UNITED STATES
SECURITIES AND EXCHANGE COMMISSION
Washington, D.C. 20549
FORM N-CSR
CERTIFIED SHAREHOLDER REPORT OF REGISTERED
MANAGEMENT INVESTMENT COMPANIES
Investment Company Act file number: 811-22037
Stone Harbor Investment Funds
(Exact name of registrant as specified in charter)
31 West 52nd Street, 16th Floor
New York, NY 10019
(Address of principal executive offices) (Zip code)
Adam J. Shapiro, Esq.
c/o Stone Harbor Investment Partners LP
31 West 52nd Street, 16th Floor
New York, NY 10019
(Name and address of agent for service)
With copies To:
Michael G. Doherty, Esq.
Ropes & Gray LLP
1211 Avenue of the Americas
New York, NY 10036
Registrant’s telephone number, including area code: (866) 699-8125
Date of fiscal year end: May 31
Date of reporting period: May 31, 2020
1
Item 1. Report to Stockholders.

Beginning on January 1, 2021, as permitted by regulations adopted by the U.S. Securities and Exchange Commission, paper copies of the Fund’s annual and semi-annual shareholder reports will no longer be sent by mail, unless you specifically request paper copies of the reports. Instead, the reports will be made available on the Funds’ website at www.shiplp.com and you will be notified by mail each time a report is posted and provided with a website link to access the report.
You may, notwithstanding the availability of shareholder reports online, elect to receive all future shareholder reports in paper free of charge. If you invest through a financial intermediary, you can contact your financial intermediary to request that you continue to receive paper copies of your shareholder reports. If you invest directly with the Funds, you can call 1.866.699.8125 to let the Funds know you wish to continue receiving paper copies of your shareholder reports.
If you already elected to receive shareholder reports electronically, you will not be affected by this change and you need not take any action. You may elect to receive shareholder reports and other communications from the Funds electronically anytime by contacting your financial intermediary (such as a broker-dealer or bank) or, if you are a direct investor, by enrolling at www.shiplp.com.
Table of Contents
| Shareholder Letter | 2 |
| Disclosure of Fund Expenses | 9 |
| Summaries of Portfolio Holdings | 10 |
| Growth of $10,000 Investment | |
| Stone Harbor Emerging Markets Debt Fund | 13 |
| Stone Harbor High Yield Bond Fund | 14 |
| Stone Harbor Local Markets Fund | 15 |
| Stone Harbor Emerging Markets Corporate Debt Fund | 16 |
| Stone Harbor Investment Grade Fund | 17 |
| Stone Harbor Strategic Income Fund | 18 |
| Stone Harbor Emerging Markets Debt Allocation Fund | 19 |
| Report of Independent Registered Public Accounting Firm | 20 |
| Statements of Investments | |
| Stone Harbor Emerging Markets Debt Fund | 21 |
| Stone Harbor High Yield Bond Fund | 35 |
| Stone Harbor Local Markets Fund | 43 |
| Stone Harbor Emerging Markets Corporate Debt Fund | 49 |
| Stone Harbor Investment Grade Fund | 54 |
| Stone Harbor Strategic Income Fund | 60 |
| Stone Harbor Emerging Markets Debt Allocation Fund | 62 |
| Statements of Assets and Liabilities | 64 |
| Statements of Operations | 66 |
| Statements of Changes in Net Assets | 68 |
| Financial Highlights | |
| Stone Harbor Emerging Markets Debt Fund | 72 |
| Stone Harbor High Yield Bond Fund | 73 |
| Stone Harbor Local Markets Fund | 74 |
| Stone Harbor Emerging Markets Corporate Debt Fund | 75 |
| Stone Harbor Investment Grade Fund | 76 |
| Stone Harbor Strategic Income Fund | 77 |
| Stone Harbor Emerging Markets Debt Allocation Fund | 78 |
| Notes to Financial Statements | 79 |
| Additional Information | 100 |
| Board Approval of Investment Advisory Agreement | 103 |
| Liquidity Risk Management Program | 106 |
| Trustees & Officers | 107 |
| Stone Harbor Investment Funds Annual Report | May 31, 2020 | 1 |
| Stone Harbor Investment Funds | Shareholder Letter |
May 31, 2020 (Unaudited)
Dear Shareholder,
The past 12-month period ended May 31, 2020 presented two contrasting periods: one in which the equity and credit markets both generated positive returns, despite concerns around slowing global growth and the U.S. – China trade tensions; and the other, where the world experienced devastating loss of lives and the global economic activity came to a near-halt due to the novel coronavirus “COVID-19” pandemic. A consistent theme throughout the period has been the commitment and unprecedented level of support of major central banks around the world.
The seven months through to the end of 2019 was a period of positive market returns despite disappointing economic data, particularly on the manufacturing side of the economy. The Eurozone manufacturing purchasing managers’ index (“PMI”) fell to a low of 45.7 in September and the Chinese PMI remained below 50 until November. The U.S. manufacturing PMI, which had held above 50, finally dipped to a low of 47.8 in December. Faced with weakening growth and subdued inflation pressures, the U.S. Federal Reserve (“Fed”) reversed its prior stance of removing accommodation and moved to ease monetary policy. Starting in July, the Fed delivered the first of three rate cuts, which brought the Fed Funds target rate down to 1.75% by end October. The Fed’s rate reductions, which were characterized as mid-cycle adjustments to protect against downside risk, dovetailed with further accommodation in Europe, China and elsewhere.
Against this background of softer growth and central bank accommodation, U.S. ten-year yields fell from 2.26% at the end of May to 1.52% by the end of August 2019, although they subsequently pushed higher to 1.85% at the end of December as the outlook for growth appeared to improve. U.S. high yield spreads narrowed from 445 basis points (bps) at the end of May 2019 to 370 bps at the end of 2019. Investment grade corporate spreads narrowed from 128 bps to 93 bps. EMD spreads lagged this rally as trade tensions continued to weigh and as idiosyncratic risks began to surface, with Argentina being perhaps the most significant. Emerging Markets Debt (“EMD”) spreads ended the year at 289 bps.
In contrast to this earlier period, the last several months have been marked by massive disruptions in the financial markets and more importantly, loss of lives on a global scale. The devastating spread of COVID-19, a dramatic drop in oil prices, and the tumultuous civil unrest in the U.S. shined a bright light on the vulnerability of people and systemic shortfalls of nations. By all measures, this was a challenging period of extreme market volatility, where the CBOE volatility Index (“VIX”) soared from 14% at the end of 2019 to a high of 87% in mid-March 2020.
The shifting economic landscape led to the decline of the ten year U.S. Treasury yields to a low of 33 bps as the Fed Funds target range was cut to 0-0.25%. The S&P 500 Index fell over 30% at one point and credit spreads widened aggressively, reaching 1100 bps in U.S. high yield, 373 bps in U.S. investment grade corporates, and 690 bps in EMD. The spread of the pandemic and the resulting collapse in economic activity that carried the threat of financial contagion necessitated a rapid and comprehensive government and central bank intervention to help mitigate some of the economic damage. The Fed implemented aggressive quantitative easing, including corporate bond purchases, and set in motion various crisis era liquidity facilities; and the European Central Bank (“ECB”) accelerated the purchase of government bonds. In other advanced economies, central banks that had policy rates above zero moved to cut them; and the Bank of Japan increased the amount of asset purchases. Across emerging markets, policy makers – many having limited room for fiscal expansions – focused on interest rate cuts, and some countries took additional steps to support proper market functioning and liquidity in key financial markets, especially in the foreign exchange (“FX”) markets.
Only time will tell how long it takes to return to a full level of activity, but the gradual opening of economic activity has allowed markets to move in a positive direction. At the end of the reporting period, U.S. high yield spreads narrowed back to 676 bps, though still over 200 bps higher than at the same time last year. U.S. investment grade spreads have narrowed to 174 bps, only 46 bps higher over the past year, reflecting, we suspect, the central role of the Fed’s corporate bond buying program in supporting the market. Emerging market spreads have tightened to 515 bps.
While uncertainty remains elevated at the time of writing, we believe governments are clearly seeking to find a balance between economic activity and health risk. As countries experience different paths to recovery, we have yet to see longer-term structural implications in terms of changing industry structures and prospects, as well as the damage that may have been done to corporate and individual balance sheets. Beyond this, there is the possibility of substantial behavioral changes that may alter the face of the economy for the foreseeable future. What we currently anticipate is that central banks will maintain rates at or near their perceived zero bound for the foreseeable future. Yield curve management is likely to become a more prominent policy tool and financial stability measures will likely remain in place. Governments are likely to transition over time from near-term support measures to longer-term fiscal strategies, reflecting the reality that some parts of the economy may have to shrink and that policy needs to focus on boosting those sectors of the economy that can offer stronger job prospects going forward. Markets are likely to remain volatile, especially over the near term; however, we would expect to see a spread tightening at the index level over the next 12 months, driven in part by increased clarity but also driven by changing index structures as defaults and restructurings occur and index constituents change. In our view, this implies that security selection will likely play a more significant role for investors over the coming year.
| 2 | www.shiplp.com |
| Stone Harbor Investment Funds | Shareholder Letter |
May 31, 2020 (Unaudited)
At Stone Harbor Investment Partners LP (“Stone Harbor”), we will continue to focus on seeking to capture excess return from stable and improving credit situations in corporate and sovereign markets worldwide. As we continue to monitor these developments, please follow our progress throughout the year by visiting our website at www.shiplp.com. There you will find updates on our view of credit markets, as well as related news and research. We appreciate the confidence you have placed in Stone Harbor and look forward to providing you with another update in the next six months.
Market Review: Emerging Markets Debt
In our last November semi-annual report, we highlighted domestic developments linked to politics and popular uprisings that contributed to a rise in idiosyncratic risks and market volatility in emerging markets (“EM”), particularly in Latin America. The political headlines on Argentina were perhaps most notable, as rising uncertainty over future policies related to the government’s plans for negotiating with the International Monetary Fund (“IMF”) on debt repayments led to a significant drop in Argentinian asset prices. Popular uprisings in Colombia, Chile, and Lebanon also negatively impacted asset prices. But despite these select negative country developments and the overhang of global growth concerns, total returns in EMD were positive and credit spreads tightened. Policy direction in the U.S. and elsewhere continued the trend toward easing and remained supportive of the global economy.
In contrast, the last several months have been defined by the global impact of the COVID-19 pandemic, coupled with a dramatic drop in oil prices, which had a crippling effect on many oil-exporting countries. The most severe impact from the global crisis on specific EM countries has been through commodity prices. Lower oil prices in particular, with the Brent crude price declining 47% in March, negatively affected a subset of EM countries. Some countries with significant accumulated buffers were able to withstand a period of extraordinarily low prices; however, others needed to make sizable policy adjustments and secure additional funding. Against the backdrop of extreme market volatility, EM sovereign credit spreads widened to 721 basis points. The largest pricing disparity within EMD was between the investment grade and non-investment grade subsectors. Based on the historical spreads of these segments of the JPMorgan EMBI Global Diversified, not only did spreads widen on an absolute basis, but the relative spread between the two sectors well exceeded levels seen during prior downturns over the past 15 years, including the global financial crisis of 2008.
As governments and central banks around the globe continue to provide comprehensive support to help mitigate some of the economic damage, the IMF also expanded its support by supplying rapid relief to countries facing fiscal pressures from lower commodity prices, falling tourism, revenues and rising health care costs. Stabilizing oil prices towards the end of the review period supported asset prices of many oil-producing countries, including Ecuador and Angola, which had suffered significant declines earlier in the period.
The JPMorgan EMBI Global Diversified spread over comparable maturity U.S. Treasury securities widened 138 bps, ending the reporting period at a spread of 515 bps and returning 0.38%. The JPMorgan CEMBI Broad Diversified credit spread widened 145 bps, ending the period at a spread of 465 bps and returning 3.19%. The JPMorgan GBI-EM Global Diversified returned 2.05% during the period.
Stone Harbor Emerging Markets Debt Fund
The total return of the Stone Harbor Emerging Markets Debt Fund (the “Fund”) for the 12-month period ended May 31, 2020 was -3.02% (net of expenses) and -2.30% (gross of expenses). This performance compares to a benchmark return of 0.38% for the JPMorgan EMBI Global Diversified Index.
The Fund underperformed its benchmark as a result of country selection, primarily in Latin America. Off-benchmark exposure in hard currency corporate bonds also detracted from performance, but off-benchmark exposure in local currency debt enhanced performance. Duration-adjusted returns that are explained by U.S. Treasury movements were positive, and miscellaneous differences that represent pricing differences, among other factors, were also positive.
The top detractors from performance were overweights in Argentina, Ecuador, and Venezuela. Uncertainty surrounding the restructuring of Argentina’s sovereign debt led to distressed prices in Argentinian assets. The sharp drop in the price of oil – Ecuador’s primary source of revenue and US dollars – combined with market uncertainty over the country’s debt sustainability as healthcare spending escalated led to the significant decline in bond prices. The total return of the Ecuador sub-index was -61.05% for the period, and the total return of the Argentina sub-index was -41.53%. While we acknowledge that the decline in oil prices erodes capacity to repay bondholders, we maintain the view that a sustainable debt path exists for both Argentina and Ecuador and that current bond prices are well below recovery values in both cases, as of May 31, 2020. In Venezuela, while the U.S. Treasury’s Office of Foreign Assets Control (“OFAC”) restricted trading of Venezuelan bonds among U.S. counterparties, the Venezuela sub-index declined, as small trades were executed outside the U.S. In other regions, an overweight in Angola, an oil producer, was one of the largest detractors from returns, although issue selection was positive. Underweights in Poland, China, and Philippines also detracted from relative returns.
| Stone Harbor Investment Funds Annual Report | May 31, 2020 | 3 |
| Stone Harbor Investment Funds | Shareholder Letter |
May 31, 2020 (Unaudited)
Top positive contributors to relative returns included overweights in Egypt and Ukraine, and underweights in Lebanon and Sri Lanka. In Egypt, government reforms and continued lending from the IMF supported the country’s U.S. dollar-denominated bonds. Ukrainian bonds benefitted from good policy-making and a favorable political environment, as well as positive discussions with the IMF that ultimately led to a new lending program with the IMF. As an oil importer, Ukraine also benefitted from the lower oil prices.
We note that following the severe market dislocation in March, the portfolio’s positions in Argentina, Ecuador, and Angola were the top contributors to positive excess returns in May. In Angola and Ecuador, the increase in oil prices and progress in debt negotiations with creditors supported bond prices. The increase in Argentinian debt prices in May reflected optimism that the country and its creditors will agree on restructuring terms at recovery values higher than prevailing Argentinian bond prices. Other positive contributors in May included overweights in Mexico, Ghana, Nigeria, Ukraine, and underweights in China and Philippines.
The Fund uses various derivative instruments to implement its strategies. These derivatives may be utilized to attempt to manage the Fund’s credit risk, interest rate risk and foreign exchange risk. These derivative positions may increase or decrease the Fund’s exposure to these risks. At the end of the reporting period, the Fund had net notional exposure to these derivatives of approximately ($457) thousand. Over the course of the reporting period these derivative positions generated a net realized loss of approximately $431 thousand and $2.4 million in unrealized depreciation for an decrease in operations of $2.8 million. We plan to continue to utilize derivative instruments to implement our strategies related to credit risk, interest rate risk and foreign exchange risk.
Stone Harbor Local Markets Fund
The total return of the Stone Harbor Local Markets Fund (the “Fund”) for the 12-month period ended May 31, 2020 was 0.59% (net of expenses) and 1.55% (gross of expenses). This performance compares to a benchmark return of 2.06% for the JPMorgan GBI-EM Global Diversified. At the index level, the bulk of the underperformance occurred in March 2020 amid the negative shocks of falling oil prices (the Brent crude price fell by 47% in March) and a sudden stop in economic activity as countries sought to slow the transmission rate of COVID-19. EM currencies bore most of the adjustment in total returns and depreciated relative to the U.S. dollar in each month during Q1, with the largest drawdown in March. Subsequently, the index returned 5.18% in May, representing a continuation of the recovery since March’s downturn and the index’s highest monthly return so far this year. Movements in currency spot markets accounted for 2.66% in total return, while changes in yield and carry delivered the remainder of the benchmark’s return in May.
In terms of total management, the top detractors from relative performance included Brazil (FX overweight and issue selection), Thailand (FX and duration underweights and issue selection), and Malaysia (currency and duration underweights and issue selection). Large declines in yields of U.S. Treasuries and German Bunds resulted in a global duration rally and led to the outperformance of low-beta EM domestic bond markets in 2019, which worked against our duration underweights in Thailand and Malaysia. The Fund had used duration exposure in Thailand and Malaysia to fund high conviction overweights. Currency exposure in Thailand was also a top detractor during the period. We have maintained a significant underweight to the Thai baht as a reflection of the country’s vulnerability to declining tourism flows and our expectation that Thailand’s economy would fall into recession this year, despite the fact that the Asian region as a whole is likely to recover somewhat sooner from a global perspective as China slowly returns to work. In Latin America, an FX overweight in Brazil was a top detractor. We were positioned for the benefits of the structural reform process to feed into the currency and were disappointed by concerns on growth and policy in other areas of the Bolsonaro administration. Additionally, the market’s widespread selling of the Brazil real as a hedge for real-denominated long duration debt positions detracted from performance.
Positive contributions to relative returns were derived from duration overweights, particularly in Indonesia, Mexico, Poland, and Russia. Mexico’s inflation remained low prior to the pandemic, and an easing cycle was already in place. We further believe that the simulative monetary policies in developed countries provide a path for many EM central banks to lower policy interest rates and provide a boost to domestic bond markets that have relatively steep yield curves. In Russia, the Russian central bank (“CRB”) cut the target interest rate by 25 basis point to 6.0% on February 7, then again by 50 basis points on April 24, which we had anticipated given the downside risks to inflation this year. Headline inflation continues to be well contained and is significantly below the CBR’s 4% target. We expect the easing cycle to continue, and therefore, maintain the overweight position in duration.
In May, duration positioning and FX exposures in several credits contributed positively to the Fund’s outperformance relative to the index. Duration overweights in Colombia and South Africa were among the top positive contributors as easing of monetary policies and low inflation supported local bond markets. Duration overweights in Indonesia, Mexico, and Peru also enhanced returns. The main market movers in FX included several oil producers whose currencies appreciated along with gains in the price of oil. The Fund’s overweights in the Mexican peso, Colombian peso, and Russian ruble enhanced relative returns. An overweight in the South African rand also enhanced performance.
| 4 | www.shiplp.com |
| Stone Harbor Investment Funds | Shareholder Letter |
May 31, 2020 (Unaudited)
The Fund uses various derivative instruments to implement its strategies. These derivatives may be utilized to attempt to manage the Fund’s credit risk, interest rate risk and foreign exchange risk. These derivative positions may increase or decrease the Fund’s exposure to these risks. At the end of the reporting period the Fund had net notional exposure to these derivatives of approximately $504 thousand. Over the course of the reporting period, these derivative positions generated a net realized loss of approximately $2.2 million and $1.1 million in unrealized depreciation, for a decrease in operations of $3.3 million. We plan to continue to utilize derivative instruments to implement our strategies related to credit risk, interest rate risk and foreign exchange risk.
Stone Harbor Emerging Markets Corporate Debt Fund
The total return of the Stone Harbor Emerging Markets Corporate Debt Fund (the “Fund”) for the 12-month period ended May 31, 2020 was -2.71% (net of expenses) and -1.70% (gross of expenses). This performance compares to a benchmark return of 3.19% for the JPMorgan CEMBI Broad Diversified Index. The spread of the COVID-19 virus, coupled with a collapse in oil prices induced a severe dislocation in EM corporate markets that was consistent with the dramatic repricing of assets across all credit markets globally. The index spread over comparable maturity U.S. Treasury securities widened by 145 bps, ending the period at 465 bps. The investment grade sub-sector outperformed, returning 5.47%, while the high yield sub-sector returned 0.00%. Following the downturn in the first quarter of this year (returning -10.17%), the EM corporate market rebounded strongly in April and into May, returning 4.09% and 3.91%, respectively.
The Fund underperformed its benchmark primarily due to issue selection decisions, though select country exposures also detracted from relative performance. Overweight exposures in Argentina, Ghana, and Ukraine, as well as underweight exposures in Turkey and China detracted from performance during the 12-month period. The negative attribution from the Fund’s overweight exposure in Argentina for the overall reporting period was driven by uncertainty over future policies related to the government’s plans for negotiating with the IMF on debt repayments, which led to a significant drop in Argentina asset prices. Subsequently, growing optimism around the likelihood that bondholders and the government would reach an agreement on the sovereign restructuring boosted corporate bond prices and, in particular, national oil company YPF. The Fund’s positioning in Argentina was one of the top positive contributors to the Fund’s outperformance relative to the benchmark in May. In Ghana, the sharp drop in the oil price in March negatively impacted oil credits, in particular Tullow Oil. We note that following the March decline, Tullow Oil posted strong performance in April and May on the back of higher oil prices and the announcement of asset sales intended to provide the company with a liquidity cushion. The Fund’s corporate exposure in Ukraine detracted from performance for the overall period, in part due to the Fund’s exposure to the country’s largest energy company, which announced that it was not going to make upcoming interest payments. However, as in the case of Argentina and Ghana, the Fund’s overweight exposure in Ukrainian corporate debt was one of the top positive contributors in May. Underweight exposures in South Africa and South Korea enhanced performance for the 12-month period.
In terms of issue selection, negative issue selection in Brazil, Chile, Colombia, and Mexico detracted most from relative returns.
From an industry perspective, overweights and issue selection in airlines, exploration & production, and metals/mining/steel – industries significantly impacted by the COVID-19 pandemic and drop in oil prices – detracted most from relative performance. Issue selection in financial/lease and wireless offset some of the negative attribution. In the latter part of the reporting period, Brazilian airline Gol was particularly impacted by COVID-19-related travel restrictions.
Attribution from credit rating was negative, with an overweight and issue selection in B-rated credits detracting most from relative performance. Other detractors included an underweight in A-rated and BBB-rated credits and an overweight in CCC-rated credits. Some of the negative attribution was offset by issue selection in BBB-rated and CCC-rated credits and an overweight in BB-rated credits.
The Fund may use various derivative instruments to implement its strategies. These derivatives may be used to attempt to manage the Fund’s credit risk, interest rate risk and foreign exchange risk. These derivative positions may increase or decrease the Fund’s exposure to these risks. At the end of the reporting period, the Fund did not have exposure to these derivatives.
| Stone Harbor Investment Funds Annual Report | May 31, 2020 | 5 |
| Stone Harbor Investment Funds | Shareholder Letter |
May 31, 2020 (Unaudited)
Stone Harbor Emerging Markets Debt Allocation Fund
The total return of the Stone Harbor Emerging Markets Debt Allocation Fund’s (the “Fund”) for the 12-month period ended May 31, 2020 was -1.21% (net of direct and indirect expenses) and -0.36% (gross of direct and indirect expenses). This compares to a blended benchmark (50% JPMorgan EMBI Global Diversified Index / 50% JPMorgan GBI-EM Global Diversified Index) return of 1.29%.
Although the Fund underperformed the index for the reporting period, the Fund outperformed the index in April and May 2020, following the significant market drawdown in March precipitated by COVID-19 and the sharp drop in oil prices. As markets gradually stabilized in reaction to signs of improving economic data and higher oil prices, the Fund benefitted from positioning in several areas. In hard currency sovereign debt, overweights in Argentina, Ecuador, Mexico, Angola, Ghana, Nigeria, South Africa, and Ukraine were among the top positive contributors to the Fund’s outperformance relative to the index in May (many of these credits had suffered significant declines in the first quarter drawdown). In Angola and Ecuador, the increase in oil prices and progress in debt negotiations with creditors supported bond prices. The increase in Argentinian debt prices in May reflected optimism that the country and its creditors will agree on restructuring terms at recovery values higher than prevailing Argentinian bond prices. Other positive contributors in May included underweights in China, Indonesia, Philippines, and Sri Lanka.
In local currency debt, duration positioning and FX exposures in several credits contributed positively to the Fund’s outperformance relative to the index in May. Duration and currency overweights in Mexico, Russia, and South Africa were among the top positive contributors. Underweight exposures in Malaysia and Thailand also contributed positively.
Off-benchmark exposures to U.S. dollar-denominated corporate debt, particularly in Colombia, Ghana, and Ukraine, also contributed positively to performance.
Despite strong relative performance at the end of the reporting period, the largest sources of the Fund’s overall underperformance were overweights in Argentina, Ecuador, and Venezuela. Uncertainty surrounding the restructuring of Argentina’s sovereign debt led to distressed prices of Argentina assets. The sharp drop in the price of oil – Ecuador’s primary source of revenue and US dollars – combined with market uncertainty over the country’s debt sustainability as healthcare spending escalated led to the significant decline in bond prices. The total return of the Ecuador sub-index was -61.05% for the period, and the total return of the Argentina sub-index was -41.53%. While we acknowledge that the decline in oil prices erodes capacity to repay bondholders, we believe a sustainable debt path exists for both Argentina and Ecuador and that current bond prices are well below recovery values in both cases, as of May 31, 2020. In Venezuela, while the U.S. Treasury’s Office of Foreign Asset Control (OFAC) restricted trading of Venezuelan bonds among U.S. counterparties, the Venezuela sub-index declined, as small trades were executed outside the U.S. In other regions, an overweight in Angola, an oil producer, was one of the largest detractors from returns, although issue selection was positive. Underweights in Poland, China, and Philippines also detracted from relative returns.
In local currency debt, the top detractor from relative performance was Brazil (FX overweight and issue selection). We were positioned for the benefits of the structural reform process to feed into the currency and were disappointed by concerns on growth and policy in other areas of the Bolsonaro administration. Additionally, the market’s widespread selling of the Brazilian real as a hedge for real-denominated long duration debt positions detracted from performance. Other detractors included overweight exposures in Argentina, Chile, and Mexico.
The Fund uses various derivative instruments to implement its strategies. These derivatives are utilized to attempt to manage the Fund’s credit risk, interest rate risk and foreign exchange risk. These derivative positions may increase or decrease the Fund’s exposure to these risks. At the end of the reporting period the Fund had net notional exposure to these derivatives of approximately $15 thousand to these derivatives. Over the course of the reporting period, these derivative positions generated a net realized gain of $318 and $15 thousand in unrealized appreciation, for an increase in operations of $15 thousand. We plan to continue to utilize derivative instruments to implement our strategies related to credit risk, interest rate risk and foreign exchange risk.
Stone Harbor High Yield Bond Fund
The total return of Stone Harbor High Yield Bond Fund (the “Fund”) for the 12-month period ended May 31, 2020 was 0.96% (net of expenses) and 1.62% (gross of expenses). This compares to a benchmark return of 0.30% for the ICE BofAML US High Yield Constrained Index.
After achieving strong returns for most of the reporting period due to positive retail flows and a supportive Fed, the market suffered a significant decline in March due to Covid-19. The global lockdown resulted in a deterioration in demand and economic activity. Additionally, large retail outflows created negative technical pressure that exacerbated the situation. Higher quality bonds continued their outperformance, with BB-rated issues the only rating category to post positive returns and CCC-rated issues suffering meaningful declines. The drop in commodity prices caused energy credits to underperform, and the global economic shutdowns severely impacted transportation and leisure-related industries. Defensive industries, including wireless, cable, utilities, and retail food/drug, outperformed. Towards the end of the reporting period, the market began to rally off the March lows in response to support from the Fed, strong fiscal stimulus, and the early stages of reopening economies around the world.
| 6 | www.shiplp.com |
| Stone Harbor Investment Funds | Shareholder Letter |
May 31, 2020 (Unaudited)
The Fund’s more defensive positioning in the second half of the fiscal year contributed to positive issue and industry selection and outperformance relative to the benchmark. Positive security selection decisions in drillers, satellites, cable, and transportation more than offset negative contributions from credit selection in consumer products and exploration & production. Favoring better quality issues benefited performance in drillers, satellites, and transportation, while cable benefited from Dish Network’s acquisition of wireless assets divested by T-Mobile and Sprint. In terms of industry selection, an underweight to drillers and overweights in building products and chemicals contributed the most to performance. This performance was partially offset by underweights in aerospace and financials. From a credit quality perspective, an underweight in CCC-rated bonds and overweight in BB- rated bonds positively contributed to relative performance, while B-rated issue selection and the exposure to bank loans detracted from performance.
The Fund uses various derivative instruments to implement its strategies. These derivatives are utilized to manage the Fund’s credit risk, interest rate risk and foreign exchange risk. These derivative positions may increase or decrease the Fund’s exposure to these risks. At the end of the reporting period, the Fund did not have exposure to these derivatives.
Stone Harbor Investment Grade Fund
The total return of the Stone Harbor Investment Grade Fund (the “Fund”) for the 12-month period ending May 31, 2020 was 7.03% (net of expenses) and 7.54% (gross of expenses). This performance compares to a benchmark return of 9.42% for the Bloomberg Barclays U.S. Aggregate Index. The Fund’s performance was negatively impacted during the period by maintaining an average duration position modestly shorter than that of the benchmark. Over the 12-month period, U.S. Treasury rates moved lower due to global growth concerns resulting from the COVID-19 pandemic. The Fund’s overweight to corporate bonds and underweight to U.S. Treasuries further negatively impacted performance as credit spreads widened. The Fund’s overweight to securitized assets positively impacted performance, offsetting drag from corporates. Within the corporate bond allocation, industry overweights to energy and electric utilities contributed negatively.
The seven months through to the end of 2019 was a period of positive market returns despite disappointing economic data, particularly on the manufacturing side of the economy. Against a background of softer growth and continuing central bank accommodation, U.S. ten-year yields fell from 2.26% at end of May 2019 to 1.52% by end August 2019, although they subsequently pushed higher to 1.85% at the end of December as the outlook for growth appeared to improve. Investment grade corporate spreads narrowed from 128 bps to 93 bps during the seven month period. In contrast, 2020 saw a dramatic return of market volatility as the spread of COVID-19 dramatically changed the economic prospects around the world and country after country found it necessary to enforce social lockdowns resulting in almost overnight collapses in economic activity. Ten-year Treasury yields fell to a low of 33 bps as the Fed cut the Fed Funds target range to 0-0.25%. The S&P 500 Index fell over 30% at one point and credit spreads widened aggressively.
The Fund may use various derivative instruments to implement its strategies. These derivatives may be used to attempt to manage the Fund’s credit risk, interest rate risk and foreign exchange risk. These derivative positions may increase or decrease the Fund’s exposure to these risks. At the end of the reporting period, the Fund did not have exposure to these derivatives.
Stone Harbor Strategic Income Fund
The total return of the Strategic Income Fund (the “Fund”) for the 12-month period ended May 31, 2020 was -1.75% (net of direct and indirect expenses) and -1.05% (gross of direct and indirect expenses). This performance compares to a benchmark return of 6.11% for the Bloomberg Barclays Global Credit Index (Hedged USD). The Fund underperformed its benchmark as a result of certain asset allocation, duration, and individual credit decisions. The Fund’s duration positioning (short relative to the benchmark) generated a negative contribution (approximately 30% of the underperformance) during the period as developed market government rates moved lower due to the COVID-19 global pandemic. Contributions from asset allocation were negative across all higher risk/return sectors, accounting for approximately 30% of the underperformance over the period. Within individual portfolio sectors, the Fund experienced outperformance in U.S. high yield corporates while underperforming within other major market segments. Within investment grade, an overweight to corporate bonds led to underperformance. In EM hard currency debt, overweights to Argentina, Venezuela and Ecuador generated the largest negative contributions. In the high yield segment, an underweight to the exploration & production sector and an overweight to the food/beverage sector both had positive effects.
| Stone Harbor Investment Funds Annual Report | May 31, 2020 | 7 |
| Stone Harbor Investment Funds | Shareholder Letter |
May 31, 2020 (Unaudited)
The seven months through to the end of 2019 was a period of positive market returns despite disappointing economic data, particularly on the manufacturing side of the economy. Against a background of softer growth and continuing central bank accommodation, U.S. ten-year yields fell from 2.26% at end May to 1.52% by end August, although they subsequently pushed higher to 1.85% at the end of December as the outlook for growth appeared to improve. Investment grade corporate spreads narrowed from 128 bps to 93 bps during the seven month period. In contrast, 2020 saw a dramatic return of market volatility as the spread of COVID-19 dramatically changed the economic prospects around the world and country after country found it necessary to enforce social lockdowns resulting in almost overnight collapses in economic activity. Ten-year Treasury yields fell to a low of 33 bps as the Federal Reserve cut the Fed Funds target range to 0-0.25%. The S&P 500 Index fell over 30% at one point and credit spreads widened aggressively.
The Fund uses various derivative instruments to implement its strategies. These derivatives are utilized to manage the Fund’s credit risk, interest rate risk and foreign exchange risk. These derivative positions may increase or decrease the Fund’s exposure to these risks. At the end of the reporting period, the Fund had net notional exposure to these derivatives of approximately $345 thousand. Over the course of the reporting period, these derivative positions generated a net realized loss of approximately $1.1 million and $61 thousand in unrealized depreciation for a decrease in operations of $1.2 million. We plan to continue to utilize derivative instruments to implement our strategies related to credit risk, interest rate risk and foreign exchange risk.
Sincerely,

Peter J. Wilby, CFA
President
Credit ratings are measured on a scale that generally ranges from AAA (highest) to D (lowest). All Fund securities except for those labeled “Not Rated” and “Other” have been rated by Moody’s, S&P or Fitch, which are each a Nationally Recognized Statistical Rating Organization (“NRSRO”). All Index securities except for those labeled “Not Rated” have been rated by Moody’s or S&P. Credit ratings are subject to change. One cannot invest directly into an index.
| 8 | www.shiplp.com |
| Stone Harbor Investment Funds | Disclosure of Fund Expenses |
May 31, 2020 (Unaudited)
Example. As a shareholder of a Fund, you incur two types of costs: (1) transaction costs, including sales charges (loads) on purchase payments and/or redemption fees (if applicable) and (2) ongoing costs, including management fees and other Fund expenses. The below examples are intended to help you understand your ongoing costs (in dollars) of investing in a Fund and to compare these costs with the ongoing costs of investing in other mutual funds. The examples are based on an investment of $1,000 invested on December 1, 2019 and held until May 31, 2020.
Actual Expenses. The first table below provides information about actual account values and actual expenses. You may use the information in this table, together with the amount you invested, to estimate the expenses that you paid over the period. Simply divide your account value by $1,000 (for example, an $8,600 account value divided by $1,000 = 8.6), then multiply the result by the number in the first line under the heading “Expenses Paid During Period” to estimate the expenses you paid on your account during this period.
Hypothetical Example for Comparison Purposes. The second table below provides information about hypothetical account values and hypothetical expenses based on the Fund’s actual expense ratio and an assumed rate of return of 5% per year before expenses, which is not the Fund’s actual return. The hypothetical account values and expenses may not be used to estimate the actual ending account balance or expenses you paid for the period. You may use this information to compare the ongoing costs of investing in a Fund and other mutual funds. To do so, compare this 5% hypothetical example with the 5% hypothetical examples that appear in the shareholder reports of the other funds.
Please note that the expenses shown in the tables are meant to highlight your ongoing costs only and do not reflect transactional costs, such as redemption fees, sales charges (loads) or exchange fees. Therefore, the second table is useful in comparing ongoing costs only, and will not help you determine the relative total costs of owning different funds. In addition, if these transactional costs were included, your costs would have been higher.
BASED ON ACTUAL TOTAL RETURN
Actual Total Return | Beginning Account Value December 1, 2019 | Ending Account Value May 31, 2020 | Expense Ratio(1) | Expenses Paid During Period(2) | |
| STONE HARBOR EMERGING MARKETS DEBT FUND | -5.82% | $1,000.00 | $941.80 | 0.73% | $3.54 |
| STONE HARBOR HIGH YIELD BOND FUND | -2.04 | 1,000.00 | 979.60 | 0.66 | 3.27 |
| STONE HARBOR LOCAL MARKETS FUND | -4.14 | 1,000.00 | 958.60 | 0.95 | 4.65 |
| STONE HARBOR EMERGING MARKETS CORPORATE DEBT FUND | -7.25 | 1,000.00 | 927.50 | 1.02 | 4.92 |
| STONE HARBOR INVESTMENT GRADE FUND | 3.24 | 1,000.00 | 1,032.40 | 0.51 | 2.59 |
| STONE HARBOR STRATEGIC INCOME FUND | -3.76 | 1,000.00 | 962.40 | 0.08(3) | 0.39 |
| STONE HARBOR EMERGING MARKETS DEBT ALLOCATION FUND | -4.93 | 1,000.00 | 950.70 | 0.01(3) | 0.05 |
BASED ON HYPOTHETICAL TOTAL RETURN
Hypothetical Annualized Total Return | Beginning Account Value December 1, 2019 | Ending Account Value May 31, 2020 | Expense Ratio(1) | Expenses Paid During Period(2) | |
| STONE HARBOR EMERGING MARKETS DEBT FUND | 5.00% | $1,000.00 | $1,021.35 | 0.73% | $3.69 |
| STONE HARBOR HIGH YIELD BOND FUND | 5.00 | 1,000.00 | 1,021.70 | 0.66 | 3.34 |
| STONE HARBOR LOCAL MARKETS FUND | 5.00 | 1,000.00 | 1,020.25 | 0.95 | 4.80 |
| STONE HARBOR EMERGING MARKETS CORPORATE DEBT FUND | 5.00 | 1,000.00 | 1,019.90 | 1.02 | 5.15 |
| STONE HARBOR INVESTMENT GRADE FUND | 5.00 | 1,000.00 | 1,022.45 | 0.51 | 2.58 |
| STONE HARBOR STRATEGIC INCOME FUND | 5.00 | 1,000.00 | 1,024.60 | 0.08(3) | 0.40 |
| STONE HARBOR EMERGING MARKETS DEBT ALLOCATION FUND | 5.00 | 1,000.00 | 1,024.95 | 0.01(3) | 0.05 |
| (1) | Annualized, based on the Fund's most recent fiscal half-year expenses. |
| (2) | Expenses are equal to the Fund's annualized expense ratio multiplied by the average account value over the period, multiplied by the number of days in the most recent fiscal half year (183), divided by 366. Note this expense example is typically based on a six-month period. |
| (3) | Ratio does not include expenses of the mutual funds held in the investment portfolio. |
| Stone Harbor Investment Funds Annual Report | May 31, 2020 | 9 |
| Stone Harbor Investment Funds | Summaries of Portfolio Holdings |
May 31, 2020 (Unaudited)
| STONE HARBOR EMERGING MARKETS DEBT FUND | |
| Country Breakdown(1) | % |
| Mexico | 10.33% |
| Ukraine | 4.91% |
| Argentina | 4.48% |
| Brazil | 4.24% |
| Indonesia | 3.98% |
| Angola | 3.81% |
| Ghana | 3.58% |
| Kazakhstan | 3.35% |
| Saudi Arabia | 3.29% |
| Ecuador | 3.28% |
| Turkey | 3.25% |
| Nigeria | 3.19% |
| United Arab Emirates | 3.11% |
| Colombia | 3.02% |
| Egypt | 2.95% |
| Chile | 2.54% |
| South Africa | 2.44% |
| Dominican Republic | 2.21% |
| Uruguay | 2.17% |
| Peru | 2.05% |
| El Salvador | 1.92% |
| Ivory Coast | 1.92% |
| Qatar | 1.91% |
| Malaysia | 1.81% |
| Panama | 1.73% |
| Oman | 1.71% |
| Kenya | 1.36% |
| Romania | 1.21% |
| Sri Lanka | 1.20% |
| Russia | 1.17% |
| Papua New Guinea | 1.03% |
| Gabon | 0.87% |
| Costa Rica | 0.86% |
| Mozambique | 0.81% |
| Iraq | 0.80% |
| Pakistan | 0.57% |
| Zambia | 0.57% |
| Lebanon | 0.55% |
| Azerbaijan | 0.52% |
| Benin | 0.50% |
| Bahrain | 0.47% |
| Trinidad/Tobago | 0.44% |
| Venezuela | 0.44% |
| Belarus | 0.38% |
| Jamaica | 0.29% |
| China | 0.26% |
| Vietnam | 0.23% |
| Tunisia | 0.18% |
| Ethiopia | 0.17% |
| Cameroon | 0.16% |
| India | 0.12% |
| Hong Kong | 0.01% |
| Total | 98.35% |
| Short Term Investments | 0.73% |
| Other Assets in Excess of Liabilities | 0.92% |
| Total Net Assets | 100.00% |
| STONE HARBOR LOCAL MARKETS FUND | |
| Country Breakdown(1) | % |
| Indonesia | 12.59% |
| Mexico | 12.51% |
| Russia | 11.31% |
| South Africa | 10.07% |
| Colombia | 7.60% |
| Brazil | 5.90% |
| Poland | 4.74% |
| China | 4.38% |
| Peru | 4.27% |
| Malaysia | 4.14% |
| Thailand | 3.43% |
| Czech Republic | 3.32% |
| Chile | 2.01% |
| Turkey | 2.00% |
| Romania | 1.50% |
| Egypt | 0.35% |
| Ghana | 0.35% |
| Ukraine | 0.29% |
| Uruguay | 0.19% |
| Kazakhstan | 0.17% |
| Total | 91.12% |
| Short Term Investments | 0.24% |
| Other Assets in Excess of Liabilities | 8.64% |
| Total Net Assets | 100.00% |
| (1) | Country refers to country of primary risk exposure, as determined by Stone Harbor. In certain instances, a security’s country of incorporation may be different from its country of risk. |
| 10 | www.shiplp.com |
| Stone Harbor Investment Funds | Summaries of Portfolio Holdings |
May 31, 2020 (Unaudited)
| STONE HARBOR HIGH YIELD BOND FUND | |
| Industry Breakdown | % |
| Healthcare | 8.65% |
| Media Cable | 7.02% |
| Exploration & Production | 5.95% |
| Food and Beverage | 5.41% |
| Media Other | 5.34% |
| Gas Pipelines | 5.22% |
| Technology | 5.11% |
| Automotive | 4.23% |
| Gaming | 3.98% |
| Building Products | 3.77% |
| Chemicals | 3.30% |
| Industrial Other | 2.96% |
| Wireless | 2.91% |
| Electric | 2.83% |
| Aerospace/Defense | 2.80% |
| Pharmaceuticals | 2.14% |
| Services Other | 1.88% |
| Satellite | 1.79% |
| Textile/Apparel | 1.78% |
| Wirelines | 1.72% |
| Drillers/Services | 1.57% |
| Paper/Forest Products | 1.49% |
| Retail Food/Drug | 1.44% |
| Leisure | 1.39% |
| Containers/Packaging | 1.38% |
| Metals/Mining/Steel | 1.38% |
| Home Builders | 1.35% |
| Financial Other | 1.25% |
| Diversified Manufacturing | 1.19% |
| Non Captive Finance | 0.89% |
| Life | 0.86% |
| Restaurants | 0.72% |
| Property & Casualty Insurance | 0.68% |
| Construction Machinery | 0.67% |
| Environmental Services | 0.63% |
| Airlines | 0.61% |
| Retail Non Food/Drug | 0.56% |
| Lodging | 0.55% |
| Transportation Non Air/Rail | 0.49% |
| Consumer Products | 0.25% |
| Total | 98.14% |
| Short Term Investments | 0.87% |
| Other Assets in Excess of Liabilities | 0.99% |
| Total Net Assets | 100.00% |
| STONE HARBOR EMERGING MARKETS CORPORATE DEBT FUND | |
| Industry Breakdown | % |
| Electric | 15.46% |
| Exploration & Production | 7.69% |
| Oil & Gas | 7.49% |
| Telecommunications | 7.35% |
| Real Estate | 6.77% |
| Banks | 5.08% |
| Iron/Steel | 4.11% |
| Mining | 3.98% |
| Commercial Services | 3.38% |
| Metals/Mining/Steel | 3.12% |
| Pharmaceuticals | 2.62% |
| Wirelines | 2.37% |
| Pipelines | 1.84% |
| Food/Bev/Tobacco | 1.80% |
| Financial/Lease | 1.77% |
| Airlines | 1.71% |
| Gas Distributors | 1.70% |
| Media | 1.68% |
| Engineering & Construction | 1.62% |
| Packaging & Containers | 1.57% |
| Transportation | 1.28% |
| Investment Companies | 1.14% |
| Building Materials | 0.99% |
| Internet | 0.95% |
| Sovereign | 0.94% |
| Lodging | 0.90% |
| Gaming | 0.90% |
| Food | 0.84% |
| Building Products | 0.83% |
| Forest Products & Paper | 0.75% |
| Technology | 0.74% |
| Retail | 0.74% |
| Transport Other | 0.59% |
| Agriculture | 0.59% |
| Chemicals | 0.56% |
| Wireless | 0.55% |
| Total | 96.40% |
| Short Term Investments | 1.02% |
| Other Assets in Excess of Liabilities | 2.58% |
| Total Net Assets | 100.00% |
| Stone Harbor Investment Funds Annual Report | May 31, 2020 | 11 |
| Stone Harbor Investment Funds | Summaries of Portfolio Holdings |
May 31, 2020 (Unaudited)
| STONE HARBOR INVESTMENT GRADE FUND | |
| Industry Breakdown | % |
| Government Entity | 44.64% |
| Banking | 13.29% |
| Financial Other | 6.70% |
| Electric | 4.03% |
| Exploration & Production | 2.45% |
| Gas Pipelines | 2.39% |
| Automotive | 2.02% |
| Technology | 1.92% |
| Real Estate Investment Trust (REITs) | 1.55% |
| Textile/Apparel | 1.18% |
| Media Cable | 1.12% |
| Services Other | 1.09% |
| Non Captive Finance | 1.08% |
| Retail Non Food/Drug | 1.07% |
| Wirelines | 1.05% |
| Chemicals | 1.02% |
| Wireless | 1.02% |
| Gas Distributors | 1.00% |
| Healthcare | 0.81% |
| Refining | 0.72% |
| Restaurants | 0.55% |
| Health Insurance | 0.54% |
| Non Corporate | 0.53% |
| Media Other | 0.49% |
| Building Products | 0.48% |
| Pharmaceuticals | 0.48% |
| Metals/Mining/Steel | 0.46% |
| Transportation Non Air/Rail | 0.46% |
| Retail Food/Drug | 0.45% |
| Leisure | 0.44% |
| Brokerage | 0.43% |
| Diversified Manufacturing | 0.41% |
| Consumer Products | 0.24% |
| Lodging | 0.24% |
| Total | 96.35% |
| Other Assets in Excess of Liabilities | 3.65% |
| Total Net Assets | 100.00% |
| STONE HARBOR STRATEGIC INCOME FUND | |
| Underlying Fund Breakdown | % |
| Stone Harbor Emerging Markets Debt Fund | 22.64% |
| Stone Harbor High Yield Bond Fund | 30.84% |
| Stone Harbor Investment Grade Fund | 36.17% |
| Stone Harbor Emerging Markets Corporate Debt Fund | 5.11% |
| Stone Harbor Local Markets Fund | 2.55% |
| Total | 97.31% |
| Short Term Investments | 0.57% |
| Other Assets in Excess of Liabilities | 2.12% |
| Total Net Assets | 100.00% |
| STONE HARBOR EMERGING MARKETS DEBT ALLOCATION FUND | |
| Underlying Fund Breakdown | % |
| Stone Harbor Emerging Markets Debt Fund | 57.87% |
| Stone Harbor Local Markets Fund | 41.71% |
| Total | 99.58% |
| Short Term Investments | 0.02% |
| Other Assets in Excess of Liabilities | 0.40% |
| Total Net Assets | 100.00% |
| 12 | www.shiplp.com |
| Stone Harbor Investment Funds | Growth of $10,000 Investment |
May 31, 2020 (Unaudited)
STONE HARBOR EMERGING MARKETS DEBT FUND
Comparison of Change in Value of $10,000 Investment in Stone Harbor Emerging Markets Debt Fund and the JPMorgan Emerging Markets Bond Index Global Diversified (JPMorgan EMBI Global Diversified Index). Please refer to the Additional Information section for detailed benchmark descriptions.
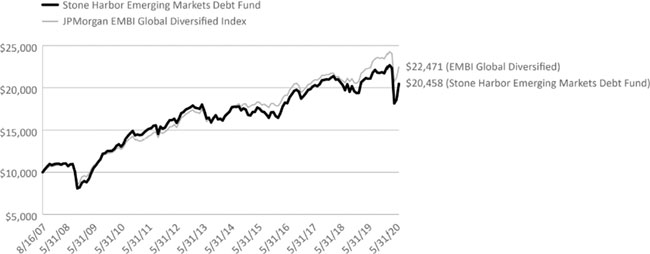
Total Returns (Inception Date, August 16, 2007)
| 1 Year | 3 Year | 5 Year | 10 Year | Since Inception | |
| Stone Harbor Emerging Markets Debt Fund | -3.02% | 0.26% | 3.14% | 4.62% | 5.76% |
| JPMorgan EMBI Global Diversified Index | 0.38% | 2.36% | 4.24% | 5.87% | 6.53% |
The performance data quoted represents past performance and does not guarantee future results. Current performance may be lower or higher than the performance quoted. Average annual total returns reflect the reinvestment of dividends and capital gains distributions and include all fee waivers and expense reimbursements. Without the fee waivers and expense reimbursements, total return figures would have been lower. The performance data quoted does not reflect the deduction of taxes that a shareholder would pay on Fund distributions or the redemption of Fund shares. Investment return and principal value will vary, and shares, when redeemed, may be worth more or less than their original cost. Index returns do not include the effects of sales charges, management fees and fund expenses or transaction costs. It is not possible to invest directly in an index.
| Stone Harbor Investment Funds Annual Report | May 31, 2020 | 13 |
| Stone Harbor Investment Funds | Growth of $10,000 Investment |
May 31, 2020 (Unaudited)
STONE HARBOR HIGH YIELD BOND FUND
Comparison of Change in Value of $10,000 Investment in Stone Harbor High Yield Bond Fund and the ICE BofAML US High Yield Constrained Index. Please refer to the Additional Information section for detailed benchmark descriptions.
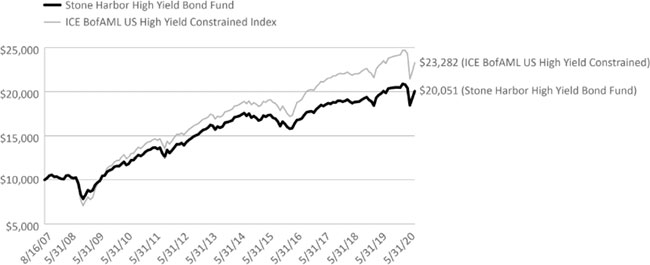
Total Returns (Inception Date, August 16, 2007)
| 1 Year | 3 Year | 5 Year | 10 Year | Since Inception | |
| Stone Harbor High Yield Bond Fund | 0.96% | 2.38% | 2.92% | 5.55% | 5.59% |
| ICE BofAML US High Yield Constrained Index | 0.30% | 2.63% | 4.06% | 6.50% | 6.83% |
The performance data quoted represents past performance and does not guarantee future results. Current performance may be lower or higher than the performance quoted. Average annual total returns reflect the reinvestment of dividends and capital gains distributions and include all fee waivers and expense reimbursements. Without the fee waivers and expense reimbursements, total return figures would have been lower. The performance data quoted does not reflect the deduction of taxes that a shareholder would pay on Fund distributions or the redemption of Fund shares. Investment return and principal value will vary, and shares, when redeemed, may be worth more or less than their original cost. Index returns do not include the effects of sales charges, management fees and fund expenses or transaction costs. It is not possible to invest directly in an index.
| 14 | www.shiplp.com |
| Stone Harbor Investment Funds | Growth of $10,000 Investment |
May 31, 2020 (Unaudited)
STONE HARBOR LOCAL MARKETS FUND
Comparison of Change in Value of $10,000 Investment in Stone Harbor Local Markets Fund and the JPMorgan Global Bond Index – Emerging Markets Global Diversified (JPMorgan GBI-EM Global Diversified Index). Please refer to the Additional Information section for detailed benchmark descriptions.
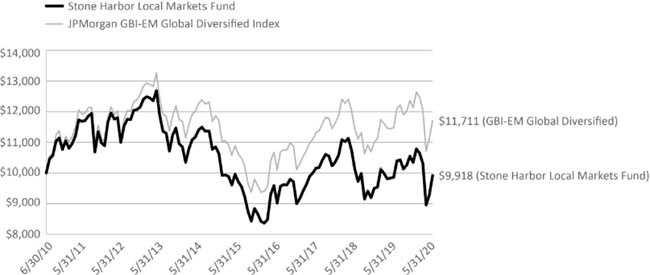
Total Returns (Inception Date, June 30, 2010)
| 1 Year | 3 Year | 5 Year | Since Inception | |
| Stone Harbor Local Markets Fund | 0.59% | -0.79% | 0.41% | -0.08% |
| JPMorgan GBI-EM Global Diversified Index | 2.06% | 1.13% | 2.00% | 1.61% |
The performance data quoted represents past performance and does not guarantee future results. Current performance may be lower or higher than the performance quoted. Average annual total returns reflect the reinvestment of dividends and capital gains distributions and include all fee waivers and expense reimbursements. Without the fee waivers and expense reimbursements, total return figures would have been lower. The performance data quoted does not reflect the deduction of taxes that a shareholder would pay on Fund distributions or the redemption of Fund shares. Investment return and principal value will vary, and shares, when redeemed, may be worth more or less than their original cost. Index returns do not include the effects of sales charges, management fees and fund expenses or transaction costs. It is not possible to invest directly in an index.
| Stone Harbor Investment Funds Annual Report | May 31, 2020 | 15 |
| Stone Harbor Investment Funds | Growth of $10,000 Investment |
May 31, 2020 (Unaudited)
STONE HARBOR EMERGING MARKETS CORPORATE DEBT FUND
Comparison of Change in Value of $10,000 Investment in Stone Harbor Emerging Market Corporate Debt Fund and the JPMorgan Corporate Emerging Market Bond Index – Broad Diversified (JPMorgan CEMBI Broad Diversified Index). Please refer to the Additional Information section for detailed benchmark descriptions.
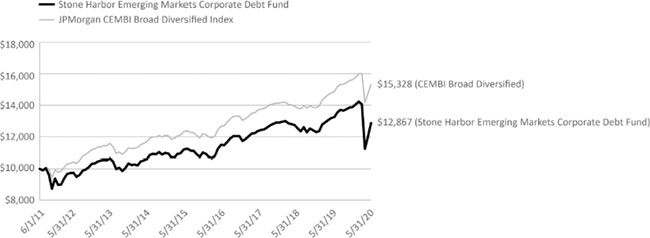
Total Returns (Inception Date, June 1, 2011)
| 1 Year | 3 Year | 5 Year | Since Inception | |
| Stone Harbor Emerging Markets Corporate Debt Fund | -2.71% | 1.21% | 2.76% | 2.86% |
| JPMorgan CEMBI Broad Diversified Index | 3.19% | 3.64% | 4.37% | 4.86% |
The performance data quoted represents past performance and does not guarantee future results. Current performance may be lower or higher than the performance quoted. Average annual total returns reflect the reinvestment of dividends and capital gains distributions and include all fee waivers and expense reimbursements. Without the fee waivers and expense reimbursements, total return figures would have been lower. The performance data quoted does not reflect the deduction of taxes that a shareholder would pay on Fund distributions or the redemption of Fund shares. Investment return and principal value will vary, and shares, when redeemed, may be worth more or less than their original cost. Index returns do not include the effects of sales charges, management fees and fund expenses or transaction costs. It is not possible to invest directly in an index.
| 16 | www.shiplp.com |
| Stone Harbor Investment Funds | Growth of $10,000 Investment |
May 31, 2020 (Unaudited)
STONE HARBOR INVESTMENT GRADE FUND
Comparison of Change in Value of $10,000 Investment in Stone Harbor Investment Grade Fund and the Bloomberg Barclays U.S. Aggregate Index. Please refer to the Additional Information section for detailed benchmark descriptions.
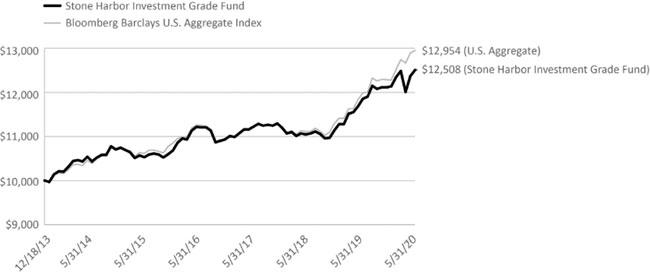
Total Returns (Inception Date, December 18, 2013)
| 1 Year | 3 Year | 5 Year | Since Inception | |
| Stone Harbor Investment Grade Fund | 7.03% | 3.88% | 3.28% | 3.53% |
| Bloomberg Barclays U.S. Aggregate Index | 9.42% | 5.07% | 3.94% | 4.09% |
The performance data quoted represents past performance and does not guarantee future results. Current performance may be lower or higher than the performance quoted. Average annual total returns reflect the reinvestment of dividends and capital gains distributions and include all fee waivers and expense reimbursements. Without the fee waivers and expense reimbursements, total return figures would have been lower. The performance data quoted does not reflect the deduction of taxes that a shareholder would pay on Fund distributions or the redemption of Fund shares. Investment return and principal value will vary, and shares, when redeemed, may be worth more or less than their original cost. Index returns do not include the effects of sales charges, management fees and fund expenses or transaction costs. It is not possible to invest directly in an index.
| Stone Harbor Investment Funds Annual Report | May 31, 2020 | 17 |
| Stone Harbor Investment Funds | Growth of $10,000 Investment |
May 31, 2020 (Unaudited)
STONE HARBOR STRATEGIC INCOME FUND
Comparison of Change in Value of $10,000 Investment in Stone Harbor Strategic Income Fund and the Bloomberg Barclays Global Credit Index (Hedged USD). Please refer to the Additional Information section for detailed benchmark descriptions.
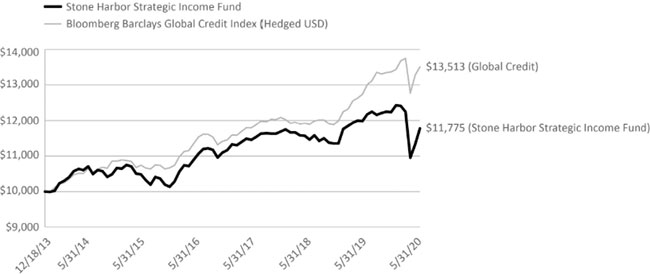
Total Returns (Inception Date, December 18, 2013)
| 1 Year | 3 Year | 5 Year | Since Inception | |
| Stone Harbor Strategic Income Fund | -1.75% | 0.82% | 1.92% | 2.57% |
| Bloomberg Barclays Global Credit Index (Hedged USD) | 6.11% | 4.63% | 4.49% | 4.78% |
The performance data quoted represents past performance and does not guarantee future results. Current performance may be lower or higher than the performance quoted. Average annual total returns reflect the reinvestment of dividends and capital gains distributions and include all fee waivers and expense reimbursements. Without the fee waivers and expense reimbursements, total return figures would have been lower. The performance data quoted does not reflect the deduction of taxes that a shareholder would pay on Fund distributions or the redemption of Fund shares. Investment return and principal value will vary, and shares, when redeemed, may be worth more or less than their original cost. Index returns do not include the effects of sales charges, management fees and fund expenses or transaction costs. It is not possible to invest directly in an index.
| 18 | www.shiplp.com |
| Stone Harbor Investment Funds | Growth of $10,000 Investment |
May 31, 2020 (Unaudited)
STONE HARBOR EMERGING MARKETS DEBT ALLOCATION FUND
Comparison of Change in Value of $10,000 Investment in Stone Harbor Emerging Markets Debt Allocation Fund, the JPMorgan EMBI Global Diversified Index, JPMorgan GBI-EM Global Diversified Index and the Blend Index (50% JPMorgan EMBI Global Diversified Index and 50% JPMorgan GBI-EM Global Diversified Index). Please refer to the Additional Information section for detailed benchmark descriptions.
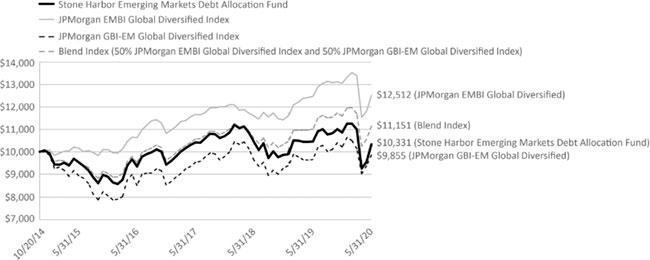
Total Returns (Inception Date, October 20, 2014)
| 1 Year | 3 Year | 5 Year | Since Inception | |
| Stone Harbor Emerging Markets Debt Allocation Fund | -1.21% | -0.27% | 1.63% | 0.58% |
| JPMorgan EMBI Global Diversified Index | 0.38% | 2.36% | 4.24% | 4.08% |
| JPMorgan GBI-EM Global Diversified Index | 2.06% | 1.13% | 2.00% | -0.26% |
| Blend Index (50% JPMorgan EMBI Global Diversified Index and 50% JPMorgan GBI-EM Global Diversified Index) | 1.29% | 1.82% | 3.19% | 1.96% |
The performance data quoted represents past performance and does not guarantee future results. Current performance may be lower or higher than the performance quoted. Average annual total returns reflect the reinvestment of dividends and capital gains distributions and include all fee waivers and expense reimbursements. Without the fee waivers and expense reimbursements, total return figures would have been lower. The performance data quoted does not reflect the deduction of taxes that a shareholder would pay on Fund distributions or the redemption of Fund shares. Investment return and principal value will vary, and shares, when redeemed, may be worth more or less than their original cost. Index returns do not include the effects of sales charges, management fees and fund expenses or transaction costs. It is not possible to invest directly in an index.
| Stone Harbor Investment Funds Annual Report | May 31, 2020 | 19 |
| Report of Independent | |
| Stone Harbor Investment Funds | Registered Public Accounting Firm |
To the shareholders and the Board of Trustees of Stone Harbor Investment Funds
Opinion on the Financial Statements and Financial Highlights
We have audited the accompanying statements of assets and liabilities of Stone Harbor Investment Funds comprising Stone Harbor Emerging Markets Debt Fund, Stone Harbor High Yield Bond Fund, Stone Harbor Local Markets Fund, Stone Harbor Emerging Markets Corporate Debt Fund, Stone Harbor Investment Grade Fund, Stone Harbor Strategic Income Fund, and Stone Harbor Emerging Markets Debt Allocation Fund (the “Funds”), including the statements of investments, as of May 31, 2020, the related statements of operations for the year then ended, the statements of changes in net assets for each of the two years in the period then ended, and the financial highlights for each of the five years in the period then ended, and the related notes.
In our opinion, the financial statements and financial highlights present fairly, in all material respects, the financial position of each of the funds constituting the Stone Harbor Investment Funds as of May 31, 2020, and the results of their operations for the year then ended, the changes in their net assets for each of the two years in the period then ended, and the financial highlights for each of the five years in the period then ended, in conformity with accounting principles generally accepted in the United States of America.
Basis for Opinion
These financial statements and financial highlights are the responsibility of the Funds’ management. Our responsibility is to express an opinion on the Funds’ financial statements and financial highlights based on our audits. We are a public accounting firm registered with the Public Company Accounting Oversight Board (United States) (PCAOB) and are required to be independent with respect to the Funds in accordance with the U.S. federal securities laws and the applicable rules and regulations of the Securities and Exchange Commission and the PCAOB.
We conducted our audits in accordance with the standards of the PCAOB. Those standards require that we plan and perform the audit to obtain reasonable assurance about whether the financial statements and financial highlights are free of material misstatement, whether due to error or fraud. The Funds are not required to have, nor were we engaged to perform, an audit of their internal control over financial reporting. As part of our audits we are required to obtain an understanding of internal control over financial reporting but not for the purpose of expressing an opinion on the effectiveness of the Funds’ internal control over financial reporting. Accordingly, we express no such opinion.
Our audits included performing procedures to assess the risks of material misstatement of the financial statements and financial highlights, whether due to error or fraud, and performing procedures that respond to those risks. Such procedures included examining, on a test basis, evidence regarding the amounts and disclosures in the financial statements and financial highlights. Our audits also included evaluating the accounting principles used and significant estimates made by management, as well as evaluating the overall presentation of the financial statements and financial highlights. Our procedures included confirmation of securities owned as of May 31, 2020, by correspondence with the custodian, transfer agent, agent banks, and brokers; when replies were not received from agent banks or brokers, we performed other auditing procedures. We believe that our audits provide a reasonable basis for our opinion.

Denver, Colorado
July 28, 2020
We have served as the auditor of one or more Stone Harbor Investment Partners investment companies since 2008.
| 20 | www.shiplp.com |
| Stone Harbor Emerging Markets Debt Fund | Statements of Investments |
May 31, 2020
| Currency | Rate | Maturity Date | Principal Amount/Shares* | Value (Expressed in USD) | ||||||||||||
| SOVEREIGN DEBT OBLIGATIONS - 64.88% | ||||||||||||||||
| Angola - 3.81% | ||||||||||||||||
| Republic of Angola: | ||||||||||||||||
| USD | 6M US L + 7.50 | % | 07/01/23 | 20,123,231 | $ | 14,891,191 | (1) | |||||||||
| USD | 6M US L + 4.50 | % | 12/07/23 | 4,104,000 | 3,036,960 | (1) | ||||||||||
| USD | 9.50 | % | 11/12/25 | 9,849,000 | 6,766,570 | (2) | ||||||||||
| USD | 8.25 | % | 05/09/28 | 6,600,000 | 4,123,969 | (2) | ||||||||||
| USD | 8.00 | % | 11/26/29 | 10,126,000 | 6,336,660 | (3) | ||||||||||
| USD | 9.38 | % | 05/08/48 | 1,650,000 | 996,188 | (3) | ||||||||||
| USD | 9.38 | % | 05/08/48 | 1,615,000 | 975,056 | (2) | ||||||||||
| USD | 9.13 | % | 11/26/49 | 7,566,000 | 4,585,706 | (3) | ||||||||||
| 41,712,300 | ||||||||||||||||
| Argentina - 4.38% | ||||||||||||||||
| Republic of Argentina: | ||||||||||||||||
| USD | 6.88 | % | 04/22/21 | 14,931,000 | 6,156,705 | (4) | ||||||||||
| EUR | 3.88 | % | 01/15/22 | 199,000 | 84,356 | (4) | ||||||||||
| USD | 5.63 | % | 01/26/22 | 6,862,000 | 2,744,800 | (4) | ||||||||||
| USD | 4.63 | % | 01/11/23 | 1,902,000 | 769,716 | (4) | ||||||||||
| EUR | 3.38 | % | 01/15/23 | 1,225,000 | 516,728 | (4) | ||||||||||
| USD | 7.50 | % | 04/22/26 | 5,457,000 | 2,094,124 | (4) | ||||||||||
| EUR | 5.00 | % | 01/15/27 | 3,970,000 | 1,564,450 | (4) | ||||||||||
| USD | 6.88 | % | 01/26/27 | 6,834,000 | 2,511,495 | (4) | ||||||||||
| USD | 5.88 | % | 01/11/28 | 5,409,000 | 1,987,807 | (4) | ||||||||||
| EUR | 5.25 | % | 01/15/28 | 540,000 | 209,800 | (4) | ||||||||||
| USD | 6.63 | % | 07/06/28 | 2,310,000 | 846,398 | (4) | ||||||||||
| EUR | 7.82 | % | 12/31/33 | 57,187,798 | 27,176,975 | (4) | ||||||||||
| EUR | 6.25 | % | 11/09/47 | 400,000 | 150,967 | (4) | ||||||||||
| USD | 7.13 | % | 06/28/17 | 3,100,000 | 1,116,000 | (4) | ||||||||||
| 47,930,321 | ||||||||||||||||
| Belarus - 0.38% | ||||||||||||||||
| Republic of Belarus: | ||||||||||||||||
| USD | 7.63 | % | 06/29/27 | 2,805,000 | 3,017,128 | (2) | ||||||||||
| USD | 6.20 | % | 02/28/30 | 1,203,000 | 1,194,165 | (2) | ||||||||||
| 4,211,293 | ||||||||||||||||
| Benin - 0.50% | ||||||||||||||||
| Republic of Benin | EUR | 5.75 | % | 03/26/26 | 5,526,000 | 5,502,514 | (3) | |||||||||
| Brazil - 2.33% | ||||||||||||||||
| Fed Republic of Brazil: | ||||||||||||||||
| USD | 6.00 | % | 04/07/26 | 1,713,000 | 1,927,125 | |||||||||||
| USD | 4.63 | % | 01/13/28 | 2,928,000 | 3,069,825 | |||||||||||
| USD | 5.00 | % | 01/27/45 | 2,312,000 | 2,202,180 | |||||||||||
| USD | 4.75 | % | 01/14/50 | 8,374,000 | 7,739,408 | |||||||||||
| State of Minas Gerais: | ||||||||||||||||
| USD | 5.33 | % | 02/15/28 | 1,480,800 | 1,498,616 | (3) | ||||||||||
| USD | 5.33 | % | 02/15/28 | 8,990,400 | 9,098,565 | (2) | ||||||||||
| 25,535,719 | ||||||||||||||||
See Notes to Financial Statements.
| Stone Harbor Investment Funds Annual Report | May 31, 2020 | 21 |
| Stone Harbor Emerging Markets Debt Fund | Statements of Investments |
May 31, 2020
| Currency | Rate | Maturity Date | Principal Amount/Shares* | Value (Expressed in USD) | ||||||||||||
| Cameroon - 0.16% | ||||||||||||||||
| Republic of Cameroon: | ||||||||||||||||
| USD | 9.50 | % | 11/19/25 | 403,000 | $ | 391,477 | (3) | |||||||||
| USD | 9.50 | % | 11/19/25 | 1,354,000 | 1,315,284 | (2) | ||||||||||
| 1,706,761 | ||||||||||||||||
| Colombia - 1.52% | ||||||||||||||||
| Republic of Colombia: | ||||||||||||||||
| USD | 8.13 | % | 05/21/24 | 2,703,000 | 3,252,891 | |||||||||||
| USD | 3.88 | % | 04/25/27 | 4,551,000 | 4,857,482 | |||||||||||
| USD | 5.00 | % | 06/15/45 | 7,465,000 | 8,501,935 | |||||||||||
| 16,612,308 | ||||||||||||||||
| Costa Rica - 0.77% | ||||||||||||||||
| Costa Rica Government: | ||||||||||||||||
| USD | 4.38 | % | 04/30/25 | 1,807,000 | 1,503,198 | (2) | ||||||||||
| USD | 6.13 | % | 02/19/31 | 2,329,000 | 1,917,786 | (2) | ||||||||||
| USD | 5.63 | % | 04/30/43 | 1,703,000 | 1,194,229 | (3) | ||||||||||
| USD | 7.16 | % | 03/12/45 | 4,784,000 | 3,776,370 | (3) | ||||||||||
| 8,391,583 | ||||||||||||||||
| Dominican Republic - 2.21% | ||||||||||||||||
| Dominican Republic: | ||||||||||||||||
| USD | 7.50 | % | 05/06/21 | 3,581,333 | 3,674,784 | (2) | ||||||||||
| USD | 6.60 | % | 01/28/24 | 1,632,000 | 1,692,690 | (2) | ||||||||||
| USD | 5.88 | % | 04/18/24 | 2,537,000 | 2,574,262 | (3) | ||||||||||
| USD | 6.88 | % | 01/29/26 | 2,379,000 | 2,460,035 | (2) | ||||||||||
| USD | 5.95 | % | 01/25/27 | 1,040,000 | 1,015,138 | (2) | ||||||||||
| USD | 7.45 | % | 04/30/44 | 1,587,000 | 1,572,866 | (3) | ||||||||||
| USD | 6.85 | % | 01/27/45 | 1,000,000 | 945,312 | (2) | ||||||||||
| USD | 6.50 | % | 02/15/48 | 5,315,000 | 4,836,650 | (2) | ||||||||||
| USD | 5.88 | % | 01/30/60 | 6,321,000 | 5,397,541 | (3) | ||||||||||
| 24,169,278 | ||||||||||||||||
| Ecuador - 3.28% | ||||||||||||||||
| Ecuador Social Bond Sarl | USD | 0.00 | % | 01/30/35 | 7,017,000 | 2,372,452 | (3)(4)(5) | |||||||||
| Republic of Ecuador: | ||||||||||||||||
| USD | 10.75 | % | 03/28/22 | 9,200,000 | 4,103,200 | (2)(4) | ||||||||||
| USD | 7.95 | % | 06/20/24 | 897,000 | 383,916 | (3)(4) | ||||||||||
| USD | 7.88 | % | 03/27/25 | 2,796,000 | 1,063,878 | (2)(4) | ||||||||||
| USD | 9.65 | % | 12/13/26 | 3,496,000 | 1,317,992 | (2)(4) | ||||||||||
| USD | 9.63 | % | 06/02/27 | 1,689,000 | 627,463 | (2)(4) | ||||||||||
| USD | 8.88 | % | 10/23/27 | 18,550,000 | 6,807,850 | (2)(4) | ||||||||||
| USD | 7.78 | % | 01/23/28 | 1,800,000 | 642,150 | (2)(4)(6) | ||||||||||
| USD | 7.78 | % | 01/23/28 | 3,493,000 | 1,246,128 | (3)(4)(6) | ||||||||||
| USD | 10.65 | % | 01/31/29 | 38,571,000 | 14,039,844 | (3)(4)(6) | ||||||||||
| USD | 10.65 | % | 01/31/29 | 8,350,000 | 3,039,400 | (2)(4) | ||||||||||
| USD | 9.50 | % | 03/27/30 | 732,000 | 269,742 | (3)(4) | ||||||||||
| 35,914,015 | ||||||||||||||||
| Egypt - 2.95% | ||||||||||||||||
| Republic of Egypt: | ||||||||||||||||
| USD | 6.13 | % | 01/31/22 | 779,000 | 793,119 | (3) | ||||||||||
See Notes to Financial Statements.
| 22 | www.shiplp.com |
| Stone Harbor Emerging Markets Debt Fund | Statements of Investments |
May 31, 2020
| Currency | Rate | Maturity Date | Principal Amount/Shares* | Value (Expressed in USD) | ||||||||||||
| Egypt (continued) | ||||||||||||||||
| Republic of Egypt: (continued) | ||||||||||||||||
| USD | 5.88 | % | 06/11/25 | 936,000 | $ | 939,949 | (3) | |||||||||
| EUR | 4.75 | % | 04/16/26 | 2,252,000 | 2,362,343 | (3) | ||||||||||
| USD | 6.59 | % | 02/21/28 | 1,229,000 | 1,202,307 | (3) | ||||||||||
| EUR | 5.63 | % | 04/16/30 | 550,000 | 546,899 | (2) | ||||||||||
| EUR | 5.63 | % | 04/16/30 | 12,542,000 | 12,471,292 | (3) | ||||||||||
| EUR | 6.38 | % | 04/11/31 | 5,102,000 | 5,174,117 | (3) | ||||||||||
| EUR | 6.38 | % | 04/11/31 | 1,943,000 | 1,970,465 | (2) | ||||||||||
| USD | 7.05 | % | 01/15/32 | 1,753,000 | 1,668,089 | (3) | ||||||||||
| USD | 8.50 | % | 01/31/47 | 1,751,000 | 1,710,782 | (2) | ||||||||||
| USD | 7.90 | % | 02/21/48 | 938,000 | 872,780 | (2) | ||||||||||
| USD | 8.15 | % | 11/20/59 | 2,749,000 | 2,545,832 | (3) | ||||||||||
| 32,257,974 | ||||||||||||||||
| El Salvador - 1.92% | ||||||||||||||||
| Republic of El Salvador: | ||||||||||||||||
| USD | 7.75 | % | 01/24/23 | 2,173,000 | 1,961,812 | (2) | ||||||||||
| USD | 5.88 | % | 01/30/25 | 3,785,000 | 3,105,474 | (2) | ||||||||||
| USD | 6.38 | % | 01/18/27 | 1,600,000 | 1,322,750 | (2) | ||||||||||
| USD | 8.25 | % | 04/10/32 | 867,000 | 730,854 | (3) | ||||||||||
| USD | 8.25 | % | 04/10/32 | 8,692,000 | 7,327,085 | (2) | ||||||||||
| USD | 7.65 | % | 06/15/35 | 3,950,000 | 3,189,625 | (2) | ||||||||||
| USD | 7.63 | % | 02/01/41 | 4,341,000 | 3,380,554 | (2) | ||||||||||
| 21,018,154 | ||||||||||||||||
| Ethiopia - 0.17% | ||||||||||||||||
| Federal Democratic Republic of Ethiopia | USD | 6.63 | % | 12/11/24 | 1,982,000 | 1,857,506 | (3) | |||||||||
| Gabon - 0.87% | ||||||||||||||||
| Republic of Gabon: | ||||||||||||||||
| USD | 6.38 | % | 12/12/24 | 5,839,000 | 5,311,665 | (2) | ||||||||||
| USD | 6.95 | % | 06/16/25 | 4,682,000 | 4,178,685 | (3) | ||||||||||
| 9,490,350 | ||||||||||||||||
| Ghana - 3.19% | ||||||||||||||||
| Republic of Ghana: | ||||||||||||||||
| USD | 7.88 | % | 08/07/23 | 1,228,000 | 1,218,790 | (2) | ||||||||||
| USD | 6.38 | % | 02/11/27 | 4,276,000 | 3,839,046 | (3) | ||||||||||
| USD | 7.88 | % | 03/26/27 | 1,999,000 | 1,889,992 | (3) | ||||||||||
| USD | 7.63 | % | 05/16/29 | 1,846,000 | 1,653,901 | (3) | ||||||||||
| USD | 7.63 | % | 05/16/29 | 5,400,000 | 4,838,063 | (2) | ||||||||||
| USD | 10.75 | % | 10/14/30 | 3,451,000 | 3,887,767 | (2) | ||||||||||
| USD | 8.13 | % | 03/26/32 | 3,254,000 | 2,879,790 | (3) | ||||||||||
| USD | 8.13 | % | 03/26/32 | 1,305,000 | 1,154,925 | (2) | ||||||||||
| USD | 7.88 | % | 02/11/35 | 4,250,000 | 3,670,938 | (3) | ||||||||||
| USD | 8.63 | % | 06/16/49 | 2,077,000 | 1,812,182 | (3) | ||||||||||
| USD | 8.95 | % | 03/26/51 | 7,981,000 | 7,002,081 | (3) | ||||||||||
| USD | 8.75 | % | 03/11/61 | 1,230,000 | 1,071,253 | (3) | ||||||||||
| 34,918,728 | ||||||||||||||||
See Notes to Financial Statements.
| Stone Harbor Investment Funds Annual Report | May 31, 2020 | 23 |
| Stone Harbor Emerging Markets Debt Fund | Statements of Investments |
May 31, 2020
| Currency | Rate | Maturity Date | Principal Amount/Shares* | Value (Expressed in USD) | ||||||||||||
| Indonesia - 1.09% | ||||||||||||||||
| Republic of Indonesia: | ||||||||||||||||
| USD | 2.85 | % | 02/14/30 | 3,232,000 | $ | 3,306,740 | ||||||||||
| USD | 8.50 | % | 10/12/35 | 2,547,000 | 3,930,339 | (2) | ||||||||||
| USD | 5.25 | % | 01/17/42 | 1,380,000 | 1,682,091 | (2) | ||||||||||
| USD | 6.75 | % | 01/15/44 | 948,000 | 1,367,490 | (2) | ||||||||||
| USD | 5.13 | % | 01/15/45 | 670,000 | 813,213 | (2) | ||||||||||
| USD | 5.25 | % | 01/08/47 | 664,000 | 823,256 | (3) | ||||||||||
| 11,923,129 | ||||||||||||||||
| Ivory Coast - 1.92% | ||||||||||||||||
| Ivory Coast Government: | ||||||||||||||||
| EUR | 5.25 | % | 03/22/30 | 8,457,000 | 8,488,532 | (2) | ||||||||||
| EUR | 5.88 | % | 10/17/31 | 5,008,000 | 5,082,263 | (3) | ||||||||||
| EUR | 5.88 | % | 10/17/31 | 1,489,000 | 1,511,080 | (2) | ||||||||||
| USD | 6.13 | % | 06/15/33 | 205,000 | 194,334 | (2) | ||||||||||
| EUR | 6.88 | % | 10/17/40 | 5,594,000 | 5,686,655 | (2) | ||||||||||
| 20,962,864 | ||||||||||||||||
| Jamaica - 0.29% | ||||||||||||||||
| Government of Jamaica | USD | 7.88 | % | 07/28/45 | 2,862,000 | 3,184,422 | ||||||||||
| Kenya - 1.36% | ||||||||||||||||
| Republic of Kenya: | ||||||||||||||||
| USD | 6.88 | % | 06/24/24 | 6,250,000 | 6,039,062 | (3) | ||||||||||
| USD | 7.00 | % | 05/22/27 | 1,951,000 | 1,864,120 | (3) | ||||||||||
| USD | 7.25 | % | 02/28/28 | 2,616,000 | 2,488,879 | (2) | ||||||||||
| USD | 8.25 | % | 02/28/48 | 2,861,000 | 2,688,446 | (3) | ||||||||||
| USD | 8.25 | % | 02/28/48 | 1,980,000 | 1,860,581 | (2) | ||||||||||
| 14,941,088 | ||||||||||||||||
| Lebanon - 0.55% | ||||||||||||||||
| Lebanese Republic: | ||||||||||||||||
| USD | 8.25 | % | 04/12/21 | 5,803,000 | 1,087,156 | (2)(4) | ||||||||||
| USD | 6.00 | % | 01/27/23 | 3,176,000 | 587,560 | (4) | ||||||||||
| USD | 6.40 | % | 05/26/23 | 1,400,000 | 257,250 | (4) | ||||||||||
| USD | 6.65 | % | 04/22/24 | 4,700,000 | 851,141 | (4) | ||||||||||
| USD | 6.60 | % | 11/27/26 | 4,525,000 | 826,519 | (4) | ||||||||||
| USD | 6.65 | % | 02/26/30 | 4,400,000 | 803,000 | (4) | ||||||||||
| USD | 8.20 | % | 05/17/33 | 9,575,000 | 1,627,750 | (4) | ||||||||||
| 6,040,376 | ||||||||||||||||
| Malaysia - 1.53% | ||||||||||||||||
| 1mdb Global Investments | USD | 4.40 | % | 03/09/23 | 18,000,000 | 16,785,002 | (2) | |||||||||
| Mexico - 2.06% | ||||||||||||||||
| United Mexican States: | ||||||||||||||||
| USD | 4.50 | % | 04/22/29 | 2,711,000 | 2,936,775 | |||||||||||
| USD | 4.75 | % | 04/27/32 | 11,989,000 | 13,008,065 | |||||||||||
| USD | 6.05 | % | 01/11/40 | 3,354,000 | 4,065,677 | |||||||||||
See Notes to Financial Statements.
| 24 | www.shiplp.com |
| Stone Harbor Emerging Markets Debt Fund | Statements of Investments |
May 31, 2020
| Currency | Rate | Maturity Date | Principal Amount/Shares* | Value (Expressed in USD) | ||||||||||||
| Mexico (continued) | ||||||||||||||||
| United Mexican States: (continued) | ||||||||||||||||
| USD | 4.75 | % | 03/08/44 | 2,446,000 | $ | 2,574,033 | ||||||||||
| 22,584,550 | ||||||||||||||||
| Mozambique - 0.81% | ||||||||||||||||
| Republic of Mozambique | USD | 5.00 | % | 09/15/31 | 11,017,000 | 8,901,392 | (3) | |||||||||
| Nigeria - 3.10% | ||||||||||||||||
| Republic of Nigeria: | ||||||||||||||||
| USD | 6.50 | % | 11/28/27 | 13,520,000 | 12,091,950 | (3) | ||||||||||
| USD | 7.14 | % | 02/23/30 | 2,116,000 | 1,865,386 | (3) | ||||||||||
| USD | 8.75 | % | 01/21/31 | 4,040,000 | 3,824,112 | (3) | ||||||||||
| USD | 7.88 | % | 02/16/32 | 10,609,000 | 9,470,190 | (3) | ||||||||||
| USD | 7.70 | % | 02/23/38 | 1,880,000 | 1,612,394 | (3) | ||||||||||
| USD | 7.70 | % | 02/23/38 | 5,855,000 | 5,021,577 | (2) | ||||||||||
| 33,885,609 | ||||||||||||||||
| Oman - 1.71% | ||||||||||||||||
| Oman Government: | ||||||||||||||||
| USD | 4.88 | % | 02/01/25 | 1,158,000 | 1,025,916 | (3) | ||||||||||
| USD | 5.63 | % | 01/17/28 | 8,771,000 | 7,367,640 | (3) | ||||||||||
| USD | 6.50 | % | 03/08/47 | 3,831,000 | 2,900,785 | (3) | ||||||||||
| USD | 6.75 | % | 01/17/48 | 9,801,000 | 7,445,697 | (2) | ||||||||||
| 18,740,038 | ||||||||||||||||
| Pakistan - 0.57% | ||||||||||||||||
| Republic of Pakistan: | ||||||||||||||||
| USD | 6.88 | % | 12/05/27 | 3,714,000 | 3,468,327 | (2) | ||||||||||
| USD | 6.88 | % | 12/05/27 | 2,511,000 | 2,344,903 | (3) | ||||||||||
| USD | 7.88 | % | 03/31/36 | 473,000 | 438,707 | (2) | ||||||||||
| 6,251,937 | ||||||||||||||||
| Panama - 1.07% | ||||||||||||||||
| Republic of Panama: | ||||||||||||||||
| USD | 4.00 | % | 09/22/24 | 4,091,000 | 4,432,982 | |||||||||||
| USD | 9.38 | % | 04/01/29 | 4,988,000 | 7,311,317 | |||||||||||
| 11,744,299 | ||||||||||||||||
| Papua New Guinea - 1.03% | ||||||||||||||||
| Papua New Guinea Government: | ||||||||||||||||
| USD | 8.38 | % | 10/04/28 | 9,410,000 | 8,563,100 | (3) | ||||||||||
| USD | 8.38 | % | 10/04/28 | 2,930,000 | 2,666,300 | (2) | ||||||||||
| 11,229,400 | ||||||||||||||||
| Peru - 0.02% | ||||||||||||||||
| Republic of Peru | USD | 6.55 | % | 03/14/37 | 155,000 | 235,116 | ||||||||||
See Notes to Financial Statements.
| Stone Harbor Investment Funds Annual Report | May 31, 2020 | 25 |
| Stone Harbor Emerging Markets Debt Fund | Statements of Investments |
May 31, 2020
| Currency | Rate | Maturity Date | Principal Amount/Shares* | Value (Expressed in USD) | ||||||||||||
| Qatar - 1.91% | ||||||||||||||||
| State of Qatar: | ||||||||||||||||
| USD | 4.00 | % | 03/14/29 | 4,406,000 | $ | 4,978,780 | (3) | |||||||||
| USD | 4.00 | % | 03/14/29 | 8,272,000 | 9,347,360 | (2) | ||||||||||
| USD | 5.75 | % | 01/20/42 | 1,798,000 | 2,508,210 | (3) | ||||||||||
| USD | 4.82 | % | 03/14/49 | 3,222,000 | 4,062,741 | (3) | ||||||||||
| 20,897,091 | ||||||||||||||||
| Romania - 1.21% | ||||||||||||||||
| Republic of Romania: | ||||||||||||||||
| EUR | 3.88 | % | 10/29/35 | 1,746,000 | 2,052,014 | (2) | ||||||||||
| EUR | 3.38 | % | 02/08/38 | 3,170,000 | 3,522,159 | (2) | ||||||||||
| EUR | 4.13 | % | 03/11/39 | 4,085,000 | 4,859,769 | |||||||||||
| EUR | 4.63 | % | 04/03/49 | 907,000 | 1,134,398 | (2) | ||||||||||
| EUR | 4.63 | % | 04/03/49 | 732,000 | 915,523 | (3) | ||||||||||
| EUR | 3.38 | % | 01/28/50 | 698,000 | 744,912 | (3) | ||||||||||
| 13,228,775 | ||||||||||||||||
| Russia - 1.17% | ||||||||||||||||
| Russian Federation: | ||||||||||||||||
| USD | 5.10 | % | 03/28/35 | 5,000,000 | 6,275,000 | (3) | ||||||||||
| USD | 5.63 | % | 04/04/42 | 3,800,000 | 5,207,781 | (2) | ||||||||||
| USD | 5.25 | % | 06/23/47 | 1,000,000 | 1,351,250 | (2) | ||||||||||
| 12,834,031 | ||||||||||||||||
| Saudi Arabia - 2.41% | ||||||||||||||||
| Kingdom of Saudi Arabia: | ||||||||||||||||
| USD | 3.25 | % | 10/22/30 | 6,400,000 | 6,640,000 | (3) | ||||||||||
| USD | 4.50 | % | 10/26/46 | 1,064,000 | 1,191,680 | (3) | ||||||||||
| USD | 4.50 | % | 10/26/46 | 4,578,000 | 5,127,360 | (2) | ||||||||||
| USD | 5.00 | % | 04/17/49 | 3,038,000 | 3,602,403 | (3) | ||||||||||
| USD | 5.00 | % | 04/17/49 | 2,123,000 | 2,517,414 | (2) | ||||||||||
| USD | 5.25 | % | 01/16/50 | 625,000 | 765,625 | (2) | ||||||||||
| USD | 4.50 | % | 04/22/60 | 5,922,000 | 6,573,420 | (3) | ||||||||||
| 26,417,902 | ||||||||||||||||
| South Africa - 0.64% | ||||||||||||||||
| Republic of South Africa: | ||||||||||||||||
| USD | 4.88 | % | 04/14/26 | 2,464,000 | 2,415,490 | |||||||||||
| USD | 5.00 | % | 10/12/46 | 1,208,000 | 963,569 | |||||||||||
| USD | 5.75 | % | 09/30/49 | 4,455,000 | 3,655,884 | |||||||||||
| 7,034,943 | ||||||||||||||||
| Sri Lanka - 1.20% | ||||||||||||||||
| Republic of Sri Lanka: | ||||||||||||||||
| USD | 6.25 | % | 10/04/20 | 340,000 | 305,522 | (2) | ||||||||||
| USD | 6.25 | % | 07/27/21 | 4,631,000 | 3,287,287 | (2) | ||||||||||
| USD | 5.88 | % | 07/25/22 | 462,000 | 283,047 | (3) | ||||||||||
| USD | 5.75 | % | 04/18/23 | 3,046,000 | 1,834,739 | (3) | ||||||||||
| USD | 6.13 | % | 06/03/25 | 758,000 | 422,850 | (3) | ||||||||||
| USD | 6.85 | % | 11/03/25 | 3,656,000 | 2,037,078 | (2) | ||||||||||
| USD | 6.20 | % | 05/11/27 | 1,145,000 | 636,369 | (2) | ||||||||||
| USD | 6.75 | % | 04/18/28 | 4,142,000 | 2,293,632 | (3) | ||||||||||
See Notes to Financial Statements.
| 26 | www.shiplp.com |
| Stone Harbor Emerging Markets Debt Fund | Statements of Investments |
May 31, 2020
| Currency | Rate | Maturity Date | Principal Amount/Shares* | Value (Expressed in USD) | ||||||||||||
| Sri Lanka (continued) | ||||||||||||||||
| Republic of Sri Lanka: (continued) | ||||||||||||||||
| USD | 7.85 | % | 03/14/29 | 3,222,000 | $ | 1,786,700 | (3) | |||||||||
| USD | 7.55 | % | 03/28/30 | 529,000 | 291,611 | (2) | ||||||||||
| 13,178,835 | ||||||||||||||||
| Trinidad & Tobago - 0.44% | ||||||||||||||||
| Trinidad & Tobago | USD | 4.38 | % | 01/16/24 | 4,954,000 | 4,808,476 | (2) | |||||||||
| Tunisia - 0.18% | ||||||||||||||||
| Banque Centrale de Tunisie: | ||||||||||||||||
| EUR | 5.63 | % | 02/17/24 | 1,825,000 | 1,789,705 | |||||||||||
| USD | 5.75 | % | 01/30/25 | 200,000 | 176,343 | (2) | ||||||||||
| 1,966,048 | ||||||||||||||||
| Turkey - 3.25% | ||||||||||||||||
| Hazine Mustesarligi Varl | USD | 5.80 | % | 02/21/22 | 9,400,000 | 9,477,843 | (3) | |||||||||
| Republic of Turkey: | ||||||||||||||||
| USD | 6.25 | % | 09/26/22 | 693,000 | 703,179 | |||||||||||
| USD | 5.75 | % | 03/22/24 | 5,448,000 | 5,339,891 | |||||||||||
| USD | 5.13 | % | 02/17/28 | 2,753,000 | 2,451,030 | |||||||||||
| USD | 6.13 | % | 10/24/28 | 6,541,000 | 6,140,364 | |||||||||||
| USD | 7.63 | % | 04/26/29 | 821,000 | 839,601 | |||||||||||
| USD | 5.25 | % | 03/13/30 | 200,000 | 172,500 | |||||||||||
| USD | 6.88 | % | 03/17/36 | 6,308,000 | 5,820,115 | |||||||||||
| USD | 6.63 | % | 02/17/45 | 1,179,000 | 1,019,835 | |||||||||||
| USD | 5.75 | % | 05/11/47 | 4,554,000 | 3,574,890 | |||||||||||
| 35,539,248 | ||||||||||||||||
| Ukraine - 3.86% | ||||||||||||||||
| Ukraine Government: | ||||||||||||||||
| USD | 7.75 | % | 09/01/21 | 4,029,000 | 4,070,317 | (2) | ||||||||||
| USD | 7.75 | % | 09/01/22 | 1,668,000 | 1,685,514 | (2) | ||||||||||
| USD | 7.75 | % | 09/01/23 | 3,977,000 | 4,016,770 | (2) | ||||||||||
| USD | 7.75 | % | 09/01/24 | 627,000 | 632,643 | (3) | ||||||||||
| EUR | 6.75 | % | 06/20/26 | 4,460,000 | 4,803,073 | (3) | ||||||||||
| USD | 7.75 | % | 09/01/26 | 2,794,000 | 2,796,794 | (3) | ||||||||||
| USD | 7.75 | % | 09/01/26 | 3,774,000 | 3,777,774 | (2) | ||||||||||
| USD | 7.75 | % | 09/01/27 | 3,027,000 | 3,006,189 | (2) | ||||||||||
| USD | 9.75 | % | 11/01/28 | 272,000 | 292,995 | (2) | ||||||||||
| EUR | 4.38 | % | 01/27/30 | 5,331,000 | 4,837,702 | (3) | ||||||||||
| USD | 7.38 | % | 09/25/32 | 2,045,000 | 1,958,088 | (3) | ||||||||||
| USD | 7.38 | % | 09/25/32 | 500,000 | 478,750 | (2) | ||||||||||
| USD | 0.00 | % | 05/31/40 | 11,503,000 | 9,863,823 | (1)(5) | ||||||||||
| 42,220,432 | ||||||||||||||||
| United Arab Emirates - 0.41% | ||||||||||||||||
| Abu Dhabi Government International | USD | 4.13 | % | 10/11/47 | 3,789,000 | 4,484,637 | (3) | |||||||||
| Uruguay - 2.17% | ||||||||||||||||
| Republic of Uruguay: | ||||||||||||||||
| USD | 4.38 | % | 10/27/27 | 13,760,705 | 15,433,491 | |||||||||||
See Notes to Financial Statements.
| Stone Harbor Investment Funds Annual Report | May 31, 2020 | 27 |
| Stone Harbor Emerging Markets Debt Fund | Statements of Investments |
May 31, 2020
| Currency | Rate | Maturity Date | Principal Amount/Shares* | Value (Expressed in USD) | ||||||||||||
| Uruguay (continued) | ||||||||||||||||
| Republic of Uruguay: (continued) | ||||||||||||||||
| USD | 5.10 | % | 06/18/50 | 1,907,000 | $ | 2,347,100 | ||||||||||
| USD | 4.98 | % | 04/20/55 | 4,930,000 | 6,022,303 | |||||||||||
| 23,802,894 | ||||||||||||||||
| Venezuela - 0.15% | ||||||||||||||||
| Republic of Venezuela: | ||||||||||||||||
| USD | 7.75 | % | 10/13/19 | 25,087,500 | 1,567,969 | (4) | ||||||||||
| USD | 9.25 | % | 05/07/28 | 1,927,000 | 120,437 | (4) | ||||||||||
| 1,688,406 | ||||||||||||||||
| Zambia - 0.33% | ||||||||||||||||
| Republic of Zambia: | ||||||||||||||||
| USD | 5.38 | % | 09/20/22 | 3,297,000 | 1,522,287 | (3) | ||||||||||
| USD | 5.38 | % | 09/20/22 | 3,998,000 | 1,845,952 | (2) | ||||||||||
| USD | 8.50 | % | 04/14/24 | 428,000 | 197,749 | (3) | ||||||||||
| 3,565,988 | ||||||||||||||||
| TOTAL SOVEREIGN DEBT OBLIGATIONS | 710,305,732 | |||||||||||||||
| (Cost $762,604,370) | ||||||||||||||||
| CORPORATE BONDS - 32.66% | ||||||||||||||||
| Argentina - 0.10% | ||||||||||||||||
| MSU Energy SA | USD | 6.88 | % | 02/01/25 | 733,000 | 405,326 | (3) | |||||||||
| Pampa Energia SA | USD | 7.50 | % | 01/24/27 | 859,000 | 648,277 | (3) | |||||||||
| 1,053,603 | ||||||||||||||||
| Azerbaijan - 0.52% | ||||||||||||||||
| Southern Gas Corridor CJSC | USD | 6.88 | % | 03/24/26 | 4,936,000 | 5,694,910 | (3) | |||||||||
| Bahrain - 0.47% | ||||||||||||||||
| Oil and Gas Holding Co. BSCC | USD | 7.63 | % | 11/07/24 | 4,932,000 | 5,144,693 | (3) | |||||||||
| Brazil - 1.91% | ||||||||||||||||
| Adecoagro SA | USD | 6.00 | % | 09/21/27 | 4,679,000 | 4,169,691 | (3) | |||||||||
| Banco do Brasil SA | USD | 10Y US TI + 6.36% | Perpetual | 1,400,000 | 1,412,600 | (1)(2)(7) | ||||||||||
| CSN Resources SA | USD | 7.63 | % | 04/17/26 | 1,566,000 | 1,291,950 | (3) | |||||||||
| Gol Finance SA | USD | 7.00 | % | 01/31/25 | 2,771,000 | 1,281,588 | (3) | |||||||||
| JSL Europe SA | USD | 7.75 | % | 07/26/24 | 1,909,000 | 1,883,209 | (3) | |||||||||
| Marb Bondco PLC | USD | 6.88 | % | 01/19/25 | 416,000 | 421,200 | (3) | |||||||||
| Minerva Luxembourg SA | USD | 6.50 | % | 09/20/26 | 1,272,000 | 1,284,720 | (3) | |||||||||
| MV24 Capital BV | USD | 6.75 | % | 06/01/34 | 2,377,391 | 2,216,917 | (3) | |||||||||
| NBM US Holdings, Inc. | USD | 7.00 | % | 05/14/26 | 1,278,000 | 1,293,975 | (3) | |||||||||
| Petrobras Global Finance BV: | ||||||||||||||||
| USD | 6.00 | % | 01/27/28 | 2,083,000 | 2,099,664 | |||||||||||
| USD | 5.75 | % | 02/01/29 | 1,606,000 | 1,611,702 | |||||||||||
| Usiminas International Sarl | USD | 5.88 | % | 07/18/26 | 2,093,000 | 1,928,830 | (3) | |||||||||
| 20,896,046 | ||||||||||||||||
See Notes to Financial Statements.
| 28 | www.shiplp.com |
| Stone Harbor Emerging Markets Debt Fund | Statements of Investments |
May 31, 2020
| Currency | Rate | Maturity Date | Principal Amount/Shares* | Value (Expressed in USD) | ||||||||||||
| Chile - 2.54% | ||||||||||||||||
| Codelco, Inc.: | ||||||||||||||||
| USD | 4.50 | % | 09/16/25 | 6,128,000 | $ | 6,815,485 | (3) | |||||||||
| USD | 5.63 | % | 10/18/43 | 1,497,000 | 1,916,862 | (2) | ||||||||||
| USD | 4.38 | % | 02/05/49 | 6,658,000 | 7,390,380 | (3) | ||||||||||
| USD | 4.38 | % | 02/05/49 | 1,550,000 | 1,720,500 | (2) | ||||||||||
| Corp Nacional del Cobre de Chile: | ||||||||||||||||
| USD | 3.00 | % | 09/30/29 | 3,880,000 | 3,990,944 | (3) | ||||||||||
| USD | 3.70 | % | 01/30/50 | 858,000 | 857,195 | (3) | ||||||||||
| Empresa Nacional del Petroleo | USD | 5.25 | % | 11/06/29 | 1,525,000 | 1,680,550 | (2) | |||||||||
| Geopark, Ltd.: | ||||||||||||||||
| USD | 6.50 | % | 09/21/24 | 2,393,000 | 2,265,498 | (3) | ||||||||||
| USD | 5.50 | % | 01/17/27 | 1,380,000 | 1,155,750 | (3) | ||||||||||
| 27,793,164 | ||||||||||||||||
| China - 0.26% | ||||||||||||||||
| ENN Clean Energy International Investment, Ltd. | USD | 7.50 | % | 02/27/21 | 1,698,000 | 1,714,980 | ||||||||||
| Wanda Properties International Co., Ltd. | USD | 7.25 | % | 01/29/24 | 1,283,000 | 1,175,549 | ||||||||||
| 2,890,529 | ||||||||||||||||
| Colombia - 1.50% | ||||||||||||||||
| AI Candelaria Spain SLU | USD | 7.50 | % | 12/15/28 | 5,251,000 | 5,161,470 | (3) | |||||||||
| Ecopetrol SA: | ||||||||||||||||
| USD | 6.88 | % | 04/29/30 | 8,851,000 | 10,158,735 | |||||||||||
| USD | 5.88 | % | 05/28/45 | 546,000 | 570,297 | |||||||||||
| Gran Tierra Energy International Holdings, Ltd. | USD | 6.25 | % | 02/15/25 | 1,940,000 | 498,338 | (3) | |||||||||
| 16,388,840 | ||||||||||||||||
| Costa Rica - 0.09% | ||||||||||||||||
| Instituto Costarricense de Electricidad | USD | 6.95 | % | 11/10/21 | 1,000,000 | 955,781 | (2) | |||||||||
| Ghana - 0.39% | ||||||||||||||||
| Kosmos Energy, Ltd. | USD | 7.13 | % | 04/04/26 | 2,531,000 | 2,063,556 | (3) | |||||||||
| Tullow Oil PLC | USD | 7.00 | % | 03/01/25 | 3,798,000 | 2,193,345 | (3) | |||||||||
| 4,256,901 | ||||||||||||||||
| India - 0.12% | ||||||||||||||||
| Network i2i, Ltd. | USD | 5Y US TI + 4.28% | Perpetual | 1,330,000 | 1,297,166 | (1)(3)(7) | ||||||||||
| Indonesia - 2.89% | ||||||||||||||||
| Indonesia Asahan Aluminium Persero PT: | ||||||||||||||||
| USD | 5.71 | % | 11/15/23 | 2,367,000 | 2,523,814 | (3) | ||||||||||
| USD | 5.45 | % | 05/15/30 | 6,856,000 | 7,368,143 | (3) | ||||||||||
| USD | 6.76 | % | 11/15/48 | 1,754,000 | 2,060,950 | (3) | ||||||||||
| USD | 5.80 | % | 05/15/50 | 541,000 | 583,468 | (3) | ||||||||||
| Pertamina Persero PT: | ||||||||||||||||
| USD | 6.00 | % | 05/03/42 | 1,922,000 | 2,219,910 | (2) | ||||||||||
| USD | 5.63 | % | 05/20/43 | 4,428,000 | 4,975,965 | (2) | ||||||||||
| USD | 6.45 | % | 05/30/44 | 7,649,000 | 9,399,904 | (2) | ||||||||||
See Notes to Financial Statements.
| Stone Harbor Investment Funds Annual Report | May 31, 2020 | 29 |
| Stone Harbor Emerging Markets Debt Fund | Statements of Investments |
May 31, 2020
| Currency | Rate | Maturity Date | Principal Amount/Shares* | Value (Expressed in USD) | ||||||||||||
| Indonesia (continued) | ||||||||||||||||
| Perusahaan Listrik Negara PT | USD | 5.45 | % | 05/21/28 | 2,300,000 | $ | 2,571,688 | (2) | ||||||||
| PT Bakrie & Brothers TBK | IDR | 0.00 | % | 12/22/22 | 6,750,674,000 | 47 | (5)(8) | |||||||||
| 31,703,889 | ||||||||||||||||
| Kazakhstan - 3.35% | ||||||||||||||||
| KazMunayGas National Co. JSC: | ||||||||||||||||
| USD | 4.75 | % | 04/24/25 | 6,009,000 | 6,364,846 | (3) | ||||||||||
| USD | 5.38 | % | 04/24/30 | 7,374,000 | 8,273,858 | (2) | ||||||||||
| USD | 5.75 | % | 04/19/47 | 7,266,000 | 8,263,486 | (3) | ||||||||||
| USD | 6.38 | % | 10/24/48 | 6,544,000 | 7,931,532 | (3) | ||||||||||
| KazTransGas JSC | USD | 4.38 | % | 09/26/27 | 5,774,000 | 5,833,443 | (3) | |||||||||
| 36,667,165 | ||||||||||||||||
| Malaysia - 0.28% | ||||||||||||||||
| 1MDB Energy, Ltd. | USD | 5.99 | % | 05/11/22 | 3,000,000 | 3,082,498 | ||||||||||
| Mexico - 8.27% | ||||||||||||||||
| Aerovias de Mexico SA de CV | USD | 7.00 | % | 02/05/25 | 2,388,000 | 597,000 | (3) | |||||||||
| Axtel SAB Axtel de CV | USD | 6.38 | % | 11/14/24 | 2,321,000 | 2,339,336 | (3) | |||||||||
| Banco Mercantil del Norte SA/Grand Cayman: | ||||||||||||||||
| USD | 6.75 | % | Perpetual | 1,486,000 | 1,415,461 | (3)(7) | ||||||||||
| USD | 7.50 | % | Perpetual | 2,615,000 | 2,510,400 | (3)(7) | ||||||||||
| Banco Nacional de Comercio Exterior SNC: | ||||||||||||||||
| USD | 3.80 | % | 08/11/26 | 3,289,000 | 3,201,122 | (1)(3) | ||||||||||
| USD | 3.80 | % | 08/11/26 | 2,056,000 | 2,001,066 | (1)(2) | ||||||||||
| Cometa Energia SA de CV | USD | 6.38 | % | 04/24/35 | 2,599,200 | 2,582,955 | (3) | |||||||||
| Petroleos Mexicanos: | ||||||||||||||||
| USD | 6.88 | % | 08/04/26 | 7,300,000 | 6,695,925 | |||||||||||
| USD | 6.49 | % | 01/23/27 | 1,006,000 | 887,795 | (3) | ||||||||||
| USD | 9.50 | % | 09/15/27 | 1,062,000 | 1,043,249 | |||||||||||
| USD | 5.35 | % | 02/12/28 | 1,267,000 | 1,032,009 | |||||||||||
| USD | 6.50 | % | 01/23/29 | 19,153,000 | 16,431,359 | |||||||||||
| USD | 6.84 | % | 01/23/30 | 8,683,000 | 7,457,830 | (3) | ||||||||||
| USD | 6.84 | % | 01/23/30 | 4,759,000 | 4,087,506 | (2) | ||||||||||
| USD | 5.95 | % | 01/28/31 | 7,330,000 | 5,955,625 | (3) | ||||||||||
| USD | 6.63 | % | 06/15/35 | 700,000 | 562,380 | |||||||||||
| USD | 5.63 | % | 01/23/46 | 653,000 | 466,895 | |||||||||||
| USD | 6.75 | % | 09/21/47 | 3,084,000 | 2,405,520 | |||||||||||
| USD | 7.69 | % | 01/23/50 | 30,074,000 | 25,186,975 | (3) | ||||||||||
| USD | 7.69 | % | 01/23/50 | 768,000 | 643,200 | (2) | ||||||||||
| USD | 6.95 | % | 01/28/60 | 3,998,000 | 3,069,464 | (3) | ||||||||||
| 90,573,072 | ||||||||||||||||
| Nigeria - 0.09% | ||||||||||||||||
| IHS Netherlands Holdco BV | USD | 8.00 | % | 09/18/27 | 1,024,000 | 1,011,200 | (3) | |||||||||
| Panama - 0.66% | ||||||||||||||||
| Aeropuerto Internacional de Tocumen SA: | ||||||||||||||||
| USD | 5.63 | % | 05/18/36 | 1,929,000 | 2,008,873 | (2) | ||||||||||
| USD | 6.00 | % | 11/18/48 | 2,626,339 | 2,731,392 | (3) | ||||||||||
See Notes to Financial Statements.
| 30 | www.shiplp.com |
| Stone Harbor Emerging Markets Debt Fund | Statements of Investments |
May 31, 2020
| Currency | Rate | Maturity Date | Principal Amount/Shares* | Value (Expressed in USD) | ||||||||||||
| Panama (continued) | ||||||||||||||||
| C&W Senior Financing DAC | USD | 6.88 | % | 09/15/27 | 2,563,000 | $ | 2,550,185 | (3) | ||||||||
| 7,290,450 | ||||||||||||||||
| Peru - 2.03% | ||||||||||||||||
| Inkia Energy, Ltd. | USD | 5.88 | % | 11/09/27 | 113,000 | 110,369 | (3) | |||||||||
| Peru Payroll Deduction Finance Ltd. | USD | 0.00 | % | 11/01/29 | 2,548,967 | 1,978,636 | (5) | |||||||||
| Petroleos del Peru SA: | ||||||||||||||||
| USD | 4.75 | % | 06/19/32 | 2,020,000 | 2,201,800 | (3) | ||||||||||
| USD | 4.75 | % | 06/19/32 | 8,689,000 | 9,471,010 | (2) | ||||||||||
| USD | 5.63 | % | 06/19/47 | 7,428,000 | 8,449,351 | (2) | ||||||||||
| 22,211,166 | ||||||||||||||||
| Saudi Arabia - 0.88% | ||||||||||||||||
| Acwa Power Management And Investments One, Ltd. | USD | 5.95 | % | 12/15/39 | 5,671,000 | 5,841,130 | (3) | |||||||||
| Saudi Arabian Oil Co.: | ||||||||||||||||
| USD | 2.88 | % | 04/16/24 | 2,328,000 | 2,409,480 | (2) | ||||||||||
| USD | 4.25 | % | 04/16/39 | 1,305,000 | 1,430,939 | (3) | ||||||||||
| 9,681,549 | ||||||||||||||||
| South Africa - 1.80% | ||||||||||||||||
| Eskom Holdings SOC, Ltd.: | ||||||||||||||||
| USD | 5.75 | % | 01/26/21 | 9,725,000 | 9,263,062 | (3) | ||||||||||
| USD | 6.75 | % | 08/06/23 | 5,327,000 | 4,962,433 | (3) | ||||||||||
| USD | 7.13 | % | 02/11/25 | 3,494,000 | 3,183,908 | (3) | ||||||||||
| USD | 8.45 | % | 08/10/28 | 2,516,000 | 2,291,133 | (3) | ||||||||||
| 19,700,536 | ||||||||||||||||
| Ukraine - 1.05% | ||||||||||||||||
| Metinvest BV: | ||||||||||||||||
| USD | 8.50 | % | 04/23/26 | 654,000 | 585,739 | (3) | ||||||||||
| USD | 8.50 | % | 04/23/26 | 2,200,000 | 1,970,375 | (2) | ||||||||||
| USD | 7.75 | % | 10/17/29 | 5,611,000 | 4,825,460 | (3) | ||||||||||
| NAK Naftogaz Ukraine via Kondor Finance PLC | USD | 7.63 | % | 11/08/26 | 3,373,000 | 3,127,403 | (3) | |||||||||
| State Savings Bank of Ukraine Via SSB #1 PLC | USD | 9.63 | % | 03/20/25 | 350,000 | 354,375 | (2)(6) | |||||||||
| Ukreximbank Via Biz Finance PLC | USD | 9.63 | % | 04/27/22 | 600,000 | 609,469 | (2) | |||||||||
| 11,472,821 | ||||||||||||||||
| United Arab Emirates - 2.70% | ||||||||||||||||
| Abu Dhabi Crude Oil Pipeline: | ||||||||||||||||
| USD | 3.65 | % | 11/02/29 | 4,957,000 | 5,551,840 | (3) | ||||||||||
| USD | 4.60 | % | 11/02/47 | 861,000 | 992,706 | (3) | ||||||||||
| DP World PLC: | ||||||||||||||||
| USD | 5.63 | % | 09/25/48 | 7,482,000 | 7,570,288 | (3) | ||||||||||
| USD | 4.70 | % | 09/30/49 | 1,007,000 | 927,541 | (3) | ||||||||||
| USD | 4.70 | % | 09/30/49 | 500,000 | 460,547 | (2) | ||||||||||
| DP World, Ltd. | USD | 6.85 | % | 07/02/37 | 1,543,000 | 1,812,061 | (3) | |||||||||
| MDGH - GMTN BV: | ||||||||||||||||
| USD | 4.50 | % | 11/07/28 | 707,000 | 824,384 | (3) | ||||||||||
| USD | 4.50 | % | 11/07/28 | 7,571,000 | 8,828,023 | (2) | ||||||||||
See Notes to Financial Statements.
| Stone Harbor Investment Funds Annual Report | May 31, 2020 | 31 |
| Stone Harbor Emerging Markets Debt Fund | Statements of Investments |
May 31, 2020
| Currency | Rate | Maturity Date | Principal Amount/Shares* | Value (Expressed in USD) | ||||||||||||
| United Arab Emirates (continued) | ||||||||||||||||
| MDGH - GMTN BV: (continued) | ||||||||||||||||
| USD | 2.88 | % | 11/07/29 | 2,482,000 | $ | 2,572,903 | (3) | |||||||||
| 29,540,293 | ||||||||||||||||
| Venezuela - 0.29% | ||||||||||||||||
| Petroleos de Venezuela SA: | ||||||||||||||||
| USD | 6.00 | % | 05/16/24 | 60,489,976 | 2,510,334 | (2)(4) | ||||||||||
| USD | 6.00 | % | 11/15/26 | 3,307,000 | 137,241 | (2)(4) | ||||||||||
| USD | 5.38 | % | 04/12/27 | 600,000 | 24,900 | (4) | ||||||||||
| USD | 9.75 | % | 05/17/35 | 11,517,000 | 477,955 | (4) | ||||||||||
| 3,150,430 | ||||||||||||||||
| Vietnam - 0.23% | ||||||||||||||||
| Mong Duong Finance Holdings BV | USD | 5.13 | % | 05/07/29 | 2,540,000 | 2,491,581 | (3) | |||||||||
| Zambia - 0.24% | ||||||||||||||||
| First Quantum Minerals, Ltd.: | ||||||||||||||||
| USD | 7.50 | % | 04/01/25 | 1,200,000 | 1,091,544 | (3) | ||||||||||
| USD | 6.88 | % | 03/01/26 | 1,670,000 | 1,509,972 | (3) | ||||||||||
| 2,601,516 | ||||||||||||||||
| TOTAL CORPORATE BONDS | 357,549,799 | |||||||||||||||
| (Cost $386,969,786) | ||||||||||||||||
| CREDIT LINKED NOTES - 0.80% | ||||||||||||||||
| Iraq - 0.80% | ||||||||||||||||
| Republic of Iraq (Counterparty: Bank of America - Merrill Lynch): | ||||||||||||||||
| JPY | 2.89 | % | 01/01/28 | 236,468,685 | 1,640,337 | (1)(8) | ||||||||||
| JPY | 0.00 | % | 01/01/28 | 508,649,009 | 3,537,362 | (5)(8) | ||||||||||
| JPY | 0.00 | % | 01/01/28 | 518,177,969 | 3,606,993 | (5)(8) | ||||||||||
| 8,784,692 | ||||||||||||||||
| TOTAL CREDIT LINKED NOTES | 8,784,692 | |||||||||||||||
| (Cost $11,379,427) | ||||||||||||||||
| Contracts | Currency | Exercise Price | Expiration Date | Notional Amount | Value (Expressed in USD) | |||||||||||||||
| PURCHASED OPTIONS - 0.01% | ||||||||||||||||||||
| Foreign Currency Call Option - 0.01% | ||||||||||||||||||||
| Hong Kong Dollar (Goldman Sachs) | 92,832,738 | USD | 7.86 | 9/1/2020 | 92,832,738 | 70,077 | ||||||||||||||
| TOTAL PURCHASED OPTIONS | 70,077 | |||||||||||||||||||
| (Cost $898,304) | ||||||||||||||||||||
See Notes to Financial Statements.
| 32 | www.shiplp.com |
| Stone Harbor Emerging Markets Debt Fund | Statements of Investments |
| May 31, 2020 |
| Currency | Rate | Maturity Date | Principal Amount/Shares* | Value (Expressed in USD) | ||||||||||||
| SHORT TERM INVESTMENTS - 0.73% | ||||||||||||||||
| Money Market Fund - 0.73% | ||||||||||||||||
| State Street Institutional Liquid Reserves Fund - Institutional Class (7-Day SEC Yield) | USD | 0.45 | % | N/A | 7,972,405 | $ | 7,976,391 | |||||||||
| TOTAL SHORT TERM INVESTMENTS | 7,976,391 | |||||||||||||||
| (Cost $7,973,989) | ||||||||||||||||
| Total Investments - 99.08% | 1,084,686,691 | |||||||||||||||
| (Cost $1,169,825,876) | ||||||||||||||||
| Other Assets In Excess of Liabilities - 0.92% | 10,026,739 | (9) | ||||||||||||||
| Net Assets - 100.00% | $ | 1,094,713,430 | ||||||||||||||
| * | The principal amount/shares of each security is stated in the currency in which the security is denominated. |
| Currency Abbreviations: | ||
| EUR | - | Euro Currency |
| IDR | - | Indonesian Rupiah |
| JPY | - | Japanese Yen |
| USD | - | United States Dollar |
Investment Abbreviations:
LIBOR - London Interbank Offered Rate
Reference Rates:
6M US L - 6 Month LIBOR as of May 31, 2020 was 0.51%
5Y US TI - 5 Year US Treasury Index as of May 31, 2020 was 0.30%
10Y US TI - 10 Year US Treasury Index as of May 31, 2020 was 0.65%
| (1) | Floating or variable rate security. The reference rate is described above. The rate in effect as of May 31, 2020 is based on the reference rate plus the displayed spread as of the security's last reset date. Certain variable rate securities are not based on a published reference rate and spread but are determined by the issuer or agent and are based on current market conditions. These securities do not indicate a reference rate and spread in their description. |
| (2) | Securities were originally issued pursuant to Regulation S under the Securities Act of 1933, which exempts securities offered and sold outside of the United States from registration. Such securities cannot be sold in the United States without either an effective registration statement filed pursuant to the Securities Act of 1933, or pursuant to an exemption from registration. As of May 31, 2020, the aggregate fair value of those securities was $310,162,390, which represents approximately 28.33% of net assets. |
| (3) | Security exempt from registration under Rule 144A of the Securities Act of 1933. Such securities may normally be sold to qualified institutional buyers in transactions exempt from registration. Total fair value of Rule 144A securities amounts to $488,120,186, which represents approximately 44.59% of net assets as of May 31, 2020. |
| (4) | Security is in default and therefore is non-income producing. |
| (5) | Issued with a zero coupon. Income is recognized through the accretion of discount. |
| (6) | Step bond. Coupon changes periodically based upon a predetermined schedule. Interest rate disclosed is that which is in effect as of May 31, 2020. |
| (7) | Security has no contractual maturity date, is not redeemable and contractually pays an indefinite stream of interest. |
| (8) | The level 3 assets were valued using significant unobservable inputs as a result of unavailable quoted prices from an active market or the unavailability of other significant observable inputs. |
| (9) | Includes cash which is being held as collateral for forward foreign currency contracts. |
| See Notes to Financial Statements. |
| Stone Harbor Investment Funds Annual Report | May 31, 2020 | 33 |
| Stone Harbor Emerging Markets Debt Fund | Statements of Investments |
| May 31, 2020 |
OUTSTANDING FORWARD FOREIGN CURRENCY CONTRACTS
| Counterparty | Settlement Date | Fund Receiving | U.S. $ Value at May 31, 2020 | Fund Delivering | U.S. $ Value at May 31, 2020 | Unrealized Appreciation/ (Depreciation) | ||||||||||||
| J.P. Morgan Chase & Co. | 06/25/20 | EUR | 13,609,762 | USD | 13,376,897 | 232,865 | ||||||||||||
| $ | 232,865 | |||||||||||||||||
| Citigroup Global Markets | 06/25/20 | USD | 8,103,184 | JPY | 8,329,714 | (226,530 | ) | |||||||||||
| J.P. Morgan Chase & Co. | 06/25/20 | USD | 110,852,334 | EUR | 113,855,880 | (3,003,546 | ) | |||||||||||
| $ | (3,230,076 | ) | ||||||||||||||||
| See Notes to Financial Statements. |
| 34 | www.shiplp.com |
| Stone Harbor High Yield Bond Fund | Statements of Investments |
| May 31, 2020 |
| Currency | Rate | Maturity Date | Principal Amount/Shares* | Value (Expressed in USD) | ||||||||||||
| CORPORATE BONDS - 92.28% | ||||||||||||||||
| Aerospace/Defense - 2.80% | ||||||||||||||||
| Bombardier, Inc. | USD | 6.00 | % | 10/15/22 | 1,039,000 | $ | 673,402 | (1) | ||||||||
| Moog, Inc. | USD | 4.25 | % | 12/15/27 | 200,000 | 191,433 | (1) | |||||||||
| Signature Aviation US Holdings, Inc. | USD | 4.00 | % | 03/01/28 | 287,000 | 254,660 | (1) | |||||||||
| TransDigm, Inc.: | ||||||||||||||||
| USD | 8.00 | % | 12/15/25 | 44,000 | 47,740 | (1) | ||||||||||
| USD | 6.25 | % | 03/15/26 | 648,000 | 664,096 | (1) | ||||||||||
| 1,831,331 | ||||||||||||||||
| Airlines - 0.61% | ||||||||||||||||
| Delta Air Lines, Inc. | USD | 7.00 | % | 05/01/25 | 274,000 | 283,485 | (1) | |||||||||
| United Airlines Holdings, Inc. | USD | 4.88 | % | 01/15/25 | 167,000 | 117,544 | ||||||||||
| 401,029 | ||||||||||||||||
| Automotive - 3.56% | ||||||||||||||||
| Dana Financing Luxembourg Sarl | USD | 6.50 | % | 06/01/26 | 257,000 | 259,217 | (1) | |||||||||
| Ford Motor Co. | USD | 8.50 | % | 04/21/23 | 317,000 | 329,981 | ||||||||||
| Ford Motor Credit Co. LLC | USD | 5.58 | % | 03/18/24 | 485,000 | 484,248 | ||||||||||
| General Motors Co. | USD | 6.80 | % | 10/01/27 | 596,000 | 678,299 | ||||||||||
| Panther BF Aggregator 2 LP / Panther Finance Co., Inc.: | ||||||||||||||||
| USD | 6.25 | % | 05/15/26 | 354,000 | 361,023 | (1) | ||||||||||
| USD | 8.50 | % | 05/15/27 | 224,000 | 220,319 | (1) | ||||||||||
| 2,333,087 | ||||||||||||||||
| Building Products - 3.77% | ||||||||||||||||
| Advanced Drainage Systems, Inc. | USD | 5.00 | % | 09/30/27 | 408,000 | 409,453 | (1) | |||||||||
| American Woodmark Corp. | USD | 4.88 | % | 03/15/26 | 450,000 | 439,227 | (1) | |||||||||
| Beacon Roofing Supply, Inc. | USD | 4.50 | % | 11/15/26 | 243,000 | 238,520 | (1) | |||||||||
| Cemex SAB de CV | USD | 5.45 | % | 11/19/29 | 309,000 | 289,173 | (1) | |||||||||
| Griffon Corp., Series WI | USD | 5.75 | % | 03/01/28 | 333,000 | 332,642 | ||||||||||
| TopBuild Corp. | USD | 5.63 | % | 05/01/26 | 358,000 | 366,435 | (1) | |||||||||
| US Concrete, Inc. | USD | 6.38 | % | 06/01/24 | 393,000 | 395,006 | ||||||||||
| 2,470,456 | ||||||||||||||||
| Chemicals - 3.30% | ||||||||||||||||
| CF Industries, Inc. | USD | 5.15 | % | 03/15/34 | 455,000 | 481,078 | ||||||||||
| Chemours Co. | USD | 7.00 | % | 05/15/25 | 303,000 | 295,457 | ||||||||||
| Element Solutions, Inc. | USD | 5.88 | % | 12/01/25 | 505,000 | 520,365 | (1) | |||||||||
| GCP Applied Technologies, Inc. | USD | 5.50 | % | 04/15/26 | 348,000 | 344,151 | (1) | |||||||||
| OCI NV | USD | 6.63 | % | 04/15/23 | 507,000 | 519,675 | (1) | |||||||||
| 2,160,726 | ||||||||||||||||
| Construction Machinery - 0.67% | ||||||||||||||||
| United Rentals North America, Inc. | USD | 6.50 | % | 12/15/26 | 410,000 | 439,137 | ||||||||||
| Containers/Packaging - 0.86% | ||||||||||||||||
| Crown Americas LLC / Crown Americas Capital Corp. VI | USD | 4.75 | % | 02/01/26 | 350,000 | 364,941 | ||||||||||
| Flex Acquisition Co., Inc. | USD | 6.88 | % | 01/15/25 | 195,000 | 197,318 | (1) | |||||||||
| 562,259 | ||||||||||||||||
| See Notes to Financial Statements. |
| Stone Harbor Investment Funds Annual Report | May 31, 2020 | 35 |
| Stone Harbor High Yield Bond Fund | Statements of Investments |
| May 31, 2020 |
| Currency | Rate | Maturity Date | Principal Amount/Shares* | Value (Expressed in USD) | ||||||||||||
| Diversified Manufacturing - 0.88% | ||||||||||||||||
| SPX FLOW, Inc. | USD | 5.63 | % | 08/15/24 | 565,000 | $ | 572,709 | (1) | ||||||||
| Drillers/Services - 1.57% | ||||||||||||||||
| Apergy Corp. | USD | 6.38 | % | 05/01/26 | 325,000 | 299,403 | ||||||||||
| Archrock Partners LP / Archrock Partners Finance Corp. | USD | 6.25 | % | 04/01/28 | 289,000 | 276,176 | (1) | |||||||||
| SESI LLC | USD | 7.75 | % | 09/15/24 | 360,000 | 123,712 | ||||||||||
| Transocean, Inc. | USD | 8.00 | % | 02/01/27 | 596,000 | 330,780 | (1) | |||||||||
| 1,030,071 | ||||||||||||||||
| Electric - 2.83% | ||||||||||||||||
| Calpine Corp. | USD | 4.50 | % | 02/15/28 | 447,000 | 449,935 | (1) | |||||||||
| Covanta Holding Corp. | USD | 5.88 | % | 07/01/25 | 468,000 | 463,954 | ||||||||||
| NRG Energy, Inc. | USD | 5.75 | % | 01/15/28 | 269,000 | 293,260 | ||||||||||
| Vistra Operations Co. LLC: | ||||||||||||||||
| USD | 5.63 | % | 02/15/27 | 460,000 | 489,911 | (1) | ||||||||||
| USD | 5.00 | % | 07/31/27 | 145,000 | 152,042 | (1) | ||||||||||
| 1,849,102 | ||||||||||||||||
| Environmental Services - 0.63% | ||||||||||||||||
| GFL Environmental, Inc.: | ||||||||||||||||
| USD | 5.13 | % | 12/15/26 | 126,000 | 131,433 | (1) | ||||||||||
| USD | 8.50 | % | 05/01/27 | 258,000 | 283,430 | (1) | ||||||||||
| 414,863 | ||||||||||||||||
| Exploration & Production - 5.95% | ||||||||||||||||
| Alta Mesa Holdings LP / Alta Mesa Finance Services Corp. | USD | 7.88 | % | 12/15/24 | 400,000 | 40 | (2)(3) | |||||||||
| Antero Resources Corp. | USD | 5.00 | % | 03/01/25 | 371,000 | 212,629 | ||||||||||
| Hilcorp Energy I LP / Hilcorp Finance Co. | USD | 5.75 | % | 10/01/25 | 599,000 | 541,283 | (1) | |||||||||
| Murphy Oil Corp. | USD | 5.88 | % | 12/01/27 | 299,000 | 278,538 | ||||||||||
| Oasis Petroleum, Inc.: | ||||||||||||||||
| USD | 6.88 | % | 03/15/22 | 462,000 | 89,039 | |||||||||||
| USD | 6.25 | % | 05/01/26 | 122,000 | 20,515 | (1) | ||||||||||
| Occidental Petroleum Corp.: | ||||||||||||||||
| USD | 2.60 | % | 08/13/21 | 785,000 | 759,880 | |||||||||||
| USD | 3.13 | % | 02/15/22 | 801,000 | 754,013 | |||||||||||
| Parsley Energy LLC / Parsley Finance Corp.: | ||||||||||||||||
| USD | 5.38 | % | 01/15/25 | 315,000 | 310,467 | (1) | ||||||||||
| USD | 4.13 | % | 02/15/28 | 180,000 | 168,188 | (1) | ||||||||||
| QEP Resources, Inc. | USD | 5.25 | % | 05/01/23 | 321,000 | 171,936 | ||||||||||
| SM Energy Co. | USD | 6.13 | % | 11/15/22 | 308,000 | 185,882 | ||||||||||
| WPX Energy, Inc.: | ||||||||||||||||
| USD | 5.75 | % | 06/01/26 | 85,000 | 85,247 | |||||||||||
| USD | 4.50 | % | 01/15/30 | 342,000 | 314,105 | |||||||||||
| 3,891,762 | ||||||||||||||||
| Financial Other - 0.74% | ||||||||||||||||
| Springleaf Finance Corp.: | ||||||||||||||||
| USD | 8.88 | % | 06/01/25 | 104,000 | 108,420 | |||||||||||
| USD | 7.13 | % | 03/15/26 | 378,000 | 373,216 | |||||||||||
| 481,636 | ||||||||||||||||
| See Notes to Financial Statements. |
| 36 | www.shiplp.com |
| Stone Harbor High Yield Bond Fund | Statements of Investments |
| May 31, 2020 |
| Currency | Rate | Maturity Date | Principal Amount/Shares* | Value (Expressed in USD) | ||||||||||||
| Food and Beverage - 5.41% | ||||||||||||||||
| Chobani LLC / Chobani Finance Corp., Inc. | USD | 7.50 | % | 04/15/25 | 314,000 | $ | 313,408 | (1) | ||||||||
| Cott Holdings, Inc. | USD | 5.50 | % | 04/01/25 | 443,000 | 447,937 | (1) | |||||||||
| JBS USA LUX SA / JBS USA Food Co. / JBS USA Finance, Inc. | USD | 6.50 | % | 04/15/29 | 578,000 | 629,910 | (1) | |||||||||
| Kraft Heinz Foods Co.: | ||||||||||||||||
| USD | 3.88 | % | 05/15/27 | 432,000 | 451,998 | (1) | ||||||||||
| USD | 3.75 | % | 04/01/30 | 514,000 | 533,153 | (1) | ||||||||||
| Pilgrim's Pride Corp.: | ||||||||||||||||
| USD | 5.88 | % | 09/30/27 | 343,000 | 357,514 | (1) | ||||||||||
| USD | 5.75 | % | 03/15/25 | 290,000 | 297,281 | (1) | ||||||||||
| Post Holdings, Inc.: | ||||||||||||||||
| USD | 5.00 | % | 08/15/26 | 303,000 | 311,276 | (1) | ||||||||||
| USD | 4.63 | % | 04/15/30 | 202,000 | 199,854 | (1) | ||||||||||
| 3,542,331 | ||||||||||||||||
| Gaming - 3.98% | ||||||||||||||||
| Boyd Gaming Corp.: | ||||||||||||||||
| USD | 8.63 | % | 06/01/25 | 325,000 | 348,238 | (1) | ||||||||||
| USD | 6.00 | % | 08/15/26 | 175,000 | 170,812 | |||||||||||
| Churchill Downs, Inc. | USD | 5.50 | % | 04/01/27 | 350,000 | 352,252 | (1) | |||||||||
| International Game Technology PLC | USD | 6.25 | % | 01/15/27 | 401,000 | 408,092 | (1) | |||||||||
| Jacobs Entertainment, Inc. | USD | 7.88 | % | 02/01/24 | 360,000 | 274,912 | (1) | |||||||||
| MGM Growth Properties Operating Partnership LP / MGP Finance Co.-Issuer, Inc. | USD | 5.75 | % | 02/01/27 | 345,000 | 362,410 | ||||||||||
| Station Casinos LLC | USD | 5.00 | % | 10/01/25 | 385,000 | 347,222 | (1) | |||||||||
| VICI Properties LP / VICI Note Co., Inc. | USD | 4.13 | % | 08/15/30 | 355,000 | 343,408 | (1) | |||||||||
| 2,607,346 | ||||||||||||||||
| Gas Pipelines - 5.22% | ||||||||||||||||
| Antero Midstream Partners LP / Antero Midstream Finance Corp.: | ||||||||||||||||
| USD | 5.75 | % | 03/01/27 | 490,000 | 387,421 | (1) | ||||||||||
| USD | 5.75 | % | 01/15/28 | 364,000 | 285,724 | (1) | ||||||||||
| DCP Midstream Operating LP | USD | 5.13 | % | 05/15/29 | 404,000 | 368,575 | ||||||||||
| Genesis Energy LP / Genesis Energy Finance Corp.: | ||||||||||||||||
| USD | 6.00 | % | 05/15/23 | 403,000 | 381,296 | |||||||||||
| USD | 7.75 | % | 02/01/28 | 350,000 | 327,763 | |||||||||||
| Holly Energy Partners LP / Holly Energy Finance Corp. | USD | 5.00 | % | 02/01/28 | 352,000 | 347,545 | (1) | |||||||||
| Tallgrass Energy Partners LP / Tallgrass Energy Finance Corp. | USD | 6.00 | % | 03/01/27 | 427,000 | 394,174 | (1) | |||||||||
| Targa Resources Partners LP / Targa Resources | ||||||||||||||||
| Partners Finance Corp. | USD | 6.50 | % | 07/15/27 | 874,000 | 922,879 | ||||||||||
| 3,415,377 | ||||||||||||||||
| Healthcare - 7.38% | ||||||||||||||||
| Bausch Health Cos., Inc.: | ||||||||||||||||
| USD | 6.13 | % | 04/15/25 | 720,000 | 732,524 | (1) | ||||||||||
| USD | 7.00 | % | 01/15/28 | 444,000 | 467,508 | (1) | ||||||||||
| Centene Corp.: | ||||||||||||||||
| USD | 4.25 | % | 12/15/27 | 401,000 | 419,821 | |||||||||||
| USD | 3.38 | % | 02/15/30 | 263,000 | 265,252 | |||||||||||
| Encompass Health Corp. | USD | 4.50 | % | 02/01/28 | 165,000 | 167,857 | ||||||||||
| HCA, Inc.: | ||||||||||||||||
| USD | 5.38 | % | 09/01/26 | 409,000 | 454,258 | |||||||||||
| USD | 5.63 | % | 09/01/28 | 446,000 | 512,258 | |||||||||||
| See Notes to Financial Statements. |
| Stone Harbor Investment Funds Annual Report | May 31, 2020 | 37 |
| Stone Harbor High Yield Bond Fund | Statements of Investments |
| May 31, 2020 |
| Currency | Rate | Maturity Date | Principal Amount/Shares* | Value (Expressed in USD) | ||||||||||||
| Healthcare (continued) | ||||||||||||||||
| Hologic, Inc. | USD | 4.38 | % | 10/15/25 | 275,000 | $ | 281,846 | (1) | ||||||||
| IQVIA, Inc. | USD | 5.00 | % | 05/15/27 | 363,000 | 379,482 | (1) | |||||||||
| LifePoint Health, Inc. | USD | 4.38 | % | 02/15/27 | 133,000 | 128,761 | (1) | |||||||||
| Tenet Healthcare Corp.: | ||||||||||||||||
| USD | 4.63 | % | 07/15/24 | 482,000 | 489,281 | |||||||||||
| USD | 7.50 | % | 04/01/25 | 109,000 | 119,355 | (1) | ||||||||||
| USD | 6.25 | % | 02/01/27 | 395,000 | 409,443 | (1) | ||||||||||
| 4,827,646 | ||||||||||||||||
| Home Builders - 1.35% | ||||||||||||||||
| KB Home | USD | 4.80 | % | 11/15/29 | 235,000 | 237,861 | ||||||||||
| Mattamy Group Corp. | USD | 4.63 | % | 03/01/30 | 275,000 | 253,645 | (1) | |||||||||
| PulteGroup, Inc. | USD | 5.00 | % | 01/15/27 | 371,000 | 394,338 | ||||||||||
| 885,844 | ||||||||||||||||
| Industrial Other - 1.38% | ||||||||||||||||
| Mueller Water Products, Inc. | USD | 5.50 | % | 06/15/26 | 311,000 | 321,437 | (1) | |||||||||
| Park-Ohio Industries, Inc. | USD | 6.63 | % | 04/15/27 | 342,000 | 265,543 | ||||||||||
| Wesco Distribution Inc. | USD | 7.25 | % | 06/15/28 | 313,000 | 314,285 | (1) | |||||||||
| 901,265 | ||||||||||||||||
| Leisure - 1.39% | ||||||||||||||||
| Live Nation Entertainment, Inc. | USD | 4.75 | % | 10/15/27 | 400,000 | 372,490 | (1) | |||||||||
| NCL Corp., Ltd. | USD | 3.63 | % | 12/15/24 | 401,000 | 241,853 | (1) | |||||||||
| Royal Caribbean Cruises, Ltd.: | ||||||||||||||||
| USD | 5.25 | % | 11/15/22 | 192,000 | 159,510 | |||||||||||
| USD | 3.70 | % | 03/15/28 | 198,000 | 133,913 | |||||||||||
| 907,766 | ||||||||||||||||
| Life - 0.86% | ||||||||||||||||
| Acrisure LLC / Acrisure Finance, Inc.: | ||||||||||||||||
| USD | 8.13 | % | 02/15/24 | 295,000 | 313,572 | (1) | ||||||||||
| USD | 7.00 | % | 11/15/25 | 265,000 | 252,249 | (1) | ||||||||||
| 565,821 | ||||||||||||||||
| Lodging - 0.55% | ||||||||||||||||
| Hilton Domestic Operating Co., Inc. | USD | 4.88 | % | 01/15/30 | 361,000 | 360,244 | ||||||||||
| Media Cable - 7.02% | ||||||||||||||||
| Altice France SA/France | USD | 7.38 | % | 05/01/26 | 632,000 | 668,223 | (1) | |||||||||
| CCO Holdings LLC / CCO Holdings Capital Corp.: | ||||||||||||||||
| USD | 5.13 | % | 05/01/27 | 308,000 | 324,119 | (1) | ||||||||||
| USD | 5.38 | % | 06/01/29 | 381,000 | 411,410 | (1) | ||||||||||
| USD | 4.50 | % | 08/15/30 | 161,000 | 167,415 | (1) | ||||||||||
| CSC Holdings LLC: | ||||||||||||||||
| USD | 5.88 | % | 09/15/22 | 427,000 | 451,136 | |||||||||||
| USD | 7.50 | % | 04/01/28 | 820,000 | 910,532 | (1) | ||||||||||
| DISH DBS Corp. | USD | 7.75 | % | 07/01/26 | 469,000 | 487,673 | ||||||||||
| Midcontinent Communications / Midcontinent Finance Corp. | USD | 5.38 | % | 08/15/27 | 210,000 | 214,948 | (1) | |||||||||
| Telenet Finance Luxembourg Notes Sarl | USD | 5.50 | % | 03/01/28 | 400,000 | 422,000 | (1) | |||||||||
| Ziggo BV: | ||||||||||||||||
| USD | 5.50 | % | 01/15/27 | 313,000 | 329,948 | (1) | ||||||||||
| See Notes to Financial Statements. |
| 38 | www.shiplp.com |
| Stone Harbor High Yield Bond Fund | Statements of Investments |
| May 31, 2020 |
| Currency | Rate | Maturity Date | Principal Amount/Shares* | Value (Expressed in USD) | ||||||||||||
| Media Cable (continued) | ||||||||||||||||
| Ziggo BV (continued) | ||||||||||||||||
| USD | 5.13 | % | 02/28/30 | 201,000 | $ | 206,496 | (1) | |||||||||
| 4,593,900 | ||||||||||||||||
| Media Other - 5.34% | ||||||||||||||||
| AMC Networks, Inc. | USD | 4.75 | % | 08/01/25 | 169,000 | 170,707 | ||||||||||
| Diamond Sports Group LLC / Diamond Sports Finance Co. | USD | 5.38 | % | 08/15/26 | 517,000 | 412,225 | (1) | |||||||||
| Lions Gate Capital Holdings LLC | USD | 6.38 | % | 02/01/24 | 436,000 | 441,182 | (1) | |||||||||
| Netflix, Inc.: | ||||||||||||||||
| USD | 4.88 | % | 04/15/28 | 518,000 | 554,599 | |||||||||||
| USD | 4.88 | % | 06/15/30 | 322,000 | 348,377 | (1) | ||||||||||
| Sirius XM Radio, Inc.: | ||||||||||||||||
| USD | 4.63 | % | 07/15/24 | 235,000 | 241,229 | (1) | ||||||||||
| USD | 5.00 | % | 08/01/27 | 645,000 | 675,518 | (1) | ||||||||||
| TEGNA, Inc. | USD | 4.63 | % | 03/15/28 | 394,000 | 375,224 | (1) | |||||||||
| Terrier Media Buyer, Inc. | USD | 8.88 | % | 12/15/27 | 283,000 | 275,394 | (1) | |||||||||
| 3,494,455 | ||||||||||||||||
| Metals/Mining/Steel - 1.38% | ||||||||||||||||
| Freeport-McMoRan, Inc. | USD | 5.00 | % | 09/01/27 | 564,000 | 573,765 | ||||||||||
| Kaiser Aluminum Corp. | USD | 4.63 | % | 03/01/28 | 345,000 | 326,824 | (1) | |||||||||
| 900,589 | ||||||||||||||||
| Non Captive Finance - 0.89% | ||||||||||||||||
| Ally Financial, Inc. | USD | 8.00 | % | 11/01/31 | 345,000 | 436,140 | ||||||||||
| CIT Group, Inc. | USD | 6.13 | % | 03/09/28 | 143,000 | 148,514 | ||||||||||
| 584,654 | ||||||||||||||||
| Paper/Forest Products - 1.49% | ||||||||||||||||
| Boise Cascade Co. | USD | 5.63 | % | 09/01/24 | 539,000 | 550,397 | (1) | |||||||||
| Louisiana-Pacific Corp. | USD | 4.88 | % | 09/15/24 | 429,000 | 426,364 | ||||||||||
| 976,761 | ||||||||||||||||
| Pharmaceuticals - 2.14% | ||||||||||||||||
| Catalent Pharma Solutions, Inc. | USD | 5.00 | % | 07/15/27 | 335,000 | 344,151 | (1) | |||||||||
| Charles River Laboratories International, Inc. | USD | 5.50 | % | 04/01/26 | 442,000 | 462,816 | (1) | |||||||||
| Endo Finance LLC / Endo Ltd. / Endo Finco, Inc. | USD | 6.00 | % | 02/01/25 | 360,000 | 265,864 | (1) | |||||||||
| Jaguar Holding Co. II / PPD Development LP | USD | 5.00 | % | 06/15/28 | 106,000 | 110,240 | (1) | |||||||||
| Par Pharmaceutical, Inc. | USD | 7.50 | % | 04/01/27 | 210,000 | 214,587 | (1) | |||||||||
| 1,397,658 | ||||||||||||||||
| Property & Casualty Insurance - 0.68% | ||||||||||||||||
| Alliant Holdings Intermediate LLC / Alliant Holdings Co.-Issuer | USD | 6.75 | % | 10/15/27 | 345,000 | 352,678 | (1) | |||||||||
| HUB International, Ltd. | USD | 7.00 | % | 05/01/26 | 89,000 | 91,690 | (1) | |||||||||
| 444,368 | ||||||||||||||||
| Restaurants - 0.72% | ||||||||||||||||
| 1011778 BC ULC / New Red Finance, Inc.: | ||||||||||||||||
| USD | 3.88 | % | 01/15/28 | 165,000 | 162,945 | (1) | ||||||||||
| USD | 4.38 | % | 01/15/28 | 310,000 | 305,293 | (1) | ||||||||||
| 468,238 | ||||||||||||||||
| See Notes to Financial Statements. |
| Stone Harbor Investment Funds Annual Report | May 31, 2020 | 39 |
| Stone Harbor High Yield Bond Fund | Statements of Investments |
| May 31, 2020 |
| Currency | Rate | Maturity Date | Principal Amount/Shares* | Value (Expressed in USD) | ||||||||||||
| Retail Food/Drug - 1.44% | ||||||||||||||||
| Albertsons Cos. Inc / Safeway, Inc. / New Albertsons LP / Albertsons LLC: | ||||||||||||||||
| USD | 5.88 | % | 02/15/28 | 205,000 | $ | 219,900 | (1) | |||||||||
| USD | 4.88 | % | 02/15/30 | 314,000 | 326,364 | (1) | ||||||||||
| Ingles Markets, Inc. | USD | 5.75 | % | 06/15/23 | 392,000 | 395,679 | ||||||||||
| 941,943 | ||||||||||||||||
| Retail Non Food/Drug - 0.56% | ||||||||||||||||
| Murphy Oil USA, Inc. | USD | 4.75 | % | 09/15/29 | 355,000 | 365,655 | ||||||||||
| Satellite - 1.79% | ||||||||||||||||
| Hughes Satellite Systems Corp. | USD | 6.63 | % | 08/01/26 | 503,000 | 526,646 | ||||||||||
| Intelsat Jackson Holdings SA | USD | 5.50 | % | 08/01/23 | 464,000 | 245,969 | (2) | |||||||||
| ViaSat, Inc. | USD | 5.63 | % | 04/15/27 | 395,000 | 400,010 | (1) | |||||||||
| 1,172,625 | ||||||||||||||||
| Services Other - 1.88% | ||||||||||||||||
| Expedia Group, Inc. | USD | 6.25 | % | 05/01/25 | 297,000 | 317,460 | (1) | |||||||||
| Prime Security Services Borrower LLC / Prime Finance, Inc.: | ||||||||||||||||
| USD | 5.75 | % | 04/15/26 | 212,000 | 218,856 | (1) | ||||||||||
| USD | 6.25 | % | 01/15/28 | 266,000 | 252,866 | (1) | ||||||||||
| WW International, Inc. | USD | 8.63 | % | 12/01/25 | 424,000 | 443,566 | (1) | |||||||||
| 1,232,748 | ||||||||||||||||
| Technology - 4.36% | ||||||||||||||||
| Dell International LLC / EMC Corp. | USD | 5.85 | % | 07/15/25 | 138,000 | 154,662 | (1) | |||||||||
| Entegris, Inc. | USD | 4.63 | % | 02/10/26 | 399,000 | 407,802 | (1) | |||||||||
| Fair Isaac Corp. | USD | 4.00 | % | 06/15/28 | 384,000 | 386,640 | (1) | |||||||||
| Nuance Communications, Inc. | USD | 5.63 | % | 12/15/26 | 425,000 | 451,853 | ||||||||||
| Qorvo, Inc. | USD | 5.50 | % | 07/15/26 | 395,000 | 414,689 | ||||||||||
| Seagate HDD Cayman | USD | 4.88 | % | 06/01/27 | 600,000 | 640,298 | ||||||||||
| SS&C Technologies, Inc. | USD | 5.50 | % | 09/30/27 | 380,000 | 400,009 | (1) | |||||||||
| 2,855,953 | ||||||||||||||||
| Textile/Apparel - 1.78% | ||||||||||||||||
| Hanesbrands, Inc. | USD | 4.63 | % | 05/15/24 | 325,000 | 331,534 | (1) | |||||||||
| Levi Strauss & Co. | USD | 5.00 | % | 05/01/25 | 413,000 | 422,766 | ||||||||||
| William Carter Co.: | ||||||||||||||||
| USD | 5.50 | % | 05/15/25 | 80,000 | 82,600 | (1) | ||||||||||
| USD | 5.63 | % | 03/15/27 | 319,000 | 326,782 | (1) | ||||||||||
| 1,163,682 | ||||||||||||||||
| Transportation Non Air/Rail - 0.49% | ||||||||||||||||
| XPO Logistics, Inc.: | ||||||||||||||||
| USD | 6.13 | % | 09/01/23 | 180,000 | 182,719 | (1) | ||||||||||
| USD | 6.75 | % | 08/15/24 | 135,000 | 140,752 | (1) | ||||||||||
| 323,471 | ||||||||||||||||
| Wireless - 2.91% | ||||||||||||||||
| Sprint Corp.: | ||||||||||||||||
| USD | 7.63 | % | 02/15/25 | 868,000 | 1,015,017 | |||||||||||
| USD | 8.75 | % | 03/15/32 | 116,000 | 167,019 | |||||||||||
| See Notes to Financial Statements. |
| 40 | www.shiplp.com |
| Stone Harbor High Yield Bond Fund | Statements of Investments |
| May 31, 2020 |
| Currency | Rate | Maturity Date | Principal Amount/Shares* | Value (Expressed in USD) | ||||||||||||
| Wireless (continued) | ||||||||||||||||
| T-Mobile USA, Inc.: | ||||||||||||||||
| USD | 6.50% | 01/15/26 | 260,000 | $ | 274,980 | |||||||||||
| USD | 5.38% | 04/15/27 | 420,000 | 447,470 | ||||||||||||
| 1,904,486 | ||||||||||||||||
| Wirelines - 1.72% | ||||||||||||||||
| CenturyLink, Inc. | USD | 4.00% | 02/15/27 | 290,000 | 290,094 | (1) | ||||||||||
| Level 3 Financing, Inc. | USD | 4.63% | 09/15/27 | 478,000 | 490,959 | (1) | ||||||||||
| Telecom Italia Capital SA | USD | 6.00% | 09/30/34 | 322,000 | 347,890 | |||||||||||
| 1,128,943 | ||||||||||||||||
| TOTAL CORPORATE BONDS | 60,401,937 | |||||||||||||||
| (Cost $61,476,935) | ||||||||||||||||
| BANK LOANS - 5.86%(4) | ||||||||||||||||
| Automotive - 0.67% | ||||||||||||||||
| Navistar, Inc. - Tranche B Term Loan | USD | 1M US L + 3.50% | 11/06/24 | 454,377 | 438,474 | |||||||||||
| Consumer Products - 0.25% | ||||||||||||||||
| Revlon Consumer Products Corporation - Initial B Term Loan | USD | 3M US L + 3.50% | 09/07/23 | 574,789 | 163,096 | |||||||||||
| Containers/Packaging - 0.52% | ||||||||||||||||
| Flex Acquisition Company, Inc. (aka Novolex) - Initial Term Loan | USD | 3M US L + 3.00% | 12/29/23 | 349,296 | 337,288 | |||||||||||
| Diversified Manufacturing - 0.31% | ||||||||||||||||
| Blount International, Inc. - New Refinancing Term Loan | USD | 1M US L + 3.75% | 04/12/23 | 213,245 | 205,071 | |||||||||||
| Financial Other - 0.51% | ||||||||||||||||
| Refinitiv US Holdings, Inc. - Initial Dollar Term Loan | USD | 1M US L + 3.25% | 10/01/25 | 340,851 | 336,225 | |||||||||||
| Healthcare - 1.27% | ||||||||||||||||
| Envision Healthcare Corporation - Initial Term Loan | USD | 1M US L + 3.75% | 10/10/25 | 438,720 | 291,064 | |||||||||||
| LifePoint Health, Inc. - Term B Loan | USD | 1M US L + 3.75% | 11/16/25 | 561,441 | 539,523 | |||||||||||
| 830,587 | ||||||||||||||||
| Industrial Other - 1.58% | ||||||||||||||||
| Filtration Group Corporation - Initial Dollar Term Loan | USD | 1M US L + 3.00% | 03/29/25 | 509,632 | 495,139 | |||||||||||
| Gates Global LLC - Initial B-2 Dollar Term Loan | USD | 1M US L + 2.75% | 03/31/24 | 558,188 | 536,279 | |||||||||||
| 1,031,418 | ||||||||||||||||
| Technology - 0.75% | ||||||||||||||||
| Avaya, Inc. - Tranche B Term Loan | USD | 1M US L + 4.25% | 12/15/24 | 527,046 | 493,008 | |||||||||||
| TOTAL BANK LOANS | 3,835,167 | |||||||||||||||
| (Cost $4,409,426) | ||||||||||||||||
| COMMON/PREFERRED STOCKS - 0.00%(5) | ||||||||||||||||
| Transportation Non Air/Rail - 0.00%(5) | ||||||||||||||||
| Euronav NV | USD | 31 | 314 | |||||||||||||
| See Notes to Financial Statements. |
| Stone Harbor Investment Funds Annual Report | May 31, 2020 | 41 |
| Stone Harbor High Yield Bond Fund | Statements of Investments |
| May 31, 2020 |
| Currency | Rate | Maturity Date | Principal Amount/Shares* | Value (Expressed in USD) | ||||||||||||
| TOTAL COMMON/PREFERRED STOCKS | $ | 314 | ||||||||||||||
| (Cost $0) | ||||||||||||||||
| SHORT TERM INVESTMENTS - 0.87% | ||||||||||||||||
| Money Market Mutual Funds - 0.87% | ||||||||||||||||
| State Street Institutional Liquid Reserves Fund - Institutional Class (7-Day SEC Yield) | USD | 0.45 | % | N/A | 568,575 | 568,859 | ||||||||||
| TOTAL SHORT TERM INVESTMENTS | 568,859 | |||||||||||||||
| (Cost $567,888) | ||||||||||||||||
| Total Investments - 99.01% | 64,806,277 | |||||||||||||||
| (Cost $66,454,249) | ||||||||||||||||
| Other Assets in Excess of Liabilities - 0.99% | 647,664 | |||||||||||||||
| Net Assets - 100.00% | $ | 65,453,941 | ||||||||||||||
| * | The principal amount/shares of each security is stated in the currency in which the security is denominated. |
Currency Abbreviations:
USD - United States Dollar
Investment Abbreviations:
LIBOR - London Interbank Offered Rate
Reference Rates:
1M US L - 1 Month LIBOR as of May 31, 2020 was 0.18%
3M US L - 3 Month LIBOR as of May 31, 2020 was 0.34%
| (1) | Security exempt from registration under Rule 144A of the Securities Act of 1933. Such securities may normally be sold to qualified institutional buyers in transactions exempt from registration. Total fair value of Rule 144A securities amounts to $36,611,630, which represents approximately 55.93% of net assets as of May 31, 2020. |
| (2) | Security is in default and therefore is non-income producing. |
| (3) | The level 3 assets were valued using significant unobservable inputs as a result of unavailable quoted prices from an active market or the unavailability of other significant observable inputs. |
| (4) | Bank loans generally pay interest at rates which are periodically determined by reference to a base lending rate plus a premium. All loans carry a variable rate of interest. These base lending rates are generally (i) the Prime Rate offered by one or more major United States banks, (ii) the lending rate offered by one or more European banks such as the London Interbank Offered Rate ("LIBOR") or (iii) the Certificate of Deposit rate. Bank Loans, while exempt from registration, under the Securities Act of 1933, contain certain restrictions on resale and cannot be sold publicly. Floating rate bank loans often require prepayments from excess cash flow or permit the borrower to repay at its election. The degree to which borrowers repay, whether as a contractual requirement or at their election, cannot be predicted with accuracy. |
| (5) | Amount represents less than 0.005% of net assets. |
| See Notes to Financial Statements. |
| 42 | www.shiplp.com |
| Stone Harbor Local Markets Fund | Statements of Investments |
May 31, 2020
| Currency | Rate | Maturity Date | Principal Amount/Shares* | Value (Expressed in USD) | ||||||||||||
| SOVEREIGN DEBT OBLIGATIONS - 84.93% | ||||||||||||||||
| Brazil - 4.77% | ||||||||||||||||
| Nota Do Tesouro Nacional: | ||||||||||||||||
| BRL | 10.00 | % | 01/01/23 | 23,570,000 | $ | 5,012,965 | ||||||||||
| BRL | 10.00 | % | 01/01/25 | 8,290,000 | 1,806,528 | |||||||||||
| BRL | 10.00 | % | 01/01/27 | 29,420,000 | 6,474,937 | |||||||||||
| BRL | 10.00 | % | 01/01/29 | 10,870,000 | 2,421,588 | |||||||||||
| 15,716,018 | ||||||||||||||||
| Chile - 2.01% | ||||||||||||||||
| Republic of Chile: | ||||||||||||||||
| CLP | 4.50 | % | 03/01/26 | 2,070,000,000 | 2,989,700 | |||||||||||
| CLP | 4.70 | % | 09/01/30 | 2,380,000,000 | 3,652,143 | (1) | ||||||||||
| 6,641,843 | ||||||||||||||||
| China - 4.38% | ||||||||||||||||
| China Government Bond: | ||||||||||||||||
| CNY | 3.29 | % | 05/23/29 | 39,600,000 | 5,767,010 | |||||||||||
| CNY | 3.13 | % | 11/21/29 | 59,650,000 | 8,659,533 | |||||||||||
| 14,426,543 | ||||||||||||||||
| Colombia - 7.60% | ||||||||||||||||
| Bogota Distrio Capital | COP | 9.75 | % | 07/26/28 | 18,392,000,000 | 5,202,027 | (2) | |||||||||
| Republic of Colombia: | ||||||||||||||||
| COP | 7.75 | % | 04/14/21 | 1,180,000,000 | 325,749 | |||||||||||
| COP | 4.38 | % | 03/21/23 | 2,310,000,000 | 619,613 | |||||||||||
| COP | 9.85 | % | 06/28/27 | 1,610,000,000 | 517,506 | |||||||||||
| Titulos De Tesoreria: | ||||||||||||||||
| COP | 7.00 | % | 05/04/22 | 11,997,000,000 | 3,431,930 | |||||||||||
| COP | 10.00 | % | 07/24/24 | 9,427,000,000 | 3,114,954 | |||||||||||
| COP | 7.50 | % | 08/26/26 | 11,119,600,000 | 3,418,047 | |||||||||||
| COP | 6.00 | % | 04/28/28 | 8,698,300,000 | 2,424,534 | |||||||||||
| COP | 7.75 | % | 09/18/30 | 12,844,000,000 | 3,933,045 | |||||||||||
| COP | 7.00 | % | 06/30/32 | 7,160,900,000 | 2,060,199 | |||||||||||
| 25,047,604 | ||||||||||||||||
| Czech Republic - 3.32% | ||||||||||||||||
| Czech Republic Government: | ||||||||||||||||
| CZK | 2.40 | % | 09/17/25 | 3,910,000 | 177,015 | |||||||||||
| CZK | 1.00 | % | 06/26/26 | 39,100,000 | 1,654,019 | |||||||||||
| CZK | 0.25 | % | 02/10/27 | 110,000,000 | 4,426,395 | |||||||||||
| CZK | 0.95 | % | 05/15/30 | 73,320,000 | 3,086,480 | |||||||||||
| CZK | 4.20 | % | 12/04/36 | 25,700,000 | 1,590,244 | |||||||||||
| 10,934,153 | ||||||||||||||||
| Egypt - 0.35% | ||||||||||||||||
| Republic of Egypt | USD | 7.60 | % | 03/01/29 | 1,130,000 | 1,148,716 | (1) | |||||||||
See Notes to Financial Statements.
| Stone Harbor Investment Funds Annual Report | May 31, 2020 | 43 |
| Stone Harbor Local Markets Fund | Statements of Investments |
May 31, 2020
| Currency | Rate | Maturity Date | Principal Amount/Shares* | Value (Expressed in USD) | ||||||||||||
| Ghana - 0.35% | ||||||||||||||||
| Republic of Ghana | USD | 8.95 | % | 03/26/51 | 1,320,000 | $ | 1,158,094 | (1) | ||||||||
| Indonesia - 12.59% | ||||||||||||||||
| Republic of Indonesia: | ||||||||||||||||
| IDR | 7.00 | % | 05/15/22 | 73,934,000,000 | 5,159,186 | |||||||||||
| IDR | 8.38 | % | 03/15/24 | 7,424,000,000 | 535,585 | |||||||||||
| IDR | 11.00 | % | 09/15/25 | 86,142,000,000 | 6,933,812 | |||||||||||
| IDR | 8.38 | % | 09/15/26 | 41,933,000,000 | 3,068,198 | |||||||||||
| IDR | 7.00 | % | 05/15/27 | 29,350,000,000 | 1,993,831 | |||||||||||
| IDR | 9.00 | % | 03/15/29 | 2,267,000,000 | 170,452 | |||||||||||
| IDR | 7.00 | % | 09/15/30 | 9,898,000,000 | 662,976 | |||||||||||
| IDR | 9.50 | % | 07/15/31 | 3,360,000,000 | 258,957 | |||||||||||
| IDR | 8.25 | % | 06/15/32 | 68,688,000,000 | 4,835,428 | |||||||||||
| IDR | 6.63 | % | 05/15/33 | 96,830,000,000 | 5,971,515 | |||||||||||
| IDR | 8.38 | % | 03/15/34 | 85,960,000,000 | 6,110,162 | |||||||||||
| IDR | 8.25 | % | 05/15/36 | 9,650,000,000 | 678,671 | |||||||||||
| IDR | 7.50 | % | 05/15/38 | 48,800,000,000 | 3,198,220 | |||||||||||
| IDR | 8.38 | % | 04/15/39 | 26,820,000,000 | 1,909,158 | |||||||||||
| 41,486,151 | ||||||||||||||||
| Malaysia - 4.14% | ||||||||||||||||
| Malaysia Government: | ||||||||||||||||
| MYR | 3.62 | % | 11/30/21 | 6,380,000 | 1,500,162 | |||||||||||
| MYR | 3.96 | % | 09/15/25 | 4,520,000 | 1,115,522 | |||||||||||
| MYR | 3.91 | % | 07/15/26 | 5,470,000 | 1,347,463 | |||||||||||
| MYR | 3.50 | % | 05/31/27 | 7,210,000 | 1,752,125 | |||||||||||
| MYR | 3.90 | % | 11/16/27 | 1,870,000 | 464,242 | |||||||||||
| MYR | 3.73 | % | 06/15/28 | 2,350,000 | 575,946 | |||||||||||
| MYR | 3.89 | % | 08/15/29 | 22,230,000 | 5,557,884 | |||||||||||
| MYR | 4.50 | % | 04/15/30 | 5,180,000 | 1,351,149 | |||||||||||
| 13,664,493 | ||||||||||||||||
| Mexico - 8.14% | ||||||||||||||||
| Mexican Bonos: | ||||||||||||||||
| MXN | 5.75 | % | 03/05/26 | 151,630,000 | 6,887,846 | |||||||||||
| MXN | 7.50 | % | 06/03/27 | 59,630,000 | 2,943,916 | |||||||||||
| MXN | 7.75 | % | 05/29/31 | 11,625,000 | 582,237 | |||||||||||
| MXN | 7.75 | % | 11/23/34 | 33,076,000 | 1,655,802 | |||||||||||
| MXN | 10.00 | % | 11/20/36 | 47,726,000 | 2,854,515 | |||||||||||
| MXN | 8.50 | % | 11/18/38 | 78,460,000 | 4,140,777 | |||||||||||
| MXN | 7.75 | % | 11/13/42 | 159,300,000 | 7,758,415 | |||||||||||
| 26,823,508 | ||||||||||||||||
| Peru - 4.27% | ||||||||||||||||
| Republic of Peru: | ||||||||||||||||
| PEN | 5.94 | % | 02/12/29 | 1,160,000 | 389,916 | (1) | ||||||||||
| PEN | 6.15 | % | 08/12/32 | 32,680,000 | 11,051,612 | (1) | ||||||||||
| PEN | 5.40 | % | 08/12/34 | 8,376,000 | 2,639,330 | (1) | ||||||||||
| 14,080,858 | ||||||||||||||||
See Notes to Financial Statements.
| 44 | www.shiplp.com |
| Stone Harbor Local Markets Fund | Statements of Investments |
May 31, 2020
| Currency | Rate | Maturity Date | Principal Amount/Shares* | Value (Expressed in USD) | ||||||||||||
| Poland - 4.74% | ||||||||||||||||
| Republic of Poland: | ||||||||||||||||
| PLN | 2.50 | % | 01/25/23 | 40,000 | $ | 10,572 | ||||||||||
| PLN | 3.25 | % | 07/25/25 | 18,290,000 | 5,140,288 | |||||||||||
| PLN | 2.50 | % | 07/25/26 | 9,250,000 | 2,534,321 | |||||||||||
| PLN | 2.50 | % | 07/25/27 | 14,100,000 | 3,892,304 | |||||||||||
| PLN | 2.75 | % | 10/25/29 | 14,160,000 | 4,043,793 | |||||||||||
| 15,621,278 | ||||||||||||||||
| Romania - 1.50% | ||||||||||||||||
| Romania Government Bond | RON | 5.00 | % | 02/12/29 | 20,140,000 | 4,938,912 | ||||||||||
| Russia - 11.31% | ||||||||||||||||
| Russian Federation: | ||||||||||||||||
| RUB | 7.60 | % | 04/14/21 | 289,890,000 | 4,230,661 | |||||||||||
| RUB | 7.40 | % | 12/07/22 | 559,040,000 | 8,454,762 | |||||||||||
| RUB | 7.00 | % | 08/16/23 | 94,400,000 | 1,432,336 | |||||||||||
| RUB | 8.50 | % | 09/17/31 | 972,630,000 | 17,161,871 | |||||||||||
| RUB | 7.70 | % | 03/23/33 | 278,000,000 | 4,667,302 | |||||||||||
| RUB | 7.70 | % | 03/16/39 | 77,500,000 | 1,341,504 | |||||||||||
| 37,288,436 | ||||||||||||||||
| South Africa - 9.55% | ||||||||||||||||
| Republic of South Africa: | ||||||||||||||||
| ZAR | 10.50 | % | 12/21/26 | 125,073,000 | 8,161,308 | |||||||||||
| ZAR | 8.00 | % | 01/31/30 | 6,900,000 | 370,825 | |||||||||||
| ZAR | 7.00 | % | 02/28/31 | 70,320,000 | 3,376,203 | |||||||||||
| ZAR | 8.88 | % | 02/28/35 | 51,050,000 | 2,583,936 | |||||||||||
| ZAR | 6.25 | % | 03/31/36 | 436,195,000 | 17,002,870 | |||||||||||
| 31,495,142 | ||||||||||||||||
| Thailand - 3.43% | ||||||||||||||||
| Thailand Government: | ||||||||||||||||
| THB | 3.85 | % | 12/12/25 | 50,820,000 | 1,851,481 | |||||||||||
| THB | 2.88 | % | 12/17/28 | 45,460,000 | 1,628,771 | |||||||||||
| THB | 3.78 | % | 06/25/32 | 125,300,000 | 4,945,486 | |||||||||||
| THB | 4.68 | % | 06/29/44 | 60,660,000 | 2,876,110 | |||||||||||
| 11,301,848 | ||||||||||||||||
| Turkey - 2.00% | ||||||||||||||||
| Republic of Turkey: | ||||||||||||||||
| TRY | 12.20 | % | 01/18/23 | 9,580,000 | 1,472,011 | |||||||||||
| TRY | 10.40 | % | 03/20/24 | 14,156,600 | 2,013,484 | |||||||||||
| TRY | 11.00 | % | 02/24/27 | 22,610,000 | 3,116,451 | |||||||||||
| 6,601,946 | ||||||||||||||||
| Ukraine - 0.29% | ||||||||||||||||
| Ukraine Government | USD | 7.75 | % | 09/01/25 | 935,000 | 942,480 | (1) | |||||||||
See Notes to Financial Statements.
| Stone Harbor Investment Funds Annual Report | May 31, 2020 | 45 |
| Stone Harbor Local Markets Fund | Statements of Investments |
May 31, 2020
| Currency | Rate | Maturity Date | Principal Amount/Shares* | Value (Expressed in USD) | ||||||||||||
| Uruguay - 0.19% | ||||||||||||||||
| Republic of Uruguay | UYU | 8.50 | % | 03/15/28 | 29,260,000 | $ | 616,172 | (1) | ||||||||
| TOTAL SOVEREIGN DEBT OBLIGATIONS | 279,934,195 | |||||||||||||||
| (Cost $302,087,889) | ||||||||||||||||
| CORPORATE BONDS - 6.19% | ||||||||||||||||
| Brazil - 1.13% | ||||||||||||||||
| Swiss Insured Brazil Power Finance Sarl | BRL | 9.85 | % | 07/16/32 | 17,535,000 | 3,716,243 | (1) | |||||||||
| Kazakhstan - 0.17% | ||||||||||||||||
| Development Bank of Kazakhstan JSC | KZT | 8.95 | % | 05/04/23 | 266,250,000 | 569,646 | (1) | |||||||||
| Mexico - 4.37% | ||||||||||||||||
| America Movil SAB de CV | MXN | 6.45 | % | 12/05/22 | 161,500,000 | 7,348,006 | ||||||||||
| Petroleos Mexicanos: | ||||||||||||||||
| MXN | 7.47 | % | 11/12/26 | 104,820,000 | 3,679,714 | |||||||||||
| USD | 7.69 | % | 01/23/50 | 4,052,000 | 3,393,550 | (1) | ||||||||||
| 14,421,270 | ||||||||||||||||
| South Africa - 0.52% | ||||||||||||||||
| Eskom Holdings SOC, Ltd. | USD | 5.75 | % | 01/26/21 | 1,790,000 | 1,704,975 | (1) | |||||||||
| TOTAL CORPORATE BONDS | 20,412,134 | |||||||||||||||
| (Cost $23,922,040) | ||||||||||||||||
| SHORT TERM INVESTMENTS - 0.24% | ||||||||||||||||
| Money Market Fund - 0.24% | ||||||||||||||||
| State Street Institutional Liquid Reserves Fund - Institutional Class (7-Day SEC Yield) | USD | 0.45 | % | N/A | 773,190 | 773,577 | ||||||||||
| TOTAL SHORT TERM INVESTMENTS | 773,577 | |||||||||||||||
| (Cost $773,610) | ||||||||||||||||
| Total Investments - 91.36% | 301,119,906 | |||||||||||||||
| (Cost $326,783,539) | ||||||||||||||||
| Other Assets In Excess of Liabilities - 8.64% | 28,476,503 | (3) | ||||||||||||||
| Net Assets - 100.00% | $ | 329,596,409 | ||||||||||||||
| * | The principal amount/shares of each security is stated in the currency in which the security is denominated. |
| Currency Abbreviations: | ||
| BRL | - | Brazilian Real |
| CLP | - | Chilean Peso |
| CNH | - | Chinese Yuan Offshore |
| CNY | - | Chinese Yuan |
| COP | - | Columbian Peso |
| CZK | - | Czech Republic Koruna |
| HUF | - | Hungarian Forint |
| IDR | - | Indonesian Rupiah |
See Notes to Financial Statements.
| 46 | www.shiplp.com |
| Stone Harbor Local Markets Fund | Statements of Investments |
May 31, 2020
| KZT | - | Kazakhstan Tenge |
| MXN | - | Mexican Peso |
| MYR | - | Malaysian Ringgit |
| PEN | - | Peruvian Nuevo Sol |
| PLN | - | Polish Zloty |
| RON | - | Romanian Leu |
| RUB | - | Russian Ruble |
| THB | - | Thai Baht |
| TRY | - | Turkish Lira |
| USD | - | United States Dollar |
| UYU | - | Uruguayan Peso |
| ZAR | - | South African Rand |
| (1) | Security exempt from registration under Rule 144A of the Securities Act of 1933. Such securities may normally be sold to qualified institutional buyers in transactions exempt from registration. Total fair value of Rule 144A securities amounts to $30,982,877, which represents approximately 9.40% of net assets as of May 31, 2020. |
| (2) | Securities were originally issued pursuant to Regulation S under the Securities Act of 1933, which exempts securities offered and sold outside of the United States from registration. Such securities cannot be sold in the United States without either an effective registration statement filed pursuant to the Securities Act of 1933, or pursuant to an exemption from registration. As of May 31, 2020, the aggregate fair value of those securities was $5,202,027, which represents approximately 1.58% of net assets. |
| (3) | Includes cash which is being held as collateral for forward foreign currency contracts. |
| OUTSTANDING FORWARD FOREIGN CURRENCY CONTRACTS | ||||||||||||||||||
| Counterparty | Settlement Date | Fund Receiving | U.S. $ Value at May 31, 2020 | Fund Delivering | U.S. $ Value at May 31, 2020 | Unrealized Appreciation/ (Depreciation) | ||||||||||||
| Citigroup Global Markets | 06/02/20 | BRL | 348,181 | USD | 268,783 | 79,398 | ||||||||||||
| Citigroup Global Markets | 07/31/20 | CLP | 4,784,497 | USD | 4,665,144 | 119,353 | ||||||||||||
| Citigroup Global Markets | 08/06/20 | CZK | 4,795,689 | USD | 4,695,454 | 100,235 | ||||||||||||
| Citigroup Global Markets | 06/26/20 | HUF | 619,470 | USD | 591,289 | 28,181 | ||||||||||||
| Citigroup Global Markets | 06/17/20 | PLN | 1,179,165 | USD | 1,130,018 | 49,147 | ||||||||||||
| Citigroup Global Markets | 07/20/20 | THB | 2,407,184 | USD | 2,342,438 | 64,746 | ||||||||||||
| Goldman Sachs & Co. | 07/02/20 | BRL | 9,909,541 | USD | 9,703,396 | 206,145 | ||||||||||||
| Goldman Sachs & Co. | 08/06/20 | CZK | 3,136,009 | USD | 3,062,672 | 73,337 | ||||||||||||
| Goldman Sachs & Co. | 06/26/20 | HUF | 5,128,642 | USD | 4,902,353 | 226,289 | ||||||||||||
| Goldman Sachs & Co. | 06/17/20 | PLN | 1,178,667 | USD | 1,130,154 | 48,513 | ||||||||||||
| Goldman Sachs & Co. | 06/30/20 | RUB | 432,416 | USD | 414,051 | 18,365 | ||||||||||||
| Goldman Sachs & Co. | 07/20/20 | THB | 2,616,028 | USD | 2,545,665 | 70,363 | ||||||||||||
| Goldman Sachs & Co. | 08/13/20 | ZAR | 1,372,897 | USD | 1,360,016 | 12,881 | ||||||||||||
| HSBC | 07/15/20 | USD | 4,599,194 | CNH | 4,575,739 | 23,455 | ||||||||||||
| J.P. Morgan Chase & Co. | 06/02/20 | BRL | 3,125,761 | USD | 2,906,811 | 218,950 | ||||||||||||
| J.P. Morgan Chase & Co. | 08/06/20 | CZK | 1,353,379 | USD | 1,321,941 | 31,438 | ||||||||||||
| J.P. Morgan Chase & Co. | 06/26/20 | HUF | 4,151,256 | USD | 3,955,903 | 195,353 | ||||||||||||
| J.P. Morgan Chase & Co. | 06/15/20 | IDR | 255,564 | USD | 249,694 | 5,870 | ||||||||||||
| J.P. Morgan Chase & Co. | 06/17/20 | PLN | 2,348,358 | USD | 2,253,056 | 95,302 | ||||||||||||
| J.P. Morgan Chase & Co. | 07/20/20 | THB | 6,426,752 | USD | 6,354,810 | 71,942 | ||||||||||||
| $ | 1,739,263 | |||||||||||||||||
| Citigroup Global Markets | 07/02/20 | BRL | 1,018,157 | USD | 1,023,625 | (5,468 | ) | |||||||||||
| Citigroup Global Markets | 06/19/20 | PEN | 571,310 | USD | 573,874 | (2,564 | ) | |||||||||||
| Citigroup Global Markets | 06/19/20 | USD | 2,909,415 | PEN | 2,916,659 | (7,244 | ) | |||||||||||
| Citigroup Global Markets | 06/17/20 | USD | 362,548 | PLN | 379,427 | (16,879 | ) | |||||||||||
| Citigroup Global Markets | 06/26/20 | USD | 323,097 | HUF | 335,421 | (12,324 | ) | |||||||||||
| Citigroup Global Markets | 06/02/20 | USD | 321,348 | BRL | 348,181 | (26,833 | ) | |||||||||||
| Citigroup Global Markets | 06/15/20 | USD | 869,664 | IDR | 886,940 | (17,276 | ) | |||||||||||
| Citigroup Global Markets | 08/21/20 | USD | 3,379,454 | COP | 3,582,211 | (202,757 | ) | |||||||||||
See Notes to Financial Statements.
| Stone Harbor Investment Funds Annual Report | May 31, 2020 | 47 |
| Stone Harbor Local Markets Fund | Statements of Investments |
May 31, 2020
| OUTSTANDING FORWARD FOREIGN CURRENCY CONTRACTS (continued) | ||||||||||||||||||
| Counterparty | Settlement Date | Fund Receiving | U.S. $ Value at May 31, 2020 | Fund Delivering | U.S. $ Value at May 31, 2020 | Unrealized Appreciation/ (Depreciation) | ||||||||||||
| Citigroup Global Markets | 07/20/20 | USD | 218,104 | THB | 220,112 | (2,008 | ) | |||||||||||
| Citigroup Global Markets | 08/06/20 | USD | 108,493 | CZK | 108,494 | (1 | ) | |||||||||||
| Goldman Sachs & Co. | 06/17/20 | PLN | 841,284 | USD | 858,100 | (16,816 | ) | |||||||||||
| Goldman Sachs & Co. | 06/30/20 | USD | 4,995,525 | RUB | 5,655,983 | (660,458 | ) | |||||||||||
| Goldman Sachs & Co. | 06/19/20 | USD | 1,368,390 | PEN | 1,373,097 | (4,707 | ) | |||||||||||
| Goldman Sachs & Co. | 06/26/20 | USD | 3,339,612 | HUF | 3,471,583 | (131,971 | ) | |||||||||||
| Goldman Sachs & Co. | 08/13/20 | USD | 4,028,909 | ZAR | 4,214,537 | (185,628 | ) | |||||||||||
| Goldman Sachs & Co. | 06/15/20 | USD | 1,782,239 | IDR | 1,822,920 | (40,681 | ) | |||||||||||
| Goldman Sachs & Co. | 07/20/20 | USD | 289,508 | THB | 292,278 | (2,770 | ) | |||||||||||
| J.P. Morgan Chase & Co. | 07/02/20 | BRL | 724,235 | USD | 728,070 | (3,835 | ) | |||||||||||
| J.P. Morgan Chase & Co. | 06/09/20 | PLN | 13,113,087 | USD | 13,161,039 | (47,952 | ) | |||||||||||
| J.P. Morgan Chase & Co. | 06/02/20 | USD | 2,875,069 | BRL | 3,125,761 | (250,692 | ) | |||||||||||
| J.P. Morgan Chase & Co. | 06/15/20 | USD | 2,400,161 | IDR | 2,450,026 | (49,865 | ) | |||||||||||
| J.P. Morgan Chase & Co. | 08/21/20 | USD | 2,919,863 | COP | 3,091,936 | (172,073 | ) | |||||||||||
| J.P. Morgan Chase & Co. | 06/17/20 | USD | 248,650 | PLN | 261,760 | (13,110 | ) | |||||||||||
| J.P. Morgan Chase & Co. | 06/26/20 | USD | 311,023 | HUF | 326,148 | (15,125 | ) | |||||||||||
| J.P. Morgan Chase & Co. | 08/06/20 | USD | 281,283 | CZK | 297,128 | (15,845 | ) | |||||||||||
| $ | (1,904,882 | ) | ||||||||||||||||
See Notes to Financial Statements.
| 48 | www.shiplp.com |
| Stone Harbor Emerging Markets Corporate Debt Fund | Statements of Investments |
May 31, 2020
| Currency | Rate | Maturity Date | Principal Amount/Shares* | Value (Expressed in USD) | ||||||||||||
| SOVEREIGN DEBT OBLIGATIONS - 0.95% | ||||||||||||||||
| Turkey - 0.95% | ||||||||||||||||
| Republic of Turkey | USD | 5.13 | % | 02/17/28 | 60,000 | $ | 53,419 | |||||||||
| TOTAL SOVEREIGN DEBT OBLIGATIONS | 53,419 | |||||||||||||||
| (Cost $50,981) | ||||||||||||||||
| CORPORATE BONDS - 95.45% | ||||||||||||||||
| Argentina - 4.57% | ||||||||||||||||
| MSU Energy SA | USD | 6.88 | % | 02/01/25 | 36,000 | 19,907 | (1) | |||||||||
| Pampa Energia SA | USD | 7.50 | % | 01/24/27 | 64,000 | 48,300 | (1) | |||||||||
| Transportadora de Gas del Sur SA | USD | 6.75 | % | 05/02/25 | 56,000 | 46,340 | (1) | |||||||||
| YPF SA: | ||||||||||||||||
| USD | 8.50 | % | 07/28/25 | 109,000 | 71,777 | (1) | ||||||||||
| USD | 6.95 | % | 07/21/27 | 115,000 | 72,378 | (2) | ||||||||||
| 258,702 | ||||||||||||||||
| Brazil - 13.15% | ||||||||||||||||
| Adecoagro SA | USD | 6.00 | % | 09/21/27 | 27,000 | 24,061 | (1) | |||||||||
| Banco do Brasil SA | USD | 9.00 | % | Perpetual | 6,000 | 6,054 | (1)(3) | |||||||||
| BRF GmbH | USD | 4.35 | % | 09/29/26 | 35,000 | 33,430 | (1) | |||||||||
| CSN Resources SA | USD | 7.63 | % | 04/17/26 | 122,000 | 100,650 | (1) | |||||||||
| Gol Finance SA | USD | 7.00 | % | 01/31/25 | 137,000 | 63,363 | (1) | |||||||||
| Itau Unibanco Holding SA | USD | 6.13 | % | Perpetual | 46,000 | 42,823 | (1)(3) | |||||||||
| JBS Investments II GmbH | USD | 7.00 | % | 01/15/26 | 31,000 | 33,170 | (2) | |||||||||
| JSL Europe SA | USD | 7.75 | % | 07/26/24 | 34,000 | 33,541 | (1) | |||||||||
| Klabin Austria GmbH | USD | 7.00 | % | 04/03/49 | 87,000 | 89,161 | (1) | |||||||||
| Minerva Luxembourg SA | USD | 6.50 | % | 09/20/26 | 44,000 | 44,440 | (1) | |||||||||
| MV24 Capital BV | USD | 6.75 | % | 06/01/34 | 77,899 | 72,641 | (1) | |||||||||
| NBM US Holdings, Inc. | USD | 7.00 | % | 05/14/26 | 47,000 | 47,588 | (1) | |||||||||
| Petrobras Global Finance BV: | ||||||||||||||||
| USD | 5.75 | % | 02/01/29 | 16,000 | 16,057 | |||||||||||
| USD | 6.90 | % | 03/19/49 | 36,000 | 35,991 | |||||||||||
| Usiminas International Sarl | USD | 5.88 | % | 07/18/26 | 111,000 | 102,293 | (1) | |||||||||
| 745,263 | ||||||||||||||||
| Chile - 5.96% | ||||||||||||||||
| Celulosa Arauco y Constitucion SA | USD | 5.50 | % | 04/30/49 | 42,000 | 42,210 | (1) | |||||||||
| Empresa Electrica Angamos SA | USD | 4.88 | % | 05/25/29 | 28,953 | 29,604 | (1) | |||||||||
| Empresa Nacional de Telecomunicaciones SA | USD | 4.88 | % | 10/30/24 | 11,000 | 11,488 | (1) | |||||||||
| Geopark, Ltd.: | ||||||||||||||||
| USD | 6.50 | % | 09/21/24 | 165,000 | 156,209 | (1) | ||||||||||
| USD | 5.50 | % | 01/17/27 | 117,000 | 97,987 | (1) | ||||||||||
| 337,498 | ||||||||||||||||
| China - 5.82% | ||||||||||||||||
| Bank of China, Ltd. | USD | 5.00 | % | 11/13/24 | 46,000 | 50,557 | (2) | |||||||||
| Golden Eagle Retail Group, Ltd. | USD | 4.63 | % | 05/21/23 | 46,000 | 41,716 | (2) | |||||||||
| Tencent Holdings, Ltd.: | ||||||||||||||||
| USD | 2.39 | % | 06/03/30 | 40,000 | 39,999 | (1) | ||||||||||
| USD | 3.24 | % | 06/03/50 | 14,000 | 13,981 | (1) | ||||||||||
See Notes to Financial Statements.
| Stone Harbor Investment Funds Annual Report | May 31, 2020 | 49 |
| Stone Harbor Emerging Markets Corporate Debt Fund | Statements of Investments |
May 31, 2020
| Currency | Rate | Maturity Date | Principal Amount/Shares* | Value (Expressed in USD) | ||||||||||||
| China (continued) | ||||||||||||||||
| Wanda Properties International Co., Ltd. | USD | 7.25 | % | 01/29/24 | 200,000 | $ | 183,250 | |||||||||
| 329,503 | ||||||||||||||||
| Colombia - 4.78% | ||||||||||||||||
| AI Candelaria Spain SLU: | ||||||||||||||||
| USD | 7.50 | % | 12/15/28 | 39,000 | 38,335 | (1) | ||||||||||
| USD | 7.50 | % | 12/15/28 | 20,000 | 19,659 | (2) | ||||||||||
| Ecopetrol SA: | ||||||||||||||||
| USD | 5.38 | % | 06/26/26 | 39,000 | 41,541 | |||||||||||
| USD | 7.38 | % | 09/18/43 | 43,000 | 51,208 | |||||||||||
| Empresas Publicas de Medellin ESP | USD | 4.25 | % | 07/18/29 | 33,000 | 32,567 | (1) | |||||||||
| Gran Tierra Energy International Holdings, Ltd. | USD | 6.25 | % | 02/15/25 | 220,000 | 56,512 | (1) | |||||||||
| Millicom International Cellular SA | USD | 5.13 | % | 01/15/28 | 31,000 | 31,103 | (1) | |||||||||
| 270,925 | ||||||||||||||||
| Ghana - 0.54% | ||||||||||||||||
| Tullow Oil PLC | USD | 7.00 | % | 03/01/25 | 53,000 | 30,607 | (1) | |||||||||
| Guatemala - 0.99% | ||||||||||||||||
| Comcel Trust via Comunicaciones Celulares SA | USD | 6.88 | % | 02/06/24 | 19,000 | 19,425 | (1) | |||||||||
| Energuate Trust | USD | 5.88 | % | 05/03/27 | 38,000 | 36,856 | (1) | |||||||||
| 56,281 | ||||||||||||||||
| Hong Kong - 3.54% | ||||||||||||||||
| ESR Cayman, Ltd. | USD | 7.88 | % | 04/04/22 | 200,000 | 200,406 | ||||||||||
| India - 3.84% | ||||||||||||||||
| Bharti Airtel, Ltd. | USD | 4.38 | % | 06/10/25 | 15,000 | 15,426 | (2) | |||||||||
| Greenko Dutch BV | USD | 5.25 | % | 07/24/24 | 43,000 | 41,233 | (1) | |||||||||
| Network i2i, Ltd. | USD | 5Y US TI + 4.28% | Perpetual | 114,000 | 111,186 | (1)(3)(4) | ||||||||||
| Vedanta Resources Finance II PLC: | ||||||||||||||||
| USD | 8.00 | % | 04/23/23 | 26,000 | 13,666 | (2) | ||||||||||
| USD | 9.25 | % | 04/23/26 | 30,000 | 16,003 | (1) | ||||||||||
| Vedanta Resources, Ltd.: | ||||||||||||||||
| USD | 6.38 | % | 07/30/22 | 17,000 | 9,672 | (1) | ||||||||||
| USD | 6.13 | % | 08/09/24 | 21,000 | 10,644 | (1) | ||||||||||
| 217,830 | ||||||||||||||||
| Indonesia - 2.89% | ||||||||||||||||
| Indo Energy Finance II BV | USD | 6.38 | % | 01/24/23 | 9,690 | 8,538 | (2) | |||||||||
| Minejesa Capital BV | USD | 4.63 | % | 08/10/30 | 140,000 | 139,737 | (1) | |||||||||
| PT Bumi Resources TBK (Eterna Capital Pte, Ltd.) | USD | 6.50% Cash + 1.00% PIK | 12/11/22 | 26,101 | 15,691 | (5) | ||||||||||
| 163,966 | ||||||||||||||||
See Notes to Financial Statements.
| 50 | www.shiplp.com |
| Stone Harbor Emerging Markets Corporate Debt Fund | Statements of Investments |
May 31, 2020
| Currency | Rate | Maturity Date | Principal Amount/Shares* | Value (Expressed in USD) | ||||||||||||
| Israel - 4.30% | ||||||||||||||||
| Altice Financing SA | USD | 5.00 | % | 01/15/28 | 94,000 | $ | 94,969 | (1) | ||||||||
| Teva Pharmaceutical Finance Netherlands III BV | USD | 3.15 | % | 10/01/26 | 164,000 | 148,574 | ||||||||||
| 243,543 | ||||||||||||||||
| Jamaica - 0.27% | ||||||||||||||||
| Digicel Group One, Ltd. | USD | 8.25 | % | 12/30/22 | 14,000 | 8,337 | (2) | |||||||||
| Digicel, Ltd. | USD | 6.75 | % | 03/01/23 | 15,000 | 6,886 | (2)�� | |||||||||
| 15,223 | ||||||||||||||||
| Kazakhstan - 0.17% | ||||||||||||||||
| Nostrum Oil & Gas Finance BV | USD | 7.00 | % | 02/16/25 | 40,000 | 9,631 | (1) | |||||||||
| Macau - 1.81% | ||||||||||||||||
| MGM China Holdings, Ltd. | USD | 5.88 | % | 05/15/26 | 32,000 | 32,040 | (2) | |||||||||
| Sands China, Ltd. | USD | 5.40 | % | 08/08/28 | 18,000 | 19,172 | ||||||||||
| Studio City Co., Ltd. | USD | 7.25 | % | 11/30/21 | 51,000 | 51,120 | (1) | |||||||||
| 102,332 | ||||||||||||||||
| Mexico - 11.42% | ||||||||||||||||
| Aerovias de Mexico SA de CV | USD | 7.00 | % | 02/05/25 | 135,000 | 33,750 | (1) | |||||||||
| Axtel SAB Axtel de CV | USD | 6.38 | % | 11/14/24 | 133,000 | 134,051 | (1) | |||||||||
| Banco Mercantil del Norte SA/Grand Cayman: | ||||||||||||||||
| USD | 6.75 | % | Perpetual | 33,000 | 31,434 | (1)(3) | ||||||||||
| USD | 7.50 | % | Perpetual | 43,000 | 41,280 | (1)(3) | ||||||||||
| BBVA Bancomer SA | USD | 6.75 | % | 09/30/22 | 11,000 | 11,681 | (1) | |||||||||
| Cemex SAB de CV: | ||||||||||||||||
| USD | 6.13 | % | 05/05/25 | 56,000 | 56,271 | (1) | ||||||||||
| USD | 7.75 | % | 04/16/26 | 45,000 | 47,186 | (1) | ||||||||||
| Cometa Energia SA de CV | USD | 6.38 | % | 04/24/35 | 96,900 | 96,294 | (1) | |||||||||
| Mexico Generadora De Energia | USD | 5.50 | % | 12/06/32 | 27,071 | 28,043 | (1) | |||||||||
| Petroleos Mexicanos: | ||||||||||||||||
| USD | 6.50 | % | 03/13/27 | 58,000 | 51,475 | |||||||||||
| USD | 7.69 | % | 01/23/50 | 35,000 | 29,312 | (1) | ||||||||||
| Sixsigma Networks Mexico SA de CV | USD | 7.50 | % | 05/02/25 | 50,000 | 42,188 | (1) | |||||||||
| Southern Copper Corp. | USD | 6.75 | % | 04/16/40 | 34,000 | 44,062 | ||||||||||
| 647,027 | ||||||||||||||||
| Nigeria - 2.41% | ||||||||||||||||
| Access Bank PLC | USD | 10.50 | % | 10/19/21 | 22,000 | 21,670 | (1) | |||||||||
| IHS Netherlands Holdco BV | USD | 8.00 | % | 09/18/27 | 93,000 | 91,837 | (1) | |||||||||
| United Bank for Africa PLC | USD | 7.75 | % | 06/08/22 | 24,000 | 23,179 | (1) | |||||||||
| 136,686 | ||||||||||||||||
| Panama - 1.12% | ||||||||||||||||
| C&W Senior Financing DAC | USD | 7.50 | % | 10/15/26 | 62,000 | 63,550 | (1) | |||||||||
See Notes to Financial Statements.
| Stone Harbor Investment Funds Annual Report | May 31, 2020 | 51 |
| Stone Harbor Emerging Markets Corporate Debt Fund | Statements of Investments |
May 31, 2020
| Currency | Rate | Maturity Date | Principal Amount/Shares* | Value (Expressed in USD) | ||||||||||||
| Peru - 4.59% | ||||||||||||||||
| Banco de Credito del Peru/Panama | USD | 3M US L + 7.04% | 04/24/27 | 31,000 | $ | 32,619 | (2)(4) | |||||||||
| Inkia Energy, Ltd. | USD | 5.88 | % | 11/09/27 | 164,000 | 160,182 | (1) | |||||||||
| Kallpa Generacion SA: | ||||||||||||||||
| USD | 4.88 | % | 05/24/26 | 30,000 | 30,891 | (1) | ||||||||||
| USD | 4.13 | % | 08/16/27 | 37,000 | 36,503 | (1) | ||||||||||
| 260,195 | ||||||||||||||||
| Russia - 1.41% | ||||||||||||||||
| Gazprom PJSC Via Gaz Capital SA | USD | 4.95 | % | 02/06/28 | 42,000 | 46,955 | (1) | |||||||||
| VTB Bank PJSC Via VTB Eurasia DAC | USD | 9.50 | % | Perpetual | 30,000 | 32,672 | (1)(3) | |||||||||
| 79,627 | ||||||||||||||||
| Saudi Arabia - 1.87% | ||||||||||||||||
| Acwa Power Management And Investments One, Ltd. | USD | 5.95 | % | 12/15/39 | 103,000 | 106,090 | (1) | |||||||||
| South Africa - 3.11% | ||||||||||||||||
| Eskom Holdings SOC, Ltd.: | ||||||||||||||||
| USD | 5.75 | % | 01/26/21 | 30,000 | 28,575 | (1) | ||||||||||
| USD | 6.75 | % | 08/06/23 | 125,000 | 116,445 | (1) | ||||||||||
| Sasol Financing International, Ltd. | USD | 4.50 | % | 11/14/22 | 37,000 | 31,452 | ||||||||||
| 176,472 | ||||||||||||||||
| Thailand - 1.91% | ||||||||||||||||
| PTT Treasury Center Co., Ltd. | USD | 4.50 | % | 10/25/42 | 60,000 | 64,566 | (1) | |||||||||
| Thaioil Treasury Center Co., Ltd. | USD | 4.88 | % | 01/23/43 | 40,000 | 43,606 | (2) | |||||||||
| 108,172 | ||||||||||||||||
| Turkey - 3.26% | ||||||||||||||||
| Akbank Turk AS | USD | 6.80 | % | 04/27/28 | 35,000 | 31,139 | (1)(4) | |||||||||
| Turk Telekomunikasyon AS: | ||||||||||||||||
| USD | 4.88 | % | 06/19/24 | 17,000 | 16,421 | (1) | ||||||||||
| USD | 6.88 | % | 02/28/25 | 72,000 | 73,643 | (1) | ||||||||||
| Turkiye Garanti Bankasi AS | USD | 6.13 | % | 05/24/27 | 69,000 | 63,329 | (1)(4) | |||||||||
| 184,532 | ||||||||||||||||
| �� | ||||||||||||||||
| Ukraine - 3.67% | ||||||||||||||||
| Metinvest BV: | ||||||||||||||||
| USD | 7.75 | % | 04/23/23 | 95,000 | 88,112 | (1) | ||||||||||
| USD | 7.75 | % | 10/17/29 | 35,000 | 30,100 | (1) | ||||||||||
| VF Ukraine PAT via VFU Funding PLC | USD | 6.20 | % | 02/11/25 | 91,000 | 89,479 | (1) | |||||||||
| 207,691 | ||||||||||||||||
| United Arab Emirates - 3.38% | ||||||||||||||||
| DP World PLC | USD | 4.70 | % | 09/30/49 | 208,000 | 191,588 | (1) | |||||||||
| Vietnam - 1.21% | ||||||||||||||||
| Mong Duong Finance Holdings BV | USD | 5.13 | % | 05/07/29 | 70,000 | 68,666 | (1) | |||||||||
See Notes to Financial Statements.
| 52 | www.shiplp.com |
| Stone Harbor Emerging Markets Corporate Debt Fund | Statements of Investments |
May 31, 2020
| Currency | Rate | Maturity Date | Principal Amount/Shares* | Value (Expressed in USD) | ||||||||||||
| Zambia - 3.46% | ||||||||||||||||
| First Quantum Minerals, Ltd.: | ||||||||||||||||
| USD | 6.50 | % | 03/01/24 | 67,000 | $ | 60,802 | (1) | |||||||||
| USD | 7.50 | % | 04/01/25 | 65,000 | 59,125 | (1) | ||||||||||
| USD | 6.88 | % | 03/01/26 | 84,000 | 75,951 | (1) | ||||||||||
| 195,878 | ||||||||||||||||
| TOTAL CORPORATE BONDS | 5,407,884 | |||||||||||||||
| (Cost $5,902,326) | ||||||||||||||||
| SHORT TERM INVESTMENTS - 1.02% | ||||||||||||||||
| Money Market Fund - 1.02% | ||||||||||||||||
| State Street Institutional Liquid Reserves Fund - Institutional Class (7-Day SEC Yield) | USD | 0.45 | % | N/A | 57,763 | 57,791 | ||||||||||
| TOTAL SHORT TERM INVESTMENTS | 57,791 | |||||||||||||||
| (Cost $57,795) | ||||||||||||||||
| Total Investments - 97.42% | 5,519,094 | |||||||||||||||
| (Cost $6,011,102) | ||||||||||||||||
| Other Assets In Excess of Liabilities - 2.58% | 146,453 | |||||||||||||||
| Net Assets - 100.00% | $ | 5,665,547 | ||||||||||||||
| * | The principal amount/shares of each security is stated in the currency in which the security is denominated. |
Currency Abbreviations:
| USD | - | United States Dollar |
Investment Abbreviations:
LIBOR - London Interbank Offered Rate
PIK - Payment in-kind
Reference Rates:
3M US L - 3 Month LIBOR as of May 31, 2020 was 0.34%
5Y US TI - 5 Year US Treasury Index as of May 31, 2020 was 0.30%
| (1) | Security exempt from registration under Rule 144A of the Securities Act of 1933. Such securities may normally be sold to qualified institutional buyers in transactions exempt from registration. Total fair value of Rule 144A securities amounts to $4,190,407, which represents approximately 73.96% of net assets as of May 31, 2020. |
| (2) | Securities were originally issued pursuant to Regulation S under the Securities Act of 1933, which exempts securities offered and sold outside of the United States from registration. Such securities cannot be sold in the United States without either an effective registration statement filed pursuant to the Securities Act of 1933, or pursuant to an exemption from registration. As of May 31, 2020, the aggregate fair value of those securities was $378,598, which represents approximately 6.68% of net assets. |
| (3) | Security has no contractual maturity date, is not redeemable and contractually pays an indefinite stream of interest. |
| (4) | Floating or variable rate security. The reference rate is described above. The rate in effect as of May 31, 2020 is based on the reference rate plus the displayed spread as of the security's last reset date. Certain variable rate securities are not based on a published reference rate and spread but are determined by the issuer or agent and are based on current market conditions. These securities do not indicate a reference rate and spread in their description. |
| (5) | Payment-in-kind securities. |
See Notes to Financial Statements.
| Stone Harbor Investment Funds Annual Report | May 31, 2020 | 53 |
| Stone Harbor Investment Grade Fund | Statements of Investments |
| May 31, 2020 |
| Currency | Rate | Maturity Date | Principal Amount/Shares* | Value (Expressed in USD) | ||||||||||||
| ASSET BACKED/COMMERCIAL MORTGAGE BACKED SECURITIES - 11.60% | ||||||||||||||||
| 1211 Avenue of the Americas Trust, Series 2015-1211 | USD | 3.90 | % | 08/10/25 | 25,000 | $ | 27,294 | |||||||||
| Aqua Finance Trust 2019-A, Series 2019-A | USD | 3.14 | % | 09/15/25 | 59,175 | 58,956 | (1) | |||||||||
| BX Commercial Mortgage Trust, Series 2019-IMC | USD | 1M US L + 1.30% | 04/15/21 | 100,000 | 89,555 | (1)(2) | ||||||||||
| Citigroup Commercial Mortgage Trust, Series 2019-SST2 | USD | 1M US L + 0.92% | 02/15/22 | 50,000 | 48,488 | (1)(2) | ||||||||||
| CLNY Trust 2019-IKPR, Series 2019-IKPR | USD | 1M US L + 1.13% | 11/15/21 | 50,000 | 45,482 | (1)(2) | ||||||||||
| Drive Auto Receivables Trust, Series 2019-1 | USD | 3.78 | % | 04/15/25 | 50,000 | 50,460 | ||||||||||
| Fannie Mae Pool: | ||||||||||||||||
| Series 2015 | USD | 12M US L + 1.60% | 11/01/45 | 67,485 | 69,710 | (2)(3) | ||||||||||
| Series 2016 | USD | 12M US L + 1.55% | 09/01/46 | 123,478 | 129,170 | (2)(3) | ||||||||||
| Financial Asset Securities Corp. AAA Trust, Series 2005-2 | USD | 1M US L + 0.30% | 11/26/35 | 14,983 | 14,632 | (1)(2) | ||||||||||
| Ford Credit Auto Owner Trust, Series 2018-1 | USD | 3.19 | % | 01/15/25 | 25,000 | 26,236 | (1) | |||||||||
| Freddie Mac Non Gold Pool, Series 2012 | USD | 12M US L + 1.65% | 12/01/42 | 35,108 | 36,442 | (2)(3) | ||||||||||
| Freddie Mac Whole Loan Securities Trust: | ||||||||||||||||
| Series 2015-SC02 | USD | 3.00 | % | 09/25/45 | 48,567 | 49,337 | (3) | |||||||||
| Series 2016-SC01 | USD | 3.50 | % | 07/25/46 | 64,993 | 67,034 | (3) | |||||||||
| Invitation Homes 2017-SFR2 Trust, Series 2017-SFR2 | USD | 1M US L + 0.85% | 12/17/19 | 45,684 | 45,051 | (1)(2) | ||||||||||
| JP Morgan Chase Commercial Mortgage Securities Trust, Series 2006-LDP9 | USD | 5.34 | % | 05/15/47 | 76,388 | 58,548 | ||||||||||
| MBRT 2019-MBR, Series 2019-MBR | USD | 1M US L + 0.85% | 11/25/21 | 75,000 | 70,819 | (1)(2) | ||||||||||
| Morgan Stanley Capital I Trust 2019-NUGS, Series 2019-NUGS | USD | 1M US L + 0.95% | 12/15/21 | 50,000 | 47,959 | (1)(2) | ||||||||||
| Pretium Mortgage Credit Partners I 2020-NPL1 LLC ,Series 2020-NPL1 | USD | 2.86 | % | 02/27/23 | 47,751 | 43,513 | (1) | |||||||||
| RBSSP Resecuritization Trust, Series 2012-6 | USD | 1M US L + 0.34% | 11/26/35 | 8,421 | 8,426 | (1)(2) | ||||||||||
| RSBO Resecuritization Trust, Series 2012-6 | USD | 1M US L + 0.33% | 01/26/36 | 2,988 | 2,988 | (1)(2) | ||||||||||
| TAL Advantage V LLC: | ||||||||||||||||
| Series 2013-2A | USD | 3.55 | % | 11/20/23 | 35,000 | 35,113 | (1) | |||||||||
| Series 2014-1A | USD | 3.51 | % | 02/20/24 | 18,750 | 18,559 | (1) | |||||||||
| Towd Point Mortgage Trust, Series 2016-5 | USD | 2.50 | % | 10/25/56 | 22,382 | 22,672 | (1)(2) | |||||||||
| VOLT LXXX LLC, Series 2019-NPL6 | USD | 3.23 | % | 10/25/49 | 60,199 | 57,973 | (1)(4) | |||||||||
| VOLT LXXXIV LLC, Series 2019-NP10 | USD | 3.43 | % | 11/25/22 | 169,820 | 162,111 | (1)(4) | |||||||||
| TOTAL ASSET BACKED/COMMERCIAL MORTGAGE BACKED SECURITIES | 1,286,528 | |||||||||||||||
| (Cost $1,323,167) | ||||||||||||||||
| U.S. GOVERNMENT AGENCY MORTGAGE BACKED SECURITIES - 20.44% | ||||||||||||||||
| Fannie Mae or Freddie Mac | USD | 2.50 | % | 06/12/20 | 150,000 | 155,614 | (3) | |||||||||
| FNMA TBA: | ||||||||||||||||
| USD | 3.00 | % | 06/11/20 | 750,000 | 788,965 | (3) | ||||||||||
| USD | 3.50 | % | 06/11/20 | 525,000 | 553,916 | (3) | ||||||||||
| USD | 4.00 | % | 06/11/20 | 325,000 | 345,947 | (3) | ||||||||||
| USD | 4.50 | % | 06/11/20 | 50,000 | 54,016 | (3) | ||||||||||
| USD | 2.50 | % | 06/17/20 | 200,000 | 209,312 | (3) | ||||||||||
| USD | 3.00 | % | 06/17/20 | 150,000 | 158,133 | (3) | ||||||||||
| TOTAL U.S. GOVERNMENT AGENCY MORTGAGE BACKED SECURITIES | 2,265,903 | |||||||||||||||
| (Cost $2,266,390) | ||||||||||||||||
| See Notes to Financial Statements. | |
| 54 | www.shiplp.com |
| Stone Harbor Investment Grade Fund | Statements of Investments |
| May 31, 2020 |
| Currency | Rate | Maturity Date | Principal Amount/Shares* | Value (Expressed in USD) | ||||||||||||
| CORPORATE BONDS - 43.29% | ||||||||||||||||
| Automotive - 1.79% | ||||||||||||||||
| Ford Motor Credit Co. LLC | USD | 4.27 | % | 01/09/27 | 50,000 | $ | 45,677 | |||||||||
| General Motors Financial Co., Inc. | USD | 4.35 | % | 01/17/27 | 50,000 | 50,053 | ||||||||||
| Hyundai Capital America: | ||||||||||||||||
| USD | 3.00 | % | 10/30/20 | 25,000 | 25,041 | (1) | ||||||||||
| USD | 3.25 | % | 09/20/22 | 25,000 | 24,908 | (1) | ||||||||||
| Toyota Motor Credit Corp. | USD | 2.90 | % | 03/30/23 | 50,000 | 52,627 | ||||||||||
| 198,306 | ||||||||||||||||
| Banking - 12.74% | ||||||||||||||||
| Bank of America Corp. | USD | 3M US L + 0.99% | 02/13/31 | 125,000 | 127,557 | (2) | ||||||||||
| Capital One Financial Corp. | USD | 3.75 | % | 03/09/27 | 75,000 | 78,482 | ||||||||||
| Citigroup, Inc. | USD | 4.40 | % | 06/10/25 | 125,000 | 138,425 | ||||||||||
| Credit Suisse Group AG | USD | 3M US L + 1.24% | 06/12/24 | 50,000 | 53,442 | (1)(2) | ||||||||||
| Deutsche Bank AG | USD | 3.70 | % | 05/30/24 | 50,000 | 50,477 | ||||||||||
| Fifth Third Bancorp | USD | 3.65 | % | 01/25/24 | 50,000 | 54,266 | ||||||||||
| Goldman Sachs Group, Inc.: | ||||||||||||||||
| USD | 3M US L + 0.99% | 07/24/23 | 50,000 | 51,419 | (2) | |||||||||||
| USD | 3.50 | % | 04/01/25 | 50,000 | 53,758 | |||||||||||
| HSBC Holdings PLC | USD | 3.95 | % | 05/18/24 | 50,000 | 53,447 | (2) | |||||||||
| Intesa Sanpaolo SpA, Series XR | USD | 4.00 | % | 09/23/29 | 75,000 | 75,968 | (1) | |||||||||
| JPMorgan Chase & Co. | USD | 3.63 | % | 12/01/27 | 50,000 | 54,641 | ||||||||||
| Key Bank NA | USD | 3.90 | % | 04/13/29 | 75,000 | 81,045 | ||||||||||
| Morgan Stanley, Series GMTN | USD | 1D US SOFR +1.14% | 01/22/31 | 25,000 | 25,790 | (2) | ||||||||||
| Royal Bank of Scotland Group PLC | USD | 6.10 | % | 06/10/23 | 50,000 | 54,643 | ||||||||||
| Societe Generale SA | USD | 2.63 | % | 10/16/24 | 100,000 | 100,569 | (1) | |||||||||
| Standard Chartered PLC: | ||||||||||||||||
| USD | 3M US L + 1.21% | 01/30/26 | 50,000 | 50,398 | (1)(2) | |||||||||||
| USD | 5.70 | % | 03/26/44 | 25,000 | 29,213 | (1) | ||||||||||
| State Street Corp. | USD | 3.03 | % | 11/01/34 | 50,000 | 52,838 | (2) | |||||||||
| Sumitomo Mitsui Financial Group, Inc. | USD | 3.20 | % | 09/17/29 | 25,000 | 26,079 | ||||||||||
| Synchrony Financial | USD | 3.70 | % | 08/04/26 | 50,000 | 48,144 | ||||||||||
| Truist Bank | USD | 2.25 | % | 03/11/30 | 50,000 | 49,468 | ||||||||||
| UBS Group AG | USD | 3.49 | % | 05/23/23 | 50,000 | 52,162 | (1) | |||||||||
| Wells Fargo & Co. | USD | 3M US L + 1.00% | 02/11/31 | 50,000 | 50,605 | (2) | ||||||||||
| 1,412,836 | ||||||||||||||||
| Building Products - 0.48% | ||||||||||||||||
| Vulcan Materials Co. | USD | 4.50 | % | 06/15/47 | 50,000 | 53,067 | ||||||||||
| Chemicals - 1.02% | ||||||||||||||||
| Huntsman International LLC | USD | 4.50 | % | 05/01/29 | 50,000 | 50,878 | ||||||||||
| Nutrien, Ltd. | USD | 5.00 | % | 04/01/49 | 50,000 | 61,716 | ||||||||||
| 112,594 | ||||||||||||||||
| Consumer Products - 0.24% | ||||||||||||||||
| Procter & Gamble Co. | USD | 2.45 | % | 03/25/25 | 25,000 | 27,142 | ||||||||||
| Diversified Manufacturing - 0.41% | ||||||||||||||||
| Carrier Global Corp. | USD | 3.58 | % | 04/05/50 | 50,000 | 45,173 | (1) | |||||||||
| Electric - 4.04% | ||||||||||||||||
| Appalachian Power Co., Series Z | USD | 3.70 | % | 05/01/50 | 50,000 | 54,242 | ||||||||||
| Electricite de France SA | USD | 4.50 | % | 09/21/28 | 50,000 | 57,629 | (1) | |||||||||
| See Notes to Financial Statements. | |
| Stone Harbor Investment Funds Annual Report | May 31, 2020 | 55 |
| Stone Harbor Investment Grade Fund | Statements of Investments |
| May 31, 2020 |
| Currency | Rate | Maturity Date | Principal Amount/Shares* | Value (Expressed in USD) | ||||||||||||
| Electric (continued) | ||||||||||||||||
| Enel Finance International NV | USD | 4.63 | % | 09/14/25 | 50,000 | $ | 56,815 | (1) | ||||||||
| Entergy Texas, Inc. | USD | 3.55 | % | 09/30/49 | 50,000 | 54,795 | ||||||||||
| Exelon Generation Co. LLC | USD | 5.60 | % | 06/15/42 | 50,000 | 56,935 | ||||||||||
| FirstEnergy Corp., Series C | USD | 4.85 | % | 07/15/47 | 50,000 | 63,163 | ||||||||||
| NextEra Energy Capital Holdings, Inc.: | ||||||||||||||||
| USD | 2.75 | % | 05/01/25 | 50,000 | 53,566 | |||||||||||
| USD | 2.25 | % | 06/01/30 | 50,000 | 51,048 | |||||||||||
| 448,193 | ||||||||||||||||
| Exploration & Production - 2.45% | ||||||||||||||||
| Apache Corp. | USD | 5.10 | % | 09/01/40 | 50,000 | 40,136 | ||||||||||
| Chevron Corp. | USD | 3.08 | % | 05/11/50 | 50,000 | 53,853 | ||||||||||
| Concho Resources, Inc. | USD | 3.75 | % | 10/01/27 | 50,000 | 52,417 | ||||||||||
| Diamondback Energy, Inc. | USD | 2.88 | % | 12/01/24 | 50,000 | 48,707 | ||||||||||
| Total Capital International SA | USD | 3.13 | % | 05/29/50 | 75,000 | 75,996 | ||||||||||
| 271,109 | ||||||||||||||||
| Gas Distributors - 1.00% | ||||||||||||||||
| Cheniere Corpus Christi Holdings LLC | USD | 5.13 | % | 06/30/27 | 50,000 | 54,301 | ||||||||||
| Sempra Energy | USD | 4.00 | % | 02/01/48 | 50,000 | 56,151 | ||||||||||
| 110,452 | ||||||||||||||||
| Gas Pipelines - 2.39% | ||||||||||||||||
| Boardwalk Pipelines LP | USD | 5.95 | % | 06/01/26 | 50,000 | 50,493 | ||||||||||
| CenterPoint Energy, Inc. | USD | 4.25 | % | 11/01/28 | 50,000 | 57,686 | ||||||||||
| Kinder Morgan Energy Partners LP | USD | 5.50 | % | 03/01/44 | 50,000 | 59,923 | ||||||||||
| Sabine Pass Liquefaction LLC | USD | 5.00 | % | 03/15/27 | 50,000 | 55,561 | ||||||||||
| Western Midstream Operating LP | USD | 5.45 | % | 04/01/44 | 50,000 | 40,875 | ||||||||||
| 264,538 | ||||||||||||||||
| Health Insurance - 0.54% | ||||||||||||||||
| UnitedHealth Group, Inc. | USD | 3.88 | % | 08/15/59 | 50,000 | 60,320 | ||||||||||
| Healthcare - 0.81% | ||||||||||||||||
| CVS Health Corp. | USD | 4.78 | % | 03/25/38 | 25,000 | 30,515 | ||||||||||
| HCA, Inc. | USD | 5.25 | % | 06/15/49 | 50,000 | 59,002 | ||||||||||
| 89,517 | ||||||||||||||||
| Leisure - 0.44% | ||||||||||||||||
| Royal Caribbean Cruises, Ltd. | USD | 2.65 | % | 11/28/20 | 50,000 | 48,527 | ||||||||||
| Lodging - 0.24% | ||||||||||||||||
| Marriott International, Inc., Series EE | USD | 5.75 | % | 05/01/25 | 25,000 | 27,023 | ||||||||||
| Media Cable - 1.12% | ||||||||||||||||
| Charter Communications Operating LLC / Charter Communications Operating Capital | USD | 6.48 | % | 10/23/45 | 50,000 | 64,760 | ||||||||||
| Comcast Corp. | USD | 3.97 | % | 11/01/47 | 50,000 | 59,061 | ||||||||||
| 123,821 | ||||||||||||||||
| Media Other - 0.49% | ||||||||||||||||
| Interpublic Group of Cos., Inc. | USD | 4.65 | % | 10/01/28 | 25,000 | 27,359 | ||||||||||
| See Notes to Financial Statements. | |
| 56 | www.shiplp.com |
| Stone Harbor Investment Grade Fund | Statements of Investments |
| May 31, 2020 |
| Currency | Rate | Maturity Date | Principal Amount/Shares* | Value (Expressed in USD) | ||||||||||||
| Media Other (continued) | ||||||||||||||||
| Omnicom Group, Inc. | USD | 4.20 | % | 06/01/30 | 25,000 | $ | 26,991 | |||||||||
| 54,350 | ||||||||||||||||
| Metals/Mining/Steel - 0.46% | ||||||||||||||||
| Anglo American Capital PLC | USD | 4.00 | % | 09/11/27 | 50,000 | 51,080 | (1) | |||||||||
| Non Captive Finance - 1.08% | ||||||||||||||||
| Air Lease Corp. | USD | 3.63 | % | 12/01/27 | 75,000 | 66,605 | ||||||||||
| GATX Corp. | USD | 4.55 | % | 11/07/28 | 50,000 | 53,433 | ||||||||||
| 120,038 | ||||||||||||||||
| Pharmaceuticals - 0.48% | ||||||||||||||||
| AbbVie, Inc. | USD | 2.95 | % | 11/21/26 | 50,000 | 53,686 | (1) | |||||||||
| Real Estate Investment Trust (REITs) - 1.55% | ||||||||||||||||
| American Homes 4 Rent LP | USD | 4.25 | % | 02/15/28 | 50,000 | 49,241 | ||||||||||
| Prologis LP | USD | 2.13 | % | 04/15/27 | 25,000 | 25,895 | ||||||||||
| SITE Centers Corp. | USD | 4.25 | % | 02/01/26 | 50,000 | 50,179 | ||||||||||
| WEA Finance LLC | USD | 2.88 | % | 01/15/27 | 50,000 | 46,568 | (1) | |||||||||
| 171,883 | ||||||||||||||||
| Refining - 0.72% | ||||||||||||||||
| Marathon Petroleum Corp.: | ||||||||||||||||
| USD | 5.13 | % | 12/15/26 | 25,000 | 28,132 | |||||||||||
| USD | 3.80 | % | 04/01/28 | 25,000 | 25,355 | |||||||||||
| Phillips 66 | USD | 3.70 | % | 04/06/23 | 25,000 | 26,731 | ||||||||||
| 80,218 | ||||||||||||||||
| Restaurants - 0.55% | ||||||||||||||||
| McDonald's Corp. | USD | 4.45 | % | 03/01/47 | 50,000 | 60,902 | ||||||||||
| Retail Food/Drug - 0.45% | ||||||||||||||||
| Walgreens Boots Alliance, Inc. | USD | 3.20 | % | 04/15/30 | 50,000 | 50,060 | ||||||||||
| Retail Non Food/Drug - 1.07% | ||||||||||||||||
| Dollar Tree, Inc. | USD | 4.00 | % | 05/15/25 | 50,000 | 55,175 | ||||||||||
| TJX Cos., Inc. | USD | 4.50 | % | 04/15/50 | 50,000 | 63,543 | ||||||||||
| 118,718 | ||||||||||||||||
| Services Other - 1.09% | ||||||||||||||||
| Expedia Group, Inc. | USD | 3.25 | % | 02/15/30 | 75,000 | 67,336 | ||||||||||
| Verisk Analytics, Inc. | USD | 3.63 | % | 05/15/50 | 50,000 | 53,710 | ||||||||||
| 121,046 | ||||||||||||||||
| Technology - 1.92% | ||||||||||||||||
| Apple, Inc. | USD | 1.13 | % | 05/11/25 | 50,000 | 50,873 | ||||||||||
| Broadcom, Inc. | USD | 4.25 | % | 04/15/26 | 50,000 | 53,617 | (1) | |||||||||
| Fiserv, Inc. | USD | 3.20 | % | 07/01/26 | 50,000 | 54,489 | ||||||||||
| Tencent Holdings, Ltd. | USD | 3.60 | % | 01/19/28 | 50,000 | 54,221 | (1) | |||||||||
| 213,200 | ||||||||||||||||
| Textile/Apparel - 1.19% | ||||||||||||||||
| NIKE, Inc. | USD | 2.40 | % | 03/27/25 | 50,000 | 53,673 | ||||||||||
| See Notes to Financial Statements. | |
| Stone Harbor Investment Funds Annual Report | May 31, 2020 | 57 |
| Stone Harbor Investment Grade Fund | Statements of Investments |
| May 31, 2020 |
| Currency | Rate | Maturity Date | Principal Amount/Shares* | Value (Expressed in USD) | ||||||||||||
| Textile/Apparel (continued) | ||||||||||||||||
| VF Corp. | USD | 2.40 | % | 04/23/25 | 75,000 | $ | 77,952 | |||||||||
| 131,625 | ||||||||||||||||
| Transportation Non Air/Rail - 0.46% | ||||||||||||||||
| FedEx Corp. | USD | 4.40 | % | 01/15/47 | 50,000 | 51,346 | ||||||||||
| Wireless - 1.02% | ||||||||||||||||
| T-Mobile USA, Inc.: | ||||||||||||||||
| USD | 3.88 | % | 04/15/30 | 25,000 | 27,227 | (1) | ||||||||||
| USD | 4.50 | % | 04/15/50 | 25,000 | 28,233 | (1) | ||||||||||
| Vodafone Group PLC | USD | 4.25 | % | 09/17/50 | 50,000 | 57,665 | ||||||||||
| 113,125 | ||||||||||||||||
| Wirelines - 1.05% | ||||||||||||||||
| AT&T, Inc. | USD | 4.35 | % | 03/01/29 | 50,000 | 56,710 | ||||||||||
| Verizon Communications, Inc. | USD | 4.33 | % | 09/21/28 | 50,000 | 59,797 | ||||||||||
| 116,507 | ||||||||||||||||
| TOTAL CORPORATE BONDS | 4,800,402 | |||||||||||||||
| (Cost $4,560,892) | ||||||||||||||||
| U.S. TREASURY BONDS/NOTES - 21.02% | ||||||||||||||||
| U.S. Treasury Bonds: | ||||||||||||||||
| USD | 2.75 | % | 02/15/28 | 50,000 | 58,390 | |||||||||||
| USD | 2.50 | % | 02/15/46 | 225,000 | 278,095 | |||||||||||
| U.S. Treasury Notes: | ||||||||||||||||
| USD | 1.38 | % | 09/30/20 | 400,000 | 401,547 | |||||||||||
| USD | 2.00 | % | 11/15/21 | 625,000 | 641,626 | |||||||||||
| USD | 2.13 | % | 05/15/25 | 325,000 | 353,901 | |||||||||||
| USD | 2.00 | % | 08/15/25 | 550,000 | 597,126 | |||||||||||
| TOTAL U.S. TREASURY BONDS/NOTES | 2,330,685 | |||||||||||||||
| (Cost $2,172,478) | ||||||||||||||||
| Total Investments - 96.35% | 10,683,518 | |||||||||||||||
| (Cost $10,322,927) | ||||||||||||||||
| Other Assets in Excess of Liabilities - 3.65% | 404,711 | |||||||||||||||
| Net Assets - 100.00% | $ | 11,088,229 | ||||||||||||||
| * | The principal amount/shares of each security is stated in the currency in which the security is denominated. |
Currency Abbreviations:
USD - United States Dollar
Investment Abbreviations:
LIBOR - London Interbank Offered Rate SOFR - Secured Overnight Financing Rate
Reference Rates:
1D US SOFR - 1 Day SOFR as of May 31, 2020 was 0.06%
1M US L - 1 Month LIBOR as of May 31, 2020 was 0.18%
3M US L - 3 Month LIBOR as of May 31, 2020 was 0.34%
12M US L - 12 Month LIBOR as of May 31, 2020 was 0.67%
| See Notes to Financial Statements. | |
| 58 | www.shiplp.com |
| Stone Harbor Investment Grade Fund | Statements of Investments |
| May 31, 2020 |
| (1) | Security exempt from registration under Rule 144A of the Securities Act of 1933. Such securities may normally be sold to qualified institutional buyers in transactions exempt from registration. Total fair value of Rule 144A securities amounts to $1,684,483, which represents approximately 15.19% of net assets as of May 31, 2020. |
| (2) | Floating or variable rate security. The reference rate is described above. The rate in effect as of May 31, 2020 is based on the reference rate plus the displayed spread as of the security's last reset date. Certain variable rate securities are not based on a published reference rate and spread but are determined by the issuer or agent and are based on current market conditions. These securities do not indicate a reference rate and spread in their description. |
| (3) | Investment purchased on a delayed delivery basis. |
| (4) | Step bond. Coupon changes periodically based upon a predetermined schedule. Interest rate disclosed is that which is in effect as of May 31, 2020. |
| See Notes to Financial Statements. | |
| Stone Harbor Investment Funds Annual Report | May 31, 2020 | 59 |
| Stone Harbor Strategic Income Fund | Statements of Investments |
May 31, 2020
| Currency | Rate | Shares* | Value (Expressed in USD) | ||||||||||||
| OPEN-END FUNDS - 97.31% | |||||||||||||||
| Stone Harbor Emerging Markets Corporate Debt Fund | USD | N/A | 191,360 | $ | 1,563,414 | (1) | |||||||||
| Stone Harbor Emerging Markets Debt Fund | USD | N/A | 777,382 | 6,934,246 | (1) | ||||||||||
| Stone Harbor High Yield Bond Fund | USD | N/A | 1,254,129 | 9,443,594 | (1) | ||||||||||
| Stone Harbor Investment Grade Fund | USD | N/A | 1,026,640 | 11,077,448 | (1) | ||||||||||
| Stone Harbor Local Markets Fund | USD | N/A | 93,458 | 779,440 | (1) | ||||||||||
| 29,798,142 | |||||||||||||||
| TOTAL OPEN-END FUNDS | 29,798,142 | ||||||||||||||
| (Cost $31,286,246) | |||||||||||||||
| SHORT TERM INVESTMENTS - 0.57% | |||||||||||||||
| Money Market Mutual Funds - 0.57% | |||||||||||||||
| State Street Institutional Liquid Reserves Fund - Institutional Class (7-Day SEC Yield) | USD | 0.45 | % | 173,761 | 173,847 | ||||||||||
| TOTAL SHORT TERM INVESTMENTS | 173,847 | ||||||||||||||
| (Cost $173,540) | |||||||||||||||
| Total Investments - 97.88% | 29,971,989 | ||||||||||||||
| (Cost $31,459,786) | |||||||||||||||
| Other Assets In Excess of Liabilities - 2.12% | 650,001 | ||||||||||||||
| Net Assets - 100.00% | $ | 30,621,990 | |||||||||||||
| * | The shares of each security is stated in the currency in which the security is denominated. |
| Currency Abbreviations: | ||
| EUR | - | Euro Currency |
| GBP | - | Great Britain Pound |
| USD | - | United States Dollar |
| (1) | Affiliated with the Fund, as each is a series of Stone Harbor Investment Funds and has the same investment adviser. |
OUTSTANDING FORWARD FOREIGN CURRENCY CONTRACTS
| Counterparty | Settlement Date | Fund Receiving | U.S. $ Value at May 31, 2020 | Fund Delivering | U.S. $ Value at May 31, 2020 | Unrealized Appreciation/ (Depreciation) | |||||||||||
| Goldman Sachs & Co. | 06/08/20 | EUR | 299,748 | GBP | 291,090 | 8,658 | |||||||||||
| Goldman Sachs & Co. | 06/15/20 | EUR | 155,447 | GBP | 152,822 | 2,625 | |||||||||||
| Goldman Sachs & Co. | 06/22/20 | EUR | 155,470 | GBP | 155,003 | 467 | |||||||||||
| $ | 11,750 | ||||||||||||||||
| Citigroup Global Markets | 06/25/20 | USD | 86,937 | GBP | 91,399 | (4,462 | ) | ||||||||||
| Citigroup Global Markets | 06/15/20 | USD | 1,148 | GBP | 1,164 | (16 | ) | ||||||||||
| Goldman Sachs & Co. | 06/15/20 | GBP | 153,986 | EUR | 155,447 | (1,461 | ) | ||||||||||
| J.P. Morgan Chase & Co. | 06/25/20 | USD | 188,719 | EUR | 194,682 | (5,963 | ) | ||||||||||
| $ | (11,902 | ) | |||||||||||||||
| See Notes to Financial Statements. |
| 60 | www.shiplp.com |
| Stone Harbor Strategic Income Fund | Statements of Investments |
May 31, 2020
FUTURES CONTRACTS
| Description | Position | Contracts | Currency | Expiration Date | Notional Amount*** | Value and Unrealized Appreciation/(Depreciation) | ||||||||||
| Euro-Bund Future | Short | (3) | EUR | 6/08/20 | $ | (517,380 | ) | $ | 9,528 | |||||||
| $ | 9,528 | |||||||||||||||
| US 10 Yr T-Note Future | Short | (107) | USD | 9/21/20 | (14,879,688 | ) | $ | (31,337 | ) | |||||||
| US Ultra Bond Future | Long | 2 | USD | 9/21/20 | 436,063 | (3,976 | ) | |||||||||
| $ | (35,313 | ) | ||||||||||||||
| *** | The notional amount of each security is stated in the currency in which the security is denominated. |
CREDIT DEFAULT SWAP CONTRACTS ON CREDIT INDICES ISSUE - BUY PROTECTION (CENTRALLY CLEARED)(1)
Reference Obligations | Clearing House | Fixed Deal Pay Rate+ | Currency | Maturity Date | Implied Credit Spread at May 31, 2020(2) | Notional Amount***(3) | Value | Upfront Premiums Received/(Paid) | Unrealized Depreciation | ||||||||||||||||||
Markit CDX IG | Intercontinental Exchange | 1.000% | USD | 06/20/2025 | 0.776 | % | 1,300,000 | $ | (14,355 | ) | $ | (7,905 | ) | $ | (22,260 | ) | |||||||||||
Markit CDX EM | Intercontinental Exchange | 1.000% | USD | 06/20/2025 | 2.932 | % | 1,775,000 | 154,352 | (205,190 | ) | (50,838 | ) | |||||||||||||||
| $ | 139,997 | $ | (213,095 | ) | $ | (73,098 | ) | ||||||||||||||||||||
| + | Credit default swaps pay quarterly. |
| *** | The notional amount of each security is stated in the currency in which the security is denominated. |
| (1) | If the Fund is a buyer of protection and a credit event occurs, as defined under the terms of that particular swap agreement, the Fund will either (i) receive from the seller of protection an amount equal to the notional amount of the swap and deliver the referenced obligation or (ii) receive a net settlement amount in the form of cash or securities equal to the notional amount of the swap less the recovery value of the referenced obligation. |
| (2) | Implied credit spreads, represented in absolute terms are utilized in determining the market value of credit default swap agreements on sovereign issues of an emerging country as of period end, serve as an indicator of the current status of the payment/performance risk and represent the likelihood or risk of default for the credit derivative. The implied credit spread of a particular referenced entity reflects the cost of buying/selling protection and may include upfront payments required to be made to enter into the agreement. Wider credit spreads represent a deterioration of the referenced entity’s credit soundness and a greater likelihood or risk of default or other credit event occurring as defined under the terms of the agreement. |
| (3) | The maximum potential amount the Fund could be required to pay as a seller of credit protection or receive as a buyer of credit protection if a credit event occurs as defined under the terms of that particular swap agreement. |
| (4) | Based on an index of 125 North American, equally weighted investment grade issuers that trade in the CDS market. |
| (5) | Based on an index of 18 sovereign issues domiciled in Latin America, Eastern Europe, the Middle East and Africa North, and Asia. |
| See Notes to Financial Statements. |
| Stone Harbor Investment Funds Annual Report | May 31, 2020 | 61 |
| Stone Harbor Emerging Markets Debt Allocation Fund | Statements of Investments |
| May 31, 2020 |
| Currency | Rate | Shares* | Value (Expressed in USD) | |||||||||||
| OPEN-END FUNDS - 99.58% | ||||||||||||||
| Stone Harbor Emerging Markets Debt Fund | USD | N/A | 2,028,368 | $ | 18,093,041 | (1) | ||||||||
| Stone Harbor Local Markets Fund | USD | N/A | 1,563,725 | 13,041,468 | (1) | |||||||||
| 31,134,509 | ||||||||||||||
| TOTAL OPEN-END FUNDS | 31,134,509 | |||||||||||||
| (Cost $29,900,708) | ||||||||||||||
| SHORT TERM INVESTMENTS - 0.02% | ||||||||||||||
| Money Market Mutual Funds - 0.02% | ||||||||||||||
| State Street Institutional Liquid Reserves Fund - Institutional Class (7-Day SEC Yield) | USD | 0.45 | % | 7,977 | 7,981 | |||||||||
| TOTAL SHORT TERM INVESTMENTS | 7,981 | |||||||||||||
| (Cost $7,982) | ||||||||||||||
| Total Investments - 99.60% | 31,142,490 | |||||||||||||
| (Cost $29,908,690) | ||||||||||||||
| Other Assets In Excess of Liabilities - 0.40% | 124,385 | |||||||||||||
| Net Assets - 100.00% | $ | 31,266,875 | ||||||||||||
| * | The shares of each security is stated in the currency in which the security is denominated. |
| Currency Abbreviations: | ||
| USD | - | United States Dollar |
| EUR | - | Euro |
| (1) | Affiliated with the Fund, as each is a series of Stone Harbor Investment Funds and has the same investment adviser. |
OUTSTANDING FORWARD FOREIGN CURRENCY CONTRACTS
Counterparty | Settlement Date | Fund Receiving | U.S. $ Value at May 31, 2020 | Fund Delivering | U.S. $ Value at May 31, 2020 | Unrealized Appreciation/ (Depreciation) | |||||||||||
| J.P. Morgan Chase & Co. | 06/24/20 | EUR | 697,422 | USD | 679,550 | 17,872 | |||||||||||
| $ | 17,872 | ||||||||||||||||
| J.P. Morgan Chase & Co. | 06/24/20 | USD | 96,824 | EUR | 99,949 | (3,125 | ) | ||||||||||
| $ | (3,125 | ) | |||||||||||||||
| See Notes to Financial Statements. |
| 62 | www.shiplp.com |
Intentionally Left Blank
| Stone Harbor Investment Funds | Statements of Assets and Liabilities |
May 31, 2020
| Stone Harbor Emerging Markets Debt Fund | Stone Harbor High Yield Bond Fund | |||||||
| ASSETS: | ||||||||
Investments, at value(1) | $ | 1,084,686,691 | $ | 64,806,277 | ||||
| Investments in affiliates, at value(2) | – | – | ||||||
| Cash | 6,206,734 | – | ||||||
| Foreign currency, at value (3) | – | – | ||||||
| Unrealized appreciation on forward foreign currency contracts | 232,865 | – | ||||||
| Deposits with brokers for credit default swap contracts | – | – | ||||||
| Deposits with brokers for forward foreign currency contracts | 2,610,000 | – | ||||||
| Cash pledged as collateral for forward commitments | – | – | ||||||
| Deposits with brokers for futures contracts | – | – | ||||||
| Receivable for investments sold | 19,222,641 | 666,964 | ||||||
| Receivable for fund shares sold | 1,010,009 | 33 | ||||||
| Receivable from adviser | – | – | ||||||
| Interest receivable | 16,110,731 | 922,240 | ||||||
| Prepaid and other assets | 50,002 | 5,743 | ||||||
| Total Assets | 1,130,129,673 | 66,401,257 | ||||||
| LIABILITIES: | ||||||||
| Bank Overdraft | – | – | ||||||
| Payable to broker for credit default swap contracts | – | – | ||||||
| Payable due to brokers for forward foreign currency contracts | 70,000 | – | ||||||
| Payable for investments purchased | 13,876,833 | 814,148 | ||||||
| Payable for fund shares redeemed | 17,532,550 | – | ||||||
| Unrealized depreciation on forward foreign currency contracts | 3,230,076 | – | ||||||
| Variation margin payable on credit default swap contracts | – | – | ||||||
| Variation margin payable on futures contracts | – | – | ||||||
| Payable to adviser | 535,886 | 27,703 | ||||||
| Payable to administrator | 85,230 | 24,557 | ||||||
| Other payables | 85,668 | 80,908 | ||||||
| Total Liabilities | 35,416,243 | 947,316 | ||||||
| Net Assets | $ | 1,094,713,430 | $ | 65,453,941 | ||||
| NET ASSETS CONSIST OF: | ||||||||
Paid-in capital | $ | 1,409,267,975 | $ | 93,120,053 | ||||
| Total distributable earnings | (314,554,545 | ) | (27,666,112 | ) | ||||
| Net Assets | $ | 1,094,713,430 | $ | 65,453,941 | ||||
| PRICING OF SHARES: | ||||||||
Institutional Class | ||||||||
| Net Assets | $ | 1,094,713,430 | $ | 65,453,941 | ||||
| Shares of beneficial interest outstanding (unlimited number of shares, par value of $0.001 per share authorized) | 122,756,383 | 8,694,226 | ||||||
| Net assets value, offering and redemption price per share | $ | 8.92 | $ | 7.53 | ||||
| (1)Cost of Investments | $ | 1,169,825,876 | $ | 66,454,249 | ||||
| (2)Cost of Investments in affiliates | $ | – | $ | – | ||||
| (3)Cost of Investments in foreign cash | $ | – | $ | – | ||||
| See Notes to Financial Statements. |
| 64 | www.shiplp.com |
| Stone Harbor Investment Funds | Statements of Assets and Liabilities |
May 31, 2020
| Stone Harbor Local Markets Fund | Stone Harbor Emerging Markets Corporate Debt Fund | Stone Harbor Investment Grade Fund | Stone Harbor Strategic Income Fund | Stone Harbor Emerging Markets Debt Allocation Fund | ||||||||||||||
| $ | 301,119,906 | $ | 5,519,094 | $ | 10,683,518 | $ | 173,847 | $ | 7,981 | |||||||||
| – | – | – | 29,798,142 | 31,134,509 | ||||||||||||||
| – | 31,815 | – | 153,528 | 139,262 | ||||||||||||||
| 711,005 | – | – | 182,337 | – | ||||||||||||||
| 1,739,263 | – | – | 11,750 | 17,872 | ||||||||||||||
| – | – | – | 210,305 | – | ||||||||||||||
| 670,000 | – | – | – | – | ||||||||||||||
| – | – | 2,675,000 | – | – | ||||||||||||||
| – | – | – | 184,772 | – | ||||||||||||||
| 25,148,012 | 131,280 | 217,004 | – | – | ||||||||||||||
| 822 | – | – | – | 21,980 | ||||||||||||||
| – | 4,767 | 4,604 | 5,369 | 5,203 | ||||||||||||||
| 6,762,868 | 96,321 | 52,832 | 107 | 39 | ||||||||||||||
| 14,919 | 8,504 | 13,705 | 14,545 | 5,915 | ||||||||||||||
| 336,166,795 | 5,791,781 | 13,646,663 | 30,734,702 | 31,332,761 | ||||||||||||||
| – | – | 13,420 | – | – | ||||||||||||||
| – | – | – | 6,248 | – | ||||||||||||||
| – | – | – | – | – | ||||||||||||||
| 4,212,884 | 53,981 | 2,478,910 | – | – | ||||||||||||||
| 78,994 | – | – | – | 20,000 | ||||||||||||||
| 1,904,882 | – | – | 11,902 | 3,125 | ||||||||||||||
| – | – | – | 6,156 | – | ||||||||||||||
| – | – | – | 37,722 | – | ||||||||||||||
| 207,287 | – | – | – | – | ||||||||||||||
| 33,374 | 10,564 | 17,123 | 6,197 | 3,590 | ||||||||||||||
| 132,965 | 61,689 | 48,981 | 44,487 | 39,171 | ||||||||||||||
| 6,570,386 | 126,234 | 2,558,434 | 112,712 | 65,886 | ||||||||||||||
| $ | 329,596,409 | $ | 5,665,547 | $ | 11,088,229 | $ | 30,621,990 | $ | 31,266,875 | |||||||||
| $ | 573,515,830 | $ | 10,495,680 | $ | 10,498,392 | $ | 34,201,674 | $ | 38,434,731 | |||||||||
| (243,919,421 | ) | (4,830,133 | ) | 589,837 | (3,579,684 | ) | (7,167,856 | ) | ||||||||||
| $ | 329,596,409 | $ | 5,665,547 | $ | 11,088,229 | $ | 30,621,990 | $ | 31,266,875 | |||||||||
| $ | 329,596,409 | $ | 5,665,547 | $ | 11,088,229 | $ | 30,621,990 | $ | 31,266,875 | |||||||||
| 39,528,471 | 693,847 | 1,027,788 | 3,352,727 | 3,631,257 | ||||||||||||||
| $ | 8.34 | $ | 8.17 | $ | 10.79 | $ | 9.13 | $ | 8.61 | |||||||||
| $ | 326,783,539 | $ | 6,011,102 | $ | 10,322,927 | $ | 173,540 | $ | 7,981 | |||||||||
| $ | – | $ | – | $ | – | $ | 31,286,246 | $ | 29,900,708 | |||||||||
| $ | 701,668 | $ | – | $ | – | $ | 179,567 | $ | – | |||||||||
| See Notes to Financial Statements. |
| Stone Harbor Investment Funds Annual Report | May 31, 2020 | 65 |
| Stone Harbor Investment Funds | Statements of Operations |
| For the Year Ended May 31, 2020 |
| Stone Harbor Emerging Markets Debt Fund | Stone Harbor High Yield Bond Fund | |||||||
| INVESTMENT INCOME: | ||||||||
| Interest(1) | $ | 63,191,406 | $ | 4,691,393 | ||||
| Dividends | 664,140 | 31,661 | ||||||
| Dividends from affiliated investment companies | – | – | ||||||
| Total Investment Income | 63,855,546 | 4,723,054 | ||||||
| EXPENSES: | ||||||||
| Operational: | ||||||||
| Investment advisory fee | 6,830,363 | 392,597 | ||||||
| Administration fees | 656,408 | 51,500 | ||||||
| Interest on line of credit | – | – | ||||||
| Custodian fees | 98,342 | 21,331 | ||||||
| Printing fees | 7,477 | 7,079 | ||||||
| Professional fees | 94,433 | 94,680 | ||||||
| Trustee fees | 239,229 | 16,786 | ||||||
| Transfer agent fees | 20,772 | 20,201 | ||||||
| Registration fees | 22,758 | 23,586 | ||||||
| Insurance fees | 59,502 | 4,360 | ||||||
| Line of credit commitment fee | 82,649 | 7,379 | ||||||
| Other | 95,473 | 50,668 | ||||||
| Total expenses before waiver/reimbursement | 8,207,406 | 690,167 | ||||||
| Less fees waived by investment adviser | – | (172,784 | ) | |||||
| Less expenses reimbursed by investment adviser | – | – | ||||||
| Total Net Expenses | 8,207,406 | 517,383 | ||||||
| Net Investment Income | 55,648,140 | 4,205,671 | ||||||
| REALIZED AND UNREALIZED GAIN/(LOSS) ON INVESTMENTS: | ||||||||
| Net realized gain/(loss) on: | ||||||||
| Investments | (5,320,270 | ) | (1,938,060 | ) | ||||
| Investments - affiliated investment companies | – | – | ||||||
| Credit default swap contracts | (6,968,541 | ) | – | |||||
| Interest rate swap contracts | – | – | ||||||
| Futures contracts | – | – | ||||||
| Forward foreign currency contracts | 6,537,196 | – | ||||||
| Foreign currency transactions | (97,287 | ) | – | |||||
| Net realized gain/(loss) | (5,848,902 | ) | (1,938,060 | ) | ||||
| Change in unrealized appreciation/(depreciation) on: | ||||||||
| Investments | (73,000,170 | ) | (845,180 | ) | ||||
| Affiliated investment companies | – | – | ||||||
| Credit default swap contracts | 2,020,857 | – | ||||||
| Interest rate swap contracts | – | – | ||||||
| Futures contracts | – | – | ||||||
| Forward foreign currency contracts | (3,606,079 | ) | – | |||||
| Translation of assets and liabilities denominated in foreign currencies | 67,147 | – | ||||||
| Net change in unrealized appreciation/(depreciation) | (74,518,245 | ) | (845,180 | ) | ||||
| Net Realized and Unrealized Gain/(Loss) | (80,367,147 | ) | (2,783,240 | ) | ||||
| Net Increase/(Decrease) in Net Assets Resulting from Operations | $ | (24,719,007 | ) | $ | 1,422,431 | |||
| (1)Including Foreign Tax Withholding | $ | 94,586 | $ | 31 | ||||
| See Notes to Financial Statements. |
| 66 | www.shiplp.com |
| Stone Harbor Investment Funds | Statements of Operations |
| For the Year Ended May 31, 2020 |
| Stone Harbor Local Markets Fund | Stone Harbor Emerging Markets Corporate Debt Fund | Stone Harbor Investment Grade Fund | Stone Harbor Strategic Income Fund | Stone Harbor Emerging Markets Debt Allocation Fund | ||||||||||||||
| $ | 30,430,959 | $ | 959,527 | $ | 270,517 | $ | – | $ | – | |||||||||
| 54,805 | – | – | 19,484 | 1,098 | ||||||||||||||
| – | – | – | 1,298,112 | 874,350 | ||||||||||||||
| 30,485,764 | 959,527 | 270,517 | 1,317,596 | 875,448 | ||||||||||||||
| 3,534,555 | 143,413 | 38,677 | 177,997 | 203,937 | ||||||||||||||
| 274,122 | 16,278 | 13,086 | 26,501 | 21,668 | ||||||||||||||
| 32,689 | – | – | – | – | ||||||||||||||
| 239,690 | 11,658 | 11,311 | 27,810 | 5,392 | ||||||||||||||
| 7,369 | 7,047 | 7,048 | 7,055 | 7,591 | ||||||||||||||
| 94,401 | 77,433 | 63,733 | 61,233 | 57,076 | ||||||||||||||
| 103,682 | 3,332 | 2,334 | 6,845 | 6,070 | ||||||||||||||
| 20,584 | 20,099 | 20,031 | 20,092 | 20,197 | ||||||||||||||
| 24,458 | 22,091 | 21,652 | 22,011 | 21,854 | ||||||||||||||
| 44,130 | 956 | 547 | 1,648 | 1,451 | ||||||||||||||
| 82,649 | 1,700 | 894 | – | – | ||||||||||||||
| 48,278 | 24,852 | 38,223 | 11,107 | 10,484 | ||||||||||||||
| 4,506,607 | 328,859 | 217,536 | 362,299 | 355,720 | ||||||||||||||
| – | (143,413 | ) | (38,677 | ) | (177,997 | ) | (203,937 | ) | ||||||||||
| – | (15,214 | ) | (122,707 | ) | (158,896 | ) | (144,465 | ) | ||||||||||
| 4,506,607 | 170,232 | 56,152 | 25,406 | 7,318 | ||||||||||||||
| 25,979,157 | 789,295 | 214,365 | 1,292,190 | 868,130 | ||||||||||||||
| (40,762,065 | ) | 567,353 | 315,577 | (419 | ) | 10 | ||||||||||||
| – | – | – | (273,077 | ) | (201,950 | ) | ||||||||||||
| (297,808 | ) | – | – | 209,210 | – | |||||||||||||
| 132,644 | – | – | – | – | ||||||||||||||
| – | – | – | (1,289,647 | ) | – | |||||||||||||
| (2,011,162 | ) | – | – | (47,789 | ) | 318 | ||||||||||||
| (811,487 | ) | – | – | (5,246 | ) | – | ||||||||||||
| (43,749,878 | ) | 567,353 | 315,577 | (1,406,968 | ) | (201,622 | ) | |||||||||||
| 39,903,323 | (578,041 | ) | 206,340 | 307 | – | |||||||||||||
| – | – | – | (444,594 | ) | (797,862 | ) | ||||||||||||
| (61,998 | ) | – | – | (162,482 | ) | – | ||||||||||||
| (35,413 | ) | – | – | – | – | |||||||||||||
| – | – | – | 104,930 | – | ||||||||||||||
| (1,068,928 | ) | – | – | (3,703 | ) | 14,747 | ||||||||||||
| 106,530 | – | – | 3,753 | – | ||||||||||||||
| 38,843,514 | (578,041 | ) | 206,340 | (501,789 | ) | (783,115 | ) | |||||||||||
| (4,906,364 | ) | (10,688 | ) | 521,917 | (1,908,757 | ) | (984,737 | ) | ||||||||||
| $ | 21,072,793 | $ | 778,607 | $ | 736,282 | $ | (616,567 | ) | $ | (116,607 | ) | |||||||
| $ | 604,223 | $ | 238 | $ | – | $ | – | $ | – | |||||||||
| See Notes to Financial Statements. |
| Stone Harbor Investment Funds Annual Report | May 31, 2020 | 67 |
| Stone Harbor Investment Funds | Statements of Changes in Net Assets |
| Stone Harbor Emerging Markets Debt Fund | ||||||||
| For the Year Ended May 31, 2020 | For the Year Ended May 31, 2019 | |||||||
| OPERATIONS: | ||||||||
| Net investment income | $ | 55,648,140 | $ | 69,173,870 | ||||
| Net realized gain/(loss) | (5,848,902 | ) | (49,360,008 | ) | ||||
| Net change in unrealized appreciation/(depreciation) | (74,518,245 | ) | 24,957,192 | |||||
| Net increase/(decrease) in net assets resulting from operations | (24,719,007 | ) | 44,771,054 | |||||
| DISTRIBUTIONS TO SHAREHOLDERS: | ||||||||
| Institutional Class | ||||||||
| From distributable earnings | (63,423,170 | ) | (74,824,068 | ) | ||||
| Net decrease in net assets from distributions to shareholders | (63,423,170 | ) | (74,824,068 | ) | ||||
| CAPITAL SHARE TRANSACTIONS: | ||||||||
| Institutional Class | ||||||||
| Proceeds from sale of shares | 197,125,478 | 185,752,687 | ||||||
| Issued to shareholders in reinvestment of distributions | 63,131,106 | 73,713,189 | ||||||
| Cost of shares redeemed | (290,174,504 | ) | (223,890,629 | ) | ||||
| Net increase/(decrease) in net assets from capital share transactions | (29,917,920 | ) | 35,575,247 | |||||
| Net Increase/(Decrease) in Net Assets | (118,060,097 | ) | 5,522,233 | |||||
| NET ASSETS: | ||||||||
| Beginning of year | 1,212,773,527 | 1,207,251,294 | ||||||
| End of year | $ | 1,094,713,430 | $ | 1,212,773,527 | ||||
| OTHER INFORMATION: | ||||||||
| Share Transactions: | ||||||||
| Institutional Class | ||||||||
| Beginning shares | 124,651,898 | 120,839,296 | ||||||
| Shares sold | 21,493,749 | 19,276,412 | ||||||
| Shares reinvested | 6,635,073 | 7,772,242 | ||||||
| Shares redeemed | (30,024,337 | ) | (23,236,052 | ) | ||||
| Shares outstanding - end of year | 122,756,383 | 124,651,898 | ||||||
| See Notes to Financial Statements. |
| 68 | www.shiplp.com |
| Stone Harbor Investment Funds | Statements of Changes in Net Assets |
| Stone Harbor High Yield Bond Fund | Stone Harbor Local Markets Fund | Stone Harbor Emerging Markets Corporate Debt Fund | ||||||||||||||||||||
| For the Year Ended May 31, 2020 | For the Year Ended May 31, 2019 | For the Year Ended May 31, 2020 | For the Year Ended May 31, 2019 | For the Year Ended May 31, 2020 | For the Year Ended May 31, 2019 | |||||||||||||||||
| $ | 4,205,671 | $ | 4,986,684 | $ | 25,979,157 | $ | 60,534,668 | $ | 789,295 | $ | 686,217 | |||||||||||
| (1,938,060 | ) | (691,308 | ) | (43,749,878 | ) | (117,701,054 | ) | 567,353 | (363,535 | ) | ||||||||||||
| (845,180 | ) | 280,629 | 38,843,514 | 30,384,821 | (578,041 | ) | 447,757 | |||||||||||||||
| 1,422,431 | 4,576,005 | 21,072,793 | (26,781,565 | ) | 778,607 | 770,439 | ||||||||||||||||
| (4,235,833 | ) | (5,017,676 | ) | (470,992 | ) | (13,888,739 | ) | (776,478 | ) | (701,876 | ) | |||||||||||
| (4,235,833 | ) | (5,017,676 | ) | (470,992 | ) | (13,888,739 | ) | (776,478 | ) | (701,876 | ) | |||||||||||
| 1,968,043 | 9,125,191 | 13,257,529 | 102,454,011 | 16,105,347 | 2,037,723 | |||||||||||||||||
| 4,069,342 | 4,646,838 | 446,306 | 13,546,847 | 776,478 | 701,876 | |||||||||||||||||
| (26,331,883 | ) | (27,803,245 | ) | (424,267,142 | ) | (404,111,525 | ) | (24,296,159 | ) | (1,233,237 | ) | |||||||||||
| (20,294,498 | ) | (14,031,216 | ) | (410,563,307 | ) | (288,110,667 | ) | (7,414,334 | ) | 1,506,362 | ||||||||||||
| (23,107,900 | ) | (14,472,887 | ) | (389,961,506 | ) | (328,780,971 | ) | (7,412,205 | ) | 1,574,925 | ||||||||||||
| 88,561,841 | 103,034,728 | 719,557,915 | 1,048,338,886 | 13,077,752 | 11,502,827 | |||||||||||||||||
| $ | 65,453,941 | $ | 88,561,841 | $ | 329,596,409 | $ | 719,557,915 | $ | 5,665,547 | $ | 13,077,752 | |||||||||||
| 11,245,195 | 13,021,383 | 86,730,808 | 121,403,860 | 1,481,930 | 1,307,685 | |||||||||||||||||
| 252,179 | 1,150,428 | 1,561,353 | 12,254,200 | 1,810,572 | 234,133 | |||||||||||||||||
| 522,941 | 596,032 | 49,922 | 1,706,152 | 87,081 | 81,807 | |||||||||||||||||
| (3,326,089 | ) | (3,522,648 | ) | (48,813,612 | ) | (48,633,404 | ) | (2,685,736 | ) | (141,695 | ) | |||||||||||
| 8,694,226 | 11,245,195 | 39,528,471 | 86,730,808 | 693,847 | 1,481,930 | |||||||||||||||||
| See Notes to Financial Statements. |
| Stone Harbor Investment Funds Annual Report | May 31, 2020 | 69 |
| Stone Harbor Investment Funds | Statements of Changes in Net Assets |
| OPERATIONS: |
| Net investment income |
| Net realized gain/(loss) |
| Net realized loss on investments - affiliated investment companies |
| Net change in unrealized appreciation/(depreciation) |
| Net increase/(decrease) in net assets resulting from operations |
| DISTRIBUTIONS TO SHAREHOLDERS: |
| Institutional Class |
| From distributable earnings |
| Net decrease in net assets from distributions to shareholders |
| CAPITAL SHARE TRANSACTIONS: |
| Institutional Class |
| Proceeds from sale of shares |
| Issued to shareholders in reinvestment of distributions |
| Cost of shares redeemed |
| Net increase/(decrease) in net assets from capital share transactions |
| Net Increase/(Decrease) in Net Assets |
| NET ASSETS: |
| Beginning of year |
| End of year |
| OTHER INFORMATION: |
| Share Transactions: |
| Institutional Class |
| Beginning shares |
| Shares sold |
| Shares reinvested |
| Shares redeemed |
| Shares outstanding - end of year |
| See Notes to Financial Statements. |
| 70 | www.shiplp.com |
| Stone Harbor Investment Funds | Statements of Changes in Net Assets |
| Stone Harbor Investment Grade Fund | Stone Harbor Strategic Income Fund | Stone Harbor Emerging Markets Debt Allocation Fund | ||||||||||||||||||||
| For the Year Ended May 31, 2020 | For the Year Ended May 31, 2019 | For the Year Ended May 31, 2020 | For the Year Ended May 31, 2019 | For the Year Ended May 31, 2020 | For the Year Ended May 31, 2019 | |||||||||||||||||
| $ | 214,365 | $ | 220,105 | $ | 1,292,190 | $ | 1,263,499 | $ | 868,130 | $ | 1,082,387 | |||||||||||
| 315,577 | 24,101 | (1,133,891 | ) | (9,729 | ) | 328 | (5,007 | ) | ||||||||||||||
| – | – | (273,077 | ) | (356,582 | ) | (201,950 | ) | (529,696 | ) | |||||||||||||
| 206,340 | 323,712 | (501,789 | ) | 198,439 | (783,115 | ) | (453,194 | ) | ||||||||||||||
| 736,282 | 567,918 | (616,567 | ) | 1,095,627 | (116,607 | ) | 94,490 | |||||||||||||||
| (291,808 | ) | (216,889 | ) | (983,732 | ) | (1,302,137 | ) | (764,332 | ) | (1,009,955 | ) | |||||||||||
| (291,808 | ) | (216,889 | ) | (983,732 | ) | (1,302,137 | ) | (764,332 | ) | (1,009,955 | ) | |||||||||||
| – | – | – | 500 | 6,158,689 | 7,091,344 | |||||||||||||||||
| 291,808 | 216,889 | 954,219 | 1,236,755 | 764,332 | 1,009,955 | |||||||||||||||||
| (396,908 | ) | (705,989 | ) | (1,221,256 | ) | (1,992,246 | ) | (2,987,875 | ) | (7,132,003 | ) | |||||||||||
| (105,100 | ) | (489,100 | ) | (267,037 | ) | (754,991 | ) | 3,935,146 | 969,296 | |||||||||||||
| 339,374 | (138,071 | ) | (1,867,336 | ) | (961,501 | ) | 3,054,207 | 53,831 | ||||||||||||||
| 10,748,855 | 10,886,926 | 32,489,326 | 33,450,827 | 28,212,668 | 28,158,837 | |||||||||||||||||
| $ | 11,088,229 | $ | 10,748,855 | $ | 30,621,990 | $ | 32,489,326 | $ | 31,266,875 | $ | 28,212,668 | |||||||||||
| 1,038,275 | 1,087,670 | 3,392,576 | 3,470,385 | 3,151,919 | 3,045,003 | |||||||||||||||||
| – | – | – | 54 | 735,646 | 801,893 | |||||||||||||||||
| 27,495 | 21,698 | 100,687 | 131,902 | 82,275 | 119,947 | |||||||||||||||||
| (37,982 | ) | (71,093 | ) | (140,536 | ) | (209,765 | ) | (338,583 | ) | (814,924 | ) | |||||||||||
| 1,027,788 | 1,038,275 | 3,352,727 | 3,392,576 | 3,631,257 | 3,151,919 | |||||||||||||||||
| See Notes to Financial Statements. |
| Stone Harbor Investment Funds Annual Report | May 31, 2020 | 71 |
| Stone Harbor Emerging Markets Debt Fund | Financial Highlights |
For a share outstanding through the periods presented.
| For the Year Ended | For the Year Ended | For the Year Ended | For the Year Ended | For the Year Ended | ||||||||||||||||
| Institutional Class | May 31, 2020 | May 31, 2019 | May 31, 2018 | May 31, 2017 | May 31, 2016 | |||||||||||||||
| Net asset value - beginning of year | $ | 9.73 | $ | 9.99 | $ | 10.60 | $ | 10.07 | $ | 10.47 | ||||||||||
| Income/(loss) from investment operations: | ||||||||||||||||||||
| Net investment income(1) | 0.47 | 0.56 | 0.58 | 0.56 | 0.77 | |||||||||||||||
| Net realized and unrealized gain/(loss) on investments | (0.74 | ) | (0.21 | ) | (0.56 | ) | 0.59 | (0.43 | ) | |||||||||||
| Total income/(loss) from investment operations | (0.27 | ) | 0.35 | 0.02 | 1.15 | 0.34 | ||||||||||||||
| Less distributions to shareholders: | ||||||||||||||||||||
| From net investment income | (0.54 | ) | (0.61 | ) | (0.63 | ) | (0.62 | ) | (0.74 | ) | ||||||||||
| Total distributions | (0.54 | ) | (0.61 | ) | (0.63 | ) | (0.62 | ) | (0.74 | ) | ||||||||||
| Net Increase/(Decrease) in Net Asset Value | (0.81 | ) | (0.26 | ) | (0.61 | ) | 0.53 | (0.40 | ) | |||||||||||
| Net asset value - end of year | $ | 8.92 | $ | 9.73 | $ | 9.99 | $ | 10.60 | $ | 10.07 | ||||||||||
| Total Return | (3.02 | )% | 3.82 | % | 0.08 | % | 11.70 | % | 3.70 | % | ||||||||||
| Ratios/Supplemental Data: | ||||||||||||||||||||
| Net assets, end of period (in millions) | $ | 1,095 | $ | 1,213 | $ | 1,207 | $ | 1,442 | $ | 1,573 | ||||||||||
| Ratio of expenses to average net assets without fees waived by investment adviser and expenses reimbursed by investment adviser | 0.72 | % | 0.71 | % | 0.71 | % | 0.69 | % | 0.68 | % | ||||||||||
| Ratio of expenses to average net assets with fees waived by investment adviser and expenses reimbursed by investment adviser | 0.72 | %(2) | 0.71 | %(2) | 0.71 | %(2) | 0.69 | % | 0.68 | % | ||||||||||
| Ratio of net investment income to average net assets with fees waived by investment adviser and expenses reimbursed by investment adviser | 4.89 | % | 5.81 | % | 5.53 | % | 5.37 | % | 7.73 | % | ||||||||||
| Portfolio turnover rate | 118 | % | 104 | % | 108 | % | 114 | % | 90 | % | ||||||||||
| (1) | Calculated using average shares throughout the period. |
| (2) | Includes borrowing costs of 0.01% to average net assets. |
| See Notes to Financial Statements. |
| 72 | www.shiplp.com |
| Stone Harbor High Yield Bond Fund | Financial Highlights |
For a share outstanding through the periods presented.
| For the Year Ended | For the Year Ended | For the Year Ended | For the Year Ended | For the Year Ended | ||||||||||||||||
| Institutional Class | May 31, 2020 | May 31, 2019 | May 31, 2018 | May 31, 2017 | May 31, 2016 | |||||||||||||||
| Net asset value - beginning of year | $ | 7.88 | $ | 7.91 | $ | 8.31 | $ | 7.91 | $ | 8.68 | ||||||||||
| Income/(loss) from investment operations: | ||||||||||||||||||||
| Net investment income(1) | 0.42 | 0.43 | 0.43 | 0.46 | 0.49 | |||||||||||||||
| Net realized and unrealized gain/(loss) on investments | (0.34 | ) | (0.02 | ) | (0.36 | ) | 0.39 | (0.77 | ) | |||||||||||
| Total income/(loss) from investment operations | 0.08 | 0.41 | 0.07 | 0.85 | (0.28 | ) | ||||||||||||||
| Less distributions to shareholders: | ||||||||||||||||||||
| From net investment income | (0.43 | ) | (0.44 | ) | (0.47 | ) | (0.45 | ) | (0.49 | ) | ||||||||||
| Total distributions | (0.43 | ) | (0.44 | ) | (0.47 | ) | (0.45 | ) | (0.49 | ) | ||||||||||
| Net Increase/(Decrease) in Net Asset Value | (0.35 | ) | (0.03 | ) | (0.40 | ) | 0.40 | (0.77 | ) | |||||||||||
| Net asset value - end of year | $ | 7.53 | $ | 7.88 | $ | 7.91 | $ | 8.31 | $ | 7.91 | ||||||||||
| Total Return(2) | 0.96 | % | 5.36 | % | 0.87 | % | 10.97 | % | (3.03 | )% | ||||||||||
| Ratios/Supplemental Data: | ||||||||||||||||||||
| Net assets, end of period (in millions) | $ | 65 | $ | 89 | $ | 103 | $ | 160 | $ | 251 | ||||||||||
| Ratio of expenses to average net assets without fees waived by investment adviser and expenses reimbursed by investment adviser | 0.88 | % | 0.84 | % | 0.77 | % | 0.67 | % | 0.64 | % | ||||||||||
| Ratio of expenses to average net assets with fees waived by investment adviser and expenses reimbursed by investment adviser | 0.66 | %(3) | 0.66 | %(3) | 0.66 | %(3) | 0.65 | % | 0.64 | % | ||||||||||
| Ratio of net investment income to average net assets with fees waived by investment adviser and expenses reimbursed by investment adviser | 5.36 | % | 5.51 | % | 5.25 | % | 5.63 | % | 6.06 | % | ||||||||||
| Portfolio turnover rate | 57 | % | 54 | % | 58 | % | 70 | % | 48 | % | ||||||||||
| (1) | Calculated using average shares throughout the period. |
| (2) | Total returns would have been lower had various fees and expenses not been waived and reimbursed during the period. The total returns in the table represent the rate that an investor would have earned (or lost) on an investment in a Fund (assuming reinvestment of all dividends and distributions). |
| (3) | Includes borrowing costs of 0.01% to average net assets. |
| See Notes to Financial Statements. |
| Stone Harbor Investment Funds Annual Report | May 31, 2020 | 73 |
| Stone Harbor Local Markets Fund | Financial Highlights |
For a share outstanding through the periods presented.
| For the Year Ended | For the Year Ended | For the Year Ended | For the Year Ended | For the Year Ended | ||||||||||||||||
| Institutional Class | May 31, 2020 | May 31, 2019 | May 31, 2018 | May 31, 2017 | May 31, 2016 | |||||||||||||||
| Net asset value - beginning of year | $ | 8.30 | $ | 8.64 | $ | 8.76 | $ | 7.78 | $ | 8.38 | ||||||||||
| Income/(loss) from investment operations: | ||||||||||||||||||||
| Net investment income(1) | 0.47 | 0.51 | 0.56 | 0.56 | 0.50 | |||||||||||||||
| Net realized and unrealized gain/(loss) on investments | (0.42 | ) | (0.74 | ) | (0.59 | ) | 0.42 | (1.10 | ) | |||||||||||
| Total income/(loss) from investment operations | 0.05 | (0.23 | ) | (0.03 | ) | 0.98 | (0.60 | ) | ||||||||||||
| Less distributions to shareholders: | ||||||||||||||||||||
| From net investment income | (0.01 | ) | (0.11 | ) | (0.09 | ) | – | – | ||||||||||||
| Total distributions | (0.01 | ) | (0.11 | ) | (0.09 | ) | – | – | ||||||||||||
| Net Increase/(Decrease) in Net Asset Value | 0.04 | (0.34 | ) | (0.12 | ) | 0.98 | (0.60 | ) | ||||||||||||
| Net asset value - end of year | $ | 8.34 | $ | 8.30 | $ | 8.64 | $ | 8.76 | $ | 7.78 | ||||||||||
| Total Return | 0.59 | % | (2.60 | )% | (0.33 | )% | 12.60 | % | (7.16 | )% | ||||||||||
| Ratios/Supplemental Data: | ||||||||||||||||||||
| Net assets, end of period (in millions) | $ | 330 | $ | 720 | $ | 1,048 | $ | 991 | $ | 927 | ||||||||||
| Ratio of expenses to average net assets without fees waived by investment adviser and expenses reimbursed by investment adviser | 0.96 | % | 0.90 | % | 0.90 | % | 0.89 | % | 0.88 | % | ||||||||||
| Ratio of expenses to average net assets with fees waived by investment adviser and expenses reimbursed by investment adviser | 0.96 | %(2) | 0.90 | %(2) | 0.90 | %(2) | 0.89 | % | 0.88 | % | ||||||||||
| Ratio of net investment income to average net assets with fees waived by investment adviser and expenses reimbursed by investment adviser | 5.53 | % | 6.28 | % | 6.13 | % | 6.76 | % | 6.49 | % | ||||||||||
| Portfolio turnover rate | 103 | % | 101 | % | 119 | % | 125 | % | 166 | % | ||||||||||
| (1) | Calculated using average shares throughout the period. |
| (2) | Includes borrowing costs of 0.01% to average net assets. |
| See Notes to Financial Statements. |
| 74 | www.shiplp.com |
| Stone Harbor Emerging Markets Corporate Debt Fund | Financial Highlights |
For a share outstanding through the periods presented.
| For the Year Ended | For the Year Ended | For the Year Ended | For the Year Ended | For the Year Ended | ||||||||||||||||
| Institutional Class | May 31, 2020 | May 31, 2019 | May 31, 2018 | May 31, 2017 | May 31, 2016 | |||||||||||||||
| Net asset value - beginning of year | $ | 8.82 | $ | 8.80 | $ | 9.14 | $ | 8.82 | $ | 9.11 | ||||||||||
| Income/(loss) from investment operations: | ||||||||||||||||||||
| Net investment income(1) | 0.42 | 0.45 | 0.44 | 0.41 | 0.43 | |||||||||||||||
| Net realized and unrealized gain/(loss) on investments | (0.64 | ) | 0.03 | (0.36 | ) | 0.32 | (0.27 | ) | ||||||||||||
| Total income/(loss) from investment operations | (0.22 | ) | 0.48 | 0.08 | 0.73 | 0.16 | ||||||||||||||
| Less distributions to shareholders: | ||||||||||||||||||||
| From net investment income | (0.43 | ) | (0.46 | ) | (0.42 | ) | (0.41 | ) | (0.45 | ) | ||||||||||
| Total distributions | (0.43 | ) | (0.46 | ) | (0.42 | ) | (0.41 | ) | (0.45 | ) | ||||||||||
| Net Increase/(Decrease) in Net Asset Value | (0.65 | ) | 0.02 | (0.34 | ) | 0.32 | (0.29 | ) | ||||||||||||
| Net asset value - end of year | $ | 8.17 | $ | 8.82 | $ | 8.80 | $ | 9.14 | $ | 8.82 | ||||||||||
| Total Return(2) | (2.71 | )% | 5.71 | % | 0.80 | % | 8.43 | % | 1.92 | % | ||||||||||
| Ratios/Supplemental Data: | ||||||||||||||||||||
| Net assets, end of period (in millions) | $ | 6 | $ | 13 | $ | 12 | $ | 13 | $ | 17 | ||||||||||
| Ratio of expenses to average net assets without fees waived by investment adviser and expenses reimbursed by investment adviser | 1.95 | % | 2.15 | % | 2.19 | % | 1.91 | % | 1.37 | % | ||||||||||
| Ratio of expenses to average net assets with fees waived by investment adviser and expenses reimbursed by investment adviser | 1.01 | %(3) | 1.01 | %(3) | 1.01 | %(3) | 1.00 | % | 1.00 | % | ||||||||||
| Ratio of net investment income to average net assets with fees waived by investment adviser and expenses reimbursed by investment adviser | 4.68 | % | 5.21 | % | 4.76 | % | 4.49 | % | 4.93 | % | ||||||||||
| Portfolio turnover rate | 168 | % | 63 | % | 115 | % | 72 | % | 127 | % | ||||||||||
| (1) | Calculated using average shares throughout the period. |
| (2) | Total returns would have been lower had various fees and expenses not been waived and reimbursed during the period. The total returns in the table represent the rate that an investor would have earned (or lost) on an investment in a Fund (assuming reinvestment of all dividends and distributions). |
| (3) | Includes borrowing costs of 0.01% to average net assets. |
| See Notes to Financial Statements. |
| Stone Harbor Investment Funds Annual Report | May 31, 2020 | 75 |
| Stone Harbor Investment Grade Fund | Financial Highlights |
For a share outstanding through the periods presented.
| For the Year Ended | For the Year Ended | For the Year Ended | For the Year Ended | For the Year Ended | ||||||||||||||||
| Institutional Class | May 31, 2020 | May 31, 2019 | May 31, 2018 | May 31, 2017 | May 31, 2016 | |||||||||||||||
| Net asset value - beginning of year | $ | 10.35 | $ | 10.01 | $ | 10.38 | $ | 10.40 | $ | 10.36 | ||||||||||
| Income/(loss) from investment operations: | ||||||||||||||||||||
| Net investment income(1) | 0.21 | 0.21 | 0.20 | 0.18 | 0.16 | |||||||||||||||
| Net realized and unrealized gain/(loss) on investments | 0.51 | 0.34 | (0.28 | ) | 0.03 | 0.12 | ||||||||||||||
| Total income/(loss) from investment operations | 0.72 | 0.55 | (0.08 | ) | 0.21 | 0.28 | ||||||||||||||
| Less distributions to shareholders: | ||||||||||||||||||||
| From net investment income | (0.21 | ) | (0.21 | ) | (0.20 | ) | (0.19 | ) | (0.15 | ) | ||||||||||
| From net realized gains | (0.07 | ) | – | (0.09 | ) | (0.04 | ) | (0.09 | ) | |||||||||||
| Total distributions | (0.28 | ) | (0.21 | ) | (0.29 | ) | (0.23 | ) | (0.24 | ) | ||||||||||
| Net Increase/(Decrease) in Net Asset Value | 0.44 | 0.34 | (0.37 | ) | (0.02 | ) | 0.04 | |||||||||||||
| Net asset value - end of year | $ | 10.79 | $ | 10.35 | $ | 10.01 | $ | 10.38 | $ | 10.40 | ||||||||||
| Total Return(2) | 7.03 | % | 5.59 | % | (0.81 | )% | 2.07 | % | 2.71 | % | ||||||||||
| Ratios/Supplemental Data: | ||||||||||||||||||||
| Net assets, end of period (in millions) | $ | 11 | $ | 11 | $ | 11 | $ | 15 | $ | 16 | ||||||||||
| Ratio of expenses to average net assets without fees waived by investment adviser and expenses reimbursed by investment adviser | 1.97 | % | 2.02 | % | 1.79 | % | 1.32 | % | 1.40 | % | ||||||||||
| Ratio of expenses to average net assets with fees waived by investment adviser and expenses reimbursed by investment adviser | 0.51 | %(3) | 0.51 | %(3) | 0.51 | %(3) | 0.50 | % | 0.50 | % | ||||||||||
| Ratio of net investment income to average net assets with fees waived by investment adviser and expenses reimbursed by investment adviser | 1.94 | % | 2.10 | % | 1.91 | % | 1.72 | % | 1.57 | % | ||||||||||
| Portfolio turnover rate | 54 | % | 49 | % | 42 | % | 49 | % | 52 | % | ||||||||||
| (1) | Calculated using average shares throughout the period. |
| (2) | Total returns would have been lower had various fees and expenses not been waived and reimbursed during the period. The total returns in the table represent the rate that an investor would have earned (or lost) on an investment in a Fund (assuming reinvestment of all dividends and distributions). |
| (3) | Includes borrowing costs of 0.01% to average net assets. |
| See Notes to Financial Statements. |
| 76 | www.shiplp.com |
| Stone Harbor Strategic Income Fund | Financial Highlights |
For a share outstanding through the periods presented.
| For the Year Ended | For the Year Ended | For the Year Ended | For the Year Ended | For the Year Ended | ||||||||||||||||
| Institutional Class | May 31, 2020 | May 31, 2019 | May 31, 2018 | May 31, 2017 | May 31, 2016 | |||||||||||||||
| Net asset value - beginning of year | $ | 9.58 | $ | 9.64 | $ | 9.90 | $ | 9.57 | $ | 10.05 | ||||||||||
| Income/(loss) from investment operations: | ||||||||||||||||||||
| Net investment income(1) | 0.38 | 0.37 | 0.40 | 0.38 | 0.43 | |||||||||||||||
| Net realized and unrealized gain/(loss) on investments | (0.54 | ) | (0.04 | ) | (0.34 | ) | 0.31 | (0.43 | ) | |||||||||||
| Total income/(loss) from investment operations | (0.16 | ) | 0.33 | 0.06 | 0.69 | – | ||||||||||||||
| Less distributions to shareholders: | ||||||||||||||||||||
| From net investment income | (0.29 | ) | (0.39 | ) | (0.32 | ) | (0.36 | ) | (0.35 | ) | ||||||||||
| From net realized gains | – | – | – | – | (0.13 | ) | ||||||||||||||
| Total distributions | (0.29 | ) | (0.39 | ) | (0.32 | ) | (0.36 | ) | (0.48 | ) | ||||||||||
| Net Increase/(Decrease) in Net Asset Value | (0.45 | ) | (0.06 | ) | (0.26 | ) | 0.33 | (0.48 | ) | |||||||||||
| Net asset value - end of year | $ | 9.13 | $ | 9.58 | $ | 9.64 | $ | 9.90 | $ | 9.57 | ||||||||||
| Total Return(2) | (1.75 | )% | 3.58 | % | 0.60 | % | 7.34 | % | 0.19 | % | ||||||||||
| Ratios/Supplemental Data: | ||||||||||||||||||||
| Net assets, end of period (in millions) | $ | 31 | $ | 32 | $ | 33 | $ | 37 | $ | 36 | ||||||||||
| Ratio of expenses to average net assets without fees waived by investment adviser and expenses reimbursed by investment adviser | 1.12 | %(3) | 1.09 | %(3) | 1.01 | %(3) | 0.94 | %(3) | 0.96 | %(3) | ||||||||||
| Ratio of expenses to average net assets with fees waived by investment adviser and expenses reimbursed by investment adviser | 0.08 | %(3) | 0.06 | %(3) | 0.07 | %(3) | 0.11 | %(3) | 0.12 | %(3) | ||||||||||
| Ratio of net investment income to average net assets with fees waived by investment adviser and expenses reimbursed by investment adviser | 3.99 | %(3) | 3.94 | %(3) | 4.03 | %(3) | 3.89 | %(3) | 4.46 | %(3) | ||||||||||
| Portfolio turnover rate | 7 | % | 8 | % | 29 | % | 20 | % | 26 | % | ||||||||||
| (1) | Calculated using average shares throughout the period. |
| (2) | Total returns would have been lower had various fees and expenses not been waived and reimbursed during the period. The total returns in the table represent the rate that an investor would have earned (or lost) on an investment in a Fund (assuming reinvestment of all dividends and distributions). |
| (3) | Ratio does not include expenses of the mutual funds held in the investment portfolio. |
| See Notes to Financial Statements. |
| Stone Harbor Investment Funds Annual Report | May 31, 2020 | 77 |
| Stone Harbor Emerging Markets Debt Allocation Fund | Financial Highlights |
For a share outstanding through the periods presented.
| For the Year Ended | For the Year Ended | For the Year Ended | For the Year Ended | For the Year Ended | ||||||||||||||||
| Institutional Class | May 31, 2020 | May 31, 2019 | May 31, 2018 | May 31, 2017 | May 31, 2016 | |||||||||||||||
| Net asset value - beginning of year | $ | 8.95 | $ | 9.25 | $ | 9.55 | $ | 8.90 | $ | 9.36 | ||||||||||
| Loss from investment operations: | ||||||||||||||||||||
| Net investment income(1) | 0.27 | 0.33 | 0.31 | 0.25 | 0.32 | |||||||||||||||
| Net realized and unrealized gain/(loss) on investments | (0.36 | ) | (0.33 | ) | (0.28 | ) | 0.74 | (0.52 | ) | |||||||||||
| Total income/(loss) from investment operations | (0.09 | ) | – | 0.03 | 0.99 | (0.20 | ) | |||||||||||||
| Less distributions to shareholders: | ||||||||||||||||||||
| From net investment income | (0.25 | ) | (0.30 | ) | (0.33 | ) | (0.34 | ) | (0.26 | ) | ||||||||||
| Total distributions | (0.25 | ) | (0.30 | ) | (0.33 | ) | (0.34 | ) | (0.26 | ) | ||||||||||
| Net Increase/(Decrease) in Net Asset Value | (0.34 | ) | (0.30 | ) | (0.30 | ) | 65.00 | (0.46 | ) | |||||||||||
| Net asset value - end of year | $ | 8.61 | $ | 8.95 | $ | 9.25 | $ | 9.55 | $ | 8.90 | ||||||||||
| Total Return(2) | (1.21 | )% | 0.20 | % | 0.21 | % | 11.51 | % | (1.96 | )% | ||||||||||
| Ratios/Supplemental Data: | ||||||||||||||||||||
| Net assets, end of period (in millions) | $ | 31 | $ | 28 | $ | 28 | $ | 28 | $ | 67 | ||||||||||
| Ratio of expenses to average net assets without fees waived by investment adviser and expenses reimbursed by investment adviser | 1.22 | %(3) | 1.21 | %(3) | 1.19 | %(3) | 0.98 | %(3) | 0.87 | %(3) | ||||||||||
| Ratio of expenses to average net assets with fees waived by investment adviser and expenses reimbursed by investment adviser | 0.03 | %(3) | 0.05 | %(3) | 0.05 | %(3) | 0.05 | %(3) | 0.06 | %(3) | ||||||||||
| Ratio of net investment income to average net assets with fees waived by investment adviser and expenses reimbursed by investment adviser | 2.98 | %(3) | 3.70 | %(3) | 3.21 | %(3) | 2.72 | %(3) | 3.72 | %(3) | ||||||||||
| Portfolio turnover rate | 21 | % | 38 | % | 33 | % | 24 | % | 70 | % | ||||||||||
| (1) | Calculated using average shares throughout the period. |
| (2) | Total returns would have been lower had various fees and expenses not been waived and reimbursed during the period. The total returns in the table represent the rate that an investor would have earned (or lost) on an investment in a Fund (assuming reinvestment of all dividends and distributions). |
| (3) | Ratio does not include expenses of the mutual funds held in the investment portfolio. |
| See Notes to Financial Statements. |
| 78 | www.shiplp.com |
| Stone Harbor Investment Funds | Notes to Financial Statements |
May 31, 2020
1. ORGANIZATION
Stone Harbor Investment Funds, which consists of Stone Harbor Emerging Markets Debt Fund, Stone Harbor High Yield Bond Fund, Stone Harbor Local Markets Fund, Stone Harbor Emerging Markets Corporate Debt Fund, Stone Harbor Investment Grade Fund, Stone Harbor Strategic Income Fund, and Stone Harbor Emerging Markets Debt Allocation Fund (each, a “Fund” and together, the “Funds”) is a Massachusetts business trust (the “Trust”), organized on February 20, 2007 and registered under the Investment Company Act of 1940, as amended (the “1940 Act”), as an open-end management investment company. Shares of each Fund are currently divided into two classes, designated Institutional Class Shares and Distributor Class Shares. As of the date of this report, Distributor Class shares were not offered for sale in each Fund. The Trust’s Declaration of Trust permits the Trustees to create additional funds and share classes. The Trust also includes the Stone Harbor Emerging Markets Debt Blend Fund which had not commenced operations as of the reporting period.
The Emerging Markets Debt Fund’s investment objective is to maximize total return. The Fund normally will invest at least 80% of its net assets (plus any borrowings made for investment purposes) in Emerging Markets Fixed Income Securities. “Emerging Markets Fixed Income Securities” include fixed income securities and derivative instruments (including, but not limited to, spot and currency contracts, futures, options and swaps) that economically are tied to countries with emerging securities markets or whose performance is linked to those countries’ markets, economies or ability to repay loans. Emerging Markets Fixed Income Securities may be denominated in non-U.S. currencies or the U.S. dollar. A security or instrument is economically tied to an emerging market country if it is principally traded on the country’s securities markets or the issuer is organized or principally operates in the country, derives a majority of its income from its operations within the country or has a majority of its assets within the country. Emerging Markets Fixed Income Securities also include derivatives and other instruments used to hedge or gain exposure to emerging securities markets (for example, futures or other derivatives whose return is based on specific emerging markets securities or indices).
The High Yield Bond Fund’s investment objective is to maximize total return. The Fund will normally invest at least 80% of its net assets (plus any borrowings made for investment purposes) in High Yield Debt Securities. “High Yield Debt Securities” include fixed income securities and derivative instruments (including, but not limited to, spot and currency contracts, futures, options and swaps) rated below investment grade (or, if unrated, of comparable quality as determined by Stone Harbor Investment Partners LP (the “Adviser” or “Stone Harbor”). These types of securities and instruments are commonly referred to as “high yield” securities or “junk bonds,” and may include, among other things, bonds, debentures, notes, equipment trust certificates, commercial paper, commercial loans, preferred stock and other obligations of U.S. and non-U.S. issuers. High Yield Debt Securities also include securities or other instruments whose return is based on the return of high yield securities, including derivative instruments and instruments created to hedge or gain exposure to the high yield markets.
The Local Markets Fund’s investment objective is to maximize total return. The Fund normally will invest at least 80% of its net assets (plus any borrowings made for investment purposes) in Emerging Markets Investments. “Emerging Markets Investments” include fixed income securities and derivative instruments (including, but not limited to, spot and currency contracts, futures, options and swaps) that economically are tied to an emerging market country, which are denominated in the predominant currency of the local market of an emerging market country (an “Emerging Markets Currency”) or whose performance is linked to those countries’ currencies, markets, economies or ability to repay loans. Although under normal circumstances a significant portion of the Fund’s investments will be denominated in Emerging Markets Currencies, Emerging Markets Investments may be denominated in non-Emerging Markets Currencies, including the U.S. dollar. A security or instrument is economically tied to an emerging market country if it is principally traded on the country’s securities markets or the issuer is organized or principally operates in the country, derives a majority of its income from its operations within the country or has a majority of its assets within the country. Emerging Markets Investments also include Emerging Markets Currencies and derivatives and other instruments used to hedge or gain exposure to emerging securities markets or Emerging Markets Currencies (for example, futures or other derivatives whose return is based on specific emerging markets securities, emerging markets indices or Emerging Markets Currencies).
The Emerging Markets Corporate Debt Fund’s investment objective is to maximize total return. The Fund normally will invest at least 80% of its net assets (plus any borrowings made for investment purposes) in Emerging Markets Corporate Debt Investments. “Emerging Markets Corporate Debt Investments” are debt instruments, including loans, issued by corporations or other business organizations that are economically tied to an emerging market country. A corporation or other business organization is economically tied to an emerging market country if it issues securities that are principally traded on the country’s securities markets or if it is organized or principally operates in the country, derives a majority of its income from its operations within the country or has a majority of its assets within the country. Emerging Markets Corporate Debt Investments also include derivative instruments used for hedging purposes or to otherwise gain or reduce long or short exposure to Emerging Markets Corporate Debt Investments.
The Investment Grade Fund’s investment objective is to maximize total return. The Fund invests in various types of fixed income securities and under normal market conditions will invest at least 80% of its net assets (plus any borrowings made for investment purposes) in Investment Grade Debt Securities. “Investment Grade Debt Securities” include fixed income securities that are rated investment grade by any of Moody’s Investors Services, Inc., Standard & Poor’s Rating Services, Fitch Ratings Limited, DBRS or other qualified rating agencies or, if unrated, are determined by the Adviser to be of comparable quality, and derivative instruments related to those securities.
| Stone Harbor Investment Funds Annual Report | May 31, 2020 | 79 |
| Stone Harbor Investment Funds | Notes to Financial Statements |
May 31, 2020
The Strategic Income Fund’s investment objective is to maximize total return. The Fund is intended to provide broad exposure to global credit markets. The Fund, either directly or through investment in the underlying funds (defined below), may invest in a broad variety of fixed income and other income producing securities and instruments (including derivatives), and will not be limited in terms of type of instrument, geography, credit rating or duration. The Fund may invest all or a significant portion of its assets in Stone Harbor Investment Grade Fund, Stone Harbor High Yield Bond Fund, Stone Harbor Emerging Markets Debt Fund, Stone Harbor Local Markets Fund and Stone Harbor Emerging Markets Corporate Debt Fund and other funds sponsored or advised by the Adviser (together, the “underlying funds”). The Fund is not required to invest in the underlying funds, and from time to time may not be invested in any underlying fund. In addition to investing in the underlying funds, the Fund may invest directly in fixed income securities and in other instruments and transactions.
The Emerging Markets Debt Allocation Fund’s investment objective is to maximize total return. The Fund will normally invest, either directly or through investment in the underlying funds (defined below), at least 80% of its net assets (plus any borrowings made for investment purposes) in Emerging Markets Investments. Emerging Markets Investments include fixed income securities and derivative instruments (including, but not limited to, spot and currency contracts, futures, options and swaps), that economically are tied to an emerging market country or whose performance is linked to those countries’ currencies, markets, economies or ability to repay loans. The Fund may invest all or a significant portion of its assets in Stone Harbor Emerging Markets Debt Fund and Stone Harbor Local Markets Fund (together, the “underlying funds”). The Fund is not required to invest in the underlying funds, and from time to time may not be invested in any underlying fund. In addition to investing in the underlying funds, the Fund may invest directly in fixed income securities and in other instruments and transactions.
The Emerging Markets Debt Fund and Local Markets Fund are each classified as “non-diversified” under the 1940 Act. As a result, these Funds can invest a greater portion of the respective Funds’ assets in obligations of a single issuer than a “diversified” fund. These Funds may therefore be more susceptible than a diversified fund to being adversely affected by any single corporate, economic, political or regulatory occurrence. The High Yield Bond Fund, Emerging Markets Corporate Debt Fund, Investment Grade Fund, Strategic Income Fund, and the Emerging Markets Debt Allocation Fund are diversified funds. The Emerging Markets Corporate Debt Fund was previously classified as a non-diversified investment company for purposes of the 1940 Act. As a result of ongoing operations, the Emerging Markets Corporate Debt Fund is now classified as a diversified company.
2. SIGNIFICANT ACCOUNTING POLICIES AND RISK DISCLOSURES
The following is a summary of significant accounting policies consistently followed by the Funds in the preparation of their financial statements. Each Fund is considered an investment company for financial reporting purposes under generally accepted accounting principles in the United States of America (“GAAP”). The policies are in conformity with GAAP. The preparation of the financial statements in accordance with GAAP requires management to make estimates and assumptions that affect the reported amounts of assets and liabilities at the date of the financial statements and the reported amounts of income and expenses during the reporting period. Actual results could differ from those estimates.
Investment Valuation: Sovereign debt obligations, corporate bonds, convertible corporate bonds, and U.S. Treasury bonds, are generally valued at the mean between the closing bid and asked prices provided by an independent pricing service. The pricing services generally use market models that consider trade data, yields, spreads, quotations from dealers and active market makers, credit worthiness, market information on comparable securities, and other relevant security specific information. Asset backed/commercial mortgage backed securities are generally valued at the mean between the closing bid and asked prices provided by an independent pricing service. The pricing services generally use models that consider trade data, prepayment and default projections, benchmark yield and spread data and estimated cash flows of each tranche of the issuer. Bank loans are primarily valued by a loan pricing provider using a composite loan price at the mean of the bid and ask prices from one or more brokers of dealers. Credit linked securities are generally valued using quotations from the broker through which the Fund executed the transaction. The broker’s quotation considers cash flows, default and recovery rates, and other security specific information. Equity securities for which market quotations are available are generally valued at the last sale price or official closing price on the primary market or exchange on which they trade. If on a given day, a closing price is not available on the exchange, the equity security is valued at the mean between the closing bid and asked prices, as such prices are provided by a pricing service. Publicly traded foreign government debt securities are typically traded internationally in the over the counter (“OTC”) market, and are valued at the mean between the bid and asked prices as of the close of business of that market. When prices are not readily available, or are determined not to reflect fair value, such as when the value of a security has been significantly affected by events after the close of the exchange or market on which the security is principally traded, but before the Funds calculate their net asset value, the Funds may value these investments at fair value as determined in accordance with the procedures approved by the Funds’ Board of Trustees (the “Board”). Short term obligations with maturities of 60 days or less are valued at amortized cost, which approximates market value. Open end funds and money market mutual funds are valued at their net asset value. Futures contracts are ordinarily valued at the settlement price established by the securities or commodities exchange on which they are traded, except that S&P 500 futures contracts are priced at the last transaction price before 4:00 p.m. Eastern time (generally at approximately 3:59 p.m. Eastern time) on the commodities exchange on which they are traded. OTC traded options are priced by Markit and exchange traded options are valued by the securities or commodities exchange on which they are traded. OTC traded credit default swaps are valued by the independent pricing source using a mid price that is calculated based on data an independent pricing source receives from dealers. OTC traded foreign currency options are valued by an independent pricing source using mid foreign exchange rates against USD for all currencies at 4:00 p.m. Eastern time. Derivatives which are cleared by an exchange are priced by using the last price on such exchange. Forward foreign currency contracts are priced at the mean between the closing bid and asked prices at 4:00 p.m. Eastern time.
| 80 | www.shiplp.com |
| Stone Harbor Investment Funds | Notes to Financial Statements |
May 31, 2020
A three-tier hierarchy has been established to measure fair value based on the extent of use of “observable inputs” as compared to “unobservable inputs” for disclosure purposes and requires additional disclosures about these valuations measurements. Inputs refer broadly to the assumptions that market participants would use in pricing a security. Observable inputs are inputs that reflect the assumptions market participants would use in pricing the security developed based on market data obtained from sources independent of the reporting entity. Unobservable inputs are inputs that reflect the reporting entity’s own assumptions about the assumptions market participants would use in pricing the security developed based on the best information available in the circumstances.
The three-tier hierarchy is summarized as follows:
| Level 1— | Unadjusted quoted prices in active markets for identical assets or liabilities that the Fund has the ability to access. |
| Level 2— | Observable inputs other than quoted prices included in level 1 that are observable for the asset or liability, either directly or indirectly. These inputs may include quoted prices for the identical instrument on an inactive market, prices for similar instruments, interest rates, prepayment speeds, credit risk, yield curves, default rates, and similar data. |
| Level 3— | Unobservable inputs for the asset or liability, to the extent relevant observable inputs are not available, representing the Fund’s own assumptions about the assumptions a market participant would use in valuing the asset or liability, and would be based on the best information available. |
The following is a summary of each Fund’s investments and financial instruments based on the three-tier hierarchy as of May 31, 2020:
| Investments in Securities at Value* | Level 1 | Level 2 | Level 3 | Total | ||||||||||||
| Stone Harbor Emerging Markets Debt Fund | ||||||||||||||||
| Sovereign Debt Obligations | $ | – | $ | 710,305,732 | $ | – | $ | 710,305,732 | ||||||||
| Corporate Bonds | ||||||||||||||||
| Indonesia | – | 31,703,842 | 47 | 31,703,889 | ||||||||||||
| Other | – | 325,845,910 | – | 325,845,910 | ||||||||||||
| Credit Linked Notes | ||||||||||||||||
| Iraq | – | – | 8,784,692 | 8,784,692 | ||||||||||||
| Purchased Options | – | 70,077 | – | 70,077 | ||||||||||||
| Short Term Investments | 7,976,391 | – | – | 7,976,391 | ||||||||||||
| Total | $ | 7,976,391 | $ | 1,067,925,561 | $ | 8,784,739 | $ | 1,084,686,691 | ||||||||
| Other Financial Instruments** | ||||||||||||||||
| Assets | ||||||||||||||||
| Forward Foreign Currency Contracts | $ | – | $ | 232,865 | $ | – | $ | 232,865 | ||||||||
| Liabilities | ||||||||||||||||
| Forward Foreign Currency Contracts | – | (3,230,076 | ) | – | (3,230,076 | ) | ||||||||||
| Total | $ | – | $ | (2,997,211 | ) | $ | – | $ | (2,997,211 | ) | ||||||
| Investments in Securities at Value* | Level 1 | Level 2 | Level 3 | Total | ||||||||||||
| Stone Harbor High Yield Bond Fund | ||||||||||||||||
| Corporate Bonds | ||||||||||||||||
| Exploration & Production | $ | – | $ | 3,891,722 | $ | 40 | $ | 3,891,762 | ||||||||
| Other | – | 56,510,175 | – | 56,510,175 | ||||||||||||
| Bank Loans | – | 3,835,167 | – | 3,835,167 | ||||||||||||
| Common/Preferred Stocks | 314 | – | – | 314 | ||||||||||||
| Short Term Investments | 568,859 | – | – | 568,859 | ||||||||||||
| Total | $ | 569,173 | $ | 64,237,064 | $ | 40 | $ | 64,806,277 | ||||||||
| Stone Harbor Investment Funds Annual Report | May 31, 2020 | 81 |
| Stone Harbor Investment Funds | Notes to Financial Statements |
May 31, 2020
| Investments in Securities at Value* | Level 1 | Level 2 | Level 3 | Total | ||||||||||||
| Stone Harbor Local Markets Fund | ||||||||||||||||
| Sovereign Debt Obligations | $ | – | $ | 279,934,195 | $ | – | $ | 279,934,195 | ||||||||
| Corporate Bonds | – | 20,412,134 | – | 20,412,134 | ||||||||||||
| Short Term Investments | 773,577 | – | – | 773,577 | ||||||||||||
| Total | $ | 773,577 | $ | 300,346,329 | $ | – | $ | 301,119,906 | ||||||||
| Other Financial Instruments** | ||||||||||||||||
| Assets | ||||||||||||||||
| Forward Foreign Currency Contracts | $ | – | $ | 1,739,263 | $ | – | $ | 1,739,263 | ||||||||
| Liabilities | ||||||||||||||||
| Forward Foreign Currency Contracts | – | (1,904,882 | ) | – | (1,904,882 | ) | ||||||||||
| Total | $ | – | $ | (165,619 | ) | $ | – | $ | (165,619 | ) | ||||||
| Investments in Securities at Value* | Level 1 | Level 2 | Level 3 | Total | ||||||||||||
| Stone Harbor Emerging Markets Corporate Debt Fund | ||||||||||||||||
| Sovereign Debt Obligations | $ | – | $ | 53,419 | $ | – | $ | 53,419 | ||||||||
| Corporate Bonds | – | 5,407,884 | – | 5,407,884 | ||||||||||||
| Short Term Investments | 57,791 | – | – | 57,791 | ||||||||||||
| Total | $ | 57,791 | $ | 5,461,303 | $ | – | $ | 5,519,094 | ||||||||
| Investments in Securities at Value* | Level 1 | Level 2 | Level 3 | Total | ||||||||||||
| Stone Harbor Investment Grade Fund*** | ||||||||||||||||
| Asset Backed/Commercial Mortgage Backed Securities | $ | – | $ | 1,286,528 | $ | – | $ | 1,286,528 | ||||||||
| U.S. Government Agency Mortgage Backed Securities | – | 2,265,903 | – | 2,265,903 | ||||||||||||
| Corporate Bonds | – | 4,800,402 | – | 4,800,402 | ||||||||||||
| U.S. Treasury Bonds/Notes | – | 2,330,685 | – | 2,330,685 | ||||||||||||
| Total | $ | – | $ | 10,683,518 | $ | – | $ | 10,683,518 | ||||||||
| Investments in Securities at Value* | Level 1 | Level 2 | Level 3 | Total | ||||||||||||
| Stone Harbor Strategic Income Fund | ||||||||||||||||
| Open-End Funds | $ | 29,798,142 | $ | – | $ | – | $ | 29,798,142 | ||||||||
| Short Term Investments | 173,847 | – | – | 173,847 | ||||||||||||
| Total | $ | 29,971,989 | $ | – | $ | – | $ | 29,971,989 | ||||||||
| Other Financial Instruments** | Level 1 | Level 2 | Level 3 | Total | ||||||||||||
| Assets | ||||||||||||||||
| Forward Foreign Currency Contracts | $ | – | $ | 11,750 | $ | – | $ | 11,750 | ||||||||
| Future Contracts | 9,528 | – | – | 9,528 | ||||||||||||
| Liabilities | ||||||||||||||||
| Forward Foreign Currency Contracts | – | (11,902 | ) | – | (11,902 | ) | ||||||||||
| Credit Default Swap Contracts | – | (73,098 | ) | – | (73,098 | ) | ||||||||||
| Future Contracts | (35,313 | ) | – | – | (35,313 | ) | ||||||||||
| Total | $ | (25,785 | ) | $ | (73,250 | ) | $ | – | $ | (99,035 | ) | |||||
| Investments in Securities at Value* | Level 1 | Level 2 | Level 3 | Total | ||||||||||||
| Stone Harbor Emerging Markets Debt Allocation Fund | ||||||||||||||||
| Open-End Funds | $ | 31,134,509 | $ | – | $ | – | $ | 31,134,509 | ||||||||
| Short Term Investments | 7,981 | – | – | 7,981 | ||||||||||||
| Total | $ | 31,142,490 | $ | – | $ | – | $ | 31,142,490 | ||||||||
| 82 | www.shiplp.com |
| Stone Harbor Investment Funds | Notes to Financial Statements |
May 31, 2020
| Other Financial Instruments** | Level 1 | Level 2 | Level 3 | Total | ||||||||||||
| Assets | ||||||||||||||||
| Forward Foreign Currency Contracts | $ | – | $ | 17,872 | $ | – | $ | 17,872 | ||||||||
| Liabilities | ||||||||||||||||
| Forward Foreign Currency Contracts | – | (3,125 | ) | – | (3,125 | ) | ||||||||||
| Total | $ | – | $ | 14,747 | $ | – | $ | 14,747 | ||||||||
| * | For detailed country descriptions, see accompanying Statement of Investments. |
| ** | Other financial instruments are derivative instruments reflected in the Statement of Investments. The derivatives shown in this table are reported at their unrealized appreciation/(depreciation) at measurement date, which represents the change in the contract's value from trade date. |
| *** | For liabilities arising from bank overdrafts, the carrying amount approximates fair value due to the relatively short-term maturity of these financial instruments. As of May 31, 2020, the liabilities related to bank overdrafts used level 2 inputs. |
The following is a reconciliation of assets in which significant unobservable inputs (Level 3) were used in determining fair value:
| Asset Type | Balance as of May 31, 2019 | Accrued Discount/ premium | Return of Capital | Realized Gain/(Loss) | Change in Unrealized Appreciation/ (Depreciation) | Purchases | Sales Proceeds | Transfer into Level 3 | Transfer Out of Level 3 | Balance as of May 31, 2020 | Net change in unrealized appreciation/ (depreciation) included in the Statements of Operations attributable to Level 3 investments held at May 31, 2020 | |||||||||||||||||||||||||||||||||
| Stone Harbor Emerging Markets Debt Fund | ||||||||||||||||||||||||||||||||||||||||||||
| Corporate Bonds | $ | 48 | $ | – | $ | – | $ | – | $ | (1 | ) | $ | – | $ | – | $ | – | $ | – | $ | 47 | $ | (1 | ) | ||||||||||||||||||||
| Credit Linked Notes | 5,326,679 | 213,523 | – | 7,978 | 202,396 | 4,200,946 | (1,166,830 | ) | – | – | 8,784,692 | (2,594,734 | ) | |||||||||||||||||||||||||||||||
| $ | 5,326,727 | $ | 213,523 | $ | – | $ | 7,978 | $ | 202,395 | $ | 4,200,946 | $ | (1,166,830 | ) | $ | – | $ | – | $ | 8,784,739 | $ | (2,594,735 | ) | |||||||||||||||||||||
| Asset Type | Balance as of May 31, 2019 | Accrued Discount/ premium | Return of Capital | Realized Gain/(Loss) | Change in Unrealized Appreciation/ (Depreciation) | Purchases | Sales Proceeds | Transfer into Level 3 | Transfer Out of Level 3 | Balance as of May 31, 2020 | Net change in unrealized appreciation/ (depreciation) included in the Statements of Operations attributable to Level 3 investments held at May 31, 2020 | |||||||||||||||||||||||||||||||||
| Stone Harbor High Yield Bond Fund | ||||||||||||||||||||||||||||||||||||||||||||
| Corporate Bonds | $ | – | $ | – | $ | – | $ | – | $ | – | $ | – | $ | – | $ | 40 | $ | – | $ | 40 | $ | (150,069 | ) | |||||||||||||||||||||
| Warrants | 33 | – | – | 2 | (1 | ) | – | (34 | ) | – | – | – | – | |||||||||||||||||||||||||||||||
| $ | 33 | $ | – | $ | – | $ | 2 | $ | (1 | ) | $ | – | $ | (34 | ) | $ | 40 | $ | – | $ | 40 | $ | (150,069 | ) | ||||||||||||||||||||
All level 3 investments have values determined utilizing third party pricing information without adjustment.
The inputs or methodology used for valuing securities are not necessarily an indication of the risk associated with investing in those securities.
In the event a Board approved independent pricing service is unable to provide an evaluated price for a security or the Adviser believes the price provided is not reliable, securities of the Funds may be valued at fair value as described above. In these instances the Adviser may seek to find an alternative independent source, such as a broker/dealer to provide a price quote, or by using evaluated pricing models similar to the techniques and models used by the independent pricing service. These fair value measurement techniques may utilize unobservable inputs (Level 3).
| Stone Harbor Investment Funds Annual Report | May 31, 2020 | 83 |
| Stone Harbor Investment Funds | Notes to Financial Statements |
May 31, 2020
On at least a quarterly basis, the Adviser presents the factors considered in determining the fair value measurements and presents that information to the Board which meets at least quarterly.
Security Transactions and Investment Income: Security transactions are accounted for on a trade date basis. Interest income, adjusted for amortization of premium and accretion of discount, is recorded on the accrual basis. Dividend income is recorded on the ex-dividend date. Foreign dividend income is recorded on the ex-dividend date or as soon as practical after the Funds determine the existence of a dividend declaration after exercising reasonable due diligence. Dividend income received from underlying affiliated funds is generally reinvested back into the underlying fund. If applicable, any foreign capital gains taxes are accrued, net of unrealized gains, and are payable upon the sale of such investments. The cost of investments sold is determined by use of the specific identification method. To the extent any issuer defaults on an expected interest payment, the Funds’ policy is to generally halt any additional interest income accruals and consider the realizability of interest accrued up to the date of default.
Foreign Currency Translation: The books and records of the Funds are maintained in U.S. dollars. Investment valuations and other assets and liabilities initially expressed in foreign currencies are converted each business day into U.S. dollars based upon current exchange rates. Prevailing foreign exchange rates may generally be obtained at the close of the NYSE (normally, 4:00 p.m. EST). The portion of realized and unrealized gains or losses on investments due to fluctuations in foreign currency exchange rates is not separately disclosed and is included in realized and unrealized gains or losses on investments, when applicable.
Foreign Securities: The Funds may directly purchase securities of foreign issuers. Investing in securities of foreign issuers involves special risks not typically associated with investing in securities of U.S. issuers. The risks include possible revaluation of currencies, the ability to repatriate funds, less complete financial information about companies and possible future adverse political and economic developments. Moreover, securities of many foreign issuers and their markets may be less liquid and their prices more volatile than those of securities of comparable U.S. issuers.
Credit Linked Notes: The Funds may invest in credit linked notes to obtain economic exposure to high yield, emerging markets or other securities. Investments in a credit linked note typically provide the holder with a return based on the return of an underlying reference instrument, such as an emerging market bond. Like an investment in a bond, investments in credit-linked securities represent the right to receive periodic income payments (in the form of distributions) and payment of principal at the end of the term of the security. In addition to the risks associated with the underlying reference instrument, an investment in a credit linked note is also subject to liquidity risk, market risk, interest rate risk and the risk that the counterparty will be unwilling or unable to meet its obligations under the note.
Segregation and Collateralization: In cases in which the 1940 Act and the interpretive positions of the U.S. Securities and Exchange Commission (“SEC”) require that a Fund either deliver collateral or segregate assets in connection with certain investments (e.g., foreign currency exchange contracts, securities with extended settlement periods, and swaps) or certain borrowings (e.g., reverse repurchase agreements), the Fund will segregate collateral or designate on its books and records cash or other liquid securities having a value at least equal to the amount that is required to be physically segregated for the benefit of the counterparty. Furthermore, based on requirements and agreements with certain exchanges and third party broker-dealers, each party has requirements to deliver/deposit cash or securities as collateral for certain investments. Cash collateral that has been pledged to cover obligations of the Funds and cash collateral received from the counterparty, if any, is reported separately on the Statements of Assets and Liabilities as “Deposits with brokers” or “Payable due to brokers”, respectively. Securities collateral pledged for the same purpose is noted on the Statements of Investments.
Line of Credit: On May 5, 2017, the Trust entered into a credit agreement (“Credit Agreement”) with State Street Bank and Trust Company (the “Bank”) in which the Funds may borrow through a revolving line of credit. Borrowings under the Credit Agreement are secured by investments held in the Funds. During the year ended May 31, 2020, the Stone Harbor Local Markets Fund, when using the line of credit, borrowed an average amount of $14,644,000 at an average interest rate of 3.10%. The remaining Funds did not borrow under the Credit Agreement. Interest and commitment fees on funded and unfunded loans can be found in the Statements of Operations of the applicable Fund. The Credit Agreement provides for an aggregate commitment amount of $50,000,000 with an annual commitment fee of 0.35% allocated on a pro-rata basis between the Funds based on their net assets, with the exception of the Stone Harbor Emerging Markets Debt Allocation Fund and the Stone Harbor Strategic Income Fund. The Credit Agreement will expire on April 30, 2021. As of year end May 31, 2020 there were no outstanding borrowings under the credit agreement.
Loan Participations and Assignments: The Funds may invest in loans arranged through private negotiation between one or more financial institutions. The Funds’ investment in any such loan may be in the form of a participation in or an assignment of the loan. In connection with purchasing participations, the Funds generally will have no right to enforce compliance by the borrower with the terms of the loan agreement relating to the loan, nor any rights of set-off against the borrower and the Funds may not benefit directly from any collateral supporting the loan in which they have purchased the participation.
| 84 | www.shiplp.com |
| Stone Harbor Investment Funds | Notes to Financial Statements |
May 31, 2020
While some loans are collateralized and senior to an issuer’s other debt securities, other loans may be unsecured and/or subordinated to other securities. Some senior loans, such as bank loans, may be illiquid and generally tend to be less liquid than many other debt securities.
The Funds may also invest in unfunded loan commitments, which are contractual obligations for future funding. Information regarding unfunded commitments is included at the end of the Funds’ Statements of Investments.
The Funds assume the credit risk of the borrower, the lender that is selling the participation and any other persons interpositioned between the Funds and the borrower. In the event of the insolvency of the lender selling the participation, the Funds may be treated as a general creditor of the lender and may not benefit from any set-off between the lender and the borrower. Loans may not be considered “securities”, and purchasers, such as the Funds, therefore may not be entitled to rely on the anti-fraud protections of the federal securities laws.
Inflation-Indexed Bonds: Certain Funds may invest in inflation-indexed bonds. Inflation-indexed bonds are fixed-income securities whose principal value is periodically adjusted to the rate of inflation. The interest rate on these bonds is generally fixed at issuance at a rate lower than typical bonds. Over the life of an inflation-indexed bond, however, interest will be paid based on a principal value which is adjusted for inflation. Any increase or decrease in the principal amount of an inflation-indexed bond will be included as interest income on the Statements of Operations, even though investors do not receive their principal until maturity.
Mortgage-Related and Other Asset-Backed Securities: Certain Funds may invest in mortgage-related and other asset-backed securities. These securities include mortgage pass-through securities, collateralized mortgage obligations, commercial mortgage-backed securities, stripped mortgage-backed securities, asset-backed securities, collateralized debt obligations and other securities that directly or indirectly represent a participation in, or are secured by and payable from, mortgage loans on real property. Mortgage-related and other asset-backed securities are interests in pools of loans or other receivables. Mortgage-related securities are created from pools of residential or commercial mortgage loans, including mortgage loans made by savings and loan institutions, mortgage bankers, commercial banks and others. Asset-backed securities are created from many types of assets, including auto loans, credit card receivables, home equity loans, and student loans. These securities provide a monthly payment which consists of both interest and principal payments. Interest payments may be determined by fixed or adjustable rates. The rate of prepayments on underlying mortgages will affect the price and volatility of a mortgage-related security, and may have the effect of shortening or extending the effective duration of the security relative to what was anticipated at the time of purchase. The timely payment of principal and interest of certain mortgage-related securities is guaranteed with the full faith and credit of the U.S. Government. Pools created and guaranteed by non-governmental issuers, including government sponsored corporations, may be supported by various forms of insurance or guarantees, but there can be no assurance that the private insurers or guarantors can meet their obligations under the insurance policies or guarantee arrangements.
U.S. Government Agencies or Government-Sponsored Enterprises: Certain Funds may invest in securities of U.S. Government agencies or government-sponsored enterprises. U.S. Government securities are obligations of and, in certain cases, guaranteed by, the U.S. Government, its agencies or instrumentalities. Some U.S. Government securities, such as Treasury bills, notes and bonds, and securities guaranteed by the Government National Mortgage Association (“GNMA” or “Ginnie Mae”), are supported by the full faith and credit of the U.S. Government; others, such as those of the Federal Home Loan Banks, are supported by the right of the issuer to borrow from the U.S. Department of the Treasury (the “U.S. Treasury”); others, such as those of the Federal National Mortgage Association (“FNMA” or “Fannie Mae”), are supported by the discretionary authority of the U.S. Government to purchase the agency’s obligations. U.S. Government securities may include zero coupon securities, which do not distribute interest on a current basis and tend to be subject to greater risk than interest-paying securities of similar maturities.
Government-related guarantors (i.e., not backed by the full faith and credit of the U.S. Government) include FNMA and the Federal Home Loan Mortgage Corporation (“FHLMC” or “Freddie Mac”). FNMA is a government-sponsored corporation. FNMA purchases conventional (i.e., not insured or guaranteed by any government agency) residential mortgages from a list of approved seller/servicers which include state and federally chartered savings and loan associations, mutual savings banks, commercial banks and credit unions and mortgage bankers. Pass-through securities issued by FNMA are guaranteed as to timely payment of principal and interest by FNMA, but are not backed by the full faith and credit of the U.S. Government. FHLMC issues Participation Certificates (“PCs”), which are pass-through securities, each representing an undivided interest in a pool of residential mortgages. FHLMC guarantees the timely payment of interest and ultimate collection of principal, but PCs are not backed by the full faith and credit of the U.S. Government.
Forward Commitments: Certain Funds may contract to purchase securities for a fixed price at a transaction date beyond the customary settlement period (i.e., “when-issued,” “delayed-delivery,” “forward commitment,” or “To Be Announced (“TBA”) transactions”) consistent with a Fund’s ability to manage its investment portfolio and meet redemption requests. These transactions involve a commitment by a Fund to purchase securities for a predetermined price or yield with payment and delivery taking place more than three days in the future or after a period longer than the customary settlement period for that type of security. No interest will be earned by a Fund on such purchases until the securities are delivered; however, the market value may change prior to delivery. A Fund will not engage in these transactions for investment leverage.
| Stone Harbor Investment Funds Annual Report | May 31, 2020 | 85 |
| Stone Harbor Investment Funds | Notes to Financial Statements |
May 31, 2020
When-issued securities involve the risk that the yield obtained in the transaction will be less than that available in the market when delivery takes place. Securities purchased on a when-issued basis are recorded as an asset and are subject to changes in value based upon changes in the value of the security or general level of interest rates. In when-issued and delayed-delivery transactions, a Fund relies on the seller to complete the transaction; the seller’s failure to do so may cause a Fund to miss an advantageous price or yield.
The Funds may enter into TBA commitments. TBA commitments are forward agreements for the purchase or sale of mortgage-backed securities for a fixed price, with payment and delivery on an agreed upon future settlement date. The specific securities to be delivered are not identified at the trade date. However, delivered securities must meet specified terms, including issuer, rate and mortgage terms. The Funds generally enter into TBA commitments with the intent to take possession of or deliver the underlying mortgage-backed securities but can extend the settlement or roll the transaction. Regulatory developments may limit the ability of a Fund to engage in TBA transactions to the extent desired.
Unsettled TBA sale (purchase) commitments are valued at the current market value of the underlying securities. The contract is adjusted to market value daily, and the change in market value is recorded by the Fund as an unrealized gain or loss. Outstanding TBA commitments and related deliverables are reflected on the Statement of Assets and Liabilities in Payable for investments purchased and Receivable for investments sold, respectively. If the TBA sale (purchase) commitment is closed through the acquisition of an offsetting purchase (sale) commitment, the Fund realizes a gain or loss from the sale of the securities based upon the unit price established at the date the commitment was entered into. These gain/loss amounts are reflected in the Accumulated net realized gain/loss on investments and Net unrealized appreciation on investments on the Statement of Assets and Liabilities.
Emerging Market Risk: Emerging market countries often experience instability in their political and economic structures. Government actions could have a great effect on the economic conditions in these countries, which can affect the value and liquidity of the assets of a Fund. Specific risks that could decrease a Fund’s return include seizure of a company’s assets, restrictions imposed on payments as a result of blockages on foreign currency exchanges, expropriation, confiscatory taxation and unanticipated social or political occurrences. In addition, the ability of an emerging market government to make timely payments on its debt obligations will depend on the extent of its reserves, interest rate fluctuations and access to international credit and investments. A country with non-diversified exports or that relies on specific imports will be subject to a greater extent to fluctuations in the pricing of those commodities. Failure to generate adequate earnings from foreign trade would make it difficult for an emerging market country to service foreign debt. Disruptions resulting from social and political factors may cause the securities markets of emerging market countries to close. If this were to occur, the liquidity and value of a Fund’s assets invested in corporate debt obligations of emerging market companies would decline. Foreign investment in debt securities of emerging market countries may be restricted or controlled to varying degrees. These restrictions can limit or preclude foreign investment in debt securities of certain emerging market countries. In addition, certain emerging market countries may also restrict investment opportunities in issuers in industries deemed important to national interests.
Interest Rate Risk: Changes in interest rates will affect the value of a Fund’s investments. In general, as interest rates rise, bond prices fall, and as interest rates fall, bond prices rise. Interest rate risk is generally greater for funds that invest a significant portion of their assets in high yield securities. However, funds that generally invest a significant portion of their assets in higher-rated fixed income securities are also subject to this risk. A Fund also faces increased interest rate risk if it invests in fixed income securities paying no current interest (such as zero coupon securities and principal-only securities), interest-only securities and fixed income securities paying non-cash interest in the form of other securities. Many financial instruments use or may use a floating rate based on LIBOR, which is the offered rate for short-term Eurodollar deposits between major international banks. On July 27, 2017, the head of the U.K.'s Financial Conduct Authority announced a desire to phase out the use of LIBOR by the end of 2021. At this time, there remains uncertainty regarding the future utilization of LIBOR and the nature of any replacement rate. The transition process away from LIBOR may lead to increased volatility and illiquidity in markets that currently rely on LIBOR to determine interest rates, and the eventual use of an alternative reference rate may adversely affect the Funds' performance. In addition, the usefulness of LIBOR may deteriorate in the period leading up to its discontinuation, which could adversely affect the liquidity or market value of securities that use LIBOR.
Liquidity Risk: Liquidity risk exists when particular investments are difficult to purchase or sell at the time that a Fund would like or at the price that the Fund believes such investments are currently worth. Certain of the Funds’ investments may be illiquid. Illiquid securities may become harder to value, especially in changing markets. A Fund’s investments in illiquid securities may reduce the returns of the Fund because it may be unable to sell the illiquid securities at an advantageous time or price or possibly require the Fund to dispose of other investments at unfavorable times or prices in order to satisfy its obligations, which could prevent the Fund from taking advantage of other investment opportunities. Additionally, the market for certain investments may become illiquid under adverse market or economic conditions independent of any specific adverse changes in the conditions of a particular issuer. Derivatives, securities that involve substantial interest rate or credit risk and bank loans tend to involve greater liquidity risk. In addition, liquidity risk tends to increase to the extent a Fund invests in securities whose sale may be restricted by law or by contract, such as Rule 144A and Regulation S securities.
Foreign Investment Risk: The securities markets of many foreign countries are relatively small, with a limited number of companies representing a small number of industries. Additionally, issuers of foreign (non-U.S.) securities are usually not subject to the same degree of regulation as U.S. issuers. Reporting, accounting, auditing and custody standards of foreign countries differ, in some cases significantly, from U.S. standards. Global economies and financial markets are becoming increasingly interconnected, and conditions and events in one country, region or financial market may adversely impact issuers in a different country, region or financial market. Also, nationalization, expropriation or confiscatory taxation, currency blockage, political changes or diplomatic developments could adversely affect a Fund’s investments in a foreign country. In the event of nationalization, expropriation or other confiscation, a Fund could lose its entire investment in foreign (non-U.S.) securities. Adverse conditions in a certain region can adversely affect securities of other countries whose economies appear to be unrelated. Foreign (non-U.S.) securities may also be less liquid and more difficult to value than securities of U.S. issuers.
| 86 | www.shiplp.com |
| Stone Harbor Investment Funds | Notes to Financial Statements |
May 31, 2020
Credit and Market Risk: The Funds invest in high yield and emerging market instruments that are subject to certain credit and market risks. The yields of high yield and emerging market debt obligations reflect, among other things, perceived credit and market risks. The Funds’ investment in securities rated below investment grade typically involves risks not associated with higher rated securities including, among others, greater risk related to timely and ultimate payment of interest and principal, greater market price volatility and less liquid secondary market trading. The consequences of political, social, economic or diplomatic changes may have disruptive effects on the market prices of investments held by the Funds. The Funds’ investment in non-U.S. dollar denominated securities may also result in foreign currency losses caused by devaluations and exchange rate fluctuations. Investments in derivatives are also subject to credit and market risks.
Distributions to Shareholders: Dividends and distributions to shareholders, which are determined in accordance with income tax regulations, are recorded on the ex-date. Income distributions, if any are generally declared and paid on a quarterly basis, except for any distributions paid by the Local Markets Fund and the Emerging Markets Debt Allocation Fund, which are declared and paid annually. Capital gain distributions, if any, are declared and paid at least annually. A portion of the Fund’s distributions made for a taxable year may be recharacterized as a return of capital to shareholders. This may occur, for example, if the Fund’s distributions exceed its “earnings and profits” for the taxable year or because certain foreign currency losses may reduce the Fund’s income. This recharacterization may be retroactive. A return of capital will generally not be taxable, but will reduce a shareholder’s basis in his or her Fund shares and therefore result in a higher gain or lower loss when the shareholder sells the shares.
Expenses: Direct expenses are charged to each Fund; expenses of the Trust are generally allocated to the Funds based on each Fund’s relative net assets.
Federal and Other Taxes: No provision for income taxes is included in the accompanying financial statements, as the Funds intend to distribute to shareholders all taxable investment income and realized gains and otherwise comply with Subchapter M of the Internal Revenue Code of 1986, as amended, applicable to regulated investment companies.
The Funds evaluate tax positions taken (or expected to be taken) in the course of preparing the Funds’ tax provisions to determine whether these positions meet a “more-likely-than-not” standard that, based on the technical merits, have a more than fifty percent likelihood of being sustained by a taxing authority upon examination. A tax position that meets the “more-likely-than-not” recognition threshold is measured to determine the amount of benefit to recognize in the financial statements.
As of and during the year ended May 31, 2020, the Funds did not have a liability for any unrecognized tax benefits. The Funds file U.S. federal, state, and local tax returns as required. The Funds’ tax returns are subject to examination by the relevant tax authorities until expiration of the applicable statute of limitations which is generally three years after the filing of the tax return for federal purposes and four years for most state returns. Tax returns for open years have incorporated no uncertain tax positions that require a provision for income taxes.
3. DERIVATIVE INSTRUMENTS
Risk Exposure and the Use of Derivative Instruments: The Funds’ investment objectives allow the Funds to enter in various types of derivatives contracts. In doing so, the Funds employ strategies in differing combinations to permit them to increase, decrease, or change the level or types of exposure to market factors. Central to those strategies are features inherent to derivatives that may make them more attractive for this purpose than equity or debt securities; they require little or no initial cash investment, they can focus exposure on only certain selected risk factors, and they may not require the ultimate receipt or delivery of the underlying security (or securities) to the contract. This may allow the Funds to pursue their objectives more quickly and efficiently than if they were to make direct purchases or sales of securities capable of affecting a similar response to market factors.
| Stone Harbor Investment Funds Annual Report | May 31, 2020 | 87 |
| Stone Harbor Investment Funds | Notes to Financial Statements |
May 31, 2020
The Funds’ use of derivatives can result in losses due to unanticipated changes in the risk factors described in Note 2 and the overall market. In instances where the Funds are using derivatives to decrease, or hedge, exposures to market risk factors for securities held by the Funds, there are also risks that those derivatives may not perform as expected resulting in losses for the combined or hedged positions.
Derivatives may have little or no initial cash investment relative to their market value exposure and therefore can produce significant gains or losses in excess of their cost. This use of embedded leverage allows each Fund to increase its market value exposure relative to its net assets and can substantially increase the volatility of the Funds’ performance.
Additional associated risks from investing in derivatives also exist and potentially could have significant effects on the valuation of the derivative and the Funds. Typically, the associated risks are not the risks that the Funds are attempting to increase or decrease exposure to, per their investment objectives, but are the additional risks from investing in derivatives.
Examples of these associated risks are liquidity risk, which is the risk that the Funds will not be able to sell or close out the derivative in a timely manner, and counterparty credit risk, which is the risk that the counterparty will not fulfill its obligation to the Funds. Associated risks can be different for each type of derivative and are discussed by each derivative type below in the notes that follow.
Derivatives are also subject to the risk of possible regulatory changes, which could adversely affect the availability and performance of derivative securities, make them more costly and limit or restrict their use by the Fund, which could prevent the Fund from implementing its investment strategies and adversely affect returns. The SEC has issued a proposed rule under the 1940 Act providing for the regulation of registered investment companies' use of derivatives and certain related instruments. The ultimate impact, if any, of possible regulation remains unclear, but the proposed rule, if adopted, could, among other things, restrict the Funds' ability to engage in derivatives transactions and/or increase the costs of such derivatives transactions such that the Funds may be unable to implement their investment strategy.
Forward Foreign Currency Contracts: Certain Funds engaged in currency transactions with counterparties during the year ended May 31, 2020 to hedge the value of portfolio securities denominated in particular currencies against fluctuations in relative value, to gain or reduce exposure to certain currencies, or to generate income or gains. A forward foreign currency contract is an agreement between two parties to buy and sell a currency at a set price on a future date. The contract is marked-to-market daily and the change in value is recorded by the Funds as an unrealized gain or loss. When a forward foreign currency contract is extinguished, through delivery, the Funds record a realized gain or loss equal to the difference between the value of the contract at the time it was opened and the value of the contract at the time it was extinguished.
Forward foreign currency contracts involve elements of market risk in excess of the amounts reflected in the Statements of Assets and Liabilities. The Funds bear the risk of an unfavorable change in the foreign exchange rate underlying the forward foreign currency contract. Risks may also arise upon entering into these contracts from the potential inability of the counterparties to meet the terms of their contracts.
Futures Contracts: Certain Funds invested in futures contracts during the year ended May 31, 2020 in accordance with their investment objectives. Each Fund does so for a variety of reasons including for cash management, hedging or non-hedging purposes in an attempt to achieve investment returns consistent with the Fund’s investment objective. A futures contract provides for the future sale by one party and purchase by another party of a specified quantity of the security or other financial instrument at a specified price and time. A futures contract on an index is an agreement pursuant to which two parties agree to take or make delivery of an amount of cash equal to the difference between the value of the index at the close of the last trading day of the contract and the price at which the index contract was originally written. Futures contract transactions may result in losses in excess of the amount invested in the futures contract. There can be no guarantee that there will be a correlation between price movements in the hedging vehicle and in the portfolio securities being hedged. An incorrect correlation could result in a loss on both the hedged securities in a Fund and the hedging vehicle so that the portfolio return might have been greater had hedging not been attempted. There can be no assurance that a liquid market will exist at a time when a Fund seeks to close out a futures contract or a futures option position. Lack of a liquid market for any reason may prevent a Fund from liquidating an unfavorable position, and the Fund would remain obligated to meet margin requirements until the position is closed. In addition, a Fund could be exposed to risk if the counterparties to the contracts are unable to meet the terms of their contracts. With exchange-traded futures contracts, there is minimal counterparty credit risk to the Funds since futures contracts are exchange-traded and the exchange’s clearinghouse, as counterparty to all exchange-traded futures contracts, guarantees the futures contracts against default.
When a purchase or sale of a futures contract is made by a Fund, the Fund is required to deposit with its broker a specified amount of liquid assets (“initial margin”). The margin required for a futures contract is set by the exchange on which the contract is traded and may be modified during the term of the contract. The margin is reported on the Statement of Assets and Liabilities as “Deposit with brokers for futures contracts”. The initial margin is in the nature of a performance bond or good faith deposit on the futures contract that is returned to a Fund upon termination of the contract, assuming all contractual obligations have been satisfied. Each day a Fund may pay or receive cash, called “variation margin,” equal to the daily change in value of the futures contract. Such payments or receipts are recorded for financial statement purposes as unrealized gains or losses by a Fund. Variation margin does not represent a borrowing or loan by a Fund but is instead a settlement between a Fund and the broker of the amount one would owe the other if the futures contract expired. When the contract is closed, a Fund records a realized gain or loss equal to the difference between the value of the contract at the time it was opened and the value at the time it was closed.
| 88 | www.shiplp.com |
| Stone Harbor Investment Funds | Notes to Financial Statements |
May 31, 2020
Swap Agreements: Certain Funds invested in swap agreements during the year ended May 31, 2020. Swap agreements are bilaterally negotiated agreements between a Fund and a counterparty to exchange or swap investment cash flows, assets, or market-linked returns at specified, future intervals. Swap agreements are privately negotiated in the OTC market (“OTC swaps”) or may be executed in a multilateral or other trade facility platform, such as a registered exchange (“centrally cleared swaps”). In a centrally cleared swap, immediately following execution of the swap agreement, the swap agreement is novated to a central counterparty (the “CCP”) and the Fund’s counterparty on the swap agreement becomes the CCP. The Fund may enter into credit default swaps, interest rate swaps, total return swaps on individual securities or groups or indices of securities for hedging, investment or leverage purposes. In connection with these agreements, securities or cash may be identified as collateral or margin in accordance with the terms of the respective swap agreements to provide assets of value and recourse in the event of default or bankruptcy/insolvency.
Swaps are marked-to-market daily and changes in value, including the accrual of periodic amounts of interest, are recorded daily. Daily changes in valuation of centrally cleared swaps, if any, are recorded as a receivable or payable for the change in value as appropriate (“variation margin”) and also reflected in the change in unrealized appreciation/(depreciation) on credit default swap contracts in the Statements of Operations. Each day the Fund may pay or receive cash, equal to the variation margin of the centrally cleared swap. Changes in value for OTC swaps are reflected in the unrealized appreciation/(depreciation) of the position until a periodic payment is made by either party.
Swap payments received or paid at the beginning of the measurement period represent premiums paid or received upon entering into the swap agreement to compensate for differences between the stated terms of the swap agreement and prevailing market conditions (credit spreads, interest rates, and other relevant factors). Generally, the basis of the swap is the unamortized premium received or paid. Periodic payments received or made by the Fund are recorded as realized gains or losses, respectively. Any upfront fees paid are recorded as assets and any upfront fees received are recorded as liabilities. For centrally cleared swaps, these amounts are included in the deposits with brokers for swap contracts while OTC swaps are displayed as a swap premium paid/received. When the swap is terminated, the Fund will record a realized gain or loss equal to the difference between the proceeds from (or cost of) the closing transaction and the Fund’s basis in the contract, if any.
Credit Default Swap Contracts: Certain Funds entered into credit default swap contracts during the year ended May 31, 2020 for hedging purposes to gain market exposure or to add leverage to its portfolio. When used for hedging purposes, a Fund is the buyer of a credit default swap contract. In that case, the Fund is entitled to receive the par (or other agreed upon) value of a referenced debt obligation, index or other investment from the counterparty to the contract in the event of a default by a third party, such as a U.S. or foreign issuer, on the referenced debt obligation. In return, the Fund would pay to the counterparty a periodic stream of payments over the term of the contract provided that no event of default has occurred. If no event of default occurs, the Fund has spent the stream of payments and received no benefit from the contract. When the Fund is the seller of a credit default swap contract, the Fund receives the stream of payments but is obligated to pay upon default of the referenced debt obligation. As the seller, the Fund effectively adds leverage to its portfolio because, in addition to its total assets, the Fund is subject to investment exposure on the notional amount of the swap.
In addition to the risks applicable to derivatives generally, credit default swaps involve special risks because they may be difficult to value, are highly susceptible to liquidity and credit risk and generally pay a return to the counterparty only in the event of an actual default by the issuer of the underlying obligation, as opposed to a credit downgrade or other indication of financial difficulty.
Interest Rate Swap Contracts: Certain Funds entered into interest rate swap agreements during the year ended May 31, 2020. Interest rate swap contracts involve the exchange by a Fund with another party for their respective commitment to pay or receive interest on the notional amount of principal. Certain forms of interest rate swap agreements may include: (i) interest rate caps, under which, in return for a premium, one party agrees to make payments to the other to the extent that interest rates exceed a specified rate, or “cap”, (ii) interest rate floors, under which, in return for a premium, one party agrees to make payments to the other to the extent that interest rates fall below a specified rate, or “floor”, (iii) interest rate collars, under which a party sells a cap and purchases a floor or vice versa in an attempt to protect itself against interest rate movements exceeding given minimum or maximum levels, (iv) callable interest rate swaps, under which the buyer pays an upfront fee in consideration for the right to early terminate the swap transaction in whole, at zero costs and at a predetermined date and time prior to the maturity date, (v) spreadlocks, which allow the interest rate swap users to lock in the forward differential (or spread) between the interest rate swap rate and a specified benchmark, or (vi) basis swaps, under which two parties can exchange variable interest rates based on different segments of money markets.
Purchased Options: When the Fund purchases an option, an amount equal to the premium paid by the Fund is recorded as an investment and is subsequently adjusted to the current value of the option purchased. If an option expires on the stipulated expiration date or if the Funds enter into a closing sale transaction, a gain or loss is realized. If a call option is exercised, the cost of the security acquired is increased by the premium paid for the call. If a put option is exercised, a gain or loss is realized from the sale of the underlying security, and the proceeds from such sale are decreased by the premium originally paid. Purchased options are non-income producing securities.
| Stone Harbor Investment Funds Annual Report | May 31, 2020 | 89 |
| Stone Harbor Investment Funds | Notes to Financial Statements |
May 31, 2020
The tables below are a summary of the fair valuations of derivative instruments categorized by risk exposure.
Fair values of purchased options, forward foreign currency contracts, credit default swaps, and futures contracts on the Statements of Assets and Liabilities as of May 31, 2020:
| Risk Exposure | Location | Fair Value | Location | Fair Value | ||||||||
| Stone Harbor Emerging Markets Debt Fund | ||||||||||||
| Currency Risk (Purchased Options) | Investments, at value | $ | 70,077 | N/A | N/A | |||||||
| Foreign Exchange Rate Risk (Forward Foreign Currency Contracts) | Unrealized appreciation on forward foreign currency contracts | 232,865 | Unrealized depreciation on forward foreign currency contracts | $ | (3,230,076 | ) | ||||||
| Total | $ | 302,942 | $ | (3,230,076 | ) | |||||||
| Stone Harbor Local Markets Fund | ||||||||||||
| Foreign Exchange Rate Risk (Forward Foreign Currency Contracts) | Unrealized appreciation on forward foreign currency contracts | 1,739,263 | Unrealized depreciation on forward foreign currency contracts | (1,904,882 | ) | |||||||
| Total | $ | 1,739,263 | $ | (1,904,882 | ) | |||||||
| Stone Harbor Strategic Income Fund | ||||||||||||
| Credit Risk (Swap Contracts)* | Unrealized appreciation on credit default swap contracts | – | Unrealized depreciation on credit default swap contracts | (73,098 | ) | |||||||
| Interest Rate Risk (Futures Contracts)** | Unrealized appreciation on futures contracts | 9,528 | Unrealized depreciation on futures contracts | (35,313 | ) | |||||||
| Foreign Exchange Rate Risk (Forward Foreign Currency Contracts) | Unrealized appreciation on forward foreign currency contracts | 11,750 | Unrealized depreciation on forward foreign currency contracts | (11,902 | ) | |||||||
| Total | $ | 21,278 | $ | (120,313 | ) | |||||||
| Stone Harbor Emerging Markets Debt Allocation Fund | ||||||||||||
| Foreign Exchange Rate Risk (Forward Foreign Currency Contracts) | Unrealized appreciation on forward foreign currency contracts | 17,872 | Unrealized depreciation on forward foreign currency contracts | (3,125 | ) | |||||||
| Total | $ | 17,872 | $ | (3,125 | ) | |||||||
| * | The value presented includes unrealized appreciation/(depreciation) on over the counter swap contracts and the cumulative gain/(loss) on centrally cleared swap contracts. For centrally cleared swap contracts, the value reflected on the accompanying Statement of Assets and Liabilities is only the unsettled variation margin receivable/(payable) as of May 31, 2020. |
| ** | The value presented includes cumulative gain/(loss) on open futures contracts and swap contracts; however, the value reflected on the accompanying Statement of Assets and Liabilities is the unsettled variation margin receivable/(payable) and/or unrealized appreciation/(depreciation) as of May 31, 2020. |
The purchased options, forward foreign currency contracts, credit default swap contracts, interest rate swap contracts, and futures contracts average volume during the year ended May 31, 2020 is noted below:
| Fund | Purchased Options* | Forward Foreign Currency Contracts Bought** | Forward Foreign Currency Contracts Sold** | Credit Default Swap Contracts*** | Interest Rate Swap Contracts*** | Futures Contracts*** | ||||||||||||||||||
| Stone Harbor Emerging Markets Debt Fund | $ | 223,269 | $ | (128,014,953 | ) | $ | 17,516,668 | $ | 10,240,250 | $ | – | $ | – | |||||||||||
| Stone Harbor Local Markets Fund | – | (68,776,749 | ) | 82,384,602 | 647,833 | 28,232,000 | – | |||||||||||||||||
| Stone Harbor Strategic Income Fund | – | (1,613,103 | ) | 1,486,335 | 5,615,688 | – | (13,452,323 | ) | ||||||||||||||||
| Stone Harbor Emerging Markets Debt Allocation Fund | – | (40,595 | ) | 75,582 | – | – | – | |||||||||||||||||
| * | Represents the average market value |
| ** | Represents the average foreign currency amount translated into U.S. dollars (bought) or sold. |
| *** | Represents the average notional value. |
| 90 | www.shiplp.com |
| Stone Harbor Investment Funds | Notes to Financial Statements |
May 31, 2020
The effect of purchased options, forward foreign currency contracts, credit default swaps, Interest rate swaps, and futures contracts on the Statements of Operations for the year ended May 31, 2020:
| Risk Exposure | Location | Realized Gain/(Loss) on Derivatives | Location | Change in Unrealized Appreciation/(Depreciation) on Derivatives Recognized in Income | ||||||||
| Stone Harbor Emerging Markets Debt Fund | ||||||||||||
| Currency Risk (Purchased Options) | Net realized gain/loss on investments | $ | – | Change in unrealized appreciation/depreciation on investments | $ | (828,227 | ) | |||||
| Credit Risk (Swap Contracts) | Net realized gain/(loss) on credit default swap contracts | (6,968,541 | ) | Change in unrealized appreciation/(depreciation) on credit default swap contracts | 2,020,857 | |||||||
| Foreign Exchange Rate Risk (Forward Foreign Currency Contracts) | Net realized gain/(loss) on forward foreign currency contracts | 6,537,196 | Change in unrealized appreciation/(depreciation) on forward foreign currency contracts | (3,606,079 | ) | |||||||
| Total | $ | (431,345 | ) | $ | (2,413,449 | ) | ||||||
| Stone Harbor Local Markets Fund | ||||||||||||
| Credit Risk (Swap Contracts) | Net realized gain/(loss) on credit default swap contracts | (297,808 | ) | Change in unrealized appreciation/(depreciation) on credit default swap contracts | (61,998 | ) | ||||||
| Interest Rate Risk (Swap Contracts) | Net realized gain/(loss) on interest rate swap contracts | 132,644 | Change in unrealized appreciation/(depreciation) on interest rate swap contracts | (35,413 | ) | |||||||
| Foreign Exchange Rate Risk (Forward Foreign Currency Contracts) | Net realized gain/(loss) on forward foreign currency contracts | (2,011,162 | ) | Change in unrealized appreciation/(depreciation) on forward foreign currency contracts | (1,068,928 | ) | ||||||
| Total | $ | (2,176,326 | ) | $ | (1,166,339 | ) | ||||||
| Stone Harbor Strategic Income Fund | ||||||||||||
| Credit Risk (Swap Contracts) | Net realized gain/(loss) on credit default swap contracts | 209,210 | Change in unrealized appreciation/(depreciation) on credit default swap contracts | (162,482 | ) | |||||||
| Interest Rate Risk (Futures Contracts) | Net realized gain/(loss) on futures contracts | (1,289,647 | ) | Change in unrealized appreciation/(depreciation) on futures contracts | 104,930 | |||||||
| Foreign Exchange Rate Risk (Forward Foreign Currency Contracts) | Net realized gain/(loss) on forward foreign currency contracts | (47,789 | ) | Change in unrealized appreciation/(depreciation) on forward foreign currency contracts | (3,703 | ) | ||||||
| Total | $ | (1,128,226 | ) | $ | (61,255 | ) | ||||||
| Stone Harbor Emerging Markets Debt Allocation Fund | ||||||||||||
| Foreign Exchange Rate Risk (Forward Foreign Currency Contracts) | Net realized gain/(loss) on forward foreign currency contracts | 318 | Change in unrealized appreciation/(depreciation) on forward foreign currency contracts | 14,747 | ||||||||
| Total | $ | 318 | $ | 14,747 | ||||||||
Offsetting Arrangements: Certain derivative contracts are executed under standardized netting agreements. A derivative netting arrangement creates an enforceable right of set-off that becomes effective, and affects the realization of settlement on individual assets, liabilities and collateral amounts, only following a specified event of default or early termination. Default events may include the failure to make payments or deliver securities timely, material adverse changes in financial condition or insolvency, the breach of minimum regulatory capital requirements, or loss of license, charter or other legal authorization necessary to perform under the contract. These agreements mitigate counterparty credit risk by providing for a single net settlement with a counterparty of all financial transactions covered by the agreement in an event of default as defined under such agreement.
| Stone Harbor Investment Funds Annual Report | May 31, 2020 | 91 |
| Stone Harbor Investment Funds | Notes to Financial Statements |
| May 31, 2020 |
The following table presents derivative financial instruments that are subject to enforceable netting arrangements, collateral arrangements or other similar agreements as of May 31, 2020.
| Offsetting of Derivatives Assets | ||||||||||||||||||||||||
| May 31, 2020 | ||||||||||||||||||||||||
| Gross Amounts Not Offset in the Statements of Assets and Liabilities | ||||||||||||||||||||||||
| Gross Amounts of Recognized Assets | Gross Amounts Offset in the Statements of Assets and Liabilities | Net Amounts Presented in the Statements of Assets and Liabilities | Financial Instruments Available for Offset(a) | Cash Collateral Received(a) | Net Amount Receivable | |||||||||||||||||||
| Stone Harbor Emerging Markets Debt Fund | ||||||||||||||||||||||||
| Forward foreign currency contracts | $ | 232,865 | $ | – | $ | 232,865 | $ | (232,865 | ) | $ | – | $ | – | |||||||||||
| Purchased options | 70,077 | – | 70,077 | – | – | 70,077 | ||||||||||||||||||
| Total | $ | 302,942 | $ | – | $ | 302,942 | $ | (232,865 | ) | $ | – | $ | 70,077 | |||||||||||
| Stone Harbor Local Markets Fund | ||||||||||||||||||||||||
| Forward foreign currency contracts | $ | 1,739,263 | $ | – | $ | 1,739,263 | $ | (1,517,744 | ) | $ | – | $ | 221,519 | |||||||||||
| Total | $ | 1,739,263 | $ | – | $ | 1,739,263 | $ | (1,517,744 | ) | $ | – | $ | 221,519 | |||||||||||
| Stone Harbor Strategic Income Fund | ||||||||||||||||||||||||
| Forward foreign currency contracts | $ | 11,750 | $ | – | $ | 11,750 | $ | (1,461 | ) | $ | – | $ | 10,289 | |||||||||||
| Total | $ | 11,750 | $ | – | $ | 11,750 | $ | (1,461 | ) | $ | – | $ | 10,289 | |||||||||||
| Stone Harbor Emerging Markets Debt Allocation Fund | ||||||||||||||||||||||||
| Forward foreign currency contracts | $ | 17,872 | $ | – | $ | 17,872 | $ | (3,125 | ) | $ | – | $ | 14,747 | |||||||||||
| Total | $ | 17,872 | $ | – | $ | 17,872 | $ | (3,125 | ) | $ | – | $ | 14,747 | |||||||||||
| Offsetting of Derivatives Liabilities | ||||||||||||||||||||||||
| Gross Amounts Not Offset in the Statements of Assets and Liabilities | ||||||||||||||||||||||||
| Gross Amounts of Recognized Liabilities | Gross Amounts Offset in the Statements of Assets and Liabilities | Net Amounts Presented in the Statements of Assets and Liabilities | Financial Instruments Available for Offset(a) | Cash Collateral Pledged(a) | Net Amount Payable | |||||||||||||||||||
| Stone Harbor Emerging Markets Debt Fund | ||||||||||||||||||||||||
| Forward foreign currency contracts | $ | 3,230,076 | $ | – | $ | 3,230,076 | $ | (232,865 | ) | $ | (2,596,530 | ) | $ | 400,681 | ||||||||||
| Total | $ | 3,230,076 | $ | – | $ | 3,230,076 | $ | (232,865 | ) | $ | (2,596,530 | ) | $ | 400,681 | ||||||||||
| Stone Harbor Local Markets Fund | ||||||||||||||||||||||||
| Forward foreign currency contracts | $ | 1,904,882 | $ | – | $ | 1,904,882 | $ | (1,517,744 | ) | $ | (387,138 | ) | $ | – | ||||||||||
| Total | $ | 1,904,882 | $ | – | $ | 1,904,882 | $ | (1,517,744 | ) | $ | (387,138 | ) | $ | – | ||||||||||
| Stone Harbor Strategic Income Fund | ||||||||||||||||||||||||
| Forward foreign currency contracts | $ | 11,902 | $ | – | $ | 11,902 | $ | (1,461 | ) | $ | – | $ | 10,441 | |||||||||||
| Total | $ | 11,902 | $ | – | $ | 11,902 | $ | (1,461 | ) | $ | – | $ | 10,441 | |||||||||||
| Stone Harbor Emerging Markets Debt Allocation Fund | ||||||||||||||||||||||||
| Forward foreign currency contracts | $ | 3,125 | $ | – | $ | 3,125 | $ | (3,125 | ) | $ | – | $ | – | |||||||||||
| Total | $ | 3,125 | $ | – | $ | 3,125 | $ | (3,125 | ) | $ | – | $ | – | |||||||||||
| (a) | These amounts are limited to the derivatives asset/liability balance and, accordingly, do not include excess collateral received/pledged. |
| 92 | www.shiplp.com |
| Stone Harbor Investment Funds | Notes to Financial Statements |
| May 31, 2020 |
4. TAX BASIS INFORMATION
Tax Basis of Distributions to Shareholders: Net investment income/ (loss) and net realized gain/ (loss) may differ for financial statement and tax purposes. The character of distributions made during the year from net investment income or net realized gains may differ from its ultimate characterization for federal income tax purposes. Also, due to the timing of dividend distributions, the fiscal year in which amounts are distributed may differ from the fiscal year in which the income or realized gain was recorded by a Fund.
The tax character of the distributions paid by the Funds during the periods ended May 31, here as follow:
| Stone Harbor Emerging Markets Debt Fund | 2020 | 2019 | ||||||
| Ordinary Income | $ | 63,423,170 | $ | 74,824,068 | ||||
| Total | $ | 63,423,170 | $ | 74,824,068 | ||||
| Stone Harbor High Yield Bond Fund | 2020 | 2019 | ||||||
| Ordinary Income | $ | 4,235,833 | $ | 5,017,676 | ||||
| Total | $ | 4,235,833 | $ | 5,017,676 | ||||
| Stone Harbor Local Markets Fund | 2020 | 2019 | ||||||
| Ordinary Income | $ | 470,992 | $ | 13,888,739 | ||||
| Total | $ | 470,992 | $ | 13,888,739 | ||||
| Stone Harbor Emerging Markets Corporate Debt Fund | 2020 | 2019 | ||||||
| Ordinary Income | $ | 776,478 | $ | 701,876 | ||||
| Total | $ | 776,478 | $ | 701,876 | ||||
| Stone Harbor Investment Grade Fund | 2020 | 2019 | ||||||
| Ordinary Income | $ | 291,808 | $ | 216,889 | ||||
| Total | $ | 291,808 | $ | 216,889 | ||||
| Stone Harbor Strategic Income Fund | 2020 | 2019 | ||||||
| Ordinary Income | $ | 983,732 | $ | 1,302,137 | ||||
| Total | $ | 983,732 | $ | 1,302,137 | ||||
| Stone Harbor Emerging Markets Debt Allocation Fund | 2020 | 2019 | ||||||
| Ordinary Income | $ | 764,332 | $ | 1,009,955 | ||||
| Total | $ | 764,332 | $ | 1,009,955 | ||||
| Stone Harbor Investment Funds Annual Report | May 31, 2020 | 93 |
| Stone Harbor Investment Funds | Notes to Financial Statements |
| May 31, 2020 |
As of May 31, 2020, the components of distributable earnings on a tax basis were as follows:
| Stone Harbor Emerging Markets Debt Fund | ||||
| Undistributed Ordinary Income | $ | 5,568,818 | ||
| Accumulated Capital Loss | (215,298,421 | ) | ||
| Unrealized Depreciation | (96,358,691 | ) | ||
| Cumulative Effect of Other Timing Difference* | (8,466,251 | ) | ||
| Total | $ | (314,554,545 | ) | |
| Stone Harbor High Yield Bond Fund | ||||
| Undistributed Ordinary Income | $ | 36,914 | ||
| Accumulated Capital Loss | (26,037,003 | ) | ||
| Unrealized Depreciation | (1,666,023 | ) | ||
| Total | $ | (27,666,112 | ) | |
| Stone Harbor Local Markets Fund | ||||
| Accumulated Capital Loss | (184,274,274 | ) | ||
| Unrealized Depreciation | (34,075,335 | ) | ||
| Cumulative Effect of Other Timing Difference* | (25,569,812 | ) | ||
| Total | $ | (243,919,421 | ) | |
| Stone Harbor Emerging Markets Corporate Debt Fund | ||||
| Undistributed Ordinary Income | $ | 20,220 | ||
| Accumulated Capital Loss | (4,340,418 | ) | ||
| Unrealized Depreciation | (509,935 | ) | ||
| Total | $ | (4,830,133 | ) | |
| Stone Harbor Investment Grade Fund | ||||
| Undistributed Ordinary Income | $ | 133,697 | ||
| Accumulated Capital Gain | 95,547 | |||
| Unrealized Appreciation | 360,593 | |||
| Total | $ | 589,837 | ||
| Stone Harbor Strategic Income Fund | ||||
| Accumulated Capital Loss | (1,643,808 | ) | ||
| Unrealized Depreciation | (1,905,639 | ) | ||
| Cumulative Effect of Other Timing Difference* | (30,237 | ) | ||
| Total | $ | (3,579,684 | ) | |
| Stone Harbor Emerging Markets Debt Allocation Fund | ||||
| Undistributed Ordinary Income | $ | 429,161 | ||
| Accumulated Capital Loss | (8,320,470 | ) | ||
| Unrealized Appreciation | 738,199 | |||
| Cumulative Effect of Other Timing Difference* | (14,746 | ) | ||
| Total | $ | (7,167,856 | ) | |
| * | Other temporary differences due to timing. |
The tax components of distributable earnings are determined with income tax regulations which may differ from the composition of net assets reported under GAAP. Accordingly, for the year ended May 31, 2020, certain differences were reclassified. These amounts were primarily attributed to the expiration of Net Operating Losses and to book to tax distribution differences.
| 94 | www.shiplp.com |
| Stone Harbor Investment Funds | Notes to Financial Statements |
| May 31, 2020 |
The reclassifications were as follows:
| Fund | Paid-in Capital | Distributable Earnings | ||||||
| Stone Harbor Emerging Markets Debt Fund | $ | (1 | ) | $ | 1 | |||
| Stone Harbor High Yield Bond Fund | – | – | ||||||
| Stone Harbor Local Markets Fund | (65,887,922 | ) | 65,887,922 | |||||
| Stone Harbor Emerging Markets Corporate Debt Fund | – | – | ||||||
| Stone Harbor Investment Grade Fund | – | – | ||||||
| Stone Harbor Strategic Income Fund | – | – | ||||||
| Stone Harbor Emerging Markets Debt Allocation Fund | – | – | ||||||
Capital Losses: As of May 31, 2020, the following Funds had capital loss carryforwards which may reduce the Funds’ taxable income arising from future net realized gains on investments, if any, to the extent permitted by the Code and thus may reduce the amount of the distributions to shareholders which would otherwise be necessary to relieve the Funds of any liability for federal tax pursuant to the Code.
Capital loss carryovers used during the year ended May 31, 2020 were:
| Fund | Amount | |||
| Stone Harbor High Yield Bond Fund | $ | 42,347 | ||
| Stone Harbor Emerging Markets Corporate Debt Fund | 422,520 | |||
Under current law, capital losses maintain their character as short-term or long-term and are carried forward to the next tax year without expiration. As of the current fiscal year end, the following amounts are available as carry forwards to the next tax year:
| Fund | Short-Term | Long-Term | ||||||
| Stone Harbor Emerging Markets Debt Fund | $ | 86,145,065 | $ | 112,875,204 | ||||
| Stone Harbor High Yield Bond Fund | 863,500 | 22,750,802 | ||||||
| Stone Harbor Local Markets Fund | 111,913,227 | 70,798,340 | ||||||
| Stone Harbor Emerging Markets Corporate Debt Fund | 1,720,879 | 2,619,539 | ||||||
| Stone Harbor Strategic Income Fund | 210,565 | 600,469 | ||||||
| Stone Harbor Emerging Markets Debt Allocation Fund | 919,549 | 7,134,713 | ||||||
Capital Losses arising in the post-October period of the current fiscal year may be deferred to the next fiscal year if the fund elects to defer the recognition of these losses. When this election is made, any losses recognized during the period are treated as having occurred on the first day of the next fiscal year separate from and in addition to the application of normal capital loss carry forwards as described above.
The following Funds elect to defer to the year ending May 31, 2021 the following capital losses recognized during the period November 1, 2019 through May 31, 2020:
| Fund | Amount | |||
| Stone Harbor Emerging Markets Debt Fund | $ | 16,278,152 | ||
| Stone Harbor High Yield Bond Fund | 2,422,701 | |||
| Stone Harbor Local Markets Fund | 1,562,707 | |||
| Stone Harbor Strategic Income Fund | 832,774 | |||
| Stone Harbor Emerging Markets Debt Allocation Fund | 266,208 | |||
Certain ordinary losses that arise in the post December period of the current fiscal year may be deferred to the next fiscal year if the fund elects to defer the recognition of those losses. When this election is made, any losses recognized during the period are treated as having occurred on the first day of the next fiscal year.
The following Funds elect to defer to the period ending May 31, 2021, late year ordinary losses in the amount of:
| Fund | Amount | |||
| Stone Harbor Local Markets Fund | $ | 25,569,812 | ||
| Stone Harbor Strategic Income Fund | 30,237 | |||
| Stone Harbor Investment Funds Annual Report | May 31, 2020 | 95 |
| Stone Harbor Investment Funds | Notes to Financial Statements |
| May 31, 2020 |
Unrealized Appreciation and Depreciation on Investments: At May 31, 2020, the aggregate gross unrealized appreciation and depreciation of investments for federal income tax purposes were as follows:
| Stone Harbor Emerging Markets Debt Fund | ||||
| Gross appreciation on investments (excess of value over tax cost) | $ | 51,255,127 | ||
| Gross depreciation on investments (excess of tax cost over value) | (147,659,937 | ) | ||
| Net appreciation of foreign currency | 46,119 | |||
| Net unrealized depreciation | $ | (96,358,691 | ) | |
| Cost of investments for income tax purposes | $ | 1,181,091,500 | ||
| Stone Harbor High Yield Bond Fund | ||||
| Gross appreciation on investments (excess of value over tax cost) | $ | 2,336,921 | ||
| Gross depreciation on investments (excess of tax cost over value) | (4,002,944 | ) | ||
| Net unrealized depreciation | $ | (1,666,023 | ) | |
| Cost of investments for income tax purposes | $ | 66,472,300 | ||
| Stone Harbor Local Markets Fund | ||||
| Gross appreciation on investments (excess of value over tax cost) | $ | 2,665,149 | ||
| Gross depreciation on investments (excess of tax cost over value) | (36,369,560 | ) | ||
| Net depreciation of foreign currency | (370,924 | ) | ||
| Net unrealized depreciation | $ | (34,075,335 | ) | |
| Cost of investments for income tax purposes | $ | 334,910,129 | ||
| Stone Harbor Emerging Markets Corporate Debt Fund | ||||
| Gross appreciation on investments (excess of value over tax cost) | $ | 124,618 | ||
| Gross depreciation on investments (excess of tax cost over value) | (634,553 | ) | ||
| Net unrealized depreciation | $ | (509,935 | ) | |
| Cost of investments for income tax purposes | $ | 6,029,028 | ||
| Stone Harbor Investment Grade Fund | ||||
| Gross appreciation on investments (excess of value over tax cost) | $ | 480,913 | ||
| Gross depreciation on investments (excess of tax cost over value) | (120,322 | ) | ||
| Net appreciation of foreign currency | 2 | |||
| Net unrealized appreciation | $ | 360,593 | ||
| Cost of investments for income tax purposes | $ | 10,322,926 | ||
| Stone Harbor Strategic Income Fund | ||||
| Gross appreciation on investments (excess of value over tax cost) | $ | 387,914 | ||
| Gross depreciation on investments (excess of tax cost over value) | (2,294,305 | ) | ||
| Net appreciation of foreign currency | 752 | |||
| Net unrealized depreciation | $ | (1,905,639 | ) | |
| Cost of investments for income tax purposes | $ | 32,059,967 | ||
| Stone Harbor Emerging Markets Debt Allocation Fund | ||||
| Gross appreciation on investments (excess of value over tax cost) | $ | 1,540,451 | ||
| Gross depreciation on investments (excess of tax cost over value) | (816,999 | ) | ||
| Net appreciation of foreign currency | 14,747 | |||
| Net unrealized appreciation | $ | 738,199 | ||
| Cost of investments for income tax purposes | $ | 30,419,037 | ||
| 96 | www.shiplp.com |
| Stone Harbor Investment Funds | Notes to Financial Statements |
May 31, 2020
5. ADVISORY FEES
Stone Harbor Investment Partners LP is the Trust’s investment adviser. Under the investment advisory agreement the Trust pays an investment advisory fee calculated daily and paid monthly of 0.60%, 0.50%, 0.75%, 0.85%, 0.35%, 0.55%, and 0.70% of the average daily net assets for Stone Harbor Emerging Markets Debt Fund, Stone Harbor High Yield Bond Fund, Stone Harbor Local Markets Fund, Stone Harbor Emerging Markets Corporate Debt Fund, Stone Harbor Investment Grade Fund, Stone Harbor Strategic Income Fund, and Stone Harbor Emerging Markets Debt Allocation Fund, respectively.
The Adviser has contractually agreed to waive investment advisory fees and reimburse other expenses with respect to each of the Funds so that the Net Annual Operating Expenses (exclusive of acquired fund fees and expenses, brokerage expenses, interest expense, taxes, borrowing costs, organizational and extraordinary expenses) of the Stone Harbor Emerging Markets Debt Fund Institutional Class, Stone Harbor High Yield Bond Fund Institutional Class, Stone Harbor Local Markets Fund Institutional Class, Stone Harbor Emerging Markets Corporate Debt Fund Institutional Class, and Stone Harbor Investment Grade Fund Institutional Class, will not exceed 0.75%, 0.65%, 1.00%, 1.00%, and 0.50%, respectively. The Adviser has contractually agreed to waive fees and reimburse expenses with respect to the Stone Harbor Strategic Income Fund Institutional Class and Stone Harbor Emerging Markets Debt Allocation Fund Institutional Class, so that the Net Annual Operating Expenses (inclusive of acquired fund fees and expenses of Stone Harbor-advised funds but exclusive of acquired fund fees and expenses of non-Stone Harbor-advised funds, brokerage expenses, interest expense, taxes, borrowing costs, organizational and extraordinary expenses) will not exceed 0.70% and 0.85%, respectively. The fee waiver agreements are in effect through September 30, 2021 and are reevaluated on an annual basis.
The Adviser will be permitted to recover, on a class by class basis, fees and expenses it has borne through the agreement described above to the extent that a Fund’s expenses in later periods fall below the annual rates set forth in the relevant agreement; provided that the amount of such recovered fees and expenses does not cause the total annual operating expenses in any such year to exceed the applicable limits described above or any other lower limit then in effect. A Fund will not be obligated to pay any such deferred fees and expenses more than three years after the end of the fiscal year in which the fee and expense was deferred. At May 31, 2020, deferred fees and expenses eligible to be recovered will expire as follows:
| 2021 | 2022 | 2023 | Total | |||||||||||||
| Stone Harbor High Yield Bond Fund | $ | 139,187 | $ | 168,393 | $ | 172,784 | $ | 480,364 | ||||||||
| Stone Harbor Emerging Markets Corporate Debt Fund | 141,504 | 150,050 | 158,627 | 450,181 | ||||||||||||
| Stone Harbor Investment Grade Fund | 156,452 | 157,767 | 161,384 | 475,603 | ||||||||||||
| Stone Harbor Strategic Income Fund | 345,886 | 331,575 | 336,893 | 1,014,354 | ||||||||||||
| Stone Harbor Emerging Markets Debt Allocation Fund | 336,034 | 339,291 | 348,402 | 1,023,727 | ||||||||||||
6. INVESTMENTS
For the year ended May 31, 2020, the aggregate cost of purchases and proceeds from sales of investments (excluding short-term investments and U.S. Government Obligations) were as follows:
| Purchases | �� | Sales | ||||||
| Stone Harbor Emerging Markets Debt Fund | $ | 1,278,220,250 | $ | 1,258,330,823 | ||||
| Stone Harbor High Yield Bond Fund | 43,482,693 | 61,197,263 | ||||||
| Stone Harbor Local Markets Fund | 459,683,531 | 787,280,210 | ||||||
| Stone Harbor Emerging Markets Corporate Debt Fund | 25,138,692 | 32,044,413 | ||||||
| Stone Harbor Investment Grade Fund | 4,420,019 | 4,426,529 | ||||||
| Stone Harbor Strategic Income Fund | 2,039,010 | 3,445,050 | ||||||
| Stone Harbor Emerging Markets Debt Allocation Fund | 10,009,455 | 6,107,569 | ||||||
For the year ended May 31, 2020 the aggregate cost of purchases and proceeds from sales of U.S. Government Obligations were as follows:
| Purchases | Sales | |||||||
| Stone Harbor Emerging Markets Debt Fund | $ | 18,198,225 | $ | 27,922,721 | ||||
| Stone Harbor Emerging Markets Corporate Debt Fund | 216,690 | 456,196 | ||||||
| Stone Harbor Investment Grade Fund | – | 260,947 | ||||||
| Stone Harbor Investment Funds Annual Report | May 31, 2020 | 97 |
| Stone Harbor Investment Funds | Notes to Financial Statements |
May 31, 2020
7. AFFILIATED COMPANIES
Funds may invest in certain securities that are considered securities issued by affiliated companies. As defined by the Investment Company Act of 1940, as amended, an affiliated person, including an affiliated company, is one in which a Fund owns 5% or more of the outstanding voting securities, or a company which is under common ownership or control with the Fund. The purchases, sales, dividend income, capital gains, return of capital distributions received, shares and value of investments in affiliated companies for the year ended May 31, 2020 were as follows:
Stone Harbor Strategic Income Fund
| Security Name | Market Value as of May 31, 2019 | Purchases | Sales | Change in Unrealized Gain/(Loss) | Realized Gain/Loss | Market Value as of May 31, 2020 | Share Balance as of May 31, 2020 | Dividends | ||||||||||||||||||||||||
| Stone Harbor Emerging Markets Corporate Debt Fund | $ | 1,674,387 | 82,200 | (61,065 | ) | $ | (121,396 | ) | $ | (10,712 | ) | $ | 1,563,414 | 191,360 | $ | 82,200 | ||||||||||||||||
| Stone Harbor Emerging Markets Debt Fund | 6,620,965 | 1,125,121 | (244,251 | ) | (507,429 | ) | (60,160 | ) | 6,934,246 | 777,382 | 384,223 | |||||||||||||||||||||
| Stone Harbor High Yield Bond Fund | 9,750,365 | 538,243 | (366,377 | ) | (351,612 | ) | (127,025 | ) | 9,443,594 | 1,254,129 | 538,243 | |||||||||||||||||||||
| Stone Harbor Investment Grade Fund | 10,734,575 | 291,492 | (396,908 | ) | 448,919 | (630 | ) | 11,077,448 | 1,026,640 | 291,492 | ||||||||||||||||||||||
| Stone Harbor Local Markets Fund | 3,141,560 | 1,955 | (2,376,449 | ) | 86,924 | (74,550 | ) | 779,440 | 93,458 | 1,954 | ||||||||||||||||||||||
| $ | 31,921,852 | $ | (444,594 | ) | $ | (273,077 | ) | $ | 29,798,142 | $ | 1,298,112 | |||||||||||||||||||||
Stone Harbor Emerging Markets Debt Allocation Fund
| Security Name | Market Value as of May 31, 2019 | Purchases | Sales | Change in Unrealized Gain/(Loss) | Realized Gain/Loss | Market Value as of May 31, 2020 | Share Balance as of May 31, 2020 | Dividends | ||||||||||||||||||||||||
| Stone Harbor Emerging Markets Debt Fund | $ | 14,042,515 | 6,676,537 | (1,698,335 | ) | $ | (879,825 | ) | $ | (47,851 | ) | $ | 18,093,041 | 2,028,368 | $ | 857,821 | ||||||||||||||||
| Stone Harbor Local Markets Fund | 14,189,920 | 3,332,918 | (4,409,234 | ) | 81,963 | (154,099 | ) | 13,041,468 | 1,563,725 | 16,529 | ||||||||||||||||||||||
| $ | 28,232,435 | $ | (797,862 | ) | $ | (201,950 | ) | $ | 31,134,509 | $ | 874,350 | |||||||||||||||||||||
The Emerging Markets Debt Fund engaged in cross trades with an affiliate during the year ended May 31, 2020 pursuant to Rule 17a-7 under the 1940 Act. Cross trading is the buying or selling of portfolio securities between funds to which the Adviser serves as the investment adviser. The Board of Trustees previously adopted procedures that apply to transactions between the Portfolios pursuant to Rule 17a-7. At its regularly scheduled meetings, the Trustees review such transactions as of the most current calendar quarter for compliance with the requirements set forth by Rule 17a-7 and the Emerging Markets Debt Fund’s procedures. The procedures require that the transactions be a purchase or sale for no consideration other than cash payment against prompt delivery of a security for which market quotations are readily available, and be consistent with the investment policies of the Funds involved. During the year ended May 31, 2020, the Emerging Markets Debt Fund purchased securities from another fund for which the Adviser is the investment adviser in the amount of $7,681,934.
8. SHARES OF BENEFICIAL INTEREST
At May 31, 2020, the Trust had an unlimited number of shares of beneficial interest authorized with a par value of $0.001 per share. The Funds have the ability to issue multiple classes of shares. Each share of a class represents an identical interest and has the same rights, except that each class bears certain direct expenses, including those specifically related to the distribution of its shares. Transactions in shares of the Institutional Class can be found on the Statements of Changes in Net Assets.
9. BENEFICIAL OWNERSHIP
As of May 31, 2020, IMF Retired Staff Benefits owned beneficially 48% of the Stone Harbor High Yield Bond Fund’s outstanding shares, an individual shareholder owned beneficially 47% of the Stone Harbor Local Markets Fund’s outstanding shares, two individual shareholders owned beneficially 49% and 30% of the Stone Harbor Emerging Markets Debt Allocation Fund’s outstanding shares, the Stone Harbor Strategic Income Fund owned beneficially 99% of the Stone Harbor Investment Grade Fund’s outstanding shares, an individual shareholder owned 76% and affiliated persons owned an aggregate of 18% of the Stone Harbor Strategic Income Fund’s outstanding shares, and two individual shareholders held 28% and 67% of the Stone Harbor Emerging Markets Corporate Bond Fund’s outstanding shares.
| 98 | www.shiplp.com |
| Stone Harbor Investment Funds | Notes to Financial Statements |
May 31, 2020
10. INDEMNIFICATIONS
Under the Trust’s organizational documents, its officers and Trustees are indemnified against certain liability arising out of the performance of their duties to the Trust. Additionally, in the normal course of business, the Trust enters into contracts with service providers that may contain general indemnification clauses. The Trust’s maximum exposure under these arrangements is unknown, as this would involve future claims that may be made against the Trust that have not yet occurred.
11. OTHER
The Funds, along with the Stone Harbor Emerging Markets Total Income Fund and the Stone Harbor Emerging Markets Income Fund (the “Stone Harbor Fund Complex”) pays each Trustee who is not an interested person, of the Investment Adviser or any of its affiliates an aggregate fee of $84,000 per year. The Chair of the Audit Committee of the Board receives additional compensation of $5,000 per year for his service as chair. These fees were allocated over the Stone Harbor Fund Complex based on the average net assets of each fund. Interested Trustees of the Trust are not compensated by the Stone Harbor Fund Complex. All Trustees are reimbursed for reasonable travel and out-of-pocket expenses incurred to attend such meetings. Officers of the Funds do not receive compensation for performing the duties of their office.
12. CORONAVIRUS (COVID-19) PANDEMIC
A recent outbreak of respiratory disease ("COVID-19") caused by a novel coronavirus was first detected in China in December 2019 and has now been detected internationally. COVID-19 has resulted in closing borders, enhanced health screenings, healthcare service preparation and delivery, quarantines, cancellations, disruptions to supply chains and customer activity, as well as general concern and uncertainty. The impact of COVID-19, and other epidemics and pandemics that may arise in the future, could affect the economies of many nations, individual companies and the market in general in ways that cannot necessarily be foreseen at the present time. In addition, the impact of infectious diseases in developing or emerging market countries may be greater due to less established health care systems. Health crises caused by the recent COVID-19 outbreak may exacerbate other pre-existing political, social and economic risks in certain countries. The impact of the outbreak may be short term or may last for an extended period of time. Widespread disease and virus epidemics, such as the COVID-19 outbreak, could be highly disruptive, adversely affecting individual companies, sectors, industries, markets, currencies, interest and inflation rates, credit ratings, investor sentiment, and other factors affecting the value of the Funds' investments. As a result, whether or not the Funds invest in securities of issuers located in or with significant exposure to the countries directly affected, the value and liquidity of the Funds' investments may be negatively affected.
13. SUBSEQUENT EVENTS
Effective July 20, 2020, Mr. Thomas K. Flanagan retired from the Board of Trustees of the Trust, and Mr. Peter J. Wilby was appointed as a Trustee. Mr. Wilby currently serves as President of the Trust and Co-Chief Investment Officer of Stone Harbor.
| Stone Harbor Investment Funds Annual Report | May 31, 2020 | 99 |
| Stone Harbor Investment Funds | Additional Information |
May 31, 2020 (Unaudited)
FUND PORTFOLIO HOLDINGS
Each Fund files its complete schedule of portfolio holdings with the SEC for the first and third quarters of each fiscal year as an exhibit to its reports on Form N-PORT. Each Fund's Form N-PORT reports are available on the SEC's website at http://www.sec.gov.
PROXY VOTING
A description of the policies and procedures that the Funds use to determine how to vote proxies relating to portfolio securities and information regarding how the Funds voted proxies relating to portfolio securities for the 12-month period ended June 30 are available without a charge, upon request, by contacting Stone Harbor Investment Funds at 1-866-699-8158 or on the SEC website at http://www.sec.gov.
SHAREHOLDER TAX INFORMATION
Certain tax information regarding the Trust is required to be provided to shareholders based upon each Fund’s income and distributions for the year ended May 31, 2020. The Funds designate the following as a percentage of taxable ordinary income distributions, up to the maximum amount allowable, for the calendar year ended December 31, 2019:
| Stone Harbor Emerging Markets Debt Fund | Stone Harbor High Yield Bond Fund | Stone Harbor Local Markets Fund | Stone Harbor Emerging Markets Corporate Debt Fund | Stone Harbor Investment Grade Fund | Stone Harbor Strategic Income Fund | Stone Harbor Emerging Markets Debt Allocation Fund | |
| Dividends Received Deduct Percentage | 0.00% | 0.00% | 0.00% | 0.00% | 0.00% | 0.00% | 0.00% |
| Qualified Dividend Income Percentage | 0.00% | 0.00% | 0.00% | 0.00% | 0.00% | 0.00% | 0.00% |
In early 2020, if applicable, shareholders of record received this information for the distributions paid to them by the Funds during the calendar year 2019 via Form 1099. The Funds will notify shareholders in early 2021 of amounts paid to them by the Funds, if any, during the calendar year 2020.
BENCHMARK DESCRIPTIONS
| Index | Description |
| Bloomberg Barclays U.S. Aggregate Index | The Bloomberg Barclays U.S. Aggregate Index represents securities that are SEC-registered, taxable, and dollar denominated. The index covers the U.S. investment grade fixed rate bond market, with index components for government and corporate securities, mortgage pass-through securities, and asset-backed securities. These major sectors are subdivided into more specific indices that are calculated and reported on a regular basis. |
| Bloomberg Barclays Global Credit Index (Hedged USD) | Bloomberg Barclays Global Credit Index is a subset of the Global Aggregate Index and is subject to the same quality, liquidity, and maturity requirements and exclusion rules of the latter. Constituents must be rated investment grade by at least two of the three major ratings agencies. Constituents must have a remaining maturity of at least one year. The index does not include convertibles, floating-rate notes, fixed-rate perpetuals, warrants, linked bonds, and structured products. |
| ICE BofAML US High Yield Constrained Index | The ICE BofAML US High Yield Constrained Index contains all securities in ICE BofAML US High Yield Index but caps issuer exposure at 2%. Index constituents are capitalization-weighted, based on their current amount outstanding, provided the total allocation to an individual issuer does not exceed 2%. Issuers that exceed the limit are reduced to 2% and the face value of each of their bonds is adjusted on a pro-rata basis. Similarly, the face values of bonds of all other issuers that fall below the 2% cap are increased on a pro-rata basis. In the event there are fewer than 50 issuers in the Index, each is equally weighted and the face values of their respective bonds are increased or decreased on a pro-rata basis. |
| JPMorgan CEMBI Broad Diversified Index | The JPMorgan CEMBI Broad Diversified tracks total returns of U.S. dollar-denominated debt instruments issued by corporate entities in emerging market countries and consists of an investable universe of corporate bonds. The minimum amount outstanding required is $350 mm for the CEMBI Broad Diversified. The CEMBI Broad Diversified limits the weights of those index countries with larger corporate debt stocks by only including a specified portion of these countries’ eligible current face amounts of debt outstanding. |
| JPMorgan EMBI Global Diversified Index | The JPMorgan EMBI Global Diversified (EMBI Global Diversified) tracks total returns for U.S. dollar-denominated debt instruments issued by emerging markets sovereign and quasi-sovereign entities: Brady bonds, loans, and Eurobonds. The index limits the weights of those index countries with larger debt stocks by only including specified portions of these countries' eligible current face amounts outstanding. The countries covered in the EMBI Global Diversified are identical to those covered by the EMBI Global. |
| JPMorgan GBI EM Global Diversified Index | The JPMorgan GBI EM Global Diversified consists of regularly traded, liquid fixed-rate, domestic currency government bonds to which international investors can gain exposure. The weightings among the countries are more evenly distributed within this index. |
| S&P 500 Index | The S&P 500 is an index of 500 stocks chosen for market size, liquidity and industry grouping, among other factors. The S&P 500 is designed to be a leading indicator of U.S. equities and is meant to reflect the risk/return characteristics of the large cap universe. |
| 100 | www.shiplp.com |
| Stone Harbor Investment Funds | Additional Information |
May 31, 2020 (Unaudited)
SPECIAL RISKS RELATED TO CYBER SECURITY
With the increased use of technologies such as the Internet and the dependence on computer systems to perform necessary business functions, the Funds and their service providers are susceptible to operational and information security risks. In general, cyber incidents can result from deliberate attacks or unintentional events. Cyber attacks include, but are not limited to, gaining unauthorized access to digital systems for purposes of misappropriating assets or sensitive information, corrupting data, or causing operational disruption. Cyber attacks may also be carried out in a manner that does not require gaining unauthorized access, such as causing denial-of-service attacks on websites. Cyber security and other operational and technology failures or breaches of a Fund's service providers (including, but not limited to, the Adviser, the administrator, the transfer agent and the custodian) or the issuers of securities in which the Funds invest, have the ability to cause disruptions and impact business operations, potentially resulting in financial losses, the inability of Fund shareholders to transact business, delays or mistakes in the calculation of the Funds' NAV or other materials provided to shareholders, violations of applicable privacy and other laws, regulatory fines, penalties, reputational damage, reimbursement or other compensation costs, and/or additional compliance costs. The Adviser does not control the cyber security plans and systems put in place by third party service providers, and such third party service providers may have limited indemnification obligations to the Adviser or the Funds. In addition, substantial costs may be incurred in order to prevent any cyber incidents in the future. The Funds and their shareholders could be negatively impacted as a result. While the Funds have established business continuity plans and systems designed to prevent such cyber attacks, there are inherent limitations in such plans and systems including the possibility that certain risks have not been identified. Furthermore, the Funds cannot control the cyber security plans and systems put in place by its service providers, financial intermediaries and issuers in which the Funds invest.
DEFINITIONS
ABS – An asset-backed security (ABS) is a financial security backed by a loan, lease or receivables against assets other than real estate and mortgage-backed securities.
Alpha – A measure of performance on a risk-adjusted basis. The excess return of the fund relative to the return of the benchmark index is a fund's alpha.
Basis Point – A unit equal to one hundredth of a percentage point.
Beta – A measure of the volatility, or systematic risk, of a security or a portfolio in comparison to the market as a whole.
Broad-Based securities indices are unmanaged and are not subject to fees and expenses typically associated with managed accounts or investment funds. Investments cannot be made directly in a broad-based securities index.
CMBS – Commercial mortgage-backed securities (CMBS) are a type of mortgage-backed security that is secured by mortgages on commercial properties, instead of residential real estate.
Credit Spread – The difference in yield between a U.S. Treasury bond and a debt security with the same maturity.
Derivative – A security with a price that is dependent on or derived from one or more underlying assets.
Duration – A measure of the sensitivity of the price (the value of principal) of a fixed-income investment to a change in interest rates. Duration is expressed as a number of years.
Floating Rate Bonds – Bond whose interest amount fluctuates in step with the market interest rates, or some other external measure.
High Yield Spread – The percentage difference in current yields of high-yield bonds compared to investment grade corporate bonds.
Investment Grade – Refers to bonds that are considered to have a relatively low risk of default, ranging from highest credit quality to good credit quality. Bonds rated below investment grade are considered to have significant speculative characteristics.
Par Value – The face value of a bond.
Purchasing Managers’ Index – a measure of the prevailing direction of economic trends in manufacturing.
RMBS – Residential mortgage-backed securities (RMBS) are a type of mortgage-backed debt obligation whose cash flows come from residential debt, such as mortgages, home-equity loans and subprime mortgages.
| Stone Harbor Investment Funds Annual Report | May 31, 2020 | 101 |
| Stone Harbor Investment Funds | Additional Information |
| May 31, 2020 (Unaudited) |
Sovereign Debt – Refers to bonds issued by a national government in order to finance the issuing country’s growth. Sovereign debt described as external is denominated in U.S. dollar, while sovereign debt described as local is issued in a foreign currency.
Spread – The difference between the bid and ask price of a security or asset.
Standard and Poor’s ratings are measured on a scale that generally ranges from AAA (highest) to D (lowest). A security that has not been given a credit rating by Standard and Poor’s is listed as “not rated”. For additional information please go to the Understanding Ratings section at www.standardpoors.com.
Tranche – Portions of debt or structured financing. Each portion (or tranche) is one of several related securities offered at the same time but with a different set of risks, rewards, and maturities.
USD 3-Month LIBOR – The average interest rate at which a selection of banks in London are prepared to lend to one another in American dollars with a maturity of 3 months. The LIBOR interest rates are used by banks as the base rate in setting the level of their savings, mortgage and loan interest rates.
Yield Curve – Yield curve tracks the relationship between interest rates and the maturity of Treasury Securities at a given time.
Yield-To-Maturity – The total return anticipated on a bond if the bond is held until the end of its lifetime. Yield to maturity is considered a long-term bond yield, but is expressed as an annual rate.
| 102 | www.shiplp.com |
| Stone Harbor Investment Funds | Board Approval of Investment Advisory Agreement |
May 31, 2020 (Unaudited)
The investment advisory agreements (each an “Agreement” and, together, the “Agreements”) for each of Stone Harbor Emerging Markets Debt Fund, Stone Harbor High Yield Bond Fund, Stone Harbor Local Markets Fund, Stone Harbor Emerging Markets Corporate Debt Fund, Stone Harbor Investment Grade Fund, Stone Harbor Strategic Income Fund, Stone Harbor Emerging Markets Debt Allocation Fund and Stone Harbor Emerging Markets Debt Blend Fund (each, a “Fund” and together, the “Funds”) is subject to annual approval by (i) the vote of a majority of the entire Board of Trustees, or of a majority of the outstanding voting securities (as defined in the Investment Company Act of 1940, as amended (the “1940 Act”)), of the applicable Fund, and (ii) the vote of a majority of the Trustees who are not interested persons of the Funds (the “Independent Trustees”). Each Agreement is terminable with respect to a Fund by Stone Harbor Investment Partners LP, each Fund’s investment adviser (the “Adviser”), a majority of the Trustees, or a vote of a majority of the outstanding voting securities of the applicable Fund, without penalty, by not less than 60 days’ prior written notice. Each Agreement will terminate automatically in the event of its assignment (as defined for purposes of the 1940 Act).
The Board of Trustees, including the Independent Trustees, meets over the course of the year with representatives of the Adviser, including the Funds’ respective portfolio managers, and regularly reviews detailed information regarding the investment program and performance of each Fund. The Board of Trustees also receives periodic updates between meetings. The Trustees, including the Independent Trustees, met on April 22, 2020 to review the Agreements for each Fund and to determine whether to approve the continuation of the Agreements for an additional one-year period. In addition, the Independent Trustees spoke separately with their counsel on April 16, 2020 to discuss these matters formally and also exchanged other informal communications with their counsel. The Trustees considered all information they deemed reasonably necessary to evaluate the terms thereof. In connection with this meeting, the Trustees received materials to assist them with their review. These materials included, among other things, (i) information provided in response to a request for information from the Independent Trustees’ independent legal counsel, including information provided in response to supplemental requests; (ii) information about the Adviser, including the Adviser’s financial results and financial condition, and services provided by the Adviser; (iii) information on each Fund’s investment objective and strategies and the size, education and experience of the Adviser’s investment staff; (iv) information on each Fund’s investment performance and the performance of a group of comparable funds prepared by a third party; (v) information on each Fund’s advisory fees and other expenses, including information about the fees charged to institutional accounts managed by the Adviser and other funds where the Adviser serves as sub-adviser, comparisons of the Funds’ fees to the fees of a group of similar funds prepared by a third party and information about any applicable expense caps; (vi) information about the profitability of each Agreement to the Adviser; (vii) information regarding arrangements in respect of the distribution of the Funds’ shares; (viii) information regarding the allocation of the Funds’ brokerage; (ix) information regarding the Adviser’s program for assuring the Funds’ and their service providers’ compliance with applicable laws; and (x) information regarding the Adviser’s business continuity planning and remote operations in the current environment. The Independent Trustees were afforded the opportunity to, and did, ask questions and request additional information. In addition, the Independent Trustees were assisted by independent legal counsel throughout the process.
In considering whether to approve the continuation of each Agreement, the Board of Trustees, including the Independent Trustees, did not identify any single factor as determinative. Individual Trustees may have evaluated the information presented differently from one another, giving different weights to various factors. Matters considered by the Trustees, including the Independent Trustees, in connection with their approval of the Agreements included, but were not limited to, the following:
The nature, extent and quality of the services provided to the Funds under the Agreements.
The Trustees considered the nature, extent and quality of the services provided by the Adviser to the Funds. In this regard, the Trustees took into account the experience of each Fund’s portfolio management team (as well as changes to those teams) and of the Adviser’s senior management, and the time and attention they devote to portfolio management activities, including managing the Funds. The Trustees also considered each Fund’s record of compliance with its investment restrictions and the compliance programs of the Funds and the Adviser. They also considered the compliance-related resources the Adviser provided to the Funds, including resources designed to ensure compliance with the investment objectives, policies and restrictions of each Fund and to meeting the regulatory requirements, including with respect to liquidity risk management. Based on these considerations, the Trustees concluded that the Funds would continue to benefit from the nature, extent and quality of these services as a result of the Adviser’s experience, personnel, operations, and resources.
Investment performance of the Funds and the Adviser.
The Trustees reviewed performance information for each Fund, including information prepared by a third party, for various time periods since each Fund’s inception. The review included a comparison of each Fund’s performance to the performance of a group of comparable funds and benchmark selected by a third party as well as the benchmarks utilized by the Adviser. The Trustees also considered the Adviser’s performance and reputation generally and its investment techniques, risk management controls and decision-making processes. The Trustees noted that: (1) Stone Harbor Emerging Markets Corporate Debt Fund's performance exceeded the third party benchmark and peer group average for all relevant time periods; (2) Stone Harbor Emerging Markets Debt Fund’s performance lagged the peer group average for the one-year period, exceeded the performance of the third party benchmark for the one-year period, lagged the peer group average and was approximately equal to the third party benchmark for the three-year period, and exceeded the performance of the third party benchmark and peer group average for all remaining relevant time periods; (3) Stone Harbor High Yield Bond Fund’s performance lagged the performance of the third party benchmark and peer group for all relevant time periods; (4) Stone Harbor Investment Grade Fund’s performance lagged the performance of the third party benchmark and peer group average for all relevant time periods; (5) Stone Harbor Local Markets Fund’s performance lagged the performance of the third party benchmark and peer group average for all relevant time periods; (6) Stone Harbor Strategic Income Fund’s performance lagged the performance of the third party benchmark and peer group average for all relevant time periods; and (7) Stone Harbor Emerging Markets Debt Allocation Fund’s performance lagged the performance of the third party benchmark and peer group average for all relevant time periods. In addition, in cases where a Fund had extended underperformance, the Trustees had further discussions with senior management of the Adviser to consider the factors that contributed to underperformance and the Adviser discussed the steps that it had taken to improve performance and its plans to monitor performance going forward. With respect to Stone Harbor Emerging Markets Debt Blend Fund, the Trustees noted that the Fund was not yet operational and therefore no performance information had been provided for the Fund.
| Stone Harbor Investment Funds Annual Report | May 31, 2020 | 103 |
| Stone Harbor Investment Funds | Board Approval of Investment Advisory Agreement |
May 31, 2020 (Unaudited)
The costs of the services to be provided and profits to be realized by the Adviser from its relationship with the Funds.
The Trustees considered the fees charged to each Fund for advisory services as well as the total expense level of each Fund. The Adviser furnished information to the Trustees compiled by a third party showing a comparison of each Fund’s advisory fees and total expense levels compared to a group of comparable funds selected by the third party. The Trustees noted that each of the Funds is subject to expense caps (although the total expense ratios for certain Funds are below the cap), and each of the Fund’s advisory fee and total expenses (after application of the expense caps and waivers) align competitively with comparable groups of mutual funds. The Trustees noted that each of the Fund's total expenses (after application of the expense caps and waivers) was at or below the median total expenses of the comparable funds selected by the third party, other than Stone Harbor Emerging Markets Corporate Debt Fund, Stone Harbor Emerging Markets Debt Allocation Fund and Stone Harbor Emerging Markets Debt Blend Fund, whose total expenses were higher than the median. With respect to the Stone Harbor Emerging Markets Debt Allocation Fund, the Trustees noted that the Fund’s advisory fee was at the median advisory fee of the comparable funds, and with respect to the Stone Harbor Emerging Markets Debt Blend Fund, the Trustees noted that the Fund’s advisory fee was below the median advisory fee of the comparable funds (after application of the expense caps and waivers). The Adviser also provided information about the costs to it of providing services to the Funds, including information about how such costs are determined for each Fund, and information about its profitability with respect to its management of each of the Funds, as well as information about, as applicable, the advisory fees it charges with respect to other funds, institutional separate accounts and sub-advised funds with similar strategies, and information about differences in such fees and the reasons for such differences. In this regard, the Trustees noted that the effective management fee rates received by the Adviser from certain Funds (after application of expense caps and waivers) are generally comparable to the fees charged to similarly managed institutional accounts. They also noted that the Funds’ investor base consisted primarily of institutional investors. With respect to the comparison of fee to funds for which the Adviser serves as sub-adviser, the Trustees took into account the additional and different services provided as an adviser and the additional risks faced as an adviser of a fund compared to serving as a sub-adviser of a fund. The Trustees also considered the demands and complexity of the investment management of the Funds as compared to the complexity of managing (or sub-advising) other funds and separate accounts. The Trustees also considered the Adviser’s description of how profitability is determined and the reasons for differences in profitability between Funds and from year to year.
Economies of Scale.
The Trustees considered to what extent economies of scale would likely be realized as the Funds grow and the extent that economies are shared with the Funds through breakpoints in their investment advisory fees or other means, such as expense caps and investments by the Adviser that may benefit the Fund. The Trustees considered the investments in personnel, cyber security, liquidity management, and technology, which the Adviser had made over the years, and the extent to which those investments could benefit the Funds. The Trustees noted that the Funds are relatively small when compared to certain of the Adviser’s institutional accounts and therefore are able to take advantage of resources that the Adviser devotes to institutional accounts. The Trustees noted that the Funds’ expenses are capped, and that the Adviser proposed to maintain the Funds’ fee waiver/expense reimbursement arrangements at current levels until September 30, 2021. They also noted that some of the Funds had expense ratios that were below the cap. The Trustees also considered the Adviser’s decision not to utilize breakpoints in the investment advisory fees.
| 104 | www.shiplp.com |
| Stone Harbor Investment Funds | Board Approval of Investment Advisory Agreement |
May 31, 2020 (Unaudited)
The Trustees also considered other factors, which included but were not limited to the following:
| ● | So-called “fallout benefits” to the Adviser, such as the benefits from offering its institutional clients the ability to invest in a registered investment company. The Trustees also considered the possible conflicts of interest associated with these fallout and other benefits, and the reporting, disclosure and other processes in place to disclose and monitor such possible conflicts of interest. |
| ● | The Trustees’ review and discussion of the Funds’ advisory arrangements in prior years, and management’s record of responding to Trustee concerns raised during the year and in prior years. |
Based on their evaluation of all factors they deemed to be material, including those factors described above, the Trustees, including the Independent Trustees, concluded that the existing investment advisory agreements for Stone Harbor Emerging Markets Debt Fund, Stone Harbor High Yield Bond Fund, Stone Harbor Local Markets Fund, Stone Harbor Emerging Markets Corporate Debt Fund, Stone Harbor Investment Grade Fund, Stone Harbor Strategic Income Fund, Stone Harbor Emerging Markets Debt Allocation Fund and Stone Harbor Emerging Markets Debt Blend Fund should be continued through June 20, 2021.
| Stone Harbor Investment Funds Annual Report | May 31, 2020 | 105 |
| Stone Harbor Investment Funds | Liquidity Risk Management Program |
May 31, 2020 (Unaudited)
Stone Harbor Investment Funds (the “Trust”) has established a liquidity risk management program (the “LRMP” or “Program”) to govern the Trust’s approach to managing liquidity risk for each of the Stone Harbor Emerging Markets Debt Fund, Stone Harbor High Yield Bond Fund, Stone Harbor Local Markets Fund, Stone Harbor Emerging Markets Corporate Debt Fund, Stone Harbor Investment Grade Fund, Stone Harbor Strategic Income Fund, and Stone Harbor Emerging Markets Debt Allocation Fund (each, a “Fund” and together, the “Funds”). Stone Harbor Investment Partners LP, the Trust’s investment adviser (“Stone Harbor” or the “Adviser”) serves as the Program Administrator of the LRMP. The Program is overseen by the Liquidity Risk Management Committee (the “Committee”), a committee comprised of representatives of the Adviser and Officers of the Trust. The Trust’s Board of Trustees (the “Board”) has approved the designation of the Committee to oversee the Program.
The Program’s principal objectives include supporting each Fund’s compliance with limits on investments in illiquid assets and mitigating the risk that a Fund will be unable to meet its redemption obligations in a timely manner. The Program also includes a number of elements that support the management and assessment of liquidity risk, including a periodic assessment of factors that influence a Fund’s liquidity and the periodic classification and re-classification of the Fund’s investments into groupings that reflect the Committee’s assessment of their relative liquidity under current market conditions.
At a meeting of the Board held on April 22, 2020, the Trustees received a report from the Committee regarding the design and operational effectiveness of the Program since its implementation on December 1, 2018. The Committee determined, and reported to the Board, that the Program is reasonably designed to assess and manage each Fund’s liquidity risk and has operated adequately and effectively to manage each Fund’s liquidity risk since implementation.
The Committee reported that during the period covered by the report, there were no liquidity events that impacted the Funds or their ability to timely meet redemptions without dilution to existing shareholders. Among other things, the Board noted that the Funds are not required to have a highly liquid investment minimum based on their liquidity classifications. The Board further noted that no material changes have been made to the Program since its implementation, although enhancements are made on a periodic basis to improve the Program’s process efficiency and comprehensiveness.
| 106 | www.shiplp.com |
| Stone Harbor Investment Funds | Trustees & Officers |
May 31, 2020 (Unaudited)
The business and affairs of each Fund are managed under the direction of its Board of Trustees. The Board of Trustees approves all significant agreements between a Fund and the persons or companies that furnish services to the Fund, including agreements with its distributor, investment adviser, administrator, custodian and transfer agent. The day-to-day operations of the Fund are delegated to the Fund’s Adviser and administrator.
The name, year of birth and principal occupations for the past five years of the Trustees and officers of the Funds are listed below, along with the number of portfolios in the Fund complex overseen by and the other directorships held by each Trustee. Except as otherwise noted, the address of each Trustee and officer is c/o Stone Harbor Investment Partners LP, 31 W. 52nd Street, 16th Floor, New York, New York 10019. The Trust’s Statement of Additional Information includes additional information about the Trustees and is available without a charge, upon request, by calling 1-866-699-8158.
INDEPENDENT TRUSTEES
Name and Year of Birth(1) | Position(s) Held with the Trust | Term of Office and Length of Time Served(2) | Principal Occupation(s) During Past 5 Years | Number of Portfolios in Fund Complex Overseen by Trustee(3) | Other Directorships Held by Trustee |
Alan Brott 1942 | Chairman of the Audit Committee; Trustee | Since 2007 | Columbia University - Associate Professor, 2000-2017; Consultant, 1991-Present. | 10 | Stone Harbor Emerging Markets Income Fund, Stone Harbor Emerging Markets Total Income Fund, Grosvenor Registered Multi-Strategy Fund and Grosvenor Hedge Fund Guided Portfolio Solution, Man FRM Alternative Multi- Strategy Fund, Excelsior Private Markets Funds (2 funds), UST Global Private Markets, and NB Crossroads Private Markets Funds (3 funds). |
Heath B. McLendon 1933 | Trustee | Since 2007 | Retired. | 10 | Stone Harbor Emerging Markets Income Fund and Stone Harbor Emerging Markets Total Income Fund. |
Patrick Sheehan 1947 | Trustee | Since 2007 | Retired. | 10 | Stone Harbor Emerging Markets Income Fund and Stone Harbor Emerging Markets Total Income Fund. |
| Stone Harbor Investment Funds Annual Report | May 31, 2020 | 107 |
| Stone Harbor Investment Funds | Trustees & Officers |
May 31, 2020 (Unaudited)
INDEPENDENT TRUSTEES (continued)
Name and Year of Birth(1) | Position(s) Held with the Trust | Term of Office and Length of Time Served(2) | Principal Occupation(s) During Past 5 Years | Number of Portfolios in Fund Complex Overseen by Trustee(3) | Other Directorships Held by Trustee |
Glenn Marchak 1956 | Trustee | Since 2015 | Consultant and Private Investor. | 10 | Stone Harbor Emerging Markets Income Fund, Stone Harbor Emerging Markets Total Income Fund, Apollo Tactical Income Fund Inc. and Apollo Senior Floating Rate Fund Inc. |
Bruce Speca 1956 | Trustee | Since 2016 | Trustee, Frost Family of Funds (2019-Present); Trustee, The Advisors’ Inner Circle Fund, The Advisors’ Inner Circle Fund II, Bishop Street Funds and The KP Funds (November 2011-Present). | 10 | Stone Harbor Emerging Markets Income Fund, Stone Harbor Emerging Markets Total Income Fund, The Advisors’ Inner Circle Fund (45 funds), The Advisors’ Inner Circle Fund II (19 funds), Bishop Street Funds (2 funds), The KP Funds (15 funds) and Frost Family of Funds (8 Funds). |
INTERESTED TRUSTEE
Name and Year of Birth(1) | Position(s) Held with the Trust | Term of Office and Length of Time Served(2) | Principal Occupation(s) During Past 5 Years | Number of Portfolios in Fund Complex Overseen by Trustee(3) | Other Directorships Held by Trustee |
Thomas K. Flanagan* 1953 | Chairman and Trustee | Since 2012 | Retired since 2018; formerly Portfolio Manager of Stone Harbor from April 2006 through December 2018. | 10 | Stone Harbor Emerging Markets Income Fund and Stone Harbor Emerging Markets Total Income Fund. |
| 108 | www.shiplp.com |
| Stone Harbor Investment Funds | Trustees & Officers |
May 31, 2020 (Unaudited)
OFFICERS
| Name and Year of Birth(1) | Position(s) Held with the Trust | Term of Office and Length of Time Served(2) | Principal Occupation(s) During Past 5 Years |
Peter J. Wilby 1958 | President | Since 2007 | Co-portfolio manager of the Funds; since December 2018, Co-Chief Investment Officer of Stone Harbor; from April 2006 to December 2018, Chief Investment Officer of Stone Harbor. |
Jeffrey S. Scott 1959 | Chief Compliance Officer | Since 2007 | Since April 2006, Chief Compliance Officer of Stone Harbor. |
Thomas M. Reynolds 1960 | Principal Financial and Accounting Officer | Since 2014 | Since February 2008, Controller of Stone Harbor. |
Amanda Suss 1969 | Treasurer | Since 2014 | Since July 2011, Senior Finance Associate of Stone Harbor. |
Adam J. Shapiro 1963 | Chief Legal Officer; Secretary; Anti-Money Laundering Officer | Since 2007 | Since April 2006, General Counsel of Stone Harbor. |
Vilma V. DeVooght 1977 | Assistant Secretary | Since 2015 | Senior Counsel, ALPS, since 2014. |
Erich Rettinger 1985 | Assistant Treasurer | Since 2016 | Fund Controller, ALPS, since 2013. |
| * | Mr. Flanagan is considered an "interested person" of the Trust (as defined in the 1940 Act) (an “Interested Trustee”) because of an ongoing financial interest associated with his December 2018 retirement from the Adviser |
| (1) | The business address of each Trustee and Officer of the Fund is c/o Stone Harbor Investment Partners LP, 31 West 52nd Street, 16th Floor, New York, NY 10019. |
| (2) | Each Trustee serves until retirement, resignation or removal from the Board. Officers are typically elected every year, unless an officer earlier retires, resigns or is removed from office. |
| (3) | The term “Fund Complex” as used in this table includes each Fund of the Trust, the Stone Harbor Emerging Markets Income Fund and the Stone Harbor Emerging Markets Total Income Fund, two closed-end funds advised by the Adviser. |
| Stone Harbor Investment Funds Annual Report | May 31, 2020 | 109 |

INVESTMENT ADVISER
Stone Harbor Investment Partners LP
31 W. 52nd Street, 16th Floor
New York, New York 10019
ADMINISTRATOR & FUND ACCOUNTANT
ALPS Fund Services, Inc.
1290 Broadway, Suite 1000
Denver, Colorado 80203
DISTRIBUTOR
ALPS Distributors, Inc.
1290 Broadway, Suite 1000
Denver, Colorado 80203
TRANSFER AGENT
ALPS Fund Services, Inc.
1290 Broadway, Suite 1000
Denver, Colorado 80203
CUSTODIAN
State Street Bank and Trust Company
One Iron Street
Boston, Massachusetts 02210
LEGAL COUNSEL
Ropes & Gray LLP
1211 Avenue of the Americas
New York, New York 10036
INDEPENDENT REGISTERED PUBLIC ACCOUNTING FIRM
Deloitte & Touche LLP
555 17th Street, Suite 3600
Denver, Colorado 80202
This material must be accompanied or preceded by a prospectus.
SHF001032 exp. 7/30/2021
| Item 2. | Code of Ethics. |
| (a) | The Registrant, as of the end of the period covered by this report, has adopted a code of ethics that applies to the Registrant’s principal executive officer, principal financial officer, principal accounting officer or controller or any persons performing similar functions on behalf of the Registrant. |
| (b) | Not applicable. |
| (c) | During the period covered by this report, no amendments to the provisions of the code of ethics adopted in Item 2(a) above were made. |
| (d) | During the period covered by this report, no implicit or explicit waivers to the provisions of the code of ethics adopted in Item 2(a) above were granted. |
| (e) | Not applicable. |
| (f) | The Registrant’s Code of Ethics is attached as Exhibit 13.A.1. hereto. |
| Item 3. | Audit Committee Financial Expert. |
The Board of Trustees of the Registrant has determined that the Registrant has at least one audit committee financial expert serving on its Audit Committee. The Board of Trustees has designated Alan J. Brott as the Registrant’s “audit committee financial expert.” Mr. Brott is “independent” as defined in paragraph (a)(2) of Item 3 to Form N-CSR.
Mr. Brott has significant public accounting experience, including significant experience as a partner at a public accounting firm.
| Item 4. | Principal Accountant Fees and Services. |
| (a) | Audit Fees: For the Registrant’s fiscal years ended May 31, 2019 and May 31, 2020, the aggregate fees billed for professional services rendered by the principal accountant for the audit of the Registrant’s annual financial statements were $343,000 and $252,100, respectively. |
| (b) | Audit-Related Fees: For the Registrant’s fiscal years ended May 31, 2019 and May 31, 2020, there were no fees billed for assurance and related services by the principal accountant that were reasonably related to the performance of the audit of the Registrant’s financial statements and were not reported in paragraph (a) of this Item 4. |
2
| (c) | Tax Fees: For the Registrant’s fiscal years ended May 31, 2019 and May 31, 2020, the aggregate fees billed for professional services rendered by the principal accountant for tax compliance, tax advice and tax planning were $47,120 and $39,615, respectively. The fiscal year 2019 and 2020 tax fees were for services pertaining to federal and state income tax return review, review of year-end dividend distributions and excise tax preparation. |
| (d) | All Other Fees: For the Registrant’s fiscal years ended May 31, 2019 and May 31, 2020, aggregate fees billed to the Registrant by the principal accountant for services provided by the principal accountant other than the services reported in paragraphs (a) through (c) of this Item 4 were $0 and $0, respectively. These fees were related to services provided to assist Stone Harbor Investment Funds in Indian tax matters. |
| (e)(1) | Audit Committee Pre-Approval Policies and Procedures: All services to be performed by the Registrant's principal accountant must be pre-approved by the Registrant's Audit Committee. |
| (e)(2) | No services described in paragraphs (b) through (d) of this Item 4 were approved by the Registrant’s audit committee pursuant to paragraph (c)(7)(i)(C) of Rule 2-01 of Regulation S-X. |
| (f) | Not applicable. |
| (g) | The aggregate non-audit fees billed by the registrant’s accountant for services rendered to the registrant, and rendered to the registrant’s investment adviser, and any entity controlling, controlled by, or under common control with the adviser that provides ongoing services to the registrant for the fiscal year ended May 31, 2019 and May 31, 2020 were $0 and $0, respectively. |
| (h) | Not applicable. |
| Item 5. | Audit Committee of Listed Registrants. |
Not applicable.
| Item 6. | Investments. |
| (a) | Schedule I - Investments in securities of unaffiliated issuers is included as part of the Report to Stockholders filed under Item 1 of this Form N-CSR. |
| (b) | Not applicable. |
3
| Item 7. | Disclosure of Proxy Voting Policies and Procedures for Closed-End Management Investment Companies. |
Not applicable.
| Item 8. | Portfolio Managers of Closed-End Management Investment Companies. |
Not applicable.
| Item 9. | Purchases of Equity Securities by Closed-End Management Investment Company and Affiliated Purchasers. |
Not applicable.
| Item 10. | Submission of Matters to Vote of Security Holders. |
There have been no material changes to the procedures by which shareholders may recommend nominees to the Registrant’s Board of Trustees.
| Item 11. | Controls and Procedures. |
| (a) | The Registrant’s principal executive officer and principal financial officer have concluded that the Registrant’s disclosure controls and procedures (as defined in Rule 30a-3(c) under the Investment Company Act of 1940, as amended) are effective based on their evaluation of these controls and procedures as of a date within 90 days of the filing date of this report. |
| (b) | There was no change in the Registrant's internal control over financial reporting (as defined in Rule 30a-3(d) under the Investment Company Act of 1940, as amended) during the period covered by this report that has materially affected, or is reasonably likely to materially affect, the Registrant's internal control over financial reporting. |
| Item 12. | Disclosure of Securities Lending Activities for Closed-End Management Investment Companies. |
Not applicable.
| Item 13. | Exhibits. |
| (a)(1) | The Code of Ethics that applies to the Registrant’s principal executive officer and principal financial officer is attached hereto as Exhibit 13.A.1. |
| (a)(2) | The certifications required by Rule 30a-2(a) of the Investment Company Act of 1940, as amended, and Section 302 of the Sarbanes-Oxley Act of 2002 are attached hereto as Exhibit 99.Cert. |
4
| (a)(3) | None. |
| (a)(4) | Not applicable. |
5
SIGNATURES
Pursuant to the requirements of the Securities Exchange Act of 1934 and the Investment Company Act of 1940, the Registrant has duly caused this report to be signed on its behalf by the undersigned, thereunto duly authorized.
| Stone Harbor Investment Funds | |||
| By: | /s/ Peter J. Wilby | ||
| Peter J. Wilby | |||
| President and Chief Executive Officer/Principal Executive Officer | |||
| Date: | August 6, 2020 | ||
Pursuant to the requirements of the Securities Exchange Act of 1934 and the Investment Company Act of 1940, this report has been signed below by the following persons on behalf of the Registrant and in the capacities and on the dates indicated.
| Stone Harbor Investment Funds | |||
| By: | /s/ Peter J. Wilby | ||
| Peter J. Wilby | |||
| President and Chief Executive Officer/Principal Executive Officer | |||
| Date: | August 6, 2020 | ||
| By: | /s/ Thomas M. Reynolds | ||
| Thomas M. Reynolds | |||
| Principal Financial Officer/Principal Accounting Officer | |||
| Date: | August 6, 2020 | ||
6