UNITED STATES
SECURITIES AND EXCHANGE COMMISSION
Washington, D.C. 20549
FORM N-CSR
CERTIFIED SHAREHOLDER REPORT OF REGISTERED MANAGEMENT
INVESTMENT COMPANIES
Investment Company Act file number 811-22041
|
| Gabelli 787 Fund, Inc. |
| (Exact name of registrant as specified in charter) |
|
| One Corporate Center |
| Rye, New York 10580-1422 |
| (Address of principal executive offices) (Zip code) |
|
| Bruce N. Alpert |
| Gabelli Funds, LLC |
| One Corporate Center |
| Rye, New York 10580-1422 |
| (Name and address of agent for service) |
Registrant’s telephone number, including area code: 1-800-422-3554
Date of fiscal year end: October 31
Date of reporting period: October 31, 2017
Form N-CSR is to be used by management investment companies to file reports with the Commission not later than 10 days after the transmission to stockholders of any report that is required to be transmitted to stockholders under Rule 30e-1 under the Investment Company Act of 1940 (17 CFR 270.30e-1). The Commission may use the information provided on Form N-CSR in its regulatory, disclosure review, inspection, and policymaking roles.
A registrant is required to disclose the information specified by Form N-CSR, and the Commission will make this information public. A registrant is not required to respond to the collection of information contained in Form N-CSR unless the Form displays a currently valid Office of Management and Budget (“OMB”) control number. Please direct comments concerning the accuracy of the information collection burden estimate and any suggestions for reducing the burden to Secretary, Securities and Exchange Commission, 450 Fifth Street, NW, Washington, DC 20549-0609. The OMB has reviewed this collection of information under the clearance requirements of 44 U.S.C. § 3507.
Item 1. Reports to Stockholders.
The Report to Shareholders is attached herewith.
Gabelli Enterprise Mergers and Acquisitions Fund
Annual Report
October 31, 2017
To Our Shareholders,
For the fiscal year ended October 31, 2017, the net asset value (“NAV”) per Class A Share of the Gabelli Enterprise Mergers and Acquisitions Fund increased 10.3% compared with an increase of 23.6% for the Standard & Poor’s (“S&P”) 500 Index. The performance of the ICE Bank of America Merrill Lynch 3 Month U.S. Treasury Bill Index for this year was 0.7%. See page 5 for additional performance information.
Enclosed are the financial statements, including the schedule of investments, as of October 31, 2017.
Performance Discussion (Unaudited)
In the first nine months of 2017, global deal activity increased 3% on a year over year basis, totaling $2.4 trillion. Overall, flat deal activity was offset by a 9% increase in the number of deals valued at more than $1 billion and an 18% increase in the number of deals announced in the United States. This was a continuation of strong volumes in the fourth quarter of 2016, when global deal volume totaled $1.2 trillion, a 50% increase over the third quarter.
Cross border merger and acquisitions (M&A) activity totaled $943.3 billion during the first nine months of 2017, the highest level reached in the first nine months of a year since 2015. This surge in cross border transaction activity was driven by outbound U.S. acquirers and regional E.U. deal making. M&A activity in Europe totaled $629.3 billion during the first nine months of the year, up 29% on a year over year basis. Although U.S. acquirers hunted the globe for asset bargains, Chinese acquirers slowed their appetite for foreign assets as China outbound M&A declined 27% compared to the first nine months of 2016.
The Energy & Power sector continued to fuel M&A activity over the first nine months of 2017. Deal activity in the space totaled $369.8 billion, up 7% on a year over year basis. The Industrials sector meaningfully contributed to M&A activity in the first nine months of 2017, accounting for 13.9% of overall merger activity. The Materials and Technology sectors experienced declines in volumes.
The robust M&A market has benefitted the Fund in that we have invested in dozens of situations across industries and globally. In addition, the buy-and-hold component of the Fund has performed well in light of an increasing number of firms undergoing various types of financial engineering and the markets recognizing the underlying value of our investments.
The Federal Reserve has been slowly raising interest rates during 2017. A deal spread is comprised of two main factors – the risk free rate and the risks inherent to the deal. Historically, rising interest rates have resulted in higher spreads.
Selected deals that closed during the Fund’s fiscal year
Rackspace Hosting Inc. (RAX) is a San Antonio, Texas based information technology company. Rackspace specializes in cloud computing technology and storage. On August 26, 2016 Apollo Global with Searchlight Capital made a $32 cash per share offer for the company. The merger valued RAX at $4.3 billion and was subject to traditional regulatory approval and a shareholder vote. The deal closed on November 3, 2016.
Cepheid (CPHD) is a medical diagnostic and testing equipment company based in Sunnyvale, California. On September 6, 2016, Danaher agreed to acquire Cepheid for $53 cash per share, or $4 billion, in order to expand its molecular diagnostics business. The merger received the necessary regulatory and shareholder approvals and closed on November 4, 2016.
NetSuite Inc. (N) is a San Mateo, California based technology company. NetSuite provides cloud-based software to enterprise clients. The software suite features products for financial management, customer relationship management, e-commerce and retail management, commerce marketing automation, professional services automation and human resources. On July 28, 2016, Oracle entered into an agreement to acquire N for $109 cash per share. This tender valued the company at $8.8 billion, and the transaction was subject to customary regulatory and shareholder approvals. The deal closed on November 7, 2016
National Interstate Corp. (NATL), based in Richfield, Ohio, operates as a property and casualty insurance company for the transportation industry. After a failed attempt in 2014, American Financial Group, NATL’s majority owner, entered into an agreement to acquire NATL for $32 cash per share plus a $0.50 special dividend. The deal came after months of negotiations. Subject to customary regulatory and shareholder approvals, the merger closed on November 10, 2016.
Cvent Inc. (CVT) is a Tysons Corner, Virginia based software company. Cvent specializes in enterprise event management through its use of cloud-based software. Vista Equity Partners made a $36 per share bid for the company on April 18, 2016. This valued CVT at $1.65 billion and was subject to customary regulatory and shareholder approvals. The deal closed on November 28, 2016.
LinkedIn Corp. (LNKD) is a Mountain View, California based business. The company operates a professional social network, which currently has over 400 million members. On June 13, 2016, Microsoft made a $196 cash per share offer to acquire the company for a total cost of $26 billion. The deal received the necessary shareholder and regulatory approvals and closed on December 8, 2016.
The Empire District Electric Company (EDE) is a regulated utility company with operations in Missouri, Kansas, Oklahoma, and Arkansas. On February 9, 2016, EDE entered into an agreement to be acquired by Algonquin Power & Utilities Corp. for $34 cash per share. This transaction valued EDE at $2.4 billion dollars, and was subject to regulatory approval and shareholder votes. The merger closed on January 1, 2017.
Media General Inc. (MRG) is a Richmond, Virginia based multimedia company. MRG provides news and entertainment through its broadcast and digital platforms. On September 28, 2015, Nexstar Broadcasting Group Inc. announced a proposal to acquire Media General for $10.50 per share in cash and a fixed ratio of 0.1249 Nexstar share per Media General share. The offer also included one contingent value right based on proceeds from the FCC spectrum auction. This deal came after Media General attempted to acquire Meredith Corporation in a merger of equals. All in, the transaction was valued at $4.6 billion and closed on January 17, 2017.
Team Health Holdings Inc. (TMH) is a Knoxville, Tennessee based healthcare facility company. The company provides professional medical staff sourcing to hospitals and other healthcare providers across the United States. On October 31, 2016, the firm entered into a deal with The Blackstone Group for a $43.50 cash per share merger. This valued TMH at $6.1 billion. The deal was subject to both regulatory and shareholder approvals, with the addition of a “go-shop” period and closed on February 7, 2017.
2
LifeLock Inc. (LOCK) is a Tempe, Arizona based provider of identity theft protection services. On November 20, 2016, LifeLock agreed to be acquired by Symantec Corp. for $24 cash per share or $2.3 billion in enterprise value. The transaction was subject to both shareholder vote and regulatory approvals and closed on February 9, 2017.
Ariad Pharmaceuticals Inc. (ARIA) is a Cambridge, Massachusetts based oncology company that develops and commercializes medicine for cancer treatment. On January 9, 2017, Ariad agreed to be acquired by Takeda Pharmaceuticals for $24.00 cash per share. The tender offer valued Ariad at $5.2 billion and was subject to regulatory approvals and other custom closing conditions. The deal closed February 16, 2017.
Columbia Pipeline Partners LP (CPPL) is a Houston, Texas based natural gas transportation and storage company. CPPL owns, operates pipeline and related midstream assets. On November 1, 2016, the partnership agreed to be acquired by Columbia Pipeline Group Inc., a subsidiary of TransCanada Corp., for $17.00 cash per unit representing an aggregate value of $915 million. The transaction was subject to shareholder vote and regulatory approval and closed on February 17, 2017.
Vascular Solutions Inc. (VASC) is a Minneapolis, Minnesota based medical device company. VASC develops and markets medical diagnostic equipment specializing in cardiovascular treatment. On December 2, 2016, the company agreed to a $56 cash per share merger with Teleflex Inc., valuing VASC at $1 billion. The deal was subject to traditional regulatory and shareholder approvals, and closed on February 21, 2017.
Clarcor Inc. (CLC) is a Franklin, Tennessee based filtration products company. On December 1, 2016, Parker Hannifin announced it would acquire Clarcor for $83 cash per share, or $4.3 billion. The merger closed on March 10, 2017 after receiving the necessary regulatory and shareholder approvals.
Harman International Industries Inc. (HAR) is a Stamford, Connecticut based consumer electronics company. Harman designs and engineers connected products. On November 14, 2016 Harman agreed to be acquired by Samsung Electronics for $112 per share in cash, representing an $8 billion equity value. The deal was subject to shareholder vote and regulatory approvals and closed on March 10, 2017.
Endurance Specialty Holdings Ltd. (ENH) is a Bermuda based holding company that underwrites specialty insurance. It operates in two segments, insurance and reinsurance. On October 5, 2016, the company agreed to be acquired for $93 cash per share by SOMPO Holdings Ltd of Japan. This valued the company at $6.3 billion. The deal was subject to regulatory approval and a shareholder vote and closed on March 29, 2017.
Joy Global Inc. (JOY), a mining equipment company based in Milwaukee, Wisconsin, manufactures mining equipment for the extraction of metals and minerals and also provides clients with the servicing of this machinery. On July 21, 2016, Komatsu entered into a $28.30 cash per share merger with Joy, valued at $2.8 billion. Shareholders approved the deal and the companies received regulatory approvals in various jurisdictions. The deal closed on April 6, 2017.
Zeltiq Aesthetics Inc. (ZLTQ) is a Pleasanton, California based medical technology company that licenses CoolSculpting, a noninvasive body sculpting procedure. ZLTQ agreed to be acquired by Allergan on February 13, 2017 for $56.50 cash per share. The deal required shareholder and regulatory approvals and closed on May 1, 2017.
InvenSense Inc. is a San Jose, California based electronic equipment company that sells motion sensor technology to its customers. InvenSense agreed to be acquired by TDK Corp. on December 21, 2016 for $13 per share or $1.3 billion. The transaction required shareholder and regulatory approvals and closed on May 18, 2017.
3
Syngenta AG (SYT) is a Basel, Switzerland based agricultural chemicals company. On February 3, 2016 Syngenta agreed to be acquired by ChemChina for $465 cash per share plus a CHF 5 special dividend. The tender offer was contingent upon SYT shareholders meeting the minimum condition and required regulatory approvals. Syngenta and ChemChina closed the deal on May 18, 2017.
Multi Packaging Solutions International Ltd. (MPSX) is a New York, New York, based paper and packaging company. On January 24, 2016, MPSX agreed to be acquired by WestRock for $18 per share in cash, representing a total enterprise value of $2.28 billion. The deal was subject to regulatory and shareholder approvals, and closed June 7, 2017.
AdvancePierre Foods Holdings, Inc. (APFH) is a Blue Ash, Ohio based food processing company that primarily distributes ready-to-eat sandwiches. APFH agreed on April 25, 2017 to be acquired by Tyson Foods, Inc. (TSN) for $40.25 in cash per share in a tender offer. The transaction required APFH shareholders to meet the minimum condition of the tender and regulatory approval. APFH and TSN completed the deal on June 8, 2017.
Mead Johnson Nutrition Co. (MJN) is a Chicago, Illinois based nutrition company focused on the distribution of pediatric products. On February 10, 2017, MJN agreed to be acquired by Reckitt Benckiser Group plc for $90 cash per share, which valued the company at $17.9 billion. The deal was subject to regulatory and shareholder approval and closed on June 15, 2017.
Actelion LTD. is an Allschwil, Switzerland based biotech company. Actelion discovers, develops, and distributes drugs targeting pulmonary arterial hypertension. On January 26, 2017, Actelion agreed to be acquired by Johnson & Johnson for $280 cash per share in a $30 billion tender. Immediately prior to the completion of the transaction, Actelion spun out its drug discovery operations into a newly created Swiss Biotech company “Idorsia” which was listed on the SIX Swiss Exchange. The transaction closed June 16, 2017.
Kate Spade & Company (KATE) is a New York, New York based apparel and accessories retailer. On May 8, 2017, KATE agreed to be acquired by Coach Inc. for $18.50 per share in cash, valuing the company at $2.4 billion. The transaction required regulatory approval and a majority of KATE shareholders to tender their shares to Coach. The deal closed on July 12, 2017.
Panera Bread Co. (PNRA) is a St. Louis, Missouri based fast casual restaurant chain. On April 5, 2017, PNRA agreed to be acquired by JAB Holding Company for $315 per share in cash, which valued the company at $7.5 billion. The deal required regulatory and shareholder approvals and subsequently closed on July 18, 2017.
Gas Natural Inc. (EGAS) is a Cleveland, Ohio based natural gas utility that distributes over 20 billion cubic feet of natural gas annually to its customers. On October 10, 2016, EGAS agreed to be acquired by First Reserve Energy Infrastructure Fund for $13.10 per share in cash, representing a $196 million total enterprise value. First Reserve Energy Infrastructure Fund was subsequently acquired by BlackRock Real Assets on June 5, 2017. After receiving the approval from EGAS shareholders, BlackRock Real Assets closed the merger on August 4, 2017.
VCA Animal Hospital Inc. (WOOF) is a Los Angeles, California based veterinary hospitals operator. On January 9, 2017, WOOF agreed to be acquired by Mars, Inc. for $93 per share in cash. Mars also operates animal hospitals. The deal valued WOOF at $7.7 billion and required regulatory and shareholder approvals. It closed on September 13, 2017.
We appreciate your continuing confidence and trust.
4
Comparative Results
| | | | | | | | | | | | | | | | |
Average Annual Returns through October 31, 2017 (a)(b) (Unaudited) | | | Since | |
| | | | | | | | | | | | Inception | |
| | | 1 Year | | | 5 Year | | | 10 Year | | | (2/28/01) | |
Class A (EMAAX) | | | 10.34% | | | | 6.13% | | | | 2.94% | | | | 4.57% | |
With sales charge (c) | | | 3.99 | | | | 4.88 | | | | 2.33 | | | | 4.20 | |
Class AAA (EAAAX) | | | 10.65 | | | | 6.34 | | | | 3.10 | | | | 10.40 | |
Class C (EMACX) | | | 9.73 | | | | 5.55 | | | | 2.37 | | | | 3.99 | |
With contingent deferred sales charge (d) | | | 8.73 | | | | 5.55 | | | | 2.37 | | | | 3.99 | |
Class T (EMATX) | | | 10.49 | | | | 6.16 | | | | 2.95 | | | | 4.57 | |
With sales charge (e) | | | 7.72 | | | | 5.62 | | | | 2.69 | | | | 4.41 | |
Class Y (EMAYX) | | | 10.87 | | | | 6.61 | | | | 3.41 | | | | 11.26 | |
S&P 500 Index | | | 23.63 | | | | 15.18 | | | | 7.51 | | | | 6.58 | |
Lipper U.S. Treasury Money Market Fund Average | | | 0.33 | | | | 0.08 | | | | 0.23 | | | | 1.06 | |
ICE Bank of America Merrill Lynch 3 Month U.S. Treasury Bill Index | | | 0.72 | | | | 0.24 | | | | 0.45 | | | | 1.44 | |
In the current prospectuses dated February 28, 2017, as amended June 30, 2017, the Fund’s expense ratios are 1.52%, 1.72%, 2.27%, 1.52%, and 1.27% for the Class AAA, A, C, T, and Y Shares, respectively. See page 14 for the expense ratios for the year ended October 31, 2017. Class AAA and Class Y Shares have no sales charge. The maximum sales charge for Class A Shares, Class C Shares, and Class T Shares is 5.75%, 1.00%, and 2.50%, respectively. | |
| | (a) | Returns represent past performance and do not guarantee future results. Total returns and average annual returns reflect changes in share price, reinvestment of distributions, and are net of expenses. Investment returns and the principal value of an investment will fluctuate. When shares are redeemed, they may be worth more or less than their original cost. Current performance may be lower or higher than the performance data presented. Visit www.gabelli.com for performance information as of the most recent month end. The Fund imposes a 2% redemption fee on shares sold or exchanged within seven days of purchase. Investors should carefully consider the investment objectives, risks, sales charges, and expenses of the Fund before investing. The prospectuses contain information about these and other matters and should be read carefully before investing. To obtain a prospectus, please visit our website at www.gabelli.com. The Class A Share NAVs are used to calculate the performance for the periods prior to the issuance of Class AAA Shares on February 26, 2010 and Class T Shares on June 30, 2017. The actual performance for the Class AAA Shares and Class T Shares would have been higher due to lower expenses associated with these share classes. The S&P 500 Index is a market capitalization weighted index of 500 large capitalization stocks commonly used to represent the U.S. equity market. The Lipper U.S. Treasury Money Market Fund Average reflects the average performance of mutual funds classified in this particular category. The ICE Bank of America Merrill Lynch 3 Month U.S. Treasury Bill Index is comprised of a single issue purchased at the beginning of the month and held for a full month. At the end of the month, that issue is sold and rolled into the outstanding Treasury Bill that matures closest to, but not beyond three months from the rebalancing date. To qualify for selection, an issue must have settled on or before the rebalancing (month end) date. Dividends are considered reinvested except for the ICE Bank of America Merrill Lynch 3 Month U.S. Treasury Bill Index. You cannot invest directly in an index. | |
| | (b) | The Fund’s fiscal year ends October 31. |
| | (c) | Performance results include the effect of the maximum 5.75% sales charge at the beginning of the period. | |
| | (d) | Assuming payment of the 1% maximum contingent deferred sales charge imposed on redemptions made within one year of purchase. | |
| | (e) | Performance results include the effect of the maximum 2.50% sales charge at the beginning of the period. | |
COMPARISON OF CHANGE IN VALUE OF A $10,000 INVESTMENT IN THE GABELLI ENTERPRISE
MERGERS AND ACQUISITIONS FUND (CLASS A SHARES) AND THE S&P 500 INDEX (Unaudited)
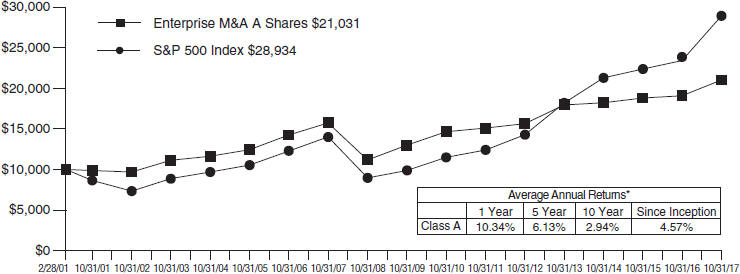
| * | Past performance is not predictive of future results. The performance tables and graph do not reflect the deduction of taxes that a shareholder would pay on fund distributions or the redemption of fund shares. |
5
| | | | |
| Gabelli Enterprise Mergers and Acquisitions Fund | | | | |
| Disclosure of Fund Expenses (Unaudited) | | | | |
| For the Six Month Period from May 1, 2017 through October 31, 2017 | | | Expense Table | |
We believe it is important for you to understand the impact of fees and expenses regarding your investment. All mutual funds have operating expenses. As a shareholder of a fund, you incur ongoing costs, which include costs for portfolio management, administrative services, and shareholder reports (like this one), among others. Operating expenses, which are deducted from a fund’s gross income, directly reduce the investment return of a fund. When a fund’s expenses are expressed as a percentage of its average net assets, this figure is known as the expense ratio. The following examples are intended to help you understand the ongoing costs (in dollars) of investing in your Fund and to compare these costs with those of other mutual funds. The examples are based on an investment of $1,000 made at the beginning of the period shown and held for the entire period.
The Expense Table below illustrates your Fund’s costs in two ways:
Actual Fund Return: This section provides information about actual account values and actual expenses. You may use this section to help you to estimate the actual expenses that you paid over the period after any fee waivers and expense reimbursements. The “Ending Account Value” shown is derived from the Fund’s actual return during the past six months, and the “Expenses Paid During Period” shows the dollar amount that would have been paid by an investor who started with $1,000 in the Fund. You may use this information, together with the amount you invested, to estimate the expenses that you paid over the period.
To do so, simply divide your account value by $1,000 (for example, an $8,600 account value divided by $1,000 = 8.6), then multiply the result by the number given for your Fund under the heading “Expenses Paid During Period” to estimate the expenses you paid during this period.
Hypothetical 5% Return: This section provides information about hypothetical account values and hypothetical expenses based on the Fund’s actual expense ratio. It assumes a hypothetical annualized return of 5% before expenses during the period shown. In this
case – because the hypothetical return used is not the Fund’s actual return – the results do not apply to your investment and you cannot use the hypothetical account value and expense to estimate the actual ending account balance or expenses you paid for the period. This example is useful in making comparisons of the ongoing costs of investing in the Fund and other funds. To do so, compare this 5% hypothetical example with the 5% hypothetical examples that appear in shareholder reports of other funds.
Please note that the expenses shown in the table are meant to highlight your ongoing costs only and do not reflect any transactional costs such as sales charges (loads), redemption fees, or exchange fees, if any, which are described in the Prospectus. If these costs were applied to your account, your costs would be higher. Therefore, the 5% hypothetical return is useful in comparing ongoing costs only, and will not help you determine the relative total costs of owning different funds. The “Annualized Expense Ratio” represents the actual expenses for the last six months and may be different from the expense ratio in the Financial Highlights which is for the year ended October 31, 2017.
| | | | | | | | | | | | |
| | | Beginning | | Ending | | Annualized | | | Expenses | |
| | | Account Value | | Account Value | | Expense | | | Paid During | |
| | | 05/01/17 | | 10/31/17 | | Ratio | | | Period* | |
Gabelli Enterprise Mergers and Acquisitions Fund | | | | | |
Actual Fund Return | |
Class AAA | | $1,000.00 | | $1,019.80 | | | 1.52% | | | | $ 7.74 | |
Class A | | $1,000.00 | | $1,018.70 | | | 1.72% | | | | $ 8.75 | |
Class C | | $1,000.00 | | $1,015.80 | | | 2.27% | | | | $11.53 | |
Class T** | | $1,000.00 | | $1,012.40 | | | 1.51% | | | | $ 5.16 | |
Class Y | | $1,000.00 | | $1,020.80 | | | 1.27% | | | | $ 6.47 | |
Hypothetical 5% Return | | | | | | | | |
Class AAA | | $1,000.00 | | $1,017.54 | | | 1.52% | | | | $ 7.73 | |
Class A | | $1,000.00 | | $1,016.53 | | | 1.72% | | | | $ 8.74 | |
Class C | | $1,000.00 | | $1,013.76 | | | 2.27% | | | | $11.52 | |
Class T | | $1,000.00 | | $1,017.59 | | | 1.51% | | | | $ 7.68 | |
Class Y | | $1,000.00 | | $1,018.80 | | | 1.27% | | | | $ 6.46 | |
| * | Expenses are equal to the Fund’s annualized expense ratio for the last six months multiplied by the average account value over the period, multiplied by the number of days in the most recent fiscal half year (184 days), then divided by 365. |
| ** | Class T Shares use a beginning account value date of 06/30/17, and Class T Share expenses are equal to the Fund’s annualized expense ratio for the period since inception multiplied by the number of days since inception (124 days), then divided by 365. |
6
Summary of Portfolio Holdings (Unaudited)
The following table presents portfolio holdings as a percent of net assets as of October 31, 2017:
Gabelli Enterprise Mergers and Acquisitions Fund
| | | | |
U.S. Government Obligations | | | 30.9 | % |
Health Care. | | | 8.3 | % |
Media | | | 5.7 | % |
Wireless Communications | | | 5.3 | % |
Energy and Utilities | | | 5.0 | % |
Food and Beverage | | | 3.7 | % |
Cable and Satellite | | | 3.6 | % |
Financial Services | | | 3.5 | % |
Telecommunications | | | 3.3 | % |
Retail | | | 3.2 | % |
Diversified Industrial | | | 2.9 | % |
Transportation | | | 2.6 | % |
Aerospace and Defense | | | 2.3 | % |
Building and Construction | | | 2.3 | % |
Specialty Chemicals | | | 2.1 | % |
| | | | |
Business Services | | | 1.9 | % |
Hotels and Gaming | | | 1.9 | % |
Computer Software and Services | | | 1.8 | % |
Communications Equipment | | | 1.3 | % |
Equipment and Supplies | | | 1.3 | % |
Semiconductors | | | 1.2 | % |
Broadcasting | | | 1.0 | % |
Consumer Services | | | 1.0 | % |
Machinery | | | 0.9 | % |
Automotive: Parts and Accessories | | | 0.5 | % |
Entertainment | | | 0.5 | % |
Metals and Mining | | | 0.4 | % |
Consumer Products | | | 0.2 | % |
Containers and Packaging | | | 0.2 | % |
Other Assets and Liabilities (Net) | | | 1.2 | % |
Paper and Forest Products | | | 0.0 | %* |
| | | | |
| | | 100.0 | % |
| | | | |
| * | Amount represents less than 0.05%. |
The Fund files a complete schedule of portfolio holdings with the Securities and Exchange Commission (the “SEC”) for the first and third quarters of each fiscal year on Form N-Q. Shareholders may obtain this information at www.gabelli.com or by calling the Fund at 800-GABELLI (800-422-3554).The Fund’s Form N-Q is available on the SEC’s website at www.sec.gov and may also be reviewed and copied at the SEC’s Public Reference Room in Washington, DC. Information on the operation of the Public Reference Room may be obtained by calling 800-SEC-0330.
Proxy Voting
The Fund files Form N-PX with its complete proxy voting record for the twelve months ended June 30, no later than August 31 of each year. A description of the Fund’s proxy voting policies, procedures, and how the Fund voted proxies relating to portfolio securities is available without charge, upon request, by (i) calling 800-GABELLI (800-422-3554); (ii) writing to The Gabelli Funds at One Corporate Center, Rye, NY 10580-1422; or (iii) visiting the SEC’s website at www.sec.gov.
7
Gabelli Enterprise Mergers and Acquisitions Fund
Schedule of Investments — October 31, 2017
| | | | | | | | | | |
Shares | | | | Cost | | | Market
Value | |
| | COMMON STOCKS — 67.7% | |
| | Aerospace and Defense — 2.3% | |
| 10,000 | | Arconic Inc. | | $ | 218,979 | | | $ | 251,200 | |
| 40,000 | | Kaman Corp. | | | 1,361,916 | | | | 2,237,600 | |
| 8,600 | | Orbital ATK Inc. | | | 1,133,032 | | | | 1,143,198 | |
| 900 | | Rockwell Collins Inc. | | | 118,267 | | | | 122,040 | |
| | | | | | | | | | |
| | | | | 2,832,194 | | | | 3,754,038 | |
| | | | | | | | | | |
| |
| | Automotive: Parts and Accessories — 0.5% | |
| 10,000 | | Federal-Mogul Holdings Corp.†(a) | | | 90,132 | | | | 100,000 | |
| 24,000 | | Haldex AB† | | | 288,867 | | | | 266,614 | |
| 7,800 | | Tenneco Inc. | | | 24,840 | | | | 453,258 | |
| | | | | | | | | | |
| | | | | 403,839 | | | | 819,872 | |
| | | | | | | | | | |
| | | |
| | Broadcasting — 1.0% | | | | | | | | |
| 40,000 | | Tribune Media Co., Cl. A | | | 1,575,978 | | | | 1,637,200 | |
| | | | | | | | | | |
| |
| | Building and Construction — 2.3% | |
| 500 | | ASH Grove Cement Co | | | 258,646 | | | | 257,500 | |
| 3,000 | | Cadus Corp.† | | | 3,615 | | | | 3,840 | |
| 52,000 | | Griffon Corp. | | | 442,000 | | | | 1,172,600 | |
| 10,000 | | Nobility Homes Inc. | | | 133,178 | | | | 172,000 | |
| 14,000 | | Norbord Inc. | | | 318,662 | | | | 504,612 | |
| 4,000 | | Polaris Materials Corp.† | | | 11,184 | | | | 10,542 | |
| 17,000 | | Skyline Corp.† | | | 92,454 | | | | 212,330 | |
| 11,000 | | Vulcan Materials Co. | | | 432,608 | | | | 1,339,250 | |
| | | | | | | | | | |
| | | | | 1,692,347 | | | | 3,672,674 | |
| | | | | | | | | | |
| |
| | Business Services — 1.9% | |
| 185,000 | | Clear Channel Outdoor Holdings Inc., Cl. A. | | | 1,298,261 | | | | 703,000 | |
| 165,000 | | Gerber Scientific Inc., Escrow†(a) | | | 0 | | | | 0 | |
| 95,000 | | The Interpublic Group of Companies Inc. | | | 1,851,011 | | | | 1,828,750 | |
| 1,111 | | Vectrus Inc.†. | | | 19,941 | | | | 33,897 | |
| 2,000 | | XPO Logistics Europe SA† | | | 484,562 | | | | 545,150 | |
| | | | | | | | | | |
| | | | | 3,653,775 | | | | 3,110,797 | |
| | | | | | | | | | |
| |
| | Cable and Satellite — 3.6% | |
| 3,000 | | AMC Entertainment Holdings Inc., Cl. A | | | 103,800 | | | | 41,700 | |
| 20,000 | | DISH Network Corp., Cl. A† | | | 386,434 | | | | 970,800 | |
| 3,500 | | Liberty Broadband Corp., Cl. A† | | | 15,669 | | | | 301,735 | |
| 5,000 | | Liberty Broadband Corp., Cl. C† | | | 99,781 | | | | 436,450 | |
| 21,000 | | Liberty Global plc, Cl. A† | | | 735,349 | | | | 647,850 | |
| 28,000 | | Liberty Global plc, Cl. C† | | | 994,232 | | | | 836,920 | |
| 8,000 | | Liberty Global plc LiLAC, Cl. A† | | | 223,265 | | | | 173,760 | |
| 10,000 | | Liberty Global plc LiLAC, Cl. C† | | | 218,850 | | | | 220,000 | |
| 3,000 | | Liberty Media Corp.- Liberty Formula One, Cl. A† | | | 7,487 | | | | 109,200 | |
| 3,000 | | Liberty Media Corp.- Liberty Formula One, Cl. C† | | | 9,444 | | | | 114,420 | |
| | | | | | | | | | |
Shares | | | | Cost | | | Market
Value | |
| 6,500 | | Liberty Media Corp.- Liberty SiriusXM, Cl. A† | | $ | 19,439 | | | $ | 271,115 | |
| 6,500 | | Liberty Media Corp.- Liberty SiriusXM, Cl. C† | | | 25,888 | | | | 270,725 | |
| 3,000 | | Scripps Networks Interactive Inc., Cl. A | | | 211,166 | | | | 249,840 | |
| 20,000 | | Shaw Communications Inc., Cl. B. | | | 265,164 | | | | 456,800 | |
| 60,000 | | Sky plc† | | | 764,324 | | | | 751,464 | |
| | | | | | | | | | |
| | | | | 4,080,292 | | | | 5,852,779 | |
| | | | | | | | | | |
| |
| | Communications Equipment — 1.3% | |
| 100,000 | | Brocade Communications Systems Inc. | | | 1,244,247 | | | | 1,165,000 | |
| 37,000 | | Digi International Inc.† | | | 435,634 | | | | 384,800 | |
| 3,000 | | exactEarth Ltd.† | | | 8,613 | | | | 2,465 | |
| 3,500 | | Harris Corp. | | | 273,843 | | | | 487,620 | |
| 6,600 | | Park Electrochemical Corp. | | | 93,217 | | | | 124,608 | |
| | | | | | | | | | |
| | | | | 2,055,554 | | | | 2,164,493 | |
| | | | | | | | | | |
| |
| | Computer Software and Services — 1.8% | |
| 4,000 | | Affecto OYJ | | | 21,205 | | | | 21,014 | |
| 18,200 | | Bankrate Inc.† | | | 252,951 | | | | 252,980 | |
| 4,000 | | BroadSoft Inc.† | | | 217,744 | | | | 219,400 | |
| 4,000 | | Business & Decision† | | | 37,005 | | | | 36,809 | |
| 4,000 | | Dalenys†. | | | 39,140 | | | | 41,422 | |
| 1,000 | | Dell Technologies Inc., Cl. V† | | | 46,886 | | | | 82,770 | |
| 70,000 | | Exa Corp.† | | | 1,694,932 | | | | 1,696,800 | |
| 30,000 | | FalconStor Software Inc.† | | | 56,565 | | | | 7,680 | |
| 13,000 | | Onvia Inc.† | | | 116,415 | | | | 116,675 | |
| 7,000 | | Planet Payment Inc.† | | | 31,360 | | | | 31,290 | |
| 20,000 | | Silver Spring Networks Inc.† | | | 323,218 | | | | 322,400 | |
| 200 | | Synchronoss Technologies Inc.† | | | 3,301 | | | | 2,266 | |
| | | | | | | | | | |
| | | | | 2,840,722 | | | | 2,831,506 | |
| | | | | | | | | | |
| |
| | Consumer Products — 0.2% | |
| 100 | | Accell Group | | | 3,366 | | | | 3,054 | |
| 100,000 | | Avon Products Inc.† | | | 608,280 | | | | 228,000 | |
| 2,000 | | Bang & Olufsen A/S† | | | 20,532 | | | | 46,335 | |
| | | | | | | | | | |
| | | | | 632,178 | | | | 277,389 | |
| | | | | | | | | | |
| |
| | Consumer Services — 1.0% | |
| 2,000 | | Funespana SA† | | | 18,121 | | | | 17,286 | |
| 30,000 | | MoneyGram International Inc.† | | | 487,864 | | | | 466,500 | |
| 30,000 | | Nets A/S† | | | 775,107 | | | | 765,938 | |
| 9,000 | | Rollins Inc. | | | 18,036 | | | | 395,190 | |
| | | | | | | | | | |
| | | | | 1,299,128 | | | | 1,644,914 | |
| | | | | | | | | | |
| |
| | Containers and Packaging — 0.2% | |
| 5,200 | | Greif Inc., Cl. A | | | 216,066 | | | | 288,756 | |
| 1,000 | | Greif Inc., Cl. B | | | 37,738 | | | | 62,850 | |
| | | | | | | | | | |
| | | | | 253,804 | | | | 351,606 | |
| | | | | | | | | | |
| |
| | Diversified Industrial — 2.9% | |
| 213,600 | | Myers Industries Inc. | | | 4,083,688 | | | | 4,613,760 | |
| | | | | | | | | | |
See accompanying notes to financial statements.
8
Gabelli Enterprise Mergers and Acquisitions Fund
Schedule of Investments (Continued) — October 31, 2017
| | | | | | | | | | |
Shares | | | | Cost | | | Market
Value | |
| | COMMON STOCKS (Continued) | | | | | |
| | Energy and Utilities — 4.9% | | | | | |
| 7,000 | | Alerion Cleanpower SpA | | $ | 19,191 | | | $ | 24,853 | |
| 485,000 | | Alvopetro Energy Ltd.† | | | 454,000 | | | | 78,947 | |
| 7,000 | | Anadarko Petroleum Corp | | | 323,159 | | | | 345,590 | |
| 4,000 | | Avangrid Inc. | | | 155,000 | | | | 206,920 | |
| 500 | | Avista Corp. | | | 26,164 | | | | 26,120 | |
| 14,000 | | Calpine Corp.† | | | 207,406 | | | | 209,160 | |
| 38,000 | | Endesa SA | | | 1,064,270 | | | | 869,793 | |
| 200 | | Etablissements Maurel et Prom† | | | 874 | | | | 848 | |
| 75,000 | | GenOn Energy Inc., Escrow†(a) | | | 0 | | | | 0 | |
| 255,000 | | Gulf Coast Ultra Deep Royalty Trust | | | 370,833 | | | | 9,180 | |
| 3,081 | | Noble Energy Inc. | | | 111,781 | | | | 85,868 | |
| 11,000 | | NorthWestern Corp. | | | 304,065 | | | | 652,080 | |
| 10,000 | | Severn Trent plc. | | | 277,722 | | | | 280,371 | |
| 1,000 | | Southwest Gas Holdings Inc. | | | 34,833 | | | | 82,390 | |
| 10,000 | | TerraForm Global Inc., Cl. A† | | | 49,425 | | | | 48,750 | |
| 87,500 | | Westar Energy Inc. | | | 4,936,945 | | | | 4,679,500 | |
| 1,000 | | WGL Holdings Inc. | | | 82,503 | | | | 85,700 | |
| 25,000 | | Whiting Petroleum Corp.† | | | 193,715 | | | | 150,250 | |
| | | | | | | | | | |
| | | | | 8,611,886 | | | | 7,836,320 | |
| | | | | | | | | | |
| |
| | Entertainment — 0.5% | |
| 3,600 | | Discovery Communications Inc., Cl. A† | | | 26,174 | | | | 67,968 | |
| 10,800 | | Discovery Communications Inc., Cl. C† | | | 60,976 | | | | 192,348 | |
| 180,000 | | Dover Motorsports Inc | | | 667,976 | | | | 351,000 | |
| 8,140 | | Lions Gate Entertainment Corp., Cl. B† | | | 212,454 | | | | 225,152 | |
| | | | | | | | | | |
| | | | | 967,580 | | | | 836,468 | |
| | | | | | | | | | |
| |
| | Equipment and Supplies — 1.3% | |
| 47,300 | | Axis Communications AB | | | 1,895,619 | | | | 2,070,733 | |
| | | | | | | | | | |
| |
| | Financial Services — 3.5% | |
| 1,400 | | Argo Group International Holdings Ltd. | | | 28,231 | | | | 88,130 | |
| 1,000 | | Aspen Insurance Holdings Ltd. | | | 43,388 | | | | 42,900 | |
| 4,600 | | BKF Capital Group Inc.† | | | 180,582 | | | | 40,250 | |
| 2,000 | | Fidelity & Guaranty Life | | | 61,350 | | | | 62,200 | |
| 318,000 | | Fortress Investment Group LLC, Cl. A | | | 2,489,110 | | | | 2,483,580 | |
| 101 | | Horizon Bancorp | | | 2,906 | | | | 2,780 | |
| 3,000 | | Kinnevik AB, Cl. A | | | 103,561 | | | | 104,316 | |
| 90,000 | | Navient Corp. | | | 849,595 | | | | 1,121,400 | |
| 100 | | Patriot National Inc.† | | | 968 | | | | 128 | |
| 100,000 | | SLM Corp.† | | | 573,264 | | | | 1,059,000 | |
| 1,600 | | SLM Solutions Group AG† | | | 55,332 | | | | 66,163 | |
| 20,025 | | Sterling Bancorp | | | 201,872 | | | | 501,626 | |
| 400 | | Topdanmark A/S† | | | 11,380 | | | | 16,443 | |
| | | | | | | | | | |
| | | | | 4,601,539 | | | | 5,588,916 | |
| | | | | | | | | | |
| | | | | | | | | | |
Shares | | | | Cost | | | Market
Value | |
| |
| | Food and Beverage — 3.7% | |
| 4,500 | | Flowers Foods Inc. | | $ | 10,669 | | | $ | 85,635 | |
| 30,000 | | GrainCorp Ltd., Cl. A | | | 341,966 | | | | 195,165 | |
| 17,000 | | Inventure Foods Inc.† | | | 67,790 | | | | 68,000 | |
| 10,000 | | Mondele¯z International Inc., Cl. A | | | 425,100 | | | | 414,300 | |
| 575,000 | | Parmalat SpA | | | 2,014,649 | | | | 2,176,813 | |
| 2,000,000 | | Premier Foods plc† | | | 1,376,332 | | | | 1,042,594 | |
| 22,500 | | Refresco Group NV | | | 524,165 | | | | 520,251 | |
| 4,650 | | Snyder’s-Lance Inc. | | | 152,288 | | | | 174,980 | |
| 1,500 | | The Hershey Co. | | | 142,995 | | | | 159,270 | |
| 30,000 | | Tootsie Roll Industries Inc. | | | 601,770 | | | | 1,068,000 | |
| 450,000 | | Yashili International Holdings Ltd.† | | | 189,692 | | | | 100,943 | |
| | | | | | | | | | |
| | | | | 5,847,416 | | | | 6,005,951 | |
| | | | | | | | | | |
| |
| | Health Care — 8.3% | |
| 12,000 | | Advanced Accelerator Applications SA, ADR† | | | 968,563 | | | | 972,000 | |
| 50,000 | | Akorn Inc.† | | | 1,661,230 | | | | 1,628,500 | |
| 6,000 | | Allergan plc. | | | 1,434,673 | | | | 1,063,380 | |
| 30,000 | | AstraZeneca plc, ADR | | | 1,089,353 | | | | 1,035,000 | |
| 3,200 | | Bio-Rad Laboratories Inc., Cl. A† | | | 314,726 | | | | 703,328 | |
| 11,000 | | Bristol-Myers Squibb Co. | | | 348,381 | | | | 678,260 | |
| 600 | | Chemed Corp. | | | 18,287 | | | | 134,058 | |
| 2,500 | | Cigna Corp. | | | 340,899 | | | | 493,050 | |
| 4,000 | | CR Bard Inc. | | | 1,227,232 | | | | 1,308,280 | |
| 7,000 | | Depomed Inc.† | | | 99,128 | | | | 33,880 | |
| 500 | | Dimension Therapeutics Inc.† | | | 2,990 | | | | 3,000 | |
| 14,000 | | Enzymotec Ltd.† | | | 165,095 | | | | 164,500 | |
| 29,000 | | Exactech Inc.† | | | 985,284 | | | | 1,213,650 | |
| 8,000 | | Grifols SA, ADR | | | 53,680 | | | | 189,200 | |
| 1,200 | | Humana Inc. | | | 215,421 | | | | 306,420 | |
| 5,700 | | ICU Medical Inc.† | | | 365,322 | | | | 1,089,270 | |
| 10,000 | | Idorsia Ltd.† | | | 102,950 | | | | 196,963 | |
| 3,000 | | Illumina Inc.† | | | 157,770 | | | | 615,570 | |
| 6,000 | | Mylan NV† | | | 293,980 | | | | 214,260 | |
| 1,000 | | NxStage Medical Inc.† | | | 29,305 | | | | 26,950 | |
| 24,000 | | Omega Protein Corp. | | | 527,503 | | | | 525,600 | |
| 3,000 | | Perrigo Co. plc. | | | 276,734 | | | | 242,970 | |
| 7,500 | | PharMerica Corp.† | | | 216,862 | | | | 219,750 | |
| 6,000 | | Smith & Nephew plc, ADR | | | 206,505 | | | | 229,560 | |
| 3,500 | | VWR Corp.† | | | 115,868 | | | | 115,850 | |
| | | | | | | | | | |
| | | | | 11,217,741 | | | | 13,403,249 | |
| | | | | | | | | | |
| |
| | Hotels and Gaming — 1.9% | |
| 20,000 | | Belmond Ltd., Cl. A† | | | 224,642 | | | | 263,000 | |
| 400 | | Churchill Downs Inc. | | | 13,096 | | | | 83,420 | |
| 2,000 | | Eldorado Resorts Inc.† | | | 9,768 | | | | 51,400 | |
| 1,000 | | Mantra Group Ltd. | | | 2,968 | | | | 2,985 | |
| 78,000 | | NYX Gaming Group Ltd.† | | | 149,526 | | | | 142,687 | |
| 38,000 | | Ryman Hospitality Properties Inc. | | | 1,354,565 | | | | 2,512,940 | |
| | | | | | | | | | |
| | | | | 1,754,565 | | | | 3,056,432 | |
| | | | | | | | | | |
See accompanying notes to financial statements.
9
Gabelli Enterprise Mergers and Acquisitions Fund
Schedule of Investments (Continued) — October 31, 2017
| | | | | | | | | | |
Shares | | | | Cost | | | Market
Value | |
| | COMMON STOCKS (Continued) | | | | | | | | |
| | Machinery — 0.9% | | | | | | | | |
| 2,500 | | CIRCOR International Inc. | | $ | 100,067 | | | $ | 109,875 | |
| 30,000 | | CNH Industrial NV | | | 270,583 | | | | 383,352 | |
| 14,000 | | Xylem Inc. | | | 356,501 | | | | 931,420 | |
| | | | | | | | | | |
| | | | | 727,151 | | | | 1,424,647 | |
| | | | | | | | | | |
| | | |
| | Media — 5.7% | | | | | | | | |
| 3,000 | | Telegraaf Media Groep NV† | | | 19,115 | | | | 19,919 | |
| 63,000 | | Telenet Group Holding NV† | | | 2,852,898 | | | | 4,357,632 | |
| 50,000 | | The E.W. Scripps Co., Cl. A† | | | 853,140 | | | | 867,000 | |
| 40,000 | | Time Warner Inc. | | | 3,686,311 | | | | 3,931,600 | |
| 2,000 | | tronc Inc.† | | | 22,980 | | | | 29,570 | |
| | | | | | | | | | |
| | | | | 7,434,444 | | | | 9,205,721 | |
| | | | | | | | | | |
| | | |
| | Metals and Mining — 0.4% | | | | | | | | |
| 40,000 | | Alamos Gold Inc., Cl. A | | | 530,476 | | | | 252,800 | |
| 17,752 | | AuRico Metals Inc.† | | | 9,447 | | | | 17,888 | |
| 3,000 | | Dominion Diamond Corp. | | | 42,188 | | | | 42,749 | |
| 19,000 | | Pan American Silver Corp. | | | 298,459 | | | | 310,457 | |
| | | | | | | | | | |
| | | | | 880,570 | | | | 623,894 | |
| | | | | | | | | | |
| | | |
| | Paper and Forest Products — 0.0% | | | | | | | | |
| 17,000 | | Tembec Inc.† | | | 54,038 | | | | 61,801 | |
| | | | | | | | | | |
| | | |
| | Retail — 3.1% | | | | | | | | |
| 4,000 | | Aaron’s Inc. | | | 113,021 | | | | 147,200 | |
| 42,500 | | Bob Evans Farms Inc. | | | 3,283,430 | | | | 3,280,575 | |
| 38,000 | | Jimmy Choo plc† | | | 114,129 | | | | 116,080 | |
| 330,000 | | Rite Aid Corp.† | | | 2,633,723 | | | | 544,500 | |
| 6,000 | | SpartanNash Co. | | | 60,130 | | | | 147,300 | |
| 29,000 | | Village Super Market Inc., Cl. A | | | 662,626 | | | | 695,710 | |
| | | | | | | | | | |
| | | | | 6,867,059 | | | | 4,931,365 | |
| | | | | | | | | | |
| | | |
| | Semiconductors — 1.2% | | | | | | | | |
| 14,800 | | AIXTRON SE† | | | 60,369 | | | | 231,013 | |
| 10,000 | | IXYS Corp.† | | | 219,496 | | | | 247,000 | |
| 1,000 | | MoSys Inc.† | | | 39,042 | | | | 660 | |
| 13,000 | | NXP Semiconductors NV† | | | 1,286,564 | | | | 1,521,650 | |
| | | | | | | | | | |
| | | | | 1,605,471 | | | | 2,000,323 | |
| | | | | | | | | | |
| | | |
| | Specialty Chemicals — 2.1% | | | | | | | | |
| 88,662 | | Calgon Carbon Corp. | | | 1,899,544 | | | | 1,923,965 | |
| 7,000 | | Ferro Corp.† | | | 98,512 | | | | 166,740 | |
| 1,500 | | Linde AG. | | | 248,756 | | | | 323,945 | |
| 4,000 | | Monsanto Co. | | | 411,181 | | | | 484,400 | |
| 32,000 | | SGL Carbon SE† | | | 597,350 | | | | 502,656 | |
| | | | | | | | | | |
| | | | | 3,255,343 | | | | 3,401,706 | |
| | | | | | | | | | |
| | | |
| | Telecommunications — 3.3% | | | | | | | | |
| 280,000 | | Asia Satellite Telecommunications Holdings Ltd. | | | 604,206 | | | | 258,415 | |
| 36,000 | | Cincinnati Bell Inc.† | | | 604,307 | | | | 687,600 | |
| 1,800 | | Gigamon Inc.† | | | 69,264 | | | | 69,300 | |
| 8,500 | | Hitachi Kokusai Electric Inc. | | | 190,555 | | | | 234,356 | |
| | | | | | | | | | |
Shares | | | | Cost | | | Market
Value | |
| 220,000 | | Koninklijke KPN NV | | $ | 657,892 | | | $ | 759,575 | |
| 50,000 | | Level 3 Communications Inc.† | | | 2,743,613 | | | | 2,681,500 | |
| 5,000 | | Loral Space & Communications Inc.† | | | 234,737 | | | | 235,750 | |
| 1,500 | | Lumos Networks Corp.† | | | 26,558 | | | | 26,940 | |
| 1,000 | | Rogers Communications Inc., Cl. B | | | 2,955 | | | | 51,900 | |
| 2,000 | | Straight Path Communications Inc., Cl. B† | | | 360,129 | | | | 363,020 | |
| | | | | | | | | | |
| | | | | 5,494,216 | | | | 5,368,356 | |
| | | | | | | | | | |
| | | |
| | Transportation — 2.6% | | | | | | | | |
| 90,000 | | Abertis Infraestructuras SA | | | 1,651,709 | | | | 1,946,813 | |
| 3,000 | | GATX Corp. | | | 118,937 | | | | 178,230 | |
| 50,000 | | Navistar International Corp.† | | | 957,947 | | | | 2,115,500 | |
| | | | | | | | | | |
| | | | | 2,728,593 | | | | 4,240,543 | |
| | | | | | | | | | |
| | | |
| | Wireless Communications — 5.3% | | | | | | | | |
| 1,000 | | DGC One AB†(a) | | | 28,852 | | | | 29,863 | |
| 46,000 | | Millicom International Cellular SA, SDR. | | | 2,787,434 | | | | 2,942,431 | |
| 58,000 | | Sprint Corp.† | | | 300,473 | | | | 379,320 | |
| 9,000 | | Telephone & Data Systems Inc. | | | 255,177 | | | | 262,350 | |
| 40,000 | | T-Mobile US Inc.† | | | 650,000 | | | | 2,390,800 | |
| 70,000 | | United States Cellular Corp.† | | | 3,221,188 | | | | 2,561,300 | |
| | | | | | | | | | |
| | | | | 7,243,124 | | | | 8,566,064 | |
| | | | | | | | | | |
| | TOTAL COMMON STOCKS | | | 96,589,854 | | | | 109,353,517 | |
| | | | | | | | | | |
| | | |
| | RIGHTS — 0.2% | | | | | | | | |
| | Energy and Utilities — 0.1% | | | | | | | | |
| 90,000 | | Dyax Corp., CVR†(a) | | | 0 | | | | 99,900 | |
| | | | | | | | | | |
| | | |
| | Health Care — 0.0% | | | | | | | | |
| 20,000 | | Adolor Corp., CPR, expire 07/01/19†(a) | | | 0 | | | | 5,200 | |
| 13,000 | | Ambit Biosciences Corp., CVR†(a) | | | 0 | | | | 7,800 | |
| 5,000 | | American Medical Alert Corp., CPR†(a) | | | 0 | | | | 50 | |
| 11,000 | | Chelsea Therapeutics International Ltd., CVR†(a) | | | 1,210 | | | | 0 | |
| 75,000 | | Innocoll, CVR†(a) | | | 45,000 | | | | 45,000 | |
| 100 | | Omthera Pharmaceuticals Inc., CVR†(a) | | | 0 | | | | 0 | |
| 250,200 | | Synergetics USA Inc., CVR†(a) | | | 25,020 | | | | 25,020 | |
| 156,000 | | Teva Pharmaceutical Industries Ltd., CCCP, expire 02/20/23†(a) | | | 74,375 | | | | 0 | |
| 7,000 | | Tobira Therapeutics Inc., CVR†(a) | | | 420 | | | | 420 | |
| | | | | | | | | | |
| | | | | 146,025 | | | | 83,490 | |
| | | | | | | | | | |
See accompanying notes to financial statements.
10
Gabelli Enterprise Mergers and Acquisitions Fund
Schedule of Investments (Continued) — October 31, 2017
| | | | | | | | | | |
Shares | | | | Cost | | | Market
Value | |
| | RIGHTS (Continued) | | | | | | | | |
| | Media — 0.0% | | | | | | | | |
| 40,000 | | Media General Inc., CVR, expire 12/31/17†(a) | | $ | 0 | | | $ | 0 | |
| | | | | | | | | | |
| | Retail — 0.1% | | | | | | | | |
| 220,000 | | Safeway Casa Ley, CVR, expire 01/30/19† | | | 39,570 | | | | 117,700 | |
| 220,000 | | Safeway PDC, CVR, expire 01/30/18† | | | 0 | | | | 3,300 | |
| | | | | | | | | | |
| | | | | 39,570 | | | | 121,000 | |
| | | | | | | | | | |
| | TOTAL RIGHTS | | | 185,595 | | | | 304,390 | |
| | | | | | | | | | |
| | | |
| | WARRANTS — 0.0% | | | | | | | | |
| | Metals and Mining — 0.0% | | | | | | | | |
| 850 | | Hudbay Minerals Inc., expire 07/20/18† | | | 962 | | | | 217 | |
| | | | | | | | | | |
Principal
Amount | | | | | | | | |
| | CORPORATE BONDS — 0.0% | | | | | | | | |
| | Health Care — 0.0% | | | | | | | | |
| $ 7,000 | | Constellation Health Promissory Note, PIK, 5.000%, 01/31/24(a)(b) | | | 3,010 | | | | 3,010 | |
| | | | | | | | | | |
| | | | | | | | | | |
Principal
Amount | | | | Cost | | | Market
Value | |
| | U.S. GOVERNMENT OBLIGATIONS — 30.9% | |
| $49,998,000 | | U.S. Treasury Bills, 0.955% to 1.248%††, 11/02/17 to 04/19/18(c) | | $ | 49,876,157 | | | $ | 49,877,320 | |
| | | | | | | | | | |
| | TOTAL INVESTMENTS — 98.8% | | $ | 146,655,578 | | | | 159,538,454 | |
| | | | | | | | | | |
| | Other Assets and Liabilities (Net) — 1.2% | | | | 1,979,059 | |
| | | | | | | | | | |
| | NET ASSETS — 100.0%. | | | | | | $ | 161,517,513 | |
| | | | | | | | | | |
| | |
(a) | | Security is valued using significant unobservable inputs and is classified as Level 3 in the fair value hierarchy. |
(b) | | Payment-in-kind (“PIK”) security. 5.00% PIK interest income will be paid as additional securities at the discretion of the issuer. |
(c) | | At October 31, 2017, $500,000 of the principal amount was pledged as collateral with Pershing. |
† | | Non-income producing security. |
†† | | Represents annualized yield at date of purchase. |
ADR | | American Depositary Receipt |
CCCP | | Contingent Cash Consideration Payment |
CPR | | Contingent Payment Right |
CVR | | Contingent Value Right |
SDR | | Swedish Depositary Receipt |
See accompanying notes to financial statements.
11
Gabelli Enterprise Mergers and Acquisitions Fund
| | | | |
| Statement of Assets and Liabilities | | | |
| October 31, 2017 | | | |
|
| |
Assets: | | | | |
Investments, at value (cost $146,655,578) | | $ | 159,538,454 | |
Foreign currency, at value (cost $2,893,489) | | | 2,967,431 | |
Cash | | | 16,351 | |
Receivable for Fund shares sold | | | 274,617 | |
Receivable for investments sold | | | 264,741 | |
Dividends receivable | | | 57,037 | |
Prepaid expenses | | | 37,439 | |
Other receivable | | | 29,250 | |
| | | | |
Total Assets | | | 163,185,320 | |
| | | | |
Liabilities: | | | | |
Payable for Fund shares redeemed | | | 172,182 | |
Payable for investments purchased | | | 1,202,922 | |
Payable for investment advisory fees | | | 128,878 | |
Payable for distribution fees | | | 52,582 | |
Payable for accounting fees | | | 15,000 | |
Payable for payroll expenses | | | 636 | |
Other accrued expenses | | | 95,607 | |
| | | | |
Total Liabilities | | | 1,667,807 | |
| | | | |
Net Assets | | | | |
(applicable to 10,895,165 shares outstanding) | | $ | 161,517,513 | |
| | �� | | |
Net Assets Consist of: | | | | |
Paid-in capital | | $ | 149,164,728 | |
Accumulated net investment loss | | | (578,435 | ) |
Distributions in excess of net realized gain on investments and foreign currency transactions | | | (25,703 | ) |
Net unrealized appreciation on investments | | | 12,882,876 | |
Net unrealized appreciation on foreign currency translations | | | 74,047 | |
| | | | |
Net Assets | | $ | 161,517,513 | |
| | | | |
| | | | |
Shares of Capital Stock, each at $0.001 par value: | | | | |
Class AAA: | | | | |
Net Asset Value, offering, and redemption price per share ($6,200,712 ÷ 414,592 shares outstanding; 100,000,000 shares authorized) | | | $14.96 | |
| | | | |
Class A: | | | | |
Net Asset Value and redemption price per share ($46,887,023 ÷ 3,182,908 shares outstanding; 200,000,000 shares authorized) | | | $14.73 | |
| | | | |
Maximum offering price per share (NAV ÷ 0.9425, based on maximum sales charge of 5.75% of the offering price) | | | $15.63 | |
| | | | |
Class C: | | | | |
Net Asset Value and offering price per share ($38,627,929 ÷ 2,854,018 shares outstanding; 100,000,000 shares authorized) | | | $13.53 | (a) |
| | | | |
Class T: | | | | |
Net Asset Value and redemption price per share ($1,012.10 ÷ 68.63 shares outstanding; 100,000,000 shares authorized) | | | $14.75 | |
| | | | |
Maximum offering price per share (NAV ÷ 0.9750, based on maximum sales charge of 2.50% of the offering price) | | | $15.13 | |
| | | | |
Class Y: | | | | |
Net Asset Value, and redemption price per share ($69,800,837 ÷ 4,443,578 shares outstanding; 100,000,000 shares authorized) | | | $15.71 | |
| | | | |
| (a) | Redemption price varies based on the length of time held. |
| | | | |
| Statement of Operations | | | |
| For the Year Ended October 31, 2017 | | | |
|
| |
Investment Income: | | | | |
Dividends (net of foreign withholding taxes of $56,613) | | $ | 1,758,691 | |
Interest | | | 300,550 | |
Other Income* | | | 3,848 | |
| | | | |
Total Investment Income | | | 2,063,089 | |
| | | | |
Expenses: | | | | |
Investment advisory fees | | | 1,545,994 | |
Distribution fees - Class AAA | | | 12,323 | |
Distribution fees - Class A | | | 230,147 | |
Distribution fees - Class C | | | 429,132 | |
Distribution fees - Class T | | | 1 | |
Shareholder services fees | | | 162,365 | |
Directors’ fees | | | 74,500 | |
Registration expenses | | | 68,827 | |
Shareholder communications expenses | | | 60,982 | |
Legal and audit fees | | | 58,302 | |
Accounting fees | | | 45,000 | |
Custodian fees | | | 31,567 | |
Interest expense | | | 18,353 | |
Payroll expenses | | | 3,201 | |
Miscellaneous expenses | | | 23,196 | |
| | | | |
Total Expenses | | | 2,763,890 | |
| | | | |
Less: | | | | |
Expenses paid indirectly by broker (See Note 6) | | | (2,486 | ) |
| | | | |
Net Expenses | | | 2,761,404 | |
| | | | |
Net Investment Loss | | | (698,315 | ) |
| | | | |
Net Realized and Unrealized Gain/(Loss) on | | | | |
Investments, Securities Sold Short, and Foreign Currency: | | | | |
Net realized gain on investments | | | 5,744,298 | |
Net realized loss on foreign currency transactions | | | (2,717 | ) |
| | | | |
Net realized gain on investments and foreign currency transactions | | | 5,741,581 | |
| | | | |
Net change in unrealized appreciation/depreciation: | | | | |
on investments | | | 10,933,870 | |
on securities sold short | | | (8,914 | ) |
on foreign currency translations | | | 172,627 | |
| | | | |
Net change in unrealized appreciation/ depreciation on investments, securities sold short, and foreign currency translations | | | 11,097,583 | |
| | | | |
Net Realized and Unrealized Gain/(Loss) on Investments, Securities Sold Short, and
Foreign Currency | | | 16,839,164 | |
| | | | |
Net Increase in Net Assets Resulting from Operations | | $ | 16,140,849 | |
| | | | |
| * | The Fund received a reimbursement of custody expenses paid in prior years. |
See accompanying notes to financial statements.
12
Gabelli Enterprise Mergers and Acquisitions Fund
Statement of Changes in Net Assets
| | | | | | | | |
| | | Year Ended
October 31, 2017 | | | Year Ended
October 31, 2016 | |
Operations: | | | | | | | | |
Net investment loss. | | | $ (698,315) | | | | $ (190,576) | |
Net realized gain on investments, and foreign currency transactions | | | 5,741,581 | | | | 10,307,496 | |
Net change in unrealized appreciation/depreciation on investments, securities sold short, and foreign currency translations | | | 11,097,583 | | | | (8,302,711) | |
| | | | | | | | |
Net Increase in Net Assets Resulting from Operations. | | | 16,140,849 | | | | 1,814,209 | |
| | | | | | | | |
Capital Share Transactions: | | | | | | | | |
Class AAA | | | 1,679,658 | | | | (922,957) | |
Class A | | | (6,922,346) | | | | (9,998,717) | |
Class C | | | (9,921,139) | | | | (9,735,326) | |
Class T | | | 1,000 | | | | — | |
Class Y | | | 3,862,479 | | | | (18,350,000) | |
| | | | | | | | |
Net Decrease in Net Assets from Capital Share Transactions | | | (11,300,348) | | | | (39,007,000) | |
| | | | | | | | |
Redemption Fees | | | 139 | | | | 2,048 | |
| | | | | | | | |
Net Increase/(Decrease) in Net Assets | | | 4,840,640 | | | | (37,190,743) | |
Net Assets: | | | | | | | | |
Beginning of year | | | 156,676,873 | | | | 193,867,616 | |
| | | | | | | | |
End of year (including undistributed net investment income of $0 and $0, respectively) | | | $161,517,513 | | | | $156,676,873 | |
| | | | | | | | |
See accompanying notes to financial statements.
13
Gabelli Enterprise Mergers and Acquisitions Fund
Financial Highlights
Selected data for a share of capital stock outstanding throughout each period:
| | | | | | | | | | | | | | | | | | | | | | | | | | | | | | | | | | | | | | | | | | | | |
| | | | | | Income (Loss) | | | | | | | | | | | | Ratios to Average Net Assets/ | |
| | | | | | from Investment Operations | | | | | | | | | | | | Supplemental Data | |
| | | Net Asset | | | Net | | | Net Realized and | | | Total | | | | | | Net Asset | | | | | | Net Assets | | | Net | | | | | | | |
| Year | | Value, | | | Investment | | | Unrealized | | | from | | | | | | Value, | | | | | | End of | | | Investment | | | | | | Portfolio | |
| Ended | | Beginning | | | Income | | | Gain on | | | Investment | | | Redemption | | | End of | | | Total | | | Period | | | Income | | | Operating | | | Turnover | |
October 31 | | of Period | | | (Loss)(a) | | | Investments | | | Operations | | | Fees (a)(b) | | | Period | | | Return† | | | (in 000’s) | | | (Loss) | | | Expenses | | | Rate | |
Class AAA | | | | | | | | | | | | | | | | | | | | | | | | | | | | | | | | | | | | | | | | | | | | |
2017 | | | $13.52 | | | | $(0.04) | | | | $1.48 | | | | $1.44 | | | | $0.00 | | | | $14.96 | | | | 10.65% | | | | $6,201 | | | | (0.28 | )% | | | 1.51%(c)(d) | | | | 113% | |
2016 | | | 13.31 | | | | 0.01 | | | | 0.20 | | | | 0.21 | | | | 0.00 | | | | 13.52 | | | | 1.58 | | | | 4,069 | | | | 0.07 | | | | 1.52(c)(d)(e)(f) | | | | 151 | |
2015 | | | 12.86 | | | | (0.07) | | | | 0.52 | | | | 0.45 | | | | 0.00 | | | | 13.31 | | | | 3.50 | | | | 4,943 | | | | (0.51 | ) | | | 1.47(c)(d)(e) | | | | 162 | |
2014 | | | 12.66 | | | | (0.03) | | | | 0.23 | | | | 0.20 | | | | 0.00 | | | | 12.86 | | | | 1.58 | | | | 11,315 | | | | (0.24 | ) | | | 1.46(d)(e) | | | | 181 | |
2013 | | | 11.00 | | | | 0.04 | | | | 1.62 | | | | 1.66 | | | | 0.00 | | | | 12.66 | | | | 15.09 | | | | 8,671 | | | | 0.37 | | | | 1.49(d) | | | | 197 | |
Class A | | | | | | | | | | | | | | | | | | | | | | | | | | | | | | | | | | | | | | | | | | | | |
2017 | | | $13.35 | | | | $(0.07) | | | | $1.45 | | | | $1.38 | | | | $0.00 | | | | $14.73 | | | | 10.34% | | | | $46,887 | | | | (0.46 | )% | | | 1.71%(c)(d) | | | | 113% | |
2016 | | | 13.17 | | | | (0.02) | | | | 0.20 | | | | 0.18 | | | | 0.00 | | | | 13.35 | | | | 1.37 | | | | 48,770 | | | | (0.13 | ) | | | 1.72(c)(d)(e)(f) | | | | 151 | |
2015 | | | 12.75 | | | | (0.08) | | | | 0.50 | | | | 0.42 | | | | 0.00 | | | | 13.17 | | | | 3.29 | | | | 58,039 | | | | (0.63 | ) | | | 1.67(c)(d)(e) | | | | 162 | |
2014 | | | 12.57 | | | | (0.06) | | | | 0.24 | | | | 0.18 | | | | 0.00 | | | | 12.75 | | | | 1.43 | | | | 93,980 | | | | (0.51 | ) | | | 1.66(d)(e) | | | | 181 | |
2013 | | | 10.94 | | | | 0.02 | | | | 1.61 | | | | 1.63 | | | | 0.00 | | | | 12.57 | | | | 14.90 | | | | 109,446 | | | | 0.15 | | | | 1.69(d) | | | | 197 | |
Class C | | | | | | | | | | | | | | | | | | | | | | | | | | | | | | | | | | | | | | | | | | | | |
2017 | | | $12.33 | | | | $(0.13) | | | | $1.33 | | | | $1.20 | | | | $0.00 | | | | $13.53 | | | | 9.73% | | | | $38,628 | | | | (1.01 | )% | | | 2.26%(c)(d) | | | | 113% | |
2016 | | | 12.23 | | | | (0.08) | | | | 0.18 | | | | 0.10 | | | | 0.00 | | | | 12.33 | | | | 0.82 | | | | 44,424 | | | | (0.67 | ) | | | 2.27(c)(d)(e)(f) | | | | 151 | |
2015 | | | 11.91 | | | | (0.14) | | | | 0.46 | | | | 0.32 | | | | 0.00 | | | | 12.23 | | | | 2.69 | | | | 53,738 | | | | (1.19 | ) | | | 2.22(c)(d)(e) | | | | 162 | |
2014 | | | 11.81 | | | | (0.12) | | | | 0.22 | | | | 0.10 | | | | 0.00 | | | | 11.91 | | | | 0.85 | | | | 57,616 | | | | (1.04 | ) | | | 2.21(d)(e) | | | | 181 | |
2013 | | | 10.33 | | | | (0.04) | | | | 1.52 | | | | 1.48 | | | | 0.00 | | | | 11.81 | | | | 14.33 | | | | 58,062 | | | | (0.39 | ) | | | 2.24(d) | | | | 197 | |
Class T(g) | | | | | | | | | | | | | | | | | | | | | | | | | | | | | | | | | | | | | | | | | | | | |
2017 | | | $14.57 | | | | $(0.03) | | | | $0.21 | | | | $0.18 | | | | — | | | | $14.75 | | | | 1.24% | | | | $1 | | | | (0.63 | )% | | | 1.51%(c)(d) | | | | 113% | |
Class Y | | | | | | | | | | | | | | | | | | | | | | | | | | | | | | | | | | | | | | | | | | | | |
2017 | | | $14.17 | | | | $(0.00)(b) | | | | $1.54 | | | | $1.54 | | | | $0.00 | | | | $15.71 | | | | 10.87% | | | | $69,801 | | | | (0.02 | )% | | | 1.26%(c)(d) | | | | 113% | |
2016 | | | 13.91 | | | | 0.05 | | | | 0.21 | | | | 0.26 | | | | 0.00 | | | | 14.17 | | | | 1.87 | | | | 59,414 | | | | 0.33 | | | | 1.27(c)(d)(e)(f) | | | | 151 | |
2015 | | | 13.41 | | | | (0.03) | | | | 0.53 | | | | 0.50 | | | | 0.00 | | | | 13.91 | | | | 3.73 | | | | 77,148 | | | | (0.20 | ) | | | 1.21(c)(d)(e) | | | | 162 | |
2014 | | | 13.16 | | | | (0.00) | | | | 0.25 | | | | 0.25 | | | | 0.00 | | | | 13.41 | | | | 1.90 | | | | 80,672 | | | | (0.03 | ) | | | 1.21(d)(e) | | | | 181 | |
2013 | | | 11.41 | | | | 0.06 | | | | 1.69 | | | | 1.75 | | | | 0.00 | | | | 13.16 | | | | 15.34 | | | | 66,746 | | | | 0.48 | | | | 1.24(d) | | | | 197 | |
| † | Total return represents aggregate total return of a hypothetical $1,000 investment at the beginning of the period and sold at the end of the period including reinvestment of distributions and does not reflect applicable sales charges. Total return for a period of less than one year is not annualized. |
| (a) | Per share amounts have been calculated using the average shares outstanding method. |
| (b) | Amount represents less than $0.005 per share. |
| (c) | The Fund received credits from a designated broker who agreed to pay certain Fund operating expenses. For the years ended October 31, 2017, 2016 and 2015, there was no impact on the expense ratios. |
| (d) | The Fund incurred interest expense during the year ended October 31, 2017. If interest expense had not been incurred during the year, the ratio of operating expenses to average net assets would have been 1.50% (Class AAA), 1.70% (Class A), 2.25% (Class C), 1.50% (Class T) and 1.25% (Class Y) respectively. For the years ended October 31, 2016, 2015, 2014, and 2013, there was no impact on the expense ratio. |
| (e) | The Fund incurred dividend expense and service fees on securities sold short. If these expenses and fees had not been incurred, the ratios of operating expenses to average net assets for the year ended October 31, 2016 would have been 1.50% (Class AAA), 1.70% (Class A), 2.25% (Class C), and 1.25% (Class Y), respectively. For the years ended October 31, 2015, and 2014, there was no impact on the expense ratios. |
| (f) | During the year ended October 31, 2016, the Fund received a reimbursement of custody expenses paid in prior years. Had such reimbursement (allocated by relative net asset values of the Fund’s share classes) been included in that period, the expense ratios would have been 1.44% (Class AAA),1.64% (Class A), 2.19% (Class C), and 1.19% (Class Y), respectively. |
| (g) | Class T Shares were initially offered on June 30, 2017. |
See accompanying notes to financial statements.
14
Gabelli Enterprise Mergers and Acquisitions Fund
Notes to Financial Statements
1. Organization. The Gabelli Enterprise Mergers and Acquisitions Fund is a series of the Gabelli 787 Fund, Inc. (the “Corporation”), which was organized in Maryland and commenced operations on February 28, 2001. On June 30, 2017, the Fund began to offer for sale Class T Shares. The Fund is a non-diversified open-end management investment company registered under the Investment Company Act of 1940, as amended (the “1940 Act”). Its primary objective is capital appreciation.
2. Significant Accounting Policies. As an investment company, the Fund follows the investment company accounting and reporting guidance, which is part of U.S. generally accepted accounting principles (“GAAP”) that may require the use of management estimates and assumptions in the preparation of its financial statements. Actual results could differ from those estimates. The following is a summary of significant accounting policies followed by the Fund in the preparation of its financial statements.
Security Valuation. Portfolio securities listed or traded on a nationally recognized securities exchange or traded in the U.S. over-the-counter market for which market quotations are readily available are valued at the last quoted sale price or a market’s official closing price as of the close of business on the day the securities are being valued. If there were no sales that day, the security is valued at the average of the closing bid and asked prices or, if there were no asked prices quoted on that day, then the security is valued at the closing bid price on that day. If no bid or asked prices are quoted on such day, the security is valued at the most recently available price or, if the Board of Directors (the “Board”) so determines, by such other method as the Board shall determine in good faith to reflect its fair market value. Portfolio securities traded on more than one national securities exchange or market are valued according to the broadest and most representative market, as determined by Gabelli Funds, LLC (the “Adviser”).
Portfolio securities primarily traded on a foreign market are generally valued at the preceding closing values of such securities on the relevant market, but may be fair valued pursuant to procedures established by the Board if market conditions change significantly after the close of the foreign market, but prior to the close of business on the day the securities are being valued. Debt obligations for which market quotations are readily available are valued at the average of the latest bid and asked prices. If there were no asked prices quoted on such day, the security is valued using the closing bid price, unless the Board determines such amount does not reflect the securities’ fair value, in which case these securities will be fair valued as determined by the Board. Certain securities are valued principally using dealer quotations. Futures contracts are valued at the closing settlement price of the exchange or board of trade on which the applicable contract is traded. OTC futures and options on futures for which market quotations are readily available will be valued by quotations received from a pricing service or, if no quotations are available from a pricing service, by quotations obtained from one or more dealers in the instrument in question by the Adviser.
Securities and assets for which market quotations are not readily available are fair valued as determined by the Board. Fair valuation methodologies and procedures may include, but are not limited to: analysis and review of available financial and non-financial information about the company; comparisons with the valuation and changes in valuation of similar securities, including a comparison of foreign securities with the equivalent U.S. dollar value American Depositary Receipt securities at the close of the U.S. exchange; and evaluation of any other information that could be indicative of the value of the security.
15
Gabelli Enterprise Mergers and Acquisitions Fund
Notes to Financial Statements (Continued)
The inputs and valuation techniques used to measure fair value of the Fund’s investments are summarized into three levels as described in the hierarchy below:
| | ● | | Level 1 — quoted prices in active markets for identical securities; |
| | ● | | Level 2 — other significant observable inputs (including quoted prices for similar securities, interest rates, prepayment speeds, credit risk, etc.); and |
| | ● | | Level 3 — significant unobservable inputs (including the Board’s determinations as to the fair value of investments). |
A financial instrument’s level within the fair value hierarchy is based on the lowest level of any input both individually and in the aggregate that is significant to the fair value measurement. The inputs or methodology used for valuing securities are not necessarily an indication of the risk associated with investing in those securities. The summary of the Fund’s investments in securities by inputs used to value the Fund’s investments as of October 31, 2017 is as follows:
| | | | | | | | | | | | | | | | |
| | | Valuation Inputs | | | | |
| | | Level 1
Quoted Prices | | | Level 2 Other Significant
Observable Inputs | | | Level 3 Significant
Unobservable Inputs | | | Total Market Value
at 10/31/17 | |
INVESTMENTS IN SECURITIES: | | | | | | | | | | | | | | | | |
ASSETS (Market Value): | | | | | | | | | | | | | | | | |
Common Stocks: | | | | | | | | | | | | | | | | |
Automotive: Parts and Accessories | | | $ 719,872 | | | | — | | | | $100,000 | | | | $ 819,872 | |
Building and Construction | | | 3,500,674 | | | | $ 172,000 | | | | — | | | | 3,672,674 | |
Business Services | | | 3,110,797 | | | | — | | | | 0 | | | | 3,110,797 | |
Energy and Utilities | | | 7,836,320 | | | | — | | | | 0 | | | | 7,836,320 | |
Financial Services | | | 5,548,666 | | | | 40,250 | | | | — | | | | 5,588,916 | |
Wireless Communications | | | 8,536,201 | | | | — | | | | 29,863 | | | | 8,566,064 | |
All Other Industries (a) | | | 79,758,874 | | | | — | | | | — | | | | 79,758,874 | |
Total Common Stocks | | | 109,011,404 | | | | 212,250 | | | | 129,863 | | | | 109,353,517 | |
Rights (a) | | | — | | | | 121,000 | | | | 183,390 | | | | 304,390 | |
Warrants (a) | | | 217 | | | | — | | | | — | | | | 217 | |
Corporate Bonds (a) | | | — | | | | — | | | | 3,010 | | | | 3,010 | |
U.S. Government Obligations | | | — | | | | 49,877,320 | | | | — | | | | 49,877,320 | |
TOTAL INVESTMENTS IN SECURITIES – ASSETS | | | $109,011,621 | | | | $50,210,570 | | | | $316,263 | | | | $159,538,454 | |
| (a) | Please refer to the Schedule of Investments for the industry classifications of these portfolio holdings. |
During the year ended October 31, 2017, the Fund had transfers of $92,600 or 0.06% from Level 1 to Level 3, $155,000 or 0.10% from Level 1 to Level 2, $88,000 or 0.06% from Level 3 to Level 2, and $7,821 or 0.01% from Level 2 to Level 1 of net assets as of October 31, 2017. Transfers from Level 1 to Level 3 and Level 1 to Level 2 are due to a decline in market activity, e.g., frequency of trades, which resulted in a lack of available market inputs to determine price. Transfers from Level 2 to Level 1 and Level 3 to Level 2 are due to an increase in market activity, e.g., frequency of trades, which resulted in an increase in available market inputs to determine price. The Fund’s policy is to recognize transfers among Levels as of the beginning of the reporting period.
16
Gabelli Enterprise Mergers and Acquisitions Fund
Notes to Financial Statements (Continued)
The following table reconciles Level 3 investments for which significant unobservable inputs were used to determine fair value:
| | | | | | | | | | | | | | | | | | | | | | | | | | | | | | | | | | | | | | | | |
| | | | | | | | | | | | | | | | | | | | | | | | | | | | | | Net change | |
| | | | | | | | | | | | | | | | | | | | | | | | | | | | | | in unrealized | |
| | | | | | | | | | | | | | | | | | | | | | | | | | | | | | appreciation/ | |
| | | | | | | | | | | | | | | | | | | | | | | | | | | | | | depreciation | |
| | | | | | | | | | | | | | | | | | | | | | | | | | | | | | during the | |
| | | | | | | | | | | | | | | | | | | | | | | | | | | | | | period on | |
| | | | | | | | | | | | Change in | | | | | | | | | | | | | | | | | | Level 3 | |
| | | Balance | | | Accrued | | | Realized | | | unrealized | | | | | | | | | Transfers | | | Transfers | | | Balance | | | investments | |
| | | as of | | | discounts/ | | | gain/ | | | appreciation/ | | | | | | | | | into | | | out of | | | as of | | | still held at | |
| | | 10/31/16 | | | (premiums) | | | (loss) | | | depreciation | | | Purchases | | | Sales | | | Level 3†† | | | Level 3†† | | | 10/31/17 | | | 10/31/17† | |
INVESTMENTS IN SECURITIES: | | | | | | | | | | | | | | | | | | | | | | | | | | | | | | | | | | | | | | | | |
ASSETS (Market Value): | | | | | | | | | | | | | | | | | | | | | | | | | | | | | | | | | | | | | | | | |
Common Stocks: | | | | | | | | | | | | | | | | | | | | | | | | | | | | | | | | | | | | | | | | |
Automotive: Parts and Accessories | | | — | | | | — | | | | — | | | | $ 7,400 | | | | — | | | | — | | | | $92,600 | | | | — | | | | $100,000 | | | | $ 7,400 | |
Business Services | | | $ 0 | | | | — | | | | — | | | | — | | | | — | | | | — | | | | — | | | | — | | | | 0 | | | | — | |
Energy and Utilities | | | 0 | | | | — | | | | — | | | | — | | | | — | | | | — | | | | — | | | | — | | | | 0 | | | | — | |
Media | | | 628,725 | | | | — | | | | $168,321 | | | | (74,732) | | | | — | | | | $ (722,314) | | | | — | | | | — | | | | — | | | | — | |
Wireless Communications | | | — | | | | — | | | | — | | | | 1,011 | | | | $28,852 | | | | — | | | | — | | | | — | | | | 29,863 | | | | 1,011 | |
Total Common Stocks | | | 628,725 | | | | — | | | | 168,321 | | | | (66,321) | | | | 28,852 | | | | (722,314) | | | | 92,600 | | | | — | | | | 129,863 | | | | 8,411 | |
Rights (a) | | | 1,120,100 | | | | — | | | | 336,191 | | | | (159,843) | | | | 45,420 | | | | (1,070,478) | | | | — | | | | $(88,000) | | | | 183,390 | | | | (89,150) | |
Corporate Bonds (a) | | | — | | | | — | | | | — | | | | — | | | | 3,010 | | | | — | | | | — | | | | — | | | | 3,010 | | | | — | |
TOTAL INVESTMENTS IN SECURITIES | | | $1,748,825 | | | | — | | | | $504,512 | | | | $(226,164) | | | | $77,282 | | | | $(1,792,792) | | | | $92,600 | | | | $(88,000) | | | | $316,263 | | | | $(80,739) | |
| (a) | Please refer to the Schedule of Investments for the industry classifications of these portfolio holdings. |
| † | Net change in unrealized appreciation/depreciation on investments is included in the related amounts in the Statement of Operations. |
| †† | The Fund’s policy is to recognize transfers into and out of Level 3 as of the beginning of the reporting period. |
The following table summarizes the valuation techniques used and unobservable inputs utilized to determine the value of certain of the Fund’s Level 3 investments as of October 31, 2017:
| | | | | | | | | | | | |
Description | | Balance at 10/31/17 | | | Valuation Technique | | Unobservable Input | | Range | |
INVESTMENTS IN SECURITIES: | | | | | | | | | | | | |
ASSETS (Market Value): | | | | | | | | | | | | |
Rights (a) | | | $183,390 | | | Acquisition price/Cash flow analysis/Intrinsic value | | Discount Range | | | 0 | % |
Corporate Bonds (a) | | | 3,010 | | | Acquisition price/Cash flow analysis | | Discount Range | | | 0 | % |
Common Stocks (a) | | | 129,863 | | | Acquisition price/Cash flow analysis/Bankruptcy plan | | Discount Range | | | 0 | % |
| | | | | | | | | | | | |
| | | $316,263 | | | | | | | | | |
| | | | | | | | | | | | |
| (a) | Please refer to the Schedule of Investments for the industry classifications of these portfolio holdings. |
| | | | |
Unobservable Input | | Impact to Value if Input Increases | | Impact to Value if Input Decreases |
Discount Range | | Decrease | | Increase |
17
Gabelli Enterprise Mergers and Acquisitions Fund
Notes to Financial Statements (Continued)
Additional Information to Evaluate Qualitative Information.
General. The Fund uses recognized industry pricing services – approved by the Board and unaffiliated with the Adviser – to value most of its securities, and uses broker quotes provided by market makers of securities not valued by these and other recognized pricing sources. Several different pricing feeds are received to value domestic equity securities, international equity securities, preferred equity securities, and fixed income securities. The data within these feeds are ultimately sourced from major stock exchanges and trading systems where these securities trade. The prices supplied by external sources are checked by obtaining quotations or actual transaction prices from market participants. If a price obtained from the pricing source is deemed unreliable, prices will be sought from another pricing service or from a broker/dealer that trades that security or similar securities.
Fair Valuation. Fair valued securities may be common or preferred equities, warrants, options, rights, or fixed income obligations. Where appropriate, Level 3 securities are those for which market quotations are not available, such as securities not traded for several days, or for which current bids are not available, or which are restricted as to transfer. When fair valuing a security, factors to consider include recent prices of comparable securities that are publicly traded, reliable prices of securities not publicly traded, the use of valuation models, current analyst reports, valuing the income or cash flow of the issuer, or cost if the preceding factors do not apply. A significant change in the unobservable inputs could result in a lower or higher value in Level 3 securities. The circumstances of Level 3 securities are frequently monitored to determine if fair valuation measures continue to apply.
The Adviser reports quarterly to the Board the results of the application of fair valuation policies and procedures. These may include backtesting the prices realized in subsequent trades of these fair valued securities to fair values previously recognized.
Derivative Financial Instruments. The Fund may engage in various portfolio investment strategies by investing in derivative financial instruments for the purposes of increasing the income of the Fund, hedging against changes in the value of its portfolio securities and in the value of securities it intends to purchase, or hedging against a specific transaction with respect to either the currency in which the transaction is denominated or another currency. Investing in certain derivative financial instruments, including participation in the options, futures, or swap markets, entails certain execution, liquidity, hedging, tax, and securities, interest, credit, or currency market risks. Losses may arise if the Adviser’s prediction of movements in the direction of the securities, foreign currency, and interest rate markets is inaccurate. Losses may also arise if the counterparty does not perform its duties under a contract, or, in the event of default, the Fund may be delayed in or prevented from obtaining payments or other contractual remedies owed to it under derivative contracts. The creditworthiness of the counterparties is closely monitored in order to minimize these risks. Participation in derivative transactions involves investment risks, transaction costs, and potential losses to which the Fund would not be subject absent the use of these strategies. The consequences of these risks, transaction costs, and losses may have a negative impact on the Fund’s ability to pay distributions.
Collateral requirements differ by type of derivative. Collateral requirements are set by the broker or exchange clearing house for exchange traded derivatives, while collateral terms are contract specific for derivatives traded over-the-counter. Securities pledged to cover obligations of the Fund under derivative contracts are noted in
18
Gabelli Enterprise Mergers and Acquisitions Fund
Notes to Financial Statements (Continued)
the Schedule of Investments. Cash collateral, if any, pledged for the same purpose will be reported separately in the Statement of Assets and Liabilities.
The Fund’s derivative contracts held at October 31, 2017, if any, are not accounted for as hedging instruments under GAAP and are disclosed in the Schedule of Investments together with the related counterparty.
Swap Agreements. The Fund may enter into equity contract for difference swap transactions for the purpose of increasing the income of the Fund. The use of swaps is a highly specialized activity that involves investment techniques and risks different from those associated with ordinary portfolio security transactions. In an equity contract for difference swap, a set of future cash flows is exchanged between two counterparties. One of these cash flow streams will typically be based on a reference interest rate combined with the performance of a notional value of shares of a stock. The other will be based on the performance of the shares of a stock. Depending on the general state of short term interest rates and the returns on the Fund’s portfolio securities at the time an equity contract for difference swap transaction reaches its scheduled termination date, there is a risk that the Fund will not be able to obtain a replacement transaction or that the terms of the replacement will not be as favorable as on the expiring transaction.
Unrealized gains related to swaps are reported as an asset and unrealized losses are reported as a liability in the Statement of Assets and Liabilities. The change in value of swaps, including the accrual of periodic amounts of interest to be paid or received on swaps, is reported as unrealized gain or loss in the Statement of Operations. A realized gain or loss is recorded upon payment or receipt of a periodic payment or termination of swap agreements. At October 31, 2017, the Fund held no investments in equity contract for difference swap agreements.
Foreign Currency Translations. The books and records of the Fund are maintained in U.S. dollars. Foreign currencies, investments, and other assets and liabilities are translated into U.S. dollars at current exchange rates. Purchases and sales of investment securities, income, and expenses are translated at the exchange rate prevailing on the respective dates of such transactions. Unrealized gains and losses that result from changes in foreign exchange rates and/or changes in market prices of securities have been included in unrealized appreciation/depreciation on investments and foreign currency translations. Net realized foreign currency gains and losses resulting from changes in exchange rates include foreign currency gains and losses between trade date and settlement date on investment securities transactions, foreign currency transactions, and the difference between the amounts of interest and dividends recorded on the books of the Fund and the amounts actually received. The portion of foreign currency gains and losses related to fluctuation in exchange rates between the initial purchase trade date and subsequent sale trade date is included in realized gain/(loss) on investments.
Foreign Securities. The Fund may directly purchase securities of foreign issuers. Investing in securities of foreign issuers involves special risks not typically associated with investing in securities of U.S. issuers. The risks include possible revaluation of currencies, the inability to repatriate funds, less complete financial information about companies, and possible future adverse political and economic developments. Moreover, securities of many foreign issuers and their markets may be less liquid and their prices more volatile than securities of comparable U.S. issuers.
19
Gabelli Enterprise Mergers and Acquisitions Fund
Notes to Financial Statements (Continued)
Foreign Taxes. The Fund may be subject to foreign taxes on income, gains on investments, or currency repatriation, a portion of which may be recoverable. The Fund will accrue such taxes and recoveries as applicable, based upon its current interpretation of tax rules and regulations that exist in the markets in which it invests.
Securities Sold Short. The Fund may enter into short sale transactions. Short selling involves selling securities that may or may not be owned and, at times, borrowing the same securities for delivery to the purchaser, with an obligation to replace such borrowed securities at a later date. The proceeds received from short sales are recorded as liabilities and the Fund records an unrealized gain or loss to the extent of the difference between the proceeds received and the value of an open short position on the day of determination. The Fund records a realized gain or loss when the short position is closed out. By entering into a short sale, the Fund bears the market risk of an unfavorable change in the price of the security sold short. Dividends on short sales are recorded as an expense by the Fund on the ex-dividend date and interest expense is recorded on the accrual basis. The broker retains collateral for the value of the open positions, which is adjusted periodically as the value of the position fluctuates. At October 31, 2017, there were no short sales outstanding.
Restricted Securities. The Fund may invest up to 15% of its net assets in securities for which the markets are restricted. Restricted securities include securities whose disposition is subject to substantial legal or contractual restrictions. The sale of restricted securities often requires more time and results in higher brokerage charges or dealer discounts and other selling expenses than the sale of securities eligible for trading on national securities exchanges or in the over-the-counter markets. Restricted securities may sell at a price lower than similar securities that are not subject to restrictions on resale. Securities freely saleable among qualified institutional investors under special rules adopted by the SEC may be treated as liquid if they satisfy liquidity standards established by the Board. The continued liquidity of such securities is not as well assured as that of publicly traded securities, and accordingly the Board will monitor their liquidity. At October 31, 2017, the Fund did not hold restricted securities.
Securities Transactions and Investment Income. Securities transactions are accounted for on the trade date with realized gain or loss on investments determined by using the identified cost method. Interest income (including amortization of premium and accretion of discount) is recorded on the accrual basis. Premiums and discounts on debt securities are amortized using the effective yield to maturity method. Dividend income is recorded on the ex-dividend date, except for certain dividends from foreign securities that are recorded as soon after the ex-dividend date as the Fund becomes aware of such dividends.
Determination of Net Asset Value and Calculation of Expenses. Certain administrative expenses are common to, and allocated among, various affiliated funds. Such allocations are made on the basis of each fund’s average net assets or other criteria directly affecting the expenses as determined by the Adviser pursuant to procedures established by the Board.
In calculating the NAV per share of each class, investment income, realized and unrealized gains and losses, redemption fees, and expenses other than class specific expenses are allocated daily to each class of shares based upon the proportion of net assets of each class at the beginning of each day. Distribution expenses are borne solely by the class incurring the expense.
Distributions to Shareholders. Distributions to shareholders are recorded on the ex-dividend date. Distributions to shareholders are based on income and capital gains as determined in accordance with federal income tax
20
Gabelli Enterprise Mergers and Acquisitions Fund
Notes to Financial Statements (Continued)
regulations, which may differ from income and capital gains as determined under GAAP. These differences are primarily due to differing treatments of income and gains on various investment securities and foreign currency transactions held by the Fund. These book/tax differences are either temporary or permanent in nature. To the extent these differences are permanent, adjustments are made to the appropriate capital accounts in the period when the differences arise. Permanent differences were primarily due to the write-off of current year net operating loss and the reclass of capital gains on passive foreign investment companies. These reclassifications have no impact on the NAV of the Fund. For the year ended October 31, 2017, reclassifications were made to decrease accumulated net investment loss by $323,798 and increase distributions in excess of net realized gain on investments and foreign currency transactions by $6,752, with an offsetting adjustment to paid-in capital.
No distributions were made during the fiscal years ended October 31, 2017 or 2016.
Provision for Income Taxes. The Fund intends to continue to qualify as a regulated investment company under Subchapter M of the Internal Revenue Code of 1986, as amended (the “Code”). It is the policy of the Fund to comply with the requirements of the Code applicable to regulated investment companies and to distribute substantially all of its net investment company taxable income and net capital gains. Therefore, no provision for federal income taxes is required.
At October 31, 2017, the components of accumulated earnings/losses on a tax basis were as follows:
| | | | |
Undistributed long term capital gains | | $ | 2,191,591 | |
Net unrealized appreciation on investments and foreign currency translations | | | 10,732,626 | |
Qualified late year loss deferral* | | | (571,432 | ) |
| | | | |
Total | | $ | 12,352,785 | |
| | | | |
| * | Qualified late year losses relate to ordinary losses incurred after December 31, 2016 through the Fund’s October 31, 2017 fiscal year end which were elected to be treated as if they occurred on the first day of the following fiscal year November 1, 2017. |
The Fund is permitted to carry forward for an unlimited period capital losses incurred in fiscal years beginning after December 22, 2010. In addition, these losses must be utilized prior to the losses incurred in pre-enactment taxable years. As a result of the rule, pre-enactment capital loss carryforwards may have an increased likelihood of expiring unused. Additionally, post enactment capital losses that are carried forward will retain their character as either short term or long term capital losses rather than being considered all short term as under previous law.
During the year ended October 31, 2017, the Fund utilized capital loss carryforwards of $3,057,974.
At October 31, 2017, the temporary differences between book basis and tax basis unrealized appreciation on investments were primarily due to deferral of losses from wash sales for tax purposes.
The following summarizes the tax cost of investments and the related net unrealized appreciation/depreciation at October 31, 2017:
| | | | | | | | | | | | | | | | |
| | | | | | Gross | | | Gross | | | | |
| | | | | | Unrealized | | | Unrealized | | | Net Unrealized | |
| | | Cost | | | Appreciation | | | Depreciation | | | Appreciation | |
Investments | | | $148,879,875 | | | | $22,599,806 | | | | $(11,941,227) | | | | $10,658,579 | |
The Fund is required to evaluate tax positions taken or expected to be taken in the course of preparing the Fund’s tax returns to determine whether the tax positions are “more-likely-than-not” of being sustained by the
21
Gabelli Enterprise Mergers and Acquisitions Fund
Notes to Financial Statements (Continued)
applicable tax authority. Income tax and related interest and penalties would be recognized by the Fund as tax expense in the Statement of Operations if the tax positions were deemed not to meet the more-likely-than-not threshold. For the year ended October 31, 2017, the Fund did not incur any income tax, interest, or penalties. As of October 31, 2017, the Adviser has reviewed all open tax years and concluded that there was no impact to the Fund’s net assets or results of operations. The Fund’s federal and state tax returns for the prior three fiscal years remain open, subject to examination. On an ongoing basis, the Adviser will monitor the Fund’s tax positions to determine if adjustments to this conclusion are necessary.
3. Investment Advisory Agreement and Other Transactions. The Fund has entered into an investment advisory agreement (the “Advisory Agreement”) with the Adviser which provides that the Fund will pay the Adviser a fee, computed daily and paid monthly, at annual rates as follows:
| | | | |
First $1 Billion | | | 0.935 | % |
Next $1 Billion | | | 0.910 | % |
Next $3 Billion | | | 0.885 | % |
Next $5 Billion | | | 0.860 | % |
Thereafter | | | 0.835 | % |
In accordance with the Advisory Agreement, the Adviser provides a continuous investment program for the Fund’s portfolio, oversees the administration of all aspects of the Fund’s business and affairs, and pays the compensation of all Officers and Directors of the Fund who are affiliated persons of the Adviser.
As per the approval of the Board, the Fund is allocated a portion of the Chief Compliance Officer’s cost. For the year ended October 31, 2017, the Fund paid or accrued $3,201 in payroll expenses in the Statement of Operations.
The Fund pays each Director who is not considered an affiliated person an annual retainer of $6,000 plus $1,000 for each Board meeting attended, and they are reimbursed by the Fund for any out of pocket expenses incurred in attending meetings. All Board committee members receive $500 per meeting attended and the Chairman of the Audit Committee and the Lead Director receive annual fees of $1,500 and $2,000, respectively. The Chairmen of the Proxy Voting Committee and the Nominating Committee each receive annual fees of $1,000. A Director may receive a single meeting fee, allocated among the participating funds, for participation in certain meetings held on behalf of multiple funds. Directors who are directors or employees of the Adviser or an affiliated company receive no compensation or expense reimbursement from the Fund.
4. Distribution Plan. The Fund’s Board has adopted a distribution plan (the “Plan”) pursuant to Rule 12b-1 under the 1940 Act. Under the Class AAA, Class A, Class C, and Class T Share Plans, payments are authorized to the G.distributors, LLC (the “Distributor”), an affiliate of the Adviser, at annual rates of 0.25%, 0.45%, 1.00%, and 0.25%, respectively, of the average daily net assets of those classes, the annual limitations under each Plan. Such payments are accrued daily and paid monthly. Class Y shares do not participate in the Plan and pay no distribution fees.
5. Portfolio Securities. Purchases and sales of securities during the fiscal year ended October 31, 2017, other than short term securities and U.S. Government obligations, aggregated $143,917,260 and $174,441,974, respectively.
6. Transactions with Affiliates and Other Arrangements. During the fiscal year ended October 31, 2017, the Fund paid $82,154 in brokerage commissions on security trades to G.research, LLC, an affiliate of the
22
Gabelli Enterprise Mergers and Acquisitions Fund
Notes to Financial Statements (Continued)
Adviser. Additionally, the Distributor retained a total of $18,700 from investors representing commissions (sales charges and underwriting fees) on sales and redemptions of Fund shares.
During the fiscal year ended October 31, 2017, the Fund received credits from a designated broker who agreed to pay certain Fund operating expenses. The amount of such expenses paid through this directed brokerage arrangement during this period was $2,486.
The cost of calculating the Fund’s NAV per share is a Fund expense pursuant to the Advisory Agreement. During the year ended October 31, 2017, the Fund paid or accrued $45,000 to the Adviser in connection with the cost of computing the Fund’s NAV.
7. Line of Credit. The Fund participates in an unsecured line of credit, which expires on March 8, 2018 and may be renewed annually, of up to $75,000,000 under which it may borrow up to 10% of its net assets from the custodian for temporary borrowing purposes. Borrowings under this arrangement bear interest at a floating rate equal to the higher of the overnight Federal Funds rate plus 125 basis points or the 30 day LIBOR plus 125 basis points in effect on that day. This amount, if any, would be included in “Interest expense” in the Statement of Operations. During the fiscal year ended October 31, 2017, there were no borrowings under the line of credit.
8. Capital Stock. The Fund offers five classes of shares – Class AAA Shares, Class A Shares, Class C Shares, Class T Shares, and Class Y Shares. Class AAA Shares and Class Y Shares are offered without a sales charge. Class A Shares and Class T Shares are subject to a maximum front-end sales charge of 5.75% and 2.50%, respectively. Class C Shares are subject to a 1.00% contingent deferred sales charge for one year after purchase.
The Fund imposes a redemption fee of 2.00% on all classes of shares that are redeemed or exchanged on or before the seventh day after the date of a purchase. The redemption fee is deducted from the proceeds otherwise payable to the redeeming shareholders and is retained by the Fund as an increase in paid-in capital. The redemption fees retained by the Fund during the fiscal years ended October 31, 2017 and 2016, if any, can be found in the Statement of Changes in Net Assets under Redemption Fees.
23
Gabelli Enterprise Mergers and Acquisitions Fund
Notes to Financial Statements (Continued)
Transactions in shares of capital stock were as follows:
| | | | | | | | | | | | | | | | |
| | | Year Ended | | | Year Ended | |
| | | October 31, 2017 | | | October 31, 2016 | |
| | | Shares | | | Amount | | | Shares | | | Amount | |
Class AAA | | | | | | | | | | | | | | | | |
Shares sold | | | 193,723 | | | $ | 2,842,300 | | | | 109,756 | | | $ | 1,478,333 | |
Shares redeemed. | | | (79,988 | ) | | | (1,162,642 | ) | | | (180,147 | ) | | | (2,401,290 | ) |
| | | | | | | | | | | | | | | | |
Net increase/(decrease) | | | 113,735 | | | $ | 1,679,658 | | | | (70,391 | ) | | $ | (922,957 | ) |
| | | | | | | | | | | | | | | | |
Class A | | | | | | | | | | | | | | | | |
Shares sold | | | 866,377 | | | $ | 12,431,219 | | | | 416,097 | | | $ | 5,502,463 | |
Shares redeemed. | | | (1,337,399 | ) | | | (19,353,565 | ) | | | (1,170,599 | ) | | | (15,501,180 | ) |
| | | | | | | | | | | | | | | | |
Net decrease. | | | (471,022 | ) | | $ | (6,922,346 | ) | | | (754,502 | ) | | $ | (9,998,717 | ) |
| | | | | | | | | | | | | | | | |
Class C | | | | | | | | | | | | | | | | |
Shares sold | | | 280,102 | | | $ | 3,702,094 | | | | 383,150 | | | $ | 4,699,402 | |
Shares redeemed. | | | (1,028,728 | ) | | | (13,623,233 | ) | | | (1,174,428 | ) | | | (14,434,728 | ) |
| | | | | | | | | | | | | | | | |
Net decrease. | | | (748,626 | ) | | $ | (9,921,139 | ) | | | (791,278 | ) | | $ | (9,735,326 | ) |
| | | | | | | | | | | | | | | | |
Class T (a) | | | | | | | | | | | | | | | | |
Shares sold | | | 69 | | | $ | 1,000 | | | | | | | | | |
| | | | | | | | | | | | | | | | |
Net increase | | | 69 | | | $ | 1,000 | | | | | | | | | |
| | | | | | | | | | | | | | | | |
Class Y | | | | | | | | | | | | | | | | |
Shares sold | | | 1,608,156 | | | $ | 24,565,072 | | | | 1,326,196 | | | $ | 18,659,209 | |
Shares redeemed. | | | (1,357,978 | ) | | | (20,702,593 | ) | | | (2,677,853 | ) | | | (37,009,209 | ) |
| | | | | | | | | | | | | | | | |
Net increase/(decrease) | | | 250,178 | | | $ | 3,862,479 | | | | (1,351,657 | ) | | $ | (18,350,000 | ) |
| | | | | | | | | | | | | | | | |
| (a) | Class T Shares were initially offered on June 30, 2017. |
9. Indemnifications. The Fund enters into contracts that contain a variety of indemnifications. The Fund’s maximum exposure under these arrangements is unknown. However, the Fund has not had prior claims or losses pursuant to these contracts. Management has reviewed the Fund’s existing contracts and expects the risk of loss to be remote.
10. Subsequent Events. Management has evaluated the impact on the Fund of all subsequent events occurring through the date the financial statements were issued and has determined that there were no subsequent events requiring recognition or disclosure in the financial statements.
24
Gabelli Enterprise Mergers and Acquisitions Fund
Report of Independent Registered Public Accounting Firm
To the Board of Directors of Gabelli 787 Fund, Inc. and the Shareholders of Gabelli Enterprise Mergers and Acquisitions Fund:
In our opinion, the accompanying statement of assets and liabilities, including the schedule of investments, and the related statements of operations and of changes in net assets and the financial highlights present fairly, in all material respects, the financial position of Gabelli Enterprise Mergers and Acquisitions Fund (a series of the Gabelli 787 Fund, Inc. and hereafter referred to as the “Fund”) as of October 31, 2017, the results of its operations for the year then ended, the changes in its net assets for each of the two years in the period then ended and the financial highlights for each of the periods indicated, in conformity with accounting principles generally accepted in the United States of America. These financial statements and financial highlights (hereafter referred to as “financial statements”) are the responsibility of the Fund’s management. Our responsibility is to express an opinion on these financial statements based on our audits. We conducted our audits of these financial statements in accordance with the standards of the Public Company Accounting Oversight Board (United States). Those standards require that we plan and perform the audit to obtain reasonable assurance about whether the financial statements are free of material misstatement. An audit includes examining, on a test basis, evidence supporting the amounts and disclosures in the financial statements, assessing the accounting principles used and significant estimates made by management, and evaluating the overall financial statement presentation. We believe that our audits, which included confirmation of securities as of October 31, 2017 by correspondence with the custodian and brokers, provide a reasonable basis for our opinion.
PricewaterhouseCoopers LLP
New York, New York
December 20, 2017
25
Gabelli Enterprise Mergers and Acquisitions Fund
Additional Fund Information (Unaudited)
The business and affairs of the Fund are managed under the direction of the Fund’s Board of Directors. Information pertaining to the Directors and officers of the Fund is set forth below. The Fund’s Statement of Additional Information includes additional information about the Fund’s Directors and is available without charge, upon request, by calling 800-GABELLI (800-422-3554) or by writing to the Gabelli Enterprise Mergers and Acquisitions Fund at One Corporate Center, Rye, NY 10580-1422.
| | | | | | | | | | |
Name, Position(s) Address1 and Age | | Term of Office
and Length of
Time Served2 | | Number of Funds
in Fund Complex
Overseen by Director | | | Principal Occupation(s) During Past Five Years | | Other Directorships Held by Director4 |
| | | | |
INTERESTED DIRECTORS3 : | | | | | | | | | | |
| | | | |
Regina M. Pitaro Director Age: 62 | | Since 2008 | | | 1 | | | Managing Director of GAMCO Asset Management, Inc. | | — |
| | | | |
INDEPENDENT DIRECTORS5 : | | | | | | | | | | |
| | | | |
Anthony J. Colavita Director Age: 81 | | Since 2008 | | | 28 | | | President of the law firm of Anthony J. Colavita, P.C. | | — |
| | | | |
James P. Conn Director Age: 79 | | Since 2008 | | | 27 | | | Former Managing Director and Chief Investment Officer of Financial Security Assurance Holdings Ltd. (1992-1998) | | — |
| | | | |
Vincent D. Enright Director Age: 73 | | Since 2008 | | | 17 | | | Former Senior Vice President and Chief Financial Officer of KeySpan Corp. (public utility) (1994-1998) | | Director of Echo Therapeutics, Inc. (therapeutics and diagnostics) (2008-2014); Director of the LGL Group, Inc. (diversified manufacturing) (2011-2014) |
| | | | |
Arthur V. Ferrara Director Age: 87 | | Since 2008 | | | 8 | | | Former Chairman of the Board and Chief Executive Officer of The Guardian Life Insurance Company of America (1993-1995) | | — |
| | | | |
Kuni Nakamura Director Age: 49 | | Since 2008 | | | 33 | | | President of Advanced Polymer, Inc. (chemical manufacturing company); President of KEN Enterprises, Inc. (real estate) | | — |
| | | | |
Salvatore M. Salibello Director Age: 72 | | Since 2016 | | | 6 | | | Former director of Kids Brand, Inc. (consumer products) – no longer in business; Senior Partner of Bright Side Consulting (consulting); Certified Public Accountant and Managing Partner of the certified public accounting firm of Salibello & Broder LLP (1978-2012); Partner of BDO Seidman, LLP (2012-2013) | | Director of Kid Brands, Inc. (consumer products) (2002- 2014) |
| | | | |
Salvatore J. Zizza Director Age: 71 | | Since 2008 | | | 30 | | | President of Zizza & Associates Corp. (private holding company); Chairman of Harbor Diversified, Inc. (pharmaceuticals); Chairman of BAM (semiconductor and aerospace manufacturing); Chairman of Bergen Cove Realty Inc.; Chairman of Metropolitan Paper Recycling Inc. (recycling) (2005-2014) | | Director and Vice Chairman of Trans-Lux Corporation (business services); Director and Chairman of Harbor Diversified Inc. (pharmaceuticals); Director, Chairman, and CEO of General Employment Enterprises (staffing services) (2009-2012) |
26
Gabelli Enterprise Mergers and Acquisitions Fund
Additional Fund Information (Continued) (Unaudited)
| | | | |
Name, Position(s) Address1 and Age | | Term of Office and Length of
Time Served2 | | Principal Occupation(s) During Past Five Years |
OFFICERS: | | | | |
| | |
Bruce N. Alpert President Age: 65 | | Since 2008 | | Executive Vice President and Chief Operating Officer of Gabelli Funds, LLC since 1988; Officer of registered investment companies within the Gabelli/GAMCO/Teton Fund Complex; Senior Vice President of GAMCO Investors, Inc. since 2008; Director of Teton Advisors, Inc., 1998-2012 |
| | |
Agnes Mullady Vice President Age: 59 | | Since 2008 | | Officer of all of the registered investment companies within the Gabelli/GAMCO/Teton Fund Complex since 2006; President and Chief Operating Officer of the Fund Division of Gabelli Funds, LLC since 2015; Chief Executive Officer of G.distributors, LLC since 2010; Senior Vice President of GAMCO Investors, Inc. since 2009; Vice President of Gabelli Funds, LLC since 2007; Executive Vice President of Associated Capital Group, Inc. since 2016 |
| | |
Andrea R. Mango Secretary Age: 45 | | Since 2013 | | Vice President of GAMCO Investors, Inc. since 2016; Counsel of Gabelli Funds, LLC since 2013; Secretary of all registered investment companies within the Gabelli/GAMCO/Teton Fund Complex since 2013; Vice President of all closed-end funds within the Gabelli/ GAMCO/Teton Fund Complex since 2014; Corporate Vice President within the Corporate Compliance Department of New York Life Insurance Company, 2011-2013; Vice President and Counsel of Deutsche Bank, 2006-2011 |
| | |
John C. Ball Treasurer Age: 41 | | Since 2017 | | Treasurer of funds within the Gabelli/GAMCO/Teton Fund Complex (closed-end funds since May 2017 and open-end funds since February 2017); Vice President and Assistant Treasurer of AMG Funds, 2014-2017; Vice President of State Street Corporation, 2007- 2014 |
| | |
Richard J. Walz Chief Compliance Officer Age: 58 | | Since 2013 | | Chief Compliance Officer of all of the registered investment companies within the Gabelli/ GAMCO/Teton Fund Complex since 2013; Chief Compliance Officer of AEGON USA Investment Management, 2011-2013; Chief Compliance Officer of Cutwater Asset Management, 2004-2011 |
| 1 | Address: One Corporate Center, Rye, NY 10580-1422, unless otherwise noted. |
| 2 | Each Director will hold office for an indefinite term until the earliest of (i) the next meeting of shareholders, if any, called for the purpose of considering the election or re-election of such Director and until the election and qualification of his or her successor, if any, elected at such meeting, or (ii) the date a Director resigns or retires, or a Director is removed by the Board of Directors or shareholders, in accordance with the Fund’s By-Laws and Articles of Incorporation. Each officer will hold office for an indefinite term until the date he or she resigns or retires or until his or her successor is elected and qualified. |
| 3 | “Interested person” of the Fund as defined in the 1940 Act. Ms. Pitaro is considered an “interested person” because of her affiliation with Gabelli Funds, LLC that acts as the Fund’s investment adviser. |
| 4 | This column includes only directorships of companies required to report to the SEC under the Securities Exchange Act of 1934, as amended, i.e., public companies, or other investment companies registered under the 1940 Act. |
| 5 | Directors who are not interested persons are considered “Independent” Directors. |
Portfolio Manager Biography
Mario J. Gabelli, CFA, is Chairman, Chief Executive Officer, and Chief Investment Officer - Value Portfolios of GAMCO Investors, Inc. that he founded in 1977, and Chief Investment Officer - Value Portfolios of Gabelli Funds, LLC and GAMCO Asset Management Inc. He is also Executive Chairman of Associated Capital Group, Inc. Mr. Gabelli is a summa cum laude graduate of Fordham University and holds an MBA degree from Columbia Business School and Honorary Doctorates from Fordham University and Roger Williams University.
27
GABELLI ENTERPRISE MERGERS AND
ACQUISITIONS FUND
A Portfolio of the Gabelli 787 Fund, Inc.
One Corporate Center
Rye, New York 10580-1422
t 800-GABELLI (800-422-3554)
f 914-921-5118
e info@gabelli.com
GABELLI.COM
Net Asset Value per share available daily
by calling 800-GABELLI after 7:00 P.M.
| | |
BOARD OF DIRECTORS | | OFFICERS |
| |
Anthony J. Colavita President, Anthony J. Colavita, P.C. James P. Conn Former Managing Director and Chief Investment Officer, Financial Security Assurance Holdings Ltd. Vincent D. Enright Former Senior Vice President and, Chief Financial Officer, KeySpan Corporation Arthur V. Ferrara Former Chairman and Chief Executive Officer, Guardian Life Insurance Company of America Kuni Nakamura President, Advanced Polymer, Inc. Regina M. Pitaro Managing Director, GAMCO Asset Management Inc. Salvatore M. Salibello Senior Partner, Bright Side Consulting Salvatore J. Zizza Chairman, Zizza & Associates Corp. | | Bruce N. Alpert President Agnes Mullady Vice President Andrea R. Mango Secretary John C. Ball Treasurer Richard J. Walz Chief Compliance Officer DISTRIBUTOR G.distributors, LLC CUSTODIAN, TRANSFER AGENT, AND DIVIDEND DISBURSING AGENT State Street Bank and Trust Company LEGAL COUNSEL Paul Hastings LLP |
|
This report is submitted for the general information of the shareholders of the Gabelli Enterprise Mergers and Acquisitions Fund. It is not authorized for distribution to prospective investors unless preceded or accompanied by an effective prospectus. |
GAB208Q417AR
Item 2. Code of Ethics.
| | (a) | The registrant, as of the end of the period covered by this report, has adopted a code of ethics that applies to the registrant’s principal executive officer, principal financial officer, principal accounting officer or controller, or persons performing similar functions, regardless of whether these individuals are employed by the registrant or a third party. |
| | (c) | There have been no amendments, during the period covered by this report, to a provision of the code of ethics that applies to the registrant’s principal executive officer, principal financial officer, principal accounting officer or controller, or persons performing similar functions, regardless of whether these individuals are employed by the registrant or a third party, and that relates to any element of the code of ethics description. |
| | (d) | The registrant has not granted any waivers, including an implicit waiver, from a provision of the code of ethics that applies to the registrant’s principal executive officer, principal financial officer, principal accounting officer or controller, or persons performing similar functions, regardless of whether these individuals are employed by the registrant or a third party, that relates to one or more of the items set forth in paragraph (b) of this item’s instructions. |
Item 3. Audit Committee Financial Expert.
As of the end of the period covered by the report, the registrant’s board of directors has determined that Salvatore M. Salibello is qualified to serve as an audit committee financial expert serving on its audit committee and that he is “independent,” as defined by Item 3 of Form N-CSR.
Item 4. Principal Accountant Fees and Services.
Audit Fees
| | (a) | The aggregate fees billed for each of the last two fiscal years for professional services rendered by the principal accountant for the audit of the registrant’s annual financial statements or services that are normally provided by the accountant in connection with statutory and regulatory filings or engagements for those fiscal years are $21,205 in 2016 and $21,205 in 2017. |
Audit-Related Fees
| | (b) | The aggregate fees billed in each of the last two fiscal years for assurance and related services by the principal accountant that are reasonably related to the performance of the audit of the registrant’s financial statements and are not reported under paragraph (a) of this Item are $0 in 2016 and $0 in 2017. |
Tax Fees
| | (c) | The aggregate fees billed in each of the last two fiscal years for professional services rendered by the principal accountant for tax compliance, tax advice, and tax planning are $4,190in 2016 and $4,190 in 2017. Tax fees include amounts related to tax compliance, tax reporting and tax planning. |
All Other Fees
| | (d) | The aggregate fees billed in each of the last two fiscal years for products and services provided by the principal accountant, other than the services reported in paragraphs (a) through (c) of this Item are $0 in 2016 and $0 in 2017. |
| | (e)(1) | Disclose the audit committee’s pre-approval policies and procedures described in paragraph (c)(7) of Rule 2-01 of Regulation S-X. |
Pre-Approval Policies and Procedures. The Audit Committee (“Committee”) of the registrant is responsible for pre-approving (i) all audit and permissible non-audit services to be provided by the independent registered public accounting firm to the registrant and (ii) all permissible non-audit services to be provided by the independent registered public accounting firm to the Adviser, Gabelli Funds, LLC, and any affiliate of Gabelli Funds, LLC (“Gabelli”) that provides services to the registrant (a “Covered Services Provider”) if the independent registered public accounting firm’s engagement related directly to the operations and financial reporting of the registrant. The Committee may delegate its responsibility to pre-approve any such audit and permissible non-audit services to the Chairperson of the Committee, and the Chairperson must report to the Committee, at its next regularly scheduled meeting after the Chairperson’s pre-approval of such services, his or her decision(s). The Committee may also establish detailed pre-approval policies and procedures for pre-approval of such services in accordance with applicable laws, including the delegation of some or all of the Committee’s pre-approval responsibilities to the other persons (other than Gabelli or the registrant’s officers). Pre-approval by the Committee of any permissible non-audit services is not required so long as: (i) the permissible non-audit services were not recognized by the registrant at the time of the engagement to be non-audit services; and (ii) such services are promptly brought to the attention of the Committee and approved by the Committee or Chairperson prior to the completion of the audit.
| | (e)(2) | The percentage of services described in each of paragraphs (b) through (d) of this Item that were approved by the audit committee pursuant to paragraph (c)(7)(i)(C) of Rule 2-01 of Regulation S-X are as follows: |
| | (f) | The percentage of hours expended on the principal accountant’s engagement to audit the registrant’s financial statements for the most recent fiscal year that were attributed to work performed by persons other than the principal accountant’s full-time, permanent employees was zero percent. |
| | (g) | The aggregate non-audit fees billed by the registrant’s accountant for services rendered to the registrant, and rendered to the registrant’s investment adviser (not including any sub-adviser whose role is primarily portfolio management and is subcontracted with or overseen by another investment adviser), and any entity controlling, controlled by, or under common control with the adviser that provides ongoing services to the registrant for each of the last two fiscal years of the registrant was $0 in 2016 and $0 in 2017. |
| | (h) | The registrant’s audit committee of the board of directors has considered whether the provision of non-audit services that were rendered to the registrant’s investment adviser (not including any sub-adviser whose role is primarily portfolio management and is subcontracted with or overseen by another investment adviser), and any entity controlling, controlled by, or under common control with the investment adviser that provides ongoing services to the registrant that were not pre-approved pursuant to paragraph (c)(7)(ii) of Rule 2-01 of Regulation S-X is compatible with maintaining the principal accountant’s independence. |
Item 5. Audit Committee of Listed Registrants.
Not applicable.
Item 6. Investments.
| (a) | Schedule of Investments in securities of unaffiliated issuers as of the close of the reporting period is included as part of the report to shareholders filed under Item 1 of this form. |
Item 7. Disclosure of Proxy Voting Policies and Procedures for Closed-End Management Investment Companies.
Not applicable.
Item 8. Portfolio Managers of Closed-End Management Investment Companies.
Not applicable.
Item 9. Purchases of Equity Securities by Closed-End Management Investment Company and Affiliated Purchasers.
Not applicable.
Item 10. Submission of Matters to a Vote of Security Holders.
There have been no material changes to the procedures by which the shareholders may recommend nominees to the registrant’s board of directors, where those changes were implemented after the registrant last provided disclosure in response to the requirements of Item 407(c)(2)(iv) of Regulation S-K (17 CFR 229.407) (as required by Item 22(b)(15) of Schedule 14A (17 CFR 240.14a-101)), or this Item.
Item 11. Controls and Procedures.
| | (a) | The registrant’s principal executive and principal financial officers, or persons performing similar functions, have concluded that the registrant’s disclosure controls and procedures (as defined in Rule 30a-3(c) under the Investment Company Act of 1940, as amended (the “1940 Act”) (17 CFR 270.30a-3(c))) are effective, as of a date within 90 days of the filing date of the report that includes the disclosure required by this paragraph, based on their evaluation of these controls and procedures required by Rule 30a-3(b) under the 1940 Act (17 CFR 270.30a-3(b)) and Rules 13a-15(b) or 15d-15(b) under the Securities Exchange Act of 1934, as amended (17 CFR 240.13a-15(b) or 240.15d-15(b)). |
| | (b) | There were no changes in the registrant’s internal control over financial reporting (as defined in Rule 30a-3(d) under the 1940 Act (17 CFR 270.30a-3(d))) that occurred during the registrant’s last fiscal quarter that has materially affected, or is reasonably likely to materially affect, the registrant’s internal control over financial reporting. |
Item 12. Disclosure of Securities Lending Activities for Closed-End Management Investment Companies.
Not applicable.
Item 13. Exhibits.
| | (a)(1) | Code of ethics, or any amendment thereto, that is the subject of disclosure required by Item 2 is attached hereto. |
| | (a)(2) | Certifications pursuant to Rule 30a-2(a) under the 1940 Act and Section 302 of the Sarbanes-Oxley Act of 2002 are attached hereto. |
| | (b) | Certifications pursuant to Rule 30a-2(b) under the 1940 Act and Section 906 of the Sarbanes-Oxley Act of 2002 are attached hereto. |
SIGNATURES
Pursuant to the requirements of the Securities Exchange Act of 1934 and the Investment Company Act of 1940, the registrant has duly caused this report to be signed on its behalf by the undersigned, thereunto duly authorized.
(Registrant) Gabelli 787 Fund, Inc.
By (Signature and Title)* /s/ Bruce N. Alpert
Bruce N. Alpert, Principal Executive Officer
Date 12/27/2017
Pursuant to the requirements of the Securities Exchange Act of 1934 and the Investment Company Act of 1940, this report has been signed below by the following persons on behalf of the registrant and in the capacities and on the dates indicated.
By (Signature and Title)* /s/ Bruce N. Alpert
Bruce N. Alpert, Principal Executive Officer
Date 12/27/2017
By (Signature and Title)* /s/ John C. Ball
John C. Ball, Principal Financial Officer and Treasurer
Date 12/27/2017
* Print the name and title of each signing officer under his or her signature.