UNITED STATES
SECURITIES AND EXCHANGE COMMISSION
Washington, D.C. 20549
FORMN-CSR
CERTIFIED SHAREHOLDER REPORT OF REGISTERED MANAGEMENT
INVESTMENT COMPANIES
Investment Company Act file number 811-22041
Gabelli 787 Fund, Inc.
(Exact name of registrant as specified in charter)
One Corporate Center
Rye, New York 10580-1422
(Address of principal executive offices) (Zip code)
Bruce N. Alpert
Gabelli Funds, LLC
One Corporate Center
Rye, New York 10580-1422
(Name and address of agent for service)
Registrant’s telephone number, including area code: 1-800-422-3554
Date of fiscal year end: October 31
Date of reporting period: October 31, 2019
FormN-CSR is to be used by management investment companies to file reports with the Commission not later than 10 days after the transmission to stockholders of any report that is required to be transmitted to stockholders under Rule30e-1 under the Investment Company Act of 1940 (17 CFR270.30e-1). The Commission may use the information provided on FormN-CSR in its regulatory, disclosure review, inspection, and policymaking roles.
A registrant is required to disclose the information specified by FormN-CSR, and the Commission will make this information public. A registrant is not required to respond to the collection of information contained in FormN-CSR unless the Form displays a currently valid Office of Management and Budget (“OMB”) control number. Please direct comments concerning the accuracy of the information collection burden estimate and any suggestions for reducing the burden to Secretary, Securities and Exchange Commission, 450 Fifth Street, NW, Washington, DC 20549-0609. The OMB has reviewed this collection of information under the clearance requirements of 44 U.S.C. § 3507.
Item 1. Reports to Stockholders.
The Report to Shareholders is attached herewith.
Gabelli Enterprise Mergers and Acquisitions Fund
Annual Report
October 31, 2019
To Our Shareholders,
For the fiscal year ended October 31, 2019, the net asset value (NAV) per Class A Share of the Gabelli Enterprise Mergers and Acquisitions Fund increased 3.4% compared with an increase of 14.3% for the Standard & Poor’s (S&P) 500 Index. The performance of the ICE Bank of America Merrill Lynch 3 Month U.S. Treasury Bill Index for this year was 2.4%. Other classes of shares are available. See page 4 for additional performance information for all classes.
Enclosed are the financial statements, including the schedule of investments, as of October 31, 2019.
Performance Discussion (Unaudited)
Global merger and acquisition (M&A) activity has been historically strong over the last three years, and the trend continued through the first nine months of 2019. Global deal volumes totaled $2.8 trillion in this period, the fourth highest level recorded during the first nine months of a year since 1980. Although volumes were still strong, deal making actually declined 10% year over year and sequentially, as M&A activity in third quarter fell 28% from second quarter levels. In part, the slowdown can be explained by a decline in the number of announced transactions during the period, which fell 10% year over year to a five year low.
Cross border mergers and acquisitions were weak, totaling $841.7 billion for the first nine months of the year, representing a 32% decline from last year’s levels. This reflects continued uncertainties related to macroeconomic and geopolitical factors, including ongoing trade negotiations between the U.S. and China. International deal activity remained subdued in both Europe and Asia, with the former registering a decrease of 31% year over year and the latter down by 21%, registering a five year low. M&A activity in Japan did not fare better, showing a 7% contraction from last year’s level. However, in stark contrast to the figures above, domestic M&A activity continued its strong pace. During the first nine months of the year, M&A activity for the United States totaled approximately $1.4 trillion, the strongest start to a year on record.
On a sector specific basis, Healthcare continues to dominate the top spot, with $437.1 billion of volume in the first nine months of the year, representing a year over year increase of 22% and record level of activity. Energy and Power trailed Healthcare, accounting for 14% of overall volume in the period, while Technology rounds out the top three, accounting for 12% of activity.
Beginning on January 1, 2021, as permitted by regulations adopted by the Securities and Exchange Commission, paper copies of the Fund’s annual and semiannual shareholder reports will no longer be sent by mail, unless you specifically request paper copies of the reports. Instead, the reports will be made available on the Fund’s website (www.gabelli.com), and you will be notified by mail each time a report is posted and provided with a website link to access the report. If you already elected to receive shareholder reports electronically, you will not be affected by this change and you need not take any action. To elect to receive all future reports on paper free of charge, please contact your financial intermediary, or, if you invest directly with the Fund, you may call800-422-3554 or send an email request to info@gabelli.com.
Selected deals that closed during the Fund’s fiscal year
Apptio Inc.is a Bellevue, Washington based software company that allows clients to manage and optimize their IT assets. On November 11, 2018, APTI agreed to be acquired by Vista Equity Partners for $38 cash per share, or $1.94 billion. The merger was subject to a shareholder vote and regulatory approvals and closed on January 11, 2019.
Esterline Technologies Corporationis a Bellevue, Washington based aerospace and defense company. On October 10, 2018, Esterline agreed to be acquired by TransDigm for $122.50 per share in cash in a $4 billion merger. The deal was subject to approval by shareholders and regulators and closed on March 14, 2019.
Imperva Inc.is a Redwood Shores, California based cyber security company. On October 10, 2018, IMPV agreed to be acquired by private equity firm Thoma Bravo for $55.75 cash in a $2.1 billion merger to round out its technology and software portfolio. The deal was subject to shareholder and regulatory approvals and closed on January 11, 2019.
Shire plcis a Dublin, Ireland based biotech company focused on hematology, immunology, and oncology. On May 8, 2018, SHPG agreed to be acquired by Takeda Pharmaceutical Company Limited for $30.33 per share in cash plus 0.839 new Takeda share per ordinary share, representing a GBP 46 billion valuation. The deal was subject to shareholder and regulatory approvals and closed on January 8, 2019.
Valero Energy Partners LPis a San Antonio, Texas based MLP formed by Valero Energy Corp. to own, operate, and develop crude oil and refine petroleum pipelines and terminals. On October 18, 2018, VLP agreed to be acquired by Valero Energy Corp. for $42.25 cash per share or $950 million. The merger was subject to a shareholder vote and regulatory approvals and closed on January 10, 2019.
ESARO Inc.is a Waltham, Massachusetts based biotech company focused on PARP inhibitors for cancer. Its main drug is known as Zejula. On December 3, 2018, TSRO agreed to be acquired by GlaxoSmithKline plc for $75 cash per share, or $5.1 billion in a tender offer. The deal was subject to a minimum tender threshold and regulatory approvals and closed on January 23, 2019.
Twenty-First Century Fox Inc.is a New York, New York based media company. On December 14, 2017, The Walt Disney Company announced it would acquire FOX in an all stock merger worth about $30 per share at the time. Shareholders would also receive shares in a spinoff entity which would house various Fox stations including Fox Broadcasting. Subsequent to this, Comcast Corporation came in with a rival bid of $35 per share in cash. Disney countered and won the bidding war with a $38 cash and stock bid for FOX. After a lengthy regulatory process and merger approval, the merger closed on March 19, 2019.
CA, Inc.is a New York, New York based software company. On July 11, 2018 CA agreed to be acquired by Broadcom Inc. for $44.50 per share in cash representing an $18.4 billion total enterprise value. The deal was subject to shareholder and regulatory approvals and closed on November 6, 2018.
Multi-Color Corp.is a Batavia, Ohio based labels company. On February 25, 2019, Platinum Equity LLC, which is based in California, agreed to pay $50 cash per share or $2.5 billion for Multi-Color. The merger was subject to receiving shareholder and regulatory approvals and closed on July 2, 2019.
| 2 |
Red Hat Inc.is a Raleigh, North Carolina based open source software products company. On October 28, 2018, RHT agreed to be acquired by IBM for $190 cash per share. As part of its strategy, the transaction will help IBM diversify its client offerings. The $34 billion merger successfully obtained shareholder and regulatory approvals and closed on July 9, 2019.
Array BioPharma Inc.is a Boulder, Colorado based oncology company. On June 17, 2019, Pfizer Inc. announced it would acquire Array for $48 cash per share in an $11 billion tender offer. The deal brings Pfizer further into the cancer treatment space. The tender required a minimum number of shares to participate, as well as domestic and foreign regulatory approvals. It closed on July 31, 2019.
Tableau Software Inc.is a Seattle, Washington based developer of enterprise software focused on data analytics. On June 10, 2019, Salesforce.com announced a $15 billion tender offer for the company. The consideration consisted of 1.103 shares of Salesforce.com for every share of Tableau, resulting in the company shareholders owning approximately 11% of the combined company. The tender offer, which was conditional upon Tableau shareholders tendering at least a majority of the company’s shares outstanding, expired on July 31, 2019. The transaction closed the next day on August 1, 2019.
Anadarko Petroleum Corp.is an oil company based in The Woodlands, Texas. On April 12, 2019, the company entered into a merger agreement with Chevron in which Chevron would pay cash and stock worth approximately $65 per share. Subsequently, Occidental Petroleum overbid, and eventually offered $59 cash + 0.2934 OXY shares for each Anadarko share outstanding, valuing the company at $76 per share. Chevron dropped its bid, and the Anadarko board recommended Occidental’s offer. The deal was subject to regulatory approvals and a shareholder vote on Anadarko’s side. It closed on August 9, 2019.
WageWorks Inc.is a San Mateo, California based retirement services company. On June 27, 2019, HealthEquity Inc. announced it would acquire WAGE for $51.35 cash per share in a $2 billion merger offer. The transaction required shareholder and regulatory approvals and closed on August 30, 2019.
Speedway Motorsports, Inc.is a Concord, North Carolina based motorsports company. On July 24, 2019, Sonic Financial Corp. announced it would pay $19.75 cash per share in a tender offer for TRK. The deal required a majority of the minority shareholders to tender their shares as well as regulatory approvals and closed on September 18, 2019.
Aquantia Corp.is a San Jose, California based semiconductor company. On May 6, 2019, Marvell Technology announced it would acquire the firm for $13.25 cash per share in a $452 million merger. The deal was subject to shareholder and regulatory approvals and closed on September 19, 2019.
Tribune Media Co.is a Chicago, Illinois based broadcasting company. TRCO unsuccessfully attempted to merge with Sinclair Broadcasting Group in 2018, and then put itself back on the block after that deal failed. On December 3, 2018, TRCO agreed to be acquired by Nexstar Broadcasting for $46.50 cash per share in a $6.4 billion merger. The deal was subject to shareholder and regulatory approvals and closed on September 19, 2019.
Peak Resorts, Inc.is an owner and operator of ski resorts based in Wildwood, Missouri. On July 22, 2019, SKIS agreed to be acquired by Vail Resorts, Inc. for $11.00 cash per share through a merger. The deal received the shareholder vote and regulatory approvals and closed on September 25, 2019.
Cray Inc.is a Seattle, Washington based manufacturer of supercomputers. On May 17, 2019, Hewlett Packard Enterprise agreed to pay $35 cash per share, or $1.3 billion, for CRAY. The merger was subject to receiving shareholder and regulatory approvals and closed on September 26, 2019.
| 3 |
Comparative Results
| Average Annual Returns through October 31, 2019 (a)(b) (Unaudited) | ||||||||||||||||||||
| 1 Year | 5 Year | 10 Year | Since Inception (2/28/01) | |||||||||||||||||
Class A (EMAAX) | 3.39% | 3.55% | 5.29% | 4.24% | ||||||||||||||||
With sales charge (c) | (1.74) | 2.33 | 4.66 | 3.91 | ||||||||||||||||
Class AAA (EAAAX) | 3.54 | 3.77 | 5.49 | 4.34 | ||||||||||||||||
Class C (EMACX) | 2.86 | 2.98 | 4.71 | 3.66 | ||||||||||||||||
With contingent deferred sales charge (d) | 1.86 | 2.98 | 4.71 | 3.66 | ||||||||||||||||
Class Y (EMAYX) | 3.86 | 4.02 | 5.77 | 4.70 | ||||||||||||||||
S&P 500 Index | 14.33 | 10.78 | 13.70 | 7.02 | ||||||||||||||||
Lipper U.S. Treasury Money Market Fund Average | 1.98 | 0.72 | 0.36 | 1.12 | ||||||||||||||||
ICE Bank of America Merrill Lynch 3 Month U.S. Treasury Bill Index | 2.40 | 1.02 | 0.56 | 1.51 | ||||||||||||||||
In the current prospectuses dated February 28, 2019, the Fund’s expense ratios are 1.50%, 1.70%, 2.24%, and 1.24% for the Class AAA, A, C, and Y Shares, respectively. See page 13 for the expense ratios for the fiscal year ended October 31, 2019. Class AAA and Class Y Shares have no sales charge. The maximum sales charge for Class A Shares and Class C Shares is 5.75% and 1.00%, respectively. | ||||||||||
(a) Returns represent past performance and do not guarantee future results. Total returns and average annual returns reflect changes in share price, reinvestment of distributions, and are net of expenses. Investment returns and the principal value of an investment will fluctuate. When shares are redeemed, they may be worth more or less than their original cost. Current performance may be lower or higher than the performance data presented. Visit www.gabelli.com for performance information as of the most recent month end. The Fund imposes a 2% redemption fee on shares sold or exchanged within seven days of purchase. Investors should carefully consider the investment objectives, risks, sales charges, and expenses of the Fund before investing. The prospectuses contain information about these and other matters and should be read carefully before investing. To obtain a prospectus, please visit our website at www.gabelli.com.The Class A Share NAVs are used to calculate the performance for the periods prior to the issuance of Class AAA Shares on February 26, 2010. The actual performance for the Class AAA Shares would have been higher due to lower expenses associated with the share class. The S&P 500 Index is a market capitalization weighted index of 500 large capitalization stocks commonly used to represent the U.S. equity market. The Lipper U.S. Treasury Money Market Fund Average reflects the average performance of mutual funds classified in this particular category. The ICE Bank of America Merrill Lynch 3 Month U.S. Treasury Bill Index is comprised of a single issue purchased at the beginning of the month and held for a full month. At the end of the month, that issue is sold and rolled into the outstanding Treasury Bill that matures closest to, but not beyond three months from the rebalancing date. To qualify for selection, an issue must have settled on or before the rebalancing (month end) date. Dividends are considered reinvested except for the ICE Bank of America Merrill Lynch 3 Month U.S. Treasury Bill Index. You cannot invest directly in an index. | ||||||||||
(b) The Fund’s fiscal year ends October 31. | ||||||||||
(c) Performance results include the effect of the maximum 5.75% sales charge at the beginning of the period. | ||||||||||
(d) Assuming payment of the 1% maximum contingent deferred sales charge imposed on redemptions made within one year of purchase. | ||||||||||
COMPARISON OF CHANGE IN VALUE OF A $10,000 INVESTMENT IN THE GABELLI ENTERPRISE MERGERS AND ACQUISITIONS FUND (CLASS A SHARES) AND THE S&P 500 INDEX (Unaudited)
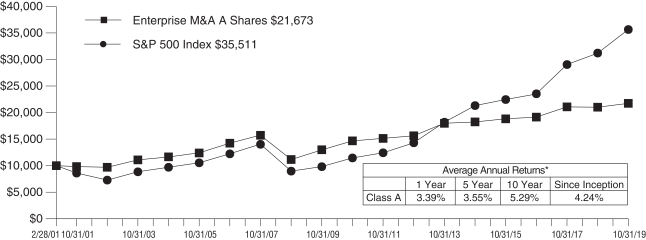
| * | Past performance is not predictive of future results. The performance tables and graph do not reflect the deduction of taxes that a shareholder would pay on fund distributions or the redemption of fund shares. |
| 4 |
| Gabelli Enterprise Mergers and Acquisitions Fund | ||
| Disclosure of Fund Expenses (Unaudited) | ||
| For the Six Month Period from May 1, 2019 through October 31, 2019 | Expense Table | |
| ||
We believe it is important for you to understand the impact of fees and expenses regarding your investment. All mutual funds have operating expenses. As a shareholder of a fund, you incur ongoing costs, which include costs for portfolio management, administrative services, and shareholder reports (like this one), among others. Operating expenses, which are deducted from a fund’s gross income, directly reduce the investment return of a fund. When a fund’s expenses are expressed as a percentage of its average net assets, this figure is known as the expense ratio. The following examples are intended to help you understand the ongoing costs (in dollars) of investing in your Fund and to compare these costs with those of other mutual funds. The examples are based on an investment of $1,000 made at the beginning of the period shown and held for the entire period.
The Expense Table below illustrates your Fund’s costs in two ways:
Actual Fund Return:This section provides information about actual account values and actual expenses. You may use this section to help you to estimate the actual expenses that you paid over the period after any fee waivers and expense reimbursements. The “Ending Account Value” shown is derived from the Fund’sactualreturn during the past six months, and the “Expenses Paid During Period” shows the dollar amount that would have been paid by an investor who started with $1,000 in the Fund. You may use this information, together with the amount you invested, to estimate the expenses that you paid over the period.
To do so, simply divide your account value by $1,000 (for example, an $8,600 account value divided by $1,000 = 8.6), then multiply the result by the number given for your Fund under the heading “Expenses Paid During Period” to estimate the expenses you paid during this period.
Hypothetical 5% Return:This section provides information about hypothetical account values and hypothetical expenses based on the Fund’s actual expense
ratio. It assumes a hypothetical annualized return of 5% before expenses during the period shown. In this case – because the hypothetical return used is not the Fund’s actual return – the results do not apply to your investment and you cannot use the hypothetical account value and expense to estimate the actual ending account balance or expenses you paid for the period. This example is useful in making comparisons of the ongoing costs of investing in the Fund and other funds. To do so, compare this 5% hypothetical example with the 5% hypothetical examples that appear in shareholder reports of other funds.
Please note that the expenses shown in the table are meant to highlight your ongoing costs only and do not reflect any transactional costs such as sales charges (loads), redemption fees, or exchange fees, if any, which are described in the Prospectus. If these costs were applied to your account, your costs would be higher. Therefore, the 5% hypothetical return is useful in comparing ongoing costs only, and will not help you determine the relative total costs of owning different funds. The “Annualized Expense Ratio” represents the actual expenses for the last six months and may be different from the expense ratio in the Financial Highlights which is for the fiscal year ended October 31, 2019.
| Beginning Account Value 05/01/19 | Ending Account Value 10/31/19 | Annualized Expense Ratio | Expenses Paid During Period* | |||||||||||||
Gabelli Enterprise Mergers and Acquisitions Fund |
| |||||||||||||||
Actual Fund Return |
| |||||||||||||||
Class AAA | $1,000.00 | $ 992.50 | 1.49 | % | $ 7.48 | |||||||||||
Class A | $1,000.00 | $ 979.40 | 1.69 | % | $ 8.43 | |||||||||||
Class C | $1,000.00 | $ 989.20 | 2.23 | % | $11.18 | |||||||||||
Class Y | $1,000.00 | $ 993.50 | 1.24 | % | $ 6.23 | |||||||||||
Hypothetical 5% Return |
| |||||||||||||||
Class AAA | $1,000.00 | $1,017.69 | 1.49 | % | $ 7.58 | |||||||||||
Class A | $1,000.00 | $1,016.69 | 1.69 | % | $ 8.59 | |||||||||||
Class C | $1,000.00 | $1,013.96 | 2.23 | % | $11.32 | |||||||||||
Class Y | $1,000.00 | $1,018.95 | 1.24 | % | $ 6.31 | |||||||||||
| * | Expenses are equal to the Fund’s annualized expense ratio for the last six months multiplied by the average account value over the period, multiplied by the number of days in the most recent fiscal half year (184 days), then divided by 365. |
| 5 |
Summary of Portfolio Holdings (Unaudited)
The following table presents portfolio holdings as a percent of net assets as of October 31, 2019:
Gabelli Enterprise Mergers and Acquisitions Fund
Long Positions | ||||
U.S. Government Obligations | 31.9 | % | ||
Health Care | 10.4 | % | ||
Energy and Utilities | 8.7 | % | ||
Transportation | 5.2 | % | ||
Wireless Communications | 4.8 | % | ||
Telecommunications | 3.8 | % | ||
Aerospace and Defense | 3.3 | % | ||
Financial Services | 3.1 | % | ||
Cable and Satellite | 2.8 | % | ||
Semiconductors | 2.7 | % | ||
Media | 2.7 | % | ||
Building and Construction | 2.4 | % | ||
Hotels and Gaming | 2.2 | % | ||
Diversified Industrial | 2.2 | % | ||
Entertainment | 2.1 | % | ||
Food and Beverage | 1.9 | % | ||
Computer Software and Services | 1.5 | % | ||
Machinery | 1.2 | % | ||
Specialty Chemicals | 1.2 | % |
Business Services | 1.0 | % | ||
Communications Equipment | 0.8 | % | ||
Retail | 0.7 | % | ||
Metals and Mining | 0.6 | % | ||
Consumer Products | 0.6 | % | ||
Real Estate | 0.5 | % | ||
Closed-End Funds | 0.4 | % | ||
Electronics | 0.3 | % | ||
Consumer Services | 0.2 | % | ||
Containers and Packaging | 0.2 | % | ||
Automotive: Parts and Accessories | 0.2 | % | ||
Paper and Forest Products | 0.1 | % | ||
Airlines | 0.1 | % | ||
Other Assets and Liabilities (Net) | 0.4 | % | ||
Short Positions | ||||
Real Estate | (0.1 | )% | ||
Financial Services | (0.1 | )% | ||
|
| |||
| 100.0 | % | |||
|
| |||
The Fund files a complete schedule of portfolio holdings with the Securities and Exchange Commission (the SEC) for the first and third quarters of each fiscal year on FormN-PORT. Shareholders may obtain this information at www.gabelli.com or by calling the Fund at800-GABELLI(800-422-3554). The Fund’s FormN-PORT is available on the SEC’s website at www.sec.gov and may also be reviewed and copied at the SEC’s Public Reference Room in Washington, DC. Information on the operation of the Public Reference Room may be obtained by calling800-SEC-0330.
Proxy Voting
The Fund files FormN-PX with its complete proxy voting record for the twelve months ended June 30, no later than August 31 of each year. A description of the Fund’s proxy voting policies, procedures, and how the Fund voted proxies relating to portfolio securities is available without charge, upon request, by (i) calling800-GABELLI(800-422-3554); (ii) writing to The Gabelli Funds at One Corporate Center, Rye, NY 10580-1422; or (iii) visiting the SEC’s website at www.sec.gov.
| 6 |
Gabelli Enterprise Mergers and Acquisitions Fund
Schedule of Investments — October 31, 2019
Shares | Cost | Market Value | ||||||||||
COMMON STOCKS — 67.2% |
| |||||||||||
Aerospace and Defense — 3.3% |
| |||||||||||
| 10,000 | Arconic Inc. | $ | 218,979 | $ | 274,700 | |||||||
| 8,500 | Cobham plc | 17,772 | 17,375 | |||||||||
| 24,000 | Kaman Corp. | 910,375 | 1,408,080 | |||||||||
| 5,500 | L3Harris Technologies Inc. | 1,046,079 | 1,134,705 | |||||||||
| 6,000 | Latecoere SACA† | 25,552 | 25,697 | |||||||||
| 7,500 | United Technologies Corp. | 891,002 | 1,076,850 | |||||||||
| 30,000 | Wesco Aircraft Holdings Inc.† | 329,811 | 330,600 | |||||||||
|
|
|
| |||||||||
| 3,439,570 | 4,268,007 | |||||||||||
|
|
|
| |||||||||
Airlines — 0.1% |
| |||||||||||
| 3,500 | WestJet Airlines Ltd. | 77,554 | 81,395 | |||||||||
|
|
|
| |||||||||
Automotive: Parts and Accessories — 0.2% |
| |||||||||||
| 26,000 | Haldex AB | 293,806 | 130,866 | |||||||||
| 7,800 | Tenneco Inc., Cl. A | 24,840 | 98,202 | |||||||||
|
|
|
| |||||||||
| 318,646 | 229,068 | |||||||||||
|
|
|
| |||||||||
Building and Construction — 2.4% |
| |||||||||||
| 42,000 | Griffon Corp. | 357,000 | 895,020 | |||||||||
| 11,000 | Nobility Homes Inc. | 154,848 | 272,250 | |||||||||
| 4,000 | Norbord Inc. | 76,509 | 115,466 | |||||||||
| 10,000 | Skyline Champion Corp.† | 47,110 | 282,300 | |||||||||
| 11,000 | Vulcan Materials Co. | 432,608 | 1,571,570 | |||||||||
|
|
|
| |||||||||
| 1,068,075 | 3,136,606 | |||||||||||
|
|
|
| |||||||||
Business Services — 1.0% |
| |||||||||||
| 500 | BCA Marketplace plc | 1,541 | 1,529 | |||||||||
| 275,021 | Clear Channel Outdoor Holdings Inc.† | 1,576,898 | 640,799 | |||||||||
| 1,000 | Just Eat plc† | 9,577 | 9,521 | |||||||||
| 2,000 | XPO Logistics Europe SA | 484,562 | 664,719 | |||||||||
|
|
|
| |||||||||
| 2,072,578 | 1,316,568 | |||||||||||
|
|
|
| |||||||||
Cable and Satellite — 2.8% |
| |||||||||||
| 30,000 | AMC Entertainment Holdings Inc., Cl. A | 470,724 | 281,100 | |||||||||
| 26,000 | DISH Network Corp., Cl. A† | 582,623 | 893,880 | |||||||||
| 3,500 | Liberty Broadband Corp., Cl. A† | 15,669 | 412,965 | |||||||||
| 3,500 | Liberty Broadband Corp., Cl. C† | 94,710 | 413,245 | |||||||||
| 20,000 | Liberty Global plc, Cl. A† | 702,960 | 503,000 | |||||||||
| 20,000 | Liberty Global plc, Cl. C† | 701,723 | 477,400 | |||||||||
| 3,000 | Liberty Media Corp.- Liberty Formula One, Cl. A† | 7,487 | 121,290 | |||||||||
| 3,000 | Liberty Media Corp.- Liberty Formula One, Cl. C† | 9,444 | 127,500 | |||||||||
| 20,000 | Shaw Communications Inc., Cl. B | 265,164 | 408,800 | |||||||||
|
|
|
| |||||||||
| 2,850,504 | 3,639,180 | |||||||||||
|
|
|
| |||||||||
Communications Equipment — 0.8% |
| |||||||||||
| 39,000 | Digi International Inc.† | 454,112 | 562,380 | |||||||||
| 60,000 | Inmarsat plc | 416,977 | 427,622 | |||||||||
|
|
|
| |||||||||
| 871,089 | 990,002 | |||||||||||
|
|
|
| |||||||||
Shares | Cost | Market Value | ||||||||||
Computer Software and Services — 1.5% |
| |||||||||||
| 4,000 | Business & Decision† | $ | 37,005 | $ | 33,013 | |||||||
| 3,000 | Cision Ltd.† | 29,967 | 30,210 | |||||||||
| 5,000 | Fiserv Inc.† | 410,594 | 530,700 | |||||||||
| 43,000 | Pivotal Software Inc., Cl. A† | 641,014 | 643,710 | |||||||||
| 27,000 | Presidio Inc. | 431,542 | 448,200 | |||||||||
| 1,400 | Rockwell Automation Inc. | 261,653 | 240,786 | |||||||||
| 8,000 | Sophos Group plc | 58,731 | 58,840 | |||||||||
|
|
|
| |||||||||
| 1,870,506 | 1,985,459 | |||||||||||
|
|
|
| |||||||||
Consumer Products — 0.6% |
| |||||||||||
| 175,000 | Avon Products Inc.† | 463,522 | 750,750 | |||||||||
| 2,000 | Bang & Olufsen A/S† | 20,532 | 11,644 | |||||||||
|
|
|
| |||||||||
| 484,054 | 762,394 | |||||||||||
|
|
|
| |||||||||
Consumer Services — 0.2% |
| |||||||||||
| 50,000 | MoneyGram International Inc.† | 472,243 | 198,000 | |||||||||
| 2,250 | Rollins Inc. | 3,006 | 85,747 | |||||||||
|
|
|
| |||||||||
| 475,249 | 283,747 | |||||||||||
|
|
|
| |||||||||
Containers and Packaging — 0.2% |
| |||||||||||
| 5,500 | Greif Inc., Cl. A | 229,419 | 215,435 | |||||||||
| 1,000 | Greif Inc., Cl. B | 37,738 | 47,030 | |||||||||
|
|
|
| |||||||||
| 267,157 | 262,465 | |||||||||||
|
|
|
| |||||||||
Diversified Industrial — 2.2% |
| |||||||||||
| 500 | Altran Technologies SA | 7,995 | 7,935 | |||||||||
| 100 | Anixter International Inc.† | 8,213 | 8,275 | |||||||||
| 168,000 | Myers Industries Inc. | 3,075,124 | 2,844,240 | |||||||||
|
|
|
| |||||||||
| 3,091,332 | 2,860,450 | |||||||||||
|
|
|
| |||||||||
Electronics — 0.3% |
| |||||||||||
| 8,000 | OSRAM Licht AG | 333,711 | 356,896 | |||||||||
|
|
|
| |||||||||
Energy and Utilities — 8.7% |
| |||||||||||
| 7,000 | Alerion Cleanpower SpA | 19,191 | 20,611 | |||||||||
| 17,000 | AltaGas Canada Inc. | 431,218 | 432,647 | |||||||||
| 460,000 | Alvopetro Energy Ltd.† | 431,120 | 218,283 | |||||||||
| 4,000 | Avangrid Inc. | 155,000 | 200,200 | |||||||||
| 7,000 | Avista Corp. | 301,129 | 336,210 | |||||||||
| 120,000 | Buckeye Partners LP | 4,921,642 | 4,975,200 | |||||||||
| 27,638 | El Paso Electric Co. | 1,816,029 | 1,843,731 | |||||||||
| 36,000 | Endesa SA | 997,783 | 979,679 | |||||||||
| 1,000 | Etablissements Maurel et Prom SA | 4,222 | 2,933 | |||||||||
| 160,000 | Gulf Coast Ultra Deep Royalty Trust | 94,045 | 5,280 | |||||||||
| 5,116 | Iberdrola SA | 50,211 | 52,540 | |||||||||
| 19,000 | KLX Energy Services Holdings Inc.† | 357,315 | 150,860 | |||||||||
| 8,000 | NorthWestern Corp. | 221,528 | 580,160 | |||||||||
| 1,000 | SemGroup Corp., Cl. A | 16,670 | 16,100 | |||||||||
| 30,000 | Severn Trent plc | 833,209 | 876,307 | |||||||||
| 1,000 | Southwest Gas Holdings Inc. | 34,833 | 87,300 | |||||||||
| 10,199 | UGI Corp. | 493,836 | 486,186 | |||||||||
| See accompanying notes to financial statements. |
| 7 |
Gabelli Enterprise Mergers and Acquisitions Fund
Schedule of Investments (Continued) — October 31, 2019
Shares | Cost | Market Value | ||||||||||
COMMON STOCKS (Continued) |
| |||||||||||
Energy and Utilities (Continued) |
| |||||||||||
| 15,000 | Whiting Petroleum Corp.† | $ | 406,111 | $ | 95,100 | |||||||
|
|
|
| |||||||||
| 11,585,092 | 11,359,327 | |||||||||||
|
|
|
| |||||||||
Entertainment — 2.1% |
| |||||||||||
| 10,000 | Cherry AB, Cl. B†(a) | 94,951 | 90,102 | |||||||||
| 3,600 | Discovery Inc., Cl. A† | 26,174 | 97,038 | |||||||||
| 10,800 | Discovery Inc., Cl. C† | 60,976 | 272,592 | |||||||||
| 180,000 | Dover Motorsports Inc. | 667,976 | 347,400 | |||||||||
| 4,500 | Entertainment One Ltd. | 33,151 | 32,439 | |||||||||
| 48,000 | Fox Corp., Cl. B | 1,987,200 | 1,499,520 | |||||||||
| 5,000 | Liberty Media Corp.- Liberty Braves, Cl. A† | 115,468 | 147,600 | |||||||||
| 5,000 | Liberty Media Corp.- Liberty Braves, Cl. C† | 115,565 | 147,050 | |||||||||
| 9,000 | Lions Gate Entertainment Corp., Cl. B† | 216,219 | 67,410 | |||||||||
| 3,000 | The Stars Group Inc.† | 59,546 | 65,280 | |||||||||
|
|
|
| |||||||||
| 3,377,226 | 2,766,431 | |||||||||||
|
|
|
| |||||||||
Financial Services — 3.1% |
| |||||||||||
| 1,400 | Argo Group International Holdings Ltd. | 24,549 | 86,618 | |||||||||
| 3,600 | BKF Capital Group Inc.† | 127,868 | 38,160 | |||||||||
| 1,000 | Charles Taylor plc | 4,079 | 4,145 | |||||||||
| 10,000 | Entegra Financial Corp.† | 295,225 | 301,000 | |||||||||
| 2,500 | LegacyTexas Financial Group Inc. | 97,854 | 106,350 | |||||||||
| 81,000 | Navient Corp. | 740,057 | 1,115,370 | |||||||||
| 100,000 | SLM Corp. | 573,264 | 844,000 | |||||||||
| 16,000 | Sterling Bancorp | 165,751 | 314,400 | |||||||||
| 2,000 | Steuben Trust Co. | 129,542 | 133,420 | |||||||||
| 1,000 | Stewardship Financial Corp. | 15,405 | 15,750 | |||||||||
| 31,000 | Synovus Financial Corp. | 1,399,508 | 1,049,970 | |||||||||
| 400 | Topdanmark A/S | 11,380 | 17,914 | |||||||||
|
|
|
| |||||||||
| 3,584,482 | 4,027,097 | |||||||||||
|
|
|
| |||||||||
Food and Beverage — 1.9% |
| |||||||||||
| 11,600 | Campbell Soup Co. | 394,807 | 537,196 | |||||||||
| 4,500 | Flowers Foods Inc. | 10,669 | 97,740 | |||||||||
| 14,000 | GrainCorp Ltd., Cl. A | 160,309 | 69,776 | |||||||||
| 2,000,000 | Premier Foods plc† | 1,361,141 | 836,798 | |||||||||
| 28,840 | Tootsie Roll Industries Inc. | 541,741 | 988,635 | |||||||||
|
|
|
| |||||||||
| 2,468,667 | 2,530,145 | |||||||||||
|
|
|
| |||||||||
Health Care — 10.3% |
| |||||||||||
| 10,000 | Achillion Pharmaceuticals Inc.† | 61,640 | 64,100 | |||||||||
| 150,000 | Akorn Inc.† | 994,086 | 748,500 | |||||||||
| 15,000 | Allergan plc | 2,631,135 | 2,641,650 | |||||||||
| 20,000 | AstraZeneca plc, ADR | 675,911 | 980,600 | |||||||||
| 1,300 | Bio-Rad Laboratories Inc., Cl. A† | 126,219 | 431,106 | |||||||||
| 3,500 | Bristol-Myers Squibb Co. | 180,343 | 200,795 | |||||||||
| 27,000 | Celgene Corp.† | 2,305,236 | 2,916,810 | |||||||||
| 8,000 | Grifols SA, ADR | 53,680 | 175,280 | |||||||||
Shares | Cost | Market Value | ||||||||||
| 100 | ICU Medical Inc.† | $ | 6,058 | $ | 16,161 | |||||||
| 10,000 | Idorsia Ltd.† | 102,950 | 227,268 | |||||||||
| 1,400 | Illumina Inc.† | 87,354 | 413,728 | |||||||||
| 10,000 | Mylan NV† | 209,820 | 191,500 | |||||||||
| 420,000 | Pacific Biosciences of California Inc.† | 3,134,746 | 2,032,800 | |||||||||
| 3,000 | Perrigo Co. plc | 133,446 | 159,060 | |||||||||
| 7,000 | Ra Pharmaceuticals Inc.† | 323,488 | 329,490 | |||||||||
| 6,000 | Smith & Nephew plc, ADR | 206,505 | 259,320 | |||||||||
| 15,000 | Spark Therapeutics Inc.† | 1,702,785 | 1,637,550 | |||||||||
|
|
|
| |||||||||
| 12,935,402 | 13,425,718 | |||||||||||
|
|
|
| |||||||||
Hotels and Gaming — 2.2% |
| |||||||||||
| 90,000 | Caesars Entertainment Corp.† | 1,048,084 | 1,105,200 | |||||||||
| 900 | Churchill Downs Inc. | 9,822 | 116,991 | |||||||||
| 2,000 | Eldorado Resorts Inc.† | 9,768 | 89,540 | |||||||||
| 4,000 | Elegant Hotels Group plc | 5,720 | 5,725 | |||||||||
| 8,500 | Empire Resorts Inc.† | 82,534 | 82,535 | |||||||||
| 1,000 | Gamenet Group SpA | 14,135 | 14,053 | |||||||||
| 18,000 | Ryman Hospitality Properties Inc., REIT | 869,412 | 1,515,060 | |||||||||
|
|
|
| |||||||||
| 2,039,475 | 2,929,104 | |||||||||||
|
|
|
| |||||||||
Machinery — 1.2% |
| |||||||||||
| 10,000 | CIRCOR International Inc.† | 362,098 | 382,900 | |||||||||
| 60,000 | CNH Industrial NV | 692,736 | 652,316 | |||||||||
| 23,000 | CNH Industrial NV, Borsa Italiana | 231,138 | 250,930 | |||||||||
| 1,000 | Gardner Denver Holdings Inc.† | 33,780 | 31,830 | |||||||||
| 4,000 | Xylem Inc. | 100,940 | 306,760 | |||||||||
|
|
|
| |||||||||
| 1,420,692 | 1,624,736 | |||||||||||
|
|
|
| |||||||||
Media — 2.7% |
| |||||||||||
| 45,000 | Central European Media Enterprises Ltd., Cl. A† | 201,654 | 201,825 | |||||||||
| 53,000 | Telenet Group Holding NV† | 2,403,424 | 2,602,061 | |||||||||
| 55,000 | The E.W. Scripps Co., Cl. A | 899,490 | 738,925 | |||||||||
|
|
|
| |||||||||
| 3,504,568 | 3,542,811 | |||||||||||
|
|
|
| |||||||||
Metals and Mining — 0.4% |
| |||||||||||
| 38,000 | Alamos Gold Inc., Cl. A | 478,500 | 206,720 | |||||||||
| 19,000 | Pan American Silver Corp., Toronto | 298,459 | 322,701 | |||||||||
|
|
|
| |||||||||
| 776,959 | 529,421 | |||||||||||
|
|
|
| |||||||||
Paper and Forest Products — 0.1% |
| |||||||||||
| 8,500 | Canfor Corp.† | 97,342 | 102,741 | |||||||||
|
|
|
| |||||||||
Real Estate — 0.5% |
| |||||||||||
| 1,000 | Condor Hospitality Trust Inc., REIT | 11,000 | 11,050 | |||||||||
| 745 | Cousins Properties Inc., REIT | 27,259 | 29,897 | |||||||||
| 250 | Dream Global Real Estate Investment Trust | 3,127 | 3,166 | |||||||||
| 4,000 | Liberty Property Trust, REIT | 234,274 | 236,280 | |||||||||
| 33,000 | Trinity Place Holdings Inc.† | 118,800 | 131,340 | |||||||||
| See accompanying notes to financial statements. |
| 8 |
Gabelli Enterprise Mergers and Acquisitions Fund
Schedule of Investments (Continued) — October 31, 2019
Shares | Cost | Market Value | ||||||||||
COMMON STOCKS (Continued) |
| |||||||||||
Real Estate (Continued) |
| |||||||||||
| 5,000 | Vastned Retail Belgium NV, REIT | $ | 336,691 | $ | 246,481 | |||||||
|
|
|
| |||||||||
| 731,151 | 658,214 | |||||||||||
|
|
|
| |||||||||
Retail — 0.7% |
| |||||||||||
| 4,000 | Hudson’s Bay Co. | 30,804 | 30,309 | |||||||||
| 10,000 | Rite Aid Corp.† | 86,903 | 92,000 | |||||||||
| 4,000 | SpartanNash Co. | 52,262 | 52,380 | |||||||||
| 29,000 | Village Super Market Inc., Cl. A | 662,626 | 768,500 | |||||||||
| 2,000 | Vitamin Shoppe Inc.† | 12,833 | 12,920 | |||||||||
|
|
|
| |||||||||
| 845,428 | 956,109 | |||||||||||
|
|
|
| |||||||||
Semiconductors — 2.7% |
| |||||||||||
| 13,500 | AIXTRON SE† | 54,597 | 123,163 | |||||||||
| 100,000 | Cypress Semiconductor Corp. | 2,247,491 | 2,327,000 | |||||||||
| 278 | II-VI Inc.† | 10,097 | 9,216 | |||||||||
| 10,000 | Mellanox Technologies Ltd.† | 1,183,679 | 1,127,000 | |||||||||
|
|
|
| |||||||||
| 3,495,864 | 3,586,379 | |||||||||||
|
|
|
| |||||||||
Specialty Chemicals — 1.2% |
| |||||||||||
| 12,000 | GCP Applied Technologies Inc.† | 283,774 | 247,920 | |||||||||
| 4,000 | Innophos Holdings Inc. | 127,759 | 130,480 | |||||||||
| 2,000 | Linde plc. | 214,829 | 396,700 | |||||||||
| 65,000 | OMNOVA Solutions Inc.† | 650,224 | 657,150 | |||||||||
| 25,000 | SGL Carbon SE† | 376,863 | 116,437 | |||||||||
|
|
|
| |||||||||
| 1,653,449 | 1,548,687 | |||||||||||
|
|
|
| |||||||||
Telecommunications — 3.8% |
| |||||||||||
| 13,000 | Acacia Communications Inc.† | 846,400 | 853,580 | |||||||||
| 5,000 | Axel Springer SE† | 350,704 | 348,531 | |||||||||
| 80,000 | CenturyLink Inc. | 1,482,961 | 1,035,200 | |||||||||
| 45,000 | Cincinnati Bell Inc.† | 501,779 | 229,950 | |||||||||
| 200,000 | Koninklijke KPN NV | 605,309 | 620,107 | |||||||||
| 8,000 | Liberty Latin America Ltd., Cl. A† | 154,189 | 149,520 | |||||||||
| 10,000 | Liberty Latin America Ltd., Cl. C† | 218,850 | 184,100 | |||||||||
| 14,000 | Loral Space & Communications Inc.† | 602,071 | 559,860 | |||||||||
| 11,000 | Parrot SA† | 39,889 | 35,455 | |||||||||
| 1,000 | Rogers Communications Inc., Cl. B | 2,955 | 47,090 | |||||||||
| 25,000 | Zayo Group Holdings Inc.† | 834,732 | 853,500 | |||||||||
|
|
|
| |||||||||
| 5,639,839 | 4,916,893 | |||||||||||
|
|
|
| |||||||||
Transportation — 5.2% |
| |||||||||||
| 2,375 | DSV PANALPINA A/S | 217,955 | 230,452 | |||||||||
| 1,000 | GATX Corp. | 75,780 | 79,550 | |||||||||
| 5,000 | Genesee & Wyoming Inc., Cl. A† | 552,437 | 555,150 | |||||||||
| 50,000 | Navistar International Corp.† | 987,122 | 1,564,000 | |||||||||
| 32,000 | WABCO Holdings Inc.† | 4,212,885 | 4,307,840 | |||||||||
|
|
|
| |||||||||
| 6,046,179 | 6,736,992 | |||||||||||
|
|
|
| |||||||||
Shares | Cost | Market Value | ||||||||||
Wireless Communications — 4.8% |
| |||||||||||
| 46,000 | Millicom International Cellular SA, SDR | $ | 2,787,434 | $ | 2,096,171 | |||||||
| 70,000 | Sprint Corp.† | 375,113 | 434,700 | |||||||||
| 5,000 | Telephone & Data Systems Inc. | 142,092 | 130,450 | |||||||||
| 33,000 | T-Mobile US Inc.† | 536,250 | 2,727,780 | |||||||||
| 22,000 | United States Cellular Corp.† | 940,891 | 818,840 | |||||||||
|
|
|
| |||||||||
| 4,781,780 | 6,207,941 | |||||||||||
|
|
|
| |||||||||
TOTAL COMMON STOCKS | 82,203,620 | 87,620,983 | ||||||||||
|
|
|
| |||||||||
CLOSED-END FUNDS — 0.4% |
| |||||||||||
| 30,000 | Altaba Inc., Escrow† | 558,024 | 603,000 | |||||||||
|
|
|
| |||||||||
RIGHTS — 0.3% |
| |||||||||||
Health Care — 0.1% |
| |||||||||||
| 1,000 | Alder BioPharmaceuticals Inc. – H. Lundbeck A/S, CVR†(a) | 0 | 900 | |||||||||
| 13,000 | Ambit Biosciences Corp., CVR†(a) | 0 | 26,325 | |||||||||
| 5,000 | American Medical Alert Corp., | 0 | 50 | |||||||||
| 75,000 | Innocoll, CVR†(a) | 45,000 | 1 | |||||||||
| 14,000 | Ipsen SA/Clementia, CVR†(a) | 18,900 | 18,900 | |||||||||
| 11,000 | Ocera Therapeutics, CVR†(a) | 2,970 | 4,290 | |||||||||
| 100 | Omthera Pharmaceuticals Inc., | 0 | 0 | |||||||||
| 156,000 | Teva Pharmaceutical Industries Ltd., CCCP, expire 02/20/23†(a) | 74,375 | 0 | |||||||||
| 7,000 | Tobira Therapeutics Inc., CVR†(a) | 420 | 420 | |||||||||
|
|
|
| |||||||||
| 141,665 | 50,886 | |||||||||||
|
|
|
| |||||||||
Media — 0.0% |
| |||||||||||
| 40,000 | Media General Inc., CVR†(a) | 0 | 0 | |||||||||
|
|
|
| |||||||||
Metals and Mining — 0.2% |
| |||||||||||
| 400,000 | Pan American Silver Corp., CVR†(a) | 92,000 | 272,000 | |||||||||
|
|
|
| |||||||||
Specialty Chemicals — 0.0% |
| |||||||||||
| 70,000 | A. Schulman Inc., | 36,610 | 36,610 | |||||||||
|
|
|
| |||||||||
TOTAL RIGHTS | 270,275 | 359,496 | ||||||||||
|
|
|
| |||||||||
Principal | ||||||||||||
CORPORATE BONDS — 0.0% |
| |||||||||||
Health Care — 0.0% |
| |||||||||||
| $7,000 | Constellation Health Promissory Note, PIK, 5.000%, | 3,010 | 3,010 | |||||||||
|
|
|
| |||||||||
| See accompanying notes to financial statements. |
| 9 |
Gabelli Enterprise Mergers and Acquisitions Fund
Schedule of Investments (Continued) — October 31, 2019
Principal | Cost | Market Value | ||||||||||
U.S. GOVERNMENT OBLIGATIONS — 31.9% |
| |||||||||||
| $ | 41,684,000 | U.S. Treasury Bills, | $ | 41,532,628 | $ | 41,550,105 | ||||||
|
|
|
| |||||||||
TOTAL INVESTMENTS BEFORE SECURITIES SOLD SHORT — 99.8% | $ | 124,567,557 | 130,136,594 | |||||||||
|
|
|
| |||||||||
SECURITIES SOLD SHORT — (0.2)% |
| |||||||||||
(Proceeds received $220,490) |
| (223,282 | ) | |||||||||
|
| |||||||||||
Other Assets and Liabilities (Net) — 0.4% |
| 465,963 | ||||||||||
|
| |||||||||||
NET ASSETS — 100.0% |
| $ | 130,379,275 | |||||||||
|
| |||||||||||
Shares | Proceeds | Market Value | ||||||||||
SECURITIES SOLD SHORT — (0.2)% |
| |||||||||||
Financial Services — (0.1)% |
| |||||||||||
| 1,611 | Community Bank System Inc. | $ | 106,399 | $ | 109,194 | |||||||
|
|
|
| |||||||||
Real Estate — (0.1)% |
| |||||||||||
| 1,300 | Prologis Inc., REIT | 114,091 | 114,088 | |||||||||
|
|
|
| |||||||||
TOTAL SECURITIES SOLD SHORT(d) | $ | 220,490 | $ | 223,282 | ||||||||
|
|
|
| |||||||||
| (a) | Security is valued using significant unobservable inputs and is classified as Level 3 in the fair value hierarchy. |
| (b) | Payment-in-kind (PIK) security. 5.00% PIK interest income will be paid as additional securities at the discretion of the issuer. |
| (c) | At October 31, 2019, $1,000,000 of the principal amount was pledged as collateral for securities sold short. |
| (d) | At October 31, 2019, these proceeds were being held at Pershing LLC. |
| † | Non-income producing security. |
| †† | Represents annualized yields at dates of purchase. |
| ADR | American Depositary Receipt |
| CCCP | Contingent Cash Consideration Payment |
| CPR | Contingent Payment Right |
| CVR | Contingent Value Right |
| REIT | Real Estate Investment Trust |
| SDR | Swedish Depositary Receipt |
| See accompanying notes to financial statements. |
| 10 |
Gabelli Enterprise Mergers and Acquisitions Fund
Statement of Assets and Liabilities
October 31, 2019
Assets: | ||||
Investments, at value (cost $124,567,557) | $130,136,594 | |||
Cash | 24,912 | |||
Deposit at brokers | 220,475 | |||
Receivable for investments sold | 446,966 | |||
Receivable for Fund shares sold | 169,672 | |||
Dividends receivable | 9,130 | |||
Prepaid expenses | 16,758 | |||
|
| |||
Total Assets | 131,024,507 | |||
|
| |||
Liabilities: | ||||
Securities sold short, at value (proceeds $220,490) | 223,282 | |||
Payable for investments purchased | 8,213 | |||
Payable for Fund shares redeemed | 168,948 | |||
Payable for investment advisory fees | 103,086 | |||
Payable for distribution fees | 28,127 | |||
Payable for accounting fees | 7,500 | |||
Payable for payroll expenses | 607 | |||
Payable for shareholder communications expenses | 33,571 | |||
Other accrued expenses | 71,898 | |||
|
| |||
Total Liabilities | 645,232 | |||
|
| |||
Net Assets | ||||
(applicable to 8,916,444 shares outstanding) | $130,379,275 | |||
|
| |||
Net Assets Consist of: | ||||
Paid-in capital | $123,833,858 | |||
Total distributable earnings | 6,545,417 | |||
|
| |||
Net Assets | $130,379,275 | |||
|
|
Shares of Capital Stock, each at $0.001 par value: |
| |||
Class AAA: | ||||
Net Asset Value, offering, and redemption price per share ($5,697,042 ÷ 393,591 shares outstanding; 100,000,000 shares authorized) | $14.47 | |||
|
| |||
Class A: | ||||
Net Asset Value and redemption price per share ($34,528,736 ÷ 2,427,609 shares outstanding; 200,000,000 shares authorized) | $14.22 | |||
|
| |||
Maximum offering price per share (NAV ÷ 0.9425, based on maximum sales charge of 5.75% of the offering price) | $15.09 | |||
|
| |||
Class C: | ||||
Net Asset Value and offering price per share ($16,154,323 ÷ 1,253,832 shares outstanding; 100,000,000 shares authorized) | $12.88 | (a) | ||
|
| |||
Class Y: | ||||
Net Asset Value, and redemption price per share ($73,999,174 ÷ 4,841,412 shares outstanding; 100,000,000 shares authorized) | $15.28 | |||
|
| |||
| (a) Redemption | price varies based on the length of time held. |
Statement of Operations
For the Year Ended October 31, 2019
Investment Income: | ||||
Dividends (net of foreign withholding taxes of $41,913) | $ | 1,317,377 | ||
Interest | 1,002,196 | |||
|
| |||
Total Investment Income | 2,319,573 | |||
|
| |||
Expenses: | ||||
Investment advisory fees | 1,390,928 | |||
Distribution fees - Class AAA | 15,601 | |||
Distribution fees - Class A | 166,175 | |||
Distribution fees - Class C | 272,206 | |||
Shareholder services fees | 126,864 | |||
Registration expenses | 70,933 | |||
Directors’ fees | 68,500 | |||
Shareholder communications expenses | 59,677 | |||
Accounting fees | 45,000 | |||
Legal and audit fees | 44,655 | |||
Custodian fees | 27,280 | |||
Payroll expenses | 3,895 | |||
Interest expense | 455 | |||
Service fees for securities sold short (See Note 2) | 6 | |||
Miscellaneous expenses | 23,724 | |||
|
| |||
Total Expenses | 2,315,899 | |||
|
| |||
Less: | ||||
Expenses paid indirectly by broker (See Note 6) | (2,528 | ) | ||
|
| |||
Net Expenses | 2,313,371 | |||
|
| |||
Net Investment Income | 6,202 | |||
|
| |||
Net Realized and Unrealized Gain/(Loss) on Investments, Securities Sold Short, and Foreign Currency: | ||||
Net realized gain on investments | 3,397,471 | |||
Net realized gain on securities sold short | 69,613 | |||
Net realized loss on foreign currency transactions | (7,188 | ) | ||
|
| |||
Net realized gain on investments, securities sold short, and foreign currency translations | 3,459,896 | |||
|
| |||
Net change in unrealized appreciation/depreciation: | ||||
on investments | 1,692,886 | |||
on securities sold short | (2,792 | ) | ||
on foreign currency translations | 37 | |||
|
| |||
Net change in unrealized appreciation/depreciation on investments, securities sold short, and foreign currency translations | 1,690,131 | |||
|
| |||
Net Realized and Unrealized Gain/(Loss) on Investments, Securities Sold Short, and Foreign Currency | 5,150,027 | |||
|
| |||
Net Increase in Net Assets Resulting from Operations | $ | 5,156,229 | ||
|
|
| See accompanying notes to financial statements. |
| 11 |
Gabelli Enterprise Mergers and Acquisitions Fund
Statement of Changes in Net Assets
| Year Ended October 31, 2019 | Year Ended October 31, 2018 | |||||||
Operations: | ||||||||
Net investment income | $ 6,202 | $ 1,156,526 | ||||||
Net realized gain on investments, securities sold short, swap contracts, and foreign currency transactions | 3,459,896 | 7,497,245 | ||||||
Net change in unrealized appreciation/depreciation on investments and foreign currency translations | 1,690,131 | (9,080,863 | ) | |||||
|
|
|
| |||||
Net Increase/(Decrease) in Net Assets Resulting from Operations | 5,156,229 | (427,092 | ) | |||||
|
|
|
| |||||
Distributions to Shareholders: | ||||||||
Class AAA | (356,542 | ) | (87,787 | ) | ||||
Class A | (1,764,666 | ) | (655,544 | ) | ||||
Class C | (1,846,077 | ) | (545,723 | ) | ||||
Class T(a) | — | (13 | ) | |||||
Class Y | (4,286,744 | ) | (903,357 | ) | ||||
|
|
|
| |||||
Total Distributions to Shareholders | (8,254,029 | ) | (2,192,424 | ) | ||||
|
|
|
| |||||
Capital Share Transactions: | ||||||||
Class AAA | (1,128,436 | ) | 909,873 | |||||
Class A | (1,832,073 | ) | (9,207,943 | ) | ||||
Class C | (18,176,557 | ) | (2,555,017 | ) | ||||
Class T(a) | — | (1,041 | ) | |||||
Class Y | (10,295,907 | ) | 16,863,689 | |||||
|
|
|
| |||||
Net Increase/(Decrease) in Net Assets from Capital Share Transactions | (31,432,973 | ) | 6,009,561 | |||||
|
|
|
| |||||
Redemption Fees | 104 | 2,386 | ||||||
|
|
|
| |||||
Net Increase/(Decrease) in Net Assets | (34,530,669 | ) | 3,392,431 | |||||
Net Assets: | ||||||||
Beginning of year | 164,909,944 | 161,517,513 | ||||||
|
|
|
| |||||
End of year | $130,379,275 | $164,909,944 | ||||||
|
|
|
| |||||
| (a) | Class T Shares were liquidated on September 21, 2018. |
| See accompanying notes to financial statements. |
| 12 |
Gabelli Enterprise Mergers and Acquisitions Fund
Financial Highlights
Selected data for a share of capital stock outstanding throughout each year:
| Income (Loss) from Investment Operations | Distributions | Ratios to Average Net Assets/ Supplemental Data | ||||||||||||||||||||||||||||||||||||||||||||||||||||||||||||||||||||
Year | Net Asset | Net | Net Realized | Total Operations | Net | Net Realized | Total | Redemption | Net Asset | Total | Net Assets | Net | Operating | Portfolio | ||||||||||||||||||||||||||||||||||||||||||||||||||||||||
Class AAA | ||||||||||||||||||||||||||||||||||||||||||||||||||||||||||||||||||||||
2019 | $14.75 | $0.01 | $0.47 | $0.48 | $(0.08 | ) | $(0.68 | ) | $(0.76 | ) | $0.00 | $14.47 | 3.54 | % | $5,697 | 0.06% | 1.50%(e) | 195% | ||||||||||||||||||||||||||||||||||||||||||||||||||||
2018 | 14.96 | 0.12 | (0.14 | ) | (0.02 | ) | — | (0.19 | ) | (0.19 | ) | 0.00 | 14.75 | (0.12 | ) | 6,974 | 0.80 | 1.50 | 159 | |||||||||||||||||||||||||||||||||||||||||||||||||||
2017 | 13.52 | (0.04 | ) | 1.48 | 1.44 | — | — | — | 0.00 | 14.96 | 10.65 | 6,201 | (0.28) | 1.51 | 113 | |||||||||||||||||||||||||||||||||||||||||||||||||||||||
2016 | 13.31 | 0.01 | 0.20 | 0.21 | — | — | — | 0.00 | 13.52 | 1.58 | 4,069 | 0.07 | 1.52(e)(f) | 151 | ||||||||||||||||||||||||||||||||||||||||||||||||||||||||
2015 | 12.86 | (0.07 | ) | 0.52 | 0.45 | — | — | — | 0.00 | 13.31 | 3.50 | 4,943 | (0.51) | �� | 1.47(e) | 162 | ||||||||||||||||||||||||||||||||||||||||||||||||||||||
Class A | ||||||||||||||||||||||||||||||||||||||||||||||||||||||||||||||||||||||
2019 | $14.49 | $(0.02 | ) | $0.47 | $0.45 | $(0.04 | ) | $(0.68 | ) | $(0.72 | ) | $0.00 | $14.22 | 3.39 | % | $34,529 | (0.14)% | 1.70%(e) | 195% | |||||||||||||||||||||||||||||||||||||||||||||||||||
2018 | 14.73 | 0.07 | (0.12 | ) | (0.05 | ) | — | (0.19 | ) | (0.19 | ) | 0.00 | 14.49 | (0.33 | ) | 37,070 | 0.51 | 1.70 | 159 | |||||||||||||||||||||||||||||||||||||||||||||||||||
2017 | 13.35 | (0.07 | ) | 1.45 | 1.38 | — | — | — | 0.00 | 14.73 | 10.34 | 46,887 | (0.46) | 1.71 | 113 | |||||||||||||||||||||||||||||||||||||||||||||||||||||||
2016 | 13.17 | (0.02 | ) | 0.20 | 0.18 | — | — | — | 0.00 | 13.35 | 1.37 | 48,770 | (0.13) | 1.72(e)(f) | 151 | |||||||||||||||||||||||||||||||||||||||||||||||||||||||
2015 | 12.75 | (0.08 | ) | 0.50 | 0.42 | — | — | — | 0.00 | 13.17 | 3.29 | 58,039 | (0.63) | 1.67(e) | 162 | |||||||||||||||||||||||||||||||||||||||||||||||||||||||
Class C | ||||||||||||||||||||||||||||||||||||||||||||||||||||||||||||||||||||||
2019 | $13.22 | $(0.09 | ) | $0.43 | $0.34 | — | $(0.68 | ) | $(0.68 | ) | $0.00 | $12.88 | 2.86 | % | $16,154 | (0.68)% | 2.25%(e) | 195% | ||||||||||||||||||||||||||||||||||||||||||||||||||||
2018 | 13.53 | (0.00 | )(b) | (0.12 | ) | (0.12 | ) | — | (0.19 | ) | (0.19 | ) | 0.00 | 13.22 | (0.88 | ) | 35,211 | (0.01) | 2.24 | 159 | ||||||||||||||||||||||||||||||||||||||||||||||||||
2017 | 12.33 | (0.13 | ) | 1.33 | 1.20 | — | — | — | 0.00 | 13.53 | 9.73 | 38,628 | (1.01) | 2.26 | 113 | |||||||||||||||||||||||||||||||||||||||||||||||||||||||
2016 | 12.23 | (0.08 | ) | 0.18 | 0.10 | — | — | — | 0.00 | 12.33 | 0.82 | 44,424 | (0.67) | 2.27(e)(f) | 151 | |||||||||||||||||||||||||||||||||||||||||||||||||||||||
2015 | 11.91 | (0.14 | ) | 0.46 | 0.32 | — | — | — | 0.00 | 12.23 | 2.69 | 53,738 | (1.19) | 2.22(e) | 162 | |||||||||||||||||||||||||||||||||||||||||||||||||||||||
Class Y | ||||||||||||||||||||||||||||||||||||||||||||||||||||||||||||||||||||||
2019 | $15.53 | $0.05 | $0.50 | $0.55 | $(0.12 | ) | $(0.68 | ) | $(0.80 | ) | $0.00 | $15.28 | 3.86 | % | $73,999 | 0.30% | 1.25%(e) | 195% | ||||||||||||||||||||||||||||||||||||||||||||||||||||
2018 | 15.71 | 0.16 | (0.15 | ) | 0.01 | — | (0.19 | ) | (0.19 | ) | 0.00 | 15.53 | 0.08 | 85,655 | 1.04 | 1.24 | 159 | |||||||||||||||||||||||||||||||||||||||||||||||||||||
2017 | 14.17 | (0.00 | )(b) | 1.54 | 1.54 | — | — | — | 0.00 | 15.71 | 10.87 | 69,801 | (0.02) | 1.26 | 113 | |||||||||||||||||||||||||||||||||||||||||||||||||||||||
2016 | 13.91 | 0.05 | 0.21 | 0.26 | — | — | — | 0.00 | 14.17 | 1.87 | 59,414 | 0.33 | 1.27(e)(f) | 151 | ||||||||||||||||||||||||||||||||||||||||||||||||||||||||
2015 | 13.41 | (0.03 | ) | 0.53 | 0.50 | — | — | — | 0.00 | 13.91 | 3.73 | 77,148 | (0.20) | 1.21(e) | 162 | |||||||||||||||||||||||||||||||||||||||||||||||||||||||
| † | Total return represents aggregate total return of a hypothetical $1,000 investment at the beginning of the year and sold at the end of the year including reinvestment of distributions and does not reflect the applicable sales charges. |
| (a) | Per share amounts have been calculated using the average shares outstanding method. |
| (b) | Amount represents less than $0.005 per share. |
| (c) | The Fund received credits from a designated broker who agreed to pay certain Fund operating expenses. For the years ended October 31, 2019, 2018, 2017, 2016, and 2015, there was no impact on the expense ratios. |
| (d) | The Fund incurred interest expense during all years presented. For the year ended October 31, 2017, if interest expense had not been incurred, the ratio of operating expenses to average net assets would have been 1.50% (Class AAA), 1.70% (Class A), 2.25% (Class C), and 1.25% (Class Y). For the years ended October 31, 2019, 2018, 2016, and 2015, there was no impact on the expense ratios. |
| (e) | The Fund incurred dividend expense and service fees on securities sold short. If these expenses and fees had not been incurred, the ratios of operating expenses to average net assets for the year ended October 31, 2016 would have been 1.50% (Class AAA), 1.70% (Class A), 2.25% (Class C), and 1.25% (Class Y). For the years ended October 31, 2019, and 2015 there was no impact on the expense ratios. |
| (f) | During the year ended October 31, 2016, the Fund received a reimbursement of custody expenses paid in prior years. Had such reimbursement (allocated by relative net asset values of the Fund’s share classes) been included in that period, the expense ratios would have been 1.44% (Class AAA), 1.64% (Class A), 2.19% (Class C), and 1.19% (Class Y). |
| See accompanying notes to financial statements. |
| 13 |
Gabelli Enterprise Mergers and Acquisitions Fund
Notes to Financial Statements
1. Organization.The Gabelli Enterprise Mergers and Acquisitions Fund is a series of the Gabelli 787 Fund, Inc. (the Corporation), which was organized in Maryland and commenced operations on February 28, 2001. The Fund is anon-diversifiedopen-end management investment company registered under the Investment Company Act of 1940, as amended (the 1940 Act). Its primary objective is capital appreciation.
2. Significant Accounting Policies.As an investment company, the Fund follows the investment company accounting and reporting guidance, which is part of U.S. generally accepted accounting principles (GAAP) that may require the use of management estimates and assumptions in the preparation of its financial statements. Actual results could differ from those estimates. The following is a summary of significant accounting policies followed by the Fund in the preparation of its financial statements.
New Accounting Pronouncements.To improve the effectiveness of fair value disclosure requirements, the Financial Accounting Standards Board recently issued Accounting Standard Update (ASU)2018-13, Fair Value Measurement Disclosure Framework – Changes to the Disclosure Requirements for Fair Value Measurement (ASU2018-13), which adds, removes, and modifies certain aspects relating to fair value disclosure. ASU2018-13 is effective for interim and annual reporting periods beginning after December 15, 2019; early adoption of the additions relating to ASU2018-13 is not required, even if early adoption is elected for the removals and modifications under ASU2018-13. Management has early adopted the removals and modifications set forth in ASU2018-13 in these financial statements and has not early adopted the additions set forth in ASU2018-13.
Security Valuation.Portfolio securities listed or traded on a nationally recognized securities exchange or traded in the U.S.over-the-counter market for which market quotations are readily available are valued at the last quoted sale price or a market’s official closing price as of the close of business on the day the securities are being valued. If there were no sales that day, the security is valued at the average of the closing bid and asked prices or, if there were no asked prices quoted on that day, then the security is valued at the closing bid price on that day. If no bid or asked prices are quoted on such day, the security is valued at the most recently available price or, if the Board of Directors (the Board) so determines, by such other method as the Board shall determine in good faith to reflect its fair market value. Portfolio securities traded on more than one national securities exchange or market are valued according to the broadest and most representative market, as determined by Gabelli Funds, LLC (the Adviser).
Portfolio securities primarily traded on a foreign market are generally valued at the preceding closing values of such securities on the relevant market, but may be fair valued pursuant to procedures established by the Board if market conditions change significantly after the close of the foreign market, but prior to the close of business on the day the securities are being valued. Debt obligations for which market quotations are readily available are valued at the average of the latest bid and asked prices. If there were no asked prices quoted on such day, the security is valued using the closing bid price, unless the Board determines such amount does not reflect the securities’ fair value, in which case these securities will be fair valued as determined by the Board. Certain securities are valued principally using dealer quotations. Futures contracts are valued at the closing settlement price of the exchange or board of trade on which the applicable contract is traded. OTC futures and options on futures for which market quotations are readily available will be valued by quotations received from a pricing service or, if no quotations are available from a pricing service, by quotations obtained from one or more dealers in the instrument in question by the Adviser.
14
Gabelli Enterprise Mergers and Acquisitions Fund
Notes to Financial Statements (Continued)
Securities and assets for which market quotations are not readily available are fair valued as determined by the Board. Fair valuation methodologies and procedures may include, but are not limited to: analysis and review of available financial andnon-financial information about the company; comparisons with the valuation and changes in valuation of similar securities, including a comparison of foreign securities with the equivalent U.S. dollar value American Depositary Receipt securities at the close of the U.S. exchange; and evaluation of any other information that could be indicative of the value of the security.
The inputs and valuation techniques used to measure fair value of the Fund’s investments are summarized into three levels as described in the hierarchy below:
| ● | Level 1 — quoted prices in active markets for identical securities; |
| ● | Level 2 — other significant observable inputs (including quoted prices for similar securities, interest rates, prepayment speeds, credit risk, etc.); and |
| ● | Level 3 — significant unobservable inputs (including the Board’s determinations as to the fair value of investments). |
A financial instrument’s level within the fair value hierarchy is based on the lowest level of any input both individually and in the aggregate that is significant to the fair value measurement. The inputs or methodology used for valuing securities are not necessarily an indication of the risk associated with investing in those securities. The summary of the Fund’s investments in securities by inputs used to value the Fund’s investments as of October 31, 2019 is as follows:
| Valuation Inputs | ||||||||||||||||
| Level 1 Quoted Prices | Level 2 Other Significant Observable Inputs | Level 3 Significant Unobservable Inputs | Total Market Value at 10/31/19 | |||||||||||||
INVESTMENTS IN SECURITIES: | ||||||||||||||||
ASSETS (Market Value): | ||||||||||||||||
Common Stocks: | ||||||||||||||||
Energy and Utilities | $11,141,044 | $ 218,283 | — | $ 11,359,327 | ||||||||||||
Entertainment | 2,676,329 | — | $ 90,102 | 2,766,431 | ||||||||||||
Financial Services | 3,855,517 | 171,580 | — | 4,027,097 | ||||||||||||
All Other Industries (a) | 69,468,128 | — | — | 69,468,128 | ||||||||||||
Total Common Stocks | 87,141,018 | 389,863 | 90,102 | 87,620,983 | ||||||||||||
Closed-End Funds | — | 603,000 | — | 603,000 | ||||||||||||
Rights (a) | — | — | 359,496 | 359,496 | ||||||||||||
Corporate Bonds (a) | — | — | 3,010 | 3,010 | ||||||||||||
U.S. Government Obligations | — | 41,550,105 | — | 41,550,105 | ||||||||||||
TOTAL INVESTMENTS IN SECURITIES – ASSETS | $87,141,018 | $42,542,968 | $452,608(b | ) | $130,136,594 | |||||||||||
LIABILITIES (Market Value): Securities Sold Short (a)* | $ (223,282 | ) | — | — | $ (223,282 | ) | ||||||||||
TOTAL INVESTMENTS IN SECURITIES - LIABILITIES | $ (223,282 | ) | — | — | $ (223,282 | ) | ||||||||||
| (a) | Please refer to the Schedule of Investments for the industry classifications of these portfolio holdings. |
| (b) | Level 3 securities are valued by acquisition price or cash flow analysis. At October 31, 2019, the value of these securities was $452,608. The inputs for these securities are not readily available and are derived based on the judgement of the Adviser according to procedures approved by the Board of Directors. |
| * | All Securities Sold Short positions are common stocks. |
During the fiscal year ended October 31, 2019, the Fund did not have transfers into or out of Level 3.
15
Gabelli Enterprise Mergers and Acquisitions Fund
Notes to Financial Statements (Continued)
The following table reconciles Level 3 investments for which significant unobservable inputs were used to determine fair value:
| Balance as of 10/31/18 | Accrued discounts/ (premiums) | Realized gain | Change in unrealized appreciation/ depreciation | Purchases | Sales | Transfers into Level 3 | Transfers out of Level 3 | Balance as of 10/31/19 | Net change in unrealized 10/31/19† | |||||||||||||||||||||||||||||||
INVESTMENTS IN SECURITIES: | ||||||||||||||||||||||||||||||||||||||||
ASSETS (Market Value): | ||||||||||||||||||||||||||||||||||||||||
Common Stocks (a) | $ 87,890 | — | $486 | $ (5,118 | ) | $ 94,951 | $ (88,107 | ) | — | — | $ 90,102 | $ (4,849 | ) | |||||||||||||||||||||||||||
Rights (a) | 197,560 | — | — | 154,426 | 110,900 | (103,390 | ) | — | — | 359,496 | 154,426 | |||||||||||||||||||||||||||||
Corporate Bonds (a) | 3,010 | — | — | — | — | — | — | — | 3,010 | — | ||||||||||||||||||||||||||||||
TOTAL INVESTMENTS IN SECURITIES | $288,460 | — | $486 | $149,308 | $205,851 | $(191,497 | ) | — | — | $452,608 | $149,577 | |||||||||||||||||||||||||||||
| (a) | Please refer to the Schedule of Investments for the industry classifications of these portfolio holdings. |
| † | Net change in unrealized appreciation/depreciation on investments is included in the related amounts in the Statement of Operations. |
Additional Information to Evaluate Qualitative Information.
General.The Fund uses recognized industry pricing services – approved by the Board and unaffiliated with the Adviser – to value most of its securities, and uses broker quotes provided by market makers of securities not valued by these and other recognized pricing sources. Several different pricing feeds are received to value domestic equity securities, international equity securities, preferred equity securities, and fixed income securities. The data within these feeds are ultimately sourced from major stock exchanges and trading systems where these securities trade. The prices supplied by external sources are checked by obtaining quotations or actual transaction prices from market participants. If a price obtained from the pricing source is deemed unreliable, prices will be sought from another pricing service or from a broker/dealer that trades that security or similar securities.
Fair Valuation.Fair valued securities may be common or preferred equities, warrants, options, rights, or fixed income obligations. Where appropriate, Level 3 securities are those for which market quotations are not available, such as securities not traded for several days, or for which current bids are not available, or which are restricted as to transfer. When fair valuing a security, factors to consider include recent prices of comparable securities that are publicly traded, reliable prices of securities not publicly traded, the use of valuation models, current analyst reports, valuing the income or cash flow of the issuer, or cost if the preceding factors do not apply. A significant change in the unobservable inputs could result in a lower or higher value in Level 3 securities. The circumstances of Level 3 securities are frequently monitored to determine if fair valuation measures continue to apply.
The Adviser reports quarterly to the Board the results of the application of fair valuation policies and procedures. These may include backtesting the prices realized in subsequent trades of these fair valued securities to fair values previously recognized.
Derivative Financial Instruments.The Fund may engage in various portfolio investment strategies by investing in derivative financial instruments for the purposes of increasing the income of the Fund, hedging against changes
16
Gabelli Enterprise Mergers and Acquisitions Fund
Notes to Financial Statements (Continued)
in the value of its portfolio securities and in the value of securities it intends to purchase, or hedging against a specific transaction with respect to either the currency in which the transaction is denominated or another currency. Investing in certain derivative financial instruments, including participation in the options, futures, or swap markets, entails certain execution, liquidity, hedging, tax, and securities, interest, credit, or currency market risks. Losses may arise if the Adviser’s prediction of movements in the direction of the securities, foreign currency, and interest rate markets is inaccurate. Losses may also arise if the counterparty does not perform its duties under a contract, or, in the event of default, the Fund may be delayed in or prevented from obtaining payments or other contractual remedies owed to it under derivative contracts. The creditworthiness of the counterparties is closely monitored in order to minimize these risks. Participation in derivative transactions involves investment risks, transaction costs, and potential losses to which the Fund would not be subject absent the use of these strategies. The consequences of these risks, transaction costs, and losses may have a negative impact on the Fund’s ability to pay distributions.
Collateral requirements differ by type of derivative. Collateral requirements are set by the broker or exchange clearing house for exchange traded derivatives, while collateral terms are contract specific for derivatives tradedover-the-counter. Securities pledged to cover obligations of the Fund under derivative contracts are noted in the Schedule of Investments. Cash collateral, if any, pledged for the same purpose will be reported separately in the Statement of Assets and Liabilities.
The Fund’s derivative contracts held at October 31, 2019, if any, are not accounted for as hedging instruments under GAAP and are disclosed in the Schedule of Investments together with the related counterparty.
Swap Agreements.The Fund may enter into equity contract for difference swap transactions for the purpose of increasing the income of the Fund. The use of swaps is a highly specialized activity that involves investment techniques and risks different from those associated with ordinary portfolio security transactions. In an equity contract for difference swap, a set of future cash flows is exchanged between two counterparties. One of these cash flow streams will typically be based on a reference interest rate combined with the performance of a notional value of shares of a stock. The other will be based on the performance of the shares of a stock. Depending on the general state of short term interest rates and the returns on the Fund’s portfolio securities at the time an equity contract for difference swap transaction reaches its scheduled termination date, there is a risk that the Fund will not be able to obtain a replacement transaction or that the terms of the replacement will not be as favorable as on the expiring transaction.
Unrealized gains related to swaps are reported as an asset and unrealized losses are reported as a liability in the Statement of Assets and Liabilities. The change in value of swaps, including the accrual of periodic amounts of interest to be paid or received on swaps, is reported as unrealized gain or loss in the Statement of Operations. A realized gain or loss is recorded upon payment or receipt of a periodic payment or termination of swap agreements. At October 31, 2019, the Fund held no investments in equity contract for difference swap agreements.
Foreign Currency Translations.The books and records of the Fund are maintained in U.S. dollars. Foreign currencies, investments, and other assets and liabilities are translated into U.S. dollars at current exchange rates. Purchases and sales of investment securities, income, and expenses are translated at the exchange rate prevailing on the respective dates of such transactions. Unrealized gains and losses that result from changes in foreign exchange rates and/or changes in market prices of securities have been included in unrealized
17
Gabelli Enterprise Mergers and Acquisitions Fund
Notes to Financial Statements (Continued)
appreciation/depreciation on investments and foreign currency translations. Net realized foreign currency gains and losses resulting from changes in exchange rates include foreign currency gains and losses between trade date and settlement date on investment securities transactions, foreign currency transactions, and the difference between the amounts of interest and dividends recorded on the books of the Fund and the amounts actually received. The portion of foreign currency gains and losses related to fluctuation in exchange rates between the initial purchase trade date and subsequent sale trade date is included in realized gain/(loss) on investments.
Foreign Securities.The Fund may directly purchase securities of foreign issuers. Investing in securities of foreign issuers involves special risks not typically associated with investing in securities of U.S. issuers. The risks include possible revaluation of currencies, the inability to repatriate funds, less complete financial information about companies, and possible future adverse political and economic developments. Moreover, securities of many foreign issuers and their markets may be less liquid and their prices more volatile than securities of comparable U.S. issuers.
Foreign Taxes.The Fund may be subject to foreign taxes on income, gains on investments, or currency repatriation, a portion of which may be recoverable. The Fund will accrue such taxes and recoveries as applicable, based upon its current interpretation of tax rules and regulations that exist in the markets in which it invests.
Securities Sold Short.The Fund may enter into short sale transactions. Short selling involves selling securities that may or may not be owned and, at times, borrowing the same securities for delivery to the purchaser, with an obligation to replace such borrowed securities at a later date. The proceeds received from short sales are recorded as liabilities and the Fund records an unrealized gain or loss to the extent of the difference between the proceeds received and the value of an open short position on the day of determination. The Fund records a realized gain or loss when the short position is closed out. By entering into a short sale, the Fund bears the market risk of an unfavorable change in the price of the security sold short. Dividends on short sales are recorded as an expense by the Fund on theex-dividend date and interest expense is recorded on the accrual basis. The broker retains collateral for the value of the open positions, which is adjusted periodically as the value of the position fluctuates. Securities sold short and details of collateral at October 31, 2019 are reflected within the Schedule of Investments. For the fiscal year ended October 31, 2019, the Fund incurred $6 in service fees related to its investment positions sold short and held by the broker. The amount is included in the Statement of Operations under Expenses, Service fees for securities sold short.
Investments in Other Investment Companies.The Fund may invest, from time to time, in shares of other investment companies (or entities that would be considered investment companies but are excluded from the definition pursuant to certain exceptions under the 1940 Act) (the Acquired Funds) in accordance with the 1940 Act and related rules. Shareholders in the Fund would bear the pro rata portion of the periodic expenses of the Acquired Funds in addition to the Fund’s expenses. For the fiscal year ended October 31, 2019, the Fund’s pro rata portion of the periodic expenses charged by the Acquired Funds was less than one basis point.
Restricted Securities.The Fund may invest up to 15% of its net assets in securities for which the markets are restricted. Restricted securities include securities whose disposition is subject to substantial legal or contractual restrictions. The sale of restricted securities often requires more time and results in higher brokerage charges or dealer discounts and other selling expenses than the sale of securities eligible for trading on national securities exchanges or in theover-the-counter markets. Restricted securities may sell at a price lower than similar securities that are not subject to restrictions on resale. Securities freely saleable among qualified institutional investors
18
Gabelli Enterprise Mergers and Acquisitions Fund
Notes to Financial Statements (Continued)
under special rules adopted by the SEC may be treated as liquid if they satisfy liquidity standards established by the Board. The continued liquidity of such securities is not as well assured as that of publicly traded securities, and accordingly the Board will monitor their liquidity. At October 31, 2019, the Fund did not hold restricted securities.
Securities Transactions and Investment Income.Securities transactions are accounted for on the trade date with realized gain or loss on investments determined by using the identified cost method. Interest income (including amortization of premium and accretion of discount) is recorded on the accrual basis. Premiums and discounts on debt securities are amortized using the effective yield to maturity method. Dividend income is recorded on theex-dividend date, except for certain dividends from foreign securities that are recorded as soon after theex-dividend date as the Fund becomes aware of such dividends.
Determination of Net Asset Value and Calculation of Expenses.Certain administrative expenses are common to, and allocated among, various affiliated funds. Such allocations are made on the basis of each fund’s average net assets or other criteria directly affecting the expenses as determined by the Adviser pursuant to procedures established by the Board.
In calculating the NAV per share of each class, investment income, realized and unrealized gains and losses, redemption fees, and expenses other than class specific expenses are allocated daily to each class of shares based upon the proportion of net assets of each class at the beginning of each day. Distribution expenses are borne solely by the class incurring the expense.
Distributions to Shareholders.Distributions to shareholders are recorded on theex-dividend date. Distributions to shareholders are based on income and capital gains as determined in accordance with federal income tax regulations, which may differ from income and capital gains as determined under GAAP. These differences are primarily due to differing treatments of income and gains on various investment securities and foreign currency transactions held by the Fund. These book/tax differences are either temporary or permanent in nature. To the extent these differences are permanent, adjustments are made to the appropriate capital accounts in the period when the differences arise. Permanent differences were primarily due to the redesignation of dividends paid, tax treatment of currency gains and losses, sale of investments in partnerships, and the reclass of capital gains on passive foreign investment companies. These reclassifications have no impact on the NAV of the Fund.
The tax character of distributions paid during the fiscal years ended October 31, 2019 and 2018 was as follows:
| Year Ended October 31, 2019 | Year Ended October 31, 2018 | |||||||
Distributions paid from: | ||||||||
Ordinary income (inclusive of short term capital gains) | $1,919,805 | — | ||||||
Net long-term capital gains | 6,334,224 | $2,192,424 | ||||||
|
|
|
| |||||
Total distributions paid | $8,254,029 | $2,192,424 | ||||||
|
|
|
| |||||
Provision for Income Taxes.The Fund intends to continue to qualify as a regulated investment company under Subchapter M of the Internal Revenue Code of 1986, as amended (the Code). It is the policy of the Fund to comply with the requirements of the Code applicable to regulated investment companies and to distribute
19
Gabelli Enterprise Mergers and Acquisitions Fund
Notes to Financial Statements (Continued)
substantially all of its net investment company taxable income and net capital gains. Therefore, no provision for federal income taxes is required.
At October 31, 2019, the components of accumulated earnings/losses on a tax basis were as follows:
Undistributed ordinary income | $ | 2,368,863 | ||
Net unrealized appreciation on investments and foreign currency translations | 4,176,554 | |||
|
| |||
Total | $ | 6,545,417 | ||
|
|
The Fund is permitted to carry forward capital losses for an unlimited period. Capital losses that are carried forward will retain their character as either short term or long term capital losses.
At October 31, 2019, the temporary differences between book basis and tax basis unrealized appreciation on investments were primarily due to deferral of losses from wash sales for tax purposes.
The following summarizes the tax cost of investments and the related net unrealized appreciation at October 31, 2019:
| Cost/(Proceeds) | Gross Unrealized Appreciation | Gross Unrealized Depreciation | Net Unrealized Appreciation | |||||||||||
Investments and securities sold short | $125,736,704 | $15,914,688 | $(11,738,080 | ) | $4,176,608 | |||||||||
The Fund is required to evaluate tax positions taken or expected to be taken in the course of preparing the Fund’s tax returns to determine whether the tax positions are“more-likely-than-not” of being sustained by the applicable tax authority. Income tax and related interest and penalties would be recognized by the Fund as tax expense in the Statement of Operations if the tax positions were deemed not to meet themore-likely-than-not threshold. For the fiscal year ended October 31, 2019, the Fund did not incur any income tax, interest, or penalties. As of October 31, 2019, the Adviser has reviewed all open tax years and concluded that there was no impact to the Fund’s net assets or results of operations. The Fund’s federal and state tax returns for the prior three fiscal years remain open, subject to examination. On an ongoing basis, the Adviser will monitor the Fund’s tax positions to determine if adjustments to this conclusion are necessary.
3. Investment Advisory Agreement and Other Transactions.The Fund has entered into an investment advisory agreement (the Advisory Agreement) with the Adviser which provides that the Fund will pay the Adviser a fee, computed daily and paid monthly, at annual rates as follows:
First $1 Billion | 0.935 | % | ||
Next $ 1 Billion | 0.910 | % | ||
Next $ 3 Billion | 0.885 | % | ||
Next $ 5 Billion | 0.860 | % | ||
Thereafter | 0.835 | % |
In accordance with the Advisory Agreement, the Adviser provides a continuous investment program for the Fund’s portfolio, oversees the administration of all aspects of the Fund’s business and affairs, and pays the compensation of all Officers and Directors of the Fund who are affiliated persons of the Adviser.
As per the approval of the Board, the Fund is allocated a portion of the Chief Compliance Officer’s cost. For the fiscal year ended October 31, 2019, the Fund paid or accrued $3,895 in payroll expenses in the Statement of Operations.
20
Gabelli Enterprise Mergers and Acquisitions Fund
Notes to Financial Statements (Continued)
The Fund pays each Director who is not considered an affiliated person an annual retainer of $6,000 plus $1,000 for each Board meeting attended, and they are reimbursed by the Fund for any out of pocket expenses incurred in attending meetings. All Board committee members receive $500 per meeting attended and the Chairman of the Audit Committee and the Lead Director receive annual fees of $1,500 and $2,000, respectively. The Chairmen of the Proxy Voting Committee and the Nominating Committee each receives annual fees of $1,000. A Director may receive a single meeting fee, allocated among the participating funds, for participation in certain meetings held on behalf of multiple funds. Directors who are directors or employees of the Adviser or an affiliated company receive no compensation or expense reimbursement from the Fund.
4. Distribution Plan.The Fund’s Board has adopted a distribution plan (the Plan) pursuant to Rule12b-1 under the 1940 Act. Under the Class AAA, Class A, and Class C Share Plans, payments are authorized to G.distributors, LLC (the Distributor), an affiliate of the Adviser, at annual rates of 0.25%, 0.45%, and 1.00%, respectively, of the average daily net assets of those classes, the annual limitations under each Plan. Such payments are accrued daily and paid monthly. Class Y shares do not participate in the Plan and pay no distribution fees.
5. Portfolio Securities.Purchases and sales of securities during the fiscal year ended October 31, 2019, other than short term securities and U.S. Government obligations, aggregated $207,218,383 and $237,899,013, respectively.
6. Transactions with Affiliates and Other Arrangements.During the fiscal year ended October 31, 2019, the Fund paid $124,210 in brokerage commissions on security trades to G.research, LLC, an affiliate of the Adviser. Additionally, the Distributor retained a total of $4,970 from investors representing commissions (sales charges and underwriting fees) on sales and redemptions of Fund shares.
During the fiscal year ended October 31, 2019, the Fund received credits from a designated broker who agreed to pay certain Fund operating expenses. The amount of such expenses paid through this directed brokerage arrangement during this period was $2,528.
The cost of calculating the Fund’s NAV per share is a Fund expense pursuant to the Advisory Agreement. During the fiscal year ended October 31, 2019, the Fund accrued $45,000 in connection with the cost of computing the Fund’s NAV.
7. Line of Credit.The Fund participates in an unsecured line of credit, which expires on March 4, 2020 and may be renewed annually, of up to $75,000,000 under which it may borrow up to 10% of its net assets from the custodian for temporary borrowing purposes. Borrowings under this arrangement bear interest at a floating rate equal to the higher of the overnight Federal Funds rate plus 125 basis points or the one month ICE LIBOR plus 125 basis points in effect on that day. This amount, if any, would be included in “Interest expense” in the Statement of Operations. During the fiscal year ended October 31, 2019, there were no borrowings under the line of credit.
8. Capital Stock.The Fund offers four classes of shares – Class AAA Shares, Class A Shares, Class C Shares, and Class Y Shares. Class AAA Shares and Class Y Shares are offered without a sales charge. Class A Shares are subject to a maximumfront-end sales charge of 5.75%, respectively. Class C Shares are subject to a 1.00% contingent deferred sales charge for one year after purchase.
21
Gabelli Enterprise Mergers and Acquisitions Fund
Notes to Financial Statements (Continued)
The Fund imposes a redemption fee of 2.00% on all classes of shares that are redeemed or exchanged on or before the seventh day after the date of purchase. The redemption fee is deducted from the proceeds otherwise payable to the redeeming shareholders and is retained by the Fund as an increase inpaid-in capital. The redemption fees retained by the Fund during the fiscal years ended October 31, 2019 and 2018, if any, can be found in the Statement of Changes in Net Assets under Redemption Fees.
Transactions in shares of capital stock were as follows:
| Year Ended October 31, 2019 | Year Ended October 31, 2018 | |||||||||||||||||||||||||||
| Shares | Amount | Shares | Amount | |||||||||||||||||||||||||
Class AAA | ||||||||||||||||||||||||||||
Shares sold | 120,955 | $ | 1,746,746 | 446,062 | $ | 6,682,300 | ||||||||||||||||||||||
Shares issued upon reinvestment of distributions | 26,124 | 355,816 | 5,883 | 87,768 | ||||||||||||||||||||||||
Shares redeemed | (226,465 | ) | (3,230,998 | ) | (393,560 | ) | (5,860,195 | ) | ||||||||||||||||||||
|
|
|
|
|
|
|
| |||||||||||||||||||||
Net increase/(decrease) | (79,386 | ) | $ | (1,128,436 | ) | 58,385 | $ | 909,873 | ||||||||||||||||||||
|
|
|
|
|
|
|
| |||||||||||||||||||||
Class A | ||||||||||||||||||||||||||||
Shares sold | 929,358 | $ | 13,212,994 | 653,935 | $ | 9,636,419 | ||||||||||||||||||||||
Shares issued upon reinvestment of distributions | 113,679 | 1,523,299 | 39,105 | 574,455 | ||||||||||||||||||||||||
Shares redeemed | (1,173,727 | ) | (16,568,366 | ) | (1,317,649 | ) | (19,418,817 | ) | ||||||||||||||||||||
|
|
|
|
|
|
|
| |||||||||||||||||||||
Net decrease | (130,690 | ) | $ | (1,832,073 | ) | (624,609 | ) | $ | (9,207,943 | ) | ||||||||||||||||||
|
|
|
|
|
|
|
| |||||||||||||||||||||
Class C | ||||||||||||||||||||||||||||
Shares sold | 226,851 | $ | 2,952,133 | 362,906 | $ | 4,914,407 | ||||||||||||||||||||||
Shares issued upon reinvestment of distributions | 135,544 | 1,652,283 | 35,125 | 473,129 | ||||||||||||||||||||||||
Shares redeemed | (1,771,118 | ) | (22,780,973 | ) | (589,494 | ) | (7,942,553 | ) | ||||||||||||||||||||
|
|
|
|
|
|
|
| |||||||||||||||||||||
Net decrease | (1,408,723 | ) | $ | (18,176,557 | ) | (191,463 | ) | $ | (2,555,017 | ) | ||||||||||||||||||
|
|
|
|
|
|
|
| |||||||||||||||||||||
Class T (a) | ||||||||||||||||||||||||||||
Shares issued upon reinvestment of distributions | — | — | 1 | $ | 13 | |||||||||||||||||||||||
Shares redeemed | — | — | (70 | ) | (1,054 | ) | ||||||||||||||||||||||
|
|
|
|
|
|
|
| |||||||||||||||||||||
Net decrease | — | — | (69 | ) | $ | (1,041 | ) | |||||||||||||||||||||
|
|
|
|
|
|
|
| |||||||||||||||||||||
Class Y | ||||||||||||||||||||||||||||
Shares sold | 1,368,874 | $ | 20,805,955 | 3,051,551 | $ | 48,099,684 | ||||||||||||||||||||||
Shares issued upon reinvestment of distributions | 237,875 | 3,413,506 | 36,202 | 568,002 | ||||||||||||||||||||||||
Shares redeemed | (2,279,500 | ) | (34,515,368 | ) | (2,017,168 | ) | (31,803,997 | ) | ||||||||||||||||||||
|
|
|
|
|
|
|
| |||||||||||||||||||||
Net increase/(decrease) | (672,751 | ) | $ | (10,295,907 | ) | 1,070,585 | $ | 16,863,689 | ||||||||||||||||||||
|
|
|
|
|
|
|
| |||||||||||||||||||||
| (a) | Class T Shares were liquidated on September 21, 2018. |
9. Indemnifications.The Fund enters into contracts that contain a variety of indemnifications. The Fund’s maximum exposure under these arrangements is unknown. However, the Fund has not had prior claims or losses pursuant to these contracts. Management has reviewed the Fund’s existing contracts and expects the risk of loss to be remote.
10. Subsequent Events.Management has evaluated the impact on the Fund of all subsequent events occurring through the date the financial statements were issued and has determined that there were no subsequent events requiring recognition or disclosure in the financial statements.
22
Gabelli Enterprise Mergers and Acquisitions Fund
Report of Independent Registered Public Accounting Firm
To the Board of Directors of Gabelli 787 Fund, Inc. and Shareholders of
Gabelli Enterprise Mergers and Acquisitions Fund
Opinion on the Financial Statements
We have audited the accompanying statement of assets and liabilities, including the schedule of investments, of Gabelli Enterprise Mergers and Acquisitions Fund (the “Fund”) as of October 31, 2019, the related statement of operations for the year ended October 31, 2019, the statement of changes in net assets for each of the two years in the period ended October 31, 2019, including the related notes, and the financial highlights for each of the five years in the period ended October 31, 2019 (collectively referred to as the “financial statements”). In our opinion, the financial statements present fairly, in all material respects, the financial position of the Fund as of October 31, 2019, the results of its operations for the year then ended, the changes in its net assets for each of the two years in the period ended October 31, 2019 and the financial highlights for each of the five years in the period ended October 31, 2019 in conformity with accounting principles generally accepted in the United States of America.
Basis for Opinion
These financial statements are the responsibility of the Fund’s management. Our responsibility is to express an opinion on the Fund’s financial statements based on our audits. We are a public accounting firm registered with the Public Company Accounting Oversight Board (United States) (“PCAOB”) and are required to be independent with respect to the Fund in accordance with the U.S. federal securities laws and the applicable rules and regulations of the Securities and Exchange Commission and the PCAOB.
We conducted our audits of these financial statements in accordance with the standards of the PCAOB. Those standards require that we plan and perform the audit to obtain reasonable assurance about whether the financial statements are free of material misstatement, whether due to error or fraud.
Our audits included performing procedures to assess the risks of material misstatement of the financial statements, whether due to error or fraud, and performing procedures that respond to those risks. Such procedures included examining, on a test basis, evidence regarding the amounts and disclosures in the financial statements. Our audits also included evaluating the accounting principles used and significant estimates made by management, as well as evaluating the overall presentation of the financial statements. Our procedures included confirmation of securities owned as of October 31, 2019 by correspondence with the custodian and brokers; when replies were not received from brokers, we performed other auditing procedures. We believe that our audits provide a reasonable basis for our opinion.
/s/PricewaterhouseCoopers LLP
New York, New York
December 23, 2019
We have served as the auditor of one or more investment companies in Gabelli/GAMCO Fund Complex since 1986.
23
Gabelli Enterprise Mergers and Acquisitions Fund
Additional Fund Information (Unaudited)
The business and affairs of the Fund are managed under the direction of the Fund’s Board of Directors. Information pertaining to the Directors and officers of the Fund is set forth below. The Fund’s Statement of Additional Information includes additional information about the Fund’s Directors and is available without charge, upon request, by calling800-GABELLI(800-422-3554) or by writing to the Gabelli Enterprise Mergers and Acquisitions Fund at One Corporate Center, Rye, NY 10580-1422.
Name, Position(s) Address1 and Age | Term of Office | Number of Funds in Fund Complex Overseen by Director | Principal Occupation(s) During Past Five Years | Other Directorships Held by Director3 | ||||
INTERESTED DIRECTOR4: | ||||||||
Regina M. Pitaro Director Age: 64 | Since 2008 | 1 | Managing Director of GAMCO Asset Management, Inc. | — | ||||
INDEPENDENT DIRECTORS5: | ||||||||
Anthony J. Colavita Director Age: 83 | Since 2008 | 20 | President of the law firm of Anthony J. Colavita, P.C. | — | ||||
James P. Conn Director Age: 81 | Since 2008 | 24 | Former Managing Director and Chief Investment Officer of Financial Security Assurance Holdings Ltd. (1992-1998) | — | ||||
Vincent D. Enright Director Age: 75 | Since 2008 | 17 | Former Senior Vice President and Chief Financial Officer of KeySpan Corp. (public utility) (1994-1998) | Director of Echo Therapeutics, Inc. (therapeutics and diagnostics) (2008-2014); Director of The LGL Group, Inc. (diversified manufacturing) (2011-2014) | ||||
Kuni Nakamura Director Age: 51 | Since 2008 | 33 | President of Advanced Polymer, Inc. (chemical manufacturing company); President of KEN Enterprises, Inc. (real estate) | — | ||||
Salvatore M. Salibello Director Age: 74 | Since 2016 | 6 | Senior Partner of Bright Side Consulting (consulting); Certified Public Accountant and Managing Partner of the certified public accounting firm of Salibello & Broder LLP (1978-2012); Partner of BDO Seidman, LLP (2012-2013) | Director of Nine West, Inc. (consumer products) (2002-2014) | ||||
Salvatore J. Zizza6 Director Age: 73 | Since 2008 | 31 | President of Zizza & Associates Corp. (private holding company); President of Bergen Cove Realty Inc.; Chairman of Harbor Diversified, Inc. (pharmaceuticals) (2009-2018); Chairman of BAM (semiconductor and aerospace manufacturing)(2000-2018); Chairman of Metropolitan Paper Recycling Inc. (recycling) (2005-2014) | Director and Chairman of Trans-Lux Corporation (business services); Director and Chairman of Harbor Diversified Inc. (pharmaceuticals) (2009-2018) | ||||
24
Gabelli Enterprise Mergers and Acquisitions Fund
Additional Fund Information (Continued) (Unaudited)
Name, Position(s) Address1 and Age | Term of Office and Length of Time Served2 | Principal Occupation(s) During Past Five Years | ||||
OFFICERS: | ||||||
Bruce N. Alpert President Age: 67 | Since 2008 | Executive Vice President and Chief Operating Officer of Gabelli Funds, LLC since 1988; Officer of registered investment companies within the Gabelli/GAMCO Fund Complex; Senior Vice President of GAMCO Investors, Inc. since 2008 | ||||
John C. Ball Treasurer Age: 43 | Since 2017 | Treasurer of funds within the Gabelli/GAMCO Fund Complex since 2017; Vice President and Assistant Treasurer of AMG Funds, 2014-2017; Vice President of State Street Corporation, 2007-2014 | ||||
Agnes Mullady Vice President Age: 61 | Since 2008 | Officer of registered investment companies within the Gabelli/GAMCO Fund Complex since 2006; President and Chief Operating Officer of the Fund Division of Gabelli Funds, LLC since 2015; Chief Executive Officer of G.distributors, LLC since 2010; Senior Vice President of GAMCO Investors, Inc. since 2009; Vice President of Gabelli Funds, LLC since 2007; Executive Vice President of Associated Capital Group, Inc. since 2016 | ||||
Andrea R. Mango Secretary Age: 47 | Since 2013 | Vice President of GAMCO Investors, Inc. since 2016; Counsel of Gabelli Funds, LLC since 2013; Secretary of registered investment companies within the Gabelli/GAMCO Fund Complex since 2013; Vice President ofclosed-end funds within the Gabelli/GAMCO Fund Complex since 2014 | ||||
Richard J. Walz Chief Compliance Officer Age: 60 | Since 2013 | Chief Compliance Officer of registered investment companies within the Gabelli/GAMCO Fund Complex since 2013 | ||||
| 1 | Address: One Corporate Center, Rye, NY 10580-1422, unless otherwise noted. |
| 2 | Each Director will hold office for an indefinite term until the earliest of (i) the next meeting of shareholders, if any, called for the purpose of considering the election orre-election of such Director and until the election and qualification of his or her successor, if any, elected at such meeting, or (ii) the date a Director resigns or retires, or a Director is removed by the Board of Directors or shareholders, in accordance with the Fund’sBy-Laws and Articles of Incorporation. Each officer will hold office for an indefinite term until the date he or she resigns or retires or until his or her successor is elected and qualified. Includes time served in prior officer positions with the Fund. |
| 3 | This column includes only directorships of companies required to report to the SEC under the Securities Exchange Act of 1934, as amended, i.e., public companies, or other investment companies registered under the 1940 Act. |
| 4 | “Interested person” of the Fund as defined in the 1940 Act. Ms. Pitaro is considered an “interested person” because of her affiliation with Gabelli Funds, LLC that acts as the Fund’s investment adviser. |
| 5 | Directors who are not interested persons are considered “Independent” Directors. |
| 6 | On September 9, 2015, Mr. Zizza entered into a settlement with the SEC to resolve an inquiry relating to an alleged violation regarding the making of false statements or omissions to the accountants of a company concerning a related party transaction. The company in question is not an affiliate of, nor has any connection to, the Fund. Under the terms of the settlement, Mr. Zizza, without admitting or denying the SEC’s findings and allegation, paid $150,000 and agreed to cease and desist committing or causing any future violations of Rule13b2-2 of the Securities Exchange Act of 1934, as amended (the 1934 Act). The Board has discussed this matter and has determined that it does not disqualify Mr. Zizza from serving as an Independent Trustee. |
25
Gabelli Enterprise Mergers and Acquisitions Fund
Additional Fund Information (Continued) (Unaudited)
2019 TAX NOTICE TO SHAREHOLDERS(Unaudited)
For the fiscal year ended October 31, 2019, the Fund paid to shareholders ordinary income distributions (comprised of net investment income and short term capital gains) totaling $0.1804, $0.1433, 0.1077, and $0.2214 per share for Class AAA, Class A, Class C, and Class Y, respectively, and long term capital gains totaling $6,334,224, or the maximum allowable. The distribution of long term capital gains has been designated as a capital gain dividend by the Fund’s Board of Directors. For the fiscal year ended October 31, 2019, 99.90% of the ordinary income distribution qualifies for the dividends received deduction available to corporations. The Fund designates 99.93% of the ordinary income distribution as qualified dividend income pursuant to the Job and Growth Tax Relief Reconciliation Act of 2003. The Fund designates 29.97% of the ordinary income distribution as qualified interest income pursuant to the Tax Relief, Unemployment Reauthorization, and Job Creation Act of 2010. The Fund designates 100.00% of the ordinary income distribution as qualified short term gain pursuant to the American Jobs Creation Act of 2004.
U.S. Government Income:
The percentage of the ordinary income distribution paid by the Fund during the fiscal year ended October 31, 2019 which was derived from U.S. Treasury securities was 12.67%. Such income is exempt from state and local tax in all states. However, many states, including New York and California, allow a tax exemption for a portion of the income earned only if a mutual fund has invested at least 50% of its assets at the end of each quarter of the Fund’s fiscal year in U.S. Government securities. The Gabelli Enterprise Mergers and Acquisitions Fund did not meet this strict requirement in 2019. The percentage of U.S. Government securities held as of October 31, 2019 was 31.90%. Due to the diversity in state and local tax law, it is recommended that you consult your personal tax adviser as to the applicability of the information provided to your specific situation.
All designations are based on financial information available as of the date of this annual report and, accordingly, are subject to change. For each item, it is the intention of the Fund to designate the maximum amount permitted under the Internal Revenue Code and the regulations thereunder.
26
GABELLI ENTERPRISE MERGERS AND ACQUISITIONS FUND
One Corporate Center
Rye, NY 10580-1422
Portfolio Manager Biography
Mario J. Gabelli, CFA,is Chairman, Chief Executive Officer, and Chief Investment Officer - Value Portfolios of GAMCO Investors, Inc. that he founded in 1977, and Chief Investment Officer - Value Portfolios of Gabelli Funds, LLC and GAMCO Asset Management Inc. He is also Executive Chairman of Associated Capital Group, Inc. Mr. Gabelli is a summa cum laude graduate of Fordham University and holds an MBA degree from Columbia Business School and Honorary Doctorates from Fordham University and Roger Williams University.
GABELLI ENTERPRISE MERGERS AND
ACQUISITIONS FUND
A Portfolio of the Gabelli 787 Fund, Inc.
One Corporate Center
Rye, New York 10580-1422
t 800-GABELLI(800-422-3554)
f 914-921-5118
e info@gabelli.com
| GABELLI.COM |
Net Asset Value per share available daily
by calling800-GABELLI after 7:00 P.M.
BOARD OF DIRECTORS
Anthony J. Colavita President, Anthony J. Colavita, P.C.
James P. Conn Former Managing Director and Chief Investment Officer, Financial Security Assurance Holdings Ltd.
Vincent D. Enright Former Senior Vice President and Chief Financial Officer, KeySpan Corporation
Kuni Nakamura President, Advanced Polymer, Inc.
Regina M. Pitaro Managing Director, GAMCO Asset Management Inc.
Salvatore M. Salibello Senior Partner, Bright Side Consulting
Salvatore J. Zizza Chairman, Zizza & Associates Corp.
|
OFFICERS
Bruce N. Alpert President
John C. Ball Treasurer
Agnes Mullady Vice President
Andrea R. Mango Secretary
Richard J. Walz Chief Compliance Officer DISTRIBUTOR
G.distributors, LLC CUSTODIAN
State Street Bank and Trust Company
TRANSFER AGENT AND DIVIDEND DISBURSING AGENT
DST Asset Manager Solutions, Inc.
LEGAL COUNSEL Paul Hastings LLP
|
This report is submitted for the general information of the shareholders of the Gabelli Enterprise Mergers and Acquisitions Fund. It is not authorized for distribution to prospective investors unless preceded or accompanied by an effective prospectus.
GAB208Q419AR

Item 2. Code of Ethics.
| (a) | The registrant, as of the end of the period covered by this report, has adopted a code of ethics that applies to the registrant’s principal executive officer, principal financial officer, principal accounting officer or controller, or persons performing similar functions, regardless of whether these individuals are employed by the registrant or a third party. |
| (c) | There have been no amendments, during the period covered by this report, to a provision of the code of ethics that applies to the registrant’s principal executive officer, principal financial officer, principal accounting officer or controller, or persons performing similar functions, regardless of whether these individuals are employed by the registrant or a third party, and that relates to any element of the code of ethics description. |
| (d) | The registrant has not granted any waivers, including an implicit waiver, from a provision of the code of ethics that applies to the registrant’s principal executive officer, principal financial officer, principal accounting officer or controller, or persons performing similar functions, regardless of whether these individuals are employed by the registrant or a third party, that relates to one or more of the items set forth in paragraph (b) of this item’s instructions. |
Item 3. Audit Committee Financial Expert.
As of the end of the period covered by the report, the registrant’s board of directors has determined that Salvatore Salibello is qualified to serve as an audit committee financial expert serving on its audit committee and that he is “independent,” as defined by Item 3 of FormN-CSR.
Item 4. Principal Accountant Fees and Services.
Audit Fees
| (a) | The aggregate fees billed for each of the last two fiscal years for professional services rendered by the principal accountant for the audit of the registrant’s annual financial statements or services that are normally provided by the accountant in connection with statutory and regulatory filings or engagements for those fiscal years are $21,205 in 2018 and $21,205 in 2019. |
Audit-Related Fees
| (b) | The aggregate fees billed in each of the last two fiscal years for assurance and related services by the principal accountant that are reasonably related to the performance of the |
audit of the registrant’s financial statements and are not reported under paragraph (a) of this Item are $0 in 2018 and $0 in 2019. |
Tax Fees
| (c) | The aggregate fees billed in each of the last two fiscal years for professional services rendered by the principal accountant for tax compliance, tax advice, and tax planning are $4,190 in 2018 and $4,340in 2019. Tax fees include amounts related to tax compliance, tax reporting and tax planning. |
All Other Fees
| (d) | The aggregate fees billed in each of the last two fiscal years for products and services provided by the principal accountant, other than the services reported in paragraphs (a) through (c) of this Item are $0 in 2018 and $0 in 2019. |
| (e)(1) | Disclose the audit committee’spre-approval policies and procedures described in paragraph (c)(7) of Rule2-01 of RegulationS-X. |
Pre-Approval Policies and Procedures. The Audit Committee (“Committee”) of the registrant is responsible forpre-approving (i) all audit and permissiblenon-audit services to be provided by the independent registered public accounting firm to the registrant and (ii) all permissiblenon-audit services to be provided by the independent registered public accounting firm to the Adviser, Gabelli Funds, LLC, and any affiliate of Gabelli Funds, LLC (“Gabelli”) that provides services to the registrant (a “Covered Services Provider”) if the independent registered public accounting firm’s engagement related directly to the operations and financial reporting of the registrant. The Committee may delegate its responsibility topre-approve any such audit and permissiblenon-audit services to the Chairperson of the Committee, and the Chairperson must report to the Committee, at its next regularly scheduled meeting after the Chairperson’spre-approval of such services, his or her decision(s). The Committee may also establish detailedpre-approval policies and procedures forpre-approval of such services in accordance with applicable laws, including the delegation of some or all of the Committee’spre-approval responsibilities to the other persons (other than Gabelli or the registrant’s officers).Pre-approval by the Committee of any permissiblenon-audit services is not required so long as: (i) the permissiblenon-audit services were not recognized by the registrant at the time of the engagement to benon-audit services; and (ii) such services are promptly brought to the attention of the Committee and approved by the Committee or Chairperson prior to the completion of the audit.
| (e)(2) | The percentage of services described in each of paragraphs (b) through (d) of this Item that were approved by the audit committee pursuant to paragraph (c)(7)(i)(C) of Rule2-01 of RegulationS-X are as follows: |
| (b) | N/A |
| (c) | 0% |
| (d) | N/A |
| (f) | The percentage of hours expended on the principal accountant’s engagement to audit the registrant’s financial statements for the most recent fiscal year that were attributed to work performed by persons other than the principal accountant’s full-time, permanent employees was less than fifty percent. |
| (g) | The aggregatenon-audit fees billed by the registrant’s accountant for services rendered to the registrant, and rendered to the registrant’s investment adviser (not including anysub-adviser whose role is primarily portfolio management and is subcontracted with or overseen by another investment adviser), and any entity controlling, controlled by, or under common control with the adviser that provides ongoing services to the registrant for each of the last two fiscal years of the registrant was $4,190 in 2018 and $4,340 in 2019. |
| (h) | The registrant’s audit committee of the board of directors has considered whether the provision ofnon-audit services that were rendered to the registrant’s investment adviser (not including anysub-adviser whose role is primarily portfolio management and is subcontracted with or overseen by another investment adviser), and any entity controlling, controlled by, or under common control with the investment adviser that provides ongoing services to the registrant that were notpre-approved pursuant to paragraph (c)(7)(ii) of Rule2-01 of RegulationS-X is compatible with maintaining the principal accountant’s independence. |
Item 5. Audit Committee of Listed Registrants.
Not applicable.
Item 6. Investments.
| (a) | Schedule of Investments in securities of unaffiliated issuers as of the close of the reporting period is included as part of the report to shareholders filed under Item 1 of this form. |
| (b) | Not applicable due to no such divestments during the semi-annual period covered since the previous FormN-CSR filing. |
| Item 7. | Disclosure of Proxy Voting Policies and Procedures forClosed-End Management Investment Companies. |
Not applicable.
Item 8. Portfolio Managers ofClosed-End Management Investment Companies.
Not applicable.
| Item 9. | Purchases of Equity Securities byClosed-End Management Investment Company and Affiliated Purchasers. |
Not applicable.
Item 10. Submission of Matters to a Vote of Security Holders.
There have been no material changes to the procedures by which the shareholders may recommend nominees to the registrant’s board of directors, where those changes were implemented after the registrant last provided disclosure in response to the requirements of Item 407(c)(2)(iv) of RegulationS-K (17 CFR 229.407) (as required by Item 22(b)(15) of Schedule 14A (17 CFR240.14a-101)), or this Item.
Item 11. Controls and Procedures.
| (a) | The registrant’s principal executive and principal financial officers, or persons performing similar functions, have concluded that the registrant’s disclosure controls and procedures (as defined in Rule30a-3(c) under the Investment Company Act of 1940, as amended (the “1940 Act”) (17 CFR270.30a-3(c))) are effective, as of a date within 90 days of the filing date of the report that includes the disclosure required by this paragraph, based on their evaluation of these controls and procedures required by Rule30a-3(b) under the 1940 Act (17 CFR270.30a-3(b)) and Rules13a-15(b) or15d-15(b) under the Securities Exchange Act of 1934, as amended (17 CFR240.13a-15(b) or240.15d-15(b)). |
| (b) | There were no changes in the registrant’s internal control over financial reporting (as defined in Rule30a-3(d) under the 1940 Act (17 CFR270.30a-3(d))) that occurred during the period covered by this report that has materially affected, or is reasonably likely to materially affect, the registrant’s internal control over financial reporting. |
| Item 12. | Disclosure of Securities Lending Activities forClosed-End Management Investment Companies. |
Not applicable.
Item 13. Exhibits.
| (a)(1) | Code of ethics, or any amendment thereto, that is the subject of disclosure required by Item 2 is attached hereto. |
| (a)(2) | Certifications pursuant to Rule30a-2(a) under the 1940 Act and Section 302 of the Sarbanes-Oxley Act of 2002 are attached hereto. |
| (a)(3) | Not applicable. |
| (a)(4) | Not applicable. |
| (b) | Certifications pursuant to Rule30a-2(b) under the 1940 Act and Section 906 of the Sarbanes-Oxley Act of 2002 are attached hereto. |
SIGNATURES
Pursuant to the requirements of the Securities Exchange Act of 1934 and the Investment Company Act of 1940, the registrant has duly caused this report to be signed on its behalf by the undersigned, thereunto duly authorized.
(Registrant) Gabelli 787 Fund, Inc. | ||||
By (Signature and Title)* /s/ Bruce N. Alpert | ||||
Bruce N. Alpert, Principal Executive Officer | ||||
Date January 2, 2020 | ||||
Pursuant to the requirements of the Securities Exchange Act of 1934 and the Investment Company Act of 1940, this report has been signed below by the following persons on behalf of the registrant and in the capacities and on the dates indicated.
By (Signature and Title)* /s/ Bruce N. Alpert | ||||
Bruce N. Alpert, Principal Executive Officer | ||||
Date January 2, 2020 | ||||
By (Signature and Title)* /s/ John C. Ball | ||||
John C. Ball, Principal Financial Officer and Treasurer | ||||
Date January 2, 2020 | ||||
* Print the name and title of each signing officer under his or her signature.