UNITED STATES
SECURITIES AND EXCHANGE COMMISSION
Washington, D.C. 20549
FORM N-CSR
CERTIFIED SHAREHOLDER REPORT OF REGISTERED
MANAGEMENT INVESTMENT COMPANIES
Investment Company Act file number 811-22045
Wisconsin Capital Funds, Inc.
(Exact name of registrant as specified in charter)
1221 John Q. Hammons Drive
Madison, Wisconsin 53717
(Address of principal executive offices) (Zip code)
Thomas G. Plumb
1221 John Q. Hammons Drive
Madison, Wisconsin 53717
(Name and address of agent for service)
(608) 824-8800
Registrant's telephone number, including area code
Date of fiscal year end: March 31
Date of reporting period: March 31, 2014
Item 1. Reports to Stockholders.
Plumb Balanced Fund
Plumb Equity Fund
ANNUAL REPORT
March 31, 2014
www.plumbfunds.com
PLUMB FUNDS
March 31, 2014
Dear Fellow Shareholders:
We are pleased to present you the seventh Annual Report of the Plumb Funds. The Funds commenced operations May 24, 2007, in a very challenging investment environment. The fiscal year ended March 31, 2014, continued the fourth year of recovery for US stock markets, and both the Plumb Balanced Fund and the Plumb Equity Fund provided shareholders positive returns, with the Funds up 16.01% and 21.38%, respectively, for the past 12 months. For the last three years, the average annual return has been 7.54% for the Plumb Balanced Fund and 7.84% for the Plumb Equity Fund. For the last five years, the average annual return has been 12.70% for the Plumb Balanced Fund and 14.65% for the Plumb Equity Fund. Since inception (5/24/2007), the Plumb Balanced Fund and Plumb Equity Fund have averaged annual returns of 2.72% and 1.87%, respectively. The Balanced Fund’s Gross and Net* Expense Ratio as noted in the prospectus dated August 1, 2013 are 1.48% and 1.26%, respectively. The Equity Fund’s Gross and Net* Expense Ratio as noted in the prospectus dated August 1, 2013 are 1.47% and 1.41%, respectively.
Performance data quoted represents past performance and does not guarantee future results. Investment returns and principal value will fluctuate, and when sold, may be worth more or less than their original cost. Performance data current to the most recent month-end may be lower or higher than the performance quoted and can be obtained by calling 866-987-7888.
| * | The Fund’s Advisor has contractually agreed to waive fees through at least July 31, 2014. |
The Funds’ performance should be reviewed in the light of the markets that they operate in. For the last one year, three years, and since the Funds’ inception, the U.S. stock market has had average annual returns of 21.86%, 14.66% and 5.49%, as measured by the total return of the S&P 500. The broader international markets, as measured by the MSCI EAFE Index, have averaged 14.42%, 4.01% and -2.29% during those periods, while the Barclays Capital Intermediate Government/Credit Bond Index averaged -0.13%, 3.13% and 4.63% for the same time frames.
Our investment approach is to seek out good quality, growing companies trading at reasonable prices. In the Balanced Fund, we generally use fixed income investments in an attempt to moderate the volatility of the stock market and to provide an income component to our total return objective. With the low interest rate environment present since the financial crisis, it has been difficult to find attractive fixed income instruments to meet that objective. In fact, at times, the dividend yield on high quality blue-chip stocks exceeded the yield of ten-year U.S. Treasury Bonds. In this environment, we have added income generating securities that may have an equity component to the Balanced Fund’s overall asset mix. Convertible bonds, REITs, and publicly traded partnerships are examples of generally higher yielding securities that combine capital appreciation potential with the potential for high current income yields.
Absolute and relative investment returns typically are influenced by the markets we operate in, our allocation to the sectors within the market, and our individual security selection. With the S&P 500 up more than 20% but the bond market
PLUMB FUNDS
down over the last year, our fixed income exposure substantially dampened our returns. In addition, our relative overweight in the energy sector and relative underweight in the consumer discretionary sector provided a headwind to our relative returns over the last year, while our stock selection in industrials improved our relative performance.
In the Plumb Equity Fund, the largest individual contributors to our investment return over the last year were Constellation Brands, Allergan, Charles Schwab, American International Group, and Walt Disney. The largest individual detractors were Ion GeoPhysical, Ansys, iShares MSCI Emerging Market ETF, Ford Motor, and TransCanada.
In the Plumb Balanced Fund, the largest individual contributors to our investment return were Constellation Brands, Walt Disney, American Express, du Pont (E.I.) de Nemours, and Allergan. The largest individual detractors were Ion GeoPhysical, Ford Motor, WW Grainger, Vanguard REIT ETF, and TransCanada.
Best wishes in the coming year from all of us at the Plumb Funds.
Thomas G. Plumb
Opinions expressed are those of Thomas Plumb and is not intended to be a forecast of future events, a guarantee of future results, nor investment advice.
Must be preceded or accompanied by a current prospectus.
Fund holdings and sector allocations are subject to change and should not be considered recommendations to buy or sell any security. Please refer to the schedule of investments in this report for complete holdings information.
Mutual fund investing involves risk. Principal loss is possible. The Funds may invest in small and mid-sized companies which involve additional risks such as limited liquidity and greater volatility. The Funds invest in foreign securities which involve greater volatility and political, economic and currency risks and differences in accounting methods. The Balanced Fund will invest in debt securities, which typically decrease in value when interest rates rise. This risk is usually greater for longer-term debt securities. Investments by the Balanced Fund in lower-rated and non-rated securities present a greater risk of loss to principal and interest than higher-rated securities. Investments in Asset Backed and Mortgage Backed Securities include additional risks that investors should be aware of such as credit risk, prepayment risk, possible illiquidity and default, as well as increased susceptibility to adverse economic developments. Because the Funds may invest in ETFs, they are subject to additional risks that do not apply to conventional mutual funds, including the risks that the market price of an ETF’s shares may trade at a discount to its net asset value (“NAV”), an active secondary trading market may not develop or be maintained, or trading may be halted by the exchange in which they trade, which may impact the Funds’
PLUMB FUNDS
ability to sell their shares. The Funds may indirectly invest in commodities such as gold and silver, which involve additional risks, such as the possibility for substantial price fluctuations over a short period of time.
The S&P 500 Index is an unmanaged market capitalization-weighted index based on the average weighted performance of 500 widely held common stocks. The Barclays Capital Intermediate Government/Credit Bond Index is an unmanaged market value weighted index measuring both the principal price changes of, and income provided by, the underlying universe of securities that comprise the index. The MSCI EAFE Index is an unmanaged market capitalization-weighted index that is designed to measure the equity market performance of developed markets, excluding the US & Canada. You cannot invest directly in an index.
The Plumb Funds are distributed by Quasar Distributors, LLC.
PLUMB FUNDS
Expense Example
March 31, 2014 (Unaudited)
As a shareholder of the Plumb Funds (the “Funds”), you incur ongoing costs, including investment advisory fees; distribution (12b-1) fees; and other fund expenses. This example is intended to help you understand your ongoing costs (in dollars) of investing in the Funds and to compare these costs with the ongoing costs of investing in other mutual funds.
The Example is based on an investment of $1,000 invested at the beginning of the period and held for the entire period (October 1, 2013 – March 31, 2014).
Actual Expenses
The first line of the table on the following page provides information about actual account values and actual expenses. However, the table does not include shareholder-specific fees such as the $15.00 fee charged for wire redemptions. The table also does not include portfolio trading commissions and related trading costs. You may use the information in this line, together with the amount you invested, to estimate the expenses that you paid over the period. Simply divide your account value by $1,000 (for example, an $8,600 account value divided by $1,000 = 8.6), then multiply the result by the number in the first line under the heading entitled “Expenses Paid During the Period” to estimate the expenses you paid on your account during this period.
Hypothetical Example for Comparison Purposes
The second line of the table on the following page provides information about hypothetical account values and hypothetical expenses based on the Fund’s actual expense ratio and an assumed rate of return of 5% per year before expenses, which is not the Fund’s actual return. The hypothetical account values and expenses may not be used to estimate the actual ending account balance or expenses you paid for the period. You may use this information to compare the ongoing costs of investing in the Funds and other funds. To do so, compare this 5% hypothetical example with the 5% hypothetical examples that appear in the shareholder reports of the other funds.
Please note that the expenses shown in the table are meant to highlight your ongoing costs only and do not reflect any transactional costs, such as sales charges (loads), redemption fees, or exchange fees, which, although not charged by the Funds, may be charged by other funds. Therefore, the second line of the table is useful in comparing ongoing costs only, and will not help you determine the relative costs of owning different funds. In addition, if these transactional costs were included, your costs would have been higher.
PLUMB FUNDS
Expense Example
March 31, 2014 (Unaudited) (Continued)
Plumb Balanced Fund
| | | | Expenses Paid |
| | Beginning | Ending | During the Period* |
| | Account Value | Account Value | October 1, 2013 to |
| | October 1, 2013 | March 31, 2014 | March 31, 2014 |
| | | | |
| Actual | $1,000.00 | $1,103.00 | $6.61 |
| | | | |
| Hypothetical | | | |
| (5% return per | | | |
| year before expenses) | $1,000.00 | $1,018.65 | $6.34 |
| * | Expenses are equal to the Fund’s annualized expense ratio of 1.26%, multiplied by the average account value over the period, multiplied by 182/365 (to reflect the partial year period). |
Plumb Equity Fund
| | | | Expenses Paid |
| | Beginning | Ending | During the Period* |
| | Account Value | Account Value | October 1, 2013 to |
| | October 1, 2013 | March 31, 2014 | March 31, 2014 |
| | | | |
| Actual | $1,000.00 | $1,139.20 | $7.52 |
| | | | |
| Hypothetical | | | |
| (5% return per | | | |
| year before expenses) | $1,000.00 | $1,017.90 | $7.09 |
| * | Expenses are equal to the Fund’s annualized expense ratio of 1.41%, multiplied by the average account value over the period, multiplied by 182/365 (to reflect the partial year period). |
PLUMB FUNDS
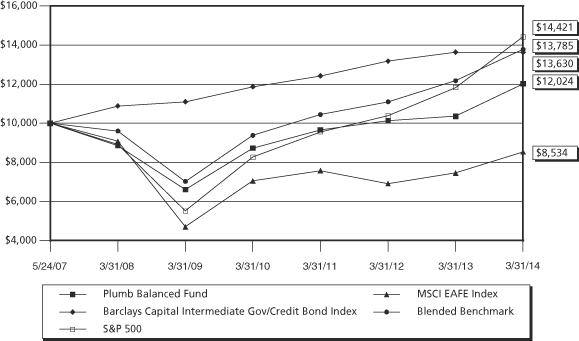
Plumb Balanced Fund (Unaudited)
Comparison of Change in Value of a Hypothetical $10,000 Investment
from inception of May 24, 2007 to March 31, 2014
Average Annual Rate of Return
Periods ended March 31, 2014
| | | | | Since Inception |
| | 1 Year | 3 Year | 5 Year | of May 24, 2007 |
| Plumb Balanced Fund | 16.01% | 7.54% | 12.70% | 2.72% |
| Barclays Capital Intermediate | | | | |
| Government/Credit Bond Index | -0.13% | 3.13% | 4.18% | 4.63% |
| MSCI EAFE Index | 14.42% | 4.01% | 12.65% | -2.29% |
| S&P 500 Index | 21.86% | 14.66% | 21.16% | 5.49% |
| Blended Benchmark | 13.13% | 9.67% | 14.42% | 4.80% |
Performance data quoted represents past performance and does not guarantee future results. The investment return and principal value of an investment will fluctuate so that an investor’s shares, when redeemed, may be worth more or less than their original cost. Current performance of the Fund may be lower or higher than the performance quoted. Performance data current to the most recent month end may be obtained by calling 1-866-987-7888.
The line graph and performance table do not reflect the deduction of taxes that a shareholder may pay on fund distributions or the redemption of fund shares. Total return calculations reflect expense reimbursements and fee waivers.
The Barclays Capital Intermediate Government/Credit Bond Index is an unmanaged index which includes nonconvertible bonds publicly issued by the U.S. government or its agencies; corporate bonds guaranteed by the U.S. government and quasi-federal corporations; and publicly issued, fixed rate, nonconvertible domestic bonds of companies in industry, public utilities, and finance.
PLUMB FUNDS
The MSCI EAFE Index in an index intended to reflect the performance of major developed countries’ international equity markets, besides the United States and Canada.
The Standard & Poor’s 500 Index (S&P 500) is an unmanaged, capitalization-weighted index generally representative of the U.S. market for large capitalization stocks.
The Blended Benchmark is made up of 55% S&P 500 Index, 35% Barclays Capital Intermediate Government/Credit Bond Index, and 10% MSCI EAFE Index.
The Fund’s portfolio holdings may differ significantly from the securities held in the relevant index and, unlike a mutual fund, an unmanaged index assumes no transaction costs, taxes, management fees or other expenses. You cannot invest directly in an index.
PLUMB FUNDS
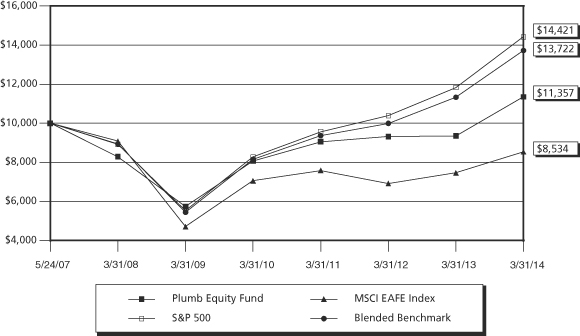
Plumb Equity Fund (Unaudited)
Comparison of Change in Value of a Hypothetical $10,000 Investment
from inception of May 24, 2007 to March 31, 2014
Average Annual Rate of Return
Periods ended March 31, 2014
| | | | | Since Inception |
| | 1 Year | 3 Year | 5 Year | of May 24, 2007 |
| Plumb Equity Fund | 21.38% | 7.84% | 14.65% | 1.87% |
| S&P 500 Index | 21.86% | 14.66% | 21.16% | 5.49% |
| MSCI EAFE Index | 14.42% | 4.01% | 12.65% | -2.29% |
| Blended Benchmark | 21.13% | 13.59% | 20.32% | 4.73% |
Performance data quoted represents past performance and does not guarantee future results. The investment return and principal value of an investment will fluctuate so that an investor’s shares, when redeemed, may be worth more or less than their original cost. Current performance of the Fund may be lower or higher than the performance quoted. Performance data current to the most recent month end may be obtained by calling 1-866-987-7888.
The line graph and performance table do not reflect the deduction of taxes that a shareholder may pay on fund distributions or the redemption of fund shares. Total return calculations reflect expense reimbursements and fee waivers.
The Standard & Poor’s 500 Index (S&P 500) is an unmanaged, capitalization-weighted index generally representative of the U.S. market for large capitalization stocks.
The MSCI EAFE Index in an index intended to reflect the performance of major developed countries’ international equity markets, besides the United States and Canada.
The Blended Benchmark is made up of 90% S&P 500 Index and 10% MSCI EAFE Index.
The Fund’s portfolio holdings may differ significantly from the securities held in the relevant index and, unlike a mutual fund, an unmanaged index assumes no transaction costs, taxes, management fees or other expenses. You cannot invest directly in an index.
PLUMB FUNDS
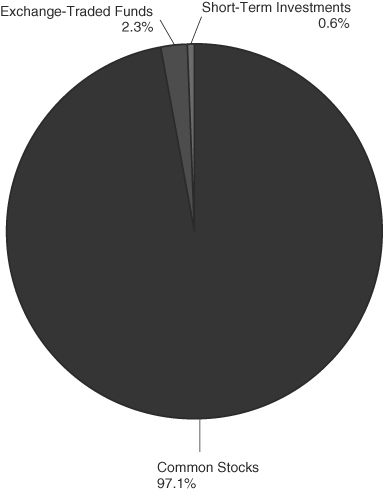
Plumb Balanced Fund
Investments by Asset Allocation as of March 31, 2014
(as a Percentage of Total Investments) (Unaudited)
PLUMB FUNDS
Plumb Equity Fund
Investments by Asset Allocation as of March 31, 2014
(as a Percentage of Total Investments) (Unaudited)
PLUMB FUNDS
Plumb Balanced Fund
Schedule of Investments – March 31, 2014
| | | Shares | | | Value | |
| | | | | | | |
| COMMON STOCKS – 66.18% | | | | | | |
| | | | | | | |
| Air Transportation – 0.62% | | | | | | |
| Delta Air Lines, Inc. | | | 6,000 | | | $ | 207,900 | |
| | | | | | | | | |
| | | | | | | | | |
| Amusement, Gambling, and | | | | | | | | |
| Recreation Industries – 1.69% | | | | | | | | |
| Las Vegas Sands Corporation | | | 7,000 | | | | 565,460 | |
| | | | | | | | | |
| | | | | | | | | |
| Beverage and Tobacco Product Manufacturing – 4.73% | | | | | | | | |
| Constellation Brands, Inc. – Class A (a) | | | 12,000 | | | | 1,019,640 | |
| Diageo PLC – ADR | | | 4,500 | | | | 560,655 | |
| | | | | | | | 1,580,295 | |
| | | | | | | | | |
| Broadcasting (except Internet) – 2.85% | | | | | | | | |
| Liberty Interactive Corporation (a) | | | 15,000 | | | | 433,050 | |
| The Walt Disney Company | | | 6,500 | | | | 520,455 | |
| | | | | | | | 953,505 | |
| | | | | | | | | |
| Chemical Manufacturing – 9.48% | | | | | | | | |
| Abbott Laboratories | | | 9,500 | | | | 365,845 | |
| AbbVie, Inc. | | | 7,000 | | | | 359,800 | |
| Allergan, Inc. | | | 5,500 | | | | 682,550 | |
| Church & Dwight Company, Inc. | | | 7,000 | | | | 483,490 | |
| E.I. du Pont de Nemours and Company | | | 9,500 | | | | 637,450 | |
| Johnson & Johnson | | | 6,500 | | | | 638,495 | |
| | | | | | | | 3,167,630 | |
| | | | | | | | | |
| Computer and Electronic | | | | | | | | |
| Product Manufacturing – 6.84% | | | | | | | | |
| Apple, Inc. | | | 900 | | | | 483,066 | |
| Medtronic, Inc. | | | 7,000 | | | | 430,780 | |
| Microchip Technology, Inc. | | | 13,000 | | | | 620,880 | |
| QUALCOMM, Inc. | | | 9,500 | | | | 749,170 | |
| | | | | | | | 2,283,896 | |
| | | | | | | | | |
| Couriers and Messengers – 1.89% | | | | | | | | |
| United Parcel Service, Inc. – Class B | | | 6,500 | | | | 632,970 | |
| | | | | | | | | |
| | | | | | | | | |
| Credit Intermediation and Related Activities – 8.71% | | | | | | | | |
| American Express Company | | | 6,500 | | | | 585,195 | |
| Citigroup, Inc. | | | 8,000 | | | | 380,800 | |
| Discover Financial Services | | | 12,000 | | | | 698,280 | |
| JPMorgan Chase & Company | | | 8,100 | | | | 491,751 | |
| Visa, Inc. – Class A | | | 3,500 | | | | 755,510 | |
| | | | | | | | 2,911,536 | |
The accompanying notes are an integral part of these financial statements.
PLUMB FUNDS
Plumb Balanced Fund
Schedule of Investments – March 31, 2014 (Continued)
| | | Shares | | | Value | |
| | | | | | | |
| COMMON STOCKS (Continued) | | | | | | |
| | | | | | | |
| Data Processing, Hosting, | | | | | | |
| and Related Services – 1.70% | | | | | | |
| Fiserv, Inc. (a) | | | 10,000 | | | $ | 566,900 | |
| | | | | | | | | |
| | | | | | | | | |
| Electrical Equipment, Appliance, and | | | | | | | | |
| Component Manufacturing – 1.40% | | | | | | | | |
| Emerson Electric Company | | | 7,000 | | | | 467,600 | |
| | | | | | | | | |
| | | | | | | | | |
| Food Manufacturing – 1.10% | | | | | | | | |
| The Hain Celestial Group, Inc. (a) | | | 4,000 | | | | 365,880 | |
| | | | | | | | | |
| | | | | | | | | |
| Insurance Carriers and Related Activities – 3.11% | | | | | | | | |
| American International Group, Inc. | | | 12,000 | | | | 600,120 | |
| Berkshire Hathaway, Inc. – Class B (a) | | | 3,500 | | | | 437,395 | |
| | | | | | | | 1,037,515 | |
| | | | | | | | | |
| Machinery Manufacturing – 1.86% | | | | | | | | |
| General Electric Company | | | 24,000 | | | | 621,360 | |
| | | | | | | | | |
| | | | | | | | | |
| Miscellaneous Manufacturing – 2.21% | | | | | | | | |
| 3M Company | | | 3,500 | | | | 474,810 | |
| Intuitive Surgical, Inc. (a) | | | 600 | | | | 262,794 | |
| | | | | | | | 737,604 | |
| | | | | | | | | |
| Other Information Services – 1.83% | | | | | | | | |
| Google Inc. – Class A (a) | | | 550 | | | | 612,980 | |
| | | | | | | | | |
| | | | | | | | | |
| Petroleum and Coal Products Manufacturing – 1.07% | | | | | | | | |
| Chevron Corporation | | | 3,000 | | | | 356,730 | |
| | | | | | | | | |
| | | | | | | | | |
| Pipeline Transportation – 4.02% | | | | | | | | |
| Enbridge, Inc. (b) | | | 15,500 | | | | 705,405 | |
| TransCanada Corporation (b) | | | 14,000 | | | | 637,280 | |
| | | | | | | | 1,342,685 | |
| | | | | | | | | |
| Professional, Scientific, and Technical Services – 1.40% | | | | | | | | |
| Exact Sciences Corporation (a) | | | 33,000 | | | | 467,610 | |
| | | | | | | | | |
| | | | | | | | | |
| Rail Transportation – 1.83% | | | | | | | | |
| Kansas City Southern | | | 6,000 | | | | 612,360 | |
The accompanying notes are an integral part of these financial statements.
PLUMB FUNDS
Plumb Balanced Fund
Schedule of Investments – March 31, 2014 (Continued)
| | | Shares | | | Value | |
| | | | | | | |
| COMMON STOCKS (Continued) | | | | | | |
| | | | | | | |
| Rental and Leasing Services – 1.91% | | | | | | |
| Ryder System, Inc. | | | 8,000 | | | $ | 639,360 | |
| | | | | | | | | |
| | | | | | | | | |
| Securities, Commodity Contracts, and Other | | | | | | | | |
| Financial Investments and Related Activities – 1.23% | | | | | | | | |
| The Charles Schwab Corporation | | | 15,000 | | | | 409,950 | |
| | | | | | | | | |
| | | | | | | | | |
| Support Activities for Mining – 3.44% | | | | | | | | |
| ConocoPhillips | | | 8,000 | | | | 562,800 | |
| Schlumberger Limited (b) | | | 6,000 | | | | 585,000 | |
| | | | | | | | 1,147,800 | |
| | | | | | | | | |
| Transportation Equipment Manufacturing – 1.26% | | | | | | | | |
| Ford Motor Company | | | 27,000 | | | | 421,200 | |
| | | | | | | | | |
| | | | | | | | | |
| TOTAL COMMON STOCKS | | | | | | | | |
| (Cost $15,035,626) | | | | | | | 22,110,726 | |
| | | | | | | | | |
| | | | | | | | | |
| EXCHANGE-TRADED FUNDS – 3.85% | | | | | | | | |
| | | | | | | | | |
| Funds, Trusts, and Other Financial Vehicles – 3.85% | | | | | | | | |
| Alerian MLP ETF | | | 50,000 | | | | 883,000 | |
| Schwab U.S. Small-Cap ETF | | | 7,500 | | | | 402,000 | |
| | | | | | | | 1,285,000 | |
| | | | | | | | | |
| TOTAL EXCHANGE-TRADED FUNDS | | | | | | | | |
| (Cost $1,231,531) | | | | | | | 1,285,000 | |
| | | | | | | | | |
| | | Principal | | | | | |
| | | Amount | | | | | |
| | | | | | | | | |
| CORPORATE BONDS – 28.77% | | | | | | | | |
| | | | | | | | | |
| Administrative and Support Services – 1.50% | | | | | | | | |
| Dun & Bradstreet | | | | | | | | |
| 4.375%, 12/01/2022 | | $ | 500,000 | | | | 500,533 | |
| | | | | | | | | |
| | | | | | | | | |
| Beverage and Tobacco Product Manufacturing – 1.75% | | | | | | | | |
| Lorillard Tobacco Company | | | | | | | | |
| 6.875%, 05/01/2020 | | | 500,000 | | | | 585,487 | |
| | | | | | | | | |
| | | | | | | | | |
| Broadcasting (except Internet) – 1.55% | | | | | | | | |
| Time Warner Cable, Inc. | | | | | | | | |
| 4.000%, 09/01/2021 | | | 500,000 | | | | 519,516 | |
| | | | | | | | | |
The accompanying notes are an integral part of these financial statements.
PLUMB FUNDS
Plumb Balanced Fund
Schedule of Investments – March 31, 2014 (Continued)
| | | Principal | | | | |
| | | Amount | | | Value | |
| | | | | | | |
| CORPORATE BONDS (Continued) | | | | | | |
| | | | | | | |
| Computer and Electronic | | | | | | |
| Product Manufacturing – 1.58% | | | | | | |
| Nokia Corporation | | | | | | |
| 5.375%, 05/15/2019 (b) | | $ | 500,000 | | | $ | 528,750 | |
| | | | | | | | | |
| | | | | | | | | |
| Credit Intermediation and Related Activities – 6.26% | | | | | | | | |
| Bank of America Corporation | | | | | | | | |
| 5.000%, 05/10/2030 (c) | | | 500,000 | | | | 499,960 | |
| General Electric Capital Corporation | | | | | | | | |
| 1.375%, 08/01/2017 (c) | | | 500,000 | | | | 496,601 | |
| Wells Fargo & Company | | | | | | | | |
| 7.980%, 03/29/2049 (c) | | | 500,000 | | | | 570,625 | |
| Zions Bancorporation | | | | | | | | |
| 3.700%, 02/15/2018 | | | 523,000 | | | | 524,658 | |
| | | | | | | | 2,091,844 | |
| | | | | | | | | |
| Funds, Trusts, and Other Financial Vehicles – 3.13% | | | | | | | | |
| Health Care Property Investors, Inc. | | | | | | | | |
| 6.000%, 03/01/2015 | | | 500,000 | | | | 524,186 | |
| Senior Housing Properties Trust | | | | | | | | |
| 4.300%, 01/15/2016 | | | 500,000 | | | | 520,096 | |
| | | | | | | | 1,044,282 | |
| | | | | | | | | |
| Health and Personal Care Stores – 1.00% | | | | | | | | |
| CVS Pass-Through Trust | | | | | | | | |
| 6.943%, 01/10/2030 | | | 281,064 | | | | 332,866 | |
| | | | | | | | | |
| | | | | | | | | |
| Merchant Wholesalers, Durable Goods – 1.63% | | | | | | | | |
| Ingram Micro, Inc. | | | | | | | | |
| 5.250%, 09/01/2017 | | | 500,000 | | | | 543,247 | |
| | | | | | | | | |
| | | | | | | | | |
| Oil and Gas Extraction – 4.75% | | | | | | | | |
| Petrobras International Finance Company | | | | | | | | |
| 3.500%, 02/06/2017 (b) | | | 500,000 | | | | 506,651 | |
| Petrohawk Energy Corporation | | | | | | | | |
| 7.250%, 08/15/2018 | | | 500,000 | | | | 531,750 | |
| Plains Exploration & Production Company | | | | | | | | |
| 6.625%, 05/01/2021 | | | 500,000 | | | | 550,000 | |
| | | | | | | | 1,588,401 | |
The accompanying notes are an integral part of these financial statements.
PLUMB FUNDS
Plumb Balanced Fund
Schedule of Investments – March 31, 2014 (Continued)
| | | Principal | | | | |
| | | Amount | | | Value | |
| | | | | | | |
| CORPORATE BONDS (Continued) | | | | | | |
| | | | | | | |
| Pipeline Transportation – 1.11% | | | | | | |
| Copano Energy, LLC | | | | | | |
| 7.125%, 04/01/2021 | | $ | 325,000 | | | $ | 369,514 | |
| | | | | | | | | |
| | | | | | | | | |
| Professional, Scientific, and Technical Services – 1.57% | | | | | | | | |
| Affiliated Computer Services | | | | | | | | |
| 5.200%, 06/01/2015 | | | 500,000 | | | | 525,040 | |
| | | | | | | | | |
| | | | | | | | | |
| Securities, Commodity Contracts, and Other | | | | | | | | |
| Financial Investments and Related Activities – 2.94% | | | | | | | | |
| The Goldman Sachs Group, Inc. | | | | | | | | |
| 3.000%, 10/30/2027 (c) | | | 500,000 | | | | 461,284 | |
| Morgan Stanley | | | | | | | | |
| 5.000%, 10/15/2030 (c) | | | 500,000 | | | | 519,905 | |
| | | | | | | | 981,189 | |
| | | | | | | | | |
| TOTAL CORPORATE BONDS | | | | | | | | |
| (Cost $9,394,871) | | | | | | | 9,610,669 | |
| | | | | | | | | |
| | | Shares | | | | | |
| | | | | | | | | |
| SHORT-TERM INVESTMENTS – 0.77% | | | | | | | | |
| | | | | | | | | |
| Money Market Funds – 0.77% | | | | | | | | |
| STIT-STIC Prime Portfolio 0.019% – | | | | | | | | |
| Institutional Class (c) | | | 258,665 | | | | 258,665 | |
| | | | | | | | | |
| | | | | | | | | |
| TOTAL SHORT-TERM INVESTMENTS | | | | | | | | |
| (Cost $258,665) | | | | | | | 258,665 | |
| | | | | | | | | |
| | | | | | | | | |
| Total Investments | | | | | | | | |
| (Cost $25,920,693) – 99.57% | | | | | | | 33,265,060 | |
| Other Assets in Excess of Liabilities – 0.43% | | | | | | | 145,247 | |
| TOTAL NET ASSETS – 100.00% | | | | | | $ | 33,410,307 | |
Percentages are stated as a percent of net assets.
ADR – American Depositary Receipt
| (a) | Non-income producing security. |
| (b) | Foreign-issued security. Total foreign concentration was as follows: Cayman Islands 1.52%, Canada 4.02%, Curacao 1.75%, Finland 1.58%. |
| (c) | Variable rate security. The rate listed is as of March 31, 2014. |
The accompanying notes are an integral part of these financial statements.
PLUMB FUNDS
Plumb Equity Fund
Schedule of Investments – March 31, 2014
| | | Shares | | | Value | |
| | | | | | | |
| COMMON STOCKS – 97.18% | | | | | | |
| | | | | | | |
| Air Transportation – 0.88% | | | | | | |
| Delta Air Lines, Inc. | | | 6,000 | | | $ | 207,900 | |
| | | | | | | | | |
| | | | | | | | | |
| Amusement, Gambling, and | | | | | | | | |
| Recreation Industries – 2.26% | | | | | | | | |
| Las Vegas Sands Corporation | | | 6,600 | | | | 533,148 | |
| | | | | | | | | |
| | | | | | | | | |
| Beverage and Tobacco | | | | | | | | |
| Product Manufacturing – 8.46% | | | | | | | | |
| Brown-Forman Corporation – Class B | | | 2,000 | | | | 179,380 | |
| Constellation Brands, Inc. – Class A (a) | | | 14,000 | | | | 1,189,580 | |
| Diageo PLC – ADR | | | 5,000 | | | | 622,950 | |
| | | | | | | | 1,991,910 | |
| | | | | | | | | |
| Broadcasting (except Internet) – 5.75% | | | | | | | | |
| Liberty Interactive Corporation (a) | | | 15,000 | | | | 433,050 | |
| Sirius XM Radio, Inc. (a) | | | 125,000 | | | | 400,000 | |
| The Walt Disney Company | | | 6,500 | | | | 520,455 | |
| | | | | | | | 1,353,505 | |
| | | | | | | | | |
| Chemical Manufacturing – 12.59% | | | | | | | | |
| Abbott Laboratories | | | 10,000 | | | | 385,100 | |
| Allergan, Inc. | | | 6,500 | | | | 806,650 | |
| Church & Dwight Company, Inc. | | | 8,000 | | | | 552,560 | |
| E.I. du Pont de Nemours and Company | | | 8,500 | | | | 570,350 | |
| Johnson & Johnson | | | 6,600 | | | | 648,318 | |
| | | | | | | | 2,962,978 | |
| | | | | | | | | |
| Computer and Electronic | | | | | | | | |
| Product Manufacturing – 9.49% | | | | | | | | |
| Apple, Inc. | | | 1,000 | | | | 536,740 | |
| Medtronic, Inc. | | | 8,000 | | | | 492,320 | |
| Microchip Technology, Inc. | | | 12,000 | | | | 573,120 | |
| QUALCOMM, Inc. | | | 8,000 | | | | 630,880 | |
| | | | | | | | 2,233,060 | |
| | | | | | | | | |
| Couriers and Messengers – 2.69% | | | | | | | | |
| United Parcel Service, Inc. – Class B | | | 6,500 | | | | 632,970 | |
The accompanying notes are an integral part of these financial statements.
PLUMB FUNDS
Plumb Equity Fund
Schedule of Investments – March 31, 2014 (Continued)
| | | Shares | | | Value | |
| | | | | | | |
| COMMON STOCKS (Continued) | | | | | | |
| | | | | | | |
| Credit Intermediation and | | | | | | |
| Related Activities – 13.14% | | | | | | |
| American Express Company | | | 6,700 | | | $ | 603,201 | |
| Citigroup, Inc. | | | 9,000 | | | | 428,400 | |
| Discover Financial Services | | | 13,000 | | | | 756,470 | |
| JPMorgan Chase & Company | | | 8,000 | | | | 485,680 | |
| Visa, Inc. – Class A | | | 3,800 | | | | 820,268 | |
| | | | | | | | 3,094,019 | |
| | | | | | | | | |
| Data Processing, Hosting, | | | | | | | | |
| and Related Services – 2.41% | | | | | | | | |
| Fiserv, Inc. (a) | | | 10,000 | | | | 566,900 | |
| | | | | | | | | |
| | | | | | | | | |
| Food Manufacturing – 2.90% | | | | | | | | |
| Annie’s Inc. (a) | | | 9,000 | | | | 361,710 | |
| The Hain Celestial Group, Inc. (a) | | | 3,500 | | | | 320,145 | |
| | | | | | | | 681,855 | |
| | | | | | | | | |
| Insurance Carriers and Related Activities – 3.98% | | | | | | | | |
| American International Group, Inc. | | | 12,500 | | | | 625,125 | |
| Berkshire Hathaway, Inc. – Class B (a) | | | 2,500 | | | | 312,425 | |
| | | | | | | | 937,550 | |
| | | | | | | | | |
| Machinery Manufacturing – 2.75% | | | | | | | | |
| General Electric Company | | | 25,000 | | | | 647,250 | |
| | | | | | | | | |
| | | | | | | | | |
| Miscellaneous Manufacturing – 2.33% | | | | | | | | |
| Intuitive Surgical, Inc. (a) | | | 1,250 | | | | 547,488 | |
| | | | | | | | | |
| | | | | | | | | |
| Oil and Gas Extraction – 2.29% | | | | | | | | |
| Phillips 66 | | | 7,000 | | | | 539,420 | |
| | | | | | | | | |
| | | | | | | | | |
| Other Information Services – 2.84% | | | | | | | | |
| Google Inc. – Class A (a) | | | 600 | | | | 668,706 | |
| | | | | | | | | |
| | | | | | | | | |
| Pipeline Transportation – 5.03% | | | | | | | | |
| Enbridge, Inc. (b) | | | 16,000 | | | | 728,160 | |
| TransCanada Corporation (b) | | | 10,000 | | | | 455,200 | |
| | | | | | | | 1,183,360 | |
The accompanying notes are an integral part of these financial statements.
PLUMB FUNDS
Plumb Equity Fund
Schedule of Investments – March 31, 2014 (Continued)
| | | Shares | | | Value | |
| | | | | | | |
| COMMON STOCKS (Continued) | | | | | | |
| | | | | | | |
| Professional, Scientific, and | | | | | | |
| Technical Services – 2.71% | | | | | | |
| Exact Sciences Corporation (a) | | | 45,000 | | | $ | 637,650 | |
| | | | | | | | | |
| | | | | | | | | |
| Rail Transportation – 2.60% | | | | | | | | |
| Kansas City Southern | | | 6,000 | | | | 612,360 | |
| | | | | | | | | |
| Rental and Leasing Services – 2.55% | | | | | | | | |
| Ryder System, Inc. | | | 7,500 | | | | 599,400 | |
| | | | | | | | | |
| | | | | | | | | |
| Securities, Commodity Contracts, and Other | | | | | | | | |
| Financial Investments and Related Activities – 1.97% | | | | | | | | |
| The Charles Schwab Corporation | | | 17,000 | | | | 464,610 | |
| | | | | | | | | |
| | | | | | | | | |
| Support Activities for Mining – 5.37% | | | | | | | | |
| ConocoPhillips | | | 8,000 | | | | 562,800 | |
| Schlumberger Limited (b) | | | 7,200 | | | | 702,000 | |
| | | | | | | | 1,264,800 | |
| | | | | | | | | |
| Transportation Equipment Manufacturing – 2.19% | | | | | | | | |
| Ford Motor Company | | | 33,000 | | | | 514,800 | |
| | | | | | | | | |
| | | | | | | | | |
| TOTAL COMMON STOCKS | | | | | | | | |
| (Cost $15,924,654) | | | | | | | 22,875,639 | |
| | | | | | | | | |
| | | | | | | | | |
| EXCHANGE-TRADED FUNDS – 2.28% | | | | | | | | |
| | | | | | | | | |
| Funds, Trusts, and Other Financial Vehicles – 2.28% | | | | | | | | |
| Schwab U.S. Small-Cap ETF | | | 10,000 | | | | 536,000 | |
| | | | | | | | | |
| | | | | | | | | |
| TOTAL EXCHANGE-TRADED FUNDS | | | | | | | | |
| (Cost $459,605) | | | | | | | 536,000 | |
The accompanying notes are an integral part of these financial statements.
PLUMB FUNDS
Plumb Equity Fund
Schedule of Investments – March 31, 2014 (Continued)
| | | Shares | | | Value | |
| | | | | | | |
| SHORT-TERM INVESTMENTS – 0.63% | | | | | | |
| | | | | | | |
| Money Market Funds – 0.63% | | | | | | |
| STIT-STIC Prime Portfolio 0.019% – | | | | | | |
| Institutional Class (c) | | | 149,404 | | | $ | 149,404 | |
| | | | | | | | | |
| | | | | | | | | |
| TOTAL SHORT-TERM INVESTMENTS | | | | | | | | |
| (Cost $149,404) | | | | | | | 149,404 | |
| | | | | | | | | |
| | | | | | | | | |
| Total Investments | | | | | | | | |
| (Cost $16,533,663) – 100.09% | | | | | | | 23,561,043 | |
| Liabilities in Excess of Other Assets – (0.09)% | | | | | | | (20,961 | ) |
| TOTAL NET ASSETS – 100.00% | | | | | | $ | 23,540,082 | |
Percentages are stated as a percent of net assets.
ADR – American Depositary Receipt
| (a) | Non-income producing security. |
| (b) | Foreign-issued security. Total foreign concentration was as follows: Canada 5.03%, Curacao 2.98%. |
| (c) | Variable rate security. The rate listed is as of March 31, 2014. |
The accompanying notes are an integral part of these financial statements.
PLUMB FUNDS
Statements of Assets and Liabilities
March 31, 2014
| | | Plumb | | | Plumb | |
| | | Balanced | | | Equity | |
| | | Fund | | | Fund | |
| | | | | | | |
| Assets | | | | | | |
| Investments, at value* | | $ | 33,265,060 | | | $ | 23,561,043 | |
| Dividends and interest receivable | | | 139,360 | | | | 21,480 | |
| Receivable for fund shares sold | | | 65,403 | | | | 4,184 | |
| Prepaid assets | | | 3,767 | | | | 3,063 | |
| Total Assets | | | 33,473,590 | | | | 23,589,770 | |
| | | | | | | | | |
| | | | | | | | | |
| Liabilities | | | | | | | | |
| Payable for fund shares redeemed | | | 847 | | | | — | |
| Accrued distribution fee | | | 15,438 | | | | 9,402 | |
| Payable to Advisor (a) | | | 9,446 | | | | 10,351 | |
| Administrative & accounting | | | | | | | | |
| services fee payable (a) | | | 5,657 | | | | 4,057 | |
| Payable to directors | | | 4,318 | | | | 3,208 | |
| Accrued expenses and other liabilities | | | 27,577 | | | | 22,670 | |
| Total Liabilities | | | 63,283 | | | | 49,688 | |
| Net Assets | | $ | 33,410,307 | | | $ | 23,540,082 | |
| | | | | | | | | |
| | | | | | | | | |
| Net Assets Consist Of: | | | | | | | | |
| Paid in capital | | $ | 36,081,718 | | | $ | 18,304,510 | |
| Accumulated undistributed | | | | | | | | |
| net investment income | | | 112,726 | | | | 36,918 | |
| Accumulated net realized loss | | | (10,128,504 | ) | | | (1,828,726 | ) |
| Net unrealized appreciation on investments | | | 7,344,367 | | | | 7,027,380 | |
| Net Assets | | $ | 33,410,307 | | | $ | 23,540,082 | |
| | | | | | | | | |
| | | | | | | | | |
| Capital shares outstanding, $0.001 par value | | | | | | | | |
| (200 million shares issued each) | | | 1,593,320 | | | | 1,091,280 | |
| Net asset value, offering and | | | | | | | | |
| redemption price per share | | $ | 20.97 | | | $ | 21.57 | |
| | | | | | | | | |
| | | | | | | | | |
| * Cost of Investments | | $ | 25,920,693 | | | $ | 16,533,663 | |
| (a) | See Note 4 in the Notes to Financial Statements. |
The accompanying notes are an integral part of these financial statements.
PLUMB FUNDS
Statements of Operations
For the Fiscal Year Ended March 31, 2014
| | | Plumb | | | Plumb | |
| | | Balanced | | | Equity | |
| | | Fund | | | Fund | |
| | | | | | | |
| Investment Income: | | | | | | |
| Dividends (Net of foreign withholding | | | | | | |
| taxes of $6,057 and $5,516, respectively) | | $ | 510,625 | | | $ | 450,627 | |
| Interest | | | 347,579 | | | | 135 | |
| Total Investment Income | | | 858,204 | | | | 450,762 | |
| | | | | | | | | |
| | | | | | | | | |
| Expenses: | | | | | | | | |
| Investment Advisor’s fee (a) | | | 214,817 | | | | 165,807 | |
| Distribution fees | | | 69,510 | | | | 63,772 | |
| Administrative & accounting service fees (a) | | | 66,097 | | | | 51,017 | |
| Legal fees | | | 25,903 | | | | 20,055 | |
| Administration fee | | | 9,040 | | | | 8,218 | |
| Transfer agent fees and expenses | | | 42,203 | | | | 37,423 | |
| Fund accounting fees | | | 30,681 | | | | 28,591 | |
| Registration fees | | | 11,528 | | | | 10,723 | |
| Director fees and expenses | | | 16,872 | | | | 13,108 | |
| Audit and tax fees | | | 17,157 | | | | 13,231 | |
| Custody fees | | | 7,803 | | | | 9,065 | |
| Insurance expense | | | 3,722 | | | | 3,956 | |
| Printing and mailing expense | | | 5,887 | | | | 4,368 | |
| Total expenses before waiver | | | 521,220 | | | | 429,334 | |
| Less: Fees waived/reimbursed by Advisor (a) | | | (108,110 | ) | | | (72,213 | ) |
| Net expenses | | | 413,110 | | | | 357,121 | |
| Net Investment Income | | | 445,094 | | | | 93,641 | |
| | | | | | | | | |
| | | | | | | | | |
| Realized and Unrealized Gain: | | | | | | | | |
| Net realized gain on investments | | | 3,577,862 | | | | 4,678,354 | |
| Net change in unrealized | | | | | | | | |
| appreciation on investments | | | 916,326 | | | | 235,641 | |
| Net realized and unrealized | | | | | | | | |
| gain on investments | | | 4,494,188 | | | | 4,913,995 | |
| | | | | | | | | |
| | | | | | | | | |
| Net Increase in Net Assets | | | | | | | | |
| Resulting from Operations | | $ | 4,939,282 | | | $ | 5,007,636 | |
| (a) | See Note 4 in the Notes to the Financial Statements. |
The accompanying notes are an integral part of these financial statements.
PLUMB FUNDS
Plumb Balanced Fund
Statements of Changes in Net Assets
| | | For the | | | For the | |
| | | Year Ended | | | Year Ended | |
| | | March 31, | | | March 31, | |
| | | 2014 | | | 2013 | |
| Operations: | | | | | | |
| Net investment income | | $ | 445,094 | | | $ | 787,846 | |
| Net realized gain (loss) on investments | | | 3,577,862 | | | | (1,037,757 | ) |
| Net change in unrealized appreciation | | | | | | | | |
| on investments | | | 916,326 | | | | 465,471 | |
| Net increase in net assets | | | | | | | | |
| resulting from operations | | | 4,939,282 | | | | 215,560 | |
| | | | | | | | | |
| Dividends And Distributions To Shareholders: | | | | | | | | |
| Net investment income | | | (469,807 | ) | | | (913,396 | ) |
| Total dividends and distributions | | | (469,807 | ) | | | (913,396 | ) |
| | | | | | | | | |
| Capital Share Transactions: | | | | | | | | |
| Proceeds from shares sold | | | 1,676,658 | | | | 2,784,133 | |
| Shares issued in reinvestment of dividends | | | 206,053 | | | | 482,860 | |
| Cost of shares redeemed | | | (7,036,124 | ) | | | (18,456,219 | ) |
| Net decrease in net assets | | | | | | | | |
| from capital share transactions | | | (5,153,413 | ) | | | (15,189,226 | ) |
| | | | | | | | | |
| Total decrease in net assets | | | (683,938 | ) | | | (15,887,062 | ) |
| | | | | | | | | |
| Net Assets: | | | | | | | | |
| Beginning of year | | | 34,094,245 | | | | 49,981,307 | |
| End of year* | | $ | 33,410,307 | | | $ | 34,094,245 | |
| | | | | | | | | |
| * Including accumulated undistributed | | | | | | | | |
| net investment income of | | $ | 112,726 | | | $ | 133,058 | |
| | | | | | | | | |
| Change In Shares Outstanding: | | | | | | | | |
| Shares sold | | | 85,008 | | | | 158,696 | |
| Shares issued in reinvestment of dividends | | | 10,298 | | | | 28,122 | |
| Shares redeemed | | | (361,453 | ) | | | (1,046,591 | ) |
| Net decrease | | | (266,147 | ) | | | (859,773 | ) |
The accompanying notes are an integral part of these financial statements.
PLUMB FUNDS
Plumb Equity Fund
Statements of Changes in Net Assets
| | | For the | | | For the | |
| | | Year Ended | | | Year Ended | |
| | | March 31, | | | March 31, | |
| | | 2014 | | | 2013 | |
| Operations: | | | | | | |
| Net investment income | | $ | 93,641 | | | $ | 471,738 | |
| Net realized gain (loss) on investments | | | 4,678,354 | | | | (892,994 | ) |
| Net change in unrealized appreciation | | | | | | | | |
| on investments and options | | | 235,641 | | | | (46,484 | ) |
| Net increase (decrease) in net assets | | | | | | | | |
| resulting from operations | | | 5,007,636 | | | | (467,740 | ) |
| | | | | | | | | |
| Dividends And Distributions To Shareholders: | | | | | | | | |
| Net investment income | | | (130,916 | ) | | | (530,427 | ) |
| Total dividends and distributions | | | (130,916 | ) | | | (530,427 | ) |
| | | | | | | | | |
| Capital Share Transactions: | | | | | | | | |
| Proceeds from shares sold | | | 1,000,148 | | | | 4,771,965 | |
| Shares issued in reinvestment of dividends | | | 77,104 | | | | 436,144 | |
| Cost of shares redeemed | | | (18,836,129 | ) | | | (17,769,354 | ) |
| Net decrease in net assets | | | | | | | | |
| from capital share transactions | | | (17,758,877 | ) | | | (12,561,245 | ) |
| | | | | | | | | |
| Total decrease in net assets | | | (12,882,157 | ) | | | (13,559,412 | ) |
| | | | | | | | | |
| Net Assets: | | | | | | | | |
| Beginning of year | | | 36,422,239 | | | | 49,981,651 | |
| End of year* | | $ | 23,540,082 | | | $ | 36,422,239 | |
| | | | | | | | | |
| * Including accumulated undistributed | | | | | | | | |
| net investment income of | | $ | 36,918 | | | $ | 71,634 | |
| | | | | | | | | |
| Change In Shares Outstanding: | | | | | | | | |
| Shares sold | | | 51,920 | | | | 282,853 | |
| Shares issued in reinvestment of dividends | | | 3,813 | | | | 26,101 | |
| Shares redeemed | | | (1,002,488 | ) | | | (1,044,132 | ) |
| Net decrease | | | (946,755 | ) | | | (735,178 | ) |
The accompanying notes are an integral part of these financial statements.
PLUMB FUNDS
Plumb Balanced Fund
Financial Highlights
| | | For the Years Ended March 31, | |
| | | 2014 | | | 2013 | | | 2012 | | | 2011 | | | 2010 | |
| Per share operating | | | | | | | | | | | | | | | |
| performance | | | | | | | | | | | | | | | |
| (For a share outstanding | | | | | | | | | | | | | | | |
| throughout the period) | | | | | | | | | | | | | | | |
| Net asset value, | | | | | | | | | | | | | | | |
| beginning of year | | $ | 18.34 | | | $ | 18.38 | | | $ | 17.82 | | | $ | 16.43 | | | $ | 12.72 | |
| Operations: | | | | | | | | | | | | | | | | | | | | |
| Net investment | | | | | | | | | | | | | | | | | | | | |
income(1) | | | 0.29 | | | | 0.39 | | | | 0.29 | | | | 0.31 | | | | 0.33 | |
| Net realized and | | | | | | | | | | | | | | | | | | | | |
| unrealized gain (loss) | | | 2.63 | | | | (0.01 | ) | | | 0.54 | | | | 1.44 | | | | 3.73 | |
| Total from | | | | | | | | | | | | | | | | | | | | |
| investment operations | | | 2.92 | | | | 0.38 | | | | 0.83 | | | | 1.75 | | | | 4.06 | |
| Dividends and distributions | | | | | | | | | | | | | | | | | | | | |
| to shareholders: | | | | | | | | | | | | | | | | | | | | |
| Dividends from net | | | | | | | | | | | | | | | | | | | | |
| investment income | | | (0.29 | ) | | | (0.42 | ) | | | (0.27 | ) | | | (0.36 | ) | | | (0.35 | ) |
| Total dividends | | | | | | | | | | | | | | | | | | | | |
| and distributions | | | (0.29 | ) | | | (0.42 | ) | | | (0.27 | ) | | | (0.36 | ) | | | (0.35 | ) |
| Change in net asset | | | | | | | | | | | | | | | | | | | | |
| value for the year | | | 2.63 | | | | (0.04 | ) | | | 0.56 | | | | 1.39 | | | | 3.71 | |
| Net asset value, | | | | | | | | | | | | | | | | | | | | |
| end of year | | $ | 20.97 | | | $ | 18.34 | | | $ | 18.38 | | | $ | 17.82 | | | $ | 16.43 | |
Total return(2) | | | 16.01 | % | | | 2.22 | % | | | 4.87 | % | | | 10.76 | % | | | 32.01 | % |
The accompanying notes are an integral part of these financial statements.
PLUMB FUNDS
Plumb Balanced Fund
Financial Highlights (Continued)
| | | For the Years Ended March 31, | |
| | | 2014 | | | 2013 | | | 2012 | | | 2011 | | | 2010 | |
| Ratios / supplemental data | | | | | | | | | | | | | | | |
| Net assets, | | | | | | | | | | | | | | | |
| end of year (000) | | $ | 33,410 | | | $ | 34,094 | | | $ | 49,981 | | | $ | 44,626 | | | $ | 44,476 | |
| Ratio of net expenses | | | | | | | | | | | | | | | | | | | | |
| to average net assets: | | | | | | | | | | | | | | | | | | | | |
| Before expense | | | | | | | | | | | | | | | | | | | | |
| reimbursement | | | | | | | | | | | | | | | | | | | | |
| and waivers | | | 1.58 | % | | | 1.47 | % | | | 1.48 | % | | | 1.56 | % | | | 1.64 | % |
| After expense | | | | | | | | | | | | | | | | | | | | |
| reimbursement | | | | | | | | | | | | | | | | | | | | |
and waivers(3) | | | 1.25 | % | | | 1.25 | % | | | 1.25 | % | | | 1.21 | % | | | 1.10 | % |
| Ratio of net investment | | | | | | | | | | | | | | | | | | | | |
| income to average net assets: | | | | | | | | | | | | | | | | | | | | |
| After expense | | | | | | | | | | | | | | | | | | | | |
| reimbursement | | | | | | | | | | | | | | | | | | | | |
and waivers(3) | | | 1.36 | % | | | 1.83 | % | | | 1.78 | % | | | 1.79 | % | | | 2.15 | % |
| Portfolio turnover rate | | | 46 | % | | | 64 | % | | | 72 | % | | | 85 | % | | | 54 | % |
| (1) | Net investment income per share is calculated using current year ending balances prior to consideration of adjustment for permanent book and tax differences. |
| (2) | Total return represents the rate that the investor would have earned or lost on an investment in the Fund, assuming reinvestment of dividends. |
| (3) | Effective July 1, 2010, the Advisor contractually agreed to cap the Fund’s expenses at 1.25%. Prior to July 1, 2010, the Fund’s expense cap was 1.10%. |
The accompanying notes are an integral part of these financial statements.
PLUMB FUNDS
Plumb Equity Fund
Financial Highlights
| | | For the Years Ended March 31, | |
| | | 2014 | | | 2013 | | | 2012 | | | 2011 | | | 2010 | |
| Per share operating | | | | | | | | | | | | | | | |
| performance | | | | | | | | | | | | | | | |
| (For a share outstanding | | | | | | | | | | | | | | | |
| throughout the period) | | | | | | | | | | | | | | | |
| Net asset value, | | | | | | | | | | | | | | | |
| beginning of year | | $ | 17.87 | | | $ | 18.02 | | | $ | 17.56 | | | $ | 15.75 | | | $ | 11.31 | |
| Operations: | | | | | | | | | | | | | | | | | | | | |
| Net investment | | | | | | | | | | | | | | | | | | | | |
income(1) | | | 0.11 | | | | 0.20 | | | | 0.08 | | | | 0.07 | | | | 0.14 | |
| Net realized and | | | | | | | | | | | | | | | | | | | | |
| unrealized gain (loss) | | | 3.70 | | | | (0.14 | ) | | | 0.42 | | | | 1.86 | | | | 4.45 | |
| Total from | | | | | | | | | | | | | | | | | | | | |
| investment operations | | | 3.81 | | | | 0.06 | | | | 0.50 | | | | 1.93 | | | | 4.59 | |
| Dividends and distributions | | | | | | | | | | | | | | | | | | | | |
| to shareholders: | | | | | | | | | | | | | | | | | | | | |
| Dividends from net | | | | | | | | | | | | | | | | | | | | |
| investment income | | | (0.11 | ) | | | (0.21 | ) | | | (0.04 | ) | | | (0.12 | ) | | | (0.15 | ) |
| Total dividends | | | | | | | | | | | | | | | | | | | | |
| and distributions | | | (0.11 | ) | | | (0.21 | ) | | | (0.04 | ) | | | (0.12 | ) | | | (0.15 | ) |
| Change in net asset | | | | | | | | | | | | | | | | | | | | |
| value for the year | | | 3.70 | | | | (0.15 | ) | | | 0.46 | | | | 1.81 | | | | 4.44 | |
| Net asset value, | | | | | | | | | | | | | | | | | | | | |
| end of year | | $ | 21.57 | | | $ | 17.87 | | | $ | 18.02 | | | $ | 17.56 | | | $ | 15.75 | |
Total return(2) | | | 21.38 | % | | | 0.42 | % | | | 2.88 | % | | | 12.31 | % | | | 40.66 | % |
The accompanying notes are an integral part of these financial statements.
PLUMB FUNDS
Plumb Equity Fund
Financial Highlights (Continued)
| | | For the Years Ended March 31, | |
| | | 2014 | | | 2013 | | | 2012 | | | 2011 | | | 2010 | |
| Ratios / supplemental data | | | | | | | | | | | | | | | |
| Net assets, | | | | | | | | | | | | | | | |
| end of year (000) | | $ | 23,540 | | | $ | 36,422 | | | $ | 49,982 | | | $ | 17,322 | | | $ | 15,406 | |
| Ratio of net expenses | | | | | | | | | | | | | | | | | | | | |
| to average net assets: | | | | | | | | | | | | | | | | | | | | |
| Before expense | | | | | | | | | | | | | | | | | | | | |
| reimbursement | | | | | | | | | | | | | | | | | | | | |
| and waivers | | | 1.68 | % | | | 1.46 | % | | | 1.54 | % | | | 1.85 | % | | | 2.18 | % |
| After expense | | | | | | | | | | | | | | | | | | | | |
| reimbursement | | | | | | | | | | | | | | | | | | | | |
and waivers(3) | | | 1.40 | % | | | 1.40 | % | | | 1.40 | % | | | 1.35 | % | | | 1.20 | % |
| Ratio of net investment | | | | | | | | | | | | | | | | | | | | |
| income to average net assets: | | | | | | | | | | | | | | | | | | | | |
| After expense | | | | | | | | | | | | | | | | | | | | |
| reimbursement | | | | | | | | | | | | | | | | | | | | |
and waivers(3) | | | 0.38 | % | | | 1.08 | % | | | 0.80 | % | | | 0.46 | % | | | 0.98 | % |
| Portfolio turnover rate | | | 52 | % | | | 84 | % | | | 69 | % | | | 111 | % | | | 73 | % |
| (1) | Net investment income per share is calculated using current year ending balances prior to consideration of adjustment for permanent book and tax differences. |
| (2) | Total return represents the rate that the investor would have earned or lost on an investment in the Fund, assuming reinvestment of dividends. |
| (3) | Effective July 1, 2010, the Advisor contractually agreed to cap the Fund’s expenses at 1.40%. Prior to July 1, 2010, the Fund’s expense cap was 1.20%. |
The accompanying notes are an integral part of these financial statements.
PLUMB FUNDS
Notes to Financial Statements
March 31, 2014
Wisconsin Capital Funds, Inc. (the “Company”) is registered under the Investment Company Act of 1940 (the “1940 Act”) as an open-end, diversified management investment company. The Company was organized as a Maryland corporation on April 3, 2007. The Company is authorized to issue up to 2 billion shares, which are units of beneficial interest with a $0.001 par value. The Company currently offers shares of two series, each with its own investment strategy and risk/reward profile: the Plumb Balanced Fund and the Plumb Equity Fund (individually a “Fund”, collectively the “Funds”). The investment objective of the Plumb Balanced Fund is high total return through capital appreciation while attempting to preserve principal, with current income as a secondary objective. The investment objective of the Plumb Equity Fund is long-term capital appreciation. Wisconsin Capital Management, LLC (the “Advisor”) serves as the Funds’ investment advisor. The Advisor is indirectly owned by SVA Plumb Financial, LLC which in turn is partially owned by TGP, Inc. The Advisor is controlled by Thomas G. Plumb indirectly through TGP, Inc. Certain directors or officers of the Funds are also officers of the Advisor.
| 2. | SIGNIFICANT ACCOUNTING POLICIES |
The following is a summary of significant accounting policies consistently followed by the Funds in the preparation of its financial statements. These policies are in conformity with accounting principles generally accepted in the United States of America (“GAAP”).
Security Valuation:
The Funds have adopted authoritative fair valuation accounting standards which establish an authoritative definition of fair value and set out a hierarchy for measuring fair value. These standards require additional disclosures about the various inputs and valuation techniques used to develop the measurements of fair value and a discussion in changes in valuation techniques and related inputs during the year. These inputs are summarized in the three broad levels listed below.
| | Level 1 – | quoted prices in active markets for identical securities |
| | | |
| | Level 2 – | other significant observable inputs (including quoted prices for similar securities, interest rates, prepayment speeds, credit risk, etc.) |
| | | |
| | Level 3 – | significant unobservable inputs (including the Funds’ own assumptions in determining fair value of investments) |
Equity securities, including common stocks, foreign issued common stocks, and exchange-traded funds, are valued at the last sale price reported by the exchange on which the securities are primarily traded on the day of valuation. Nasdaq-listed
PLUMB FUNDS
Notes to Financial Statements
March 31, 2014 (Continued)
securities are valued at their Nasdaq Official Closing Price. Equity securities not traded on a listed exchange or not traded using Nasdaq are valued as of the last sale price at the close of the U.S. market. If there are no sales on a given day for securities traded on an exchange, the latest bid quotation will be used. These securities will generally be classified as Level 1 securities.
Investments in mutual funds, including money market funds, are generally priced at the ending net asset value (NAV) provided by the service agent of the funds and will be classified as Level 1 securities.
Debt securities, such as corporate bonds, are valued using a market approach based on information supplied by independent pricing services. The market inputs used by the independent pricing service include: benchmark yields, reported trades, broker/dealer quotes, issuer spreads, two-sided markets, benchmark securities, bids, offers, and reference data including market research publications. Debt securities with remaining maturities of 60 days or less may be valued on an amortized cost basis, which involves valuing an instrument at its cost and thereafter assuming a constant amortization to maturity of any discount or premium, regardless of the impact of fluctuating rates on the fair value of the instrument. To the extent the inputs are observable and timely, these debt securities will generally be classified as Level 2 securities.
Any securities or other assets for which market quotations are not readily available are valued at fair value as determined in good faith by the Advisor pursuant to procedures established under the general supervision and responsibility of the Funds’ Board of Directors and will be classified as Level 3 securities.
The inputs or methodology used for valuing securities may not be an indication of the risk associated with investing in those securities. The inputs used to measure fair value may fall into different levels of the fair value hierarchy. In such cases, for disclosure purposes, the level in the fair value hierarchy within which the fair value measurement falls in its entirety is determined based on the lowest level input that is significant to the fair value measurement in its entirety.
PLUMB FUNDS
Notes to Financial Statements
March 31, 2014 (Continued)
The following is a summary of the inputs used, as of March 31, 2014, to value the Funds’ investments carried at fair value:
| Description | | Level 1 | | | Level 2 | | | Level 3 | | | Total | |
| Plumb Balanced Fund | | | | | | | | | | | | |
| Investments in: | | | | | | | | | | | | |
| Common Stock* | | $ | 22,110,726 | | | $ | — | | | $ | — | | | $ | 22,110,726 | |
| Exchange-Traded Funds* | | | 1,285,000 | | | | — | | | | — | | | | 1,285,000 | |
| Corporate Bonds* | | | — | | | | 9,610,669 | | | | — | | | | 9,610,669 | |
| Money Market Funds | | | 258,665 | | | | — | | | | — | | | | 258,665 | |
| Total | | $ | 23,654,391 | | | $ | 9,610,669 | | | $ | — | | | $ | 33,265,060 | |
| | | | | | | | | | | | | | | | | |
| Description | | Level 1 | | | Level 2 | | | Level 3 | | | Total | |
| Plumb Equity Fund | | | | | | | | | | | | | | | | |
| Investments in: | | | | | | | | | | | | | | | | |
| Common Stock* | | $ | 22,875,639 | | | $ | — | | | $ | — | | | $ | 22,875,639 | |
| Exchange-Traded Funds* | | | 536,000 | | | | — | | | | — | | | | 536,000 | |
| Money Market Funds | | | 149,404 | | | | — | | | | — | | | | 149,404 | |
| Total | | $ | 23,561,043 | | | $ | — | | | $ | — | | | $ | 23,561,043 | |
| | * | For detailed industry descriptions, refer to the Schedule of Investments. |
The Funds did not hold any investments during the year with significant unobservable inputs which would be classified as Level 3. As of and during the fiscal year ending March 31, 2014, no securities were transferred into or out of Level 1 or Level 2. It is the Funds’ policy to consider transfers into or out of any level as of the end of the reporting period. The Funds did not hold any derivative instruments during the fiscal year ended March 31, 2014.
Use of Estimates:
The presentation of the financial statements in conformity with GAAP requires management to make estimates and assumptions that affect the reported amounts of assets and liabilities and disclosure of contingent assets and liabilities at the date of the financial statements and the reported amounts of increases and decreases in net assets from operations during the reporting period. Actual results could differ from those estimates.
Expenses:
Expenses directly attributable to a Fund are charged to the Fund, while expenses attributable to more than one series of the Company are allocated among the respective series based on relative net assets or another appropriate basis.
PLUMB FUNDS
Notes to Financial Statements
March 31, 2014 (Continued)
Federal Income Taxes:
The Funds intend to meet the requirements of the Internal Revenue Code (the “Code”) applicable to regulated investment companies and to distribute substantially all net investment taxable income and net capital gains to shareholders in a manner which results in no tax cost to the Funds. Therefore, no federal income or excise tax provision is recorded.
As of and during the fiscal year ended March 31, 2014, the Funds did not have a liability for any unrecognized tax benefits. The Funds recognize interest and penalties, if any, related to unrecognized tax benefits as income tax expense in the Statements of Operations. During the fiscal year ended March 31, 2014, the Funds did not incur any interest or penalties. The Funds are not subject to examination by U.S. taxing authorities for tax years prior to 2010.
Distributions to Shareholders:
Dividends from net investment income are declared and paid at least annually. Distributions of net realized capital gains, if any, will be declared and paid at least annually. Distributions to shareholders are recorded on the ex-dividend date.
The Funds may periodically make reclassifications among certain of its capital accounts as a result of the recognition and characterization of certain income and capital gain distributions determined annually in accordance with federal tax regulations which may differ from GAAP. Any such reclassifications will have no effect on net assets, results of operations or net asset values per share of the Funds.
For the fiscal year ended March 31, 2014, the Funds made the following reclassifications to increase (decrease) the components of net assets:
| | Accumulated Undistributed | Accumulated Net |
| | Net Investment Income | Realized Loss |
| Plumb Balanced Fund | $4,381 | $(4,381) |
| Plumb Equity Fund | $2,559 | $(2,559) |
Options:
Each of the Funds may purchase call or put options on securities and indices and enter into related closing transactions. Each of the Funds may engage in transactions in options either for bona fide hedging purposes or to seek to increase total return. The Funds may invest in purchased call options in an attempt to achieve increased total returns. As a holder of a call option, a Fund pays a non-refundable premium to the seller for the right, but not the obligation, to purchase a security at a fixed price (the exercise price) during the specified period (exercise period). As a holder of a put option, a Fund pays a non-refundable premium for the right, but not the obligation, to sell a security at the
Notes to Financial Statements
March 31, 2014 (Continued)
exercise price during the exercise period. The premium that a Fund pays when purchasing a call option will reflect, among other things, the market price of the security, the relationship of the exercise price to the market price of the security, the relationship of the exercise price to the volatility of the security, the length of the option period and supply and demand factors.
The counterparty risk associated with purchased options is minimal because the options are exchange-traded, and the Options Clearing Corporation guarantees performance to selling and purchasing clearing members.
If a purchased call option is exercised by a Fund, the premium is added to the cost basis of the security purchased, which will subsequently decrease the gain or increase the loss recognized at the time of sale. If a purchased put option is exercised by the Fund, the premium is deducted from the proceeds of the sale of the underlying security in determining whether the Fund has realized a gain or loss.
The Plumb Balanced and Plumb Equity Funds did not hold any derivative instruments during the fiscal year ended March 31, 2014.
Other:
Investment and shareholder transactions are recorded on the trade date. Gains or losses from investment transactions are determined using the specific identification method. Dividend income is recognized on the ex-dividend date and interest income is recognized on an accrual basis. Discounts and premiums on securities purchased are amortized over the expected life of the respective securities using the effective interest method. Withholding taxes on foreign dividends have been provided for in accordance with the Funds’ understanding of the applicable country’s tax rules and rates.
The Company has adopted a plan pursuant to Rule 12b-1 under the 1940 Act (the “12b-1 Plan”), on behalf of the Funds, which authorizes it to pay Quasar Distributors, LLC (the “Distributor”) a distribution fee of 0.25% of the Funds’ average daily net assets for services to prospective Fund shareholders and distribution of Fund shares. During the fiscal year ended March 31, 2014, the Plumb Balanced Fund and the Plumb Equity Fund incurred expenses of $69,510 and $63,772, respectively, pursuant to the 12b-1 Plan. As of March 31, 2014, $15,438 and $9,402 for the Plumb Balanced Fund and Plumb Equity Fund, respectively, were accrued.
| 4. | INVESTMENT ADVISOR AND OTHER AFFILIATES |
The Funds have an Investment Advisory Agreement (the “Advisory Agreement”) with Wisconsin Capital Management, LLC. The Advisory Agreement
Notes to Financial Statements
March 31, 2014 (Continued)
provides for advisory fees computed daily and paid monthly at an annual rate of 0.65% of the Funds’ average daily net assets.
Under the terms of the Advisory Agreement, the Advisor has contractually agreed to limit the Funds’ expenses. The Advisor has agreed to limit annual operating expenses through July 31, 2014, to 1.25% and 1.40% of the Funds’ average daily net assets for the Plumb Balanced Fund and the Plumb Equity Fund, respectively. Any such waiver or reimbursement is subject to later adjustment to allow the Advisor to recoup amounts waived or reimbursed to the extent actual fees and expenses for a period are less than the expense limitation caps in place at the time the waiver was made, provided, however, that the Advisor shall only be entitled to recoup such amounts for a period of three years from the date such amount was waived or reimbursed. For the fiscal year ended March 31, 2014, the Advisor waived expenses for the Plumb Balanced Fund and the Plumb Equity Fund of $108,110 and $72,213, respectively. There were no expense recoupments during the fiscal year ended March 31, 2014.
The following table shows the remaining waived or reimbursed expenses subject to potential recovery as of March 31, 2014 expiring in:
| Plumb Balanced Fund | Plumb Equity Fund |
| 2015 . . . . . . . $109,061 | 2015 . . . . . . . $42,559 |
| 2016 . . . . . . . $94,065 | 2016 . . . . . . . $24,641 |
| 2017 . . . . . . . $108,110 | 2017 . . . . . . . $72,213 |
The Funds also have an Administrative and Accounting Services Agreement (“Agreement”) with the Advisor. Fund administration responsibilities include general fund management, compliance, financial reporting, and oversight and assistance to other providers. The Advisor’s administrative and accounting fees are 0.20% of the Funds’ average daily net assets, computed daily and paid monthly.
| 5. | INVESTMENT TRANSACTIONS |
For the fiscal year ended March 31, 2014, the aggregate purchases and sales of investment securities, other than short-term investments, were as follows:
| | Plumb Balanced Fund | Plumb Equity Fund |
| Purchases: | $14,703,586 | $13,154,101 |
| Sales: | $19,914,974 | $31,020,707 |
The beneficial ownership, either directly or indirectly, of more than 25% of the voting securities of a fund creates a presumption of control of the fund under Section 2(a)(9) of the 1940 Act. As of March 31, 2014 certain entities and their affiliates which may control or be under common control with the Advisor,
PLUMB FUNDS
Notes to Financial Statements
March 31, 2014 (Continued)
including Thomas Plumb, SVA Plumb Trust Company, and SVA Plumb Wealth Management, LLC, either directly or for the benefit of their customers, owned 65.48% of the Plumb Balanced Fund and 71.95% of the Plumb Equity Fund.
| 7. | FEDERAL TAX INFORMATION |
As of March 31, 2014 the components of accumulated earnings (losses) for income tax purposes were as follows:
| | | Plumb Balanced Fund | | | Plumb Equity Fund | |
| Unrealized appreciation | | $ | 7,523,538 | | | $ | 7,088,216 | |
| Unrealized depreciation | | | (194,729 | ) | | | (101,989 | ) |
| Net tax unrealized | | | | | | | | |
| appreciation on investments | | | 7,328,809 | | | | 6,986,227 | |
| Undistributed ordinary income | | | 69,281 | | | | 36,918 | |
| Other accumulated losses | | | (10,069,501 | ) | | | (1,787,573 | ) |
| Total accumulated gains (losses) | | $ | (2,671,411 | ) | | $ | 5,235,572 | |
The tax cost of investments as of March 31, 2014 was $25,936,251 and $16,574,816 for the Plumb Balanced Fund and Plumb Equity Fund, respectively. The tax basis of investments for tax and financial reporting purposes differs principally due to the deferral of losses on wash sales.
As of March 31, 2014 the Funds had prior tax basis capital losses which may be carried over to offset future capital gains as shown below.
| | | Capital Loss Carryover | |
| | | Plumb Balanced Fund | | | Plumb Equity Fund | |
| Expires: | | | | | | |
| March 31, 2017 | | $ | (1,851,503 | ) | | $ | — | |
| March 31, 2018 | | $ | (8,217,998 | ) | | $ | (1,787,573 | ) |
Prior year capital loss carryovers of $3,578,437 and $4,636,638 for the Plumb Balanced Fund and Plumb Equity Fund, respectively, were utilized during the year.
PLUMB FUNDS
Notes to Financial Statements
March 31, 2014 (Continued)
| 8. | DISTRIBUTIONS TO SHAREHOLDERS |
The tax character of distributions paid during the fiscal years ended March 31, 2014 and 2013 was as follows:
| | Plumb Balanced Fund | |
| | Year Ended | | Year Ended | |
| | March 31, 2014 | | March 31, 2013 | |
| Distributions paid from: | | | | |
| Ordinary Income | $ | 469,807 | | $ | 913,396 | |
| Total Distributions Paid | $ | 469,807 | | $ | 913,396 | |
| | | | | | | |
| | Plumb Equity Fund | |
| | Year Ended | | Year Ended | |
| | March 31, 2014 | | March 31, 2013 | |
| Distributions paid from: | | | | | | |
| Ordinary Income | $ | 130,916 | | $ | 530,427 | |
| Total Distributions Paid | $ | 130,916 | | $ | 530,427 | |
Report of Independent Registered Public Accounting Firm
To the Shareholders and Board of Directors
Wisconsin Capital Funds, Inc.
We have audited the accompanying statements of assets and liabilities, including the schedules of investments of Wisconsin Capital Funds, Inc., comprising the Plumb Balanced Fund and the Plumb Equity Fund (the “Funds”), as of March 31, 2014, and the related statements of operations for the year then ended, the statements of changes in net assets for each of the two years in the period then ended, and the financial highlights for each of the five years in the period then ended. These financial statements and financial highlights are the responsibility of the Funds’ management. Our responsibility is to express an opinion on these financial statements and financial highlights based on our audits.
We conducted our audits in accordance with the standards of the Public Company Accounting Oversight Board (United States). Those standards require that we plan and perform the audit to obtain reasonable assurance about whether the financial statements and financial highlights are free of material misstatement. An audit includes examining, on a test basis, evidence supporting the amounts and disclosures in the financial statements. Our procedures included confirmation of securities owned as of March 31, 2014, by correspondence with the custodian. An audit also includes assessing the accounting principles used and significant estimates made by management, as well as evaluating the overall financial statement presentation. We believe that our audits provide a reasonable basis for our opinion.
In our opinion, the financial statements and financial highlights referred to above present fairly, in all material respects, the financial position of the Plumb Balanced Fund and the Plumb Equity Fund as of March 31, 2014, the results of their operations for the year then ended, the changes in their net assets for each of the two years in the period then ended, and the financial highlights for each of the five years in the period then ended, in conformity with accounting principles generally accepted in the United States of America.
COHEN FUND AUDIT SERVICES, LTD.
Cleveland, Ohio
May 27, 2014
PLUMB FUNDS
Additional Information (Unaudited)
| 1. | ADDITIONAL DISCLOSURE REGARDING FUND DIRECTORS AND OFFICERS |
| | Position(s) Held with | Principal | Number of | Other |
| | Wisconsin Capital | Occupation(s) | Plumb Funds | Directorships |
| Name, Address | Funds, Inc. and Length | During Past | Overseen | Held by |
| and Age | of Time Served(1) | Five Years | by Director | Director |
| | | | | | |
| Independent Directors: | | | | | |
| | | | | | |
| Patrick J. Quinn | Director since | • | Currently retired | 2 | National |
| 1221 John Q. | May 2007 | • | President and | | Presto |
| Hammons Dr., | | | Chairman of the | | Industries |
| Madison, WI 53719 | | | Board of Ayres | | since May |
| Birth date: | | | Associates (professional | | 2001 |
| September 1949 | | | civil engineering firm), | | |
| | | | from April 2000 to | | |
| | | | December 2010 | | |
| | | | | | |
| Jay Loewi | Director since | • | Chief Executive | 2 | None |
| 1221 John Q. | May 2007 | | Officer, QTI Group | | |
| Hammons Dr., | | | (staffing company), | | |
| Madison, WI 53719 | | | since November 2007 | | |
| Birth date: | | • | President, QTI Group | | |
| March 1957 | | | of Companies, | | |
| | | | since 2002 | | |
| | | | | | |
| Jeffrey B. Sauer | Director since | • | Assistant to the | 2 | None |
| 1221 John Q. | May 2007 | | Commissioner of | | |
| Hammons Dr., | | | Western Collegiate | | |
| Madison, WI 53719 | | | Hockey Association, | | |
| Birth date: | | | since 2002 | | |
| March 1943 | | | | | |
| |
| Interested Directors and Officers: |
| | | | | | |
Thomas G. Plumb(2) | Director, Chairman, | • | President of SVA | 2 | None |
| 1221 John Q. | President and Chief | | Plumb Wealth | | |
| Hammons Dr., | Executive Officer | | Management, LLC, | | |
| Madison, WI 53719 | since May 2007 | | since March 2011 | | |
| Birth date: | | • | President of SVA | | |
| July 1952 | | | Plumb Financial, LLC, | | |
| | | | since March 2011 | | |
| | | • | CEO of SVA Plumb | | |
| | | | Trust Company, | | |
| | | | since March 2011 | | |
| | | • | President of Wisconsin | | |
| | | | Capital Management, | | |
| | | | LLC, since January 2004 | | |
| | | • | CEO of Plumb Trust | | |
| | | | Company from 2001 | | |
| | | | to February 2011 | | |
PLUMB FUNDS
Additional Information (Unaudited) (Continued)
| | Position(s) Held with | | | Other |
| | Wisconsin Capital | | | Directorships |
| Name, Address | Funds, Inc. and Length | Principal Occupation(s) | Held by |
| and Age | of Time Served(1) | During Past Five Years | Director |
| | | | | |
| Timothy R. O’Brien | Chief Financial Officer | • | Principal of SVA Plumb | N/A |
| 1221 John Q. | since May 2007 | | Wealth Management, | |
| Hammons Dr., | | | LLC since March 2011 | |
| Madison, WI 53719 | Vice President | • | Vice President and | |
| Birth date: | since August 2010 | | Portfolio Manager for | |
| June 1959 | | | Wisconsin Capital | |
| | Secretary | | Management, LLC | |
| | from January | | since 2004 | |
| | 2009 to July 2010 | | | |
| | | | | |
| | Treasurer | | | |
| | from May 2007 | | | |
| | to July 2010 | | | |
| | | | | |
| Connie M. Redman | Chief Compliance | • | Chief Compliance | N/A |
| 1221 John Q. | Officer since May 2007 | | Officer of SVA Plumb | |
| Hammons Dr., | | | Wealth Management, | |
| Madison, WI 53719 | Secretary | | LLC since April 2012 | |
| Birth date: | since August 2010 | • | Vice President, Chief | |
| February 1966 | | | Compliance Officer, and | |
| | | | Corporate Secretary of | |
| | | | Wisconsin Capital | |
| | | | Management, LLC | |
| | | | since March 2008 | |
| | | | | |
Additional Information (Unaudited) (Continued)
| | Position(s) Held with | | | Other |
| | Wisconsin Capital | | | Directorships |
| Name, Address | Funds, Inc. and Length | Principal Occupation(s) | Held by |
| and Age | of Time Served(1) | During Past Five Years | Director |
| | | | | |
| Donna M. Baker | Treasurer | • | Operations Manager of | N/A |
| 1221 John Q. | since August 2010 | | SVA Plumb Trust Company | |
| Hammons Dr., | | | since March 2011 | |
| Madison, WI 53719 | Secretary | • | Chief Financial Officer and | |
| Birth date: | from May 2007 to | | Human Resource Manager | |
| March 1964 | December 2008 | | of Wisconsin Capital | |
| | | | Management, LLC, from | |
| | | | June 2010 to February 2011 | |
| | | • | Controller, HospiceCare, Inc. | |
| | | | from January 2009 to | |
| | | | February 2010 | |
| (1) | Officers of the Funds serve one-year terms, subject to annual reappointment by the Board of Directors. Directors of the Funds serve a term of indefinite length until their resignation or removal, and stand for re-election by shareholders as and when required under the 1940 Act. |
| (2) | Thomas G. Plumb is an “interested person” of the Funds by virtue of his positions with the Funds and the Advisor. |
PLUMB FUNDS
Additional Information (Unaudited) (Continued)
The Board of Directors of the Funds has an audit committee and a nominating committee. The audit committee consults with the independent auditors for the Funds on matters pertaining to their audits of the Funds’ annual financial statements, and approves all audit and non-audit services to be provided by the independent auditors. The audit committee has adopted a written charter, which is available upon request. The audit committee consists of Jay Loewi (Chair), Patrick J. Quinn and Jeffrey B. Sauer, none of whom is an “interested” person of the Funds. Jay Loewi has been determined by the Board to be an audit committee financial expert.
The nominating committee considers and recommends nominees for directors to the Board to fill vacancies and for election and re-election as and when required. All nominations of directors who are not “interested persons” of the Funds must be made and approved by the nominating committee. The nominating committee has not established any specific, minimum qualifications or standards for director nominees. The nominating committee will generally not consider any director candidates recommended by shareholders. The nominating committee has adopted a written charter, which is available upon request. No policy or procedure has been established as to the recommendation of director nominees by shareholders, except that nominations of directors who are not “interested persons” of the Funds must be made and approved by the nominating committee. The nominating committee consists of Jeffrey B. Sauer (Chair), Jay Loewi and Patrick J. Quinn.
The Funds’ Statement of Additional Information includes additional information about the directors of the Company and is available, without charge, at www.wiscap.com or upon request, by calling 1-866-987-7888.
| 2. | QUALIFIED DIVIDEND INCOME/DIVIDENDS RECEIVED DEDUCTION |
For the fiscal year ended March 31, 2014, certain dividends paid by the Funds may be subject to a maximum tax rate of 23.8% (which includes a 3.8% Medicare tax). The percentage of dividends declared from ordinary income designated as qualified dividend income was as follows:
| Plumb Balanced Fund | 99.73% | |
| Plumb Equity Fund | 100.00% | |
For corporate shareholders, the percent of ordinary income distributions qualifying for the corporate dividends–received deduction for the fiscal year ended March 31, 2014, was as follows:
| Plumb Balanced Fund | 88.40% | |
| Plumb Equity Fund | 100.00% | |
(This Page Intentionally Left Blank.)
WISCONSIN CAPITAL FUNDS, INC.
c/o U.S. Bancorp Fund Services, LLC
P.O. Box 701
Milwaukee, WI 53201-0701
1-866-987-7888
INVESTMENT ADVISOR
Wisconsin Capital Management, LLC
1221 John Q. Hammons Drive
Madison, WI 53717
Telephone: (608) 824-8800
DISTRIBUTOR
Quasar Distributors, LLC
615 East Michigan Street
Milwaukee, WI 53202
CUSTODIAN
U.S. Bank National Association
1555 N. Rivercenter Drive
MK-WI-5302
Milwaukee, WI 53212
TRANSFER AGENT AND
DIVIDEND DISBURSING AGENT
US Bancorp Fund Services, LLC
615 East Michigan Street
Milwaukee, WI 53202
INDEPENDENT REGISTERED PUBLIC ACCOUNTING FIRM
Cohen Fund Audit Services, Ltd.
1350 Euclid Avenue
Suite 800
Cleveland, OH 44115
LEGAL COUNSEL
Quarles & Brady LLP
411 East Wisconsin Avenue
Milwaukee, WI 53202
This report has been prepared for shareholders and may be distributed to others only if preceded or accompanied by a current prospectus.
The Funds’ Proxy Voting Policies and Procedures are available without charge upon request by calling 1-866-987-7888 and on the SEC’s website at www.sec.gov. Information regarding how the Funds voted proxies relating to portfolio securities during the 12-month period ended June 30, 2013 is available by calling 1-866-987-7888 and on the SEC’s website at www.sec.gov.
The Funds’ complete schedule of portfolio holdings for the first and third quarters is filed with the SEC on Form N-Q. The Funds’ Form N-Q is available without charge, upon request, by calling 1-866-987-7888 and on the SEC’s website at www.sec.gov. The Funds’ Forms N-Q may also be reviewed and copied at the Commission’s Public Reference Room in Washington, DC. Information on the operation of the Public Reference Room may be obtained by calling 1-800-SEC-0330.
Item 2. Code of Ethics.
The registrant has adopted a code of ethics that applies to the registrant’s principal executive officer and principal financial officer. The registrant has not made any material amendments to its code of ethics during the period covered by this report. The registrant has not granted any waivers from any provisions of the code of ethics during the period covered by this report.
Incorporated by reference to the Registrant’s June 6, 2009 N-CSR filing.
Item 3. Audit Committee Financial Expert.
The registrant’s board of directors has determined that there is at least one audit committee financial expert serving on its audit committee. Jay V. Loewi is the “audit committee financial expert” and is considered to be “independent” as each term is defined in Item 3 of Form N-CSR.
Item 4. Principal Accountant Fees and Services.
The registrant has engaged its principal accountant to perform audit services, audit-related services, tax services, and other services during the past two fiscal years. “Audit services” refer to performing an audit of the registrant's annual financial statements or services that are normally provided by the accountant in connection with statutory and regulatory filings or engagements for those fiscal years. “Audit-related services” refer to the assurance and related services by the principal accountant that are reasonably related to the performance of the audit. “Tax services” refer to professional services rendered by the principal accountant for tax compliance, tax advice, and tax planning. “Other services” relate to the review by the principal accountant of the Funds’ Semi-Annual Report to Shareholders. The following table details the aggregate fees billed or expected to be billed for the last two fiscal years for audit fees, audit-related fees, tax fees and other fees by the principal accountant.
| | FYE 3/31/14 | FYE 3/31/13 |
| Audit Fees | $24,000 | $24,000 |
| Audit-Related Fees | 0 | 0 |
| Tax Fees | $ 5,000 | $ 5,000 |
| All Other Fees | $ 1,500 | $ 1,500 |
The audit committee has adopted pre-approval policies and procedures that require the audit committee to pre-approve all audit and non-audit services of the registrant, including services provided to any entity affiliated with the registrant. All of the principal accountant’s hours spent on auditing the registrant’s financial statements were attributed to work performed by full-time permanent employees of the principal accountant.
The following table indicates the non-audit fees billed or expected to be billed by the registrant’s accountant for services to the registrant and to the registrant’s investment adviser (not including any sub-adviser whose role is primarily portfolio management and is subcontracted with or overseen by another investment adviser) and any entity controlling, controlled by, or under common control with the adviser that provides ongoing services to the registrant for the last two fiscal years. The audit committee of the board of directors has considered whether the provision of non-audit services that were rendered to the registrant's investment adviser is compatible with maintaining the principal accountant's independence in its audit of the Registrant and has concluded that the provision of such non-audit services by the accountant has not compromised the accountant’s independence.
| Non-Audit Related Fees | FYE 3/31/14 | FYE 3/31/13 |
| Registrant | $1,500 | $1,500 |
| Registrant’s Investment Adviser | $ 0 | $ 0 |
No services described in paragraphs (b)-(d) of this Item were approved by the audit committee pursuant to paragraph (c)(7)(i)(c) of Rule 2-01 of Regulation S-X.
Item 5. Audit Committee of Listed Registrants.
Not applicable to registrants who are not listed issuers (as defined in Rule 10A-3 under the Securities Exchange Act of 1934).
Item 6. Investments.
Schedule of Investments is included as part of the report to shareholders filed under Item 1 of this Form.
Item 7. Disclosure of Proxy Voting Policies and Procedures for Closed-End Management Investment Companies.
Not applicable to open-end investment companies.
Item 8. Portfolio Managers of Closed-End Management Investment Companies.
Not applicable to open-end investment companies.
Item 9. Purchases of Equity Securities by Closed-End Management Investment Company and Affiliated Purchasers.
Not applicable to open-end investment companies.
Item 10. Submission of Matters to a Vote of Security Holders.
There have been no material changes to the procedures by which shareholders may recommend nominees to the registrant’s board of directors/trustees.
Item 11. Controls and Procedures.
| (a) | The Registrant’s President/Chief Executive Officer (principal executive officer) and Vice President/Chief Financial Officer (principal financial officer) have reviewed the Registrant's disclosure controls and procedures (as defined in Rule 30a-3(c) under the Investment Company Act of 1940 (the “Act”)) as of a date within 90 days of the filing of this report, as required by Rule 30a-3(b) under the Act and Rules 13a-15(b) or 15d-15(b) under the Securities Exchange Act of 1934. Based on their review, such officers have concluded that the disclosure controls and procedures are effective in ensuring that information required to be disclosed in this report is appropriately recorded, processed, summarized and reported and made known to them by others within the Registrant and by the Registrant’s service provider. |
| (b) | There were no changes in the Registrant's internal control over financial reporting (as defined in Rule 30a-3(d) under the Act) that occurred during the second fiscal quarter of the period covered by this report that has materially affected, or is reasonably likely to materially affect, the Registrant's internal control over financial reporting. |
Item 12. Exhibits.
| (a) | (1) Any code of ethics or amendment thereto, that is the subject of the disclosure required by Item 2, to the extent that the registrant intends to satisfy Item 2 requirements through filing an exhibit. Incorporated by reference to the Registrant’s June 6, 2009 N-CSR filing. |
(2) A separate certification for each principal executive and principal financial officer pursuant to Section 302 of the Sarbanes-Oxley Act of 2002. Filed herewith.
(3) Any written solicitation to purchase securities under Rule 23c-1 under the Act sent or given during the period covered by the report by or on behalf of the registrant to 10 or more persons. Not applicable to open-end investment companies.
| (b) | Certifications pursuant to Section 906 of the Sarbanes-Oxley Act of 2002. Furnished herewith. |
SIGNATURES
Pursuant to the requirements of the Securities Exchange Act of 1934 and the Investment Company Act of 1940, the registrant has duly caused this report to be signed on its behalf by the undersigned, thereunto duly authorized.
(Registrant) Wisconsin Capital Funds, Inc.
By (Signature and Title) /s/Thomas G. Plumb
Thomas G. Plumb, President
Date May 20, 2014
Pursuant to the requirements of the Securities Exchange Act of 1934 and the Investment Company Act of 1940, this report has been signed below by the following persons on behalf of the registrant and in the capacities and on the dates indicated.
By (Signature and Title) /s/Thomas G. Plumb
Thomas G. Plumb, Principal Executive Officer
Date May 20, 2014
By (Signature and Title) /s/Timothy R. O’Brien
Timothy R. O’Brien, Principal Financial Officer
Date May 20, 2014