Plumb Balanced Fund
Plumb Equity Fund
ANNUAL REPORT
March 31, 2019
Beginning on January 1, 2021, as permitted by regulations adopted by the Securities and Exchange Commission, paper copies of the Funds’ shareholder reports will no longer be sent by mail, unless you specifically request paper copies of the reports from your financial intermediary or, if you invest directly through the Fund’s transfer agent, U.S. Bank Global Fund Services (the “Transfer Agent”), from the Transfer Agent. Instead, the reports will be made available on a website, and you will be notified by mail each time a report is posted and provided with a website link to access the report.
If you already elected to receive shareholder reports electronically, you will not be affected by this change and you need not take any action. You may elect to receive shareholder reports and other communications electronically by contacting your financial intermediary, or, if you invest directly through the Transfer Agent by contacting the Transfer Agent.
You may elect to receive all future reports in paper free of charge by contacting your financial intermediary or, if you invest directly through the Transfer Agent, by contacting the Transfer Agent at (855) 609-3680. Your election to receive reports in paper will apply to all funds held in your account if you invest through a financial intermediary or all funds within the fund complex if you invest directly through the Transfer Agent.
www.plumbfunds.com
March 31, 2019
Dear Fellow Shareholders:
We are pleased to state the Plumb Funds outperformed their respective benchmarks again over the fiscal year ending March 31, 2019. For the fiscal year, the Plumb Balanced Fund was up 9.47% and led its blended benchmark* which was up 6.26%. For the fiscal year, the Plumb Equity Fund was up 12.67% and led its blended benchmark* which was up 7.83%.
Our investments continued to follow our “rise of innovation” secular trend thesis and this thesis continued to bear fruit. Granted, innovation does not follow a consistent uniform upward curve, but tends to happen more in a step-like pattern as transformational new ideas build and evolve on top of one another. We are not trying to be first, looking for companies that are testing the “bleeding edge” or unproven, unprofitable stage of technological development or change. However, we do believe that recognizing a true secular change can allow one to participate with more proven leaders with successful business plans. We believe we are living in a time of amazing change as the digital revolution will continue to fuel innovations in artificial intelligence, machine learning, and digital cloud applications. These developments affect every one of us as companies making products as diverse as smarter cars, new drug therapies, disease detection, and financial processing develop new products much more efficiently. More than at any time in our career, we are seeing old ways fall by the wayside even in where and how we as consumers or businesspeople buy the things we use in everyday life.
We continue to focus on investments that reflect our shared sustainable values. We believe we are doing something logical yet distinct here, attempting to identify good growth companies that have long-term secular tailwinds. We focus mainly on businesses where we feel secular and cyclical opportunities are aligned and have the potential to provide self-funding growth strategies.
We believe that global health care innovation is one area with dynamic opportunities. There has been some tremendous advancement in this field, including new drugs, therapies, early detection, treatment, medical devices, information systems, and robotics, to name just a few. Three of our investments held by both Funds in this area, Exact Sciences Corporation, Canopy Growth Corp and Intuitive Surgical Inc, were particularly beneficial to the Funds over the last fiscal year as they each appreciated over 38% during the year.
The electronic financial processing of transactions is another industry that we believe has continued significant growth potential. In the United States, cash and checks continue to represent a smaller share of the value of transaction payments and companies servicing this trend remain the largest focus of the Plumb Funds’ equity investments during the period with VISA, Mastercard Inc. and PayPal, Inc all advancing over 30% for the fiscal year.
The Plumb Equity and Plumb Balanced Funds have different overall objectives. However, both use the same general equity selection philosophy to select stocks to help meet their individual mandates.
We are honored and pleased that you are a shareholder of the Plumb Funds. We remain steadfast in our approach and feel confident that it will continue to work for the long-term. We at Wisconsin Capital Management, LLC (the Plumb Funds’ advisor) are dedicated to a fundamental investment process that we believe can offer competitive returns over a market cycle. We welcome hearing from our shareholders and look forward to exploring the appropriateness of the Plumb Funds in helping to fulfill your investment goals.
Thomas G. Plumb
Opinions expressed are those of Thomas Plumb and are not intended to be a forecast of future events, a guarantee of future results, or investment advice.
Must be preceded or accompanied by a current prospectus.
Past performance does not guarantee future results.
Fund holdings and sector allocations are subject to change and should not be considered recommendations to buy or sell any security. Please refer to the schedule of investments in this report for complete holdings information.
Mutual fund investing involves risk. Principal loss is possible. The Funds may invest in small and mid-sized companies which involve additional risks such as limited liquidity and greater volatility. The Funds invest in foreign securities which involve greater volatility and political, economic and currency risks and differences in accounting methods. The Plumb Balanced Fund will invest in debt securities, which typically decrease in value when interest rates rise. This risk is usually greater for longer-term debt securities. Investments by the Plumb Balanced Fund in lower-rated and non-rated securities present a greater risk of loss to principal and interest than higher-rated securities. Investments in Asset Backed and Mortgage Backed Securities include additional risks that investors should be aware of such as credit risk, prepayment risk, possible illiquidity and default, as well as increased susceptibility to adverse economic developments. Because the Funds may invest in ETFs, they are subject to additional risks that do not apply to conventional mutual funds, including the risks that the market price of an ETF’s shares may trade at a discount to its net asset value (“NAV”), an active secondary trading market may not develop or be maintained, or trading may be halted by the exchange in which they trade, which may impact the Funds’ ability to sell their shares.
The S&P 500 Index is an unmanaged market capitalization-weighted index based on the average weighted performance of 500 widely held common stocks. The Bloomberg Barclays Capital Intermediate Government/Credit Bond Index is an unmanaged market value weighted index measuring both the principal price changes of, and income provided by, the underlying universe of securities that
comprise the index. The MSCI EAFE Index is an unmanaged market capitalization-weighted index that is designed to measure the equity market performance of developed markets, excluding the US & Canada.
| * | The blended benchmark for the Plumb Balanced Fund is made up of 55% S&P 500 index, 35% Bloomberg Barclays Capital Intermediate Government/Credit Bond Index and 10% MSCI EAFE index. The blended benchmark for the Plumb Equity Fund is made up of 90% S&P 500 index and 10% MSCI EAFE index. You cannot invest directly in an index. |
The Plumb Funds are distributed by Quasar Distributors, LLC.
Expense Example
March 31, 2019 (Unaudited)
As a shareholder of the Plumb Funds (the “Funds”), you incur ongoing costs, including investment advisory fees; distribution (12b-1) fees; and other fund expenses. This example is intended to help you understand your ongoing costs (in dollars) of investing in the Funds and to compare these costs with the ongoing costs of investing in other mutual funds.
The Example is based on an investment of $1,000 invested at the beginning of the period and held for the entire period (October 1, 2018 – March 31, 2019).
Actual Expenses
The first line of the table on the following page provides information about actual account values and actual expenses. However, the table does not include shareholder-specific fees such as the $15.00 fee charged for wire redemptions. The table also does not include portfolio trading commissions and related trading costs. You may use the information in this line, together with the amount you invested, to estimate the expenses that you paid over the period. Simply divide your account value by $1,000 (for example, an $8,600 account value divided by $1,000 = 8.6), then multiply the result by the number in the first line under the heading entitled “Expenses Paid During the Period” to estimate the expenses you paid on your account during this period.
Hypothetical Example for Comparison Purposes
The second line of the table on the following page provides information about hypothetical account values and hypothetical expenses based on the Fund’s actual expense ratio and an assumed rate of return of 5% per year before expenses, which is not the Fund’s actual return. The hypothetical account values and expenses may not be used to estimate the actual ending account balanced or expenses you paid for the period. You may use this information to compare the ongoing costs of investing in the Funds and other funds. To do so, compare this 5% hypothetical example with the 5% hypothetical examples that appear in the shareholder reports of the other funds.
Please note that the expenses shown in the table are meant to highlight your ongoing costs only and do not reflect any transactional costs, such as sales charges (loads), redemption fees, or exchange fees, which, although not charged by the Funds, may be charged by other funds. Therefore, the second line of the table is useful in comparing ongoing costs only, and will not help you determine the relative costs of owning different funds. In addition, if these transactional costs were included, your costs would have been higher.
Expense Example
March 31, 2019 (Unaudited) (Continued)
Plumb Balanced Fund
| | | | Expenses Paid |
| | Beginning | Ending | During the Year* |
| | Account Value | Account Value | October 1, 2018 to |
| | October 1, 2018 | March 31, 2019 | March 31, 2019 |
| Actual | $1,000.00 | $ 983.00 | $5.88 |
| | | | |
| Hypothetical | | | |
| (5% return per | | | |
| year before expenses) | $1,000.00 | $1,019.00 | $5.99 |
| * | Expenses are equal to the Fund’s annualized six-month expense ratio of 1.19%, multiplied by the average account value over the period, multiplied by 182/365 (to reflect the partial year period). |
Plumb Equity Fund
| | | | Expenses Paid |
| | Beginning | Ending | During the Year* |
| | Account Value | Account Value | October 1, 2018 to |
| | October 1, 2018 | March 31, 2019 | March 31, 2019 |
| Actual | $1,000.00 | $ 953.10 | $5.79 |
| | | | |
| Hypothetical | | | |
| (5% return per | | | |
| year before expenses) | $1,000.00 | $1,019.00 | $5.99 |
| * | Expenses are equal to the Fund’s annualized six-month expense ratio of 1.19%, multiplied by the average account value over the period, multiplied by 182/365 (to reflect the partial year period). |
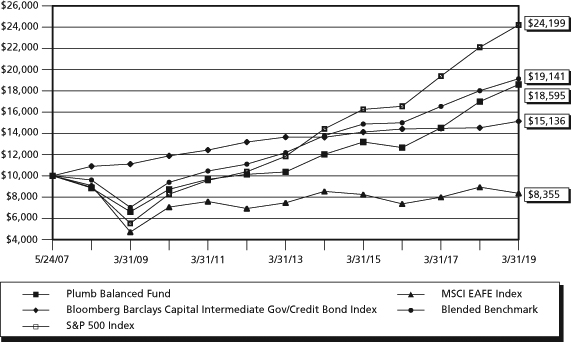
Plumb Balanced Fund (Unaudited)
Comparison of Change in Value of a Hypothetical $10,000 Investment
from inception of May 24, 2007 to March 31, 2019
Average Annual Rate of Return
Periods ended March 31, 2019
| | 1 Year | 3 Year | 5 Year | 10 Year | Since Inception |
| Plumb Balanced Fund | 9.47% | 13.68% | 9.11% | 10.89% | 5.37% |
| Bloomberg Barclays | | | | | |
| Capital Intermediate | | | | | |
| Government/Credit | | | | | |
| Bond Index | 4.24% | 1.66% | 2.12% | 3.14% | 3.56% |
| S&P 500 Index | 9.50% | 13.51% | 10.91% | 15.92% | 7.74% |
| MSCI EAFE Index | -6.49% | 4.32% | -0.42% | 5.91% | -1.50% |
| Blended Benchmark | 6.26% | 8.47% | 6.78% | 10.54% | 5.63% |
Performance data quoted represents past performance and does not guarantee future results. The investment return and principal value of an investment will fluctuate so that an investor’s shares, when redeemed, may be worth more or less than their original cost. Current performance of the Fund may be lower or higher than the performance quoted. Performance data current to the most recent month end may be obtained by calling 1-866-987-7888.
The line graph and performance table do not reflect the deduction of taxes that a shareholder may pay on fund distributions or the redemption of fund shares. Total return calculations reflect expense reimbursements and fee waivers.
The Bloomberg Barclays Capital Intermediate Government/Credit Bond Index is an unmanaged index which includes nonconvertible bonds publicly issued by the U.S. government or its agencies; corporate bonds guaranteed by the U.S. government and quasi-federal corporations; and publicly issued, fixed rate, nonconvertible domestic bonds of companies in industry, public utilities, and finance.
The MSCI EAFE Index in an index intended to reflect the performance of major developed countries’ international equity markets, besides the United States and Canada The Standard & Poor’s 500 Index (S&P 500) is an unmanaged, capitalization-weighted index generally representative of the U.S. market for large capitalization stocks.
The Standard & Poor’s 500 Index (S&P 500) is an unmanaged, capitalization-weighted index generally representative of the U.S. market for large capitalization stocks.
The Blended Benchmark is made up of 55% S&P 500 Index, 35% Barclays Capital Intermediate Government/Credit Bond Index, and 10% MSCI EAFE Index.
The Fund’s portfolio holdings may differ significantly from the securities held in the relevant index and, unlike a mutual fund, an unmanaged index assumes no transaction costs, taxes, management fees or other expenses. You cannot invest directly in an index.
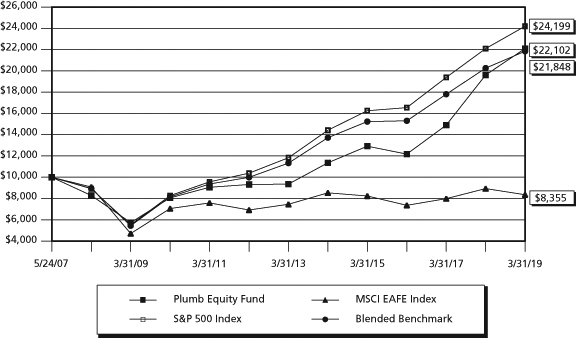
Plumb Equity Fund (Unaudited)
Comparison of Change in Value of a Hypothetical $10,000 Investment
from inception of May 24, 2007 to March 31, 2019
Average Annual Rate of Return
Periods ended March 31, 2019
| | 1 Year | 3 Year | 5 Year | 10 Year | Since Inception |
| Plumb Equity Fund | 12.67% | 21.99% | 14.24% | 14.45% | 6.92% |
| S&P 500 Index | 9.50% | 13.51% | 10.91% | 15.92% | 7.74% |
| MSCI EAFE Index | -6.49% | 4.32% | -0.42% | 5.91% | -1.50% |
| Blended Benchmark | 7.83% | 12.59% | 9.75% | 14.91% | 6.81% |
Performance data quoted represents past performance and does not guarantee future results. The investment return and principal value of an investment will fluctuate so that an investor’s shares, when redeemed, may be worth more or less than their original cost. Current performance of the Fund may be lower or higher than the performance quoted. Performance data current to the most recent month end may be obtained by calling 1-866-987-7888.
The line graph and performance table do not reflect the deduction of taxes that a shareholder may pay on fund distributions or the redemption of fund shares. Total return calculations reflect expense reimbursements and fee waivers.
The Standard & Poor’s 500 Index (S&P 500) is an unmanaged, capitalization-weighted index generally representative of the U.S. market for large capitalization stocks.
The MSCI EAFE Index in an index intended to reflect the performance of major developed countries’ international equity markets, besides the United States and Canada.
The Blended Benchmark is made up of 90% S&P 500 Index and 10% MSCI EAFE Index.
The Fund’s portfolio holdings may differ significantly from the securities held in the relevant index and, unlike a mutual fund, an unmanaged index assumes no transaction costs, taxes, management fees or other expenses. You cannot invest directly in an index.
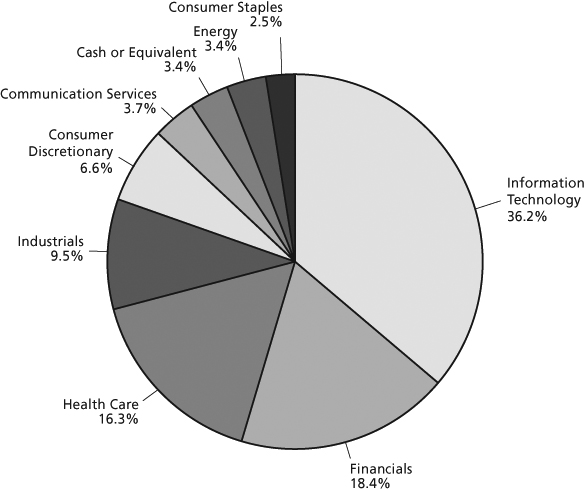
Plumb Balanced Fund
Investments by Industry Sector as of March 31, 2019
(as a Percentage of Total Investments) (Unaudited)
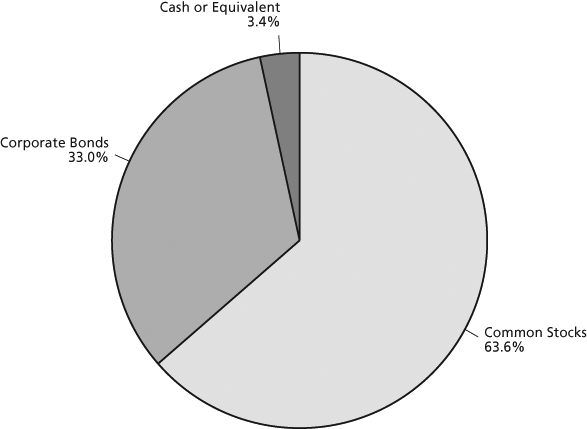
Plumb Balanced Fund
Investments by Asset Allocation as of March 31, 2019
(as a Percentage of Total Investments) (Unaudited)
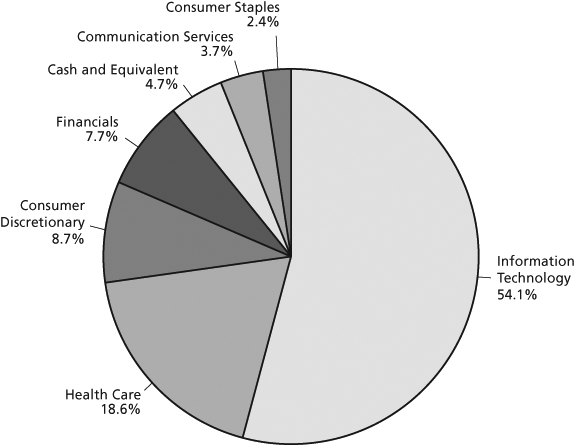
Plumb Equity Fund
Investments by Industry Sector as of March 31, 2019
(as a Percentage of Total Investments) (Unaudited)
The Global Industry Classification Standard (GICS®) was developed by and/or is the exclusive property of MSCI, Inc. (“MSCI”) and Standard & Poor’s Financial Services LLC (“S&P”). GICS is a service mark of MSCI and S&P and has been licensed for use by U.S. Bank Global Fund Services.
Plumb Balanced Fund
Schedule of Investments – March 31, 2019
| | | Shares | | | Value | |
| COMMON STOCKS – 63.71% | | | | | | |
| | | | | | | |
| Banks – 1.46% | | | | | | |
| JPMorgan Chase & Co. | | | 14,000 | | | $ | 1,417,220 | |
| | | | | | | | | |
| Capital Goods – 3.18% | | | | | | | | |
| Honeywell International, Inc. | | | 10,000 | | | | 1,589,200 | |
| Lockheed Martin Corp. | | | 5,000 | | | | 1,500,800 | |
| | | | | | | | 3,090,000 | |
| Diversified Financials – 3.82% | | | | | | | | |
| American Express Co. | | | 17,000 | | | | 1,858,100 | |
| Discover Financial Services | | | 26,000 | | | | 1,850,160 | |
| | | | | | | | 3,708,260 | |
| Energy – 3.40% | | | | | | | | |
| Enbridge, Inc. (b) | | | 49,000 | | | | 1,776,740 | |
| Phillips 66 | | | 16,000 | | | | 1,522,720 | |
| | | | | | | | 3,299,460 | |
| Food, Beverage & Tobacco – 1.35% | | | | | | | | |
| Constellation Brands, Inc. – Class A | | | 7,500 | | | | 1,314,975 | |
| | | | | | | | | |
| Health Care Equipment & Services – 7.28% | | | | | | | | |
| ABIOMED, Inc. (a) | | | 5,000 | | | | 1,427,950 | |
| Guardant Health, Inc. (a) | | | 12,500 | | | | 958,750 | |
| Intuitive Surgical, Inc. (a) | | | 3,500 | | | | 1,997,030 | |
| Medtronic PLC (b) | | | 16,500 | | | | 1,502,820 | |
| Stryker Corp. | | | 6,000 | | | | 1,185,120 | |
| | | | | | | | 7,071,670 | |
| Media & Entertainment – 3.65% | | | | | | | | |
| Alphabet, Inc. – Class A (a) | | | 1,100 | | | | 1,294,579 | |
| Alphabet, Inc. – Class C (a) | | | 500 | | | | 586,655 | |
| Walt Disney Co. | | | 15,000 | | | | 1,665,450 | |
| | | | | | | | 3,546,684 | |
| Pharmaceuticals, Biotechnology | | | | | | | | |
| & Life Sciences – 3.35% | | | | | | | | |
| Canopy Growth Corp. (a) (b) | | | 15,000 | | | | 650,550 | |
| Exact Sciences Corp. (a) | | | 14,000 | | | | 1,212,680 | |
| Portola Pharmaceuticals, Inc. (a) | | | 40,000 | | | | 1,388,000 | |
| | | | | | | | 3,251,230 | |
The accompanying notes are an integral part of these financial statements.
Plumb Balanced Fund
Schedule of Investments – March 31, 2019 (Continued)
| | | Shares | | | Value | |
| COMMON STOCKS (Continued) | | | | | | |
| | | | | | | |
| Retailing – 5.15% | | | | | | |
| Alibaba Group Holding Ltd. – ADR (a) (b) | | | 10,000 | | | $ | 1,824,500 | |
| Amazon.com, Inc. (a) | | | 1,050 | | | | 1,869,787 | |
| Booking Holdings, Inc. (a) | | | 750 | | | | 1,308,683 | |
| | | | | | | | 5,002,970 | |
| Semiconductors & Semiconductor Equipment – 3.37% | | | | | | | | |
| Microchip Technology, Inc. | | | 20,000 | | | | 1,659,200 | |
| NVIDIA Corp. | | | 9,000 | | | | 1,616,040 | |
| | | | | | | | 3,275,240 | |
| Software & Services – 26.45% | | | | | | | | |
| Adobe, Inc. (a) | | | 6,600 | | | | 1,758,834 | |
| Autodesk, Inc. (a) | | | 8,800 | | | | 1,371,216 | |
| Dassault Systemes SE – ADR (b) | | | 9,500 | | | | 1,412,650 | |
| Fiserv, Inc. (a) | | | 16,500 | | | | 1,456,620 | |
| FleetCor Technologies, Inc. (a) | | | 8,000 | | | | 1,972,720 | |
| Guidewire Software, Inc. (a) | | | 15,000 | | | | 1,457,400 | |
| Mastercard, Inc. – Class A | | | 10,500 | | | | 2,472,225 | |
| Microsoft Corp. | | | 15,000 | | | | 1,769,100 | |
| PayPal Holdings, Inc. (a) | | | 20,000 | | | | 2,076,800 | |
| Salesforce.com, Inc. (a) | | | 9,000 | | | | 1,425,330 | |
| Square, Inc. (a) | | | 22,000 | | | | 1,648,240 | |
| Tyler Technologies, Inc. (a) | | | 8,850 | | | | 1,808,940 | |
| Visa, Inc. – Class A | | | 19,500 | | | | 3,045,705 | |
| WEX, Inc. (a) | | | 10,500 | | | | 2,015,895 | |
| | | | | | | | 25,691,675 | |
| Technology Hardware & Equipment – 1.25% | | | | | | | | |
| Cisco Systems, Inc. | | | 22,500 | | | | 1,214,775 | |
| TOTAL COMMON STOCKS | | | | | | | | |
| (Cost $49,369,414) | | | | | | | 61,884,159 | |
| | | | | | | | | |
| | | Principal | | | | | |
| | | Amount | | | | | |
| CORPORATE BONDS – 33.07% | | | | | | | | |
| | | | | | | | | |
| Automobiles & Components – 0.52% | | | | | | | | |
| Toyota Industries Corp. (b) | | | | | | | | |
| 3.11%, 03/12/2022 | | $ | 500,000 | | | | 504,718 | |
The accompanying notes are an integral part of these financial statements.
Plumb Balanced Fund
Schedule of Investments – March 31, 2019 (Continued)
| | | Principal | | | | |
| | | Amount | | | Value | |
| CORPORATE BONDS (Continued) | | | | | | |
| | | | | | | |
| Banks – 9.28% | | | | | | |
| Bank of America Corp. (c) | | | | | | |
| 3.92% (3 Month LIBOR USD + 1.16%), 01/20/2023 | | $ | 1,000,000 | | | $ | 1,012,718 | |
| Bank of the Ozarks, Inc. (c) | | | | | | | | |
| 5.50% (3 Month LIBOR USD + 4.425%), 07/01/2026 | | | 1,305,000 | | | | 1,320,641 | |
| Citigroup, Inc. (c) | | | | | | | | |
| 4.12% (3 Month LIBOR USD + 1.35%), 04/25/2024 | | | 500,000 | | | | 503,378 | |
| 3.78% (3 Month LIBOR USD + 1.10%), 05/17/2024 | | | 1,500,000 | | | | 1,507,163 | |
| Home BancShares, Inc. (c) | | | | | | | | |
| 5.63% (3 Month LIBOR USD + 3.575%), 04/15/2027 | | | 1,740,000 | | | | 1,767,481 | |
| JPMorgan Chase & Co. (c) | | | | | | | | |
| 6.75% (3 Month LIBOR USD + 3.78%), 01/29/2050 | | | 1,500,000 | | | | 1,645,373 | |
| Wells Fargo & Co. (c) (d) | | | | | | | | |
| 6.38% (3 Month LIBOR USD + 3.77%), 03/29/2049 | | | 1,250,000 | | | | 1,259,375 | |
| | | | | | | | 9,016,129 | |
| Capital Goods – 5.59% | | | | | | | | |
| Boeing Co. | | | | | | | | |
| 4.88%, 02/15/2020 | | | 686,000 | | | | 698,638 | |
| Carlisle Cos, Inc. | | | | | | | | |
| 3.50%, 12/01/2024 | | | 500,000 | | | | 499,885 | |
| 5.13%, 12/15/2020 | | | 250,000 | | | | 256,096 | |
| General Electric Co. (c) | | | | | | | | |
| 3.61% (3 Month LIBOR USD + 1.00%), 03/15/2023 | | | 1,000,000 | | | | 973,181 | |
| Lockheed Martin Corp. | | | | | | | | |
| 2.50%, 11/23/2020 | | | 1,772,000 | | | | 1,767,224 | |
| Owens Corning | | | | | | | | |
| 4.20%, 12/15/2022 | | | 1,200,000 | | | | 1,231,568 | |
| | | | | | | | 5,426,592 | |
| Diversified Financials – 1.26% | | | | | | | | |
| Goldman Sachs Group, Inc. | | | | | | | | |
| 2.60%, 04/23/2020 | | | 1,223,000 | | | | 1,219,765 | |
| | | | | | | | | |
| Food, Beverage & Tobacco – 1.15% | | | | | | | | |
| Ingredion, Inc. | | | | | | | | |
| 4.63%, 11/01/2020 | | | 1,000,000 | | | | 1,023,630 | |
| PepsiCo, Inc. | | | | | | | | |
| 4.50%, 01/15/2020 | | | 95,000 | | | | 96,381 | |
| | | | | | | | 1,120,011 | |
The accompanying notes are an integral part of these financial statements.
Plumb Balanced Fund
Schedule of Investments – March 31, 2019 (Continued)
| | | Principal | | | | |
| | | Amount | | | Value | |
| CORPORATE BONDS (Continued) | | | | | | |
| | | | | | | |
| Health Care Equipment & Services – 0.84% | | | | | | |
| CVS Pass-Through Trust | | | | | | |
| 6.94%, 01/10/2030 | | $ | 222,656 | | | $ | 253,911 | |
| Owens & Minor, Inc. | | | | | | | | |
| 3.88%, 09/15/2021 | | | 500,000 | | | | 400,000 | |
| UnitedHealth Group, Inc. | | | | | | | | |
| 2.30%, 12/15/2019 | | | 162,000 | | | | 161,563 | |
| | | | | | | | 815,474 | |
| Insurance – 1.63% | | | | | | | | |
| Fidelity National Financial, Inc. | | | | | | | | |
| 5.50%, 09/01/2022 | | | 1,000,000 | | | | 1,060,377 | |
| Old Republic International Corp. | | | | | | | | |
| 4.88%, 10/01/2024 | | | 500,000 | | | | 527,623 | |
| | | | | | | | 1,588,000 | |
| Pharmaceuticals, Biotechnology | | | | | | | | |
| & Life Sciences – 4.91% | | | | | | | | |
| Allergan Funding SCS (b) | | | | | | | | |
| 3.00%, 03/12/2020 | | | 1,000,000 | | | | 999,688 | |
| AstraZeneca Plc (b) | | | | | | | | |
| 2.38%, 11/16/2020 | | | 1,000,000 | | | | 994,604 | |
| Bio-Rad Laboratories, Inc. | | | | | | | | |
| 4.88%, 12/15/2020 | | | 1,250,000 | | | | 1,285,398 | |
| Zoetis, Inc. | | | | | | | | |
| 3.45%, 11/13/2020 | | | 1,475,000 | | | | 1,488,954 | |
| | | | | | | | 4,768,644 | |
| Retailing – 0.92% | | | | | | | | |
| Amazon.com, Inc. | | | | | | | | |
| 1.90%, 08/21/2020 | | | 900,000 | | | | 892,919 | |
| | | | | | | | | |
| Semiconductors & Semiconductor Equipment – 1.03% | | | | | | | | |
| KLA-Tencor Corp. | | | | | | | | |
| 3.38%, 11/01/2019 | | | 1,000,000 | | | | 1,002,664 | |
| | | | | | | | | |
| Software & Services – 1.04% | | | | | | | | |
| CA, Inc. | | | | | | | | |
| 4.50%, 08/15/2023 | | | 1,000,000 | | | | 1,010,515 | |
The accompanying notes are an integral part of these financial statements.
Plumb Balanced Fund
Schedule of Investments – March 31, 2019 (Continued)
| | | Principal | | | | |
| | | Amount | | | Value | |
| CORPORATE BONDS (Continued) | | | | | | |
| | | | | | | |
| Technology Hardware & Equipment – 3.16% | | | | | | |
| Apple, Inc. | | | | | | |
| 2.25%, 02/23/2021 | | $ | 400,000 | | | $ | 398,712 | |
| FLIR Systems, Inc. | | | | | | | | |
| 3.13%, 06/15/2021 | | | 1,405,000 | | | | 1,400,957 | |
| Motorola Solutions, Inc. | | | | | | | | |
| 4.00%, 09/01/2024 | | | 1,250,000 | | | | 1,274,129 | |
| | | | | | | | 3,073,798 | |
| Transportation – 1.74% | | | | | | | | |
| Burlington Northern Santa Fe LLC | | | | | | | | |
| 4.10%, 06/01/2021 | | | 1,645,000 | | | | 1,689,231 | |
| TOTAL CORPORATE BONDS | | | | | | | | |
| (Cost $32,339,254) | | | | | | | 32,128,460 | |
| | | | | | | | | |
| | | Shares | | | | | |
| SHORT-TERM INVESTMENTS – 3.42% | | | | | | | | |
| | | | | | | | | |
| Money Market Fund – 3.42% | | | | | | | | |
| First American Government Obligations Fund – | | | | | | | | |
| Class X – 2.35% (e) | | | 3,324,498 | | | | 3,324,498 | |
| | | | | | | | | |
| TOTAL SHORT-TERM INVESTMENTS | | | | | | | | |
| (Cost $3,324,498) | | | | | | | 3,324,498 | |
| | | | | | | | | |
| Total Investments (Cost $85,033,166) – 100.20% | | | | | | | 97,337,117 | |
| Liabilities in Excess of Other Assets – (0.20)% | | | | | | | (198,019 | ) |
| TOTAL NET ASSETS – 100.00% | | | | | | $ | 97,139,098 | |
Percentages are stated as a percent of net assets.
ADR – American Depositary Receipt
PLC – Public Limited Company
| (a) | Non-income producing security. |
| (b) | Foreign issued security. Foreign concentration is as follows: Cayman Islands: 1.88%, Canada: 2.50%, Ireland: 1.55%, France: 1.45%, Luxembourg: 1.03%, United Kingdom 1.02%, Japan 0.52%. |
| (c) | Variable or Floating rate security based on a reference index and spread. The rate listed is as of March 31, 2019. |
| (d) | Step-up bond that pays an initial coupon rate for the first period and then a higher coupon rate for the following periods. The rate listed is as of March 31, 2019. |
| (e) | Rate shown is the 7-day effective yield. |
The accompanying notes are an integral part of these financial statements.
Plumb Equity Fund
Schedule of Investments – March 31, 2019
| | | Shares | | | Value | |
| COMMON STOCKS – 95.95% | | | | | | |
| | | | | | | |
| Diversified Financials – 7.71% | | | | | | |
| American Express Co. | | | 13,500 | | | $ | 1,475,550 | |
| Discover Financial Services | | | 20,000 | | | | 1,423,200 | |
| | | | | | | | 2,898,750 | |
| Food, Beverage & Tobacco – 2.43% | | | | | | | | |
| Constellation Brands, Inc. – Class A | | | 5,200 | | | | 911,716 | |
| | | | | | | | | |
| Health Care Equipment & Services – 11.86% | | | | | | | | |
| ABIOMED, Inc. (a) | | | 4,000 | | | | 1,142,360 | |
| Guardant Health, Inc. (a) | | | 9,500 | | | | 728,650 | |
| Intuitive Surgical, Inc. (a) | | | 2,800 | | | | 1,597,624 | |
| Stryker Corp. | | | 5,000 | | | | 987,600 | |
| | | | | | | | 4,456,234 | |
| Media & Entertainment – 3.76% | | | | | | | | |
| Alphabet, Inc. – Class A (a) | | | 1,200 | | | | 1,412,268 | |
| | | | | | | | | |
| Pharmaceuticals, Biotechnology | | | | | | | | |
| & Life Sciences – 6.90% | | | | | | | | |
| Canopy Growth Corp. (a) (b) | | | 15,000 | | | | 650,550 | |
| Exact Sciences Corp. (a) | | | 10,000 | | | | 866,200 | |
| Portola Pharmaceuticals, Inc. (a) | | | 31,000 | | | | 1,075,700 | |
| | | | | | | | 2,592,450 | |
| Retailing – 8.79% | | | | | | | | |
| Alibaba Group Holding Ltd. – ADR (a) (b) | | | 6,500 | | | | 1,185,925 | |
| Amazon.com, Inc. (a) | | | 700 | | | | 1,246,525 | |
| Booking Holdings, Inc. (a) | | | 500 | | | | 872,455 | |
| | | | | | | | 3,304,905 | |
| Semiconductors & Semiconductor Equipment – 6.20% | | | | | | | | |
| Microchip Technology, Inc. | | | 14,000 | | | | 1,161,440 | |
| NVIDIA Corp. | | | 6,500 | | | | 1,167,140 | |
| | | | | | | | 2,328,580 | |
| Software & Services – 46.50% | | | | | | | | |
| Adobe Systems, Inc. (a) | | | 5,500 | | | | 1,465,695 | |
| Autodesk, Inc. (a) | | | 9,000 | | | | 1,402,380 | |
| Dassault Systemes SE – ADR (b) | | | 8,000 | | | | 1,189,600 | |
| FleetCor Technologies, Inc. (a) | | | 5,900 | | | | 1,454,881 | |
| Guidewire Software, Inc. (a) | | | 12,000 | | | | 1,165,920 | |
| Mastercard, Inc. – Class A | | | 7,500 | | | | 1,765,875 | |
The accompanying notes are an integral part of these financial statements.
Plumb Equity Fund
Schedule of Investments – March 31, 2019 (Continued)
| | | Shares | | | Value | |
| COMMON STOCKS (Continued) | | | | | | |
| | | | | | | |
| Software & Services (Continued) | | | | | | |
| Microsoft Corp. | | | 11,000 | | | $ | 1,297,340 | |
| PayPal Holdings, Inc. (a) | | | 15,000 | | | | 1,557,600 | |
| Square, Inc. (a) | | | 17,500 | | | | 1,311,100 | |
| Tyler Technologies, Inc. (a) | | | 7,000 | | | | 1,430,800 | |
| Visa, Inc. – Class A | | | 12,200 | | | | 1,905,518 | |
| WEX, Inc. (a) | | | 8,000 | | | | 1,535,920 | |
| | | | | | | | 17,482,629 | |
| Technology Hardware & Equipment – 1.80% | | | | | | | | |
| Cisco Systems, Inc. | | | 12,500 | | | | 674,875 | |
| TOTAL COMMON STOCKS | | | | | | | | |
| (Cost $24,654,453) | | | | | | | 36,062,407 | |
| | | | | | | | | |
| SHORT-TERM INVESTMENTS – 4.78% | | | | | | | | |
| | | | | | | | | |
| Money Market Fund – 4.78% | | | | | | | | |
| First American Government Obligations Fund – | | | | | | | | |
| Class X – 2.35% (c) | | | 1,797,757 | | | | 1,797,757 | |
| | | | | | | | | |
| TOTAL SHORT-TERM INVESTMENTS | | | | | | | | |
| (Cost $1,797,757) | | | | | | | 1,797,757 | |
| | | | | | | | | |
| Total Investments (Cost $26,452,210) – 100.73% | | | | | | | 37,860,164 | |
| Liabilities in Excess of Other Assets – (0.73)% | | | | | | | (273,023 | ) |
| TOTAL NET ASSETS – 100.00% | | | | | | $ | 37,587,141 | |
Percentages are stated as a percent of net assets.
ADR – American Depositary Receipt
PLC – Public Limited Company
| (a) | Non-income producing security. |
| (b) | Foreign issued security. Foreign concentration is as follows: Cayman Islands: 3.16%, Canada: 1.73%, France: 3.16%. |
| (c) | Rate shown is the 7-day effective yield. |
The accompanying notes are an integral part of these financial statements.
Statements of Assets and Liabilities
March 31, 2019
| | | Plumb | | | Plumb | |
| | | Balanced | | | Equity | |
| | | Fund | | | Fund | |
| Assets | | | | | | |
| Investments, at value* | | $ | 97,337,117 | | | $ | 37,860,164 | |
| Dividends and interest receivable | | | 329,427 | | | | 4,505 | |
| Receivable for fund shares sold | | | 227,211 | | | | 20,500 | |
| Prepaid assets | | | 40,601 | | | | 23,215 | |
| Total Assets | | | 97,934,356 | | | | 37,908,384 | |
| | | | | | | | | |
| Liabilities | | | | | | | | |
| Payable for investments purchased | | | 674,222 | | | | 243,373 | |
| Payable for funds shares redeemed | | | 11,103 | | | | 5,079 | |
| Accrued distribution fee | | | — | | | | 9,677 | |
| Payable to Adviser (a) | | | 50,952 | | | | 13,013 | |
| Payable to directors | | | 298 | | | | 138 | |
| Accrued expenses and other liabilities | | | 58,683 | | | | 49,963 | |
| Total Liabilities | | | 795,258 | | | | 321,243 | |
| Net Assets | | $ | 97,139,098 | | | $ | 37,587,141 | |
| | | | | | | | | |
| Net Assets Consist Of: | | | | | | | | |
| Paid in Capital | | $ | 82,684,063 | | | $ | 25,146,087 | |
| Total Distributable Earnings | | | 14,455,035 | | | | 12,441,054 | |
| Net Assets | | $ | 97,139,098 | | | $ | 37,587,141 | |
| | | | | | | | | |
| Capital shares outstanding, $0.001 par value | | | | | | | | |
| (200 million shares issued each) | | | 3,135,499 | | | | 1,325,791 | |
| Net asset value, offering and | | | | | | | | |
| redemption price per share | | $ | 30.98 | | | $ | 28.35 | |
| | | | | | | | | |
| * Cost of Investments | | $ | 85,033,166 | | | $ | 26,452,210 | |
(a) See Note 4 in the Notes to Financial Statements.
The accompanying notes are an integral part of these financial statements.
Statements of Operations
For the Fiscal Year Ended March 31, 2019
| | | Plumb | | | Plumb | |
| | | Balanced | | | Equity | |
| | | Fund | | | Fund | |
| Investment Income: | | | | | | |
| Dividend income (Net of foreign withholding | | | | | | |
| taxes of $13,761 and $1,787, respectively) | | $ | 447,488 | | | $ | 174,780 | |
| Interest | | | 996,105 | | | | 21,238 | |
| Total Investment Income | | | 1,443,593 | | | | 196,018 | |
| | | | | | | | | |
| Expenses: | | | | | | | | |
| Investment Advisor’s fee (a) | | | 503,736 | | | | 229,194 | |
| Distribution fees | | | 144,963 | | | | 74,852 | |
| Fund accounting fees | | | 69,134 | | | | 58,852 | |
| Transfer agent fees and expenses | | | 55,412 | | | | 38,550 | |
| Director fees and expenses | | | 35,046 | | | | 16,180 | |
| Registration fees | | | 25,836 | | | | 25,929 | |
| Legal fees | | | 24,395 | | | | 25,871 | |
| Insurance expense | | | 16,018 | | | | 9,763 | |
| Audit and tax fees | | | 15,651 | | | | 15,651 | |
| Custody fees | | | 12,402 | | | | 8,497 | |
| Printing and mailing expense | | | 10,479 | | | | 5,352 | |
| Total expenses before waiver/recoupment | | | 913,072 | | | | 508,691 | |
| Less: Fees (waived)/recouped | | | | | | | | |
| by Advisor, net (a) | | | 9,153 | | | | (89,091 | ) |
| Net expenses | | | 922,225 | | | | 419,600 | |
| Net Investment Income (Loss) | | | 521,368 | | | | (223,582 | ) |
| | | | | | | | | |
| Realized and Unrealized Gain (Loss): | | | | | | | | |
| Net realized gain on investments | | | 2,921,662 | | | | 3,422,574 | |
| Net realized loss on foreign | | | | | | | | |
| currency translation | | | (240 | ) | | | — | |
| Net change in unrealized | | | | | | | | |
| appreciation on investments | | | 2,146,680 | | | | 525,492 | |
| Net realized and unrealized | | | | | | | | |
| gain on investments | | | 5,068,102 | | | | 3,948,066 | |
| | | | | | | | | |
| Net Increase in Net Assets | | | | | | | | |
| Resulting from Operations | | $ | 5,589,470 | | | $ | 3,724,484 | |
(a) See Note 4 in the Notes to the Financial Statements.
The accompanying notes are an integral part of these financial statements.
Plumb Balanced Fund
Statements of Changes in Net Assets
| | | For the | | | For the | |
| | | Year Ended | | | Year Ended | |
| | | March 31, | | | March 31, | |
| | | 2019 | | | 2018 | |
| Operations: | | | | | | |
| Net investment income | | $ | 521,368 | | | $ | 217,141 | |
| Net realized gain on investments | | | 2,921,662 | | | | 3,440,919 | |
| Net realized loss on foreign | | | | | | | | |
| currency translation | | | (240 | ) | | | 62 | |
| Net change in unrealized appreciation | | | | | | | | |
| on investments | | | 2,146,680 | | | | 1,996,363 | |
| Net increase in net assets | | | | | | | | |
| resulting from operations | | | 5,589,470 | | | | 5,654,485 | |
| | | | | | | | | |
| Dividends And Distributions To Shareholders: | | | | | | | | |
| Net dividends and distributions | | | (1,306,126 | ) | | | (252,532 | )(1) |
| Total dividends and distributions | | | (1,306,126 | ) | | | (252,532 | ) |
| | | | | | | | | |
| Capital Share Transactions: | | | | | | | | |
| Proceeds from shares sold | | | 82,189,718 | | | | 9,376,488 | |
| Shares issued in reinvestment of dividends | | | 1,271,329 | | | | 123,249 | |
| Cost of shares redeemed | | | (35,327,559 | ) | | | (3,460,399 | ) |
| Net increase in net assets | | | | | | | | |
| from capital share transactions | | | 48,133,488 | | | | 6,039,338 | |
| | | | | | | | | |
| Total increase in net assets | | | 52,416,832 | | | | 11,441,291 | |
| | | | | | | | | |
| Net Assets: | | | | | | | | |
| Beginning of year | | | 44,722,266 | | | | 33,280,975 | |
| End of year | | $ | 97,139,098 | | | $ | 44,722,266 | (2) |
| | | | | | | | | |
| Change in Shares Outstanding: | | | | | | | | |
| Shares sold | | | 2,712,518 | | | | 331,809 | |
| Shares issued in reinvestment of dividends | | | 45,453 | | | | 4,347 | |
| Shares redeemed | | | (1,177,144 | ) | | | (126,230 | ) |
| Net increase | | | 1,580,827 | | | | 209,926 | |
| (1) | Distribution is comprised of net investment income. |
| (2) | Includes accumulated undistributed net investment income of $18,569. |
The accompanying notes are an integral part of these financial statements.
Plumb Equity Fund
Statements of Changes in Net Assets
| | | For the | | | For the | |
| | | Year Ended | | | Year Ended | |
| | | March 31, | | | March 31, | |
| | | 2019 | | | 2018 | |
| Operations: | | | | | | |
| Net investment loss | | $ | (223,582 | ) | | $ | (216,923 | ) |
| Net realized gain on investments | | | 3,422,574 | | | | 4,862,307 | |
| Net change in unrealized appreciation | | | | | | | | |
| on investments | | | 525,492 | | | | 2,707,535 | |
| Net increase in net assets | | | | | | | | |
| resulting from operations | | | 3,724,484 | | | | 7,352,919 | |
| | | | | | | | | |
| Dividends And Distributions To Shareholders: | | | | | | | | |
| Net dividends and distributions | | | (4,161,974 | ) | | | (2,950,416 | )(1) |
| Total dividends and distributions | | | (4,161,974 | ) | | | (2,950,416 | ) |
| | | | | | | | | |
| Capital Share Transactions: | | | | | | | | |
| Proceeds from shares sold | | | 14,231,675 | | | | 17,535,465 | |
| Shares issued in reinvestment of dividends | | | 4,161,274 | | | | 2,934,704 | |
| Cost of shares redeemed | | | (10,008,969 | ) | | | (18,765,097 | ) |
| Net increase in net assets | | | | | | | | |
| from capital share transactions | | | 8,383,980 | | | | 1,705,072 | |
| | | | | | | | | |
| Total increase in net assets | | | 7,946,490 | | | | 6,107,575 | |
| | | | | | | | | |
| Net Assets: | | | | | | | | |
| Beginning of year | | | 29,640,651 | | | | 23,533,076 | |
| End of year | | $ | 37,587,141 | | | $ | 29,640,651 | |
| | | | | | | | | |
| Change in Shares Outstanding: | | | | | | | | |
| Shares sold | | | 470,058 | | | | 649,047 | |
| Shares issued in reinvestment of dividends | | | 171,316 | | | | 107,341 | |
| Shares redeemed | | | (345,610 | ) | | | (678,971 | ) |
| Net increase | | | 295,764 | | | | 77,417 | |
| (1) | Distribution is comprised of net realized gains. |
The accompanying notes are an integral part of these financial statements.
(This Page Intentionally Left Blank.)
Plumb Balanced Fund
Financial Highlights
Per share operating performance
(For a share outstanding throughout the year)
Net asset value, beginning of year
Operations:
Net investment income(1)
Net realized and unrealized gain (loss)
Total from investment operations
Dividends and distributions to shareholders:
Dividends from net investment income
Distributions from net realized gains
Total dividends and distributions
Change in net asset value for the year
Net asset value, end of year
Total return(2)
Ratios / supplemental data
Net assets, end of year (000)
Ratio of net expenses to average net assets:
Before expense reimbursement and waivers/recoupment
After expense reimbursement and waivers/recoupment(3)
Ratio of net investment income to average net assets:
After expense reimbursement and waivers/recoupment(3)
Portfolio turnover rate
| (1) | Net investment income per share is calculated using current year ending balances prior to consideration of adjustment for permanent book and tax differences. |
| (2) | Total return represents the rate that the investor would have earned or lost on an investment in the Fund, assuming reinvestment of dividends. |
| (3) | Effective December 1, 2017, the Advisor contractually agreed to cap the Funds expenses at 1.19%. Prior to December 1, 2017, the Fund’s expense cap was 1.30%. |
The accompanying notes are an integral part of these financial statements.
Plumb Balanced Fund
Financial Highlights (Continued)
| For the Years Ended March 31, | | |
| 2019 | | | 2018 | | | 2017 | | | 2016 | | | 2015 | | |
| | | | | | | | | | | | | | | |
| | | | | | | | | | | | | | | |
| | | | | | | | | | | | | | | |
| $ | 28.77 | | | $ | 24.75 | | | $ | 21.69 | | | $ | 22.75 | | | $ | 20.97 | | |
| | | | | | | | | | | | | | | | | | | | |
| | 0.16 | | | | 0.15 | | | | 0.13 | | | | 0.15 | | | | 0.24 | | |
| | 2.51 | | | | 4.05 | | | | 3.05 | | | | (1.05 | ) | | | 1.77 | | |
| | 2.67 | | | | 4.20 | | | | 3.18 | | | | (0.90 | ) | | | 2.01 | | |
| | | | | | | | | | | | | | | | | | | | |
| | | | | | | | | | | | | | | | | | | | |
| | — | | | | (0.18 | ) | | | (0.12 | ) | | | (0.16 | ) | | | (0.23 | ) | |
| | (0.46 | ) | | | — | | | | — | | | | — | | | | — | | |
| | (0.46 | ) | | | (0.18 | ) | | | (0.12 | ) | | | (0.16 | ) | | | (0.23 | ) | |
| | | | | | | | | | | | | | | | | | | | |
| | 2.21 | | | | 4.02 | | | | 3.06 | | | | (1.06 | ) | | | 1.78 | | |
| | | | | | | | | | | | | | | | | | | | |
| $ | 30.98 | | | $ | 28.77 | | | $ | 24.75 | | | $ | 21.69 | | | $ | 22.75 | | |
| | 9.47 | % | | | 16.98 | % | | | 14.70 | % | | | -3.98 | % | | | 9.65 | % | |
| | | | | | | | | | | | | | | | | | | | |
| | | | | | | | | | | | | | | | | | | | |
| $ | 97,139 | | | $ | 44,722 | | | $ | 33,281 | | | $ | 32,229 | | | $ | 35,098 | | |
| | | | | | | | | | | | | | | | | | | | |
| | 1.18 | % | | | 1.50 | % | | | 1.68 | % | | | 1.65 | % | | | 1.62 | % | |
| | 1.19 | % | | | 1.26 | % | | | 1.28 | % | | | 1.25 | % | | | 1.25 | % | |
| | | | | | | | | | | | | | | | | | | | |
| | 0.66 | % | | | 0.57 | % | | | 0.56 | % | | | 0.65 | % | | | 1.05 | % | |
| | 58 | % | | | 37 | % | | | 29 | % | | | 52 | % | | | 53 | % | |
The accompanying notes are an integral part of these financial statements.
Plumb Equity Fund
Financial Highlights
Per share operating performance
(For a share outstanding throughout the year)
Net asset value, beginning of year
Operations:
Net investment loss(1)
Net realized and unrealized gain (loss)
Total from investment operations
Dividends and distributions to shareholders:
Dividends from net investment income
Distributions from net realized gains
Total dividends and distributions
Change in net asset value for the year
Net asset value, end of year
Total return(3)
Ratios / supplemental data
Net assets, end of year (000)
Ratio of net expenses to average net assets:
Before expense reimbursement and waivers
After expense reimbursement and waivers(4)
Ratio of net investment income to average net assets:
After expense reimbursement and waivers(4)
Portfolio turnover rate
| (1) | Net investment income per share is calculated using current year ending balances prior to consideration of adjustment for permanent book and tax differences. |
| (2) | Realized and unrealized gains and losses per share in this caption are balancing amounts necessary to reconcile the change in net asset value per share for the period, and may not reconcile with the aggregate gains and losses in the Statement of Operations due to share transactions for the period. |
| (3) | Total return represents the rate that the investor would have earned or lost on an investment in the Fund, assuming reinvestment of dividends. |
| (4) | Effective December 1, 2017, the Advisor contractually agreed to cap the Funds expenses at 1.19%. Prior to December 1, 2017, the Fund’s expense cap was 1.45%. |
The accompanying notes are an integral part of these financial statements.
Plumb Equity Fund
Financial Highlights (Continued)
| For the Years Ended March 31, | | |
| 2019 | | | 2018 | | | 2017 | | | 2016 | | | 2015 | | |
| | | | | | | | | | | | | | | |
| | | | | | | | | | | | | | | |
| | | | | | | | | | | | | | | |
| $ | 28.78 | | | $ | 24.70 | | | $ | 20.40 | | | $ | 24.26 | | | $ | 21.57 | | |
| | | | | | | | | | | | | | | | | | | | |
| | (0.17 | ) | | | (0.21 | ) | | | (0.15 | ) | | | (0.10 | ) | | | (0.01 | ) | |
| | 3.23 | | | | 7.84 | (2) | | | 4.69 | | | | (1.16 | ) | | | 2.96 | | |
| | 3.06 | | | | 7.63 | | | | 4.54 | | | | (1.26 | ) | | | 2.95 | | |
| | | | | | | | | | | | | | | | | | | | |
| | | | | | | | | | | | | | | | | | | | |
| | — | | | | — | | | | — | | | | — | | | | (0.04 | ) | |
| | (3.49 | ) | | | (3.55 | ) | | | (0.24 | ) | | | (2.60 | ) | | | (0.22 | ) | |
| | (3.49 | ) | | | (3.55 | ) | | | (0.24 | ) | | | (2.60 | ) | | | (0.26 | ) | |
| | | | | | | | | | | | | | | | | | | | |
| | (0.43 | ) | | | 4.08 | | | | 4.30 | | | | (3.86 | ) | | | 2.69 | | |
| | | | | | | | | | | | | | | | | | | | |
$
| 28.35 | | | $
| 28.78 | | | $
| 24.70 | | | $
| 20.40 | | | $
| 24.26 | | |
| | 12.67 | % | | | 31.65 | % | | | 22.38 | % | | | -5.76 | % | | | 13.76 | % | |
| | | | | | | | | | | | | | | | | | | | |
| | | | | | | | | | | | | | | | | | | | |
| $ | 37,587 | | | $ | 29,641 | | | $ | 23,533 | | | $ | 21,423 | | | $ | 24,130 | | |
| | | | | | | | | | | | | | | | | | | | |
| | 1.44 | % | | | 1.68 | % | | | 1.86 | % | | | 1.82 | % | | | 1.72 | % | |
| | 1.19 | % | | | 1.36 | % | | | 1.43 | % | | | 1.40 | % | | | 1.40 | % | |
| | | | | | | | | | | | | | | | | | | | |
| | -0.63 | % | | | -0.79 | % | | | -0.74 | % | | | -0.48 | % | | | -0.05 | % | |
| | 64 | % | | | 69 | % | | | 18 | % | | | 41 | % | | | 52 | % | |
The accompanying notes are an integral part of these financial statements.
Notes to Financial Statements
March 31, 2019
1. ORGANIZATION
Wisconsin Capital Funds, Inc. (the “Company”) is registered under the Investment Company Act of 1940 (the “1940 Act”) as an open-end, diversified management investment company. The Company was organized as a Maryland corporation on April 3, 2007. The Company is authorized to issue up to 2 billion shares, which are units of beneficial interest with a $0.001 par value. The Company currently offers shares of two series, each with its own investment strategy and risk/reward profile: the Plumb Balanced Fund and the Plumb Equity Fund (individually a “Fund”, collectively the “Funds”). The investment objective of the Plumb Balanced Fund is high total return through capital appreciation while attempting to preserve principal, with current income as a secondary objective. The investment objective of the Plumb Equity Fund is long-term capital appreciation. Wisconsin Capital Management, LLC (the “Advisor”) serves as the Funds’ investment advisor. As of December 31, 2014, the Advisor is owned by TGP, Inc. The Advisor is controlled by Thomas G. Plumb indirectly through TGP, Inc. Certain directors or officers of the Funds are also officers of the Advisor.
2. SIGNIFICANT ACCOUNTING POLICES
The following is a summary of significant accounting policies consistently followed by the Funds in the preparation of its financial statements. These policies are in conformity with accounting principles generally accepted in the United States of America (“GAAP”). The Fund is an investment company and accordingly follows the investment company accounting and reporting guidance of the Financial Accounting Standards Board (“FASB”) Accounting Standards Codification Topic 946 Financial Services – Investment Companies.
In August 2018, FASB issued ASU 2018-13, Fair Value Measurement (Topic 820): Disclosure Framework—Changes to the Disclosure Requirements for Fair Value Measurement (“ASU 2018-13”). The primary focus of ASU 2018-13 is to improve the effectiveness of the disclosure requirements for fair value measurements. The changes affect all companies that are required to include fair value measurement disclosures. In general, the amendments in ASU 2018-13 are effective for all entities for fiscal years and interim periods within those fiscal years, beginning after December 15, 2019. An entity is permitted to early adopt the removed or modified disclosures upon the issuance of ASU 2018-13 and may delay adoption of the additional disclosures, which are required for public companies only, until their effective date. The Funds have early adopted this standard effective March 31, 2019, and the changes are incorporated into the financial statements.
Security Valuation:
The Funds have adopted authoritative fair valuation accounting standards which establish an authoritative definition of fair value and set out a hierarchy for
Notes to Financial Statements
March 31, 2019 (Continued)
measuring fair value. These standards require additional disclosures about the various inputs and valuation techniques used to develop the measurements of fair value and a discussion in changes in valuation techniques and related inputs during the year. These inputs are summarized in the three broad levels listed below.
| | Level 1 – | quoted prices in active markets for identical securities |
| | | |
| | Level 2 – | other significant observable inputs (including quoted prices for similar securities, interest rates, prepayment speeds, credit risk, etc.) |
| | | |
| | Level 3 – | significant unobservable inputs (including the Funds’ own assumptions in determining far value of investments) |
Equity securities, including domestic common stocks and foreign issued common stocks, are valued at the last sale price reported by the exchange on which the securities are primarily traded on the day of valuation. Nasdaq-listed securities are valued at their Nasdaq Official Closing Price. Equity securities not traded on a listed exchange or not traded using Nasdaq are valued as of the last sale price at the close of the U.S. market. If there are no sales on a given day for securities traded on an exchange, the latest bid quotation will be used. These securities will generally be classified as Level 1 securities.
Investments in mutual funds, including money market funds, are generally priced at the ending net asset value (NAV) provided by the service agent of the Funds and will be classified as Level 1 securities.
Debt securities such as corporate bonds and preferred securities are valued using a market approach based on information supplied by independent pricing services. The market inputs used by the independent pricing service include: benchmark yields, reported trades, broker/dealer quotes, issuer spreads, two sided markets, benchmark securities, bids, offers, and reference data including market research publications. Debt securities with remaining maturities of 60 days or less may be valued on an amortized cost basis, which involves valuing an instrument at its cost and thereafter assuming a constant amortization to maturity of any discount or premium, regardless of the impact of fluctuating rates on the fair value of the instrument. To the extent the inputs are observable and timely, these debt securities will generally be classified as Level 2 securities.
Any securities or other assets for which market quotations are not readily available are valued at fair value as determined in good faith by the Advisor pursuant to procedures established under the general supervision and responsibility of the Funds’ Board of Directors and will be classified as Level 3 securities.
The inputs or methodology used for valuing securities may not be an indication of the risk associated with investing in those securities. The inputs used to measure fair value may fall into different levels of the fair value hierarchy. In
Notes to Financial Statements
March 31, 2019 (Continued)
such cases, for disclosure purposes, the level in the fair value hierarchy within which the fair value measurement falls in its entirety is determined based on the lowest level input that is significant to the fair value measurement in its entirety.
The following is a summary of the inputs used, as of March 31, 2019, to value the Funds’ investments carried at fair value:
Description | | Level 1 | | | Level 2 | | | Level 3 | | | Total | |
| Plumb Balanced Fund | | | | | | | | | | | | |
| Investments in: | | | | | | | | | | | | |
| Common Stocks* | | $ | 61,884,159 | | | $ | — | | | $ | — | | | $ | 61,884,159 | |
| Corporate Bonds* | | | — | | | | 32,128,460 | | | | — | | | | 32,128,460 | |
| Short-Term Investments | | | 3,324,498 | | | | — | | | | — | | | | 3,324,498 | |
| Total | | $ | 65,208,657 | | | $ | 32,128,460 | | | $ | — | | | $ | 97,337,117 | |
| | | | | | | | | | | | | | | | | |
Description | | Level 1 | | | Level 2 | | | Level 3 | | | Total | |
| Plumb Equity Fund | | | | | | | | | | | | | | | | |
| Investments in: | | | | | | | | | | | | | | | | |
| Common Stocks* | | $ | 36,062,407 | | | $ | — | | | $ | — | | | $ | 36,062,407 | |
| Short-Term Investments | | | 1,797,757 | | | | — | | | | — | | | | 1,797,757 | |
| Total | | $ | 37,860,164 | | | $ | — | | | $ | — | | | $ | 37,860,164 | |
| * | For detailed industry descriptions, refer to the Schedule of Investments. |
The Funds did not hold any derivative instruments during the year ended March 31, 2019.
Use of Estimates:
The presentation of the financial statements in conformity with GAAP requires management to make estimates and assumptions that affect the reported amounts of assets and liabilities and disclosure of contingent assets and liabilities at the date of the financial statements and the reported amounts of increases and decreases in net assets from operations during the reporting period. Actual results could differ from those estimates.
Expenses:
Generally, expenses directly attributable to a Fund are charged to the Fund, while expenses attributable to more than one series of the Company are allocated among the respective series based on relative net assets or another appropriate basis.
Notes to Financial Statements
March 31, 2019 (Continued)
Federal Income Taxes:
The Funds intend to meet the requirements of the Internal Revenue Code (the “Code”) applicable to regulated investment companies and to distribute substantially all net investment taxable income and net capital gains to shareholders in a manner which results in no tax cost to the Funds. Therefore, no federal income or excise tax provision is recorded.
As of and during the year ended March 31, 2019, the Funds did not have a liability for any unrecognized tax benefits. The Funds recognize interest and penalties, if any, related to unrecognized tax benefits as income tax expense in the Statements of Operations. During the year ended March 31, 2019, the Funds did not incur any interest or penalties.
Distributions to Shareholders:
Dividends from net investment income are declared and paid at least annually. Distributions of net realized capital gains, if any, will be declared and paid at least annually. Distributions to shareholders are recorded on the ex-dividend date.
The Funds may periodically make reclassifications among certain of its capital accounts as a result of the recognition and characterization of certain income and capital gain distributions determined annually in accordance with federal tax regulations which may differ from GAAP. Any such reclassifications will have no effect on net assets, results of operations or net asset values per share of the Funds.
For the fiscal year ended March 31, 2019, the Funds did not make any reclassifications to the components of net assets.
Other:
Investment and shareholder transactions are recorded on the trade date. Gains or losses from investment transactions are determined using the specific identification method. Dividend income is recognized on the ex-dividend date and interest income is recognized on an accrual basis. Discounts and premiums on securities purchased are amortized over the expected life of the respective securities using the effective interest method. Withholding taxes on foreign dividends have been provided for in accordance with the Funds’ understanding of the applicable country’s tax rules and rates.
Investment securities and other assets and liabilities denominated in foreign currencies are translated into U.S. dollar amounts at the date of valuation. Purchases and sales of investment securities and income and expense items denominated in foreign currencies are translated into U.S. dollar amounts on the respective dates of such transactions. The Fund does not isolate the portion of the results of operations from changes in foreign exchange rates on investments
Notes to Financial Statements
March 31, 2019 (Continued)
from the fluctuations arising from changes in market prices of securities held. Realized foreign exchange gains or losses arising from sales of portfolio securities and sales and maturities of short-term securities are reported within realized gain (loss) on investments. Net unrealized foreign exchange gains and losses arising from changes in the values of investments in securities from fluctuations in exchange rates are reported within unrealized gain (loss) on investments.
3. DISTRIBUTION PLAN
The Company has adopted a plan pursuant to Rule 12b-1 under the 1940 Act (the “12b-1 Plan”), on behalf of the Funds, which authorizes it to pay Quasar Distributors, LLC (the “Distributor”) a distribution fee up to 0.25% of the Funds’ average daily net assets for services to prospective Fund shareholders and distribution of Fund shares. During the year ended March 31, 2019, the Plumb Balanced Fund and the Plumb Equity Fund incurred expenses of $144,963 and $74,852, respectively, pursuant to the 12b-1 Plan.
4. INVESTMENT ADVISOR AND OTHER AFFILIATES
The Funds have an Investment Advisory Agreement (the “Advisory Agreement”) with Wisconsin Capital Management, LLC. The Advisory Agreement provides for advisory fees computed daily and paid monthly at an annual rate of 0.65% of the Funds’ average daily net assets.
Under the terms of the Advisory Agreement, the Advisor has contractually agreed to limit the Funds’ expenses. Effective December 1, 2017, Wisconsin Capital Management, LLC, the investment advisor to the Funds (the “Advisor”), has contractually agreed to waive its advisory fee and/or reimburse expenses in order to limit the Total Annual Fund Operating Expenses of each of the Funds to 1.19% of such Fund’s average daily net assets. This contractual limitation is in effect until July 31, 2020, and may not be terminated without the approval of the Board of Directors of Wisconsin Capital Funds, Inc. Prior to December 1, 2017, the Plumb Balanced Fund and the Plumb Equity Fund’s expense cap was 1.30% and 1.45%, respectively. Any such waiver or reimbursement is subject to later adjustment to allow the Advisor to recoup amounts waived or reimbursed to the extent actual fees and expenses for a period are less than the expense limitation caps in place at the time the waiver was made, provided, however, that the Advisor shall only be entitled to recoup such amounts for a period of three years from the date such amount was waived or reimbursed. For the year ended March 31, 2019, the Advisor waived expenses for the Plumb Equity Fund of $89,091. For the year ended March 31, 2019, the Advisor recouped expenses from the Plumb Balanced Fund in the amount of $20,951 and waived expenses in the amount of $11,798.
Notes to Financial Statements
March 31, 2019 (Continued)
As of March 31, 2019, the Adviser has waived and recouped fees. The following table shows the remaining amount subject to potential recoupment as of March 31, 2019 and expiring on:
Plumb Balanced Fund | Plumb Equity Fund |
| March 31, 2020 . . . . . . . $130,821 | March 31, 2020 . . . . . . . $ 93,826 |
| March 31, 2021 . . . . . . . $122,739 | March 31, 2021 . . . . . . . $110,110 |
| March 31, 2022 . . . . . . . $ 11,798 | March 31, 2022 . . . . . . . $ 89,091 |
5. INVESTMENT TRANSACTIONS
For the fiscal year ended March 31, 2019, the aggregate purchases and sales of investment securities, other than short-term investments, were as follows:
| | | U.S. Government Securities | Other |
| | | Purchases | Sales | Purchases | Sales |
| | Plumb Balanced Fund | $2,487,269 | $1,498,828 | $86,657,382 | $41,827,124 |
| | Plumb Equity Fund | $ — | $ — | $25,450,280 | $21,815,089 |
6. BENEFICIAL OWNERSHIP
The beneficial ownership, either directly or indirectly, of more than 25% of the voting securities of a fund creates a presumption of control of the fund under Section 2(a)(9) of the 1940 Act. As of March 31, 2019, National Financial Services, LLC, for the benefit of its customers, owned 38.22% of the outstanding shares of the Plumb Balanced Fund. As of March 31, 2019, SVA Plumb Trust Company owned 32.88% of the outstanding shares of the Plumb Equity Fund.
7. FEDERAL TAX INFORMATION
As of March 31, 2019 the components of accumulated earnings (losses) for income tax purposes were as follows:
| | | Plumb Balanced Fund | | Plumb Equity Fund |
| | Unrealized appreciation | | $ | 13,597,957 | | | | $ | 11,656,584 | |
| | Unrealized depreciation | | | (1,937,845 | ) | | | | (460,058 | ) |
| | Net tax unrealized | | | | | | | | | |
| | appreciation on investments | | | 11,660,112 | | | | | 11,196,526 | |
| | Undistributed ordinary income | | | 1,039,864 | | | | | — | |
| | Undistributed long-term capital gain | | | 1,755,059 | | | | | 1,297,588 | |
| | Other accumulated losses | | | — | | | | | (53,060 | ) |
| | Total accumulated gains (losses) | | $ | 14,455,035 | | | | $ | 12,441,054 | |
The tax cost of investments as of March 31, 2019 was $85,677,005 and $26,663,638 for the Plumb Balanced Fund and Plumb Equity Fund, respectively.
Notes to Financial Statements
March 31, 2019 (Continued)
The tax basis of investments for tax and financial reporting purposes differs principally due to the deferral of losses on wash sales.
As of March 31, 2019, the Funds had no prior tax basis capital losses.
As of March 31, 2019, the Funds deferred, on a tax basis, late year ordinary and post-October capital losses of:
| | | Plumb Balanced Fund | Plumb Equity Fund |
| | Late Year Ordinary Loss | $ — | $53,060 |
| | Post-October Capital Loss | $ — | $ — |
8. DISTRIBUTIONS TO SHAREHOLDERS
The tax character of distributions paid during the fiscal years ended March 31, 2019 and 2018 was as follows:
| | | | Plumb Balanced Fund | |
| | | | Year Ended | | | Year Ended | |
| | | | March 31, 2019 | | | March 31, 2018 | |
| | Distributions paid from: | | | | | | |
| | Ordinary Income | | $ | 18,569 | | | $ | 252,532 | |
| | Long Term Capital Gain | | | 1,287,557 | | | | — | |
| | Total Distributions Paid | | $ | 1,306,126 | | | $ | 252,532 | |
| | | | | | | | | | |
| | | | Plumb Equity Fund | |
| | | | Year Ended | | | Year Ended | |
| | | | March 31, 2019 | | | March 31, 2018 | |
| | Distributions paid from: | | | | | | | | |
| | Ordinary Income | | $ | 649,543 | | | $ | 298,128 | |
| | Long-Term Capital Gains | | | 3,512,431 | | | | 2,652,288 | |
| | Total Distributions Paid | | $ | 4,161,974 | | | $ | 2,950,416 | |
Report of Independent Registered Public Accounting Firm
To the Shareholders and Board of Directors of Wisconsin Capital Funds, Inc.
Opinion on the Financial Statements
We have audited the accompanying statements of assets and liabilities, including the schedules of investments, of Wisconsin Capital Funds, Inc., comprising Plumb Balanced Fund and Plumb Equity Fund (the “Funds”) as of March 31, 2019, and the related statements of operations for the year then ended, the statements of changes in net assets for each of the two years in the period then ended, including the related notes, and the financial highlights for each of the five years in the period then ended (collectively referred to as the “financial statements”). In our opinion, the financial statements present fairly, in all material respects, the financial position of each of the Funds as of March 31, 2019, the results of their operations for the year then ended, the changes in their net assets for each of the two years in the period then ended, and the financial highlights for each of the five years in the period then ended, in conformity with accounting principles generally accepted in the United States of America.
Basis for Opinion
These financial statements are the responsibility of the Funds’ management. Our responsibility is to express an opinion on the Funds’ financial statements based on our audits. We are a public accounting firm registered with the Public Company Accounting Oversight Board (United States) (“PCAOB”) and are required to be independent with respect to the Funds in accordance with the U.S. federal securities laws and the applicable rules and regulations of the Securities and Exchange Commission and the PCAOB.
We conducted our audits in accordance with the standards of the PCAOB. Those standards require that we plan and perform the audit to obtain reasonable assurance about whether the financial statements are free of material misstatement, whether due to error or fraud.
Our audits included performing procedures to assess the risks of material misstatement of the financial statements, whether due to error or fraud, and performing procedures that respond to those risks. Such procedures included examining, on a test basis, evidence regarding the amounts and disclosures in the financial statements. Our procedures included confirmation of securities owned as of March 31, 2019, by correspondence with the custodian and brokers or by other appropriate auditing procedures where replies from brokers or counterparties were not received. Our audits also included evaluating the accounting principles used and significant estimates made by management, as well as evaluating the overall presentation of the financial statements. We believe that our audits provide a reasonable basis for our opinion.
We have served as the Funds’ auditor since 2007.
COHEN & COMPANY, LTD.
Cleveland, Ohio
May 24, 2019
Additional Information (Unaudited)
1. ADDITIONAL DISCLOSURE REGARDING FUND DIRECTORS AND OFFICERS
| | | | | Number of | |
| | Position(s) | Term of | | Portfolios | |
| | Held with | Office and | Principal | in Fund | Other |
| Name, | Wisconsin | Length | Occupation(s) | Complex | Directorships |
| Address and | Capital | of Time | During Past | Overseen by | Held by |
Year of Birth | Funds, Inc. | Served(1) | Five Years | Director | Director |
| Independent Directors: | | | | | |
| | | | | | |
| Jay Loewi | Director | Since | Chief Executive | 2 | None |
| Birth date: 1957 | | May 2007 | Officer, QTI | | |
| | | | Group (staffing | | |
| | | | company), since | | |
| | | | November 2007; | | |
| | | | President, QTI | | |
| | | | Group of | | |
| | | | Companies, | | |
| | | | since 2002. | | |
| | | | | | |
| Harlan J. | Director | Since | Chief Financial | 2 | None |
| Moeckler | | June 2017 | Officer and | | |
| Birth date: 1957 | | | Treasurer of | | |
| | | | TradeLink Holdings | | |
| | | | LLC (alternative | | |
| | | | investment and | | |
| | | | proprietary | | |
| | | | trading firm) | | |
| | | | since 2006. | | |
| | | | | | |
| Patrick J. Quinn | Director | Since | Currently Retired; | 2 | National |
| Birth date:1949 | | May 2007 | President and | | Presto |
| | | | Chairman of the | | Industries |
| | | | Board of Ayres | | since May |
| | | | Associates | | 2001. |
| | | | (professional civil | | |
| | | | engineering firm), | | |
| | | | from April 2000 | | |
| | | | until retirement | | |
| | | | in December 2010. | | |
| | | | | | |
| Roy S. | Director | Since | Currently Retired; | 2 | None |
| Schlachtenhaufen | | June 2017 | Senior Portfolio | | |
| Birth date: 1949 | | | Manager at US | | |
| | | | Bancorp Investments, | | |
| | | | Inc. (wealth | | |
| | | | management firm) | | |
| | | | from 1991 until | | |
| | | | retirement in | | |
| | | | April 2017. | | |
Additional Information (Unaudited) (Continued)
| | | | | Number of | |
| | Position(s) | Term of | | Portfolios | |
| | Held with | Office and | Principal | in Fund | Other |
| Name, | Wisconsin | Length | Occupation(s) | Complex | Directorships |
| Address and | Capital | of Time | During Past | Overseen by | Held by |
Year of Birth | Funds, Inc. | Served(1) | Five Years | Director | Director |
| Interested Directors and Officers: | | | | |
| Thomas G. | Director, | Since | President of | 2 | None |
Plumb(2)(3) | Chairman, | May 2007 | Wisconsin Capital | | |
| Birth date:1952 | President | | Management, LLC, | | |
| | and Chief | | since January 2004; | | |
| | Executive | | President and | | |
| | Officer | | Principal of SVA | | |
| | Secretary | Since | Plumb Wealth | | |
| | | August 1, | Management, LLC | | |
| | | 2017 | from March 2011 – | | |
| | | | March 2019; President | | |
| | | | of SVA Plumb Financial, | | |
| | | | LLC (financial and trust | | |
| | | | services firm) from | | |
| | | | March 2011 – March 2019; | | |
| | | | CEO of SVA Plumb Trust | | |
| | | | Company from March | | |
| | | | 2011 – March 2019. | | |
| Nathan M. | Director | Since | Principal of Custer | 2 | None |
Plumb(3) | Chief | January | Plumb Financial | | |
| Birth date: 1975 | Financial | 2017 | Services; Chief | | |
| | Officer and | Since | Operating Officer, | | |
| | Treasurer | August 1, | Vice President, and | | |
| | | 2017 | Corporate Secretary | | |
| | | | of Wisconsin Capital | | |
| | | | Management, LLC | | |
| | | | from January 2015 | | |
| | | | to December 2016; | | |
| | | | Portfolio Manager of | | |
| | | | Wisconsin Capital | | |
| | | | Management, LLC | | |
| | | | from September 2013 | | |
| | | | to December 2016; | | |
| | | | Assistant Portfolio | | |
| | | | Manager of Wisconsin | | |
| | | | Capital Management, | | |
| | | | LLC from 2010 to | | |
| | | | September 2013; | | |
| | | | Associate Financial | | |
| | | | Consultant of SVA | | |
| | | | Plumb Wealth | | |
| | | | Management, LLC | | |
| | | | from March 2011 | | |
| | | | to December 2014. | | |
Additional Information (Unaudited) (Continued)
| | | | | Number of | |
| | Position(s) | Term of | | Portfolios | |
| | Held with | Office and | Principal | in Fund | Other |
| Name, | Wisconsin | Length | Occupation(s) | Complex | Directorships |
| Address and | Capital | of Time | During Past | Overseen by | Held by |
Year of Birth | Funds, Inc. | Served(1) | Five Years | Director | Director |
| Bonnie | Chief | Since | State Analyst, | N/A | N/A |
| Romani | Compliance | August 1, | American Family | | |
| Birth date: 1970 | Officer | 2018 | Insurance, from | | |
| | | | February, 2006 | | |
| | | | through March, | | |
| | | | 2018. | | |
The address of each Director and Officer as it relates to the Funds is 8401 Excelsior Drive, Suite 102, Madison, WI 53717.
| (1) | Officers of the Funds serve one-year terms, subject to annual reappointment by the Board of Directors. Directors of the Funds serve a term of indefinite length until their resignation or removal, and stand for re-election by shareholders as and when required under the 1940 Act. |
| (2) | Thomas G. Plumb is an “interested person” of the Funds by virtue of his positions with the Funds and the Advisor. |
| (3) | Nathan M. Plumb is the son of Thomas G. Plumb. Nathan M. Plumb is an “interested person” of the Funds by virtue of this relationship to Thomas G. Plumb. |
Additional Information (Unaudited) (Continued)
The Board of Directors of the Funds has an audit committee and a nominating committee. The audit committee consults with the independent auditors for the Funds on matters pertaining to their audits of the Funds’ annual financial statements and approves all audit and non-audit services to be provided by the independent auditors. The audit committee has adopted a written charter, which is available upon request. The audit committee consists of Jay Loewi, Harlan Moeckler (Chair), Patrick J. Quinn and Roy Schlachtenhaufen none of whom is an “interested” person of the Funds. Messers. Moeckler and Schlachtenhaufen were appointed to the committee concurrent with their election by the shareholders to the Board of Directors on June 1, 2017. Harlan J. Moeckler has been determined by the Board to be an audit committee financial expert.
The nominating committee considers and recommends nominees for directors to the Board to fill vacancies and for election and re-election as and when required. All nominations of directors who are not “interested persons” of the Funds must be made and approved by the nominating committee. The nominating committee has not established any specific, minimum qualifications or standards for director nominees. The nominating committee has adopted a written charter, which is available upon request. No policy or procedure has been established as to the recommendation of director nominees by shareholders, except that nominations of directors who are not “interested persons” of the Funds must be made and approved by the nominating committee. The nominating committee consists of Jay Loewi (Chair), Harlan Moeckler, Patrick J. Quinn and Roy Schlachtenhaufen none of whom is an “interested” person of the Funds. Messers. Moeckler and Schlachtenhaufen were appointed to the committee concurrent with their election by the shareholders to the Board of Directors on June 1, 2017.
The Fund’s Statement of Additional Information includes additional information about the directors of the Company and is available, without charge, at www.plumbfunds.com or upon request, by calling 1-866-987-7888.
2. QUALIFIED DIVIDEND INCOME/DIVIDENDS RECEIVED DEDUCTION
For the fiscal year ended March 31, 2019, certain dividends paid by the Funds may be subject to a maximum tax rate of 23.8% (which includes 3.8% Medicare tax). The percentage of dividends declared from ordinary income designated as qualified dividend income was as follows:
| | Plumb Balanced Fund | 100.00% | |
| | Plumb Equity Fund | 40.10% | |
For corporate shareholders, the percent of ordinary income distributions qualifying for the corporate dividends-received deduction for the fiscal year ended March 31, 2018, was as follows:
| | Plumb Balanced Fund | 100.00% | | |
| | Plumb Equity Fund | 39.52% | | |
(This Page Intentionally Left Blank.)
WISCONSIN CAPITAL FUNDS, INC.
c/o U.S. Bank Global Fund Services
P.O. Box 701
Milwaukee, WI 53201-0701
1-866-987-7888
INVESTMENT ADVISOR
Wisconsin Capital Management, LLC
8401 Excelsior Drive, Suite 102
Madison, WI 53717
Telephone: (608) 960-4616
DISTRIBUTOR
Quasar Distributors, LLC
777 East Wisconsin Avenue
Milwaukee, WI 53202
CUSTODIAN
U.S. Bank National Association
1555 N. Rivercenter Drive
MK-WI-5302
Milwaukee, WI 53212
TRANSFER AGENT AND
DIVIDEND DISBURSING AGENT
U.S. Bank Global Fund Services
615 East Michigan Street
Milwaukee, WI 53202
INDEPENDENT REGISTERED PUBLIC ACCOUNTING FIRM
Cohen & Company, Ltd.
1350 Euclid Avenue, Suite 800
Cleveland, OH 44115
LEGAL COUNSEL
Quarles & Brady LLP
411 East Wisconsin Avenue
Milwaukee, WI 53202
This report has been prepared for shareholders and may be distributed to others only if preceded or accompanied by a current prospectus.
The Funds’ Statement of Additional Information contains additional information about the Funds’ directors and officers and is available, without charge, at www.plumbfunds.com or upon request by calling 1-866-987-7888.
The Funds’ Proxy Voting Policies and Procedures are available without charge upon request by calling 1-866-987-7888 and on the SEC’s website at www.sec.gov. Information regarding how the Funds voted proxies relating to portfolio securities during the 12-month period ended June 30, 2018 is available by calling 1-866-987-7888 and on the SEC’s website at www.sec.gov.
The Funds’ complete schedule of portfolio holdings for the first and third quarters is filed with the SEC on Form N-Q. The Funds’ Form N-Q is available on the SEC’s website at www.sec.gov.
Item 2. Code of Ethics.
The registrant has adopted a code of ethics that applies to the registrant’s principal executive officer and principal financial officer. The registrant’s Code of Ethics, as defined in Item 2(b) of Form N-CSR, and any amendments or waivers thereto are available on the registrant’s website at www.plumbfunds.com.
Item 3. Audit Committee Financial Expert.
The registrant’s board of directors has determined that there is at least one audit committee financial expert serving on its audit committee. Harlan Moeckler is the “audit committee financial expert” and is considered to be “independent” as each term is defined in Item 3 of Form N‑CSR.
Item 4. Principal Accountant Fees and Services.
The registrant has engaged its principal accountant to perform audit services, audit-related services, tax services and other services during the past two fiscal years. “Audit services” refer to performing an audit of the registrant's annual financial statements or services that are normally provided by the accountant in connection with statutory and regulatory filings or engagements for those fiscal years. “Audit-related services” refer to the assurance and related services by the principal accountant that are reasonably related to the performance of the audit. “Tax services” refer to professional services rendered by the principal accountant for tax compliance, tax advice, and tax planning. The following table details the aggregate fees billed or expected to be billed for each of the last two fiscal years for audit fees, audit-related fees, tax fees and other fees by the principal accountant.
| | FYE 3/31/2019
| FYE 3/31/2018 |
| Audit Fees | $24,800 | $24,800 |
| Audit-Related Fees | $0 | $0 |
| Tax Fees | $5,000 | $5,000 |
| All Other Fees | $1,500 | $1,000 |
The audit committee has adopted pre-approval policies and procedures that require the audit committee to pre‑approve all audit and non‑audit services of the registrant, including services provided to any entity affiliated with the registrant.
The percentage of fees billed by Cohen & Co applicable to non-audit services pursuant to waiver of pre-approval requirement were as follows:
| | FYE 3/31/2019 | FYE 3/31/2018 |
| Audit-Related Fees | 0% | 0% |
| Tax Fees | 0% | 0% |
| All Other Fees | 0% | 0% |
All of the principal accountant’s hours spent on auditing the registrant’s financial statements were attributed to work performed by full‑time permanent employees of the principal accountant.
The following table indicates the non-audit fees billed or expected to be billed by the registrant’s accountant for services to the registrant and to the registrant’s investment adviser (and any other controlling entity, etc.—not sub-adviser) for the last two years. The audit committee of the board of trustees/directors has considered whether the provision of non-audit services that were rendered to the registrant's investment adviser is compatible with maintaining the principal accountant's independence and has concluded that the provision of such non-audit services by the accountant has not compromised the accountant’s independence.
| Non-Audit Related Fees | FYE 3/31/2019 | FYE 3/31/2018 |
| Registrant | $1,500 | $1,500 |
| Registrant’s Investment Adviser | $0 | $0 |
Item 5. Audit Committee of Listed Registrants.
Not applicable to registrants who are not listed issuers (as defined in Rule 10A-3 under the Securities Exchange Act of 1934).
Item 6. Investments.
| (a) | Schedule of Investments is included as part of the report to shareholders filed under Item 1 of this Form. |
Item 7. Disclosure of Proxy Voting Policies and Procedures for Closed-End Management Investment Companies.
Not applicable to open-end investment companies.
Item 8. Portfolio Managers of Closed-End Management Investment Companies.
Not applicable to open-end investment companies.
Item 9. Purchases of Equity Securities by Closed‑End Management Investment Company and Affiliated Purchasers.
Not applicable to open-end investment companies.
Item 10. Submission of Matters to a Vote of Security Holders.
There have been no material changes to the procedures by which shareholders may recommend nominees to the registrant’s board of directors.
Item 11. Controls and Procedures.
| (a) | The Registrant’s President and Principal Financial Officer have reviewed the Registrant's disclosure controls and procedures (as defined in Rule 30a-3(c) under the Investment Company Act of 1940 (the “Act”)) as of a date within 90 days of the filing of this report, as required by Rule 30a-3(b) under the Act and Rules 13a-15(b) or 15d‑15(b) under the Securities Exchange Act of 1934. Based on their review, such officers have concluded that the disclosure controls and procedures are effective in ensuring that information required to be disclosed in this report is appropriately recorded, processed, summarized and reported and made known to them by others within the Registrant and by the Registrant’s service provider. |
| (b) | There were no changes in the Registrant's internal control over financial reporting (as defined in Rule 30a-3(d) under the Act) that occurred during the second fiscal quarter of the period covered by this report that have materially affected, or are reasonably likely to materially affect, the Registrant's internal control over financial reporting. |
Item 12. Disclosure of Securities Lending Activities for Closed-End Management Investment Companies
Not applicable to open-end investment companies.
Item 13. Exhibits.
| (a) | (1) Any code of ethics or amendment thereto, that is the subject of the disclosure required by Item 2, to the extent that the registrant intends to satisfy Item 2 requirements through filing an exhibit. Not applicable due to availability through the registrant's website.
|
(2) A separate certification for each principal executive officer and principal financial officer pursuant to Section 302 of the Sarbanes-Oxley Act of 2002. Filed herewith.
(3) Any written solicitation to purchase securities under Rule 23c‑1 under the Act sent or given during the period covered by the report by or on behalf of the registrant to 10 or more persons. Not applicable to open-end investment companies.
(4) There was no change in the registrant’s independent public accountant for the period covered by this report.
| (b) | Certifications pursuant to Section 906 of the Sarbanes‑Oxley Act of 2002. Furnished herewith. |
SIGNATURES
Pursuant to the requirements of the Securities Exchange Act of 1934 and the Investment Company Act of 1940, the registrant has duly caused this report to be signed on its behalf by the undersigned, thereunto duly authorized.
(Registrant) Wisconsin Capital Funds, Inc.
By (Signature and Title)* /s/Thomas G. Plumb
Thomas G. Plumb, President (Principal Executive Officer)
Date June 7, 2019
Pursuant to the requirements of the Securities Exchange Act of 1934 and the Investment Company Act of 1940, this report has been signed below by the following persons on behalf of the registrant and in the capacities and on the dates indicated.
By (Signature and Title)* /s/Thomas G. Plumb
Thomas G. Plumb, President (Principal Executive Officer)
Date June 7, 2019
By (Signature and Title)* /s/Nathan Plumb
Nathan Plumb, Chief Financial Officer (Principal Financial Officer)
Date June 7, 2019
* Print the name and title of each signing officer under his or her signature.