Plumb Balanced Fund
Investor Shares (PLBBX)
Institutional Shares (PLIBX)
Class A Shares (PLABX)
Plumb Equity Fund
Investor Shares (PLBEX)
Institutional Shares (PLIEX)
Class A Shares (PLAEX)
ANNUAL REPORT
March 31, 2021
www.plumbfunds.com
March 31, 2021
Dear Fellow Shareholders,
We are pleased to present the annual report dated March 31, 2021 for the Plumb Funds. The world lapped the anniversary of the initial pandemic breakout in the first quarter of 2021. We all recognize that in some ways the world will never be the same. But, as throughout history, a new normal replaces the old and we start to adjust to new realities. The stock and bond markets have been barometers reflecting change. That is why our stock portfolio emphasis is focused on identifying disruptive changes and the drivers, enablers, and beneficiaries of major innovations. We then drill down into projected growth rates, profit margins, cash flow, sustainability, and valuations.
The pandemic accelerated the adoption of many technologies and behavioral changes that were already quite strong before the crisis started. Virtual shopping, digital wallet, streaming entertainment and business meetings, cloud data storage, virtualization, software as a service business models that enhance security, reduce processing time and expense, etc. all were quite developed and immediately able to fill voids left by the economic shutdowns.
It also accelerated the process of reducing the footprint of brick-and-mortar retailers, made the very competitive restaurant industry even tougher to survive and increased the economic divide between economies and within economies. So, while China and much of the United States is poised for significant economic recovery in 2021, Europe and the emerging economies are still under significant pressure with muted recovery prospects for this year.
The bond market reflects supply and demand, like all other markets. In the United States government fiscal and monetary policies set the stage. The Federal Reserve has pledged to remain accommodative (keeping interest rates low) in its policies well into next year and possibly beyond. But while their initial actions last year drove down rates along the entire maturity spectrum, we have seen ten-year Treasury yields pick up over 1% since last summer.
The United States stock markets reflected optimism over the developing recovery with the Dow Jones Industrial Average, the S&P 500 and NASDAQ all showing single digit returns for the first quarter and over 50% returns over the last twelve months.1,2 As the focus of investors turned to cyclical recovery plays, the growth stocks that served us so well last year took a rest in the first part of calendar 2021. Please review the Plumb Fund Fact sheets under “Literature” at plumbfunds.com. We are very proud that both Funds have provided returns exceeding their benchmarks for the one, three, five and ten year periods ending March 31, 2021.
___________________
1 | https://ycharts.com/indicators/sp_500_12_month_total_return |
2 | https://www.nasdaq.com/articles/a-very-strong-q1-and-2021-earnings-picture-2021-03-26 |
We believe that the worldwide recovery from the pandemic induced economic shutdown will continue for the rest of 2021, albeit unevenly and not universally. For example, it is estimated that five percent of all home mortgages are still in forbearance programs. Some people, companies and countries will come back stronger than ever while some will have a very difficult time dealing with deficiencies, debt levels and structural problems that became more exposed during the crisis.
We are still trying to identify and hold long-term winners with our equity investments and are generally keeping fixed income exposure limited to shorter duration investment grade bonds. We believe this has the potential to continue to benefit you as the year progresses.
We hope you, your family, friends and colleagues stay safe through all of this.
Thomas G. Plumb
SPXT-S&P 500 Total Return Index. S&P 500 is an unmanaged index which is widely regarded as the standard for measuring large-cap U.S. stock market performance. Calculated intraday by S&P based on the price changes and reinvested dividends of SPX with a starting date of Jan 4, 1988.
Nasdaq is a global electronic marketplace for buying and selling securities. Nasdaq was created by the National Association of Securities Dealers (NASD) to enable investors to trade securities on a computerized, speedy, and transparent system, and commenced operations on February 8, 1971.
It is not possible to invest directly in an index.
Past performance does not guarantee future results.
Opinions expressed are those of the author and are subject to change, are not intended to be a forecast of future events, a guarantee of future results, nor investment advice.
Mutual fund investing involves risk. Principal loss is possible.
The fund may invest in small and mid-sized companies which involve additional risks such as limited liquidity and greater volatility. The funds invest in foreign securities which involve greater volatility and political, economic and currency risks and differences in accounting methods. Because the funds may invest in ETFs, they are subject to additional risks that do not apply to conventional mutual funds, including the risks that the market price of an ETF’s shares may trade at a discount to its net asset value (“NAV”), an active secondary trading market may not develop or be maintained, or trading may be halted by the exchange in which they trade, which may impact a fund’s ability to sell its
shares. The fund may also use options and future contracts, which have the risks of unlimited losses of the underlying holdings due to unanticipated market movements and failure to correctly predict the direction of securities prices, interest rates and currency exchange rates. The investment in options is not suitable for all investors. The Plumb Balanced Fund will invest in debt securities, which typically decrease in value when interest rates rise. This risk is usually greater for longer-term debt securities.
Fund holdings are subject to change at any time and should not be considered a recommendation to buy or sell any security.
Plumb Funds are distributed by Quasar Distributors, LLC, distributor.
Expense Example
March 31, 2021 (Unaudited)
As a shareholder of the Plumb Funds (the “Funds”), you incur two types of costs: (1) transaction costs, including sales charges (loads) on purchase payments and redemption fees (for Class A Shares); and (2) ongoing costs, including investment advisory fees; distribution (12b-1) fees; and other fund expenses. This example is intended to help you understand your ongoing costs (in dollars) of investing in the Funds and to compare these costs with the ongoing costs of investing in other mutual funds.
The Example is based on an investment of $1,000 invested at the beginning of the period and held for the entire period (October 1, 2020 – March 31, 2021).
Actual Expenses
The first line of the table on the following page provides information about actual account values and actual expenses. However, the table does not include shareholder-specific fees such as the $15.00 fee charged for wire redemptions. The table also does not include portfolio trading commissions and related trading costs. You may use the information in this line, together with the amount you invested, to estimate the expenses that you paid over the period. Simply divide your account value by $1,000 (for example, an $8,600 account value divided by $1,000 = 8.6), then multiply the result by the number in the first line under the heading entitled “Expenses Paid During the Period” to estimate the expenses you paid on your account during this period.
Hypothetical Example for Comparison Purposes
The second line of the table on the following page provides information about hypothetical account values and hypothetical expenses based on the Fund’s actual expense ratio and an assumed rate of return of 5% per year before expenses, which is not the Fund’s actual return. The hypothetical account values and expenses may not be used to estimate the actual ending account balanced or expenses you paid for the period. You may use this information to compare the ongoing costs of investing in the Funds and other funds. To do so, compare this 5% hypothetical example with the 5% hypothetical examples that appear in the shareholder reports of the other funds
Please note that the expenses shown in the table are meant to highlight your ongoing costs only and do not reflect any transactional costs, such as sales charges (loads), redemption fees, or exchange fees, which, although not charged by the Funds, may be charged by other funds. Therefore, the second line of the table is useful in comparing ongoing costs only, and will not help you determine the relative costs of owning different funds. In addition, if these transactional costs were included, your costs would have been higher.
Expense Example
March 31, 2021 (Unaudited) (Continued)
Plumb Balanced Fund
| | | Ending | |
| | Beginning | Account Value | Expenses Paid |
| | Account Value | March 31, 2021 | During the Period |
| Actual – | | | |
Investor Shares(1) | $1,000.00 | $1,084.20 | $6.18 |
Institutional Shares(2) | $1,000.00 | $1,085.50 | $5.15 |
Class A Shares(3) | $1,000.00 | $ 951.30 | $1.59 |
| | | | |
| Hypothetical – | | | |
Investor Shares(4) | $1,000.00 | $1,019.00 | $5.99 |
Institutional Shares(5) | $1,000.00 | $1,020.00 | $4.99 |
Class A Shares(6) | $1,000.00 | $1,038.10 | $6.05 |
| (1) | Expenses are equal to the Fund’s annualized six-month expense ratio of 1.19%, multiplied by the average account value over the period, multiplied by 182/365 (to reflect the partial year period). |
| (2) | Expenses are equal to the Fund’s annualized six-month expense ratio of 0.99%, multiplied by the average account value over the period, multiplied by 182/365 (to reflect the partial year period). |
| (3) | The Inception date for the Plumb Balanced Fund Class A Shares was February 8, 2021. Expenses are equal to the Fund’s annualized expense ratio of 1.19%, multiplied by the average account value over the period, multiplied by 50/365 (to reflect the partial year period). |
| (4) | Assumes 5% return per year before expenses. Expenses are equal to the Fund’s annualized six-month expense ratio of 1.19%, multiplied by the average account value over the period, multiplied by 182/365 (to reflect the partial year period). |
| (5) | Assumes 5% return per year before expenses. Expenses are equal to the Fund’s annualized six-month expense ratio of 0.99%, multiplied by the average account value over the period, multiplied by 182/365 (to reflect the partial year period). |
| (6) | Assumes 5% return per year before expenses. Expenses are equal to the Fund’s annualized expense ratio of 1.19%, multiplied by the average account value over the period, multiplied by 50/365 (to reflect the partial year period). |
Expense Example
March 31, 2021 (Unaudited) (Continued)
Plumb Equity Fund
| | | Ending | |
| | Beginning | Account Value | Expenses Paid |
| | Account Value | March 31, 2021 | During the Period |
| Actual – | | | |
Investor Shares(1) | $1,000.00 | $1,137.00 | $6.34 |
Institutional Shares(2) | $1,000.00 | $1,138.10 | $5.28 |
Class A Shares(3) | $1,000.00 | $ 925.70 | $1.57 |
| | | | |
| Hypothetical – | | | |
Investor Shares(4) | $1,000.00 | $1,019.00 | $5.99 |
Institutional Shares(5) | $1,000.00 | $1,020.00 | $4.99 |
Class A Shares(6) | $1,000.00 | $1,038.10 | $6.05 |
| (1) | Expenses are equal to the Fund’s annualized six-month expense ratio of 1.19%, multiplied by the average account value over the period, multiplied by 182/365 (to reflect the partial year period). |
| (2) | Expenses are equal to the Fund’s annualized six-month expense ratio of 0.99%, multiplied by the average account value over the period, multiplied by 182/365 (to reflect the partial year period). |
| (3) | The Inception date for the Plumb Equity Fund Class A Shares was February 8, 2021. Expenses are equal to the Fund’s annualized expense ratio of 1.19%, multiplied by the average account value over the period, multiplied by 50/365 (to reflect the partial year period). |
| (4) | Assumes 5% return per year before expenses. Expenses are equal to the Fund’s annualized six-month expense ratio of 1.19%, multiplied by the average account value over the period, multiplied by 182/365 (to reflect the partial year period). |
| (5) | Assumes 5% return per year before expenses. Expenses are equal to the Fund’s annualized six-month expense ratio of 0.99%, multiplied by the average account value over the period, multiplied by 182/365 (to reflect the partial year period). |
| (6) | Assumes 5% return per year before expenses. Expenses are equal to the Fund’s annualized expense ratio of 1.19%, multiplied by the average account value over the period, multiplied by 50/365 (to reflect the partial year period). |
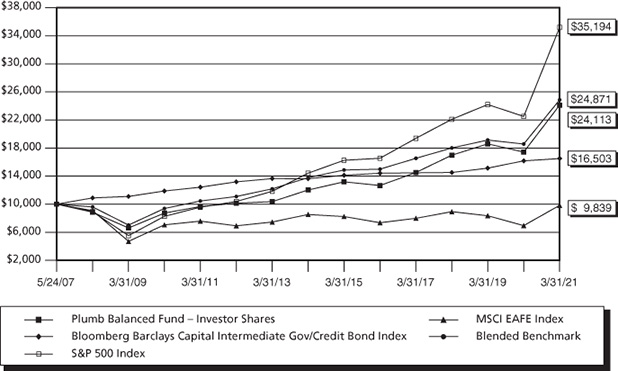
Plumb Balanced Fund (Unaudited)
Comparison of Change in Value of a Hypothetical $10,000 Investment
from inception of May 24, 2007 to March 31, 2021
Average Annual Rate of Return
Periods ended March 31, 2021
| | 1 Year | 3 Year | 5 Year | 10 Year | Since Inception |
| Plumb Balanced Fund – | | | | | |
| Investor Shares | 38.35% | 12.39% | 13.76% | 9.57% | 6.56% |
| Plumb Balanced Fund – | | | | | |
| Institutional Shares* | 38.68% | 12.92% | 13.99% | 9.79% | 6.77% |
| Plumb Balanced Fund – | | | | | |
| Class A Shares | | | | | |
| (w sales charge)** | 30.39% | 10.18% | 12.42% | 8.92% | 6.10% |
| Plumb Balanced Fund – | | | | | |
| Class A Shares | | | | | |
| (w/o sales charge)** | 38.35% | 12.39% | 13.76% | 9.57% | 6.56% |
| Bloomberg Barclays | | | | | |
| Capital Intermediate | | | | | |
| Government/Credit | | | | | |
| Bond Index | 2.01% | 4.36% | 2.75% | 2.88% | 3.68% |
| MSCI EAFE Index | 41.60% | 3.26% | 5.98% | 2.64% | -0.12%
|
| S&P 500 Index | 56.35% | 16.78% | 16.29% | 13.91%
| 9.51% |
| Blended Benchmark | 33.89% | 11.35% | 10.65% | 9.06% | 6.80% |
| * | Performance shown for the Institutional Shares prior to its inception on August 1, 2020 reflects the performance of the Investor Shares adjusted for the fees and expenses of the Institutional Shares. |
| ** | Performance shown for the Class A Shares prior to its inception on February 8, 2021 reflects the performance of the Investor Shares adjusted for the fees and expenses of the Class A Shares and sales charge of 5.75% |
Per the prospectus dated February 5, 2021, the gross expense ratios are 1.19%, 0.95% and 1.19% for the Investor Shares, Institutional Shares and Class A Shares, respectively.
Performance data quoted represents past performance and does not guarantee future results. The investment return and principal value of an investment will fluctuate so that an investor’s shares, when redeemed, may be worth more or less than their original cost. Current performance of the Fund may be lower or higher than the performance quoted. Performance data current to the most recent month end may be obtained by calling 1-866-987-7888.
The line graph and performance table do not reflect the deduction of taxes that a shareholder may pay on fund distributions or the redemption of fund shares. Total return calculations reflect expense reimbursements and fee waivers.
The Barclays Capital Intermediate Government/Credit Bond Index is an unmanaged index which includes nonconvertible bonds publicly issued by the U.S. government or its agencies; corporate bonds guaranteed by the U.S. government and quasi-federal corporations; and publicly issued, fixed rate, nonconvertible domestic bonds of companies in industry, public utilities, and finance.
The MSCI EAFE Index in an index intended to reflect the performance of major developed countries’ international equity markets, besides the United States and Canada.
The Standard & Poor’s 500 Index (S&P 500) is an unmanaged, capitalization-weighted index generally representative of the U.S. market for large capitalization stocks.
The Blended Benchmark is made up of 55% S&P 500 Index, 35% Barclays Capital Intermediate Government/Credit Bond Index, and 10% MSCI EAFE Index.
The Fund’s portfolio holdings may differ significantly from the securities held in the relevant index and, unlike a mutual fund, an unmanaged index assumes no transaction costs, taxes, management fees or other expenses. You cannot invest directly in an index.
Plumb Equity Fund (Unaudited)
Comparison of Change in Value of a Hypothetical $10,000 Investment
from inception of May 24, 2007 to March 31, 2021
Average Annual Rate of Return
Periods ended March 31, 2021
| | 1 Year | 3 Year | 5 Year | 10 Year | Since Inception |
| Plumb Equity Fund – | | | | | |
| Investor Shares | 59.42% | 16.45% | 20.54% | 13.09% | 8.50% |
| Plumb Equity Fund – | | | | | |
| Institutional Shares* | 59.78% | 16.70% | 20.78% | 13.31% | 8.72% |
| Plumb Equity Fund – | | | | | |
| Class A Shares | | | | | |
| (w sales charge)** | 50.24% | 14.17% | 19.12% | 12.42% | 8.04% |
| Plumb Equity Fund – | | | | | |
| Class A Shares | | | | | |
| (w/o sales charge)** | 59.42% | 16.45% | 20.54% | 13.09% | 8.50% |
| S&P 500 Index | 56.35% | 16.78% | 16.29% | 13.91% | 9.51% |
| MSCI EAFE Index | 41.60% | 3.26% | 5.98% | 2.64% | -0.12%
|
| Blended Benchmark | 54.86% | 15.39% | 15.25% | 12.76% | 8.54% |
| * | | Performance shown for the Institutional Shares prior to its inception on August 1, 2020 reflects the performance of the Investor Shares adjusted for the fees and expenses of the Institutional Shares. |
| ** | | Performance shown for the Class A Shares prior to its inception on February 8, 2021 reflects the performance of the Investor Shares adjusted for the fees and expenses of the Class A Shares and sales charge of 5.75%. |
Per the prospectus dated February 5, 2021, the gross expense ratios are 1.44%, 1.22% and 1.44% for the Investor Shares, Institutional Shares and Class A Shares, respectively.
Performance data quoted represents past performance and does not guarantee future results. The investment return and principal value of an investment will fluctuate so that an investor’s shares, when redeemed, may be worth more or less than their original cost. Current performance of the Fund may be lower or higher than the performance quoted. Performance data current to the most recent month end may be obtained by calling 1-866-987-7888.
The line graph and performance table do not reflect the deduction of taxes that a shareholder may pay on fund distributions or the redemption of fund shares. Total return calculations reflect expense reimbursements and fee waivers.
The Standard & Poor’s 500 Index (S&P 500) is an unmanaged, capitalization-weighted index generally representative of the U.S. market for large capitalization stocks.
The MSCI EAFE Index in an index intended to reflect the performance of major developed countries’ international equity markets, besides the United States and Canada.
The Blended Benchmark is made up of 90% S&P 500 Index and 10% MSCI EAFE Index.
The Fund’s portfolio holdings may differ significantly from the securities held in the relevant index and, unlike a mutual fund, an unmanaged index assumes no transaction costs, taxes, management fees or other expenses. You cannot invest directly in an index.
Plumb Balanced Fund
Investments by Industry Sector as of March 31, 2021
(as a Percentage of Total Investments) (Unaudited)
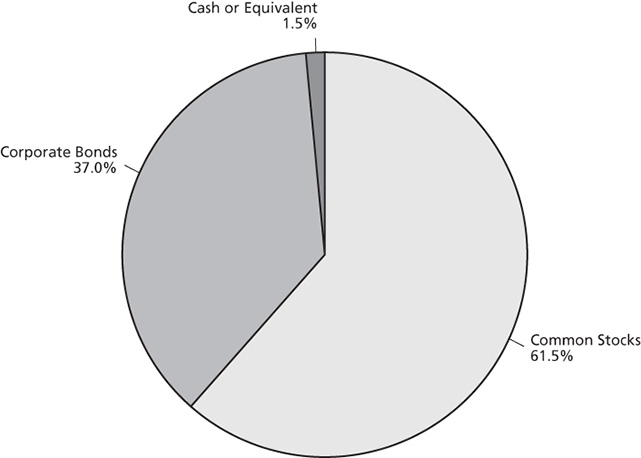
Plumb Balanced Fund
Investments by Asset Allocation as of March 31, 2021
(as a Percentage of Total Investments) (Unaudited)
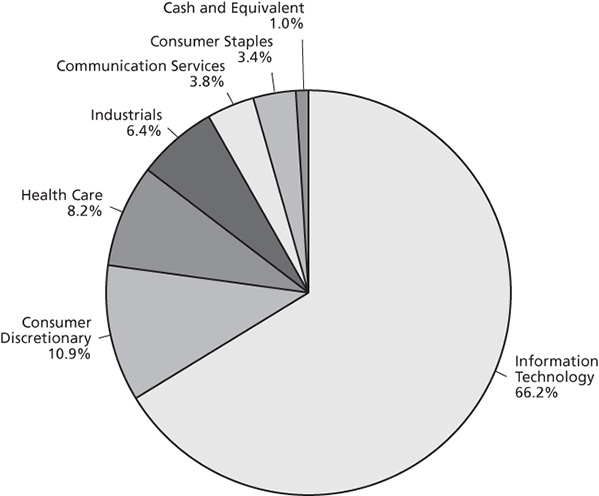
Plumb Equity Fund
Investments by Industry Sector as of March 31, 2021
(as a Percentage of Total Investments) (Unaudited)
The Global Industry Classification Standard (GICS®) was developed by and/or is the exclusive property of MSCI, Inc. (“MSCI”) and Standard & Poor’s Financial Services LLC (“S&P”). GICS is a service mark of MSCI and S&P and has been licensed for use by U.S. Bank Global Fund Services.
Plumb Balanced Fund
Schedule of Investments – March 31, 2021
| | | Shares | | | Value | |
| COMMON STOCKS – 62.11% | | | | | | |
| | | | | | | |
| Banks – 1.34% | | | | | | |
| JPMorgan Chase & Co. | | | 12,500 | | | $ | 1,902,875 | |
| | | | | | | | | |
| Capital Goods – 2.61% | | | | | | | | |
| Lockheed Martin Corp. | | | 10,000 | | | | 3,695,000 | |
| | | | | | | | | |
| Commercial & Professional Services – 1.84% | | | | | | | | |
| Copart, Inc. (a) | | | 24,000 | | | | 2,606,640 | |
| | | | | | | | | |
| Diversified Financials – 1.34% | | | | | | | | |
| Discover Financial Services | | | 20,000 | | | | 1,899,800 | |
| | | | | | | | | |
| Food, Beverage & Tobacco – 2.26% | | | | | | | | |
| Constellation Brands, Inc. – Class A | | | 14,000 | | | | 3,192,000 | |
| | | | | | | | | |
| Health Care Equipment & Services – 2.55% | | | | | | | | |
| Guardant Health, Inc. (a) | | | 14,000 | | | | 2,137,100 | |
| Intuitive Surgical, Inc. (a) | | | 2,000 | | | | 1,477,880 | |
| | | | | | | | 3,614,980 | |
| Media & Entertainment – 2.04% | | | | | | | | |
| Alphabet, Inc. – Class A (a) | | | 1,400 | | | | 2,887,528 | |
| | | | | | | | | |
| Pharmaceuticals, Biotechnology & Life Sciences – 1.30% | | | | | | | | |
| Exact Sciences Corp. (a) | | | 14,000 | | | | 1,844,920 | |
| | | | | | | | | |
| Retailing – 6.83% | | | | | | | | |
| Alibaba Group Holding Ltd. ADR (a)(b) | | | 13,000 | | | | 2,947,490 | |
| Amazon.com, Inc. (a) | | | 1,100 | | | | 3,403,488 | |
| MercadoLibre, Inc. (a) | | | 2,250 | | | | 3,312,315 | |
| | | | | | | | 9,663,293 | |
| Semiconductors & Semiconductor Equipment – 3.13% | | | | | | | | |
| NVIDIA Corp. | | | 8,300 | | | | 4,431,619 | |
| | | | | | | | | |
| Software & Services – 34.28% | | | | | | | | |
| Adobe, Inc. (a) | | | 7,250 | | | | 3,446,432 | |
| Adyen NV – ADR (a)(b) | | | 62,500 | | | | 2,795,625 | |
| ANSYS, Inc. (a) | | | 6,800 | | | | 2,309,008 | |
The accompanying notes are an integral part of these financial statements.
Plumb Balanced Fund
Schedule of Investments – March 31, 2021 (Continued)
| | | Shares | | | Value | |
| COMMON STOCKS (Continued) | | | | | | |
| | | | | | | |
| Software & Services (Continued) | | | | | | |
| Autodesk, Inc. (a) | | | 12,250 | | | $ | 3,395,087 | |
| Coupa Software, Inc. (a) | | | 9,000 | | | | 2,290,320 | |
| Domo, Inc. (a) | | | 38,500 | | | | 2,167,165 | |
| FleetCor Technologies, Inc. (a) | | | 13,500 | | | | 3,626,505 | |
| Mastercard, Inc. – Class A | | | 12,750 | | | | 4,539,638 | |
| Microsoft Corp. | | | 16,700 | | | | 3,937,359 | |
| Mitek Systems, Inc. (a) | | | 135,000 | | | | 1,968,300 | |
| Pagseguro Digital Ltd. – ADR (a)(b) | | | 57,114 | | | | 2,644,378 | |
| PayPal Holdings, Inc. (a) | | | 15,500 | | | | 3,764,020 | |
| Square, Inc. (a) | | | 9,000 | | | | 2,043,450 | |
| Tyler Technologies, Inc. (a) | | | 5,750 | | | | 2,441,048 | |
| Visa, Inc. – Class A | | | 19,000 | | | | 4,022,870 | |
| WEX, Inc. (a) | | | 15,000 | | | | 3,138,300 | |
| | | | | | | | 48,529,505 | |
| Technology Hardware & Equipment – 2.59% | | | | | | | | |
| Apple, Inc. | | | 30,000 | | | | 3,664,500 | |
| TOTAL COMMON STOCKS | | | | | | | | |
| (Cost $54,185,654) | | | | | | | 87,932,660 | |
| | | | | | | | | |
| | | Principal | | | | | |
| | | Amount | | | | | |
| | | | | | | | | |
| CORPORATE BONDS – 37.36% | | | | | | | | |
| | | | | | | | | |
| Automobiles & Components – 0.36% | | | | | | | | |
| Toyota Industries Corp. | | | | | | | | |
| 3.110%, 03/12/2022 (b) | | $ | 500,000 | | | | 511,719 | |
| | | | | | | | | |
| Banks – 11.92% | | | | | | | | |
| BAC Capital Trust XIII | | | | | | | | |
| 4.000%, (3 Month LIBOR USD + 0.400%) | | | | | | | | |
| Perpetual Maturity (c) | | | 1,200,000 | | | | 1,186,500 | |
| Bank of America Corp. | | | | | | | | |
| 1.384%, (3 Month LIBOR USD + 1.160%) | | | | | | | | |
| 01/20/2023 (c) | | | 2,000,000 | | | | 2,015,878 | |
The accompanying notes are an integral part of these financial statements.
Plumb Balanced Fund
Schedule of Investments – March 31, 2021 (Continued)
| | | Principal | | | | |
| | | Amount | | | Value | |
| CORPORATE BONDS (Continued) | | | | | | |
| | | | | | | |
| Banks (Continued) | | | | | | |
| Bank OZK | | | | | | |
| 5.500%, (3 Month LIBOR USD + 4.425%) | | | | | | |
| 07/01/2026 (c) | | $ | 2,985,000 | | | $ | 3,010,964 | |
| Citigroup, Inc. | | | | | | | | |
| 1.292%, (3 Month LIBOR USD + 1.100%) | | | | | | | | |
| 05/17/2024 (c) | | | 2,500,000 | | | | 2,536,797 | |
| 1.568%, (3 Month LIBOR USD + 1.350%) | | | | | | | | |
| 04/25/2024 (c) | | | 500,000 | | | | 507,879 | |
| 4.700%, (SOFR + 3.234%) Perpetual Maturity (c) | | | 600,000 | | | | 605,325 | |
| Home BancShares, Inc. | | | | | | | | |
| 5.625%, (3 Month LIBOR USD + 3.575%) | | | | | | | | |
| 04/15/2027 (c) | | | 2,295,000 | | | | 2,358,333 | |
| JPMorgan Chase & Co. | | | | | | | | |
| 6.750%, (3 Month LIBOR USD + 3.780%) | | | | | | | | |
| Perpetual Maturity (c) | | | 2,325,000 | | | | 2,546,534 | |
| Pinnacle Financial Partners, Inc. | | | | | | | | |
| 4.125%, (3 Month LIBOR USD + 2.775%) | | | | | | | | |
| 09/15/2029 (c) | | | 1,575,000 | | | | 1,569,320 | |
| TriState Capital Holdings, Inc. | | | | | | | | |
| 5.750%, (3 Month LIBOR USD + 5.36%) | | | | | | | | |
| 05/15/2030 (c) | | | 500,000 | | | | 541,561 | |
| | | | | | | | 16,879,091 | |
| Capital Goods – 2.16% | | | | | | | | |
| Carlisle Cos, Inc. | | | | | | | | |
| 3.500%, 12/01/2024 | | | 500,000 | | | | 542,250 | |
| General Electric Co. | | | | | | | | |
| 1.184%, (3 Month LIBOR USD + 1.000%) | | | | | | | | |
| 03/15/2023 (c) | | | 1,000,000 | | | | 1,011,086 | |
| Owens Corning | | | | | | | | |
| 4.200%, 12/15/2022 | | | 1,200,000 | | | | 1,258,553 | |
| Raytheon Technologies Corp. | | | | | | | | |
| 3.100%, 11/15/2021 | | | 250,000 | | | | 252,491 | |
| | | | | | | | 3,064,380 | |
| Diversified Financials – 5.38% | | | | | | | | |
| Discover Financial Services | | | | | | | | |
| 6.125%, (H15T5Y + 5.783%) | | | | | | | | |
| Perpetual Maturity (c) | | | 250,000 | | | | 278,438 | |
The accompanying notes are an integral part of these financial statements.
Plumb Balanced Fund
Schedule of Investments – March 31, 2021 (Continued)
| | | Principal | | | | |
| | | Amount | | | Value | |
| CORPORATE BONDS (Continued) | | | | | | |
| | | | | | | |
| Diversified Financials (Continued) | | | | | | |
| General Motors Financial Co, Inc. | | | | | | |
| 3.450%, 01/14/2022 | | $ | 2,500,000 | | | $ | 2,550,403 | |
The Charles Schwab Corp. 5.375%, (H15T5Y + 4.971%) | | | | | | | | |
| | | | | | | | |
| Perpetual Maturity (c) | | | 1,000,000 | | | | 1,111,000 | |
| The Goldman Sachs Group, Inc. | | | | | | | | |
| 1.938%, (3 Month LIBOR USD + 1.700%) | | | | | | | | |
| 04/05/2026 (c) | | | 1,000,000 | | | | 1,013,179 | |
| Toyota Motor Credit Corp. | | | | | | | | |
| 1.150%, 05/26/2022 | | | 2,625,000 | | | | 2,654,341 | |
| | | | | | | | 7,607,361 | |
| Food, Beverage & Tobacco – 0.75% | | | | | | | | |
| General Mills, Inc. | | | | | | | | |
| 3.150%, 12/15/2021 | | | 450,000 | | | | 455,758 | |
| 3.200%, 04/16/2021 | | | 200,000 | | | | 200,244 | |
| PepsiCo., Inc. | | | | | | | | |
| 0.767%, (3 Month LIBOR USD + 0.530%) | | | | | | | | |
| 10/06/2021 (c) | | | 410,000 | | | | 411,132 | |
| | | | | | | | 1,067,134 | |
| Health Care Equipment & Services – 1.62% | | | | | | | | |
| CVS Pass-Through Trust | | | | | | | | |
| 6.943%, 01/10/2030 | | | 193,012 | | | | 233,143 | |
| Kaiser Foundation Hospitals | | | | | | | | |
| 3.500%, 04/01/2022 | | | 2,000,000 | | | | 2,061,839 | |
| | | | | | | | 2,294,982 | |
| Insurance – 1.15% | | | | | | | | |
| Fidelity National Financial, Inc. | | | | | | | | |
| 5.500%, 09/01/2022 | | | 1,000,000 | | | | 1,068,211 | |
| Old Republic International Corp. | | | | | | | | |
| 4.875%, 10/01/2024 | | | 500,000 | | | | 564,051 | |
| | | | | | | | 1,632,262 | |
| Pharmaceuticals, Biotechnology | | | | | | | | |
| & Life Sciences – 0.91% | | | | | | | | |
| Amgen, Inc. | | | | | | | | |
| 3.625%, 05/15/2022 | | | 1,250,000 | | | | 1,280,542 | |
The accompanying notes are an integral part of these financial statements.
Plumb Balanced Fund
Schedule of Investments – March 31, 2021 (Continued)
| | | Principal | | | | |
| | | Amount | | | Value | |
| CORPORATE BONDS (Continued) | | | | | | |
| | | | | | | |
| Retailing – 2.07% | | | | | | |
| Expedia Group, Inc. | | | | | | |
| 5.000%, 02/15/2026 | | $ | 2,600,000 | | | $ | 2,936,997 | |
| | | | | | | | | |
| Semiconductors & Semiconductor Equipment – 3.62% | | | | | | | | |
| Intel Corp. | | | | | | | | |
| 1.700%, 05/19/2021 | | | 1,200,000 | | | | 1,199,401 | |
| NVIDIA Corp. | | | | | | | | |
| 2.200%, 09/16/2021 | | | 1,245,000 | | | | 1,254,169 | |
| Qorvo, Inc. | | | | | | | | |
| 4.375%, 10/15/2029 | | | 2,500,000 | | | | 2,673,075 | |
| | | | | | | | 5,126,645 | |
| Software & Services – 5.26% | | | | | | | | |
| CDK Global, Inc. | | | | | | | | |
| 4.875%, 06/01/2027 | | | 2,000,000 | | | | 2,093,250 | |
| PayPal Holdings, Inc. | | | | | | | | |
| 2.200%, 09/26/2022 | | | 1,548,000 | | | | 1,588,866 | |
| VeriSign, Inc. | | | | | | | | |
| 4.750%, 07/15/2027 | | | 2,000,000 | | | | 2,126,250 | |
| VMware, Inc. | | | | | | | | |
| 3.900%, 08/21/2027 | | | 1,500,000 | | | | 1,637,754 | |
| | | | | | | | 7,446,120 | |
| Technology Hardware & Equipment – 0.88% | | | | | | | | |
| Motorola Solutions, Inc. | | | | | | | | |
| 4.000%, 09/01/2024 | | | 1,135,000 | | | | 1,243,585 | |
| | | | | | | | | |
| Transportation – 1.28% | | | | | | | | |
| Burlington Northern Santa Fe LLC | | | | | | | | |
| 3.450%, 09/15/2021 | | | 996,000 | | | | 1,002,159 | |
| Union Pacific Corp. | | | | | | | | |
| 3.200%, 06/08/2021 | | | 800,000 | | | | 804,156 | |
| | | | | | | | 1,806,315 | |
| TOTAL CORPORATE BONDS | | | | | | | | |
| (Cost $52,517,804) | | | | | | | 52,897,133 | |
The accompanying notes are an integral part of these financial statements.
Plumb Balanced Fund
Schedule of Investments – March 31, 2021 (Continued)
| | | Shares | | | Value | |
| SHORT TERM INVESTMENT – 1.54% | | | | | | |
| | | | | | | |
| Money Market Fund – 1.54% | | | | | | |
| First American Government Obligations Fund – | | | | | | |
| Class X – 0.04% (d) | | | 2,186,155 | | | $ | 2,186,155 | |
| TOTAL SHORT TERM INVESTMENT | | | | | | | | |
| (Cost $2,186,155) | | | | | | | 2,186,155 | |
| | | | | | | | | |
| Total Investments (Cost $108,889,613) – 101.01% | | | | | | | 143,015,948 | |
| Liabilities in Excess of Other Assets – (1.01)% | | | | | | | (1,429,901 | ) |
| TOTAL NET ASSETS – 100.00% | | | | | | $ | 141,586,047 | |
Percentages are stated as a percent of net assets.
ADR – American Depositary Receipt
H15T5Y – 5 Year Treasury Constant Maturity Rate
LIBOR – London Inter-bank Offered Rate
SOFR – Secured Overnight Financing Rate
| (a) | Non-income producing security. |
| (b) | Foreign issued security. Foreign concentration is as follows: Cayman Islands: 3.95%, Netherlands 1.97%, Japan: 0.36%. |
| (c) | Variable or floating rate security based on a reference index and spread. The rate listed is as of March 31, 2021. |
| (d) | Rate shown is the 7-day effective yield. |
The Global Industry Classification Standard (GICS®) was developed by and/or is the exclusive property of MSCI, Inc. and Standard & Poor’s Financial Services LLC (“S&P”). GICS is a service mark of MSCI and S&P and has been licensed for use by U.S. Bancorp Global Fund Services, LLC.
The accompanying notes are an integral part of these financial statements.
Plumb Equity Fund
Schedule of Investments – March 31, 2021
| | | Shares | | | Value | |
| COMMON STOCKS – 99.18% | | | | | | |
| | | | | | | |
| Capital Goods – 3.19% | | | | | | |
| Lockheed Martin Corp. | | | 3,300 | | | $ | 1,219,350 | |
| | | | | | | | | |
| Commercial & Professional Services – 3.27% | | | | | | | | |
| Copart, Inc. (a) | | | 11,500 | | | | 1,249,015 | |
| | | | | | | | | |
| Food, Beverage & Tobacco – 3.43% | | | | | | | | |
| Constellation Brands, Inc. – Class A | | | 5,750 | | | | 1,311,000 | |
| | | | | | | | | |
| Health Care Equipment & Services – 5.68% | | | | | | | | |
| Guardant Health, Inc. (a) | | | 6,000 | | | | 915,900 | |
| Intuitive Surgical, Inc. (a) | | | 1,700 | | | | 1,256,198 | |
| | | | | | | | 2,172,098 | |
| Media & Entertainment – 3.77% | | | | | | | | |
| Alphabet, Inc. – Class A (a) | | | 700 | | | | 1,443,764 | |
| | | | | | | | | |
| Pharmaceuticals, Biotechnology & Life Sciences – 2.58% | | | | | | | | |
| Exact Sciences Corp. (a) | | | 7,500 | | | | 988,350 | |
| | | | | | | | | |
| Retailing – 10.92% | | | | | | | | |
| Alibaba Group Holding Ltd. – ADR (a)(b) | | | 4,500 | | | | 1,020,285 | |
| Amazon.com, Inc. (a) | | | 450 | | | | 1,392,336 | |
| MercadoLibre, Inc. (a) | | | 1,200 | | | | 1,766,568 | |
| | | | | | | | 4,179,189 | |
| Semiconductors & Semiconductor Equipment – 5.30% | | | | | | | | |
| NVIDIA Corp. | | | 3,800 | | | | 2,028,934 | |
| | | | | | | | | |
| Software & Services – 57.21% | | | | | | | | |
| Adobe, Inc. (a) | | | 3,000 | | | | 1,426,110 | |
| Adyen NV – ADR (a)(b) | | | 30,000 | | | | 1,341,900 | |
| ANSYS, Inc. (a) | | | 3,000 | | | | 1,018,680 | |
| Autodesk, Inc. (a) | | | 4,500 | | | | 1,247,175 | |
| Coupa Software, Inc. (a) | | | 3,600 | | | | 916,128 | |
| Domo, Inc. (a) | | | 18,000 | | | | 1,013,220 | |
| Fiserv, Inc. (a) | | | 8,700 | | | | 1,035,648 | |
| FleetCor Technologies, Inc. (a) | | | 5,000 | | | | 1,343,150 | |
| Mastercard, Inc. – Class A | | | 5,000 | | | | 1,780,250 | |
| Microsoft Corp. | | | 6,750 | | | | 1,591,448 | |
The accompanying notes are an integral part of these financial statements.
Plumb Equity Fund
Schedule of Investments – March 31, 2021 (Continued)
| | | Shares | | | Value | |
| COMMON STOCKS (Continued) | | | | | | |
| | | | | | | |
| Software & Services (Continued) | | | | | | |
| Mitek Systems, Inc. (a) | | | 55,000 | | | $ | 801,900 | |
| Pagseguro Digital Ltd. – ADR (a)(b) | | | 25,000 | | | | 1,157,500 | |
| PayPal Holdings, Inc. (a) | | | 6,750 | | | | 1,639,170 | |
| Square, Inc. (a) | | | 5,800 | | | | 1,316,890 | |
| Tyler Technologies, Inc. (a) | | | 2,500 | | | | 1,061,325 | |
| Visa, Inc. – Class A | | | 8,200 | | | | 1,736,186 | |
| WEX, Inc. (a) | | | 7,000 | | | | 1,464,540 | |
| | | | | | | | 21,891,220 | |
| Technology Hardware & Equipment – 3.83% | | | | | | | | |
| Apple, Inc. | | | 12,000 | | | | 1,465,800 | |
| TOTAL COMMON STOCKS | | | | | | | | |
| (Cost $21,517,065) | | | | | | | 37,948,720 | |
| | | | | | | | | |
| SHORT TERM INVESTMENT – 1.03% | | | | | | | | |
| | | | | | | | | |
| Money Market Fund – 1.03% | | | | | | | | |
| First American Government Obligations Fund – | | | | | | | | |
| Class X – 0.04% (c) | | | 396,232 | | | | 396,232 | |
| TOTAL SHORT TERM INVESTMENT | | | | | | | | |
| (Cost $396,232) | | | | | | | 396,232 | |
| | | | | | | | | |
| Total Investments (Cost $21,913,297) – 100.21% | | | | | | | 38,344,952 | |
| Liabilities in Excess of Other Assets – (0.21)% | | | | | | | (81,635 | ) |
| TOTAL NET ASSETS – 100.00% | | | | | | $ | 38,263,317 | |
Percentages are stated as a percent of net assets.
ADR – American Depositary Receipt
| (a) | Non-income producing security. |
| (b) | Foreign issued security. Foreign concentration is as follows: Cayman Islands: 5.69%, Netherlands: 3.51%. |
| (c) | Rate shown is the 7-day effective yield. |
The Global Industry Classification Standard (GICS®) was developed by and/or is the exclusive property of MSCI, Inc. and Standard & Poor’s Financial Services LLC (“S&P”). GICS is a service mark of MSCI and S&P and has been licensed for use by U.S. Bancorp Global Fund Services, LLC.
The accompanying notes are an integral part of these financial statements.
Statements of Assets and Liabilities
March 31, 2021
| | | Plumb | | | Plumb | |
| | | Balanced | | | Equity | |
| | | Fund | | | Fund | |
| Assets | | | | | | |
| Investments, at value* | | $ | 143,015,948 | | | $ | 38,344,952 | |
| Dividends and interest receivable | | | 451,264 | | | | 16 | |
| Prepaid assets | | | 78,252 | | | | 49,335 | |
| Receivable for fund shares sold | | | 214,853 | | | | 850 | |
| Total Assets | | | 143,760,317 | | | | 38,395,153 | |
| | | | | | | | | |
| Liabilities | | | | | | | | |
| Payable for investment securities purchased | | | 1,945,576 | | | | — | |
| Payable for fund shares redeemed | | | 88,313 | | | | 67,011 | |
| Payable to Adviser (Note 4) | | | 60,364 | | | | 188 | |
| Accrued 12b-1 fees (Note 3) | | | — | | | | 17,012 | |
| Accrued Directors’ fees | | | 7,856 | | | | 2,204 | |
| Accrued expenses and other liabilities | | | 72,161 | | | | 45,421 | |
| Total Liabilities | | | 2,174,270 | | | | 131,836 | |
| Total Net Assets | | $ | 141,586,047 | | | $ | 38,263,317 | |
| | | | | | | | | |
| Net Assets Consist Of: | | | | | | | | |
| Paid in Capital | | $ | 100,575,065 | | | $ | 17,796,099 | |
| Total distributable earnings | | | 41,010,982 | | | | 20,467,218 | |
| Total Net Assets | | $ | 141,586,047 | | | $ | 38,263,317 | |
| | | | | | | | | |
| Investor Shares | | | | | | | | |
| Net Assets | | $ | 94,514,421 | | | $ | 23,403,668 | |
| Capital shares outstanding, $0.001 par value | | | | | | | | |
| (200 million shares issued each) | | | 2,420,998 | | | | 671,141 | |
| Net asset value, offering and | | | | | | | | |
| redemption price per share | | $ | 39.04 | | | $ | 34.87 | |
| | | | | | | | | |
| Institutional Shares** | | | | | | | | |
| Net Assets | | $ | 47,024,068 | | | $ | 14,813,368 | |
| Capital shares outstanding, $0.001 par value | | | | | | | | |
| (200 million shares issued each) | | | 1,204,603 | | | | 424,969 | |
| Net asset value, offering and | | | | | | | | |
| redemption price per share | | $ | 39.04 | | | $ | 34.86 | |
| | | | | | | | | |
| Class A Shares*** | | | | | | | | |
| Net Assets | | $ | 47,558 | | | $ | 46,281 | |
| Capital shares outstanding, $0.001 par value | | | | | | | | |
| (200 million shares issued each) | | | 1,218 | | | | 1,327 | |
| Net asset value, offering and | | | | | | | | |
| redemption price per share | | $ | 39.04 | | | $ | 34.87 | |
| * | | Cost of Investments | | $ | 108,889,613 | | | $ | 21,913,297 | |
| ** | | Institutional Shares began operations on August 1, 2020. | | | | | | | | |
| *** | | Class A Shares began operations on February 8, 2021. | | | | | | | | |
The accompanying notes are an integral part of these financial statements.
Statements of Operations
For the Fiscal Year Ended March 31, 2021
| | | Plumb | | | Plumb | |
| | | Balanced | | | Equity | |
| | | Fund | | | Fund | |
| Investment Income: | | | | | | |
| Dividend income* | | $ | 458,709 | | | $ | 160,316 | |
| Interest income | | | 1,232,879 | | | | 951 | |
| Total Investment Income | | | 1,691,588 | | | | 161,267 | |
| | | | | | | | | |
| Expenses: | | | | | | | | |
| Investment Advisor’s fee (Note 4) | | | 849,051 | | | | 257,060 | |
| 12b-1 fees – Investor shares (Note 3) | | | 271,669 | | | | 71,338 | |
| 12b-1 fees – Class A shares (Note 3) | | | 17 | | | | 17 | |
| Fund administration and accounting fees | | | 140,847 | | | | 88,967 | |
| Transfer agent fees and expenses | | | 97,784 | | | | 51,605 | |
| Registration fees | | | 52,019 | | | | 42,258 | |
| Legal fees | | | 45,784 | | | | 37,941 | |
| Director fees and expenses | | | 43,808 | | | | 13,295 | |
| Audit and tax fees | | | 16,239 | | | | 16,239 | |
| Printing and mailing expense | | | 14,578 | | | | 3,619 | |
| Custody fees | | | 10,102 | | | | 10,001 | |
| Insurance expense | | | 9,020 | | | | 3,030 | |
| Total expenses before Adviser | | | | | | | | |
| waiver and/or recoupment | | | 1,550,918 | | | | 595,370 | |
| Less: Fees waived by Adviser (Note 4) | | | (42,624 | ) | | | (140,256 | ) |
| Net expenses before Adviser recoupment | | | 1,508,294 | | | | 455,114 | |
| Fees recouped by Adviser (Note 4) | | | 2,225 | | | | — | |
| Net expenses | | | 1,510,519 | | | | 455,114 | |
| Net Investment Income (Loss) | | | 181,069 | | | | (293,847 | ) |
| | | | | | | | | |
| Realized and Unrealized Gain: | | | | | | | | |
| Net realized gain on investments | | | 7,548,512 | | | | 7,292,241 | |
| Net change in unrealized | | | | | | | | |
| appreciation on investments | | | 29,931,654 | | | | 10,494,676 | |
| Net Realized and Unrealized Gain on Investments | | | 37,480,166 | | | | 17,786,917 | |
| | | | | | | | | |
| Net Increase in Net Assets | | | | | | | | |
| Resulting from Operations | | $ | 37,661,235 | | | $ | 17,493,070 | |
| * | Net of foreign withholding taxes of $8,378 and $844, respectively. |
The accompanying notes are an integral part of these financial statements.
Plumb Balanced Fund
Statements of Changes in Net Assets
| | | For the | | | For the | |
| | | Year Ended | | | Year Ended | |
| | | March 31, | | | March 31, | |
| | | 2021 | | | 2020 | |
| Operations: | | | | | | |
| Net investment income | | $ | 181,069 | | | $ | 645,602 | |
| Net realized gain (loss) on investments | | | 7,548,512 | | | | (201,279 | ) |
| Net realized loss on foreign currency translation | | | — | | | | (492 | ) |
| Net change in unrealized appreciation | | | | | | | | |
| (depreciation) on investments | | | 29,931,654 | | | | (8,109,086 | ) |
| Net increase (decrease) in net assets | | | | | | | | |
| resulting from operations | | | 37,661,235 | | | | (7,665,255 | ) |
| | | | | | | | | |
| Distributions To Shareholders: | | | | | | | | |
| Net distributions – Investor shares | | | (432,494 | ) | | | (2,794,939 | ) |
| Net distributions – Institutional shares* | | | (212,600 | ) | | | — | |
| Total distributions to shareholders | | | (645,094 | ) | | | (2,794,939 | ) |
| | | | | | | | | |
| Capital Share Transactions: | | | | | | | | |
| Proceeds from shares sold – Investor shares | | | 40,229,343 | | | | 50,940,980 | |
| Proceeds from shares sold – Institutional shares* | | | 57,505,210 | | | | — | |
| Proceeds from shares sold – Class A shares** | | | 50,000 | | | | — | |
| Shares issued in reinvestment of dividends – | | | | | | | | |
| Investor shares | | | 400,341 | | | | 2,460,902 | |
| Shares issued in reinvestment of dividends – | | | | | | | | |
| Institutional shares* | | | 212,600 | | | | — | |
| Cost of shares redeemed – Investor shares | | | (76,145,029 | ) | | | (43,932,544 | ) |
| Cost of shares redeemed – Institutional shares* | | | (13,830,801 | ) | | | — | |
| Net increase in net assets from | | | | | | | | |
| capital share transactions | | | 8,421,664 | | | | 9,469,338 | |
| | | | | | | | | |
| Total increase (decrease) in net assets | | | 45,437,805 | | | | (990,856 | ) |
| | | | | | | | | |
| Net Assets: | | | | | | | | |
| Beginning of year | | | 96,148,242 | | | | 97,139,098 | |
| End of year | | $ | 141,586,047 | | | $ | 96,148,242 | |
The accompanying notes are an integral part of these financial statements.
Plumb Balanced Fund
Statements of Changes in Net Assets (Continued)
| | | For the | | | For the | |
| | | Year Ended | | | Year Ended | |
| | | March 31, | | | March 31, | |
| | | 2021 | | | 2020 | |
| Change in Shares Outstanding: | | | | | | |
| Investor Shares | | | | | | |
| Shares sold | | | 1,109,270 | | | | 1,584,010 | |
| Shares issued in reinvestment of dividends | | | 10,019 | | | | 75,257 | |
| Shares redeemed | | | (2,092,013 | ) | | | (1,401,044 | ) |
| Net increase (decrease) | | | (972,724 | ) | | | 258,223 | |
| | | | | | | | | |
| Institutional Shares* | | | | | | | | |
| Shares sold | | | 1,556,512 | | | | — | |
| Shares issued in reinvestment of dividends | | | 5,324 | | | | — | |
| Shares redeemed | | | (357,233 | ) | | | — | |
| Net increase | | | 1,204,603 | | | | — | |
| | | | | | | | | |
| Class A Shares** | | | | | | | | |
| Shares sold | | | 1,218 | | | | — | |
| Net increase | | | 1,218 | | | | — | |
| * | | Institutional Shares began operations on August 1, 2020. |
| ** | | Class A Shares began operations on February 8, 2021. |
The accompanying notes are an integral part of these financial statements.
Plumb Equity Fund
Statements of Changes in Net Assets
| | | For the | | | For the | |
| | | Year Ended | | | Year Ended | |
| | | March 31, | | | March 31, | |
| | | 2021 | | | 2020 | |
| Operations: | | | | | | |
| Net investment loss | | $ | (293,847 | ) | | $ | (274,979 | ) |
| Net realized gain on investments | | | 7,292,241 | | | | 1,425,860 | |
| Net change in unrealized appreciation | | | | | | | | |
| (depreciation) on investments | | | 10,494,676 | | | | (5,470,975 | ) |
| Net increase (decrease) in net assets | | | | | | | | |
| resulting from operations | | | 17,493,070 | | | | (4,320,094 | ) |
| | | | | | | | | |
| Distributions To Shareholders: | | | | | | | | |
| Net distributions – Investor shares | | | (2,749,763 | ) | | | (1,654,811 | ) |
| Net distributions – Institutional shares* | | | (1,002,629 | ) | | | — | |
| Total distributions to shareholders | | | (3,752,392 | ) | | | (1,654,811 | ) |
| | | | | | | | | |
| Capital Share Transactions: | | | | | | | | |
| Proceeds from shares sold – Investor shares | | | 3,313,604 | | | | 6,139,788 | |
| Proceeds from shares sold – Institutional shares* | | | 20,538,488 | | | | — | |
| Proceeds from shares sold – Class A shares** | | | 50,000 | | | | — | |
| Shares issued in reinvestment of dividends – | | | | | | | | |
| Investor shares | | | 2,449,688 | | | | 1,321,110 | |
| Shares issued in reinvestment of dividends – | | | | | | | | |
| Institutional shares* | | | 1,002,629 | | | | — | |
| Cost of shares redeemed – Investor shares | | | (26,344,429 | ) | | | (8,017,246 | ) |
| Cost of shares redeemed – Institutional shares* | | | (7,543,229 | ) | | | — | |
| Net decrease in net assets | | | | | | | | |
| from capital share transactions | | | (6,533,249 | ) | | | (556,348 | ) |
| | | | | | | | | |
| Total increase (decrease) in net assets | | | 7,207,429 | | | | (6,531,253 | ) |
| | | | | | | | | |
| Net Assets: | | | | | | | | |
| Beginning of year | | | 31,055,888 | | | | 37,587,141 | |
| End of year | | $ | 38,263,317 | | | $ | 31,055,888 | |
The accompanying notes are an integral part of these financial statements.
Plumb Equity Fund
Statements of Changes in Net Assets (Continued)
| | | For the | | | For the | |
| | | Year Ended | | | Year Ended | |
| | | March 31, | | | March 31, | |
| | | 2021 | | | 2020 | |
| Change in Shares Outstanding: | | | | | | |
| Investor Shares | | | | | | |
| Shares sold | | | 101,558 | | | | 211,555 | |
| Shares issued in reinvestment of dividends | | | 67,522 | | | | 44,738 | |
| Shares redeemed | | | (797,522 | ) | | | (282,501 | ) |
| Net decrease | | | (628,442 | ) | | | (26,208 | ) |
| | | | | | | | | |
| Institutional Shares* | | | | | | | | |
| Shares sold | | | 610,038 | | | | — | |
| Shares issued in reinvestment of dividends | | | 27,666 | | | | — | |
| Shares redeemed | | | (212,735 | ) | | | — | |
| Net increase | | | 424,969 | | | | — | |
| | | | | | | | | |
| Class A Shares** | | | | | | | | |
| Shares sold | | | 1,327 | | | | — | |
| Net increase | | | 1,327 | | | | — | |
| * | | Institutional Shares began operations on August 1, 2020. |
| ** | | Class A Shares began operations on February 8, 2021. |
The accompanying notes are an integral part of these financial statements.
Plumb Balanced Fund – Investor Shares
Financial Highlights
Per share operating performance
(For a share outstanding throughout the year)
Net asset value, beginning of year
Operations:
Net investment income(1)
Net realized and unrealized gain (loss)
Total from investment operations
Distributions to shareholders:
Distributions from net investment income
Distributions from net realized gains
Total distributions to shareholders
Change in net asset value for the year
Net asset value, end of year
Total return(2)
Ratios / supplemental data
Net assets, end of year (000)
Ratio of net expenses to average net assets:
Before expense reimbursement and waivers/recoupment
After expense reimbursement and waivers/recoupment(3)
Ratio of net investment income to average net assets:
After expense reimbursement and waivers/recoupment(3)
Portfolio turnover rate
| (1) | Effective for the year ended March 31, 2021, net investment income per share has been calculated based on average shares outstanding during the year. Prior to the year ended March 31, 2021, net investment income per share was calculated using current year ending balances prior to consideration of adjustment for permanent book and tax differences. |
| (2) | Total return represents the rate that the investor would have earned or lost on an investment in the Fund, assuming reinvestment of dividends. |
| (3) | Effective December 1, 2017, the Advisor contractually agreed to cap the Funds’ expenses at 1.19%. Prior to December 1, 2017, the Fund’s expense cap was 1.30%. |
The accompanying notes are an integral part of these financial statements.
Plumb Balanced Fund – Investor Shares
Financial Highlights (Continued)
| For the Years Ended March 31, | |
| 2021 | | | 2020 | | | 2019 | | | 2018 | | | 2017 | |
| | | | | | | | | | | | | | |
| | | | | | | | | | | | | | |
| | | | | | | | | | | | | | |
| $ | 28.33 | | | $ | 30.98 | | | $ | 28.77 | | | $ | 24.75 | | | $ | 21.69 | |
| | | | | | | | | | | | | | | | | | | |
| | 0.05 | | | | 0.17 | | | | 0.16 | | | | 0.15 | | | | 0.13 | |
| | 10.82 | | | | (2.01 | ) | | | 2.51 | | | | 4.05 | | | | 3.05 | |
| | 10.87 | | | | (1.84 | ) | | | 2.67 | | | | 4.20 | | | | 3.18 | |
| | | | | | | | | | | | | | | | | | | |
| | | | | | | | | | | | | | | | | | | |
| | (0.16 | ) | | | (0.15 | ) | | | — | | | | (0.18 | ) | | | (0.12 | ) |
| | — | | | | (0.66 | ) | | | (0.46 | ) | | | — | | | | — | |
| | (0.16 | ) | | | (0.81 | ) | | | (0.46 | ) | | | (0.18 | ) | | | (0.12 | ) |
| | | | | | | | | | | | | | | | | | | |
| | 10.71 | | | | (2.65 | ) | | | 2.21 | | | | 4.02 | | | | 3.06 | |
| | | | | | | | | | | | | | | | | | | |
| $ | 39.04 | | | $ | 28.33 | | | $ | 30.98 | | | $ | 28.77 | | | $ | 24.75 | |
| | 38.35 | % | | | (6.27 | )% | | | 9.47 | % | | | 16.98 | % | | | 14.70 | % |
| | | | | | | | | | | | | | | | | | | |
| | | | | | | | | | | | | | | | | | | |
| $ | 94,514 | | | $ | 96,148 | | | $ | 97,139 | | | $ | 44,722 | | | $ | 33,281 | |
| | | | | | | | | | | | | | | | | | | |
| | 1.22 | % | | | 1.19 | % | | | 1.18 | % | | | 1.50 | % | | | 1.68 | % |
| | 1.19 | % | | | 1.19 | % | | | 1.19 | % | | | 1.26 | % | | | 1.28 | % |
| | | | | | | | | | | | | | | | | | | |
| | 0.13 | % | | | 0.58 | % | | | 0.66 | % | | | 0.57 | % | | | 0.56 | % |
| | 63 | % | | | 52 | % | | | 58 | % | | | 37 | % | | | 29 | % |
The accompanying notes are an integral part of these financial statements.
Plumb Balanced Fund – Institutional Shares
Financial Highlights
| | | For the | |
| | | Period | |
| | | Ended | |
| | | March 31, | |
| | | 2021(1) | |
| Per share operating performance | | | |
| (For a share outstanding throughout the period) | | | |
| | | | |
| Net asset value, beginning of period | | $ | 35.38 | |
| Operations: | | | | |
Net investment income(2) | | | 0.04 | |
| Net realized and unrealized gain (loss) | | | 3.85 | |
| Total from investment operations | | | 3.89 | |
| | | | | |
| Distributions to shareholders: | | | | |
| Distributions from net investment income | | | (0.23 | ) |
| Distributions from net realized gains | | | — | |
| Total distributions to shareholders | | | (0.23 | ) |
| | | | | |
| Change in net asset value for the period | | | 3.66 | |
| | | | | |
| Net asset value, end of period | | $ | 39.04 | |
Total return(3) | | | 10.97 | %(4) |
| | | | | |
| Ratios / supplemental data | | | | |
| Net assets, end of period (000) | | $ | 47,024 | |
| Ratio of net expenses to average net assets: | | | | |
| Before expense reimbursement and waivers | | | 1.02 | %(5) |
| After expense reimbursement and waivers | | | 0.99 | %(5) |
| Ratio of net investment income to average net assets: | | | | |
| After expense reimbursement and waivers | | | 0.16 | %(5) |
| Portfolio turnover rate | | | 63 | %(4) |
| (1) | Institutional Shares began operations on August 1, 2020. |
| (2) | Net investment income (loss) per share has been calculated based on average shares outstanding during the period. |
| (3) | Total return represents the rate that the investor would have earned or lost on an investment in the Fund, assuming reinvestment of dividends. |
| (4) | Not annualized for the period ended March 31, 2021. |
| (5) | Annualized for the period ended March 31, 2021. |
The accompanying notes are an integral part of these financial statements.
Plumb Balanced Fund – Class A Shares
Financial Highlights
| | | For the | |
| | | Period | |
| | | Ended | |
| | | March 31, | |
| | | 2021(1) | |
| Per share operating performance | | | |
| (For a share outstanding throughout the period) | | | |
| | | | |
| Net asset value, beginning of period | | $ | 41.04 | |
| Operations: | | | | |
Net investment income(2) | | | (0.00 | )(3) |
| Net realized and unrealized gain (loss) | | | (2.00 | )(4) |
| Total from investment operations | | | (2.00 | ) |
| | | | | |
| Distributions to shareholders: | | | | |
| Distributions from net investment income | | | — | |
| Distributions from net realized gains | | | — | |
| Total distributions to shareholders | | | — | |
| | | | | |
| Change in net asset value for the period | | | (2.00 | ) |
| | | | | |
| Net asset value, end of period | | $ | 39.04 | |
Total return(5) | | | (4.87 | )%(6) |
| | | | | |
| Ratios / supplemental data | | | | |
| Net assets, end of period (000) | | $ | 48 | |
| Ratio of net expenses to average net assets: | | | | |
| Before expense reimbursement and waivers | | | 1.33 | %(7) |
| After expense reimbursement and waivers | | | 1.19 | %(7) |
| Ratio of net investment income to average net assets: | | | | |
| After expense reimbursement and waivers | | | (0.03 | )%(7) |
| Portfolio turnover rate | | | 63 | %(6) |
| (1) | Class A Shares began operations on February 8, 2021. |
| (2) | Net investment income (loss) per share has been calculated based on average shares outstanding during the period. |
| (3) | Amount rounds to less than $0.005. |
| (4) | Net realized and unrealized gains and losses per share in this caption are balancing amounts necessary to reconcile the change in net asset value per share for the period, and may not reconcile with the Fund’s statement of operations due to share transactions for the period. |
| (5) | Total return represents the rate that the investor would have earned or lost on an investment in the Fund, assuming reinvestment of dividends. |
| (6) | Not annualized for the period ended March 31, 2021. |
| (7) | Annualized for the period ended March 31, 2021. |
The accompanying notes are an integral part of these financial statements.
Plumb Equity Fund – Investor Shares
Financial Highlights
Per share operating performance
(For a share outstanding throughout the year)
Net asset value, beginning of year
Operations:
Net investment loss(1)
Net realized and unrealized gain (loss)
Total from investment operations
Distributions to shareholders:
Distributions from net investment income
Distributions from net realized gains
Total distributions to shareholders
Change in net asset value for the year
Net asset value, end of year
Total return(3)
Ratios / supplemental data
Net assets, end of year (000)
Ratio of net expenses to average net assets:
Before expense reimbursement and waivers
After expense reimbursement and waivers(4)
Ratio of net investment income to average net assets:
After expense reimbursement and waivers(4)
Portfolio turnover rate
| (1) | Effective for the year ended March 31, 2021, Net investment loss per share has been calculated based on average shares outstanding during the year. Prior to the year ended March 31, 2021, net investment loss per share was calculated using current year ending balances prior to consideration of adjustment for permanent book and tax differences. |
| (2) | Realized and unrealized gains and losses per share in this caption are balancing amounts necessary to reconcile the change in net asset value per share for the period, and may not reconcile with the aggregate gains and losses in the Statement of Operations due to share transactions for the year. |
| (3) | Total return represents the rate that the investor would have earned or lost on an investment in the Fund, assuming reinvestment of dividends. |
| (4) | Effective December 1, 2017, the Advisor contractually agreed to cap the Funds’ expenses at 1.19%. Prior to December 1, 2017, the Fund’s expense cap was 1.45%. |
The accompanying notes are an integral part of these financial statements.
Plumb Equity Fund – Investor Shares
Financial Highlights (Continued)
| For the Years Ended March 31, | |
| 2021 | | | 2020 | | | 2019 | | | 2018 | | | 2017 | |
| | | | | | | | | | | | | | |
| | | | | | | | | | | | | | |
| | | | | | | | | | | | | | |
| $ | 23.90 | | | $ | 28.35 | | | $ | 28.78 | | | $ | 24.70 | | | $ | 20.40 | |
| | | | | | | | | | | | | | | | | | | |
| | (0.24 | ) | | | (0.21 | ) | | | (0.17 | ) | | | (0.21 | ) | | | (0.15 | ) |
| | 14.57 | | | | (2.97 | ) | | | 3.23 | | | | 7.84 | (2) | | | 4.69 | |
| | 14.33 | | | | (3.18 | ) | | | 3.06 | | | | 7.63 | | | | 4.54 | |
| | | | | | | | | | | | | | | | | | | |
| | | | | | | | | | | | | | | | | | | |
| | (0.15 | ) | | | — | | | | — | | | | — | | | | — | |
| | (3.21 | ) | | | (1.27 | ) | | | (3.49 | ) | | | (3.55 | ) | | | (0.24 | ) |
| | (3.36 | ) | | | (1.27 | ) | | | (3.49 | ) | | | (3.55 | ) | | | (0.24 | ) |
| | | | | | | | | | | | | | | | | | | |
| | 10.97 | | | | (4.45 | ) | | | (0.43 | ) | | | 4.08 | | | | 4.30 | |
| | | | | | | | | | | | | | | | | | | |
| $ | 34.87 | | | $ | 23.90 | | | $ | 28.35 | | | $ | 28.78 | | | $ | 24.70 | |
| | 59.42 | % | | | (12.07 | )% | | | 12.67 | % | | | 31.65 | % | | | 22.38 | % |
| | | | | | | | | | | | | | | | | | | |
| | | | | | | | | | | | | | | | | | | |
| $ | 23,404 | | | $ | 31,056 | | | $ | 37,587 | | | $ | 29,641 | | | $ | 23,533 | |
| | | | | | | | | | | | | | | | | | | |
| | 1.53 | % | | | 1.43 | % | | | 1.44 | % | | | 1.68 | % | | | 1.86 | % |
| | 1.19 | % | | | 1.19 | % | | | 1.19 | % | | | 1.36 | % | | | 1.43 | % |
| | | | | | | | | | | | | | | | | | | |
| | (0.75 | )% | | | (0.70 | )% | | | (0.63 | )% | | | (0.79 | )% | | | (0.74 | )% |
| | 66 | % | | | 46 | % | | | 64 | % | | | 69 | % | | | 18 | % |
The accompanying notes are an integral part of these financial statements.
Plumb Equity Fund – Institutional Shares
Financial Highlights
| | | For the | |
| | | Period | |
| | | Ended | |
| | | March 31, | |
| | | 2021(1) | |
| Per share operating performance | | | |
| (For a share outstanding throughout the period) | | | |
| | | | |
| Net asset value, beginning of period | | $ | 32.57 | |
| Operations: | | | | |
Net investment income(2) | | | (0.16 | ) |
| Net realized and unrealized gain (loss) | | | 5.88 | |
| Total from investment operations | | | 5.72 | |
| | | | | |
| Distributions to shareholders: | | | | |
| Distributions from net investment income | | | (0.22 | ) |
| Distributions from net realized gains | | | (3.21 | ) |
| Total distributions to shareholders | | | (3.43 | ) |
| | | | | |
| Change in net asset value for the period | | | 2.29 | |
| | | | | |
| Net asset value, end of period | | $ | 34.86 | |
Total return(3) | | | 17.17 | %(4) |
| | | | | |
| Ratios / supplemental data | | | | |
| Net assets, end of period (000) | | $ | 14,813 | |
| Ratio of net expenses to average net assets: | | | | |
| Before expense reimbursement and waivers | | | 1.39 | %(5) |
| After expense reimbursement and waivers | | | 0.99 | %(5) |
| Ratio of net investment income to average net assets: | | | | |
| After expense reimbursement and waivers | | | (0.70 | )%(5) |
| Portfolio turnover rate | | | 66 | %(4) |
| (1) | Institutional Shares began operations on August 1, 2020. |
| (2) | Net investment income (loss) per share has been calculated based on average shares outstanding during the period. |
| (3) | Total return represents the rate that the investor would have earned or lost on an investment in the Fund, assuming reinvestment of dividends. |
| (4) | Not annualized for the period ended March 31, 2021. |
| (5) | Annualized for the period ended March 31, 2021. |
The accompanying notes are an integral part of these financial statements.
Plumb Equity Fund – Class A Shares
Financial Highlights
| | | For the | |
| | | Period | |
| | | Ended | |
| | | March 31, | |
| | | 2021(1) | |
| Per share operating performance | | | |
| (For a share outstanding throughout the period) | | | |
| | | | |
| Net asset value, beginning of period | | $ | 37.67 | |
| Operations: | | | | |
Net investment income(2) | | | (0.05 | ) |
| Net realized and unrealized gain (loss) | | | (2.75 | )(3) |
| Total from investment operations | | | (2.80 | ) |
| | | | | |
| Distributions to shareholders: | | | | |
| Distributions from net investment income | | | — | |
| Distributions from net realized gains | | | — | |
| Total distributions to shareholders | | | — | |
| | | | | |
| Change in net asset value for the period | | | (2.80 | ) |
| | | | | |
| Net asset value, end of period | | $ | 34.87 | |
Total return(4) | | | (7.43 | )%(5) |
| | | | | |
| Ratios / supplemental data | | | | |
| Net assets, end of period (000) | | $ | 46 | |
| Ratio of net expenses to average net assets: | | | | |
| Before expense reimbursement and waivers | | | 1.77 | %(6) |
| After expense reimbursement and waivers | | | 1.19 | %(6) |
| Ratio of net investment income to average net assets: | | | | |
| After expense reimbursement and waivers | | | (0.98 | )%(6) |
| Portfolio turnover rate | | | 66 | %(5) |
| (1) | Class A Shares began operations on February 8, 2021. |
| (2) | Net investment income (loss) per share has been calculated based on average shares outstanding during the period. |
| (3) | Net realized and unrealized gains and losses per share in this caption are balancing amounts necessary to reconcile the change in net asset value per share for the period, and may not reconcile with the Fund's statement of operations due to share transactions for the period. |
| (4) | Total return represents the rate that the investor would have earned or lost on an investment in the Fund, assuming reinvestment of dividends. |
| (5) | Not annualized for the period ended March 31, 2021. |
| (6) | Annualized for the period ended March 31, 2021. |
The accompanying notes are an integral part of these financial statements.
Notes to Financial Statements
March 31, 2021
1. ORGANIZATION
Wisconsin Capital Funds, Inc. (the “Company”), also referred to as the “Plumb Funds”, is registered under the Investment Company Act of 1940 (the “1940 Act”) as an open-end, diversified management investment company. The Company was organized as a Maryland corporation on April 3, 2007. The Company is authorized to issue up to 2 billion shares, which are units of beneficial interest with a $0.001 par value. The Company currently offers shares of two series, each with its own investment strategy and risk/reward profile: the Plumb Balanced Fund and the Plumb Equity Fund (individually a “Fund”, collectively the “Funds”). Each Fund offers three share classes: the Investor Shares (Inception date of May 24, 2007), the Institutional Shares (Inception date of August 1, 2020), and the Class A Shares (Inception date of February 8, 2021). The investment objective of the Plumb Balanced Fund is high total return through capital appreciation while attempting to preserve principal, with current income as a secondary objective. The investment objective of the Plumb Equity Fund is long-term capital appreciation. Wisconsin Capital Management, LLC (the “Advisor”) serves as the Funds’ investment advisor. As of December 31, 2014, the Advisor is owned by TGP, Inc. The Advisor is controlled by Thomas G. Plumb indirectly through TGP, Inc. Certain directors or officers of the Funds are also officers of the Advisor.
2. SIGNIFICANT ACCOUNTING POLICIES
The following is a summary of significant accounting policies consistently followed by the Funds in the preparation of its financial statements. These policies are in conformity with accounting principles generally accepted in the United States of America (“GAAP”). The Fund is an investment company and accordingly follows the investment company accounting and reporting guidance of the Financial Accounting Standards Board (“FASB”) Accounting Standards Codification Topic 946 Financial Services – Investment Companies.
Security Valuation:
The Funds have adopted authoritative fair valuation accounting standards which establish an authoritative definition of fair value and set out a hierarchy for measuring fair value. These standards require additional disclosures about the various inputs and valuation techniques used to develop the measurements of fair value and a discussion in changes in valuation techniques and related inputs during the year. These inputs are summarized in the three broad levels listed below.
| | Level 1 – | quoted prices in active markets for identical securities |
| | | |
| | Level 2 – | other significant observable inputs (including quoted prices for similar securities, interest rates, prepayment speeds, credit risk, etc.) |
| | | |
| | Level 3 – | significant unobservable inputs (including the Funds’ own assumptions in determining far value of investments) |
Notes to Financial Statements
March 31, 2021 (Continued)
Equity securities, including domestic common stocks and foreign issued common stocks, are valued at the last sale price reported by the exchange on which the securities are primarily traded on the day of valuation. Nasdaq-listed securities are valued at their Nasdaq Official Closing Price. Equity securities not traded on a listed exchange or not traded using Nasdaq are valued as of the last sale price at the close of the U.S. market. If there are no sales on a given day for securities traded on an exchange, the latest bid quotation will be used. These securities will generally be classified as Level 1 securities.
Investments in mutual funds, including money market funds, are generally priced at the ending net asset value (NAV) provided by the service agent of the Funds and will be classified as Level 1 securities.
Debt securities such as corporate bonds and preferred securities are valued using a market approach based on information supplied by independent pricing services. The market inputs used by the independent pricing service include benchmark yields, reported trades, broker/dealer quotes, issuer spreads, two sided markets, benchmark securities, bids, offers, and reference data including market research publications. Debt securities with remaining maturities of 60 days or less may be valued on an amortized cost basis, which involves valuing an instrument at its cost and thereafter assuming a constant amortization to maturity of any discount or premium, regardless of the impact of fluctuating rates on the fair value of the instrument. To the extent the inputs are observable and timely, these debt securities will generally be classified as Level 2 securities.
Any securities or other assets for which market quotations are not readily available are valued at fair value as determined in good faith by the Advisor pursuant to procedures established under the general supervision and responsibility of the Funds’ Board of Directors and will be classified as Level 3 securities.
The inputs or methodology used for valuing securities may not be an indication of the risk associated with investing in those securities. The inputs used to measure fair value may fall into different levels of the fair value hierarchy. In such cases, for disclosure purposes, the level in the fair value hierarchy within which the fair value measurement falls in its entirety is determined based on the lowest level input that is significant to the fair value measurement in its entirety.
Notes to Financial Statements
March 31, 2021 (Continued)
The following is a summary of the inputs used, as of March 31, 2021, to value the Funds’ investments carried at fair value:
Description | | Level 1 | | | Level 2 | | | Level 3 | | | Total | |
| Plumb Balanced Fund | | | | | | | | | | | | |
| Common Stocks* | | $ | 87,932,660 | | | $ | — | | | $ | — | | | $ | 87,932,660 | |
| Corporate Bonds* | | | — | | | | 52,897,133 | | | | — | | | | 52,897,133 | |
| Short-Term Investment | | | 2,186,155 | | | | — | | | | — | | | | 2,186,155 | |
| Total | | $ | 90,118,815 | | | $ | 52,897,133 | | | $ | — | | | $ | 143,015,948 | |
| | | | | | | | | | | | | | | | | |
Description | | Level 1 | | | Level 2 | | | Level 3 | | | Total | |
| Plumb Equity Fund | | | | | | | | | | | | | | | | |
| Common Stocks* | | $ | 37,948,720 | | | $ | — | | | $ | — | | | $ | 37,948,720 | |
| Short-Term Investment | | | 396,232 | | | | — | | | | — | | | | 396,232 | |
| Total | | $ | 38,344,952 | | | $ | �� | | | $ | — | | | $ | 38,344,952 | |
| * | For detailed industry descriptions, refer to the Schedule of Investments. |
Use of Estimates:
The presentation of the financial statements in conformity with GAAP requires management to make estimates and assumptions that affect the reported amounts of assets and liabilities and disclosure of contingent assets and liabilities at the date of the financial statements and the reported amounts of increases and decreases in net assets from operations during the reporting period. Actual results could differ from those estimates.
Expenses:
Generally, expenses directly attributable to a Fund are charged to the Fund, while expenses attributable to more than one series of the Company are allocated among the respective series based on relative net assets or another appropriate basis.
Federal Income Taxes:
The Funds intend to meet the requirements of the Internal Revenue Code (the “Code”) applicable to regulated investment companies and to distribute substantially all net investment taxable income and net capital gains to shareholders in a manner which results in no tax cost to the Funds. Therefore, no federal income or excise tax provision is recorded.
As of and during the year ended March 31, 2021, the Funds did not have a liability for any unrecognized tax benefits. The Funds recognize interest and penalties, if any, related to unrecognized tax benefits as income tax expense in the Statements of Operations. During the year ended March 31, 2021, the Funds did not incur any interest or penalties.
Notes to Financial Statements
March 31, 2021 (Continued)
Distributions to Shareholders:
Dividends from net investment income are declared and paid at least annually. Distributions of net realized capital gains, if any, will be declared and paid at least annually. Distributions to shareholders are recorded on the ex-dividend date.
The Funds may periodically make reclassifications among certain of its capital accounts as a result of the recognition and characterization of certain income and capital gain distributions determined annually in accordance with federal tax regulations which may differ from GAAP. Any such reclassifications will have no effect on net assets, results of operations or net asset values per share of the Funds. For the fiscal year ended March 31, 2021, the Funds did not make any reclassifications to increase (decrease) the components of net assets.
Other:
Investment and shareholder transactions are recorded on the trade date. Gains or losses from investment transactions are determined using the specific identification method. Dividend income is recognized on the ex-dividend date and interest income is recognized on an accrual basis. Discounts and premiums on securities purchased are amortized over the expected life of the respective securities using the effective interest method. Withholding taxes on foreign dividends have been provided for in accordance with the Funds’ understanding of the applicable country’s tax rules and rates.
Investment securities and other assets and liabilities denominated in foreign currencies are translated into U.S. dollar amounts at the date of valuation. Purchases and sales of investment securities and income and expense items denominated in foreign currencies are translated into U.S. dollar amounts on the respective dates of such transactions. The Fund does not isolate the portion of the results of operations from changes in foreign exchange rates on investments from the fluctuations arising from changes in market prices of securities held. Realized foreign exchange gains or losses arising from sales of portfolio securities and sales and maturities of short-term securities are reported within realized gain (loss) on investments. Net unrealized foreign exchange gains and losses arising from changes in the values of investments in securities from fluctuations in exchange rates are reported within unrealized gain (loss) on investments.
Under the Company’s organizational documents, the Company will indemnify its officers and directors for certain liabilities that may arise from performance of their duties to the Funds. Additionally, in the normal course of business, the Funds enter into contracts that contain a variety of representatives and warranties which provide general indemnifications. The Funds’ maximum exposure under these arrangements is unknown, as this would involve future claims that may be made against the Funds that have not yet occurred.
Notes to Financial Statements
March 31, 2021 (Continued)
3. DISTRIBUTION PLAN
The Company has adopted a plan pursuant to Rule 12b-1 under the 1940 Act (the “12b-1 Plan”), on behalf of the Funds, which authorizes it to pay Quasar Distributors, LLC (the “Distributor”) a distribution fee up to 0.25% of the Funds’ average daily net assets attributable to both the Investor Shares and the Class A Shares of each Fund, for services to prospective Fund shareholders and distribution of Fund shares. During the year ended March 31, 2021, the Plumb Balanced Fund Investor Shares and Class A Shares incurred expenses of $271,669 and $17, respectively, and the Plumb Equity Fund Investor Shares and Class A Shares incurred expenses of $71,338 and $17, respectively, pursuant to the 12b-1 Plan. The Institutional Shares of each Fund are not subject to any 12b-1 fees under this Plan.
4. INVESTMENT ADVISOR AND OTHER AFFILIATES
The Funds have an Investment Advisory Agreement (the “Advisory Agreement”) with Wisconsin Capital Management, LLC. The Advisory Agreement provides for advisory fees computed daily and paid monthly at an annual rate of 0.65% of the Funds’ average daily net assets.
Under the terms of the Advisory Agreement, the Advisor has contractually agreed to limit the Funds’ expenses. Effective December 1, 2017, Wisconsin Capital Management, LLC, the investment advisor to the Funds (the “Advisor”), has contractually agreed to waive its advisory fee and/or reimburse expenses in order to limit the Total Annual Fund Operating Expenses of each Fund to 1.19% of the Fund’s average daily net assets for the Investor Shares and the Class A Shares, and 0.99% of the Fund’s average daily net assets for the Institutional Shares. This contractual limitation is in effect until July 31, 2022 and may not be terminated without the approval of the Board of Directors of Wisconsin Capital Funds, Inc. Prior to December 1, 2017, the Plumb Balanced Fund and the Plumb Equity Fund’s expense cap was 1.30% and 1.45% for the Investor Shares, respectively. Any such waiver or reimbursement is subject to later adjustment to allow the Advisor to recoup amounts waived or reimbursed to the extent actual fees and expenses for a period are less than the expense limitation caps in place at the time the waiver was made, provided, however, that the Advisor shall only be entitled to recoup such amounts for a period of three years from the date such amount was waived or reimbursed. For the year ended March 31, 2021, the Advisor waived $36,933 of expenses and recouped $2,225 of expenses in the Plumb Balanced Fund’s Investor Shares and waived $5,682 and $9 in Plumb Balanced Fund’s Institutional Shares and Class A Shares, respectively. For the year ended March 31, 2021, the Advisor waived $108,883, $31,336, and $37 in expenses in the Plumb Equity Fund’s Investor Shares, Institutional Shares, and Class A Shares, respectively.
Notes to Financial Statements
March 31, 2021 (Continued)
As of March 31, 2021, the Adviser has waived and recouped fees. The following table shows the remaining amount subject to potential recoupment as of March 31, 2021 and expiring on:
| | Plumb Balanced Fund Investor Shares | Plumb Equity Fund Investor Shares | |
| | March 31, 2022 . . . . . . . $11,798 | March 31, 2022 . . . . . . . $ 89,091 | |
| | March 31, 2023 . . . . . . . $28,760 | March 31, 2023 . . . . . . . $ 95,993 | |
| | March 31, 2024 . . . . . . . $36,933 | March 31, 2024 . . . . . . . $108,883 | |
| | | | |
| | Plumb Balanced Fund Institutional Shares | Plumb Equity Fund Institutional Shares | |
| | March 31, 2024 . . . . . . . $ 5,682 | March 31, 2024 . . . . . . . $ 31,336 | |
| | | | |
| | Plumb Balanced Fund Class A Shares | Plumb Equity Fund Class A Shares | |
| | March 31, 2024 . . . . . . . $ 9 | March 31, 2024 . . . . . . . $ 37 | |
Waived fees by the Adviser for the Plumb Balanced Fund Investor Shares and the Plumb Equity Fund Investor Shares totaling $120,514 and $110,110, respectively, expired during the fiscal year ended March 31, 2021 and are no longer eligible for recoupment by the Adviser.
5. INVESTMENT TRANSACTIONS
For the fiscal year ended March 31, 2021, the aggregate purchases and sales of investment securities, other than short-term investments, were as follows:
| | | | U.S. Government Securities | | | Other | |
| | | | Purchases | | | Sales | | | Purchases | | | Sales | |
| | Plumb Balanced Fund | | $ | — | | | $ | 1,018,438 | | | $ | 85,596,275 | | | $ | 77,688,326 | |
| | Plumb Equity Fund | | | — | | | | — | | | | 24,907,900 | | | | 34,490,565 | |
6. BENEFICIAL OWNERSHIP
The beneficial ownership, either directly or indirectly, of more than 25% of the voting securities of a fund creates a presumption of control of the fund under Section 2(a)(9) of the 1940 Act. As of March 31, 2021, beneficial ownership of more than 25% of the shares outstanding in each class is as follows:
| | Plumb Balanced Fund | | Plumb Equity Fund | |
| | Investor | Institutional | Class A | | Investor | Institutional | Class A | |
| | Shares | Shares | Shares | | Shares | Shares | Shares | |
| National Financial | | | | | | | | |
| Services LLC | 36.64% | 90.76% | — | | 27.83% | 65.07% | — | |
| Charles Schwab | | | | | | | | |
| & Co, Inc. | 27.75% | — | — | | — | 28.11% | — | |
| Thomas G. Plumb | — | — | 100.00% | | — | — | 100.00% | |
Notes to Financial Statements
March 31, 2021 (Continued)
7. FEDERAL TAX INFORMATION
As of March 31, 2021 the components of accumulated earnings (losses) for income tax purposes were as follows:
| | | Plumb Balanced Fund | | Plumb Equity Fund |
| | Unrealized appreciation | | $ | 35,344,243 | | | | $ | 16,733,104 | |
| | Unrealized depreciation | | | (1,383,091 | ) | | | | (319,908 | ) |
| | Net unrealized appreciation | | | | | | | | | |
| | on investments | | | 33,961,152 | | | | | 16,413,196 | |
| | Undistributed ordinary income | | | 1,456,814 | | | | | 970,757 | |
| | Undistributed long-term capital gain | | | 5,593,016 | | | | | 3,083,265 | |
| | Total accumulated gain | | $ | 41,010,982 | | | | $ | 20,467,218 | |
The tax cost of investments as of March 31, 2021 was $109,054,980 and $21,931,756 for the Plumb Balanced Fund and Plumb Equity Fund, respectively. The tax basis of investments for tax and financial reporting purposes differs principally due to the deferral of losses on wash sales.
During the fiscal year ended March 31, 2021, the Plumb Balanced Fund utilized $692,163 of short term capital loss carryforwards. As of March 31, 2021, the Funds had utilized all capital loss carryforwards.
As of March 31, 2021 the Funds did not differ, on a tax basis, any late year ordinary and post-October capital losses.
8. DISTRIBUTIONS TO SHAREHOLDERS
The tax character of distributions paid during the fiscal years ended March 31, 2021 and 2020 was as follows:
| | | | Plumb Balanced Fund | |
| | | | Year Ended | | | Year Ended | |
| | | | March 31, 2021 | | | March 31, 2020 | |
| | Distributions paid from: | | | | | | |
| | Ordinary Income | | $ | 645,094 | | | $ | 1,039,880 | |
| | Long Term Capital Gains | | | — | | | | 1,755,059 | |
| | Total Distributions Paid | | $ | 645,094 | | | $ | 2,794,939 | |
Notes to Financial Statements
March 31, 2021 (Continued)
| | | | Plumb Equity Fund | |
| | | | Year Ended | | | Year Ended | |
| | | | March 31, 2021 | | | March 31, 2020 | |
| | Distributions paid from: | | | | | | |
| | Ordinary Income | | $ | 190,449 | | | $ | — | |
| | Long-Term Capital Gains | | | 3,561,943 | | | | 1,654,811 | |
| | Total Distributions Paid | | $ | 3,752,392 | | | $ | 1,654,811 | |
9. COVID-19
Unexpected events, such as the global outbreak of COVID-19, have caused adverse effects on many companies, sectors, regions, and the market in general, and may cause these effects for an unknown period of time and in ways that cannot be foreseen. The effects may impact the value and performance of the Funds, their ability to buy and sell fund investments at appropriate valuations and their ability to achieve investment objectives.
10. SUBSEQUENT EVENTS
In preparing these financial statements, the Funds have evaluated events and transactions for potential recognition or disclosure through the date the financial statements were issued. Management has determined that there were no material events that would require disclosure in the Fund’s financial statements.
Report of Independent Registered Public Accounting Firm
To the Shareholders and Board of Directors of Wisconsin Capital Funds, Inc.
Opinion on the Financial Statements
We have audited the accompanying statements of assets and liabilities, including the schedules of investments, of Wisconsin Capital Funds, Inc., comprising Plumb Balanced Fund and Plumb Equity Fund (the “Funds”) as of March 31, 2021, the related statements of operations for the year then ended, the statements of changes in net assets for each of the two years in the period then ended, the related notes, and the financial highlights for each of the periods indicated in the period then ended (collectively referred to as the “financial statements”). In our opinion, the financial statements present fairly, in all material respects, the financial position of the each of the Funds as of March 31, 2021, the results of their operations for the year then ended, the changes in net assets for each of the two years in the period then ended, and the financial highlights for each of the periods indicated in the period then ended, in conformity with accounting principles generally accepted in the United States of America.
Basis for Opinion
These financial statements are the responsibility of the Funds’ management. Our responsibility is to express an opinion on the Funds’ financial statements based on our audits. We are a public accounting firm registered with the Public Company Accounting Oversight Board (United States) (“PCAOB”) and are required to be independent with respect to the Funds in accordance with the U.S. federal securities laws and the applicable rules and regulations of the Securities and Exchange Commission and the PCAOB.
We conducted our audits in accordance with the standards of the PCAOB. Those standards require that we plan and perform the audit to obtain reasonable assurance about whether the financial statements are free of material misstatement whether due to error or fraud.
Our audits included performing procedures to assess the risks of material misstatement of the financial statements, whether due to error or fraud, and performing procedures that respond to those risks. Such procedures included examining, on a test basis, evidence regarding the amounts and disclosures in the financial statements. Our procedures included confirmation of securities owned as of March 31, 2021, by correspondence with the custodian and broker. Our audits also included evaluating the accounting principles used and significant estimates made by management, as well as evaluating the overall presentation of the financial statements. We believe that our audits provide a reasonable basis for our opinion.
We have served as the Funds’ auditor since 2007.
COHEN & COMPANY, LTD.
Cleveland, Ohio
May 26, 2021
Additional Information (Unaudited)
| 1. | OPERATION AND EFFECTIVENESS OF THE FUNDS’ LIQUIDITY RISK MANAGEMENT PROGRAM: |
The Funds have adopted a Liquidity Risk Management Program (the “Program”) under Rule 22e-4 under the Investment Company Act of 1940, as amended (the “Liquidity Rule”), that seeks to assess, manage, and review each Fund’s liquidity risk. The Liquidity Rule requires in part that the Board of Directors of the Funds receive a written report on a no-less-frequently-than-annual basis that addresses the operation of the Program and assesses its adequacy and effectiveness of implementation, including the operation of any highly liquid investment minimum established for a Fund and any material changes to the Program.
The Board of Directors of the Funds has appointed Wisconsin Capital Management, LLC’s Compliance Committee as the program administrator for the Program (the “Program Administrator”). At its meetings on May 11, 2020, August 7, 2020, November 6, 2020 and February 12, 2021, the Board of Directors of the Funds reviewed the Program Administrator’s written reports (collectively, the “Report”) relating to the operation of the Program for the period from January 1, 2020 through December 31, 2020 (the “Program Reporting Period”). The Report addressed the operation of the Program and assessed its adequacy and effectiveness of implementation, including that each Fund continues to primarily hold assets that are highly liquid investments. There were no material changes to the Program during the Program Reporting Period and no liquidity events occurring during the Program Reporting Period that affected the Funds or their ability to meet redemptions.
Based on this review, the Report concluded that the Program continues to be reasonably designed to effectively assess and manage each Fund’s liquidity risk and the Program has been adequately and effectively implemented with respect to each Fund during the Program Reporting Period.
| 2. | ADDITIONAL DISCLOSURE REGARDING FUND DIRECTORS AND OFFICERS |
| | | | | Number of | |
| | Position(s) | Term of | | Portfolios | |
| | Held with | Office and | Principal | in Fund | Other |
| Name, | Wisconsin | Length | Occupation(s) | Complex | Directorships |
| Address and | Capital | of Time | During Past | Overseen by | Held by |
Year of Birth | Funds, Inc. | Served(1) | Five Years | Director | Director |
| Independent Directors: | | | | | |
| | | | | | |
| Jay Loewi | Director | Since | Chief Executive | 2 | None |
| Birth date: 1957 | | May 2007 | Officer, QTI | | |
| | | | Group (staffing | | |
| | | | company), since | | |
| | | | November 2007; | | |
| | | | President, QTI | | |
| | | | Group of | | |
| | | | Companies, | | |
| | | | since 2002. | | |
Additional Information (Unaudited) (Continued)
| | | | | Number of | |
| | Position(s) | Term of | | Portfolios | |
| | Held with | Office and | Principal | in Fund | Other |
| Name, | Wisconsin | Length | Occupation(s) | Complex | Directorships |
| Address and | Capital | of Time | During Past | Overseen by | Held by |
Year of Birth | Funds, Inc. | Served(1) | Five Years | Director | Director |
| Harlan J. | Director | Since | Chief Financial | 2 | None |
| Moeckler | | June 2017 | Officer and | | |
| Birth date: 1957 | | | Treasurer of | | |
| | | | TradeLink | | |
| | | | Holdings | | |
| | | | LLC (alternative | | |
| | | | investment and | | |
| | | | proprietary | | |
| | | | trading firm) | | |
| | | | since 2006. | | |
| | | | | | |
| Patrick J. Quinn | Director | Since | Currently | 2 | National |
| Birth date:1949 | | May 2007 | Retired; | | Presto |
| | | | President and | | Industries |
| | | | Chairman of the | | since |
| | | | Board of Ayres | | May 2001. |
| | | | Associates | | |
| | | | (professional | | |
| | | | civil engineering | | |
| | | | firm), from April | | |
| | | | 2000 until | | |
| | | | retirement in | | |
| | | | December 2010. | | |
| | | | | | |
| Roy S. | Director | Since | Currently | 2 | None |
| Schlachtenhaufen | | June 2017 | Retired; | | |
| Birth date: 1949 | | | Senior Portfolio | | |
| | | | Manager at | | |
| | | | US Bancorp | | |
| | | | Investments, | | |
| | | | Inc. (wealth | | |
| | | | management | | |
| | | | firm) from | | |
| | | | 1991 until | | |
| | | | retirement in | | |
| | | | April 2017. | | |
Additional Information (Unaudited) (Continued)
| | | | | Number of | |
| | Position(s) | Term of | | Portfolios | |
| | Held with | Office and | Principal | in Fund | Other |
| Name, | Wisconsin | Length | Occupation(s) | Complex | Directorships |
| Address and | Capital | of Time | During Past | Overseen by | Held by |
Year of Birth | Funds, Inc. | Served(1) | Five Years | Director | Director |
| Interested Directors and Officers: | | | | | |
| | | | | | |
| Thomas G. | Director, | Since | President of | 2 | None |
Plumb(2)(3) | Chairman, | May 2007 | Wisconsin | | |
| Birth date:1952 | President | | Capital | | |
| | and Chief | | Management, | | |
| | Executive | | LLC, since | | |
| | Officer | | January 2004; | | |
| | Secretary | Since | President and | | |
| | | August 1, | Principal of SVA | | |
| | | 2017 | Plumb Wealth | | |
| | | | Management, | | |
| | | | LLC from March | | |
| | | | 2011 – March | | |
| | | | 2019; President | | |
| | | | of SVA Plumb | | |
| | | | Financial, LLC | | |
| | | | (financial and | | |
| | | | trust services | | |
| | | | firm) from | | |
| | | | March 2011 – | | |
| | | | March 2019; | | |
| | | | CEO of SVA | | |
| | | | Plumb Trust | | |
| | | | from Company | | |
| | | | March 2011 – | | |
| | | | March 2019. | | |
Additional Information (Unaudited) (Continued)
| | | | | Number of | |
| | Position(s) | Term of | | Portfolios | |
| | Held with | Office and | Principal | in Fund | Other |
| Name, | Wisconsin | Length | Occupation(s) | Complex | Directorships |
| Address and | Capital | of Time | During Past | Overseen by | Held by |
Year of Birth | Funds, Inc. | Served(1) | Five Years | Director | Director |
| Nathan M. | Director | Since | Principal of | 2 | None |
Plumb(3) | | January | Custer Plumb | | |
| Birth date: 1975 | | 2017 | Financial | | |
| | | | Services from | | |
| | Chief | Since | January 2017 to | | |
| | Financial | August 1, | September 2020; | | |
| | Officer and | 2017 | Chief Operating | | |
| | Treasurer | | Officer, Vice | | |
| | | | President, and | | |
| | | | Corporate | | |
| | | | Secretary | | |
| | | | of Wisconsin | | |
| | | | Capital | | |
| | | | Management, | | |
| | | | LLC from | | |
| | | | January 2015 to | | |
| | | | December 2016; | | |
| | | | Portfolio | | |
| | | | Manager of | | |
| | | | Wisconsin | | |
| | | | Capital | | |
| | | | Management, | | |
| | | | LLC from | | |
| | | | September 2013 | | |
| | | | to December | | |
| | | | 2016; Assistant | | |
| | | | Portfolio | | |
| | | | Manager of | | |
| | | | Wisconsin | | |
| | | | Capital | | |
| | | | Management, | | |
| | | | LLC from 2010 to | | |
| | | | September 2013; | | |
| | | | Associate | | |
| | | | Financial | | |
| | | | Consultant of | | |
| | | | SVA Plumb | | |
| | | | Wealth | | |
| | | | Management, | | |
| | | | LLC from | | |
| | | | March 2011 to | | |
| | | | December 2014. | | |
Additional Information (Unaudited) (Continued)
| | | | | Number of | |
| | Position(s) | Term of | | Portfolios | |
| | Held with | Office and | Principal | in Fund | Other |
| Name, | Wisconsin | Length | Occupation(s) | Complex | Directorships |
| Address and | Capital | of Time | During Past | Overseen by | Held by |
Year of Birth | Funds, Inc. | Served(1) | Five Years | Director | Director |
| Bonnie | Chief | Since | CCO of | N/A | N/A |
| Romani | Compliance | August 1, | Wisconsin | | |
| Birth date: 1970 | Officer | 2018 | Capital | | |
| | | | Management, | | |
| | | | LLC, since | | |
| | | | August 2020; | | |
| | | | Client Service | | |
| | | | Administrator of | | |
| | | | Wisconsin | | |
| | | | Capital | | |
| | | | Management, | | |
| | | | LLC, since | | |
| | | | August 2018; | | |
| | | | State Analyst, | | |
| | | | American Family | | |
| | | | Insurance, from | | |
| | | | February, 2006 | | |
| | | | through March, | | |
| | | | 2018. | | |
The address of each Director and Officer as it relates to the Funds is 8401 Excelsior Drive, Suite 102, Madison, WI 53717.
| (1) | Officers of the Funds serve one-year terms, subject to annual reappointment by the Board of Directors. Directors of the Funds serve a term of indefinite length until their resignation or removal, and stand for re-election by shareholders as and when required under the 1940 Act. |
| (2) | Thomas G. Plumb is an “interested person” of the Funds by virtue of his positions with the Funds and the Advisor. |
| (3) | Nathan M. Plumb is the son of Thomas G. Plumb. Nathan M. Plumb is an “interested person” of the Funds by virtue of this relationship to Thomas G. Plumb. |
Additional Information (Unaudited) (Continued)
The Board of Directors of the Funds has an audit committee and a nominating committee. The audit committee consults with the independent auditors for the Funds on matters pertaining to their audits of the Funds’ annual financial statements and approves all audit and non-audit services to be provided by the independent auditors. The audit committee has adopted a written charter, which is available upon request. The audit committee consists of Jay Loewi, Harlan Moeckler (Chair), Patrick J. Quinn and Roy Schlachtenhaufen none of whom is an “interested” person of the Funds. Harlan J. Moeckler has been determined by the Board to be an audit committee financial expert.
The nominating committee considers and recommends nominees for directors to the Board to fill vacancies and for election and re-election as and when required. All nominations of directors who are not “interested persons” of the Funds must be made and approved by the nominating committee. The nominating committee has not established any specific, minimum qualifications or standards for director nominees. The nominating committee has adopted a written charter, which is available upon request. No policy or procedure has been established as to the recommendation of director nominees by shareholders, except that nominations of directors who are not “interested persons” of the Funds must be made and approved by the nominating committee. The nominating committee consists of Jay Loewi (Chair), Harlan Moeckler, Patrick J. Quinn and Roy Schlachtenhaufen none of whom is an “interested” person of the Funds.
3. QUALIFIED DIVIDEND INCOME/DIVIDENDS RECEIVED DEDUCTION
For the fiscal year ended March 31, 2021, certain dividends paid by the Funds may be subject to a maximum tax rate of 23.8% (which includes a 3.8% Medicare tax). The percentage of dividends declared from ordinary income designated as qualified dividend income was as follows:
| | Plumb Balanced Fund | 98.63% | |
| | Plumb Equity Fund | 13.53% | |
For corporate shareholders, the percent of ordinary income distributions qualifying for the corporate dividends-received deduction for the fiscal year ended March 31, 2021, was as follows:
| | Plumb Balanced Fund | 76.82% | |
| | Plumb Equity Fund | 13.17% | |
(This Page Intentionally Left Blank.)
WISCONSIN CAPITAL FUNDS, INC.
c/o U.S. Bank Global Fund Services
P.O. Box 701
Milwaukee, WI 53201
1-866-987-7888
INVESTMENT ADVISOR
Wisconsin Capital Management, LLC
8401 Excelsior Drive, Suite 102
Madison, WI 53717
(608) 960-4616
DISTRIBUTOR
Quasar Distributors, LLC
111 East Kilbourn Avenue, Suite 2200
Milwaukee, WI 53202
CUSTODIAN
U.S. Bank National Association
1555 North Rivercenter Drive
Suite 302
Milwaukee, WI 53212
TRANSFER AGENT AND
DIVIDEND DISBURSING AGENT
U.S. Bank Global Fund Services
615 East Michigan Street
Milwaukee, WI 53202
INDEPENDENT REGISTERED PUBLIC ACCOUNTING FIRM
Cohen & Company, Ltd.
1350 Euclid Avenue, Suite 800
Cleveland, OH 44115
LEGAL COUNSEL
Quarles & Brady LLP
411 East Wisconsin Avenue
Milwaukee, WI 53202
This report has been prepared for shareholders and may be distributed to others only if preceded or accompanied by a current prospectus.
The Funds’ Statement of Additional Information contains additional information about the Funds’ directors and officers and is available, without charge, at www.plumbfunds.com or upon request by calling 1-866-987-7888.
The Funds’ Proxy Voting Policies and Procedures are available without charge upon request by calling 1-866-987-7888 and on the SEC’s website at www.sec.gov. Information regarding how the Funds voted proxies relating to portfolio securities during the 12-month period ended June 30, 2020 is available by calling 1-866-987-7888 and on the SEC’s website at www.sec.gov.
The Funds’ complete schedule of portfolio holdings for the first and third quarters is filed with the SEC on Form N-PORT Part F. The Funds’ Form N-PORT Part F is available on the SEC’s website at www.sec.gov.
(b) Not applicable
Item 2. Code of Ethics.
The registrant has adopted a code of ethics that applies to the registrant’s principal executive officer and principal financial officer. The registrant has not made any substantive amendments to its code of ethics during the period covered by this report. The registrant’s Code of Ethics, as defined in Item 2(b) of Form N-CSR, and any amendments or waivers thereto are available on the registrant’s website at www.plumbfunds.com.
Item 3. Audit Committee Financial Expert.
The registrant’s board of directors has determined that there is at least one audit committee financial expert serving on its audit committee. Harlan Moeckler is the “audit committee financial expert” and is considered to be “independent” as each term is defined in Item 3 of Form N‑CSR.
Item 4. Principal Accountant Fees and Services.
The registrant has engaged its principal accountant to perform audit services, audit-related services, tax services and other services during the past two fiscal years. “Audit services” refer to performing an audit of the registrant's annual financial statements or services that are normally provided by the accountant in connection with statutory and regulatory filings or engagements for those fiscal years. “Audit-related services” refer to the assurance and related services by the principal accountant that are reasonably related to the performance of the audit. “Tax services” refer to professional services rendered by the principal accountant for tax compliance, tax advice, and tax planning. The following table details the aggregate fees billed or expected to be billed for each of the last two fiscal years for audit fees, audit-related fees, tax fees and other fees by the principal accountant.
| | FYE 3/31/2021 | FYE 3/31/2020 |
Audit Fees | $27,500 | $26,000 |
Audit-Related Fees | $0 | $0 |
Tax Fees | $5,000 | $5,000 |
All Other Fees | $0 | $2,000 |
The audit committee has adopted pre-approval policies and procedures that require the audit committee to pre‑approve all audit and non‑audit services of the registrant, including services provided to any entity affiliated with the registrant.
The percentage of fees billed by Cohen & Co applicable to non-audit services pursuant to waiver of pre-approval requirement were as follows:
| | FYE 3/31/2021 | FYE 3/31/2020 |
Audit-Related Fees | 0% | 0% |
Tax Fees | 0% | 0% |
All Other Fees | 0% | 0% |
All of the principal accountant’s hours spent on auditing the registrant’s financial statements were attributed to work performed by full‑time permanent employees of the principal accountant.
The following table indicates the non-audit fees billed or expected to be billed by the registrant’s accountant for services to the registrant and to the registrant’s investment adviser (and any other controlling entity, etc.—not sub-adviser) for the last two years. The audit committee of the board of directors has considered whether the provision of non-audit services that were rendered to the registrant's investment adviser is compatible with maintaining the principal accountant's independence and has concluded that the provision of such non-audit services by the accountant has not compromised the accountant’s independence.
Non-Audit Related Fees | FYE 3/31/2021 | FYE 3/31/2020 |
Registrant | $0 | $2,000 |
Registrant’s Investment Adviser | $0 | $0 |
The registrant has not been identified by the U.S. Securities and Exchange Commission as having filed an annual report issued by a registered public accounting firm branch or office that is located in a foreign jurisdiction where the Public Company Accounting Oversight Board is unable to inspect or completely investigate because of a position taken by an authority in that jurisdiction.
The registrant is not a foreign issuer.
Item 5. Audit Committee of Listed Registrants.
Not applicable to registrants who are not listed issuers (as defined in Rule 10A-3 under the Securities Exchange Act of 1934).
Item 6. Investments.
Schedule of Investments is included as part of the report to shareholders filed under Item 1 of this Form.
Item 7. Disclosure of Proxy Voting Policies and Procedures for Closed-End Management Investment Companies.
Not applicable to open-end investment companies.
Item 8. Portfolio Managers of Closed-End Management Investment Companies.
Not applicable to open-end investment companies.
Item 9. Purchases of Equity Securities by Closed‑End Management Investment Company and Affiliated Purchasers.
Not applicable to open-end investment companies.
Item 10. Submission of Matters to a Vote of Security Holders.
There have been no material changes to the procedures by which shareholders may recommend nominees to the registrant’s board of directors.
Item 11. Controls and Procedures.
(a) | The Registrant’s President and Principal Financial Officer have reviewed the Registrant's disclosure controls and procedures (as defined in Rule 30a-3(c) under the Investment Company Act of 1940 (the “Act”)) as of a date within 90 days of the filing of this report, as required by Rule 30a-3(b) under the Act and Rules 13a-15(b) or 15d‑15(b) under the Securities Exchange Act of 1934. Based on their review, such officers have concluded that the disclosure controls and procedures are effective in ensuring that information required to be disclosed in this report is appropriately recorded, processed, summarized and reported and made known to them by others within the Registrant and by the Registrant’s service provider. |
(b) | There were no changes in the Registrant's internal control over financial reporting (as defined in Rule 30a-3(d) under the Act) that occurred during the period covered by this report that have materially affected, or are reasonably likely to materially affect, the Registrant's internal control over financial reporting. |
Item 12. Disclosure of Securities Lending Activities for Closed-End Management Investment Companies
Not applicable to open-end investment companies.
Item 13. Exhibits.
(3) Any written solicitation to purchase securities under Rule 23c‑1 under the Act sent or given during the period covered by the report by or on behalf of the registrant to 10 or more persons. Not applicable to open-end investment companies.
(4) There was no change in the registrant’s independent public accountant for the period covered by this report.
SIGNATURES
Pursuant to the requirements of the Securities Exchange Act of 1934 and the Investment Company Act of 1940, the registrant has duly caused this report to be signed on its behalf by the undersigned, thereunto duly authorized.
(Registrant) Wisconsin Capital Funds, Inc.
By (Signature and Title)* /s/Thomas G. Plumb
Thomas G. Plumb, President (Principal Executive Officer)
Date June 2, 2021
Pursuant to the requirements of the Securities Exchange Act of 1934 and the Investment Company Act of 1940, this report has been signed below by the following persons on behalf of the registrant and in the capacities and on the dates indicated.
By (Signature and Title)* /s/Thomas G. Plumb
Thomas G. Plumb, President (Principal Executive Officer)
Date June 2, 2021
By (Signature and Title)* /s/Nathan Plumb
Nathan Plumb, Chief Financial Officer (Principal Financial Officer)
Date June 2, 2021