UNITED STATES
SECURITIES AND EXCHANGE COMMISSION
Washington, D.C. 20549
FORM N-CSR
CERTIFIED SHAREHOLDER REPORT OF REGISTERED
MANAGEMENT INVESTMENT COMPANIES
Investment Company Act file number 811-22083
Fidelity Central Investment Portfolios II LLC
(Exact name of registrant as specified in charter)
245 Summer St., Boston, Massachusetts 02210
(Address of principal executive offices) (Zip code)
Margaret Carey, Secretary
245 Summer St.
Boston, Massachusetts 02210
(Name and address of agent for service)
Registrant's telephone number, including area code:
617-563-7000
| |
Date of fiscal year end: | December 31 |
|
|
Date of reporting period: | December 31, 2023 |
Item 1.
Reports to Stockholders
Fidelity® International Credit Central Fund
Annual Report
December 31, 2023
Contents
To view a fund's proxy voting guidelines and proxy voting record for the 12-month period ended June 30, visit http://www.fidelity.com/proxyvotingresults or visit the Securities and Exchange Commission's (SEC) web site at http://www.sec.gov.
You may also call 1-800-544-8544 to request a free copy of the proxy voting guidelines.
Standard & Poor's, S&P and S&P 500 are registered service marks of The McGraw-Hill Companies, Inc. and have been licensed for use by Fidelity Distributors Corporation.
Other third-party marks appearing herein are the property of their respective owners.
All other marks appearing herein are registered or unregistered trademarks or service marks of FMR LLC or an affiliated company. © 2024 FMR LLC. All rights reserved.
A fund files its complete schedule of portfolio holdings with the SEC for the first and third quarters of each fiscal year on Form N-PORT. Forms N-PORT are available on the SEC's web site at http://www.sec.gov. A fund's Forms N-PORT may be reviewed and copied at the SEC's Public Reference Room in Washington, DC. Information regarding the operation of the SEC's Public Reference Room may be obtained by calling 1-800-SEC-0330.
Average annual total return reflects the change in the value of an investment, assuming reinvestment of distributions from dividend income and capital gains (the profits earned upon the sale of securities that have grown in value, if any) and assuming a constant rate of performance each year. The hypothetical investment and the average annual total returns do not reflect the deduction of taxes that a shareholder would pay on fund distributions or the redemption of fund shares. During periods of reimbursement by Fidelity, a fund's total return will be greater than it would be had the reimbursement not occurred. How a fund did yesterday is no guarantee of how it will do tomorrow.
| Average Annual Total Returns |
| | | | |
Periods ended December 31, 2023 | Past 1 year | Past 5 years | Life of Fund A |
| Fidelity® International Credit Central Fund | 7.02% | 1.59% | 1.37% |
A From June 13, 2017
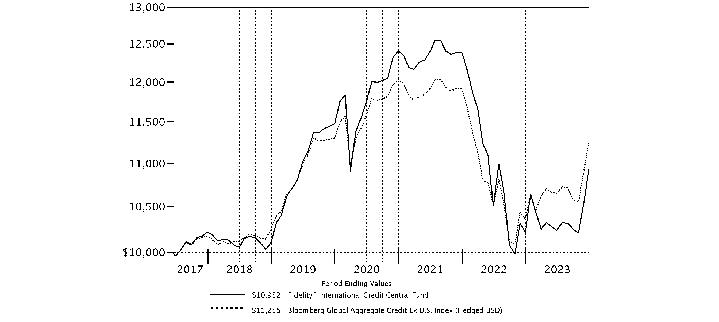
| $10,000 Over Life of Fund |
| |
Let's say hypothetically that $10,000 was invested in Fidelity® International Credit Central Fund, on June 13, 2017, when the fund started. The chart shows how the value of your investment would have changed, and also shows how the Bloomberg Global Aggregate Credit Ex U.S. Index (Hedged USD) performed over the same period. |
|
|
Market Recap:
Global investment-grade bonds gained 8.68% in 2023, according to the Bloomberg Global Aggregate Credit Index (Hedged USD), as falling commodity prices, cooling inflation and the easing of monetary tightening efforts by the U.S. Federal Reserve and other central banks provided a favorable backdrop for global credit assets. The strong gain followed a difficult 2022, during which the index returned -14.22%. The 2023 advance was driven by a powerful rally in the year's final two months, but the 12-month period was marked by high levels of volatility. The bond market saw sluggish returns for much of the year, including sharp sell-offs in September and October after the U.S. Fed temporarily adopted a "higher for longer" message on interest rates. But after the Fed struck a more optimistic tone at its committee meetings in November and December, a strong relief rally followed, as investors priced in the expectation of rate cuts in 2024. That said, the magnitude of future global easing remains uncertain at year-end. Between March 2022 and July 2023, the Fed hiked its benchmark interest rate 11 times, from a target range of 0% to 0.25% to a range of 5.25% to 5.50%, a 22-year high, before pausing and deciding to hold rates steady through year-end. To varying degrees, other major central banks have followed the Fed's lead: the Bank of England's benchmark rate stood at 5.25% at year-end, while the European Central Bank's was at 4% after policymakers paused increases in October.
Comments from Co-Portfolio Managers Michael Foggin, Lisa Easterbrook and Andrew Lewis:
For the year, the fund returned roughly 7%, lagging, net of fees, the 8.70% result of the benchmark, the Bloomberg Global Aggregate Credit Ex US Index (Hedged USD). At year-end, about 68% of the portfolio was in corporate bond holdings, while 11% was in non-benchmark exposure to U.S. government bonds and roughly 6.5% in non-U.S. government securities. The fund also had about a 5% allocation to cash as of December 31. Roughly 49% of the fund was invested in investment-grade securities rates A and above, while about 47% was in bonds rated BBB and lower. Versus the Bloomberg benchmark, the largest individual relative detractor was a sizable sub-investment-grade stake in Credit Suisse. In March, Swiss regulators orchestrated the bank's takeover by its chief Swiss banking rival, UBS Group, resulting in the loss of our sub-investment-grade position. Holdings in the debt of European property company Heimstaden also detracted from the relative result. Conversely, an overweight stake in senior Credit Suisse bonds, which were folded into the new UBS Group, contributed to the fund's relative result. Top fund holdings at the end of the year included the European Investment Bank, KfW, Swiss Re, John Lewis and NatWest Group.
The views expressed above reflect those of the portfolio manager(s) only through the end of the period as stated on the cover of this report and do not necessarily represent the views of Fidelity or any other person in the Fidelity organization. Any such views are subject to change at any time based upon market or other conditions and Fidelity disclaims any responsibility to update such views. These views may not be relied on as investment advice and, because investment decisions for a Fidelity fund are based on numerous factors, may not be relied on as an indication of trading intent on behalf of any Fidelity fund.
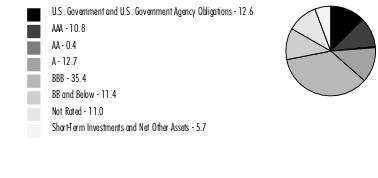
Quality Diversification (% of Fund's net assets) |
|
| |
| We have used ratings from Moody's Investors Service, Inc. Where Moody's® ratings are not available, we have used S&P® ratings. All ratings are as of the date indicated and do not reflect subsequent changes. |
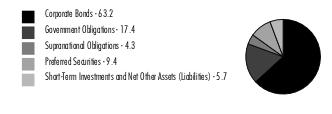
Asset Allocation (% of Fund's net assets) |
|
Futures and Swaps - 23.4% |
Forward foreign currency contracts - (68.4)% |
|
Geographic Diversification (% of Fund's net assets) |
|
* Includes Short-Term investments and Net Other Assets (Liabilities). Percentages are adjusted for the effect of derivatives, if applicable. |
| |
Forward foreign currency contracts and other assets and liabilities are included within United States of America, as applicable.
Showing Percentage of Net Assets
| Nonconvertible Bonds - 63.2% |
| | | Principal Amount (a) | Value ($) |
| Australia - 1.5% | | | |
| AusNet Services Holdings Pty Ltd. 1.625% 3/11/81 (Reg. S) (b) | EUR | 300,000 | 298,360 |
| Leighton Finance U.S.A. Pty Ltd. 1.5% 5/28/29 (Reg. S) | EUR | 1,070,000 | 1,019,579 |
| QBE Insurance Group Ltd.: | | | |
| 2.5% 9/13/38 (Reg. S) (b) | GBP | 825,000 | 890,879 |
| 6.75% 12/2/44 (Reg. S) (b) | | 1,400,000 | 1,391,250 |
TOTAL AUSTRALIA | | | 3,600,068 |
| Belgium - 0.8% | | | |
| KBC Group NV 6.324% 9/21/34 (b)(c) | | 1,720,000 | 1,816,635 |
| Denmark - 1.3% | | | |
| Danske Bank A/S: | | | |
| 2.25% 1/14/28 (Reg. S) (b) | GBP | 1,595,000 | 1,855,082 |
| 4.625% 4/13/27 (Reg. S) (b) | GBP | 565,000 | 713,866 |
| 4.75% 6/21/30 (Reg. S) (b) | EUR | 510,000 | 593,282 |
TOTAL DENMARK | | | 3,162,230 |
| Finland - 0.6% | | | |
| Nordea Bank Abp 4.125% 5/5/28 (Reg. S) | EUR | 1,365,000 | 1,555,528 |
| France - 5.7% | | | |
| BNP Paribas SA: | | | |
| 2.159% 9/15/29 (b)(c) | | 1,380,000 | 1,200,266 |
| 2.5% 3/31/32 (Reg. S) (b) | EUR | 700,000 | 730,800 |
| 4.125% 5/24/33 (Reg. S) | EUR | 900,000 | 1,046,859 |
| BPCE SA 1.5% 1/13/42 (Reg. S) (b) | EUR | 1,000,000 | 1,000,642 |
| Electricite de France SA: | | | |
| 5.5% 1/25/35 (Reg. S) | GBP | 1,600,000 | 2,057,591 |
| 5.7% 5/23/28 (c) | | 558,000 | 577,333 |
| 6.25% 5/23/33 (c) | | 635,000 | 687,189 |
| Engie SA 4.25% 9/6/34 (Reg. S) | EUR | 1,100,000 | 1,286,919 |
| Holding d'Infrastructures et des Metiers de l'Environnement 0.625% 9/16/28 (Reg. S) | EUR | 645,000 | 618,207 |
| Lagardere S.C.A. 1.75% 10/7/27 (Reg. S) | EUR | 1,500,000 | 1,649,715 |
| Societe Generale: | | | |
| 4.75% 11/24/25 (c) | | 1,220,000 | 1,194,758 |
| 6.691% 1/10/34 (b)(c) | | 1,145,000 | 1,209,080 |
| Technip Energies NV 1.125% 5/28/28 | EUR | 550,000 | 547,319 |
TOTAL FRANCE | | | 13,806,678 |
| Germany - 10.3% | | | |
| ACCENTRO Real Estate AG 5.625% 2/13/26 (Reg. S) | EUR | 2,242,800 | 962,521 |
| AGPS BondCo PLC 4.625% 1/14/26 (Reg. S) (b) | EUR | 4,600,000 | 1,754,508 |
| Bayer AG 4.625% 5/26/33 (Reg. S) | EUR | 520,000 | 598,975 |
| Bayer U.S. Finance LLC 6.375% 11/21/30 (c) | | 800,000 | 823,087 |
| Commerzbank AG 8.625% 2/28/33 (Reg. S) (b) | GBP | 600,000 | 812,397 |
| Deutsche Bank AG: | | | |
| 3.25% 5/24/28 (Reg. S) (b) | EUR | 1,700,000 | 1,836,069 |
| 6.125% 12/12/30 (Reg. S) (b) | GBP | 2,000,000 | 2,581,023 |
| EnBW Energie Baden-Wuerttemberg AG 1.375% 8/31/81 (Reg. S) (b) | EUR | 1,300,000 | 1,223,344 |
| KfW: | | | |
| 0% 3/31/27 (Reg. S) | EUR | 1,520,000 | 1,552,600 |
| 0% 9/17/30 (Reg. S) | EUR | 2,000,000 | 1,874,313 |
| 0.75% 1/15/29 (Reg. S) | EUR | 4,520,000 | 4,597,113 |
| 2.875% 5/29/26 (Reg. S) | EUR | 1,290,000 | 1,436,118 |
| Robert Bosch GmbH 4.375% 6/2/43 (Reg. S) | EUR | 800,000 | 946,793 |
| Schaeffler AG 3.375% 10/12/28 (Reg. S) | EUR | 1,100,000 | 1,174,879 |
| Sirius Real Estate Ltd. 1.125% 6/22/26 (Reg. S) | EUR | 800,000 | 795,780 |
| Vonovia SE 5% 11/23/30 (Reg. S) | EUR | 500,000 | 582,573 |
| ZF Europe Finance BV 2% 2/23/26 (Reg. S) | EUR | 500,000 | 525,756 |
| ZF Finance GmbH 2% 5/6/27 (Reg. S) | EUR | 700,000 | 713,052 |
TOTAL GERMANY | | | 24,790,901 |
| Greece - 0.4% | | | |
| Alpha Bank SA 4.25% 2/13/30 (Reg. S) (b) | EUR | 930,000 | 1,000,350 |
| Hong Kong - 0.7% | | | |
| Prudential Funding Asia PLC 2.95% 11/3/33 (Reg. S) (b) | | 1,790,000 | 1,568,735 |
| Ireland - 3.5% | | | |
| AIB Group PLC: | | | |
| 1.875% 11/19/29 (Reg. S) (b) | EUR | 760,000 | 815,367 |
| 2.25% 4/4/28 (Reg. S) (b) | EUR | 2,595,000 | 2,745,812 |
| 6.608% 9/13/29 (b)(c) | | 1,125,000 | 1,185,134 |
| Bank of Ireland Group PLC: | | | |
| 1.375% 8/11/31 (Reg. S) (b) | EUR | 3,185,000 | 3,277,269 |
| 2.029% 9/30/27 (b)(c) | | 515,000 | 469,579 |
TOTAL IRELAND | | | 8,493,161 |
| Italy - 0.4% | | | |
| UniCredit SpA 2.731% 1/15/32 (Reg. S) (b) | EUR | 1,024,000 | 1,059,679 |
| Luxembourg - 2.1% | | | |
| Alpha Trains Finance SA 2.064% 6/30/30 | EUR | 604,000 | 633,852 |
| Blackstone Property Partners Europe LP: | | | |
| 1% 5/4/28 (Reg. S) | EUR | 2,835,000 | 2,618,794 |
| 1.75% 3/12/29 (Reg. S) | EUR | 1,305,000 | 1,210,602 |
| 2.625% 10/20/28 (Reg. S) | GBP | 660,000 | 716,845 |
TOTAL LUXEMBOURG | | | 5,180,093 |
| Mexico - 1.3% | | | |
| Petroleos Mexicanos 6.5% 3/13/27 | | 3,335,000 | 3,099,466 |
| Netherlands - 2.9% | | | |
| ING Groep NV: | | | |
| 4.5% 5/23/29 (Reg. S) (b) | EUR | 400,000 | 454,907 |
| 4.75% 5/23/34 (Reg. S) (b) | EUR | 3,100,000 | 3,638,059 |
| JDE Peet's BV 2.25% 9/24/31 (c) | | 224,000 | 179,402 |
| Rabobank Nederland 4% 1/10/30 (Reg. S) | EUR | 1,000,000 | 1,139,619 |
| REWE International Finance 4.875% 9/13/30 (Reg. S) | EUR | 700,000 | 818,505 |
| Universal Music Group NV 4% 6/13/31 (Reg. S) | EUR | 750,000 | 865,259 |
TOTAL NETHERLANDS | | | 7,095,751 |
| Poland - 0.4% | | | |
| GTC Aurora Luxembourg SA 2.25% 6/23/26 (Reg. S) | EUR | 1,215,000 | 966,406 |
| Portugal - 0.2% | | | |
| Fidelidade-Companhia de Seguros SA 4.25% 9/4/31 (Reg. S) (b) | EUR | 500,000 | 495,868 |
| Spain - 0.7% | | | |
| Werfenlife SA 4.625% 6/6/28 (Reg. S) | EUR | 1,400,000 | 1,574,320 |
| Sweden - 0.8% | | | |
| Heimstaden AB 4.375% 3/6/27 (Reg. S) | EUR | 1,800,000 | 817,696 |
| Samhallsbyggnadsbolaget I Norden AB: | | | |
| 1.75% 1/14/25 (Reg. S) | EUR | 769,000 | 730,100 |
| 2.25% 8/12/27 (Reg. S) | EUR | 350,000 | 258,845 |
TOTAL SWEDEN | | | 1,806,641 |
| Switzerland - 5.0% | | | |
| Cloverie PLC 4.5% 9/11/44 (Reg. S) (b) | | 3,512,000 | 3,461,638 |
| Demeter Investments BV: | | | |
| 5.625% 8/15/52 (Reg. S) (b) | | 1,020,000 | 988,368 |
| 5.75% 8/15/50 (Reg. S) (b) | | 2,010,000 | 1,980,212 |
| UBS Group AG: | | | |
| 2.125% 11/15/29 (Reg. S) (b) | GBP | 1,000,000 | 1,128,524 |
| 4.194% 4/1/31 (b)(c) | | 1,065,000 | 991,561 |
| 4.75% 3/17/32 (Reg. S) (b) | EUR | 1,535,000 | 1,783,968 |
| 4.988% 8/5/33 (Reg. S) (b) | | 500,000 | 483,415 |
| 6.537% 8/12/33 (b)(c) | | 470,000 | 501,564 |
| Zurich Finance (Ireland) DAC 3.5% 5/2/52 (Reg. S) (b) | | 970,000 | 788,969 |
TOTAL SWITZERLAND | | | 12,108,219 |
| United Kingdom - 21.5% | | | |
| Admiral Group PLC 8.5% 1/6/34 (Reg. S) | GBP | 450,000 | 629,681 |
| Anglian Water (Osprey) Financing PLC 2% 7/31/28 (Reg. S) | GBP | 465,000 | 483,593 |
| Barclays PLC: | | | |
| 5.262% 1/29/34 (Reg. S) (b) | EUR | 1,930,000 | 2,279,239 |
| 7.437% 11/2/33 (b) | | 650,000 | 727,821 |
| 8.407% 11/14/32 (Reg. S) (b) | GBP | 445,000 | 604,492 |
| Heathrow Funding Ltd.: | | | |
| 2.625% 3/16/28 (Reg. S) | GBP | 1,395,000 | 1,579,924 |
| 7.125% 2/14/24 | GBP | 750,000 | 956,771 |
| HSBC Holdings PLC: | | | |
| 4.787% 3/10/32 (Reg. S) (b) | EUR | 1,420,000 | 1,656,775 |
| 4.856% 5/23/33 (Reg. S) (b) | EUR | 1,660,000 | 1,943,826 |
| 6.8% 9/14/31 (b) | GBP | 360,000 | 494,400 |
| 8.201% 11/16/34 (Reg. S) (b) | GBP | 585,000 | 822,385 |
| Imperial Brands Finance Netherlands BV 5.25% 2/15/31 (Reg. S) | EUR | 1,000,000 | 1,141,590 |
| Imperial Tobacco Finance PLC 3.5% 7/26/26 (c) | | 1,052,000 | 1,003,537 |
| InterContinental Hotel Group PLC 3.375% 10/8/28 (Reg. S) | GBP | 660,000 | 783,622 |
| John Lewis PLC 6.125% 1/21/25 | GBP | 4,297,000 | 5,456,331 |
| Lloyds Banking Group PLC: | | | |
| 1.985% 12/15/31 (b) | GBP | 710,000 | 811,776 |
| 4.5% 1/11/29 (Reg. S) (b) | EUR | 675,000 | 773,494 |
| 4.75% 9/21/31 (Reg. S) (b) | EUR | 2,400,000 | 2,798,693 |
| Marks & Spencer PLC 4.5% 7/10/27 (Reg. S) | GBP | 880,000 | 1,080,793 |
| Mobico Group PLC 4.875% 9/26/31 (Reg. S) | EUR | 1,650,000 | 1,845,525 |
| NatWest Group PLC: | | | |
| 2.105% 11/28/31 (Reg. S) (b) | GBP | 1,655,000 | 1,878,394 |
| 3.622% 8/14/30 (Reg. S) (b) | GBP | 615,000 | 749,590 |
| 4.771% 2/16/29 (Reg. S) (b) | EUR | 1,535,000 | 1,760,983 |
| 7.416% 6/6/33 (Reg. S) (b) | GBP | 885,000 | 1,177,616 |
| NGG Finance PLC 2.125% 9/5/82 (Reg. S) (b) | EUR | 1,440,000 | 1,440,432 |
| Reckitt Benckiser Treasury Services PLC 3.875% 9/14/33 (Reg. S) | EUR | 845,000 | 987,711 |
| Rolls-Royce PLC 3.375% 6/18/26 | GBP | 970,000 | 1,172,810 |
| Severn Trent Utilities Finance PLC: | | | |
| 4.625% 11/30/34 (Reg. S) | GBP | 500,000 | 622,213 |
| 6.125% 2/26/24 | GBP | 385,000 | 490,853 |
| Southern Water Services Finance Ltd. 1.625% 3/30/27 (Reg. S) | GBP | 576,000 | 646,994 |
| SW Finance I PLC 7.375% 12/12/41 (Reg. S) | GBP | 352,000 | 479,636 |
| Tesco Corporate Treasury Services PLC: | | | |
| 2.75% 4/27/30 (Reg. S) | GBP | 985,000 | 1,108,997 |
| 5.5% 2/27/35 (Reg. S) | GBP | 300,000 | 386,492 |
| Thames Water Utility Finance PLC 1.875% 1/24/24 (Reg. S) | GBP | 770,000 | 972,272 |
| The Berkeley Group PLC 2.5% 8/11/31 (Reg. S) | GBP | 1,330,000 | 1,305,457 |
| Travis Perkins PLC 3.75% 2/17/26 (Reg. S) | GBP | 862,000 | 1,033,922 |
| Tritax EuroBox PLC 0.95% 6/2/26 (Reg. S) | EUR | 610,000 | 611,403 |
| Virgin Money UK PLC 7.625% 8/23/29 (Reg. S) (b) | GBP | 1,260,000 | 1,707,363 |
| Vodafone Group PLC: | | | |
| 4.875% 10/3/78 (Reg. S) (b) | GBP | 275,000 | 340,491 |
| 6.25% 10/3/78 (Reg. S) (b) | | 1,109,000 | 1,102,069 |
| Whitbread PLC: | | | |
| 2.375% 5/31/27 (Reg. S) | GBP | 645,000 | 748,416 |
| 3.375% 10/16/25 (Reg. S) | GBP | 2,710,000 | 3,342,534 |
TOTAL UNITED KINGDOM | | | 51,940,916 |
| United States of America - 3.1% | | | |
| Blackstone Private Credit Fund 4.875% 4/14/26 | GBP | 1,295,000 | 1,576,510 |
| Carrier Global Corp. 4.5% 11/29/32 (Reg. S) | EUR | 425,000 | 501,779 |
| Duke Energy Corp. 3.85% 6/15/34 | EUR | 905,000 | 987,208 |
| Ford Motor Credit Co. LLC 6.86% 6/5/26 | GBP | 790,000 | 1,038,049 |
| General Motors Financial Co., Inc. 5.15% 8/15/26 (Reg. S) | GBP | 375,000 | 480,089 |
| Morgan Stanley 4.656% 3/2/29 (b) | EUR | 725,000 | 830,675 |
| MPT Operating Partnership LP/MPT Finance Corp. 2.5% 3/24/26 | GBP | 930,000 | 961,474 |
| Southern Co. 1.875% 9/15/81 (b) | EUR | 1,135,000 | 1,073,055 |
TOTAL UNITED STATES OF AMERICA | | | 7,448,839 |
| TOTAL NONCONVERTIBLE BONDS (Cost $162,213,071) | | | 152,570,484 |
| | | | |
| U.S. Government and Government Agency Obligations - 12.6% |
| | | Principal Amount (a) | Value ($) |
| U.S. Treasury Obligations - 12.6% | | | |
| U.S. Treasury Bonds: | | | |
| 1.125% 8/15/40 | | 1,500,000 | 957,422 |
| 2.25% 8/15/46 | | 190,000 | 135,086 |
| 3.625% 5/15/53 | | 300,000 | 277,359 |
| 3.875% 5/15/43 | | 4,200,000 | 4,012,055 |
| 4.375% 8/15/43 | | 3,245,000 | 3,312,435 |
| 6.25% 5/15/30 (d)(e) | | 5,750,000 | 6,499,740 |
| U.S. Treasury Notes: | | | |
| 1% 7/31/28 | | 5,000,000 | 4,397,852 |
| 3.875% 8/15/33 | | 800,000 | 799,000 |
| 4.125% 1/31/25 | | 4,200,000 | 4,173,750 |
| 4.375% 11/30/28 | | 2,800,000 | 2,865,188 |
| 4.875% 10/31/28 | | 1,900,000 | 1,983,273 |
| 5% 9/30/25 | | 1,000,000 | 1,010,195 |
| | | | |
| TOTAL U.S. GOVERNMENT AND GOVERNMENT AGENCY OBLIGATIONS (Cost $29,719,401) | | | 30,423,355 |
| | | | |
| Foreign Government and Government Agency Obligations - 4.8% |
| | | Principal Amount (a) | Value ($) |
| Germany - 3.3% | | | |
| German Federal Republic: | | | |
| 0% 5/15/35 (Reg. S) | EUR | 2,055,000 | 1,786,654 |
| 1% 5/15/38(Reg. S) | EUR | 2,050,000 | 1,923,859 |
| 1.25% 8/15/48 (d)(e) | EUR | 4,450,000 | 3,990,280 |
| 3.25% 7/4/42 | EUR | 300,000 | 378,212 |
TOTAL GERMANY | | | 8,079,005 |
| Japan - 1.5% | | | |
| Japan Government, yield at date of purchase -0.1896% to -0.1796% 2/5/24 to 2/26/24 | JPY | 510,650,000 | 3,622,321 |
| TOTAL FOREIGN GOVERNMENT AND GOVERNMENT AGENCY OBLIGATIONS (Cost $14,053,157) | | | 11,701,326 |
| | | | |
| Supranational Obligations - 4.3% |
| | | Principal Amount (a) | Value ($) |
| European Investment Bank: | | | |
| 0% 3/13/26 (Reg. S) | EUR | 4,000,000 | 4,187,044 |
| 0% 6/17/27 | EUR | 4,200,000 | 4,274,435 |
| 0% 1/14/31 (Reg. S) | EUR | 800,000 | 742,602 |
| 0.625% 1/22/29 (Reg. S) | EUR | 800,000 | 808,918 |
| European Union 2.75% 10/5/26 (Reg. S) | EUR | 300,000 | 333,678 |
| TOTAL SUPRANATIONAL OBLIGATIONS (Cost $9,995,531) | | | 10,346,677 |
| | | | |
| Preferred Securities - 9.4% |
| | | Principal Amount (a) | Value ($) |
| Australia - 0.4% | | | |
| QBE Insurance Group Ltd. 5.25% (Reg. S) (b)(f) | | 1,070,000 | 1,025,918 |
| Canada - 0.5% | | | |
| Bank of Nova Scotia: | | | |
| CME Term SOFR 3 Month Index + 2.900% 8.3354% (b)(f)(g) | | 850,000 | 784,439 |
| 4.9% (b)(f) | | 440,000 | 421,884 |
TOTAL CANADA | | | 1,206,323 |
| Czech Republic - 0.1% | | | |
| CPI Property Group SA 3.75% (Reg. S) (b)(f) | EUR | 1,300,000 | 339,026 |
| Finland - 0.2% | | | |
| Citycon Oyj 4.496% (Reg. S) (b)(f) | EUR | 565,000 | 503,698 |
| France - 1.1% | | | |
| BNP Paribas SA 6.625% (Reg. S) (b)(f) | | 1,015,000 | 1,028,029 |
| Electricite de France SA 5.625% (Reg. S) (b)(f) | | 1,490,000 | 1,522,934 |
TOTAL FRANCE | | | 2,550,963 |
| Germany - 3.3% | | | |
| Aroundtown SA 3.375% (Reg. S) (b)(f) | EUR | 3,000,000 | 1,340,902 |
| AT Securities BV USD SWAP SEMI 30/360 5Y INDX + 3.540% 7.747% (Reg. S) (b)(f)(g) | | 3,000,000 | 1,473,700 |
| Grand City Properties SA 1.5% (Reg. S) (b)(f) | EUR | 2,200,000 | 1,089,330 |
| Volkswagen International Finance NV: | | | |
| 3.748% (Reg. S) (b)(f) | EUR | 800,000 | 827,407 |
| 3.875% (Reg. S) (b)(f) | EUR | 3,200,000 | 3,307,165 |
TOTAL GERMANY | | | 8,038,504 |
| Ireland - 0.5% | | | |
| AerCap Holdings NV 5.875% 10/10/79 (b) | | 845,000 | 845,610 |
| AIB Group PLC 6.25% (Reg. S) (b)(f) | EUR | 360,000 | 393,949 |
TOTAL IRELAND | | | 1,239,559 |
| Sweden - 0.4% | | | |
| Heimstaden Bostad AB 3.248% (Reg. S) (b)(f) | EUR | 1,510,000 | 896,728 |
| Samhallsbyggnadsbolaget I Norden AB 2.624% (Reg. S) (b)(f) | EUR | 805,000 | 151,827 |
TOTAL SWEDEN | | | 1,048,555 |
| Switzerland - 0.7% | | | |
| Credit Suisse Group AG Claim (h) | | 9,515,000 | 1,094,225 |
| UBS Group AG 7% (Reg. S) (b)(f) | | 500,000 | 526,278 |
TOTAL SWITZERLAND | | | 1,620,503 |
| United Kingdom - 2.2% | | | |
| Barclays PLC: | | | |
| 7.125% (b)(f) | GBP | 200,000 | 248,403 |
| 8.875% (b)(f) | GBP | 700,000 | 892,597 |
| British American Tobacco PLC 3% (Reg. S) (b)(f) | EUR | 2,135,000 | 2,104,532 |
| Lloyds Banking Group PLC 5.125% (b)(f) | GBP | 280,000 | 345,781 |
| Mobico Group PLC 4.25% (Reg. S) (b)(f) | GBP | 525,000 | 611,731 |
| SSE PLC 3.74% (Reg. S) (b)(f) | GBP | 870,000 | 1,070,960 |
TOTAL UNITED KINGDOM | | | 5,274,004 |
| TOTAL PREFERRED SECURITIES (Cost $42,023,688) | | | 22,847,053 |
| | | | |
| Money Market Funds - 4.8% |
| | | Shares | Value ($) |
Fidelity Cash Central Fund 5.40% (i) (Cost $11,501,763) | | 11,499,464 | 11,501,764 |
| | | | |
| TOTAL INVESTMENT IN SECURITIES - 99.1% (Cost $269,506,611) | 239,390,659 |
NET OTHER ASSETS (LIABILITIES) - 0.9% | 2,125,653 |
| NET ASSETS - 100.0% | 241,516,312 |
| | |
| Futures Contracts |
| | Number of contracts | Expiration Date | Notional Amount ($) | Value ($) | Unrealized Appreciation/ (Depreciation) ($) |
| Purchased | | | | | |
| | | | | | |
| Bond Index Contracts | | | | | |
| ASX 10 Year Treasury Bond Index Contracts (Australia) | 20 | Mar 2024 | 1,590,037 | 46,383 | 46,383 |
| Eurex Euro-Schatz Contracts (Germany) | 35 | Mar 2024 | 4,116,712 | 31,638 | 31,638 |
| TME 10 Year Canadian Note Contracts (Canada) | 80 | Mar 2024 | 7,497,377 | 315,387 | 315,387 |
| | | | | | |
| TOTAL BOND INDEX CONTRACTS | | | | | 393,408 |
| | | | | | |
| Treasury Contracts | | | | | |
| CBOT 2-Year U.S. Treasury Note Contracts (United States) | 82 | Mar 2024 | 16,884,953 | 168,969 | 168,969 |
| CBOT 5-Year U.S. Treasury Note Contracts (United States) | 211 | Mar 2024 | 22,951,195 | 510,035 | 510,035 |
| CBOT Long Term U.S. Treasury Bond Contracts (United States) | 94 | Mar 2024 | 11,744,125 | 844,388 | 844,388 |
| | | | | | |
| TOTAL TREASURY CONTRACTS | | | | | 1,523,392 |
| | | | | | |
| TOTAL PURCHASED | | | | | 1,916,800 |
| | | | | | |
| Sold | | | | | |
| | | | | | |
| Bond Index Contracts | | | | | |
| ICE Long Gilt Contracts (United Kingdom) | 41 | Mar 2024 | 5,364,556 | (285,260) | (285,260) |
| | | | | | |
| TOTAL FUTURES CONTRACTS | | | | | 1,631,540 |
| The notional amount of futures purchased as a percentage of Net Assets is 26.9% |
| The notional amount of futures sold as a percentage of Net Assets is 2.2% |
For the period, the average monthly notional amount at value for futures contracts in the aggregate was $98,811,489.
| Forward Foreign Currency Contracts |
Currency Purchased
| Currency Sold | Counterparty | Settlement Date | Unrealized Appreciation/ (Depreciation) ($) |
| | | | | | | |
| EUR | 521,000 | USD | 575,882 | Bank of America, N.A. | 1/03/24 | (724) |
| CAD | 174,000 | USD | 130,125 | BNP Paribas S.A. | 1/12/24 | 1,208 |
| EUR | 877,000 | USD | 947,397 | JPMorgan Chase Bank, N.A. | 1/12/24 | 21,143 |
| GBP | 146,000 | USD | 182,967 | Citibank, N. A. | 1/12/24 | 3,142 |
| GBP | 914,000 | USD | 1,167,274 | Citibank, N. A. | 1/12/24 | (2,181) |
| USD | 94,561 | AUD | 144,000 | Brown Brothers Harriman & Co | 1/12/24 | (3,599) |
| USD | 286,677 | CAD | 380,000 | BNP Paribas S.A. | 1/12/24 | (142) |
| USD | 190,893 | CAD | 259,000 | Canadian Imperial Bk. of Comm. | 1/12/24 | (4,597) |
| USD | 164,924 | EUR | 150,000 | BNP Paribas S.A. | 1/12/24 | (733) |
| USD | 3,498,435 | EUR | 3,164,000 | Bank of America, N.A. | 1/12/24 | 4,183 |
| USD | 105,156,329 | EUR | 96,988,000 | Bank of America, N.A. | 1/12/24 | (1,955,093) |
| USD | 266,648 | EUR | 244,000 | Brown Brothers Harriman & Co | 1/12/24 | (2,820) |
| USD | 749,327 | GBP | 589,000 | BNP Paribas S.A. | 1/12/24 | (1,482) |
| USD | 51,236,469 | GBP | 40,589,000 | BNP Paribas S.A. | 1/12/24 | (503,076) |
| USD | 395,654 | GBP | 316,000 | Bank of America, N.A. | 1/12/24 | (7,157) |
| USD | 3,566,645 | JPY | 511,550,000 | BNP Paribas S.A. | 1/12/24 | (66,677) |
| | | | | | | |
| TOTAL FORWARD FOREIGN CURRENCY CONTRACTS | | (2,518,605) |
| Unrealized Appreciation | | | 29,676 |
| Unrealized Depreciation | | | (2,548,281) |
For the period, the average contract value for forward foreign currency contracts was $237,458,170. Contract value represents contract amount in United States dollars plus or minus unrealized appreciation or depreciation, respectively.
| Credit Default Swaps |
| Underlying Reference | | Maturity Date | Clearinghouse / Counterparty | Fixed Payment Received/ (Paid) | Payment Frequency | Notional Amount(1) | Value ($) | Upfront Premium Received/ (Paid) ($) | Unrealized Appreciation/ (Depreciation) ($) |
| Buy Protection | | | | | | | | | | |
| Intesa Sanpaolo SpA | | Jun 2028 | JPMorgan Chase Bank, N.A. | (1%) | Quarterly | EUR | 2,630,000 | (33,489) | 3,403 | (30,086) |
| | | | | | | | | | | |
(1)Notional amount is stated in U.S. Dollars unless otherwise noted.
Currency Abbreviations
| AUD | - | Australian dollar |
| CAD | - | Canadian dollar |
| EUR | - | European Monetary Unit |
| GBP | - | British pound sterling |
| JPY | - | Japanese yen |
| USD | - | U.S. dollar |
Legend
| (a) | Amount is stated in United States dollars unless otherwise noted. |
| (b) | Coupon rates for floating and adjustable rate securities reflect the rates in effect at period end. |
| (c) | Security exempt from registration under Rule 144A of the Securities Act of 1933. These securities may be resold in transactions exempt from registration, normally to qualified institutional buyers. At the end of the period, the value of these securities amounted to $11,839,125 or 4.9% of net assets. |
| (d) | Security or a portion of the security was pledged to cover margin requirements for futures contracts. At period end, the value of securities pledged amounted to $1,427,154. |
| (e) | Security or a portion of the security has been segregated as collateral for open forward foreign currency contracts. At period end, the value of securities pledged amounted to $3,106,463. |
| (f) | Security is perpetual in nature with no stated maturity date. |
| (g) | Coupon is indexed to a floating interest rate which may be multiplied by a specified factor and/or subject to caps or floors. |
| (h) | Non-income producing - Security is in default. |
| (i) | Affiliated fund that is generally available only to investment companies and other accounts managed by Fidelity Investments. The rate quoted is the annualized seven-day yield of the fund at period end. A complete unaudited listing of the fund's holdings as of its most recent quarter end is available upon request. In addition, each Fidelity Central Fund's financial statements, which are not covered by the Fund's Report of Independent Registered Public Accounting Firm, are available on the SEC's website or upon request. |
Affiliated Central Funds
Fiscal year to date information regarding the Fund's investments in Fidelity Central Funds, including the ownership percentage, is presented below.
| Affiliate | Value, beginning of period ($) | Purchases ($) | Sales Proceeds ($) | Dividend Income ($) | Realized Gain (loss) ($) | Change in Unrealized appreciation (depreciation) ($) | Value, end of period ($) | % ownership, end of period |
| Fidelity Cash Central Fund 5.40% | 12,016,704 | 137,754,040 | 138,268,980 | 554,525 | - | - | 11,501,764 | 0.0% |
| Fidelity Securities Lending Cash Central Fund 5.40% | - | 226,353 | 226,353 | 33 | - | - | - | 0.0% |
| Total | 12,016,704 | 137,980,393 | 138,495,333 | 554,558 | - | - | 11,501,764 | |
| | | | | | | | | |
Amounts in the dividend income column in the above table include any capital gain distributions from underlying funds, which are presented in the corresponding line item in the Statement of Operations, if applicable.
Amounts in the dividend income column for Fidelity Securities Lending Cash Central Fund represents the income earned on investing cash collateral, less rebates paid to borrowers and any lending agent fees associated with the loan, plus any premium payments received for lending certain types of securities.
Amounts included in the purchases and sales proceeds columns may include in-kind transactions, if applicable.
Investment Valuation
The following is a summary of the inputs used, as of December 31, 2023, involving the Fund's assets and liabilities carried at fair value. The inputs or methodology used for valuing securities may not be an indication of the risk associated with investing in those securities. For more information on valuation inputs, and their aggregation into the levels used below, please refer to the Investment Valuation section in the accompanying Notes to Financial Statements.
| Valuation Inputs at Reporting Date: |
| Description | Total ($) | Level 1 ($) | Level 2 ($) | Level 3 ($) |
Investments in Securities: | | | | |
|
| Corporate Bonds | 152,570,484 | - | 152,570,484 | - |
|
| U.S. Government and Government Agency Obligations | 30,423,355 | - | 30,423,355 | - |
|
| Foreign Government and Government Agency Obligations | 11,701,326 | - | 11,701,326 | - |
|
| Supranational Obligations | 10,346,677 | - | 10,346,677 | - |
|
| Preferred Securities | 22,847,053 | - | 22,847,053 | - |
|
| Money Market Funds | 11,501,764 | 11,501,764 | - | - |
| Total Investments in Securities: | 239,390,659 | 11,501,764 | 227,888,895 | - |
Derivative Instruments: Assets | | | | |
Futures Contracts | 1,916,800 | 1,916,800 | - | - |
Forward Foreign Currency Contracts | 29,676 | - | 29,676 | - |
| Total Assets | 1,946,476 | 1,916,800 | 29,676 | - |
| Liabilities | | | | |
Futures Contracts | (285,260) | (285,260) | - | - |
Forward Foreign Currency Contracts | (2,548,281) | - | (2,548,281) | - |
Swaps | (33,489) | - | (33,489) | - |
| Total Liabilities | (2,867,030) | (285,260) | (2,581,770) | - |
| Total Derivative Instruments: | (920,554) | 1,631,540 | (2,552,094) | - |
Value of Derivative Instruments
The following table is a summary of the Fund's value of derivative instruments by primary risk exposure as of December 31, 2023. For additional information on derivative instruments, please refer to the Derivative Instruments section in the accompanying Notes to Financial Statements.
Primary Risk Exposure / Derivative Type | Value |
| Asset ($) | Liability ($) |
| Credit Risk | | |
Swaps (a) | 0 | (33,489) |
| Total Credit Risk | 0 | (33,489) |
| Foreign Exchange Risk | | |
Forward Foreign Currency Contracts (b) | 29,676 | (2,548,281) |
| Total Foreign Exchange Risk | 29,676 | (2,548,281) |
| Interest Rate Risk | | |
Futures Contracts (c) | 1,916,800 | (285,260) |
| Total Interest Rate Risk | 1,916,800 | (285,260) |
| Total Value of Derivatives | 1,946,476 | (2,867,030) |
(a)For bi-lateral over-the-counter (OTC) swaps, reflects gross value which is presented in the Statement of Assets and Liabilities in the bi-lateral OTC swaps, at value line-items.
(b)Gross value is presented in the Statement of Assets and Liabilities in the unrealized appreciation/depreciation on forward foreign currency contracts line-items.
(c)Reflects gross cumulative appreciation (depreciation) on futures contracts as presented in the Schedule of Investments. In the Statement of Assets and Liabilities, the period end daily variation margin is included in receivable or payable for daily variation margin on futures contracts, and the net cumulative appreciation (depreciation) is included in Total accumulated earnings (loss).
The following table is a summary of the Fund's derivatives inclusive of potential netting arrangements.
| | | | | | | | | | | |
| Counterparty | | Value of Derivative Assets ($) | | Value of Derivative Liabilities ($) | | Collateral Received(a) ($) | | Collateral Pledged(a) ($) | | Net(b) ($) |
| Bank of America, N.A. | | 4,183 | | (1,962,974) | | - | | 1,958,791 | | - |
| BNP Paribas S.A. | | 1,208 | | (572,110) | | - | | 570,902 | | - |
| Brown Brothers Harriman & Co | | - | | (6,419) | | - | | - | | (6,419) |
| Canadian Imperial Bk. of Comm. | | - | | (4,597) | | - | | - | | (4,597) |
| Citibank, N.A. | | 3,142 | | (2,181) | | - | | - | | 961 |
| JPMorgan Chase Bank, N.A. | | 21,143 | | (33,489) | | - | | - | | (12,346) |
| Total | $ | 29,676 | $ | (2,581,770) | $ | - | $ | 2,529,693 | $ | (22,401) |
| | | | | | | | | | | |
(a) Reflects collateral received from or pledged to an individual counterparty, excluding any excess or initial collateral amounts.
(b) Net represents the receivable / (payable) that would be due from / (to) the counterparty in an event of default. Netting may be allowed across transactions traded under the same legal agreement with the same legal entity. Please refer to Derivative Instruments - Risk Exposures and the Use of Derivative Instruments section in the accompanying Notes to Financial Statements.
| Statement of Assets and Liabilities |
| | | | December 31, 2023 |
| | | | | |
| Assets | | | | |
| Investment in securities, at value - See accompanying schedule: | | | | |
Unaffiliated issuers (cost $258,004,848) | $ | 227,888,895 | | |
Fidelity Central Funds (cost $11,501,763) | | 11,501,764 | | |
| | | | | |
| | | | | |
| Total Investment in Securities (cost $269,506,611) | | | $ | 239,390,659 |
| Foreign currency held at value (cost $1,434,030) | | | | 1,445,673 |
| Unrealized appreciation on forward foreign currency contracts | | | | 29,676 |
| Receivable for fund shares sold | | | | 453,510 |
| Interest receivable | | | | 3,494,207 |
| Distributions receivable from Fidelity Central Funds | | | | 48,705 |
| Receivable for daily variation margin on futures contracts | | | | 73,717 |
Total assets | | | | 244,936,147 |
| Liabilities | | | | |
| Payable for investments purchased | $ | 809,849 | | |
| Unrealized depreciation on forward foreign currency contracts | | 2,548,281 | | |
| Payable for fund shares redeemed | | 24,665 | | |
| Bi-lateral OTC swaps, at value | | 33,489 | | |
| Other payables and accrued expenses | | 3,551 | | |
| Total Liabilities | | | | 3,419,835 |
| Net Assets | | | $ | 241,516,312 |
| Net Assets consist of: | | | | |
| Paid in capital | | | $ | 366,574,871 |
| Total accumulated earnings (loss) | | | | (125,058,559) |
| Net Assets | | | $ | 241,516,312 |
Net Asset Value, offering price and redemption price per share ($241,516,312 ÷ 3,033,544 shares) | | | $ | 79.62 |
| Statement of Operations |
| | | | Year ended December 31, 2023 |
| Investment Income | | | | |
| Dividends | | | $ | 3,010,847 |
| Interest | | | | 7,892,872 |
| Income from Fidelity Central Funds (including $33 from security lending) | | | | 554,558 |
| Total Income | | | | 11,458,277 |
| Expenses | | | | |
| Custodian fees and expenses | $ | 11,842 | | |
| Independent trustees' fees and expenses | | 1,057 | | |
| Miscellaneous | | 6 | | |
| Total expenses before reductions | | 12,905 | | |
| Expense reductions | | (2,016) | | |
| Total expenses after reductions | | | | 10,889 |
| Net Investment income (loss) | | | | 11,447,388 |
| Realized and Unrealized Gain (Loss) | | | | |
| Net realized gain (loss) on: | | | | |
| Investment Securities: | | | | |
| Unaffiliated issuers | | (55,697,604) | | |
| Forward foreign currency contracts | | (4,428,458) | | |
| Foreign currency transactions | | 23,435 | | |
| Futures contracts | | (2,643,416) | | |
| Swaps | | (62,843) | | |
| Total net realized gain (loss) | | | | (62,808,886) |
| Change in net unrealized appreciation (depreciation) on: | | | | |
| Investment Securities: | | | | |
| Unaffiliated issuers | | 69,068,932 | | |
| Fidelity Central Funds | | 1 | | |
| Forward foreign currency contracts | | (2,706,133) | | |
| Assets and liabilities in foreign currencies | | (42,817) | | |
| Futures contracts | | 1,502,759 | | |
| Swaps | | (26,521) | | |
| Total change in net unrealized appreciation (depreciation) | | | | 67,796,221 |
| Net gain (loss) | | | | 4,987,335 |
| Net increase (decrease) in net assets resulting from operations | | | $ | 16,434,723 |
| Statement of Changes in Net Assets |
| |
| | Year ended December 31, 2023 | | Year ended December 31, 2022 |
| Increase (Decrease) in Net Assets | | | | |
| Operations | | | | |
| Net investment income (loss) | $ | 11,447,388 | $ | 14,705,780 |
| Net realized gain (loss) | | (62,808,886) | | (19,087,653) |
| Change in net unrealized appreciation (depreciation) | | 67,796,221 | | (96,564,382) |
| Net increase (decrease) in net assets resulting from operations | | 16,434,723 | | (100,946,255) |
| Distributions to shareholders | | (10,069,714) | | (27,874,672) |
| Distributions to shareholders from tax return of capital | | - | | (92,865) |
| | | | | |
| Total Distributions | | (10,069,714) | | (27,967,537) |
| Affiliated share transactions | | | | |
| Proceeds from sales of shares | | 35,866,979 | | 26,968,985 |
| Reinvestment of distributions | | 10,069,714 | | 27,967,537 |
| Cost of shares redeemed | | (172,439,294) | | (219,671,418) |
| | | | | |
Net increase (decrease) in net assets resulting from share transactions | | (126,502,601) | | (164,734,896) |
| Total increase (decrease) in net assets | | (120,137,592) | | (293,648,688) |
| | | | | |
| Net Assets | | | | |
| Beginning of period | | 361,653,904 | | 655,302,592 |
| End of period | $ | 241,516,312 | $ | 361,653,904 |
| | | | | |
| Other Information | | | | |
| Shares | | | | |
| Sold | | 467,702 | | 295,639 |
| Issued in reinvestment of distributions | | 131,428 | | 339,843 |
| Redeemed | | (2,232,453) | | (2,478,557) |
| Net increase (decrease) | | (1,633,323) | | (1,843,075) |
| | | | | |
Financial Highlights
| Fidelity® International Credit Central Fund |
| |
| Years ended December 31, | | 2023 | | 2022 | | 2021 | | 2020 | | 2019 |
Selected Per-Share Data | | | | | | | | | | |
| Net asset value, beginning of period | $ | 77.49 | $ | 100.66 | $ | 104.23 | $ | 101.26 | $ | 94.83 |
| Income from Investment Operations | | | | | | | | | | |
Net investment income (loss) A,B | | 3.322 | | 2.720 | | 2.309 | | 3.060 | | 2.744 |
| Net realized and unrealized gain (loss) | | 1.936 | | (20.165) | | (2.501) | | 5.002 | | 9.957 |
| Total from investment operations | | 5.258 | | (17.445) | | (.192) | | 8.062 | | 12.701 |
| Distributions from net investment income | | (3.128) | | (5.143) | | (2.087) C | | (3.418) | | (3.022) C |
| Distributions from net realized gain | | - | | (.563) | | (1.291) C | | (1.674) | | (3.040) C |
| Distributions from tax return of capital | | - | | (.019) | | - | | - | | (.209) |
| Total distributions | | (3.128) | | (5.725) | | (3.378) | | (5.092) | | (6.271) |
| Net asset value, end of period | $ | 79.62 | $ | 77.49 | $ | 100.66 | $ | 104.23 | $ | 101.26 |
Total Return D | | 7.02% | | (17.51)% | | (.18)% | | 8.11% | | 13.57% |
Ratios to Average Net Assets B,E,F | | | | | | | | | | |
| Expenses before reductions | | -% G | | -% G | | -% G | | .01% | | .01% |
| Expenses net of fee waivers, if any | | -% G | | -% G | | -% G | | .01% | | .01% |
| Expenses net of all reductions | | -% G | | -% G | | -% G | | .01% | | .01% |
| Net investment income (loss) | | 4.25% | | 3.08% | | 2.27% | | 2.97% | | 2.72% |
| Supplemental Data | | | | | | | | | | |
| Net assets, end of period (000 omitted) | $ | 241,516 | $ | 361,654 | $ | 655,303 | $ | 455,948 | $ | 310,543 |
Portfolio turnover rate H | | 73% | | 25% | | 52% | | 67% | | 84% |
ACalculated based on average shares outstanding during the period.
BNet investment income (loss) is affected by the timing of the declaration of dividends by any underlying mutual funds or exchange-traded funds (ETFs). Net investment income (loss) of any mutual funds or ETFs is not included in the Fund's net investment income (loss) ratio.
CThe amount shown reflects reclassifications related to book to tax differences that were made in the year shown.
DTotal returns would have been lower if certain expenses had not been reduced during the applicable periods shown.
EFees and expenses of any underlying mutual funds or exchange-traded funds (ETFs) are not included in the Fund's expense ratio. The Fund indirectly bears its proportionate share of these expenses. For additional expense information related to investments in Fidelity Central Funds, please refer to the "Investments in Fidelity Central Funds" note found in the Notes to Financial Statements section of the most recent Annual or Semi-Annual report.
FExpense ratios reflect operating expenses of the class. Expenses before reductions do not reflect amounts reimbursed, waived, or reduced through arrangements with the investment adviser, brokerage services, or other offset arrangements, if applicable, and do not represent the amount paid by the class during periods when reimbursements, waivers or reductions occur.
GAmount represents less than .005%.
HAmount does not include the portfolio activity of any underlying mutual funds or exchange-traded funds (ETFs).
For the period ended December 31, 2023
1. Organization.
Fidelity International Credit Central Fund (the Fund) is a fund of Fidelity Central Investment Portfolios II LLC (the LLC) and is authorized to issue an unlimited number of shares. Shares of the Fund are only offered to other investment companies and accounts managed by Fidelity Management & Research Company LLC (FMR), or its affiliates (the Investing Funds). The LLC is registered under the Investment Company Act of 1940, as amended (the 1940 Act), as an open-end management investment company organized as a Delaware Limited Liability Company.
2. Investments in Fidelity Central Funds.
Funds may invest in Fidelity Central Funds, which are open-end investment companies generally available only to other investment companies and accounts managed by the investment adviser and its affiliates. The Schedule of Investments lists any Fidelity Central Funds held as an investment as of period end, but does not include the underlying holdings of each Fidelity Central Fund. An investing fund indirectly bears its proportionate share of the expenses of the underlying Fidelity Central Funds.
Based on its investment objective, each Fidelity Central Fund may invest or participate in various investment vehicles or strategies that are similar to those of the investing fund. These strategies are consistent with the investment objectives of the investing fund and may involve certain economic risks which may cause a decline in value of each of the Fidelity Central Funds and thus a decline in the value of the investing fund.
| Fidelity Central Fund | Investment Manager | Investment Objective | Investment Practices | Expense RatioA |
| Fidelity Money Market Central Funds | Fidelity Management & Research Company LLC (FMR) | Each fund seeks to obtain a high level of current income consistent with the preservation of capital and liquidity. | Short-term Investments | Less than .005% |
A Expenses expressed as a percentage of average net assets and are as of each underlying Central Fund's most recent annual or semi-annual shareholder report.
A complete unaudited list of holdings for each Fidelity Central Fund is available upon request or at the Securities and Exchange Commission website at www.sec.gov. In addition, the financial statements of the Fidelity Central Funds which contain the significant accounting policies (including investment valuation policies) of those funds, and are not covered by the Report of Independent Registered Public Accounting Firm, are available on the Securities and Exchange Commission website or upon request.
3. Significant Accounting Policies.
The Fund is an investment company and applies the accounting and reporting guidance of the Financial Accounting Standards Board (FASB) Accounting Standards Codification Topic 946 Financial Services - Investment Companies. The financial statements have been prepared in conformity with accounting principles generally accepted in the United States of America (GAAP), which require management to make certain estimates and assumptions at the date of the financial statements. Actual results could differ from those estimates. Subsequent events, if any, through the date that the financial statements were issued have been evaluated in the preparation of the financial statements. The Fund's Schedule of Investments lists any underlying mutual funds or exchange-traded funds (ETFs) but does not include the underlying holdings of these funds. The following summarizes the significant accounting policies of the Fund:
Investment Valuation. Investments are valued as of 4:00 p.m. Eastern time on the last calendar day of the period. The Board of Directors (the Board) has designated the Fund's investment adviser as the valuation designee responsible for the fair valuation function and performing fair value determinations as needed. The investment adviser has established a Fair Value Committee (the Committee) to carry out the day-to-day fair valuation responsibilities and has adopted policies and procedures to govern the fair valuation process and the activities of the Committee. In accordance with these fair valuation policies and procedures, which have been approved by the Board, the Fund attempts to obtain prices from one or more third party pricing services or brokers to value its investments. When current market prices, quotations or currency exchange rates are not readily available or reliable, investments will be fair valued in good faith by the Committee, in accordance with the policies and procedures. Factors used in determining fair value vary by investment type and may include market or investment specific events, transaction data, estimated cash flows, and market observations of comparable investments. The frequency that the fair valuation procedures are used cannot be predicted and they may be utilized to a significant extent. The Committee manages the Fund's fair valuation practices and maintains the fair valuation policies and procedures. The Fund's investment adviser reports to the Board information regarding the fair valuation process and related material matters.
The Fund categorizes the inputs to valuation techniques used to value its investments into a disclosure hierarchy consisting of three levels as shown below:
Level 1 - unadjusted quoted prices in active markets for identical investments
Level 2 - other significant observable inputs (including quoted prices for similar investments, interest rates, prepayment speeds, etc.)
Level 3 - unobservable inputs (including the Fund's own assumptions based on the best information available)
Valuation techniques used to value the Fund's investments by major category are as follows:
Debt securities, including restricted securities, are valued based on evaluated prices received from third party pricing services or from brokers who make markets in such securities. Corporate bonds, foreign government and government agency obligations, preferred securities, supranational obligations and U.S. government and government agency obligations are valued by pricing services who utilize matrix pricing which considers yield or price of bonds of comparable quality, coupon, maturity and type or by broker-supplied prices. Swaps are marked-to-market daily based on valuations from third party pricing services, registered derivatives clearing organizations (clearinghouses) or broker-supplied valuations. These pricing sources may utilize inputs such as interest rate curves, credit spread curves, default possibilities and recovery rates. When independent prices are unavailable or unreliable, debt securities and swaps may be valued utilizing pricing methodologies which consider similar factors that would be used by third party pricing services. For foreign debt securities, when significant market or security specific events arise, valuations may be determined in good faith in accordance with procedures adopted by the Board. Debt securities and swaps are generally categorized as Level 2 in the hierarchy but may be Level 3 depending on the circumstances.
The U.S. dollar value of forward foreign currency contracts is determined using currency exchange rates supplied by a pricing service and are categorized as Level 2 in the hierarchy. Futures contracts are valued at the settlement price established each day by the board of trade or exchange on which they are traded and are categorized as Level 1 in the hierarchy. Investments in open-end mutual funds, including other Fidelity Central Funds, are valued at their closing net asset value (NAV) each business day and are categorized as Level 1 in the hierarchy.
Changes in valuation techniques may result in transfers in or out of an assigned level within the disclosure hierarchy. The aggregate value of investments by input level as of December 31, 2023 is included at the end of the Fund's Schedule of Investments.
Foreign Currency. Foreign-denominated assets, including investment securities, and liabilities are translated into U.S. dollars at the exchange rates at period end. Purchases and sales of investment securities, income and dividends received, and expenses denominated in foreign currencies are translated into U.S. dollars at the exchange rate in effect on the transaction date.
The effects of exchange rate fluctuations on investments are included with the net realized and unrealized gain (loss) on investment securities. Other foreign currency transactions resulting in realized and unrealized gain (loss) are disclosed separately.
Realized gains and losses on foreign currency transactions arise from the disposition of foreign currency, realized changes in the value of foreign currency between the trade and settlement dates on security transactions, and the difference between the amounts of dividends, interest and foreign withholding taxes recorded on transaction date and the U.S. dollar equivalent of the amounts actually received or paid. Unrealized gains and losses on assets and liabilities in foreign currencies arise from changes in the value of foreign currency, and from assets and liabilities denominated in foreign currencies, other than investments, which are held at period end.
Investment Transactions and Income. For financial reporting purposes, the Fund's investment holdings and NAV include trades executed through the end of the last business day of the period. The NAV per share for processing shareholder transactions is calculated as of the close of business of the New York Stock Exchange (NYSE), normally 4:00 p.m. Eastern time and includes trades executed through the end of the prior business day. Gains and losses on securities sold are determined on the basis of identified cost. Dividend income is recorded on the ex-dividend date. Income and capital gain distributions from Fidelity Central Funds, if any, are recorded on the ex-dividend date. Interest income is accrued as earned and includes coupon interest and amortization of premium and accretion of discount on debt securities as applicable. Investment income is recorded net of foreign taxes withheld where recovery of such taxes is uncertain. Debt obligations may be placed on non-accrual status and related interest income may be reduced by ceasing current accruals and writing off interest receivables when the collection of all or a portion of interest has become doubtful based on consistently applied procedures. A debt obligation is removed from non-accrual status when the issuer resumes interest payments or when collectability of interest is reasonably assured. Funds may file withholding tax reclaims in certain jurisdictions to recover a portion of amounts previously withheld. Any withholding tax reclaims income is included in the Statement of Operations in interest. Any receivables for withholding tax reclaims are included in the Statement of Assets and Liabilities in interest receivable.
Expenses. Expenses directly attributable to a fund are charged to that fund. Expenses attributable to more than one fund are allocated among the respective funds on the basis of relative net assets or other appropriate methods. Expenses included in the accompanying financial statements reflect the expenses of that fund and do not include any expenses associated with any underlying mutual funds or exchange-traded funds. Although not included in a fund's expenses, a fund indirectly bears its proportionate share of these expenses through the net asset value of each underlying mutual fund or exchange-traded fund. Expense estimates are accrued in the period to which they relate and adjustments are made when actual amounts are known.
Income Tax Information and Distributions to Shareholders. Each year, the Fund intends to qualify as a regulated investment company under Subchapter M of the Internal Revenue Code, including distributing substantially all of its taxable income and realized gains. As a result, no provision for U.S. Federal income taxes is required. As of December 31, 2023, the Fund did not have any unrecognized tax benefits in the financial statements; nor is the Fund aware of any tax positions for which it is reasonably possible that the total amounts of unrecognized tax benefits will significantly change in the next twelve months. The Fund files a U.S. federal tax return, in addition to state and local tax returns as required. The Fund's federal income tax returns are subject to examination by the Internal Revenue Service (IRS) for a period of three fiscal years after they are filed. State and local tax returns may be subject to examination for an additional fiscal year depending on the jurisdiction. Foreign taxes are provided for based on the Fund's understanding of the tax rules and rates that exist in the foreign markets in which it invests.
Distributions are declared and recorded on the ex-dividend date. Income and capital gain distributions are determined in accordance with income tax regulations, which may differ from GAAP.
Capital accounts within the financial statements are adjusted for permanent book-tax differences. These adjustments have no impact on net assets or the results of operations. Capital accounts are not adjusted for temporary book-tax differences which will reverse in a subsequent period.
Book-tax differences are primarily due to futures contracts, swaps, foreign currency transactions, market discount, capital loss carryforwards, and losses deferred due to wash sales and excise tax regulations.
For the period ended December 31, 2022, the Fund's distributions exceeded the aggregate amount of taxable income resulting in a return of capital for tax purposes. This was due to reductions in taxable income available for distribution after certain distributions had been made.
As of period end, the cost and unrealized appreciation (depreciation) in securities, and derivatives if applicable, for federal income tax purposes were as follows:
| Gross unrealized appreciation | $7,318,670 |
| Gross unrealized depreciation | (36,089,844) |
| Net unrealized appreciation (depreciation) | $(28,771,174) |
| Tax Cost | $269,065,445 |
The tax-based components of distributable earnings as of period end were as follows:
| Undistributed ordinary income | $969,515 |
| Capital loss carryforward | $(97,329,572) |
| Net unrealized appreciation (depreciation) on securities and other investments | $(28,698,503) |
Capital loss carryforwards are only available to offset future capital gains of the Fund to the extent provided by regulations and may be limited. The capital loss carryforward information presented below, including any applicable limitation, is estimated as of fiscal period end and is subject to adjustment.
Short-term | $(16,977,348) |
Long-term | (80,352,224) |
| Total capital loss carryforward | $(97,329,572) |
The tax character of distributions paid was as follows:
| | December 31, 2023 | December 31, 2022 |
| Ordinary Income | $10,069,714 | $ 25,207,941 |
| Long-term Capital Gains | - | 2,666,731 |
| Tax Return of Capital | - | 92,865 |
| Total | $10,069,714 | $ 27,967,537 |
Restricted Securities (including Private Placements). Funds may invest in securities that are subject to legal or contractual restrictions on resale. These securities generally may be resold in transactions exempt from registration or to the public if the securities are registered. Disposal of these securities may involve time-consuming negotiations and expense, and prompt sale at an acceptable price may be difficult. Information regarding restricted securities held at period end is included at the end of the Schedule of Investments, if applicable.
4. Derivative Instruments.
Risk Exposures and the Use of Derivative Instruments. The Fund's investment objectives allow for various types of derivative instruments, including futures contracts, forward foreign currency contracts, options and swaps. Derivatives are investments whose value is primarily derived from underlying assets, indices or reference rates and may be transacted on an exchange or over-the-counter (OTC). Derivatives may involve a future commitment to buy or sell a specified asset based on specified terms, to exchange future cash flows at periodic intervals based on a notional principal amount, or for one party to make one or more payments upon the occurrence of specified events in exchange for periodic payments from the other party.
Derivatives were used to increase returns, to gain exposure to certain types of assets, to facilitate transactions in foreign-denominated securities and to manage exposure to certain risks as defined below. The success of any strategy involving derivatives depends on analysis of numerous economic factors, and if the strategies for investment do not work as intended, the objectives may not be achieved.
Derivatives were used to increase or decrease exposure to the following risk(s):
| | |
| Credit Risk | Credit risk relates to the ability of the issuer of a financial instrument to make further principal or interest payments on an obligation or commitment that it has to a fund. |
| Foreign Exchange Risk | Foreign exchange rate risk relates to fluctuations in the value of an asset or liability due to changes in currency exchange rates. |
| Interest Rate Risk | Interest rate risk relates to the fluctuations in the value of interest-bearing securities due to changes in the prevailing levels of market interest rates. |
Funds are also exposed to additional risks from investing in derivatives, such as liquidity risk and counterparty credit risk. Liquidity risk is the risk that a fund will be unable to close out the derivative in the open market in a timely manner. Counterparty credit risk is the risk that the counterparty will not be able to fulfill its obligation to a fund. Derivative counterparty credit risk is managed through formal evaluation of the creditworthiness of all potential counterparties. On certain OTC derivatives such as forward foreign currency contracts, options and bi-lateral swaps, a fund attempts to reduce its exposure to counterparty credit risk by entering into an International Swaps and Derivatives Association, Inc. (ISDA) Master Agreement with each of its counterparties. The ISDA Master Agreement gives a fund the right to terminate all transactions traded under such agreement upon the deterioration in the credit quality of the counterparty beyond specified levels. The ISDA Master Agreement gives each party the right, upon an event of default by the other party or a termination of the agreement, to close out all transactions traded under such agreement and to net amounts owed under each transaction to one net payable by one party to the other. To mitigate counterparty credit risk on bi-lateral OTC derivatives, a fund receives collateral in the form of cash or securities once net unrealized appreciation on outstanding derivative contracts under an ISDA Master Agreement exceeds certain applicable thresholds, subject to certain minimum transfer provisions. The collateral received is held in segregated accounts with the custodian bank in accordance with the collateral agreements entered into between a fund, the counterparty and the custodian bank. A fund could experience delays and costs in gaining access to the collateral even though it is held by the custodian bank. The maximum risk of loss to a fund from counterparty credit risk related to bi-lateral OTC derivatives is generally the aggregate unrealized appreciation and unpaid counterparty payments in excess of any collateral pledged by the counterparty to a fund. A fund may be required to pledge collateral for the benefit of the counterparties on bi-lateral OTC derivatives in an amount not less than each counterparty's unrealized appreciation on outstanding derivative contracts, subject to certain minimum transfer provisions, and any such pledged collateral is identified in the Schedule of Investments. Exchange-traded contracts are not covered by the ISDA Master Agreement; however counterparty credit risk related to these contracts may be mitigated by the protection provided by the exchange on which they trade. A summary of derivatives inclusive of potential netting arrangements is presented at the end of the Schedule of Investments.
Investing in derivatives may involve greater risks than investing in the underlying assets directly and, to varying degrees, may involve risk of loss in excess of any initial investment and collateral received and amounts recognized in the Statement of Assets and Liabilities. In addition, there may be the risk that the change in value of the derivative contract does not correspond to the change in value of the underlying instrument.
Net Realized Gain (Loss) and Change in Net Unrealized Appreciation (Depreciation) on Derivatives. The table below, which reflects the impacts of derivatives on the financial performance, summarizes the net realized gain (loss) and change in net unrealized appreciation (depreciation) for derivatives during the period as presented in the Statement of Operations.
| Primary Risk Exposure / Derivative Type | Net Realized Gain (Loss)($) | Change in Net Unrealized Appreciation (Depreciation)($) |
| Fidelity International Credit Central Fund | | |
| Credit Risk | | |
| Purchased Options | (1,246,084) | 256,214 |
| Swaps | (62,843) | (26,521) |
| Total Credit Risk | (1,308,927) | 229,693 |
| Foreign Exchange Risk | | |
| Forward Foreign Currency Contracts | (4,428,458) | (2,706,133) |
| Total Foreign Exchange Risk | (4,428,458) | (2,706,133) |
| Interest Rate Risk | | |
| Futures Contracts | (2,643,416) | 1,502,759 |
| Total Interest Rate Risk | (2,643,416) | 1,502,759 |
| Totals | (8,380,801) | (973,681) |
If there are any open positions at period end, a summary of the value of derivatives by primary risk exposure is included at the end of the Schedule of Investments.
Forward Foreign Currency Contracts. Forward foreign currency contracts represent obligations to purchase or sell foreign currency on a specified future date at a price fixed at the time the contracts are entered into. Forward foreign currency contracts were used to facilitate transactions in foreign-denominated securities and to manage exposure to certain foreign currencies.
Forward foreign currency contracts are valued daily and fluctuations in exchange rates on open contracts are recorded as unrealized appreciation or (depreciation) and reflected in total accumulated earnings (loss) in the Statement of Assets and Liabilities. When the contract is closed, a gain or loss is realized equal to the difference between the closing value and the value at the time it was opened. Non-deliverable forward foreign currency exchange contracts are settled with the counterparty in cash without the delivery of foreign currency. The net realized gain (loss) and change in net unrealized appreciation (depreciation) on forward foreign currency contracts during the period is presented in the Statement of Operations.
Any open forward foreign currency contracts at period end are presented in the Schedule of Investments under the caption "Forward Foreign Currency Contracts." The contract amount and unrealized appreciation (depreciation) reflects each contract's exposure to the underlying currency at period end, and is representative of volume of activity during the period unless an average contract value is presented.
Futures Contracts. A futures contract is an agreement between two parties to buy or sell a specified underlying instrument for a fixed price at a specified future date. Futures contracts were used to manage exposure to the bond market and fluctuations in interest rates.
Upon entering into a futures contract, a fund is required to deposit either cash or securities (initial margin) with a clearing broker in an amount equal to a certain percentage of the face value of the contract. Futures contracts are marked-to-market daily and subsequent daily payments are made or received by a fund depending on the daily fluctuations in the value of the futures contracts and are recorded as unrealized appreciation or (depreciation). This receivable and/or payable, if any, is included in daily variation margin on futures contracts in the Statement of Assets and Liabilities. Realized gain or (loss) is recorded upon the expiration or closing of a futures contract. The net realized gain (loss) and change in net unrealized appreciation (depreciation) on futures contracts during the period is presented in the Statement of Operations.
Any open futures contracts at period end are presented in the Schedule of Investments under the caption "Futures Contracts". The notional amount at value reflects each contract's exposure to the underlying instrument or index at period end, and is representative of volume of activity during the period unless an average notional amount is presented. Any securities deposited to meet initial margin requirements are identified in the Schedule of Investments. Any cash deposited to meet initial margin requirements is presented as segregated cash with brokers for derivative instruments in the Statement of Assets and Liabilities.
Options. Options give the purchaser the right, but not the obligation, to buy (call) or sell (put) an underlying security or financial instrument at an agreed exercise or strike price between or on certain dates. Options obligate the seller (writer) to buy (put) or sell (call) an underlying instrument at the exercise or strike price or cash settle an underlying derivative instrument if the holder exercises the option on or before the expiration date. OTC options, such as swaptions, which are options where the underlying instrument is a swap, were used to manage exposure to potential credit events.
Upon entering into an options contract, a fund will pay or receive a premium. Premiums paid on purchased options are reflected as cost of investments and premiums received on written options are reflected as a liability on the Statement of Assets and Liabilities. Certain options may be purchased or written with premiums to be paid or received on a future date. Options are valued daily and any unrealized appreciation (depreciation) is reflected in total accumulated earnings (loss) in the Statement of Assets and Liabilities. When an option is exercised, the cost or proceeds of the underlying instrument purchased or sold is adjusted by the amount of the premium. When an option is closed, a gain or loss is realized depending on whether the proceeds or amount paid for the closing sale transaction is greater or less than the premium received or paid. When an option expires, gains and losses are realized to the extent of premiums received and paid, respectively. The net realized and unrealized gains (losses) on purchased options are included in the Statement of Operations in net realized gain (loss) and change in net unrealized appreciation (depreciation) on investment securities. The net realized gain (loss) and change in net unrealized appreciation (depreciation) on written options are presented in the Statement of Operations.
Any open options at period end are presented in the Schedule of Investments under the captions "Purchased Options," "Purchased Swaptions," "Written Options" and "Written Swaptions," as applicable. For the period, the average monthly notional amount for purchased swaptions was $18,686,939.
Writing puts and buying calls tend to increase exposure to the underlying instrument while buying puts and writing calls tend to decrease exposure to the underlying instrument. For purchased options, risk of loss is limited to the premium paid, and for written options, risk of loss is the change in value in excess of the premium received.
Swaps. A swap is a contract between two parties to exchange future cash flows at periodic intervals based on a notional principal amount. A bi-lateral OTC swap is a transaction between a fund and a dealer counterparty where cash flows are exchanged between the two parties for the life of the swap.
Bi-lateral OTC swaps are marked-to-market daily and changes in value are reflected in the Statement of Assets and Liabilities in the bi-lateral OTC swaps at value line items. Any upfront premiums paid or received upon entering a bi-lateral OTC swap to compensate for differences between stated terms of the swap and prevailing market conditions (e.g. credit spreads, interest rates or other factors) are recorded in total accumulated earnings (loss) in the Statement of Assets and Liabilities and amortized to realized gain or (loss) ratably over the term of the swap. Any unamortized upfront premiums are presented in the Schedule of Investments.
Payments are exchanged at specified intervals, accrued daily commencing with the effective date of the contract and recorded as realized gain or (loss). Some swaps may be terminated prior to the effective date and realize a gain or loss upon termination. The net realized gain (loss) and change in net unrealized appreciation (depreciation) on swaps during the period is presented in the Statement of Operations.
Any open swaps at period end are included in the Schedule of Investments under the caption "Swaps", and are representative of volume of activity during the period unless an average notional amount is presented.
Credit Default Swaps. Credit default swaps enable a fund to buy or sell protection against specified credit events on a single-name issuer or a traded credit index. Under the terms of a credit default swap the buyer of protection (buyer) receives credit protection in exchange for making periodic payments to the seller of protection (seller) based on a fixed percentage applied to a notional principal amount. In return for these payments, the seller will be required to make a payment upon the occurrence of one or more specified credit events. A fund enters into credit default swaps as a seller to gain credit exposure to an issuer and/or as a buyer to obtain a measure of protection against defaults of an issuer. Periodic payments are made over the life of the contract by the buyer provided that no credit event occurs.
For credit default swaps on most corporate and sovereign issuers, credit events include bankruptcy, failure to pay or repudiation/moratorium. For credit default swaps on corporate or sovereign issuers, the obligation that may be put to the seller is not limited to the specific reference obligation described in the Schedule of Investments. For credit default swaps on asset-backed securities, a credit event may be triggered by events such as failure to pay principal, maturity extension, rating downgrade or write-down. For credit default swaps on asset-backed securities, the reference obligation described represents the security that may be put to the seller. For credit default swaps on a traded credit index, a specified credit event may affect all or individual underlying securities included in the index.
As a seller, if an underlying credit event occurs, a fund will pay a net settlement amount of cash equal to the notional amount of the swap less the recovery value of the reference obligation or underlying securities comprising an index. Only in the event of the industry's inability to value the underlying asset will a fund be required to take delivery of the reference obligation or underlying securities comprising an index and pay an amount equal to the notional amount of the swap.
As a buyer, if an underlying credit event occurs, a fund will receive a net settlement amount of cash equal to the notional amount of the swap less the recovery value of the reference obligation or underlying securities comprising an index. Only in the event of the industry's inability to value the underlying asset will a fund be required to deliver the reference obligation or underlying securities comprising an index in exchange for payment of an amount equal to the notional amount of the swap.
Typically, the value of each credit default swap and credit rating disclosed for each reference obligation in the Schedule of Investments, where a fund is the seller, can be used as measures of the current payment/performance risk of the swap. As the value of the swap changes as a positive or negative percentage of the total notional amount, the payment/performance risk may decrease or increase, respectively. In addition to these measures, the investment adviser monitors a variety of factors including cash flow assumptions, market activity and market sentiment as part of its ongoing process of assessing payment/performance risk.
5. Purchases and Sales of Investments.
Purchases and sales of securities, other than short-term securities, U.S. government securities and in-kind transactions, as applicable, are noted in the table below.
| | Purchases ($) | Sales ($) |
| Fidelity International Credit Central Fund | 128,199,243 | 275,464,317 |
6. Fees and Other Transactions with Affiliates.
Management Fee and Expense Contract. Fidelity Management & Research Company LLC (the investment adviser) provides the Fund with investment management services. The Fund does not pay any fees for these services. Pursuant to the Fund's management contract, the investment adviser receives a monthly management fee that represents a portion of the management fees it receives from the Investing Funds. In addition, under an expense contract, the investment adviser also pays all other expenses of the Fund, excluding custody fees, the compensation of the independent Directors, and certain miscellaneous expenses such as proxy and shareholder meeting expenses.
Interfund Trades. Funds may purchase from or sell securities to other Fidelity Funds under procedures adopted by the Board. The procedures have been designed to ensure these interfund trades are executed in accordance with Rule 17a-7 of the 1940 Act. Any interfund trades are included within the respective purchases and sales amounts shown in the Purchases and Sales of Investments note. During the period, there were no interfund trades.
Subsequent Event - Sub-Advisory Arrangements. Effective March 1, 2024, the Fund's sub-advisory agreements with FMR Investment Management (UK) Limited, Fidelity Management & Research (Hong Kong) Limited, and Fidelity Management & Research (Japan) Limited will be amended to provide that the investment adviser will pay each sub-adviser monthly fees equal to 110% of the sub-adviser's costs for providing sub-advisory services.
7. Security Lending.
Funds lend portfolio securities from time to time in order to earn additional income. Lending agents are used, including National Financial Services (NFS), an affiliate of the investment adviser. Pursuant to a securities lending agreement, NFS will receive a fee, which is capped at 9.9% of a fund's daily lending revenue, for its services as lending agent. A fund may lend securities to certain qualified borrowers, including NFS. On the settlement date of the loan, a fund receives collateral (in the form of U.S. Treasury obligations, letters of credit and/or cash) against the loaned securities and maintains collateral in an amount not less than 100% of the market value of the loaned securities during the period of the loan. The market value of the loaned securities is determined at the close of business of a fund and any additional required collateral is delivered to a fund on the next business day. A fund or borrower may terminate the loan at any time, and if the borrower defaults on its obligation to return the securities loaned because of insolvency or other reasons, a fund may apply collateral received from the borrower against the obligation. A fund may experience delays and costs in recovering the securities loaned. Any cash collateral received is invested in the Fidelity Securities Lending Cash Central Fund. Any loaned securities are identified as such in the Schedule of Investments, and the value of loaned securities and cash collateral at period end, as applicable, are presented in the Statement of Assets and Liabilities. Security lending income represents the income earned on investing cash collateral, less rebates paid to borrowers and any lending agent fees associated with the loan, plus any premium payments received for lending certain types of securities. Security lending income is presented in the Statement of Operations as a component of income from Fidelity Central Funds. Affiliated security lending activity, if any, was as follows:
| | Total Security Lending Fees Paid to NFS | Security Lending Income From Securities Loaned to NFS | Value of Securities Loaned to NFS at Period End |
| Fidelity International Credit Central Fund | $3 | $- | $- |
8. Expense Reductions.
Through arrangements with the Fund's custodian, credits realized as a result of certain uninvested cash balances were used to reduce the Fund's expenses by $2,016.
9. Other.
A fund's organizational documents provide former and current directors and officers with a limited indemnification against liabilities arising in connection with the performance of their duties to the fund. In the normal course of business, a fund may also enter into contracts that provide general indemnifications. A fund's maximum exposure under these arrangements is unknown as this would be dependent on future claims that may be made against a fund. The risk of material loss from such claims is considered remote.
At the end of the period, mutual funds managed by the investment adviser or its affiliates were the owners of record of all of the outstanding shares of the Fund.
10. Risk and Uncertainties.
Many factors affect a fund's performance. Developments that disrupt global economies and financial markets, such as pandemics, epidemics, outbreaks of infectious diseases, war, terrorism, and environmental disasters, may significantly affect a fund's investment performance. The effects of these developments to a fund will be impacted by the types of securities in which a fund invests, the financial condition, industry, economic sector, and geographic location of an issuer, and a fund's level of investment in the securities of that issuer. Significant concentrations in security types, issuers, industries, sectors, and geographic locations may magnify the factors that affect a fund's performance.
To the Board of Trustees of Fidelity Central Investment Portfolios II LLC and Shareholders of Fidelity International Credit Central Fund
Opinion on the Financial Statements
We have audited the accompanying statement of assets and liabilities, including the schedule of investments, of Fidelity International Credit Central Fund (one of the funds constituting Fidelity Central Investment Portfolios II LLC, referred to hereafter as the "Fund") as of December 31, 2023, the related statement of operations for the year ended December 31, 2023, the statement of changes in net assets for each of the two years in the period ended December 31, 2023, including the related notes, and the financial highlights for each of the five years in the period ended December 31, 2023 (collectively referred to as the "financial statements"). In our opinion, the financial statements present fairly, in all material respects, the financial position of the Fund as of December 31, 2023, the results of its operations for the year then ended, the changes in its net assets for each of the two years in the period ended December 31, 2023 and the financial highlights for each of the five years in the period ended December 31, 2023 in conformity with accounting principles generally accepted in the United States of America.
Basis for Opinion
These financial statements are the responsibility of the Fund's management. Our responsibility is to express an opinion on the Fund's financial statements based on our audits. We are a public accounting firm registered with the Public Company Accounting Oversight Board (United States) (PCAOB) and are required to be independent with respect to the Fund in accordance with the U.S. federal securities laws and the applicable rules and regulations of the Securities and Exchange Commission and the PCAOB.
We conducted our audits of these financial statements in accordance with the standards of the PCAOB. Those standards require that we plan and perform the audit to obtain reasonable assurance about whether the financial statements are free of material misstatement, whether due to error or fraud.
Our audits included performing procedures to assess the risks of material misstatement of the financial statements, whether due to error or fraud, and performing procedures that respond to those risks. Such procedures included examining, on a test basis, evidence regarding the amounts and disclosures in the financial statements. Our audits also included evaluating the accounting principles used and significant estimates made by management, as well as evaluating the overall presentation of the financial statements. Our procedures included confirmation of securities owned as of December 31, 2023 by correspondence with the custodian and brokers; when replies were not received from brokers, we performed other auditing procedures. We believe that our audits provide a reasonable basis for our opinion.
/s/ PricewaterhouseCoopers LLP
Boston, Massachusetts
February 14, 2024
We have served as the auditor of one or more investment companies in the Fidelity group of funds since 1932.
DIRECTORS AND OFFICERS (TRUSTEES AND OFFICERS)
The Trustees, Members of the Advisory Board (if any), and officers of the Fidelity Central Investment Portfolios II LLC and fund, as applicable, are listed below. The Board of Trustees governs the fund and is responsible for protecting the interests of shareholders. The Trustees are experienced executives who meet periodically throughout the year to oversee the fund's activities, review contractual arrangements with companies that provide services to the fund, oversee management of the risks associated with such activities and contractual arrangements, and review the fund's performance. Each of the Trustees oversees 314 funds.
The Trustees hold office without limit in time except that (a) any Trustee may resign; (b) any Trustee may be removed by written instrument, signed by at least two-thirds of the number of Trustees prior to such removal; (c) any Trustee who requests to be retired or who has become incapacitated by illness or injury may be retired by written instrument signed by a majority of the other Trustees; and (d) any Trustee may be removed at any special meeting of shareholders by a two-thirds vote of the outstanding voting securities of the trust. Each Trustee who is not an interested person (as defined in the 1940 Act) of the trust and the fund is referred to herein as an Independent Trustee. Each Independent Trustee shall retire not later than the last day of the calendar year in which his or her 75th birthday occurs. The Independent Trustees may waive this mandatory retirement age policy with respect to individual Trustees. Officers and Advisory Board Members hold office without limit in time, except that any officer or Advisory Board Member may resign or may be removed by a vote of a majority of the Trustees at any regular meeting or any special meeting of the Trustees. Except as indicated, each individual has held the office shown or other offices in the same company for the past five years.
The fund's Statement of Additional Information (SAI) includes more information about the Trustees. To request a free copy, call Fidelity at 1-800-544-8544.
Experience, Skills, Attributes, and Qualifications of the Trustees. The Governance and Nominating Committee has adopted a statement of policy that describes the experience, qualifications, attributes, and skills that are necessary and desirable for potential Independent Trustee candidates (Statement of Policy). The Board believes that each Trustee satisfied at the time he or she was initially elected or appointed a Trustee, and continues to satisfy, the standards contemplated by the Statement of Policy. The Governance and Nominating Committee also engages professional search firms to help identify potential Independent Trustee candidates who have the experience, qualifications, attributes, and skills consistent with the Statement of Policy. From time to time, additional criteria based on the composition and skills of the current Independent Trustees, as well as experience or skills that may be appropriate in light of future changes to board composition, business conditions, and regulatory or other developments, have also been considered by the professional search firms and the Governance and Nominating Committee. In addition, the Board takes into account the Trustees' commitment and participation in Board and committee meetings, as well as their leadership of standing and ad hoc committees throughout their tenure.
In determining that a particular Trustee was and continues to be qualified to serve as a Trustee, the Board has considered a variety of criteria, none of which, in isolation, was controlling. The Board believes that, collectively, the Trustees have balanced and diverse experience, qualifications, attributes, and skills, which allow the Board to operate effectively in governing the fund and protecting the interests of shareholders. Information about the specific experience, skills, attributes, and qualifications of each Trustee, which in each case led to the Board's conclusion that the Trustee should serve (or continue to serve) as a trustee of the fund, is provided below.
Board Structure and Oversight Function. Abigail P. Johnson is an interested person and currently serves as Chairman. The Trustees have determined that an interested Chairman is appropriate and benefits shareholders because an interested Chairman has a personal and professional stake in the quality and continuity of services provided to the fund. Independent Trustees exercise their informed business judgment to appoint an individual of their choosing to serve as Chairman, regardless of whether the Trustee happens to be independent or a member of management. The Independent Trustees have determined that they can act independently and effectively without having an Independent Trustee serve as Chairman and that a key structural component for assuring that they are in a position to do so is for the Independent Trustees to constitute a substantial majority for the Board. The Independent Trustees also regularly meet in executive session. Michael E. Kenneally serves as Chairman of the Independent Trustees and as such (i) acts as a liaison between the Independent Trustees and management with respect to matters important to the Independent Trustees and (ii) with management prepares agendas for Board meetings.
Fidelity® funds are overseen by different Boards of Trustees. The fund's Board oversees Fidelity's investment-grade bond, money market, asset allocation and certain equity funds, and other Boards oversee Fidelity's alternative investment, high income and other equity funds. The asset allocation funds may invest in Fidelity® funds that are overseen by such other Boards. The use of separate Boards, each with its own committee structure, allows the Trustees of each group of Fidelity® funds to focus on the unique issues of the funds they oversee, including common research, investment, and operational issues. On occasion, the separate Boards establish joint committees to address issues of overlapping consequences for the Fidelity® funds overseen by each Board.
The Trustees operate using a system of committees to facilitate the timely and efficient consideration of all matters of importance to the Trustees, the fund, and fund shareholders and to facilitate compliance with legal and regulatory requirements and oversight of the fund's activities and associated risks. The Board, acting through its committees, has charged FMR and its affiliates with (i) identifying events or circumstances the occurrence of which could have demonstrably adverse effects on the fund's business and/or reputation; (ii) implementing processes and controls to lessen the possibility that such events or circumstances occur or to mitigate the effects of such events or circumstances if they do occur; and (iii) creating and maintaining a system designed to evaluate continuously business and market conditions in order to facilitate the identification and implementation processes described in (i) and (ii) above. Because the day-to-day operations and activities of the fund are carried out by or through FMR, its affiliates, and other service providers, the fund's exposure to risks is mitigated but not eliminated by the processes overseen by the Trustees. While each of the Board's committees has responsibility for overseeing different aspects of the fund's activities, oversight is exercised primarily through the Operations and Audit Committees. In addition, an ad hoc Board committee of Independent Trustees has worked with FMR to enhance the Board's oversight of investment and financial risks, legal and regulatory risks, technology risks, and operational risks, including the development of additional risk reporting to the Board. Appropriate personnel, including but not limited to the fund's Chief Compliance Officer (CCO), FMR's internal auditor, the independent accountants, the fund's Treasurer and portfolio management personnel, make periodic reports to the Board's committees, as appropriate, including an annual review of Fidelity's risk management program for the Fidelity® funds. The responsibilities of each standing committee, including their oversight responsibilities, are described further under "Standing Committees of the Trustees."
Interested Trustees*:
Correspondence intended for a Trustee who is an interested person may be sent to Fidelity Investments, 245 Summer Street, Boston, Massachusetts 02210.
Name, Year of Birth; Principal Occupations and Other Relevant Experience+
Abigail P. Johnson (1961)
Year of Election or Appointment: 2009
Trustee
Chairman of the Board of Trustees
Ms. Johnson also serves as Trustee of other Fidelity® funds. Ms. Johnson serves as Chairman (2016-present), Chief Executive Officer (2014-present), and Director (2007-present) of FMR LLC (diversified financial services company), President of Fidelity Financial Services (2012-present) and President of Personal, Workplace and Institutional Services (2005-present). Ms. Johnson is Chairman and Director of Fidelity Management & Research Company LLC (investment adviser firm, 2011-present). Previously, Ms. Johnson served as Chairman and Director of FMR Co., Inc. (investment adviser firm, 2011-2019), Vice Chairman (2007-2016) and President (2013-2016) of FMR LLC, President and a Director of Fidelity Management & Research Company (2001-2005), a Trustee of other investment companies advised by Fidelity Management & Research Company, Fidelity Investments Money Management, Inc. (investment adviser firm), and FMR Co., Inc. (2001-2005), Senior Vice President of the Fidelity® funds (2001-2005), and managed a number of Fidelity® funds. Ms. Abigail P. Johnson and Mr. Arthur E. Johnson are not related.
Jennifer Toolin McAuliffe (1959)
Year of Election or Appointment: 2016
Trustee
Ms. McAuliffe also serves as Trustee of other Fidelity® funds and as Trustee of Fidelity Charitable (2020-present). Previously, Ms. McAuliffe served as Co-Head of Fixed Income of Fidelity Investments Limited (now known as FIL Limited (FIL)) (diversified financial services company), Director of Research for FIL's credit and quantitative teams in London, Hong Kong and Tokyo and Director of Research for taxable and municipal bonds at Fidelity Investments Money Management, Inc. Ms. McAuliffe previously served as a member of the Advisory Board of certain Fidelity® funds (2016). Ms. McAuliffe was previously a lawyer at Ropes & Gray LLP and an international banker at Chemical Bank NA (now JPMorgan Chase & Co.). Ms. McAuliffe also currently serves as director or trustee of several not-for-profit entities.
Christine J. Thompson (1958)
Year of Election or Appointment: 2023
Trustee
Ms. Thompson also serves as a Trustee of other Fidelity® funds. Ms. Thompson serves as Leader of Advanced Technologies for Investment Management at Fidelity Investments (2018-present). Previously, Ms. Thompson served as Chief Investment Officer in the Bond group at Fidelity Management & Research Company (2010-2018) and held various other roles including Director of municipal bond portfolio managers and Portfolio Manager of certain Fidelity® funds.
* Determined to be an "Interested Trustee" by virtue of, among other things, his or her affiliation with the Fidelity Central Investment Portfolios II LLC or various entities under common control with FMR.
+ The information includes the Trustee's principal occupation during the last five years and other information relating to the experience, attributes, and skills relevant to the Trustee's qualifications to serve as a Trustee, which led to the conclusion that the Trustee should serve as a Trustee for the fund.
Independent Trustees:
Correspondence intended for an Independent Trustee may be sent to Fidelity Investments, P.O. Box 55235, Boston, Massachusetts 02205-5235.
Name, Year of Birth; Principal Occupations and Other Relevant Experience+
Elizabeth S. Acton (1951)
Year of Election or Appointment: 2013
Trustee
Ms. Acton also serves as Trustee of other Fidelity® funds. Prior to her retirement, Ms. Acton served as Executive Vice President, Finance (2011-2012), Executive Vice President, Chief Financial Officer (2002-2011) and Treasurer (2004-2005) of Comerica Incorporated (financial services). Prior to joining Comerica, Ms. Acton held a variety of positions at Ford Motor Company (1983-2002), including Vice President and Treasurer (2000-2002) and Executive Vice President and Chief Financial Officer of Ford Motor Credit Company (1998-2000). Ms. Acton currently serves as a member of the Board and Audit and Finance Committees of Beazer Homes USA, Inc. (homebuilding, 2012-present). Ms. Acton previously served as a member of the Advisory Board of certain Fidelity® funds (2013-2016).
Laura M. Bishop (1961)
Year of Election or Appointment: 2023
Trustee
Ms. Bishop also serves as Trustee or Member of the Advisory Board of other Fidelity® funds. Prior to her retirement, Ms. Bishop held a variety of positions at United Services Automobile Association (2001-2020), including Executive Vice President and Chief Financial Officer (2014-2020) and Senior Vice President and Deputy Chief Financial Officer (2012-2014). Ms. Bishop currently serves as a member of the Audit Committee and Compensation and Personnel Committee (2021-present) of the Board of Directors of Korn Ferry (global organizational consulting). Previously, Ms. Bishop served as a Member of the Advisory Board of certain Fidelity® funds (2022-2023).
Ann E. Dunwoody (1953)
Year of Election or Appointment: 2018
Trustee
General Dunwoody also serves as Trustee of other Fidelity® funds. General Dunwoody (United States Army, Retired) was the first woman in U.S. military history to achieve the rank of four-star general and prior to her retirement in 2012 held a variety of positions within the U.S. Army, including Commanding General, U.S. Army Material Command (2008-2012). General Dunwoody currently serves as a member of the Board, Chair of Nomination Committee and a member of the Corporate Governance Committee of Kforce Inc. (professional staffing services, 2016-present) and a member of the Board of Automattic Inc. (software engineering, 2018-present). Previously, General Dunwoody served as President of First to Four LLC (leadership and mentoring services, 2012-2022), a member of the Advisory Board and Nominating and Corporate Governance Committee of L3 Technologies, Inc. (communication, electronic, sensor and aerospace systems, 2013-2019) and a member of the Board and Audit and Sustainability and Corporate Responsibility Committees of Republic Services, Inc. (waste collection, disposal and recycling, 2013-2016). General Dunwoody also serves on several boards for non-profit organizations, including as a member of the Board, Chair of the Nomination and Governance Committee and a member of the Audit Committee of the Noble Reach Foundation (formerly Logistics Management Institute) (consulting non-profit, 2012-present) and a member of the Board of ThanksUSA (military family education non-profit, 2014-present). Previously, General Dunwoody served as a member of the Board of Florida Institute of Technology (2015-2022) and a member of the Council of Trustees for the Association of the United States Army (advocacy non-profit, 2013-2021). General Dunwoody previously served as a member of the Advisory Board of certain Fidelity® funds (2018).
John Engler (1948)
Year of Election or Appointment: 2014
Trustee
Mr. Engler also serves as Trustee of other Fidelity® funds. Previously, Mr. Engler served as Governor of Michigan (1991-2003), President of the Business Roundtable (2011-2017) and interim President of Michigan State University (2018-2019). Previously, Mr. Engler served as a member of the Board of Stride, Inc. (formerly K12 Inc.) (technology-based education company, 2012-2022), a member of the Board of Universal Forest Products (manufacturer and distributor of wood and wood-alternative products, 2003-2019) and Trustee of The Munder Funds (2003-2014). Mr. Engler previously served as a member of the Advisory Board of certain Fidelity® funds (2014-2016).
Robert F. Gartland (1951)
Year of Election or Appointment: 2010
Trustee
Mr. Gartland also serves as Trustee of other Fidelity® funds. Prior to his retirement, Mr. Gartland held a variety of positions at Morgan Stanley (financial services, 1979-2007), including Managing Director (1987-2007) and Chase Manhattan Bank (1975-1978). Mr. Gartland previously served as Chairman and an investor in Gartland & Mellina Group Corp. (consulting, 2009-2019), as a member of the Board of National Securities Clearing Corporation (1993-1996) and as Chairman of TradeWeb (2003-2004).
Robert W. Helm (1957)
Year of Election or Appointment: 2023
Trustee
Mr. Helm also serves as Trustee or Member of the Advisory Board of other Fidelity® funds. Mr. Helm was formerly Deputy Chairman (2003-2020), partner (1991-2020) and an associate (1984-1991) of Dechert LLP (formerly Dechert Price & Rhoads). Mr. Helm currently serves on boards and committees of several not-for-profit organizations, including as a Trustee and member of the Executive Committee of the Baltimore Council on Foreign Affairs, a member of the Board of Directors of the St. Vincent de Paul Society of Baltimore and a member of the Life Guard Society of Mt. Vernon. Previously, Mr. Helm served as a Member of the Advisory Board of certain Fidelity® funds (2021-2023).
Michael E. Kenneally (1954)
Year of Election or Appointment: 2009
Trustee
Chairman of the Independent Trustees
Mr. Kenneally also serves as Trustee of other Fidelity® funds and was Vice Chairman (2018-2021) of the Independent Trustees of certain Fidelity® funds. Prior to retirement in 2005, he was Chairman and Global Chief Executive Officer of Credit Suisse Asset Management, the worldwide fund management and institutional investment business of Credit Suisse Group. Previously, Mr. Kenneally was an Executive Vice President and the Chief Investment Officer for Bank of America. In this role, he was responsible for the investment management, strategy and products delivered to the bank's institutional, high-net-worth and retail clients. Earlier, Mr. Kenneally directed the organization's equity and quantitative research groups. He began his career as a research analyst and then spent more than a dozen years as a portfolio manager for endowments, pension plans and mutual funds. He earned the Chartered Financial Analyst (CFA) designation in 1991.
Mark A. Murray (1954)
Year of Election or Appointment: 2016
Trustee
Mr. Murray also serves as Trustee of other Fidelity® funds. Previously, Mr. Murray served as Co-Chief Executive Officer (2013-2016), President (2006-2013) and Vice Chairman (2013-2020) of Meijer, Inc. Mr. Murray serves as a member of the Board (2009-present) and Public Policy and Responsibility Committee (2009-present) and Chair of the Nuclear Review Committee (2019-present) of DTE Energy Company (diversified energy company). Mr. Murray previously served as a member of the Board of Spectrum Health (not-for-profit health system, 2015-2019) and as a member of the Board and Audit Committee and Chairman of the Nominating and Corporate Governance Committee of Universal Forest Products, Inc. (manufacturer and distributor of wood and wood-alternative products, 2004-2016). Mr. Murray also serves as a member of the Board of many community and professional organizations. Mr. Murray previously served as a member of the Advisory Board of certain Fidelity® funds (2016).
Carol J. Zierhoffer (1960)
Year of Election or Appointment: 2023
Trustee
Ms. Zierhoffer also serves as Trustee or Member of the Advisory Board of other Fidelity® funds. Prior to her retirement, Ms. Zierhoffer held a variety of positions at Bechtel Corporation (engineering company, 2013-2019), including Principal Vice President and Chief Information Officer (2013-2016) and Senior Vice President and Chief Information Officer (2016-2019). Ms. Zierhoffer currently serves as a member of the Board of Directors, Audit Committee and Compensation Committee of Allscripts Healthcare Solutions, Inc. (healthcare technology, 2020-present) and as a member of the Board of Directors, Audit and Finance Committee and Nominating and Governance Committee of Atlas Air Worldwide Holdings, Inc. (aviation operating services, 2021-present). Previously, Ms. Zierhoffer served as a member of the Board of Directors and Audit Committee and as the founding Chair of the Information Technology Committee of MedAssets, Inc. (healthcare technology, 2013-2016), and as a Member of the Advisory Board of certain Fidelity® funds (2023).
+ The information includes the Trustee's principal occupation during the last five years and other information relating to the experience, attributes, and skills relevant to the Trustee's qualifications to serve as a Trustee, which led to the conclusion that the Trustee should serve as a Trustee for the fund.
Advisory Board Members and Officers:
Correspondence intended for a Member of the Advisory Board (if any) may be sent to Fidelity Investments, P.O. Box 55235, Boston, Massachusetts 02205-5235. Correspondence intended for an officer may be sent to Fidelity Investments, 245 Summer Street, Boston, Massachusetts 02210.
Name, Year of Birth; Principal Occupation
Heather Bonner (1977)
Year of Election or Appointment: 2023
Assistant Treasurer
Ms. Bonner also serves as an officer of other funds. Ms. Bonner is a Senior Vice President (2022-present) and is an employee of Fidelity Investments (2022-present). Ms. Bonner serves as Vice President, Treasurer, or Assistant Treasurer of certain Fidelity entities. Prior to joining Fidelity, Ms. Bonner served as Managing Director at AQR Capital Management (2013-2022) and was the Treasurer and Principal Financial Officer of the AQR Funds (2013-2022).
Craig S. Brown (1977)
Year of Election or Appointment: 2019
Assistant Treasurer
Mr. Brown also serves as an officer of other funds. Mr. Brown is a Vice President (2015-present) and is an employee of Fidelity Investments. Mr. Brown serves as Assistant Treasurer of FIMM, LLC (2021-present). Previously, Mr. Brown served as Assistant Treasurer of certain Fidelity® funds (2019-2022).
John J. Burke III (1964)
Year of Election or Appointment: 2018
Chief Financial Officer
Mr. Burke also serves as Chief Financial Officer of other funds. Mr. Burke is Head of Fidelity Fund and Investment Operations (2018-present) and is an employee of Fidelity Investments. Mr. Burke serves as President, Executive Vice President, or Director of certain Fidelity entities. Previously Mr. Burke served as head of Asset Management Investment Operations (2012-2018).
Margaret Carey (1973)
Year of Election or Appointment: 2023
Secretary and Chief Legal Officer (CLO)
Ms. Carey also serves as an officer of other funds and as CLO of certain Fidelity entities. Ms. Carey is a Senior Vice President, Deputy General Counsel (2019-present) and is an employee of Fidelity Investments.
David J. Carter (1973)
Year of Election or Appointment: 2020
Assistant Secretary
Mr. Carter also serves as Assistant Secretary of other funds. Mr. Carter is a Senior Vice President, Deputy General Counsel (2022-present) and is an employee of Fidelity Investments. Mr. Carter serves as Chief Legal Officer of Fidelity Investments Institutional Operations Company LLC - Shareholder Division (transfer agent, 2020-present).
Jonathan Davis (1968)
Year of Election or Appointment: 2010
Assistant Treasurer
Mr. Davis also serves as an officer of other funds. Mr. Davis is a Vice President (2006-present) and is an employee of Fidelity Investments. Mr. Davis serves as Assistant Treasurer of certain Fidelity entities.
Laura M. Del Prato (1964)
Year of Election or Appointment: 2018
President and Treasurer
Ms. Del Prato also serves as an officer of other funds. Ms. Del Prato is a Senior Vice President (2017-present) and is an employee of Fidelity Investments. Ms. Del Prato serves as Vice President or Assistant Treasurer of certain Fidelity entities. Previously, Ms. Del Prato served as President and Treasurer of The North Carolina Capital Management Trust: Cash Portfolio and Term Portfolio (2018-2020).
Robin Foley (1964)
Year of Election or Appointment: 2023
Vice President
Ms. Foley also serves as Vice President of other funds. Ms. Foley serves as Head of Fidelity's Fixed Income division (2023-present) and is an employee of Fidelity Investments. Previously, Ms. Foley served as Chief Investment Officer of Bonds (2017-2023).
Christopher M. Gouveia (1973)
Year of Election or Appointment: 2023
Chief Compliance Officer
Mr. Gouveia also serves as Chief Compliance Officer of other funds. Mr. Gouveia is a Senior Vice President of Asset Management Compliance (2019-present) and is an employee of Fidelity Investments. Mr. Gouveia serves as Compliance Officer of Fidelity Management Trust Company (2023-present). Previously, Mr. Gouveia served as Chief Compliance Officer of the North Carolina Capital Management Trust (2016-2019).
Colm A. Hogan (1973)
Year of Election or Appointment: 2016
Assistant Treasurer
Mr. Hogan also serves as an officer of other funds. Mr. Hogan is a Vice President (2016-present) and is an employee of Fidelity Investments. Mr. Hogan serves as Assistant Treasurer of certain Fidelity entities. Previously, Mr. Hogan served as Deputy Treasurer of certain Fidelity® funds (2016-2020) and Assistant Treasurer of certain Fidelity® funds (2016-2018).
Chris Maher (1972)
Year of Election or Appointment: 2013
Assistant Treasurer
Mr. Maher also serves as an officer of other funds. Mr. Maher is a Vice President (2008-present) and is an employee of Fidelity Investments. Mr. Maher serves as Assistant Treasurer of certain Fidelity entities. Previously, Mr. Maher served as Assistant Treasurer of certain funds (2013-2020).
Brett Segaloff (1972)
Year of Election or Appointment: 2021
Anti-Money Laundering (AML) Officer
Mr. Segaloff also serves as AML Officer of other funds. Mr. Segaloff is a Vice President (2022-present) and is an employee of Fidelity Investments. Mr. Segaloff serves as Anti Money Laundering Compliance Officer or Anti Money Laundering/Bank Secrecy Act Compliance Officer of certain Fidelity entities.
Stacie M. Smith (1974)
Year of Election or Appointment: 2013
Assistant Treasurer
Ms. Smith also serves as an officer of other funds. Ms. Smith is a Senior Vice President (2016-present) and is an employee of Fidelity Investments. Ms. Smith serves as Assistant Treasurer of certain Fidelity entities and has served in other fund officer roles.
Jim Wegmann (1979)
Year of Election or Appointment: 2021
Deputy Treasurer
Mr. Wegmann also serves as an officer of other funds. Mr. Wegmann is a Vice President (2016-present) and is an employee of Fidelity Investments. Mr. Wegmann serves as Assistant Treasurer of FIMM, LLC (2021-present). Previously, Mr. Wegmann served as Assistant Treasurer of certain Fidelity® funds (2019-2021).
As a shareholder, you incur two types of costs: (1) transaction costs, which may include sales charges (loads) on purchase payments or redemption proceeds, as applicable and (2) ongoing costs, which generally include management fees, distribution and/or service (12b-1) fees and other Fund expenses. This Example is intended to help you understand your ongoing costs (in dollars) of investing in a fund and to compare these costs with the ongoing costs of investing in other mutual funds.
| The Example is based on an investment of $1,000 invested at the beginning of the period and held for the entire period (July 1, 2023 to December 31, 2023). |
Actual Expenses
The first line of the accompanying table provides information about actual account values and actual expenses. You may use the information in this line, together with the amount you invested, to estimate the expenses that you paid over the period. Simply divide your account value by $1,000.00 (for example, an $8,600 account value divided by $1,000.00 = 8.6), then multiply the result by the number in the first line for a class/Fund under the heading entitled "Expenses Paid During Period" to estimate the expenses you paid on your account during this period. If any fund is a shareholder of any underlying mutual funds or exchange-traded funds (ETFs) (the Underlying Funds), such fund indirectly bears its proportional share of the expenses of the Underlying Funds in addition to the direct expenses incurred presented in the table. These fees and expenses are not included in the annualized expense ratio used to calculate the expense estimate in the table below.
Hypothetical Example for Comparison Purposes
The second line of the accompanying table provides information about hypothetical account values and hypothetical expenses based on the actual expense ratio and an assumed rate of return of 5% per year before expenses, which is not the actual return. The hypothetical account values and expenses may not be used to estimate the actual ending account balance or expenses you paid for the period. You may use this information to compare the ongoing costs of investing in the Fund and other funds. To do so, compare this 5% hypothetical example with the 5% hypothetical examples that appear in the shareholder reports of the other funds. If any fund is a shareholder of any Underlying Funds, such fund indirectly bears its proportional share of the expenses of the Underlying Funds in addition to the direct expenses as presented in the table. These fees and expenses are not included in the annualized expense ratio used to calculate the expense estimate in the table below.
Please note that the expenses shown in the table are meant to highlight your ongoing costs only and do not reflect any transaction costs. Therefore, the second line of the table is useful in comparing ongoing costs only, and will not help you determine the relative total costs of owning different funds. In addition, if these transactional costs were included, your costs would have been higher.
| | | | | Annualized Expense Ratio- A | | Beginning Account Value July 1, 2023 | | Ending Account Value December 31, 2023 | | Expenses Paid During Period- C July 1, 2023 to December 31, 2023 |
| | | | | | | | | | |
| Fidelity® International Credit Central Fund | | | | 0.0046% | | | | | | |
| Actual | | | | | | $ 1,000 | | $ 1,068.00 | | $ .02 |
Hypothetical-B | | | | | | $ 1,000 | | $ 1,025.18 | | $ .02 |
| |
A Annualized expense ratio reflects expenses net of applicable fee waivers.
B 5% return per year before expenses
C Expenses are equal to the annualized expense ratio, multiplied by the average account value over the period, multiplied by 184/ 365 (to reflect the one-half year period). The fees and expenses of any Underlying Funds are not included in each annualized expense ratio.
The dividend and capital gains distributions for the fund(s) are available on Fidelity.com or Institutional.Fidelity.com.
The fund designates $5,034,916 of distributions paid during the fiscal year ended 2023 as qualifying to be taxed as section 163(j) interest dividends.
The fund will notify shareholders in January 2024 of amounts for use in preparing 2023 income tax returns.
Board Approval of Investment Advisory Contracts and Management Fees
Fidelity International Credit Central Fund
Each year, the Board of Trustees, including the Independent Trustees (together, the Board), considers the renewal of the fund's management contract with Fidelity Management & Research Company LLC (FMR) and the sub-advisory agreements (together, the Advisory Contracts) for the fund. FMR and the sub-advisers are referred to herein as the Investment Advisers. The Board, assisted by the advice of fund counsel and Independent Trustees' counsel, requests and considers a broad range of information relevant to the renewal of the Advisory Contracts throughout the year.
The Board meets regularly and, at each of its meetings, covers an extensive agenda of topics and materials and considers factors that are relevant to its annual consideration of the renewal of the fund's Advisory Contracts, including the services and support provided to the fund and its shareholders. The Board's Operations Committee, of which all the Independent Trustees are members, meets regularly throughout the year and requests, receives and considers, among other matters, information related to the annual consideration of the renewal of the fund's Advisory Contracts before making its recommendation to the Board. The Board also meets as needed to review matters specifically related to the Board's annual consideration of the renewal of the Advisory Contracts. Members of the Board may also meet from time to time with trustees of other Fidelity funds through joint ad hoc committees to discuss certain matters relevant to all of the Fidelity funds.
At its September 2023 meeting, the Board unanimously determined to renew the fund's Advisory Contracts. The Board considered all factors it believed relevant and reached a determination, with the assistance of fund counsel and Independent Trustees' counsel and through the exercise of its business judgment, that the renewal of the Advisory Contracts was in the best interests of the fund and its shareholders and the fact that no fee is payable under the management contract was fair and reasonable in light of all the surrounding circumstances.
Nature, Extent, and Quality of Services Provided. The Board considered staffing as it relates to the fund, including the backgrounds and experience of investment personnel of the Investment Advisers, and also considered the Investment Advisers' implementation of the fund's investment program. The Independent Trustees also had discussions with senior management of Fidelity's investment operations and investment groups. The Board considered the structure of the investment personnel compensation program and whether this structure provides appropriate incentives to act in the best interests of the fund.
Resources Dedicated to Investment Management and Support Services. The Board reviewed the general qualifications and capabilities of Fidelity's investment staff, including its size, education, experience, and resources, as well as Fidelity's approach to recruiting, training, managing, and compensating investment personnel. The Board noted the resources devoted to Fidelity's global investment organization, and that Fidelity's analysts have extensive resources, tools and capabilities that allow them to conduct quantitative and fundamental analysis, as well as credit analysis of issuers, counterparties and guarantors. Further, the Board considered that Fidelity's investment professionals have sufficient access to global information and data so as to provide competitive investment results over time, and that those professionals also have access to sophisticated tools that permit them to assess portfolio construction and risk and performance attribution characteristics continuously, as well as to transmit new information and research conclusions rapidly around the world. Additionally, in its deliberations, the Board considered Fidelity's trading, risk management, compliance, cybersecurity, and technology and operations capabilities and resources, which are integral parts of the investment management process.
Administrative Services. The Board considered (i) the nature, extent, quality, and cost of advisory and administrative services performed by the Investment Advisers and their affiliates under the Advisory Contracts and under separate agreements covering transfer agency and pricing and bookkeeping services for the fund; (ii) the nature and extent of Fidelity's supervision of third party service providers, principally custodians, subcustodians, and pricing vendors; and (iii) the resources devoted by Fidelity to, and the record of compliance with, the fund's compliance policies and procedures.
Investment Performance. The Board reviewed the fund's absolute investment performance, as well as the fund's relative investment performance. In this regard, the Board noted that the fund is designed to offer a liquid investment option for other Fidelity funds and accounts and ultimately to enhance the performance of those funds and accounts.
Based on its review, the Board concluded that the nature, extent, and quality of services provided to the fund under the Advisory Contracts should continue to benefit the shareholders of the fund.
Competitiveness of Management Fee and Total Expense Ratio. The Board considered that while the fund does not pay a management fee, FMR receives fees for providing services to funds that invest in the fund. The Board also noted that FMR bears all expenses of the fund with certain limited exceptions (i.e., custody fees, interest, taxes, fees and expenses of the Independent Trustees, proxy and shareholder meeting expenses, and extraordinary expenses). The Board further noted that the fund pays its non-operating expenses, including brokerage commissions and fees and expenses associated with the fund's securities lending program, if applicable. Based on its review, the Board concluded that the management fee received for providing services to the fund and the fund's total expense ratio were reasonable in light of the services that the fund and its shareholders receive and the other factors considered.
Costs of the Services and Profitability. The Board considered the profitability of the funds that invest in the fund, as well as Fidelity's profits in respect of all the Fidelity funds.
A public accounting firm has been engaged annually by the Board as part of the Board's assessment of Fidelity's profitability analysis. The engagement includes the review and assessment of the methodologies used by Fidelity in determining the revenues and expenses attributable to Fidelity's fund business, and completion of agreed-upon procedures in respect of the mathematical accuracy of certain fund profitability information and its conformity to established allocation methodologies. After considering the reports issued under the engagement and information provided by Fidelity, the Board concluded that while other allocation methods may also be reasonable, Fidelity's profitability methodologies are reasonable in all material respects.
The Board also reviewed Fidelity's non-fund businesses and potential indirect benefits such businesses may have received as a result of their association with Fidelity's fund business (i.e., fall-out benefits) as well as cases where Fidelity's affiliates may benefit from the funds' business. The Board considered areas where potential indirect benefits to the Fidelity funds from their relationships with Fidelity may exist. The Board's consideration of these matters was informed by the findings of a joint ad hoc committee created by it and the boards of other Fidelity funds to evaluate potential fall-out benefits.
The Board concluded that the costs of the services provided by and the profits realized by Fidelity in connection with the operation of the fund were not relevant to the renewal of the Advisory Contracts because the fund pays no advisory fees and FMR bears all expenses of the fund with certain limited exceptions.
Economies of Scale. The Board concluded that because the fund pays no advisory fees and FMR bears all expenses of the fund with certain limited exceptions, the realization of economies of scale was not a material factor in the Board's decision to renew the fund's Advisory Contract.
Additional Information Requested by the Board. In order to develop fully the factual basis for consideration of the Fidelity funds' advisory contracts, the Board requested and received additional information on certain topics, including: (i) Fidelity's fund profitability methodology, profitability trends for certain funds, the allocation of various costs to different funds, and the impact of certain factors on fund profitability results; (ii) portfolio manager changes that have occurred during the past year and Fidelity's views regarding portfolio manager investment in the Fidelity funds that they manage; (iii) hiring, training, and retaining personnel; (iv) the arrangements with and compensation paid to certain fund sub-advisers on behalf of the Fidelity funds and the treatment of such compensation within Fidelity's fund profitability methodology; (v) the terms of the funds' various management fee structures, including the basic group fee and the terms of Fidelity's voluntary expense limitation arrangements; (vi) Fidelity's transfer agent, pricing and bookkeeping fees, expense and service structures for different funds and classes relative to competitive trends and market conditions; (vii) the impact on fund profitability of recent industry trends, such as the growth in passively managed funds and the changes in flows for different types of funds; (viii) the types of management fee and total expense comparisons provided, and the challenges and limitations associated with such information; (ix) explanations regarding the relative total expense ratios and management fees of certain funds and classes, total expense and management fee competitive trends, and methodologies for total expense and management fee competitive comparisons; and (x) matters related to money market funds, exchange-traded funds, and target date funds. In addition, the Board considered its discussions with Fidelity regarding Fidelity's efforts to maintain the continuous investment and shareholder services necessary for the funds during the current pandemic and economic circumstances.
Conclusion. Based on its evaluation of all of the conclusions noted above, and after considering all factors it believed relevant, the Board, including the Independent Trustees, concluded that the advisory and sub-advisory fee arrangements are fair and reasonable in light of all of the surrounding circumstances and that the fund's Advisory Contracts should be renewed through September 30, 2024.
| A special meeting of shareholders was held on October 18, 2023. The results of votes taken among shareholders on the proposal before them are reported below. Each vote reported represents one dollar of net asset value held on the record date for the meeting. |
| Proposal 1 |
| To elect a Board of Trustees. |
| | # of Votes | % of Votes |
| Abigail P. Johnson |
| Affirmative | 37,482,316,252.700 | 100.000 |
| TOTAL | 37,482,316,252.700 | 100.000 |
| Jennifer Toolin McAuliffe |
| Affirmative | 37,482,316,252.700 | 100.000 |
| TOTAL | 37,482,316,252.700 | 100.000 |
| Christine J. Thompson |
| Affirmative | 37,482,316,252.700 | 100.000 |
| TOTAL | 37,482,316,252.700 | 100.000 |
| Elizabeth S. Acton |
| Affirmative | 37,482,316,252.700 | 100.000 |
| TOTAL | 37,482,316,252.700 | 100.000 |
| Laura M. Bishop |
| Affirmative | 37,482,316,252.700 | 100.000 |
| TOTAL | 37,482,316,252.700 | 100.000 |
| Ann E. Dunwoody |
| Affirmative | 37,482,316,252.700 | 100.000 |
| TOTAL | 37,482,316,252.700 | 100.000 |
| John Engler |
| Affirmative | 37,482,316,252.700 | 100.000 |
| TOTAL | 37,482,316,252.700 | 100.000 |
| Robert F. Gartland |
| Affirmative | 37,482,316,252.700 | 100.000 |
| TOTAL | 37,482,316,252.700 | 100.000 |
| Robert W. Helm |
| Affirmative | 37,482,316,252.700 | 100.000 |
| TOTAL | 37,482,316,252.700 | 100.000 |
| Arthur E. Johnson |
| Affirmative | 37,482,316,252.700 | 100.000 |
| TOTAL | 37,482,316,252.700 | 100.000 |
| Michael E. Kenneally |
| Affirmative | 37,482,316,252.700 | 100.000 |
| TOTAL | 37,482,316,252.700 | 100.000 |
| Mark A. Murray |
| Affirmative | 37,482,316,252.700 | 100.000 |
| TOTAL | 37,482,316,252.700 | 100.000 |
| Carol J. Zierhoffer |
| Affirmative | 37,482,316,252.700 | 100.000 |
| TOTAL | 37,482,316,252.700 | 100.000 |
| | | |
| Proposal 1 reflects trust wide proposal and voting results. |
1.9882753.106
ICF-ANN-0224
Item 2.
Code of Ethics
As of the end of the period, December 31, 2023, Fidelity Central Investment Portfolios II LLC (the trust) has adopted a code of ethics, as defined in Item 2 of Form N-CSR, that applies to its President and Treasurer and its Chief Financial Officer. A copy of the code of ethics is filed as an exhibit to this Form N-CSR.
Item 3.
Audit Committee Financial Expert
The Board of Trustees of the trust has determined that Elizabeth S. Acton is an audit committee financial expert, as defined in Item 3 of Form N-CSR. Ms. Acton is independent for purposes of Item 3 of Form N-CSR.
Item 4.
Principal Accountant Fees and Services
Fees and Services
The following table presents fees billed by PricewaterhouseCoopers LLP (“PwC”) in each of the last two fiscal years for services rendered to Fidelity International Credit Central Fund (the “Fund”):
Services Billed by PwC
December 31, 2023 FeesA
| | | | |
| Audit Fees | Audit-Related Fees | Tax Fees | All Other Fees |
Fidelity International Credit Central Fund | $78,400 | $6,100 | $11,900 | $2,600 |
| | | | |
| Audit Fees | Audit-Related Fees | Tax Fees | All Other Fees |
Fidelity International Credit Central Fund | $74,700 | $6,200 | $11,400 | $2,800 |
The following table(s) present(s) fees billed by PwC that were required to be approved by the Audit Committee for services that relate directly to the operations and financial reporting of the Fund(s) and that are rendered on behalf of Fidelity Management & Research Company LLC ("FMR") and entities controlling, controlled by, or under common control with FMR (not including any sub-adviser whose role is primarily portfolio management and is subcontracted with or overseen by another investment adviser) that provide ongoing services to the Fund(s) (“Fund Service Providers”):
Services Billed by PwC
| | |
| December 31, 2023A | December 31, 2022A |
Audit-Related Fees | $8,284,200 | $7,914,600 |
Tax Fees | $1,000 | $1,000 |
All Other Fees | $- | $- |
A Amounts may reflect rounding.
“Audit-Related Fees” represent fees billed for assurance and related services that are reasonably related to the performance of the fund audit or the review of the fund's financial statements and that are not reported under Audit Fees.
“Tax Fees” represent fees billed for tax compliance, tax advice or tax planning that relate directly to the operations and financial reporting of the fund.
“All Other Fees” represent fees billed for services provided to the fund or Fund Service Provider, a significant portion of which are assurance related, that relate directly to the operations and financial reporting of the fund, excluding those services that are reported under Audit Fees, Audit-Related Fees or Tax Fees.
Assurance services must be performed by an independent public accountant.
* * *
The aggregate non-audit fees billed by PwC for services rendered to the Fund(s), FMR (not including any sub-adviser whose role is primarily portfolio management and is subcontracted with or overseen by another investment adviser), and any Fund Service Provider for each of the last two fiscal years of the Fund(s) are as follows:
| | |
Billed By | December 31, 2023A | December 31, 2022A |
PwC | $13,608,400 | $12,903,400 |
A Amounts may reflect rounding.
The trust's Audit Committee has considered non-audit services that were not pre-approved that were provided by PwC to Fund Service Providers to be compatible with maintaining the independence of PwC in its(their) audit of the Fund(s), taking into account representations from PwC, in accordance with Public Company Accounting Oversight Board rules, regarding its independence from the Fund(s) and its(their) related
entities and FMR’s review of the appropriateness and permissibility under applicable law of such non-audit services prior to their provision to the Fund(s) Service Providers.
Audit Committee Pre-Approval Policies and Procedures
The trust’s Audit Committee must pre-approve all audit and non-audit services provided by a fund’s independent registered public accounting firm relating to the operations or financial reporting of the fund. Prior to the commencement of any audit or non-audit services to a fund, the Audit Committee reviews the services to determine whether they are appropriate and permissible under applicable law.
The Audit Committee has adopted policies and procedures to, among other purposes, provide a framework for the Committee’s consideration of non-audit services by the audit firms that audit the Fidelity funds. The policies and procedures require that any non-audit service provided by a fund audit firm to a Fidelity fund and any non-audit service provided by a fund auditor to a Fund Service Provider that relates directly to the operations and financial reporting of a Fidelity fund (“Covered Service”) are subject to approval by the Audit Committee before such service is provided.
All Covered Services must be approved in advance of provision of the service either: (i) by formal resolution of the Audit Committee, or (ii) by oral or written approval of the service by the Chair of the Audit Committee (or if the Chair is unavailable, such other member of the Audit Committee as may be designated by the Chair to act in the Chair’s absence). The approval contemplated by (ii) above is permitted where the Treasurer determines that action on such an engagement is necessary before the next meeting of the Audit Committee.
Non-audit services provided by a fund audit firm to a Fund Service Provider that do not relate directly to the operations and financial reporting of a Fidelity fund are reported to the Audit Committee periodically.
Non-Audit Services Approved Pursuant to Rule 2-01(c)(7)(i)(C) and (ii) of Regulation S-X (“De Minimis Exception”)
There were no non-audit services approved or required to be approved by the Audit Committee pursuant to the De Minimis Exception during the Fund’s(s’) last two fiscal years relating to services provided to (i) the Fund(s) or (ii) any Fund Service Provider that relate directly to the operations and financial reporting of the Fund(s).
The Registrant has not retained, for the preparation of the audit report on the financial statements included in the Form N-CSR, a registered public accounting firm that has a branch or office that is located in a foreign jurisdiction and that the Public Company Accounting Oversight Board (the “PCAOB”) has determined that the PCAOB is unable to inspect or investigate completely because of a position taken by an authority in the foreign jurisdiction.
The Registrant is not a “foreign issuer,” as defined in 17 CFR 240.3b-4.
Item 5.
Audit Committee of Listed Registrants
Not applicable.
Item 6.
Investments
(a)
Not applicable.
(b)
Not applicable.
Item 7.
Disclosure of Proxy Voting Policies and Procedures for Closed-End Management Investment Companies
Not applicable.
Item 8.
Portfolio Managers of Closed-End Management Investment Companies
Not applicable.
Item 9.
Purchase of Equity Securities by Closed-End Management Investment Company and Affiliated Purchasers
Not applicable.
Item 10.
Submission of Matters to a Vote of Security Holders
There were no material changes to the procedures by which shareholders may recommend nominees to the trust’s Board of Trustees.
Item 11.
Controls and Procedures
(a)(i) The President and Treasurer and the Chief Financial Officer have concluded that the trust’s disclosure controls and procedures (as defined in Rule 30a-3(c) under the Investment Company Act) provide reasonable assurances that material information relating to the trust is made known to them by the appropriate persons, based on their evaluation of these controls and procedures as of a date within 90 days of the filing date of this report.
(a)(ii) There was no change in the trust’s internal control over financial reporting (as defined in Rule 30a-3(d) under the Investment Company Act) that occurred during the period covered by this report that has materially affected, or is reasonably likely to materially affect, the trust’s internal control over financial reporting.
Item 12.
Disclosure of Securities Lending Activities for Closed-End Management
Investment Companies
Not applicable.
Item 18.
Recovery of Erroneously Awarded Compensation
(a)
Not applicable.
(b)
Not applicable.
Item 19.
Exhibits
SIGNATURES
Pursuant to the requirements of the Securities Exchange Act of 1934 and the Investment Company Act of 1940, the registrant has duly caused this report to be signed on its behalf by the undersigned, thereunto duly authorized.
Fidelity Central Investment Portfolios II LLC
| |
By: | /s/Laura M. Del Prato |
| Laura M. Del Prato |
| President and Treasurer |
|
|
Date: | February 22, 2024 |
Pursuant to the requirements of the Securities Exchange Act of 1934 and the Investment Company Act of 1940, this report has been signed below by the following persons on behalf of the registrant and in the capacities and on the dates indicated.
| |
By: | /s/Laura M. Del Prato |
| Laura M. Del Prato |
| President and Treasurer |
|
|
Date: | February 22, 2024 |
| |
By: | /s/John J. Burke III |
| John J. Burke III |
| Chief Financial Officer |
|
|
Date: | February 22, 2024 |