UNITED STATES
SECURITIES AND EXCHANGE COMMISSION
Washington, D.C. 20549
FORM N-CSR
CERTIFIED SHAREHOLDER REPORT OF REGISTERED
MANAGEMENT INVESTMENT COMPANIES
Investment Company Act file number 811-22083
Fidelity Central Investment Portfolios II LLC
(Exact name of registrant as specified in charter)
245 Summer St., Boston, Massachusetts 02210
(Address of principal executive offices) (Zip code)
Nicole Macarchuk, Secretary
245 Summer St.
Boston, Massachusetts 02210
(Name and address of agent for service)
Registrant's telephone number, including area code:
617-563-7000
| |
Date of fiscal year end: | September 30 |
|
|
Date of reporting period: | September 30, 2024 |
Item 1.
Reports to Stockholders
| |
| | ANNUAL SHAREHOLDER REPORT | AS OF SEPTEMBER 30, 2024 | This report describes changes to the Fund that occurred during the reporting period. |
| | Fidelity® Investment Grade Bond Central Fund Fidelity® Investment Grade Bond Central Fund true |
| | | |
This annual shareholder report contains information about Fidelity® Investment Grade Bond Central Fund for the period October 1, 2023 to September 30, 2024. You can find additional information about the Fund at fundresearch.fidelity.com/prospectus/sec. You can also request this information by contacting us at 1-800-544-8544.
What were your Fund costs for the last year?(based on hypothetical $10,000 investment)
FUND COST (PREVIOUS YEAR)
| | Costs of a $10,000 investment | Costs paid as a percentage of a $10,000 investment | |
| Fidelity® Investment Grade Bond Central Fund | $ 0 A | 0.00%B | |
A Amount represents less than $.50
B Amount represents less than 0.005%
What affected the Fund's performance this period?
•U.S. taxable investment-grade bonds posted a strong advance for the 12 months ending September 30, 2024, helped by notable gains during the summer months as the bond market priced in anticipated interest-rate reductions by the U.S. Federal Reserve, which finally began with a 50 basis point cut on September 18. The full 12-month period was marked by high volatility.
•Against this backdrop, relative to the benchmark Bloomberg U.S. Aggregate Bond Index, the fund benefited from favorable duration positioning. Specifically, the portfolio was more interest-rate sensitive than the index in a period of often-falling rates.
•The fund also benefited from an overweight in credit risk, which added value as credit spreads approached historically tight levels.
•Other notable relative contributors included the fund's allocations to securitized products, including outperforming stakes in commercial mortgage-backed securities, asset-backed securities and collateralized loan obligations.
•Outsized exposure to investment-grade corporate bonds, especially those of bank issuers, also was beneficial, although our positioning among industrial and utility bonds detracted.
•Notable changes in positioning include reduced exposure to investment-grade corporate bonds, an increased allocation to U.S. Treasury debt, and purchases of mortgage bonds during periods of wider credit spreads.
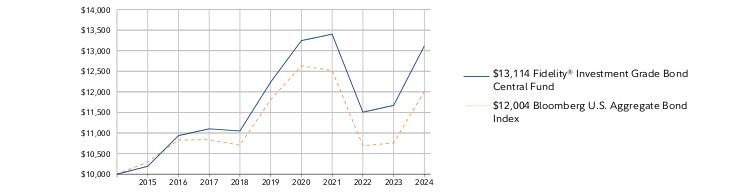
How did the Fund perform over the past 10 years?
CUMULATIVE PERFORMANCE
September 30, 2014 through September 30, 2024.
Initial investment of $10,000.
Fidelity® Investment Grade Bond Central Fund | $10,000 | $10,190 | $10,935 | $11,101 | $11,049 | $12,236 | $13,245 | $13,401 | $11,506 | $11,671 | $13,114 |
Bloomberg U.S. Aggregate Bond Index | $10,000 | $10,294 | $10,829 | $10,836 | $10,705 | $11,807 | $12,632 | $12,518 | $10,691 | $10,760 | $12,004 |
| | 2014 | 2015 | 2016 | 2017 | 2018 | 2019 | 2020 | 2021 | 2022 | 2023 | 2024 |
AVERAGE ANNUAL TOTAL RETURNS: | | 1 Year | 5 Year | 10 Year |
| Fidelity® Investment Grade Bond Central Fund | 12.37% | 1.40% | 2.75% |
| Bloomberg U.S. Aggregate Bond Index | 11.57% | 0.33% | 1.84% |
Visit www.fidelity.com for more recent performance information. |
The Fund's past performance is not a good predictor of the Fund's future performance. The graph and table do not reflect the deduction of taxes that a shareholder would pay on fund distributions or redemption of fund shares. |
Key Fund Statistics (as of September 30, 2024)
KEY FACTS | | |
| Fund Size | $41,003,302,425 | |
| Number of Holdings | 4,835 | |
| Total Advisory Fee | $0 | |
| Portfolio Turnover | 206% | |
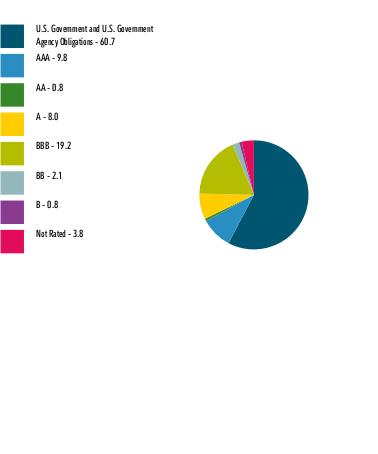
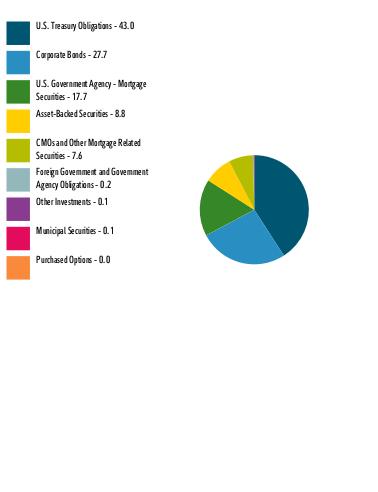
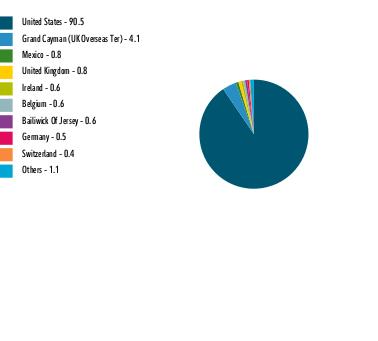
What did the Fund invest in?
(as of September 30, 2024)
| U.S. Government and U.S. Government Agency Obligations | 60.7 |
| AAA | 9.8 |
| AA | 0.8 |
| A | 8.0 |
| BBB | 19.2 |
| BB | 2.1 |
| B | 0.8 |
| Not Rated | 3.8 |
QUALITY DIVERSIFICATION (% of Fund's net assets) |
|
| Short-Term Investments and Net Other Assets (Liabilities) - (5.2)% |
| |
| We have used ratings from Moody's Investors Service, Inc. Where Moody's® ratings are not available, we have used S&P® ratings. All ratings are as of the date indicated and do not reflect subsequent changes. |
| U.S. Treasury Obligations | 43.0 |
| Corporate Bonds | 27.7 |
| U.S. Government Agency - Mortgage Securities | 17.7 |
| Asset-Backed Securities | 8.8 |
| CMOs and Other Mortgage Related Securities | 7.6 |
| Foreign Government and Government Agency Obligations | 0.2 |
| Other Investments | 0.1 |
| Municipal Securities | 0.1 |
| Purchased Options | 0.0 |
ASSET ALLOCATION (% of Fund's net assets) |
|
| Short-Term Investments and Net Other Assets (Liabilities) - (5.2)% |
|
| United States | 90.5 |
| Grand Cayman (UK Overseas Ter) | 4.1 |
| Mexico | 0.8 |
| United Kingdom | 0.8 |
| Ireland | 0.6 |
| Belgium | 0.6 |
| Bailiwick Of Jersey | 0.6 |
| Germany | 0.5 |
| Switzerland | 0.4 |
| Others | 1.1 |
GEOGRAPHIC DIVERSIFICATION (% of Fund's net assets) |
|
| |
|
TOP HOLDINGS (% of Fund's net assets) | | |
| US Treasury Notes | 31.6 | |
| US Treasury Bonds | 11.4 | |
| Fannie Mae Mortgage pass-thru certificates | 5.7 | |
| Ginnie Mae II Pool | 4.8 | |
| Freddie Mac Gold Pool | 4.2 | |
| Uniform Mortgage Backed Securities | 2.3 | |
| JPMorgan Chase & Co | 1.5 | |
| Freddie Mac Multifamily Structured pass-thru certificates | 1.4 | |
| Morgan Stanley | 1.3 | |
| Bank of America Corp | 1.0 | |
| | 65.2 | |
How has the Fund changed?
This is a summary of certain changes to the Fund since October 1, 2023. For more complete information, you may review the Fund's next prospectus, which we expect to be available by November 29, 2024 at fundresearch.fidelity.com/prospectus/sec or upon request at 1-800-544-8544 .
Effective March 1, 2024, the fund's management contract was amended to remove the fee the investment adviser received from investing funds. | |
| Fidelity, the Fidelity Investments Logo and all other Fidelity trademarks or service marks used herein are trademarks or service marks of FMR LLC. Any third-party marks that are used herein are trademarks or service marks of their respective owners. © 2024 FMR LLC. All rights reserved. |
| | For additional information about the Fund; including its prospectus, financial information, holdings and proxy information, scan the QR code or visit fundresearch.fidelity.com/prospectus/sec 1.9913751.100 1374-TSRA-1124 |
| |
| | ANNUAL SHAREHOLDER REPORT | AS OF SEPTEMBER 30, 2024 | This report describes changes to the Fund that occurred during the reporting period. |
| | Fidelity® Inflation-Protected Bond Index Central Fund Fidelity® Inflation-Protected Bond Index Central Fund true |
| | | |
This annual shareholder report contains information about Fidelity® Inflation-Protected Bond Index Central Fund for the period October 1, 2023 to September 30, 2024. You can find additional information about the Fund at fundresearch.fidelity.com/prospectus/sec. You can also request this information by contacting us at 1-800-544-8544.
What were your Fund costs for the last year?(based on hypothetical $10,000 investment)
FUND COST (PREVIOUS YEAR)
| | Costs of a $10,000 investment | Costs paid as a percentage of a $10,000 investment | |
| Fidelity® Inflation-Protected Bond Index Central Fund | $ 0 A | 0.00%B | |
A Amount represents less than $.50
B Amount represents less than 0.005%
What affected the Fund's performance this period?
•U.S. taxable investment-grade bonds posted a strong advance for the 12 months ending September 30, 2024, helped by notable gains during the summer months as the bond market priced in anticipated interest rate reductions by the U.S. Federal Reserve - which finally began with a 50 basis point cut on September 18. The full 12-month period was marked by high volatility.
•We construct the portfolio using optimization. This approach minimizes the differences between risk exposures of the fund relative to the index. We attempt to hold all positions held by the index in the same relative proportions. Notable exposures within the portfolio include duration, key rate durations, and other factors.
How did the Fund perform over the past 10 years?
CUMULATIVE PERFORMANCE
September 30, 2014 through September 30, 2024.
Initial investment of $10,000.
Fidelity® Inflation-Protected Bond Index Central Fund | $10,000 | $9,914 | $10,402 | $10,374 | $10,414 | $11,022 | $11,854 | $12,535 | $11,598 | $11,847 | $12,915 |
Bloomberg U.S. Treasury Inflation-Protected Securities (TIPS) 1-10 Year Index | $10,000 | $9,918 | $10,397 | $10,383 | $10,416 | $11,015 | $11,869 | $12,551 | $11,617 | $11,862 | $12,931 |
Bloomberg U.S. Aggregate Bond Index | $10,000 | $10,294 | $10,829 | $10,836 | $10,705 | $11,807 | $12,632 | $12,518 | $10,691 | $10,760 | $12,004 |
| | 2014 | 2015 | 2016 | 2017 | 2018 | 2019 | 2020 | 2021 | 2022 | 2023 | 2024 |
AVERAGE ANNUAL TOTAL RETURNS: | | 1 Year | 5 Year | 10 Year |
| Fidelity® Inflation-Protected Bond Index Central Fund | 9.01% | 3.22% | 2.59% |
| Bloomberg U.S. Treasury Inflation-Protected Securities (TIPS) 1-10 Year Index | 9.01% | 3.26% | 2.60% |
| Bloomberg U.S. Aggregate Bond Index | 11.57% | 0.33% | 1.84% |
Visit www.fidelity.com for more recent performance information. |
The Fund's past performance is not a good predictor of the Fund's future performance. The graph and table do not reflect the deduction of taxes that a shareholder would pay on fund distributions or redemption of fund shares. |
Key Fund Statistics (as of September 30, 2024)
KEY FACTS | | |
| Fund Size | $442,456,808 | |
| Number of Holdings | 35 | |
| Total Advisory Fee | $0 | |
| Portfolio Turnover | 63% | |
What did the Fund invest in?
(as of September 30, 2024)
COUPON DISTRIBUTION (% of Fund's net assets) |
| 0.01 - 0.99% | 58.2 | |
| 1 - 1.99% | 24.9 | |
| 2 - 2.99% | 11.7 | |
| 3 - 3.99% | 4.8 | |
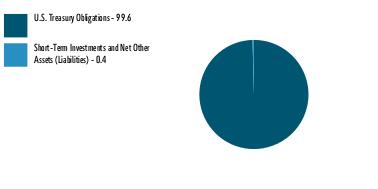
| U.S. Treasury Obligations | 99.6 |
| Short-Term Investments and Net Other Assets (Liabilities) | 0.4 |
ASSET ALLOCATION (% of Fund's net assets) |
|
|
TOP HOLDINGS (% of Fund's net assets) | | |
| US Treasury Notes | 88.3 | |
| US Treasury Bonds | 11.3 | |
| | 99.6 | |
How has the Fund changed?
This is a summary of certain changes to the Fund since October 1, 2023. For more complete information, you may review the Fund's next prospectus, which we expect to be available by November 29, 2024 at fundresearch.fidelity.com/prospectus/sec or upon request at 1-800-544-8544 .
Effective March 1, 2024, the fund's management contract was amended to remove the fee the investment adviser received from investing funds. | |
| Fidelity, the Fidelity Investments Logo and all other Fidelity trademarks or service marks used herein are trademarks or service marks of FMR LLC. Any third-party marks that are used herein are trademarks or service marks of their respective owners. © 2024 FMR LLC. All rights reserved. |
| | For additional information about the Fund; including its prospectus, financial information, holdings and proxy information, scan the QR code or visit fundresearch.fidelity.com/prospectus/sec 1.9913781.100 2398-TSRA-1124 |
Item 2.
Code of Ethics
As of the end of the period, September 30, 2024, Fidelity Central Investment Portfolios II LLC (the trust) has adopted a code of ethics, as defined in Item 2 of Form N-CSR, that applies to its President and Treasurer and its Chief Financial Officer. A copy of the code of ethics is filed as an exhibit to this Form N-CSR.
Item 3.
Audit Committee Financial Expert
The Board of Trustees of the trust has determined that Elizabeth S. Acton is an audit committee financial expert, as defined in Item 3 of Form N-CSR. Ms. Acton is independent for purposes of Item 3 of Form N-CSR.
Item 4.
Principal Accountant Fees and Services
Fees and Services
The following table presents fees billed by Deloitte & Touche LLP, the member firms of Deloitte Touche Tohmatsu, and their respective affiliates (collectively, “Deloitte Entities”) in each of the last two fiscal years for services rendered to Fidelity Inflation-Protected Bond Index Central Fund and Fidelity Investment Grade Bond Central Fund (the “Fund(s)”):
Services Billed by Deloitte Entities
September 30, 2024 FeesA
| | | | |
| Audit Fees | Audit-Related Fees | Tax Fees | All Other Fees |
Fidelity Inflation-Protected Bond Index Central Fund | $43,700 | $- | $10,500 | $1,100 |
Fidelity Investment Grade Bond Central Fund | $73,600 | $- | $9,700 | $1,700 |
| | | | |
| Audit Fees | Audit-Related Fees | Tax Fees | All Other Fees |
Fidelity Inflation-Protected Bond Index Central Fund | $43,900 | $- | $10,500 | $1,100 |
Fidelity Investment Grade Bond Central Fund | $73,700 | $- | $9,700 | $1,700 |
A Amounts may reflect rounding.
The following table(s) present(s) fees billed by Deloitte Entities that were required to be approved by the Audit Committee for services that relate directly to the operations and financial reporting of the Fund(s) and that are rendered on behalf of Fidelity Management & Research Company LLC ("FMR") and entities controlling, controlled by, or under common control with FMR (not including any sub-adviser whose role is primarily portfolio management and is subcontracted with or overseen by another investment adviser) that provide ongoing services to the Fund(s) (“Fund Service Providers”):
Services Billed by Deloitte Entities
| | |
| September 30, 2024A | September 30, 2023A |
Audit-Related Fees | $125,000 | $75,000 |
Tax Fees | $- | $- |
All Other Fees | $2,929,500 | $- |
A Amounts may reflect rounding.
“Audit-Related Fees” represent fees billed for assurance and related services that are reasonably related to the performance of the fund audit or the review of the fund's financial statements and that are not reported under Audit Fees.
“Tax Fees” represent fees billed for tax compliance, tax advice or tax planning that relate directly to the operations and financial reporting of the fund.
“All Other Fees” represent fees billed for services provided to the fund or Fund Service Provider, a significant portion of which are assurance related, that relate directly to the operations and financial reporting of the fund, excluding those services that are reported under Audit Fees, Audit-Related Fees or Tax Fees.
Assurance services must be performed by an independent public accountant.
* * *
The aggregate non-audit fees billed by Deloitte Entities for services rendered to the Fund(s), FMR (not including any sub-adviser whose role is primarily portfolio management and is subcontracted with or overseen by another investment adviser), and any Fund Service Provider for each of the last two fiscal years of the Fund(s) are as follows:
| | | |
Billed By | September 30, 2024A | September 30, 2023A |
Deloitte Entities | $5,208,000 | $4,004,500 | |
A Amounts may reflect rounding.
The trust's Audit Committee has considered non-audit services that were not pre-approved that were provided by Deloitte Entities to Fund Service Providers to be compatible with maintaining the independence of Deloitte Entities in its(their) audit of the Fund(s), taking into account representations from Deloitte Entities, in accordance with Public Company Accounting Oversight Board rules, regarding its independence from the Fund(s) and its(their) related entities and FMR’s review of the appropriateness and permissibility under applicable law of such non-audit services prior to their provision to the Fund(s) Service Providers.
Audit Committee Pre-Approval Policies and Procedures
The trust’s Audit Committee must pre-approve all audit and non-audit services provided by a fund’s independent registered public accounting firm relating to the operations or financial reporting of the fund. Prior to the commencement of any audit or non-audit services to a fund, the Audit Committee reviews the services to determine whether they are appropriate and permissible under applicable law.
The Audit Committee has adopted policies and procedures to, among other purposes, provide a framework for the Committee’s consideration of non-audit services by the audit firms that audit the Fidelity funds. The policies and procedures require that any non-audit service provided by a fund audit firm to a Fidelity fund and any non-audit service provided by a fund auditor to a Fund Service Provider that relates directly to the operations and financial reporting of a Fidelity fund (“Covered Service”) are subject to approval by the Audit Committee before such service is provided.
All Covered Services must be approved in advance of provision of the service either: (i) by formal resolution of the Audit Committee, or (ii) by oral or written approval of the service by the Chair of the Audit Committee (or if the Chair is unavailable, such other member of the Audit Committee as may be designated by the Chair to act in the Chair’s absence). The approval contemplated by (ii) above is permitted where the Treasurer determines that action on such an engagement is necessary before the next meeting of the Audit Committee.
Non-audit services provided by a fund audit firm to a Fund Service Provider that do not relate directly to the operations and financial reporting of a Fidelity fund are reported to the Audit Committee periodically.
Non-Audit Services Approved Pursuant to Rule 2-01(c)(7)(i)(C) and (ii) of Regulation S-X (“De Minimis Exception”)
There were no non-audit services approved or required to be approved by the Audit Committee pursuant to the De Minimis Exception during the Fund’s(s’) last two fiscal years relating to services provided to (i) the Fund(s) or (ii) any Fund Service Provider that relate directly to the operations and financial reporting of the Fund(s).
The Registrant has not retained, for the preparation of the audit report on the financial statements included in the Form N-CSR, a registered public accounting firm that has a branch or office that is located in a foreign jurisdiction and that the Public Company Accounting Oversight Board (the “PCAOB”) has determined that the PCAOB is unable to inspect or investigate completely because of a position taken by an authority in the foreign jurisdiction.
The Registrant is not a “foreign issuer,” as defined in 17 CFR 240.3b-4.
Item 5.
Audit Committee of Listed Registrants
Not applicable.
Item 6.
Investments
(a)
Not applicable.
(b)
Not applicable.
Item 7.
Financial Statements and Financial Highlights for Open-End Management Investment Companies
Fidelity® Inflation-Protected Bond Index Central Fund
Annual Report
September 30, 2024
Contents
To view a fund's proxy voting guidelines and proxy voting record for the 12-month period ended June 30, visit http://www.fidelity.com/proxyvotingresults or visit the Securities and Exchange Commission's (SEC) web site at http://www.sec.gov.
You may also call 1-800-544-8544 to request a free copy of the proxy voting guidelines.
BLOOMBERG ® is a trademark and service mark of Bloomberg Finance L.P. and its affiliates (collectively "Bloomberg"). Bloomberg or Bloomberg's licensors own all proprietary rights in the Bloomberg Indices. Neither Bloomberg nor Bloomberg's licensors approves or endorses this material, or guarantees the accuracy or completeness of any information herein, or makes any warranty, express or implied, as to the results to be obtained therefrom and, to the maximum extent allowed by law, neither shall have any liability or responsibility for injury or damages arising in connection therewith.
Standard & Poor's, S&P and S&P 500 are registered service marks of The McGraw-Hill Companies, Inc. and have been licensed for use by Fidelity Distributors Corporation.
Other third-party marks appearing herein are the property of their respective owners.
All other marks appearing herein are registered or unregistered trademarks or service marks of FMR LLC or an affiliated company. © 2024 FMR LLC. All rights reserved.
A fund files its complete schedule of portfolio holdings with the SEC for the first and third quarters of each fiscal year on Form N-PORT. Forms N-PORT are available on the SEC's web site at http://www.sec.gov. A fund's Forms N-PORT may be reviewed and copied at the SEC's Public Reference Room in Washington, DC. Information regarding the operation of the SEC's Public Reference Room may be obtained by calling 1-800-SEC-0330.
Item 7: Financial Statements and Financial Highlights for Open-End Management Investment Companies (Annual Report)
Fidelity® Inflation-Protected Bond Index Central Fund
Schedule of Investments September 30, 2024
Showing Percentage of Net Assets
| U.S. Treasury Inflation-Protected Obligations - 99.6% |
| | | Principal Amount (a) | Value ($) |
| U.S. Treasury Inflation-Indexed Bonds: | | | |
| 1.75% 1/15/28 | | 10,916,752 | 11,007,770 |
| 2% 1/15/26 | | 6,190,073 | 6,179,819 |
| 2.375% 1/15/27 | | 5,377,915 | 5,466,951 |
| 2.5% 1/15/29 | | 6,032,952 | 6,293,438 |
| 3.375% 4/15/32 | | 3,898,532 | 4,406,154 |
| 3.625% 4/15/28 | | 6,884,344 | 7,379,271 |
| 3.875% 4/15/29 | | 8,380,429 | 9,251,567 |
| U.S. Treasury Inflation-Indexed Notes: | | | |
| 0.125% 10/15/25 | | 17,903,573 | 17,556,811 |
| 0.125% 4/15/26 | | 8,930,658 | 8,683,347 |
| 0.125% 7/15/26 | | 12,008,125 | 11,706,857 |
| 0.125% 10/15/26 | | 18,701,434 | 18,187,521 |
| 0.125% 4/15/27 | | 15,284,354 | 14,716,350 |
| 0.125% 1/15/30 | | 11,052,984 | 10,315,879 |
| 0.125% 7/15/30 | | 20,509,642 | 19,078,009 |
| 0.125% 1/15/31 | | 15,008,294 | 13,795,493 |
| 0.125% 7/15/31 | | 14,332,810 | 13,116,655 |
| 0.125% 1/15/32 | | 22,330,699 | 20,190,664 |
| 0.25% 7/15/29 | | 15,170,315 | 14,397,403 |
| 0.375% 1/15/27 | | 16,117,641 | 15,661,490 |
| 0.375% 7/15/27 | | 14,666,291 | 14,263,842 |
| 0.5% 1/15/28 | | 12,599,955 | 12,202,051 |
| 0.625% 1/15/26 | | 11,954,877 | 11,726,421 |
| 0.625% 7/15/32 | | 19,399,654 | 18,172,225 |
| 0.75% 7/15/28 | | 14,540,508 | 14,221,072 |
| 0.875% 1/15/29 | | 9,517,072 | 9,293,177 |
| 1.125% 1/15/33 | | 16,979,515 | 16,390,031 |
| 1.25% 4/15/28 | | 14,009,830 | 13,880,477 |
| 1.375% 7/15/33 | | 19,304,889 | 19,038,665 |
| 1.625% 10/15/27 | | 15,184,026 | 15,286,268 |
| 1.75% 1/15/34 | | 20,301,478 | 20,536,704 |
| 1.875% 7/15/34 | | 13,692,921 | 14,032,696 |
| 2.125% 4/15/29 | | 17,169,677 | 17,650,680 |
| 2.375% 10/15/28 | | 15,876,183 | 16,492,021 |
| TOTAL U.S. TREASURY INFLATION-PROTECTED OBLIGATIONS (Cost $441,043,364) | | | 440,577,779 |
| | | | |
| Money Market Funds - 0.4% |
| | | Shares | Value ($) |
Fidelity Cash Central Fund 4.89% (b) (Cost $1,675,903) | | 1,675,568 | 1,675,903 |
| | | | |
| TOTAL INVESTMENT IN SECURITIES - 100.0% (Cost $442,719,267) | 442,253,682 |
NET OTHER ASSETS (LIABILITIES) - 0.0% | 203,126 |
| NET ASSETS - 100.0% | 442,456,808 |
| | |
Legend
| (a) | Amount is stated in United States dollars unless otherwise noted. |
| (b) | Affiliated fund that is generally available only to investment companies and other accounts managed by Fidelity Investments. The rate quoted is the annualized seven-day yield of the fund at period end. A complete unaudited listing of the fund's holdings as of its most recent quarter end is available upon request. In addition, each Fidelity Central Fund's financial statements, which are not covered by the Fund's Report of Independent Registered Public Accounting Firm, are available on the SEC's website or upon request. |
Affiliated Central Funds
Fiscal year to date information regarding the Fund's investments in Fidelity Central Funds, including the ownership percentage, is presented below.
| Affiliate | Value, beginning of period ($) | Purchases ($) | Sales Proceeds ($) | Dividend Income ($) | Realized Gain (loss) ($) | Change in Unrealized appreciation (depreciation) ($) | Value, end of period ($) | % ownership, end of period |
| Fidelity Cash Central Fund 4.89% | 1,553,459 | 41,780,590 | 41,658,214 | 38,465 | 68 | - | 1,675,903 | 0.0% |
| Total | 1,553,459 | 41,780,590 | 41,658,214 | 38,465 | 68 | - | 1,675,903 | |
| | | | | | | | | |
Amounts in the dividend income column in the above table include any capital gain distributions from underlying funds, which are presented in the corresponding line item in the Statement of Operations, if applicable.
Amounts included in the purchases and sales proceeds columns may include in-kind transactions, if applicable.
Investment Valuation
The following is a summary of the inputs used, as of September 30, 2024, involving the Fund's assets and liabilities carried at fair value. The inputs or methodology used for valuing securities may not be an indication of the risk associated with investing in those securities. For more information on valuation inputs, and their aggregation into the levels used below, please refer to the Investment Valuation section in the accompanying Notes to Financial Statements.
| Valuation Inputs at Reporting Date: |
| Description | Total ($) | Level 1 ($) | Level 2 ($) | Level 3 ($) |
Investments in Securities: | | | | |
|
| U.S. Government and Government Agency Obligations | 440,577,779 | - | 440,577,779 | - |
|
| Money Market Funds | 1,675,903 | 1,675,903 | - | - |
| Total Investments in Securities: | 442,253,682 | 1,675,903 | 440,577,779 | - |
Financial Statements
| Statement of Assets and Liabilities |
As of September 30, 2024 |
| Assets | | | | |
| Investment in securities, at value - See accompanying schedule: | | | | |
Unaffiliated issuers (cost $441,043,364) | $ | 440,577,779 | | |
Fidelity Central Funds (cost $1,675,903) | | 1,675,903 | | |
| | | | | |
| | | | | |
| Total Investment in Securities (cost $442,719,267) | | | $ | 442,253,682 |
| Receivable for investments sold | | | | 7,331,353 |
| Receivable for fund shares sold | | | | 2,195 |
| Interest receivable | | | | 1,407,612 |
| Distributions receivable from Fidelity Central Funds | | | | 6,330 |
Total assets | | | | 451,001,172 |
| Liabilities | | | | |
| Payable for investments purchased | $ | 8,340,942 | | |
| Payable for fund shares redeemed | | 203,355 | | |
| Other payables and accrued expenses | | 67 | | |
| Total liabilities | | | | 8,544,364 |
| Net Assets | | | $ | 442,456,808 |
| Net Assets consist of: | | | | |
| Paid in capital | | | $ | 472,741,387 |
| Total accumulated earnings (loss) | | | | (30,284,579) |
| Net Assets | | | $ | 442,456,808 |
Net Asset Value, offering price and redemption price per share ($442,456,808 ÷ 4,847,843 shares) | | | $ | 91.27 |
| Statement of Operations |
| Year ended September 30, 2024 |
| Investment Income | | | | |
| Interest | | | $ | 20,926,438 |
| Income from Fidelity Central Funds | | | | 38,465 |
| Total income | | | | 20,964,903 |
| Expenses | | | | |
| Custodian fees and expenses | $ | 900 | | |
| Independent trustees' fees and expenses | | 1,423 | | |
| Miscellaneous | | 1 | | |
| Total expenses | | | | 2,324 |
| Net Investment income (loss) | | | | 20,962,579 |
| Realized and Unrealized Gain (Loss) | | | | |
| Net realized gain (loss) on: | | | | |
| Investment Securities: | | | | |
| Unaffiliated issuers | | (13,678,841) | | |
| Fidelity Central Funds | | 68 | | |
| Total net realized gain (loss) | | | | (13,678,773) |
| Change in net unrealized appreciation (depreciation) on investment securities | | | | 33,657,042 |
| Net gain (loss) | | | | 19,978,269 |
| Net increase (decrease) in net assets resulting from operations | | | $ | 40,940,848 |
| Statement of Changes in Net Assets |
| |
| | Year ended September 30, 2024 | | Year ended September 30, 2023 |
| Increase (Decrease) in Net Assets | | | | |
| Operations | | | | |
| Net investment income (loss) | $ | 20,962,579 | $ | 21,130,326 |
| Net realized gain (loss) | | (13,678,773) | | (24,018,732) |
| Change in net unrealized appreciation (depreciation) | | 33,657,042 | | 18,689,043 |
| Net increase (decrease) in net assets resulting from operations | | 40,940,848 | | 15,800,637 |
| Distributions to shareholders | | (26,643,897) | | (68,116,659) |
| | | | | |
| Affiliated share transactions | | | | |
| Proceeds from sales of shares | | 215,028,822 | | 26,438,998 |
| Reinvestment of distributions | | 26,643,897 | | 68,116,659 |
| Cost of shares redeemed | | (237,216,801) | | (232,780,447) |
| | | | | |
Net increase (decrease) in net assets resulting from share transactions | | 4,455,918 | | (138,224,790) |
| Total increase (decrease) in net assets | | 18,752,869 | | (190,540,812) |
| | | | | |
| Net Assets | | | | |
| Beginning of period | | 423,703,939 | | 614,244,751 |
| End of period | $ | 442,456,808 | $ | 423,703,939 |
| | | | | |
| Other Information | | | | |
| Shares | | | | |
| Sold | | 2,417,895 | | 295,860 |
| Issued in reinvestment of distributions | | 302,854 | | 753,905 |
| Redeemed | | (2,687,702) | | (2,592,904) |
| Net increase (decrease) | | 33,047 | | (1,543,139) |
| | | | | |
Financial Highlights
Fidelity® Inflation-Protected Bond Index Central Fund |
| |
| Years ended September 30, | | 2024 | | 2023 | | 2022 | | 2021 | | 2020 |
Selected Per-Share Data | | | | | | | | | | |
| Net asset value, beginning of period | $ | 88.00 | $ | 96.61 | $ | 113.48 | $ | 108.93 | $ | 102.91 |
| Income from Investment Operations | | | | | | | | | | |
Net investment income (loss) A,B | | 3.663 | | 3.381 | | 7.596 | | 5.098 | | 1.359 |
| Net realized and unrealized gain (loss) | | 4.042 | | (1.285) | | (15.349) | | 1.090 | | 6.303 |
| Total from investment operations | | 7.705 | | 2.096 | | (7.753) | | 6.188 | | 7.662 |
| Distributions from net investment income | | (4.435) | | (8.189) | | (7.113) | | (.222) | | (.389) |
| Distributions from net realized gain | | - | | (2.517) | | (2.004) | | (1.416) | | (1.253) |
| Total distributions | | (4.435) | | (10.706) | | (9.117) | | (1.638) | | (1.642) |
| Net asset value, end of period | $ | 91.27 | $ | 88.00 | $ | 96.61 | $ | 113.48 | $ | 108.93 |
Total Return C | | | | 2.15% | | (7.47)% | | 5.74% | | 7.55% |
Ratios to Average Net Assets B,D,E | | | | | | | | | | |
Expenses before reductions F | | -% | | -% | | -% | | -% | | -% |
Expenses net of fee waivers, if any F | | | | -% | | -% | | -% | | -% |
Expenses net of all reductions F | | -% | | -% | | -% | | -% | | -% |
| Net investment income (loss) | | 4.13% | | 3.71% | | 7.12% | | 4.60% | | 1.30% |
| Supplemental Data | | | | | | | | | | |
| Net assets, end of period (000 omitted) | $ | 442,457 | $ | 423,704 | $ | 614,245 | $ | 1,177,340 | $ | 1,596,245 |
Portfolio turnover rate G | | | | 33% | | 33% | | 24% | | 41% |
ACalculated based on average shares outstanding during the period.
BNet investment income (loss) is affected by the timing of the declaration of dividends by any underlying mutual funds or exchange-traded funds (ETFs). Net investment income (loss) of any mutual funds or ETFs is not included in the Fund's net investment income (loss) ratio.
CTotal returns would have been lower if certain expenses had not been reduced during the applicable periods shown.
DFees and expenses of any underlying mutual funds or exchange-traded funds (ETFs) are not included in the Fund's expense ratio. The Fund indirectly bears its proportionate share of these expenses. For additional expense information related to investments in Fidelity Central Funds, please refer to the "Investments in Fidelity Central Funds" note found in the Notes to Financial Statements section of the most recent Annual or Semi-Annual report.
EExpense ratios reflect operating expenses of the class. Expenses before reductions do not reflect amounts reimbursed, waived, or reduced through arrangements with the investment adviser, brokerage services, or other offset arrangements, if applicable, and do not represent the amount paid by the class during periods when reimbursements, waivers or reductions occur.
FAmount represents less than .005%.
GAmount does not include the portfolio activity of any underlying mutual funds or exchange-traded funds (ETFs).
Notes to Financial Statements
For the period ended September 30, 2024
1. Organization.
Fidelity Inflation-Protected Bond Index Central Fund (the Fund) is a fund of Fidelity Central Investment Portfolios II LLC (the LLC) and is authorized to issue an unlimited number of shares. Shares of the Fund are only offered to other investment companies and accounts managed by Fidelity Management & Research Company LLC (FMR), or its affiliates (the Investing Funds). The LLC is registered under the Investment Company Act of 1940, as amended (the 1940 Act), as an open-end management investment company organized as a Delaware Limited Liability Company.
2. Investments in Fidelity Central Funds.
Funds may invest in Fidelity Central Funds, which are open-end investment companies generally available only to other investment companies and accounts managed by the investment adviser and its affiliates. The Schedule of Investments lists any Fidelity Central Funds held as an investment as of period end, but does not include the underlying holdings of each Fidelity Central Fund. An investing fund indirectly bears its proportionate share of the expenses of the underlying Fidelity Central Funds.
Based on its investment objective, each Fidelity Central Fund may invest or participate in various investment vehicles or strategies that are similar to those of the investing fund. These strategies are consistent with the investment objectives of the investing fund and may involve certain economic risks which may cause a decline in value of each of the Fidelity Central Funds and thus a decline in the value of the investing fund.
| Fidelity Central Fund | Investment Manager | Investment Objective | Investment Practices | Expense RatioA |
| Fidelity Money Market Central Funds | Fidelity Management & Research Company LLC (FMR) | Each fund seeks to obtain a high level of current income consistent with the preservation of capital and liquidity. | Short-term Investments | Less than .005% |
A Expenses expressed as a percentage of average net assets and are as of each underlying Central Fund's most recent annual or semi-annual shareholder report.
A complete unaudited list of holdings for each Fidelity Central Fund is available upon request or at the Securities and Exchange Commission website at www.sec.gov. In addition, the financial statements of the Fidelity Central Funds which contain the significant accounting policies (including investment valuation policies) of those funds, and are not covered by the Report of Independent Registered Public Accounting Firm, are available on the Securities and Exchange Commission website or upon request.
3. Significant Accounting Policies.
The Fund is an investment company and applies the accounting and reporting guidance of the Financial Accounting Standards Board (FASB) Accounting Standards Codification Topic 946 Financial Services - Investment Companies. The financial statements have been prepared in conformity with accounting principles generally accepted in the United States of America (GAAP), which require management to make certain estimates and assumptions at the date of the financial statements. Actual results could differ from those estimates. Subsequent events, if any, through the date that the financial statements were issued have been evaluated in the preparation of the financial statements. The Fund's Schedule of Investments lists any underlying mutual funds or exchange-traded funds (ETFs) but does not include the underlying holdings of these funds. The following summarizes the significant accounting policies of the Fund:
Investment Valuation. Investments are valued as of 4:00 p.m. Eastern time on the last calendar day of the period. The Board of Directors (the Board) has designated the Fund's investment adviser as the valuation designee responsible for the fair valuation function and performing fair value determinations as needed. The investment adviser has established a Fair Value Committee (the Committee) to carry out the day-to-day fair valuation responsibilities and has adopted policies and procedures to govern the fair valuation process and the activities of the Committee. In accordance with these fair valuation policies and procedures, which have been approved by the Board, the Fund attempts to obtain prices from one or more third party pricing services or brokers to value its investments. When current market prices, quotations or currency exchange rates are not readily available or reliable, investments will be fair valued in good faith by the Committee, in accordance with the policies and procedures. Factors used in determining fair value vary by investment type and may include market or investment specific events, transaction data, estimated cash flows, and market observations of comparable investments. The frequency that the fair valuation procedures are used cannot be predicted and they may be utilized to a significant extent. The Committee manages the Fund's fair valuation practices and maintains the fair valuation policies and procedures. The Fund's investment adviser reports to the Board information regarding the fair valuation process and related material matters.
The Fund categorizes the inputs to valuation techniques used to value its investments into a disclosure hierarchy consisting of three levels as shown below:
Level 1 - unadjusted quoted prices in active markets for identical investments
Level 2 - other significant observable inputs (including quoted prices for similar investments, interest rates, prepayment speeds, etc.)
Level 3 - unobservable inputs (including the Fund's own assumptions based on the best information available)
Valuation techniques used to value the Fund's investments by major category are as follows:
Debt securities, including restricted securities, are valued based on evaluated prices received from third party pricing services or from brokers who make markets in such securities. U.S. government and government agency obligations are valued by pricing services who utilize matrix pricing which considers yield or price of bonds of comparable quality, coupon, maturity and type or by broker-supplied prices. When independent prices are unavailable or unreliable, debt securities may be valued utilizing pricing methodologies which consider similar factors that would be used by third party pricing services. Debt securities are generally categorized as Level 2 in the hierarchy but may be Level 3 depending on the circumstances.
Investments in open-end mutual funds, including the Fidelity Central Funds, are valued at their closing net asset value (NAV) each business day and are categorized as Level 1 in the hierarchy.
Changes in valuation techniques may result in transfers in or out of an assigned level within the disclosure hierarchy. The aggregate value of investments by input level as of September 30, 2024 is included at the end of the Fund's Schedule of Investments.
Investment Transactions and Income. For financial reporting purposes, the Fund's investment holdings and NAV include trades executed through the end of the last business day of the period. The NAV per share for processing shareholder transactions is calculated as of the close of business of the New York Stock Exchange (NYSE), normally 4:00 p.m. Eastern time and includes trades executed through the end of the prior business day. Gains and losses on securities sold are determined on the basis of identified cost. Income and capital gain distributions from Fidelity Central Funds, if any, are recorded on the ex-dividend date. Interest income is accrued as earned and includes coupon interest and amortization of premium and accretion of discount on debt securities as applicable. For Treasury Inflation-Protected Securities (TIPS) the principal amount is adjusted daily to keep pace with inflation. Interest is accrued based on the adjusted principal amount. The adjustments to principal due to inflation are reflected as increases or decreases to Interest in the accompanying Statement of Operations. Such adjustments may result in negative Interest and may have a significant impact on the Fund's distributions.
Expenses. Expenses directly attributable to a fund are charged to that fund. Expenses attributable to more than one fund are allocated among the respective funds on the basis of relative net assets or other appropriate methods. Expenses included in the accompanying financial statements reflect the expenses of that fund and do not include any expenses associated with any underlying mutual funds or exchange-traded funds. Although not included in a fund's expenses, a fund indirectly bears its proportionate share of these expenses through the net asset value of each underlying mutual fund or exchange-traded fund. Expense estimates are accrued in the period to which they relate and adjustments are made when actual amounts are known.
Income Tax Information and Distributions to Shareholders. Each year, the Fund intends to qualify as a regulated investment company under Subchapter M of the Internal Revenue Code, including distributing substantially all of its taxable income and realized gains. As a result, no provision for U.S. Federal income taxes is required. As of September 30, 2024, the Fund did not have any unrecognized tax benefits in the financial statements; nor is the Fund aware of any tax positions for which it is reasonably possible that the total amounts of unrecognized tax benefits will significantly change in the next twelve months. The Fund files a U.S. federal tax return, in addition to state and local tax returns as required. The Fund's federal income tax returns are subject to examination by the Internal Revenue Service (IRS) for a period of three fiscal years after they are filed. State and local tax returns may be subject to examination for an additional fiscal year depending on the jurisdiction.
Distributions are declared and recorded daily and paid monthly from net investment income. Distributions from realized gains, if any, are declared and recorded on the ex-dividend date. Income and capital gain distributions are determined in accordance with income tax regulations, which may differ from GAAP.
Capital accounts within the financial statements are adjusted for permanent book-tax differences. These adjustments have no impact on net assets or the results of operations. Capital accounts are not adjusted for temporary book-tax differences which will reverse in a subsequent period.
Book-tax differences are primarily due to capital loss carryforwards and losses deferred due to wash sales.
As of period end, the cost and unrealized appreciation (depreciation) in securities, and derivatives if applicable, for federal income tax purposes were as follows:
| Gross unrealized appreciation | $5,703,269 |
| Gross unrealized depreciation | (7,125,610) |
| Net unrealized appreciation (depreciation) | $(1,422,341) |
| Tax Cost | $443,676,023 |
The tax-based components of distributable earnings as of period end were as follows:
| Undistributed ordinary income | $9,030,626 |
| Capital loss carryforward | $(37,892,862) |
| Net unrealized appreciation (depreciation) on securities and other investments | $(1,422,341) |
Capital loss carryforwards are only available to offset future capital gains of the Fund to the extent provided by regulations and may be limited. The capital loss carryforward information presented below, including any applicable limitation, is estimated as of fiscal period end and is subject to adjustment.
Short-term | $(6,359,926) |
Long-term | (31,532,936) |
| Total capital loss carryforward | $(37,892,862) |
The tax character of distributions paid was as follows:
| | September 30, 2024 | September 30, 2023 |
| Ordinary Income | $26,643,897 | $ 51,056,626 |
| Long-term Capital Gains | - | 17,060,033 |
| Total | $26,643,897 | $ 68,116,659 |
4. Fees and Other Transactions with Affiliates.
Management Fee and Expense Contract. Fidelity Management & Research Company LLC (the investment adviser) provides the Fund with investment management services. The Fund does not pay any fees for these services. Pursuant to the Fund's expense contract, the investment adviser also pays all other expenses of the Fund, excluding custody fees, the compensation of the independent Directors, and certain miscellaneous expenses such as proxy and shareholder meeting expenses.
Interfund Trades. Funds may purchase from or sell securities to other Fidelity Funds under procedures adopted by the Board. The procedures have been designed to ensure these interfund trades are executed in accordance with Rule 17a-7 of the 1940 Act. Any interfund trades are included within the respective purchases and sales amounts shown in the Purchases and Sales of Investments note. During the period, there were no interfund trades.
Sub-Advisory Arrangements. Effective March 1, 2024, the Fund's sub-advisory agreements with FMR Investment Management (UK) Limited, Fidelity Management & Research (Hong Kong) Limited, and Fidelity Management & Research (Japan) Limited were amended to provide that the investment adviser pays each sub-adviser monthly fees equal to 110% of the sub-adviser's costs for providing sub-advisory services.
5. Other.
A fund's organizational documents provide former and current directors and officers with a limited indemnification against liabilities arising in connection with the performance of their duties to the fund. In the normal course of business, a fund may also enter into contracts that provide general indemnifications. A fund's maximum exposure under these arrangements is unknown as this would be dependent on future claims that may be made against a fund. The risk of material loss from such claims is considered remote.
At the end of the period, mutual funds managed by the investment adviser or its affiliates were the owners of record of all of the outstanding shares of the Fund.
6. Risk and Uncertainties.
Many factors affect a fund's performance. Developments that disrupt global economies and financial markets, such as pandemics, epidemics, outbreaks of infectious diseases, war, terrorism, and environmental disasters, may significantly affect a fund's investment performance. The effects of these developments to a fund will be impacted by the types of securities in which a fund invests, the financial condition, industry, economic sector, and geographic location of an issuer, and a fund's level of investment in the securities of that issuer. Significant concentrations in security types, issuers, industries, sectors, and geographic locations may magnify the factors that affect a fund's performance.
Report of Independent Registered Public Accounting Firm
To the Board of Trustees of Fidelity Central Investment Portfolios II LLC and the Shareholders of Fidelity Inflation-Protected Bond Index Central Fund:
Opinion on the Financial Statements and Financial Highlights
We have audited the accompanying statement of assets and liabilities of Fidelity Inflation-Protected Bond Index Central Fund (the "Fund"), a fund of Fidelity Central Investment Portfolios II LLC, including the schedule of investments, as of September 30, 2024, the related statement of operations for the year then ended, the statement of changes in net assets for each of the two years in the period then ended, the financial highlights for each of the five years in the period then ended, and the related notes. In our opinion, the financial statements and financial highlights present fairly, in all material respects, the financial position of the Fund as of September 30, 2024, and the results of its operations for the year then ended, the changes in its net assets for each of the two years in the period then ended, and the financial highlights for each of the five years in the period then ended in conformity with accounting principles generally accepted in the United States of America.
Basis for Opinion
These financial statements and financial highlights are the responsibility of the Fund's management. Our responsibility is to express an opinion on the Fund's financial statements and financial highlights based on our audits. We are a public accounting firm registered with the Public Company Accounting Oversight Board (United States) (PCAOB) and are required to be independent with respect to the Fund in accordance with the U.S. federal securities laws and the applicable rules and regulations of the Securities and Exchange Commission and the PCAOB.
We conducted our audits in accordance with the standards of the PCAOB. Those standards require that we plan and perform the audit to obtain reasonable assurance about whether the financial statements and financial highlights are free of material misstatement, whether due to error or fraud. The Fund is not required to have, nor were we engaged to perform, an audit of its internal control over financial reporting. As part of our audits, we are required to obtain an understanding of internal control over financial reporting but not for the purpose of expressing an opinion on the effectiveness of the Fund's internal control over financial reporting. Accordingly, we express no such opinion.
Our audits included performing procedures to assess the risks of material misstatement of the financial statements and financial highlights, whether due to error or fraud, and performing procedures that respond to those risks. Such procedures included examining, on a test basis, evidence regarding the amounts and disclosures in the financial statements and financial highlights. Our audits also included evaluating the accounting principles used and significant estimates made by management, as well as evaluating the overall presentation of the financial statements and financial highlights. Our procedures included confirmation of securities owned as of September 30, 2024, by correspondence with the custodian and brokers; when replies were not received from brokers, we performed other auditing procedures. We believe that our audits provide a reasonable basis for our opinion.
/s/ Deloitte & Touche LLP
Boston, Massachusetts
November 13, 2024
We have served as the auditor of one or more of the Fidelity investment companies since 1999.
Distributions
(Unaudited)
The dividend and capital gains distributions for the fund(s) are available on Fidelity.com or Institutional.Fidelity.com.
A total of 99.85% of the dividends distributed during the fiscal year was derived from interest on U.S. Government securities which is generally exempt from state income tax.
The fund designates $21,500,865 of distributions paid in the calendar year 2023 as qualifying to be taxed as interest-related dividends for nonresident alien shareholders.
The fund designates $24,612,522 of distributions paid during the fiscal year ended 2024 as qualifying to be taxed as section 163(j) interest dividends.
The fund will notify shareholders in January 2025 of amounts for use in preparing 2024 income tax returns.
Item 8: Changes in and Disagreements with Accountants for Open-End Management Investment Companies
(Unaudited)
Note: This is not applicable for any fund included in this document.
Item 9: Proxy Disclosures for Open-End Management Investment Companies
(Unaudited)
| A special meeting of shareholders was held on October 18, 2023. The results of votes taken among shareholders on the proposal before them are reported below. Each vote reported represents one dollar of net asset value held on the record date for the meeting. |
| Proposal 1 |
| To elect a Board of Trustees. |
| | # of Votes | % of Votes |
| Abigail P. Johnson |
| Affirmative | 37,482,316,252.70 | 100.00 |
| Withheld | 0.00 | 0.00 |
| TOTAL | 37,482,316,252.70 | 100.00 |
| Jennifer Toolin McAuliffe |
| Affirmative | 37,482,316,252.70 | 100.00 |
| Withheld | 0.00 | 0.00 |
| TOTAL | 37,482,316,252.70 | 100.00 |
| Christine J. Thompson |
| Affirmative | 37,482,316,252.70 | 100.00 |
| Withheld | 0.00 | 0.00 |
| TOTAL | 37,482,316,252.70 | 100.00 |
| Elizabeth S. Acton |
| Affirmative | 37,482,316,252.70 | 100.00 |
| Withheld | 0.00 | 0.00 |
| TOTAL | 37,482,316,252.70 | 100.00 |
| Laura M. Bishop |
| Affirmative | 37,482,316,252.70 | 100.00 |
| Withheld | 0.00 | 0.00 |
| TOTAL | 37,482,316,252.70 | 100.00 |
| Ann E. Dunwoody |
| Affirmative | 37,482,316,252.70 | 100.00 |
| Withheld | 0.00 | 0.00 |
| TOTAL | 37,482,316,252.70 | 100.00 |
| John Engler |
| Affirmative | 37,482,316,252.70 | 100.00 |
| Withheld | 0.00 | 0.00 |
| TOTAL | 37,482,316,252.70 | 100.00 |
| Robert F. Gartland |
| Affirmative | 37,482,316,252.70 | 100.00 |
| Withheld | 0.00 | 0.00 |
| TOTAL | 37,482,316,252.70 | 100.00 |
| Robert W. Helm |
| Affirmative | 37,482,316,252.70 | 100.00 |
| Withheld | 0.00 | 0.00 |
| TOTAL | 37,482,316,252.70 | 100.00 |
| Arthur E. Johnson |
| Affirmative | 37,482,316,252.70 | 100.00 |
| Withheld | 0.00 | 0.00 |
| TOTAL | 37,482,316,252.70 | 100.00 |
| Michael E. Kenneally |
| Affirmative | 37,482,316,252.70 | 100.00 |
| Withheld | 0.00 | 0.00 |
| TOTAL | 37,482,316,252.70 | 100.00 |
| Mark A. Murray |
| Affirmative | 37,482,316,252.70 | 100.00 |
| Withheld | 0.00 | 0.00 |
| TOTAL | 37,482,316,252.70 | 100.00 |
| Carol J. Zierhoffer |
| Affirmative | 37,482,316,252.70 | 100.00 |
| Withheld | 0.00 | 0.00 |
| TOTAL | 37,482,316,252.70 | 100.00 |
| | | |
| Proposal 1 reflects trust-wide proposal and voting results. |
Item 10: Remuneration Paid to Directors, Officers, and others of Open-End Management Investment Companies
(Unaudited)
Note: This information is disclosed as part of the financial statements for each Fund as part of Item 7: Financial Statements and Financial Highlights for Open-End Management Investment companies.
Item 11: Statement Regarding Basis for Approval of Investment Advisory Contract
(Unaudited)
Board Approval of Investment Advisory Contracts and Management Fees
Fidelity Inflation-Protected Bond Index Central Fund
Each year, the Board of Directors, including the Independent Directors (together, the Board), considers the renewal of the fund's management contract with Fidelity Management & Research Company LLC (FMR) and the sub-advisory agreements (together, the Advisory Contracts) for the fund. FMR and the sub-advisers are referred to herein as the Investment Advisers. The Board, assisted by the advice of fund counsel and Independent Directors' counsel, requests and considers a broad range of information relevant to the renewal of the Advisory Contracts throughout the year.
The Board meets regularly and, at each of its meetings, covers an extensive agenda of topics and materials and considers factors that are relevant to its annual consideration of the renewal of the fund's Advisory Contracts, including the services and support provided to the fund and its shareholders. The Board's Operations Committee, of which all the Independent Directors are members, meets regularly throughout the year and requests, receives and considers, among other matters, information related to the annual consideration of the renewal of the fund's Advisory Contracts before making its recommendation to the Board. The Board also meets as needed to review matters specifically related to the Board's annual consideration of the renewal of the Advisory Contracts. Members of the Board may also meet from time to time with trustees of other Fidelity funds through joint ad hoc committees to discuss certain matters relevant to all of the Fidelity funds.
At its September 2024 meeting, the Board unanimously determined to renew the fund's Advisory Contracts. The Board considered all factors it believed relevant and reached a determination, with the assistance of fund counsel and Independent Directors' counsel and through the exercise of its business judgment, that the renewal of the Advisory Contracts was in the best interests of the fund and its shareholders and the fact that no fee is payable under the management contract was fair and reasonable in light of all of the surrounding circumstances. The Board's decision to renew the Advisory Contracts was not based on any single factor and the factors may have been weighed differently by different Trustees.
Nature, Extent, and Quality of Services Provided. The Board considered the Investment Advisers' staffing as it relates to the fund, including the backgrounds and experience of investment personnel, and also considered the Investment Advisers' implementation of the fund's investment program. The Independent Directors also had discussions with senior management of Fidelity's investment operations and investment groups. The Board considered the structure of the investment personnel compensation program and whether this structure provides appropriate incentives to act in the best interests of the fund.
Resources Dedicated to Investment Management and Support Services. The Board reviewed the general qualifications and capabilities of Fidelity's investment staff, including its size, education, experience, and resources, as well as Fidelity's approach to recruiting, training, managing, and compensating investment personnel. The Board noted the resources devoted to Fidelity's global investment organization, and that Fidelity's analysts have extensive resources, tools and capabilities that allow them to conduct quantitative and fundamental analysis, as well as credit analysis of issuers, counterparties and guarantors. Further, the Board considered that Fidelity's investment professionals have sufficient access to global information and data so as to provide competitive investment results over time, and that those professionals also have access to sophisticated tools that permit them to assess portfolio construction and risk and performance attribution characteristics continuously, as well as to transmit new information and research conclusions rapidly around the world. Additionally, in its deliberations, the Board considered Fidelity's trading, risk management, compliance, cybersecurity, and technology and operations capabilities and resources, which are integral parts of the investment management process.
Administrative Services. The Board considered (i) the nature, extent, quality, and cost of advisory and administrative services performed by the Investment Advisers and their affiliates under the Advisory Contracts and under separate agreements covering transfer agency and pricing and bookkeeping services for the fund; (ii) the nature and extent of Fidelity's supervision of third party service providers, principally custodians, subcustodians, and pricing vendors; and (iii) the resources devoted by Fidelity to, and the record of compliance with, the fund's compliance policies and procedures, including with respect to liquidity risk management. The Board also considered the fund's securities lending activities and any payments made to Fidelity relating to securities lending under a separate agreement.
Investment Performance. The Board reviewed the fund's absolute investment performance, as well as the fund's relative investment performance. In this regard, the Board noted that the fund is designed to offer a liquid investment option for other Fidelity funds and accounts and ultimately to enhance the performance of those funds and accounts.
Based on its review, the Board concluded that the nature, extent, and quality of services provided to the fund under the Advisory Contracts should continue to benefit the shareholders of the fund.
Competitiveness of Management Fee and Total Expense Ratio. The Board considered that while the fund does not pay a management fee, FMR receives fees for providing services to funds that invest in the fund. The Board also noted that FMR bears all expenses of the fund with certain limited exceptions (i.e., custody fees, interest, taxes, fees and expenses of the Independent Directors, proxy and shareholder meeting expenses, and extraordinary expenses). The Board further noted that the fund pays its non-operating expenses, including brokerage commissions and fees and expenses associated with the fund's securities lending program, if applicable. Based on its review, the Board concluded that the management fee received for providing services to the fund and the fund's total expense ratio were reasonable in light of the services that the fund and its shareholders receive and the other factors considered.
Costs of the Services and Profitability. The Board considered the profitability of the funds that invest in the fund, as well as Fidelity's profits in respect of all the Fidelity funds.
A public accounting firm has been engaged annually by the Board as part of the Board's assessment of Fidelity's profitability analysis. The engagement includes the review and assessment of the methodologies used by Fidelity in determining the revenues and expenses attributable to Fidelity's fund business. After considering the reports issued under the engagement and information provided by Fidelity, the Board concluded that while other allocation methods may also be reasonable, Fidelity's profitability methodologies are reasonable in all material respects.
The Board also reviewed Fidelity's non-fund businesses and potential indirect benefits such businesses may have received as a result of their association with Fidelity's fund business (i.e., fall-out benefits) as well as cases where Fidelity's affiliates may benefit from the funds' business. The Board considered areas where potential indirect benefits to the Fidelity funds from their relationships with Fidelity may exist. The Board's consideration of these matters was informed by the findings of a joint ad hoc committee created by it and the boards of other Fidelity funds to evaluate potential fall-out benefits.
The Board concluded that the costs of the services provided by and the profits realized by Fidelity in connection with the operation of the fund were not relevant to the renewal of the Advisory Contracts because the fund pays no advisory fees and FMR bears all expenses of the fund with certain limited exceptions.
Economies of Scale. The Board concluded that because the fund pays no advisory fees and FMR bears all expenses of the fund with certain limited exceptions, the realization of economies of scale was not a material factor in the Board's decision to renew the fund's Advisory Contract.
Additional Information Requested by the Board. In order to develop fully the factual basis for consideration of the Fidelity funds' advisory contracts, the Board requested and received additional information on certain topics, including: (i) portfolio manager changes that have occurred during the past year; (ii) hiring, training, compensating, and retaining adviser and sub-adviser personnel; (iii) the terms of the funds' various management fee structures and arrangements for transfer agent and pricing and bookkeeping services; (iv) Fidelity's fund profitability methodology, profitability trends for certain funds, the allocation of various costs to different funds, and the impact of certain factors on fund profitability results; (v) the impact on fund profitability of recent industry trends, such as the growth in passively managed funds and the changes in flows for different types of funds; (vi) the types of management fee and total expense comparisons provided, and the challenges and limitations associated with such information; (vii) explanations regarding the relative total expense ratios and management fees of certain funds and classes, total expense and management fee competitive trends, and methodologies for total expense and management fee competitive comparisons; (viii) matters related to money market funds, exchange-traded funds, and target date funds; (ix) the arrangements with and compensation paid to certain fund sub-advisers and the treatment of such compensation within Fidelity's fund profitability methodology; and (x) the terms of management contracts between Fidelity and other funds and products not overseen by the Board.
Conclusion. Based on its evaluation of all of the conclusions noted above, and after considering all factors it believed relevant, the Board, including the Independent Directors, concluded that the advisory and sub-advisory fee arrangements are fair and reasonable in light of all of the surrounding circumstances and that the fund's Advisory Contracts should be renewed through September 30, 2025.
1.938133.112
IPB-ANN-1124
Fidelity® Investment Grade Bond Central Fund
Annual Report
September 30, 2024
Contents
To view a fund's proxy voting guidelines and proxy voting record for the 12-month period ended June 30, visit http://www.fidelity.com/proxyvotingresults or visit the Securities and Exchange Commission's (SEC) web site at http://www.sec.gov.
You may also call 1-800-544-8544 to request a free copy of the proxy voting guidelines.
Standard & Poor's, S&P and S&P 500 are registered service marks of The McGraw-Hill Companies, Inc. and have been licensed for use by Fidelity Distributors Corporation.
Other third-party marks appearing herein are the property of their respective owners.
All other marks appearing herein are registered or unregistered trademarks or service marks of FMR LLC or an affiliated company. © 2024 FMR LLC. All rights reserved.
A fund files its complete schedule of portfolio holdings with the SEC for the first and third quarters of each fiscal year on Form N-PORT. Forms N-PORT are available on the SEC's web site at http://www.sec.gov. A fund's Forms N-PORT may be reviewed and copied at the SEC's Public Reference Room in Washington, DC. Information regarding the operation of the SEC's Public Reference Room may be obtained by calling 1-800-SEC-0330.
Item 7: Financial Statements and Financial Highlights for Open-End Management Investment Companies (Annual Report)
Fidelity® Investment Grade Bond Central Fund
Schedule of Investments September 30, 2024
Showing Percentage of Net Assets
| Nonconvertible Bonds - 27.6% |
| | | Principal Amount (a) | Value ($) |
| COMMUNICATION SERVICES - 2.2% | | | |
| Diversified Telecommunication Services - 0.6% | | | |
| AT&T, Inc.: | | | |
| 2.55% 12/1/33 | | 53,719,000 | 45,279,074 |
| 3.8% 12/1/57 | | 106,127,000 | 80,352,396 |
| 4.3% 2/15/30 | | 13,106,000 | 13,090,060 |
| 4.75% 5/15/46 | | 10,000,000 | 9,357,135 |
| Verizon Communications, Inc.: | | | |
| 2.987% 10/30/56 | | 65,611,000 | 43,035,414 |
| 3.15% 3/22/30 | | 9,123,000 | 8,596,986 |
| 4.78% 2/15/35 (b) | | 5,482,000 | 5,474,127 |
| 4.862% 8/21/46 | | 27,196,000 | 26,505,572 |
| 5.012% 4/15/49 | | 3,772,000 | 3,801,403 |
| | | | 235,492,167 |
| Entertainment - 0.0% | | | |
| NBCUniversal Media LLC 5.95% 4/1/41 | | 6,541,000 | 7,131,022 |
| The Walt Disney Co. 3.6% 1/13/51 | | 25,350,000 | 20,260,968 |
| | | | 27,391,990 |
| Media - 1.3% | | | |
| Charter Communications Operating LLC/Charter Communications Operating Capital Corp.: | | | |
| 4.4% 4/1/33 | | 11,421,000 | 10,448,731 |
| 4.908% 7/23/25 | | 4,371,000 | 4,363,850 |
| 5.05% 3/30/29 | | 10,610,000 | 10,554,546 |
| 5.25% 4/1/53 | | 21,987,000 | 17,966,703 |
| 5.375% 5/1/47 | | 78,778,000 | 66,144,216 |
| 5.5% 4/1/63 | | 11,421,000 | 9,305,930 |
| 5.75% 4/1/48 | | 11,687,000 | 10,206,021 |
| 6.1% 6/1/29 | | 26,277,000 | 27,198,263 |
| 6.484% 10/23/45 | | 9,303,000 | 8,974,549 |
| 6.55% 6/1/34 | | 14,327,000 | 14,902,558 |
| Comcast Corp.: | | | |
| 3.3% 4/1/27 | | 6,795,000 | 6,685,180 |
| 3.4% 4/1/30 | | 6,970,000 | 6,686,763 |
| 3.75% 4/1/40 | | 2,448,000 | 2,119,183 |
| 3.9% 3/1/38 | | 5,001,000 | 4,513,875 |
| 4.65% 7/15/42 | | 11,795,000 | 11,148,855 |
| Discovery Communications LLC: | | | |
| 3.625% 5/15/30 | | 14,753,000 | 13,291,782 |
| 4.125% 5/15/29 | | 937,000 | 885,787 |
| Fox Corp.: | | | |
| 4.709% 1/25/29 | | 4,409,000 | 4,465,249 |
| 5.476% 1/25/39 | | 8,943,000 | 9,022,217 |
| Time Warner Cable LLC: | | | |
| 4.5% 9/15/42 | | 19,701,000 | 15,096,268 |
| 5.5% 9/1/41 | | 8,397,000 | 7,280,763 |
| 5.875% 11/15/40 | | 7,566,000 | 6,861,097 |
| 6.55% 5/1/37 | | 73,937,000 | 73,183,328 |
| 6.75% 6/15/39 | | 10,675,000 | 10,690,522 |
| 7.3% 7/1/38 | | 16,247,000 | 17,067,744 |
| Warnermedia Holdings, Inc.: | | | |
| 3.638% 3/15/25 | | 10,102,000 | 10,031,098 |
| 3.755% 3/15/27 | | 19,757,000 | 19,103,984 |
| 4.054% 3/15/29 | | 5,910,000 | 5,598,751 |
| 4.279% 3/15/32 | | 28,666,000 | 25,464,930 |
| 5.05% 3/15/42 | | 14,442,000 | 11,789,188 |
| 5.141% 3/15/52 | | 115,677,000 | 89,218,734 |
| | | | 530,270,665 |
| Wireless Telecommunication Services - 0.3% | | | |
| T-Mobile U.S.A., Inc.: | | | |
| 2.25% 11/15/31 | | 40,000,000 | 34,511,975 |
| 3.75% 4/15/27 | | 25,540,000 | 25,233,077 |
| 3.875% 4/15/30 | | 36,970,000 | 35,952,240 |
| 4.375% 4/15/40 | | 5,513,000 | 5,083,659 |
| 4.5% 4/15/50 | | 10,830,000 | 9,632,764 |
| | | | 110,413,715 |
TOTAL COMMUNICATION SERVICES | | | 903,568,537 |
| CONSUMER DISCRETIONARY - 1.0% | | | |
| Automobiles - 0.1% | | | |
| General Motors Financial Co., Inc.: | | | |
| 2.35% 2/26/27 | | 17,500,000 | 16,659,141 |
| 4% 1/15/25 | | 14,536,000 | 14,483,443 |
| 5.85% 4/6/30 | | 13,062,000 | 13,612,539 |
| | | | 44,755,123 |
| Hotels, Restaurants & Leisure - 0.1% | | | |
| McDonald's Corp.: | | | |
| 3.3% 7/1/25 | | 2,498,000 | 2,474,206 |
| 3.5% 7/1/27 | | 7,113,000 | 7,014,153 |
| 3.6% 7/1/30 | | 8,445,000 | 8,197,056 |
| 4.2% 4/1/50 | | 4,263,000 | 3,685,674 |
| | | | 21,371,089 |
| Household Durables - 0.1% | | | |
| D.R. Horton, Inc. 2.6% 10/15/25 | | 34,514,000 | 33,837,400 |
| Toll Brothers Finance Corp. 4.875% 3/15/27 | | 16,319,000 | 16,429,629 |
| | | | 50,267,029 |
| Leisure Products - 0.1% | | | |
| Hasbro, Inc. 3% 11/19/24 | | 19,745,000 | 19,677,157 |
| Specialty Retail - 0.4% | | | |
| AutoNation, Inc.: | | | |
| 3.85% 3/1/32 | | 21,966,000 | 20,259,590 |
| 4.75% 6/1/30 | | 3,310,000 | 3,294,389 |
| AutoZone, Inc.: | | | |
| 3.625% 4/15/25 | | 4,758,000 | 4,725,601 |
| 4% 4/15/30 | | 22,128,000 | 21,722,529 |
| Lowe's Companies, Inc.: | | | |
| 3.35% 4/1/27 | | 3,072,000 | 3,015,982 |
| 3.75% 4/1/32 | | 9,454,000 | 9,021,610 |
| 4.25% 4/1/52 | | 59,996,000 | 50,795,438 |
| 4.45% 4/1/62 | | 39,650,000 | 33,592,472 |
| 4.5% 4/15/30 | | 16,112,000 | 16,319,284 |
| O'Reilly Automotive, Inc. 4.2% 4/1/30 | | 4,968,000 | 4,928,106 |
| The Home Depot, Inc. 2.5% 4/15/27 | | 3,139,000 | 3,033,461 |
| | | | 170,708,462 |
| Textiles, Apparel & Luxury Goods - 0.2% | | | |
| NIKE, Inc. 2.75% 3/27/27 | | 6,632,000 | 6,463,346 |
| Tapestry, Inc.: | | | |
| 7% 11/27/26 | | 14,433,000 | 14,932,789 |
| 7.05% 11/27/25 | | 5,350,000 | 5,455,837 |
| 7.35% 11/27/28 | | 22,394,000 | 23,533,269 |
| 7.7% 11/27/30 | | 22,394,000 | 24,125,199 |
| 7.85% 11/27/33 | | 22,394,000 | 24,282,186 |
| | | | 98,792,626 |
TOTAL CONSUMER DISCRETIONARY | | | 405,571,486 |
| CONSUMER STAPLES - 0.9% | | | |
| Beverages - 0.9% | | | |
| Anheuser-Busch Companies LLC / Anheuser-Busch InBev Worldwide, Inc. 4.9% 2/1/46 | | 17,500,000 | 17,234,771 |
| Anheuser-Busch InBev Worldwide, Inc.: | | | |
| 3.5% 6/1/30 | | 10,000,000 | 9,706,863 |
| 4.35% 6/1/40 | | 10,000,000 | 9,444,008 |
| 4.5% 6/1/50 | | 30,000,000 | 28,596,976 |
| 4.75% 4/15/58 | | 26,711,000 | 25,650,254 |
| 5.45% 1/23/39 | | 23,200,000 | 24,835,366 |
| 5.55% 1/23/49 | | 54,331,000 | 58,569,115 |
| 5.8% 1/23/59 (Reg. S) | | 55,947,000 | 63,034,709 |
| Molson Coors Beverage Co.: | | | |
| 3% 7/15/26 | | 48,345,000 | 47,432,068 |
| 5% 5/1/42 | | 3,080,000 | 3,015,693 |
| PepsiCo, Inc.: | | | |
| 2.625% 3/19/27 | | 2,862,000 | 2,780,044 |
| 2.75% 3/19/30 | | 18,600,000 | 17,420,372 |
| The Coca-Cola Co.: | | | |
| 3.375% 3/25/27 | | 24,531,000 | 24,316,288 |
| 3.45% 3/25/30 | | 14,988,000 | 14,621,553 |
| | | | 346,658,080 |
| Consumer Staples Distribution & Retail - 0.0% | | | |
| Sysco Corp. 3.25% 7/15/27 | | 11,011,000 | 10,727,803 |
| Food Products - 0.0% | | | |
| Archer Daniels Midland Co. 3.25% 3/27/30 | | 6,931,000 | 6,613,171 |
| General Mills, Inc. 2.875% 4/15/30 | | 3,013,000 | 2,799,630 |
| | | | 9,412,801 |
| Household Products - 0.0% | | | |
| Kimberly-Clark Corp. 3.1% 3/26/30 | | 1,764,000 | 1,681,522 |
TOTAL CONSUMER STAPLES | | | 368,480,206 |
| ENERGY - 2.9% | | | |
| Energy Equipment & Services - 0.0% | | | |
| Halliburton Co.: | | | |
| 3.8% 11/15/25 | | 207,000 | 205,543 |
| 4.85% 11/15/35 | | 7,402,000 | 7,391,003 |
| | | | 7,596,546 |
| Oil, Gas & Consumable Fuels - 2.9% | | | |
| Cenovus Energy, Inc. 5.25% 6/15/37 | | 13,846,000 | 13,660,435 |
| Columbia Pipeline Group, Inc. 4.5% 6/1/25 | | 6,628,000 | 6,609,886 |
| Columbia Pipelines Operating Co. LLC: | | | |
| 5.927% 8/15/30 (b) | | 5,327,000 | 5,641,512 |
| 6.036% 11/15/33 (b) | | 14,358,000 | 15,319,982 |
| 6.497% 8/15/43 (b) | | 4,293,000 | 4,787,391 |
| 6.544% 11/15/53 (b) | | 7,728,000 | 8,703,781 |
| 6.714% 8/15/63 (b) | | 4,626,000 | 5,288,526 |
| DCP Midstream Operating LP: | | | |
| 5.125% 5/15/29 | | 15,661,000 | 16,050,990 |
| 5.6% 4/1/44 | | 13,506,000 | 13,430,768 |
| 6.45% 11/3/36 (b) | | 10,621,000 | 11,454,440 |
| Enbridge, Inc. 4.25% 12/1/26 | | 8,321,000 | 8,312,117 |
| Energy Transfer LP: | | | |
| 3.75% 5/15/30 | | 27,891,000 | 26,643,529 |
| 4.95% 6/15/28 | | 18,799,000 | 19,119,409 |
| 5% 5/15/50 | | 29,826,000 | 26,945,419 |
| 5.25% 4/15/29 | | 10,158,000 | 10,449,177 |
| 5.25% 7/1/29 | | 11,564,000 | 11,910,157 |
| 5.4% 10/1/47 | | 6,651,000 | 6,333,394 |
| 5.6% 9/1/34 | | 20,000,000 | 20,778,400 |
| 5.8% 6/15/38 | | 10,481,000 | 10,912,795 |
| 6% 6/15/48 | | 26,826,000 | 27,464,992 |
| 6.25% 4/15/49 | | 7,637,000 | 8,030,312 |
| Enterprise Products Operating LP: | | | |
| 3.7% 2/15/26 | | 8,600,000 | 8,552,394 |
| 3.75% 2/15/25 | | 285,000 | 283,770 |
| Hess Corp.: | | | |
| 4.3% 4/1/27 | | 23,059,000 | 23,053,509 |
| 5.6% 2/15/41 | | 5,656,000 | 5,884,835 |
| 7.125% 3/15/33 | | 4,791,000 | 5,529,239 |
| 7.3% 8/15/31 | | 6,610,000 | 7,569,352 |
| 7.875% 10/1/29 | | 20,178,000 | 23,100,601 |
| Kinder Morgan Energy Partners LP 6.55% 9/15/40 | | 1,645,000 | 1,784,602 |
| MPLX LP: | | | |
| 2.65% 8/15/30 | | 9,000,000 | 8,100,488 |
| 4.8% 2/15/29 | | 5,370,000 | 5,453,590 |
| 4.875% 12/1/24 | | 12,572,000 | 12,558,117 |
| 4.95% 9/1/32 | | 30,925,000 | 31,042,353 |
| 5.5% 2/15/49 | | 16,108,000 | 15,683,476 |
| Occidental Petroleum Corp.: | | | |
| 5.55% 3/15/26 | | 26,200,000 | 26,498,164 |
| 5.55% 10/1/34 | | 27,742,000 | 28,163,258 |
| 6.2% 3/15/40 | | 7,169,000 | 7,442,476 |
| 6.45% 9/15/36 | | 15,883,000 | 17,153,005 |
| 6.6% 3/15/46 | | 28,439,000 | 30,600,023 |
| 7.5% 5/1/31 | | 29,749,000 | 33,803,878 |
| ONEOK, Inc.: | | | |
| 4.25% 9/24/27 | | 10,175,000 | 10,184,725 |
| 4.4% 10/15/29 | | 10,640,000 | 10,604,001 |
| 4.75% 10/15/31 | | 20,697,000 | 20,697,049 |
| Ovintiv, Inc.: | | | |
| 5.15% 11/15/41 | | 5,000,000 | 4,406,262 |
| 8.125% 9/15/30 | | 13,383,000 | 15,543,197 |
| Petroleos Mexicanos: | | | |
| 4.5% 1/23/26 | | 24,688,000 | 23,873,296 |
| 5.35% 2/12/28 | | 3,500,000 | 3,270,750 |
| 5.95% 1/28/31 | | 26,624,000 | 22,973,850 |
| 6.35% 2/12/48 | | 14,404,000 | 9,967,712 |
| 6.49% 1/23/27 | | 37,360,000 | 36,788,530 |
| 6.5% 3/13/27 | | 21,300,000 | 20,863,350 |
| 6.7% 2/16/32 | | 43,200,000 | 38,627,280 |
| 6.75% 9/21/47 | | 102,130,000 | 73,022,950 |
| 6.84% 1/23/30 | | 14,971,000 | 13,840,690 |
| 6.95% 1/28/60 | | 18,760,000 | 13,424,656 |
| 7.69% 1/23/50 | | 117,141,000 | 90,948,272 |
| Plains All American Pipeline LP/PAA Finance Corp.: | | | |
| 3.55% 12/15/29 | | 5,964,000 | 5,672,668 |
| 3.6% 11/1/24 | | 6,641,000 | 6,631,190 |
| 3.8% 9/15/30 | | 15,976,000 | 15,226,426 |
| Sabine Pass Liquefaction LLC 4.5% 5/15/30 | | 33,855,000 | 33,765,199 |
| Shell International Finance BV 4.375% 5/11/45 | | 6,392,000 | 5,807,389 |
| The Williams Companies, Inc.: | | | |
| 2.6% 3/15/31 | | 5,542,000 | 4,897,315 |
| 3.5% 11/15/30 | | 45,537,000 | 43,050,671 |
| 3.9% 1/15/25 | | 4,336,000 | 4,317,850 |
| 4.65% 8/15/32 | | 32,200,000 | 31,990,701 |
| 5.3% 8/15/52 | | 7,294,000 | 7,075,702 |
| Western Midstream Operating LP: | | | |
| 3.95% 6/1/25 | | 3,918,000 | 3,886,865 |
| 4.5% 3/1/28 | | 3,100,000 | 3,073,055 |
| 4.65% 7/1/26 | | 9,376,000 | 9,377,191 |
| 4.75% 8/15/28 | | 5,504,000 | 5,496,624 |
| 6.35% 1/15/29 | | 13,343,000 | 14,185,971 |
| | | | 1,173,595,929 |
TOTAL ENERGY | | | 1,181,192,475 |
| FINANCIALS - 12.7% | | | |
| Banks - 5.2% | | | |
| Bank of America Corp.: | | | |
| 2.299% 7/21/32 (c) | | 80,000,000 | 69,252,190 |
| 2.972% 2/4/33 (c) | | 17,500,000 | 15,672,004 |
| 3.419% 12/20/28 (c) | | 23,187,000 | 22,556,370 |
| 3.5% 4/19/26 | | 34,343,000 | 34,006,995 |
| 3.705% 4/24/28 (c) | | 58,915,000 | 58,062,008 |
| 3.95% 4/21/25 | | 19,377,000 | 19,280,667 |
| 4.183% 11/25/27 | | 22,749,000 | 22,702,937 |
| 4.25% 10/22/26 | | 20,189,000 | 20,178,850 |
| 4.271% 7/23/29 (c) | | 2,000,000 | 1,994,730 |
| 4.376% 4/27/28 (c) | | 40,000,000 | 40,063,366 |
| 4.45% 3/3/26 | | 3,182,000 | 3,186,367 |
| 5.015% 7/22/33 (c) | | 50,000,000 | 51,297,393 |
| 5.468% 1/23/35 (c) | | 50,000,000 | 52,580,205 |
| Barclays PLC: | | | |
| 2.852% 5/7/26 (c) | | 34,514,000 | 34,060,040 |
| 2.894% 11/24/32 (c) | | 13,572,000 | 11,903,287 |
| 4.375% 1/12/26 | | 28,767,000 | 28,712,223 |
| 5.088% 6/20/30 (c) | | 35,020,000 | 35,132,286 |
| 5.2% 5/12/26 | | 11,811,000 | 11,884,692 |
| 5.829% 5/9/27 (c) | | 33,090,000 | 33,719,269 |
| 6.224% 5/9/34 (c) | | 31,185,000 | 33,597,634 |
| 6.692% 9/13/34 (c) | | 45,000,000 | 50,042,476 |
| BNP Paribas SA 2.219% 6/9/26 (b)(c) | | 32,804,000 | 32,173,380 |
| Citigroup, Inc.: | | | |
| 3.785% 3/17/33 (c) | | 17,500,000 | 16,393,311 |
| 3.875% 3/26/25 | | 35,450,000 | 35,261,127 |
| 4.3% 11/20/26 | | 52,072,000 | 52,019,160 |
| 4.4% 6/10/25 | | 11,010,000 | 10,970,669 |
| 4.412% 3/31/31 (c) | | 45,100,000 | 44,786,991 |
| 4.45% 9/29/27 | | 69,500,000 | 69,596,799 |
| 4.91% 5/24/33 (c) | | 47,460,000 | 47,837,976 |
| 5.5% 9/13/25 | | 42,579,000 | 42,838,528 |
| 6.174% 5/25/34 (c) | | 21,587,000 | 23,033,209 |
| Citizens Financial Group, Inc.: | | | |
| 2.638% 9/30/32 | | 35,537,000 | 29,303,015 |
| 6.645% 4/25/35 (c) | | 12,127,000 | 13,314,148 |
| Commonwealth Bank of Australia: | | | |
| 3.61% 9/12/34 (b)(c) | | 12,091,000 | 11,373,108 |
| 3.784% 3/14/32 (b) | | 10,165,000 | 9,462,474 |
| Cooperatieve Rabobank UA 4.375% 8/4/25 | | 36,518,000 | 36,325,974 |
| HSBC Holdings PLC: | | | |
| 2.099% 6/4/26 (c) | | 25,000,000 | 24,524,428 |
| 2.804% 5/24/32 (c) | | 6,013,000 | 5,320,167 |
| 3.973% 5/22/30 (c) | | 9,000,000 | 8,769,437 |
| 5.25% 3/14/44 | | 2,847,000 | 2,829,373 |
| Intesa Sanpaolo SpA 5.71% 1/15/26 (b) | | 48,607,000 | 48,984,112 |
| JPMorgan Chase & Co.: | | | |
| 2.95% 10/1/26 | | 63,807,000 | 62,533,592 |
| 2.956% 5/13/31 (c) | | 18,323,000 | 16,852,557 |
| 2.963% 1/25/33 (c) | | 17,500,000 | 15,748,323 |
| 4.125% 12/15/26 | | 146,208,000 | 146,147,907 |
| 4.203% 7/23/29 (c) | | 3,000,000 | 2,988,838 |
| 4.452% 12/5/29 (c) | | 46,000,000 | 46,213,316 |
| 4.586% 4/26/33 (c) | | 70,000,000 | 70,014,827 |
| 5.299% 7/24/29 (c) | | 15,000,000 | 15,520,547 |
| 5.336% 1/23/35 (c) | | 50,000,000 | 52,262,462 |
| 5.35% 6/1/34 (c) | | 60,000,000 | 62,784,918 |
| 5.717% 9/14/33 (c) | | 75,200,000 | 79,731,804 |
| NatWest Group PLC 3.073% 5/22/28 (c) | | 20,149,000 | 19,466,749 |
| Santander Holdings U.S.A., Inc.: | | | |
| 2.49% 1/6/28 (c) | | 25,589,000 | 24,255,336 |
| 6.499% 3/9/29 (c) | | 35,670,000 | 37,352,628 |
| Societe Generale: | | | |
| 1.488% 12/14/26 (b)(c) | | 40,199,000 | 38,503,780 |
| 3.337% 1/21/33 (b)(c) | | 17,500,000 | 15,382,057 |
| Synchrony Bank: | | | |
| 5.4% 8/22/25 | | 29,530,000 | 29,592,241 |
| 5.625% 8/23/27 | | 26,739,000 | 27,217,900 |
| Wells Fargo & Co.: | | | |
| 2.406% 10/30/25 (c) | | 19,840,000 | 19,785,777 |
| 3.526% 3/24/28 (c) | | 42,125,000 | 41,327,324 |
| 4.478% 4/4/31 (c) | | 60,800,000 | 60,868,840 |
| 5.389% 4/24/34 (c) | | 30,000,000 | 31,115,846 |
| Westpac Banking Corp. 4.11% 7/24/34 (c) | | 17,722,000 | 17,138,890 |
| | | | 2,147,809,834 |
| Capital Markets - 3.3% | | | |
| Ares Capital Corp. 3.875% 1/15/26 | | 54,729,000 | 53,931,817 |
| Athene Global Funding: | | | |
| 5.339% 1/15/27 (b) | | 56,732,000 | 57,678,291 |
| 5.583% 1/9/29 (b) | | 28,541,000 | 29,556,147 |
| Blackstone Private Credit Fund: | | | |
| 2.625% 12/15/26 | | 30,000,000 | 28,366,532 |
| 4.7% 3/24/25 | | 43,143,000 | 43,035,137 |
| 7.05% 9/29/25 | | 39,080,000 | 39,813,719 |
| Deutsche Bank AG 4.5% 4/1/25 | | 67,655,000 | 67,375,527 |
| Deutsche Bank AG New York Branch: | | | |
| 3.035% 5/28/32 (c) | | 4,469,000 | 3,980,379 |
| 6.72% 1/18/29 (c) | | 22,570,000 | 23,893,414 |
| Goldman Sachs Group, Inc.: | | | |
| 2.383% 7/21/32 (c) | | 39,755,000 | 34,477,534 |
| 3.102% 2/24/33 (c) | | 47,500,000 | 42,737,300 |
| 3.691% 6/5/28 (c) | | 21,000,000 | 20,667,560 |
| 3.75% 2/25/26 | | 15,000,000 | 14,903,355 |
| 3.8% 3/15/30 | | 67,720,000 | 65,880,172 |
| 4.25% 10/21/25 | | 22,692,000 | 22,607,555 |
| 4.411% 4/23/39 (c) | | 3,000,000 | 2,828,263 |
| 5.15% 5/22/45 | | 9,000,000 | 8,997,023 |
| 6.75% 10/1/37 | | 30,816,000 | 35,484,282 |
| Intercontinental Exchange, Inc. 3.75% 12/1/25 | | 4,530,000 | 4,501,996 |
| Moody's Corp.: | | | |
| 3.25% 1/15/28 | | 10,681,000 | 10,441,141 |
| 3.25% 5/20/50 | | 9,704,000 | 7,072,338 |
| 3.75% 3/24/25 | | 21,924,000 | 21,802,650 |
| Morgan Stanley: | | | |
| 2.943% 1/21/33 (c) | | 17,500,000 | 15,631,818 |
| 3.125% 7/27/26 | | 24,646,000 | 24,206,890 |
| 3.622% 4/1/31 (c) | | 41,803,000 | 40,137,798 |
| 3.7% 10/23/24 | | 15,967,000 | 15,951,570 |
| 4.21% 4/20/28 (c) | | 40,000,000 | 39,918,699 |
| 4.431% 1/23/30 (c) | | 54,318,000 | 54,436,771 |
| 5% 11/24/25 | | 102,478,000 | 102,980,731 |
| 5.25% 4/21/34 (c) | | 50,000,000 | 51,639,451 |
| 5.424% 7/21/34 (c) | | 47,424,000 | 49,456,378 |
| 6.342% 10/18/33 (c) | | 58,000,000 | 64,498,033 |
| 6.627% 11/1/34 (c) | | 50,000,000 | 56,552,274 |
| Peachtree Corners Funding Trust 3.976% 2/15/25 (b) | | 25,500,000 | 25,369,621 |
| Sixth Street Specialty Lending, Inc. 6.125% 3/1/29 | | 20,911,000 | 21,479,590 |
| State Street Corp. 2.901% 3/30/26 (c) | | 2,660,000 | 2,632,281 |
| UBS Group AG: | | | |
| 1.494% 8/10/27 (b)(c) | | 24,731,000 | 23,370,534 |
| 3.091% 5/14/32 (b)(c) | | 13,398,000 | 12,081,690 |
| 3.75% 3/26/25 | | 24,390,000 | 24,262,768 |
| 3.869% 1/12/29 (b)(c) | | 9,005,000 | 8,810,962 |
| 4.125% 9/24/25 (b) | | 17,678,000 | 17,622,470 |
| 4.194% 4/1/31 (b)(c) | | 40,079,000 | 39,143,741 |
| 4.55% 4/17/26 | | 5,038,000 | 5,050,670 |
| 6.537% 8/12/33 (b)(c) | | 30,000,000 | 33,121,258 |
| | | | 1,368,388,130 |
| Consumer Finance - 2.3% | | | |
| AerCap Ireland Capital Ltd./AerCap Global Aviation Trust: | | | |
| 1.65% 10/29/24 | | 12,404,000 | 12,369,231 |
| 2.45% 10/29/26 | | 17,295,000 | 16,608,353 |
| 3% 10/29/28 | | 18,114,000 | 17,111,149 |
| 3.3% 1/30/32 | | 19,378,000 | 17,488,617 |
| 4.45% 4/3/26 | | 15,328,000 | 15,289,169 |
| 6.45% 4/15/27 | | 59,444,000 | 62,273,143 |
| 6.5% 7/15/25 | | 15,770,000 | 15,931,125 |
| Ally Financial, Inc.: | | | |
| 4.75% 6/9/27 | | 60,000,000 | 59,951,198 |
| 5.75% 11/20/25 | | 16,947,000 | 17,020,216 |
| 5.8% 5/1/25 | | 68,233,000 | 68,477,144 |
| 6.7% 2/14/33 | | 50,000,000 | 51,134,845 |
| 7.1% 11/15/27 | | 37,620,000 | 39,881,865 |
| 8% 11/1/31 | | 11,577,000 | 13,106,528 |
| Capital One Financial Corp.: | | | |
| 2.636% 3/3/26 (c) | | 21,697,000 | 21,456,141 |
| 3.273% 3/1/30 (c) | | 32,130,000 | 30,208,433 |
| 3.65% 5/11/27 | | 57,194,000 | 56,221,944 |
| 3.8% 1/31/28 | | 29,870,000 | 29,229,558 |
| 4.985% 7/24/26 (c) | | 31,384,000 | 31,386,121 |
| 5.247% 7/26/30 (c) | | 40,470,000 | 41,157,098 |
| 5.468% 2/1/29 (c) | | 26,778,000 | 27,449,307 |
| 5.817% 2/1/34 (c) | | 46,541,000 | 48,431,209 |
| Discover Financial Services: | | | |
| 3.95% 11/6/24 | | 41,289,000 | 41,229,023 |
| 4.1% 2/9/27 | | 5,722,000 | 5,674,292 |
| 4.5% 1/30/26 | | 23,106,000 | 23,077,276 |
| Ford Motor Credit Co. LLC 4.063% 11/1/24 | | 79,422,000 | 79,331,075 |
| Synchrony Financial: | | | |
| 3.95% 12/1/27 | | 37,530,000 | 36,438,905 |
| 5.15% 3/19/29 | | 30,433,000 | 30,363,811 |
| Toyota Motor Credit Corp.: | | | |
| 3% 4/1/25 | | 29,531,000 | 29,299,709 |
| 3.375% 4/1/30 | | 9,583,000 | 9,190,907 |
| | | | 946,787,392 |
| Financial Services - 0.9% | | | |
| Corebridge Financial, Inc.: | | | |
| 3.5% 4/4/25 | | 9,337,000 | 9,267,228 |
| 3.65% 4/5/27 | | 33,012,000 | 32,475,521 |
| 3.85% 4/5/29 | | 13,061,000 | 12,722,948 |
| 3.9% 4/5/32 | | 15,550,000 | 14,584,493 |
| 4.35% 4/5/42 | | 3,537,000 | 3,132,081 |
| 4.4% 4/5/52 | | 10,459,000 | 8,952,728 |
| Equitable Holdings, Inc. 4.572% 2/15/29 (b) | | 7,172,000 | 7,144,487 |
| Jackson Financial, Inc.: | | | |
| 3.125% 11/23/31 | | 5,636,000 | 4,923,085 |
| 5.17% 6/8/27 | | 14,655,000 | 14,878,622 |
| 5.67% 6/8/32 | | 27,163,000 | 28,212,757 |
| Jbs U.S.A. Holding Lux/ Jbs U.S.A. F: | | | |
| 2.5% 1/15/27 | | 38,495,000 | 36,829,248 |
| 3% 5/15/32 | | 43,240,000 | 37,496,872 |
| 3.625% 1/15/32 | | 18,075,000 | 16,525,060 |
| 5.125% 2/1/28 | | 15,645,000 | 15,854,721 |
| 5.5% 1/15/30 | | 5,250,000 | 5,317,746 |
| 5.75% 4/1/33 | | 23,392,000 | 24,235,983 |
| 6.75% 3/15/34 (b) | | 31,567,000 | 34,972,966 |
| MasterCard, Inc.: | | | |
| 3.3% 3/26/27 | | 3,028,000 | 2,985,516 |
| 3.35% 3/26/30 | | 4,213,000 | 4,069,489 |
| Pine Street Trust II 5.568% 2/15/49 (b) | | 29,500,000 | 29,120,527 |
| | | | 343,702,078 |
| Insurance - 1.0% | | | |
| AFLAC, Inc. 3.6% 4/1/30 | | 9,937,000 | 9,608,814 |
| AIA Group Ltd.: | | | |
| 3.2% 9/16/40 (b) | | 15,222,000 | 11,938,234 |
| 3.375% 4/7/30 (b) | | 30,867,000 | 29,345,022 |
| Five Corners Funding Trust II 2.85% 5/15/30 (b) | | 48,444,000 | 44,766,010 |
| Hartford Financial Services Group, Inc. 2.8% 8/19/29 | | 7,704,000 | 7,183,651 |
| Liberty Mutual Group, Inc.: | | | |
| 3.951% 10/15/50 (b) | | 4,626,000 | 3,619,130 |
| 4.569% 2/1/29 (b) | | 19,896,000 | 19,982,537 |
| Lincoln National Corp. 3.4% 1/15/31 | | 34,132,000 | 31,577,090 |
| Marsh & McLennan Companies, Inc.: | | | |
| 4.375% 3/15/29 | | 19,688,000 | 19,891,233 |
| 4.75% 3/15/39 | | 9,035,000 | 8,895,300 |
| Massachusetts Mutual Life Insurance Co. 3.729% 10/15/70 (b) | | 20,812,000 | 15,093,487 |
| New York Life Insurance Co. 3.75% 5/15/50 (b) | | 7,429,000 | 5,953,776 |
| Northwestern Mutual Life Insurance Co. 6.063% 3/30/40 (b) | | 2,000 | 2,195 |
| Pacific LifeCorp 5.125% 1/30/43 (b) | | 15,610,000 | 15,311,508 |
| Progressive Corp. 3.2% 3/26/30 | | 3,815,000 | 3,632,689 |
| Prudential Financial, Inc. 6% 9/1/52 (c) | | 55,017,000 | 57,009,551 |
| Swiss Re Finance Luxembourg SA 5% 4/2/49 (b)(c) | | 3,800,000 | 3,857,513 |
| Teachers Insurance & Annuity Association of America: | | | |
| 3.3% 5/15/50 (b) | | 16,941,000 | 12,393,073 |
| 4.9% 9/15/44 (b) | | 29,277,000 | 27,982,148 |
| TIAA Asset Management Finance LLC 4.125% 11/1/24 (b) | | 8,401,000 | 8,391,930 |
| Unum Group: | | | |
| 3.875% 11/5/25 | | 16,863,000 | 16,721,583 |
| 4% 6/15/29 | | 21,076,000 | 20,655,610 |
| 5.75% 8/15/42 | | 29,395,000 | 30,018,655 |
| | | | 403,830,739 |
TOTAL FINANCIALS | | | 5,210,518,173 |
| HEALTH CARE - 1.9% | | | |
| Biotechnology - 0.4% | | | |
| AbbVie, Inc. 3.2% 11/21/29 | | 17,500,000 | 16,735,286 |
| Amgen, Inc.: | | | |
| 1.65% 8/15/28 | | 65,000,000 | 59,180,040 |
| 5.15% 3/2/28 | | 20,069,000 | 20,665,263 |
| 5.25% 3/2/30 | | 18,321,000 | 19,116,308 |
| 5.25% 3/2/33 | | 20,683,000 | 21,532,562 |
| 5.6% 3/2/43 | | 19,649,000 | 20,642,995 |
| 5.65% 3/2/53 | | 9,768,000 | 10,275,241 |
| 5.75% 3/2/63 | | 17,801,000 | 18,789,456 |
| | | | 186,937,151 |
| Health Care Providers & Services - 1.2% | | | |
| Centene Corp.: | | | |
| 2.45% 7/15/28 | | 32,380,000 | 29,819,545 |
| 2.625% 8/1/31 | | 15,205,000 | 13,037,875 |
| 3.375% 2/15/30 | | 17,480,000 | 16,108,110 |
| 4.25% 12/15/27 | | 19,645,000 | 19,294,364 |
| 4.625% 12/15/29 | | 30,530,000 | 29,876,107 |
| Cigna Group: | | | |
| 3.05% 10/15/27 | | 67,800,000 | 65,749,906 |
| 4.375% 10/15/28 | | 29,050,000 | 29,162,879 |
| 4.8% 8/15/38 | | 18,087,000 | 17,622,291 |
| 4.9% 12/15/48 | | 18,071,000 | 17,018,795 |
| 5.4% 3/15/33 | | 30,000,000 | 31,474,845 |
| CVS Health Corp.: | | | |
| 3% 8/15/26 | | 2,965,000 | 2,896,800 |
| 3.625% 4/1/27 | | 7,479,000 | 7,374,808 |
| 3.875% 7/20/25 | | 20,803,000 | 20,653,574 |
| 5% 1/30/29 | | 15,279,000 | 15,600,195 |
| 5.25% 1/30/31 | | 6,265,000 | 6,450,439 |
| HCA Holdings, Inc.: | | | |
| 3.5% 9/1/30 | | 18,350,000 | 17,292,589 |
| 3.625% 3/15/32 | | 4,185,000 | 3,869,931 |
| 5.625% 9/1/28 | | 19,094,000 | 19,817,520 |
| 5.875% 2/1/29 | | 21,003,000 | 22,011,859 |
| Humana, Inc.: | | | |
| 3.7% 3/23/29 | | 12,046,000 | 11,721,196 |
| 5.375% 4/15/31 | | 25,106,000 | 26,004,391 |
| Sabra Health Care LP: | | | |
| 3.2% 12/1/31 | | 39,949,000 | 35,160,235 |
| 3.9% 10/15/29 | | 10,094,000 | 9,562,622 |
| Toledo Hospital 5.325% 11/15/28 | | 9,969,000 | 9,869,011 |
| | | | 477,449,887 |
| Pharmaceuticals - 0.3% | | | |
| Bayer U.S. Finance II LLC 4.25% 12/15/25 (b) | | 63,993,000 | 63,530,260 |
| Elanco Animal Health, Inc. 6.65% 8/28/28 (c) | | 6,362,000 | 6,585,007 |
| Mylan NV 4.55% 4/15/28 | | 6,911,000 | 6,897,420 |
| Utah Acquisition Sub, Inc. 3.95% 6/15/26 | | 7,459,000 | 7,385,293 |
| Viatris, Inc. 2.7% 6/22/30 | | 23,444,000 | 20,832,897 |
| | | | 105,230,877 |
TOTAL HEALTH CARE | | | 769,617,915 |
| INDUSTRIALS - 0.9% | | | |
| Aerospace & Defense - 0.3% | | | |
| BAE Systems PLC 3.4% 4/15/30 (b) | | 9,575,000 | 9,069,039 |
| The Boeing Co.: | | | |
| 3.55% 3/1/38 | | 3,337,000 | 2,588,909 |
| 5.15% 5/1/30 | | 6,621,000 | 6,636,906 |
| 5.805% 5/1/50 | | 34,788,000 | 33,609,334 |
| 5.93% 5/1/60 | | 12,640,000 | 12,107,447 |
| 6.259% 5/1/27 (b) | | 7,761,000 | 8,016,479 |
| 6.298% 5/1/29 (b) | | 11,086,000 | 11,663,438 |
| 6.388% 5/1/31 (b) | | 8,397,000 | 8,928,839 |
| 6.528% 5/1/34 (b) | | 8,987,000 | 9,645,434 |
| 6.858% 5/1/54 (b) | | 13,529,000 | 14,849,567 |
| 7.008% 5/1/64 (b) | | 12,768,000 | 14,067,504 |
| | | | 131,182,896 |
| Building Products - 0.0% | | | |
| Carrier Global Corp.: | | | |
| 5.9% 3/15/34 | | 3,574,000 | 3,900,692 |
| 6.2% 3/15/54 | | 2,214,000 | 2,556,427 |
| | | | 6,457,119 |
| Ground Transportation - 0.0% | | | |
| CSX Corp. 3.8% 4/15/50 | | 5,875,000 | 4,836,963 |
| Industrial Conglomerates - 0.0% | | | |
| 3M Co.: | | | |
| 2.65% 4/15/25 | | 1,885,000 | 1,864,055 |
| 3.05% 4/15/30 | | 1,519,000 | 1,440,773 |
| | | | 3,304,828 |
| Machinery - 0.2% | | | |
| Daimler Trucks Finance North America LLC: | | | |
| 1.625% 12/13/24 (b) | | 28,773,000 | 28,550,528 |
| 2% 12/14/26 (b) | | 30,000,000 | 28,563,759 |
| Deere & Co.: | | | |
| 2.75% 4/15/25 | | 3,746,000 | 3,710,431 |
| 3.1% 4/15/30 | | 9,897,000 | 9,398,169 |
| | | | 70,222,887 |
| Professional Services - 0.0% | | | |
| Leidos, Inc. 3.625% 5/15/25 | | 12,349,000 | 12,242,413 |
| Trading Companies & Distributors - 0.1% | | | |
| Air Lease Corp. 3.375% 7/1/25 | | 28,656,000 | 28,319,783 |
| Transportation Infrastructure - 0.3% | | | |
| Avolon Holdings Funding Ltd.: | | | |
| 4.375% 5/1/26 (b) | | 21,306,000 | 21,093,078 |
| 5.75% 3/1/29 (b) | | 40,000,000 | 41,233,429 |
| 6.375% 5/4/28 (b) | | 33,577,000 | 35,099,831 |
| | | | 97,426,338 |
TOTAL INDUSTRIALS | | | 353,993,227 |
| INFORMATION TECHNOLOGY - 0.8% | | | |
| Electronic Equipment, Instruments & Components - 0.2% | | | |
| Dell International LLC/EMC Corp.: | | | |
| 5.25% 2/1/28 | | 28,212,000 | 29,144,093 |
| 5.3% 10/1/29 | | 11,000,000 | 11,457,290 |
| 5.85% 7/15/25 | | 5,417,000 | 5,458,317 |
| 6.02% 6/15/26 | | 5,507,000 | 5,639,171 |
| 6.1% 7/15/27 | | 9,944,000 | 10,440,336 |
| 6.2% 7/15/30 | | 8,607,000 | 9,359,037 |
| | | | 71,498,244 |
| Semiconductors & Semiconductor Equipment - 0.4% | | | |
| Broadcom, Inc.: | | | |
| 1.95% 2/15/28 (b) | | 7,184,000 | 6,670,183 |
| 2.45% 2/15/31 (b) | | 61,131,000 | 54,172,821 |
| 2.6% 2/15/33 (b) | | 61,131,000 | 52,404,220 |
| 3.5% 2/15/41 (b) | | 49,365,000 | 40,597,658 |
| 3.75% 2/15/51 (b) | | 23,167,000 | 18,414,606 |
| | | | 172,259,488 |
| Software - 0.2% | | | |
| Oracle Corp.: | | | |
| 2.5% 4/1/25 | | 24,552,000 | 24,268,796 |
| 2.8% 4/1/27 | | 24,552,000 | 23,771,589 |
| 3.6% 4/1/40 | | 24,550,000 | 20,425,176 |
| 3.6% 4/1/50 | | 24,550,000 | 18,689,972 |
| 3.85% 4/1/60 | | 24,600,000 | 18,517,788 |
| | | | 105,673,321 |
TOTAL INFORMATION TECHNOLOGY | | | 349,431,053 |
| MATERIALS - 0.1% | | | |
| Chemicals - 0.1% | | | |
| Celanese U.S. Holdings LLC: | | | |
| 6.35% 11/15/28 | | 18,666,000 | 19,708,082 |
| 6.55% 11/15/30 | | 18,931,000 | 20,405,504 |
| 6.7% 11/15/33 | | 11,063,000 | 12,103,655 |
| The Dow Chemical Co. 4.55% 11/30/25 | | 13,459,000 | 13,452,042 |
| | | | 65,669,283 |
| REAL ESTATE - 2.8% | | | |
| Equity Real Estate Investment Trusts (REITs) - 2.4% | | | |
| Alexandria Real Estate Equities, Inc.: | | | |
| 2% 5/18/32 | | 19,486,000 | 16,124,073 |
| 4.9% 12/15/30 | | 17,745,000 | 18,110,109 |
| American Homes 4 Rent LP: | | | |
| 2.375% 7/15/31 | | 3,169,000 | 2,721,774 |
| 3.625% 4/15/32 | | 14,296,000 | 13,215,667 |
| 4.3% 4/15/52 | | 9,909,000 | 8,197,512 |
| Boston Properties, Inc.: | | | |
| 3.25% 1/30/31 | | 16,564,000 | 14,919,549 |
| 4.5% 12/1/28 | | 18,628,000 | 18,387,770 |
| 6.75% 12/1/27 | | 24,397,000 | 25,799,178 |
| Brixmor Operating Partnership LP: | | | |
| 3.85% 2/1/25 | | 450,000 | 447,443 |
| 4.05% 7/1/30 | | 22,047,000 | 21,436,025 |
| 4.125% 6/15/26 | | 26,610,000 | 26,458,847 |
| 4.125% 5/15/29 | | 24,028,000 | 23,518,420 |
| Corporate Office Properties LP: | | | |
| 2% 1/15/29 | | 2,896,000 | 2,572,777 |
| 2.25% 3/15/26 | | 7,272,000 | 7,023,775 |
| 2.75% 4/15/31 | | 7,105,000 | 6,216,765 |
| Healthcare Realty Holdings LP: | | | |
| 3.1% 2/15/30 | | 6,066,000 | 5,573,604 |
| 3.5% 8/1/26 | | 6,318,000 | 6,209,794 |
| Healthpeak OP, LLC: | | | |
| 3.25% 7/15/26 | | 2,733,000 | 2,685,973 |
| 3.4% 2/1/25 | | 912,000 | 907,129 |
| 3.5% 7/15/29 | | 3,125,000 | 2,997,608 |
| Hudson Pacific Properties LP 4.65% 4/1/29 | | 37,205,000 | 30,896,316 |
| Invitation Homes Operating Partnership LP 4.15% 4/15/32 | | 21,143,000 | 20,195,958 |
| Kite Realty Group LP 5.5% 3/1/34 | | 6,294,000 | 6,483,764 |
| Kite Realty Group Trust: | | | |
| 4% 3/15/25 | | 27,373,000 | 27,224,632 |
| 4.75% 9/15/30 | | 42,235,000 | 42,240,834 |
| LXP Industrial Trust (REIT) 2.7% 9/15/30 | | 7,890,000 | 7,017,393 |
| Omega Healthcare Investors, Inc.: | | | |
| 3.25% 4/15/33 | | 26,948,000 | 23,189,725 |
| 3.375% 2/1/31 | | 14,471,000 | 13,185,366 |
| 3.625% 10/1/29 | | 26,970,000 | 25,417,996 |
| 4.5% 1/15/25 | | 12,446,000 | 12,426,345 |
| 4.5% 4/1/27 | | 86,567,000 | 86,136,608 |
| 4.75% 1/15/28 | | 28,933,000 | 28,884,170 |
| 5.25% 1/15/26 | | 28,200,000 | 28,303,962 |
| Phillips Edison Grocery Center Operating Partnership I LP 5.75% 7/15/34 | | 6,358,000 | 6,641,138 |
| Piedmont Operating Partnership LP 2.75% 4/1/32 | | 6,300,000 | 5,109,941 |
| Prologis LP 3.25% 6/30/26 | | 2,124,000 | 2,093,626 |
| Realty Income Corp.: | | | |
| 2.2% 6/15/28 | | 3,445,000 | 3,199,536 |
| 2.85% 12/15/32 | | 4,238,000 | 3,705,416 |
| 3.25% 1/15/31 | | 4,502,000 | 4,199,849 |
| 3.4% 1/15/28 | | 7,083,000 | 6,910,634 |
| Regency Centers LP 3.7% 6/15/30 | | 25,000,000 | 24,052,366 |
| Retail Opportunity Investments Partnership LP 4% 12/15/24 | | 4,615,000 | 4,596,113 |
| Simon Property Group LP 2.65% 2/1/32 | | 30,000,000 | 26,474,590 |
| Store Capital LLC: | | | |
| 2.75% 11/18/30 | | 8,515,000 | 7,447,321 |
| 4.625% 3/15/29 | | 8,847,000 | 8,672,228 |
| Sun Communities Operating LP: | | | |
| 2.3% 11/1/28 | | 7,110,000 | 6,487,591 |
| 2.7% 7/15/31 | | 18,176,000 | 15,893,638 |
| Ventas Realty LP: | | | |
| 2.5% 9/1/31 | | 53,031,000 | 46,061,054 |
| 3% 1/15/30 | | 35,454,000 | 32,838,231 |
| 3.5% 2/1/25 | | 7,488,000 | 7,446,722 |
| 4% 3/1/28 | | 10,351,000 | 10,211,771 |
| 4.125% 1/15/26 | | 7,649,000 | 7,612,114 |
| 4.375% 2/1/45 | | 3,802,000 | 3,308,933 |
| 4.75% 11/15/30 | | 41,973,000 | 42,357,885 |
| VICI Properties LP: | | | |
| 4.375% 5/15/25 | | 3,704,000 | 3,683,518 |
| 4.75% 2/15/28 | | 29,291,000 | 29,404,122 |
| 4.95% 2/15/30 | | 38,231,000 | 38,457,289 |
| 5.125% 5/15/32 | | 10,549,000 | 10,591,871 |
| 5.75% 4/1/34 | | 5,034,000 | 5,272,138 |
| Vornado Realty LP 2.15% 6/1/26 | | 7,918,000 | 7,539,508 |
| Welltower OP LLC 4% 6/1/25 | | 4,568,000 | 4,540,817 |
| WP Carey, Inc.: | | | |
| 3.85% 7/15/29 | | 6,097,000 | 5,922,573 |
| 4% 2/1/25 | | 26,847,000 | 26,719,732 |
| | | | 982,579,126 |
| Real Estate Management & Development - 0.4% | | | |
| Brandywine Operating Partnership LP: | | | |
| 3.95% 11/15/27 | | 20,195,000 | 19,303,948 |
| 4.55% 10/1/29 | | 27,295,000 | 25,666,209 |
| 8.3% 3/15/28 | | 33,242,000 | 35,841,491 |
| CBRE Group, Inc.: | | | |
| 2.5% 4/1/31 | | 23,518,000 | 20,537,675 |
| 4.875% 3/1/26 | | 19,900,000 | 19,991,834 |
| Mid-America Apartments LP 4% 11/15/25 | | 3,541,000 | 3,522,376 |
| Tanger Properties LP: | | | |
| 2.75% 9/1/31 | | 18,732,000 | 16,130,822 |
| 3.125% 9/1/26 | | 16,602,000 | 16,102,321 |
| 3.875% 7/15/27 | | 28,881,000 | 28,245,754 |
| | | | 185,342,430 |
TOTAL REAL ESTATE | | | 1,167,921,556 |
| UTILITIES - 1.4% | | | |
| Electric Utilities - 0.6% | | | |
| Alabama Power Co. 3.05% 3/15/32 | | 29,471,000 | 26,855,112 |
| Cleco Corporate Holdings LLC: | | | |
| 3.375% 9/15/29 | | 15,724,000 | 14,421,653 |
| 3.743% 5/1/26 | | 60,730,000 | 59,774,577 |
| Cleveland Electric Illuminating Co. 5.95% 12/15/36 | | 1,128,000 | 1,208,719 |
| Consolidated Edison Co. of New York, Inc. 3.35% 4/1/30 | | 3,290,000 | 3,164,868 |
| Duquesne Light Holdings, Inc.: | | | |
| 2.532% 10/1/30 (b) | | 10,574,000 | 9,315,434 |
| 2.775% 1/7/32 (b) | | 19,219,000 | 16,601,857 |
| Exelon Corp.: | | | |
| 2.75% 3/15/27 | | 6,523,000 | 6,312,334 |
| 3.35% 3/15/32 | | 7,920,000 | 7,349,152 |
| 4.05% 4/15/30 | | 7,291,000 | 7,179,597 |
| 4.1% 3/15/52 | | 5,867,000 | 4,844,760 |
| 4.7% 4/15/50 | | 3,246,000 | 2,977,658 |
| IPALCO Enterprises, Inc. 5.75% 4/1/34 | | 43,698,000 | 45,774,984 |
| Southern Co. 5.7% 3/15/34 | | 27,735,000 | 29,768,438 |
| | | | 235,549,143 |
| Gas Utilities - 0.0% | | | |
| Nakilat, Inc. 6.067% 12/31/33 (b) | | 5,821,725 | 6,217,194 |
| Independent Power and Renewable Electricity Producers - 0.3% | | | |
| Emera U.S. Finance LP 3.55% 6/15/26 | | 6,732,000 | 6,603,017 |
| The AES Corp.: | | | |
| 1.375% 1/15/26 | | 30,500,000 | 29,268,778 |
| 2.45% 1/15/31 | | 28,885,000 | 25,016,094 |
| 3.3% 7/15/25 (b) | | 37,234,000 | 36,691,620 |
| 3.95% 7/15/30 (b) | | 42,717,000 | 40,737,708 |
| | | | 138,317,217 |
| Multi-Utilities - 0.5% | | | |
| Berkshire Hathaway Energy Co.: | | | |
| 3.7% 7/15/30 | | 4,149,000 | 4,058,211 |
| 4.05% 4/15/25 | | 53,700,000 | 53,560,811 |
| NiSource, Inc.: | | | |
| 2.95% 9/1/29 | | 40,740,000 | 38,171,024 |
| 3.6% 5/1/30 | | 22,835,000 | 21,926,421 |
| Puget Energy, Inc.: | | | |
| 4.1% 6/15/30 | | 25,767,000 | 24,823,020 |
| 4.224% 3/15/32 | | 27,319,000 | 25,688,312 |
| Sempra 6% 10/15/39 | | 5,386,000 | 5,742,310 |
| WEC Energy Group, Inc. CME Term SOFR 3 Month Index + 2.110% 7.4922% 5/15/67 (c)(d) | | 12,629,000 | 12,227,413 |
| | | | 186,197,522 |
TOTAL UTILITIES | | | 566,281,076 |
| TOTAL NONCONVERTIBLE BONDS (Cost $11,773,359,273) | | | 11,342,244,987 |
| | | | |
| U.S. Treasury Obligations - 43.0% |
| | | Principal Amount (a) | Value ($) |
| U.S. Treasury Bonds: | | | |
| 1.75% 8/15/41 | | 896,321,000 | 635,512,599 |
| 1.875% 11/15/51 | | 120,053,000 | 74,789,267 |
| 2% 8/15/51 | | 733,544,000 | 472,505,487 |
| 2.375% 2/15/42 | | 95,700,000 | 74,513,331 |
| 2.875% 5/15/52 | | 556,400,000 | 435,752,483 |
| 3% 2/15/49 | | 271,460,000 | 219,765,956 |
| 3.375% 8/15/42 | | 485,600,000 | 438,235,032 |
| 3.625% 2/15/53 | | 193,384,000 | 175,843,468 |
| 3.625% 5/15/53 | | 192,000,000 | 174,727,500 |
| 4.125% 8/15/53 | | 522,303,000 | 520,119,935 |
| 4.25% 2/15/54 | | 1,223,485,000 | 1,246,807,683 |
| 4.625% 5/15/54 | | 192,000,000 | 208,260,000 |
| U.S. Treasury Notes: | | | |
| 1.5% 11/30/28 | | 800,000,000 | 735,968,752 |
| 2.375% 3/31/29 | | 504,000,000 | 478,859,064 |
| 2.625% 7/31/29 | | 273,317,000 | 261,754,409 |
| 2.75% 8/15/32 | | 913,762,000 | 853,867,752 |
| 2.875% 5/15/32 | | 763,588,000 | 721,769,630 |
| 3.375% 5/15/33 | | 465,000,000 | 452,085,350 |
| 3.5% 4/30/30 | | 528,900,000 | 525,945,596 |
| 3.5% 2/15/33 | | 470,900,000 | 462,696,037 |
| 3.625% 8/31/29 | | 670,000,000 | 671,989,063 |
| 3.75% 5/31/30 | | 514,100,000 | 517,493,862 |
| 3.75% 6/30/30 | | 543,000,000 | 546,563,438 |
| 3.75% 8/31/31 | | 660,000,000 | 663,506,250 |
| 3.875% 11/30/29 | | 255,000,000 | 258,336,915 |
| 3.875% 8/15/33 | | 477,166,000 | 481,005,698 |
| 4% 1/31/29 | | 1,009,000,000 | 1,026,026,875 |
| 4% 7/31/30 | | 1,606,800,000 | 1,638,245,556 |
| 4% 2/15/34 | | 270,800,000 | 275,454,375 |
| 4.125% 7/31/31 | | 75,000,000 | 77,110,148 |
| 4.125% 11/15/32 | | 1,523,000,000 | 1,566,607,770 |
| 4.375% 5/15/34 | | 259,000,000 | 271,262,031 |
| 4.5% 11/15/33 | | 355,600,000 | 375,533,048 |
| 4.625% 5/31/31 | | 73,600,000 | 77,774,500 |
| TOTAL U.S. TREASURY OBLIGATIONS (Cost $18,327,911,693) | | | 17,616,688,860 |
| | | | |
| U.S. Government Agency - Mortgage Securities - 25.2% |
| | | Principal Amount (a) | Value ($) |
| Fannie Mae - 5.7% | | | |
| Refinitiv USD IBOR Consumer Cash Fallbacks Term 1Y + 1.390% 6.321% 5/1/33 (c)(d) | | 1,222 | 1,243 |
| Refinitiv USD IBOR Consumer Cash Fallbacks Term 1Y + 1.440% 5.945% 4/1/37 (c)(d) | | 15,435 | 15,835 |
| Refinitiv USD IBOR Consumer Cash Fallbacks Term 1Y + 1.460% 6.085% 1/1/35 (c)(d) | | 4,477 | 4,591 |
| Refinitiv USD IBOR Consumer Cash Fallbacks Term 1Y + 1.480% 7.48% 7/1/34 (c)(d) | | 2,005 | 2,060 |
| Refinitiv USD IBOR Consumer Cash Fallbacks Term 1Y + 1.550% 7.428% 6/1/36 (c)(d) | | 29,373 | 30,217 |
| Refinitiv USD IBOR Consumer Cash Fallbacks Term 1Y + 1.560% 6.065% 3/1/37 (c)(d) | | 16,595 | 17,058 |
| Refinitiv USD IBOR Consumer Cash Fallbacks Term 1Y + 1.630% 5.815% 9/1/36 (c)(d) | | 3,663 | 3,769 |
| Refinitiv USD IBOR Consumer Cash Fallbacks Term 1Y + 1.630% 7.099% 7/1/35 (c)(d) | | 49,402 | 50,822 |
| Refinitiv USD IBOR Consumer Cash Fallbacks Term 1Y + 1.640% 6.836% 11/1/36 (c)(d) | | 85,585 | 88,045 |
| Refinitiv USD IBOR Consumer Cash Fallbacks Term 1Y + 1.640% 7.389% 5/1/35 (c)(d) | | 28,168 | 28,977 |
| Refinitiv USD IBOR Consumer Cash Fallbacks Term 1Y + 1.640% 7.394% 5/1/36 (c)(d) | | 46,771 | 48,116 |
| Refinitiv USD IBOR Consumer Cash Fallbacks Term 1Y + 1.650% 6.414% 3/1/33 (c)(d) | | 11,332 | 11,614 |
| Refinitiv USD IBOR Consumer Cash Fallbacks Term 1Y + 1.680% 7.062% 5/1/36 (c)(d) | | 11,470 | 11,799 |
| Refinitiv USD IBOR Consumer Cash Fallbacks Term 1Y + 1.690% 6.409% 7/1/43 (c)(d) | | 228,867 | 235,447 |
| Refinitiv USD IBOR Consumer Cash Fallbacks Term 1Y + 1.700% 7.172% 6/1/42 (c)(d) | | 23,948 | 24,636 |
| Refinitiv USD IBOR Consumer Cash Fallbacks Term 1Y + 1.710% 6.736% 3/1/36 (c)(d) | | 50,957 | 52,422 |
| Refinitiv USD IBOR Consumer Cash Fallbacks Term 1Y + 1.730% 6.028% 3/1/40 (c)(d) | | 30,406 | 31,281 |
| Refinitiv USD IBOR Consumer Cash Fallbacks Term 1Y + 1.750% 6.437% 7/1/35 (c)(d) | | 16,527 | 17,002 |
| Refinitiv USD IBOR Consumer Cash Fallbacks Term 1Y + 1.750% 7.5% 8/1/41 (c)(d) | | 50,106 | 51,547 |
| Refinitiv USD IBOR Consumer Cash Fallbacks Term 1Y + 1.800% 6.05% 1/1/42 (c)(d) | | 64,458 | 66,311 |
| Refinitiv USD IBOR Consumer Cash Fallbacks Term 1Y + 1.800% 6.667% 12/1/40 (c)(d) | | 863,930 | 888,768 |
| Refinitiv USD IBOR Consumer Cash Fallbacks Term 1Y + 1.800% 7.635% 7/1/41 (c)(d) | | 7,320 | 7,530 |
| Refinitiv USD IBOR Consumer Cash Fallbacks Term 1Y + 1.810% 6.06% 12/1/39 (c)(d) | | 10,314 | 10,611 |
| Refinitiv USD IBOR Consumer Cash Fallbacks Term 1Y + 1.810% 6.068% 9/1/41 (c)(d) | | 10,701 | 11,009 |
| Refinitiv USD IBOR Consumer Cash Fallbacks Term 1Y + 1.810% 6.297% 2/1/42 (c)(d) | | 28,614 | 29,436 |
| Refinitiv USD IBOR Consumer Cash Fallbacks Term 1Y + 1.810% 7.639% 7/1/41 (c)(d) | | 14,171 | 14,579 |
| Refinitiv USD IBOR Consumer Cash Fallbacks Term 1Y + 1.820% 6.297% 2/1/35 (c)(d) | | 41,903 | 43,108 |
| Refinitiv USD IBOR Consumer Cash Fallbacks Term 1Y + 1.830% 6.08% 10/1/41 (c)(d) | | 9,290 | 9,468 |
| Refinitiv USD IBOR Consumer Cash Fallbacks Term 1Y + 1.950% 7.703% 7/1/37 (c)(d) | | 71,085 | 73,129 |
| Refinitiv USD IBOR Consumer Cash Fallbacks Term 6M + 1.310% 6.438% 5/1/34 (c)(d) | | 26,875 | 27,145 |
| Refinitiv USD IBOR Consumer Cash Fallbacks Term 6M + 1.420% 6.572% 9/1/33 (c)(d) | | 68,985 | 69,648 |
| Refinitiv USD IBOR Consumer Cash Fallbacks Term 6M + 1.500% 6.755% 1/1/35 (c)(d) | | 24,145 | 24,515 |
| Refinitiv USD IBOR Consumer Cash Fallbacks Term 6M + 1.510% 7.26% 2/1/33 (c)(d) | | 174 | 176 |
| Refinitiv USD IBOR Consumer Cash Fallbacks Term 6M + 1.530% 6.785% 12/1/34 (c)(d) | | 12,256 | 12,454 |
| Refinitiv USD IBOR Consumer Cash Fallbacks Term 6M + 1.530% 6.785% 3/1/35 (c)(d) | | 10,269 | 10,439 |
| Refinitiv USD IBOR Consumer Cash Fallbacks Term 6M + 1.550% 7.195% 10/1/33 (c)(d) | | 1,952 | 1,984 |
| Refinitiv USD IBOR Consumer Cash Fallbacks Term 6M + 1.560% 7.315% 7/1/35 (c)(d) | | 2,797 | 2,847 |
| Refinitiv USD IBOR Consumer Cash Fallbacks Term 6M + 1.960% 6.757% 9/1/35 (c)(d) | | 4,241 | 4,360 |
| Refinitiv USD IBOR Consumer Cash Fallbacks Term 6M + 2.500% 7.75% 3/1/36 (c)(d) | | 43,137 | 44,377 |
| U.S. TREASURY 1 YEAR INDEX + 2.200% 6.583% 3/1/35 (c)(d) | | 14,435 | 14,678 |
| U.S. TREASURY 1 YEAR INDEX + 2.220% 6.392% 8/1/36 (c)(d) | | 82,654 | 84,117 |
| U.S. TREASURY 1 YEAR INDEX + 2.270% 6.395% 6/1/36 (c)(d) | | 22,455 | 22,924 |
| U.S. TREASURY 1 YEAR INDEX + 2.280% 6.445% 10/1/33 (c)(d) | | 23,381 | 23,864 |
| U.S. TREASURY 1 YEAR INDEX + 2.460% 6.852% 5/1/35 (c)(d) | | 10,184 | 10,393 |
| U.S. TREASURY 1 YEAR INDEX + 2.460% 7.192% 7/1/34 (c)(d) | | 22,539 | 23,029 |
| 1.5% 9/1/35 to 9/1/51 | | 192,476,071 | 165,164,605 |
| 2% 2/1/28 to 3/1/52 (e) | | 424,514,919 | 370,275,476 |
| 2.5% 9/1/29 to 1/1/52 | | 530,787,621 | 471,623,052 |
| 3% 12/1/28 to 3/1/52 (f)(g) | | 351,762,272 | 324,720,291 |
| 3.25% 12/1/41 | | 16,038 | 15,226 |
| 3.4% 7/1/42 to 9/1/42 | | 332,694 | 314,971 |
| 3.5% 10/1/33 to 8/1/52 | | 197,254,499 | 187,965,135 |
| 3.65% 5/1/42 to 8/1/42 | | 74,307 | 71,704 |
| 3.9% 4/1/42 | | 26,773 | 26,207 |
| 4% 3/1/36 to 4/1/52 | | 151,096,065 | 147,938,766 |
| 4.25% 11/1/41 | | 50,617 | 50,214 |
| 4.5% to 4.5% 6/1/25 to 12/1/52 | | 110,864,373 | 110,926,595 |
| 5% 9/1/25 to 12/1/52 | | 81,021,872 | 82,004,443 |
| 5.288% 8/1/41 (c) | | 573,847 | 583,465 |
| 5.5% 5/1/48 to 9/1/54 | | 145,087,536 | 147,877,772 |
| 6% to 6% 9/1/29 to 9/1/54 | | 219,435,298 | 225,527,999 |
| 6.5% 7/1/32 to 7/1/54 | | 107,460,575 | 112,270,427 |
| 6.729% 2/1/39 (c) | | 237,012 | 246,307 |
| 7% to 7% 8/1/25 to 7/1/37 | | 254,227 | 264,774 |
| 7.5% to 7.5% 7/1/25 to 11/1/31 | | 178,498 | 184,360 |
| 8% 3/1/37 | | 8,432 | 9,056 |
TOTAL FANNIE MAE | | | 2,350,318,225 |
| Freddie Mac - 4.4% | | | |
| Refinitiv USD IBOR Consumer Cash Fallbacks Term 1Y + 1.320% 5.575% 1/1/36 (c)(d) | | 11,476 | 11,671 |
| Refinitiv USD IBOR Consumer Cash Fallbacks Term 1Y + 1.370% 5.861% 3/1/36 (c)(d) | | 46,760 | 47,751 |
| Refinitiv USD IBOR Consumer Cash Fallbacks Term 1Y + 1.500% 5.824% 3/1/36 (c)(d) | | 35,722 | 36,539 |
| Refinitiv USD IBOR Consumer Cash Fallbacks Term 1Y + 1.750% 6% 12/1/40 (c)(d) | | 331,436 | 340,965 |
| Refinitiv USD IBOR Consumer Cash Fallbacks Term 1Y + 1.750% 6.726% 9/1/41 (c)(d) | | 129,103 | 132,814 |
| Refinitiv USD IBOR Consumer Cash Fallbacks Term 1Y + 1.750% 7.568% 7/1/41 (c)(d) | | 82,508 | 84,880 |
| Refinitiv USD IBOR Consumer Cash Fallbacks Term 1Y + 1.800% 7.381% 5/1/35 (c)(d) | | 72,071 | 74,143 |
| Refinitiv USD IBOR Consumer Cash Fallbacks Term 1Y + 1.860% 7.239% 4/1/36 (c)(d) | | 24,537 | 25,242 |
| Refinitiv USD IBOR Consumer Cash Fallbacks Term 1Y + 1.880% 7.255% 4/1/41 (c)(d) | | 3,504 | 3,605 |
| Refinitiv USD IBOR Consumer Cash Fallbacks Term 1Y + 1.880% 7.455% 9/1/41 (c)(d) | | 14,852 | 15,279 |
| Refinitiv USD IBOR Consumer Cash Fallbacks Term 1Y + 1.910% 7.155% 5/1/41 (c)(d) | | 27,817 | 28,617 |
| Refinitiv USD IBOR Consumer Cash Fallbacks Term 1Y + 1.910% 7.54% 5/1/41 (c)(d) | | 27,713 | 28,510 |
| Refinitiv USD IBOR Consumer Cash Fallbacks Term 1Y + 1.910% 7.628% 6/1/41 (c)(d) | | 26,852 | 27,624 |
| Refinitiv USD IBOR Consumer Cash Fallbacks Term 1Y + 1.910% 7.785% 6/1/41 (c)(d) | | 7,714 | 7,936 |
| Refinitiv USD IBOR Consumer Cash Fallbacks Term 1Y + 1.920% 7.154% 10/1/42 (c)(d) | | 47,287 | 48,647 |
| Refinitiv USD IBOR Consumer Cash Fallbacks Term 1Y + 2.020% 6.936% 4/1/38 (c)(d) | | 20,487 | 21,076 |
| Refinitiv USD IBOR Consumer Cash Fallbacks Term 1Y + 2.030% 7.658% 3/1/33 (c)(d) | | 396 | 408 |
| Refinitiv USD IBOR Consumer Cash Fallbacks Term 1Y + 2.040% 7.91% 7/1/36 (c)(d) | | 24,539 | 25,245 |
| Refinitiv USD IBOR Consumer Cash Fallbacks Term 1Y + 2.200% 6.45% 12/1/36 (c)(d) | | 29,321 | 30,164 |
| Refinitiv USD IBOR Consumer Cash Fallbacks Term 6M + 1.120% 6.424% 8/1/37 (c)(d) | | 22,363 | 22,470 |
| Refinitiv USD IBOR Consumer Cash Fallbacks Term 6M + 1.650% 7.3% 4/1/35 (c)(d) | | 47,696 | 48,401 |
| Refinitiv USD IBOR Consumer Cash Fallbacks Term 6M + 1.860% 6.831% 10/1/36 (c)(d) | | 42,377 | 43,259 |
| Refinitiv USD IBOR Consumer Cash Fallbacks Term 6M + 1.990% 7% 10/1/35 (c)(d) | | 28,553 | 29,144 |
| Refinitiv USD IBOR Consumer Cash Fallbacks Term 6M + 2.020% 7.635% 6/1/37 (c)(d) | | 13,029 | 13,358 |
| Refinitiv USD IBOR Consumer Cash Fallbacks Term 6M + 3.040% 8.669% 10/1/35 (c)(d) | | 9,525 | 9,799 |
| U.S. TREASURY 1 YEAR INDEX + 2.030% 6.783% 6/1/33 (c)(d) | | 38,611 | 39,046 |
| U.S. TREASURY 1 YEAR INDEX + 2.240% 6.371% 1/1/35 (c)(d) | | 2,171 | 2,209 |
| U.S. TREASURY 1 YEAR INDEX + 2.260% 7.128% 6/1/33 (c)(d) | | 73,462 | 74,552 |
| U.S. TREASURY 1 YEAR INDEX + 2.460% 7.168% 3/1/35 (c)(d) | | 128,149 | 130,621 |
| 1.5% 7/1/35 to 6/1/51 | | 157,561,531 | 136,047,053 |
| 2% 6/1/35 to 4/1/52 | | 517,906,930 | 447,053,096 |
| 2.5% 10/1/29 to 12/1/51 (h) | | 354,471,515 | 315,817,976 |
| 3% 12/1/30 to 6/1/52 | | 210,861,679 | 194,096,832 |
| 3.5% 12/1/29 to 4/1/52 | | 258,655,376 | 246,276,612 |
| 4% 1/1/36 to 10/1/52 (g) | | 130,774,880 | 127,881,319 |
| 4% 4/1/48 | | 27,335 | 26,672 |
| 4.5% 6/1/25 to 4/1/53 | | 73,984,477 | 73,688,401 |
| 5% 8/1/33 to 8/1/53 | | 107,860,606 | 109,022,404 |
| 5.5% 3/1/53 to 2/1/54 (e) | | 69,116,536 | 70,960,796 |
| 6% 7/1/28 to 7/1/53 | | 32,391,622 | 33,552,481 |
| 6.5% 1/1/32 to 1/1/54 | | 33,008,782 | 34,571,908 |
| 7% 3/1/26 to 9/1/36 | | 201,680 | 210,718 |
| 7.5% 7/1/26 to 6/1/32 | | 46,459 | 48,421 |
| 8% 7/1/25 to 4/1/32 | | 8,056 | 8,326 |
| 8.5% 4/1/25 to 1/1/28 | | 2,501 | 2,567 |
TOTAL FREDDIE MAC | | | 1,790,669,557 |
| Ginnie Mae - 7.7% | | | |
| 3% 2/20/31 to 5/20/50 | | 28,627,674 | 26,969,678 |
| 3.5% 9/20/40 to 2/20/50 | | 42,593,571 | 40,771,079 |
| 4% 7/15/39 to 5/20/49 | | 47,075,697 | 46,187,085 |
| 4.5% 6/20/33 to 8/15/41 | | 22,812,901 | 22,915,560 |
| 5.5% 7/15/33 to 9/15/39 | | 823,180 | 850,238 |
| 6% to 6% 10/15/30 to 5/15/40 | | 721,275 | 751,499 |
| 7% to 7% 8/15/25 to 11/15/32 | | 612,186 | 631,495 |
| 7.5% to 7.5% 8/15/25 to 9/15/31 | | 54,583 | 55,796 |
| 8% 11/15/24 to 11/15/29 | | 5,937 | 6,092 |
| 8.5% 11/15/27 to 11/15/31 | | 15,445 | 16,320 |
| Ginnie Mae: | | | |
| 2% 10/1/54 (i) | | 56,900,000 | 48,230,249 |
| 2% 10/1/54 (i) | | 94,800,000 | 80,355,495 |
| 2% 10/1/54 (i) | | 76,050,000 | 64,462,398 |
| 2% 10/1/54 (i) | | 76,700,000 | 65,013,359 |
| 2% 10/1/54 (i) | | 38,400,000 | 32,549,061 |
| 2% 10/1/54 (i) | | 38,900,000 | 32,972,877 |
| 2% 10/1/54 (i) | | 25,225,000 | 21,381,512 |
| 2% 10/1/54 (i) | | 80,800,000 | 68,488,649 |
| 2% 10/1/54 (i) | | 159,700,000 | 135,366,798 |
| 2% 10/1/54 (i) | | 15,025,000 | 12,735,668 |
| 2% 11/1/54 (i) | | 312,800,000 | 265,456,907 |
| 3% 10/1/54 (i) | | 34,750,000 | 31,691,030 |
| 3% 10/1/54 (i) | | 67,250,000 | 61,330,124 |
| 3% 10/1/54 (i) | | 94,475,000 | 86,158,564 |
| 3% 10/1/54 (i) | | 70,250,000 | 64,066,040 |
| 3% 10/1/54 (i) | | 38,025,000 | 34,677,739 |
| 3% 11/1/54 (i) | | 139,550,000 | 127,385,622 |
| 3.5% 10/1/54 (i) | | 126,900,000 | 119,283,754 |
| 3.5% 10/1/54 (i) | | 48,600,000 | 45,683,140 |
| 3.5% 10/1/54 (i) | | 30,000,000 | 28,199,469 |
| 5% 10/1/54 (i) | | 37,200,000 | 37,268,601 |
| 5% 10/1/54 (i) | | 45,700,000 | 45,784,275 |
| 5% 11/1/54 (i) | | 35,600,000 | 35,636,447 |
| 5.5% 10/1/54 (i) | | 109,175,000 | 110,232,425 |
| 5.5% 10/1/54 (i) | | 49,200,000 | 49,676,532 |
| 5.5% 10/1/54 (i) | | 48,325,000 | 48,793,057 |
| 5.5% 11/1/54 (i) | | 72,150,000 | 72,831,911 |
| 6% 10/1/54 (i) | | 157,650,000 | 160,296,471 |
| 6% 10/1/54 (i) | | 110,300,000 | 112,151,606 |
| 6% 10/1/54 (i) | | 78,800,000 | 80,122,816 |
| 6% 10/1/54 (i) | | 31,050,000 | 31,571,236 |
| 6% 11/1/54 (i) | | 139,050,000 | 141,313,623 |
| 6.5% 10/1/54 (i) | | 33,400,000 | 34,169,255 |
| 6.5% 10/1/54 (i) | | 39,700,000 | 40,614,355 |
| 2% 8/20/50 to 11/20/52 | | 2,390,053 | 2,028,204 |
| 2.5% 8/20/51 to 12/20/52 | | 153,621,567 | 133,722,365 |
| 2.5% 10/1/54 (i) | | 101,125,000 | 89,074,510 |
| 2.5% 10/1/54 (i) | | 78,300,000 | 68,969,435 |
| 2.5% 10/1/54 (i) | | 40,900,000 | 36,026,180 |
| 2.5% 11/1/54 (i) | | 167,250,000 | 147,470,028 |
| 4% 10/1/54 (i) | | 70,200,000 | 67,873,656 |
| 4.5% 10/1/54 (i) | | 24,250,000 | 23,941,157 |
| 4.5% 10/1/54 (i) | | 11,900,000 | 11,748,444 |
| 4.5% 10/1/54 (i) | | 3,100,000 | 3,060,519 |
| 5% 12/15/32 to 4/20/48 | | 9,512,186 | 9,737,859 |
| 6.5% 3/20/31 to 6/15/37 | | 107,030 | 111,665 |
TOTAL GINNIE MAE | | | 3,158,869,929 |
| Uniform Mortgage Backed Securities - 7.4% | | | |
| 1.5% 10/1/54 (i) | | 186,700,000 | 147,496,473 |
| 4% 10/1/54 (i) | | 57,500,000 | 55,220,217 |
| 4.5% 11/1/54 (i) | | 18,300,000 | 17,991,188 |
| 5% 10/1/39 (i) | | 61,300,000 | 62,068,647 |
| Uniform Mortgage Backed Securities: | | | |
| 2% 10/1/39 (i) | | 5,900,000 | 5,398,731 |
| 2% 10/1/39 (i) | | 4,800,000 | 4,392,188 |
| 2% 10/1/54 (i) | | 307,400,000 | 254,181,375 |
| 2% 10/1/54 (i) | | 223,525,000 | 184,827,234 |
| 2% 10/1/54 (i) | | 234,850,000 | 194,191,594 |
| 2% 10/1/54 (i) | | 51,950,000 | 42,956,156 |
| 2% 10/1/54 (i) | | 61,650,000 | 50,976,844 |
| 2% 10/1/54 (i) | | 61,550,000 | 50,894,156 |
| 2% 10/1/54 (i) | | 35,000,000 | 28,940,625 |
| 2% 10/1/54 (i) | | 122,900,000 | 101,622,938 |
| 2% 10/1/54 (i) | | 8,900,000 | 7,359,188 |
| 2% 10/1/54 (i) | | 6,125,000 | 5,064,609 |
| 2% 10/1/54 (i) | | 19,675,000 | 16,268,766 |
| 2% 10/1/54 (i) | | 36,675,000 | 30,325,641 |
| 2% 11/1/54 (i) | | 210,850,000 | 174,593,689 |
| 2% 11/1/54 (i) | | 159,150,000 | 131,783,664 |
| 2.5% 10/1/54 (i) | | 78,600,000 | 67,826,274 |
| 2.5% 10/1/54 (i) | | 3,400,000 | 2,933,961 |
| 2.5% 10/1/54 (i) | | 3,450,000 | 2,977,107 |
| 2.5% 10/1/54 (i) | | 2,100,000 | 1,812,152 |
| 2.5% 10/1/54 (i) | | 30,875,000 | 26,642,954 |
| 2.5% 10/1/54 (i) | | 16,200,000 | 13,979,461 |
| 2.5% 10/1/54 (i) | | 6,200,000 | 5,350,164 |
| 3% 10/1/54 (i) | | 6,300,000 | 5,654,250 |
| 3% 10/1/54 (i) | | 80,350,000 | 72,114,125 |
| 3% 10/1/54 (i) | | 36,000,000 | 32,310,000 |
| 3% 10/1/54 (i) | | 37,625,000 | 33,768,438 |
| 3.5% 10/1/54 (i) | | 52,800,000 | 49,184,436 |
| 3.5% 10/1/54 (i) | | 38,900,000 | 36,236,260 |
| 3.5% 10/1/54 (i) | | 79,700,000 | 74,242,415 |
| 3.5% 10/1/54 (i) | | 34,600,000 | 32,230,710 |
| 4.5% 10/1/54 (i) | | 18,300,000 | 17,990,472 |
| 4.5% 10/1/54 (i) | | 30,000,000 | 29,492,577 |
| 4.5% 10/1/54 (i) | | 4,500,000 | 4,423,887 |
| 4.5% 10/1/54 (i) | | 13,275,000 | 13,050,465 |
| 4.5% 10/1/54 (i) | | 5,100,000 | 5,013,738 |
| 5.5% 10/1/54 (i) | | 89,800,000 | 90,848,837 |
| 5.5% 10/1/54 (i) | | 62,700,000 | 63,432,317 |
| 5.5% 10/1/54 (i) | | 24,275,000 | 24,558,525 |
| 5.5% 10/1/54 (i) | | 500,000 | 505,840 |
| 6% 10/1/54 (i) | | 26,700,000 | 27,285,106 |
| 6% 10/1/54 (i) | | 109,350,000 | 111,746,307 |
| 6% 10/1/54 (i) | | 63,550,000 | 64,942,641 |
| 6% 10/1/54 (i) | | 69,825,000 | 71,355,152 |
| 6% 10/1/54 (i) | | 84,225,000 | 86,070,715 |
| 6% 10/1/54 (i) | | 59,400,000 | 60,701,698 |
| 6% 10/1/54 (i) | | 45,300,000 | 46,292,709 |
| 6% 10/1/54 (i) | | 40,250,000 | 41,132,043 |
| 6% 10/1/54 (i) | | 101,600,000 | 103,826,473 |
| 6% 11/1/54 (i) | | 109,700,000 | 112,138,247 |
| 6.5% 10/1/54 (i) | | 34,400,000 | 35,465,595 |
TOTAL UNIFORM MORTGAGE BACKED SECURITIES | | | 3,034,089,974 |
| TOTAL U.S. GOVERNMENT AGENCY - MORTGAGE SECURITIES (Cost $10,551,391,689) | | | 10,333,947,685 |
| | | | |
| Asset-Backed Securities - 8.8% |
| | | Principal Amount (a) | Value ($) |
| Aaset 2024-1 U.S. Ltd. / Aaset 20 Series 2024-1A: | | | |
| Class A1, 6.261% 5/16/49 (b) | | 22,043,504 | 22,879,693 |
| Class A2, 6.261% 5/16/49 (b) | | 20,147,458 | 20,911,723 |
| AASET Trust: | | | |
| Series 2018-1A Class A, 3.844% 1/16/38 (b) | | 9,396,343 | 6,737,125 |
| Series 2019-1 Class A, 3.844% 5/15/39 (b) | | 1,199,830 | 1,158,111 |
| Series 2019-2: | | | |
Class A, 3.376% 10/16/39 (b) | | 15,235,576 | 14,635,295 |
Class B, 4.458% 10/16/39 (b) | | 4,664,187 | 2,798,856 |
| Series 2021-1A Class A, 2.95% 11/16/41 (b) | | 18,710,417 | 17,408,973 |
| Series 2021-2A Class A, 2.798% 1/15/47 (b) | | 37,291,263 | 34,122,915 |
| AASET, Ltd. Series 2022-1A Class A, 6% 5/16/47 (b) | | 26,215,103 | 26,444,669 |
| Affirm Asset Securitization Trust: | | | |
| Series 2023-X1 Class A, 7.11% 11/15/28 (b) | | 2,830,411 | 2,841,759 |
| Series 2024-A Class 1A, 5.61% 2/15/29 (b) | | 20,700,000 | 20,969,228 |
| Series 2024-X1 Class A, 6.27% 5/15/29 (b) | | 9,791,724 | 9,832,987 |
| Aimco Series 2024-BA Class ARR, CME Term SOFR 3 Month Index + 1.500% 6.7861% 4/16/37 (b)(c)(d) | | 35,255,000 | 35,436,387 |
| Aimco Clo 17 Ltd. / Aimco Clo 1 Series 2024-17A Class A1R, CME Term SOFR 3 Month Index + 1.350% 6.632% 7/20/37 (b)(c)(d) | | 28,099,438 | 28,181,179 |
| Aimco Clo 19 Ltd. Series 2024-19A Class A, CME Term SOFR 3 Month Index + 1.350% 1.35% 10/20/37 (b)(c)(d)(i) | | 10,259,000 | 10,259,000 |
| Aimco Clo 21 Ltd. / Aimco Clo 2 Series 2024-21A Class A1, CME Term SOFR 3 Month Index + 1.500% 6.8251% 4/18/37 (b)(c)(d) | | 24,647,000 | 24,785,935 |
| Aimco Clo 22 Ltd. / Aimco Clo 2 Series 2024-22A Class A, CME Term SOFR 3 Month Index + 1.500% 6.8266% 4/19/37 (b)(c)(d) | | 55,620,000 | 55,775,736 |
| AIMCO CLO Ltd. Series 2024-11A Class A1R2, CME Term SOFR 3 Month Index + 1.340% 6.5839% 7/17/37 (b)(c)(d) | | 18,929,000 | 18,940,244 |
| AIMCO CLO Ltd. / AIMCO CLO LLC Series 2021-14A Class A, CME Term SOFR 3 Month Index + 1.250% 6.5336% 4/20/34 (b)(c)(d) | | 46,919,000 | 46,941,474 |
| Allegro CLO XV, Ltd. / Allegro CLO VX LLC Series 2022-1A Class A, CME Term SOFR 3 Month Index + 1.500% 6.782% 7/20/35 (b)(c)(d) | | 25,047,000 | 25,063,381 |
| Allegro CLO, Ltd. Series 2021-1A Class A, CME Term SOFR 3 Month Index + 1.400% 6.6836% 7/20/34 (b)(c)(d) | | 21,007,000 | 21,009,920 |
| Ally Auto Receivables Trust Series 2024-1 Class A3, 5.08% 12/15/28 | | 18,910,000 | 19,138,213 |
| American Express Credit Account Master Trust Series 2023-1 Class A, 4.87% 5/15/28 | | 19,110,000 | 19,337,621 |
| Apollo Aviation Securitization Equity Trust Series 2020-1A: | | | |
| Class A, 3.351% 1/16/40 (b) | | 5,022,343 | 4,771,642 |
| Class B, 4.335% 1/16/40 (b) | | 1,196,541 | 990,170 |
| Ares CLO Series 2024-54A Class AR, CME Term SOFR 3 Month Index + 1.270% 6.5714% 10/15/32 (b)(c)(d) | | 36,024,000 | 36,035,312 |
| Ares Ln Funding V Ltd. / Ares Ln Fund Series 2024-ALF5A Class A1, CME Term SOFR 3 Month Index + 1.500% 6.8235% 7/27/37 (b)(c)(d) | | 32,417,000 | 32,496,778 |
| Ares LV CLO Ltd. Series 2021-55A Class A1R, CME Term SOFR 3 Month Index + 1.390% 6.693% 7/15/34 (b)(c)(d) | | 19,036,000 | 19,055,436 |
| Ares LVIII CLO LLC Series 2022-58A Class AR, CME Term SOFR 3 Month Index + 1.330% 6.6314% 1/15/35 (b)(c)(d) | | 37,068,000 | 37,131,868 |
| Ares XLI CLO Ltd. / Ares XLI CLO LLC Series 2021-41A Class AR2, CME Term SOFR 3 Month Index + 1.330% 6.633% 4/15/34 (b)(c)(d) | | 29,947,000 | 29,953,888 |
| Ari Fleet Lease Trust 2024-B Series 2024-B Class A2, 5.54% 4/15/33 (b) | | 8,378,000 | 8,476,654 |
| Babson CLO Ltd. Series 2021-1A Class AR, CME Term SOFR 3 Month Index + 1.410% 6.713% 10/15/36 (b)(c)(d) | | 17,946,000 | 17,962,223 |
| Barings CLO Ltd. Series 2024-4A Class AR, 6.4518% 10/20/37 (b)(c) | | 28,775,000 | 28,810,825 |
| Barings CLO Ltd. 2023-IV Series 2024-4A Class A, CME Term SOFR 3 Month Index + 1.750% 7.032% 1/20/37 (b)(c)(d) | | 42,652,000 | 43,138,190 |
| Beechwood Park CLO Ltd. Series 2022-1A Class A1R, CME Term SOFR 3 Month Index + 1.300% 6.5858% 1/17/35 (b)(c)(d) | | 38,048,000 | 38,174,053 |
| BETHP Series 2021-1A Class A, CME Term SOFR 3 Month Index + 1.390% 6.693% 1/15/35 (b)(c)(d) | | 27,114,000 | 27,145,669 |
| Blackbird Capital Aircraft: | | | |
| Series 2016-1A Class A, 4.213% 12/16/41 (b) | | 17,910,919 | 17,800,229 |
| Series 2021-1A Class A, 2.443% 7/15/46 (b) | | 27,576,264 | 25,393,707 |
| Blueberry Park Clo Ltd. Series 2024-1A Class A, CME Term SOFR 3 Month Index + 1.350% 6.4761% 10/20/37 (b)(c)(d) | | 32,753,000 | 32,823,484 |
| Bofa Auto Trust 2024-1 Series 2024-1A Class A3, 5.35% 11/15/28 (b) | | 7,012,000 | 7,155,826 |
| Bristol Park CLO, Ltd. Series 2020-1A Class AR, CME Term SOFR 3 Month Index + 1.250% 6.553% 4/15/29 (b)(c)(d) | | 3,834,789 | 3,837,105 |
| Capital One Multi-Asset Execution Trust Series 2023-A1 Class A, 4.42% 5/15/28 | | 21,500,000 | 21,584,626 |
| Carlyle U.S. CLO Ltd. Series 2024-11A Class A1R, CME Term SOFR 3 Month Index + 1.410% 6.7329% 7/25/37 (b)(c)(d) | | 38,098,000 | 38,138,879 |
| Carmax Auto Owner Trust Series 2024-2 Class A3, 5.5% 1/16/29 | | 13,392,000 | 13,759,142 |
| Carmax Auto Owner Trust 2023-4 Series 2023-4 Class A3, 6% 7/17/28 | | 17,076,000 | 17,510,087 |
| Carmax Select Receivables Trust Series 2024-A: | | | |
| Class A2A, 5.78% 9/15/27 | | 5,979,000 | 6,027,591 |
| Class A3, 5.4% 11/15/28 | | 4,752,000 | 4,839,579 |
| Castlelake Aircraft Securitization Trust Series 2019-1A: | | | |
| Class A, 3.967% 4/15/39 (b) | | 18,710,934 | 17,122,544 |
| Class B, 5.095% 4/15/39 (b) | | 10,307,675 | 7,038,249 |
| Castlelake Aircraft Structured Trust: | | | |
| Series 2018-1 Class A, 4.125% 6/15/43 (b) | | 4,993,927 | 4,657,236 |
| Series 2021-1A Class A, 3.474% 1/15/46 (b) | | 3,372,503 | 3,259,986 |
| Cedar Funding Series 2024-18A Class A, CME Term SOFR 3 Month Index + 1.550% 6.833% 4/23/37 (b)(c)(d) | | 60,600,000 | 60,914,029 |
| Cedar Funding Ltd.: | | | |
| Series 2021-10A Class AR, CME Term SOFR 3 Month Index + 1.360% 6.6436% 10/20/32 (b)(c)(d) | | 21,787,000 | 21,793,536 |
| Series 2021-12A Class A1R, CME Term SOFR 3 Month Index + 1.390% 6.6762% 10/25/34 (b)(c)(d) | | 16,882,000 | 16,911,544 |
| Series 2022-15A Class A, CME Term SOFR 3 Month Index + 1.320% 6.602% 4/20/35 (b)(c)(d) | | 35,314,000 | 35,317,673 |
| Cedar Funding Xvii Clo Ltd. Series 2023-17A Class A, CME Term SOFR 3 Month Index + 1.850% 7.132% 7/20/36 (b)(c)(d) | | 25,314,000 | 25,424,723 |
| CEDF Series 2021-6A Class ARR, CME Term SOFR 3 Month Index + 1.310% 6.5936% 4/20/34 (b)(c)(d) | | 26,059,000 | 26,075,469 |
| CFMT LLC Series 2023 HB12 Class A, 4.25% 4/25/33 (b) | | 7,349,980 | 7,246,035 |
| Chase Auto Owner Trust Series 2024-1A Class A3, 5.13% 5/25/29 (b) | | 17,651,000 | 17,964,155 |
| Chesapeake Funding II LLC: | | | |
| Series 2023-2A Class A1, 6.16% 10/15/35 (b) | | 8,851,564 | 8,999,811 |
| Series 2024-1A Class A1, 5.52% 5/15/36 (b) | | 12,431,342 | 12,576,854 |
| Citizens Auto Receivables Trust Series 2024-2 Class A3, 5.33% 8/15/28 (b) | | 9,000,000 | 9,151,121 |
| CNH Equipment Trust Series 2023 A Class A2, 5.34% 9/15/26 | | 4,004,071 | 4,008,817 |
| Columbia Cent CLO 29 Ltd./Columbia Cent CLO 29 Corp. Series 2021-29A Class AR, CME Term SOFR 3 Month Index + 1.430% 6.7136% 10/20/34 (b)(c)(d) | | 27,352,000 | 27,385,205 |
| Columbia Cent CLO 31 Ltd. Series 2021-31A Class A1, CME Term SOFR 3 Month Index + 1.460% 6.7436% 4/20/34 (b)(c)(d) | | 28,400,000 | 28,419,624 |
| DB Master Finance LLC: | | | |
| Series 2017-1A Class A2II, 4.03% 11/20/47 (b) | | 35,785,255 | 35,093,780 |
| Series 2021-1A Class A23, 2.791% 11/20/51 (b) | | 11,894,648 | 10,397,968 |
| Discover Card Execution Note Trust Series 2023 A1 Class A, 4.31% 3/15/28 | | 7,800,000 | 7,813,663 |
| Dllaa 2023-1A Series 2023-1A: | | | |
| Class A2, 5.93% 7/20/26 (b) | | 3,500,649 | 3,518,394 |
| Class A3, 5.64% 2/22/28 (b) | | 7,444,000 | 7,617,008 |
| DLLAD: | | | |
| Series 2023-1A Class A3, 4.79% 1/20/28 (b) | | 7,200,000 | 7,246,637 |
| Series 2024-1A Class A3, 5.3% 7/20/29 (b) | | 6,879,000 | 7,063,580 |
| Dllmt 2024-1 LLC Series 2024-1A Class A3, 4.84% 8/21/28 (b) | | 21,700,000 | 21,975,325 |
| Dominos Pizza Master Issuer LLC Series 2019-1A Class A2, 3.668% 10/25/49 (b) | | 20,812,800 | 19,778,926 |
| Dryden 108 Clo Ltd. / Dryden 10 Series 2024-108A Class A1R, CME Term SOFR 3 Month Index + 1.360% 6.6386% 7/18/37 (b)(c)(d) | | 51,421,000 | 51,587,913 |
| Dryden 98 CLO Ltd. Series 2022-98A Class A, CME Term SOFR 3 Month Index + 1.300% 6.582% 4/20/35 (b)(c)(d) | | 19,817,000 | 19,848,925 |
| Dryden CLO, Ltd. Series 2024-83A Class AR, CME Term SOFR 3 Month Index + 1.530% 6.8642% 4/18/37 (b)(c)(d) | | 31,605,000 | 31,753,544 |
| Dryden Senior Loan Fund: | | | |
| Series 2021-90A Class A1A, CME Term SOFR 3 Month Index + 1.390% 6.52% 2/20/35 (b)(c)(d) | | 14,569,000 | 14,588,056 |
| Series 2024-78A Class A1R, CME Term SOFR 3 Month Index + 1.530% 6.8158% 4/17/37 (b)(c)(d) | | 12,000,000 | 12,043,044 |
| Series 2024-85A Class A1R2, CME Term SOFR 3 Month Index + 1.380% 6.6814% 7/15/37 (b)(c)(d) | | 30,259,000 | 30,293,314 |
| Eaton Vance CLO, Ltd.: | | | |
| Series 2021-2A Class AR, CME Term SOFR 3 Month Index + 1.410% 6.713% 1/15/35 (b)(c)(d) | | 32,919,000 | 32,928,876 |
| Series 2024-1A: | | | |
Class AR2, CME Term SOFR 3 Month Index + 1.510% 6.8399% 7/15/37 (b)(c)(d) | | 30,522,000 | 30,662,249 |
Class ARR, CME Term SOFR 3 Month Index + 1.390% 6.6914% 10/15/37 (b)(c)(d) | | 29,715,000 | 29,858,583 |
| Series 2024-2A Class AR2, CME Term SOFR 3 Month Index + 1.380% 0% 10/15/37 (b)(c)(d) | | 32,919,000 | 32,924,827 |
| Eaton Vance CLO, Ltd. / Eaton Vance CLO LLC Series 2021-1A Class A13R, CME Term SOFR 3 Month Index + 1.510% 6.813% 1/15/34 (b)(c)(d) | | 6,000,000 | 6,007,176 |
| Enterprise Fleet Financing Series 2024-2: | | | |
| Class A2, 5.74% 12/20/26 (b) | | 10,500,000 | 10,620,194 |
| Class A3, 5.61% 4/20/28 (b) | | 10,500,000 | 10,806,444 |
| Enterprise Fleet Financing 2023-3 L Series 2023-3 Class A2, 6.4% 3/20/30 (b) | | 24,790,149 | 25,339,411 |
| Finance of America HECM Buyout Series 2022-HB1 Class A, 2.6948% 2/25/32 (b)(c) | | 7,320,249 | 7,207,085 |
| Flatiron CLO Ltd.: | | | |
| Series 2021-1A Class AR, CME Term SOFR 3 Month Index + 1.340% 6.4371% 11/16/34 (b)(c)(d) | | 17,723,000 | 17,759,332 |
| Series 2024-1A Class A1R, 1.36% 10/19/37 (b)(c) | | 32,703,000 | 32,738,515 |
| Flatiron CLO Ltd. / Flatiron CLO LLC Series 2024-1A Class AR, CME Term SOFR 3 Month Index + 1.380% 6.5084% 5/20/36 (b)(c)(d) | | 55,130,000 | 55,253,491 |
| Ford Credit Auto Owner Trust 2 Series 2022-1 Class A, 3.88% 11/15/34 (b) | | 10,400,000 | 10,301,450 |
| Ford Credit Floorplan Master Owner Trust: | | | |
| Series 2023-1 Class A1, 4.92% 5/15/28 (b) | | 31,100,000 | 31,408,839 |
| Series 2024-1 Class A1, 5.29% 4/15/29 (b) | | 15,500,000 | 15,875,687 |
| GM Financial Automobile Leasing Trust Series 2023-2 Class A2A, 5.44% 10/20/25 | | 1,610,471 | 1,611,420 |
| Gm Financial Consumer Automobile Re Series 2023-3 Class A3, 5.45% 6/16/28 | | 15,130,000 | 15,356,029 |
| GM Financial Consumer Automobile Receivables Series 2023 2 Class A3, 4.47% 2/16/28 | | 23,205,000 | 23,237,120 |
| Gm Financial Leasing Trust 202 Series 2023-3 Class A3, 5.38% 11/20/26 | | 7,660,000 | 7,718,453 |
| Gm Financial Revolving Receiva Series 2024-1 Class A, 4.98% 12/11/36 (b) | | 16,913,000 | 17,354,470 |
| Horizon Aircraft Finance I Ltd. Series 2018-1 Class A, 4.458% 12/15/38 (b) | | 9,139,654 | 8,454,071 |
| Horizon Aircraft Finance Ltd. Series 2019-1 Class A, 3.721% 7/15/39 (b) | | 9,544,641 | 8,974,750 |
| HPEFS Equipment Trust Series 2024-2A Class A3, 5.36% 10/20/31 (b) | | 6,400,000 | 6,510,900 |
| Hyundai Auto Lease Securitizat Series 2024-B Class A3, 5.41% 5/17/27 (b) | | 22,900,000 | 23,288,849 |
| Hyundai Auto Receivables Trust Series 2024-A Class A3, 4.99% 2/15/29 | | 19,744,000 | 20,067,340 |
| Invesco CLO Ltd. Series 2021-3A Class A, CME Term SOFR 3 Month Index + 1.390% 6.6736% 10/22/34 (b)(c)(d) | | 19,246,000 | 19,270,365 |
| Invesco U.S. Clo 2024-1 Ltd. Series 2024-1RA Class AR, CME Term SOFR 3 Month Index + 1.550% 6.8514% 4/15/37 (b)(c)(d) | | 28,432,000 | 28,558,807 |
| Invesco U.S. CLO Ltd. Series 2024-3A Class A, CME Term SOFR 3 Month Index + 1.510% 6.8292% 7/20/37 (b)(c)(d) | | 24,935,000 | 25,025,738 |
| KKR CLO Ltd. Series 2022-41A Class A1, CME Term SOFR 3 Month Index + 1.330% 6.6314% 4/15/35 (b)(c)(d) | | 46,050,000 | 46,129,344 |
| Kubota Credit Owner Trust Series 2024-2A Class A3, 5.26% 11/15/28 (b) | | 17,700,000 | 18,145,996 |
| Long Beach Mortgage Loan Trust Series 2003-3 Class M1, CME Term SOFR 1 Month Index + 1.230% 6.0943% 7/25/33 (c)(d) | | 448,039 | 443,547 |
| Madison Park Funding L Ltd. / Madison Park Funding L LLC Series 2021-50A Class A, CME Term SOFR 3 Month Index + 1.400% 6.6811% 4/19/34 (b)(c)(d) | | 30,470,000 | 30,518,691 |
| Madison Park Funding LII Ltd. / Madison Park Funding LII LLC Series 2021-52A Class A, CME Term SOFR 3 Month Index + 1.360% 6.6436% 1/22/35 (b)(c)(d) | | 32,026,000 | 32,041,501 |
| Madison Park Funding XLV Ltd./Madison Park Funding XLV LLC Series 2021-45A Class AR, CME Term SOFR 3 Month Index + 1.380% 6.683% 7/15/34 (b)(c)(d) | | 27,800,000 | 27,804,726 |
| Madison Pk Funding Lxvii Ltd. / Mad Series 2024-67A Class A1, CME Term SOFR 3 Month Index + 1.510% 6.8002% 4/25/37 (b)(c)(d) | | 36,634,000 | 36,702,945 |
| Magnetite CLO LTD Series 2023-36A Class A, CME Term SOFR 3 Month Index + 1.800% 7.082% 4/22/36 (b)(c)(d) | | 17,468,000 | 17,549,733 |
| Magnetite CLO Ltd. Series 2021-27A Class AR, CME Term SOFR 3 Month Index + 1.400% 6.6836% 10/20/34 (b)(c)(d) | | 6,442,000 | 6,452,565 |
| Magnetite IX, Ltd. / Magnetite IX LLC Series 2021-30A Class A, CME Term SOFR 3 Month Index + 1.390% 6.6762% 10/25/34 (b)(c)(d) | | 32,900,000 | 32,909,015 |
| Magnetite XXI Ltd. Series 2021-21A Class AR, CME Term SOFR 3 Month Index + 1.280% 6.5636% 4/20/34 (b)(c)(d) | | 25,147,000 | 25,170,638 |
| Magnetite XXIII, Ltd. Series 2021-23A Class AR, CME Term SOFR 3 Month Index + 1.390% 6.6762% 1/25/35 (b)(c)(d) | | 23,616,000 | 23,621,691 |
| Magnetite XXIX, Ltd. / Magnetite XXIX LLC Series 2024-29A Class AR, CME Term SOFR 3 Month Index + 1.350% 6.5917% 7/15/37 (b)(c)(d) | | 28,521,000 | 28,579,582 |
| Marlette Funding Trust 2024-1 Series 2024-1A Class A, 5.95% 7/17/34 (b) | | 5,016,311 | 5,046,184 |
| Mercedes-Benz Auto Lease Trust Series 2024-A Class A3, 5.32% 1/18/28 | | 19,400,000 | 19,823,436 |
| Merchants Fleet Funding LLC: | | | |
| Series 2023-1A Class A, 7.21% 5/20/36 (b) | | 11,748,156 | 11,894,398 |
| Series 2024-1A Class A, 5.82% 4/20/37 (b) | | 15,200,000 | 15,446,204 |
| Milos CLO, Ltd. Series 2020-1A Class AR, CME Term SOFR 3 Month Index + 1.330% 6.6136% 10/20/30 (b)(c)(d) | | 20,777,744 | 20,804,007 |
| Neuberger Berman Loan Advisers Series 2024-25A Class AR2, CME Term SOFR 3 Month Index + 1.400% 6.723% 7/18/38 (b)(c)(d) | | 28,786,000 | 28,874,978 |
| Nissan Master Owner Trust Receiva Series 2024-B Class A, 5.05% 2/15/29 (b) | | 18,500,000 | 18,852,277 |
| Oak Hill Credit Partners Series 2024-18A: | | | |
| Class A1, 6.7917% 4/20/37 (b)(c) | | 41,264,000 | 41,499,989 |
| Class A2, CME Term SOFR 3 Month Index + 1.650% 6.9417% 4/20/37 (b)(c)(d) | | 2,187,000 | 2,194,281 |
| Park Place Securities, Inc. Series 2005-WCH1 Class M4, CME Term SOFR 1 Month Index + 1.350% 6.2143% 1/25/36 (c)(d) | | 282,893 | 280,240 |
| Peace Park CLO, Ltd. Series 2021-1A Class A, CME Term SOFR 3 Month Index + 1.390% 6.6736% 10/20/34 (b)(c)(d) | | 26,956,000 | 26,971,338 |
| PK ALIFT Loan Funding 3 LP Series 2024-1 Class A1, 5.842% 9/15/39 (b) | | 6,685,543 | 6,854,592 |
| Planet Fitness Master Issuer LLC: | | | |
| Series 2019-1A Class A2, 3.858% 12/5/49 (b) | | 21,913,215 | 20,577,758 |
| Series 2022-1A: | | | |
Class A2I, 3.251% 12/5/51 (b) | | 32,079,450 | 30,871,110 |
Class A2II, 4.008% 12/5/51 (b) | | 19,953,375 | 18,712,469 |
| Project Silver Series 2019-1 Class A, 3.967% 7/15/44 (b) | | 16,590,865 | 15,265,254 |
| Prpm 2023-Rcf2 LLC Series 2023-RCF2 Class A1, 4% 11/25/53 (b) | | 7,561,540 | 7,439,348 |
| Rockland Park CLO Ltd. Series 2021-1A Class A, CME Term SOFR 3 Month Index + 1.380% 6.6636% 4/20/34 (b)(c)(d) | | 35,857,000 | 35,876,291 |
| RR Ltd. Series 2022-7A Class A1AB, CME Term SOFR 3 Month Index + 1.340% 6.6414% 1/15/37 (b)(c)(d) | | 38,243,000 | 38,223,879 |
| Sapphire Aviation Finance Series 2020-1A: | | | |
| Class A, 3.228% 3/15/40 (b) | | 16,335,514 | 14,994,205 |
| Class B, 4.335% 3/15/40 (b) | | 1,946,639 | 1,538,483 |
| SBA Tower Trust: | | | |
| Series 2019, 2.836% 1/15/50 (b) | | 28,285,000 | 28,081,368 |
| 1.884% 7/15/50 (b) | | 10,516,000 | 10,148,731 |
| 2.328% 7/15/52 (b) | | 8,041,000 | 7,434,629 |
| Sbna Auto Lease Trust Series 2024-B Class A3, 5.56% 11/22/27 (b) | | 15,300,000 | 15,567,946 |
| Sbna Auto Lease Trust 2024-C Series 2024-C Class A3, 4.56% 2/22/28 (b) | | 14,200,000 | 14,229,231 |
| Sfs Auto Receivables Securitiz Series 2023-1A Class A2A, 5.89% 3/22/27 (b) | | 4,988,996 | 5,004,048 |
| Sfs Auto Receivables Securitization Trust Series 2024-2A Class A3, 5.33% 11/20/29 (b) | | 10,479,000 | 10,725,084 |
| Store Master Funding Series 2021-1A Class A1, 2.12% 6/20/51 (b) | | 9,542,375 | 8,598,517 |
| Subway Funding LLC: | | | |
| Series 2024-1A: | | | |
Class A23, 6.505% 7/30/54 (b) | | 26,198,000 | 27,145,762 |
Class A2I, 6.028% 7/30/54 (b) | | 50,249,000 | 51,815,332 |
Class A2II, 6.268% 7/30/54 (b) | | 29,873,000 | 30,829,525 |
| Series 2024-3A: | | | |
Class A23, 5.914% 7/30/54 (b) | | 36,059,000 | 36,053,898 |
Class A2I, 5.246% 7/30/54 (b) | | 37,597,000 | 37,569,028 |
Class A2II, 5.566% 7/30/54 (b) | | 17,784,000 | 17,797,697 |
| SYMP Series 2022-32A Class A1, CME Term SOFR 3 Month Index + 1.320% 6.603% 4/23/35 (b)(c)(d) | | 39,612,000 | 39,609,901 |
| Symphony Clo 43 Ltd. Series 2024-43A Class A1, CME Term SOFR 3 Month Index + 1.520% 6.8465% 4/15/37 (b)(c)(d) | | 25,363,000 | 25,483,094 |
| Symphony CLO XXI, Ltd. Series 2021-21A Class AR, CME Term SOFR 3 Month Index + 1.320% 6.623% 7/15/32 (b)(c)(d) | | 3,663,000 | 3,666,553 |
| Symphony CLO XXVI Ltd. / Symphony CLO XXVI LLC Series 2021-26A Class AR, CME Term SOFR 3 Month Index + 1.340% 6.6236% 4/20/33 (b)(c)(d) | | 28,357,259 | 28,385,617 |
| Terwin Mortgage Trust Series 2003-4HE Class A1, CME Term SOFR 1 Month Index + 0.970% 5.8293% 9/25/34 (c)(d) | | 48,219 | 49,153 |
| Tesla Series 2024-A Class A2A, 5.37% 6/22/26 (b) | | 7,197,057 | 7,211,811 |
| Tesla Auto Lease Trust 23-A Series 2023-A Class A3, 5.89% 6/22/26 (b) | | 17,400,000 | 17,496,005 |
| Thunderbolt Aircraft Lease Ltd. Series 2018-A Class A, 4.147% 9/15/38 (b)(c) | | 22,995,354 | 21,157,432 |
| Thunderbolt III Aircraft Lease Ltd. Series 2019-1 Class A, 3.671% 11/15/39 (b) | | 22,894,785 | 20,606,680 |
| Toyota Lease Owner Trust: | | | |
| Series 2023 A Class A3, 4.93% 4/20/26 (b) | | 18,007,000 | 18,018,524 |
| Series 2024-A Class A3, 5.25% 4/20/27 (b) | | 18,300,000 | 18,558,592 |
| Trapeza CDO XII Ltd./Trapeza CDO XII, Inc. Series 2007-12A Class B, CME Term SOFR 3 Month Index + 0.820% 6.1359% 4/6/42 (b)(c)(d) | | 3,641,000 | 2,676,914 |
| Upstart Securitization Trust Series 2022-1 Class A, 3.12% 3/20/32 (b) | | 433,958 | 433,098 |
| Usaa Auto Owner Trust 2024-A Series 2024-A Class A3, 5.03% 3/15/29 (b) | | 11,600,000 | 11,788,152 |
| Volkswagen Auto Lease Trust 2024- Series 2024-A Class A3, 5.21% 6/21/27 | | 11,770,000 | 11,970,244 |
| Volvo Financial Equipment LLC Series 2024-1A Class A3, 4.29% 10/16/28 (b) | | 7,800,000 | 7,822,559 |
| Voya Clo 2023-1 Ltd. Series 2023-1A Class A1, CME Term SOFR 3 Month Index + 1.800% 7.082% 1/20/37 (b)(c)(d) | | 32,560,000 | 32,811,396 |
| Voya Clo Ltd. Series 2024-1A Class A1, CME Term SOFR 3 Month Index + 1.520% 6.8461% 4/15/37 (b)(c)(d) | | 24,125,000 | 24,156,749 |
| Voya CLO Ltd./Voya CLO LLC: | | | |
| Series 2021-2A Class A1R, CME Term SOFR 3 Month Index + 1.420% 6.7011% 7/19/34 (b)(c)(d) | | 10,748,000 | 10,751,407 |
| Series 2021-3A Class AR, CME Term SOFR 3 Month Index + 1.410% 6.6936% 10/20/34 (b)(c)(d) | | 36,484,000 | 36,536,172 |
| Wheels Fleet Lease Funding 1 L: | | | |
| Series 2023-2A Class A, 6.46% 8/18/38 (b) | | 38,773,748 | 39,238,436 |
| Series 2024-1A Class A1, 5.49% 2/18/39 (b) | | 14,400,000 | 14,617,375 |
| Willis Engine Structured Trust Vi Series 2023-A Class A, 8% 10/15/48 (b) | | 12,864,070 | 13,681,376 |
| World Omni Auto Receivables Trust: | | | |
| Series 2023 B Class A3, 4.66% 5/15/28 | | 19,065,000 | 19,112,224 |
| Series 2023-C Class A3, 5.15% 11/15/28 | | 9,413,000 | 9,512,040 |
| World Omni Automobile Lease Series 2023-A Class A2A, 5.47% 11/17/25 | | 4,399,792 | 4,403,431 |
| TOTAL ASSET-BACKED SECURITIES (Cost $3,623,667,895) | | | 3,617,496,972 |
| | | | |
| Collateralized Mortgage Obligations - 1.3% |
| | | Principal Amount (a) | Value ($) |
| Private Sponsor - 0.4% | | | |
| Ajax Mortgage Loan Trust sequential payer: | | | |
| Series 2021-C Class A, 5.115% 1/25/61 (b) | | 2,706,925 | 2,693,677 |
| Series 2021-E Class A1, 1.74% 12/25/60 (b) | | 9,350,625 | 8,223,889 |
| Binom Securitization Trust 202 Series 2022-RPL1 Class A1, 3% 2/25/61 (b) | | 11,741,412 | 10,960,637 |
| Brass PLC Series 2021-10A Class A1, 0.669% 4/16/69 (b)(c) | | 2,009,884 | 1,997,822 |
| BRAVO Residential Funding Trust sequential payer Series 2022-RPL1 Class A1, 2.75% 9/25/61 (b) | | 13,611,008 | 12,516,028 |
| Cfmt 2024-Hb15 LLC sequential payer Series 2024-HB15 Class A, 4% 8/25/34 (b)(c) | | 7,560,964 | 7,438,960 |
| Cfmt LLC floater sequential payer Series 2024-HB13 Class A, 3% 5/25/34 (b)(c) | | 13,638,920 | 13,088,281 |
| Gs Mtg-Backed Securities Trust 2024-Rpl Series 2024-RPL2 Class A1, 3.75% 7/25/61 (b) | | 4,812,820 | 4,687,423 |
| New Residential Mortgage Loan Trust Series 2020-1A Class A1B, 3.5% 10/25/59 (b) | | 7,496,854 | 7,056,242 |
| New York Mortgage Trust sequential payer Series 2021-SP1 Class A1, 4.6696% 8/25/61 (b) | | 7,596,173 | 7,516,658 |
| NYMT Loan Trust sequential payer Series 2021-CP1 Class A1, 2.0424% 7/25/61 (b) | | 11,233,669 | 10,406,164 |
| Nymt Loan Trust 2024-Cp1 sequential payer Series 2024-CP1 Class A1, 3.75% 2/25/68 (b) | | 5,906,881 | 5,599,335 |
| Ocwen Ln Investment Trust 2023-Hb1 Series 2023-HB1 Class A, 3% 6/25/36 (b) | | 2,439,610 | 2,386,296 |
| Ocwen Loan Invest Trust Series 2024-HB1 Class A, 3% 2/25/37 (b) | | 2,197,429 | 2,140,614 |
| Onity Loan Investment Trust 20 Series 2024-HB2 Class A, 5% 8/25/37 (b) | | 4,864,319 | 4,845,834 |
| Preston Ridge Partners Mortgage Trust Series 2021-RPL2 Class A1, 1.455% 10/25/51 (b)(c) | | 5,047,263 | 4,657,907 |
| Pret 2024-Rpl1 Trust sequential payer Series 2024-RPL1 Class A1, 3.9% 10/25/63 (b) | | 10,364,700 | 9,937,017 |
| Prmi Securitization Trust 2024-Cm floater Series 2024-CMG1 Class A1, U.S. 30-Day Avg. Secured Overnight Fin. Rate (SOFR) Index + 1.300% 6.8012% 7/25/54 (b)(c)(d) | | 9,831,279 | 9,803,080 |
| Prpm 2024-Rpl2 LLC Series 2024-RPL2 Class A1, 3.5% 5/25/54 (b)(c) | | 11,864,894 | 11,493,238 |
| RMF Buyout Issuance Trust: | | | |
| sequential payer Series 2022-HB1 Class A, 4.272% 4/25/32 (b) | | 163,805 | 163,564 |
| Series 2020-HB1 Class A1, 1.7188% 10/25/50 (b) | | 3,507,933 | 3,345,541 |
| Sequoia Mortgage Trust floater Series 2004-6 Class A3B, CME Term SOFR 6 Month Index + 1.300% 6.5772% 7/20/34 (c)(d) | | 9,011 | 8,353 |
| Thornburg Mortgage Securities Trust floater Series 2003-4 Class A1, CME Term SOFR 1 Month Index + 0.750% 5.6093% 9/25/43 (c)(d) | | 531,441 | 505,877 |
| Towd Point Mortgage Trust sequential payer Series 2022-K147 Class A2, 3.75% 7/25/62 (b) | | 16,819,282 | 16,038,361 |
TOTAL PRIVATE SPONSOR | | | 157,510,798 |
| U.S. Government Agency - 0.9% | | | |
| Fannie Mae: | | | |
| floater: | | | |
Series 2002-18 Class FD, U.S. 30-Day Avg. Secured Overnight Fin. Rate (SOFR) Index + 0.910% 6.1946% 2/25/32 (c)(d) | | 5,184 | 5,204 |
Series 2002-39 Class FD, U.S. 30-Day Avg. Secured Overnight Fin. Rate (SOFR) Index + 1.110% 6.4559% 3/18/32 (c)(d) | | 9,429 | 9,503 |
Series 2002-60 Class FV, U.S. 30-Day Avg. Secured Overnight Fin. Rate (SOFR) Index + 1.110% 6.3946% 4/25/32 (c)(d) | | 10,100 | 10,192 |
Series 2002-63 Class FN, U.S. 30-Day Avg. Secured Overnight Fin. Rate (SOFR) Index + 1.110% 6.3946% 10/25/32 (c)(d) | | 12,361 | 12,474 |
Series 2002-7 Class FC, U.S. 30-Day Avg. Secured Overnight Fin. Rate (SOFR) Index + 0.860% 6.1446% 1/25/32 (c)(d) | | 4,765 | 4,771 |
Series 2003-118 Class S, 7.980% - U.S. 30-Day Avg. Secured Overnight Fin. Rate (SOFR) Index 2.7054% 12/25/33 (c)(j)(k) | | 192,911 | 30,049 |
Series 2006-104 Class GI, 6.560% - U.S. 30-Day Avg. Secured Overnight Fin. Rate (SOFR) Index 1.2854% 11/25/36 (c)(j)(k) | | 141,607 | 15,861 |
Series 2012-154 Class F, U.S. 30-Day Avg. Secured Overnight Fin. Rate (SOFR) Index + 0.410% 5.6946% 1/25/43 (c)(d) | | 601,178 | 588,504 |
Series 2017-36 Class FB, U.S. 30-Day Avg. Secured Overnight Fin. Rate (SOFR) Index + 0.460% 5.7446% 5/25/47 (c)(d) | | 1,242,729 | 1,210,114 |
Series 2018-32 Class FB, U.S. 30-Day Avg. Secured Overnight Fin. Rate (SOFR) Index + 0.410% 5.6946% 5/25/48 (c)(d) | | 678,725 | 658,571 |
Series 2018-38 Class FG, U.S. 30-Day Avg. Secured Overnight Fin. Rate (SOFR) Index + 0.410% 5.6946% 6/25/48 (c)(d) | | 1,608,737 | 1,558,422 |
| planned amortization class: | | | |
Series 1999-17 Class PG, 6% 4/25/29 | | 39,472 | 40,316 |
Series 1999-32 Class PL, 6% 7/25/29 | | 55,429 | 56,640 |
Series 1999-33 Class PK, 6% 7/25/29 | | 40,504 | 41,355 |
Series 1999-57 Class PH, 6.5% 12/25/29 | | 123,411 | 125,575 |
Series 2001-52 Class YZ, 6.5% 10/25/31 | | 6,983 | 7,296 |
Series 2005-102 Class CO 11/25/35 (l) | | 26,394 | 22,859 |
Series 2005-73 Class SA, 17.500% x U.S. 30-Day Avg. Secured Overnight Fin. Rate (SOFR) Index 3.524% 8/25/35 (c)(d)(k) | | 5,551 | 5,888 |
Series 2005-81 Class PC, 5.5% 9/25/35 | | 89,777 | 92,708 |
Series 2006-12 Class BO 10/25/35 (l) | | 125,363 | 111,352 |
Series 2006-15 Class OP 3/25/36 (l) | | 188,678 | 161,462 |
Series 2006-37 Class OW 5/25/36 (l) | | 18,299 | 15,023 |
Series 2006-45 Class OP 6/25/36 (l) | | 58,817 | 49,193 |
Series 2006-62 Class KP 4/25/36 (l) | | 91,141 | 76,682 |
Series 2012-149: | | | |
Class DA, 1.75% 1/25/43 | | 225,271 | 210,274 |
Class GA, 1.75% 6/25/42 | | 275,808 | 257,275 |
| sequential payer: | | | |
Series 1997-41 Class J, 7.5% 6/18/27 | | 6,271 | 6,450 |
Series 1999-25 Class Z, 6% 6/25/29 | | 44,389 | 44,835 |
Series 2001-20 Class Z, 6% 5/25/31 | | 52,971 | 54,338 |
Series 2001-31 Class ZC, 6.5% 7/25/31 | | 22,476 | 22,916 |
Series 2002-16 Class ZD, 6.5% 4/25/32 | | 24,636 | 25,621 |
Series 2002-74 Class SV, 7.430% - U.S. 30-Day Avg. Secured Overnight Fin. Rate (SOFR) Index 2.1554% 11/25/32 (c)(j)(k) | | 21,773 | 589 |
Series 2012-67 Class AI, 4.5% 7/25/27 (j) | | 11,232 | 138 |
Series 2020-43 Class MA, 2% 1/25/45 | | 4,417,801 | 4,122,552 |
Series 2020-49 Class JA, 2% 8/25/44 | | 2,084,826 | 1,955,742 |
Series 2020-56 Class AH, 2% 5/25/45 | | 3,432,068 | 3,237,736 |
Series 2020-80 Class BA, 1.5% 3/25/45 | | 8,211,338 | 7,291,329 |
Series 2021-85 Class L, 2.5% 8/25/48 | | 2,418,499 | 2,167,762 |
Series 2021-95: | | | |
Class 0, 2.5% 9/25/48 | | 7,701,449 | 6,920,695 |
Class BA, 2.5% 6/25/49 | | 11,725,984 | 10,471,443 |
Series 2021-96 Class HA, 2.5% 2/25/50 | | 3,866,045 | 3,461,550 |
Series 2022-1 Class KA, 3% 5/25/48 | | 3,829,876 | 3,573,101 |
Series 2022-11 Class B, 3% 6/25/49 | | 4,578,288 | 4,300,693 |
Series 2022-13: | | | |
Class HA, 3% 8/25/46 | | 3,706,874 | 3,527,491 |
Class JA, 3% 5/25/48 | | 3,224,970 | 3,038,501 |
Series 2022-15 Class GC, 3% 1/25/47 | | 5,331,076 | 5,049,392 |
Series 2022-17 Class BH, 3% 5/25/47 | | 5,811,459 | 5,558,230 |
Series 2022-3: | | | |
Class D, 2% 2/25/48 | | 11,144,041 | 10,072,307 |
Class N, 2% 10/25/47 | | 30,615,309 | 27,540,813 |
Series 2022-30 Class E, 4.5% 7/25/48 | | 10,896,827 | 10,828,064 |
Series 2022-4 Class B, 2.5% 5/25/49 | | 2,819,702 | 2,534,061 |
Series 2022-42 Class BA, 4% 6/25/50 | | 11,781,663 | 11,600,972 |
Series 2022-49 Class TC, 4% 12/25/48 | | 3,473,762 | 3,389,417 |
Series 2022-5: | | | |
Class 0, 2.5% 6/25/48 | | 4,134,769 | 3,768,642 |
Class BA, 2.5% 12/25/49 | | 4,433,971 | 3,901,490 |
Class DA, 2.25% 11/25/47 | | 12,100,563 | 10,974,018 |
Series 2022-7: | | | |
Class A, 3% 5/25/48 | | 5,451,447 | 5,086,372 |
Class E, 2.5% 11/25/47 | | 11,259,552 | 10,334,471 |
Series 2022-9 Class BA, 3% 5/25/48 | | 2,487,480 | 2,321,026 |
| Series 06-116 Class SG, 6.520% - U.S. 30-Day Avg. Secured Overnight Fin. Rate (SOFR) Index 1.2454% 12/25/36 (c)(j)(k) | | 93,019 | 10,510 |
| Series 07-40 Class SE, 6.320% - U.S. 30-Day Avg. Secured Overnight Fin. Rate (SOFR) Index 1.0454% 5/25/37 (c)(j)(k) | | 47,234 | 5,872 |
| Series 2003-21 Class SK, 7.980% - U.S. 30-Day Avg. Secured Overnight Fin. Rate (SOFR) Index 2.7054% 3/25/33 (c)(j)(k) | | 10,043 | 1,154 |
| Series 2005-72 Class ZC, 5.5% 8/25/35 | | 765,757 | 782,496 |
| Series 2005-79 Class ZC, 5.9% 9/25/35 | | 462,970 | 474,760 |
| Series 2007-57 Class SA, 40.600% x U.S. 30-Day Avg. Secured Overnight Fin. Rate (SOFR) Index 8.2524% 6/25/37 (c)(d)(k) | | 39,097 | 50,768 |
| Series 2007-66: | | | |
Class SA, 38.910% x U.S. 30-Day Avg. Secured Overnight Fin. Rate (SOFR) Index 7.2324% 7/25/37 (c)(d)(k) | | 59,334 | 77,854 |
Class SB, 38.910% x U.S. 30-Day Avg. Secured Overnight Fin. Rate (SOFR) Index 7.2324% 7/25/37 (c)(d)(k) | | 12,553 | 14,470 |
| Series 2010-135 Class ZA, 4.5% 12/25/40 | | 207,159 | 212,303 |
| Series 2010-150 Class ZC, 4.75% 1/25/41 | | 1,824,628 | 1,845,796 |
| Series 2010-95 Class ZC, 5% 9/25/40 | | 3,833,503 | 3,911,243 |
| Series 2011-39 Class ZA, 6% 11/25/32 | | 221,458 | 231,439 |
| Series 2011-4 Class PZ, 5% 2/25/41 | | 631,128 | 626,420 |
| Series 2011-67 Class AI, 4% 7/25/26 (j) | | 6,121 | 83 |
| Series 2012-100 Class WI, 3% 9/25/27 (j) | | 442,016 | 12,691 |
| Series 2012-9 Class SH, 6.430% - U.S. 30-Day Avg. Secured Overnight Fin. Rate (SOFR) Index 1.1554% 6/25/41 (c)(j)(k) | | 17,568 | 88 |
| Series 2013-133 Class IB, 3% 4/25/32 (j) | | 96,453 | 1,018 |
| Series 2013-134 Class SA, 5.930% - U.S. 30-Day Avg. Secured Overnight Fin. Rate (SOFR) Index 0.6554% 1/25/44 (c)(j)(k) | | 230,587 | 27,391 |
| Series 2013-51 Class GI, 3% 10/25/32 (j) | | 175,216 | 8,074 |
| Series 2013-N1 Class A, 6.600% - U.S. 30-Day Avg. Secured Overnight Fin. Rate (SOFR) Index 1.3254% 6/25/35 (c)(j)(k) | | 245,859 | 20,981 |
| Series 2015-42 Class IL, 6% 6/25/45 (j) | | 1,286,656 | 207,095 |
| Series 2015-70 Class JC, 3% 10/25/45 | | 1,477,493 | 1,422,334 |
| Series 2017-30 Class AI, 5.5% 5/25/47 (j) | | 719,008 | 116,711 |
| Series 2019-82 Class PI, 4% 6/25/49 (j) | | 5,887,934 | 1,006,427 |
| Series 2020-45 Class JL, 3% 7/25/40 | | 130,861 | 121,267 |
| Series 2021-59 Class H, 2% 6/25/48 | | 2,535,565 | 2,128,924 |
| Series 2021-66: | | | |
Class DA, 2% 1/25/48 | | 2,693,108 | 2,272,405 |
Class DM, 2% 1/25/48 | | 2,862,002 | 2,414,916 |
| Series 2022-28 Class A, 2.5% 2/25/52 | | 13,628,839 | 12,945,275 |
| Fannie Mae Stripped Mortgage-Backed Securities: | | | |
| Series 339 Class 5, 5.5% 7/25/33 (j) | | 47,819 | 7,256 |
| Series 343 Class 16, 5.5% 5/25/34 (j) | | 44,916 | 6,879 |
| Series 348 Class 14, 6.5% 8/25/34 (c)(j) | | 29,349 | 5,444 |
| Series 351: | | | |
Class 12, 5.5% 4/25/34 (c)(j) | | 16,955 | 2,709 |
Class 13, 6% 3/25/34 (j) | | 28,101 | 4,917 |
| Series 359 Class 19, 6% 7/25/35 (c)(j) | | 15,296 | 2,808 |
| Series 384 Class 6, 5% 7/25/37 (j) | | 187,774 | 31,247 |
| Freddie Mac: | | | |
| floater: | | | |
Series 2412 Class FK, U.S. 30-Day Avg. Secured Overnight Fin. Rate (SOFR) Index + 0.910% 6.2566% 1/15/32 (c)(d) | | 3,708 | 3,721 |
Series 2423 Class FA, U.S. 30-Day Avg. Secured Overnight Fin. Rate (SOFR) Index + 1.010% 6.3566% 3/15/32 (c)(d) | | 5,471 | 5,504 |
Series 2424 Class FM, U.S. 30-Day Avg. Secured Overnight Fin. Rate (SOFR) Index + 1.110% 6.4566% 3/15/32 (c)(d) | | 5,041 | 5,077 |
Series 2432: | | | |
Class FE, U.S. 30-Day Avg. Secured Overnight Fin. Rate (SOFR) Index + 1.010% 6.3566% 6/15/31 (c)(d) | | 8,754 | 8,790 |
Class FG, U.S. 30-Day Avg. Secured Overnight Fin. Rate (SOFR) Index + 1.010% 6.3566% 3/15/32 (c)(d) | | 3,159 | 3,173 |
Series 4709 Class FE, U.S. 30-Day Avg. Secured Overnight Fin. Rate (SOFR) Index + 0.460% 5.8066% 8/15/47 (c)(d) | | 620,243 | 604,092 |
| planned amortization class: | | | |
Series 2095 Class PE, 6% 11/15/28 | | 51,892 | 53,036 |
Series 2101 Class PD, 6% 11/15/28 | | 4,955 | 5,070 |
Series 2121 Class MG, 6% 2/15/29 | | 22,556 | 23,074 |
Series 2131 Class BG, 6% 3/15/29 | | 156,964 | 160,686 |
Series 2137 Class PG, 6% 3/15/29 | | 26,720 | 27,333 |
Series 2154 Class PT, 6% 5/15/29 | | 41,483 | 42,453 |
Series 2162 Class PH, 6% 6/15/29 | | 7,817 | 7,988 |
Series 2520 Class BE, 6% 11/15/32 | | 94,048 | 97,685 |
Series 2693 Class MD, 5.5% 10/15/33 | | 209,657 | 213,875 |
Series 2802 Class OB, 6% 5/15/34 | | 55,840 | 57,544 |
Series 3002 Class NE, 5% 7/15/35 | | 213,867 | 218,713 |
Series 3110 Class OP 9/15/35 (l) | | 27,501 | 26,497 |
Series 3119 Class PO 2/15/36 (l) | | 223,003 | 183,664 |
Series 3121 Class KO 3/15/36 (l) | | 31,361 | 27,250 |
Series 3123 Class LO 3/15/36 (l) | | 121,729 | 101,219 |
Series 3145 Class GO 4/15/36 (l) | | 132,739 | 111,158 |
Series 3189 Class PD, 6% 7/15/36 | | 203,107 | 214,041 |
Series 3225 Class EO 10/15/36 (l) | | 67,745 | 56,011 |
Series 3258 Class PM, 5.5% 12/15/36 | | 68,948 | 71,263 |
Series 3415 Class PC, 5% 12/15/37 | | 93,493 | 94,966 |
Series 3832 Class PE, 5% 3/15/41 | | 910,173 | 932,400 |
Series 4135 Class AB, 1.75% 6/15/42 | | 201,702 | 189,211 |
| sequential payer: | | | |
Series 2020-4993 Class LA, 2% 8/25/44 | | 4,191,652 | 3,934,110 |
Series 2020-5018: | | | |
Class LC, 3% 10/25/40 | | 884,169 | 817,651 |
Class LY, 3% 10/25/40 | | 671,189 | 620,840 |
Series 2020-5066 Class A, 1.5% 11/25/44 | | 2,733,870 | 2,430,120 |
Series 2021-5169 Class TP, 2.5% 6/25/49 | | 3,107,050 | 2,771,711 |
Series 2021-5175 Class CB, 2.5% 4/25/50 | | 14,005,087 | 12,521,631 |
Series 2021-5180 Class KA, 2.5% 10/25/47 | | 2,791,222 | 2,552,720 |
Series 2022-5189: | | | |
Class DA, 2.5% 5/25/49 | | 2,947,315 | 2,642,944 |
Class TP, 2.5% 5/25/49 | | 2,848,903 | 2,557,948 |
Series 2022-5190: | | | |
Class BA, 2.5% 11/25/47 | | 2,831,682 | 2,587,232 |
Class CA, 2.5% 5/25/49 | | 2,381,498 | 2,138,072 |
Series 2022-5191 Class CA, 2.5% 4/25/50 | | 3,275,430 | 2,908,784 |
Series 2022-5197: | | | |
Class A, 2.5% 6/25/49 | | 2,381,505 | 2,138,073 |
Class DA, 2.5% 11/25/47 | | 2,149,396 | 1,966,044 |
Series 2022-5198 Class BA, 2.5% 11/25/47 | | 10,471,289 | 9,568,204 |
Series 2022-5202: | | | |
Class AG, 3% 1/25/49 | | 2,562,572 | 2,383,236 |
Class LB, 2.5% 10/25/47 | | 2,305,754 | 2,110,455 |
Class UA, 3% 4/25/50 | | 4,043,143 | 3,761,363 |
Series 2022-5210 Class TA, 3.5% 11/25/46 | | 3,481,329 | 3,333,331 |
Series 2135 Class JE, 6% 3/15/29 | | 8,697 | 8,935 |
Series 2274 Class ZM, 6.5% 1/15/31 | | 15,659 | 15,935 |
Series 2281 Class ZB, 6% 3/15/30 | | 28,149 | 28,895 |
Series 2303 Class ZV, 6% 4/15/31 | | 14,859 | 15,323 |
Series 2357 Class ZB, 6.5% 9/15/31 | | 142,783 | 147,526 |
Series 2502 Class ZC, 6% 9/15/32 | | 36,328 | 37,726 |
Series 2519 Class ZD, 5.5% 11/15/32 | | 50,639 | 52,166 |
Series 2998 Class LY, 5.5% 7/15/25 | | 2,104 | 2,104 |
| Series 06-3115 Class SM, 6.480% - U.S. 30-Day Avg. Secured Overnight Fin. Rate (SOFR) Index 1.1435% 2/15/36 (c)(j)(k) | | 66,193 | 6,874 |
| Series 2013-4281 Class AI, 4% 12/15/28 (j) | | 4,310 | 27 |
| Series 2017-4683 Class LM, 3% 5/15/47 | | 1,842,364 | 1,785,240 |
| Series 2017-4720 Class IO, 4% 9/15/47 (j) | | 7,537,899 | 1,531,223 |
| Series 2018-4765 Class IB, 4% 3/15/48 (j) | | 6,707,585 | 1,361,479 |
| Series 2020-5041 Class LB, 3% 11/25/40 | | 1,503,485 | 1,389,982 |
| Series 2021-5083 Class VA, 1% 8/15/38 | | 9,974,956 | 9,470,498 |
| Series 2021-5182 Class A, 2.5% 10/25/48 | | 18,385,296 | 16,501,574 |
| Series 2022-5236 Class P, 5% 4/25/48 | | 4,566,633 | 4,615,315 |
| Series 2022-5266 Class CD, 4.5% 10/25/44 | | 10,316,158 | 10,280,261 |
| Series 2933 Class ZM, 5.75% 2/15/35 | | 1,006,737 | 1,049,916 |
| Series 2947 Class XZ, 6% 3/15/35 | | 409,357 | 427,992 |
| Series 2996 Class ZD, 5.5% 6/15/35 | | 659,827 | 682,292 |
| Series 3237 Class C, 5.5% 11/15/36 | | 891,441 | 919,168 |
| Series 3244 Class SG, 6.540% - U.S. 30-Day Avg. Secured Overnight Fin. Rate (SOFR) Index 1.2035% 11/15/36 (c)(j)(k) | | 291,590 | 29,131 |
| Series 3336 Class LI, 6.460% - U.S. 30-Day Avg. Secured Overnight Fin. Rate (SOFR) Index 1.1235% 6/15/37 (c)(j)(k) | | 187,559 | 23,727 |
| Series 3949 Class MK, 4.5% 10/15/34 | | 150,538 | 151,375 |
| Series 4055 Class BI, 3.5% 5/15/31 (j) | | 23,069 | 29 |
| Series 4149 Class IO, 3% 1/15/33 (j) | | 98,735 | 7,026 |
| Series 4314 Class AI, 5% 3/15/34 (j) | | 8,803 | 107 |
| Series 4427 Class LI, 3.5% 2/15/34 (j) | | 583,371 | 25,426 |
| Series 4471 Class PA 4% 12/15/40 | | 503,348 | 499,980 |
| target amortization class: | | | |
Series 2007-3366 Class FD, U.S. 30-Day Avg. Secured Overnight Fin. Rate (SOFR) Index + 0.360% 5.7066% 5/15/37 (c)(d) | | 234,161 | 228,257 |
Series 2156 Class TC, 6.25% 5/15/29 | | 6,624 | 6,627 |
| Freddie Mac Manufactured Housing participation certificates guaranteed sequential payer: | | | |
| Series 2043 Class ZH, 6% 4/15/28 | | 14,530 | 14,822 |
| Series 2056 Class Z, 6% 5/15/28 | | 41,786 | 42,718 |
| Freddie Mac Multiclass Mortgage participation certificates: | | | |
| floater Series 4795 Class FA, U.S. 30-Day Avg. Secured Overnight Fin. Rate (SOFR) Index + 0.410% 5.7566% 5/15/48 (c)(d) | | 1,106,372 | 1,070,639 |
| sequential payer: | | | |
Series 2021-5159: | | | |
Class EA, 2.5% 8/25/48 | | 3,067,078 | 2,750,589 |
Class GC, 2% 11/25/47 | | 2,235,443 | 2,001,631 |
Series 2021-5164 Class M, 2.5% 7/25/48 | | 3,125,765 | 2,804,301 |
| Series 4386 Class AZ, 4.5% 11/15/40 | | 2,192,577 | 2,169,683 |
| Ginnie Mae guaranteed REMIC pass-thru certificates: | | | |
| floater: | | | |
Series 2007-37 Class TS, 6.570% - CME Term SOFR 1 Month Index 1.479% 6/16/37 (c)(j)(k) | | 121,472 | 13,864 |
Series 2010-H03 Class FA, CME Term SOFR 1 Month Index + 0.660% 5.9405% 3/20/60 (c)(d)(m) | | 582,435 | 581,996 |
Series 2010-H17 Class FA, CME Term SOFR 1 Month Index + 0.440% 5.7205% 7/20/60 (c)(d)(m) | | 155,966 | 155,505 |
Series 2010-H18 Class AF, CME Term SOFR 1 Month Index + 0.410% 5.7665% 9/20/60 (c)(d)(m) | | 125,403 | 124,754 |
Series 2010-H19 Class FG, CME Term SOFR 1 Month Index + 0.410% 5.7665% 8/20/60 (c)(d)(m) | | 117,315 | 116,845 |
Series 2010-H27 Class FA, CME Term SOFR 1 Month Index + 0.380% 5.8465% 12/20/60 (c)(d)(m) | | 331,187 | 330,062 |
Series 2011-H05 Class FA, CME Term SOFR 1 Month Index + 0.610% 5.9665% 12/20/60 (c)(d)(m) | | 258,106 | 257,774 |
Series 2011-H07 Class FA, CME Term SOFR 1 Month Index + 0.610% 5.9665% 2/20/61 (c)(d)(m) | | 264,745 | 264,330 |
Series 2011-H12 Class FA, CME Term SOFR 1 Month Index + 0.600% 5.9565% 2/20/61 (c)(d)(m) | | 328,895 | 328,230 |
Series 2011-H13 Class FA, CME Term SOFR 1 Month Index + 0.610% 5.9665% 4/20/61 (c)(d)(m) | | 311,597 | 311,262 |
Series 2011-H14: | | | |
Class FB, CME Term SOFR 1 Month Index + 0.610% 5.9665% 5/20/61 (c)(d)(m) | | 293,450 | 292,942 |
Class FC, CME Term SOFR 1 Month Index + 0.610% 5.9665% 5/20/61 (c)(d)(m) | | 310,973 | 310,627 |
Series 2011-H17 Class FA, CME Term SOFR 1 Month Index + 0.640% 5.9965% 6/20/61 (c)(d)(m) | | 332,187 | 331,961 |
Series 2011-H20 Class FA, CME Term SOFR 1 Month Index + 0.660% 6.0165% 9/20/61 (c)(d)(m) | | 915,778 | 915,264 |
Series 2011-H21 Class FA, CME Term SOFR 1 Month Index + 0.710% 6.0665% 10/20/61 (c)(d)(m) | | 328,570 | 328,576 |
Series 2012-98 Class FA, CME Term SOFR 1 Month Index + 0.510% 5.4753% 8/20/42 (c)(d) | | 574,913 | 565,584 |
Series 2012-H01 Class FA, CME Term SOFR 1 Month Index + 0.810% 6.1665% 11/20/61 (c)(d)(m) | | 417,153 | 417,750 |
Series 2012-H03 Class FA, CME Term SOFR 1 Month Index + 0.810% 6.1665% 1/20/62 (c)(d)(m) | | 191,469 | 191,748 |
Series 2012-H06 Class FA, CME Term SOFR 1 Month Index + 0.740% 6.0965% 1/20/62 (c)(d)(m) | | 377,293 | 377,431 |
Series 2012-H07 Class FA, CME Term SOFR 1 Month Index + 0.740% 6.0965% 3/20/62 (c)(d)(m) | | 181,342 | 181,139 |
Series 2012-H21 Class DF, CME Term SOFR 1 Month Index + 0.760% 6.1165% 5/20/61 (c)(d)(m) | | 13,645 | 13,644 |
Series 2012-H23 Class WA, CME Term SOFR 1 Month Index + 0.630% 5.9865% 10/20/62 (c)(d)(m) | | 10,609 | 10,598 |
Series 2013-H07 Class BA, CME Term SOFR 1 Month Index + 0.360% 5.8265% 3/20/63 (c)(d)(m) | | 12,533 | 12,492 |
Series 2014-H03 Class FA, CME Term SOFR 1 Month Index + 0.710% 6.0665% 1/20/64 (c)(d)(m) | | 180,403 | 180,398 |
Series 2014-H05 Class FB, CME Term SOFR 1 Month Index + 0.710% 6.0665% 12/20/63 (c)(d)(m) | | 299,225 | 299,145 |
Series 2014-H11 Class BA, CME Term SOFR 1 Month Index + 0.610% 5.9665% 6/20/64 (c)(d)(m) | | 244,787 | 244,467 |
Series 2015-H13 Class FL, CME Term SOFR 1 Month Index + 0.390% 5.7465% 5/20/63 (c)(d)(m) | | 9,006 | 8,915 |
Series 2015-H19 Class FA, CME Term SOFR 1 Month Index + 0.310% 5.6665% 4/20/63 (c)(d)(m) | | 11,604 | 11,483 |
Series 2016-H20 Class FM, CME Term SOFR 1 Month Index + 0.510% 5.8665% 12/20/62 (c)(d)(m) | | 35,131 | 34,880 |
Series 2019-128 Class FH, CME Term SOFR 1 Month Index + 0.610% 5.5753% 10/20/49 (c)(d) | | 1,519,028 | 1,491,319 |
Series 2019-23 Class NF, CME Term SOFR 1 Month Index + 0.560% 5.5253% 2/20/49 (c)(d) | | 3,020,155 | 2,978,108 |
| planned amortization class: | | | |
Series 2011-136 Class WI, 4.5% 5/20/40 (j) | | 33,144 | 1,739 |
Series 2016-69 Class WA, 3% 2/20/46 | | 609,871 | 575,871 |
Series 2017-134 Class BA, 2.5% 11/20/46 | | 325,026 | 301,704 |
Series 2017-153 Class GA, 3% 9/20/47 | | 2,864,873 | 2,660,704 |
Series 2017-182 Class KA, 3% 10/20/47 | | 2,279,806 | 2,132,171 |
Series 2018-13 Class Q, 3% 4/20/47 | | 2,703,895 | 2,574,516 |
| sequential payer: | | | |
Series 2004-24 Class ZM, 5% 4/20/34 | | 327,755 | 328,127 |
Series 2010-160 Class DY, 4% 12/20/40 | | 2,712,239 | 2,681,494 |
Series 2010-170 Class B, 4% 12/20/40 | | 598,158 | 590,834 |
Series 2017-139 Class BA, 3% 9/20/47 | | 6,487,681 | 5,972,037 |
| Series 2004-32 Class GS, 6.380% - CME Term SOFR 1 Month Index 1.289% 5/16/34 (c)(j)(k) | | 67,339 | 5,220 |
| Series 2004-73 Class AL, 7.080% - CME Term SOFR 1 Month Index 1.989% 8/17/34 (c)(j)(k) | | 66,143 | 6,464 |
| Series 2007-35 Class SC, 39.510% x CME Term SOFR 1 Month Index 8.9341% 6/16/37 (c)(d)(k) | | 2,221 | 2,648 |
| Series 2010-116 Class QB, 4% 9/16/40 | | 199,176 | 193,336 |
| Series 2010-H10 Class FA, CME Term SOFR 1 Month Index + 0.440% 5.7205% 5/20/60 (c)(d)(m) | | 432,610 | 431,484 |
| Series 2011-94 Class SA, 5.980% - CME Term SOFR 1 Month Index 1.0247% 7/20/41 (c)(j)(k) | | 248,932 | 26,993 |
| Series 2013-149 Class MA, 2.5% 5/20/40 | | 1,426,316 | 1,396,587 |
| Series 2014-2 Class BA, 3% 1/20/44 | | 5,363,664 | 5,023,838 |
| Series 2014-21 Class HA, 3% 2/20/44 | | 2,000,210 | 1,886,623 |
| Series 2014-25 Class HC, 3% 2/20/44 | | 3,403,345 | 3,180,249 |
| Series 2014-5 Class A, 3% 1/20/44 | | 2,758,877 | 2,583,123 |
| Series 2015-H13 Class HA, 2.5% 8/20/64 (m) | | 15,985 | 15,485 |
| Series 2016-H13 Class FB, U.S. TREASURY 1 YEAR INDEX + 0.500% 5.15% 5/20/66 (c)(d)(m) | | 738,695 | 735,290 |
| Series 2017-186 Class HK, 3% 11/16/45 | | 2,924,939 | 2,746,408 |
| Series 2017-H06 Class FA, U.S. TREASURY 1 YEAR INDEX + 0.350% 5% 8/20/66 (c)(d)(m) | | 1,299,362 | 1,292,830 |
| Ginnie Mae REMIC Trust Series 2015-H17 Class GZ, 4.252% 5/20/65 (c)(m) | | 79,715 | 79,208 |
| Prpm 2024-Rcf4 LLC Series 2024-RCF4 Class A1, 4% 7/25/54 (b) | | 3,463,812 | 3,385,472 |
TOTAL U.S. GOVERNMENT AGENCY | | | 385,512,375 |
| TOTAL COLLATERALIZED MORTGAGE OBLIGATIONS (Cost $543,539,818) | | | 543,023,173 |
| | | | |
| Commercial Mortgage Securities - 6.3% |
| | | Principal Amount (a) | Value ($) |
| BAMLL Commercial Mortgage Securities Trust: | | | |
| floater Series 2022-DKLX: | | | |
Class A, CME Term SOFR 1 Month Index + 1.150% 6.247% 1/15/39 (b)(c)(d) | | 20,613,000 | 20,477,727 |
Class B, CME Term SOFR 1 Month Index + 1.550% 6.647% 1/15/39 (b)(c)(d) | | 3,893,000 | 3,850,420 |
Class C, CME Term SOFR 1 Month Index + 2.150% 7.247% 1/15/39 (b)(c)(d) | | 2,780,000 | 2,744,381 |
| sequential payer Series 2019-BPR: | | | |
Class AMP, 3.287% 11/5/32 (b) | | 38,000,000 | 36,767,215 |
Class ANM, 3.112% 11/5/32 (b) | | 17,278,000 | 16,069,390 |
| Series 2019-BPR: | | | |
Class BNM, 3.465% 11/5/32 (b) | | 3,878,000 | 3,344,916 |
Class CNM, 3.8425% 11/5/32 (b)(c) | | 1,604,000 | 1,166,933 |
| BANK: | | | |
| sequential payer: | | | |
Series 2017-BNK9 Class A4, 3.538% 11/15/54 | | 4,324,000 | 4,169,463 |
Series 2018-BN10: | | | |
| Class A4, 3.428% 2/15/61 | | 10,090,573 | 9,774,501 |
| Class A5, 3.688% 2/15/61 | | 20,569,000 | 20,043,135 |
Series 2018-BN14 Class A4, 4.231% 9/15/60 | | 30,445,000 | 30,213,524 |
Series 2019-BN21 Class A5, 2.851% 10/17/52 | | 2,858,000 | 2,619,076 |
Series 2019-BN23 Class ASB, 2.846% 12/15/52 | | 2,200,000 | 2,113,768 |
Series 2021-BN34 Class A4, 2.156% 6/15/63 | | 5,000,000 | 4,228,349 |
Series 2021-BN35 Class ASB, 2.067% 6/15/64 | | 7,200,000 | 6,567,618 |
Series 2023-5YR1 Class A3, 6.26% 4/15/56 | | 8,800,000 | 9,242,765 |
| Series 2020-BN25 Class XB, 0.5319% 1/15/63 (c)(j) | | 31,293,000 | 641,938 |
| Series 2021-BN33 Class XA, 1.1624% 5/15/64 (c)(j) | | 14,076,975 | 670,025 |
| BANK Trust sequential payer Series 2017-BNK5 Class ASB, 3.179% 6/15/60 | | 10,016,152 | 9,834,301 |
| Bank5 2023-5Yr3 sequential payer Series 2023-5YR3 Class A3, 6.724% 9/15/56 | | 8,000,000 | 8,602,198 |
| BBCMS Mortgage Trust sequential payer Series 2023-C21 Class A3, 6.5065% 9/15/56 (c) | | 17,797,000 | 19,411,512 |
| Benchmark 2024-V9 Mortgage Tru sequential payer Series 2024-V9 Class A3, 5.6019% 8/15/57 | | 19,000,000 | 19,751,448 |
| Benchmark Mortgage Trust: | | | |
| sequential payer: | | | |
Series 2018-B4 Class A5, 4.121% 7/15/51 | | 3,240,000 | 3,197,104 |
Series 2019-B10 Class A4, 3.717% 3/15/62 | | 2,700,000 | 2,613,457 |
Series 2023-V3 Class A3, 6.3629% 7/15/56 | | 8,400,000 | 8,901,399 |
| Series 2019-B14 Class XA, 0.8919% 12/15/62 (c)(j) | | 107,526,356 | 2,433,429 |
| Series 2020-B17 Class XA, 1.5345% 3/15/53 (c)(j) | | 109,288,283 | 4,726,150 |
| Series 2020-B18 Class XA, 1.9079% 7/15/53 (c)(j) | | 49,246,030 | 2,760,964 |
| BLP Commercial Mortgage Trust sequential payer Series 2024-IND2 Class A, CME Term SOFR 1 Month Index + 1.340% 6.4387% 3/15/41 (b)(c)(d) | | 16,705,000 | 16,652,797 |
| BMO Mortgage Trust sequential payer: | | | |
| Series 2022-C3 Class ASB, 5.5032% 9/15/54 (c) | | 6,607,000 | 6,888,695 |
| Series 2023-5C1 Class A3, 6.534% 8/15/56 | | 4,200,000 | 4,464,679 |
| BMP floater Series 2024-MF23: | | | |
| Class A, CME Term SOFR 1 Month Index + 1.370% 6.4685% 6/15/41 (b)(c)(d) | | 22,372,000 | 22,330,053 |
| Class B, CME Term SOFR 1 Month Index + 1.640% 6.7381% 6/15/41 (b)(c)(d) | | 11,045,000 | 11,010,484 |
| Class C, CME Term SOFR 1 Month Index + 1.840% 6.9378% 6/15/41 (b)(c)(d) | | 7,810,000 | 7,780,713 |
| BPR Trust floater Series 2022-OANA: | | | |
| Class A, CME Term SOFR 1 Month Index + 1.890% 6.9945% 4/15/37 (b)(c)(d) | | 76,026,000 | 76,263,581 |
| Class B, CME Term SOFR 1 Month Index + 2.440% 7.5435% 4/15/37 (b)(c)(d) | | 19,373,000 | 19,433,541 |
| BX Commercial Mortgage Trust: | | | |
| floater: | | | |
Series 2019-IMC: | | | |
| Class B, CME Term SOFR 1 Month Index + 1.340% 6.4433% 4/15/34 (b)(c)(d) | | 15,742,000 | 15,486,193 |
| Class C, CME Term SOFR 1 Month Index + 1.640% 6.7433% 4/15/34 (b)(c)(d) | | 10,407,000 | 10,231,382 |
| Class D, CME Term SOFR 1 Month Index + 1.940% 7.0433% 4/15/34 (b)(c)(d) | | 10,925,000 | 10,740,641 |
Series 2021-BXMF Class A, CME Term SOFR 1 Month Index + 0.750% 5.8474% 10/15/26 (b)(c)(d) | | 12,443,600 | 12,334,718 |
Series 2021-LBA Class AJV, CME Term SOFR 1 Month Index + 0.910% 6.0115% 2/15/36 (b)(c)(d) | | 7,697,069 | 7,660,989 |
Series 2021-PAC: | | | |
| Class A, CME Term SOFR 1 Month Index + 0.800% 5.9006% 10/15/36 (b)(c)(d) | | 49,523,000 | 49,074,198 |
| Class B, CME Term SOFR 1 Month Index + 1.010% 6.1103% 10/15/36 (b)(c)(d) | | 5,541,000 | 5,461,348 |
| Class C, CME Term SOFR 1 Month Index + 1.210% 6.3101% 10/15/36 (b)(c)(d) | | 7,417,000 | 7,289,520 |
| Class D, CME Term SOFR 1 Month Index + 1.410% 6.5098% 10/15/36 (b)(c)(d) | | 7,201,000 | 7,063,731 |
| Class E, CME Term SOFR 1 Month Index + 2.060% 7.159% 10/15/36 (b)(c)(d) | | 25,035,000 | 24,753,356 |
Series 2021-VINO Class A, CME Term SOFR 1 Month Index + 0.760% 5.8638% 5/15/38 (b)(c)(d) | | 22,421,568 | 22,295,447 |
Series 2022-IND Class A, CME Term SOFR 1 Month Index + 1.490% 6.5875% 4/15/37 (b)(c)(d) | | 28,419,970 | 28,411,089 |
Series 2022-LP2: | | | |
| Class A, CME Term SOFR 1 Month Index + 1.010% 6.1094% 2/15/39 (b)(c)(d) | | 31,833,230 | 31,654,168 |
| Class B, CME Term SOFR 1 Month Index + 1.310% 6.4088% 2/15/39 (b)(c)(d) | | 11,954,924 | 11,872,733 |
| Class C, CME Term SOFR 1 Month Index + 1.560% 6.6582% 2/15/39 (b)(c)(d) | | 11,954,924 | 11,865,262 |
| Class D, CME Term SOFR 1 Month Index + 1.960% 7.0573% 2/15/39 (b)(c)(d) | | 11,954,924 | 11,857,790 |
Series 2023-XL3: | | | |
| Class A, CME Term SOFR 1 Month Index + 1.760% 6.8579% 12/9/40 (b)(c)(d) | | 19,906,218 | 19,968,425 |
| Class B, CME Term SOFR 1 Month Index + 2.190% 7.2873% 12/9/40 (b)(c)(d) | | 5,395,802 | 5,399,174 |
| Class C, CME Term SOFR 1 Month Index + 2.640% 7.7367% 12/9/40 (b)(c)(d) | | 2,384,192 | 2,384,937 |
| floater sequential payer: | | | |
Series 2019-CALM Class A, CME Term SOFR 1 Month Index + 0.990% 6.0875% 11/15/32 (b)(c)(d) | | 1,291,448 | 1,291,045 |
Series 2019-IMC Class A, CME Term SOFR 1 Month Index + 1.040% 6.1433% 4/15/34 (b)(c)(d) | | 14,082,756 | 13,924,325 |
Series 2021-SOAR Class A, CME Term SOFR 1 Month Index + 0.780% 5.8815% 6/15/38 (b)(c)(d) | | 5,874,143 | 5,837,430 |
Series 2024-XL5 Class A, CME Term SOFR 1 Month Index + 1.390% 6.4882% 3/15/41 (b)(c)(d) | | 91,742,988 | 91,748,483 |
| BX Commercial Mortgage Trust 2024-Xl4: | | | |
| floater: | | | |
Series 2024-XL4 Class B, CME Term SOFR 1 Month Index + 1.790% 6.8881% 2/15/39 (b)(c)(d) | | 4,785,202 | 4,774,735 |
Series 2024-XL5: | | | |
| Class B, CME Term SOFR 1 Month Index + 1.690% 6.7877% 3/15/41 (b)(c)(d) | | 14,836,535 | 14,771,625 |
| Class C, CME Term SOFR 1 Month Index + 1.940% 7.0374% 3/15/41 (b)(c)(d) | | 19,696,987 | 19,610,813 |
| floater sequential payer Series 2024-XL4 Class A, CME Term SOFR 1 Month Index + 1.440% 6.5385% 2/15/39 (b)(c)(d) | | 38,268,011 | 38,268,011 |
| BX Commercial Mtg Trust floater Series 2024-MDHS Class A, 6.7378% 5/15/41 (b)(c) | | 48,896,460 | 48,957,581 |
| BX Trust floater: | | | |
| Series 2022-GPA Class A, CME Term SOFR 1 Month Index + 2.160% 7.2615% 8/15/39 (b)(c)(d) | | 20,319,336 | 20,319,336 |
| Series 2022-IND: | | | |
Class B, CME Term SOFR 1 Month Index + 1.940% 7.0365% 4/15/37 (b)(c)(d) | | 14,487,421 | 14,478,366 |
Class C, CME Term SOFR 1 Month Index + 2.290% 7.3865% 4/15/37 (b)(c)(d) | | 3,269,183 | 3,269,183 |
Class D, CME Term SOFR 1 Month Index + 2.830% 7.9355% 4/15/37 (b)(c)(d) | | 2,737,461 | 2,737,461 |
| Series 2024-CNYN: | | | |
Class A, CME Term SOFR 1 Month Index + 1.440% 6.5384% 4/15/41 (b)(c)(d) | | 59,305,883 | 59,250,284 |
Class B, CME Term SOFR 1 Month Index + 1.690% 6.788% 4/15/41 (b)(c)(d) | | 9,451,594 | 9,422,058 |
Class C, CME Term SOFR 1 Month Index + 1.940% 7.0377% 4/15/41 (b)(c)(d) | | 7,847,315 | 7,822,793 |
| CAMB Commercial Mortgage Trust floater Series 2019-LIFE Class A, CME Term SOFR 1 Month Index + 1.360% 6.464% 12/15/37 (b)(c)(d) | | 11,218,000 | 11,210,989 |
| CD Mortgage Trust sequential payer Series 2017-CD5 Class A3, 3.171% 8/15/50 | | 14,100,000 | 13,567,033 |
| CF Hippolyta Issuer LLC sequential payer: | | | |
| Series 2020-1: | | | |
Class A1, 1.69% 7/15/60 (b) | | 64,636,420 | 62,542,956 |
Class A2, 1.99% 7/15/60 (b) | | 24,935,790 | 22,596,666 |
| Series 2021-1A Class A1, 1.53% 3/15/61 (b) | | 46,851,895 | 44,014,910 |
| Citigroup Commercial Mortgage Trust: | | | |
| Series 2015-GC27 Class A5, 3.137% 2/10/48 | | 7,844,653 | 7,814,972 |
| Series 2019-GC41 Class XA, 1.161% 8/10/56 (c)(j) | | 47,965,361 | 1,745,599 |
| Citigroup Commercial Mtg Trust 2018-C6 sequential payer Series 2018-C6 Class A3, 4.145% 11/10/51 | | 1,000,000 | 965,766 |
| COMM Mortgage Trust sequential payer: | | | |
| Series 2015 LC19 Class A3, 2.922% 2/10/48 | | 12,461,288 | 12,443,593 |
| Series 2015-DC1 Class A4, 3.078% 2/10/48 | | 22,432,114 | 22,379,872 |
| Computershare Corporate Trust Series 2018-C48 Class A5, 4.302% 1/15/52 | | 13,797,000 | 13,650,625 |
| Credit Suisse Mortgage Trust sequential payer Series 2020-NET Class A, 2.2569% 8/15/37 (b) | | 4,634,595 | 4,466,569 |
| CSAIL Commercial Mortgage Trust sequential payer Series 2015-C4 Class A3, 3.5438% 11/15/48 | | 3,179,799 | 3,144,524 |
| DTP Commercial Mortgage Trust 2023-Ste2 sequential payer Series 2023-STE2 Class A, 6.038% 1/15/41 (b)(c) | | 7,693,000 | 7,885,502 |
| ELP Commercial Mortgage Trust floater Series 2021-ELP: | | | |
| Class A, CME Term SOFR 1 Month Index + 0.810% 5.9125% 11/15/38 (b)(c)(d) | | 51,777,731 | 51,357,037 |
| Class B, CME Term SOFR 1 Month Index + 1.230% 6.3317% 11/15/38 (b)(c)(d) | | 19,941,788 | 19,854,022 |
| EQT Trust sequential payer Series 2024-EXTR Class A, 5.3308% 7/5/41 (b)(c) | | 21,183,000 | 21,673,916 |
| Extended Stay America Trust floater Series 2021-ESH: | | | |
| Class A, CME Term SOFR 1 Month Index + 1.190% 6.2915% 7/15/38 (b)(c)(d) | | 11,611,973 | 11,597,458 |
| Class B, CME Term SOFR 1 Month Index + 1.490% 6.5915% 7/15/38 (b)(c)(d) | | 8,450,579 | 8,432,094 |
| Class C, CME Term SOFR 1 Month Index + 1.810% 6.9115% 7/15/38 (b)(c)(d) | | 6,230,119 | 6,216,491 |
| Class D, CME Term SOFR 1 Month Index + 2.360% 7.4615% 7/15/38 (b)(c)(d) | | 12,598,349 | 12,622,691 |
| Freddie Mac: | | | |
| sequential payer: | | | |
Series 2015-K049 Class A2, 3.01% 7/25/25 | | 3,145,363 | 3,107,136 |
Series 2016-K054 Class A2, 2.745% 1/25/26 | | 14,550,957 | 14,279,376 |
Series 2017-K070 Class A2, 3.303% 11/25/27 | | 13,300,000 | 13,063,755 |
Series 2018-K074 Class A2, 3.6% 1/25/28 | | 23,600,000 | 23,357,729 |
Series 2018-K731 Class A2, 3.6% 2/25/25 | | 5,171,976 | 5,143,139 |
Series 2019-K098 Class A2, 2.425% 8/25/29 | | 3,500,000 | 3,263,364 |
Series 2020-K740 Class A2, 1.47% 9/25/27 | | 13,400,000 | 12,473,121 |
Series 2022-K750 Class A2, 3% 9/25/29 | | 31,300,000 | 29,948,259 |
Series 2023-K751 Class A2, 4.412% 3/25/30 | | 10,600,000 | 10,765,325 |
Series 2023-K752 Class A2, 4.284% 7/25/30 | | 22,495,000 | 22,692,117 |
Series 2024-K517 Class A2, 5.355% 1/25/29 | | 39,500,000 | 41,414,972 |
Series K069 Class A2, 3.187% 9/25/27 | | 8,968,405 | 8,776,542 |
Series K071 Class A2, 3.286% 11/25/27 | | 18,600,000 | 18,253,627 |
Series K072 Class A2, 3.444% 12/25/27 | | 6,100,000 | 6,012,758 |
Series K073 Class A2, 3.35% 1/25/28 | | 15,200,000 | 14,937,999 |
| Series 2017-K068 Class A2, 3.244% 8/25/27 | | 6,000,000 | 5,887,855 |
| Series 2018-K075 Class A2, 3.65% 2/25/28 | | 42,000,000 | 41,607,796 |
| Series 2018-K081 Class A2, 3.9% 8/25/28 | | 5,000,000 | 4,985,023 |
| Series 2022 K748 Class A2, 2.26% 1/25/29 | | 54,100,000 | 50,458,248 |
| Series K047 Class A2, 3.329% 5/25/25 | | 23,431,593 | 23,223,668 |
| Series K076 Class A2, 3.9% 4/25/28 | | 6,900,000 | 6,886,662 |
| Series K077 Class A2, 3.85% 5/25/28 | | 22,800,000 | 22,696,499 |
| Series K084 Class A2, 3.78% 10/25/28 | | 6,000,000 | 5,955,617 |
| Freddie Mac Multiclass Mortgage participation certificates Series K044 Class A2, 2.811% 1/25/25 | | 13,471,388 | 13,383,503 |
| GS Mortgage Securities Trust: | | | |
| floater: | | | |
Series 2018-3PCK Class A, CME Term SOFR 1 Month Index + 2.060% 7.1615% 9/15/31 (b)(c)(d) | | 4,977,334 | 4,952,661 |
Series 2021-IP: | | | |
| Class A, CME Term SOFR 1 Month Index + 1.060% 6.1615% 10/15/36 (b)(c)(d) | | 21,765,000 | 21,578,890 |
| Class B, CME Term SOFR 1 Month Index + 1.260% 6.3615% 10/15/36 (b)(c)(d) | | 3,364,000 | 3,302,689 |
| Class C, CME Term SOFR 1 Month Index + 1.660% 6.7615% 10/15/36 (b)(c)(d) | | 2,773,000 | 2,725,333 |
| sequential payer: | | | |
Series 2017-GS6 Class A2, 3.164% 5/10/50 | | 2,679,224 | 2,577,096 |
Series 2017-GS8 Class AAB, 3.313% 11/10/50 | | 7,604,971 | 7,481,993 |
Series 2018-GS10: | | | |
| Class A5, 4.155% 7/10/51 | | 4,160,000 | 4,056,128 |
| Class AAB, 4.106% 7/10/51 | | 1,110,936 | 1,105,756 |
Series 2019-GC38 Class A3, 3.703% 2/10/52 | | 1,100,000 | 1,065,347 |
Series 2019-GSA1 Class A4, 3.0479% 11/10/52 | | 6,943,770 | 6,505,110 |
Series 2020-GC45 Class AAB, 2.8428% 2/13/53 | | 4,750,000 | 4,551,579 |
| Series 2011-GC5 Class A/S, 5.209% 8/10/44 (b)(c) | | 3,323,907 | 3,179,045 |
| Intown Mortgage Trust floater sequential payer Series 2022-STAY Class A, CME Term SOFR 1 Month Index + 2.480% 7.5856% 8/15/39 (b)(c)(d) | | 54,074,000 | 54,209,185 |
| J.P. Morgan Chase Commercial Mortgage Securities Trust floater Series 2012-NLP Class A, CME Term SOFR 1 Month Index + 0.590% 5.693% 4/15/37 (b)(c)(d) | | 13,375,030 | 13,007,217 |
| JPMCC Commercial Mortgage Securities Trust sequential payer Series 2016 JP4 Class A3, 3.3928% 12/15/49 | | 13,946,510 | 13,633,506 |
| Jpmcc Commercial Mortgage Security sequential payer Series 2017-JP6 Class ASB, 3.2829% 7/15/50 | | 1,833,722 | 1,807,383 |
| JPMorgan Chase Commercial Mortgage Securities Trust: | | | |
| floater Series 2019-BKWD Class A, CME Term SOFR 1 Month Index + 1.610% 6.7115% 9/15/29 (b)(c)(d) | | 5,557,878 | 5,196,618 |
| Series 2018-WPT: | | | |
Class CFX, 4.9498% 7/5/33 (b) | | 3,450,000 | 2,661,329 |
Class DFX, 5.3503% 7/5/33 (b) | | 5,907,000 | 4,273,713 |
| Ksl Commercial Mtg Trust 2023-Ht floater Series 2023-HT Class A, CME Term SOFR 1 Month Index + 2.290% 7.3867% 12/15/36 (b)(c)(d) | | 8,300,000 | 8,320,750 |
| Life Financial Services Trust floater Series 2022-BMR2: | | | |
| Class A1, CME Term SOFR 1 Month Index + 1.290% 6.3918% 5/15/39 (b)(c)(d) | | 57,498,000 | 55,916,805 |
| Class B, CME Term SOFR 1 Month Index + 1.790% 6.8904% 5/15/39 (b)(c)(d) | | 33,561,000 | 31,977,340 |
| Class C, CME Term SOFR 1 Month Index + 2.090% 7.1896% 5/15/39 (b)(c)(d) | | 19,262,000 | 18,202,590 |
| Class D, CME Term SOFR 1 Month Index + 2.540% 7.6384% 5/15/39 (b)(c)(d) | | 17,119,000 | 15,916,308 |
| LIFE Mortgage Trust floater Series 2021-BMR: | | | |
| Class A, CME Term SOFR 1 Month Index + 0.810% 5.9115% 3/15/38 (b)(c)(d) | | 18,998,737 | 18,692,077 |
| Class B, CME Term SOFR 1 Month Index + 0.990% 6.0915% 3/15/38 (b)(c)(d) | | 5,915,988 | 5,813,151 |
| Class C, CME Term SOFR 1 Month Index + 1.210% 6.3115% 3/15/38 (b)(c)(d) | | 3,722,179 | 3,652,854 |
| Class D, CME Term SOFR 1 Month Index + 1.510% 6.6115% 3/15/38 (b)(c)(d) | | 5,177,580 | 5,074,717 |
| Class E, CME Term SOFR 1 Month Index + 1.860% 6.9615% 3/15/38 (b)(c)(d) | | 4,523,244 | 4,388,443 |
| MHP Commercial Mortgage Trust floater Series 2021-STOR Class A, CME Term SOFR 1 Month Index + 0.810% 5.9115% 7/15/38 (b)(c)(d) | | 22,147,000 | 21,980,898 |
| Morgan Stanley BAML Trust sequential payer Series 2016-C28 Class A3, 3.272% 1/15/49 | | 25,898,504 | 25,482,326 |
| Morgan Stanley Capital I Trust: | | | |
| sequential payer Series 2019-MEAD Class A, 3.17% 11/10/36 (b) | | 42,970,000 | 41,906,836 |
| Series 2018-H4 Class A4, 4.31% 12/15/51 | | 11,843,000 | 11,657,517 |
| Series 2019-MEAD: | | | |
Class B, 3.283% 11/10/36 (b)(c) | | 5,415,000 | 5,217,279 |
Class C, 3.283% 11/10/36 (b)(c) | | 5,196,000 | 4,928,316 |
| Series 2021-L6 Class XA, 1.2895% 6/15/54 (c)(j) | | 47,025,723 | 2,348,940 |
| Morgan Stanley Capital I Trust 2024-N sequential payer Series 2024-NSTB Class A, 3.9% 7/20/32 (b)(c) | | 18,700,000 | 18,130,110 |
| MSWF Commercial Mortgage Trust Series 2023-2 Class XD, 3.2521% 12/15/56 (b)(c)(j) | | 8,200,000 | 1,706,450 |
| OPEN Trust sequential payer Series 2023-AIR: | | | |
| Class A, CME Term SOFR 1 Month Index + 3.080% 8.1856% 10/15/28 (b)(c)(d) | | 20,180,426 | 20,369,618 |
| Class B, CME Term SOFR 1 Month Index + 3.830% 9.1749% 10/15/28 (b)(c)(d) | | 12,159,841 | 12,251,040 |
| Providence Place Group Ltd. Partnership Series 2000-C1 Class A2, 7.75% 7/20/28 (b) | | 365,408 | 376,506 |
| RLGH Trust floater Series 2021-TROT Class A, CME Term SOFR 1 Month Index + 0.910% 6.0115% 4/15/36 (b)(c)(d) | | 12,400,000 | 12,296,128 |
| SPGN Mortgage Trust floater Series 2022-TFLM: | | | |
| Class B, CME Term SOFR 1 Month Index + 2.000% 7.0965% 2/15/39 (b)(c)(d) | | 9,333,000 | 9,146,340 |
| Class C, CME Term SOFR 1 Month Index + 2.650% 7.7465% 2/15/39 (b)(c)(d) | | 4,854,000 | 4,723,549 |
| SREIT Trust floater: | | | |
| Series 2021-FLWR Class A, CME Term SOFR 1 Month Index + 0.690% 5.788% 7/15/36 (b)(c)(d) | | 16,700,000 | 16,616,500 |
| Series 2021-MFP: | | | |
Class A, CME Term SOFR 1 Month Index + 0.840% 5.9418% 11/15/38 (b)(c)(d) | | 38,518,516 | 38,325,923 |
Class B, CME Term SOFR 1 Month Index + 1.190% 6.2908% 11/15/38 (b)(c)(d) | | 27,730,843 | 27,522,862 |
Class C, CME Term SOFR 1 Month Index + 1.440% 6.54% 11/15/38 (b)(c)(d) | | 12,001,932 | 11,896,915 |
Class D, CME Term SOFR 1 Month Index + 1.690% 6.7892% 11/15/38 (b)(c)(d) | | 7,887,421 | 7,818,406 |
| UBS Commercial Mortgage Trust sequential payer Series 2018-C9 Class A4, 4.117% 3/15/51 | | 2,800,000 | 2,735,932 |
| Ubs Commercial Mtg Trust 2017-C6 sequential payer Series 2017-C6 Class A5, 3.5795% 12/15/50 | | 7,045,000 | 6,781,786 |
| VLS Commercial Mortgage Trust: | | | |
| sequential payer Series 2020-LAB Class A, 2.13% 10/10/42 (b) | | 29,470,000 | 24,324,833 |
| Series 2020-LAB: | | | |
Class B, 2.453% 10/10/42 (b) | | 1,400,000 | 1,127,071 |
Class X, 0.5162% 10/10/42 (b)(c)(j) | | 40,100,000 | 869,857 |
| Wells Fargo Commercial Mortage Trust 20 floater Series 2024-MGP: | | | |
| Class A11, CME Term SOFR 1 Month Index + 1.990% 7.3407% 8/15/41 (b)(c)(d) | | 7,800,000 | 7,796,787 |
| Class A12, CME Term SOFR 1 Month Index + 1.690% 7.0412% 8/15/41 (b)(c)(d) | | 22,500,000 | 22,491,097 |
| Wells Fargo Commercial Mortgage Trust: | | | |
| floater: | | | |
Series 2016-C35 Class A4FL, CME Term SOFR 1 Month Index + 1.160% 6.2472% 7/15/48 (b)(c)(d) | | 8,500,000 | 8,495,725 |
Series 2021-FCMT Class A, CME Term SOFR 1 Month Index + 1.310% 6.4115% 5/15/31 (b)(c)(d) | | 19,889,000 | 19,441,498 |
| sequential payer: | | | |
Series 2015-C26 Class A4, 3.166% 2/15/48 | | 16,246,000 | 16,137,366 |
Series 2016-LC25 Class A3, 3.374% 12/15/59 | | 8,922,099 | 8,718,030 |
Series 2018-C46 Class A4, 4.152% 8/15/51 | | 1,115,000 | 1,088,713 |
Series 2024-5C1 Class A3, 5.928% 7/15/57 | | 8,000,000 | 8,435,411 |
| Series 2018-C46 Class XA, 1.0767% 8/15/51 (c)(j) | | 40,520,378 | 916,271 |
| Wells Fargo Commercial Mtg Trust sequential payer Series 2016-C37, Class A4, 3.525% 12/15/49 | | 6,585,998 | 6,447,012 |
| TOTAL COMMERCIAL MORTGAGE SECURITIES (Cost $2,617,126,924) | | | 2,593,143,115 |
| | | | |
| Municipal Securities - 0.1% |
| | | Principal Amount (a) | Value ($) |
New Jersey Econ. Dev. Auth. State Pension Fdg. Rev. Series 1997, 7.425% 2/15/29 (Nat'l. Pub. Fin. Guarantee Corp. Insured) (Cost $37,195,409) | | 32,466,000 | 35,059,611 |
| | | | |
| Foreign Government and Government Agency Obligations - 0.2% |
| | | Principal Amount (a) | Value ($) |
| Colombian Republic: | | | |
| 8% 11/14/35 | | 10,685,000 | 11,374,183 |
| 8.75% 11/14/53 | | 14,370,000 | 15,729,833 |
| Panamanian Republic 3.298% 1/19/33 | | 50,825,000 | 42,362,638 |
| TOTAL FOREIGN GOVERNMENT AND GOVERNMENT AGENCY OBLIGATIONS (Cost $77,180,287) | | | 69,466,654 |
| | | | |
| Bank Notes - 0.1% |
| | | Principal Amount (a) | Value ($) |
| Discover Bank ICE IBA - USD SOFR SPREAD-ADJ + 1.730% 5.974% 8/9/28 (c)(d) | | 23,162,000 | 23,917,504 |
| KeyBank NA 6.95% 2/1/28 | | 850,000 | 900,644 |
| Regions Bank 6.45% 6/26/37 | | 30,566,000 | 32,882,398 |
| TOTAL BANK NOTES (Cost $58,335,669) | | | 57,700,546 |
| | | | |
| Money Market Funds - 0.8% |
| | | Shares | Value ($) |
Fidelity Cash Central Fund 4.89% (n) (Cost $322,794,482) | | 322,730,525 | 322,795,071 |
| | | | |
| Purchased Swaptions - 0.1% |
| | Expiration Date | Notional Amount (a) | Value ($) |
| Put Options - 0.0% | | | | |
| Option on an interest rate swap with Bank of America N.A. to pay annually a fixed rate of 3.14% and receive annually a floating rate based on the U.S. Secured Overnight Fin. Rate (SOFR) Index, expiring September 2035. | 9/12/25 | | 52,300,000 | 1,971,274 |
| Option on an interest rate swap with Bank of America N.A. to pay annually a fixed rate of 3.7375% and receive annually a floating rate based on the U.S. Secured Overnight Fin. Rate (SOFR) Index, expiring February 2035. | 2/26/25 | | 50,000,000 | 415,311 |
| Option on an interest rate swap with Bank of America N.A. to pay annually a fixed rate of 4.05% and receive annually a floating rate based on the U.S. Secured Overnight Fin. Rate (SOFR) Index, expiring April 2034. | 4/23/29 | | 60,200,000 | 1,644,088 |
| Option on an interest rate swap with Citibank N.A. to pay annually a fixed rate of 3.755% and receive annually a floating rate based on the U.S. Secured Overnight Fin. Rate (SOFR) Index, expiring March 2034. | 3/19/29 | | 35,100,000 | 1,078,650 |
| Option on an interest rate swap with Citibank N.A. to pay annually a fixed rate of 3.778% and receive annually a floating rate based on the U.S. Secured Overnight Fin. Rate (SOFR) Index, expiring February 2035. | 2/24/25 | | 82,200,000 | 618,464 |
| Option on an interest rate swap with Goldman Sachs Bank U.S.A. to pay annually a fixed rate of 3.1415% and receive annually a floating rate based on the U.S. Secured Overnight Fin. Rate (SOFR) Index, expiring September 2035. | 9/15/25 | | 24,000,000 | 906,185 |
| Option on an interest rate swap with Goldman Sachs Bank U.S.A. to pay annually a fixed rate of 3.386% and receive annually a floating rate based on the U.S. Secured Overnight Fin. Rate (SOFR) Index, expiring August 2035. | 8/18/25 | | 34,900,000 | 934,302 |
| Option on an interest rate swap with Goldman Sachs Bank U.S.A. to pay annually a fixed rate of 3.53% and receive annually a floating rate based on the U.S. Secured Overnight Fin. Rate (SOFR) Index, expiring August 2034. | 8/01/29 | | 51,500,000 | 1,825,264 |
| | | | | |
| TOTAL PUT OPTIONS | | | | 9,393,538 |
| Call Options - 0.1% | | | | |
| Option on an interest rate swap with Bank of America N.A. to receive annually a fixed rate of 3.14% and pay annually a floating rate based on the U.S. Secured Overnight Fin. Rate (SOFR) Index, expiring September 2035. | 9/12/25 | | 52,300,000 | 1,392,771 |
| Option on an interest rate swap with Bank of America N.A. to receive annually a fixed rate of 3.7375% and pay annually a floating rate based on the U.S. Secured Overnight Fin. Rate (SOFR) Index, expiring February 2035. | 2/26/25 | | 50,000,000 | 2,379,628 |
| Option on an interest rate swap with Bank of America N.A. to receive annually a fixed rate of 4.05% and pay annually a floating rate based on the U.S. Secured Overnight Fin. Rate (SOFR) Index, expiring April 2034. | 4/23/29 | | 60,200,000 | 3,289,761 |
| Option on an interest rate swap with Citibank N.A. to receive annually a fixed rate of 3.755% and pay annually a floating rate based on the U.S. Secured Overnight Fin. Rate (SOFR) Index, expiring March 2034. | 3/19/29 | | 35,100,000 | 1,637,696 |
| Option on an interest rate swap with Citibank N.A. to receive annually a fixed rate of 3.778% and pay annually a floating rate based on the U.S. Secured Overnight Fin. Rate (SOFR) Index, expiring February 2035. | 2/24/25 | | 82,200,000 | 4,126,064 |
| Option on an interest rate swap with Goldman Sachs Bank U.S.A. to receive annually a fixed rate of 3.1415% and pay annually a floating rate based on the U.S. Secured Overnight Fin. Rate (SOFR) Index, expiring September 2035. | 9/15/25 | | 24,000,000 | 643,711 |
| Option on an interest rate swap with Goldman Sachs Bank U.S.A. to receive annually a fixed rate of 3.386% and pay annually a floating rate based on the U.S. Secured Overnight Fin. Rate (SOFR) Index, expiring August 2035. | 8/18/25 | | 34,900,000 | 1,266,155 |
| Option on an interest rate swap with Goldman Sachs Bank U.S.A. to receive annually a fixed rate of 3.53% and pay annually a floating rate based on the U.S. Secured Overnight Fin. Rate (SOFR) Index, expiring August 2034. | 8/01/29 | | 51,500,000 | 2,126,666 |
| | | | | |
| TOTAL CALL OPTIONS | | | | 16,862,452 |
TOTAL PURCHASED SWAPTIONS (Cost $29,048,620) | | | | 26,255,990 |
| TOTAL INVESTMENT IN SECURITIES - 113.5% (Cost $47,961,551,759) | 46,557,822,664 |
NET OTHER ASSETS (LIABILITIES) - (13.5)% | (5,554,520,239) |
| NET ASSETS - 100.0% | 41,003,302,425 |
| | |
| TBA Sale Commitments |
| | Principal Amount (a) | Value ($) |
| Ginnie Mae | | |
| Ginnie Mae 2% 10/1/54 | (312,800,000) | (265,139,223) |
| Ginnie Mae 3% 10/1/54 | (139,550,000) | (127,265,707) |
| Ginnie Mae 3.5% 10/1/54 | (99,000,000) | (93,058,248) |
| Ginnie Mae 5% 10/1/54 | (35,600,000) | (35,665,650) |
| Ginnie Mae 5.5% 10/1/54 | (72,150,000) | (72,848,816) |
| Ginnie Mae 6% 10/1/54 | (139,050,000) | (141,384,232) |
| 2.5% 10/1/54 | (167,250,000) | (147,319,771) |
| 4% 10/1/54 | (70,200,000) | (67,873,656) |
| 4.5% 10/1/54 | (39,250,000) | (38,750,120) |
| | | |
| TOTAL GINNIE MAE | | (989,305,423) |
| | | |
| Uniform Mortgage Backed Securities | | |
| 1.5% 10/1/54 | (59,700,000) | (47,164,110) |
| 1.5% 10/1/54 | (36,675,000) | (28,973,932) |
| 4% 10/1/54 | (57,500,000) | (55,220,217) |
| 4% 10/1/54 | (100,000,000) | (96,035,160) |
| 4.5% 11/1/54 | (18,300,000) | (17,991,188) |
| 5% 10/1/39 | (52,200,000) | (52,854,541) |
| Uniform Mortgage Backed Securities 2% 10/1/39 | (10,700,000) | (9,790,918) |
| Uniform Mortgage Backed Securities 2% 10/1/54 | (24,800,000) | (20,506,500) |
| Uniform Mortgage Backed Securities 2% 10/1/54 | (210,850,000) | (174,346,594) |
| Uniform Mortgage Backed Securities 2% 10/1/54 | (159,150,000) | (131,597,156) |
| Uniform Mortgage Backed Securities 2% 10/1/54 | (200,000,000) | (165,375,000) |
| Uniform Mortgage Backed Securities 2% 10/1/54 | (135,400,000) | (111,958,875) |
| Uniform Mortgage Backed Securities 2% 10/1/54 | (250,000,000) | (206,718,750) |
| Uniform Mortgage Backed Securities 2% 10/1/54 | (190,000,000) | (157,106,250) |
| Uniform Mortgage Backed Securities 2% 11/1/54 | (307,400,000) | (254,541,617) |
| Uniform Mortgage Backed Securities 2.5% 10/1/54 | (1,925,000) | (1,661,140) |
| Uniform Mortgage Backed Securities 2.5% 10/1/54 | (30,525,000) | (26,340,929) |
| Uniform Mortgage Backed Securities 2.5% 10/1/54 | (17,475,000) | (15,079,697) |
| Uniform Mortgage Backed Securities 2.5% 10/1/54 | (13,600,000) | (11,735,844) |
| Uniform Mortgage Backed Securities 2.5% 10/1/54 | (21,925,000) | (18,919,734) |
| Uniform Mortgage Backed Securities 2.5% 10/1/54 | (8,200,000) | (7,076,024) |
| Uniform Mortgage Backed Securities 3% 10/1/54 | (5,300,000) | (4,756,750) |
| Uniform Mortgage Backed Securities 3% 10/1/54 | (6,800,000) | (6,103,000) |
| Uniform Mortgage Backed Securities 3% 10/1/54 | (13,600,000) | (12,206,000) |
| Uniform Mortgage Backed Securities 3% 10/1/54 | (19,200,000) | (17,232,000) |
| Uniform Mortgage Backed Securities 3% 10/1/54 | (35,450,000) | (31,816,375) |
| Uniform Mortgage Backed Securities 3.5% 10/1/54 | (51,150,000) | (47,647,422) |
| Uniform Mortgage Backed Securities 3.5% 10/1/54 | (63,300,000) | (58,965,431) |
| Uniform Mortgage Backed Securities 3.5% 10/1/54 | (56,950,000) | (53,050,258) |
| Uniform Mortgage Backed Securities 3.5% 10/1/54 | (56,950,000) | (53,050,258) |
| Uniform Mortgage Backed Securities 3.5% 10/1/54 | (23,800,000) | (22,170,257) |
| Uniform Mortgage Backed Securities 4.5% 10/1/54 | (18,300,000) | (17,990,472) |
| Uniform Mortgage Backed Securities 4.5% 10/1/54 | (18,300,000) | (17,990,472) |
| Uniform Mortgage Backed Securities 4.5% 10/1/54 | (29,475,000) | (28,976,457) |
| Uniform Mortgage Backed Securities 6% 10/1/54 | (109,700,000) | (112,103,977) |
| | | |
| TOTAL UNIFORM MORTGAGE BACKED SECURITIES | | (2,095,053,305) |
| | | |
TOTAL TBA SALE COMMITMENTS (Proceeds $3,100,246,127) | | (3,084,358,728) |
| Futures Contracts |
| | Number of contracts | Expiration Date | Notional Amount ($) | Value ($) | Unrealized Appreciation/ (Depreciation) ($) |
| Purchased | | | | | |
| | | | | | |
| Treasury Contracts | | | | | |
| CBOT 10-Year U.S. Treasury Note Contracts (United States) | 875 | Dec 2024 | 99,996,094 | (473,142) | (473,142) |
| CBOT Long Term U.S. Treasury Bond Contracts (United States) | 1,386 | Dec 2024 | 172,123,875 | (1,966,837) | (1,966,837) |
| CBOT Ultra Long Term U.S. Treasury Bond Contracts (United States) | 74 | Dec 2024 | 9,848,938 | (158,727) | (158,727) |
| | | | | | |
| TOTAL PURCHASED | | | | | (2,598,706) |
| | | | | | |
| Sold | | | | | |
| | | | | | |
| Treasury Contracts | | | | | |
| CBOT 2-Year U.S. Treasury Note Contracts (United States) | 576 | Dec 2024 | 119,947,500 | 271,105 | 271,105 |
| CBOT 5-Year U.S. Treasury Note Contracts (United States) | 227 | Dec 2024 | 24,943,398 | 49,104 | 49,104 |
| | | | | | |
| TOTAL SOLD | | | | | 320,209 |
| | | | | | |
| TOTAL FUTURES CONTRACTS | | | | | (2,278,497) |
| The notional amount of futures purchased as a percentage of Net Assets is 0.7% |
| The notional amount of futures sold as a percentage of Net Assets is 0.4% |
| Credit Default Swaps |
| Underlying Reference | Rating(1) | Maturity Date | Clearinghouse / Counterparty | Fixed Payment Received/ (Paid) | Payment Frequency | Notional Amount(2)(3) | Value ($)(1) | Upfront Premium Received/ (Paid) ($) | Unrealized Appreciation/ (Depreciation) ($) |
| Buy Protection | | | | | | | | | | |
| CMBX N.A. AAA Index Series 13 | | Dec 2072 | Citigroup Global Markets Ltd. | (0.5%) | Monthly | | 17,690,000 | 83,311 | (157,491) | (74,180) |
| CMBX N.A. AAA Index Series 13 | | Dec 2072 | Citigroup Global Markets Ltd. | (0.5%) | Monthly | | 10,070,000 | 47,425 | (107,396) | (59,971) |
| CMBX N.A. AAA Index Series 13 | | Dec 2072 | Morgan Stanley Capital Services LLC | (0.5%) | Monthly | | 13,100,000 | 61,694 | (208,077) | (146,383) |
| CMBX N.A. AAA Index Series 13 | | Dec 2072 | Morgan Stanley Capital Services LLC | (0.5%) | Monthly | | 16,000,000 | 75,352 | (105,937) | (30,585) |
| CMBX N.A. BBB Index Series 15 | | Nov 2064 | Citigroup Global Markets Ltd. | (3%) | Monthly | | 600,000 | 91,401 | (90,238) | 1,163 |
| CMBX N.A. BBB- Index Series 16 | | Apr 2065 | Citigroup Global Markets Ltd. | (3%) | Monthly | | 2,000,000 | 309,977 | (442,919) | (132,942) |
| CMBX N.A. BBB- Index Series 16 | | Apr 2065 | Citigroup Global Markets Ltd. | (3%) | Monthly | | 2,420,000 | 375,073 | (660,109) | (285,036) |
| CMBX N.A. BBB- Index Series 16 | | Apr 2065 | Citigroup Global Markets Ltd. | (3%) | Monthly | | 1,240,000 | 192,186 | (323,674) | (131,488) |
| CMBX N.A. BBB- Index Series 16 | | Apr 2065 | Goldman Sachs & Co. LLC | (3%) | Monthly | | 1,170,000 | 181,337 | (284,097) | (102,760) |
| CMBX N.A. BBB- Index Series 16 | | Apr 2065 | Goldman Sachs & Co. LLC | (3%) | Monthly | | 1,200,000 | 185,986 | (187,449) | (1,463) |
| CMBX N.A. BBB- Index Series 16 | | Apr 2065 | Goldman Sachs & Co. LLC | (3%) | Monthly | | 1,800,000 | 278,980 | (346,580) | (67,600) |
| CMBX N.A. BBB- Index Series 16 | | Apr 2065 | Goldman Sachs & Co. LLC | (3%) | Monthly | | 6,600,000 | 1,022,925 | (1,079,105) | (56,180) |
| CMBX N.A. BBB- Index Series 16 | | Apr 2065 | Goldman Sachs & Co. LLC | (3%) | Monthly | | 2,700,000 | 418,469 | (704,407) | (285,938) |
| CMBX N.A. BBB- Index Series 16 | | Apr 2065 | JPMorgan Securities LLC | (3%) | Monthly | | 2,550,000 | 395,221 | (765,881) | (370,660) |
| CMBX N.A. BBB- Index Series 16 | | Apr 2065 | JPMorgan Securities LLC | (3%) | Monthly | | 1,650,000 | 255,731 | (432,588) | (176,857) |
| CMBX N.A. BBB- Index Series 16 | | Apr 2065 | JPMorgan Securities LLC | (3%) | Monthly | | 2,480,000 | 384,372 | (703,489) | (319,117) |
| CMBX N.A. BBB- Index Series 16 | | Apr 2065 | Morgan Stanley Capital Services LLC | (3%) | Monthly | | 600,000 | 92,993 | (92,488) | 505 |
| CMBX N.A. BBB- Index Series 16 | | Apr 2065 | Morgan Stanley Capital Services LLC | (3%) | Monthly | | 3,470,000 | 537,811 | (855,413) | (317,602) |
| CMBX N.A. BBB- Index Series 16 | | Apr 2065 | Morgan Stanley Capital Services LLC | (3%) | Monthly | | 2,390,000 | 370,423 | (560,842) | (190,419) |
| CMBX N.A. BBB- Index Series 16 | | Apr 2065 | Morgan Stanley Capital Services LLC | (3%) | Monthly | | 1,760,000 | 272,780 | (401,917) | (129,137) |
| CMBX N.A. BBB- Index Series 16 | | Apr 2065 | Morgan Stanley Capital Services LLC | (3%) | Monthly | | 1,100,000 | 170,488 | (183,895) | (13,407) |
| CMBX N.A. BBB- Index Series 16 | | Apr 2065 | Morgan Stanley Capital Services LLC | (3%) | Monthly | | 3,200,000 | 495,964 | (803,082) | (307,118) |
| CMBX N.A. BBB- Index Series 17 | | Dec 2056 | Goldman Sachs & Co. LLC | (3%) | Monthly | | 2,000,000 | 237,514 | (257,765) | (20,251) |
| CMBX N.A. BBB- Index Series 17 | | Dec 2056 | Goldman Sachs & Co. LLC | (3%) | Monthly | | 2,000,000 | 237,514 | (279,671) | (42,157) |
| CMBX N.A. BBB- Index Series 17 | | Dec 2056 | Goldman Sachs & Co. LLC | (3%) | Monthly | | 2,000,000 | 237,514 | (245,699) | (8,185) |
| CMBX N.A. BBB- Index Series 17 | | Dec 2056 | JPMorgan Securities LLC | (3%) | Monthly | | 1,500,000 | 178,136 | (196,991) | (18,855) |
| CMBX N.A. BBB- Index Series 17 | | Dec 2056 | Morgan Stanley Capital Services LLC | (3%) | Monthly | | 1,300,000 | 154,384 | (180,581) | (26,197) |
| | | | | | | | | | | |
| TOTAL BUY PROTECTION | | | | | | | | 7,344,961 | (10,657,781) | (3,312,820) |
| Sell Protection | | | | | | | | | | |
| CMBX N.A. AAA Index Series 13 | NR | Dec 2072 | Morgan Stanley Capital Services LLC | 0.5% | Monthly | | 35,930,000 | (169,212) | 808,637 | 639,425 |
| CMBX N.A. AAA Index Series 13 | NR | Dec 2072 | Morgan Stanley Capital Services LLC | 0.5% | Monthly | | 20,930,000 | (98,570) | 484,431 | 385,861 |
| CMBX N.A. AAA Index Series 15 | NR | Nov 2064 | Citigroup Global Markets Ltd. | 0.5% | Monthly | | 1,450,000 | (16,518) | 19,722 | 3,204 |
| CMBX N.A. AAA Index Series 16 | NR | Apr 2065 | Citigroup Global Markets Ltd. | 0.5% | Monthly | | 13,400,000 | (210,929) | 267,317 | 56,388 |
| CMBX N.A. AAA Index Series 16 | NR | Apr 2065 | Citigroup Global Markets Ltd. | 0.5% | Monthly | | 40,900,000 | (643,807) | 821,829 | 178,022 |
| CMBX N.A. AAA Index Series 16 | NR | Apr 2065 | Citigroup Global Markets Ltd. | 0.5% | Monthly | | 6,200,000 | (97,594) | 97,852 | 258 |
| CMBX N.A. AAA Index Series 16 | NR | Apr 2065 | Goldman Sachs & Co. LLC | 0.5% | Monthly | | 15,700,000 | (247,134) | 314,319 | 67,185 |
| CMBX N.A. AAA Index Series 16 | NR | Apr 2065 | Goldman Sachs & Co. LLC | 0.5% | Monthly | | 11,700,000 | (184,170) | 153,795 | (30,375) |
| CMBX N.A. AAA Index Series 17 | NR | Dec 2056 | Citigroup Global Markets Ltd. | 0.5% | Monthly | | 10,900,000 | (227,437) | 271,397 | 43,960 |
| CMBX N.A. AAA Index Series 17 | NR | Dec 2056 | Citigroup Global Markets Ltd. | 0.5% | Monthly | | 40,900,000 | (853,411) | 1,024,877 | 171,466 |
| CMBX N.A. AAA Index Series 17 | NR | Dec 2056 | Citigroup Global Markets Ltd. | 0.5% | Monthly | | 6,000,000 | (125,195) | 125,162 | (33) |
| CMBX N.A. AAA Index Series 17 | NR | Dec 2056 | Goldman Sachs & Co. LLC | 0.5% | Monthly | | 7,200,000 | (150,234) | 180,547 | 30,313 |
| CMBX N.A. AAA Index Series 17 | NR | Dec 2056 | Goldman Sachs & Co. LLC | 0.5% | Monthly | | 9,775,000 | (203,963) | 261,292 | 57,329 |
| CMBX N.A. AAA Index Series 17 | NR | Dec 2056 | Morgan Stanley Capital Services LLC | 0.5% | Monthly | | 19,300,000 | (402,710) | 407,233 | 4,523 |
| | | | | | | | | | | |
| TOTAL SELL PROTECTION | | | | | | | | (3,630,884) | 5,238,410 | 1,607,526 |
| TOTAL CREDIT DEFAULT SWAPS | | | | | | | | 3,714,077 | (5,419,371) | (1,705,294) |
(1)Ratings are presented for credit default swaps in which the Fund has sold protection on the underlying referenced debt. Ratings for an underlying index represent a weighted average of the ratings of all securities included in the index. The credit rating or value can be measures of the current payment/performance risk. Ratings are from Moody's Investors Service, Inc. Where Moody's® ratings are not available, S&P® ratings are disclosed and are indicated as such. All ratings are as of the report date and do not reflect subsequent changes.
(2)The notional amount of each credit default swap where the Fund has sold protection approximates the maximum potential amount of future payments that the Fund could be required to make if a credit event were to occur.
(3)Notional amount is stated in U.S. Dollars unless otherwise noted.
| Interest Rate Swaps |
| Payment Received | Payment Frequency | Payment Paid | Payment Frequency | Clearinghouse / Counterparty(1) | Maturity Date | Notional Amount(2) | Value ($) | Upfront Premium Received/ (Paid) ($)(3) | Unrealized Appreciation/ (Depreciation) ($) |
U.S. Secured Overnight Fin. Rate (SOFR) Index(4) | Annual | 3.75% | Annual | LCH | Dec 2026 | | 422,086,000 | 1,306,505 | 0 | 1,306,505 |
U.S. Secured Overnight Fin. Rate (SOFR) Index(4) | Annual | 3.75% | Annual | LCH | Dec 2027 | | 518,419,000 | 2,103,293 | 0 | 2,103,293 |
U.S. Secured Overnight Fin. Rate (SOFR) Index(4) | Annual | 3.75% | Annual | LCH | Dec 2028 | | 69,939,000 | 385,886 | 0 | 385,886 |
U.S. Secured Overnight Fin. Rate (SOFR) Index(4) | Annual | 3.75% | Annual | LCH | Dec 2029 | | 18,835,000 | 132,091 | 0 | 132,091 |
U.S. Secured Overnight Fin. Rate (SOFR) Index(4) | Annual | 3.75% | Annual | LCH | Dec 2031 | | 284,900,000 | 2,729,211 | 0 | 2,729,211 |
| 3.75% | Annual | U.S. Secured Overnight Fin. Rate (SOFR) Index(4) | Annual | LCH | Dec 2034 | | 10,341,000 | (113,875) | 0 | (113,875) |
U.S. Secured Overnight Fin. Rate (SOFR) Index(4) | Annual | 3.75% | Annual | LCH | Dec 2044 | | 83,017,000 | 1,807,210 | 0 | 1,807,210 |
| 3.5% | Annual | U.S. Secured Overnight Fin. Rate (SOFR) Index(4) | Annual | LCH | Dec 2054 | | 67,803,000 | (1,570,465) | 0 | (1,570,465) |
| TOTAL INTEREST RATE SWAPS | | | | | | | | 6,779,856 | 0 | 6,779,856 |
| | | | | | | | | | | |
(1)Swaps with LCH Clearnet Group (LCH) are centrally cleared swaps.
(2)Notional amount is stated in U.S. Dollars unless otherwise noted.
(3)Any premiums for centrally cleared swaps are recorded periodically throughout the term of the swap to variation margin and included in unrealized appreciation (depreciation).
(4)Represents floating rate.
Legend
| (a) | Amount is stated in United States dollars unless otherwise noted. |
| (b) | Security exempt from registration under Rule 144A of the Securities Act of 1933. These securities may be resold in transactions exempt from registration, normally to qualified institutional buyers. At the end of the period, the value of these securities amounted to $6,633,041,750 or 16.2% of net assets. |
| (c) | Coupon rates for floating and adjustable rate securities reflect the rates in effect at period end. |
| (d) | Coupon is indexed to a floating interest rate which may be multiplied by a specified factor and/or subject to caps or floors. |
| (e) | Security or a portion of the security has been segregated as collateral for open bi-lateral over the counter (OTC) swaps. At period end, the value of securities pledged amounted to $4,168,296. |
| (f) | Security or a portion of the security was pledged to cover margin requirements for futures contracts. At period end, the value of securities pledged amounted to $7,754,598. |
| (g) | Security or a portion of the security was pledged to cover margin requirements for centrally cleared swaps. At period end, the value of securities pledged amounted to $34,690,777. |
| (h) | Security or a portion of the security has been segregated as collateral for mortgage-backed or asset-backed securities purchased on a delayed delivery or when-issued basis. At period end, the value of securities pledged amounted to $737,130. |
| (i) | Security or a portion of the security purchased on a delayed delivery or when-issued basis. |
| (j) | Interest Only (IO) security represents the right to receive only monthly interest payments on an underlying pool of mortgages or assets. Principal shown is the outstanding par amount of the pool as of the end of the period. |
| (k) | Coupon is inversely indexed to a floating interest rate multiplied by a specified factor. The price may be considerably more volatile than the price of a comparable fixed rate security. |
| (l) | Principal Only Strips represent the right to receive the monthly principal payments on an underlying pool of mortgage loans. |
| (m) | Represents an investment in an underlying pool of reverse mortgages which typically do not require regular principal and interest payments as repayment is deferred until a maturity event. |
| (n) | Affiliated fund that is generally available only to investment companies and other accounts managed by Fidelity Investments. The rate quoted is the annualized seven-day yield of the fund at period end. A complete unaudited listing of the fund's holdings as of its most recent quarter end is available upon request. In addition, each Fidelity Central Fund's financial statements, which are not covered by the Fund's Report of Independent Registered Public Accounting Firm, are available on the SEC's website or upon request. |
Affiliated Central Funds
Fiscal year to date information regarding the Fund's investments in Fidelity Central Funds, including the ownership percentage, is presented below.
| Affiliate | Value, beginning of period ($) | Purchases ($) | Sales Proceeds ($) | Dividend Income ($) | Realized Gain (loss) ($) | Change in Unrealized appreciation (depreciation) ($) | Value, end of period ($) | % ownership, end of period |
| Fidelity Cash Central Fund 4.89% | 363,138,224 | 8,095,959,468 | 8,136,307,753 | 29,421,342 | 5,132 | - | 322,795,071 | 0.7% |
| Fidelity Securities Lending Cash Central Fund 4.89% | - | 3,006,128,316 | 3,006,128,316 | 253,183 | - | - | - | 0.0% |
| Total | 363,138,224 | 11,102,087,784 | 11,142,436,069 | 29,674,525 | 5,132 | - | 322,795,071 | |
| | | | | | | | | |
Amounts in the dividend income column in the above table include any capital gain distributions from underlying funds, which are presented in the corresponding line item in the Statement of Operations, if applicable.
Amounts in the dividend income column for Fidelity Securities Lending Cash Central Fund represents the income earned on investing cash collateral, less rebates paid to borrowers and any lending agent fees associated with the loan, plus any premium payments received for lending certain types of securities.
Amounts included in the purchases and sales proceeds columns may include in-kind transactions, if applicable.
Investment Valuation
The following is a summary of the inputs used, as of September 30, 2024, involving the Fund's assets and liabilities carried at fair value. The inputs or methodology used for valuing securities may not be an indication of the risk associated with investing in those securities. For more information on valuation inputs, and their aggregation into the levels used below, please refer to the Investment Valuation section in the accompanying Notes to Financial Statements.
| Valuation Inputs at Reporting Date: |
| Description | Total ($) | Level 1 ($) | Level 2 ($) | Level 3 ($) |
Investments in Securities: | | | | |
|
| Corporate Bonds | 11,342,244,987 | - | 11,342,244,987 | - |
|
| U.S. Government and Government Agency Obligations | 17,616,688,860 | - | 17,616,688,860 | - |
|
| U.S. Government Agency - Mortgage Securities | 10,333,947,685 | - | 10,333,947,685 | - |
|
| Asset-Backed Securities | 3,617,496,972 | - | 3,617,496,972 | - |
|
| Collateralized Mortgage Obligations | 543,023,173 | - | 543,023,173 | - |
|
| Commercial Mortgage Securities | 2,593,143,115 | - | 2,593,143,115 | - |
|
| Municipal Securities | 35,059,611 | - | 35,059,611 | - |
|
| Foreign Government and Government Agency Obligations | 69,466,654 | - | 69,466,654 | - |
|
| Bank Notes | 57,700,546 | - | 57,700,546 | - |
|
| Money Market Funds | 322,795,071 | 322,795,071 | - | - |
|
| Purchased Swaptions | 26,255,990 | - | 26,255,990 | - |
| Total Investments in Securities: | 46,557,822,664 | 322,795,071 | 46,235,027,593 | - |
Derivative Instruments: Assets | | | | |
Futures Contracts | 320,209 | 320,209 | - | - |
Swaps | 15,809,157 | - | 15,809,157 | - |
| Total Assets | 16,129,366 | 320,209 | 15,809,157 | - |
| Liabilities | | | | |
Futures Contracts | (2,598,706) | (2,598,706) | - | - |
Swaps | (5,315,224) | - | (5,315,224) | - |
| Total Liabilities | (7,913,930) | (2,598,706) | (5,315,224) | - |
| Total Derivative Instruments: | 8,215,436 | (2,278,497) | 10,493,933 | - |
Other Financial Instruments: | | | | |
TBA Sale Commitments | (3,084,358,728) | - | (3,084,358,728) | - |
| Total Other Financial Instruments: | (3,084,358,728) | - | (3,084,358,728) | - |
Value of Derivative Instruments
The following table is a summary of the Fund's value of derivative instruments by primary risk exposure as of September 30, 2024. For additional information on derivative instruments, please refer to the Derivative Instruments section in the accompanying Notes to Financial Statements.
Primary Risk Exposure / Derivative Type | Value |
| Asset ($) | Liability ($) |
| Credit Risk | | |
Swaps (a) | 7,344,961 | (3,630,884) |
| Total Credit Risk | 7,344,961 | (3,630,884) |
| Interest Rate Risk | | |
Futures Contracts (b) | 320,209 | (2,598,706) |
Purchased Swaptions (c) | 26,255,990 | 0 |
Swaps (d) | 8,464,196 | (1,684,340) |
| Total Interest Rate Risk | 35,040,395 | (4,283,046) |
| Total Value of Derivatives | 42,385,356 | (7,913,930) |
(a)For bi-lateral over-the-counter (OTC) swaps, reflects gross value which is presented in the Statement of Assets and Liabilities in the bi-lateral OTC swaps, at value line-items.
(b)Reflects gross cumulative appreciation (depreciation) on futures contracts as presented in the Schedule of Investments. In the Statement of Assets and Liabilities, the period end daily variation margin is included in receivable or payable for daily variation margin on futures contracts, and the net cumulative appreciation (depreciation) is included in Total accumulated earnings (loss).
(c)Gross value is presented in the Statement of Assets and Liabilities in the Investments in Securities at value line-item.
(d)For centrally cleared swaps, reflects gross cumulative appreciation (depreciation) as presented in the Schedule of Investments. In the Statement of Assets and Liabilities, the period end daily variation margin for centrally cleared swaps is included in receivable or payable for daily variation margin on centrally cleared swaps, and the net cumulative appreciation (depreciation) for centrally cleared swaps is included in Total accumulated earnings (loss).
Financial Statements
| Statement of Assets and Liabilities |
As of September 30, 2024 |
| Assets | | | | |
| Investment in securities, at value - See accompanying schedule: | | | | |
Unaffiliated issuers (cost $47,638,757,277) | $ | 46,235,027,593 | | |
Fidelity Central Funds (cost $322,794,482) | | 322,795,071 | | |
| | | | | |
| | | | | |
| Total Investment in Securities (cost $47,961,551,759) | | | $ | 46,557,822,664 |
| Receivable for investments sold | | | | 74,072,870 |
| Receivable for TBA sale commitments | | | | 3,100,246,127 |
| Receivable for fund shares sold | | | | 34,882 |
| Interest receivable | | | | 337,996,779 |
| Distributions receivable from Fidelity Central Funds | | | | 880,305 |
| Receivable for daily variation margin on centrally cleared swaps | | | | 2,564,402 |
| Bi-lateral OTC swaps, at value | | | | 7,344,961 |
| Other receivables | | | | 487 |
Total assets | | | | 50,080,963,477 |
| Liabilities | | | | |
| Payable for investments purchased | | | | |
Regular delivery | $ | 61,904,794 | | |
Delayed delivery | | 5,920,492,998 | | |
| TBA sale commitments, at value | | 3,084,358,728 | | |
| Payable for fund shares redeemed | | 6,222,939 | | |
| Bi-lateral OTC swaps, at value | | 3,630,884 | | |
| Payable for daily variation margin on futures contracts | | 1,041,587 | | |
| Other payables and accrued expenses | | 9,122 | | |
| Total liabilities | | | | 9,077,661,052 |
| Net Assets | | | $ | 41,003,302,425 |
| Net Assets consist of: | | | | |
| Paid in capital | | | $ | 44,163,208,807 |
| Total accumulated earnings (loss) | | | | (3,159,906,382) |
| Net Assets | | | $ | 41,003,302,425 |
Net Asset Value, offering price and redemption price per share ($41,003,302,425 ÷ 406,758,897 shares) | | | $ | 100.80 |
| Statement of Operations |
| Year ended September 30, 2024 |
| Investment Income | | | | |
| Interest | | | $ | 1,652,034,723 |
| Income from Fidelity Central Funds (including $253,183 from security lending) | | | | 29,674,525 |
| Total income | | | | 1,681,709,248 |
| Expenses | | | | |
| Custodian fees and expenses | $ | 18,411 | | |
| Independent trustees' fees and expenses | | 109,281 | | |
| Total expenses before reductions | | 127,692 | | |
| Expense reductions | | (16,417) | | |
| Total expenses after reductions | | | | 111,275 |
| Net Investment income (loss) | | | | 1,681,597,973 |
| Realized and Unrealized Gain (Loss) | | | | |
| Net realized gain (loss) on: | | | | |
| Investment Securities: | | | | |
| Unaffiliated issuers | | (426,929,009) | | |
| Fidelity Central Funds | | 5,132 | | |
| Futures contracts | | (24,663,748) | | |
| Swaps | | (31,559,932) | | |
| Written options | | 254,250 | | |
| Total net realized gain (loss) | | | | (482,893,307) |
| Change in net unrealized appreciation (depreciation) on: | | | | |
| Investment Securities: | | | | |
| Unaffiliated issuers | | 3,396,662,494 | | |
| Futures contracts | | (13,847,301) | | |
| Swaps | | 4,910,453 | | |
| Written options | | 147,421 | | |
| TBA Sale commitments | | 1,057,987 | | |
| Total change in net unrealized appreciation (depreciation) | | | | 3,388,931,054 |
| Net gain (loss) | | | | 2,906,037,747 |
| Net increase (decrease) in net assets resulting from operations | | | $ | 4,587,635,720 |
| Statement of Changes in Net Assets |
| |
| | Year ended September 30, 2024 | | Year ended September 30, 2023 |
| Increase (Decrease) in Net Assets | | | | |
| Operations | | | | |
| Net investment income (loss) | $ | 1,681,597,973 | $ | 1,353,282,266 |
| Net realized gain (loss) | | (482,893,307) | | (712,027,754) |
| Change in net unrealized appreciation (depreciation) | | 3,388,931,054 | | (281,554,785) |
| Net increase (decrease) in net assets resulting from operations | | 4,587,635,720 | | 359,699,727 |
| Distributions to shareholders | | (1,677,228,498) | | (1,344,400,074) |
| | | | | |
| Affiliated share transactions | | | | |
| Proceeds from sales of shares | | 2,177,625,569 | | 6,154,992,243 |
| Reinvestment of distributions | | 1,677,228,498 | | 1,344,397,865 |
| Cost of shares redeemed | | (2,756,697,727) | | (1,454,049,597) |
| | | | | |
Net increase (decrease) in net assets resulting from share transactions | | 1,098,156,340 | | 6,045,340,511 |
| Total increase (decrease) in net assets | | 4,008,563,562 | | 5,060,640,164 |
| | | | | |
| Net Assets | | | | |
| Beginning of period | | 36,994,738,863 | | 31,934,098,699 |
| End of period | $ | 41,003,302,425 | $ | 36,994,738,863 |
| | | | | |
| Other Information | | | | |
| Shares | | | | |
| Sold | | 22,306,502 | | 63,031,003 |
| Issued in reinvestment of distributions | | 17,255,967 | | 13,833,701 |
| Redeemed | | (28,023,917) | | (14,901,688) |
| Net increase (decrease) | | 11,538,552 | | 61,963,016 |
| | | | | |
Financial Highlights
Fidelity® Investment Grade Bond Central Fund |
| |
| Years ended September 30, | | 2024 | | 2023 | | 2022 | | 2021 | | 2020 |
Selected Per-Share Data | | | | | | | | | | |
| Net asset value, beginning of period | $ | 93.61 | $ | 95.82 | $ | 114.50 | $ | 118.41 | $ | 112.59 |
| Income from Investment Operations | | | | | | | | | | |
Net investment income (loss) A,B | | 4.155 | | 3.682 | | 2.699 | | 2.569 | | 3.127 |
| Net realized and unrealized gain (loss) | | 7.187 | | (2.239) | | (18.662) | | (1.197) | | 6.011 |
| Total from investment operations | | 11.342 | | 1.443 | | (15.963) | | 1.372 | | 9.138 |
| Distributions from net investment income | | (4.152) | | (3.653) | | (2.717) | | (2.615) | | (3.192) |
| Distributions from net realized gain | | - | | - | | - | | (2.667) | | (.126) |
| Total distributions | | (4.152) | | (3.653) | | (2.717) | | (5.282) | | (3.318) |
| Net asset value, end of period | $ | 100.80 | $ | 93.61 | $ | 95.82 | $ | 114.50 | $ | 118.41 |
Total Return C | | | | 1.43% | | (14.14)% | | 1.18% | | 8.24% |
Ratios to Average Net Assets B,D,E | | | | | | | | | | |
Expenses before reductions F | | -% | | -% | | -% | | -% | | -% |
Expenses net of fee waivers, if any F | | | | -% | | -% | | -% | | -% |
Expenses net of all reductions F | | -% | | -% | | -% | | -% | | -% |
| Net investment income (loss) | | 4.28% | | 3.79% | | 2.53% | | 2.22% | | 2.72% |
| Supplemental Data | | | | | | | | | | |
| Net assets, end of period (000 omitted) | $ | 41,003,302 | $ | 36,994,739 | $ | 31,934,099 | $ | 32,962,327 | $ | 29,136,547 |
Portfolio turnover rate G | | | | 174% | | 181% | | 245% | | 204% H |
ACalculated based on average shares outstanding during the period.
BNet investment income (loss) is affected by the timing of the declaration of dividends by any underlying mutual funds or exchange-traded funds (ETFs). Net investment income (loss) of any mutual funds or ETFs is not included in the Fund's net investment income (loss) ratio.
CTotal returns would have been lower if certain expenses had not been reduced during the applicable periods shown.
DFees and expenses of any underlying mutual funds or exchange-traded funds (ETFs) are not included in the Fund's expense ratio. The Fund indirectly bears its proportionate share of these expenses. For additional expense information related to investments in Fidelity Central Funds, please refer to the "Investments in Fidelity Central Funds" note found in the Notes to Financial Statements section of the most recent Annual or Semi-Annual report.
EExpense ratios reflect operating expenses of the class. Expenses before reductions do not reflect amounts reimbursed, waived, or reduced through arrangements with the investment adviser, brokerage services, or other offset arrangements, if applicable, and do not represent the amount paid by the class during periods when reimbursements, waivers or reductions occur.
FAmount represents less than .005%.
GAmount does not include the portfolio activity of any underlying mutual funds or exchange-traded funds (ETFs).
HPortfolio turnover rate excludes securities received or delivered in-kind.
Notes to Financial Statements
For the period ended September 30, 2024
1. Organization.
Fidelity Investment Grade Bond Central Fund (the Fund) is a fund of Fidelity Central Investment Portfolios II LLC (the LLC) and is authorized to issue an unlimited number of shares. Shares of the Fund are only offered to other investment companies and accounts managed by Fidelity Management & Research Company LLC (FMR), or its affiliates (the Investing Funds). The LLC is registered under the Investment Company Act of 1940, as amended (the 1940 Act), as an open-end management investment company organized as a Delaware Limited Liability Company.
2. Investments in Fidelity Central Funds.
Funds may invest in Fidelity Central Funds, which are open-end investment companies generally available only to other investment companies and accounts managed by the investment adviser and its affiliates. The Schedule of Investments lists any Fidelity Central Funds held as an investment as of period end, but does not include the underlying holdings of each Fidelity Central Fund. An investing fund indirectly bears its proportionate share of the expenses of the underlying Fidelity Central Funds.
Based on its investment objective, each Fidelity Central Fund may invest or participate in various investment vehicles or strategies that are similar to those of the investing fund. These strategies are consistent with the investment objectives of the investing fund and may involve certain economic risks which may cause a decline in value of each of the Fidelity Central Funds and thus a decline in the value of the investing fund.
| Fidelity Central Fund | Investment Manager | Investment Objective | Investment Practices | Expense RatioA |
| Fidelity Money Market Central Funds | Fidelity Management & Research Company LLC (FMR) | Each fund seeks to obtain a high level of current income consistent with the preservation of capital and liquidity. | Short-term Investments | Less than .005% |
A Expenses expressed as a percentage of average net assets and are as of each underlying Central Fund's most recent annual or semi-annual shareholder report.
A complete unaudited list of holdings for each Fidelity Central Fund is available upon request or at the Securities and Exchange Commission website at www.sec.gov. In addition, the financial statements of the Fidelity Central Funds which contain the significant accounting policies (including investment valuation policies) of those funds, and are not covered by the Report of Independent Registered Public Accounting Firm, are available on the Securities and Exchange Commission website or upon request.
3. Significant Accounting Policies.
The Fund is an investment company and applies the accounting and reporting guidance of the Financial Accounting Standards Board (FASB) Accounting Standards Codification Topic 946 Financial Services - Investment Companies. The financial statements have been prepared in conformity with accounting principles generally accepted in the United States of America (GAAP), which require management to make certain estimates and assumptions at the date of the financial statements. Actual results could differ from those estimates. Subsequent events, if any, through the date that the financial statements were issued have been evaluated in the preparation of the financial statements. The Fund's Schedule of Investments lists any underlying mutual funds or exchange-traded funds (ETFs) but does not include the underlying holdings of these funds. The following summarizes the significant accounting policies of the Fund:
Investment Valuation. Investments are valued as of 4:00 p.m. Eastern time on the last calendar day of the period. The Board of Directors (the Board) has designated the Fund's investment adviser as the valuation designee responsible for the fair valuation function and performing fair value determinations as needed. The investment adviser has established a Fair Value Committee (the Committee) to carry out the day-to-day fair valuation responsibilities and has adopted policies and procedures to govern the fair valuation process and the activities of the Committee. In accordance with these fair valuation policies and procedures, which have been approved by the Board, the Fund attempts to obtain prices from one or more third party pricing services or brokers to value its investments. When current market prices, quotations or currency exchange rates are not readily available or reliable, investments will be fair valued in good faith by the Committee, in accordance with the policies and procedures. Factors used in determining fair value vary by investment type and may include market or investment specific events, transaction data, estimated cash flows, and market observations of comparable investments. The frequency that the fair valuation procedures are used cannot be predicted and they may be utilized to a significant extent. The Committee manages the Fund's fair valuation practices and maintains the fair valuation policies and procedures. The Fund's investment adviser reports to the Board information regarding the fair valuation process and related material matters.
The Fund categorizes the inputs to valuation techniques used to value its investments into a disclosure hierarchy consisting of three levels as shown below:
Level 1 - unadjusted quoted prices in active markets for identical investments
Level 2 - other significant observable inputs (including quoted prices for similar investments, interest rates, prepayment speeds, etc.)
Level 3 - unobservable inputs (including the Fund's own assumptions based on the best information available)
Valuation techniques used to value the Fund's investments by major category are as follows:
Debt securities, including restricted securities, are valued based on evaluated prices received from third party pricing services or from brokers who make markets in such securities. Corporate bonds, bank notes, foreign government and government agency obligations, municipal securities and U.S. government and government agency obligations are valued by pricing services who utilize matrix pricing which considers yield or price of bonds of comparable quality, coupon, maturity and type or by broker-supplied prices. Asset backed securities, collateralized mortgage obligations, commercial mortgage securities and U.S. government agency mortgage securities are valued by pricing services who utilize matrix pricing which considers prepayment speed assumptions, attributes of the collateral, yield or price of bonds of comparable quality, coupon, maturity and type or by broker-supplied prices. Swaps are marked-to-market daily based on valuations from third party pricing services, registered derivatives clearing organizations (clearinghouses) or broker-supplied valuations. These pricing sources may utilize inputs such as interest rate curves, credit spread curves, default possibilities and recovery rates. When independent prices are unavailable or unreliable, debt securities and swaps may be valued utilizing pricing methodologies which consider similar factors that would be used by third party pricing services. Debt securities and swaps are generally categorized as Level 2 in the hierarchy but may be Level 3 depending on the circumstances.
Futures contracts are valued at the settlement price established each day by the board of trade or exchange on which they are traded and are categorized as Level 1 in the hierarchy. Options traded over-the-counter are valued using service or broker-supplied valuations and are categorized as Level 2 in the hierarchy. Investments in open-end mutual funds, including the Fidelity Central Funds, are valued at their closing net asset value (NAV) each business day and are categorized as Level 1 in the hierarchy.
Changes in valuation techniques may result in transfers in or out of an assigned level within the disclosure hierarchy. The aggregate value of investments by input level as of September 30, 2024 is included at the end of the Fund's Schedule of Investments.
Investment Transactions and Income. For financial reporting purposes, the Fund's investment holdings and NAV include trades executed through the end of the last business day of the period. The NAV per share for processing shareholder transactions is calculated as of the close of business of the New York Stock Exchange (NYSE), normally 4:00 p.m. Eastern time and includes trades executed through the end of the prior business day. Gains and losses on securities sold are determined on the basis of identified cost and include proceeds received from litigation. Income and capital gain distributions from Fidelity Central Funds, if any, are recorded on the ex-dividend date. Interest income is accrued as earned and includes coupon interest and amortization of premium and accretion of discount on debt securities as applicable. Debt obligations may be placed on non-accrual status and related interest income may be reduced by ceasing current accruals and writing off interest receivables when the collection of all or a portion of interest has become doubtful based on consistently applied procedures. A debt obligation is removed from non-accrual status when the issuer resumes interest payments or when collectability of interest is reasonably assured.
Expenses. Expenses directly attributable to a fund are charged to that fund. Expenses attributable to more than one fund are allocated among the respective funds on the basis of relative net assets or other appropriate methods. Expenses included in the accompanying financial statements reflect the expenses of that fund and do not include any expenses associated with any underlying mutual funds or exchange-traded funds. Although not included in a fund's expenses, a fund indirectly bears its proportionate share of these expenses through the net asset value of each underlying mutual fund or exchange-traded fund. Expense estimates are accrued in the period to which they relate and adjustments are made when actual amounts are known.
Income Tax Information and Distributions to Shareholders. Each year, the Fund intends to qualify as a regulated investment company under Subchapter M of the Internal Revenue Code, including distributing substantially all of its taxable income and realized gains. As a result, no provision for U.S. Federal income taxes is required. As of September 30, 2024, the Fund did not have any unrecognized tax benefits in the financial statements; nor is the Fund aware of any tax positions for which it is reasonably possible that the total amounts of unrecognized tax benefits will significantly change in the next twelve months. The Fund files a U.S. federal tax return, in addition to state and local tax returns as required. The Fund's federal income tax returns are subject to examination by the Internal Revenue Service (IRS) for a period of three fiscal years after they are filed. State and local tax returns may be subject to examination for an additional fiscal year depending on the jurisdiction.
Distributions are declared and recorded daily and paid monthly from net investment income. Distributions from realized gains, if any, are declared and recorded on the ex-dividend date. Income and capital gain distributions are determined in accordance with income tax regulations, which may differ from GAAP.
Capital accounts within the financial statements are adjusted for permanent book-tax differences. These adjustments have no impact on net assets or the results of operations. Capital accounts are not adjusted for temporary book-tax differences which will reverse in a subsequent period.
Book-tax differences are primarily due to futures contracts, swaps, capital loss carryforwards, losses deferred due to wash sales and futures contracts.
As of period end, the cost and unrealized appreciation (depreciation) in securities, and derivatives if applicable, for federal income tax purposes were as follows:
| Gross unrealized appreciation | $521,529,003 |
| Gross unrealized depreciation | (1,926,015,541) |
| Net unrealized appreciation (depreciation) | $(1,404,486,538) |
| Tax Cost | $47,987,650,146 |
The tax-based components of distributable earnings as of period end were as follows:
| Undistributed ordinary income | $18,343,852 |
| Capital loss carryforward | $(1,766,505,800) |
| Net unrealized appreciation (depreciation) on securities and other investments | $(1,411,744,434) |
| | |
Capital loss carryforwards are only available to offset future capital gains of the Fund to the extent provided by regulations and may be limited. The capital loss carryforward information presented below, including any applicable limitation, is estimated as of fiscal period end and is subject to adjustment.
Short-term | $(707,003,508) |
Long-term | (1,059,502,292) |
| Total capital loss carryforward | $(1,766,505,800) |
The tax character of distributions paid was as follows:
| | September 30, 2024 | September 30, 2023 |
| Ordinary Income | $1,677,228,498 | $ 1,344,400,074 |
| Total | $1,677,228,498 | $ 1,344,400,074 |
Delayed Delivery Transactions and When-Issued Securities. During the period, certain Funds transacted in securities on a delayed delivery or when-issued basis. Payment and delivery may take place after the customary settlement period for that security. The price of the underlying securities and the date when the securities will be delivered and paid for are fixed at the time the transaction is negotiated. Securities purchased on a delayed delivery or when-issued basis are identified as such in the Schedule of Investments. Compensation for interest forgone in the purchase of a delayed delivery or when-issued debt security may be received. With respect to purchase commitments, each applicable Fund identifies securities as segregated in its records with a value at least equal to the amount of the commitment. Payables and receivables associated with the purchases and sales of delayed delivery securities having the same coupon, settlement date and broker are offset. Delayed delivery or when-issued securities that have been purchased from and sold to different brokers are reflected as both payables and receivables in the Statement of Assets and Liabilities under the caption "Delayed delivery", as applicable. Losses may arise due to changes in the value of the underlying securities or if the counterparty does not perform under the contract's terms, or if the issuer does not issue the securities due to political, economic, or other factors.
To-Be-Announced (TBA) Securities and Mortgage Dollar Rolls. TBA securities involve buying or selling mortgage-backed securities (MBS) on a forward commitment basis. A TBA transaction typically does not designate the actual security to be delivered and only includes an approximate principal amount; however delivered securities must meet specified terms defined by industry guidelines, including issuer, rate and current principal amount outstanding on underlying mortgage pools. Funds may enter into a TBA transaction with the intent to take possession of or deliver the underlying MBS, or a fund may elect to extend the settlement by entering into either a mortgage or reverse mortgage dollar roll. Mortgage dollar rolls are transactions where a fund sells TBA securities and simultaneously agrees to repurchase MBS on a later date at a lower price and with the same counterparty. Reverse mortgage dollar rolls involve the purchase and simultaneous agreement to sell TBA securities on a later date at a lower price. Transactions in mortgage dollar rolls and reverse mortgage dollar rolls are accounted for as purchases and sales and may result in an increase to a fund's portfolio turnover rate.
Purchases and sales of TBA securities involve risks similar to those discussed above for delayed delivery and when-issued securities. Also, if the counterparty in a mortgage dollar roll or a reverse mortgage dollar roll transaction files for bankruptcy or becomes insolvent, a fund's right to repurchase or sell securities may be limited. Additionally, when a fund sells TBA securities without already owning or having the right to obtain the deliverable securities (an uncovered forward commitment to sell), it incurs a risk of loss because it could have to purchase the securities at a price that is higher than the price at which it sold them. A fund may be unable to purchase the deliverable securities if the corresponding market is illiquid.
TBA securities subject to a forward commitment to sell at period end are included at the end of the Schedule of Investments under the caption "TBA Sale Commitments." The value of these commitments and proceeds to be received at contractual settlement date are reflected in the Statement of Assets and Liabilities as "TBA sale commitments, at value" and "Receivable for TBA sale commitments," respectively. If the TBA sale commitment is closed through the acquisition of an offsetting TBA purchase commitment, a fund realizes a gain or loss. If a fund delivers securities under the commitment, a fund realizes a gain or loss from the sale of the securities based upon the price established at the date the commitment was entered into.
Restricted Securities (including Private Placements). Funds may invest in securities that are subject to legal or contractual restrictions on resale. These securities generally may be resold in transactions exempt from registration or to the public if the securities are registered. Disposal of these securities may involve time-consuming negotiations and expense, and prompt sale at an acceptable price may be difficult. Information regarding restricted securities held at period end is included at the end of the Schedule of Investments, if applicable.
4. Derivative Instruments.
Risk Exposures and the Use of Derivative Instruments. The Fund's investment objectives allow for various types of derivative instruments, including futures contracts, swaps and options. Derivatives are investments whose value is primarily derived from underlying assets, indices or reference rates and may be transacted on an exchange or over-the-counter (OTC). Derivatives may involve a future commitment to buy or sell a specified asset based on specified terms, to exchange future cash flows at periodic intervals based on a notional principal amount, or for one party to make one or more payments upon the occurrence of specified events in exchange for periodic payments from the other party.
Derivatives were used to increase returns, to gain exposure to certain types of assets and to manage exposure to certain risks as defined below. The success of any strategy involving derivatives depends on analysis of numerous economic factors, and if the strategies for investment do not work as intended, the objectives may not be achieved.
Derivatives were used to increase or decrease exposure to the following risk(s):
| | |
| Credit Risk | Credit risk relates to the ability of the issuer of a financial instrument to make further principal or interest payments on an obligation or commitment that it has to a fund. |
| Interest Rate Risk | Interest rate risk relates to the fluctuations in the value of interest-bearing securities due to changes in the prevailing levels of market interest rates. |
Funds are also exposed to additional risks from investing in derivatives, such as liquidity risk and counterparty credit risk. Liquidity risk is the risk that a fund will be unable to close out the derivative in the open market in a timely manner. Counterparty credit risk is the risk that the counterparty will not be able to fulfill its obligation to a fund. Derivative counterparty credit risk is managed through formal evaluation of the creditworthiness of all potential counterparties. On certain OTC derivatives such as options and bi-lateral swaps, a fund attempts to reduce its exposure to counterparty credit risk by entering into an International Swaps and Derivatives Association, Inc. (ISDA) Master Agreement with each of its counterparties. The ISDA Master Agreement gives a fund the right to terminate all transactions traded under such agreement upon the deterioration in the credit quality of the counterparty beyond specified levels. The ISDA Master Agreement gives each party the right, upon an event of default by the other party or a termination of the agreement, to close out all transactions traded under such agreement and to net amounts owed under each transaction to one net payable by one party to the other. To mitigate counterparty credit risk on bi-lateral OTC derivatives, a fund receives collateral in the form of cash or securities once net unrealized appreciation on outstanding derivative contracts under an ISDA Master Agreement exceeds certain applicable thresholds, subject to certain minimum transfer provisions. The collateral received is held in segregated accounts with the custodian bank in accordance with the collateral agreements entered into between a fund, the counterparty and the custodian bank. A fund could experience delays and costs in gaining access to the collateral even though it is held by the custodian bank. The maximum risk of loss to a fund from counterparty credit risk related to bi-lateral OTC derivatives is generally the aggregate unrealized appreciation and unpaid counterparty payments in excess of any collateral pledged by the counterparty to a fund. For OTC written options with upfront premiums received, a fund is obligated to perform and therefore does not have counterparty risk. For OTC written options with premiums to be received at a future date, the maximum risk of loss from counterparty credit risk is the amount of the premium in excess of any collateral pledged by the counterparty. A fund may be required to pledge collateral for the benefit of the counterparties on bi-lateral OTC derivatives in an amount not less than each counterparty's unrealized appreciation on outstanding derivative contracts, subject to certain minimum transfer provisions, and any such pledged collateral is identified in the Schedule of Investments. Exchange-traded contracts are not covered by the ISDA Master Agreement; however counterparty credit risk related to these contracts may be mitigated by the protection provided by the exchange on which they trade. Counterparty credit risk related to centrally cleared swaps may be mitigated by the protection provided by the clearinghouse.
Investing in derivatives may involve greater risks than investing in the underlying assets directly and, to varying degrees, may involve risk of loss in excess of any initial investment and collateral received and amounts recognized in the Statement of Assets and Liabilities. In addition, there may be the risk that the change in value of the derivative contract does not correspond to the change in value of the underlying instrument.
Net Realized Gain (Loss) and Change in Net Unrealized Appreciation (Depreciation) on Derivatives. The table below, which reflects the impacts of derivatives on the financial performance, summarizes the net realized gain (loss) and change in net unrealized appreciation (depreciation) for derivatives during the period as presented in the Statement of Operations.
| Primary Risk Exposure / Derivative Type | Net Realized Gain (Loss)($) | Change in Net Unrealized Appreciation (Depreciation)($) |
| Fidelity Investment Grade Bond Central Fund | | |
| Credit Risk | | |
| Swaps | (212,788) | (1,699,343) |
| Total Credit Risk | (212,788) | (1,699,343) |
| Interest Rate Risk | | |
| Futures Contracts | (24,663,748) | (13,847,301) |
| Purchased Options | (245,129) | (3,647,424) |
| Written Options | 254,250 | 147,421 |
| Swaps | (31,347,144) | 6,609,796 |
| Total Interest Rate Risk | (56,001,771) | (10,737,508) |
| Totals | (56,214,559) | (12,436,851) |
If there are any open positions at period end, a summary of the value of derivatives by primary risk exposure is included at the end of the Schedule of Investments.
Futures Contracts. A futures contract is an agreement between two parties to buy or sell a specified underlying instrument for a fixed price at a specified future date. Futures contracts were used to manage exposure to the bond market and fluctuations in interest rates.
Upon entering into a futures contract, a fund is required to deposit either cash or securities (initial margin) with a clearing broker in an amount equal to a certain percentage of the face value of the contract. Futures contracts are marked-to-market daily and subsequent daily payments are made or received by a fund depending on the daily fluctuations in the value of the futures contracts and are recorded as unrealized appreciation or (depreciation). This receivable and/or payable, if any, is included in daily variation margin on futures contracts in the Statement of Assets and Liabilities. Realized gain or (loss) is recorded upon the expiration or closing of a futures contract. The net realized gain (loss) and change in net unrealized appreciation (depreciation) on futures contracts during the period is presented in the Statement of Operations.
Any open futures contracts at period end are presented in the Schedule of Investments under the caption "Futures Contracts". The notional amount at value reflects each contract's exposure to the underlying instrument or index at period end, and is representative of volume of activity during the period unless an average notional amount is presented. Any securities deposited to meet initial margin requirements are identified in the Schedule of Investments. Any cash deposited to meet initial margin requirements is presented as segregated cash with brokers for derivative instruments in the Statement of Assets and Liabilities.
Options. Options give the purchaser the right, but not the obligation, to buy (call) or sell (put) an underlying security or financial instrument at an agreed exercise or strike price between or on certain dates. Options obligate the seller (writer) to buy (put) or sell (call) an underlying instrument at the exercise or strike price or cash settle an underlying derivative instrument if the holder exercises the option on or before the expiration date. OTC options, such as swaptions, which are options where the underlying instrument is a swap, were used to manage exposure to fluctuations in interest rates.
Upon entering into an options contract, a fund will pay or receive a premium. Premiums paid on purchased options are reflected as cost of investments and premiums received on written options are reflected as a liability on the Statement of Assets and Liabilities. Certain options may be purchased or written with premiums to be paid or received on a future date. Options are valued daily and any unrealized appreciation (depreciation) is reflected in total accumulated earnings (loss) in the Statement of Assets and Liabilities. When an option is exercised, the cost or proceeds of the underlying instrument purchased or sold is adjusted by the amount of the premium. When an option is closed, a gain or loss is realized depending on whether the proceeds or amount paid for the closing sale transaction is greater or less than the premium received or paid. When an option expires, gains and losses are realized to the extent of premiums received and paid, respectively. The net realized and unrealized gains (losses) on purchased options are included in the Statement of Operations in net realized gain (loss) and change in net unrealized appreciation (depreciation) on investment securities. The net realized gain (loss) and change in net unrealized appreciation (depreciation) on written options are presented in the Statement of Operations.
Any open options at period end are presented in the Schedule of Investments under the captions "Purchased Options," "Purchased Swaptions," "Written Options" and "Written Swaptions," as applicable, and are representative of volume of activity during the period unless an average notional amount is presented.
Writing puts and buying calls tend to increase exposure to the underlying instrument while buying puts and writing calls tend to decrease exposure to the underlying instrument. For purchased options, risk of loss is limited to the premium paid, and for written options, risk of loss is the change in value in excess of the premium received.
Swaps. A swap is a contract between two parties to exchange future cash flows at periodic intervals based on a notional principal amount. A bi-lateral OTC swap is a transaction between a fund and a dealer counterparty where cash flows are exchanged between the two parties for the life of the swap. A centrally cleared swap is a transaction executed between a fund and a dealer counterparty, then cleared by a futures commission merchant (FCM) through a clearinghouse. Once cleared, the clearinghouse serves as a central counterparty, with whom a fund exchanges cash flows for the life of the transaction, similar to transactions in futures contracts.
Bi-lateral OTC swaps are marked-to-market daily and changes in value are reflected in the Statement of Assets and Liabilities in the bi-lateral OTC swaps at value line items. Any upfront premiums paid or received upon entering a bi-lateral OTC swap to compensate for differences between stated terms of the swap and prevailing market conditions (e.g. credit spreads, interest rates or other factors) are recorded in total accumulated earnings (loss) in the Statement of Assets and Liabilities and amortized to realized gain or (loss) ratably over the term of the swap. Any unamortized upfront premiums are presented in the Schedule of Investments.
Centrally cleared swaps require a fund to deposit either cash or securities (initial margin) with the FCM, at the instruction of and for the benefit of the clearinghouse. Any securities deposited to meet initial margin requirements are identified in the Schedule of Investments. Any cash deposited to meet initial margin requirements is presented in segregated cash with brokers for derivative instruments in the Statement of Assets and Liabilities. Centrally cleared swaps are marked-to-market daily and subsequent payments (variation margin) are made or received depending on the daily fluctuations in the value of the swaps and are recorded as unrealized appreciation or (depreciation). These daily payments, if any, are included in receivable or payable for daily variation margin on centrally cleared swaps in the Statement of Assets and Liabilities. Any premiums for centrally cleared swaps are recorded periodically throughout the term of the swap to variation margin and included in total accumulated earnings (loss) in the Statement of Assets and Liabilities. Any premiums are recognized as realized gain (loss) upon termination or maturity of the swap.
For both bi-lateral and centrally cleared swaps, payments are exchanged at specified intervals, accrued daily commencing with the effective date of the contract and recorded as realized gain or (loss). Some swaps may be terminated prior to the effective date and realize a gain or loss upon termination. The net realized gain (loss) and change in net unrealized appreciation (depreciation) on swaps during the period is presented in the Statement of Operations.
Any open swaps at period end are included in the Schedule of Investments under the caption "Swaps", and are representative of volume of activity during the period unless an average notional amount is presented.
Credit Default Swaps. Credit default swaps enable a fund to buy or sell protection against specified credit events on a single-name issuer or a traded credit index. Under the terms of a credit default swap the buyer of protection (buyer) receives credit protection in exchange for making periodic payments to the seller of protection (seller) based on a fixed percentage applied to a notional principal amount. In return for these payments, the seller will be required to make a payment upon the occurrence of one or more specified credit events. A fund enters into credit default swaps as a seller to gain credit exposure to an issuer and/or as a buyer to obtain a measure of protection against defaults of an issuer. Periodic payments are made over the life of the contract by the buyer provided that no credit event occurs.
For credit default swaps on most corporate and sovereign issuers, credit events include bankruptcy, failure to pay or repudiation/moratorium. For credit default swaps on corporate or sovereign issuers, the obligation that may be put to the seller is not limited to the specific reference obligation described in the Schedule of Investments. For credit default swaps on asset-backed securities, a credit event may be triggered by events such as failure to pay principal, maturity extension, rating downgrade or write-down. For credit default swaps on asset-backed securities, the reference obligation described represents the security that may be put to the seller. For credit default swaps on a traded credit index, a specified credit event may affect all or individual underlying securities included in the index.
As a seller, if an underlying credit event occurs, a fund will pay a net settlement amount of cash equal to the notional amount of the swap less the recovery value of the reference obligation or underlying securities comprising an index. Only in the event of the industry's inability to value the underlying asset will a fund be required to take delivery of the reference obligation or underlying securities comprising an index and pay an amount equal to the notional amount of the swap.
As a buyer, if an underlying credit event occurs, a fund will receive a net settlement amount of cash equal to the notional amount of the swap less the recovery value of the reference obligation or underlying securities comprising an index. Only in the event of the industry's inability to value the underlying asset will a fund be required to deliver the reference obligation or underlying securities comprising an index in exchange for payment of an amount equal to the notional amount of the swap.
Typically, the value of each credit default swap and credit rating disclosed for each reference obligation in the Schedule of Investments, where a fund is the seller, can be used as measures of the current payment/performance risk of the swap. As the value of the swap changes as a positive or negative percentage of the total notional amount, the payment/performance risk may decrease or increase, respectively. In addition to these measures, the investment adviser monitors a variety of factors including cash flow assumptions, market activity and market sentiment as part of its ongoing process of assessing payment/performance risk.
Interest Rate Swaps. Interest rate swaps are agreements between counterparties to exchange cash flows, one based on a fixed rate, and the other on a floating rate. A fund enters into interest rate swaps to manage its exposure to interest rate changes. Changes in interest rates can have an effect on both the value of bond holdings as well as the amount of interest income earned. In general, the value of bonds can fall when interest rates rise and can rise when interest rates fall.
5. Purchases and Sales of Investments.
Purchases and sales of securities, other than short-term securities, U.S. government securities and in-kind transactions, as applicable, are noted in the table below.
| | Purchases ($) | Sales ($) |
| Fidelity Investment Grade Bond Central Fund | 46,281,899,646 | 46,064,261,906 |
6. Fees and Other Transactions with Affiliates.
Management Fee and Expense Contract. Fidelity Management & Research Company LLC (the investment adviser) provides the Fund with investment management services. The Fund does not pay any fees for these services. Pursuant to the Fund's expense contract, the investment adviser also pays all other expenses of the Fund, excluding custody fees, the compensation of the independent Directors, and certain miscellaneous expenses such as proxy and shareholder meeting expenses.
Interfund Trades. Funds may purchase from or sell securities to other Fidelity Funds under procedures adopted by the Board. The procedures have been designed to ensure these interfund trades are executed in accordance with Rule 17a-7 of the 1940 Act. Any interfund trades are included within the respective purchases and sales amounts shown in the Purchases and Sales of Investments note. During the period, there were no interfund trades.
Sub-Advisory Arrangements. Effective March 1, 2024, the Fund's sub-advisory agreements with FMR Investment Management (UK) Limited, Fidelity Management & Research (Hong Kong) Limited, and Fidelity Management & Research (Japan) Limited were amended to provide that the investment adviser pays each sub-adviser monthly fees equal to 110% of the sub-adviser's costs for providing sub-advisory services.
7. Security Lending.
Funds lend portfolio securities from time to time in order to earn additional income. Lending agents are used, including National Financial Services (NFS), an affiliate of the investment adviser. Pursuant to a securities lending agreement, NFS will receive a fee, which is capped at 9.9% of a fund's daily lending revenue, for its services as lending agent. A fund may lend securities to certain qualified borrowers, including NFS. On the settlement date of the loan, a fund receives collateral (in the form of U.S. Treasury obligations, letters of credit and/or cash) against the loaned securities and maintains collateral in an amount not less than 100% of the market value of the loaned securities during the period of the loan. The market value of the loaned securities is determined at the close of business of a fund and any additional required collateral is delivered to a fund on the next business day. A fund or borrower may terminate the loan at any time, and if the borrower defaults on its obligation to return the securities loaned because of insolvency or other reasons, a fund may apply collateral received from the borrower against the obligation. A fund may experience delays and costs in recovering the securities loaned. Any cash collateral received is invested in the Fidelity Securities Lending Cash Central Fund. Any loaned securities are identified as such in the Schedule of Investments, and the value of loaned securities and cash collateral at period end, as applicable, are presented in the Statement of Assets and Liabilities. Security lending income represents the income earned on investing cash collateral, less rebates paid to borrowers and any lending agent fees associated with the loan, plus any premium payments received for lending certain types of securities. Security lending income is presented in the Statement of Operations as a component of income from Fidelity Central Funds. Affiliated security lending activity, if any, was as follows:
| | Total Security Lending Fees Paid to NFS ($) | Security Lending Income From Securities Loaned to NFS ($) | Value of Securities Loaned to NFS at Period End ($) |
| Fidelity Investment Grade Bond Central Fund | 26,904 | - | - |
8. Expense Reductions.
Through arrangements with the Fund's custodian, credits realized as a result of certain uninvested cash balances were used to reduce the Fund's expenses by $16,417.
9. Other.
A fund's organizational documents provide former and current directors and officers with a limited indemnification against liabilities arising in connection with the performance of their duties to the fund. In the normal course of business, a fund may also enter into contracts that provide general indemnifications. A fund's maximum exposure under these arrangements is unknown as this would be dependent on future claims that may be made against a fund. The risk of material loss from such claims is considered remote.
At the end of the period, mutual funds managed by the investment adviser or its affiliates were the owners of record of all of the outstanding shares of the Fund.
10. Credit Risk.
The Fund invests a significant portion of its assets in structured securities of issuers backed by commercial and residential mortgage loans, credit card receivables and automotive loans. The value and related income of these securities is sensitive to changes in economic conditions, including delinquencies and/or defaults.
11. Risk and Uncertainties.
Many factors affect a fund's performance. Developments that disrupt global economies and financial markets, such as pandemics, epidemics, outbreaks of infectious diseases, war, terrorism, and environmental disasters, may significantly affect a fund's investment performance. The effects of these developments to a fund will be impacted by the types of securities in which a fund invests, the financial condition, industry, economic sector, and geographic location of an issuer, and a fund's level of investment in the securities of that issuer. Significant concentrations in security types, issuers, industries, sectors, and geographic locations may magnify the factors that affect a fund's performance.
Report of Independent Registered Public Accounting Firm
To the Board of Trustees of Fidelity Central Investment Portfolios II LLC and the Shareholders of Fidelity Investment Grade Bond Central Fund:
Opinion on the Financial Statements and Financial Highlights
We have audited the accompanying statement of assets and liabilities of Fidelity Investment Grade Bond Central Fund (the "Fund"), a fund of Fidelity Central Investment Portfolios II LLC, including the schedule of investments, as of September 30, 2024, the related statement of operations for the year then ended, the statement of changes in net assets for each of the two years in the period then ended, the financial highlights for each of the five years in the period then ended, and the related notes. In our opinion, the financial statements and financial highlights present fairly, in all material respects, the financial position of the Fund as of September 30, 2024, and the results of its operations for the year then ended, the changes in its net assets for each of the two years in the period then ended, and the financial highlights for each of the five years in the period then ended in conformity with accounting principles generally accepted in the United States of America.
Basis for Opinion
These financial statements and financial highlights are the responsibility of the Fund's management. Our responsibility is to express an opinion on the Fund's financial statements and financial highlights based on our audits. We are a public accounting firm registered with the Public Company Accounting Oversight Board (United States) (PCAOB) and are required to be independent with respect to the Fund in accordance with the U.S. federal securities laws and the applicable rules and regulations of the Securities and Exchange Commission and the PCAOB.
We conducted our audits in accordance with the standards of the PCAOB. Those standards require that we plan and perform the audit to obtain reasonable assurance about whether the financial statements and financial highlights are free of material misstatement, whether due to error or fraud. The Fund is not required to have, nor were we engaged to perform, an audit of its internal control over financial reporting. As part of our audits, we are required to obtain an understanding of internal control over financial reporting but not for the purpose of expressing an opinion on the effectiveness of the Fund's internal control over financial reporting. Accordingly, we express no such opinion.
Our audits included performing procedures to assess the risks of material misstatement of the financial statements and financial highlights, whether due to error or fraud, and performing procedures that respond to those risks. Such procedures included examining, on a test basis, evidence regarding the amounts and disclosures in the financial statements and financial highlights. Our audits also included evaluating the accounting principles used and significant estimates made by management, as well as evaluating the overall presentation of the financial statements and financial highlights. Our procedures included confirmation of securities owned as of September 30, 2024, by correspondence with the custodian and brokers; when replies were not received from brokers, we performed other auditing procedures. We believe that our audits provide a reasonable basis for our opinion.
/s/ Deloitte & Touche LLP
Boston, Massachusetts
November 13, 2024
We have served as the auditor of one or more of the Fidelity investment companies since 1999.
Distributions
(Unaudited)
The dividend and capital gains distributions for the fund(s) are available on Fidelity.com or Institutional.Fidelity.com.
A total of 35.01% of the dividends distributed during the fiscal year was derived from interest on U.S. Government securities which is generally exempt from state income tax.
The fund designates $1,259,914,306 of distributions paid in the calendar year 2023 as qualifying to be taxed as interest-related dividends for nonresident alien shareholders.
The fund designates $1,673,876,645 of distributions paid during the fiscal year ended 2024 as qualifying to be taxed as section 163(j) interest dividends.
The fund will notify shareholders in January 2025 of amounts for use in preparing 2024 income tax returns.
Item 8: Changes in and Disagreements with Accountants for Open-End Management Investment Companies
(Unaudited)
Note: This is not applicable for any fund included in this document.
Item 9: Proxy Disclosures for Open-End Management Investment Companies
(Unaudited)
| A special meeting of shareholders was held on October 18, 2023. The results of votes taken among shareholders on the proposal before them are reported below. Each vote reported represents one dollar of net asset value held on the record date for the meeting. |
| Proposal 1 |
| To elect a Board of Trustees. |
| | # of Votes | % of Votes |
| Abigail P. Johnson |
| Affirmative | 37,482,316,252.70 | 100.00 |
| Withheld | 0.00 | 0.00 |
| TOTAL | 37,482,316,252.70 | 100.00 |
| Jennifer Toolin McAuliffe |
| Affirmative | 37,482,316,252.70 | 100.00 |
| Withheld | 0.00 | 0.00 |
| TOTAL | 37,482,316,252.70 | 100.00 |
| Christine J. Thompson |
| Affirmative | 37,482,316,252.70 | 100.00 |
| Withheld | 0.00 | 0.00 |
| TOTAL | 37,482,316,252.70 | 100.00 |
| Elizabeth S. Acton |
| Affirmative | 37,482,316,252.70 | 100.00 |
| Withheld | 0.00 | 0.00 |
| TOTAL | 37,482,316,252.70 | 100.00 |
| Laura M. Bishop |
| Affirmative | 37,482,316,252.70 | 100.00 |
| Withheld | 0.00 | 0.00 |
| TOTAL | 37,482,316,252.70 | 100.00 |
| Ann E. Dunwoody |
| Affirmative | 37,482,316,252.70 | 100.00 |
| Withheld | 0.00 | 0.00 |
| TOTAL | 37,482,316,252.70 | 100.00 |
| John Engler |
| Affirmative | 37,482,316,252.70 | 100.00 |
| Withheld | 0.00 | 0.00 |
| TOTAL | 37,482,316,252.70 | 100.00 |
| Robert F. Gartland |
| Affirmative | 37,482,316,252.70 | 100.00 |
| Withheld | 0.00 | 0.00 |
| TOTAL | 37,482,316,252.70 | 100.00 |
| Robert W. Helm |
| Affirmative | 37,482,316,252.70 | 100.00 |
| Withheld | 0.00 | 0.00 |
| TOTAL | 37,482,316,252.70 | 100.00 |
| Arthur E. Johnson |
| Affirmative | 37,482,316,252.70 | 100.00 |
| Withheld | 0.00 | 0.00 |
| TOTAL | 37,482,316,252.70 | 100.00 |
| Michael E. Kenneally |
| Affirmative | 37,482,316,252.70 | 100.00 |
| Withheld | 0.00 | 0.00 |
| TOTAL | 37,482,316,252.70 | 100.00 |
| Mark A. Murray |
| Affirmative | 37,482,316,252.70 | 100.00 |
| Withheld | 0.00 | 0.00 |
| TOTAL | 37,482,316,252.70 | 100.00 |
| Carol J. Zierhoffer |
| Affirmative | 37,482,316,252.70 | 100.00 |
| Withheld | 0.00 | 0.00 |
| TOTAL | 37,482,316,252.70 | 100.00 |
| | | |
| Proposal 1 reflects trust-wide proposal and voting results. |
Item 10: Remuneration Paid to Directors, Officers, and others of Open-End Management Investment Companies
(Unaudited)
Note: This information is disclosed as part of the financial statements for each Fund as part of Item 7: Financial Statements and Financial Highlights for Open-End Management Investment companies.
Item 11: Statement Regarding Basis for Approval of Investment Advisory Contract
(Unaudited)
Board Approval of Investment Advisory Contracts and Management Fees
Fidelity Investment Grade Bond Central Fund
Each year, the Board of Trustees, including the Independent Trustees (together, the Board), considers the renewal of the fund's management contract with Fidelity Management & Research Company LLC (FMR) and the sub-advisory agreements (together, the Advisory Contracts) for the fund. FMR and the sub-advisers are referred to herein as the Investment Advisers. The Board, assisted by the advice of fund counsel and Independent Trustees' counsel, requests and considers a broad range of information relevant to the renewal of the Advisory Contracts throughout the year.
The Board meets regularly and, at each of its meetings, covers an extensive agenda of topics and materials and considers factors that are relevant to its annual consideration of the renewal of the fund's Advisory Contracts, including the services and support provided to the fund and its shareholders. The Board's Operations Committee, of which all the Independent Trustees are members, meets regularly throughout the year and requests, receives and considers, among other matters, information related to the annual consideration of the renewal of the fund's Advisory Contracts before making its recommendation to the Board. The Board also meets as needed to review matters specifically related to the Board's annual consideration of the renewal of the Advisory Contracts. Members of the Board may also meet from time to time with trustees of other Fidelity funds through joint ad hoc committees to discuss certain matters relevant to all of the Fidelity funds.
At its September 2024 meeting, the Board unanimously determined to renew the fund's Advisory Contracts. The Board considered all factors it believed relevant and reached a determination, with the assistance of fund counsel and Independent Trustees' counsel and through the exercise of its business judgment, that the renewal of the Advisory Contracts was in the best interests of the fund and its shareholders and the fact that no fee is payable under the management contract was fair and reasonable in light of all of the surrounding circumstances. The Board's decision to renew the Advisory Contracts was not based on any single factor and the factors may have been weighed differently by different Trustees.
Nature, Extent, and Quality of Services Provided. The Board considered the Investment Advisers' staffing as it relates to the fund, including the backgrounds and experience of investment personnel, and also considered the Investment Advisers' implementation of the fund's investment program. The Independent Trustees also had discussions with senior management of Fidelity's investment operations and investment groups. The Board considered the structure of the investment personnel compensation program and whether this structure provides appropriate incentives to act in the best interests of the fund.
Resources Dedicated to Investment Management and Support Services. The Board reviewed the general qualifications and capabilities of Fidelity's investment staff, including its size, education, experience, and resources, as well as Fidelity's approach to recruiting, training, managing, and compensating investment personnel. The Board noted the resources devoted to Fidelity's global investment organization, and that Fidelity's analysts have extensive resources, tools and capabilities that allow them to conduct quantitative and fundamental analysis, as well as credit analysis of issuers, counterparties and guarantors. Further, the Board considered that Fidelity's investment professionals have sufficient access to global information and data so as to provide competitive investment results over time, and that those professionals also have access to sophisticated tools that permit them to assess portfolio construction and risk and performance attribution characteristics continuously, as well as to transmit new information and research conclusions rapidly around the world. Additionally, in its deliberations, the Board considered Fidelity's trading, risk management, compliance, cybersecurity, and technology and operations capabilities and resources, which are integral parts of the investment management process.
Administrative Services. The Board considered (i) the nature, extent, quality, and cost of advisory and administrative services performed by the Investment Advisers and their affiliates under the Advisory Contracts and under separate agreements covering transfer agency and pricing and bookkeeping services for the fund; (ii) the nature and extent of Fidelity's supervision of third party service providers, principally custodians, subcustodians, and pricing vendors; and (iii) the resources devoted by Fidelity to, and the record of compliance with, the fund's compliance policies and procedures, including with respect to liquidity risk management. The Board also considered the fund's securities lending activities and any payments made to Fidelity relating to securities lending under a separate agreement.
Investment Performance. The Board reviewed the fund's absolute investment performance, as well as the fund's relative investment performance. In this regard, the Board noted that the fund is designed to offer a liquid investment option for other Fidelity funds and accounts and ultimately to enhance the performance of those funds and accounts.
Based on its review, the Board concluded that the nature, extent, and quality of services provided to the fund under the Advisory Contracts should continue to benefit the shareholders of the fund.
Competitiveness of Management Fee and Total Expense Ratio. The Board considered that while the fund does not pay a management fee, FMR receives fees for providing services to funds that invest in the fund. The Board also noted that FMR bears all expenses of the fund with certain limited exceptions (i.e., custody fees, interest, taxes, fees and expenses of the Independent Trustees, proxy and shareholder meeting expenses, and extraordinary expenses). The Board further noted that the fund pays its non-operating expenses, including brokerage commissions and fees and expenses associated with the fund's securities lending program, if applicable. Based on its review, the Board concluded that the management fee received for providing services to the fund and the fund's total expense ratio were reasonable in light of the services that the fund and its shareholders receive and the other factors considered.
Costs of the Services and Profitability. The Board considered the profitability of the funds that invest in the fund, as well as Fidelity's profits in respect of all the Fidelity funds.
A public accounting firm has been engaged annually by the Board as part of the Board's assessment of Fidelity's profitability analysis. The engagement includes the review and assessment of the methodologies used by Fidelity in determining the revenues and expenses attributable to Fidelity's fund business. After considering the reports issued under the engagement and information provided by Fidelity, the Board concluded that while other allocation methods may also be reasonable, Fidelity's profitability methodologies are reasonable in all material respects.
The Board also reviewed Fidelity's non-fund businesses and potential indirect benefits such businesses may have received as a result of their association with Fidelity's fund business (i.e., fall-out benefits) as well as cases where Fidelity's affiliates may benefit from the funds' business. The Board considered areas where potential indirect benefits to the Fidelity funds from their relationships with Fidelity may exist. The Board's consideration of these matters was informed by the findings of a joint ad hoc committee created by it and the boards of other Fidelity funds to evaluate potential fall-out benefits.
The Board concluded that the costs of the services provided by and the profits realized by Fidelity in connection with the operation of the fund were not relevant to the renewal of the Advisory Contracts because the fund pays no advisory fees and FMR bears all expenses of the fund with certain limited exceptions.
Economies of Scale. The Board concluded that because the fund pays no advisory fees and FMR bears all expenses of the fund with certain limited exceptions, the realization of economies of scale was not a material factor in the Board's decision to renew the fund's Advisory Contract.
Additional Information Requested by the Board. In order to develop fully the factual basis for consideration of the Fidelity funds' advisory contracts, the Board requested and received additional information on certain topics, including: (i) portfolio manager changes that have occurred during the past year; (ii) hiring, training, compensating, and retaining adviser and sub-adviser personnel; (iii) the terms of the funds' various management fee structures and arrangements for transfer agent and pricing and bookkeeping services; (iv) Fidelity's fund profitability methodology, profitability trends for certain funds, the allocation of various costs to different funds, and the impact of certain factors on fund profitability results; (v) the impact on fund profitability of recent industry trends, such as the growth in passively managed funds and the changes in flows for different types of funds; (vi) the types of management fee and total expense comparisons provided, and the challenges and limitations associated with such information; (vii) explanations regarding the relative total expense ratios and management fees of certain funds and classes, total expense and management fee competitive trends, and methodologies for total expense and management fee competitive comparisons; (viii) matters related to money market funds, exchange-traded funds, and target date funds; (ix) the arrangements with and compensation paid to certain fund sub-advisers and the treatment of such compensation within Fidelity's fund profitability methodology; and (x) the terms of management contracts between Fidelity and other funds and products not overseen by the Board.
Conclusion. Based on its evaluation of all of the conclusions noted above, and after considering all factors it believed relevant, the Board, including the Independent Trustees, concluded that the advisory and sub-advisory fee arrangements are fair and reasonable in light of all of the surrounding circumstances and that the fund's Advisory Contracts should be renewed through September 30, 2025.
1.822351.119
TP1-ANN-1124
Item 8.
Changes in and Disagreements with Accountants for Open-End Management Investment Companies
See Item 7.
Item 9.
Proxy Disclosures for Open-End Management Investment Companies
See Item 7.
Item 10.
Remuneration Paid to Directors, Officers, and Others of Open-End Management Investment Companies
See Item 7.
Item 11.
Statement Regarding Basis for Approval of Investment Advisory Contract
See Item 7.
Item 12.
Disclosure of Proxy Voting Policies and Procedures for Closed-End Management Investment Companies
Not applicable.
Item 13.
Portfolio Managers of Closed-End Management Investment Companies
Not applicable.
Item 14.
Purchase of Equity Securities by Closed-End Management Investment Company and Affiliated Purchasers
Not applicable.
Item 15.
Submission of Matters to a Vote of Security Holders
There were no material changes to the procedures by which shareholders may recommend nominees to the trust’s Board of Trustees.
Item 16.
Controls and Procedures
(a)(i) The President and Treasurer and the Chief Financial Officer have concluded that the trust’s disclosure controls and procedures (as defined in Rule 30a-3(c) under the Investment Company Act) provide reasonable assurances that material information relating to the trust is made known to them by the appropriate persons, based on their evaluation of these controls and procedures as of a date within 90 days of the filing date of this report.
(a)(ii) There was no change in the trust’s internal control over financial reporting (as defined in Rule 30a-3(d) under the Investment Company Act) that occurred during the period covered by this report that has materially affected, or is reasonably likely to materially affect, the trust’s internal control over financial reporting.
Item 17.
Disclosure of Securities Lending Activities for Closed-End Management Investment Companies
Not applicable.
Item 18.
Recovery of Erroneously Awarded Compensation
(a)
Not applicable.
(b)
Not applicable.
Item 19.
Exhibits
SIGNATURES
Pursuant to the requirements of the Securities Exchange Act of 1934 and the Investment Company Act of 1940, the registrant has duly caused this report to be signed on its behalf by the undersigned, thereunto duly authorized.
Fidelity Central Investment Portfolios II LLC
|
By: | /s/Laura M. Del Prato |
| Laura M. Del Prato |
| President and Treasurer (Principal Executive Officer) |
|
|
Date: | November 21, 2024 |
Pursuant to the requirements of the Securities Exchange Act of 1934 and the Investment Company Act of 1940, this report has been signed below by the following persons on behalf of the registrant and in the capacities and on the dates indicated.
|
By: | /s/Laura M. Del Prato |
| Laura M. Del Prato |
| President and Treasurer (Principal Executive Officer) |
|
|
Date: | November 21, 2024 |
|
By: | /s/Stephanie Caron |
| Stephanie Caron |
| Chief Financial Officer (Principal Financial Officer) |
|
|
Date: | November 21, 2024 |