UNITED STATES
SECURITIES AND EXCHANGE COMMISSION
Washington, D.C. 20549
FORM N-CSR
CERTIFIED SHAREHOLDER REPORT OF REGISTERED MANAGEMENT INVESTMENT COMPANIES
Investment Company Act file number 811-22077
Prospector Funds, Inc.
(Exact name of registrant as specified in charter)
370 Church St., Guilford, CT 06437
(Address of principal executive offices) (Zip code)
Prospector Partners Asset Management, LLC, 370 Church St., Guilford, CT 06437
(Name and address of agent for service)
(203) 458-1500
Registrant's telephone number, including area code
Date of fiscal year end: December 31, 2007
Date of reporting period: December 31, 2007
Item 1. Report to Stockholders.
PROSPECTOR CAPITAL APPRECIATION FUND
PROSPECTOR OPPORTUNITY FUND
ANNUAL REPORT
| www.prospectorfunds.com | DECEMBER 31, 2007 |
PROSPECTOR FUNDS, INC.
FEBRUARY 22, 2008
To the Shareholders and Directors of Prospector Capital Appreciation Fund and Prospector Opportunity Fund:
Welcome to the Prospector Funds family! We are pleased to report our results for the partial year ended December 31, 2007. The funds were launched on September 28, 2007 into a turbulent equity market. We believe that this choppy environment has allowed us to invest your money prudently into attractive investment opportunities.
How We Got Here
It has been quite a millennium so far in the stock market. We began at the peak of the internet bubble when internet companies sold equity to fund advertising campaigns, telecommunications companies vastly overspent on building national fiber optic networks, and new valuation metrics such as price to eyeballs (web page views) dominated the scene. As the bubble burst, corporate malfeasance came to light (Worldcom, Global Crossing, Tyco, Enron, et al), causing a crisis in confidence in corporate America. As a result the technology/internet laden Nasdaq fell by 75% and the broader S&P 500 dropped 44% by the end of 2002.
The Fed, under the leadership of Alan Greenspan, intervened by cutting short term rates fast and hard to 1% in an attempt to limit the longer term damage. This abundance of cheap funding precipitated a boom in borrowing activity. Most everyone levered up, including consumers, corporations, and institutional investors. The easy borrowing led to rapid asset price inflation as vacation houses, commercial real estate, fine art, and companies all appreciated rapidly from 2003 through 2006.
Wall Street satisfied the rising appetite for leverage by creating innovative new structures, such as securitization of new asset classes (e.g. sub prime), collateralized debt obligations (CDO) and collateralized loan obligations (CLO). The common element of these new constructs was the removal of consequences to the originator of the loan for the ultimate performance of the loan. The rating agencies fell prey to smooth talking investment bankers who made the case for high ratings for these untested securities. Regulators watched the banks while the most aggressive action occurred in the unregulated world of hedge funds and derivatives.
The U.S. consumer enjoyed the fruits of rising wealth, driven by home values and stock market/retirement account balances. The consumer responded to this good fortune by increasing spending faster than income growth for the past few years, keeping the U.S. economy on a solid growth trend through 2006.
By early 2007, the first signs of concern appeared in the form of rising defaults by sub prime borrowers. The percentage of households in the U.S. who own their own home had risen rapidly to an all time high. This increase was driven primarily by the lure of rapid price appreciation and the availability of mortgage debt to less creditworthy borrowers at low introductory rates. The rising default statistics were quickly dismissed as "an isolated segment" by institutional investors. By mid summer 2007, the problems had spread to CDO’s containing sub prime mortgage debt, resulting in a first wave of ratings downgrades of these structures which precipitated further sharp price declines.
Price declines in leveraged portfolios then triggered margin calls. Investors tried to clear out their sub prime and related CDO positions but found few takers and unacceptable prices. Hence they started to unload assets that were more saleable such as high yield and leveraged loans. This put pressure on prices in those markets and resulted in contagion of the credit crisis to these markets. Compounding the issue was the fact that many of
PROSPECTOR FUNDS, INC.
these leveraged holders (e.g. structured investment vehicles or SIV’s) of "now" less liquid assets were themselves funded short term in the commercial paper market. Investors quickly lost confidence in these vehicles and refused to roll their funding. Over the period of a few short months, investors have cycled from viewing the world as a champagne flute half full to seeing the current environment as a half empty beer mug.
Money center banks and major investment banks have been stuck holding large inventories of questionable assets and funding commitments. In recent months, concurrent with changes in top management, they have begun to report huge write downs of the value of questionable assets, causing capital shortfalls. Auditors are less likely to bless "mark to model" pricing for these assets. The full force of the credit crunch is upon us.
Ben Bernanke and the Fed changed course in September and continued in December by cutting short term rates. The easy money tonic administered by the Fed may or may not prove the best medicine. Should an economy made drunk (and dependent) on excess leverage brought about by an accommodating central bank be given an extra shot of easy money at the first sign of the shakes (detoxification)? Will rising inflationary forces accelerate? Will foreigners lose their appetite for dollar reserves? Will easy money increase banks willingness to lend or consumers desire to borrow? Should the Fed bail out institutional speculators who overextend themselves time and time again?
Where We Are
Capital Appreciation Fund:
The investment objective of the Capital Appreciation Fund is capital appreciation. The investment strategy utilized by Prospector Partners Asset Management, LLC (the "Advisor") to achieve this objective for the Capital Appreciation Fund is to invest in securities using a value orientation consisting of bottom-up fundamental value analysis with an emphasis on balance sheet strength. In pursuit of its value oriented strategy, the Capital Appreciation Fund will invest without regard to market capitalization.
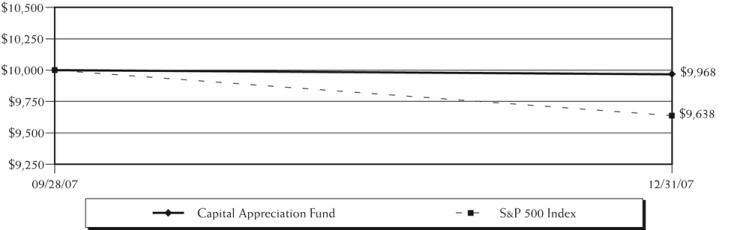
Since the fund’s inception on September 28, 2007 through December 31, 2007, the Capital Appreciation Fund reflected a -0.32% return to shareholders as compared to the S&P 500 index return for the same period of -3.62%.
Portfolio gainers included energy and electric utility shares which substantially offset weakness in real estate related, independent power producer, and pharmaceutical issues.
Opportunity Fund:
The general investment policy of the Opportunity Fund is to invest using the same value orientation as the Capital Appreciation Fund. In pursuit of its value-oriented strategy, the Advisor for the Opportunity Fund will invest significantly in small-to-mid capitalization companies with market capitalizations at the time of investment in the range of between $150 million and $15 billion.
Since the fund’s inception on September 28, 2007 through December 31, 2007, the Capital Appreciation Fund has returned 0.11% to shareholders as compared to the Russell Mid Cap index return of -3.80% and the Russell 2000 index return of -5.58% for the same period.
Opportunity Fund investments in energy and consumer staple industries generated solid performance and offset declines in the prices of financial services and restaurant shares.
PROSPECTOR FUNDS, INC.
Outlook
The macro outlook is mixed. Most positive is that interest rates remain historically low with an accommodating Fed. GDP and corporate profits growth are slightly positive. Corporate balance sheets remain generally strong. When these factors are combined with a mid teens earnings multiple, the outlook for investing in equities seems reasonable. On the other hand, the housing market is in terrible shape with price declines, increased unsold inventory and foreclosures, and painful mortgage price resets still on the horizon. Consumer spending outlook is murky with concerns about energy, healthcare, and housing costs weighing heavily. Inflation pressure is rising while the value of the dollar is falling as a result of the Fed’s actions. The M&A market has cooled as the availability of credit has contracted. The odds of an economic slowdown in 2008 have risen as well.
As always, now is the most difficult time to invest.
Respectfully submitted,
| | | |
| John D. Gillespie | Richard P. Howard | Kevin R. O’Brien |
Performance data quoted represents past performance; past performance does not guarantee future results. Short-term performance, in particular, is not a good indication of the fund’s performance, and an investment should not be made based solely on returns.
Must be preceded or accompanied by a prospectus.
Mutual fund investing involves risk. Principal loss is possible. Investments in debt securities typically decrease in value when interest rates rise. This risk is usually greater for longer-term debt securities. The Funds invest in foreign securities which involve greater volatility and political, economic and currency risks and differences in accounting methods. The Funds invests in smaller and mid-cap companies, which involve additional risks such as limited liquidity and greater volatility. The fund may hold restricted securities purchased through private placements. Such securities can be difficult to sell without experiencing delays or additional costs. Derivatives involve risks different from, and in certain cases, greater than the risks presented by more traditional investments. These risks are fully disclosed in the prospectus.
Investment performance reflects fee waivers in effect. In the absence of such waivers, total return would be reduced.
The S&P 500 Index is a broad based unmanaged index of 500 stocks, which is widely recognized as representative of the equity market in general. The Russell 2000 Index consists of the smallest 2,000 companies in a group of 3,000 U.S. companies in the Russell 3000 Index, as ranked by market capitalization. The Russell Midcap Index measures the performance of the mid-cap segment of the U.S. equity universe. The Russell Midcap Index is a subset of the Russell 1000¨ Index. In includes approximately 800 of the smallest securities based on a combination of their market cap and current index membership. The Russell Midcap Index represents approximately 31% of the total market capitalization of the Russell 1000 companies. You cannot invest directly in an index.
Prospector Funds, Inc. are distributed by Quasar Distributors, LLC. (02/08)
PROSPECTOR FUNDS, INC.
Capital Appreciation Fund
The chart assumes an initial investment of $10,000. Performance reflects waivers of fee and operating expenses in effect. In the absence of such waivers, total return would be reduced. Past performance is not predictive of future performance. Investment return and principal value will fluctuate, so that your shares, when redeemed maybe worth more or less than their original cost. Performance assumes the reinvestment of capital gains and income distributions. The performance does not reflect the deduction of taxes that a shareholder would pay on Fund distributions or the redemption of Fund shares.
Rates of Return (%) |
| | Since Inception(1) to |
| | December 31, 2007 |
Capital Appreciation Fund | -0.32% |
S&P 500 Index(2) | -3.62% |
| (2) | The Standard & Poor’s 500 Index (S&P 500) is an unmanaged, capitalization-weighted index generally representative of the U.S. market for large capitalization stocks. This Index cannot be invested in directly. |
PROSPECTOR FUNDS, INC.
Opportunity Fund
The chart assumes an initial investment of $10,000. Performance reflects waivers of fee and operating expenses in effect. In the absence of such waivers, total return would be reduced. Past performance is not predictive of future performance. Investment return and principal value will fluctuate, so that your shares, when redeemed maybe worth more or less than their original cost. Performance assumes the reinvestment of capital gains and income distributions. The performance does not reflect the deduction of taxes that a shareholder would pay on Fund distributions or the redemption of Fund shares.
Rates of Return (%) |
| | Since Inception(1) to |
| | December 31, 2007 |
Opportunity Fund | 0.11% |
Russell 2000 Index(2) | -5.58% |
Russell Midcap Index(3) | -3.80% |
| (2) | An unmanaged small-cap index that measures the performance of the 2,000 smallest companies in the Russell 3000 Index. |
| (3) | An unmanaged mid-cap index that measures the performance of the 800 smallest companies in the Russell 1000 Index. |
PROSPECTOR FUNDS, INC.
EXPENSE EXAMPLE
DECEMBER 31, 2007
As a shareholder of the Fund, you incur two types of costs: (1) transaction costs, which may include but are not limited to, redemption fees, wire transfer fees, maintenance fee (IRA accounts), and exchange fees; and (2) ongoing costs, including management fees; distribution and/or service fees; and other Fund expenses. This Example is intended to help you understand your ongoing costs (in dollars) of investing in the Fund and to compare these costs with the ongoing costs of investing in other mutual funds. The Example is based on an investment of $1,000 invested at the beginning of the period and held for the entire period (September 28, 2007 – December 31, 2007).
ACTUAL EXPENSES
The first line of the table below provides information about actual account values and actual expenses. Although the Fund charges no sales load or transaction fees, you will be assessed fees for outgoing wire transfers, returned checks and stop payment orders at prevailing rates charged by U.S. Bancorp Fund Services, LLC, the Fund’s transfer agent. The example below includes, but is not limited to, management fees, shareholder servicing fees and other Fund expenses. However, the example below does not include portfolio trading commissions and related expenses, interest expense and other extraordinary expenses as determined under generally accepted accounting principles. You may use the information in this line, together with the amount you invested, to estimate the expenses that you paid over the period. Simply divide your account value by $1,000 (for example, an $8,600 account value divided by $1,000 = 8.6), then multiply the result by the number in the first line under the heading entitled "Expenses Paid During Period" to estimate the expenses you paid on your account during this period.
HYPOTHETICAL EXAMPLE FOR COMPARISON PURPOSES
The second line of the table below provides information about hypothetical account values and hypothetical expenses based on the Fund’s actual expense ratio and an assumed rate of return of 5% per year before expenses, which is not the Fund’s actual return. The hypothetical account values and expenses may not be used to estimate the actual ending account balance or expenses you paid for the period. You may use this information to compare the ongoing costs of investing in the Fund and other funds. To do so, compare this 5% hypothetical example with the 5% hypothetical examples that appear in the shareholder reports of the other funds.
Please note that the expenses shown in the table are meant to highlight your ongoing costs only and do not reflect any transactional costs, such as redemption fees or exchange fees. Therefore, the second line of the table is useful in comparing ongoing costs only, and will not help you determine the relative total costs of owning different funds. In addition, if these transactional costs were included, your costs would have been higher.
| | | | Expenses Paid |
| | Beginning Account | Ending Account | During Period(1) |
| | Value (09/28/07) | Value (12/31/07) | (09/28/07 to 12/31/07) |
Capital Appreciation Actual(2) | $1,000.00 | $ 996.80 | $3.77 |
| Capital Appreciation Hypothetical | | | |
| (5% return before expenses) | 1,000.00 | 1,008.82 | 3.80 |
Opportunity Actual(2) | 1,000.00 | 1,001.10 | 3.78 |
| Opportunity Hypothetical | | | |
| (5% return before expenses) | 1,000.00 | 1,008.82 | 3.80 |
| (1) | Expenses are equal to the fund’s annualized expense ratio for the period since inception of 1.50% and 1.50% for Capital Appreciation Fund and Opportunity Fund, respectively, multiplied by the average account value over the period, multiplied by the number of days in the period since inception/365 (to reflect the period since inception). |
| (2) | Based on the actual returns for the period from inception, September 28, 2007, through December 31, 2007 of -0.32% and 0.11% for Capital Appreciation Fund and Opportunity Fund, respectively. |
PROSPECTOR FUNDS, INC.
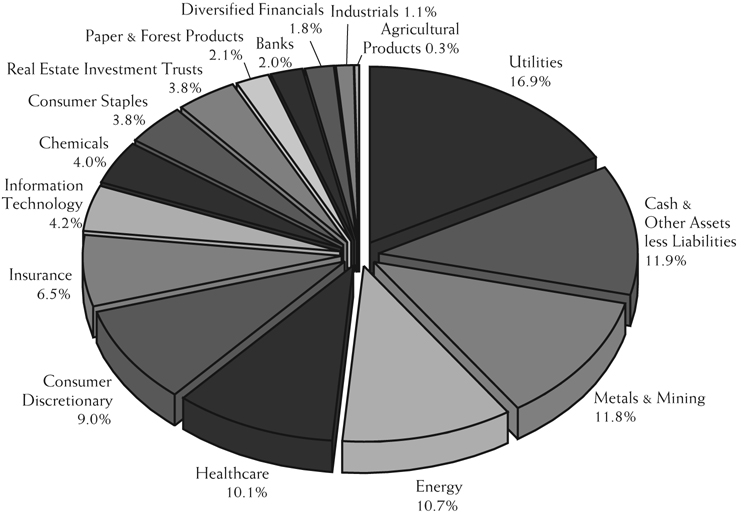
SECTOR ALLOCATION (% OF NET ASSETS)
AS OF DECEMBER 31, 2007(1)
Capital Appreciation Fund
TOP 10 HOLDINGS (% OF NET ASSETS)
AS OF DECEMBER 31, 2007(1)(2)
Capital Appreciation Fund
| Mirant | 6.7% |
| Cimarex Energy | 4.3% |
| Calpine, 8.500%, 02/15/2011 | 4.1% |
| E.I. Du Pont de Nemours | 4.0% |
| Unisource Energy | 3.7% |
| Post Properties | 3.4% |
| Barrick Gold | 2.9% |
| Newmont Mining | 2.7% |
| Berkshire Hathaway, Class B | 2.6% |
| YRC Worldwide, 4.886%, 01/15/2024 | 2.6% |
| | |
| (1) | Fund holdings and sector allocations are subject to change at any time and are not recommendations to buy or sell any security. |
| (2) | Excludes short-term holdings. |
PROSPECTOR FUNDS, INC.
SECTOR ALLOCATION (% OF NET ASSETS)
AS OF DECEMBER 31, 2007(1)
Opportunity Fund
TOP 10 HOLDINGS (% OF NET ASSETS)
AS OF DECEMBER 31, 2007(1)(2)
| UST | 2.7% |
| Cimarex Energy | 2.6% |
| Unisource Energy | 2.4% |
| Invesco, ADR | 2.4% |
| Calpine, 8.500%, 02/15/2011 | 2.4% |
| Mirant | 2.4% |
| Church & Dwight | 2.1% |
| CMS Energy | 2.0% |
| Zenith National Insurance | 2.0% |
| CACI International | 1.9% |
| | |
| (1) | Fund holdings and sector allocations are subject to change at any time and are not recommendations to buy or sell any security. |
| (2) | Excludes short-term holdings. |
PROSPECTOR FUNDS, INC.
SCHEDULE OF INVESTMENTS
DECEMBER 31, 2007
Capital Appreciation Fund
Description | | Shares | | | Value | |
COMMON STOCKS – 59.7% | | | | | | |
Agricultural Products – 0.3% | | | | | | |
| Saskatchewan Wheat Pool* | | | 2,000 | | | $ | 27,012 | |
Banks – 2.0% | | | | | | | | |
| Capitol Federal Financial | | | 1,500 | | | | 46,500 | |
| Charter Financial | | | 1,400 | | | | 51,800 | |
| Fox Chase Bancorp* | | | 100 | | | | 1,140 | |
| Investors Bancorp* | | | 1,000 | | | | 14,140 | |
| Oritani Financial* | | | 1,200 | | | | 14,760 | |
| Rockville Financial | | | 1,000 | | | | 12,200 | |
| Roma Financial | | | 300 | | | | 4,707 | |
| Wauwatosa Holdings* | | | 1,200 | | | | 15,384 | |
| | | | | | | | 160,631 | |
Chemicals – 4.0% | | | | | | | | |
| E.I. Du Pont de Nemours | | | 7,400 | | | | 326,266 | |
Consumer Discretionary – 4.8% | | | | | | | | |
| E.W. Scripps, Class A | | | 1,200 | | | | 54,012 | |
| Fortune Brands | | | 600 | | | | 43,416 | |
| H&R Block | | | 3,000 | | | | 55,710 | |
| Meredith | | | 3,400 | | | | 186,932 | |
| New York Times, Class A | | | 2,700 | | | | 47,331 | |
| | | | | | | | 387,401 | |
Consumer Staples – 1.6% | | | | | | | | |
| Coca-Cola | | | 800 | | | | 49,096 | |
| Tootsie Roll Industries | | | 3,000 | | | | 82,260 | |
| | | | | | | | 131,356 | |
Energy – 10.7% | | | | | | | | |
| Chevron | | | 300 | | | | 27,999 | |
| Cimarex Energy | | | 8,200 | | | | 348,746 | |
| Clayton Williams Energy* | | | 200 | | | | 6,232 | |
| Encore Acquisition* | | | 1,800 | | | | 60,066 | |
| Hess | | | 1,600 | | | | 161,376 | |
| Petro – Canada | | | 2,800 | | | | 150,136 | |
| Plains Exploration & Production* | | | 2,235 | | | | 120,690 | |
| | | | | | | | 875,245 | |
Healthcare – 1.5% | | | | | | | | |
| Pfizer | | | 5,500 | | | | 125,015 | |
See Notes to the Financial Statements
PROSPECTOR FUNDS, INC.
SCHEDULE OF INVESTMENTS – CONTINUED
DECEMBER 31, 2007
Capital Appreciation Fund – Continued
Description | | Shares | | | Value | |
COMMON STOCKS – 59.7% (CONTINUED) | | | | | | |
Industrials – 0.2% | | | | | | |
| Tyco International | | | 500 | | | $ | 19,825 | |
Information Technology – 1.8% | | | | | | | | |
| Automatic Data Processing | | | 1,800 | | | | 80,154 | |
| IBM | | | 300 | | | | 32,430 | |
| Xerox | | | 2,000 | | | | 32,380 | |
| | | | | | | | 144,964 | |
Insurance – 4.8% | | | | | | | | |
| Berkshire Hathaway, Class B* | | | 45 | | | | 213,120 | |
| Cincinnati Financial | | | 1,300 | | | | 51,402 | |
| Employers Holdings | | | 2,600 | | | | 43,446 | |
| Marsh & McLennan | | | 1,400 | | | | 37,058 | |
| State Auto Financial | | | 1,900 | | | | 49,970 | |
| | | | | | | | 394,996 | |
Metals & Mining – 9.3% | | | | | | | | |
| Alcoa | | | 2,900 | | | | 105,995 | |
| Barrick Gold | | | 5,600 | | | | 235,480 | |
| Gold Fields, ADR | | | 11,500 | | | | 163,300 | |
| Newmont Mining | | | 4,500 | | | | 219,735 | |
| Norsk Hydro, ADR | | | 1,100 | | | | 15,720 | |
| Northgate Minerals* | | | 6,000 | | | | 18,180 | |
| | | | | | | | 758,410 | |
Paper & Forest Products – 2.1% | | | | | | | | |
| Domtar* | | | 3,400 | | | | 26,146 | |
| Fraser Papers* | | | 2,500 | | | | 6,789 | |
| International Paper | | | 800 | | | | 25,904 | |
| Neenah Paper | | | 200 | | | | 5,830 | |
| TimberWest Forest | | | 7,100 | | | | 105,750 | |
| | | | | | | | 170,419 | |
Real Estate Investment Trusts – 3.8% | | | | | | | | |
| Post Properties | | | 8,000 | | | | 280,960 | |
| Thomas Properties Group | | | 3,000 | | | | 32,340 | |
| | | | | | | | 313,300 | |
Utilities – 12.8% | | | | | | | | |
| British Energy Group | | | 2,800 | | | | 30,600 | |
| Mirant* | | | 14,000 | | | | 545,720 | |
See Notes to the Financial Statements
SCHEDULE OF INVESTMENTS – CONTINUED
DECEMBER 31, 2007
Capital Appreciation Fund – Continued
Description | | Shares | | | Value | |
COMMON STOCKS – 59.7% (CONTINUED) | | | | | | |
Utilities – 12.8% (Continued) | | | | | | |
| MMC Energy* | | | 2,000 | | | $ | 7,000 | |
| NorthWestern | | | 3,000 | | | | 88,500 | |
| Sierra Pacific Resources | | | 4,300 | | | | 73,014 | |
| Unisource Energy | | | 9,500 | | | | 299,725 | |
| | | | | | | | 1,044,559 | |
Total Common Stocks | | | | | | | | |
(Cost $4,949,083) | | | | | | | 4,879,399 | |
| | | | | | | | | |
| | | Par | | | | | |
CONVERTIBLE CORPORATE BONDS – 24.3% | | | | | | | | |
| Amdocs, 0.500%, 03/15/2024 | | $ | 100,000 | | | | 101,625 | |
| Amgen, 0.125%, 02/01/2011 | | | 225,000 | | | | 205,031 | |
| Anglogold Ashanti, 2.375%, 02/27/2009 | | | 200,000 | | | | 200,700 | |
| Archer Daniels, 0.875%, 02/15/2014 | | | 150,000 | | | | 180,937 | |
| Carnival, 1.132%, 04/29/2033 | | | 125,000 | | | | 82,656 | |
| Conseco, 3.500%, 09/30/2035 | | | 75,000 | | | | 65,531 | |
| ERP Operating, 3.850%, 08/15/2026 | | | 150,000 | | | | 143,850 | |
| Eastman Kodak, 3.375%, 10/15/2033 | | | 175,000 | | | | 178,063 | |
| Electronic Data Systems, 3.875%, 07/15/2023 | | | 100,000 | | | | 99,375 | |
| JetBlue Airways, 3.750%, 03/15/2035 | | | 25,000 | | | | 21,687 | |
| Medtronic, 1.500%, 04/15/2011 | | | 175,000 | | | | 186,813 | |
| Prudential Financial, 2.733%, 12/12/2036 (a) | | | 75,000 | | | | 74,745 | |
| St Jude Medical, 1.220%, 12/15/2008 | | | 100,000 | | | | 100,250 | |
| UAL, 5.000%, 02/01/2021 | | | 25,000 | | | | 25,969 | |
| Walt Disney, 2.125%, 04/15/2023 | | | 75,000 | | | | 85,500 | |
| Wyeth, 4.886%, 01/15/2024 (a) | | | 200,000 | | | | 211,008 | |
| YRC Worldwide, 3.375%, 11/25/2023 | | | 25,000 | | | | 20,500 | |
Total Convertible Corporate Bonds | | | | | | | | |
(Cost $1,976,909) | | | | | | | 1,984,240 | |
| | | | | | | | | |
CORPORATE BOND – 4.1% | | | | | | | | |
| Calpine, 8.500%, 02/15/2011* (b) | | | | | | | | |
(Cost $339,455) | | | 300,000 | | | | 337,500 | |
See Notes to the Financial Statements
PROSPECTOR FUNDS, INC.
SCHEDULE OF INVESTMENTS – CONTINUED
DECEMBER 31, 2007
Capital Appreciation Fund – Continued
Description | | Shares | | | Value | |
RIGHT– 0.0% | | | | | | |
| Fraser Papers | | | | | | |
(Cost $193) | | | 2,500 | | | $ | 13 | |
| | | | | | | | | |
SHORT-TERM INVESTMENT – 13.2% | | | | | | | | |
| AIM Short-Term Treasury Portfolio | | | | | | | | |
(Cost $1,075,972) | | | 1,075,972 | | | | 1,075,972 | |
Total Investments – 101.3% | | | | | | | | |
(Cost $8,341,612) | | | | | | | 8,277,124 | |
Other Assets and Liabilities, Net – (1.3%) | | | | | | | (109,127 | ) |
Total Net Assets – 100.0% | | | | | | $ | 8,167,997 | |
| * | Non-income producing security. |
| (a) | Variable rate security at December 31, 2007. |
| (b) | Security in default at December 31, 2007. |
ADR – American Depository Receipt
See Notes to the Financial Statements
PROSPECTOR FUNDS, INC.
SCHEDULE OF INVESTMENTS
DECEMBER 31, 2007
Opportunity Fund
Description | | Shares | | | Value | |
COMMON STOCKS – 86.1% | | | | | | |
Agricultural Products – 1.0% | | | | | | |
| Saskatchewan Wheat Pool* | | | 4,400 | | | $ | 59,428 | |
Banks – 10.1% | | | | | | | | |
| Abington Bancorp | | | 11,300 | | | | 106,220 | |
| Charter Financial | | | 1,040 | | | | 38,480 | |
| Countrywide Financial | | | 500 | | | | 4,470 | |
| Fox Chase Bancorp* | | | 8,900 | | | | 101,460 | |
| Heritage Financial Group | | | 2,360 | | | | 26,550 | |
| OceanFirst Financial | | | 1,200 | | | | 18,972 | |
| Oritani Financial* | | | 7,100 | | | | 87,330 | |
| Roma Financial | | | 3,700 | | | | 58,053 | |
| State Bancorp | | | 2,600 | | | | 33,800 | |
| UnionBanCal | | | 800 | | | | 39,128 | |
| ViewPoint Financial Group | | | 600 | | | | 9,918 | |
| Westfield Financial | | | 7,100 | | | | 68,870 | |
| | | | | | | | 593,251 | |
Chemicals – 0.6% | | | | | | | | |
| Scotts Miracle-Gro | | | 1,000 | | | | 37,420 | |
Consumer Discretionary – 3.8% | | | | | | | | |
| AFC Enterprises* | | | 7,300 | | | | 82,636 | |
| American Eagle Outfitters | | | 1,400 | | | | 29,078 | |
| Dollar Thrifty Automotive Group* | | | 1,100 | | | | 26,048 | |
| Landry’s Restaurants | | | 1,800 | | | | 35,460 | |
| NVR* | | | 100 | | | | 52,400 | |
| | | | | | | | 225,622 | |
Consumer Staples – 8.5% | | | | | | | | |
| Church & Dwight | | | 2,250 | | | | 121,657 | |
| Heineken Holding | | | 1,500 | | | | 84,938 | |
| Hershey | | | 2,660 | | | | 104,804 | |
| Tootsie Roll Industries | | | 1,200 | | | | 32,904 | |
| UST | | | 2,900 | | | | 158,920 | |
| | | | | | | | 503,223 | |
Diversified Financials – 5.1% | | | | | | | | |
| Bear Stearns | | | 210 | | | | 18,533 | |
| Cowen Group* | | | 2,700 | | | | 25,677 | |
| Invesco, ADR | | | 4,500 | | | | 141,210 | |
| Legg Mason | | | 800 | | | | 58,520 | |
| | | | | | | | | |
See Notes to the Financial Statements
PROSPECTOR FUNDS, INC.
SCHEDULE OF INVESTMENTS – CONTINUED
DECEMBER 31, 2007
Opportunity Fund – Continued
Description | | Shares | | | Value | |
COMMON STOCKS – 86.1% (CONTINUED) | | | | | | |
Diversified Financials – 5.1% (Continued) | | | | | | |
| Leucadia National | | | 1,200 | | | $ | 56,520 | |
| | | | | | | | 300,460 | |
Energy – 7.5% | | | | | | | | |
| Cimarex Energy | | | 3,600 | | | | 153,108 | |
| Encore Acquisition* | | | 1,700 | | | | 56,729 | |
| Hugoton Royalty Trust | | | 3,800 | | | | 85,234 | |
| Plains Exploration & Production* | | | 1,967 | | | | 106,218 | |
| San Juan Basin Royalty Trust | | | 1,200 | | | | 40,032 | |
| | | | | | | | 441,321 | |
Industrials – 2.7% | | | | | | | | |
| MTC Technologies* | | | 2,500 | | | | 58,750 | |
| Toro | | | 1,800 | | | | 97,992 | |
| | | | | | | | 156,742 | |
Information Technology – 7.7% | | | | | | | | |
| CACI International* | | | 2,440 | | | | 109,239 | |
| Dynamics Research* | | | 1,962 | | | | 21,228 | |
| Network Appliance* | | | 1,300 | | | | 32,448 | |
| Novellus Systems* | | | 3,300 | | | | 90,981 | |
| SAIC* | | | 4,800 | | | | 96,576 | |
| Symantec* | | | 2,000 | | | | 32,280 | |
| Zebra Technologies* | | | 2,000 | | | | 69,400 | |
| | | | | | | | 452,152 | |
Insurance – 19.4% | | | | | | | | |
| AON | | | 1,700 | | | | 81,073 | |
| Arch Capital Group* | | | 1,200 | | | | 84,420 | |
| Assurant | | | 1,200 | | | | 80,280 | |
| Axis Capital Holdings | | | 2,600 | | | | 101,322 | |
| Chubb | | | 1,070 | | | | 58,401 | |
| CIGNA | | | 1,500 | | | | 80,595 | |
| Cincinnati Financial | | | 1,500 | | | | 59,310 | |
| Hanover Insurance Group | | | 1,500 | | | | 68,700 | |
| Lancashire Holdings* | | | 10,900 | | | | 78,979 | |
| Lincoln National | | | 1,200 | | | | 69,864 | |
| Max Capital Group | | | 2,100 | | | | 58,779 | |
| Platinum Underwriters Holdings | | | 2,100 | | | | 74,676 | |
| Safety Insurance Group | | | 1,500 | | | | 54,930 | |
See Notes to the Financial Statements
PROSPECTOR FUNDS, INC.
SCHEDULE OF INVESTMENTS – CONTINUED
DECEMBER 31, 2007
Opportunity Fund – Continued
Description | | Shares | | | Value | |
COMMON STOCKS – 86.1% (CONTINUED) | | | | | | |
Insurance – 19.4% (Continued) | | | | | | |
| Wesco Financial Group | | | 186 | | | $ | 75,702 | |
| Zenith National Insurance | | | 2,600 | | | | 116,298 | |
| | | | | | | | 1,143,329 | |
Metals & Mining – 3.5% | | | | | | | | |
| Gold Fields, ADR | | | 7,500 | | | | 106,500 | |
| Kinross Gold* | | | 5,400 | | | | 99,360 | |
| | | | | | | | 205,860 | |
Paper & Forest Products – 2.4% | | | | | | | | |
| Domtar* | | | 6,500 | | | | 49,985 | |
| Neenah Paper | | | 800 | | | | 23,320 | |
| Timberwest Forest | | | 4,700 | | | | 70,004 | |
| | | | | | | | 143,309 | |
Real Estate Investment Trusts – 3.1% | | | | | | | | |
| Post Properties | | | 2,900 | | | | 101,848 | |
| Thomas Properties Group | | | 7,600 | | | | 81,928 | |
| | | | | | | | 183,776 | |
Utilities – 10.7% | | | | | | | | |
| CMS Energy | | | 6,700 | | | | 116,446 | |
| DPL | | | 1,900 | | | | 56,335 | |
| Mirant* | | | 3,600 | | | | 140,328 | |
| NorthWestern | | | 3,500 | | | | 103,250 | |
| Sierra Pacific Resources | | | 4,200 | | | | 71,316 | |
| Unisource Energy | | | 4,500 | | | | 141,975 | |
| | | | | | | | 629,650 | |
Total Common Stocks | | | | | | | | |
(Cost $5,112,205) | | | | | | | 5,075,543 | |
| | | | | | | | | |
Closed-End Fund – 0.2% | | | | | | | | |
| Clough Global Opportunities Fund | | | | | | | | |
(Cost $9,477) | | | 500 | | | | 9,470 | |
| | | | | | | | | |
| | | Par | | | | | |
Corporate Bond – 2.4% | | | | | | | | |
| Calpine, 8.500%, 02/15/2011* (a) | | | | | | | | |
(Cost $138,226) | | $ | 125,000 | | | | 140,625 | |
| | | | | | | | | |
See Notes to the Financial Statements
PROSPECTOR FUNDS, INC.
SCHEDULE OF INVESTMENTS – CONTINUED
DECEMBER 31, 2007
Opportunity Fund – Continued
Description | | Shares | | | Value | |
SHORT-TERM INVESTMENT – 9.4% | | | | | | |
| AIM Short-Term Treasury Portfolio | | | | | | |
(Cost $557,708) | | | 557,708 | | | $ | 557,708 | |
Total Investments – 98.1% | | | | | | | | |
(Cost $5,817,616) | | | | | | | 5,783,346 | |
Other Assets and Liabilities, Net – 1.9% | | | | | | | 112,385 | |
Total Net Assets – 100.0% | | | | | | $ | 5,895,731 | |
| * | Non-income producing security. |
| (a) | Security in default at December 31, 2007. |
ADR – American Depository Receipt
See Notes to the Financial Statements
PROSPECTOR FUNDS, INC.
STATEMENTS OF ASSETS AND LIABILITIES
DECEMBER 31, 2007
| | | Capital Appreciation Fund | | | Opportunity Fund | |
ASSETS: | | | | | | |
| Investments, at market value | | | | | | |
| (Cost $8,341,612 and $5,817,616 respectively) | | $ | 8,277,124 | | | $ | 5,783,346 | |
| Cash | | | — | | | | 144 | |
| Receivable for investment securities purchased | | | 77,188 | | | | — | |
| Receivable for dividends and interest | | | 25,286 | | | | 7,780 | |
| Receivable for capital shares sold | | | — | | | | 299,900 | |
| Receivable for adviser reimbursements | | | 50,256 | | | | 50,321 | |
| Offering costs | | | 64,020 | | | | 64,020 | |
| Prepaid expenses and other assets | | | 15,916 | | | | 15,916 | |
| Total assets | | | 8,509,790 | | | | 6,221,427 | |
| | | | | | | | | |
LIABILITIES: | | | | | | | | |
| Payable for investment securities purchased | | | 199,314 | | | | 188,434 | |
| Payable to adviser | | | 69,662 | | | | 64,937 | |
| Accrued distribution fees | | | 2,352 | | | | 1,725 | |
| Accrued expenses and other liabilities | | | 70,465 | | | | 70,600 | |
| Total liabilities | | | 341,793 | | | | 325,696 | |
| | | | | | | | | |
NET ASSETS | | $ | 8,167,997 | | | $ | 5,895,731 | |
| | | | | | | | | |
COMPOSITION OF NET ASSETS: | | | | | | | | |
| Portfolio Capital | | $ | 8,211,460 | | | $ | 5,946,347 | |
| Accumulated net realized gain (loss) on investments | | | 21,030 | | | | (16,342 | ) |
| Net unrealized depreciation of investments | | | (64,493 | ) | | | (34,274 | ) |
| Total Net Assets | | $ | 8,167,997 | | | $ | 5,895,731 | |
| | | | | | | | | |
CAPITAL STOCK, $0.0001 par value | | | | | | | | |
| Authorized | | | 500,000,000 | | | | 500,000,000 | |
| Issued and Outstanding | | | 546,581 | | | | 394,194 | |
| | | | | | | | | |
NET ASSET VALUE, REDEMPTION PRICE, | | | | | | | | |
AND OFFERING PRICE PER SHARE | | $ | 14.94 | | | $ | 14.96 | |
See Notes to the Financial Statements
PROSPECTOR FUNDS, INC.
STATEMENTS OF OPERATIONS
FOR THE PERIOD SEPTEMBER 28, 2007(1) THROUGH DECEMBER 31, 2007
| | | Capital Appreciation Fund | | | Opportunity Fund | |
INVESTMENT INCOME: | | | | | | |
| Interest income | | $ | 9,203 | | | $ | 5,553 | |
| Dividend income | | | 21,513 | | | | 21,521 | |
| Less: Foreign taxes withheld | | | (408 | ) | | | (193 | ) |
| Total investment income | | | 30,308 | | | | 26,881 | |
| | | | | | | | | |
EXPENSES: | | | | | | | | |
| Directors’ fees | | | 50,032 | | | | 50,032 | |
| Audit fees | | | 25,024 | | | | 25,024 | |
| Legal fees | | | 22,448 | | | | 22,448 | |
| Offering costs | | | 21,620 | | | | 21,620 | |
| Investment advisory fees | | | 17,571 | | | | 13,247 | |
| Administration fees | | | 10,672 | | | | 10,672 | |
| Fund accounting fees | | | 9,600 | | | | 9,600 | |
| Transfer agent fees | | | 6,146 | | | | 5,996 | |
| Custodian fees | | | 4,212 | | | | 4,212 | |
| Distribution fees | | | 3,993 | | | | 3,011 | |
| Registration fees | | | 3,938 | | | | 3,888 | |
| Other expenses | | | 3,548 | | | | 3,548 | |
| Postage and printing fees | | | 1,288 | | | | 1,288 | |
| Total expenses | | | 180,092 | | | | 174,586 | |
| Less: Fee waivers | | | (156,132 | ) | | | (156,522 | ) |
| Total net expenses | | | 23,960 | | | | 18,064 | |
NET INVESTMENT INCOME | | | 6,348 | | | | 8,817 | |
| | | | | | | | | |
REALIZED AND UNREALIZED GAINS (LOSSES): | | | | | | | | |
| Net realized gain (loss) on investments | | | 21,504 | | | | (5,978 | ) |
| Net change in unrealized depreciation of investments | | | (64,493 | ) | | | (34,274 | ) |
| Net loss on investments | | | (42,989 | ) | | | (40,252 | ) |
| | | | | | | | | |
NET DECREASE IN NET ASSETS | | | | | | | | |
RESULTING FROM OPERATIONS | | $ | (36,641 | ) | | $ | (31,435 | ) |
| (1) | Inception date of each fund. |
See Notes to the Financial Statements
PROSPECTOR FUNDS, INC.
STATEMENTS OF CHANGES IN NET ASSETS
| | | Capital Appreciation Fund | | | Opportunity Fund | |
| | | For the period | | | For the period | |
| | | September 28, 2007(1) | | | September 28, 2007(1) | |
| | | to | | | to | |
| | | December 31, 2007 | | | December 31, 2007 | |
OPERATIONS: | | | | | | |
| Net investment income | | $ | 6,348 | | | $ | 8,817 | |
| Net realized gain (loss) on investments | | | 21,504 | | | | (5,978 | ) |
| Net change in unrealized depreciation on investments | | | (64,493 | ) | | | (34,274 | ) |
| Net decrease resulting from operations | | | (36,641 | ) | | | (31,435 | ) |
| | | | | | | | | |
CAPITAL SHARE TRANSACTIONS: | | | | | | | | |
| Proceeds from shares sold | | | 8,155,359 | | | | 5,877,349 | |
| Proceeds from reinvestment of distributions | | | 6,376 | | | | 20,839 | |
| Payments for shares redeemed | | | (285 | ) | | | (195 | ) |
| Net increase from capital share transactions | | | 8,161,450 | | | | 5,897,993 | |
| | | | | | | | | |
DISTRIBUTIONS PAID FROM: | | | | | | | | |
| Net investment income | | | (6,822 | ) | | | (9,168 | ) |
| Net realized gains | | | — | | | | (11,669 | ) |
| Total distributions to shareholders | | | (6,822 | ) | | | (20,837 | ) |
| | | | | | | | | |
TOTAL INCREASE IN NET ASSETS | | | 8,117,987 | | | | 5,845,721 | |
| | | | | | | | | |
NET ASSETS: | | | | | | | | |
| Beginning of period | | | 50,010 | | | | 50,010 | |
| End of period (including undistributed net investment | | | | | | | | |
| income of $0 and $0, respectively) | | $ | 8,167,997 | | | $ | 5,895,731 | |
| | | | | | | | | |
TRANSACTIONS IN SHARES: | | | | | | | | |
| Shares sold | | | 542,839 | | | | 389,481 | |
| Shares issued in reinvestment of distributions | | | 426 | | | | 1,392 | |
| Shares redeemed | | | (18 | ) | | | (13 | ) |
| Net increase | | | 543,247 | | | | 390,860 | |
| (1) | Inception date of the fund. |
See Notes to the Financial Statements
PROSPECTOR FUNDS, INC.
FINANCIAL HIGHLIGHTS
| | | Capital Appreciation Fund | |
| | | September 28, 2007(1) | |
| | | through | |
| | | December 31, 2007 | |
| For a Fund share outstanding throughout the period | | | |
| | | | |
NET ASSET VALUE: | | | |
| Beginning of period | | $ | 15.00 | |
| | | | | |
OPERATIONS: | | | | |
| Net investment income | | | 0.01 | |
| Net realized and unrealized loss on investments | | | (0.06 | ) |
| Total from operations | | | (0.05 | ) |
| | | | | |
LESS DISTRIBUTIONS: | | | | |
| From net investment income | | | (0.01 | ) |
| From net realized gains | | | — | |
| Total distributions | | | (0.01 | ) |
| | | | | |
NET ASSET VALUE: | | | | |
| End of period | | $ | 14.94 | |
| | | | | |
TOTAL RETURN | | | (0.32 | )%(2) |
| | | | | |
SUPPLEMENTAL DATA AND RATIOS: | | | | |
| Net assets, end of period (in thousands) | | $ | 8,168 | |
| Ratio of expenses to average net assets: | | | | |
| Before expense reimbursement | | | 11.28 | %(3) |
| After expense reimbursement | | | 1.50 | %(3) |
| Ratio of net investment income (loss) to average net assets: | | | | |
| Before expense reimbursement | | | (9.38 | )%(3) |
| After expense reimbursement | | | 0.40 | %(3) |
| Portfolio turnover rate | | | 5 | %(2) |
| (1) | Inception date of the fund. |
See Notes to the Financial Statements
PROSPECTOR FUNDS, INC.
FINANCIAL HIGHLIGHTS
| | | Opportunity Fund | |
| | | September 28, 2007(1) | |
| | | through | |
| | | December 31, 2007 | |
| For a Fund share outstanding throughout the period | | | |
| | | | |
NET ASSET VALUE: | | | |
| Beginning of period | | $ | 15.00 | |
| | | | | |
OPERATIONS: | | | | |
| Net investment income | | | 0.02 | |
| Net realized and unrealized gain on investment securities | | | (0.01 | ) |
| Total from operations | | | 0.01 | |
| | | | | |
LESS DISTRIBUTIONS: | | | | |
| From net investment income | | | (0.02 | ) |
| From net realized gains | | | (0.03 | ) |
| Total distributions | | | (0.05 | ) |
| | | | | |
NET ASSET VALUE: | | | | |
| End of period | | $ | 14.96 | |
| | | | | |
TOTAL RETURN | | | 0.11 | %(2) |
| | | | | |
SUPPLEMENTAL DATA AND RATIOS: | | | | |
| Net assets, end of period (in thousands) | | $ | 5,896 | |
| Ratio of expenses to average net assets: | | | | |
| Before expense reimbursement | | | 14.50 | %(3) |
| After expense reimbursement | | | 1.50 | %(3) |
| Ratio of net investment income (loss) to average net assets: | | | | |
| Before expense reimbursement | | | (12.27 | )%(3) |
| After expense reimbursement | | | 0.73 | %(3) |
| Portfolio turnover rate | | | 18 | %(2) |
| (1) | Inception date of the fund. |
See Notes to the Financial Statements
PROSPECTOR FUNDS, INC.
NOTES TO THE FINANCIAL STATEMENTS
DECEMBER 31, 2007
1. ORGANIZATION
Prospector Funds, Inc. (the "Corporation") was organized as a Maryland corporation on June 6, 2007 and is registered under the Investment Company Act of 1940 (the "1940 Act"), as amended, as an open-end diversified management investment company. The Corporation issues its shares in series, each series representing a distinct portfolio with its own investment objectives and policies. There are two series presently authorized, the Prospector Capital Appreciation Fund and the Prospector Opportunity Fund (individually a "Fund" and collectively the "Funds"). The Funds commenced operations on September 28, 2007.
2. SIGNIFICANT ACCOUNTING POLICIES
The following is a summary of significant accounting policies consistently followed by each Fund:
Security Valuation– Portfolio securities which are traded on an exchange are valued at the last sales price reported by the exchange on which the securities are primarily traded on the day of valuation. If there are no sales on a given day for securities traded on an exchange or for securities not traded or dealt on any securities exchange for which over-the-counter market quotations are readily available, the latest bid quotation will be used. Debt securities with remaining maturities of 60 days or less may be valued on an amortized cost basis, which involves valuing an instrument at its cost and thereafter assuming a constant amortization to maturity of any discount or premium, regardless of the impact of fluctuating rates on the market value of the instrument. Any securities or other assets for which market quotations are not readily available are valued at fair value as determined in good faith by Prospector Partners Asset Management, LLC (the "Adviser" or "Investment Manager") pursuant to procedures established under the general supervision and responsibility of the Funds’ Board of Directors.
Distributions to Shareholders– Dividends from net investment income and distributions of net realized capital gains, if any, will be declared and paid at least annually. The character of distributions made during the period from net investment income or net realized gains may differ from the characterization for federal income tax purposes due to differences in the recognition of income, expense and gain items for financial statement and tax purposes. All short-term capital gains are included in ordinary income for tax purposes.
Use of Estimates– The preparation of financial statements in conformity with accounting principles generally accepted in the United States of America requires management to make estimates and assumptions that affect the reported amounts of assets and liabilities and disclosure of contingent assets and liabilities at the date of the financial statements and the reported amounts of revenues and expenses during the reporting period. Actual results could differ from those estimates.
Federal Income Taxes– The Funds intend to meet the requirements of subchapter M of the Internal Revenue Code applicable to regulated investment companies and to distribute substantially all net taxable investment income and net realized gains to shareholders in a manner which results in no tax cost to the Funds. Therefore, no federal income or excise tax provision is required. The Funds recognize uncertain tax positions consistent with FASB Interpretation No. 48, "Accounting for Uncertainty in Income Taxes." As of December 31, 2007, there were no such uncertainties recognized in the accompanying financial statements.
Foreign Currency Translation– The books and records relating to the Funds’ non-U.S. dollar denominated investments are maintained in U.S. dollars on the following bases: (1) market value of investment securities, assets, and liabilities are translated at the current rate of exchange; and (2) purchases and sales of investment securities, income, and expenses are translated at the relevant rates of exchange prevailing on the respective dates of such transactions. The Funds do not isolate the portion of gains and losses on investments in equity securities that is due to changes in the foreign exchange rates from that which is due to changes in market prices of equity securi-
PROSPECTOR FUNDS, INC.
NOTES TO THE FINANCIAL STATEMENTS – CONTINUED
DECEMBER 31, 2007
ties. The Funds report certain foreign currency-related transactions as components of realized gains for financial reporting purposes, whereas such components are treated as ordinary income for federal income tax purposes.
Expenses– Expenses directly attributable to a Fund are charged to that Fund, while expenses attributable to more than one Fund are allocated among the respective Funds based on relative net assets or another appropriate basis. Offering costs for each Fund are being amortized on a straight-line basis over the first twelve months after commencement of operations of the Funds.
Other– Investment and shareholder transactions are recorded on the trade date. Each Fund determines the gain or loss realized from the investment transactions on the basis of identified costs. Dividend income is recognized on the ex-dividend date. Interest income, including amortization of bond premium and discount, is recognized on an accrual basis.
Reclassification of Capital Accounts– Accounting principles generally accepted in the United States of America require that certain components of net assets relating to permanent differences be reclassified between financial and tax reporting. These reclassifications have no effect on net assets or net asset value per share. For the fiscal period ended December 31, 2007, the following reclassifications were made on the Statement of Assets & Liabilities:
| | Undistributed | Accumulated | |
| | Net Investment | Net Realized | Portfolio |
| | Income | Gain (Loss) | Capital |
| Capital Appreciation Fund | $474 | $(474) | $ — |
| Opportunity Fund | 351 | 1,305 | (1,656) |
3. INVESTMENT TRANSACTIONS
During the fiscal period ended December 31, 2007, purchases of securities and proceeds from sales of securities, other than temporary investments in short-term securities, were as follows:
| | Purchases | Sales |
| Capital Appreciation Fund | $7,575,992 | $289,446 |
| Opportunity Fund | 6,059,346 | 775,572 |
There were no purchases or sales of long-term U.S. Government securities.
The aggregate gross unrealized appreciation and depreciation of securities held by the Funds and the total cost of securities for federal income tax purposes at December 31, 2007, were as follows:
| | Aggregate | Aggregate | | Federal |
| | Gross | Gross | | Income |
| | Appreciation | Depreciation | Net | Tax Cost |
| Capital Appreciation Fund | $241,755 | $(306,298) | $(64,543) | $8,341,662 |
| Opportunity Fund | 217,328 | (252,296) | (34,968) | 5,818,310 |
At December 31, 2007, components of accumulated earnings (deficit) on a tax-basis were as follows:
| | Undistributed | Other | | Total |
| | Ordinary | Accumulated | Unrealized | Accumulated |
| | Income | Losses | Depreciation | Earnings (Deficit) |
| Capital Appreciation Fund | $21,080 | $ — | $(64,543) | $(43,463) |
| Opportunity Fund | — | (15,648) | (34,968) | (50,616) |
PROSPECTOR FUNDS, INC.
NOTES TO THE FINANCIAL STATEMENTS – CONTINUED
DECEMBER 31, 2007
As of December 31, 2007, the Funds did not have any accumulated net realized capital loss carryovers. As of December 31, 2007, Capital Appreciation Fund and Opportunity Fund had $0 and $15,468, respectively, of deferred, on a tax basis, post-October losses.
The tax character of distributions paid during the fiscal period ended December 31, 2007 were as follows:
| | Ordinary | Long Term | |
| | Income | Capital Gains | Total |
| Capital Appreciation Fund | $ 6,822 | $— | $ 6,822 |
| Opportunity Fund | 20,837 | — | 20,837 |
4. AGREEMENTS
The Funds have entered into an Investment Advisory Agreement with the Adviser, with whom certain directors and officers of the Corporation are affiliated, to furnish investment advisory services to the Funds. Pursuant to this Agreement, the Adviser is entitled to receive a fee, calculated daily and payable monthly, at the annual rate of 1.10% as applied to each Fund’s daily net assets.
The Adviser has contractually agreed to waive, through September 28, 2010 its management fee and/or reimburse each Fund’s other expenses to the extent necessary to ensure that each Fund’s operating expenses do not exceed 1.50% of its average daily net assets. Any such waiver or reimbursement may be subject to later adjustment to allow the Adviser to recoup amounts waived or reimbursed to the extent actual fees and expenses for a fiscal period are less than the respective expense cap limitations, provided, however, that the Adviser shall only be entitled to recoup such amounts for a period of three years from the date such amount was waived or reimbursed. Waived/reimbursed fees and expenses subject to potential recovery by year of expiration are as follows:
| | 12/31/2010 |
| Capital Appreciation Fund | $156,132 |
| Opportunity Fund | 156,522 |
As of December 31, 2007, it was possible, but not probable, those amounts would be recovered by the Adviser. At the end of each fiscal year in the future, the Funds will continue to assess the potential recovery of waived/reimbursed fees and expenses for financial reporting purposes.
Quasar Distributors, LLC ("Quasar"), a subsidiary of U.S. Bancorp, serves as distributor of the Funds’ shares pursuant to a Distribution Agreement with the Corporation. Each Fund’s shares are sold on a no-load basis and, therefore, Quasar receives no sales commission or sales load for providing services to the Funds. The Corporation has adopted a plan pursuant to Rule 12b-1 under the 1940 Act (the "12b-1 Plan"), which authorizes the Corporation to reimburse Quasar and certain financial intermediaries who assist in distributing each Fund’s shares or who provide shareholder services to Fund shareholders a distribution and/or shareholder servicing fee of up to 0.25% of each Fund’s average daily net assets (computed on an annual basis). All or a portion of the fee may be used by the Funds or Quasar to pay the Funds’ distribution fees and costs of printing reports and prospectuses for potential investors and the costs of other distribution and shareholder services expenses. During the fiscal period ended December 31, 2007, the Capital Appreciation Fund and Opportunity Fund incurred expenses of $3,993 and $3,011, respectively, pursuant to the 12b-1 Plan.
U.S. Bancorp Fund Services, LLC serves as transfer agent, administrator and fund accountant for the Funds. U.S. Bank, N.A. serves as custodian for the Funds.
PROSPECTOR FUNDS, INC.
NOTES TO THE FINANCIAL STATEMENTS – CONTINUED
DECEMBER 31, 2007
5. INDEMNIFICATIONS
The Funds enter into contracts that contain a variety of indemnifications. The Funds’ maximum exposure under these arrangements is unknown. However, the Funds have not had prior claims or losses pursuant to these contracts and expect the risk of loss to be remote.
6. NEW ACCOUNTING PRONOUNCEMENTS
In September 2006, FASB issued Statement of Financial Accounting Standards No. 157, "Fair Value Measurements" ("FAS 157"). FAS 157 clarifies the definition of fair value for financial reporting, establishes a framework for measuring fair value, and requires additional disclosures about the use of fair value measurements. FAS 157 is effective for financial statements issued for fiscal years beginning after November 15, 2007 and interim periods within those fiscal years. As of December 31, 2007, the Funds do not believe the adoption of FAS 157 will impact the amounts reported in the financial statements; however, additional disclosures will be required about the inputs used to develop the measurements of fair value and the effect of certain measurements reported in the Statement of Operations for a fiscal period.
PROSPECTOR FUNDS, INC.
REPORT OF INDEPENDENT REGISTERED PUBLIC ACCOUNTING FIRM
The Board of Directors and Shareholders of Prospector Funds, Inc.:
We have audited the accompanying statements of assets and liabilities, including the schedule of investments, of Prospector Funds, Inc., comprising, the Prospector Capital Appreciation Fund and the Prospector Opportunity Fund (the Funds) as of December 31, 2007, and the related statements of operations, the statements of changes in net assets, and the financial highlights for the period then ended. These financial statements and financial highlights are the responsibility of the Funds’ management. Our responsibility is to express an opinion on these financial statements and financial highlights based on our audits.
We conducted our audits in accordance with the standards of the Public Company Accounting Oversight Board (United States). Those standards require that we plan and perform the audit to obtain reasonable assurance about whether the financial statements and financial highlights are free of material misstatement. We were not engaged to perform an audit of the Funds’ internal control over financial reporting. Our audits included consideration of internal control over financial reporting as a basis for designing audit procedures that are appropriate in the circumstances, but not for the purpose of expressing an opinion on the effectiveness of the Funds’ internal control over financial reporting. Accordingly, we express no such opinion. An audit also includes examining, on a test basis, evidence supporting the amounts and disclosures in the financial statements and financial highlights, assessing the accounting principles used and significant estimates made by management, and evaluating the overall financial statement presentation. Our procedures included confirmation of securities owned as of December 31, 2007, by correspondence with the custodian and brokers. We believe that our audits provide a reasonable basis for our opinion.
In our opinion, the financial statements and financial highlights referred to above present fairly, in all material respects, the financial position of the Funds at December 31, 2007, the results of their operations, the changes in their net assets, and the financial highlights for the period then ended, in conformity with U.S. generally accepted accounting principles.
Minneapolis, Minnesota
February 15, 2008
PROSPECTOR FUNDS, INC.
ADDITIONAL INFORMATION (UNAUDITED)
DECEMBER 31, 2007
BOARD APPROVAL OF INVESTMENT ADVISORY AGREEMENT
The Corporation’s independent directors (the "directors") unanimously approved the Investment Advisory Agreement (the "Advisory Agreement") between the Funds and the Investment Manager and US Bancorp Fund Services, LLC (the Funds’ administrator) at the organizational meeting held on September 7, 2007.
In preparation for the meeting, the directors had been provided materials, including expense and other information for other investment companies with similar investment objectives derived from data compiled by the Investment Manager. Prior to voting, the directors reviewed the proposed approval of the Advisory Agreement and Expense Waiver and Reimbursement Agreements (collectively, the "Advisor-Related Agreements") with management and with counsel to the Corporation and reviewed memorandum from such counsel discussing the legal standards for their consideration of the proposed approval. In reaching their determinations relating to approval of the Advisor-Related Agreements, the directors considered all factors they believed relevant including the following:
| 1. | the nature, extent and quality of investment, and other services to be rendered by the Investment Manager; |
| 2. | payments to be received by the Investment Manager from all sources in respect of the Funds; |
| 3. | comparative fee and expense data for the Funds and other investment companies with similar investment objectives; |
| 4. | the extent to which economies of scale may be realized as the Funds grows and whether fee levels reflect these economies of scale for the benefit of investors; |
| 5. | the Investment Manager’s policies and practices regarding allocation of portfolio transactions of the Funds, including the extent to which the Investment Manager may benefit from soft dollar arrangements; |
| 6. | fall-out benefits which the Investment Manager and its affiliates may receive from their relationships to the Funds; |
| 7. | information about fees charged by the Investment Manager to other clients with similar investment objectives; |
| 8. | the professional experience and qualifications of the Funds’ portfolio managers and other senior personnel of the Investment Manager; and |
| 9. | the terms of the Advisory Agreement. |
The directors also considered their overall confidence in the integrity and competence of the Investment Manager and the portfolio managers. In their deliberations, the directors did not identify any particular information that was all-important or controlling, and each director attributed different weights to the various factors. The directors determined that the overall arrangements between the Funds and the Investment Manager, as provided in the Advisory Agreement, were fair and reasonable in light of the services performed, expenses expected to be incurred and such other matters as the directors considered relevant in the exercise of their reasonable judgment.
The material factors and conclusions that formed the basis for the directors reaching their determinations to approve the Advisory Agreement (including their determinations that the Investment Manager should be the investment adviser for the Funds, and that the fees payable to the Investment Manager pursuant to the Advisory Agreement are appropriate) were separately discussed by the directors.
PROSPECTOR FUNDS, INC.
ADDITIONAL INFORMATION (UNAUDITED) – CONTINUED
DECEMBER 31, 2007
Nature, extent and quality of services provided by the Investment Manager
The directors noted that, under the Advisory Agreement, the Investment Manager, subject to the control of the directors, administers the Funds’ business and other affairs. The Investment Manager manages the investment of the assets of the Funds, including making purchases and sales of portfolio securities consistent with each Fund’s investment objective and policies. They noted that the Investment Manager also provides the Funds with such office space, administrative and other services (exclusive of, and in addition to, any such services provided by any others retained by the Funds) and executive and other personnel as are necessary for the Funds’ operations. The Directors considered that the Investment Manager pays all of the compensation of the officers of the Funds that are affiliated persons of the Investment Manager.
The Directors also considered that the Advisory Agreement for the Funds provides that the Funds will reimburse the Investment Manager for the cost of certain clerical, accounting, administrative and other services provided at the Funds’ request by employees of the Investment Manager or its affiliates. These "at no more than cost" reimbursements will be approved by the Directors on a quarterly basis and may result in a higher rate of total compensation from the Funds to the Investment Manager than the stated fee rates in the Funds’ Advisor Agreement.
The directors considered the scope and quality of services proposed to be provided by the Investment Manager under the Advisory Agreement. The directors considered the quality of the investment research capabilities of the Investment Manager and the other resources it proposes to dedicate to performing services for the Funds. The directors also considered the portfolio managers’ experience, reputation and investment philosophy. The quality of administrative and other services also were considered. The directors concluded that, overall, they were satisfied with the nature, extent and quality of services proposed to be provided to the Funds under the Advisory Agreement.
Payments to be Received by the Investment Manager; Fall-Out Benefits
The directors determined that the Investment Manager was not receiving additional benefits in connection with providing advisory services to the Funds other than potential benefits pursuant to soft dollar arrangements as discussed. The directors considered that the Investment Manager may benefit from soft dollar arrangements whereby it receives brokerage and research services from many of the brokers and dealers that execute purchases and sales of securities on behalf of its clients, including the Funds. The Directors received and reviewed a description of the Investment Manager’s policies and procedures with respect to allocating portfolio transactions for brokerage and research services.
Advisory Fees and Other Expenses
The directors considered the advisory fee rate paid by the Funds to the Investment Manager and information prepared by the Investment Manager concerning fee rates paid by other comparable funds. The directors recognized that it is difficult to make comparisons of advisory fees because there are variations in the services that are included in the fees paid by other funds, but determined that the proposed advisory fee rate was in line with other comparable funds. The directors also considered that the proposed advisory fee was comparable to the fees proposed to be charged by the Investment Manager to its other client accounts.
The directors also considered the anticipated total expense ratio of the Funds in comparison to the fees and expenses of the funds included in the comparison. The directors noted that the expense ratios of some of the comparable funds also were lower because of waivers or reimbursements by those funds’ investment advisers, which in some cases were voluntary and perhaps temporary. In particular, the Directors noted that the Investment Manager’s fee waiver pursuant to the proposed Expense Waiver and Reimbursement Agreement was contractual in nature and customary for the industry. The directors concluded that the Funds’ anticipated expense ratio was satisfactory. Finally, the directors noted that there may be economies of scale as the Funds grows and concluded that it may be appropriate to consider those issues in the future.
PROSPECTOR FUNDS, INC.
ADDITIONAL INFORMATION (UNAUDITED) – CONTINUED
DECEMBER 31, 2007
AVAILABILITY OF FUND PORTFOLIO INFORMATION
The Funds file complete schedules of portfolio holdings with the SEC for the first and third quarters of each fiscal year on Form N-Q, which is available on the SEC’s website at www.sec.com. The Funds’ Form N-Q may be reviewed and copied at the SEC’s Public Reference Room in Washington, D.C. For information on the Public Reference Room call 1-800-SEC-0330. In addition, the Funds’ Form N-Q is available without charge upon request by calling 1-877-PFI-STOCK or 1-877-734-7862.
AVAILABILITY OF PROXY VOTING INFORMATION
A description of the Funds’ Proxy Voting Policies and Procedures is available without charge, upon request, by calling 1-877-PFI-STOCK or 1-877-734-7862. The Funds’ proxy voting record will be available after August 31, 2008.
QUALIFIED DIVIDEND INCOME/DIVIDENDS RECEIVED DEDUCTION
For the fiscal period ended December 31, 2007, certain dividends paid by the Funds may be subject to a maximum tax rate of 15%, as provided for by the Jobs and Growth Tax Relief Reconciliation Act of 2003. The percentage of dividends declared from ordinary income designated as qualified dividend income was 100.0% and 100.0% for the Capital Appreciation Fund and Opportunity Fund, respectively.
For corporate shareholders, the percent of ordinary income distributions qualifying for the corporate dividends received deduction for the fiscal period ended December 31, 2007 were 100.0% and 100.0% for the Capital Appreciation Fund and Opportunity Fund, respectively.
ADDITIONAL INFORMATION APPLICABLE TO FOREIGN SHAREHOLDERS ONLY
The percent of ordinary income distributions designated as interest related dividends for the fiscal period ended December 31, 2007 were 32.6% and 17.4% for the Capital Appreciation Fund and Opportunity Fund, respectively.
The percent of ordinary income distributions designated as short-term capital gain distributions for the fiscal period ended December 31, 2007 were 6.9% and 56.1% for the Capital Appreciation Fund and Opportunity Fund, respectively.
PROSPECTOR FUNDS, INC.
ADDITIONAL INFORMATION (UNAUDITED) – CONTINUED
DECEMBER 31, 2007
DIRECTORS & OFFICERS
| | | | | Number of | |
| | | | | Portfolios | |
| | | | Principal | in Fund | |
Name, | | Length | Occupation | Complex | Other |
Year of Birth | | of Time | During Past | Overseen | Directorships |
and Address | Position | Served* | 5 Years | by Director | Served |
INDEPENDENT BOARD MEMBERS |
Harvey D. Hirsch* | Director | Since | Senior Vice President, | 2 | None. |
| Year of Birth: 1941 | | September 7, | Marketing, Van Eck | | |
| | | 2007 | Associates Corporation, | | |
| | | | an investment adviser, | | |
| | | | since May 2007. | | |
| | | | Independent (self-employed) | | |
| | | | marketing consultant from | | |
| | | | 1996 to May 2007. | | |
Joseph Klein III* | Director | Since | Managing Director of Gauss | 2 | BioMarin |
| Year of Birth: 1961 | | September 7, | Capital Advisors, LLC, a | | Pharmaceutical, |
| | | 2007 | financial consulting and | | Inc. |
| | | | investment advisory firm | | ISIS |
| | | | focused on biopharmaceuticals | | Pharmaceuticals, |
| | | | since he founded the company | | Inc. |
| | | | in March 1998. | | OSI |
| | | | Founding Venture Partner of | | Pharmaceuticals, |
| | | | Red Abbey Venture Partners, | | Inc. |
| | | | LP, a private health venture | | Savient |
| | | | fund, since September 2003. | | Pharmaceuticals, |
| | | | | | Inc. |
| | | | | | PDL BioPharma |
| | | | | | Inc. |
Roy L. Nersesian* | Director | Since | Associate professor of the | 2 | None. |
| Year of Birth: 1939 | | September 7, | School of Business, Monmouth | | |
| | | 2007 | University, since September 1985. | | |
| | | | Adjunct Professor of the Center | | |
| | | | for Energy and Marine | | |
| | | | Transportation, Columbia | | |
| | | | University, since September 2000. | | |
| | | | Consultant, Poten & Partners, | | |
| | | | provider of brokerage and | | |
| | | | consulting services to the energy | | |
| | | | and ocean transportation | | |
| | | | industries, since September 1992. | | |
PROSPECTOR FUNDS, INC.
ADDITIONAL INFORMATION (UNAUDITED) – CONTINUED
DECEMBER 31, 2007
| | | | | Number of | |
| | | | | Portfolios | |
| | | | Principal | in Fund | |
Name, | | Length | Occupation | Complex | Other |
Year of Birth | | of Time | During Past | Overseen | Directorships |
and Address | Position | Served* | 5 Years | by Director | Served |
John T. Rossello, Jr.* | Director | Since | Partner at | 2 | None. |
| Year of Birth: 1951 | | September 7, | PricewaterhouseCoopers LLP | | |
| | | 2007 | from October 1988 to June 2007 | | |
| | | | | | |
INTERESTED BOARD MEMBERS AND OFFICERS |
John D. Gillespie†* | Director | Since | Managing member of | 2 | White |
| Year of Birth: 1959 | President | September 7, | Prospector Partners, LLC, an | | Mountains |
| | | 2007 | affiliate of the Investment | | Insurance |
| | | | Manager, and portfolio manager | | Group, Ltd. |
| | | | of the investment funds sponsored | | |
| | | | by Prospector Partners, LLC | | |
| | | | since 1997. | | |
| | | | Chairman and President of | | |
| | | | White Mountains Advisors, | | |
| | | | an investment adviser, from | | |
| | | | 2002 to 2005. | | |
Richard P. Howard | Executive | Since | Portfolio Manager at | N/A | OneBeacon |
| Year of Birth: 1946 | Vice | September 7, | Prospector Partners, LLC | | Insurance |
| | President | 2007 | since August 2005. | | Group, Ltd. |
| | | | Managing Director of White | | |
| | | | Mountains Advisors, LLC from | | |
| | | | 2001 to August 2005. | | |
| | | | Senior Vice President of | | |
| | | | OneBeacon Insurance Group | | |
| | | | from 2001 to August 2005. | | |
Kevin R. O’Brien | Executive | Since | Portfolio Manager at | N/A | None. |
| Year of Birth: 1963 | Vice | September 7, | Prospector Partners, LLC | | |
| | President | 2007 | since April 2003. | | |
| | | | Managing Director of White | | |
| | | | Mountains Advisors, LLC from | | |
| | | | April 2003 to August 2005. | | |
PROSPECTOR FUNDS, INC.
ADDITIONAL INFORMATION (UNAUDITED) – CONTINUED
DECEMBER 31, 2007
| | | | | Number of | |
| | | | | Portfolios | |
| | | | Principal | in Fund | |
Name, | | Length | Occupation | Complex | Other |
Year of Birth | | of Time | During Past | Overseen | Directorships |
and Address | Position | Served* | 5 Years | by Director | Served |
Peter N. Perugini, Jr. | Secretary | Secretary | Chief Financial Officer at | N/A | None. |
| Year of Birth: 1970 | Treasurer | since | Prospector Partners, LLC | | |
| | | September 7, | since 2000. | | |
| | | 2007 | Controller of Prospector | | |
| | | Treasurer | Partners, LLC from 1997-2000. | | |
| | | since | | | |
| | | June 6, | | | |
| | | 2007 | | | |
Kim Just | Chief | Since | Chief Compliance Officer at | N/A | None. |
| Year of Birth: 1967 | Compliance | September 7, | Prospector Partners, LLC | | |
| | Officer | 2007 | since March 2006. | | |
| | | | Manager, Whittlesey & | | |
| | | | Hadley, P.C., an accounting | | |
| | | | services firm from September | | |
| | | | 1997 to March 2006. | | |
Brian Wiedmeyer | Assistant | Since | Mutual fund client compliance | N/A | None. |
| Year of Birth: 1973 | Secretary | September 7, | officer for US Bancorp Fund | | |
| | | 2007 | Services, LLC, a mutual fund | | |
| | | | service provider, since January | | |
| | | | 2005. | | |
| | | | Fund administration and | | |
| | | | accounting role for UMB Fund | | |
| | | | Services, a mutual fund service | | |
| | | | provider, from 1998 to 2005. | | |
Douglas Schafer | Assistant | Since | Mutual fund client compliance | N/A | None. |
| Year of Birth: 1970 | Secretary | September 7, | officer for US Bancorp Fund | | |
| | | 2007 | Services, LLC, a mutual fund | | |
| | | | service provider, since April 2002. | | |
| * | Each of the Funds’ directors was elected by written consent of the sole shareholder of the Funds on September 7, 2007. |
| † | John D. Gillespie is an interested director of the Funds because he is also the managing member of the Investment Manager. |
(This Page Intentionally Left Blank.)
DIRECTORS
John D. Gillespie
Harvey D. Hirsch
Joseph Klein III
Roy L. Nersesian
John T. Rossello, Jr.
INVESTMENT ADVISER
Prospector Partners Asset Management, LLC
370 Church Street
Guilford, CT 06437
DISTRIBUTOR
Quasar Distributors, LLC
615 East Michigan Street
Milwaukee, WI 53202
CUSTODIAN
U.S. Bank, N.A.
1555 North River Center Drive
Milwaukee, WI 53212
ADMINISTRATOR AND TRANSFER AGENT
U.S. Bancorp Fund Services, LLC
Third Floor
615 E. Michigan Street
Milwaukee, WI 53202
INDEPENDENT REGISTERED PUBLIC ACCOUNTING FIRM
Ernst & Young LLP
220 South Sixth Street, Suite 1400
Minneapolis, MN 55402
LEGAL COUNSEL
Seward & Kissel LLP
One Battery Plaza
New York, NY 10004
This report should be accompanied or preceded by a prospectus.
The Funds’ Statement of Additional Information contains additional information about the Funds’ directors and is available without charge upon request by calling 1-877-PFI-STOCK.
Item 2. Code of Ethics.
The registrant has adopted a code of ethics that applies to the registrant’s principal executive officer and principal financial officer. The registrant has not made any substantive amendments to its code of ethics during the period covered by this period.
The registrant has not granted any waivers from any provisions of the code of ethics during the period covered by this report.
A copy of the registrant’s code of ethics that applies to the registrant’s principal executive officer and principal financial officer is filed herewith.
Item 3. Audit Committee Financial Expert.
The registrant’s board of directors has determined that there is at least one audit committee financial expert serving on its audit committee. John Rossello, Jr. is the “audit committee financial expert” and is considered to be “independent” as each term is defined in Item 3 of Form N-CSR.
Item 4. Principal Accountant Fees and Services.
The registrant has engaged its principal accountant to perform audit services, audit-related services, tax services and other services during the past fiscal year (The registrant’s inception date was September 28, 2007, as such, there is only one fiscal year to present). “Audit services” refer to performing an audit of the registrant's annual financial statements or services that are normally provided by the accountant in connection with statutory and regulatory filings or engagements for the past fiscal year. “Audit-related services” refer to the assurance and related services by the principal accountant that are reasonably related to the performance of the audit. “Tax services” refer to professional services rendered by the principal accountant for tax compliance, tax advice, and tax planning. Other services” provided by the principal accountant were for the audit of the registrant’s seed financial statements. The following table details the aggregate fees billed or expected to be billed for the past fiscal year for audit fees, audit-related fees, tax fees and other fees by the principal accountant.
| | FYE 12/31/2007 |
| Audit Fees | $45,000 |
| Audit-Related Fees | $0 |
| Tax Fees | $5,000 |
| All Other Fees | $5,000 |
The audit committee has adopted pre-approval policies and procedures that require the audit committee to pre-approve all audit and non-audit services of the registrant. All of the principal accountant’s hours spent on auditing the registrant’s financial statements were attributed to work performed by full-time permanent employees of the principal accountant.
The following table indicates the non-audit fees billed or expected to be billed by the registrant’s accountant for services to the registrant and to the registrant’s investment adviser for the past fiscal year. The audit committee of the board of directors has considered whether the provision of non-audit services that were rendered to the registrant's investment adviser is compatible with maintaining the principal accountant's independence and has concluded that the provision of such non-audit services by the accountant has not compromised the accountant’s independence.
| Non-Audit Related Fees | FYE 12/31/2007 |
| Registrant | $0 |
| Registrant’s Investment Adviser | $0 |
Item 5. Audit Committee of Listed Registrants.
Not applicable to open-end investment companies.
Item 6. Schedule of Investments.
Schedule of Investments is included as part of the report to shareholders filed under Item 1 of this Form.
Item 7. Disclosure of Proxy Voting Policies and Procedures for Closed-End Management Investment Companies.
Not applicable to open-end investment companies.
Item 8. Portfolio Managers of Closed-End Management Investment Companies.
Not applicable to open-end investment companies.
Item 9. Purchases of Equity Securities by Closed-End Management Investment Company and Affiliated Purchases.
Not applicable to open-end investment companies.
Item 10. Submission of Matters to a Vote of Security Holders.
Not Applicable.
Item 11. Controls and Procedures.
| (a) | The Registrant’s President and Treasurer have reviewed the Registrant's disclosure controls and procedures (as defined in Rule 30a-3(c) under the Investment Company Act of 1940 (the “Act”)) as of a date within 90 days of the filing of this report, as required by Rule 30a-3(b) under the Act and Rules 13a-15(b) or 15d-15(b) under the Securities Exchange Act of 1934. Based on their review, such officers have concluded that the disclosure controls and procedures are effective in ensuring that information required to be disclosed in this report is appropriately recorded, processed, summarized and reported and made known to them by others within the Registrant and by the Registrant’s service provider. |
| (b) | There were no significant changes in the Registrant's internal control over financial reporting (as defined in Rule 30a-3(d) under the Act) that occurred during the second fiscal quarter of the period covered by this report that has materially affected, or is reasonably likely to materially affect, the Registrant's internal control over financial reporting. |
Item 12. Exhibits.
| (a) | (1) Any code of ethics or amendment thereto, that is subject of the disclosure required by Item 2, to the extent that the registrant intends to satisfy Item 2 requirements through filing an exhibit. 1) Filed herewith |
(2) Certifications pursuant to Section 302 of the Sarbanes-Oxley Act of 2002. Filed herewith.
(3) Any written solicitation to purchase securities under Rule 23c-1 under the Act sent or given during the period covered by the report by or on behalf of the registrant to 10 or more persons. Not applicable to open-end investment companies.
(b) | Certification pursuant to Section 906 of the Sarbanes-Oxley Act of 2002. Furnished herewith. |
SIGNATURES
Pursuant to the requirements of the Securities Exchange Act of 1934 and the Investment Company Act of 1940, the registrant has duly caused this report to be signed on its behalf by the undersigned, thereunto duly authorized.
(Registrant) Prospector Funds, Inc.
By (Signature and Title)* /s/ John D. Gillespie
John D. Gillespie, President
Date February 29, 2008
Pursuant to the requirements of the Securities Exchange Act of 1934 and the Investment Company Act of 1940, this report has been signed below by the following persons on behalf of the registrant and in the capacities and on the dates indicated.
By (Signature and Title)* /s/ John D. Gillespie
John D. Gillespie, President
Date February 29, 2008
By (Signature and Title)* /s/ Peter N. Perugini, Jr.
Peter N. Perugini, Jr., Treasurer
Date February 29, 2008
* Print the name and title of each signing officer under his or her signature.