UNITED STATES
SECURITIES AND EXCHANGE COMMISSION
Washington, D.C. 20549
FORM N-CSR
CERTIFIED SHAREHOLDER REPORT OF REGISTERED
MANAGEMENT INVESTMENT COMPANIES
Investment Company Act file number 811-22077
Prospector Funds, Inc.
(Exact name of registrant as specified in charter)
370 Church St., Guilford, CT 06437
(Address of principal executive offices) (Zip code)
Prospector Partners Asset Management, LLC, 370 Church St., Guilford, CT 06437
(Name and address of agent for service)
(203) 458-1500
Registrant's telephone number, including area code
Date of fiscal year end: December 31, 2010
Date of reporting period: December 31, 2010
Item 1. Report to Stockholders.
Prospector Capital Appreciation Fund
Prospector Opportunity Fund
| | Annual Report |
| | |
| www.prospectorfunds.com | December 31, 2010 |
February 5, 2011
Dear Shareholders of the Prospector Capital Appreciation Fund and Prospector Opportunity Fund:
Since Ben Bernanke announced the much anticipated second round of quantitative easing stimulus (QE2) on November 3, 2010, the stock market has risen sharply. The unmanaged S&P 500 rose 7.0% in the month of December and 10.8% during the final three months of 2010 to finish the full year up 15.1%.
The QE2 program is a continuation of the U.S. Government policy formulated to deal with the financial crisis of 2008. The QE2 policy looks to ease liquidity concerns, stimulate economic growth, and, by helping to keep short term interest rates near zero, allow banks to rebuild balance sheet strength lost during the crisis.
While these government policies have achieved some success towards their goals of boosting liquidity, economic growth, and shoring up the banking system, there have been some significant immediate side effects. The extremely low yields offered by treasuries have encouraged (some would say pushed) investors towards riskier types of investments. As the crisis fades into memory (perhaps too quickly for our own long-run benefit), the puny returns on treasuries don’t look attractive.
The butterfly effect of this phenomenon has been pronounced in the last four months of 2010. Risk premiums, in the form of spreads in the fixed income market, have shrunk to pre-crisis levels (if not beyond for structured products and non financial corporate bonds). In the equity markets, smaller, more volatile shares with high degrees of financial and operating leverage have far outpaced the shares of larger, diversified, and conservatively financed “blue chip” stocks.
One of the adverse side effects of the U.S. government financial policies since the financial crisis of 2008 has been the dramatic levering up of our sovereign balance sheet. We currently run a budget deficit of approximately 11% of GDP. Also our ratio of debt outstanding to GDP is a worrisome 94%. These high risk factors combined with a continuation of our easy money strategy foreshadow a future slide in the value of our paper money. Unlike the U.K. or Ireland, Greece, Portugal, Spain, et al, the United States is reluctant to adopt a fiscal policy of austerity, designed to bring us back towards the concept of living within our means.
The U.S. Congress, fresh off the mid-term elections, will soon take up the topic of extending our nation’s debt ceiling. Early rhetoric from rookie tea party republicans suggest the raising of the debt ceiling may not quite be a fait accompli. At some point, we need to stop playing the game of chicken with our currency (see how much we can lever up with short-term debt to prop up asset prices without sharply devaluing the dollar) and get back to the fundamentals of long-term prosperity.
The Attraction of Blue Chips
During 2010, the net weighting of large-capitalization shares (defined as market value above $10 billion) in your funds has risen substantially. As value investors, we naturally look for opportunity in the shares of companies that are less popular. The large capitalization stocks, especially the “blue chip” variety seem to have lost their luster with the average investor over the past ten years.
The unmanaged S&P 500, a rough proxy for large capitalization blue chips, is still 20% below the market peak in 2007 and has generated a 1% compound return over the past ten years. Furthermore the big caps sell at lower price
to earnings ratios and higher dividend yields than their mid and small-cap brethren. Finally many blue chips are multinational corporations who offer greater exposure to faster growing international markets in Asia and Latin America than smaller companies.
Prospector Capital Appreciation Highlights
After several disappointing years our large DuPont holding redeemed itself. This top 2010 full-year contributor was also the best stock in Dow Jones Industrial Average. Is the outlook for DuPont and other blue chips looking better? We think so.
Another winner was CWEI, Clayton Williams. This little known oil and gas exploration company was the second leading contributor to 2010’s full-year results. We began establishing this position at the Fund’s inception over 3 years ago at about one fourth the current price. This is a true winner, not a security recovering from a dismal 2008 or 2009. CWEI has been attractive based upon the earnings and cash flow of its underlying properties. Importantly, it had unique ability to shift focus from natural gas drilling to oil development.
Another large contributor for the year was USEC, a nuclear fuel processing company. It was our largest purchase in 2010. We own the convertible securities maturing in 2014 and a small common stock position which together make USEC our largest year-end holding.
Biggest loser, Mirant, remains a stubborn holding. We will wait for electricity demand to recover before actively considering sale. (By the way, thanks to a merger you won’t be reading the “M word” again; it’s now renamed GenOn.) During 2010, we sold H&R Block (second worst holding) at a loss with your older portfolio manager finally convinced personal computing is here to stay. As a result, the tax preparation business looks permanently impaired.
Prospector Opportunity Fund Highlights
The leading contributors to 2010 performance were natural resource companies including gold miners, Newmont Mining and Gold Fields. We continue to hold a meaningful position in gold. An ounce of gold costs 65 times what it did in 1930. The good news in the near term is that performance calculations are made in the debasing U.S. dollar. This “paper money effect” should help gold returns if the dollar decline continues. The shares of the gold miners have significantly lagged the price performance of the actual commodity over the past five years. Part of this difference can be explained by rising costs of extraction (mainly energy) or an ill conceived forward hedging program (selling future production at older, lower prices), but these impacts do not nearly explain the huge underperformance of the miners. So we are hoping for more “catch up” in 2011.
Oil companies such as Murphy Oil and Hess Corp. were also meaningful positive contributors to 2010 results. Our strategy for investing in energy companies is to own medium sized companies with large individual projects that could be attractive acquisition targets for the major oil companies – goliaths that potentially might offer tantalizing takeover premiums.
The worst performing sector in the Fund in 2010 was the home builders, including NVR and Toll Brothers. The expiration of the Federal Homebuyer tax credit in May 2010 precipitated a sharp decline in home buying. However, the sustained low level of housing starts coupled with the decade’s low inventory level of new home stock for sale could presage a meaningful cyclical rebound.
Prospector Funds Update
In September 2010, the Prospector Funds celebrated their three year anniversary, a significant milestone in the mutual fund world. As of December 31, 2010, the Prospector Capital Appreciation Fund received a five star Overall Morningstar Rating among 217 Aggressive Allocation Funds and the Prospector Opportunity Fund received a five star Overall Morningstar Rating among 373 Mid-Cap Blend Funds. The Overall Morningstar Rating for a fund is derived from a weighted average of the risk-adjusted performance figures associated with its 3 year Morningstar Rating metrics. Morningstar, Inc. is a respected and reliable source of independent investment analysis.
Outlook
The U.S. economy rebounded nicely in 2010 and, despite a slowdown in mid year, ended the year on the upswing. Consumer spending, auto sales, and consumer confidence all rebounded nicely, although not yet near the levels of 2007. Even consumer credit bounced back to positive levels. The unemployment picture remains the major negative as employers have been slow to hire back workers who lost their jobs during the recession. Instead employers are making do with paying overtime and using temporary workers, which is a boost to profits in the near term. Corporate America is in great shape overall with strong balance sheets and high profit margins, despite a sluggish top line.
The volatile environment introduced in 2008/2009 probably isn’t over. More likely, it has metastasized and will reemerge in a new form at some unknowable place and time. The obvious possibilities include a sovereign debt default or major bank failure, but what’s obvious isn’t overly scary. We’ve seen that movie; it ends with a major financial institution or perhaps a small country “bailed out” and a paper money flood. Of course, Bear Sterns wasn’t the 2008 crisis end point, so clearly this isn’t as simple as it sounds. Certainly there are negatives associated with money creation solutions, but significantly lower stock prices are not usually among them.
What is more worrisome is an event that no one, including us, has considered…a “black swan”. Perhaps a revolution comparable to the creation of Russian communism, or China/Japan mercantilism getting even more malevolent or a devastating new computer virus1 or something else entirely. Given the endless possibilities, you can see why this sort of speculation is largely pointless.
Our working hypothesis continues to be that the S&P is in a trading range of 950-1350 and that eventually it will likely be broken to the upside. Admittedly we are near the upper end of that range, and a correction seems possible. Stocks are reasonably valued, certainly not terribly overvalued. We see little attraction in bonds or most any alternative to stocks. As such, we believe the best course of action is to invest long term in stocks.
We would like to close with a quotation. This from legendary coach John Wooden, who died this past year at age 99, captures the essence of professional investing. “It’s what you learn after you know it all that counts.”
Thank you for entrusting us with your money.
Respectfully Submitted,
| John D. Gillespie | Richard P. Howard | Kevin R. O’Brien |
| 1 | Oops, the Stuxnet virus completely savaged the Iranian nuclear program. Centrifuges pushed to destructive speeds, while control systems signaled A-OK. This was the first cyber super weapon – that we know of. Let’s hope the wrong people don’t acquire it. |
Performance data quoted represents past performance; past performance does not guarantee future results.
Opinions expressed are those of the Funds and are subject to change, are not guaranteed, and should not be considered a recommendation to buy or sell any security.
Mutual fund investing involves risk. Principal loss is possible. Investments in debt securities typically decrease in value when interest rates rise. This risk is usually greater for longer-term debt securities. The Funds invest in foreign securities which involve greater volatility and political, economic and currency risks and differences in accounting methods. The Funds invest in smaller and mid-cap companies, which involve additional risks such as limited liquidity and greater volatility. The Funds may hold restricted securities purchased through private placements. Such securities can be difficult to sell without experiencing delays or additional costs. Derivatives involve risks different from, and in certain cases, greater than the risks presented by more traditional investments. These risks are fully disclosed in the prospectus.
The S&P 500 Index is a broad based unmanaged index of 500 stocks, which is widely recognized as representative of the equity market in general. You cannot invest directly in an index. Free cash flow measures the cash generating capability of a company by adding non-cash charges (e.g. depreciation) and interest expense to pretax income. The Price to Earnings (P/E) Ratio is calculated by dividing current price of the stock by the company’s trailing 12 months’ earnings per share. Earnings per share (EPS) is calculated by taking the total earnings divided by the number of shares outstanding.
The Dow Jones Industrial Average is a stock market index which tracks the performance of 30 of America’s largest companies.
Fund holdings and/or security allocations are subject to change at any time and are not recommendations to buy or sell any security. Please see the Schedule of Investments section in this report for a full listing of the Funds holdings. Current and future portfolio holdings are subject to risk.
For each fund with at least a three-year history, Morningstar calculates a Morningstar Rating™ (based on a Morningstar Risk Adjusted Return measure that accounts for variation in a fund’s monthly performance, including the effects of sales charges, loads, and redemption fees), placing more emphasis on downward variations and rewarding consistent performance. The top 10% of funds in each category receive 5 stars, the next 22.5% receive 4 stars, the next 35% receive 3 stars, the next 22.5% receive 2 stars and the bottom 10% receive 1 star. (Each share class is counted as a fraction of one fund within this scale and rated separately, which may cause slight variations in the distribution percentages.) For the three year period ending 12/31/2010 the Prospector Opportunity Fund received 5 stars among 373 Mid-Cap Blend Funds and the Prospector Capital Appreciation Fund received 5 stars among 217 Aggressive Allocation Funds.
©2011 Morningstar, Inc. All Rights Reserved. The information contained herein (1) is proprietary to Morningstar (2) may not be copied or distributed and (3) is not warranted to be accurate, complete or timely. Neither Morningstar nor its content providers are responsible for any damages or losses arising from any use of this information.
Prospector Funds, Inc. are distributed by Quasar Distributors, LLC (2/11).
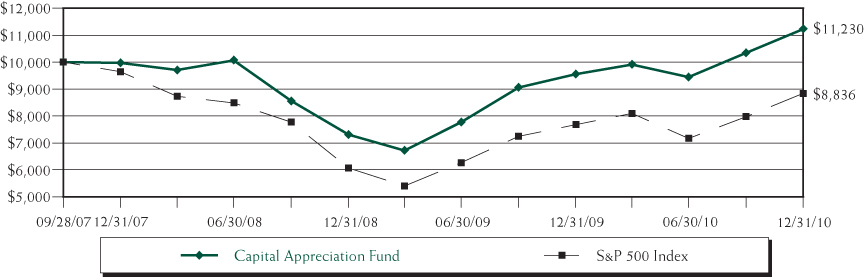
Capital Appreciation Fund
The chart assumes an initial investment of $10,000. Performance reflects waivers of fee and operating expenses in effect. In the absence of such waivers, total return would be reduced. Past performance is not predictive of future performance. Investment return and principal value will fluctuate, so that your shares, when redeemed may be worth more or less than their original cost. Performance assumes the reinvestment of capital gains and income distributions. The performance does not reflect the deduction of taxes that a shareholder would pay on Fund distributions or the redemption of Fund shares.
Average Annual Rates of Return (%)
| | | | Since Inception(1) to |
| | One Year | Three Year | December 31, 2010 |
| Capital Appreciation Fund | 17.52% | 4.05% | 3.62% |
S&P 500 Index(2) | 15.06% | -2.86% | -3.73% |
| (2) | The Standard & Poor’s 500 Index (S&P 500) is an unmanaged, capitalization-weighted index generally representative of the U.S. market for large capitalization stocks. This Index cannot be invested in directly. |
Opportunity Fund
The chart assumes an initial investment of $10,000. Performance reflects waivers of fee and operating expenses in effect. In the absence of such waivers, total return would be reduced. Past performance is not predictive of future performance. Investment return and principal value will fluctuate, so that your shares, when redeemed may be worth more or less than their original cost. Performance assumes the reinvestment of capital gains and income distributions. The performance does not reflect the deduction of taxes that a shareholder would pay on Fund distributions or the redemption of Fund shares.
Average Annual Rates of Return (%)
| | | | Since Inception(1) to |
| | One Year | Three Year | December 31, 2010 |
| Opportunity Fund | 16.94% | 6.04% | 5.58% |
Russell 2000 Index(2) | 26.85% | 2.22% | 0.26% |
Russell Midcap Index(3) | 25.48% | 1.05% | -0.23% |
| (2) | An unmanaged small-cap index that measures the performance of the 2,000 smallest companies in the Russell 3000 Index. This index cannot be invested in directly. |
| (3) | An unmanaged mid-cap index that measures the performance of the 800 smallest companies in the Russell 1000 Index. This index cannot be invested in directly. |
Expense Example
December 31, 2010
As a shareholder of the Fund, you incur two types of costs: (1) transaction costs, which may include but are not limited to, redemption fees, wire transfer fees, maintenance fee (IRA accounts), and exchange fees; and (2) ongoing costs, including management fees; distribution and/or service fees; and other Fund expenses. This Example is intended to help you understand your ongoing costs (in dollars) of investing in the Fund and to compare these costs with the ongoing costs of investing in other mutual funds. The Example is based on an investment of $1,000 invested at the beginning of the period and held for the entire period (July 1, 2010 – December 31, 2010).
ACTUAL EXPENSES
The first line of the table below provides information about actual account values and actual expenses. Although the Fund charges no sales load or transaction fees, you will be assessed fees for outgoing wire transfers, returned checks and stop payment orders at prevailing rates charged by U.S. Bancorp Fund Services, LLC, the Fund’s transfer agent. The example below includes, but is not limited to, management fees, shareholder servicing fees and other Fund expenses. However, the example below does not include portfolio trading commissions and related expenses, interest expense and other extraordinary expenses as determined under generally accepted accounting principles. You may use the information in this line, together with the amount you invested, to estimate the expenses that you paid over the period. Simply divide your account value by $1,000 (for example, an $8,600 account value divided by $1,000 = 8.6), then multiply the result by the number in the first line under the heading entitled “Expenses Paid During Period” to estimate the expenses you paid on your account during this period.
HYPOTHETICAL EXAMPLE FOR COMPARISON PURPOSES
The second line of the table below provides information about hypothetical account values and hypothetical expenses based on the Fund’s actual expense ratio and an assumed rate of return of 5% per year before expenses, which is not the Fund’s actual return. The hypothetical account values and expenses may not be used to estimate the actual ending account balance or expenses you paid for the period. You may use this information to compare the ongoing costs of investing in the Fund and other funds. To do so, compare this 5% hypothetical example with the 5% hypothetical examples that appear in the shareholder reports of the other funds.
Please note that the expenses shown in the table are meant to highlight your ongoing costs only and do not reflect any transactional costs, such as redemption fees or exchange fees. Therefore, the second line of the table is useful in comparing ongoing costs only, and will not help you determine the relative total costs of owning different funds. In addition, if these transactional costs were included, your costs would have been higher.
| | | | Expenses Paid |
| | Beginning Account | Ending Account | During Period(1) |
| | Value (07/01/10) | Value (12/31/10) | (07/01/10 to 12/31/10) |
Capital Appreciation Actual(2) | $1,000.00 | $1,189.70 | $8.28 |
| Capital Appreciation Hypothetical | | | | |
| (5% return before expenses) | 1,000.00 | 1,017.64 | 7.63 |
| | | | |
Opportunity Actual(2) | 1,000.00 | 1,207.70 | 8.35 |
| Opportunity Hypothetical | | | |
| (5% return before expenses) | 1,000.00 | 1,017.64 | 7.63 |
| (1) | Expenses are equal to the fund's annualized expense ratio for the most recent six-month period of 1.50% and 1.50% for Capital Appreciation Fund and Opportunity Fund, respectively, multiplied by the average account value over the period, multiplied by the number of days in the most recent fiscal half year/365 (to reflect the one-half year period). |
| (2) | Based on the actual returns for the six-month period ended December 31, 2010 of 18.97% and 20.77% for Capital Appreciation Fund and Opportunity Fund, respectively. |
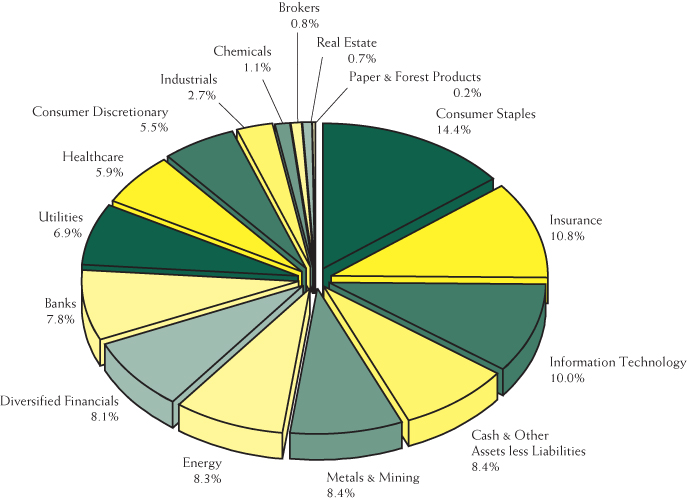
Sector Allocation (% of net assets) (Unaudited)
as of December 31, 2010(1)(2)
Capital Appreciation Fund
Top 10 Holdings (% of net assets)
as of December 31, 2010(1)(3)
Capital Appreciation Fund
| E.I. Du Pont de Nemours | | | 4.4 | % |
| USEC, 3.000%, 10/01/2014 | | | 3.9 | % |
| Gold Fields - ADR | | | 3.7 | % |
| Barrick Gold | | | 3.4 | % |
| Nexen | | | 3.3 | % |
| Newmont Mining | | | 3.0 | % |
| Anixter International, 1.000%, 02/15/2013 | | | 3.0 | % |
| Automatic Data Processing | | | 3.0 | % |
| Allegheny Energy | | | 2.8 | % |
| Domtar | | | 2.7 | % |
| (1) | Fund holdings and sector allocations are subject to change at any time and are not recommendations to buy or sell any security. |
| (2) | Sector allocation includes all investment types. |
| (3) | AIM Short-Term Treasury Portfolio excluded from top 10 holdings. |
Sector Allocation (% of net assets) (Unaudited)
as of December 31, 2010(1)(2)
Opportunity Fund
Top 10 Holdings (% of net assets)
as of December 31, 2010(1)(3)
Opportunity Fund
| Newmont Mining | | | 3.1 | % |
| Leucadia National | | | 2.6 | % |
| Hess | | | 2.5 | % |
| Gold Fields - ADR | | | 2.4 | % |
| Alberto-Culver | | | 2.3 | % |
| Platinum Underwriters Holdings | | | 2.3 | % |
| Franklin Resources | | | 2.2 | % |
| Murphy Oil | | | 2.2 | % |
| Kinross Gold | | | 2.1 | % |
| Church & Dwight | | | 2.0 | % |
| (1) | Fund holdings and sector allocations are subject to change at any time and are not recommendations to buy or sell any security. |
| (2) | Sector allocation includes all investment types. |
| (3) | AIM Short-Term Treasury Portfolio excluded from top 10 holdings. |
Schedule of Investments
December 31, 2010
Capital Appreciation Fund
| Description | | Shares | | | Value | |
| | | | | | | |
| COMMON STOCKS – 66.7% | | | | | | |
| | | | | | | |
| Banks – 0.2% | | | | | | |
| Charter Financial | | | 8,600 | | | $ | 76,540 | |
| Waterstone Financial* | | | 6,400 | | | | 20,800 | |
| | | | | | | | 97,340 | |
| Chemicals – 4.4% | | | | | | | | |
| E.I. Du Pont de Nemours | | | 38,100 | | | | 1,900,428 | |
| Consumer Discretionary – 3.3% | | | | | | | | |
| Comcast, Class A | | | 21,100 | | | | 439,091 | |
| Fortune Brands | | | 8,700 | | | | 524,175 | |
| Meredith | | | 7,900 | | | | 273,735 | |
| New York Times, Class A* | | | 9,900 | | | | 97,020 | |
| Walt Disney | | | 2,700 | | | | 101,277 | |
| | | | | | | | 1,435,298 | |
| Consumer Staples – 7.5% | | | | | | | | |
| Campbell Soup | | | 13,100 | | | | 455,225 | |
| Coca-Cola | | | 3,300 | | | | 217,041 | |
| Coca Cola Enterprises | | | 16,500 | | | | 412,995 | |
| Sara Lee | | | 19,000 | | | | 332,690 | |
| SUPERVALU | | | 22,400 | | | | 215,712 | |
| Tootsie Roll Industries | | | 24,959 | | | | 723,062 | |
| Viterra* | | | 6,600 | | | | 61,599 | |
| Walgreen | | | 18,500 | | | | 720,760 | |
| Wal-Mart Stores | | | 2,600 | | | | 140,218 | |
| | | | | | | | 3,279,302 | |
| Energy – 10.2% | | | | | | | | |
| Clayton Williams Energy* | | | 9,900 | | | | 831,303 | |
| El Paso | | | 13,200 | | | | 181,632 | |
| Hess | | | 4,100 | | | | 313,814 | |
| Marathon Oil | | | 24,600 | | | | 910,938 | |
| Nexen | | | 63,400 | | | | 1,451,860 | |
| OPTI Canada* | | | 73,800 | | | | 49,730 | |
| Repsol YPF - ADR | | | 22,600 | | | | 631,444 | |
| USEC* | | | 10,500 | | | | 63,210 | |
| | | | | | | | 4,433,931 | |
| | | | | | | | | |
See Notes to the Financial Statements
Schedule of Investments – Continued
December 31, 2010
Capital Appreciation Fund
| Description | | Shares | | | Value | |
| | | | | | | |
COMMON STOCKS – 66.7% (Continued) | | | | | | |
| | | | | | | |
| Healthcare – 3.7% | | | | | | |
| Abbott Laboratories | | | 9,700 | | | $ | 464,727 | |
| Johnson & Johnson | | | 4,700 | | | | 290,695 | |
| Pfizer | | | 48,700 | | | | 852,737 | |
| | | | | | | | 1,608,159 | |
| Industrials – 0.4% | | | | | | | | |
| Tyco International | | | 4,300 | | | | 178,192 | |
| Information Technology – 4.6% | | | | | | | | |
| Automatic Data Processing | | | 28,000 | | | | 1,295,840 | |
| Xerox | | | 59,700 | | | | 687,744 | |
| | | | | | | | 1,983,584 | |
| Insurance – 8.6% | | | | | | | | |
| Alterra Capital Holdings | | | 13,100 | | | | 283,484 | |
| Arch Capital Group* | | | 3,700 | | | | 325,785 | |
| Berkshire Hathaway, Class B* | | | 6,800 | | | | 544,748 | |
| Donegal Group, Class A | | | 6,300 | | | | 91,224 | |
| First American Financial | | | 10,600 | | | | 158,364 | |
| Loews | | | 18,800 | | | | 731,508 | |
| Mercer Insurance Group | | | 3,700 | | | | 103,563 | |
| Platinum Underwriters Holdings | | | 21,700 | | | | 975,849 | |
| State Auto Financial | | | 31,700 | | | | 552,214 | |
| | | | | | | | 3,766,739 | |
| Metals & Mining – 10.6% | | | | | | | | |
| AngloGold Ashanti - ADR | | | 2,900 | | | | 142,767 | |
| Barrick Gold | | | 27,600 | | | | 1,467,768 | |
| Gold Fields - ADR | | | 88,500 | | | | 1,604,505 | |
| Newmont Mining | | | 21,500 | | | | 1,320,745 | |
| Northgate Minerals* | | | 21,800 | | | | 69,760 | |
| | | | | | | | 4,605,545 | |
| Paper & Forest Products – 3.4% | | | | | | | | |
| Domtar | | | 15,650 | | | | 1,188,148 | |
| Neenah Paper | | | 14,700 | | | | 289,296 | |
| | | | | | | | 1,477,444 | |
| | | | | | | | | |
See Notes to the Financial Statements
Schedule of Investments – Continued
December 31, 2010
Capital Appreciation Fund
| Description | | Shares | | | Value | |
| | | | | | | |
COMMON STOCKS – 66.7% (Continued) | | | | | | |
| | | | | | | |
| Real Estate – 2.3% | | | | | | |
| Forestar Group* | | | 12,200 | | | $ | 235,460 | |
| Post Properties | | | 21,200 | | | | 769,560 | |
| Thomas Properties Group* | | | 1,000 | | | | 4,220 | |
| | | | | | | | 1,009,240 | |
| Telecommunication Services – 0.8% | | | | | | | | |
| Telephone & Data Systems | | | 9,100 | | | | 332,605 | |
| Utilities – 6.7% | | | | | | | | |
| Allegheny Energy | | | 49,900 | | | | 1,209,576 | |
| Calpine* | | | 18,188 | | | | 242,628 | |
| Calpine - Escrow Shares* | | | 1,075,000 | | | | 86,000 | |
| GenOn Energy* | | | 291,154 | | | | 1,109,297 | |
| Public Service Enterprise Group | | | 8,300 | | | | 264,023 | |
| | | | | | | | 2,911,524 | |
| Total Common Stocks | | | | | | | | |
| (Cost $26,180,952) | | | | | | | 29,019,331 | |
| | | | | | | | | |
| | | Par | | | | | |
| CONVERTIBLE CORPORATE BONDS – 24.4% | | | | | | | | |
| Advanced Micro Devices | | | | | | | | |
| 5.750%, 08/15/2012 | | $ | 375,000 | | | | 384,375 | |
| Amgen | | | | | | | | |
| 0.125%, 02/01/2011 | | | 650,000 | | | | 649,188 | |
| Anixter International | | | | | | | | |
| 1.000%, 02/15/2013 | | | 1,175,000 | | | | 1,314,531 | |
| Archer Daniels | | | | | | | | |
| 0.875%, 02/15/2014 | | | 650,000 | | | | 663,813 | |
| Century Aluminum | | | | | | | | |
| 1.750%, 08/01/2024 | | | 100,000 | | | | 99,125 | |
| Charles River Laboratories International | | | | | | | | |
| 2.250%, 06/15/2013 | | | 400,000 | | | | 400,000 | |
| Chemed | | | | | | | | |
| 1.875%, 05/15/2014 | | | 150,000 | | | | 149,813 | |
| Chiquita Brands | | | | | | | | |
| 4.250%, 08/15/2016 | | | 50,000 | | | | 48,437 | |
| Dominion Resources, Series C | | | | | | | | |
| 2.125%, 12/15/2023 | | | 100,000 | | | | 121,875 | |
| | | | | | | | | |
See Notes to the Financial Statements
Schedule of Investments – Continued
December 31, 2010
Capital Appreciation Fund
| Description | | Par | | | Value | |
| | | | | | | |
CONVERTIBLE CORPORATE BONDS – 24.4% (CONTINUED) | | | | | | |
| Gilead Sciences | | | | | | |
| 0.625%, 05/01/2013 | | $ | 350,000 | | | $ | 385,875 | |
| Greatbatch | | | | | | | | |
| 2.250%, 06/15/2013 | | | 500,000 | | | | 487,500 | |
| Kinross Gold | | | | | | | | |
| 1.750%, 03/15/2028 | | | 550,000 | | | | 567,188 | |
| 1.750%, 03/15/2028 (a) | | | 100,000 | | | | 103,125 | |
| L-3 Communications | | | | | | | | |
| 3.000%, 08/01/2035 | | | 175,000 | | | | 175,437 | |
| Medtronic | | | | | | | | |
| 1.500%, 04/15/2011 | | | 625,000 | | | | 625,000 | |
| Newmont Mining | | | | | | | | |
| 1.250%, 07/15/2014 | | | 150,000 | | | | 215,062 | |
| Northgate Minerals | | | | | | | | |
| 3.500%, 10/01/2016 | | | 100,000 | | | | 107,625 | |
| Penn Virginia | | | | | | | | |
| 4.500%, 11/15/2012 | | | 250,000 | | | | 247,500 | |
| PHH | | | | | | | | |
| 4.000%, 04/15/2012 | | | 150,000 | | | | 184,125 | |
| RTI International | | | | | | | | |
| 3.000%, 12/01/2015 | | | 25,000 | | | | 25,906 | |
| Smithfield Foods | | | | | | | | |
| 4.000%, 06/30/2013 | | | 325,000 | | | | 379,031 | |
| Trinity Industries | | | | | | | | |
| 3.875%, 06/01/2036 | | | 525,000 | | | | 498,094 | |
| UAL | | | | | | | | |
| 5.000%, 02/01/2021 | | | 225,000 | | | | 212,063 | |
| 4.500%, 06/30/2021 | | | 175,000 | | | | 178,062 | |
| Unisource Energy | | | | | | | | |
| 4.500%, 03/01/2035 | | | 650,000 | | | | 689,000 | |
| USEC | | | | | | | | |
| 3.000%, 10/01/2014 | | | 1,900,000 | | | | 1,710,000 | |
| Total Convertible Corporate Bonds | | | | | | | | |
| (Cost $9,751,149) | | | | | | | 10,621,750 | |
| | | | | | | | | |
See Notes to the Financial Statements
Schedule of Investments – Continued
December 31, 2010
Capital Appreciation Fund
| Description | | Shares | | | Value | |
| | | | | | | |
| STAPLED UNIT – 0.6% | | | | | | |
| Paper & Forest Products – 0.6% | | | | | | |
| TimberWest Forest | | | | | | |
| (Cost $490,248) | | | 66,054 | | | $ | 279,017 | |
| | | | | | | | | |
| | | Par | | | | | |
| CORPORATE BOND – 0.4% | | | | | | | | |
| Edison Mission Energy | | | | | | | | |
| 7.000%, 05/15/2017 | | | | | | | | |
| (Cost $157,659) | | $ | 200,000 | | | | 158,500 | |
| | | | | | | | | |
| | | Shares | | | | | |
| CONVERTIBLE PREFERRED STOCK – 0.3% | | | | | | | | |
| Energy – 0.3% | | | | | | | | |
| El Paso Energy Capital Trust | | | | | | | | |
| (Cost $118,918) | | | 3,500 | | | | 136,045 | |
| | | | | | | | | |
| SHORT-TERM INVESTMENT – 7.0% | | | | | | | | |
| AIM Short-Term Treasury Portfolio, 0.040% | | | | | | | | |
| (Cost $3,049,969) | | | 3,049,969 | | | | 3,049,969 | |
| Total Investments – 99.4% | | | | | | | | |
| Cost ($39,748,895) | | | | | | | 43,264,612 | |
| Other Assets and Liabilities, Net – 0.6% | | | | | | | 270,358 | |
| Total Net Assets – 100.0% | | | | | | $ | 43,534,970 | |
| * | Non-income producing security |
| (a) | Security purchased within the terms of a private placement memorandum, exempt from registration under Rule 144A of the Securities Act of 1933, as amended, and may be sold only to dealers in that program or other “qualified institutional buyers.” As of December 31, 2010, the value of this investment was $103,125 or 0.2% of total net assets. |
ADR – American Depository Receipt
See Notes to the Financial Statements
Schedule of Investments
December 31, 2010
Opportunity Fund
| Description | | Shares | | | Value | |
| | | | | | | |
| COMMON STOCKS – 88.9% | | | | | | |
| | | | | | | |
| Banks – 7.8% | | | | | | |
| Abington Bancorp | | | 5,500 | | | $ | 65,615 | |
| AJS Bancorp | | | 2,000 | | | | 23,500 | |
| Cape Bancorp* | | | 10,900 | | | | 92,650 | |
| Chicopee Bancorp* | | | 9,900 | | | | 125,235 | |
| Clifton Savings Bancorp | | | 12,600 | | | | 136,206 | |
| First Defiance Financial | | | 7,000 | | | | 83,300 | |
| Fox Chase Bancorp* | | | 16,602 | | | | 196,734 | |
| Guaranty Bancorp* | | | 12,200 | | | | 17,202 | |
| Hampden Bancorp | | | 6,500 | | | | 73,645 | |
| Northern Trust | | | 6,800 | | | | 376,788 | |
| Ocean Shore Holding | | | 4,572 | | | | 52,349 | |
| OmniAmerican Bancorp* | | | 24,400 | | | | 330,620 | |
| Oritani Financial | | | 39,750 | | | | 486,540 | |
| Popular* | | | 41,533 | | | | 130,414 | |
| State Bancorp | | | 8,100 | | | | 74,925 | |
| Territorial Bancorp | | | 13,100 | | | | 260,821 | |
| ViewPoint Financial Group | | | 26,600 | | | | 310,954 | |
| Westfield Financial | | | 11,700 | | | | 108,225 | |
| | | | | | | | 2,945,723 | |
| Brokers – 0.8% | | | | | | | | |
| MF Global Holdings* | | | 34,700 | | | | 290,092 | |
| Chemicals – 1.1% | | | | | | | | |
| Air Products & Chemicals | | | 4,500 | | | | 409,275 | |
| Consumer Discretionary – 5.3% | | | | | | | | |
| American Eagle Outfitters | | | 15,600 | | | | 228,228 | |
| Brinker International | | | 4,200 | | | | 87,696 | |
| Fortune Brands | | | 4,900 | | | | 295,225 | |
| Morton’s Restaurant Group* | | | 27,100 | | | | 175,608 | |
| NVR* | | | 690 | | | | 476,804 | |
| Toll Brothers* | | | 17,300 | | | | 328,700 | |
| Yum! Brands | | | 8,000 | | | | 392,400 | |
| | | | | | | | 1,984,661 | |
| Consumer Staples – 14.4% | | | | | | | | |
| Alberto-Culver | | | 23,800 | | | | 881,552 | |
| Church & Dwight | | | 11,050 | | | | 762,671 | |
| Clorox | | | 11,700 | | | | 740,376 | |
See Notes to the Financial Statements
Schedule of Investments – Continued
December 31, 2010
Opportunity Fund
| Description | | Shares | | | Value | |
| | | | | | | |
COMMON STOCKS – 88.9% (Continued) | | | | | | |
| | | | | | | |
| Consumer Staples – 14.4% (Continued) | | | | | | |
| Coca-Cola | | | 6,200 | | | $ | 407,774 | |
| Foster’s Group | | | 80,100 | | | | 465,340 | |
| Molson Coors Brewing, Class B | | | 8,600 | | | | 431,634 | |
| PepsiCo | | | 8,200 | | | | 535,706 | |
| Philip Morris International | | | 4,600 | | | | 269,238 | |
| Sysco | | | 10,000 | | | | 294,000 | |
| Viterra* | | | 10,600 | | | | 98,932 | |
| Wal-Mart Stores | | | 9,500 | | | | 512,335 | |
| | | | | | | | 5,399,558 | |
| Diversified Financial Services – 7.5% | | | | | | | | |
| Franklin Resources | | | 7,600 | | | | 845,196 | |
| Invesco | | | 21,400 | | | | 514,884 | |
| JPMorgan Chase | | | 4,700 | | | | 199,374 | |
| Leucadia National | | | 34,100 | | | | 995,038 | |
| PICO Holdings* | | | 7,900 | | | | 251,220 | |
| | | | | | | | 2,805,712 | |
| Energy – 8.3% | | | | | | | | |
| Hess | | | 12,400 | | | | 949,096 | |
| Hugoton Royalty Trust | | | 10,400 | | | | 213,408 | |
| Marathon Oil | | | 10,200 | | | | 377,706 | |
| Murphy Oil | | | 11,300 | | | | 842,415 | |
| Nexen | | | 33,000 | | | | 755,700 | |
| | | | | | | | 3,138,325 | |
| Healthcare – 5.9% | | | | | | | | |
| American Medical Systems Holdings* | | | 19,600 | | | | 369,656 | |
| Biogen Idec* | | | 2,600 | | | | 174,330 | |
| Henry Schein* | | | 1,600 | | | | 98,224 | |
| Humana* | | | 4,200 | | | | 229,908 | |
| Johnson & Johnson | | | 4,300 | | | | 265,955 | |
| Merck & Co. | | | 13,148 | | | | 473,854 | |
| Pfizer | | | 9,600 | | | | 168,096 | |
| WellPoint* | | | 7,600 | | | | 432,136 | |
| | | | | | | | 2,212,159 | |
| | | | | | | | | |
See Notes to the Financial Statements
Schedule of Investments – Continued
December 31, 2010
Opportunity Fund
| Description | | Shares | | | Value | |
| | | | | | | |
COMMON STOCKS – 88.9% (Continued) | | | | | | |
| | | | | | | |
| Industrials – 2.2% | | | | | | |
| Alliant Techsystems* | | | 1,400 | | | $ | 104,202 | |
| Graco | | | 9,800 | | | | 386,610 | |
| Tyco International | | | 8,300 | | | | 343,952 | |
| | | | | | | | 834,764 | |
| Information Technology – 9.2% | | | | | | | | |
| Automatic Data Processing | | | 8,500 | | | | 393,380 | |
| BMC Software* | | | 9,300 | | | | 438,402 | |
| CACI International* | | | 2,140 | | | | 114,276 | |
| EMC* | | | 24,100 | | | | 551,890 | |
| Marvell Technology Group* | | | 15,400 | | | | 285,670 | |
| Microsoft | | | 6,200 | | | | 173,104 | |
| Symantec* | | | 8,800 | | | | 147,312 | |
| Synopsys* | | | 13,900 | | | | 374,049 | |
| Teradata* | | | 5,200 | | | | 214,032 | |
| Xerox | | | 33,670 | | | | 387,878 | |
| Xilinx | | | 13,100 | | | | 379,638 | |
| | | | | | | | 3,459,631 | |
| Insurance – 10.8% | | | | | | | | |
| Alleghany* | | | 369 | | | | 113,051 | |
| AON | | | 8,700 | | | | 400,287 | |
| Arch Capital Group* | | | 3,200 | | | | 281,760 | |
| Arthur J. Gallagher | | | 8,900 | | | | 258,812 | |
| Aspen Insurance Holdings | | | 11,900 | | | | 340,578 | |
| Assurant | | | 6,800 | | | | 261,936 | |
| Cincinnati Financial | | | 11,400 | | | | 361,266 | |
| Lancashire Holdings | | | 31,490 | | | | 271,499 | |
| Mercer Insurance Group | | | 5,000 | | | | 139,950 | |
| Penn Millers Holding* | | | 16,505 | | | | 216,876 | |
| Platinum Underwriters Holdings | | | 19,600 | | | | 881,412 | |
| Progressive | | | 7,600 | | | | 151,012 | |
| RenaissanceRe Holdings | | | 3,300 | | | | 210,177 | |
| Wesco Financial Group | | | 427 | | | | 157,311 | |
| | | | | | | | 4,045,927 | |
| | | | | | | | | |
See Notes to the Financial Statements
Schedule of Investments – Continued
December 31, 2010
Opportunity Fund
| Description | | Shares | | | Value | |
| | | | | | | |
COMMON STOCKS – 88.9% (Continued) | | | | | | |
| | | | | | | |
| Metals & Mining – 7.8% | | | | | | |
| Gold Fields - ADR | | | 49,900 | | | $ | 904,687 | |
| Kinross Gold | | | 40,700 | | | | 771,672 | |
| Newmont Mining | | | 18,800 | | | | 1,154,884 | |
| Victoria Gold* | | | 96,500 | | | | 104,817 | |
| | | | | | | | 2,936,060 | |
| Paper & Forest Products – 0.2% | | | | | | | | |
| Domtar | | | 1,258 | | | | 95,507 | |
| Real Estate – 0.7% | | | | | | | | |
| Forestar Group* | | | 3,600 | | | | 69,480 | |
| Thomas Properties Group* | | | 43,200 | | | | 182,304 | |
| | | | | | | | 251,784 | |
| Utilities – 6.9% | | | | | | | | |
| Allegheny Energy | | | 25,300 | | | | 613,272 | |
| Ameren | | | 7,200 | | | | 202,968 | |
| American Electric Power | | | 6,500 | | | | 233,870 | |
| Calpine - Escrow Shares* | | | 125,000 | | | | 10,000 | |
| Empire District Electric | | | 22,000 | | | | 488,400 | |
| GenOn Energy* | | | 35,437 | | | | 135,015 | |
| NV Energy | | | 35,300 | | | | 495,965 | |
| TransAlta | | | 8,500 | | | | 180,806 | |
| Unisource Energy | | | 1,400 | | | | 50,176 | |
| Unitil | | | 8,000 | | | | 181,924 | |
| | | | | | | | 2,592,396 | |
| Total Common Stocks | | | | | | | | |
| (Cost $28,035,976) | | | | | | | 33,401,574 | |
| | | Par | | | | | |
| CONVERTIBLE BONDS – 1.4% | | | | | | | | |
| Alliant Techsystems | | | | | | | | |
| 3.00%, 08/15/2024 | | $ | 150,000 | | | | 168,750 | |
| Kinross Gold | | | | | | | | |
| 1.75%, 03/15/2028 (a) | | | 150,000 | | | | 154,687 | |
| 1.75%, 03/15/2028 | | | 75,000 | | | | 77,344 | |
| Symantec | | | | | | | | |
| 0.75%, 06/15/2011 | | | 125,000 | | | | 129,532 | |
| Total Convertible Bond | | | | | | | | |
| (Cost 497,064) | | | | | | | 530,313 | |
| | | | | | | | | |
See Notes to the Financial Statements
Schedule of Investments – Continued
December 31, 2010
Opportunity Fund
| Description | | Par | | | Value | |
| CORPORATE BONDS – 1.3% | | | | | | |
| Broadridge Financial Solutions | | | | | | |
| 6.13%, 06/01/2017 | | $ | 175,000 | | | $ | 177,804 | |
| Leucadia National | | | | | | | | |
| 7.00%, 08/15/2013 | | | 200,000 | | | | 214,250 | |
| Mohawk Industries | | | | | | | | |
| 6.50%, 01/15/2011 | | | 75,000 | | | | 74,813 | |
| Total Corporate Bond | | | | | | | | |
| (Cost 403,429) | | | | | | | 466,867 | |
| | | | | | | | | |
| | | Shares | | | | | |
| SHORT-TERM INVESTMENT – 6.4% | | | | | | | | |
| AIM Short-Term Treasury Portfolio, 0.040% | | | | | | | | |
| (Cost $2,406,456) | | | 2,406,456 | | | | 2,406,456 | |
| | | | | | | | | |
| Total Investments – 98.0% | | | | | | | | |
| Cost ($31,342,925) | | | | | | | 36,805,210 | |
| Other Assets and Liabilities, Net – 2.0% | | | | | | | 770,122 | |
| Total Net Assets – 100.0% | | | | | | $ | 37,575,332 | |
| | | | | | | | | |
| * | Non-income producing security |
| (a) | Security purchased within the terms of a private placement memorandum, exempt from registration under Rule 144A of the Securities Act of 1933, as amended, and may be sold only to dealers in that program or other “qualified institutional buyers.” As of December 31, 2010, the value of this investment was $154,687 or 0.4% of total net assets. |
ADR – American Depository Receipt
See Notes to the Financial Statements
Statements of Assets and Liabilities
December 31, 2010
| | | Capital Appreciation Fund | | | Opportunity Fund | |
| ASSETS: | | | | | | |
| Investments, at market value | | | | | | |
| (Cost $39,748,895 and $31,342,925, respectively) | | $ | 43,264,612 | | | $ | 36,805,210 | |
| Receivable for investment securities sold | | | 114,771 | | | | 29,947 | |
| Receivable for dividends and interest | | | 91,196 | | | | 100,095 | |
| Receivable for capital shares sold | | | 190,778 | | | | 733,027 | |
| Prepaid expenses | | | 17,115 | | | | 16,369 | |
| Total assets | | | 43,678,472 | | | | 37,684,648 | |
| | | | | | | | | |
| LIABILITIES: | | | | | | | | |
| Payable for investment securities purchased | | | 55,287 | | | | 29,895 | |
| Payable for capital shares redeemed | | | 2,220 | | | | 1,466 | |
| Payable to adviser, net | | | 22,893 | | | | 17,162 | |
| Accrued distribution fees | | | 6,423 | | | | 6,039 | |
| Accrued expenses and other liabilities | | | 56,679 | | | | 54,754 | |
| Total liabilities | | | 143,502 | | | | 109,316 | |
| | | | | | | | | |
| NET ASSETS | | $ | 43,534,970 | | | $ | 37,575,332 | |
| | | | | | | | | |
| COMPOSITION OF NET ASSETS: | | | | | | | | |
| Portfolio capital | | $ | 40,348,867 | | | $ | 31,929,444 | |
| Distributions in excess of net investment income | | | (106,690 | ) | | | (45,909 | ) |
| Accumulated net realized gain (loss) on investments | | | (222,969 | ) | | | 229,437 | |
| Net unrealized appreciation of investments | | | 3,515,762 | | | | 5,462,360 | |
| Total net assets | | $ | 43,534,970 | | | $ | 37,575,332 | |
| | | | | | | | | |
CAPITAL STOCK, $0.0001 par value | | | | | | | | |
| Authorized | | | 500,000,000 | | | | 500,000,000 | |
| Issued and outstanding | | | 2,734,952 | | | | 2,152,801 | |
| | | | | | | | | |
| NET ASSET VALUE, REDEMPTION PRICE, | | | | | | | | |
| AND OFFERING PRICE PER SHARE | | $ | 15.92 | | | $ | 17.45 | |
| | | | | | | | | |
See Notes to the Financial Statements
Statements of Operations
For the Year Ended December 31, 2010
| | | Capital Appreciation Fund | | | Opportunity Fund | |
| INVESTMENT INCOME: | | | | | | |
| Interest income | | $ | 455,825 | | | $ | 72,044 | |
| Dividend income | | | 441,980 | | | | 589,322 | |
| Less: Foreign taxes withheld | | | (5,790 | ) | | | (8,639 | ) |
| Total investment income | | | 892,015 | | | | 652,727 | |
| | | | | | | | | |
| EXPENSES: | | | | | | | | |
| Investment advisory fees | | | 383,506 | | | | 342,938 | |
| Directors’ fees | | | 54,981 | | | | 48,204 | |
| Administration fees | | | 49,712 | | | | 49,423 | |
| Fund accounting fees | | | 38,790 | | | | 37,990 | |
| Legal fees | | | 34,108 | | | | 30,309 | |
| Transfer agent fees | | | 31,676 | | | | 30,610 | |
| Audit fees | | | 26,898 | | | | 26,898 | |
| Distribution fees | | | 24,739 | | | | 23,396 | |
| Registration fees | | | 23,568 | | | | 23,370 | |
| Other expenses | | | 14,956 | | | | 11,528 | |
| Custodian fees | | | 12,157 | | | | 9,621 | |
| Postage and printing fees | | | 4,879 | | | | 4,437 | |
| Total expenses | | | 699,970 | | | | 638,724 | |
| Less: Fee waivers | | | (177,007 | ) | | | (171,081 | ) |
| Total net expenses | | | 522,963 | | | | 467,643 | |
| NET INVESTMENT INCOME | | | 369,052 | | | | 185,084 | |
| | | | | | | | | |
| REALIZED AND UNREALIZED GAINS: | | | | | | | | |
| Net realized gain on investments | | | 614,148 | | | | 1,502,770 | |
| Net change in unrealized | | | | | | | | |
| appreciation or depreciation of investments | | | 4,942,359 | | | | 3,551,411 | |
| Net gain on investments | | | 5,556,507 | | | | 5,054,181 | |
| | | | | | | | | |
| NET INCREASE IN NET ASSETS | | | | | | | | |
| RESULTING FROM OPERATIONS | | $ | 5,925,559 | | | $ | 5,239,265 | |
| | | | | | | | | |
See Notes to the Financial Statements
Statements of Changes in Net Assets
| | | Capital Appreciation Fund | |
| | | Year Ended | | | Year Ended | |
| | | December 31, 2010 | | | December 31, 2009 | |
| OPERATIONS: | | | | | | |
| Net investment income | | $ | 369,052 | | | $ | 509,808 | |
| Net realized gain on investments | | | 614,148 | | | | 501,382 | |
| Net change in unrealized appreciation of investments | | | 4,942,359 | | | | 5,498,306 | |
| Net increase resulting from operations | | | 5,925,559 | | | | 6,509,496 | |
| | | | | | | | | |
| CAPITAL SHARE TRANSACTIONS: | | | | | | | | |
| Proceeds from shares sold | | | 13,237,074 | | | | 7,663,277 | |
| Proceeds from reinvestment of distributions | | | 1,236,930 | | | | 487,535 | |
| Payments for shares redeemed | | | (5,327,060 | ) | | | (4,536,906 | ) |
| Redemption fees | | | 1,469 | | | | 7,179 | |
| Net increase from capital share transactions | | | 9,148,413 | | | | 3,621,085 | |
| | | | | | | | | |
| DISTRIBUTIONS PAID FROM: | | | | | | | | |
| Net investment income | | | (435,315 | ) | | | (498,151 | ) |
| Net realized gains | | | (827,499 | ) | | | — | |
| Total distributions to shareholders | | | (1,262,814 | ) | | | (498,151 | ) |
| | | | | | | | | |
| TOTAL INCREASE IN NET ASSETS | | | 13,811,158 | | | | 9,632,430 | |
| | | | | | | | | |
| NET ASSETS: | | | | | | | | |
| Beginning of period | | | 29,723,812 | | | | 20,091,382 | |
| | | | | | | | | |
| End of period (including distributions | | | | | | | | |
| in excess of net investment income | | | | | | | | |
| of $(106,690) and $(31,083), respectively) | | $ | 43,534,970 | | | $ | 29,723,812 | |
| | | | | | | | | |
| TRANSACTIONS IN SHARES: | | | | | | | | |
| Shares sold | | | 883,030 | | | | 631,668 | |
| Shares issued in reinvestment of distributions | | | 77,794 | | | | 34,651 | |
| Shares redeemed | | | (356,268 | ) | | | (387,533 | ) |
| Net increase | | | 604,556 | | | | 278,786 | |
| | | | | | | | | |
| | | | | | | | | |
See Notes to the Financial Statements
Statements of Changes in Net Assets
| | | Opportunity Fund | |
| | | Year Ended | | | Year Ended | |
| | | December 31, 2010 | | | December 31, 2009 | |
| OPERATIONS: | | | | | | |
| Net investment income | | $ | 185,084 | | | $ | 143,612 | |
| Net realized gain (loss) on investments | | | 1,502,770 | | | | (284,138 | ) |
| Net change in unrealized appreciation or depreciation | | | | | | | | |
| of investments | | | 3,551,411 | | | | 4,791,653 | |
| Net increase resulting from operations | | | 5,239,265 | | | | 4,651,127 | |
| | | | | | | | | |
| CAPITAL SHARE TRANSACTIONS: | | | | | | | | |
| Proceeds from shares sold | | | 11,571,265 | | | | 9,039,886 | |
| Proceeds from reinvestment of distributions | | | 417,731 | | | | 141,283 | |
| Payments for shares redeemed | | | (5,299,701 | ) | | | (3,639,425 | ) |
| Redemption fees | | | 534 | | | | 6,991 | |
| Net increase from capital share transactions | | | 6,689,829 | | | | 5,548,735 | |
| | | | | | | | | |
| DISTRIBUTIONS PAID FROM: | | | | | | | | |
| Net investment income | | | (248,189 | ) | | | (142,261 | ) |
| Net realized gains | | | (187,790 | ) | | | — | |
| Total distributions to shareholders | | | (435,979 | ) | | | (142,261 | ) |
| | | | | | | | | |
| TOTAL INCREASE IN NET ASSETS | | | 11,493,115 | | | | 10,057,601 | |
| | | | | | | | | |
| NET ASSETS: | | | | | | | | |
| Beginning of period | | | 26,082,217 | | | | 16,024,616 | |
| End of period (including distributions | | | | | | | | |
| in excess of net investment income | | | | | | | | |
| of $(45,909) and $(3,732), respectively) | | $ | 37,575,332 | | | $ | 26,082,217 | |
| | | | | | | | | |
| TRANSACTIONS IN SHARES: | | | | | | | | |
| Shares sold | | | 731,881 | | | | 681,323 | |
| Shares issued in reinvestment of distributions | | | 23,925 | | | | 9,289 | |
| Shares redeemed | | | (330,822 | ) | | | (294,001 | ) |
| Net increase | | | 424,984 | | | | 396,611 | |
| | | | | | | | | |
| | | | | | | | | |
See Notes to the Financial Statements
Financial Highlights
| | | Capital Appreciation Fund | |
| | | Year Ended | | | Year Ended | | | Year Ended | | | September 28, 2007(1) | |
| | | December 31, | | | December 31, | | | December 31, | | | through | |
| | | 2010 | | | 2009 | | | 2008 | | | December 31, 2007 | |
| For a Fund share outstanding | | | | | | | | | | | | |
| throughout the period | | | | | | | | | | | | |
| | | | | | | | | | | | | |
| NET ASSET VALUE: | | | | | | | | | | | | |
| Beginning of period | | $ | 13.95 | | | $ | 10.85 | | | $ | 14.94 | | | $ | 15.00 | |
| | | | | | | | | | | | | | | | | |
| OPERATIONS: | | | | | | | | | | | | | | | | |
| Net investment income | | | 0.14 | | | | 0.25 | | | | 0.08 | | | | 0.01 | |
| Net realized and unrealized | | | | | | | | | | | | | | | | |
| gain (loss) on investments | | | 2.30 | | | | 3.09 | | | | (4.08 | ) | | | (0.06 | ) |
| Total from operations | | | 2.44 | | | | 3.34 | | | | (4.00 | ) | | | (0.05 | ) |
| | | | | | | | | | | | | | | | | |
| LESS DISTRIBUTIONS: | | | | | | | | | | | | | | | | |
| From net investment income | | | (0.16 | ) | | | (0.24 | ) | | | (0.09 | ) | | | (0.01 | ) |
| From net realized gains | | | (0.31 | ) | | | — | | | | (0.01 | ) | | | — | |
| Total distributions | | | (0.47 | ) | | | (0.24 | ) | | | (0.10 | ) | | | (0.01 | ) |
| | | | | | | | | | | | | | | | | |
| Paid in capital from redemption fees | | | — | (2) | | | — | (2) | | | 0.01 | | | | — | |
| | | | | | | | | | | | | | | | | |
| NET ASSET VALUE: | | | | | | | | | | | | | | | | |
| End of period | | $ | 15.92 | | | $ | 13.95 | | | $ | 10.85 | | | $ | 14.94 | |
| | | | | | | | | | | | | | | | | |
| TOTAL RETURN | | | 17.52 | % | | | 30.74 | % | | | (26.67 | )% | | | (0.32 | )%(3) |
| | | | | | | | | | | | | | | | | |
| SUPPLEMENTAL DATA | | | | | | | | | | | | | | | | |
| AND RATIOS: | | | | | | | | | | | | | | | | |
| Net assets, end of period | | | | | | | | | | | | | | | | |
| (in thousands) | | $ | 43,535 | | | $ | 29,724 | | | $ | 20,091 | | | $ | 8,168 | |
| Ratio of expenses to average net assets: | | | | | | | | | | | | | | | | |
| Before expense reimbursement | | | 2.01 | % | | | 2.38 | % | | | 3.51 | % | | | 11.28 | %(4) |
| After expense reimbursement | | | 1.50 | % | | | 1.50 | % | | | 1.50 | % | | | 1.50 | %(4) |
| Ratio of net investment income (loss) | | | | | | | | | | | | | | | | |
| to average net assets: | | | | | | | | | | | | | | | | |
| Before expense reimbursement | | | 0.55 | % | | | 1.27 | % | | | (1.07 | )% | | | (9.38 | )%(4) |
| After expense reimbursement | | | 1.06 | % | | | 2.15 | % | | | 0.94 | % | | | 0.40 | %(4) |
| Portfolio turnover rate | | | 27 | % | | | 41 | % | | | 21 | % | | | 5 | %(3) |
| | | | | | | | | | | | | | | | | |
| (1) | Inception date of the fund. |
| (2) | Less than $0.01 per share. |
See Notes to the Financial Statements
Financial Highlights
| | | Opportunity Fund | |
| | | Year Ended | | | Year Ended | | | Year Ended | | | September 28, 2007(1) | |
| | | December 31, | | | December 31, | | | December 31, | | | through | |
| | | 2010 | | | 2009 | | | 2008 | | | December 31, 2007 | |
| For a Fund share outstanding | | | | | | | | | | | | |
| throughout the period | | | | | | | | | | | | |
| | | | | | | | | | | | | |
| NET ASSET VALUE: | | | | | | | | | | | | |
| Beginning of period | | $ | 15.10 | | | $ | 12.04 | | | $ | 14.96 | | | $ | 15.00 | |
| | | | | | | | | | | | | | | | | |
| OPERATIONS: | | | | | | | | | | | | | | | | |
| Net investment income | | | 0.09 | | | | 0.08 | | | | 0.05 | | | | 0.02 | |
| Net realized and unrealized | | | | | | | | | | | | | | | | |
| gain (loss) on investments | | | 2.47 | | | | 3.06 | | | | (2.92 | ) | | | (0.01 | ) |
| Total from operations | | | 2.56 | | | | 3.14 | | | | (2.87 | ) | | | 0.01 | |
| | | | | | | | | | | | | | | | | |
| LESS DISTRIBUTIONS: | | | | | | | | | | | | | | | | |
| From net investment income | | | (0.12 | ) | | | (0.08 | ) | | | (0.06 | ) | | | (0.02 | ) |
| From net realized gains | | | (0.09 | ) | | | — | | | | — | | | | (0.03 | ) |
| Total distributions | | | (0.21 | ) | | | (0.08 | ) | | | (0.06 | ) | | | (0.05 | ) |
| | | | | | | | | | | | | | | | | |
| Paid in capital from redemption fees | | | — | (2) | | | — | (2) | | | 0.01 | | | | — | |
| | | | | | | | | | | | | | | | | |
| NET ASSET VALUE: | | | | | | | | | | | | | | | | |
| End of period | | $ | 17.45 | | | $ | 15.10 | | | $ | 12.04 | | | $ | 14.96 | |
| | | | | | | | | | | | | | | | | |
| TOTAL RETURN | | | 16.94 | % | | | 26.10 | % | | | (19.14 | )% | | | 0.11 | %(3) |
| | | | | | | | | | | | | | | | | |
| SUPPLEMENTAL DATA | | | | | | | | | | | | | | | | |
| AND RATIOS: | | | | | | | | | | | | | | | | |
| Net assets, end of period | | | | | | | | | | | | | | | | |
| (in thousands) | | $ | 37,575 | | | $ | 26,082 | | | $ | 16,025 | | | $ | 5,896 | |
| Ratio of expenses to average net assets: | | | | | | | | | | | | | | | | |
| Before expense reimbursement | | | 2.05 | % | | | 2.51 | % | | | 4.11 | % | | | 14.50 | %(4) |
| After expense reimbursement | | | 1.50 | % | | | 1.50 | % | | | 1.50 | % | | | 1.50 | %(4) |
| Ratio of net investment income (loss) | | | | | | | | | | | | | | | | |
| to average net assets: | | | | | | | | | | | | | | | | |
| Before expense reimbursement | | | 0.04 | % | | | (0.27 | )% | | | (1.96 | )% | | | (12.27 | )%(4) |
| After expense reimbursement | | | 0.59 | % | | | 0.74 | % | | | 0.65 | % | | | 0.73 | %(4) |
| Portfolio turnover rate | | | 45 | % | | | 51 | % | | | 66 | % | | | 18 | %(3) |
| | | | | | | | | | | | | | | | | |
| (1) | Inception date of the fund. | | | | | | | | | | | | | | |
| (2) | Less than $0.01 per share. | | | | | | | | | | | | | | |
| (3) | Not Annualized. | | | | | | | | | | | | | | |
| (4) | Annualized. | | | | | | | | | | | | | | |
See Notes to the Financial Statements
Notes to the Financial Statements
December 31, 2010
Prospector Funds, Inc. (the “Corporation”) was organized as a Maryland corporation on June 6, 2007 and is registered under the Investment Company Act of 1940 (the “1940 Act”), as amended, as an open-end diversified management investment company. The Corporation issues its shares in series, each series representing a distinct portfolio with its own investment objectives and policies. There are two series presently authorized, the Prospector Capital Appreciation Fund and the Prospector Opportunity Fund (individually a “Fund” and collectively the “Funds”). The Funds commenced operations on September 28, 2007.
| 2. | SIGNIFICANT ACCOUNTING POLICIES |
The following is a summary of significant accounting policies consistently followed by each Fund:
Security Valuation – Portfolio securities which are traded on an exchange are valued at the last sales price reported by the exchange on which the securities are primarily traded on the day of valuation. If there are no sales on a given day for securities traded on an exchange or for securities not traded or dealt on any securities exchange for which over-the-counter market quotations are readily available, the latest bid quotation will be used. Debt securities with remaining maturities of 60 days or less may be valued on an amortized cost basis, which involves valuing an instrument at its cost and thereafter assuming a constant amortization to maturity of any discount or premium, regardless of the impact of fluctuating rates on the market value of the instrument. Any securities or other assets for which market quotations are not readily available are valued at fair value as determined in good faith by Prospector Partners Asset Management, LLC (the “Adviser” or “Investment Manager”) pursuant to procedures under the general supervision and responsibility of the Funds’ Board of Directors.
Generally accepted accounting principles (“GAAP”) require disclosures regarding the inputs and valuation techniques used to measure fair value and any changes in valuation inputs or technique. These principles establish a three-tier hierarchy for inputs used in measuring fair value. Fair value inputs are summarized in the three broad levels listed below:
| Level 1 – | Quoted prices in active markets for identical securities |
| Level 2 – | Other significant observable inputs (including quoted prices for similar securities, interest rates, prepayment speeds, credit risk, etc.). |
| Level 3 – | Significant unobservable inputs (including the Funds’ own assumptions in determining the fair value of investments). |
The inputs or methodology used for valuing securities are not an indication of the risk associated with investing in those securities.
Notes to the Financial Statements – Continued
December 31, 2010
As of December 31, 2010, each fund’s investments in securities were classified as follows:
| | | Level 1 | | | Level 2 | | | Level 3 | | | Total | |
| Capital Appreciation Fund | | | | | | | | | | | | |
| Common Stocks | | $ | 28,933,331 | | | $ | — | | | $ | 86,000 | | | $ | 29,019,331 | |
| Convertible Bonds | | | — | | | | 10,621,750 | | | | — | | | | 10,621,750 | |
| Stapled Units | | | 279,017 | | | | — | | | | — | | | | 279,017 | |
| Corporate Bond | | | — | | | | 158,500 | | | | — | | | | 158,500 | |
| Convertible Preferred Stocks | | | 136,045 | | | | — | | | | — | | | | 136,045 | |
| Short-Term Investments | | | 3,049,969 | | | | — | | | | — | | | | 3,049,969 | |
| Total Investments | | $ | 32,398,362 | | | $ | 10,780,250 | | | $ | 86,000 | | | $ | 43,264,612 | |
| | | | | | | | | | | | | | | | | |
| Opportunity Fund | | | | | | | | | | | | | | | | |
| Common Stocks | | $ | 33,391,574 | | | $ | — | | | $ | 10,000 | | | $ | 33,401,574 | |
| Corporate Bonds | | | — | | | | 466,867 | | | | — | | | | 466,867 | |
| Convertible Bonds | | | — | | | | 530,313 | | | | — | | | | 530,313 | |
| Short-Term Investments | | | 2,406,456 | | | | — | | | | — | | | | 2,406,456 | |
| Total Investments | | $ | 35,798,030 | | | $ | 997,180 | | | $ | 10,000 | | | $ | 36,805,210 | |
Refer to each Fund’s Schedule of Investments for further sector breakout.
The following is a reconciliation of Level 3 assets for which significant unobservable inputs were used to determine fair value.
| | | | | | | |
| | | Common | | | | | | Common | |
| | | Stocks - | | | Convertible | | | Stocks - | |
| | | Utilities | | | Bonds | | | Utilities | |
| Balance as of 12/31/2009 | | $ | 61,812 | | | $ | 156,480 | | | $ | 7,188 | |
| Accrued discounts/premiums | | | — | | | | — | | | | — | |
| Realized gain (loss) | | | — | | | | — | | | | — | |
| Change in net unrealized appreciation | | | 24,188 | | | | — | | | | 2,812 | |
| Net purchases (sales) | | | — | | | | — | | | | — | |
| Transfers in and/or out of Level 3 | | | — | | | | (156,480 | ) | | | — | |
| | | | | | | | | | | | | |
| Balance as of 12/31/2010 | | $ | 86,000 | | | $ | — | | | $ | 10,000 | |
| Net unrealized appreciation (depreciation) | | | | | | | | | | | | |
| of Level 3 securities as of December 31, 2010 | | $ | (125 | ) | | $ | — | | | $ | 10,000 | |
| | | | | | | | | | | | | |
Transfers in and/or out of Level 3 are shown using beginning of period values. During the year ended December 31, 2010, the Funds recognized no significant transfers to/from Level 1 or Level 2. The convertible bond held by Capital Appreciation Fund was not priced by pricing services as of December 31, 2009. The security was transferred from Level 3 once it began being priced by a pricing service.
Notes to the Financial Statements – Continued
December 31, 2010
The Funds may invest in derivative financial instruments in order to manage risk or gain exposure to various other investments or markets. The Funds’ investment objectives allow the Funds to enter into various types of derivative contracts, including, but not limited to, futures contracts, forward foreign exchange contracts, and purchased and written options. Derivatives may contain various risks including the potential inability of the counterparty to fulfill their obligations under the terms of the contract, the potential for an illiquid secondary market, and the potential for market movements which may expose the funds to gains or losses in excess of the amounts shown on the Statements of Assets and Liabilities. As of and for the year ended December 31, 2010, the Funds held no derivative instruments.
Distributions to Shareholders – Dividends from net investment income and distributions of net realized capital gains, if any, will be declared and paid at least annually. The character of distributions made during the period from net investment income or net realized gains may differ from the characterization for federal income tax purposes due to differences in the recognition of income, expense and gain items for financial statement and tax purposes. All short-term capital gains are included in ordinary income for tax purposes.
Use of Estimates – The preparation of financial statements in conformity with accounting principles generally accepted in the United States of America requires management to make estimates and assumptions that affect the reported amounts of assets and liabilities and disclosure of contingent assets and liabilities at the date of the financial statements and the reported amounts of revenues and expenses during the reporting period. Actual results could differ from those estimates.
Federal Income Taxes – The Funds intend to meet the requirements of subchapter M of the Internal Revenue Code applicable to regulated investment companies and to distribute substantially all net taxable investment income and net realized gains to shareholders in a manner which results in no tax cost to the Funds. Therefore, no federal income or excise tax provision is required. As of December 31, 2010, the Funds did not have any tax positions that did not meet the “more-likely-than-not” threshold of being sustained by the applicable tax authority. Generally, tax authorities can examine all the tax returns filed for the last three years.
Reclassification of Capital Accounts – GAAP requires that certain components of net assets relating to permanent differences be reclassified between financial and tax reporting. These reclassifications have no effect on net assets or net asset value per share. For the fiscal year ended December 31, 2010, the following reclassifications were made on the Statements of Assets and Liabilities:
| | | Undistributed Net | | | Accumulated Net | |
| | | Investment Income | | | Realized Gain | |
| Capital Appreciation Fund | | $ | (9,344 | ) | | $ | 9,344 | |
| Opportunity Fund | | | 20,928 | | | | (20,928 | ) |
Foreign Currency Translation – The books and records relating to the Funds’ non-U.S. dollar denominated investments are maintained in U.S. dollars on the following bases: (1) market value of investment securities, assets, and liabilities are translated at the current rate of exchange; and (2) purchases and sales of investment securities, income, and expenses are translated at the relevant rates of exchange prevailing on the respective dates of such transactions. The Funds do not isolate the portion of gains and losses on investments in equity securities that is due to changes in the foreign exchange rates from that which is due to changes in market prices of equity securities. The Funds report certain foreign currency-related transactions as components of realized gains for financial reporting purposes, whereas such components are treated as ordinary income for federal income tax purposes.
Notes to the Financial Statements – Continued
December 31, 2010
Expenses – Expenses directly attributable to a Fund are charged to that Fund, while expenses attributable to more than one Fund are allocated among the respective Funds based on relative net assets or another appropriate basis.
Other – Investment and shareholder transactions are recorded on the trade date. Each Fund determines the gain or loss realized from the investment transactions on the basis of identified cost. Dividend income is recognized on the ex-dividend date. Interest income, including amortization of bond premium and discount, is recognized on an accrual basis.
| 3. | INVESTMENT TRANSACTIONS |
During the year ended December 31, 2010, purchases of securities and proceeds from sales of securities, other than temporary investments in short-term securities, were as follows:
| | | Purchases | | | Sales | |
| Capital Appreciation Fund | | $ | 15,911,333 | | | $ | 8,874,863 | |
| Opportunity Fund | | | 18,095,633 | | | | 13,093,572 | |
There were no purchases or sales of long-term U.S. Government securities.
The aggregate gross unrealized appreciation and depreciation of securities held by the Funds and the total cost of securities for federal income tax purposes at December 31, 2010, were as follows:
| | | Aggregate | | | Aggregate | | | | | | Federal | |
| | | Gross | | | Gross | | | | | | Income | |
| | | Appreciation | | | Depreciation | | | Net | | | Tax Cost | |
| Capital Appreciation Fund | | $ | 6,414,697 | | | $ | (3,161,069 | ) | | $ | 3,253,628 | | | $ | 40,011,029 | |
| Opportunity Fund | | | 6,092,591 | | | | (663,792 | ) | | | 5,428,799 | | | | 31,376,486 | |
At December 31, 2010, the Funds’ most recently completed fiscal year-end, components of accumulated earnings (deficit) on a tax-basis were as follows:
| | | Undistributed | | | Undistributed | | | Other | | | | | | Total | |
| | | Ordinary | | | Long-Term | | | Accumulated | | | Unrealized | | | Accumulated | |
| | | Income | | | Capital Gains | | | Losses | | | Appreciation | | | Earnings | |
| Capital Appreciation Fund | | $ | 4,850 | | | $ | — | | | $ | (72,375 | ) | | $ | 3,253,628 | | | $ | 3,186,103 | |
| Opportunity Fund | | | — | | | | 231,357 | | | | (14,268 | ) | | | 5,428,799 | | | | 5,645,888 | |
As of December 31, 2010, the Funds did not have any capital loss carryovers. During the year ended December 31, 2010, the Opportunity Fund utilized $1,015,488 in capital loss carryforwards. As of December 31, 2010, Capital Appreciation Fund and Opportunity Fund had $54,917 and $217, respectively, of deferred, on a tax basis, post-October losses.
Notes to the Financial Statements – Continued
December 31, 2010
The tax character of distributions paid during the fiscal year ended December 31, 2010 were as follows:
| | | Ordinary | | | Long Term | | | | |
| | | Income | | | Capital Gains | | | Total | |
| Capital Appreciation Fund | | $ | 814,694 | | | $ | 448,120 | | | $ | 1,262,814 | |
| Opportunity Fund | | | 210,919 | | | | 225,060 | | | | 435,979 | |
The tax character of distributions paid during the fiscal year ended December 31, 2009 were as follows:
| | | Ordinary | | | Long Term | | | | |
| | | Income | | | Capital Gains | | | Total | |
| Capital Appreciation Fund | | $ | 498,151 | | | $ | — | | | $ | 498,151 | |
| Opportunity Fund | | | 142,261 | | | | — | | | | 142,261 | |
The Funds have entered into an Investment Advisory Agreement with the Adviser, with whom certain directors and officers of the Corporation are affiliated, to furnish investment advisory services to the Funds. Pursuant to this Agreement, the Adviser is entitled to receive a fee, calculated daily and payable monthly, at the annual rate of 1.10% as applied to each Fund’s daily net assets.
The Adviser has contractually agreed to waive, through September 30, 2012 its management fee and/or reimburse each Fund’s other expenses to the extent necessary to ensure that each Fund’s operating expenses do not exceed 1.50% of its average daily net assets. Any such waiver or reimbursement may be subject to later adjustment to allow the Adviser to recoup amounts waived or reimbursed to the extent actual fees and expenses for a fiscal year are less than the respective expense cap limitations, provided, however, that the Adviser shall only be entitled to recoup such amounts for a period of three years from the date such amount was waived or reimbursed. Waived/reimbursed fees and expenses subject to potential recovery by year of expiration are as follows:
| Expiration | | Capital Appreciation Fund | | | Opportunity Fund | |
| 12/31/11 | | $ | 316,194 | | | $ | 287,941 | |
| 12/31/12 | | | 209,174 | | | | 194,762 | |
| 12/31/13 | | | 177,007 | | | | 171,081 | |
| Total | | $ | 702,375 | | | $ | 653,784 | |
As of December 31, 2010, it was possible, but not probable, those amounts would be recovered by the Adviser. At the end of each fiscal year in the future, the Funds will continue to assess the potential recovery of waived/reimbursed fees and expenses for financial reporting purposes.
Quasar Distributors, LLC (“Quasar”), a subsidiary of U.S. Bancorp, serves as distributor of the Funds’ shares pursuant to a Distribution Agreement with the Corporation. Each Fund’s shares are sold on a no-load basis and, therefore, Quasar receives no sales commission or sales load for providing services to the Funds. The Corporation has adopted a plan pursuant to Rule 12b-1 under the 1940 Act (the “12b-1 Plan”), which authorizes the Corporation to reimburse Quasar and certain financial intermediaries who assist in distributing each Fund’s shares or who provide shareholder services to Fund shareholders a distribution and/or shareholder servicing fee of up to 0.25% of each Fund’s average
Notes to the Financial Statements – Continued
December 31, 2010
daily net assets (computed on an annual basis). All or a portion of the fee may be used by the Funds or Quasar to pay the Fund’s distribution fees and costs of printing reports and prospectuses for potential investors and the costs of other distribution and shareholder services expenses. During the year ended December 31, 2010, Capital Appreciation Fund and Opportunity Fund incurred expenses of $24,739 and $23,396, respectively, pursuant to the 12b-1 Plan.
U.S. Bancorp Fund Services, LLC serves as transfer agent, administrator and fund accountant for the Funds. U.S. Bank, N.A. serves as custodian for the Funds.
The Funds enter into contracts that contain a variety of indemnifications. The Funds’ maximum exposure under these arrangements is unknown. However, the Funds have not had prior claims or losses pursuant to these contracts and expect the risk of loss to be remote.
Management has evaluated fund related events and transactions that occurred subsequent to December 31, 2010, through the date of issuance of the Funds’ financial statements. There were no events or transactions that occurred during this period that materially impacted the amounts or disclosures in the Funds’ financial statements.
Report of Independent Registered Public Accounting Firm
The Board of Directors and Shareholders
Prospector Funds, Inc.:
We have audited the accompanying statements of assets and liabilities, including the schedule of investments, of Prospector Funds, Inc., comprised of, the Prospector Capital Appreciation Fund and the Prospector Opportunity Fund (the Funds) as of December 31, 2010, and the related statements of operations for the year then ended, the statements of changes in net assets for the two years in the period then ended, and financial highlights for each of the periods indicated therein. These financial statements and financial highlights are the responsibility of the Funds’ management. Our responsibility is to express an opinion on these financial statements and financial highlights based on our audits.
We conducted our audits in accordance with the standards of the Public Company Accounting Oversight Board (United States). Those standards require that we plan and perform the audit to obtain reasonable assurance about whether the financial statements and financial highlights are free of material misstatement. We were not engaged to perform an audit of the Funds’ internal control over financial reporting. Our audits included consideration of internal control over financial reporting as a basis for designing audit procedures that are appropriate in the circumstances, but not for the purpose of expressing an opinion on the effectiveness of the Funds’ internal control over financial reporting. Accordingly, we express no such opinion. An audit also includes examining, on a test basis, evidence supporting the amounts and disclosures in the financial statements and financial highlights, assessing the accounting principles used and significant estimates made by management, and evaluating the overall financial statement presentation. Our procedures included confirmation of securities owned as of December 31, 2010, by correspondence with the custodian and brokers or by other appropriate auditing procedures where replies from brokers were not received. We believe that our audits provide a reasonable basis for our opinion.
In our opinion, the financial statements and financial highlights referred to above present fairly, in all material respects, the financial position of the Funds at December 31, 2010, the results of their operations for the year then ended, the changes in their net assets for the two years in the period then ended, and the financial highlights for the periods indicated therein, in conformity with U.S. generally accepted accounting principles.
Minneapolis, Minnesota
February 25, 2011
Additional Information (Unaudited)
December 31, 2010
Board Approval of Investment Advisory Agreement
The Corporation’s independent directors (the “directors”) unanimously approved the continuance of the Investment Advisory Agreement (the “Advisory Agreement”) between the Funds and the Investment Manager at a Board of Director’s meeting held on September 2, 2010.
In preparation for the meeting, the directors had requested from the Investment Manager and evaluated a memorandum providing certain information requested by the Board pursuant to Section 15(c) of the 1940 Act, including (i) expense, compliance and other information as it relates to the Investment Manager; (ii) performance of other accounts managed by its affiliate Prospector Partners, LLC with similar investment objectives derived from data compiled by the Investment Manager and (iii) expense and other information for other registered investment companies with similar investment objectives derived from data compiled by the Investment Manager. Prior to voting, the directors reviewed the proposed approval of the Advisory Agreement with management and with counsel to the Corporation and reviewed a memorandum from such counsel discussing the legal standards for their consideration of the proposed approval. In reaching their determinations relating to approval of the continuance of the Advisory Agreement, the directors considered all factors they believed relevant including the following:
| 1. | the nature, extent and quality of investment, and other services to be rendered by the Investment Manager; |
| 2. | payments to be received by the Investment Manager from all sources in respect of the Funds; |
| 3. | comparative fee and expense data for the Funds and other investment companies with similar investment objectives; |
| 4. | the extent to which economies of scale may be realized as the Funds grow and whether fee levels reflect these economies of scale for the benefit of investors; |
| 5. | The Investment Manager’s policies and practices regarding allocation of portfolio transactions of the Funds, including the extent to which the Investment Manager may benefit from soft dollar arrangements; |
| 6. | fall-out benefits which the Investment Manager and its affiliates may receive from their relationships to the Funds; |
| 7. | information about fees charged by the Investment Manager to other clients with similar investment objectives; |
| 8. | the professional experience and qualifications of the Funds’ portfolio managers and other senior personnel of the Investment Manager; |
| 9. | profitability of the Investment manager; and |
| 10. | the terms of the Advisory Agreement. |
The directors also considered their overall confidence in the integrity and competence of the Investment Manager and the portfolio managers. In their deliberations, the directors did not identify any particular information that was all-important or controlling, and each director attributed different weights to the various factors. The directors determined that the overall arrangements between the Funds and the Investment Manager, as provided in the Advisory Agreement, were fair and reasonable in light of the services performed, expenses expected to be incurred and such other matters as the directors considered relevant in the exercise of their reasonable judgment.
The material factors and conclusions that formed the basis for the directors reaching their determinations to approve the continuance of the Advisory Agreement (including their determinations that the Investment Manager should be the investment adviser for the Funds, and that the fees payable to the Investment Manager pursuant to the Advisory Agreement are appropriate) were separately discussed by the directors.
Additional Information (Unaudited) – Continued
December 31, 2010
Nature, extent and quality of services provided by the Investment Manager
The directors noted that, under the Advisory Agreement, the Investment Manager, subject to the control of the directors, administers the Funds’ business and other affairs. The Investment Manager manages the investment of the assets of the Funds, including making purchases and sales or portfolio securities consistent with each Fund’s investment objective and policies.
The directors considered the scope and quality of services provided by the Investment Manager under the Advisory Agreement. The directors considered the quality of the investment research capabilities of the Investment Manager and the other resources it proposes to dedicate to performing services for the Funds. The directors also considered the portfolio managers’ experience, reputation and investment philosophy. The quality of administrative and other services also were considered. The directors concluded that, overall, they were satisfied with the nature, extent and quality of services proposed to be provided to the Funds under the Advisory Agreement.
Investment Manager Fees; Performance of the Fund
The directors considered the advisory fee rate paid by the Funds to the Investment Manager and information prepared by the Investment Manager concerning fee rates paid by other comparable funds. The directors recognized that it is difficult to make comparisons of advisory fees because there are variations in the services that are included in the fees paid by other funds, but determined that the proposed advisory fee rate was in line with other comparable funds.
The directors also considered the performance of each Fund compared to each Fund’s benchmarks and industry averages. The directors noted that from the period from inception through June 30, 2010, each Fund was in the top quartile for performance compared to its peer group. The directors concluded that the advisory fee rate, taking into account performance and the other factors mentioned, was in line with comparable funds.
Other Fund Expenses
The directors also considered the total expense ratio of the Funds in comparison to the fees and expenses of the funds included in the comparison. The directors noted that the expense ratios of some of the comparable funds also were lower because of waivers or reimbursements by those funds’ investment advisers, which in some cases were voluntary and perhaps temporary. In particular, the directors noted that the Investment Manager’s fee waiver pursuant to the Fee Waiver and Expenses Reimbursement Agreement was contractual in nature and customary for the industry. The directors concluded that the Funds’ expense ratio was satisfactory. Finally, the directors noted that there may be economies of scale as the Funds grows and concluded that it may be appropriate to consider those issues in the future.
Investment Manager Profitability
The directors noted that the Investment Manager also provides the Funds with such office space, administrative and other services (exclusive of, and in addition to, any such services provided by any others retained by the Funds) and executive and other personnel as are necessary for the Funds’ operations. The directors considered that the Investment Manager pays all of the compensation of the officers of the Company that are affiliated persons of the Investment Manager, pays a portion of the insurance costs and paid the cost of the organization of the Funds (without reimbursement).
Additional Information (Unaudited) – Continued
December 31, 2010
The directors also noted that the Investment Manager has contractually agreed to waive, through September 30, 2011, its management fee and/or reimburse each Fund’s other expenses to the extent necessary to ensure that each Fund’s operating expenses do not exceed 1.50% of its average daily net assets. Under the terms of the Waiver and Expense Reimbursement Agreement at the present asset levels of the Funds, the Investment Manager has received a portion of its management fee amounts. It was also noted that the Investment Manager does not receive “fall out” benefits commonly received by managers of mutual funds that provide transfer agency, distribution or printing services in-house. The directors considered the expenses of the Investment Manager and the services provided by the Investment Manager and determined that the Investment Manager was profitable based upon the expenses.
Additional Information (Unaudited) – Continued
December 31, 2010
AVAILABILITY OF FUND PORTFOLIO INFORMATION
The Funds file complete schedules of portfolio holdings with the SEC for the first and third quarters of each fiscal year on Form N-Q, which is available on the SEC’s website at www.sec.gov. The Funds’ Form N-Q may be reviewed and copied at the SEC’s Public Reference Room in Washington, D.C. For information on the Public Reference Room call 1-800-SEC-0330. In addition, the Funds’ Form N-Q is available without charge upon request by calling 1-877-PFI-STOCK or 1-877-734-7862.
AVAILABILITY OF PROXY VOTING INFORMATION
A description of the Funds’ Proxy Voting Policies and Procedures is available without charge, upon request, by calling 1-877-PFI-STOCK or 1-877-734-7862. Information regarding how the Funds voted proxies relating to portfolio securities during the most recent 12 month period ended June 30, is available (1) without charge, upon request, by calling 1-877-PFI-STOCK or 1-877-734-7862, or (2) on the SEC’s website at www.sec.gov.
QUALIFIED DIVIDEND INCOME/DIVIDENDS RECEIVED DEDUCTION
For the fiscal year ended December 31, 2010, certain dividends paid by the Funds may be subject to a maximum tax rate of 15%, as provided for by the Jobs and Growth Tax Relief Reconciliation Act of 2003. The percentage of dividends declared from ordinary income designated as qualified dividend income was 53.45% and 100.00% for the Capital Appreciation Fund and Opportunity Fund, respectively.
For corporate shareholders, the percent of ordinary income distributions qualifying for the corporate dividends received deduction for the fiscal year ended December 31, 2010 were 45.76% and 100.00% for the Capital Appreciation Fund and Opportunity Fund, respectively.
ADDITIONAL INFORMATION APPLICABLE TO FOREIGN SHAREHOLDERS ONLY
The percent of ordinary income distributions designated as interest related dividends for the fiscal year ended December 31, 2010 were 40.39% and 9.70% for the Capital Appreciation Fund and Opportunity Fund, respectively.
The percentage of taxable ordinary income distributions that are designated as short-term capital gain distributions under Internal Revenue Section 871(k)(2)(C) for the fiscal year ended December 31, 2010 were 45.49% and 0.00% for the Capital Appreciation Fund and Opportunity Fund, respectively (unaudited).
Additional Information (Unaudited) – Continued
December 31, 2010
DIRECTORS & OFFICERS
| | | Term of | | Number of | |
| | | Office | | Portfolios | |
| | | and | | | |
| Name, | | Length | Occupation | | |
| Year of Birth | | of Time | | | |
| and Address^ | | | | | |
| |
| Independent Board Members |
| |
Harvey D. Hirsch* | Director | Indefinite; | Senior Vice President, | 2 | None. |
| Year of Birth: 1941 | | Since | Marketing, Van Eck | | |
| | | September 7, | Associates Corporation, | | |
| | | 2007 | an investment adviser, | | |
| | | | since May 2007. | | |
| | | | Independent (self-employed) | | |
| | | | marketing consultant from | | |
| | | | 1996 to May 2007. | | |
| | | | | | |
Joseph Klein III* | Director | Indefinite; | Managing Director of Gauss | 2 | BioMarin |
| Year of Birth: 1961 | | Since | Capital Advisors, LLC, | | Pharmaceuticals, |
| | | September 7, | a financial consulting and | | Inc. |
| | | 2007 | investment advisory firm | | ISIS |
| | | | focused on biopharmaceuticals | | Pharmaceuticals, |
| | | | since he founded the company | | Inc. |
| | | | in March 1998. | | OSI |
| | | | Founding Venture Partner of | | Pharmaceuticals, |
| | | | Red Abbey Venture Partners, LP, | | Inc. |
| | | | a private health venture fund, | | Savient |
| | | | from September 2003 through | | Pharmaceuticals, |
| | | | December 2008. | | Inc. |
| | | | | | PDL |
| | | | | | Pharmaceuticals, |
| | | | | | Inc. |
| | | | | | |
Roy L. Nersesian* | Director | Indefinite; | Associate professor of the | 2 | None |
| Year of Birth: 1939 | | Since | School of Business, Monmouth | | |
| | | September 7, | University, since September 1985. | | |
| | | 2007 | Adjunct Professor of the Center | | |
| | | | for Energy and Marine | | |
| | | | Transportation, Columbia | | |
| | | | University, since September 2000. | | |
| | | | Consultant, Poten & Partners, | | |
| | | | provider of brokerage and | | |
| | | | consulting services to the energy | | |
| | | | and ocean transportation industries, | | |
| | | | since September 1992. | | |
Additional Information (Unaudited) – Continued
December 31, 2010
| | | Term of | | Number of | |
| | | Office | | Portfolios | Other |
| | | and | | | |
| Name, | | Length | | | |
| Year of Birth | | of Time | | | |
| and Address^ | | | | | |
John T. Rossello, Jr.* | Director | Indefinite; | Partner at | 2 | None |
| Year of Birth: 1951 | | Since | Pricewaterhouse Coopers LLP | | |
| | | September 7, | from October 1988 | | |
| | | 2007 | to June 2007 | | |
| | | | | | |
| Interested Board Members and Officers |
| |
John D. Gillespie†* | Director | Indefinite; | Managing member of | 2 | White |
| Year of Birth: 1959 | President | Since | Prospector Partners, LLC, an | | Mountains |
| | | September 7, | affiliate of the Investment | | Insurance |
| | | 2007 | Manager, and portfolio manager | | Group, Ltd. |
| | | | of the investment funds | | |
| | | | sponsored by Prospector | | |
| | | | Partners, LLC since 1997. | | |
| | | | | | |
| | | | Chairman and President of | | |
| | | | White Mountains Advisors, | | |
| | | | an investment adviser, | | |
| | | | from 2002 to 2005. | | |
| | | | | | |
| Richard P. Howard | Executive | Indefinite; | Portfolio Manager at | N/A | OneBeacon |
| Year of Birth: 1946 | Vice | Since | Prospector Partners, LLC | | Insurance |
| | President | September 7, | since August 2005. | | Group, Ltd. |
| | | 2007 | | | |
| | | | Managing Director of White | | |
| | | | Mountains Advisors, LLC from | | |
| | | | 2001 to August 2005. | | |
| | | | | | |
| | | | Senior Vice President of | | |
| | | | OneBeacon Insurance Group | | |
| | | | from 2001 to August 2005. | | |
| | | | | | |
| Kevin R. O’Brien | Executive | Indefinite; | Portfolio Manager at | N/A | None |
| Year of Birth: 1963 | Vice | Since | Prospector Partners, LLC | | |
| | President | September 7, | since April 2003. | | |
| | | 2007 | | | |
| | | | Managing Director of White | | |
| | | | Mountains Advisors, LLC from | | |
| | | | April 2003 to August 2005. | | |
Additional Information (Unaudited) – Continued
December 31, 2010
| | | Term of | | Number of | |
| | | Office | | Portfolios | |
| | | and | | | |
| Name, | | Length | | | |
| Year of Birth | | of Time | | | |
| and Address^ | | | | | |
| Peter N. Perugini, Jr. | Secretary | Indefinite; | Chief Financial Officer at | N/A | None |
| Year of Birth: 1970 | Treasurer | Secretary | Prospector Partners, LLC | | |
| | | since | since 2000. | | |
| | | September 7, | Controller of Prospector | | |
| | | 2007 | Partners, LLC from 1997-2000. | | |
| | | Indefinite; | | | |
| | | Treasurer | | | |
| | | since | | | |
| | | June 6, | | | |
| | | 2007 | | | |
| | | | | | |
| Kim Just | Chief | Indefinite; | Chief Compliance Officer at | N/A | None |
| Year of Birth: 1967 | Compliance | Since | Prospector Partners, LLC since | | |
| | Officer | September 7, | March 2006. | | |
| | | 2007 | Manager, Whittlesey & Hadley, | | |
| | | | P.C., an accounting services firm | | |
| | | | from September 1997 to | | |
| | | | March 2006. | | |
| | | | | | |
| Brian Wiedmeyer | Assistant | Indefinite; | Assistant Vice President for | N/A | None |
| Year of Birth: 1973 | Secretary | Since | US Bancorp Fund Services, LLC, | | |
| | | September 7, | a mutual fund service provider, | | |
| | | 2007 | since January 2005. | | |
| | | | | | |
| Douglas Schafer | Assistant | Indefinite; | Compliance Officer for | N/A | None |
| Year of Birth: 1970 | Secretary | Since | US Bancorp Fund Services, LLC, | | |
| | | September 7, | a mutual fund service provider, | | |
| | | 2007 | since April 2002. | | |
| | | | | | |
| ^ | The address for all directors and officers is 370 Church Street, Guilford, Connecticut 06437. |
| * | Each of the Company’s directors was elected by written consent of the sole shareholder of the Funds on September 7, 2007. |
| † | John D. Gillespie is an interested director of the Fund because he is also the managing member of the Investment Manager. |
(This Page Intentionally Left Blank.)
DIRECTORS
John D. Gillespie
Harvey D. Hirsch
Joseph Klein III
Roy L. Nersesian
John T. Rossello, Jr.
INVESTMENT ADVISER
Prospector Partners Asset Management, LLC
370 Church Street
Guilford, CT 06437
DISTRIBUTOR
Quasar Distributors, LLC
615 East Michigan Street
Milwaukee, WI 53202
CUSTODIAN
U.S. Bank, N.A.
1555 North River Center Drive
Milwaukee, WI 53212
ADMINISTRATOR AND TRANSFER AGENT
U.S. Bancorp Fund Services, LLC
Third Floor
615 E. Michigan Street
Milwaukee, WI 53202
INDEPENDENT REGISTERED PUBLIC ACCOUNTING FIRM
Ernst & Young LLP
220 South Sixth Street, Suite 1400
Minneapolis, MN 55402
LEGAL COUNSEL
Seward & Kissel LLP
One Battery Plaza
New York, NY 10004
This report should be accompanied or preceded by a prospectus.
The Funds’ Statement of Additional Information contains additional information about the
Funds’ directors and is available without charge upon request by calling 1-877-PFI-STOCK.
Item 2. Code of Ethics.
The registrant has adopted a code of ethics that applies to the registrant’s principal executive officer and principal financial officer. The registrant has not made any substantive amendments to its code of ethics during the period covered by this period.
The registrant has not granted any waivers from any provisions of the code of ethics during the period covered by this report.
A copy of the registrant’s code of ethics that applies to the registrant’s principal executive officer and principal financial officer is filed herewith.
Item 3. Audit Committee Financial Expert.
The registrant’s board of directors has determined that there is at least one audit committee financial expert serving on its audit committee. John Rossello, Jr. is the “audit committee financial expert” and is considered to be “independent” as each term is defined in Item 3 of Form N-CSR.
Item 4. Principal Accountant Fees and Services.
The registrant has engaged its principal accountant to perform audit services, audit-related services, tax services and other services during the past two fiscal periods. “Audit services” refer to performing an audit of the registrant's annual financial statements or services that are normally provided by the accountant in connection with statutory and regulatory filings or engagements for the past fiscal year. “Audit-related services” refer to the assurance and related services by the principal accountant that are reasonably related to the performance of the audit. “Tax services” refer to professional services rendered by the principal accountant for tax compliance, tax advice, and tax planning. The following table details the aggregate fees billed or expected to be billed for each of the last two fiscal periods for audit fees, audit-related fees, tax fees and other fees by the principal accountant.
| | FYE 12/31/2010 | FYE 12/31/2009 |
| Audit Fees | $47,900 | $47,900 |
| Audit-Related Fees | $0 | $0 |
| Tax Fees | $5,900 | $5,900 |
| All Other Fees | $0 | $0 |
The audit committee has adopted pre-approval policies and procedures that require the audit committee to pre-approve all audit and non-audit services that exceed $5,000 for the registrant. All of the principal accountant’s hours spent on auditing the registrant’s financial statements were attributed to work performed by full-time permanent employees of the principal accountant.
The audit committee noted that as indicated in the table below, for the registrant’s prior two fiscal periods, no fees were billed by the registrant’s independent public accountants in connection with non-audit services rendered to the registrant’s investment adviser, and any entity controlling, controlled by, or under common control with the investment adviser that provides ongoing services to the registrant.
| Non-Audit Related Fees | FYE 12/31/2010 | FYE 12/31/2009 |
| Registrant | $0 | $0 |
| Registrant’s Investment Adviser | $0 | $0 |
Item 5. Audit Committee of Listed Registrants.
Not applicable to open-end investment companies.
Item 6. Schedule of Investments.
Schedule of Investments is included as part of the report to shareholders filed under Item 1 of this Form.
Item 7. Disclosure of Proxy Voting Policies and Procedures for Closed-End Management Investment Companies.
Not applicable to open-end investment companies.
Item 8. Portfolio Managers of Closed-End Management Investment Companies.
Not applicable to open-end investment companies.
Item 9. Purchases of Equity Securities by Closed-End Management Investment Company and Affiliated Purchases.
Not applicable to open-end investment companies.
Item 10. Submission of Matters to a Vote of Security Holders.
Not Applicable.
Item 11. Controls and Procedures.
| (a) | The Registrant’s President and Treasurer have reviewed the Registrant's disclosure controls and procedures (as defined in Rule 30a-3(c) under the Investment Company Act of 1940 (the “Act”)) as of a date within 90 days of the filing of this report, as required by Rule 30a-3(b) under the Act and Rules 13a-15(b) or 15d-15(b) under the Securities Exchange Act of 1934. Based on their review, such officers have concluded that the disclosure controls and procedures are effective in ensuring that information required to be disclosed in this report is appropriately recorded, processed, summarized and reported and made known to them by others within the Registrant and by the Registrant’s service provider. |
| (b) | There were no significant changes in the Registrant's internal control over financial reporting (as defined in Rule 30a-3(d) under the Act) that occurred during the second fiscal quarter of the period covered by this report that has materially affected, or is reasonably likely to materially affect, the Registrant's internal control over financial reporting. |
Item 12. Exhibits.
| (a) | (1) Any code of ethics or amendment thereto, that is subject of the disclosure required by Item 2, to the extent that the registrant intends to satisfy Item 2 requirements through filing an exhibit. Filed herewith |
(2) Certifications pursuant to Section 302 of the Sarbanes-Oxley Act of 2002. Filed herewith.
(3) Any written solicitation to purchase securities under Rule 23c-1 under the Act sent or given during the period covered by the report by or on behalf of the registrant to 10 or more persons. Not applicable to open-end investment companies.
| (b) | Certification pursuant to Section 906 of the Sarbanes-Oxley Act of 2002. Furnished herewith. |
SIGNATURES
Pursuant to the requirements of the Securities Exchange Act of 1934 and the Investment Company Act of 1940, the registrant has duly caused this report to be signed on its behalf by the undersigned, thereunto duly authorized.
(Registrant) Prospector Funds, Inc.
By (Signature and Title) */s/John D. Gillespie
John D. Gillespie, President
Date March 5, 2011
Pursuant to the requirements of the Securities Exchange Act of 1934 and the Investment Company Act of 1940, this report has been signed below by the following persons on behalf of the registrant and in the capacities and on the dates indicated.
By (Signature and Title) */s/John D. Gillespie
John D. Gillespie, President
Date March 5, 2011
By (Signature and Title) */s/Peter N. Perugini, Jr.
Peter N. Perugini, Jr., Treasurer
Date March 5, 2011
* Print the name and title of each signing officer under his or her signature.