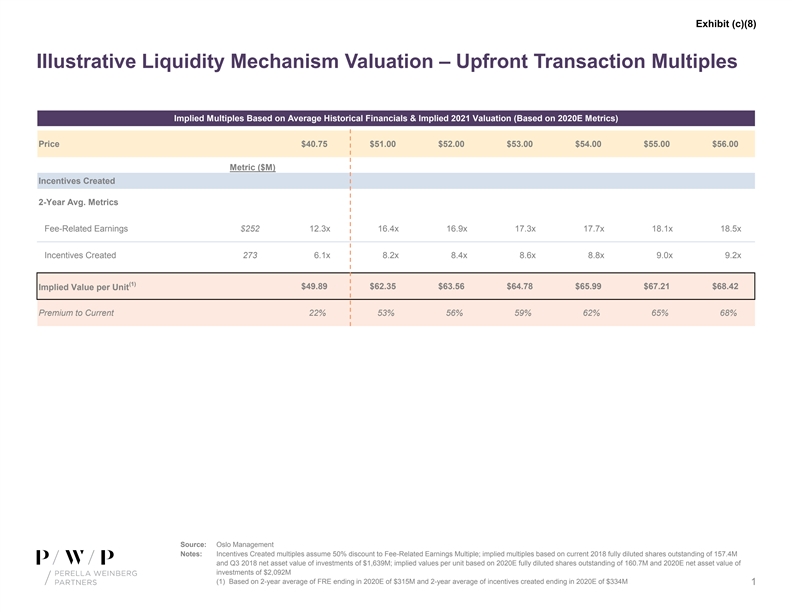
Exhibit (c)(8) Illustrative Liquidity Mechanism Valuation – Upfront Transaction Multiples Implied Multiples Based on Average Historical Financials & Implied 2021 Valuation (Based on 2020E Metrics) Price $40.75 $51.00 $52.00 $53.00 $54.00 $55.00 $56.00 Metric ($M) Incentives Created 2-Year Avg. Metrics Fee-Related Earnings $252 12.3x 16.4x 16.9x 17.3x 17.7x 18.1x 18.5x Incentives Created 273 6.1x 8.2x 8.4x 8.6x 8.8x 9.0x 9.2x (1) $49.89 $62.35 $63.56 $64.78 $65.99 $67.21 $68.42 Implied Value per Unit Premium to Current 22% 53% 56% 59% 62% 65% 68% Source: Oslo Management Notes: Incentives Created multiples assume 50% discount to Fee-Related Earnings Multiple; implied multiples based on current 2018 fully diluted shares outstanding of 157.4M and Q3 2018 net asset value of investments of $1,639M; implied values per unit based on 2020E fully diluted shares outstanding of 160.7M and 2020E net asset value of investments of $2,092M (1) Based on 2-year average of FRE ending in 2020E of $315M and 2-year average of incentives created ending in 2020E of $334M 1Exhibit (c)(8) Illustrative Liquidity Mechanism Valuation – Upfront Transaction Multiples Implied Multiples Based on Average Historical Financials & Implied 2021 Valuation (Based on 2020E Metrics) Price $40.75 $51.00 $52.00 $53.00 $54.00 $55.00 $56.00 Metric ($M) Incentives Created 2-Year Avg. Metrics Fee-Related Earnings $252 12.3x 16.4x 16.9x 17.3x 17.7x 18.1x 18.5x Incentives Created 273 6.1x 8.2x 8.4x 8.6x 8.8x 9.0x 9.2x (1) $49.89 $62.35 $63.56 $64.78 $65.99 $67.21 $68.42 Implied Value per Unit Premium to Current 22% 53% 56% 59% 62% 65% 68% Source: Oslo Management Notes: Incentives Created multiples assume 50% discount to Fee-Related Earnings Multiple; implied multiples based on current 2018 fully diluted shares outstanding of 157.4M and Q3 2018 net asset value of investments of $1,639M; implied values per unit based on 2020E fully diluted shares outstanding of 160.7M and 2020E net asset value of investments of $2,092M (1) Based on 2-year average of FRE ending in 2020E of $315M and 2-year average of incentives created ending in 2020E of $334M 1

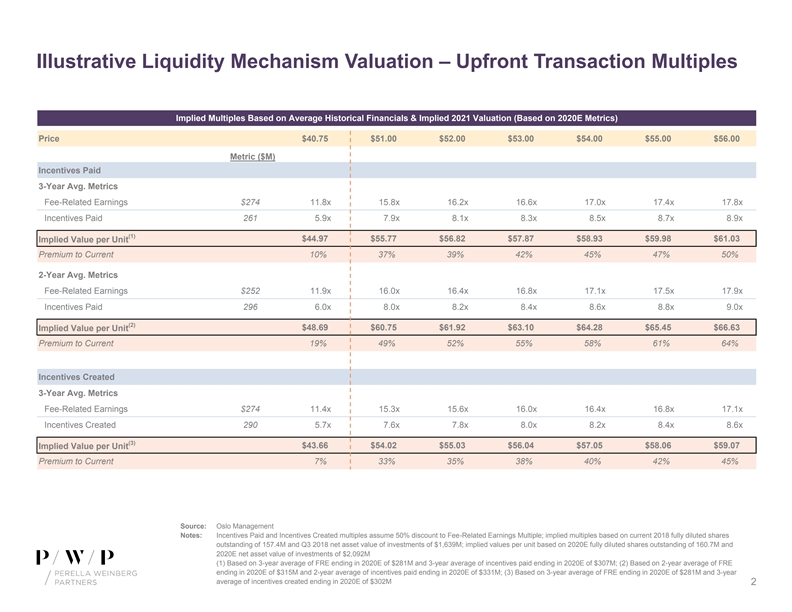
Illustrative Liquidity Mechanism Valuation – Upfront Transaction Multiples Implied Multiples Based on Average Historical Financials & Implied 2021 Valuation (Based on 2020E Metrics) Price $40.75 $51.00 $52.00 $53.00 $54.00 $55.00 $56.00 Metric ($M) Incentives Paid 3-Year Avg. Metrics Fee-Related Earnings $274 11.8x 15.8x 16.2x 16.6x 17.0x 17.4x 17.8x Incentives Paid 261 5.9x 7.9x 8.1x 8.3x 8.5x 8.7x 8.9x (1) Implied Value per Unit $44.97 $55.77 $56.82 $57.87 $58.93 $59.98 $61.03 Premium to Current 10% 37% 39% 42% 45% 47% 50% 2-Year Avg. Metrics Fee-Related Earnings $252 11.9x 16.0x 16.4x 16.8x 17.1x 17.5x 17.9x Incentives Paid 296 6.0x 8.0x 8.2x 8.4x 8.6x 8.8x 9.0x (2) $48.69 $60.75 $61.92 $63.10 $64.28 $65.45 $66.63 Implied Value per Unit Premium to Current 19% 49% 52% 55% 58% 61% 64% Incentives Created 3-Year Avg. Metrics Fee-Related Earnings $274 11.4x 15.3x 15.6x 16.0x 16.4x 16.8x 17.1x Incentives Created 290 5.7x 7.6x 7.8x 8.0x 8.2x 8.4x 8.6x (3) $43.66 $54.02 $55.03 $56.04 $57.05 $58.06 $59.07 Implied Value per Unit Premium to Current 7% 33% 35% 38% 40% 42% 45% Source: Oslo Management Notes: Incentives Paid and Incentives Created multiples assume 50% discount to Fee-Related Earnings Multiple; implied multiples based on current 2018 fully diluted shares outstanding of 157.4M and Q3 2018 net asset value of investments of $1,639M; implied values per unit based on 2020E fully diluted shares outstanding of 160.7M and 2020E net asset value of investments of $2,092M (1) Based on 3-year average of FRE ending in 2020E of $281M and 3-year average of incentives paid ending in 2020E of $307M; (2) Based on 2-year average of FRE ending in 2020E of $315M and 2-year average of incentives paid ending in 2020E of $331M; (3) Based on 3-year average of FRE ending in 2020E of $281M and 3-year average of incentives created ending in 2020E of $302M 2Illustrative Liquidity Mechanism Valuation – Upfront Transaction Multiples Implied Multiples Based on Average Historical Financials & Implied 2021 Valuation (Based on 2020E Metrics) Price $40.75 $51.00 $52.00 $53.00 $54.00 $55.00 $56.00 Metric ($M) Incentives Paid 3-Year Avg. Metrics Fee-Related Earnings $274 11.8x 15.8x 16.2x 16.6x 17.0x 17.4x 17.8x Incentives Paid 261 5.9x 7.9x 8.1x 8.3x 8.5x 8.7x 8.9x (1) Implied Value per Unit $44.97 $55.77 $56.82 $57.87 $58.93 $59.98 $61.03 Premium to Current 10% 37% 39% 42% 45% 47% 50% 2-Year Avg. Metrics Fee-Related Earnings $252 11.9x 16.0x 16.4x 16.8x 17.1x 17.5x 17.9x Incentives Paid 296 6.0x 8.0x 8.2x 8.4x 8.6x 8.8x 9.0x (2) $48.69 $60.75 $61.92 $63.10 $64.28 $65.45 $66.63 Implied Value per Unit Premium to Current 19% 49% 52% 55% 58% 61% 64% Incentives Created 3-Year Avg. Metrics Fee-Related Earnings $274 11.4x 15.3x 15.6x 16.0x 16.4x 16.8x 17.1x Incentives Created 290 5.7x 7.6x 7.8x 8.0x 8.2x 8.4x 8.6x (3) $43.66 $54.02 $55.03 $56.04 $57.05 $58.06 $59.07 Implied Value per Unit Premium to Current 7% 33% 35% 38% 40% 42% 45% Source: Oslo Management Notes: Incentives Paid and Incentives Created multiples assume 50% discount to Fee-Related Earnings Multiple; implied multiples based on current 2018 fully diluted shares outstanding of 157.4M and Q3 2018 net asset value of investments of $1,639M; implied values per unit based on 2020E fully diluted shares outstanding of 160.7M and 2020E net asset value of investments of $2,092M (1) Based on 3-year average of FRE ending in 2020E of $281M and 3-year average of incentives paid ending in 2020E of $307M; (2) Based on 2-year average of FRE ending in 2020E of $315M and 2-year average of incentives paid ending in 2020E of $331M; (3) Based on 3-year average of FRE ending in 2020E of $281M and 3-year average of incentives created ending in 2020E of $302M 2

