UNITED STATES
SECURITIES AND EXCHANGE COMMISSION
Washington, D.C. 20549
FORM N-CSR
CERTIFIED SHAREHOLDER REPORT OF REGISTERED MANAGEMENT
INVESTMENT COMPANIES
Investment Company Act file number 811-22110
AdvisorShares Trust
(Exact name of registrant as specified in charter)
4800 Montgomery Lane, Suite 150
Bethesda, Maryland 20814
(Address of principal executive offices) (Zip code)
Dan Ahrens
4800 Montgomery Lane, Suite 150
Bethesda, Maryland 20814
(Name and address of agent for service)
Registrant's telephone number, including area code: 1-877-843-3831
Date of fiscal year end: June 30
Date of reporting period: June 30, 2020
Form N-CSR is to be used by management investment companies to file reports with the Commission not later than 10 days after the transmission to stockholders of any report that is required to be transmitted to stockholders under Rule 30e-1 under the Investment Company Act of 1940 (17 CFR 270.30e-1). The Commission may use the information provided on Form N-CSR in its regulatory, disclosure review, inspection, and policymaking roles.
A registrant is required to disclose the information specified by Form N-CSR, and the Commission will make this information public. A registrant is not required to respond to the collection of information contained in Form N-CSR unless the Form displays a currently valid Office of Management and Budget ("OMB") control number. Please direct comments concerning the accuracy of the information collection burden estimate and any suggestions for reducing the burden to Secretary, Securities and Exchange Commission, 450 Fifth Street, NW, Washington, DC 20549-0609. The OMB has reviewed this collection of information under the clearance requirements of 44 U.S.C. § 3507.
Item 1. Reports to Stockholders.
The Report to Shareholders is attached herewith.
![]()
- - - - - - - - - - - - - - - - - - - - - - - - - - - - - - - - - - - - - - - - - - - - - - - - - - - - - - - - - - - - - - - -
ADVISORSHARES TRUST
4800 Montgomery Lane
Suite 150
Bethesda, Maryland 20814
www.advisorshares.com
1.877.843.3831
Annual Report
June 30, 2020
Beginning on January 1, 2021, as permitted by regulations adopted by the U.S. Securities and Exchange Commission, paper copies of the Fund’s shareholder reports will no longer be sent by mail, unless you specifically request paper copies of the reports from your financial intermediary, such as a broker-dealer or bank. Instead, the reports will be made available on a website, and you will be notified by mail each time a report is posted and provided with a website link to access the report. If you already elected to receive shareholder reports electronically, you will not be affected by this change and you need not take any action. Please contact your financial intermediary to elect to receive shareholder reports and other communications electronically. You may elect to receive all future reports in paper free of charge. Please contact your financial intermediary to continue receiving paper copies of your shareholder reports and for information about whether your election to receive reports in paper will apply to all funds held with your financial intermediary.
TABLE OF CONTENTS
1 | ||
Hypothetical Growth of a $10,000 Investment, Historical Performances | 3 | |
34 | ||
Schedules of Investments | ||
36 | ||
39 | ||
42 | ||
44 | ||
46 | ||
51 | ||
55 | ||
58 | ||
60 | ||
62 | ||
74 | ||
77 | ||
80 | ||
85 | ||
87 | ||
90 | ||
94 | ||
98 | ||
106 | ||
117 | ||
141 | ||
143 | ||
Board Review of Investment Advisory and Sub-Advisory Agreements | 144 | |
146 | ||
147 |
Letter from the CEO of AdvisorShares Investments, LLC
June 30, 2020 |
As we turned into a new decade, 2020 stampeded in with its record long bull market surrounded by historically low unemployment and a sound economy. The second half of the fiscal year then witnessed an abrupt shock as the global COVID-19 pandemic brought quickly a devastating public health emergency, record unemployment, a halted economy, and an end to the bull market run. The markets’ immediate freefall carried a stronger gravitational force than witnessed almost a dozen years earlier during the Great Financial Crisis, and like that historic event, the U.S. Federal Reserve stepped in to provide whatever means necessary to restore confidence and infuse liquidity into capital markets.
While the seriousness, challenges and significant effects of the pandemic persist, there are reasons for hope and optimism with improved treatments and the prospects and wonders of modern medicine to be able to deliver a deployable vaccine by the second half of this new fiscal year which we are now embarking. The economy begins to reopen and seeks a long road to recovery. The bear market that pounced on that long-running bull appears to have been a short-lived one, although given the broader markets and macroeconomic implications, volatility remains a real concern and the importance of preparedness and maintaining risk-awareness remains paramount. In terms of our actively managed ETF offerings, diversification among our investment strategies and portfolio managers persevered during an unprecedented period.
During market downturns and a bear market environment, two of our strategies in particular can stand out: the AdvisorShares Dorsey Wright Short ETF (Ticker: DWSH) and the AdvisorShares Ranger Equity Bear ETF (Ticker: HDGE). Both ETFs are dedicated short-equity strategies driven by deeply skilled and established sub-advisors, with Nasdaq Dorsey Wright providing their renowned technical prowess of relative strength/weakness investing, and Ranger Alternative delivering a fundamental approach rooted in a forensic accounting based expertise. Both DWSH and HDGE can be well-served components to a long-short equity strategy and these ETFs stood out through performance, asset growth and inflows during the severe market stress and thereafter.
The market downturn which began in March presented its challenges for long equity funds although also provided an opportunity for active managers to showcase their value add on both a risk-adjusted and relative basis respective to their fund benchmarks after navigating through the initial market duress. The AdvisorShares DoubleLine Value Equity ETF (Ticker: DBLV), which is sub-advised by DoubleLine Equity LP, as well as other strategies managed by Nasdaq Dorsey Wright including the AdvisorShares Dorsey Wright ADR ETF (Ticker: AADR), the AdvisorShares Dorsey Wright FSM All Cap World ETF (Ticker: DWAW) and the AdvisorShares Dorsey Wright FSM US Core ETF (Ticker: DWUS) excelled as the fiscal year concluded. We also closed one fund, the AdvisorShares Cornerstone Small Cap ETF (Ticker: SCAP), while no other ETFs were launched during the third and fourth quarters.
Thematic ETFs continue their emergence in the overall marketplace, providing niche, concentrated exposure to select market segments. We have two notable offerings, the AdvisorShares Pure Cannabis ETF (Ticker: YOLO) and the AdvisorShares Vice ETF (Ticker: ACT) that further demonstrated their emergence as the fiscal year closed. YOLO, which became the first actively managed ETF with a dedicated cannabis investment mandate when it launched in April 2019, showcased its differentiation from cannabis index-tracking funds with its active stock selection and allocation weightings. ACT, which provides cannabis-related investment exposure, also invests in equities related to alcohol and tobacco to deliver a more diversified approach with its Vice investment strategy. Both ETF portfolios are managed by AdvisorShares chief operating officer Dan Ahrens, who is well-known for his expertise and accomplished history as a portfolio manager in those respective spaces. As we begin a new fiscal year, we look forward to introducing new additions to our active ETF suite, including the AdvisorShares Pure US Cannabis ETF (Ticker: MSOS) which will seek to provide further investment exposure to multi-state operators (MSOs) which are U.S. based companies directly involved in the legal production and distribution of cannabis in states where approved.
1
ADVISORSHARES TRUST
Letter from the CEO of AdvisorShares Investments, LLC (Continued)
June 30, 2020 |
For more information on AdvisorShares ETFs, including performance and holdings, please visit www.advisorshares.com.
We understand and recognize the unprecedented territories that we face together as a society and as partners in financial stewardship. AdvisorShares has realized increased growth as a firm during 2020, which we cannot accomplish without the continuing trust and support of you. Our transparency and commitment to you will never waver and as we begin a new fiscal year and turn into the second half of a historic calendar year. We wish you nothing but health, happiness, and prosperity as we move forward.
Sincerest regards,
Noah Hamman
CEO, AdvisorShares Investments
An investment in the Funds is subject to risk, including the possible loss of principal amount invested. ADRs are subject to the risk of change in political or economic conditions and exchange rates in foreign countries. Certain funds may participate in leveraged transactions to include selling securities short which creates the risk of magnified capital losses. Under certain market conditions, short sales can increase the volatility and decrease the liquidity of certain securities or positions, and may lower the Fund’s return or result in a loss. There is no guarantee that the individual Funds’ will achieve the stated investment objectives. The risks associated with each Fund include the risks associated with the underlying ETFs, which can result in higher volatility, and are detailed in each Fund’s prospectus and on each Fund’s webpage.
Cannabis-Related Company Risk. Cannabis-related companies are subject to various laws and regulations that may differ at the state/local and federal level. These laws and regulations may (i) significantly affect a cannabis-related company’s ability to secure financing, (ii) impact the market for marijuana industry sales and services, and (iii) set limitations on marijuana use, production, transportation, and storage. Cannabis-related companies may also be required to secure permits and authorizations from government agencies to cultivate or research marijuana. In addition, cannabis-related companies are subject to the risks associated with the greater agricultural industry, including changes to or trends that affect commodity prices, labor costs, weather conditions, and laws and regulations related to environmental protection, health and safety. Cannabis-related companies may also be subject to risks associated with the biotechnology and pharmaceutical industries. These risks include increased government regulation, the use and enforcement of intellectual property rights and patents, technological change and obsolescence, product liability lawsuits, and the risk that research and development may not necessarily lead to commercially successful products.
The views in this report were those of the Fund’s CEO as of June 30, 2020 and may not reflect his views on the date that this report is first published or anytime thereafter. These views are intended to assist shareholders in understanding their investments and do not constitute investment advice.
2
AdvisorShares Dorsey Wright ADR ETF (AADR)
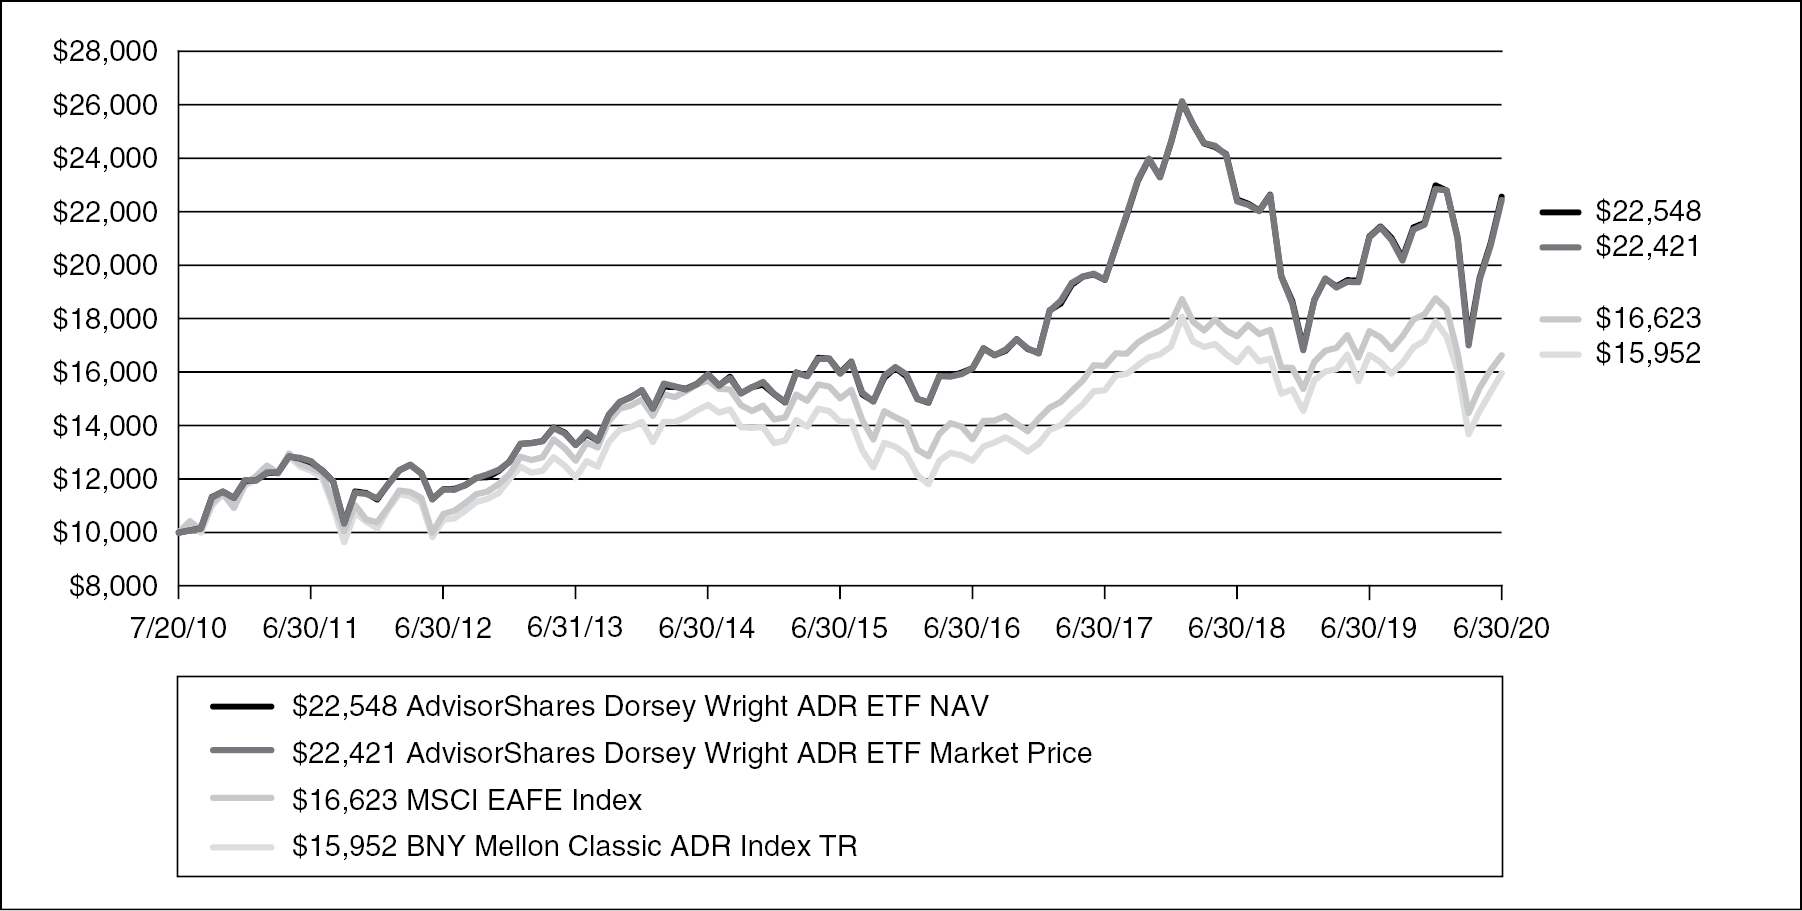
The AdvisorShares Dorsey Wright ADR ETF (AADR) finished the year ended June 30, 2020 ahead of its benchmarks, the MSCI EAFE Index and the BNY Mellon Classic ADR Index. While international equities underperformed domestic equities during the past year, AADR was still able to deliver solid performance.
The past fiscal year’s results were affected quite a bit by COVID-19. During the initial sell-off, the fund struggled to keep pace with the market and underperformed. However, the fund regained nicely during the recovery and outperformed during that time period. It is impossible for us to predict how COVID-19 will affect markets in the coming months. Our strategy is designed to unemotionally follow trends, which we think will be a benefit in the coming months that we expected to be filled with uncertainty. The fund has seen higher turnover levels than normal because of the volatility. If volatility continues at current levels, we expect the fund to continue to experience above average turnover as our process adapts to strength.
Despite the underperformance of cap-weighted international indexes versus domestic indexes, we are still finding plenty of opportunities in high momentum names. High momentum stocks in both developed and emerging markets outperformed low momentum stocks over the last fiscal year. There was large laggard rally off of the bear market bottom, but the fund’s holdings performed well throughout that period, which is not always the case. The fund is well positioned, and a shift back to international outperformance would provide a welcome tailwind. Until then, high momentum continues to perform well.
HYPOTHETICAL GROWTH OF $10,000 INVESTMENT
For the period July 20, 2010* to June 30, 2020
3
HISTORICAL PERFORMANCE
Total Return as of June 30, 2020
1 Year | 3 Year | 5 Year | Since | |||||
AdvisorShares Dorsey Wright ADR ETF NAV | 7.06% | 5.07% | 7.14% | 8.52% | ||||
AdvisorShares Dorsey Wright ADR ETF Market Price** | 6.62% | 4.85% | 7.07% | 8.46% | ||||
MSCI EAFE Index (Net) | -5.13% | 0.81% | 2.05% | 5.24% | ||||
BNY Mellon Classic ADR Index TR | -4.14% | 1.36% | 2.44% | 4.81% |
Performance data quoted represents past performance and is no guarantee of future results. Current performance may be lower or higher than the performance data quoted. Investment return and principal value will fluctuate so that an investor’s shares, when redeemed, may be worth more or less than original cost. Fund NAV returns are calculated using the Fund’s daily 4:00 p.m. NAV. Returns shown include the reinvestment of all dividends and other distributions. Index returns do not include expenses. As stated in the current prospectus, the Fund’s annual operating expense ratio (gross) is 0.96% and the net expense ratio is 0.88%. (Actual expenses can be referenced in the Financial Highlights section later in this report.) The Fund’s advisor has agreed to waive a portion of its fees and/or reimburse expenses to the extent necessary to keep the Fund’s expenses from exceeding 0.88%. Returns less than one year are not annualized. The performance table and graph do not reflect the deduction of taxes that a shareholder would pay on Fund distributions or the redemption of Fund shares. For the Fund’s most recent month end performance, please call 1-877-843-3831.
____________
* Commencement of operations.
** The price used to calculate market return (“Market Price’’) is determined by using the closing price listed on the NYSE Arca and does not represent returns an investor would receive if shares were traded at other times. Total returns are calculated using the daily 4:00pm midpoint between the bid and offer. Shares are bought and sold at market price, not NAV and are not individually redeemed from the Fund.
The MSCI EAFE Index is an unmanaged free float-adjusted market capitalization index that is designed to measure the equity market performance of developed markets, excluding the U.S. & Canada. One cannot invest directly in an index.
The BNY Mellon Classic ADR Index combines the over the counter (OTC) traded ADRs with exchange-listed ADRs bringing transparency to the available universe of American Depositary Receipts, including those issued by many of the world’s premier companies. One cannot invest directly in an index.
4
ADVISORSHARES TRUST
AdvisorShares Dorsey Wright Alpha Equal Weight ETF (DWEQ)
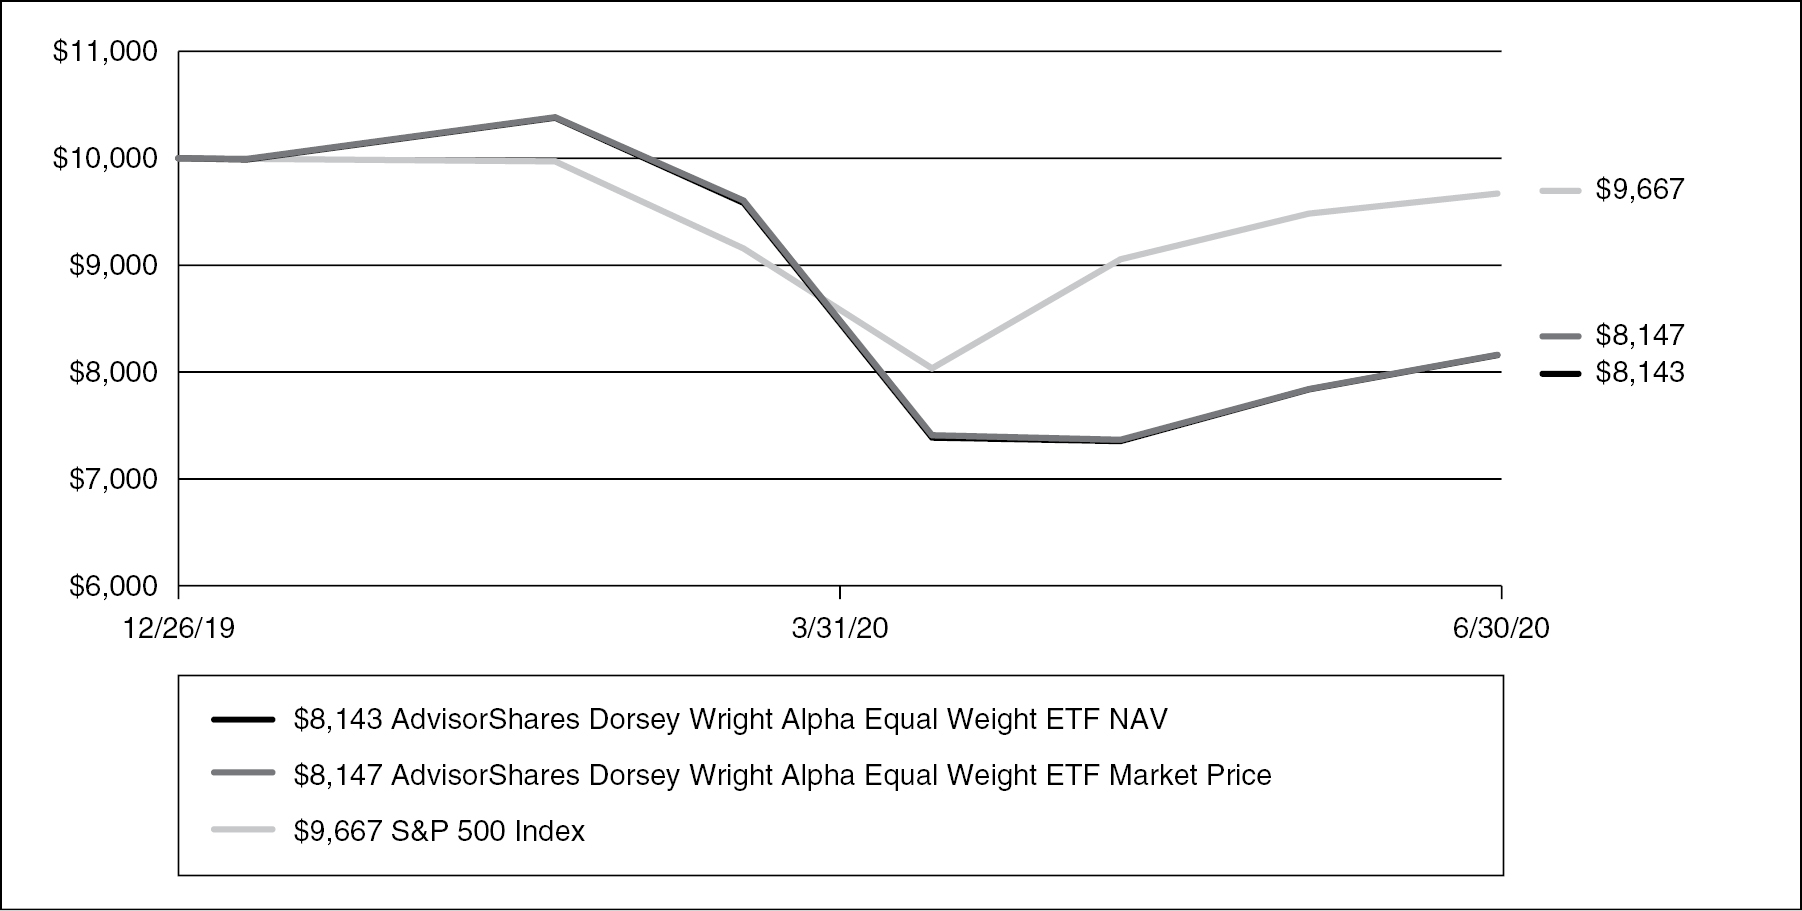
The AdvisorShares Dorsey Wright Alpha Equal Weight ETF (DWEQ) finished the year ended June 30,2020 behind its benchmark, the S&P 500 Index. The fund was launched at the end of 2019, year so there is only a partial year of performance. Our performance was primarily impacted by the cash position raised in the first quarter as well as the laggard rally that took place in the second quarter.
The past fiscal year’s results were affected quite a bit by COVID-19. We raised maximum cash in the portfolio during the first quarter as the market had a sharp sell-off. That cash position helped the fund perform well as the market was declining. But that cash position caused the fund to underperform when the market recovered sharply in the second quarter. We employ a trend following model to raise and lower the cash position in the fund so we will always lag behind major turning points. We finished the quarter fully invested, which helped the fund perform better near the end of the fiscal year. Results were also impacted by the laggard rally off the market bottom. In this situation, the laggard stocks outperform the leaders. It is not uncommon for this to happen during a bear market recovery. As we neared the end of the fiscal year, the strength of the laggard rally had subsided, and the fund began to perform much better relative to its benchmark.
If the market continues to recover the fund is well positioned to capitalize on rising equity prices. The laggard rally is losing steam, and leading stocks are once again beginning to reassert themselves. There is a tremendous amount of uncertainty though, so we may need to make big shifts in the coming months. The cash position in the fund provides an insurance policy against declining equity prices, and if the market begins to weaken we may have to add more cash back in to the fund.
HYPOTHETICAL GROWTH OF $10,000 INVESTMENT
For the period December 26, 2019* to June 30, 2020
5
HISTORICAL PERFORMANCE
Total Return as of June 30, 2020
Since | ||
AdvisorShares Dorsey Wright Alpha Equal Weight ETF NAV | -18.57% | |
AdvisorShares Dorsey Wright Alpha Equal Weight ETF Market Price** | -18.53% | |
S&P 500 Index | -3.33% |
Performance data quoted represents past performance and is no guarantee of future results. Current performance may be lower or higher than the performance data quoted. Investment return and principal value will fluctuate so that an investor’s shares, when redeemed, may be worth more or less than original cost. Fund NAV returns are calculated using the Fund’s daily 4:00 p.m. NAV. Returns shown include the reinvestment of all dividends and other distributions. Index returns do not include expenses. As stated in the current prospectus, the Fund’s annual operating expense ratio (gross) is 3.06% and the net expense ratio is 0.90%. (Actual expenses can be referenced in the Financial Highlights section later in this report.) The Fund’s advisor has agreed to waive a portion of its fees and/or reimburse expenses to the extent necessary to keep the Fund’s expenses from exceeding 0.90%. Returns less than one year are not annualized. The performance table and graph do not reflect the deduction of taxes that a shareholder would pay on Fund distributions or the redemption of Fund shares. For the Fund’s most recent month end performance, please call 1-877-843-3831.
____________
* Commencement of operations.
** The price used to calculate market return (“Market Price’’) is determined by using the closing price listed on the NYSE Arca and does not represent returns an investor would receive if shares were traded at other times. Total returns are calculated using the daily 4:00pm midpoint between the bid and offer. Shares are bought and sold at market price, not NAV and are not individually redeemed from the Fund.
The S&P 500 Index is a broad-based, unmanaged measurement of changes in stock market conditions based on the average of 500 widely held common stocks. One cannot invest directly in an index.
6
ADVISORSHARES TRUST
AdvisorShares Dorsey Wright FSM All Cap World ETF (DWAW)
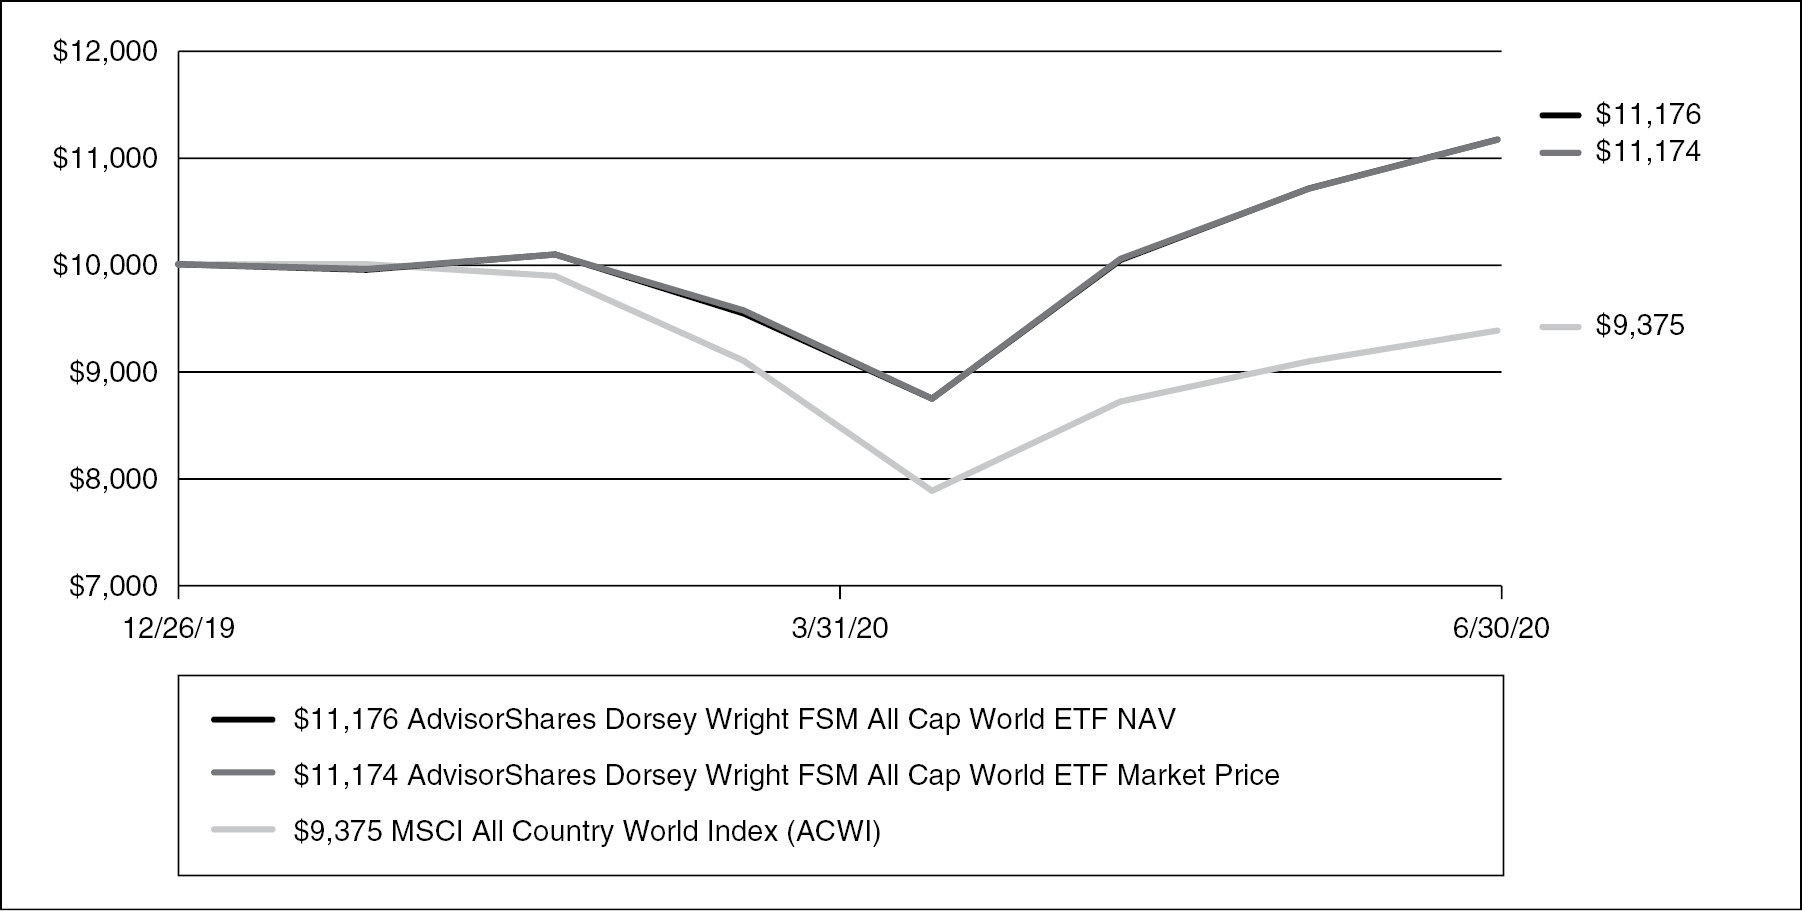
The AdvisorShares Dorsey Wright FSM All Cap World ETF (DWAW) outperformed its benchmark, the MSCI All Country World Index, since the fund’s inception on December 26, 2019 through June 30, 2020. The fund launched in a positive market environment for focused equity allocation and has maintained strength through exposure to equity market leadership.
Global equity markets have seen drastic swings in strength over the past six months, with COVID-19 leading to major declines in March, followed by a swift rally across domestic and international equities through the end of the second quarter of 2020. While few equity-only allocations were without a drawdown during this period, large-cap growth oriented domestic equities continued to outperform other equity classifications throughout the drawdown and subsequent rally. Exposure towards large-cap domestic growth helped the fund outperform its benchmark in each month since its inception. The fund continues to maintain exposure towards these areas as we head into the second half of the year, with sector overweights toward Technology and Communication Services.
Our outlook on equity markets over the next few months is positive and has continued to improve with the global equity rally, although much of the recent strength has been focused in domestic-growth representatives. These areas still lead the way in our relative comparisons, however, we are confident in the fund’s ability to rotate into other areas of strength should this leadership change in the months to come.
HYPOTHETICAL GROWTH OF $10,000 INVESTMENT
For the period December 26, 2019* to June 30, 2020
7
HISTORICAL PERFORMANCE
Total Return as of June 30, 2020
Since | ||
AdvisorShares Dorsey Wright FSM All Cap World ETF NAV | 11.76% | |
AdvisorShares Dorsey Wright FSM All Cap World ETF Market Price** | 11.74% | |
MSCI All Country World Index (ACWI) | -6.25% |
Performance data quoted represents past performance and is no guarantee of future results. Current performance may be lower or higher than the performance data quoted. Investment return and principal value will fluctuate so that an investor’s shares, when redeemed, may be worth more or less than original cost. Fund NAV returns are calculated using the Fund’s daily 4:00 p.m. NAV. Returns shown include the reinvestment of all dividends and other distributions. Index returns do not include expenses. As stated in the current prospectus, the Fund’s annual operating expense ratio (gross) is 3.06% and the net expense ratio is 0.90%. (Actual expenses can be referenced in the Financial Highlights section later in this report.) The Fund’s advisor has agreed to waive a portion of its fees and/or reimburse expenses to the extent necessary to keep the Fund’s expenses from exceeding 0.90%. Returns less than one year are not annualized. The performance table and graph do not reflect the deduction of taxes that a shareholder would pay on Fund distributions or the redemption of Fund shares. For the Fund’s most recent month end performance, please call 1-877-843-3831.
____________
* Commencement of operations.
** The price used to calculate market return (“Market Price’’) is determined by using the closing price listed on the NYSE Arca and does not represent returns an investor would receive if shares were traded at other times. Total returns are calculated using the daily 4:00pm midpoint between the bid and offer. Shares are bought and sold at market price, not NAV and are not individually redeemed from the Fund.
The MSCI All Country World Index (Net) is an unmanaged free float-adjusted market capitalization weighted index that is designed to measure the equity market performance of developed and emerging markets. One cannot invest directly in an index.
8
ADVISORSHARES TRUST
AdvisorShares Dorsey Wright FSM US Core ETF (DWUS)
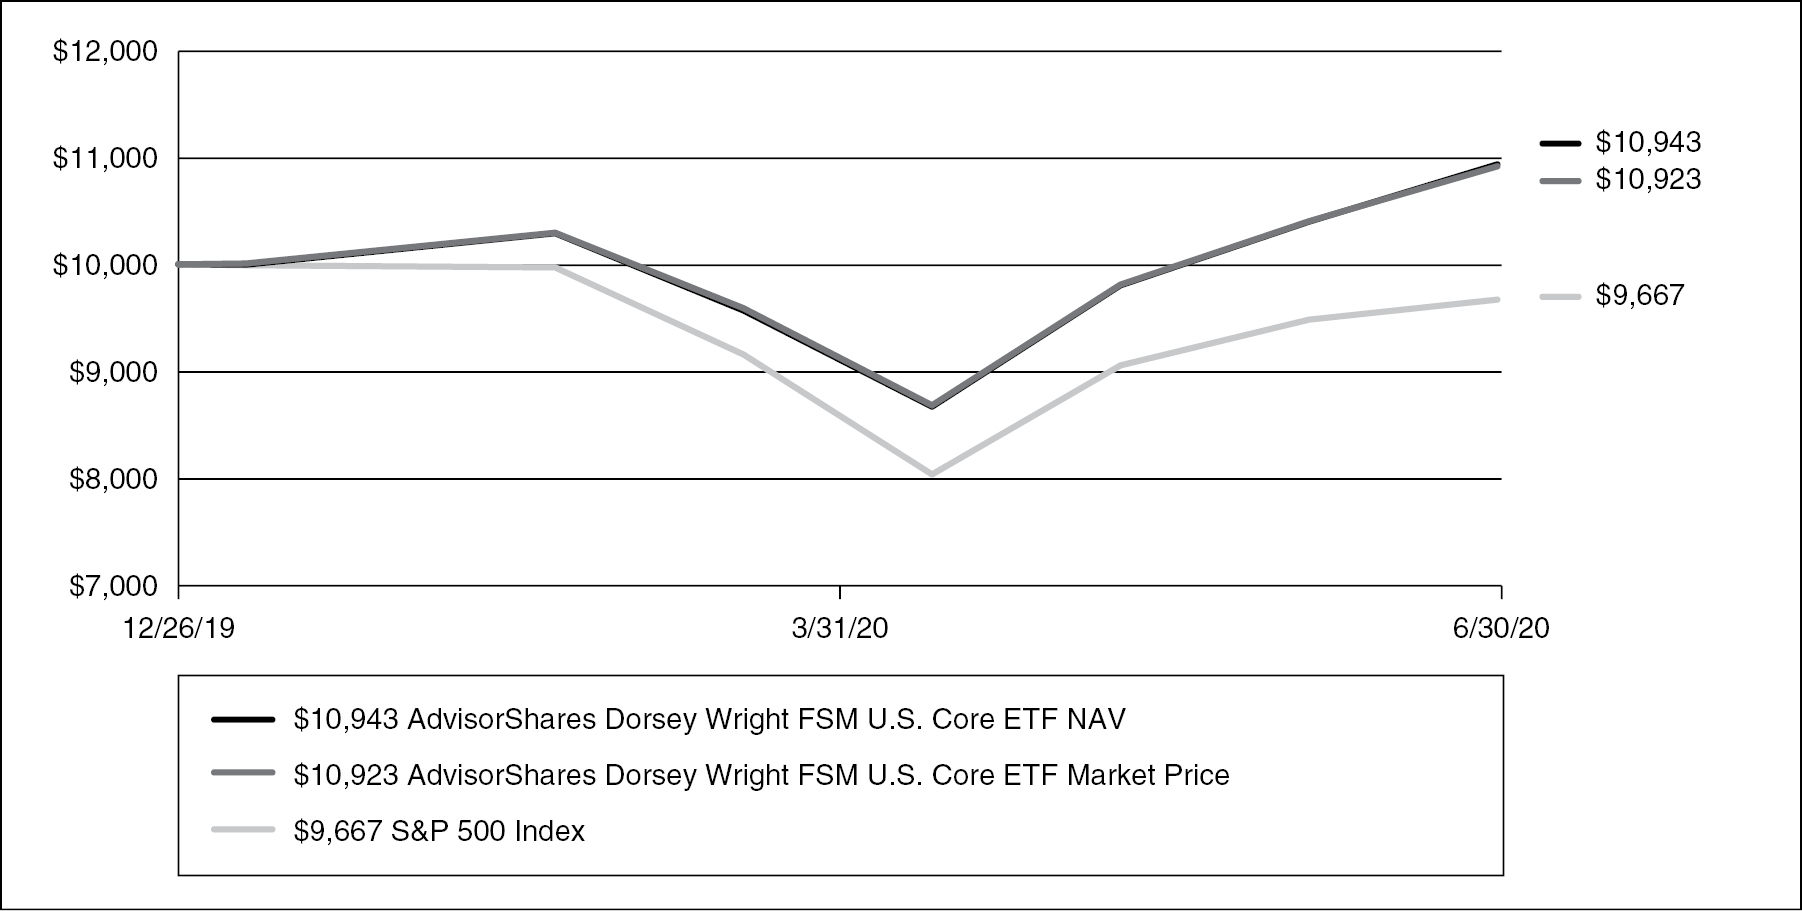
The AdvisorShares Dorsey Wright FSM US Core ETF (DWUS) outperformed its benchmark, the S&P 500 Index, since the fund’s inception on December 26, 2019 through June 30, 2020. The fund launched in a positive market environment for broad domestic equity allocation, and has maintained strength through exposure to growth-oriented names throughout the timeframe examined.
Domestic equity markets have seen a major increase in volatility in 2020, with COVID-19 leading to major declines in March, followed by a swift rally through the end of the second quarter. While few equity-only allocations were without a drawdown during this period, large-cap names continued to outperform other size classifications, with an emphasis on growth and momentum factor exposure. We saw this benefit the fund in the first quarter of the year, as the strategy rotated out of low volatility in place of momentum. The fund continues to maintain exposure towards these areas as we head into the second half of the year, with a majority of its allocation positioned in large-cap names that are focused in technology and communication services.
Our outlook on equity markets over the next few months is positive and has continued to improve with the global equity rally, although much of the recent strength has been focused in domestic-growth representatives. Large-cap names continue to lead the way across the various size classifications, with growth and momentum areas demonstrating continued outperformance as we head into the next few months. We remain confident in the strategy to provide allocation toward the strongest tranches of the broad domestic equity market if the current leadership changes.
HYPOTHETICAL GROWTH OF $10,000 INVESTMENT
For the period December 26, 2019* to June 30, 2020
9
HISTORICAL PERFORMANCE
Total Return as of June 30, 2020
Since | ||
AdvisorShares Dorsey Wright FSM US Core ETF NAV | 9.43% | |
AdvisorShares Dorsey Wright FSM US Core ETF Market Price** | 9.23% | |
S&P 500 Index | -3.33% |
Performance data quoted represents past performance and is no guarantee of future results. Current performance may be lower or higher than the performance data quoted. Investment return and principal value will fluctuate so that an investor’s shares, when redeemed, may be worth more or less than original cost. Fund NAV returns are calculated using the Fund’s daily 4:00 p.m. NAV. Returns shown include the reinvestment of all dividends and other distributions. Index returns do not include expenses. As stated in the current prospectus, the Fund’s annual operating expense ratio (gross) is 3.06% and the net expense ratio is 0.90%. (Actual expenses can be referenced in the Financial Highlights section later in this report.) The Fund’s advisor has agreed to waive a portion of its fees and/or reimburse expenses to the extent necessary to keep the Fund’s expenses from exceeding 0.90%. Returns less than one year are not annualized. The performance table and graph do not reflect the deduction of taxes that a shareholder would pay on Fund distributions or the redemption of Fund shares. For the Fund’s most recent month end performance, please call 1-877-843-3831.
____________
* Commencement of operations.
** The price used to calculate market return (“Market Price’’) is determined by using the closing price listed on the NYSE Arca and does not represent returns an investor would receive if shares were traded at other times. Total returns are calculated using the daily 4:00pm midpoint between the bid and offer. Shares are bought and sold at market price, not NAV and are not individually redeemed from the Fund.
The S&P 500 Index is a broad-based, unmanaged measurement of changes in stock market conditions based on the average of 500 widely held common stocks. One cannot invest directly in an index.
10
ADVISORSHARES TRUST
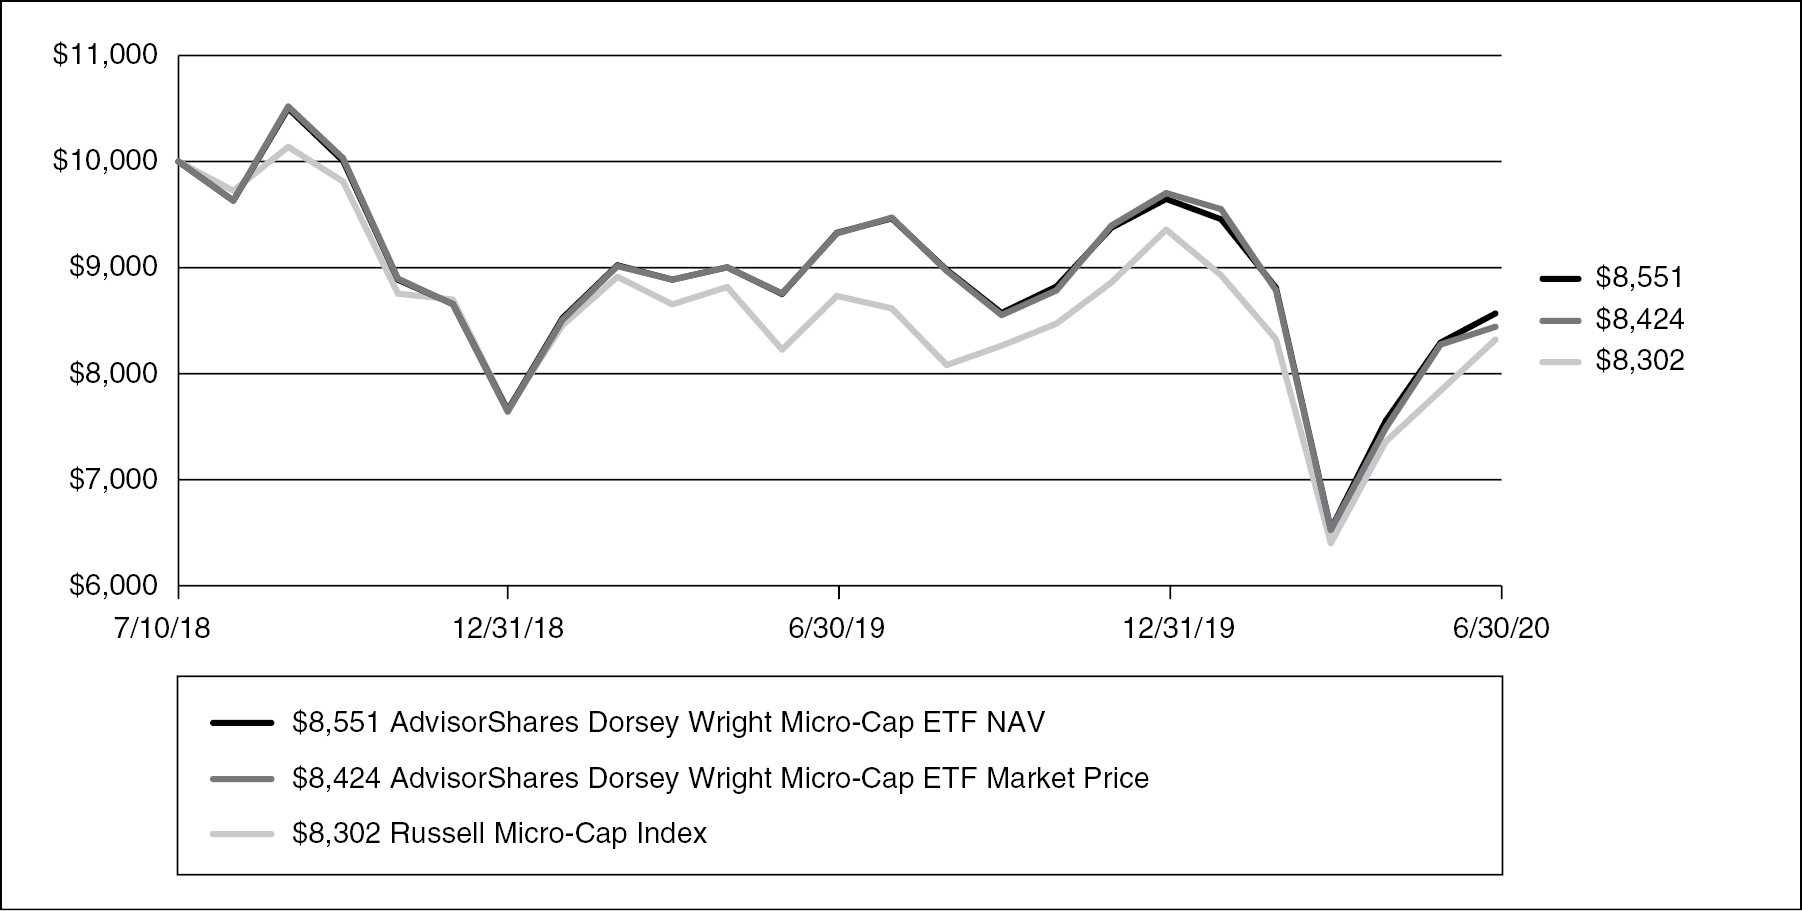
AdvisorShares Dorsey Wright Micro-Cap ETF (DWMC)
The AdvisorShares Dorsey Wright Micro-Cap ETF (DWMC) finished the year ended June 30, 2020 behind its benchmark, the Russell Micro Cap Index. It was a difficult year for small cap stocks as investors continued to focus on the largest capitalization stocks.
The past fiscal year’s results were affected quite a bit by COVID-19. During the initial sell-off, the fund struggled to keep pace with the market and underperformed. However, the fund recovered nicely during the recovery and outperformed during that time period. It is impossible for us to predict how COVID-19 will affect markets in the coming months. Our strategy is designed to unemotionally follow trends, which we think will be a benefit in the coming months that we expected to be filled with uncertainty. The fund has seen higher turnover levels than normal because of the volatility. If volatility continues at current levels, we expect the fund to continue to experience above average turnover as our process adapts to strength.
As the economy begins to recover, the prospects for micro-cap stocks should improve. These are small companies and can’t weather economic storms as well as their large-cap counterparts. As we emerge from the recession, we expect micro-cap stocks to continue to perform well. Valuations for smaller stocks have also become attractive relative to large caps. Investors have focused on a few mega cap stocks, which has caused a huge valuation gap. This can persist for long periods but doesn’t last forever. The fund is well positioned to capitalize on a narrowing valuation gap when it comes.
HYPOTHETICAL GROWTH OF $10,000 INVESTMENT
For the period July 10, 2018* to June 30, 2020
11
HISTORICAL PERFORMANCE
Total Return as of June 30, 2020
1 Year | Since | |||
AdvisorShares Dorsey Wright Micro-Cap ETF | -8.26% | -7.63% | ||
AdvisorShares Dorsey Wright Micro-Cap ETF Market Price** | -9.58% | -8.33% | ||
Russell Micro-Cap Index | -4.77% | -9.00% |
Performance data quoted represents past performance and is no guarantee of future results. Current performance may be lower or higher than the performance data quoted. Investment return and principal value will fluctuate so that an investor’s shares, when redeemed, may be worth more or less than original cost. Fund NAV returns are calculated using the Fund’s daily 4:00 p.m. NAV. Returns shown include the reinvestment of all dividends and other distributions. Index returns do not include expenses. As stated in the current prospectus, the Fund’s annual operating expense ratio (gross) is 1.12% and the net expense ratio is 0.99%. (Actual expenses can be referenced in the Financial Highlights section later in this report.) The Fund’s advisor has agreed to waive a portion of its fees and/or reimburse expenses to the extent necessary to keep the Fund’s expenses from exceeding 0.99%. Returns less than one year are not annualized. The performance table and graph do not reflect the deduction of taxes that a shareholder would pay on Fund distributions or the redemption of Fund shares. For the Fund’s most recent month end performance, please call 1-877-843-3831.
____________
* Commencement of operations.
** The price used to calculate market return (“Market Price’’) is determined by using the closing price listed on the NYSE Arca and does not represent returns an investor would receive if shares were traded at other times. Total returns are calculated using the daily 4:00pm midpoint between the bid and offer. Shares are bought and sold at market price, not NAV and are not individually redeemed from the Fund.
The Russell Micro-Cap Index measures the performance of the micro cap segment of the U.S. equity market. It includes 1,000 of the smallest securities in the Russell 2000 Index based on a combination of their market cap and current index membership and it also includes up to the next 1,000 stocks.
12
ADVISORSHARES TRUST
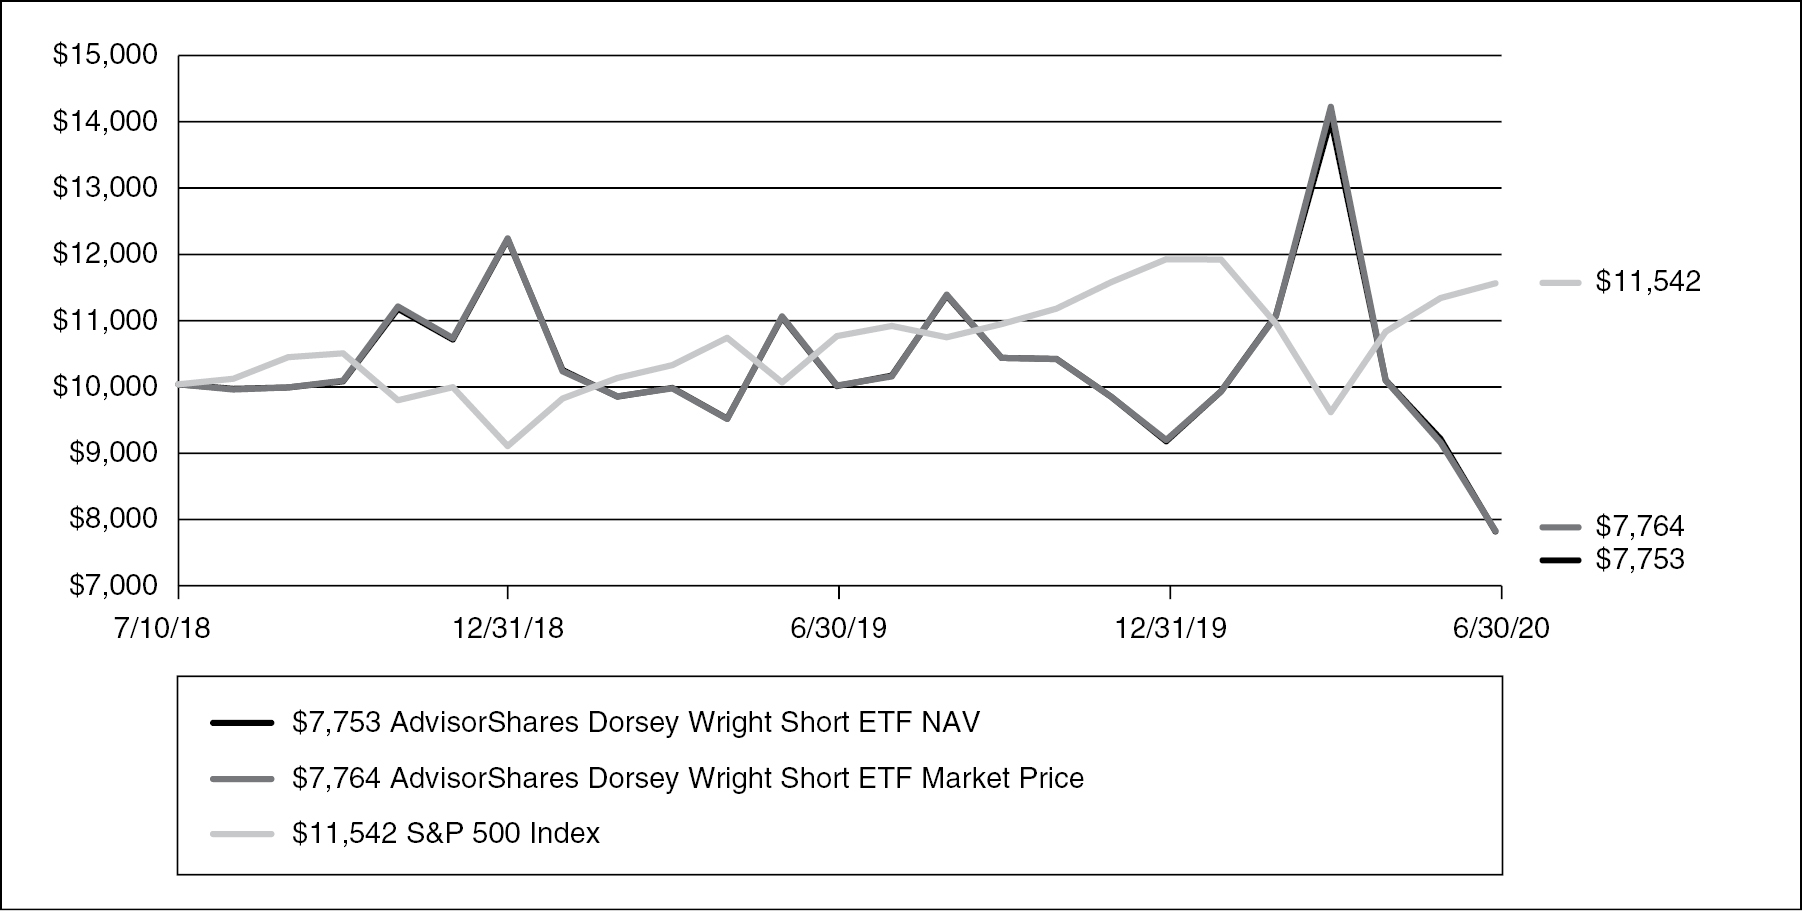
AdvisorShares Dorsey Wright Short ETF (DWSH)
The AdvisorShares Dorsey Wright Short ETF (DWSH) finished the year ended June 30, 2020 behind its benchmark, the inverse of the S&P 500 Total Return Index. It was a challenging year for shorting stocks with the market’s upward bias near the beginning of the fiscal year and then the extreme volatility at the end of the year.
The past fiscal year’s results were affected quite a bit by COVID-19. During the initial sell-off, the fund provided an excellent hedge against the declining equity market. The decline was characterized by the laggards dramatically underperforming the leaders. This is an ideal environment for our short strategy, and the fund performed very well. Near the bottom, the laggards began to rally more than the leaders. This is a two part problem for our strategy. First, the entire market was rallying. Second, we short the laggards and when they go up more than the leaders that is not ideal for our strategy. The laggard rally began to run its course near the end of the quarter, and the fund began to perform better.
With the uncertainty surrounding markets the fund remains an attractive hedge against declining markets. Our strategy of continuing to rotate toward the weakest sectors and stocks in the market should be more in favor now that the initial bounce off the bear market bottom is done, and the laggard rally has dissipated.
HYPOTHETICAL GROWTH OF $10,000 INVESTMENT
For the period July 10, 2018* to June 30, 2020
13
HISTORICAL PERFORMANCE
Total Return as of June 30, 2020
1 Year | Since | |||
AdvisorShares Dorsey Wright Short ETF NAV | -22.26% | -12.11% | ||
AdvisorShares Dorsey Wright Short ETF Market Price** | -22.24% | -12.04% | ||
S&P 500 Index | 7.51% | 7.54% |
Performance data quoted represents past performance and is no guarantee of future results. Current performance may be lower or higher than the performance data quoted. Investment return and principal value will fluctuate so that an investor’s shares, when redeemed, may be worth more or less than original cost. Fund NAV returns are calculated using the Fund’s daily 4:00 p.m. NAV. Returns shown include the reinvestment of all dividends and other distributions. Index returns do not include expenses. As stated in the current prospectus, the Fund’s annual operating expense ratio (gross) is 1.12% and the net expense ratio is 0.99%. (Actual expenses can be referenced in the Financial Highlights section later in this report.) The Fund’s advisor has agreed to waive a portion of its fees and/or reimburse expenses to the extent necessary to keep the Fund’s expenses from exceeding 0.99%. Returns less than one year are not annualized. The performance table and graph do not reflect the deduction of taxes that a shareholder would pay on Fund distributions or the redemption of Fund shares. For the Fund’s most recent month end performance, please call 1-877-843-3831.
____________
* Commencement of operations.
** The price used to calculate market return (“Market Price’’) is determined by using the closing price listed on the NYSE Arca and does not represent returns an investor would receive if shares were traded at other times. Total returns are calculated using the daily 4:00pm midpoint between the bid and offer. Shares are bought and sold at market price, not NAV and are not individually redeemed from the Fund.
The S&P 500 Index is a broad-based, unmanaged measurement of changes in stock market conditions based on the average of 500 widely held common stocks. One cannot invest directly in an index.
14
ADVISORSHARES TRUST
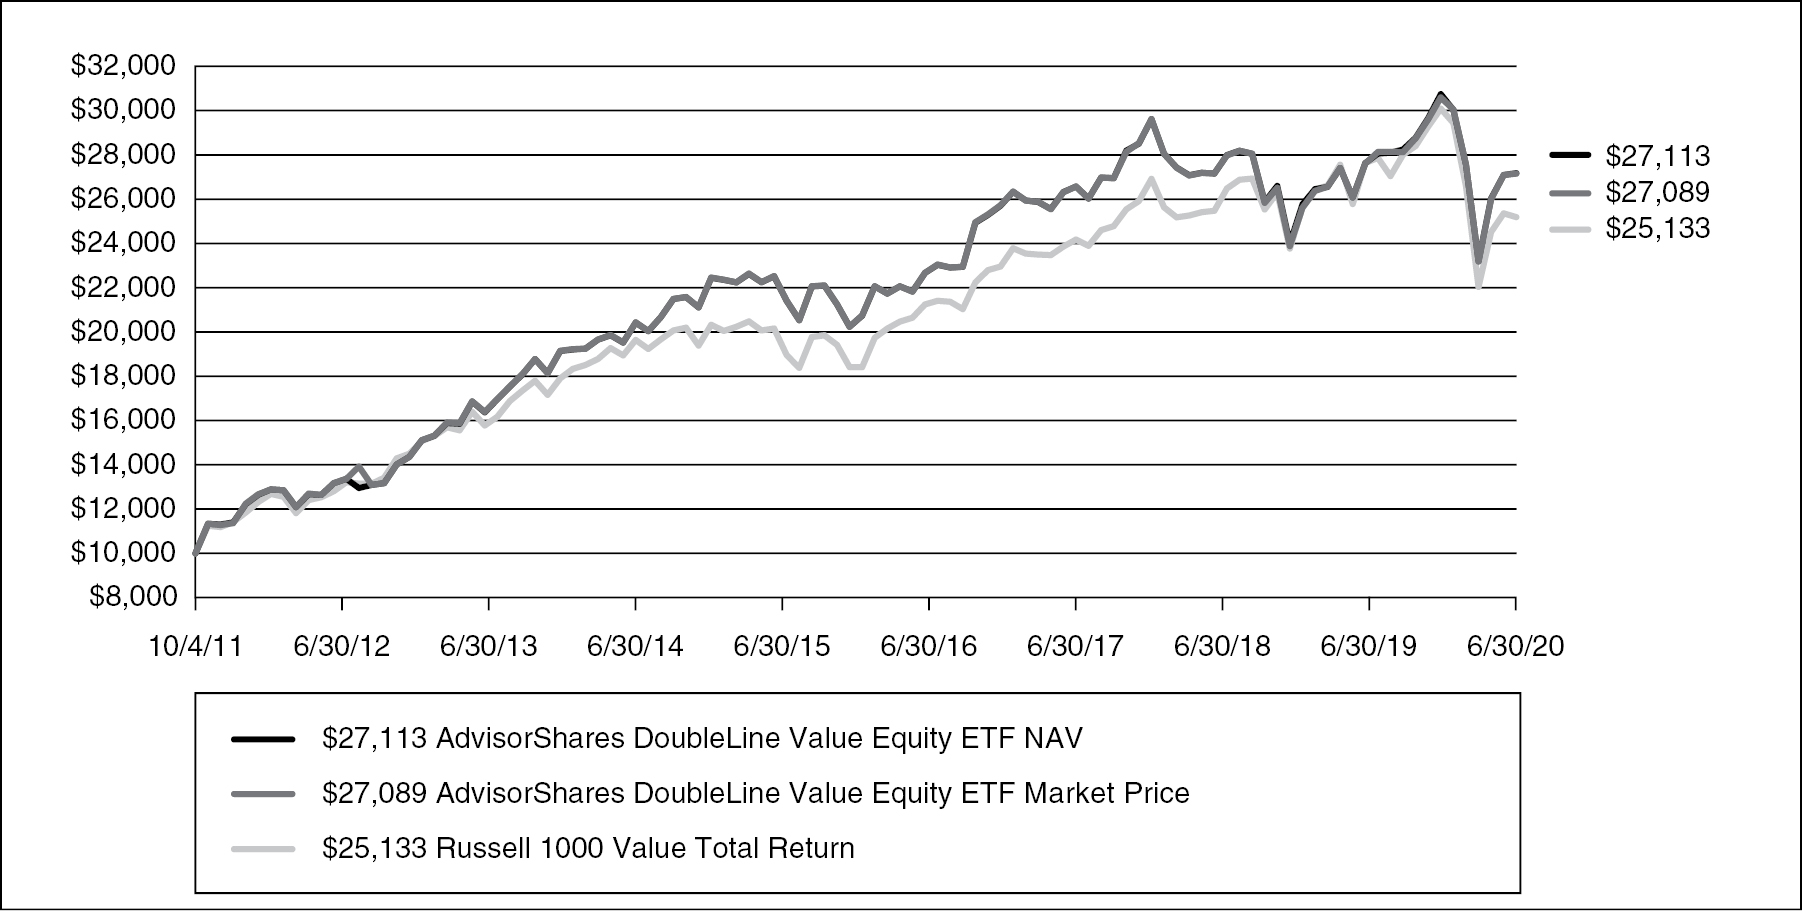
AdvisorShares DoubleLine Value Equity ETF (DBLV)
For the year ended June 30, 2020, the AdvisorShares DoubleLine Value Equity ETF (DBLV) posted a return of -1.63%, based on NAV, and -1.65%, based on Market Price, while the Russell 1000 Value Index, its benchmark, returned -8.84%.
For the year, DBLV benefitted from both favorable stock selection and sector positioning, with individual names contributing to a larger portion of the overall outperformance. DBLV’s performance, on a relative basis, benefitted mostly from positive stock selection within the communications services, consumer discretionary, financials, real estate, and healthcare sectors, but was impacted by unfavorable selection within consumer staples, industrials and energy sectors. Meanwhile, our overweights in information technology and healthcare, as well as an underweight in financials contributed to relative performance, while our overweight in energy detracted from relative performance.
COVID-19 has had a damaging effect on the economy, but some companies have been able to weather through this downturn better than others or have even thrived during the shelter-in-place order. Technology has played a key role in enabling businesses to operate efficiently in a work from home environment. Several of our technology-related holdings, such as Microsoft and Google, continued to generate growth through this recession, by providing innovative solutions and helping businesses to automate and reduce costs. We also benefited from holding some of the largest e-commerce players like Amazon and Alibaba that gained market share and grew even stronger during the crisis, as well as defensive retailers, such as Dollar General and Target, that saw consumers stock up on groceries and other household essentials given the shelter-in-place order. Conversely, the prohibition of dining in at restaurants indirectly harmed U.S. Foods, a major distributor to restaurants, while restrictions on air travel indirectly impacted Boeing, a leading airplane manufacturer. We continue to hold both stocks as we believe they will be able to withstand the downturn and we see long-term value in them.
We are still in the midst of one of the worst economic crisis in history brought on by the COVID-19 diseases. Unemployment hit a record high and GDP fell the most since the Great Depression. The dramatic collapse in the economy has elicited an unprecedented pace of monetary intervention by the Federal Reserve, along with record levels of governmental fiscal stimulus. While the flood of liquidity helped fuel a strong market rally, the economy is still only in the very early stages of recovery and the path to a full recovery remains highly uncertain and likely will carry setbacks along the way. While we expect many states to continue to move forward with their re-opening plans, in spite of resurgences in infections and hospitalizations, we also believe that systemic risks remain elevated and the financial system and the wider economy are both still under stress. Yet, we think the market is pricing in too much good news relating to an economic recovery, but not discounting enough of the substantial risk and unknowns that could cause economic conditions to deteriorate. Given this, we believe an abundance of caution is warranted at the present time. We seek to balance our portfolio exposures between those names that should prove defensive in these difficult times and those that present superior opportunity as the underlying economy begins a broader, sustainable recovery. Our differentiated fundamental value strategy affords us an ability to balance these two types of investments within the DBLV portfolio.
15
HYPOTHETICAL GROWTH OF $10,000 INVESTMENT
For the period October 4, 2011* to June 30, 2020
HISTORICAL PERFORMANCE
Total Return as of June 30, 2020
1 Year | 3 Year | 5 Year | Since | |||||
AdvisorShares DoubleLine Value Equity ETF | -1.63% | 1.07% | 4.08% | 12.09% | ||||
AdvisorShares DoubleLine Value Equity ETF Market Price** | -1.65% | 1.06% | 4.06% | 12.08% | ||||
Russell 1000 Value Total Return | -8.84% | 1.82% | 4.64% | 11.12% |
Performance data quoted represents past performance and is no guarantee of future results. Current performance may be lower or higher than the performance data quoted. Investment return and principal value will fluctuate so that an investor’s shares, when redeemed, may be worth more or less than original cost. Fund NAV returns are calculated using the Fund’s daily 4:00 p.m. NAV. Returns shown include the reinvestment of all dividends and other distributions. Index returns do not include expenses. As stated in the current prospectus, the Fund’s annual operating expense ratio (gross) and net expense ratio is 0.90%. (Actual expenses can be referenced in the Financial Highlights section later in this report.) The Fund’s advisor has agreed to waive a portion of its fees and/or reimburse expenses to the extent necessary to keep the Fund’s expenses from exceeding 0.90%. Returns less than one year are not annualized. The performance table and graph do not reflect the deduction of taxes that a shareholder would pay on Fund distributions or the redemption of Fund shares. For the Fund’s most recent month end performance, please call 1-877-843-3831.
____________
* Commencement of operations.
** The price used to calculate market return (“Market Price’’) is determined by using the closing price listed on the NYSE Arca and does not represent returns an investor would receive if shares were traded at other times. Total returns are calculated using the daily 4:00pm midpoint between the bid and offer. Shares are bought and sold at market price, not NAV and are not individually redeemed from the Fund.
The Russell 1000 Value Total Return Index measures the performance of the large-cap value segment of the U.S. equity market. It includes those Russell 1000 companies with lower price-to-book ratios and lower expected and historical growth rates.
16
ADVISORSHARES TRUST
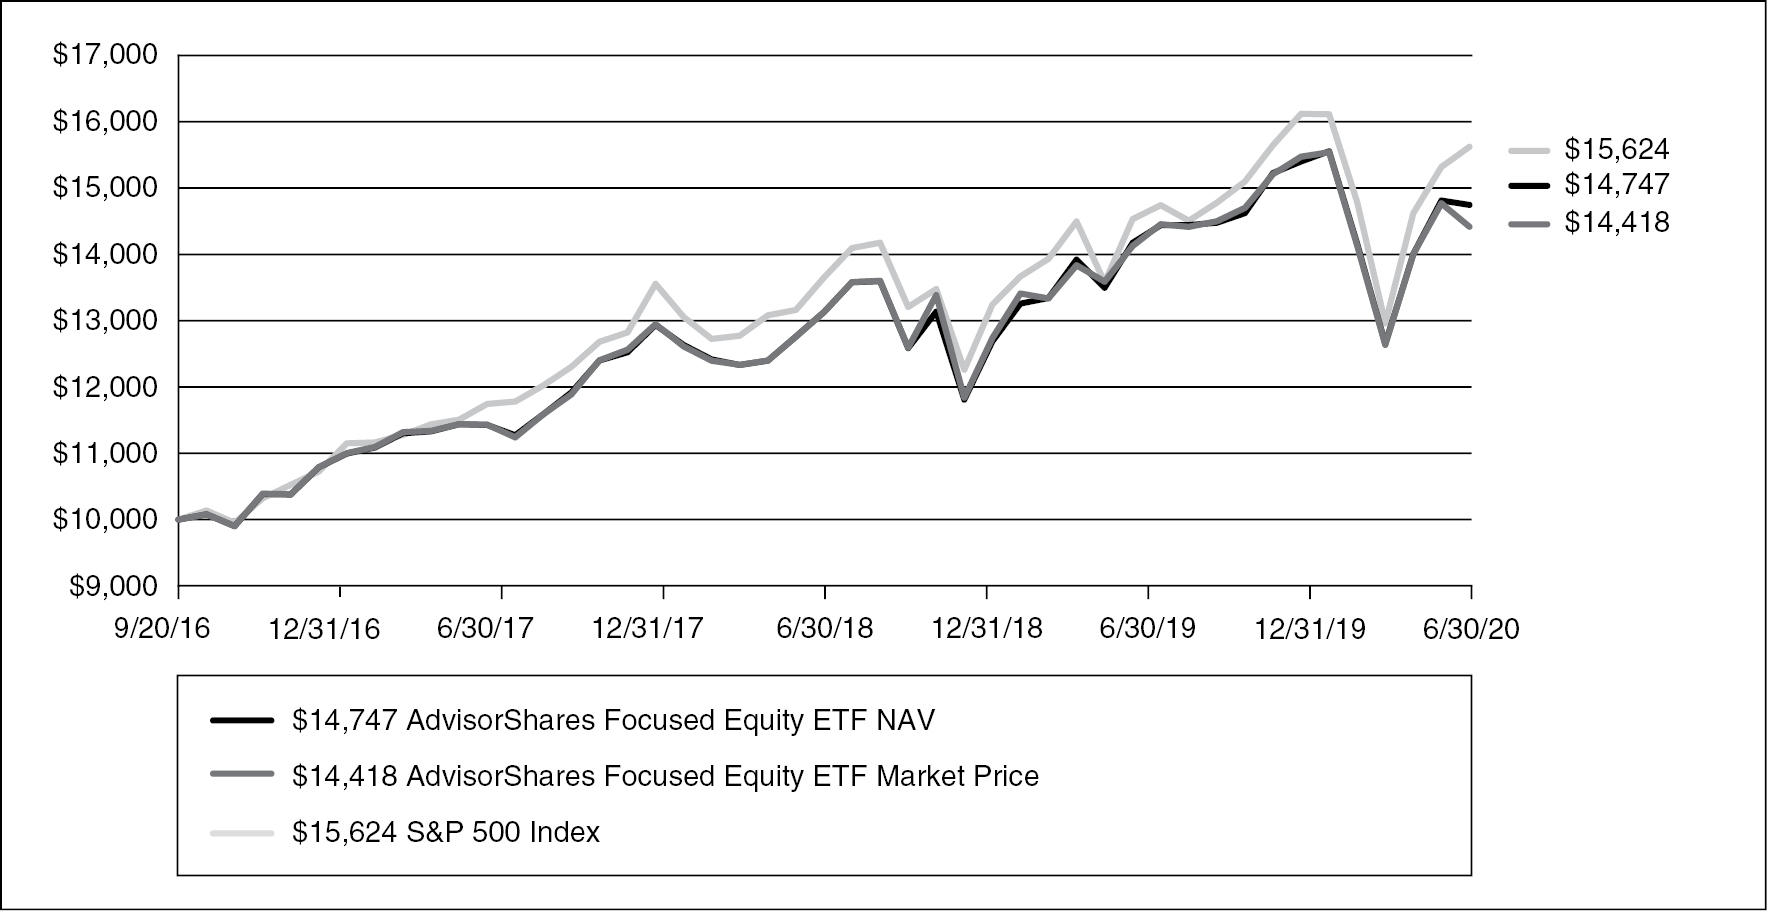
AdvisorShares Focused Equity ETF (CWS)
The period from the July 1, 2019 until June 30, 2020 was highly unusual for the stock market. What had been a calm and buoyant market got a sudden shock due to the emergence of the coronavirus. As a result, the stock market suffered one of the sharpest corrections ever recorded in February and March of 2020. For the entire 12-month period, the fund increased 4.02% (NAV).
Until the market broke, the AdvisorShares Focused Equity ETF (CWS) behaved quite well. The Net Asset Value (NAV) of the fund reached an all-time high of $38.96 per share on February 14, 2020. However, once the reality of the coronavirus became apparent, the ETF fell along with the rest of the market. Due to the fund’s weight in high-quality stocks, the ETF didn’t fall as much as the broader market. The Federal Reserve and U.S. government responded with rate cuts and massive stimulus programs.
According to the ETF’s methodology, CWS holds 25 stocks for the calendar year, changing out five stocks at the end of each calendar year. This year, the five stocks removed were Continental Building Products (CBPX), Cognizant Technology Solutions (CTSH), Raytheon (RTN), JM Smucker (SJM) and Signature Bank (SBNY). The five new stocks added were Ansys (ANSS), Middleby (MIDD), Silgan (SLGN), Stepan (SCL) and Trex (TREX). Trex has been a very good performer for us, gaining more than 40% during the first half of 2020.
The outlook for the ETF is heavily tied to the outlook for the coronavirus. If the virus subsidies and the economy can reopen, then the ETF should respond positively. In fact, the fund is particularly well-position to profit from a resurgence in consumer spending with stocks such as Ross Stores (ROST) and Disney (DIS) in its portfolio. Overall, in our opinion, the business outlook for the CWS portfolio is quite bright.
HYPOTHETICAL GROWTH OF $10,000 INVESTMENT
For the period September 20, 2016* to June 30, 2020
17
HISTORICAL PERFORMANCE
Total Return as of June 30, 2020
1 Year | 3 Year | Since | ||||
AdvisorShares Focused Equity ETF NAV | 4.02% | 8.84% | 10.84% | |||
AdvisorShares Focused Equity ETF Market Price** | 2.06% | 8.02% | 10.18% | |||
S&P 500 Index | 7.51% | 10.73% | 12.55% |
Performance data quoted represents past performance and is no guarantee of future results. Current performance may be lower or higher than the performance data quoted. Investment return and principal value will fluctuate so that an investor’s shares, when redeemed, may be worth more or less than original cost. Fund NAV returns are calculated using the Fund’s daily 4:00 p.m. NAV. Returns shown include the reinvestment of all dividends and other distributions. Index returns do not include expenses. As stated in the current prospectus, the Fund’s annual operating expense ratio (gross) is 1.39% and the net expense ratio is 0.68%. (Actual expenses can be referenced in the Financial Highlights section later in this report.) The Fund’s advisor has agreed to waive a portion of its fees and/or reimburse expenses to the extent necessary to keep the Fund’s expenses from exceeding 0.75%. Returns less than one year are not annualized. The performance table and graph do not reflect the deduction of taxes that a shareholder would pay on Fund distributions or the redemption of Fund shares. For the Fund’s most recent month end performance, please call 1-877-843-3831.
____________
* Commencement of operations.
** The price used to calculate market return (“Market Price’’) is determined by using the closing price listed on the NYSE Arca and does not represent returns an investor would receive if shares were traded at other times. Total returns are calculated using the daily 4:00pm midpoint between the bid and offer. Shares are bought and sold at market price, not NAV and are not individually redeemed from the Fund.
The S&P 500 Index is a broad-based, unmanaged measurement of changes in stock market conditions based on the average of 500 widely held common stocks. One cannot invest directly in an index.
18
ADVISORSHARES TRUST
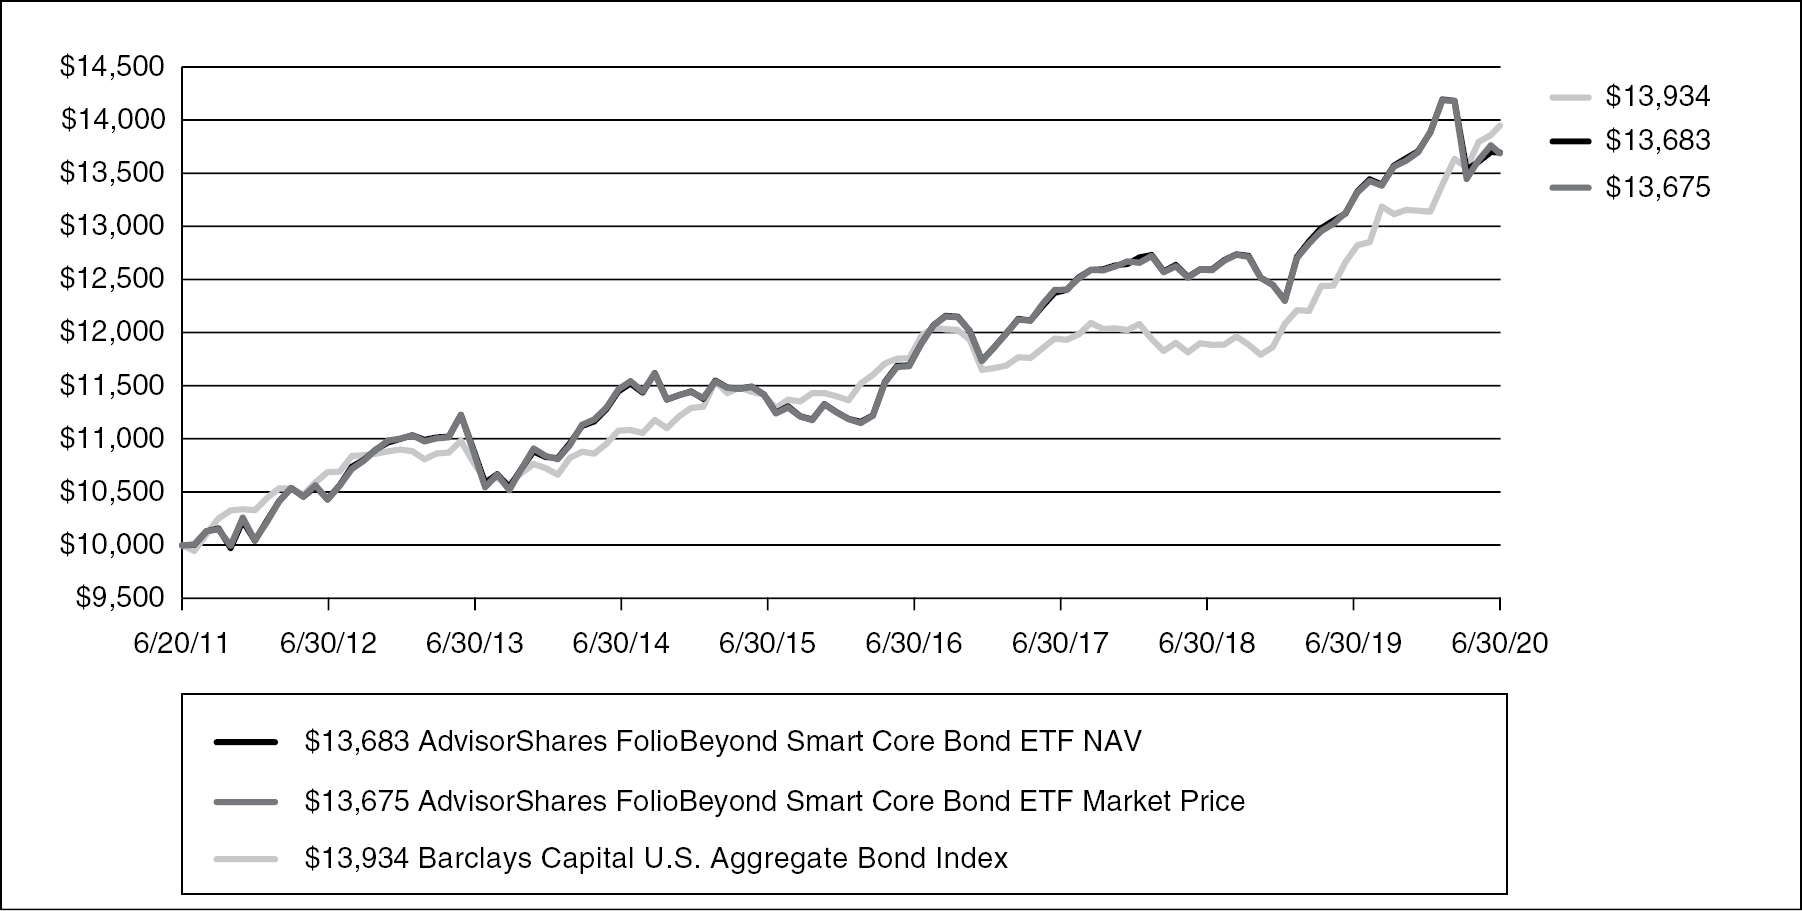
AdvisorShares FolioBeyond Smart Core Bond ETF (FWDB)
The FolioBeyond algorithm underlying the AdvisorShares FolioBeyond Smart Core Bond ETF (FWDB) returned 2.73% (NAV) for the one-year period ending on June 30, 2020, versus 8.74% for the Bloomberg Barclays U.S. Aggregate Bond Index (“AGG”). FolioBeyond’s multi-sector fixed income strategy is driven by an automated sector rebalancing process that optimizes FWDB’s portfolio allocation across 23 possible Fixed Income subsector ETFs. This multi-factor modeling approach is a systematic and tactical strategy designed to capture the major sources of risk and return in Fixed Income securities, including forward looking relative value measures, historical and implied volatility risk levels, correlations, momentum effects and stress testing.
The one year historical return profile can be bifurcated into two distinct time periods. The first six months (6/30/19-12/31/19) were characterized by strong returns from Mortgage REITs, long duration Treasuries, short duration High Yield Corporates and High Yield Municipals. The low volatility environment that persisted during this time period made these sectors the most attractive sources of income and total return.
As we entered the six-month period at the beginning of this year, the flight-to-quality rally accelerated in February 2020 and implied volatility levels in the options market spiked. Consequently, FolioBeyond’s algorithm quickly responded to the heightened risk levels and FWDB was rebalanced frequently to de-risk the portfolio and remove a majority of the high-risk exposures. While the fund suffered a drawdown in March of 2020, FWDB outperformed the other bond funds in its Morningstar category (Multisector Bond) by more than 500 basis points through 1st quarter end. Relative to AGG, FWDB underperformed due to a combination of lower duration and lower exposure to Treasuries, Agency MBS and Investment Grade Corporates, especially given how these markets received external support through massive Federal Reserve support.
Entering the second half of the year and with the pace of economic recovery remaining highly uncertain, FWDB’s strategy is defensively positioned to take advantage of any further dislocations and opportunities within the confines of model risk limits. Given the current low interest environment, FolioBeyond believes that FWDB’s model is properly positioned to dynamically adjust to sector rotation opportunities and provide strong risk-adjusted returns in comparison to static index-based exposures.
HYPOTHETICAL GROWTH OF $10,000 INVESTMENT
For the period June 20, 2011* to June 30, 2020
19
HISTORICAL PERFORMANCE
Total Return as of June 30, 2020
1 Year | 3 Year | 5 Year | Since | |||||
AdvisorShares FolioBeyond Smart Core Bond ETF NAV | 2.73% | 3.35% | 4.01% | 3.54% | ||||
AdvisorShares FolioBeyond Smart Core Bond ETF Market Price** | 2.75% | 3.33% | 4.01% | 3.53% | ||||
Bloomberg Barclays U.S. Aggregate Bond Index | 8.74% | 5.32% | 4.30% | 3.74% |
Performance data quoted represents past performance and is no guarantee of future results. Current performance may be lower or higher than the performance data quoted. Investment return and principal value will fluctuate so that an investor’s shares, when redeemed, may be worth more or less than original cost. Fund NAV returns are calculated using the Fund’s daily 4:00 p.m. NAV. Returns shown include the reinvestment of all dividends and other distributions. Index returns do not include expenses. As stated in the current prospectus, the Fund’s annual operating expense ratio (gross) is 1.68% and the net expense ratio is 1.41%. (Actual expenses can be referenced in the Financial Highlights section later in this report.) The Fund’s advisor has agreed to waive a portion of its fees and/or reimburse expenses to the extent necessary to keep the Fund’s expenses from exceeding 0.95%. Returns less than one year are not annualized. The performance table and graph do not reflect the deduction of taxes that a shareholder would pay on Fund distributions or the redemption of Fund shares. For the Fund’s most recent month end performance, please call 1-877-843-3831.
____________
* Commencement of operations.
** The price used to calculate market return (“Market Price’’) is determined by using the closing price listed on the NYSE Arca and does not represent returns an investor would receive if shares were traded at other times. Total returns are calculated using the daily 4:00pm midpoint between the bid and offer. Shares are bought and sold at market price, not NAV and are not individually redeemed from the Fund.
Bloomberg Barclays U.S. Aggregate Bond Index measures the performance of the U.S. investment grade bond market. One cannot invest directly in an index.
20
ADVISORSHARES TRUST
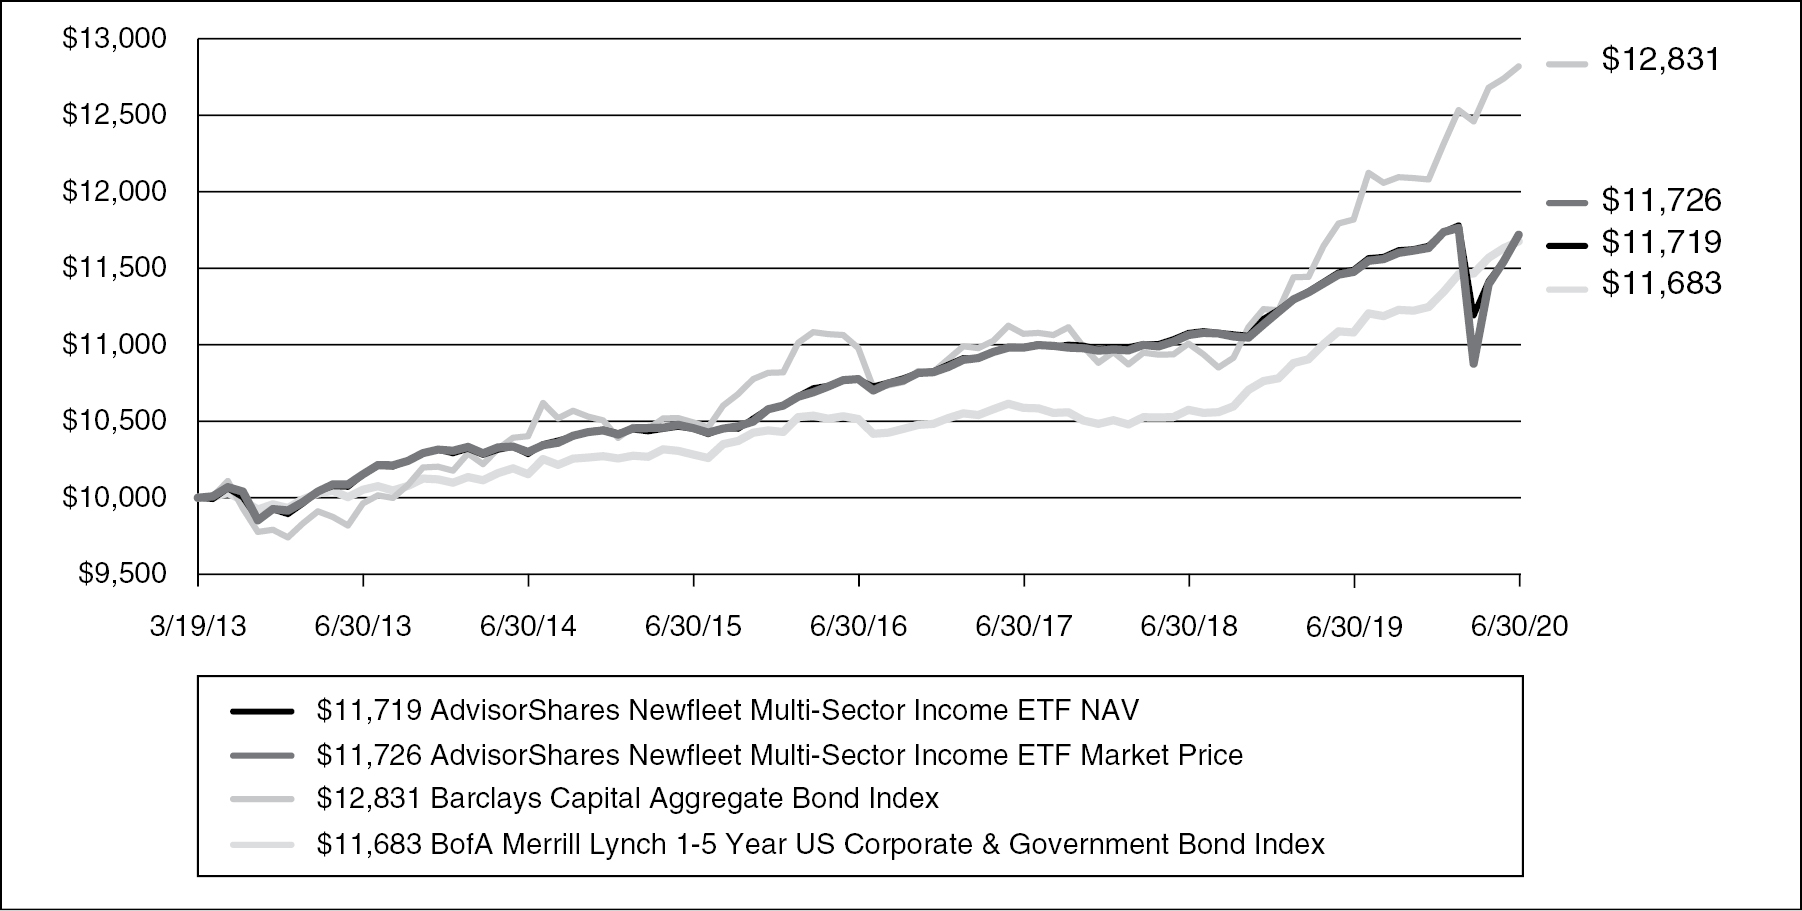
AdvisorShares Newfleet Multi-Sector Income ETF (MINC)
The AdvisorShares Newfleet Multi-Sector Income ETF (MINC) posted a return of 2.10%, based on NAV and 2.28%, based on Market Price as compared to 8.74% for the Bloomberg Barclays U.S. Aggregate Bond Index or 5.32% for the BofA Merrill lynch 1-5 Year U.S. Corporate & Government Bond Index for the 1-year period ended June 30th 2020.
The past year included multiple challenges, with bouts of elevated volatility during the time. In the first half of the fiscal year, investors maintained their appetite for risk assets. Fixed income markets responded favorably during the period to the dovish pivot by global central banks and the positive developments on the trade front as well as signs of stability in economic data. Geopolitical developments (i.e. trade, Mid-East tensions and European politics) and central bank headlines all continued to be significant market movers. In stark contrast, the first quarter of 2020 saw volatility spike to levels not seen since the financial crisis of 2008-2009 and will be remembered for the emergence of COVID-19 as the first global pandemic since the H1N1 “swine flu” of 2009-2010. The ultimate human and economic toll are still unknown as events continues to unfold, however, governments and central banks have responded in unprecedented fashion to help brunt the effects of the virus. Our expectation remains that policymakers will fine tune their response as warranted. The containment measures implemented to date are unambiguously negative for near term local, regional and global economic growth.
Coming into 2020, MINC was positioned for an environment of steady and improving growth, moderate inflation and a strong consumer. The negative effects of the coronavirus on the financial markets caused the fund to underperform as the selloff was unprecedented. During the first quarter, U. S. Treasuries significantly out-performed spread sectors. Over the next three months, the fixed income markets experienced a significant rebound with spread sectors outperforming U.S. Treasuries and the largest laggards in March outperforming for the next three months, albeit not to levels seen prior to the crisis. During the one-year period, MINC’s underweight to U.S. Treasuries and agency mortgage-backed securities and overweight to spread sectors had a negative impact on the fund. The Fund’s exposure to asset backed securities and non-agency residential mortgage backed securities were detractors for the period. Each of these sectors experienced heightened volatility and came under pressure as a result of the unknown economic impact of the coronavirus and performance in the securitized space has been slower to recover than corporate sectors.
As always, we believe it is important to stay diversified, have granular positions, and emphasize liquid investments. The coronavirus, like other events that trigger volatility in the market, can affect valuations and create opportunities for implementing MINC’s multi-sector relative value approach. We highlight the importance of credit selection and positioning in the current environment. Given the widening in spreads late in the first quarter of 2020, valuations had cheapened substantially and we continue to identify opportunities in spread sectors, including those within non-investment grade sectors that we have added to and may continue to add to in the portfolios. Even with the recovery since the end of March, valuations look attractive in many spread sectors that we believe offer some of the best total return and yield opportunities in fixed income. Some of the specific sectors where we are finding the best relative value opportunities are corporate high yield, investment grade corporates, EM debt, out-of-index/off-the-run ABS, and non-agency RMBS.
21
HYPOTHETICAL GROWTH OF $10,000 INVESTMENT
For the period March 19, 2013* to June 30, 2020
HISTORICAL PERFORMANCE
Total Return as of June 30, 2020
1 Year | 3 Year | 5 Year | Since | |||||
AdvisorShares Newfleet Multi-Sector Income ETF NAV | 2.10% | 2.40% | 2.37% | 2.20% | ||||
AdvisorShares Newfleet Multi-Sector Income ETF Market Price** | 2.28% | 2.41% | 2.40% | 2.21% | ||||
Bloomberg Barclays Aggregate Bond Index | 8.74% | 5.32% | 4.30% | 3.48% | ||||
BofA Merrill Lynch 1-5 Year U.S. Corporate & Government Bond Index | 5.32% | 3.48% | 2.64% | 2.16% |
Performance data quoted represents past performance and is no guarantee of future results. Current performance may be lower or higher than the performance data quoted. Investment return and principal value will fluctuate so that an investor’s shares, when redeemed, may be worth more or less than original cost. Fund NAV returns are calculated using the Fund’s daily 4:00 p.m. NAV. Returns shown include the reinvestment of all dividends and other distributions. Index returns do not include expenses. As stated in the current prospectus, the Fund’s annual operating expense ratio (gross) and net expense ratio is 0.69%. (Actual expenses can be referenced in the Financial Highlights section later in this report.) The Fund’s advisor has agreed to waive a portion of its fees and/or reimburse expenses to the extent necessary to keep the Fund’s expenses from exceeding 0.75%. Returns less than one year are not annualized. The performance table and graph do not reflect the deduction of taxes that a shareholder would pay on Fund distributions or the redemption of Fund shares. For the Fund’s most recent month end performance, please call 1-877-843-3831.
____________
* Commencement of operations.
** The price used to calculate market return (“Market Price’’) is determined by using the closing price listed on the NYSE Arca and does not represent returns an investor would receive if shares were traded at other times. Total returns are calculated using the daily 4:00pm midpoint between the bid and offer. Shares are bought and sold at market price, not NAV and are not individually redeemed from the Fund.
22
The Bloomberg Barclays Aggregate Bond Index measures the performance of the U.S. investment grade bond market. One cannot invest directly in an index.
The BofA Merrill Lynch 1-5 Year U.S. Corporate & Government Bond Index tracks the performance of US dollar denominated investment grade debt publicly issued in the US domestic market, including US Treasury, US agency, foreign government, supranational and corporate securities, with a remaining term to final maturity less than 5 years, calculated on a total return basis. One cannot invest directly in an index.
23
ADVISORSHARES TRUST
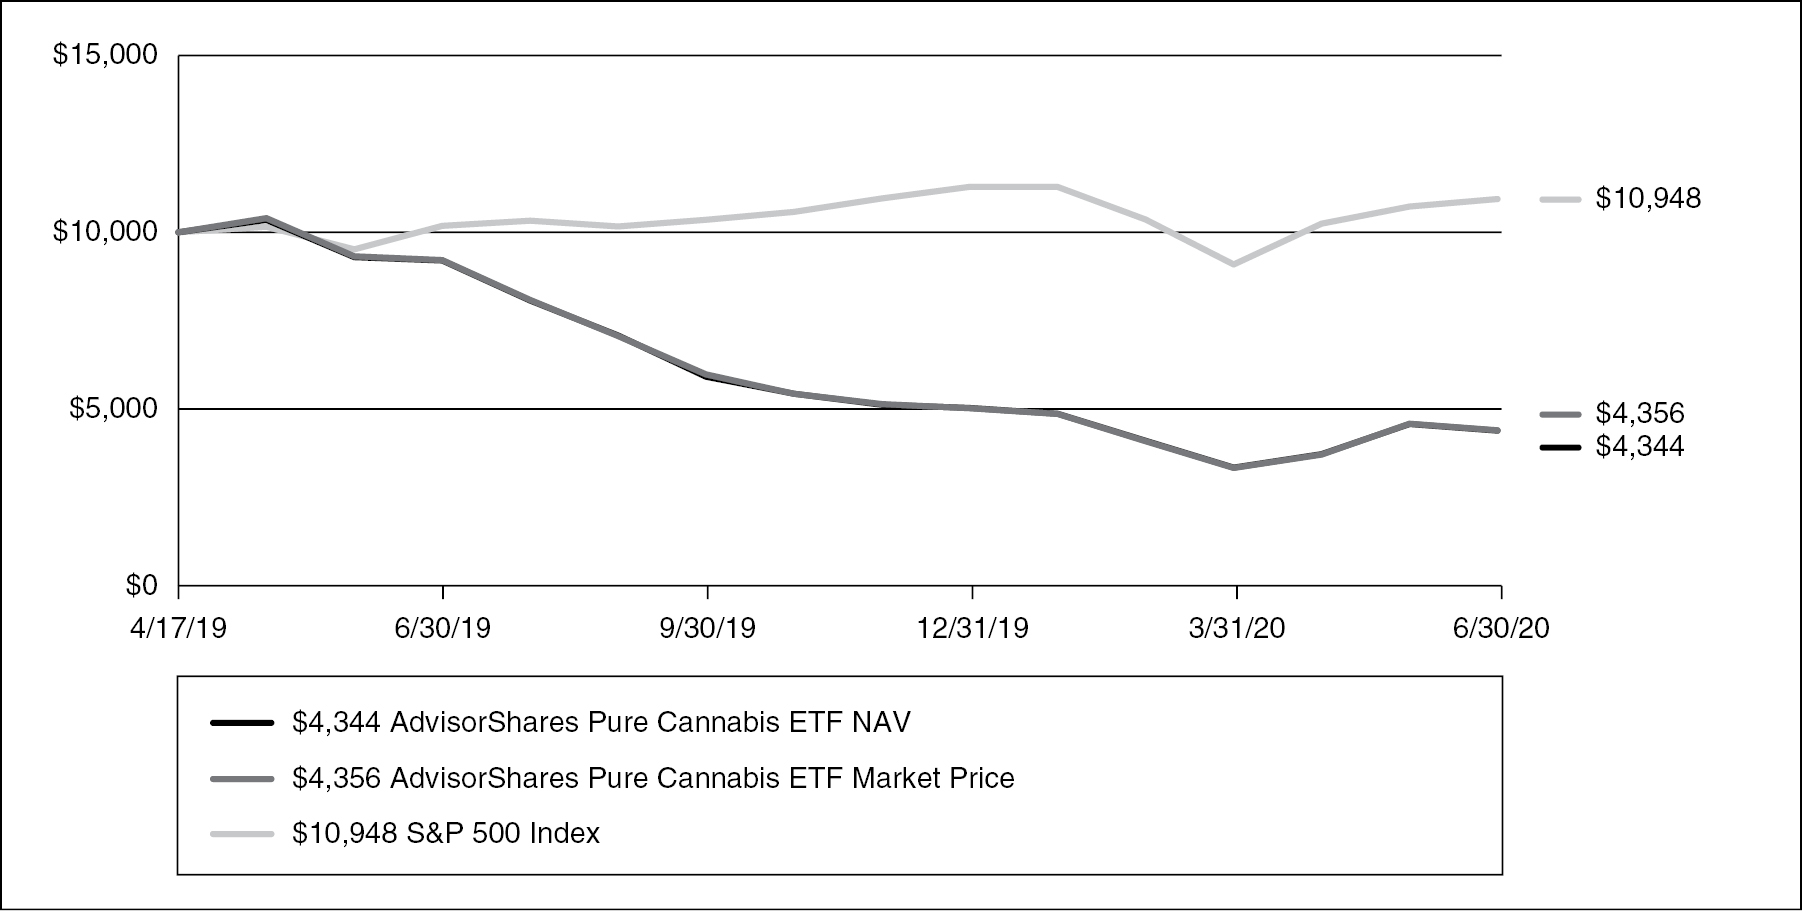
AdvisorShares Pure Cannabis ETF (YOLO)
The AdvisorShares Pure Cannabis ETF (YOLO) was launched April 17, 2019 and it now has a full fiscal year period of performance for the first time. For the 12-month timeframe of July 1, 2019 through June 30, 2020, cannabis stocks in general were quite negative. The Fund returned -52.70% on market price and -52.76% based on Net Asset Value. The Fund officially benchmarks against the S%P 500, which was positive for the period. As compared to other existing competitor marijuana or cannabis funds and related indexes, we feel that AdvisorShares Pure Cannabis ETF outperformed for the year (losing less) due to our active security selection and above-average exposure to U.S. cannabis stocks.
Through early 2020, the Fund was negatively impacted by the COVID-19 pandemic, along with the overall market. However, cannabis dispensaries were quickly deemed essential businesses throughout North America and allowed to remain open. Like certain other consumer products, cannabis sales showed increased and sustained sales following the COVID outbreak. Cannabis stocks rebounded better on average than the overall market. For the period April 1, 2020 through fiscal year end June 30, 2020, YOLO gained 32.74% on market price and 31.94% based on Net Asset Value, while the S&P 500 rebounded 20.54% in the three month period.
As a specialty area of investing, cannabis stocks, as a whole, can perform with lower correlation to the overall market. Following a sell-off and underperformance in 2019 and the first few months of 2020, we are very bullish on cannabis growth prospects long term, and think they are poised for good performance in the next fiscal year with legislative and market developments.
HYPOTHETICAL GROWTH OF $10,000 INVESTMENT
For the period April 17, 2019* to June 30, 2020
24
HISTORICAL PERFORMANCE
Total Return as of June 30, 2020
1 Year | Since | |||
AdvisorShares Pure Cannabis ETF NAV | -52.76% | -50.01% | ||
AdvisorShares Pure Cannabis ETF Market Price** | -52.70% | -49.89% | ||
S&P 500 Index | 7.51% | 7.82% |
Performance data quoted represents past performance and is no guarantee of future results. Current performance may be lower or higher than the performance data quoted. Investment return and principal value will fluctuate so that an investor’s shares, when redeemed, may be worth more or less than original cost. Fund NAV returns are calculated using the Fund’s daily 4:00 p.m. NAV. Returns shown include the reinvestment of all dividends and other distributions. Index returns do not include expenses. As stated in the current prospectus, the Fund’s annual operating expense ratio (gross) and net expense ratio is 0.74%. (Actual expenses can be referenced in the Financial Highlights section later in this report.) The Fund’s advisor has agreed to waive a portion of its fees and/or reimburse expenses to the extent necessary to keep the Fund’s expenses from exceeding 0.74%. Returns less than one year are not annualized. The performance table and graph do not reflect the deduction of taxes that a shareholder would pay on Fund distributions or the redemption of Fund shares. For the Fund’s most recent month end performance, please call 1-877-843-3831.
____________
* Commencement of operations.
** The price used to calculate market return (“Market Price’’) is determined by using the closing price listed on the NYSE Arca and does not represent returns an investor would receive if shares were traded at other times. Total returns are calculated using the daily 4:00pm midpoint between the bid and offer. Shares are bought and sold at market price, not NAV and are not individually redeemed from the Fund.
The S&P 500 Index is a broad-based, unmanaged measurement of changes in stock market conditions based on the average of 500 widely held common stocks. One cannot invest directly in an index.
25
ADVISORSHARES TRUST
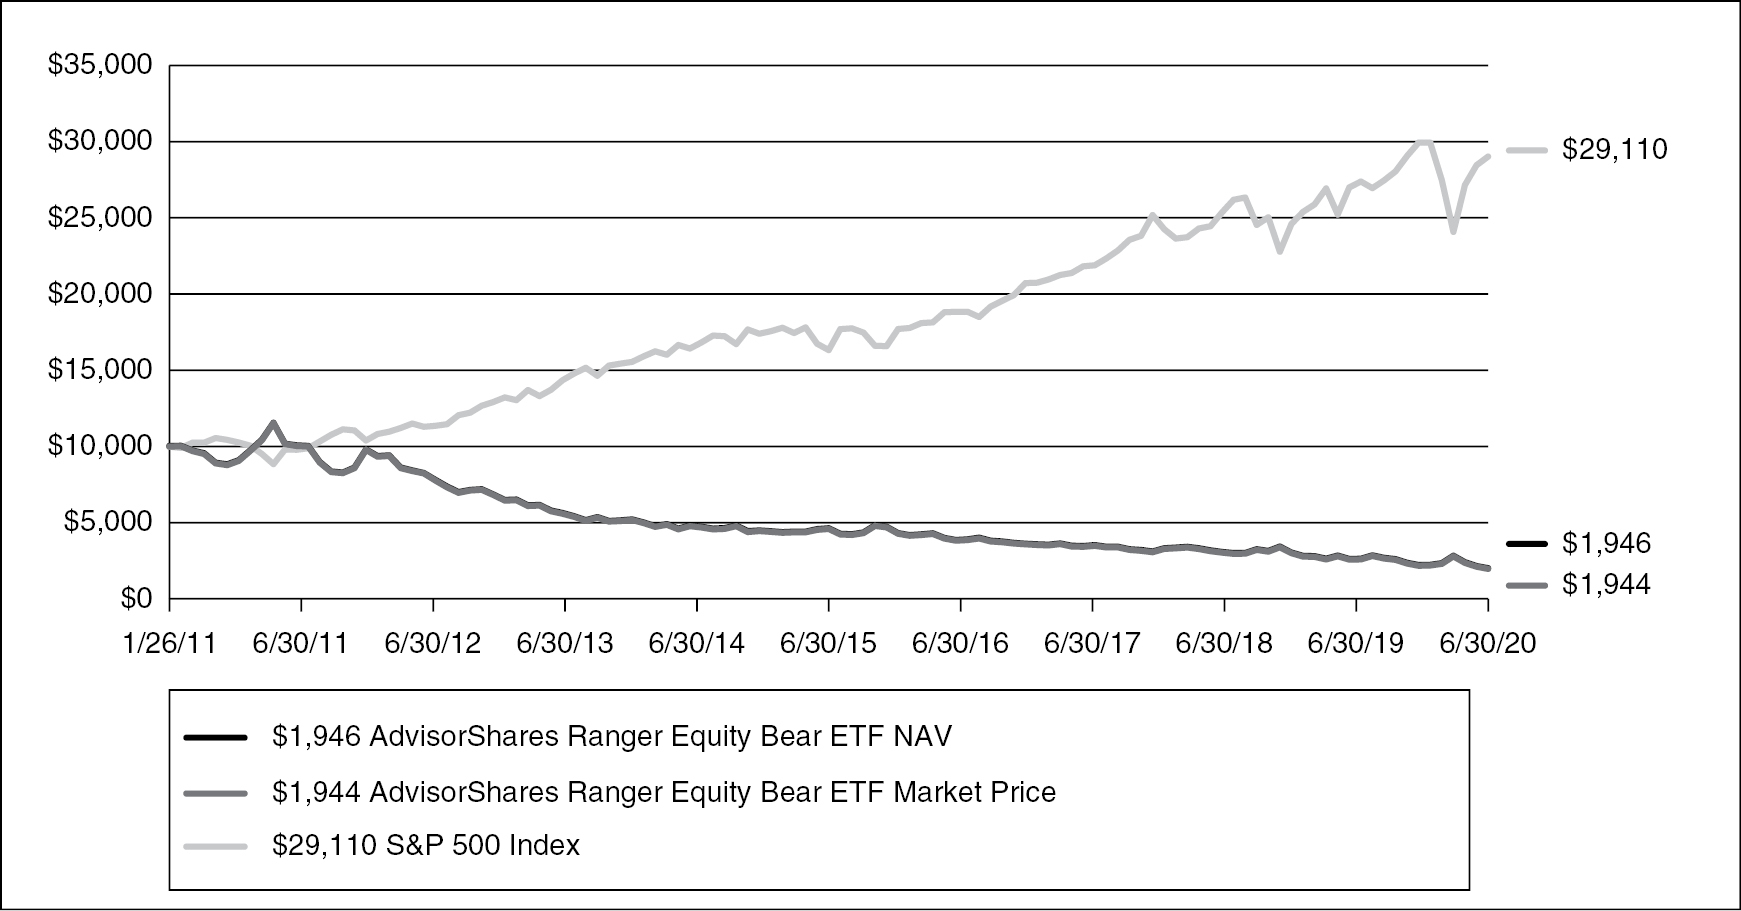
AdvisorShares Ranger Equity Bear ETF (HDGE)
The AdvisorShares Ranger Equity Bear ETF’s performance through June 30, 2020 was -23.79%. The first six months of 2020 were marked by unprecedented volatility. The declines from all-times highs near the start of the year to bear market territory represented the fastest in history. Huge influxes of liquidity led to a historical rally not seen in nine decades.
The portfolio benefitted from short positions in financially weak companies, as well as, a bearish bet on volatility near the lows. While exposure was reduced near the lows, the subsequent rally led to significant gains in the lowest quality companies, which hurt performance. However, we view this as a short-term phenomenon. We feel that eventually the market will separate long-term winners and losers in the business environment going forward and that active management may be value additive after over a decade of stocks benefitting from massive index inflows.
Our outlook remains aggressively bearish toward companies that are levered with bloated/overvalued assets and weak cash flows. While many companies may actually thrive in a COVID-19 and post-COVID-19 environment, there are plenty of companies whose entire operations are at risk. During the extensive bull market that began in 2009, share buybacks were a leading driver of stock performance. Weak cash flows may prohibit companies for share repurchases. Levered balance sheets may further prevent the use of cheap debt to reduce share count. The portfolio remains heavily short companies with poor earnings quality.
HYPOTHETICAL GROWTH OF $10,000 INVESTMENT
For the period January 26, 2011* to June 30, 2020
26
HISTORICAL PERFORMANCE
Total Return as of June 30, 2020
1 Year | 3 Year | 5 Year | Since | |||||
AdvisorShares Ranger Equity Bear ETF NAV | -23.79% | -17.18% | -14.87% | -15.94% | ||||
AdvisorShares Ranger Equity Bear ETF Market Price** | -23.94% | -17.16% | -14.88% | -15.95% | ||||
S&P 500 Index | 7.51% | 10.73% | 10.73% | 12.01% |
Performance data quoted represents past performance and is no guarantee of future results. Current performance may be lower or higher than the performance data quoted. Investment return and principal value will fluctuate so that an investor’s shares, when redeemed, may be worth more or less than original cost. Fund NAV returns are calculated using the Fund’s daily 4:00 p.m. NAV. Returns shown include the reinvestment of all dividends and other distributions. Index returns do not include expenses. As stated in the current prospectus, the Fund’s annual operating expense ratio (gross) and net expense ratio is 2.72%. (Actual expenses can be referenced in the Financial Highlights section later in this report.) The Fund’s advisor has agreed to waive a portion of its fees and/or reimburse expenses to the extent necessary to keep the Fund’s expenses from exceeding 1.85%. Returns less than one year are not annualized. The performance table and graph do not reflect the deduction of taxes that a shareholder would pay on Fund distributions or the redemption of Fund shares. For the Fund’s most recent month end performance, please call 1-877-843-3831.
____________
* Commencement of operations.
** The price used to calculate market return (“Market Price’’) is determined by using the closing price listed on the NYSE Arca and does not represent returns an investor would receive if shares were traded at other times. Total returns are calculated using the daily 4:00pm midpoint between the bid and offer. Shares are bought and sold at market price, not NAV and are not individually redeemed from the Fund.
The S&P 500 Index is a broad-based, unmanaged measurement of changes in stock market conditions based on the average of 500 widely held common stocks. One cannot invest directly in an index.
27
ADVISORSHARES TRUST
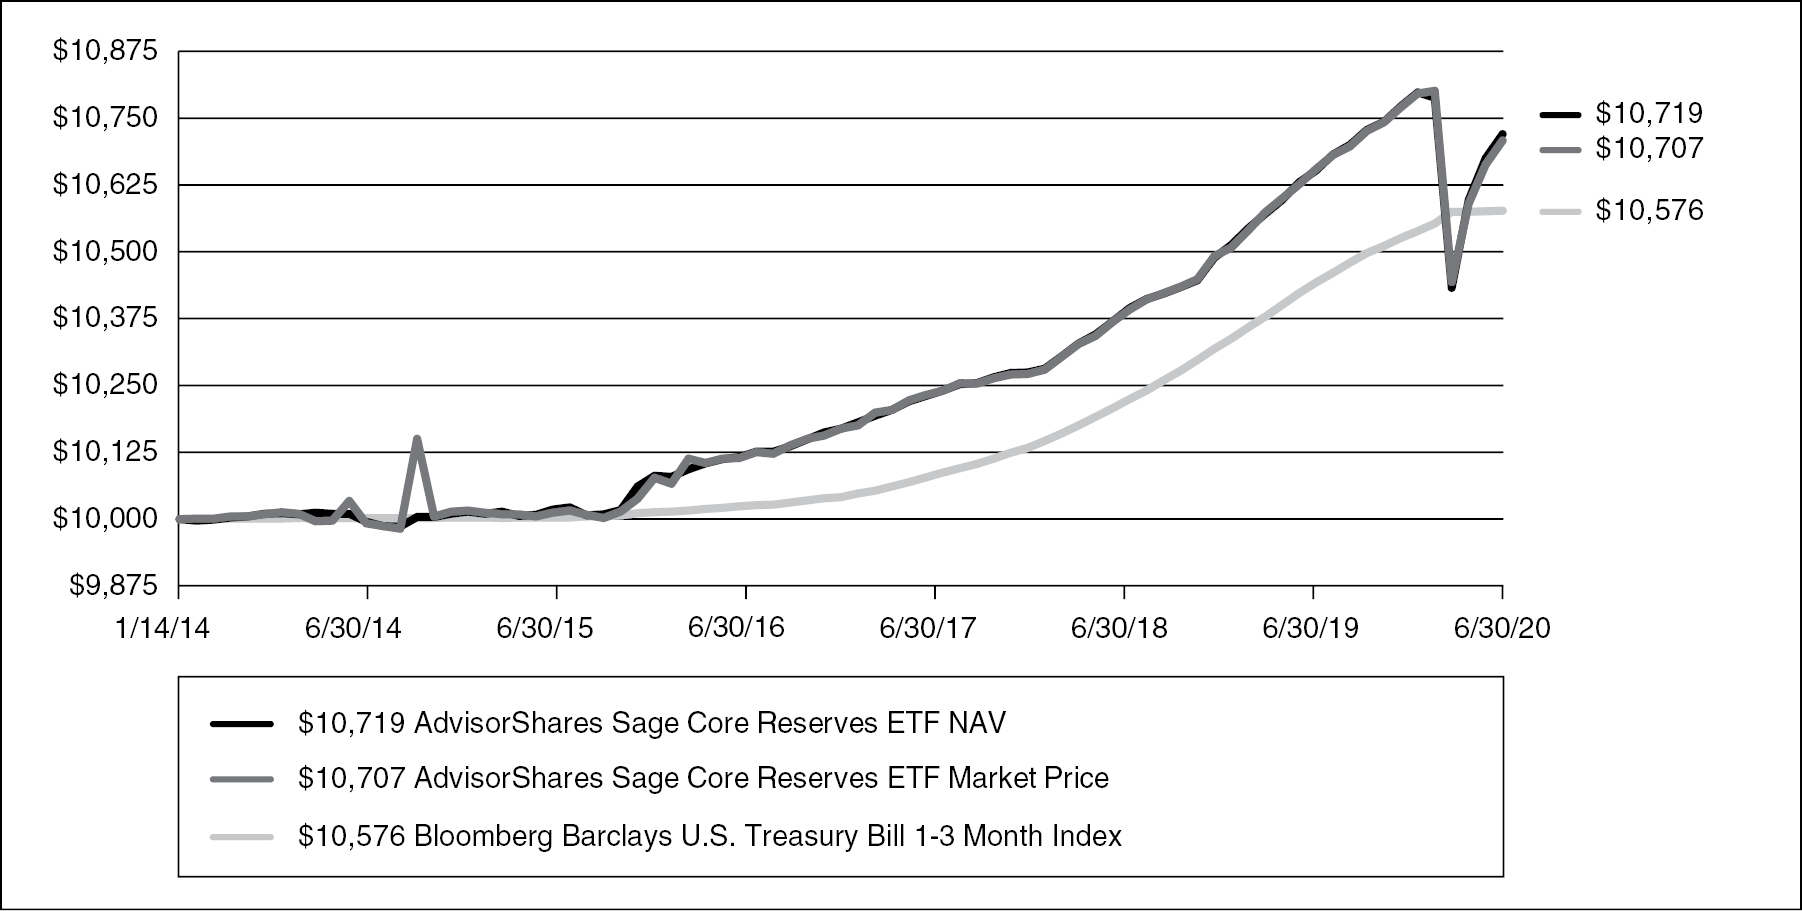
AdvisorShares Sage Core Reserves ETF (HOLD)
The AdvisorShares Core Reserves ETF (HOLD) had a NAV-based return of 0.83% and a price-based return of 0.75% during the one year period ending June 30th, 2020. It underperformed its benchmark, the Bloomberg Barclays 1-3 month T-bill Index, which returned 1.47% during the same time period.
The fund is designed to outperform the index by harvesting extra yield from both the corporate and securitized sectors. However, the volatility that the market experienced, specifically at the beginning of the Covid pandemic, caused risk-assets to severely underperform during the flight to quality. This underperformance impacted, not only the corporate sector, but rather all non-Treasury related assets. The magnitude of the spread widening was severe and expansive, impacting the breadth of the market in unison. Due to the large amount of spread product in the fund, HOLD certainly felt the brunt of this reality. HOLD did, however, have positive performance during the 12 month time period.
Looking ahead at the remainder of 2020, it will be important to monitor the policy and actions of the Federal Reserve, which have been the primary driver of returns over the past decade. The Fed’s balance sheet has increased by over $3 trillion since the beginning of the pandemic, with no end in sight to their boundless Qualitive Easing programs. While short rates are likely to remain range-bound, the curve has begun to steepen with long-end rates rising. While further steepening is likely somewhat limited in scope, the excessive amount of debt due to be issued by the Treasury will likely put pressure on the curve. The obvious uncertainty surrounds the current pandemic and how it might play out in the weeks and months ahead. The financial markets seem bent on a V shaped recovery, but only time will tell if that comes to fruition.
HYPOTHETICAL GROWTH OF $10,000 INVESTMENT
For the period January 14, 2014* to June 30, 2020
28
HISTORICAL PERFORMANCE
Total Return as of June 30, 2020
1 Year | 3 Year | 5 Year | Since | |||||
AdvisorShares Sage Core Reserves ETF NAV | 0.83% | 1.65% | 1.37% | 1.08% | ||||
AdvisorShares Sage Core Reserves ETF Market Price** | 0.75% | 1.61% | 1.35% | 1.06% | ||||
Bloomberg Barclays U.S. Treasury Bill 1-3 Month Index | 1.47% | 1.68% | 1.12% | 0.87% |
Performance data quoted represents past performance and is no guarantee of future results. Current performance may be lower or higher than the performance data quoted. Investment return and principal value will fluctuate so that an investor’s shares, when redeemed, may be worth more or less than original cost. Fund NAV returns are calculated using the Fund’s daily 4:00 p.m. NAV. Returns shown include the reinvestment of all dividends and other distributions. Index returns do not include expenses. As stated in the current prospectus, the Fund’s annual operating expense ratio (gross) is 0.65% and the net expense ratio is 0.35%. (Actual expenses can be referenced in the Financial Highlights section later in this report.) The Fund’s advisor has agreed to waive a portion of its fees and/or reimburse expenses to the extent necessary to keep the Fund’s expenses from exceeding 0.35%. Returns less than one year are not annualized. The performance table and graph do not reflect the deduction of taxes that a shareholder would pay on Fund distributions or the redemption of Fund shares. For the Fund’s most recent month end performance, please call 1-877-843-3831.
____________
* Commencement of operations.
** The price used to calculate market return (“Market Price’’) is determined by using the closing price listed on the NYSE Arca and does not represent returns an investor would receive if shares were traded at other times. Total returns are calculated using the daily 4:00pm midpoint between the bid and offer. Shares are bought and sold at market price, not NAV and are not individually redeemed from the Fund.
The Bloomberg Barclays U.S. Treasury Bill 1-3 Month Index includes all publicly issued zero-coupon U.S. Treasury Bills that have a remaining maturity of less than 3 months and more than 1 month, are rated investment grade, and have $250 million or more of outstanding face value. The Bloomberg Barclays U.S. 1-3 Month Treasury Bill Index is an unmanaged index considered representative of the performance of the U.S. Treasury Bill issued by the U.S. Government. One cannot invest directly in an index.
29
ADVISORSHARES TRUST
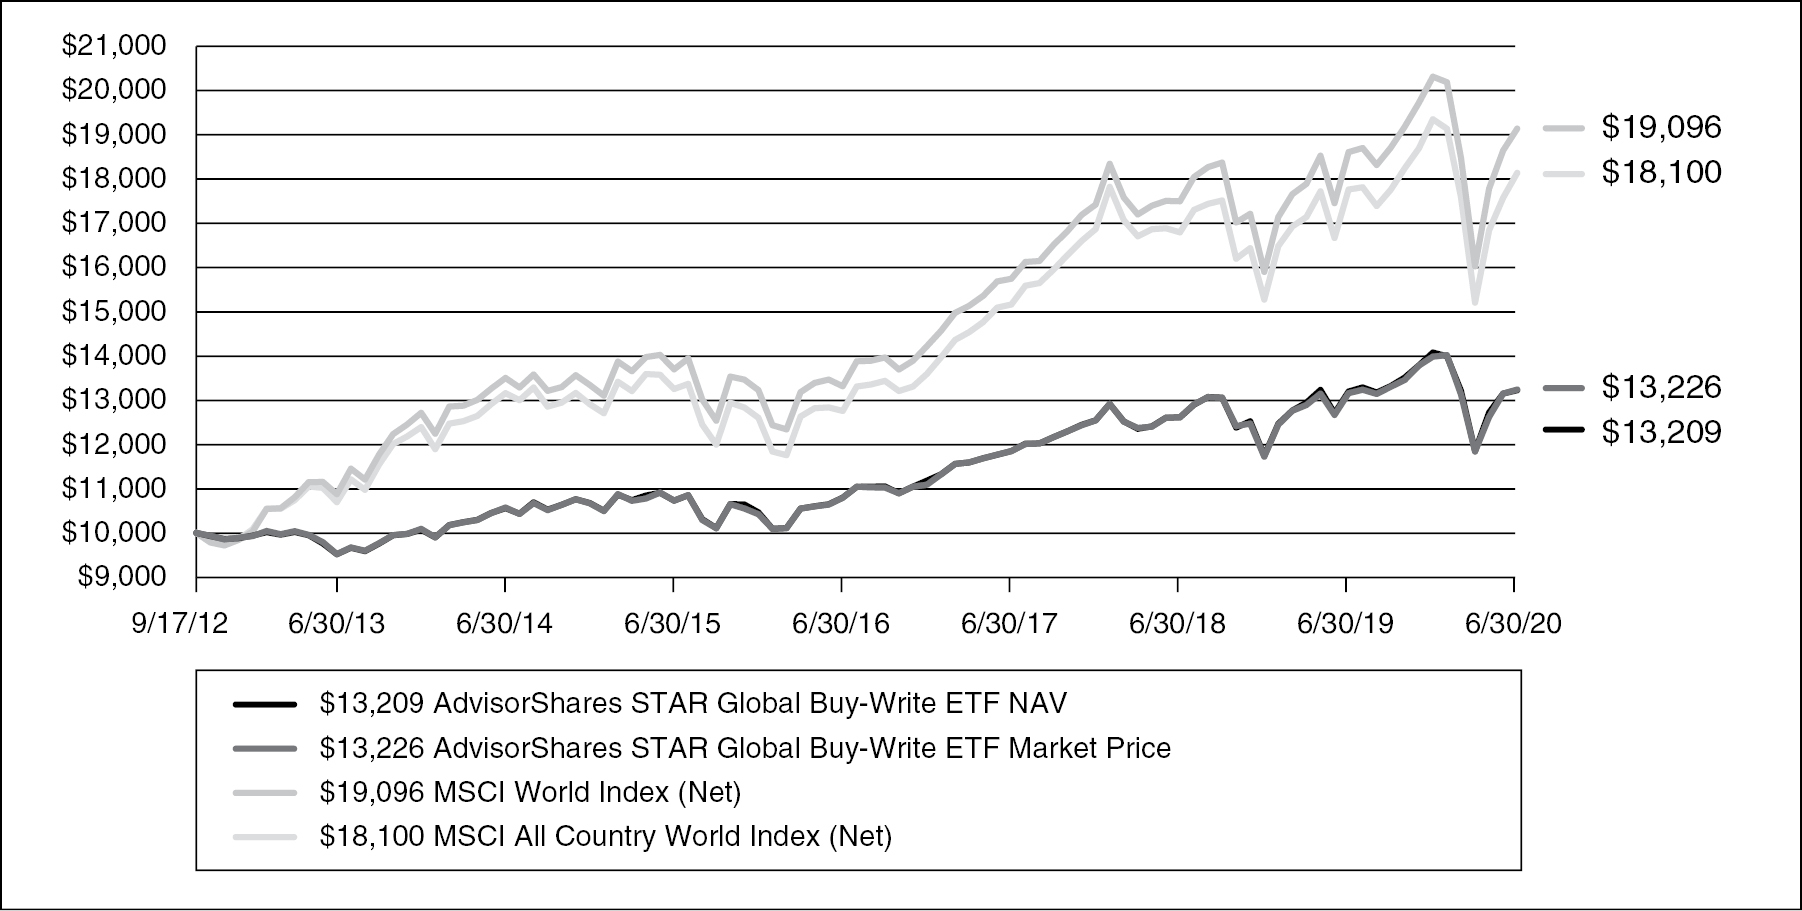
AdvisorShares STAR Global Buy-Write ETF (VEGA)
For the last 12 months ended June 30, 2020, the AdvisorShares STAR Global Buy-Write (VEGA) had a return of 0.20%, based on NAV and 0.63%, based on market price. It compared favorably to the MSCI All Country World Index which for the same period had a return of 2.11%. Other indexes commonly referenced in VEGA commentary are the CBOE S&P 500 Buy-Write Index and Bloomberg Barclays US Aggregate Bond Index, which had returns of -10.94% and 8.74%, respectively. VEGA outperformed Buy-Write Index it uses for reference given its investment mandate.
The last 12 months can be broken into two distinct sub-periods: July 2019-January 2020 and February 2020-June 2020. The first of the two periods experienced a steady rising equity market environment and VEGA benefited from it because most of VEGA’s exposure is U.S. equity-based. In addition, covered calls were written during this period to allow for extended price appreciation and foregoing excess premium. Then, in the second period beginning in mid-February 2020, all markets experienced dramatic volatility and equities suffered a dramatic price drop due to the widespread effects of COVID-19. During this second period, VEGA benefitted from both its protective puts and volatility-based reinvestment strategies. The protective puts were sold for more than four times their purchase price, adding cash to the portfolio. Additionally, when the CBOE Volatility Index (VIX) rises in conjunction with a falling market, VEGA reinvests the portfolio’s cash component into its existing equity positions. There were several instances during February and March when VEGA reinvested this cash into portfolio holdings at ever lower prices.
The most likely scenario going forward is that there will not be a quick reversion to operational normalcy in the post-COVID-19 world. Unfortunately, there continues to be negative data related to the second wave of virus through the population. Considering this, more than 40% of S&P 500 companies have pulled their quarterly or annual guidance. Markets are currently operating in a pandemic during an election year coupled with high social unrest. Volatility at this juncture appears to be a given for the remainder of 2020 and well into 2021. However, VEGA uses volatility to its advantage through the fund’s covered calls, protective puts and volatility-based reinvestment strategies. These tools may help smooth the effects that a volatile market places on a portfolio.
HYPOTHETICAL GROWTH OF $10,000 INVESTMENT
For the period September 17, 2012* to June 30, 2020
30
HISTORICAL PERFORMANCE
Total Return as of June 30, 2020
1 Year | 3 Year | 5 Year | Since | |||||
AdvisorShares STAR Global Buy-Write ETF NAV | 0.20% | 3.71% | 4.25% | 3.64% | ||||
AdvisorShares STAR Global Buy-Write ETF Market Price** | 0.63% | 3.76% | 4.27% | 3.66% | ||||
MSCI World Index (Net) | 2.84% | 6.70% | 6.90% | 8.67% | ||||
MSCI All Country World Index (Net) | 2.11% | 6.14% | 6.46% | 7.92% |
Performance data quoted represents past performance and is no guarantee of future results. Current performance may be lower or higher than the performance data quoted. Investment return and principal value will fluctuate so that an investor’s shares, when redeemed, may be worth more or less than original cost. Fund NAV returns are calculated using the Fund’s daily 4:00 p.m. NAV. Returns shown include the einvestment of all dividends and other distributions. Index returns do not include expenses. As stated in the current prospectus, the Fund’s annual operating expense ratio (gross) is 2.39% and the net expense ratio is 2.06%. (Actual expenses can be referenced in the Financial Highlights section later in this report.) The Fund’s advisor has agreed to waive a portion of its fees and/or reimburse expenses to the extent necessary to keep the Fund’s expenses from exceeding 1.85%. Returns less than one year are not annualized. The performance table and graph do not reflect the deduction of taxes that a shareholder would pay on Fund distributions or the redemption of Fund shares. For the Fund’s most recent month end performance, please call 1-877-843-3831.
____________
* Commencement of operations.
** The price used to calculate market return (“Market Price’’) is determined by using the closing price listed on the NYSE Arca and does not represent returns an investor would receive if shares were traded at other times. Total returns are calculated using the daily 4:00pm midpoint between the bid and offer. Shares are bought and sold at market price, not NAV and are not individually redeemed from the Fund.
The MSCI World Index (Net) is a free float-adjusted market capitalization weighted index that is designed to measure the equity market performance of developed markets. One cannot invest directly in an index.
The MSCI All Country World Index (Net) is an unmanaged free float-adjusted market capitalization weighted index that is designed to measure the equity market performance of developed and emerging markets. One cannot invest directly in an index.
31
ADVISORSHARES TRUST
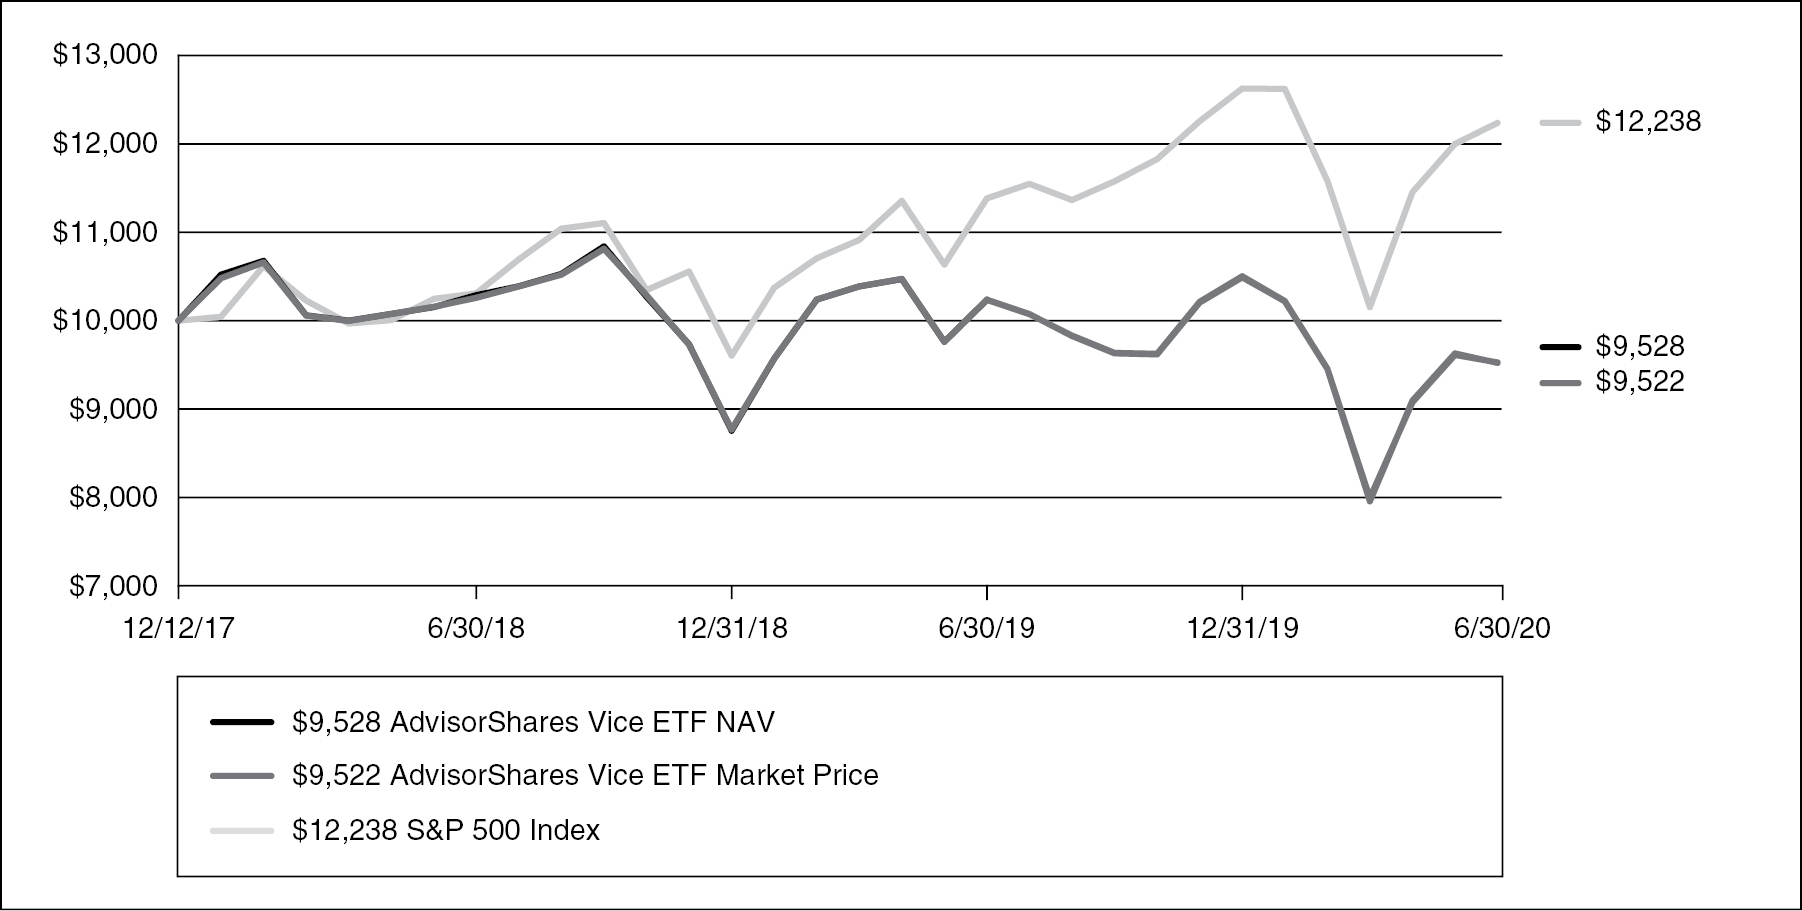
AdvisorShares Vice ETF (ACT)
The AdvisorShares Vice ETF (ACT) was launched with an inception date of December 12, 2017. For its most recent 12-month timeframe of July 1, 2019 through June 30, 2020, the Fund returned -6.99% based on market price and -6.91% based on Net Asset Value. During the same timeframe, the Standard & Poor’s 500 Index returned was positive. In the first six months of 2020, the Fund’s performance was impacted by the COVID-19 pandemic. After a low point for the past year in March, the Fund rebounded well for April through June 2020, gaining 19.68% on market price and 19.18% on its Net Asset Value.
The AdvisorShares Vice ETF focuses primarily on alcohol, tobacco and cannabis-related stocks. Its performance is subject, in large part, to the overall performance of those areas, although we aim for relative outperformance through good individual security selection and successful trading techniques. Top contributors to performance came primarily from the Fund’s largest positions in certain alcohol producers and sellers, plus pharmaceutical and healthcare companies that we hold as cannabis-related.
On the other hand, the primary drag to performance was caused by some smaller-weight holdings in “big beer” alcohol companies, alcohol-related restaurant and entertainment companies, and some cannabis-related consumer companies. During the extreme volatility of COVID, the fund did underweight restaurants and hold excess cash before more fully reinvesting months later.
The overall market seems unpredictable at this point as COVID-19 weighs on the economy. In negative or stagnant markets, alcohol, tobacco and other vice-oriented stocks can often look attractive and show their “market-resistant” qualities. We expect this Vice ETF to perform with less volatility than the overall market and to offer good growth as individuals continue to support consumer alcohol brands.
HYPOTHETICAL GROWTH OF $10,000 INVESTMENT
For the period December 12, 2017* to June 30, 2020
32
HISTORICAL PERFORMANCE
Total Return as of June 30, 2020
1 Year | Since | |||
AdvisorShares VICE ETF NAV | -6.91% | -1.88% | ||
AdvisorShares VICE ETF Market Price** | -6.99% | -1.91% | ||
S&P 500 Index | 7.51% | 8.25% |
Performance data quoted represents past performance and is no guarantee of future results. Current performance may be lower or higher than the performance data quoted. Investment return and principal value will fluctuate so that an investor’s shares, when redeemed, may be worth more or less than original cost. Fund NAV returns are calculated using the Fund’s daily 4:00 p.m. NAV. Returns shown include the reinvestment of all dividends and other distributions. Index returns do not include expenses. As stated in the current prospectus, the Fund’s annual operating expense ratio (gross) is 2.18% and the net expense ratio is 0.75%. (Actual expenses can be referenced in the Financial Highlights section later in this report.) The Fund’s advisor has agreed to waive a portion of its fees and/or reimburse expenses to the extent necessary to keep the Fund’s expenses from exceeding 0.75%. Returns less than one year are not annualized. The performance table and graph do not reflect the deduction of taxes that a shareholder would pay on Fund distributions or the redemption of Fund shares. For the Fund’s most recent month end performance, please call 1-877-843-3831.
____________
* Commencement of operations.
** The price used to calculate market return (“Market Price’’) is determined by using the closing price listed on the NYSE Arca and does not represent returns an investor would receive if shares were traded at other times. Total returns are calculated using the daily 4:00pm midpoint between the bid and offer. Shares are bought and sold at market price, not NAV and are not individually redeemed from the Fund.
The S&P 500 Index is a broad-based, unmanaged measurement of changes in stock market conditions based on the average of 500 widely held common stocks. One cannot invest directly in an index.
33
Shareholder Expense Examples (unaudited)
As a shareholder of the Fund, you incur transaction cost and ongoing costs, including management fees and other Fund expenses. The following example is intended to help you understand your ongoing costs (in dollars and cents) of investing in the Fund and to compare these costs with the ongoing costs of investing in other funds. The examples are based on an initial investment of $1,000 invested at January 1, 2020 and held for the period ended June 30, 2020, unless noted below for Funds not in operations for the full six month period.
Actual Expenses
The first line under each Fund in the table below provides information about actual account values and actual expenses. You may use the information, together with the amount you invested, to estimate the expenses that you incurred over the period. Simply divide your account value by $1,000 (for example, an $8,600 account value divided by $1,000 = 8.6), then multiply the result by the number under the heading entitled “Expenses Paid” to estimate the expenses attributable to your account during this period.
Hypothetical Example for Comparison Purposes
The second line under each Fund in the table provides information about hypothetical account values and hypothetical expenses based on the Fund’s actual expense ratio and an assumed rate of return of 5% per year before expenses, which is not the Fund’s actual return. The hypothetical account values and expenses may not be used to estimate the actual ending account balance or expenses for the period. You may use this information to compare the ongoing costs of investing in the Funds and other ETF funds. To do so, compare this 5% hypothetical example with the 5% hypothetical examples that appear in the shareholder reports of other funds.
Please note that the expenses shown in the table are meant to highlight your ongoing costs only and do not reflect any transactional costs. Therefore, the hypothetical example is useful in comparing ongoing costs only, and will not help you determine the relative total costs of owning different funds.
In addition, if these transactional costs were included, your costs would have been higher.
Fund Name | Beginning | Ending | Annualized | Expenses | |||||||
AdvisorShares Dorsey Wright ADR ETF |
|
|
| ||||||||
Actual | $ | 1,000.00 | $ | 981.50 | 1.10% | $ | 5.42 | ||||
Hypothetical (assuming a 5% return before expenses) | $ | 1,000.00 | $ | 1,019.39 | 1.10% | $ | 5.52 | ||||
AdvisorShares Dorsey Wright Alpha Equal Weight ETF |
|
|
| ||||||||
Actual | $ | 1,000.00 | $ | 817.20 | 0.99% | $ | 4.47 | ||||
Hypothetical (assuming a 5% return before expenses) | $ | 1,000.00 | $ | 1,019.94 | 0.99% | $ | 4.97 | ||||
AdvisorShares Dorsey Wright FSM All Cap World ETF(2) |
|
|
| ||||||||
Actual | $ | 1,000.00 | $ | 1,123.40 | 0.99% | $ | 5.23 | ||||
Hypothetical (assuming a 5% return before expenses) | $ | 1,000.00 | $ | 1,019.94 | 0.99% | $ | 4.97 | ||||
AdvisorShares Dorsey Wright FSM US Core ETF(2) |
|
|
| ||||||||
Actual | $ | 1,000.00 | $ | 1,094.20 | 0.99% | $ | 5.15 | ||||
Hypothetical (assuming a 5% return before expenses) | $ | 1,000.00 | $ | 1,019.94 | 0.99% | $ | 4.97 | ||||
34
ADVISORSHARES TRUST
Shareholder Expense Examples (unaudited) (continued)
Fund Name | Beginning | Ending | Annualized | Expenses | |||||||
AdvisorShares Dorsey Wright Micro-Cap ETF |
|
|
| ||||||||
Actual | $ | 1,000.00 | $ | 886.70 | 1.25% | $ | 5.86 | ||||
Hypothetical (assuming a 5% return before expenses) | $ | 1,000.00 | $ | 1,018.65 | 1.25% | $ | 6.27 | ||||
AdvisorShares Dorsey Wright Short ETF |
|
|
| ||||||||
Actual | $ | 1,000.00 | $ | 849.20 | 1.08% | $ | 4.97 | ||||
Hypothetical (assuming a 5% return before expenses) | $ | 1,000.00 | $ | 1,019.49 | 1.08% | $ | 5.42 | ||||
AdvisorShares DoubleLine Value Equity ETF |
|
|
| ||||||||
Actual | $ | 1,000.00 | $ | 884.00 | 0.90% | $ | 4.22 | ||||
Hypothetical (assuming a 5% return before expenses) | $ | 1,000.00 | $ | 1,020.39 | 0.90% | $ | 4.52 | ||||
AdvisorShares Focused Equity ETF |
|
|
| ||||||||
Actual | $ | 1,000.00 | $ | 957.50 | 0.75% | $ | 3.65 | ||||
Hypothetical (assuming a 5% return before expenses) | $ | 1,000.00 | $ | 1,021.13 | 0.75% | $ | 3.77 | ||||
AdvisorShares FolioBeyond Smart Core Bond ETF(2) |
|
|
| ||||||||
Actual | $ | 1,000.00 | $ | 986.50 | 0.95% | $ | 4.69 | ||||
Hypothetical (assuming a 5% return before expenses) | $ | 1,000.00 | $ | 1,020.14 | 0.95% | $ | 4.77 | ||||
AdvisorShares Newfleet Multi-Sector Income ETF |
|
|
| ||||||||
Actual | $ | 1,000.00 | $ | 1,005.60 | 0.75% | $ | 3.74 | ||||
Hypothetical (assuming a 5% return before expenses) | $ | 1,000.00 | $ | 1,021.13 | 0.75% | $ | 3.77 | ||||
AdvisorShares Pure Cannabis ETF |
|
|
| ||||||||
Actual | $ | 1,000.00 | $ | 870.10 | 0.74% | $ | 3.44 | ||||
Hypothetical (assuming a 5% return before expenses) | $ | 1,000.00 | $ | 1,021.18 | 0.74% | $ | 3.72 | ||||
AdvisorShares Ranger Equity Bear ETF |
|
|
| ||||||||
Actual | $ | 1,000.00 | $ | 903.60 | 1.71% | $ | 8.09 | ||||
Hypothetical (assuming a 5% return before expenses) | $ | 1,000.00 | $ | 1,016.36 | 1.71% | $ | 8.57 | ||||
AdvisorShares Sage Core Reserves ETF |
|
|
| ||||||||
Actual | $ | 1,000.00 | $ | 995.10 | 0.35% | $ | 1.74 | ||||
Hypothetical (assuming a 5% return before expenses) | $ | 1,000.00 | $ | 1,023.12 | 0.35% | $ | 1.76 | ||||
AdvisorShares STAR Global Buy-Write ETF(2) |
|
|
| ||||||||
Actual | $ | 1,000.00 | $ | 939.40 | 1.85% | $ | 8.92 | ||||
Hypothetical (assuming a 5% return before expenses) | $ | 1,000.00 | $ | 1,015.66 | 1.85% | $ | 9.27 | ||||
AdvisorShares Vice ETF |
|
|
| ||||||||
Actual | $ | 1,000.00 | $ | 907.20 | 0.99% | $ | 4.69 | ||||
Hypothetical (assuming a 5% return before expenses) | $ | 1,000.00 | $ | 1,019.94 | 0.99% | $ | 4.97 | ||||
____________
(1) Expenses are calculated using each Fund’s annualized expense ratio, multiplied by the average account value for the period, multiplied by 1842/366 (to reflect the six-month period).
(2) The Fund invests in other funds and indirectly bears its proportionate shares of fees and expenses incurred by the funds in which the Fund is invested in. These ratios do not include these indirect fees and expenses.
35
Investments | Shares | Value | |||
COMMON STOCKS — 99.7% | |||||
Apparel — 2.9% |
| ||||
LVMH Moet Hennessy Louis Vuitton SE (France)(a) | 25,024 | $ | 2,212,872 | ||
Biotechnology — 7.6% |
| ||||
Argenx SE (Netherlands)*(a) | 18,983 |
| 4,275,541 | ||
Genmab A/S (Denmark)*(a) | 44,706 |
| 1,515,086 | ||
Total Biotechnology |
| 5,790,627 | |||
Commercial Services — 8.2% |
| ||||
Experian PLC (United Kingdom)(a) | 44,176 |
| 1,553,228 | ||
New Oriental Education & Technology Group, Inc. (China)*(a) | 14,215 |
| 1,851,220 | ||
TAL Education Group (China)*(a) | 41,666 |
| 2,849,121 | ||
Total Commercial Services |
| 6,253,569 | |||
Computers — 2.4% |
| ||||
Logitech International SA (Switzerland)(b) | 27,551 |
| 1,796,876 | ||
Electric — 2.2% |
| ||||
Enel SpA (Italy)(a) | 191,488 |
| 1,641,052 | ||
Electronics — 2.7% |
| ||||
Allegion PLC | 20,125 |
| 2,057,177 | ||
Food — 2.6% |
| ||||
Nestle SA (Switzerland)(a) | 17,624 |
| 1,946,395 | ||
Gas — 1.9% |
| ||||
National Grid PLC (United Kingdom)(a)(b) | 23,632 |
| 1,435,408 | ||
Healthcare – Products — 3.9% | |||||
Koninklijke Philips NV (Netherlands)* | 29,674 |
| 1,389,930 | ||
Smith & Nephew PLC (United Kingdom)(a)(b) | 40,531 |
| 1,545,042 | ||
Total Healthcare – Products |
| 2,934,972 | |||
Healthcare – Services — 2.7% | |||||
ICON PLC (Ireland)* | 12,037 |
| 2,027,753 | ||
Internet — 12.7% |
| ||||
21Vianet Group, Inc. (China)*(a)(b) | 79,612 |
| 1,899,542 | ||
MercadoLibre, Inc. (Argentina)* | 4,537 |
| 4,472,439 | ||
Tencent Holdings Ltd. (China)(a)(b) | 26,388 |
| 1,688,832 | ||
Vipshop Holdings Ltd. (China)*(a) | 80,158 |
| 1,595,946 | ||
Total Internet |
| 9,656,759 | |||
Investments | Shares | Value | |||
COMMON STOCKS (continued) | |||||
Media — 1.8% |
| ||||
Thomson Reuters Corp. (Canada) | 19,751 | $ | 1,342,475 | ||
Mining — 12.1% |
| ||||
AngloGold Ashanti Ltd. (Australia)(a) | 120,233 |
| 3,545,671 | ||
Gold Fields Ltd. (South Africa)(a) | 409,449 |
| 3,848,821 | ||
Sibanye Stillwater Ltd. (South Africa)*(a) | 206,275 |
| 1,784,279 | ||
Total Mining |
| 9,178,771 | |||
Pharmaceuticals — 14.9% |
| ||||
AstraZeneca PLC (United Kingdom)(a) | 43,902 |
| 2,321,977 | ||
Dr Reddy’s Laboratories Ltd. (India)(a) | 34,600 |
| 1,834,146 | ||
Galapagos NV (Belgium)*(a)(b) | 18,324 |
| 3,615,142 | ||
Novartis AG (Switzerland)(a) | 17,616 |
| 1,538,581 | ||
Novo Nordisk A/S (Denmark)(a) | 30,839 |
| 2,019,338 | ||
Total Pharmaceuticals |
| 11,329,184 | |||
Semiconductors — 5.5% |
| ||||
ASML Holding NV (Netherlands) | 7,578 |
| 2,788,931 | ||
NXP Semiconductors NV (Netherlands) | 12,385 |
| 1,412,386 | ||
Total Semiconductors |
| 4,201,317 | |||
Software — 2.1% |
| ||||
SAP SE (Germany)(a)(b) | 11,211 |
| 1,569,540 | ||
Telecommunications — 9.2% |
| ||||
Chunghwa Telecom Co., Ltd. (Taiwan)(a) | 35,816 |
| 1,410,076 | ||
Mobile TeleSystems PJSC (Russia)(a) | 160,369 |
| 1,473,791 | ||
Nice Ltd. (Israel)*(a)(b) | 21,884 |
| 4,141,328 | ||
Total Telecommunications |
| 7,025,195 | |||
Transportation — 4.3% |
| ||||
ZTO Express Cayman, Inc. (China)(a) | 88,346 |
| 3,243,182 | ||
Total Common Stocks |
| 75,643,124 | |||
MONEY MARKET FUND — 0.4% | |||||
Invesco Government & Agency Portfolio – Private Investment Class, 0.01%(c) (Cost $312,749) | 312,749 |
| 312,749 | ||
See accompanying Notes to Financial Statements.
36
ADVISORSHARES DORSEY WRIGHT ADR ETF June 30, 2020 |
Investments | Principal | Value | ||||
REPURCHASE AGREEMENTS — 11.5%(d) | ||||||
Citigroup Global Markets, Inc., dated 06/30/20, due 07/01/20, 0.09%, total to be received $2,033,225, (collateralized by various U.S. Government Agency Obligations, 0.50% – 7.50%, 07/31/21 – 05/20/70, totaling $2,065,743) | $ | 2,033,220 | $ | 2,033,220 | ||
HSBC Securities USA, Inc., dated 06/30/20, due 07/01/20, 0.08%, total to be received $2,033,225, (collateralized by various U.S. Government Agency Obligations, 0.00% – 4.50%, 05/15/44 – 03/20/50, totaling $2,068,343) |
| 2,033,220 |
| 2,033,220 | ||
JP Morgan Securities LLC, dated 06/30/20, due 07/01/20, 0.07%, total to be received $602,739, (collateralized by various U.S. Government Agency Obligations, 0.00% – 2.50%, 10/08/20 – 04/30/23, totaling $614,520) |
| 602,738 |
| 602,738 | ||
Nomura Securities International, Inc., dated 06/30/20, due 07/01/20, 0.09%, total to be received $2,033,225, (collateralized by various U.S. Government Agency Obligations, 2.45% – 6.00%, 07/01/27 – 10/20/68, totaling $2,067,509) |
| 2,033,220 |
| 2,033,220 | ||
Investments | Principal | Value | |||||
REPURCHASE AGREEMENTS (continued) |
| ||||||
RBC Dominion Securities, Inc., dated 06/30/20, due 07/01/20, 0.09%, total to be received $2,033,225, (collateralized by various U.S. Government Agency Obligations, 0.00% – 7.00%, 07/31/20 – 07/01/50, totaling $2,069,023) | $ | 2,033,220 | $ | 2,033,220 |
| ||
Total Repurchase Agreements |
|
| 8,735,618 |
| |||
Total Investments — 111.6% |
|
| 84,691,491 |
| |||
Liabilities in Excess of Other Assets — (11.6%) |
|
| (8,812,169 | ) | |||
Net Assets — 100.0% |
| $ | 75,879,322 |
| |||
____________
PLC — Public Limited Company
* Non-income producing security.
(a) American Depositary Receipt.
(b) All or a portion of security is on loan. The aggregate market value of the securities on loan is $13,819,242; the aggregate market value of the collateral held by the fund is $13,985,470. The aggregate market value of the collateral includes non-cash U.S. Treasury securities collateral having a value of $5,249,852.
(c) Rate shown reflects the 7-day yield as of June 30, 2020.
(d) Collateral received from brokers for securities lending was invested in these short-term investments.
See accompanying Notes to Financial Statements.
37
ADVISORSHARES DORSEY WRIGHT ADR ETF June 30, 2020 |
Fair Value Measurements
The following is a summary of the inputs used, as of June 30, 2020, in valuing the Fund’s assets and liabilities carried at fair value. These inputs are summarized in three broad levels. Level 1 includes quoted prices in active markets for identical securities. Level 2 includes other significant observable inputs (including quoted prices for similar securities, interest rates, prepayment speeds and credit risk). Level 3 includes significant unobservable inputs (including the Fund’s own assumptions in determining the fair value of investments). The level assigned to the securities valuations may not be an indication of the risk or liquidity associated with investing in those securities.
Assets | Level 1 | Level 2 | Level 3 | Total | ||||||||
Common Stocks | $ | 75,643,124 | $ | — | $ | — | $ | 75,643,124 | ||||
Money Market Fund |
| 312,749 |
| — |
| — |
| 312,749 | ||||
Repurchase Agreements |
| — |
| 8,735,618 |
| — |
| 8,735,618 | ||||
Total | $ | 75,955,873 | $ | 8,735,618 | $ | — | $ | 84,691,491 | ||||
SUMMARY OF SCHEDULE OF INVESTMENTS
% of | |||
Apparel | 2.9 | % | |
Biotechnology | 7.6 |
| |
Commercial Services | 8.2 |
| |
Computers | 2.4 |
| |
Electric | 2.2 |
| |
Electronics | 2.7 |
| |
Food | 2.6 |
| |
Gas | 1.9 |
| |
Healthcare – Products | 3.9 |
| |
Healthcare – Services | 2.7 |
| |
Internet | 12.7 |
| |
Media | 1.8 |
| |
Mining | 12.1 |
| |
Pharmaceuticals | 14.9 |
| |
Semiconductors | 5.5 |
| |
Software | 2.1 |
| |
Telecommunications | 9.2 |
| |
Transportation | 4.3 |
| |
Money Market Fund | 0.4 |
| |
Repurchase Agreements | 11.5 |
| |
Total Investments | 111.6 |
| |
Liabilities in Excess of Other Assets | (11.6 | ) | |
Net Assets | 100.0 | % | |
See accompanying Notes to Financial Statements.
38
Investments | Shares | Value | |||
COMMON STOCKS — 99.2% |
| ||||
Advertising — 3.1% |
| ||||
Trade Desk, Inc. (The), Class A*(a) | 2,978 | $ | 1,210,557 | ||
Apparel — 2.3% |
| ||||
NIKE, Inc., Class B | 9,377 |
| 919,415 | ||
Computers — 5.4% |
| ||||
Apple, Inc. | 2,928 |
| 1,068,135 | ||
EPAM Systems, Inc.* | 4,109 |
| 1,035,509 | ||
Total Computers |
| 2,103,644 | |||
Distribution/Wholesale — 2.4% | |||||
Pool Corp. | 3,541 |
| 962,692 | ||
Diversified Financial Services — 2.4% | |||||
Mastercard, Inc., Class A | 3,134 |
| 926,724 | ||
Electronics — 2.4% |
| ||||
Mettler-Toledo International, Inc.* | 1,187 |
| 956,188 | ||
Entertainment — 2.6% |
| ||||
Eldorado Resorts, Inc.*(a) | 25,508 |
| 1,021,850 | ||
Healthcare – Products — 14.3% | |||||
Danaher Corp. | 5,666 |
| 1,001,919 | ||
Edwards Lifesciences Corp.* | 12,060 |
| 833,466 | ||
IDEXX Laboratories, Inc.* | 3,036 |
| 1,002,366 | ||
Masimo Corp.* | 3,986 |
| 908,768 | ||
Repligen Corp.* | 7,301 |
| 902,477 | ||
West Pharmaceutical Services, Inc. | 4,303 |
| 977,512 | ||
Total Healthcare – Products |
| 5,626,508 | |||
Healthcare – Services — 6.9% | |||||
Amedisys, Inc.* | 4,795 |
| 951,999 | ||
Humana, Inc. | 2,216 |
| 859,254 | ||
UnitedHealth Group, Inc. | 3,082 |
| 909,036 | ||
Total Healthcare – Services |
| 2,720,289 | |||
Household Products/Wares — 2.5% | |||||
Helen of Troy Ltd.* | 5,160 |
| 972,970 | ||
Internet — 2.6% |
| ||||
Amazon.com, Inc.* | 376 |
| 1,037,316 | ||
Pharmaceuticals — 4.8% |
| ||||
Becton Dickinson and Co. | 3,717 |
| 889,367 | ||
Horizon Therapeutics PLC* | 18,107 |
| 1,006,387 | ||
Total Pharmaceuticals |
| 1,895,754 | |||
Investments | Shares | Value | |||
COMMON STOCKS (continued) | |||||
Retail — 20.4% |
| ||||
Best Buy Co., Inc. | 11,871 | $ | 1,035,982 | ||
Burlington Stores, Inc.* | 4,525 |
| 891,108 | ||
Carvana Co.* | 10,635 |
| 1,278,327 | ||
Chipotle Mexican Grill, Inc.* | 935 |
| 983,957 | ||
Dollar General Corp. | 4,881 |
| 929,879 | ||
Domino’s Pizza, Inc. | 2,440 |
| 901,434 | ||
Home Depot, Inc. (The) | 3,755 |
| 940,665 | ||
RH*(a) | 4,200 |
| 1,045,380 | ||
Total Retail |
| 8,006,732 | |||
Semiconductors — 7.9% |
| ||||
Broadcom, Inc. | 3,213 |
| 1,014,055 | ||
Monolithic Power Systems, Inc. | 4,575 |
| 1,084,275 | ||
NVIDIA Corp. | 2,672 |
| 1,015,119 | ||
Total Semiconductors |
| 3,113,449 | |||
Software — 19.2% |
| ||||
ANSYS, Inc.* | 3,269 |
| 953,665 | ||
Cadence Design Systems, Inc.* | 10,160 |
| 974,954 | ||
Fiserv, Inc.* | 8,979 |
| 876,530 | ||
Five9, Inc.* | 8,953 |
| 990,829 | ||
Paycom Software, Inc.* | 3,180 |
| 984,941 | ||
ServiceNow, Inc.* | 2,420 |
| 980,245 | ||
Tyler Technologies, Inc.* | 2,491 |
| 864,078 | ||
Veeva Systems, Inc., Class A* | 3,983 |
| 933,695 | ||
Total Software |
| 7,558,937 | |||
Total Common Stocks |
| 39,033,025 | |||
MONEY MARKET FUND — 0.8% | |||||
BlackRock Liquidity Funds Treasury Trust Fund Portfolio, Institutional Class, 0.10%(b) | 332,884 |
| 332,884 | ||
See accompanying Notes to Financial Statements.
39
ADVISORSHARES DORSEY WRIGHT ALPHA EQUAL WEIGHT ETF June 30, 2020 |
Investments | Shares/ | Value | |||||
REPURCHASE AGREEMENT — 0.6%(c) |
| ||||||
RBC Dominion Securities, Inc., dated 06/30/20, due 07/01/20, 0.09%, total to be received $218,121, (collateralized by various U.S. Government Agency Obligations, 0.00% – 7.00%, 07/31/20 – 07/01/50, totaling $221,961) (Cost $218,120) | $ | 218,120 | $ | 218,120 |
| ||
Total Investments — 100.6% |
|
| 39,584,029 |
| |||
Liabilities in Excess of Other Assets — (0.6%) |
|
| (250,674 | ) | |||
Net Assets — 100.0% |
| $ | 39,333,355 |
| |||
____________
PLC — Public Limited Company
* Non-income producing security.
(a) All or a portion of security is on loan. The aggregate market value of the securities on loan is $2,177,883; the aggregate market value of the collateral held by the fund is $2,230,167. The aggregate market value of the collateral includes non-cash U.S. Treasury securities collateral having a value of $2,012,047.
(b) Rate shown reflects the 7-day yield as of June 30, 2020.
(c) Collateral received from brokers for securities lending was invested in these short-term investments.
Fair Value Measurements
The following is a summary of the inputs used, as of June 30, 2020, in valuing the Fund’s assets and liabilities carried at fair value. These inputs are summarized in three broad levels. Level 1 includes quoted prices in active markets for identical securities. Level 2 includes other significant observable inputs (including quoted prices for similar securities, interest rates, prepayment speeds and credit risk). Level 3 includes significant unobservable inputs (including the Fund’s own assumptions in determining the fair value of investments). The level assigned to the securities valuations may not be an indication of the risk or liquidity associated with investing in those securities.
Assets | Level 1 | Level 2 | Level 3 | Total | ||||||||
Common Stocks | $ | 39,033,025 | $ | — | $ | — | $ | 39,033,025 | ||||
Money Market Fund |
| 332,884 |
| — |
| — |
| 332,884 | ||||
Repurchase Agreement |
| — |
| 218,120 |
| — |
| 218,120 | ||||
Total | $ | 39,365,909 | $ | 218,120 | $ | — | $ | 39,584,029 | ||||
See accompanying Notes to Financial Statements.
40
ADVISORSHARES DORSEY WRIGHT ALPHA EQUAL WEIGHT ETF June 30, 2020 |
SUMMARY OF SCHEDULE OF INVESTMENTS
% of | |||
Advertising | 3.1 | % | |
Apparel | 2.3 |
| |
Computers | 5.4 |
| |
Distribution/Wholesale | 2.4 |
| |
Diversified Financial Services | 2.4 |
| |
Electronics | 2.4 |
| |
Entertainment | 2.6 |
| |
Healthcare – Products | 14.3 |
| |
Healthcare – Services | 6.9 |
| |
Household Products/Wares | 2.5 |
| |
Internet | 2.6 |
| |
Pharmaceuticals | 4.8 |
| |
Retail | 20.4 |
| |
Semiconductors | 7.9 |
| |
Software | 19.2 |
| |
Money Market Fund | 0.8 |
| |
Repurchase Agreement | 0.6 |
| |
Total Investments | 100.6 |
| |
Liabilities in Excess of Other Assets | (0.6 | ) | |
Net Assets | 100.0 | % | |
See accompanying Notes to Financial Statements.
41
Investments | Shares/ | Value | ||||
EXCHANGE TRADED FUNDS — 99.9% | ||||||
Equity Fund — 99.9% |
|
| ||||
Invesco QQQ Trust Series 1(a) |
| 151,600 | $ | 37,536,160 | ||
iShares Morningstar Large-Cap Growth ETF |
| 153,740 |
| 36,048,955 | ||
Total Exchange Traded Funds |
|
| 73,585,115 | |||
MONEY MARKET FUND — 0.1% | ||||||
BlackRock Liquidity Funds Treasury Trust Fund Portfolio, Institutional Class, 0.06%(b) (Cost $103,275) |
| 103,275 |
| 103,275 | ||
REPURCHASE AGREEMENTS — 30.3%(c) | ||||||
Citigroup Global Markets, Inc., dated 06/30/20, due 07/01/20, 0.09%, total to be received $5,195,520, (collateralized by various U.S. Government Agency Obligations, 0.50% – 7.50%, 07/31/21 – 05/20/70, totaling $5,278,612) | $ | 5,195,507 |
| 5,195,507 | ||
Daiwa Capital Markets America, dated 06/30/20, due 07/01/20, 0.10%, total to be received $5,195,521, (collateralized by various U.S. Government Agency Obligations, 0.00% – 6.50%, 07/28/20 – 03/01/52, totaling $5,285,346) |
| 5,195,507 |
| 5,195,507 | ||
HSBC Securities USA, Inc., dated 06/30/20, due 07/01/20, 0.08%, total to be received $5,280,344, (collateralized by various U.S. Government Agency Obligations, 0.00% – 4.50%, 05/15/44 – 03/20/50, totaling $5,371,547) |
| 5,280,332 |
| 5,280,332 | ||
Investments |
| Value | |||||
REPURCHASE AGREEMENTS (continued) |
| ||||||
JP Morgan Securities LLC, dated 06/30/20, due 07/01/20, 0.07%, total to be received $1,455,363, (collateralized by various U.S. Government Agency Obligations, 0.00% – 2.50%, 10/08/20 – 04/30/23, totaling $1,483,808) | $ | 1,455,360 | $ | 1,455,360 |
| ||
RBC Dominion Securities, Inc., dated 06/30/20, due 07/01/20, 0.09%, total to be received $5,195,520, (collateralized by various U.S. Government Agency Obligations, 0.00% – 7.00%, 07/31/20 – 07/01/50, totaling $5,286,996) |
| 5,195,507 |
| 5,195,507 |
| ||
Total Repurchase Agreements |
| 22,322,213 |
| ||||
Total Investments — 130.3% |
| 96,010,603 |
| ||||
Liabilities in Excess of Other Assets — (30.3%) |
|
| (22,325,807 | ) | |||
Net Assets — 100.0% |
| $ | 73,684,796 |
| |||
____________
ETF — Exchange Traded Fund
(a) All or a portion of security is on loan. The aggregate market value of the securities on loan is $36,785,437; the aggregate market value of the collateral held by the fund is $36,813,069. The aggregate market value of the collateral includes non-cash U.S. Treasury securities collateral having a value of $14,490,856.
(b) Rate shown reflects the 7-day yield as of June 30, 2020.
(c) Collateral received from brokers for securities lending was invested in these short-term investments.
See accompanying Notes to Financial Statements.
42
ADVISORSHARES DORSEY WRIGHT FSM ALL CAP WORLD ETF June 30, 2020 |
Fair Value Measurements
The following is a summary of the inputs used, as of June 30, 2020, in valuing the Fund’s assets and liabilities carried at fair value. These inputs are summarized in three broad levels. Level 1 includes quoted prices in active markets for identical securities. Level 2 includes other significant observable inputs (including quoted prices for similar securities, interest rates, prepayment speeds and credit risk). Level 3 includes significant unobservable inputs (including the Fund’s own assumptions in determining the fair value of investments). The level assigned to the securities valuations may not be an indication of the risk or liquidity associated with investing in those securities.
Assets | Level 1 | Level 2 | Level 3 | Total | ||||||||
Exchange Traded Funds | $ | 73,585,115 | $ | — | $ | — | $ | 73,585,115 | ||||
Money Market Fund |
| 103,275 |
| — |
| — |
| 103,275 | ||||
Repurchase Agreements |
| — |
| 22,322,213 |
| — |
| 22,322,213 | ||||
Total | $ | 73,688,390 | $ | 22,322,213 | $ | — | $ | 96,010,603 | ||||
SUMMARY OF SCHEDULE OF INVESTMENTS
% of | |||
Equity Fund | 99.9 | % | |
Money Market Fund | 0.1 |
| |
Repurchase Agreements | 30.3 |
| |
Total Investments | 130.3 |
| |
Liabilities in Excess of Other Assets | (30.3 | ) | |
Net Assets | 100.0 | % | |
See accompanying Notes to Financial Statements.
43
Investments | Shares/ | Value | ||||
EXCHANGE TRADED FUNDS — 99.5% | ||||||
Equity Fund — 99.5% |
|
| ||||
Invesco QQQ Trust |
| 95,510 | $ | 23,648,276 | ||
iShares Edge MSCI USA Momentum |
| 174,845 |
| 22,904,695 | ||
Total Exchange Traded Funds (Cost $43,273,431) |
|
| 46,552,971 | |||
MONEY MARKET FUND — 0.5% | ||||||
BlackRock Liquidity Funds Treasury Trust Fund Portfolio, Institutional Class, 0.06%(b) |
| 224,948 |
| 224,948 | ||
REPURCHASE AGREEMENTS — 48.9%(c) | ||||||
Citigroup Global Markets, Inc., dated 06/30/20, due 07/01/20, 0.09%, total to be received $5,320,840, (collateralized by various U.S. Government Agency Obligations, 0.50% – 7.50%, 07/31/21 – 05/20/70, totaling $5,405,937) | $ | 5,320,827 |
| 5,320,827 | ||
HSBC Securities USA, Inc., dated 06/30/20, due 07/01/20, 0.08%, total to be received $5,320,839, (collateralized by various U.S. Government Agency Obligations, 0.00% – 4.50%, 05/15/44 – 03/20/50, totaling $5,412,741) |
| 5,320,827 |
| 5,320,827 | ||
JP Morgan Securities LLC, dated 06/30/20, due 07/01/20, 0.07%, total to be received $1,577,336, (collateralized by various U.S. Government Agency Obligations, 0.00% – 2.50%, 10/08/20 – 04/30/23, totaling $1,608,165) |
| 1,577,333 |
| 1,577,333 | ||
| Principal | Value | |||||
REPURCHASE AGREEMENTS (continued) |
| ||||||
Nomura Securities International, Inc., dated 06/30/20, due 07/01/20, 0.09%, total to be received $5,320,840, (collateralized by various U.S. Government Agency Obligations, 2.45% – 6.00%, 07/01/27 – 10/20/68, totaling $5,410,558) | $ | 5,320,827 | $ | 5,320,827 |
| ||
RBC Dominion Securities, Inc., dated 06/30/20, due 07/01/20, 0.09%, total to be received $5,320,840, (collateralized by various U.S. Government Agency Obligations, 0.00% – 7.00%, 07/31/20 – 07/01/50, totaling $5,414,523) |
| 5,320,827 |
| 5,320,827 |
| ||
Total Repurchase Agreements |
| 22,860,641 |
| ||||
Total Investments — 148.9% |
| 69,638,560 |
| ||||
Liabilities in Excess of Other Assets — (48.9%) |
|
| (22,871,311 | ) | |||
Net Assets — 100.0% |
| $ | 46,767,249 |
| |||
____________
ETF — Exchange Traded Fund
(a) All or a portion of security is on loan. The aggregate market value of the securities on loan is $23,044,589; the aggregate market value of the collateral held by the fund is $23,057,159. The aggregate market value of the collateral includes non-cash U.S. Treasury securities collateral having a value of $196,518.
(b) Rate shown reflects the 7-day yield as of June 30, 2020.
(c) Collateral received from brokers for securities lending was invested in these short-term investments.
See accompanying Notes to Financial Statements.
44
ADVISORSHARES DORSEY WRIGHT FSM US CORE ETF June 30, 2020 |
Fair Value Measurements
The following is a summary of the inputs used, as of June 30, 2020, in valuing the Fund’s assets and liabilities carried at fair value. These inputs are summarized in three broad levels. Level 1 includes quoted prices in active markets for identical securities. Level 2 includes other significant observable inputs (including quoted prices for similar securities, interest rates, prepayment speeds and credit risk). Level 3 includes significant unobservable inputs (including the Fund’s own assumptions in determining the fair value of investments). The level assigned to the securities valuations may not be an indication of the risk or liquidity associated with investing in those securities.
Assets | Level 1 | Level 2 | Level 3 | Total | ||||||||
Exchange Traded Funds | $ | 46,552,971 | $ | — | $ | — | $ | 46,552,971 | ||||
Money Market Fund |
| 224,948 |
| — |
| — |
| 224,948 | ||||
Repurchase Agreements |
| — |
| 22,860,641 |
| — |
| 22,860,641 | ||||
Total | $ | 46,777,919 | $ | 22,860,641 | $ | — | $ | 69,638,560 | ||||
SUMMARY OF SCHEDULE OF INVESTMENTS
% of | |||
Equity Fund | 99.5 | % | |
Money Market Fund | 0.5 |
| |
Repurchase Agreements | 48.9 |
| |
Total Investments | 148.9 |
| |
Liabilities in Excess of Other Assets | (48.9 | ) | |
Net Assets | 100.0 | % | |
See accompanying Notes to Financial Statements.
45
Investments | Shares | Value | |||
COMMON STOCKS — 99.7% |
| ||||
Auto Parts & Equipment — 1.0% | |||||
Shyft Group, Inc. (The) | 555 | $ | 9,346 | ||
XPEL, Inc.* | 741 |
| 11,589 | ||
Total Auto Parts & Equipment |
| 20,935 | |||
Banks — 2.3% |
| ||||
Bank First Corp.(a) | 177 |
| 11,346 | ||
Bank of Marin Bancorp | 202 |
| 6,733 | ||
Luther Burbank Corp. | 943 |
| 9,430 | ||
Red River Bancshares, Inc. | 212 |
| 9,305 | ||
Stock Yards Bancorp, Inc. | 273 |
| 10,974 | ||
Total Banks |
| 47,788 | |||
Beverages — 1.1% |
| ||||
Celsius Holdings, Inc.* | 1,934 |
| 22,763 | ||
Biotechnology — 17.9% |
| ||||
Adverum Biotechnologies, Inc.* | 742 |
| 15,493 | ||
Anavex Life Sciences Corp.* | 2,361 |
| 11,616 | ||
Applied Genetic Technologies Corp.* | 2,050 |
| 11,357 | ||
Ardelyx, Inc.* | 1,703 |
| 11,785 | ||
Aspira Women’s Health, Inc.*(a) | 2,556 |
| 9,815 | ||
Assembly Biosciences, Inc.* | 510 |
| 11,893 | ||
Atreca, Inc., Class A*(a) | 541 |
| 11,512 | ||
BrainStorm Cell Therapeutics, Inc.*(a) | 1,500 |
| 16,815 | ||
Catabasis Pharmaceuticals, Inc.* | 1,414 |
| 9,092 | ||
Compugen Ltd. (Israel)* | 1,990 |
| 29,890 | ||
Cue Biopharma, Inc.* | 635 |
| 15,564 | ||
Kodiak Sciences, Inc.*(a) | 913 |
| 49,411 | ||
Liquidia Technologies, Inc.*(a) | 1,060 |
| 8,925 | ||
Mersana Therapeutics, Inc.* | 1,259 |
| 29,461 | ||
Molecular Templates, Inc.* | 972 |
| 13,404 | ||
NantKwest, Inc.*(a) | 1,668 |
| 20,483 | ||
Ovid therapeutics, Inc.*(a) | 1,336 |
| 9,846 | ||
Prevail Therapeutics, Inc.* | 653 |
| 9,730 | ||
Scholar Rock Holding Corp.*(a) | 577 |
| 10,507 | ||
Twist Bioscience Corp.* | 265 |
| 12,004 | ||
Veracyte, Inc.*(a) | 693 |
| 17,949 | ||
Veru, Inc.* | 2,867 |
| 9,576 | ||
XBiotech, Inc.* | 691 |
| 9,474 | ||
Xenon Pharmaceuticals, Inc. (Canada)* | 674 |
| 8,452 | ||
Zymeworks, Inc. (Canada)*(a) | 399 |
| 14,392 | ||
Total Biotechnology |
| 378,446 | |||
Investments | Shares | Value | |||
COMMON STOCKS (continued) |
| ||||
Building Materials — 0.5% |
| ||||
LSI Industries, Inc. | 1,518 | $ | 9,821 | ||
Chemicals — 0.5% |
| ||||
Oil-Dri Corp. of America | 286 |
| 9,924 | ||
Commercial Services — 2.6% |
| ||||
American Public Education, Inc.* | 303 |
| 8,969 | ||
PFSweb, Inc.* | 1,357 |
| 9,065 | ||
R1 RCM, Inc.* | 1,279 |
| 14,261 | ||
Universal Technical Institute, Inc.* | 1,340 |
| 9,313 | ||
Vectrus, Inc.* | 279 |
| 13,707 | ||
Total Commercial Services |
| 55,315 | |||
Computers — 2.4% |
| ||||
ExOne Co. (The)*(a) | 1,090 |
| 9,319 | ||
iCAD, Inc.* | 1,208 |
| 12,068 | ||
Kornit Digital Ltd. (Israel)* | 381 |
| 20,338 | ||
Mitek Systems, Inc.* | 1,034 |
| 9,937 | ||
Total Computers |
| 51,662 | |||
Cosmetics/Personal Care — 0.5% | |||||
elf Beauty, Inc.* | 566 |
| 10,794 | ||
Diversified Financial Services — 1.7% | |||||
Freedom Holding Corp. NV (Kazakhstan)* | 538 |
| 10,055 | ||
Hamilton Lane, Inc., Class A | 249 |
| 16,775 | ||
I3 Verticals, Inc., Class A* | 311 |
| 9,408 | ||
Total Diversified Financial Services |
| 36,238 | |||
Electric — 1.5% |
| ||||
Ameresco, Inc., Class A*(a) | 798 |
| 22,168 | ||
Genie Energy Ltd., Class B | 1,197 |
| 8,810 | ||
Total Electric |
| 30,978 | |||
Electrical Components & Equipment — 1.4% | |||||
Novanta, Inc.* | 281 |
| 30,002 | ||
Electronics — 3.4% |
| ||||
Akoustis Technologies, Inc.*(a) | 1,208 |
| 10,014 | ||
Camtek Ltd. (Israel) | 1,152 |
| 14,492 | ||
CyberOptics Corp.* | 480 |
| 15,461 | ||
RADA Electronic Industries Ltd. (Israel)* | 1,561 |
| 10,209 | ||
Turtle Beach Corp.* | 719 |
| 10,584 | ||
Wrap Technologies, Inc.*(a) | 1,091 |
| 11,434 | ||
Total Electronics |
| 72,194 | |||
See accompanying Notes to Financial Statements.
46
ADVISORSHARES DORSEY WRIGHT MICRO-CAP ETF June 30, 2020 |
Investments | Shares | Value | |||
COMMON STOCKS (continued) |
| ||||
Energy – Alternate Sources — 0.5% | |||||
FutureFuel Corp. | 942 | $ | 11,257 | ||
Engineering & Construction — 1.6% | |||||
Construction Partners, Inc., Class A*(a) | 736 |
| 13,071 | ||
Great Lakes Dredge & Dock Corp.* | 1,223 |
| 11,325 | ||
IES Holdings, Inc.* | 418 |
| 9,685 | ||
Total Engineering & Construction |
| 34,081 | |||
Entertainment — 0.5% |
| ||||
Accel Entertainment, Inc.*(a) | 993 |
| 9,563 | ||
Environmental Control — 3.0% | |||||
Casella Waste Systems, Inc., Class A* | 924 |
| 48,159 | ||
Energy Recovery, Inc.*(a) | 1,109 |
| 8,423 | ||
Sharps Compliance Corp.*(a) | 1,068 |
| 7,508 | ||
Total Environmental Control |
| 64,090 | |||
Food — 1.9% |
| ||||
Ingles Markets, Inc., Class A | 261 |
| 11,241 | ||
Landec Corp.* | 932 |
| 7,419 | ||
Natural Grocers by Vitamin Cottage, Inc. | 711 |
| 10,580 | ||
SpartanNash Co. | 538 |
| 11,432 | ||
Total Food |
| 40,672 | |||
Forest Products & Paper — 1.1% | |||||
Clearwater Paper Corp.* | 380 |
| 13,729 | ||
P H Glatfelter Co. | 652 |
| 10,465 | ||
Total Forest Products & Paper |
| 24,194 | |||
Healthcare – Products — 3.0% | |||||
Castle Biosciences, Inc.* | 264 |
| 9,950 | ||
CytoSorbents Corp.*(a) | 913 |
| 9,039 | ||
iRadimed Corp.* | 414 |
| 9,609 | ||
OrthoPediatrics Corp.*(a) | 188 |
| 8,227 | ||
Utah Medical Products, Inc. | 101 |
| 8,951 | ||
Zynex, Inc.*(a) | 728 |
| 18,105 | ||
Total Healthcare – Products |
| 63,881 | |||
Healthcare – Services — 1.4% | |||||
Addus HomeCare Corp.* | 183 |
| 16,939 | ||
Vapotherm, Inc.* | 301 |
| 12,338 | ||
Total Healthcare – Services |
| 29,277 | |||
Investments | Shares | Value | |||
COMMON STOCKS (continued) |
| ||||
Holding Companies – Diversified — 0.5% | |||||
Collier Creek Holdings, Class A* | 784 | $ | 10,741 | ||
Home Furnishings — 1.0% |
| ||||
Universal Electronics, Inc.* | 207 |
| 9,692 | ||
VOXX International Corp.* | 2,004 |
| 11,583 | ||
Total Home Furnishings |
| 21,275 | |||
Insurance — 3.2% |
| ||||
Goosehead Insurance, Inc., Class A* | 270 |
| 20,293 | ||
HCI Group, Inc.(a) | 220 |
| 10,160 | ||
Kinsale Capital Group, Inc. | 245 |
| 38,026 | ||
Total Insurance |
| 68,479 | |||
Internet — 5.0% |
| ||||
Allot Ltd. (Israel)* | 840 |
| 8,795 | ||
ChannelAdvisor Corp.* | 730 |
| 11,563 | ||
EverQuote, Inc., Class A*(a) | 789 |
| 45,888 | ||
TechTarget, Inc.* | 445 |
| 13,363 | ||
Tucows, Inc., Class A*(a) | 169 |
| 9,687 | ||
US Auto Parts Network, Inc.* | 1,889 |
| 16,359 | ||
Total Internet |
| 105,655 | |||
Investment Companies — 0.4% | |||||
Newtek Business Services Corp. | 413 |
| 7,525 | ||
Leisure Time — 1.8% |
| ||||
Clarus Corp. | 990 |
| 11,464 | ||
Nautilus, Inc.* | 1,500 |
| 13,905 | ||
Vista Outdoor, Inc.* | 940 |
| 13,583 | ||
Total Leisure Time |
| 38,952 | |||
Metal Fabricate/Hardware — 1.1% | |||||
Northwest Pipe Co.* | 397 |
| 9,953 | ||
Omega Flex, Inc. | 115 |
| 12,167 | ||
Total Metal Fabricate/Hardware |
| 22,120 | |||
Miscellaneous Manufacturing — 0.9% | |||||
Smith & Wesson Brands, Inc.* | 912 |
| 19,626 | ||
Oil & Gas — 0.5% |
| ||||
Sprague Resources LP | 710 |
| 11,183 | ||
Packaging & Containers — 0.5% | |||||
UFP Technologies, Inc.* | 255 |
| 11,235 | ||
See accompanying Notes to Financial Statements.
47
ADVISORSHARES DORSEY WRIGHT MICRO-CAP ETF June 30, 2020 |
Investments | Shares | Value | |||
COMMON STOCKS (continued) |
| ||||
Pharmaceuticals — 7.4% |
| ||||
Aeglea BioTherapeutics, Inc.* | 1,157 | $ | 10,702 | ||
Corbus Pharmaceuticals Holdings, Inc.*(a) | 1,351 |
| 11,335 | ||
Cytokinetics, Inc.*(a) | 712 |
| 16,782 | ||
Heska Corp.* | 113 |
| 10,528 | ||
Kadmon Holdings, Inc.* | 2,421 |
| 12,396 | ||
Kala Pharmaceuticals, Inc.*(a) | 1,105 |
| 11,614 | ||
Lifevantage Corp.* | 668 |
| 9,031 | ||
Mirum Pharmaceuticals, Inc.*(a) | 550 |
| 10,703 | ||
Neoleukin Therapeutics, Inc.* | 795 |
| 13,197 | ||
NeuBase Therapeutics, Inc.*(a) | 1,578 |
| 13,855 | ||
Ocular Therapeutix, Inc.*(a) | 1,646 |
| 13,711 | ||
Relmada Therapeutics, Inc.*(a) | 240 |
| 10,740 | ||
Spero Therapeutics, Inc.* | 850 |
| 11,500 | ||
Total Pharmaceuticals |
| 156,094 | |||
REITS — 2.7% |
| ||||
Community Healthcare Trust, Inc. | 277 |
| 11,329 | ||
Dynex Capital, Inc. | 457 |
| 6,535 | ||
Farmland Partners, Inc. | 1,418 |
| 9,713 | ||
Gladstone Land Corp. | 614 |
| 9,738 | ||
Global Medical REIT, Inc. | 1,004 |
| 11,376 | ||
UMH Properties, Inc. | 626 |
| 8,094 | ||
Total REITS |
| 56,785 | |||
Retail — 3.1% |
| ||||
Aspen Aerogels, Inc.* | 1,391 |
| 9,153 | ||
El Pollo Loco Holdings, Inc.*(a) | 677 |
| 9,993 | ||
GrowGeneration Corp.*(a) | 1,843 |
| 12,606 | ||
PetMed Express, Inc. | 311 |
| 11,084 | ||
Sportsman’s Warehouse Holdings, Inc.* | 1,556 |
| 22,173 | ||
Total Retail |
| 65,009 | |||
Semiconductors — 3.7% |
| ||||
ACM Research, Inc., Class A*(a) | 271 |
| 16,900 | ||
Atomera, Inc.*(a) | 1,134 |
| 10,206 | ||
Axcelis Technologies, Inc.* | 396 |
| 11,029 | ||
AXT, Inc.* | 1,784 |
| 8,492 | ||
CEVA, Inc.* | 305 |
| 11,413 | ||
DSP Group, Inc.* | 663 |
| 10,528 | ||
Photronics, Inc.* | 781 |
| 8,692 | ||
Total Semiconductors |
| 77,260 | |||
Investments | Shares | Value | |||
COMMON STOCKS (continued) |
| ||||
Software — 11.0% |
| ||||
American Software, Inc., Class A | 690 | $ | 10,874 | ||
AppFolio, Inc., Class A* | 254 |
| 41,328 | ||
Daily Journal Corp.*(a) | 40 |
| 10,800 | ||
Digital Turbine, Inc.* | 1,706 |
| 21,444 | ||
eGain Corp.* | 1,023 |
| 11,366 | ||
Five9, Inc.* | 363 |
| 40,173 | ||
Magic Software Enterprises Ltd. (Israel) | 897 |
| 10,136 | ||
MTBC, Inc.* | 1,235 |
| 10,238 | ||
PDF Solutions, Inc.* | 534 |
| 10,445 | ||
Rosetta Stone, Inc.* | 550 |
| 9,273 | ||
Sapiens International Corp. NV (Israel) | 671 |
| 18,775 | ||
Sciplay Corp., Class A* | 762 |
| 11,301 | ||
Simulations Plus, Inc. | 217 |
| 12,981 | ||
Veritone, Inc.*(a) | 822 |
| 12,215 | ||
Total Software |
| 231,349 | |||
Telecommunications — 5.3% |
| ||||
A10 Networks, Inc.* | 1,474 |
| 10,038 | ||
Anterix, Inc.* | 227 |
| 10,292 | ||
AudioCodes Ltd. (Israel) | 1,190 |
| 37,830 | ||
Calix, Inc.* | 1,140 |
| 16,986 | ||
Consolidated Communications Holdings, Inc.* | 1,466 |
| 9,925 | ||
Neonode, Inc.* | 1,364 |
| 11,580 | ||
NeoPhotonics Corp.* | 941 |
| 8,356 | ||
PCTEL, Inc.* | 1,039 |
| 6,941 | ||
Total Telecommunications |
| 111,948 | |||
Transportation — 0.7% |
| ||||
CryoPort, Inc.*(a) | 467 |
| 14,127 | ||
Water — 1.1% |
| ||||
Middlesex Water Co. | 198 |
| 13,302 | ||
York Water Co. (The) | 211 |
| 10,119 | ||
Total Water |
| 23,421 | |||
Total Common Stocks |
| 2,106,659 | |||
MONEY MARKET FUND — 2.1% | |||||
STIT – Government & Agency Portfolio, Institutional Class, | 44,250 |
| 44,250 | ||
See accompanying Notes to Financial Statements.
48
ADVISORSHARES DORSEY WRIGHT MICRO-CAP ETF June 30, 2020 |
Investments | Principal | Value | |||||
REPURCHASE AGREEMENTS — 13.1%(c) |
| ||||||
BofA Securities, Inc., dated 06/30/20, due 07/01/20, 0.07%, total to be received $26,942, (collateralized by various U.S. Government Agency Obligations, 0.13% – 5.00%, 10/15/24 – 02/15/48, totaling $27,435) | $ | 26,942 | $ | 26,942 |
| ||
Citigroup Global Markets, Inc., dated 06/30/20, due 07/01/20, 0.09%, total to be received $249,001, (collateralized by various U.S. Government Agency Obligations, 0.50% – 7.50%, 07/31/21 – 05/20/70, totaling $252,983) |
| 249,000 |
| 249,000 |
| ||
Total Repurchase Agreements |
|
| 275,942 |
| |||
Total Investments — 114.9% (Cost $1,931,077) |
|
| 2,426,851 |
| |||
Liabilities in Excess of Other Assets — (14.9%) |
|
| (315,054 | ) | |||
Net Assets — 100.0% |
| $ | 2,111,797 |
| |||
____________
LP — Limited Partnership
REITS — Real Estate Investment Trusts
* Non-income producing security.
(a) All or a portion of security is on loan. The aggregate market value of the securities on loan is $508,908; the aggregate market value of the collateral held by the fund is $516,946. The aggregate market value of the collateral includes non-cash U.S. Treasury securities collateral having a value of $241,004.
(b) Rate shown reflects the 7-day yield as of June 30, 2020.
(c) Collateral received from brokers for securities lending was invested in these short-term investments.
See accompanying Notes to Financial Statements.
49
ADVISORSHARES DORSEY WRIGHT MICRO-CAP ETF June 30, 2020 |
Fair Value Measurements
The following is a summary of the inputs used, as of June 30, 2020, in valuing the Fund’s assets and liabilities carried at fair value. These inputs are summarized in three broad levels. Level 1 includes quoted prices in active markets for identical securities. Level 2 includes other significant observable inputs (including quoted prices for similar securities, interest rates, prepayment speeds and credit risk). Level 3 includes significant unobservable inputs (including the Fund’s own assumptions in determining the fair value of investments). The level assigned to the securities valuations may not be an indication of the risk or liquidity associated with investing in those securities.
Assets | Level 1 | Level 2 | Level 3 | Total | ||||||||
Common Stocks | $ | 2,106,659 | $ | — | $ | — | $ | 2,106,659 | ||||
Money Market Fund |
| 44,250 |
| — |
| — |
| 44,250 | ||||
Repurchase Agreements |
| — |
| 275,942 |
| — |
| 275,942 | ||||
Total | $ | 2,150,909 | $ | 275,942 | $ | — | $ | 2,426,851 | ||||
SUMMARY OF SCHEDULE OF INVESTMENTS
% of | |||
Auto Parts & Equipment | 1.0 | % | |
Banks | 2.3 |
| |
Beverages | 1.1 |
| |
Biotechnology | 17.9 |
| |
Building Materials | 0.5 |
| |
Chemicals | 0.5 |
| |
Commercial Services | 2.6 |
| |
Computers | 2.4 |
| |
Cosmetics/Personal Care | 0.5 |
| |
Diversified Financial Services | 1.7 |
| |
Electric | 1.5 |
| |
Electrical Components & Equipment | 1.4 |
| |
Electronics | 3.4 |
| |
Energy – Alternate Sources | 0.5 |
| |
Engineering & Construction | 1.6 |
| |
Entertainment | 0.5 |
| |
Environmental Control | 3.0 |
| |
Food | 1.9 |
| |
Forest Products & Paper | 1.1 |
| |
Healthcare – Products | 3.0 |
| |
Healthcare – Services | 1.4 |
| |
Holding Companies – Diversified | 0.5 |
| |
SUMMARY OF SCHEDULE OF INVESTMENTS (continued)
% of | |||
Home Furnishings | 1.0 | % | |
Insurance | 3.2 |
| |
Internet | 5.0 |
| |
Investment Companies | 0.4 |
| |
Leisure Time | 1.8 |
| |
Metal Fabricate/Hardware | 1.1 |
| |
Miscellaneous Manufacturing | 0.9 |
| |
Oil & Gas | 0.5 |
| |
Packaging & Containers | 0.5 |
| |
Pharmaceuticals | 7.4 |
| |
REITS | 2.7 |
| |
Retail | 3.1 |
| |
Semiconductors | 3.7 |
| |
Software | 11.0 |
| |
Telecommunications | 5.3 |
| |
Transportation | 0.7 |
| |
Water | 1.1 |
| |
Money Market Fund | 2.1 |
| |
Repurchase Agreements | 13.1 |
| |
Total Investments | 114.9 |
| |
Liabilities in Excess of Other Assets | (14.9 | ) | |
Net Assets | 100.0 | % | |
See accompanying Notes to Financial Statements.
50
Investments | Shares | Value | |||||
EXCHANGE TRADED FUND — 15.2% |
|
|
| ||||
Debt Fund — 15.2% |
|
|
| ||||
AdvisorShares Sage Core Reserves ETF† | 175,000 |
| $ | 17,212,125 |
| ||
MONEY MARKET FUND — 85.3% |
|
|
| ||||
STIT – Government & Agency Portfolio, Institutional Class, 0.09%(a) | 96,503,312 |
|
| 96,503,312 |
| ||
Total Investments Before Securities Sold, Not Yet Purchased |
|
| 113,715,437 |
| |||
Securities Sold, Not Yet Purchased — (97.2)%(b) |
| ||||||
COMMON STOCKS — (97.2)% |
|
|
| ||||
Aerospace/Defense — (3.0)% |
|
|
| ||||
Boeing Co. (The) | (5,894 | ) |
| (1,080,370 | ) | ||
Hexcel Corp. | (29,045 | ) |
| (1,313,415 | ) | ||
Spirit AeroSystems Holdings, Inc., Class A | (43,855 | ) |
| (1,049,889 | ) | ||
Total Aerospace/Defense |
|
| (3,443,674 | ) | |||
Airlines — (3.3)% |
|
|
| ||||
Alaska Air Group, Inc. | (29,687 | ) |
| (1,076,451 | ) | ||
American Airlines Group, Inc. | (94,519 | ) |
| (1,235,363 | ) | ||
United Airlines Holdings, Inc.* | (42,531 | ) |
| (1,471,998 | ) | ||
Total Airlines |
|
| (3,783,812 | ) | |||
Apparel — (2.2)% |
|
|
| ||||
PVH Corp. | (21,599 | ) |
| (1,037,832 | ) | ||
Tapestry, Inc. | (59,823 | ) |
| (794,449 | ) | ||
Under Armour, Inc., Class C* | (79,957 | ) |
| (706,820 | ) | ||
Total Apparel |
|
| (2,539,101 | ) | |||
Auto Parts & Equipment — (1.3)% |
|
|
| ||||
Goodyear Tire & Rubber Co. (The) | (158,341 | ) |
| (1,416,360 | ) | ||
Banks — (9.5)% |
|
|
| ||||
CIT Group, Inc. | (62,162 | ) |
| (1,288,618 | ) | ||
Comerica, Inc. | (21,153 | ) |
| (805,929 | ) | ||
First Horizon National Corp. | (113,269 | ) |
| (1,128,159 | ) | ||
Hancock Whitney Corp. | (49,372 | ) |
| (1,046,686 | ) | ||
IBERIABANK Corp. | (23,246 | ) |
| (1,058,623 | ) | ||
PacWest Bancorp | (55,167 | ) |
| (1,087,342 | ) | ||
Synovus Financial Corp. | (49,030 | ) |
| (1,006,586 | ) | ||
Investments | Shares | Value | |||||
COMMON STOCKS (continued) |
| ||||||
Banks (continued) |
|
|
| ||||
Texas Capital Bancshares, Inc.* | (7,673 | ) | $ | (236,866 | ) | ||
Webster Financial Corp. | (35,556 | ) |
| (1,017,257 | ) | ||
Wells Fargo & Co. | (41,279 | ) |
| (1,056,742 | ) | ||
Wintrust Financial Corp. | (24,062 | ) |
| (1,049,585 | ) | ||
Total Banks |
|
| (10,782,393 | ) | |||
Biotechnology — (1.9)% |
| ||||||
Bluebird Bio, Inc.* | (15,938 | ) |
| (972,856 | ) | ||
Sage Therapeutics, Inc.* | (29,135 | ) |
| (1,211,433 | ) | ||
Total Biotechnology |
|
| (2,184,289 | ) | |||
Building Materials — (1.0)% |
|
|
| ||||
JELD-WEN Holding, Inc.* | (70,701 | ) |
| (1,138,993 | ) | ||
|
|
| |||||
Chemicals — (1.9)% |
|
|
| ||||
CF Industries Holdings, Inc. | (40,197 | ) |
| (1,131,144 | ) | ||
Mosaic Co. (The) | (84,410 | ) |
| (1,055,969 | ) | ||
Total Chemicals |
|
| (2,187,113 | ) | |||
Coal — (0.8)% |
| ||||||
Peabody Energy Corp. | (309,220 | ) |
| (890,554 | ) | ||
|
|
| |||||
Commercial Services — (1.8)% |
| ||||||
Brink’s Co. (The) | (26,483 | ) |
| (1,205,241 | ) | ||
Sabre Corp. | (108,074 | ) |
| (871,077 | ) | ||
Total Commercial Services |
|
| (2,076,318 | ) | |||
Computers — (2.6)% |
| ||||||
DXC Technology Co. | (49,486 | ) |
| (816,519 | ) | ||
Hewlett Packard Enterprise Co. | (115,682 | ) |
| (1,125,586 | ) | ||
NCR Corp.* | (56,433 | ) |
| (977,419 | ) | ||
Total Computers |
|
| (2,919,524 | ) | |||
Cosmetics/Personal Care — (0.6)% |
| ||||||
Coty, Inc., Class A | (160,663 | ) |
| (718,164 | ) | ||
Distribution/Wholesale — (1.1)% |
| ||||||
Univar Solutions, Inc.* | (74,253 | ) |
| (1,251,906 | ) | ||
Diversified Financial Services — (3.1)% |
|
|
| ||||
Alliance Data Systems Corp. | (20,119 | ) |
| (907,769 | ) | ||
Discover Financial Services | (23,175 | ) |
| (1,160,836 | ) | ||
Invesco Ltd. | (130,278 | ) |
| (1,401,791 | ) | ||
Total Diversified Financial Services |
|
| (3,470,396 | ) | |||
See accompanying Notes to Financial Statements.
51
ADVISORSHARES DORSEY WRIGHT SHORT ETF June 30, 2020 |
Investments | Shares | Value | |||||
COMMON STOCKS (continued) |
| ||||||
Engineering & Construction — (1.2)% |
| ||||||
Fluor Corp. | (113,979 | ) | $ | (1,376,866 | ) | ||
Entertainment — (2.9)% |
| ||||||
Cinemark Holdings, Inc. | (67,779 | ) |
| (782,847 | ) | ||
Scientific Games Corp.* | (99,296 | ) |
| (1,535,116 | ) | ||
Six Flags Entertainment Corp. | (48,080 | ) |
| (923,617 | ) | ||
Total Entertainment |
|
| (3,241,580 | ) | |||
Food — (2.0)% |
| ||||||
Performance Food Group Co.* | (46,612 | ) |
| (1,358,274 | ) | ||
US Foods Holding Corp.* | (46,507 | ) |
| (917,118 | ) | ||
Total Food |
|
| (2,275,392 | ) | |||
Gas — (0.8)% |
|
|
| ||||
UGI Corp. | (28,338 | ) |
| (901,148 | ) | ||
Healthcare – Products — (1.1)% |
| ||||||
Cantel Medical Corp. | (26,946 | ) |
| (1,191,822 | ) | ||
Healthcare – Services — (0.8)% |
| ||||||
MEDNAX, Inc.* | (49,765 | ) |
| (850,981 | ) | ||
Insurance — (4.9)% |
| ||||||
American Financial Group, Inc. | (17,606 | ) |
| (1,117,277 | ) | ||
American International Group, Inc. | (40,564 | ) |
| (1,264,785 | ) | ||
Cincinnati Financial Corp. | (17,231 | ) |
| (1,103,301 | ) | ||
Lincoln National Corp. | (30,272 | ) |
| (1,113,707 | ) | ||
Unum Group | (55,396 | ) |
| (919,020 | ) | ||
Total Insurance |
|
| (5,518,090 | ) | |||
Internet — (1.5)% |
| ||||||
Expedia Group, Inc. | (11,529 | ) |
| (947,684 | ) | ||
TripAdvisor, Inc. | (41,191 | ) |
| (783,041 | ) | ||
Total Internet |
|
| (1,730,725 | ) | |||
Iron/Steel — (0.8)% |
| ||||||
United States Steel Corp. | (121,279 | ) |
| (875,634 | ) | ||
Leisure Time — (1.6)% |
| ||||||
Carnival Corp. | (43,399 | ) |
| (712,612 | ) | ||
Royal Caribbean Cruises Ltd. | (21,314 | ) |
| (1,072,094 | ) | ||
Total Leisure Time |
|
| (1,784,706 | ) | |||
Lodging — (1.0)% |
|
|
| ||||
MGM Resorts International | (69,751 | ) |
| (1,171,817 | ) | ||
Machinery – Construction & Mining — (1.2)% |
| ||||||
Terex Corp. | (70,653 | ) |
| (1,326,157 | ) | ||
Investments | Shares | Value | |||||
COMMON STOCKS (continued) |
| ||||||
Machinery – Diversified — (0.8)% |
| ||||||
Middleby Corp. (The)* | (11,374 | ) | $ | (897,864 | ) | ||
Media — (1.5)% |
| ||||||
ViacomCBS, Inc., Class B | (72,652 | ) |
| (1,694,245 | ) | ||
Mining — (0.8)% |
| ||||||
Alcoa Corp.* | (82,948 | ) |
| (932,335 | ) | ||
Miscellaneous Manufacturing — (0.8)% |
| ||||||
Textron, Inc. | (27,861 | ) |
| (916,905 | ) | ||
Office/Business Equipment — (0.8)% |
| ||||||
Xerox Holdings Corp. | (59,946 | ) |
| (916,574 | ) | ||
Oil & Gas — (14.3)% |
| ||||||
Antero Resources Corp.* | (329,841 | ) |
| (837,796 | ) | ||
Cimarex Energy Co. | (44,020 | ) |
| (1,210,110 | ) | ||
Concho Resources, Inc. | (17,849 | ) |
| (919,224 | ) | ||
Continental Resources, Inc. | (63,144 | ) |
| (1,106,914 | ) | ||
Devon Energy Corp. | (95,053 | ) |
| (1,077,901 | ) | ||
Diamondback Energy, Inc. | (31,889 | ) |
| (1,333,598 | ) | ||
Helmerich & Payne, Inc. | (44,092 | ) |
| (860,235 | ) | ||
HollyFrontier Corp. | (40,999 | ) |
| (1,197,171 | ) | ||
Marathon Oil Corp. | (211,473 | ) |
| (1,294,215 | ) | ||
Noble Energy, Inc. | (130,068 | ) |
| (1,165,409 | ) | ||
Occidental Petroleum Corp. | (66,741 | ) |
| (1,221,360 | ) | ||
Parsley Energy, Inc., Class A | (135,083 | ) |
| (1,442,686 | ) | ||
Patterson-UTI Energy, Inc. | (419,107 | ) |
| (1,454,301 | ) | ||
Transocean Ltd.* | (603,509 | ) |
| (1,104,422 | ) | ||
Total Oil & Gas |
|
| (16,225,342 | ) | |||
Oil & Gas Services — (5.7)% |
| ||||||
Baker Hughes Co. | (53,494 | ) |
| (823,273 | ) | ||
Core Laboratories NV | (74,195 | ) |
| (1,507,642 | ) | ||
Halliburton Co. | (112,559 | ) |
| (1,461,016 | ) | ||
National Oilwell Varco, Inc. | (66,825 | ) |
| (818,606 | ) | ||
RPC, Inc.* | (317,502 | ) |
| (977,906 | ) | ||
Schlumberger Ltd. | (45,700 | ) |
| (840,423 | ) | ||
Total Oil & Gas Services |
|
| (6,428,866 | ) | |||
Packaging & Containers — (0.9)% |
| ||||||
O-I Glass, Inc. | (109,184 | ) |
| (980,472 | ) | ||
Pharmaceuticals — (1.2)% |
| ||||||
Alkermes PLC* | (67,131 | ) |
| (1,302,677 | ) | ||
Real Estate — (1.0)% |
| ||||||
Howard Hughes Corp. (The)* | (20,838 | ) |
| (1,082,534 | ) | ||
See accompanying Notes to Financial Statements.
52
ADVISORSHARES DORSEY WRIGHT SHORT ETF June 30, 2020 |
Investments | Shares | Value | |||||
COMMON STOCKS (continued) |
| ||||||
REITS — (6.4)% |
| ||||||
Diversified Healthcare Trust | (308,067 | ) | $ | (1,363,197 | ) | ||
EPR Properties | (38,640 | ) |
| (1,280,143 | ) | ||
Macerich Co. (The) | (57,319 | ) |
| (514,152 | ) | ||
Ryman Hospitality Properties, Inc. | (31,146 | ) |
| (1,077,652 | ) | ||
Service Properties Trust | (146,938 | ) |
| (1,041,790 | ) | ||
Simon Property Group, Inc. | (16,943 | ) |
| (1,158,562 | ) | ||
Ventas, Inc. | (21,618 | ) |
| (791,651 | ) | ||
Total REITS |
|
| (7,227,147 | ) | |||
Retail — (5.6)% |
| ||||||
Foot Locker, Inc. | (25,577 | ) |
| (745,825 | ) | ||
Gap, Inc. (The) | (118,992 | ) |
| (1,501,679 | ) | ||
Kohl’s Corp. | (47,833 | ) |
| (993,491 | ) | ||
Macy’s, Inc. | (174,719 | ) |
| (1,202,067 | ) | ||
Michaels Cos., Inc. (The)* | (274,827 | ) |
| (1,943,027 | ) | ||
Total Retail |
|
| (6,386,089 | ) | |||
Telecommunications — (1.6)% |
| ||||||
CommScope Holding Co., Inc.* | (114,744 | ) |
| (955,818 | ) | ||
ViaSat, Inc.* | (21,511 | ) |
| (825,377 | ) | ||
Total Telecommunications |
|
| (1,781,195 | ) | |||
Investments | Shares | Value | |||||
COMMON STOCKS (continued) |
| ||||||
Textiles — (0.8)% |
| ||||||
Mohawk Industries, Inc.* | (9,334 | ) | $ | (949,828 | ) | ||
Transportation — (1.1)% |
| ||||||
Ryder System, Inc. | (31,628 | ) |
| (1,186,366 | ) | ||
Total Securities Sold, Not Yet Purchased [Proceeds Received $(129,073,560)] |
|
| (109,955,954 | ) | |||
Total Investments — 3.3% |
|
| 3,759,483 |
| |||
Other Assets in Excess of Liabilities — 96.7% |
|
| 109,338,616 |
| |||
Net Assets — 100.0% |
| $ | 113,098,099 |
| |||
____________
ETF — Exchange Traded Fund
PLC — Public Limited Company
REITS — Real Estate Investment Trusts
* Non-income producing security.
† Affiliated Company.
(a) Rate shown reflects the 7-day yield as of June 30, 2020.
(b) As of June 30, 2020 cash in the amount of $107,102,220 has been segregated as collateral from the broker for securities sold short.
Fair Value Measurements
The following is a summary of the inputs used, as of June 30, 2020, in valuing the Fund’s assets and liabilities carried at fair value. These inputs are summarized in three broad levels. Level 1 includes quoted prices in active markets for identical securities. Level 2 includes other significant observable inputs (including quoted prices for similar securities, interest rates, prepayment speeds and credit risk). Level 3 includes significant unobservable inputs (including the Fund’s own assumptions in determining the fair value of investments). The level assigned to the securities valuations may not be an indication of the risk or liquidity associated with investing in those securities.
Assets | Level 1 | Level 2 | Level 3 | Total | ||||||||
Exchange Traded Fund | $ | 17,212,125 | $ | — | $ | — | $ | 17,212,125 | ||||
Money Market Fund |
| 96,503,312 |
| — |
| — |
| 96,503,312 | ||||
Total | $ | 113,715,437 | $ | — | $ | — | $ | 113,715,437 | ||||
Liabilities | Level 1 | Level 2 | Level 3 | Total | ||||||||||
Common Stocks | $ | (109,955,954 | ) | $ | — | $ | — | $ | (109,955,954 | ) | ||||
Total | $ | (109,955,954 | ) | $ | — | $ | — | $ | (109,955,954 | ) | ||||
See accompanying Notes to Financial Statements.
53
ADVISORSHARES DORSEY WRIGHT SHORT ETF June 30, 2020 |
SUMMARY OF SCHEDULE OF INVESTMENTS
% of | |||
Aerospace/Defense | (3.0 | )% | |
Airlines | (3.3 | ) | |
Apparel | (2.2 | ) | |
Auto Parts & Equipment | (1.3 | ) | |
Banks | (9.5 | ) | |
Biotechnology | (1.9 | ) | |
Building Materials | (1.0 | ) | |
Chemicals | (1.9 | ) | |
Coal | (0.8 | ) | |
Commercial Services | (1.8 | ) | |
Computers | (2.6 | ) | |
Cosmetics/Personal Care | (0.6 | ) | |
Debt Fund | 15.2 |
| |
Distribution/Wholesale | (1.1 | ) | |
Diversified Financial Services | (3.1 | ) | |
Engineering & Construction | (1.2 | ) | |
Entertainment | (2.9 | ) | |
Food | (2.0 | ) | |
Gas | (0.8 | ) | |
Healthcare – Products | (1.1 | ) | |
Healthcare – Services | (0.8 | ) | |
Insurance | (4.9 | ) | |
Internet | (1.5 | ) | |
SUMMARY OF SCHEDULE OF INVESTMENTS (continued)
% of | |||
Iron/Steel | (0.8 | )% | |
Leisure Time | (1.6 | ) | |
Lodging | (1.0 | ) | |
Machinery – Construction & Mining | (1.2 | ) | |
Machinery – Diversified | (0.8 | ) | |
Media | (1.5 | ) | |
Mining | (0.8 | ) | |
Miscellaneous Manufacturing | (0.8 | ) | |
Office/Business Equipment | (0.8 | ) | |
Oil & Gas | (14.3 | ) | |
Oil & Gas Services | (5.7 | ) | |
Packaging & Containers | (0.9 | ) | |
Pharmaceuticals | (1.2 | ) | |
Real Estate | (1.0 | ) | |
REITS | (6.4 | ) | |
Retail | (5.6 | ) | |
Telecommunications | (1.6 | ) | |
Textiles | (0.8 | ) | |
Transportation | (1.1 | ) | |
Money Market Fund | 85.3 |
| |
Total Investments | 3.3 |
| |
Other Assets in Excess of Liabilities | 96.7 |
| |
Net Assets | 100.0 | % | |
Affiliated holdings are funds which are managed by the Trust or an affiliate of the Trust. Transactions with affiliated companies during the year ended June 30, 2020 were as follows:
Affiliated Fund Name | Value at | Purchases/ | Sales/ | Realized | Change in | Number of | Value at | Dividend | ||||||||||||||||
AdvisorShares Sage Core Reserves ETF | $ | 2,490,250 | $ | 14,965,755 | $ | — | $ | — | $ | (243,880 | ) | 175,000 | $ | 17,212,125 | $ | 211,958 | ||||||||
See accompanying Notes to Financial Statements.
54
Investments | Shares | Value | |||
COMMON STOCKS — 94.7% | |||||
Aerospace/Defense — 1.0% | |||||
Boeing Co. (The) | 2,178 | $ | 399,227 | ||
Agriculture — 2.3% | |||||
Philip Morris International, Inc. | 13,791 |
| 966,197 | ||
Banks — 13.4% | |||||
Bank of America Corp. | 56,216 |
| 1,335,130 | ||
Citizens Financial Group, Inc. | 30,242 |
| 763,308 | ||
Goldman Sachs Group, Inc. (The) | 3,808 |
| 752,537 | ||
JPMorgan Chase & Co. | 13,362 |
| 1,256,830 | ||
M&T Bank Corp. | 5,985 |
| 622,260 | ||
PNC Financial Services Group, Inc. (The) | 7,943 |
| 835,683 | ||
Total Banks |
| 5,565,748 | |||
Beverages — 2.4% | |||||
PepsiCo, Inc. | 7,678 |
| 1,015,492 | ||
Chemicals — 4.2% | |||||
Air Products and Chemicals, Inc. | 3,219 |
| 777,260 | ||
DuPont de Nemours, Inc. | 18,399 |
| 977,539 | ||
Total Chemicals |
| 1,754,799 | |||
Commercial Services — 1.2% | |||||
IHS Markit Ltd. | 6,433 |
| 485,692 | ||
Diversified Financial Services — 3.0% | |||||
Capital One Financial Corp. | 10,681 |
| 668,524 | ||
Intercontinental Exchange, Inc. | 6,322 |
| 579,095 | ||
Total Diversified Financial Services |
| 1,247,619 | |||
Electric — 1.1% | |||||
Ameren Corp. | 6,581 |
| 463,039 | ||
Electronics — 1.7% | |||||
Flex Ltd.* | 67,192 |
| 688,718 | ||
Engineering & Construction — 1.2% | |||||
KBR, Inc. | 22,535 |
| 508,164 | ||
Food — 3.9% | |||||
Mondelez International, Inc., Class A | 21,253 |
| 1,086,666 | ||
US Foods Holding Corp.* | 25,855 |
| 509,860 | ||
Total Food |
| 1,596,526 | |||
Investments | Shares | Value | |||
COMMON STOCKS (continued) | |||||
Healthcare – Products — 3.3% | |||||
Alcon, Inc. (Switzerland)* | 9,251 | $ | 530,267 | ||
Medtronic PLC | 9,087 |
| 833,278 | ||
Total Healthcare – Products |
| 1,363,545 | |||
Healthcare – Services — 2.0% |
| ||||
Anthem, Inc. | 3,158 |
| 830,491 | ||
Household Products/Wares — 1.4% | |||||
Reynolds Consumer | 17,077 |
| 593,255 | ||
Insurance — 4.7% | |||||
Chubb Ltd. | 4,609 |
| 583,592 | ||
Prudential Financial, Inc. | 10,415 |
| 634,273 | ||
Willis Towers Watson PLC | 3,678 |
| 724,382 | ||
Total Insurance |
| 1,942,247 | |||
Internet — 4.6% | |||||
Alphabet, Inc., Class A* | 829 |
| 1,175,563 | ||
Amazon.com, Inc.* | 262 |
| 722,811 | ||
Total Internet |
| 1,898,374 | |||
Miscellaneous Manufacturing — 2.3% | |||||
Parker-Hannifin Corp. | 5,229 |
| 958,319 | ||
Oil & Gas — 5.8% |
| ||||
Chevron Corp. | 12,638 |
| 1,127,689 | ||
EOG Resources, Inc. | 12,593 |
| 637,961 | ||
Valero Energy Corp. | 10,637 |
| 625,668 | ||
Total Oil & Gas |
| 2,391,318 | |||
Pharmaceuticals — 10.5% | |||||
AstraZeneca PLC | 14,859 |
| 785,893 | ||
Cigna Corp. | 4,626 |
| 868,069 | ||
CVS Health Corp. | 14,159 |
| 919,910 | ||
Roche Holding AG (Switzerland)(a) | 15,475 |
| 671,305 | ||
Sanofi (France)(a) | 21,374 |
| 1,091,143 | ||
Total Pharmaceuticals |
| 4,336,320 | |||
REITS — 2.6% | |||||
American Tower Corp. | 4,179 |
| 1,080,439 | ||
Retail — 6.8% | |||||
Dollar General Corp. | 3,942 |
| 750,990 | ||
Target Corp. | 8,846 |
| 1,060,901 | ||
TJX Cos., Inc. (The) | 19,567 |
| 989,308 | ||
Total Retail |
| 2,801,199 | |||
See accompanying Notes to Financial Statements.
55
ADVISORSHARES DOUBLELINE VALUE EQUITY ETF June 30, 2020 |
Investments | Shares | Value | |||
COMMON STOCKS (continued) | |||||
Semiconductors — 6.9% | |||||
KLA Corp. | 3,178 | $ | 618,057 | ||
Lam Research Corp. | 2,201 |
| 711,936 | ||
Microchip Technology, Inc.(b) | 7,348 |
| 773,818 | ||
Taiwan Semiconductor Manufacturing Co., Ltd. (Taiwan)(a) | 13,257 |
| 752,600 | ||
Total Semiconductors |
| 2,856,411 | |||
Software — 2.3% | |||||
Microsoft Corp. | 4,705 |
| 957,515 | ||
Telecommunications — 4.3% | |||||
Verizon Communications, Inc. | 32,352 |
| 1,783,566 | ||
Transportation — 1.8% | |||||
Norfolk Southern Corp. | 4,365 |
| 766,363 | ||
Total Common Stocks |
| 39,250,583 | |||
Investments | Shares | Value | |||
MONEY MARKET FUND — 5.3% | |||||
Wells Fargo Advantage Government Money Market Fund – Institutional Class, 0.05%(c) | 2,214,140 | $ | 2,214,140 | ||
Total Investments — 100.0% |
| 41,464,723 | |||
Other Assets in Excess of Liabilities — 0.0%** |
| 18,518 | |||
Net Assets — 100.0% | $ | 41,483,241 | |||
____________
PLC — Public Limited Company
REITS — Real Estate Investment Trusts
* Non-income producing security.
** Less than 0.05%.
(a) American Depositary Receipt.
(b) All or a portion of security is on loan. The aggregate market value of the securities on loan is $758,337; the aggregate market value of the collateral held by the fund is $753,568. The aggregate market value of the collateral includes non-cash U.S. Treasury securities collateral having a value of $753,568.
(c) Rate shown reflects the 7-day yield as of June 30, 2020.
Fair Value Measurements
The following is a summary of the inputs used, as of June 30, 2020, in valuing the Fund’s assets and liabilities carried at fair value. These inputs are summarized in three broad levels. Level 1 includes quoted prices in active markets for identical securities. Level 2 includes other significant observable inputs (including quoted prices for similar securities, interest rates, prepayment speeds and credit risk). Level 3 includes significant unobservable inputs (including the Fund’s own assumptions in determining the fair value of investments). The level assigned to the securities valuations may not be an indication of the risk or liquidity associated with investing in those securities.
Assets | Level 1 | Level 2 | Level 3 | Total | ||||||||
Common Stocks | $ | 39,250,583 | $ | — | $ | — | $ | 39,250,583 | ||||
Money Market Fund |
| 2,214,140 |
| — |
| — |
| 2,214,140 | ||||
Total | $ | 41,464,723 | $ | — | $ | — | $ | 41,464,723 | ||||
See accompanying Notes to Financial Statements.
56
ADVISORSHARES DOUBLELINE VALUE EQUITY ETF June 30, 2020 |
SUMMARY OF SCHEDULE OF INVESTMENTS
% of | |||
Aerospace/Defense | 1.0 | % | |
Agriculture | 2.3 |
| |
Banks | 13.4 |
| |
Beverages | 2.4 |
| |
Chemicals | 4.2 |
| |
Commercial Services | 1.2 |
| |
Diversified Financial Services | 3.0 |
| |
Electric | 1.1 |
| |
Electronics | 1.7 |
| |
Engineering & Construction | 1.2 |
| |
Food | 3.9 |
| |
Healthcare – Products | 3.3 |
| |
Healthcare – Services | 2.0 |
| |
Household Products/Wares | 1.4 |
| |
Insurance | 4.7 |
| |
Internet | 4.6 |
| |
Miscellaneous Manufacturing | 2.3 |
| |
Oil & Gas | 5.8 |
| |
Pharmaceuticals | 10.5 |
| |
REITS | 2.6 |
| |
Retail | 6.8 |
| |
Semiconductors | 6.9 |
| |
Software | 2.3 |
| |
Telecommunications | 4.3 |
| |
Transportation | 1.8 |
| |
Money Market Fund | 5.3 |
| |
Total Investments | 100.0 |
| |
Other Assets in Excess of Liabilities | 0.0 | ** | |
Net Assets | 100.0 | % | |
____________
** Less than 0.05%.
See accompanying Notes to Financial Statements.
57
Investments | Shares | Value | |||
COMMON STOCKS — 99.9% | |||||
Banks — 2.8% | |||||
Eagle Bancorp, Inc. | 16,651 | $ | 545,320 | ||
Building Materials — 6.0% | |||||
Trex Co., Inc.*(a) | 8,972 |
| 1,166,988 | ||
Chemicals — 12.3% | |||||
RPM International, Inc. | 10,819 |
| 812,074 | ||
Sherwin-Williams Co. (The) | 1,410 |
| 814,768 | ||
Stepan Co. | 8,168 |
| 793,113 | ||
Total Chemicals |
| 2,419,955 | |||
Commercial Services — 4.8% | |||||
Moody’s Corp. | 3,430 |
| 942,324 | ||
Computers — 4.0% | |||||
Check Point Software Technologies Ltd. (Israel)* | 7,318 |
| 786,173 | ||
Diversified Financial Services — 4.1% | |||||
Intercontinental Exchange, Inc. | 8,830 |
| 808,828 | ||
Food — 8.2% | |||||
Hershey Co. (The) | 5,605 |
| 726,520 | ||
Hormel Foods Corp. | 18,102 |
| 873,784 | ||
Total Food |
| 1,600,304 | |||
Healthcare – Products — 8.4% | |||||
Danaher Corp. | 5,366 |
| 948,870 | ||
Stryker Corp. | 3,909 |
| 704,362 | ||
Total Healthcare – Products |
| 1,653,232 | |||
Household Products/Wares — 4.6% | |||||
Church & Dwight Co., Inc. | 11,654 |
| 900,854 | ||
Insurance — 5.8% | |||||
Aflac, Inc. | 15,584 |
| 561,491 | ||
Globe Life, Inc. | 7,738 |
| 574,392 | ||
Total Insurance |
| 1,135,883 | |||
Machinery – Diversified — 3.0% | |||||
Middleby Corp. (The)* | 7,406 |
| 584,630 | ||
Investments | Shares | Value | ||||
COMMON STOCKS (continued) |
| |||||
Media — 8.3% |
| |||||
FactSet Research Systems, Inc. | 3,049 | $ | 1,001,505 |
| ||
Walt Disney Co. (The) | 5,628 |
| 627,578 |
| ||
Total Media |
| 1,629,083 |
| |||
Packaging & Containers — 4.3% |
| |||||
Silgan Holdings, Inc. | 26,326 |
| 852,699 |
| ||
Pharmaceuticals — 3.7% |
| |||||
Becton Dickinson and Co. | 3,025 |
| 723,792 |
| ||
Retail — 3.1% |
| |||||
Ross Stores, Inc. | 7,111 |
| 606,142 |
| ||
Software — 16.5% |
| |||||
ANSYS, Inc.* | 3,174 |
| 925,951 |
| ||
Broadridge Financial Solutions, Inc. | 6,687 |
| 843,833 |
| ||
Cerner Corp. | 11,230 |
| 769,816 |
| ||
Fiserv, Inc.* | 7,067 |
| 689,881 |
| ||
Total Software |
| 3,229,481 |
| |||
Total Common Stocks |
| 19,585,688 |
| |||
MONEY MARKET FUND — 0.3% |
| |||||
BlackRock Liquidity Funds Treasury Trust Fund Portfolio, Institutional Class, 0.06%(b) | 64,032 |
| 64,032 |
| ||
Total Investments — 100.2% |
| 19,649,720 |
| |||
Liabilities in Excess of Other Assets — (0.2%) |
| (33,261 | ) | |||
Net Assets — 100.0% | $ | 19,616,459 |
| |||
____________
* Non-income producing security.
(a) All or a portion of security is on loan. The aggregate market value of the securities on loan is $476,316; the aggregate market value of the collateral held by the fund is $478,436. The aggregate market value of the collateral includes non-cash U.S. Treasury securities collateral having a value of $478,436.
(b) Rate shown reflects the 7-day yield as of June 30, 2020.
See accompanying Notes to Financial Statements.
58
ADVISORSHARES FOCUSED EQUITY ETF June 30, 2020 |
Fair Value Measurements
The following is a summary of the inputs used, as of June 30, 2020, in valuing the Fund’s assets and liabilities carried at fair value. These inputs are summarized in three broad levels. Level 1 includes quoted prices in active markets for identical securities. Level 2 includes other significant observable inputs (including quoted prices for similar securities, interest rates, prepayment speeds and credit risk). Level 3 includes significant unobservable inputs (including the Fund’s own assumptions in determining the fair value of investments). The level assigned to the securities valuations may not be an indication of the risk or liquidity associated with investing in those securities.
Assets | Level 1 | Level 2 | Level 3 | Total | ||||||||
Common Stocks | $ | 19,585,688 | $ | — | $ | — | $ | 19,585,688 | ||||
Money Market Fund |
| 64,032 |
| — |
| — |
| 64,032 | ||||
Total | $ | 19,649,720 | $ | — | $ | — | $ | 19,649,720 | ||||
SUMMARY OF SCHEDULE OF INVESTMENTS
% of | |||
Banks | 2.8 | % | |
Building Materials | 6.0 |
| |
Chemicals | 12.3 |
| |
Commercial Services | 4.8 |
| |
Computers | 4.0 |
| |
Diversified Financial Services | 4.1 |
| |
Food | 8.2 |
| |
Healthcare – Products | 8.4 |
| |
Household Products/Wares | 4.6 |
| |
Insurance | 5.8 |
| |
Machinery – Diversified | 3.0 |
| |
Media | 8.3 |
| |
Packaging & Containers | 4.3 |
| |
Pharmaceuticals | 3.7 |
| |
Retail | 3.1 |
| |
Software | 16.5 |
| |
Money Market Fund | 0.3 |
| |
Total Investments | 100.2 |
| |
Liabilities in Excess of Other Assets | (0.2 | ) | |
Net Assets | 100.0 | % | |
See accompanying Notes to Financial Statements.
59
Investments | Shares/ | Value | ||||
EXCHANGE TRADED FUNDS — 100.0% | ||||||
Debt Fund — 100.0% | ||||||
iShares 0-5 Year High Yield Corporate Bond ETF |
| 10,326 | $ | 442,882 | ||
iShares 1-3 Year Treasury Bond ETF |
| 17,100 |
| 1,481,031 | ||
iShares Agency Bond ETF |
| 21,258 |
| 2,574,344 | ||
iShares Short Treasury Bond ETF(a) |
| 22,728 |
| 2,516,898 | ||
SPDR Bloomberg Barclays Short Term High Yield Bond ETF |
| 51,414 |
| 1,295,633 | ||
Total Exchange Traded Funds |
| 8,310,788 | ||||
MONEY MARKET FUND — 1.0% | ||||||
BlackRock Liquidity Funds FedFund Portfolio, Institutional Class, 0.10%(b) (Cost $86,224) |
| 86,224 |
| 86,224 | ||
REPURCHASE AGREEMENTS — 16.4%(c) | ||||||
Citigroup Global Markets, Inc., dated 06/30/20, due 07/01/20, 0.09%, total to be received $316,958, (collateralized by various U.S. Government Agency Obligations, 0.50% – 7.50%, | $ | 316,957 |
| 316,957 | ||
Daiwa Capital Markets America, dated 06/30/20, due 07/01/20, 0.10%, total to be received $316,958, (collateralized by various U.S. Government Agency Obligations, 0.00% – 6.50%, 07/28/20 – 03/01/52, totaling $322,438) |
| 316,957 |
| 316,957 | ||
HSBC Securities USA, Inc., dated 06/30/20, due 07/01/20, 0.08%, total to be received $316,958, (collateralized by various U.S. Government Agency Obligations, 0.00% – 4.50%, 05/15/44 – 03/20/50, totaling $322,432) |
| 316,957 |
| 316,957 | ||
Investments |
| Value | |||||
REPURCHASE AGREEMENTS (continued) |
| ||||||
JP Morgan Securities LLC, dated 06/30/20, due 07/01/20, 0.07%, total to be received $93,958, (collateralized by various U.S. Government Agency Obligations, 0.00% – 2.50%, 10/08/20 – 04/30/23, totaling $95,795) | $ | 93,958 | $ | 93,958 |
| ||
RBC Dominion Securities, Inc., dated 06/30/20, due 07/01/20, 0.09%, total to be received $316,958, (collateralized by various U.S. Government Agency Obligations, 0.00% – 7.00%, 07/31/20 – 07/01/50, totaling $322,538) |
| 316,957 |
| 316,957 |
| ||
Total Repurchase Agreements |
| 1,361,786 |
| ||||
Total Investments — 117.4% |
|
| 9,758,798 |
| |||
Liabilities in Excess of Other Assets — (17.4%) |
|
| (1,446,816 | ) | |||
Net Assets — 100.0% |
| $ | 8,311,982 |
| |||
____________
ETF — Exchange Traded Fund
(a) All or a portion of security is on loan. The aggregate market value of the securities on loan is $1,334,528; the aggregate market value of the collateral held by the fund is $1,361,786.
(b) Rate shown reflects the 7-day yield as of June 30, 2020.
(c) Collateral received from brokers for securities lending was invested in these short-term investments.
See accompanying Notes to Financial Statements.
60
ADVISORSHARES FOLIOBEYOND SMART CORE BOND ETF June 30, 2020 |
Fair Value Measurements
The following is a summary of the inputs used, as of June 30, 2020, in valuing the Fund’s assets and liabilities carried at fair value. These inputs are summarized in three broad levels. Level 1 includes quoted prices in active markets for identical securities. Level 2 includes other significant observable inputs (including quoted prices for similar securities, interest rates, prepayment speeds and credit risk). Level 3 includes significant unobservable inputs (including the Fund’s own assumptions in determining the fair value of investments). The level assigned to the securities valuations may not be an indication of the risk or liquidity associated with investing in those securities.
Assets | Level 1 | Level 2 | Level 3 | Total | ||||||||
Exchange Traded Funds | $ | 8,310,788 | $ | — | $ | — | $ | 8,310,788 | ||||
Money Market Fund |
| 86,224 |
| — |
| — |
| 86,224 | ||||
Repurchase Agreements |
| — |
| 1,361,786 |
| — |
| 1,361,786 | ||||
Total | $ | 8,397,012 | $ | 1,361,786 | $ | — | $ | 9,758,798 | ||||
SUMMARY OF SCHEDULE OF INVESTMENTS
% of | |||
Debt Fund | 100.0 | % | |
Money Market Fund | 1.0 |
| |
Repurchase Agreements | 16.4 |
| |
Total Investments | 117.4 |
| |
Liabilities in Excess of Other Assets | (17.4 | ) | |
Net Assets | 100.0 | % | |
See accompanying Notes to Financial Statements.
61
Investments | Principal | Value | ||||
ASSET BACKED SECURITIES — 29.9% | ||||||
ACC Trust, Class A, Series 2019-1, 3.75%, 05/20/22‡ | $ | 109,344 | $ | 110,163 | ||
American Credit Acceptance Receivables Trust, Class B, Series 2019-1, 3.32%, 04/12/23‡ |
| 155,000 |
| 156,092 | ||
American Credit Acceptance Receivables Trust, Class C, Series 2018-3, 3.75%, 10/15/24‡ |
| 338,925 |
| 341,267 | ||
American Credit Acceptance Receivables Trust, Class C, Series 2018-4, 3.97%, 01/13/25‡ |
| 380,000 |
| 386,015 | ||
American Credit Acceptance Receivables Trust, Class C, Series 2019-2, 3.17%, 06/12/25‡ |
| 205,000 |
| 208,225 | ||
AmeriCredit Automobile Receivables Trust, Class D, Series 2018-1, 3.82%, 03/18/24 |
| 285,000 |
| 295,346 | ||
Amur Equipment Finance Receivables V LLC, Class A2, Series 2018-1A, 3.24%, 12/20/23‡ |
| 135,648 |
| 136,663 | ||
Amur Equipment Finance Receivables VI LLC, Class A2, Series 2018-2A, 3.89%, 07/20/22‡ |
| 249,933 |
| 255,453 | ||
Amur Equipment Finance Receivables VIII LLC, Class B, Series 2020-1A, 2.50%, 03/20/26‡ |
| 230,000 |
| 230,968 | ||
Aqua Finance Trust, Class A, Series 2019-A, 3.14%, 07/16/40‡ |
| 168,379 |
| 168,217 | ||
Aqua Finance Trust, Class C, Series 2019-A, 4.01%, 07/16/40‡ |
| 195,000 |
| 174,841 | ||
Avid Automobile Receivables Trust, Class A, Series 2018-1, 2.84%, 08/15/23‡ |
| 51,950 |
| 52,099 | ||
BCC Funding Corp. XVI LLC, Class B, Series 2019-1A, 2.64%, 09/20/24‡ |
| 220,000 |
| 221,718 | ||
BRE Grand Islander Timeshare Issuer LLC, Class A, Series 2017-1A, 2.94%, 05/25/29‡ |
| 255,354 |
| 253,333 | ||
BXG Receivables Note Trust, Class A, Series 2013-A, 3.01%, 12/04/28‡ |
| 50,877 |
| 50,702 | ||
Investments | Principal | Value | ||||
ASSET BACKED SECURITIES (continued) | ||||||
BXG Receivables Note Trust, Class A, Series 2015-A, 2.88%, 05/02/30‡ | $ | 269,167 | $ | 263,548 | ||
Carnow Auto Receivables Trust, Class A, Series 2019-1A, 2.72%, 11/15/22‡ |
| 106,151 |
| 106,710 | ||
CCG Receivables Trust, Class B, Series 2019-2, 2.55%, 03/15/27‡ |
| 210,000 |
| 211,792 | ||
Centre Point Funding LLC, Class 1, Series 2012-2A, 2.61%, 08/20/21‡ |
| 5,465 |
| 5,459 | ||
Commonbond Student Loan Trust, Class A1, Series 2019-AGS, 2.54%, 01/25/47‡ |
| 184,942 |
| 192,317 | ||
Conn’s Receivables Funding LLC, Class B, Series 2018-A, 4.65%, 01/15/23‡ |
| 49,115 |
| 48,587 | ||
Consumer Loan Underlying Bond CLUB Credit Trust, Class A, Series 2019-P2, 2.47%, 10/15/26‡ |
| 97,938 |
| 98,148 | ||
Consumer Loan Underlying Bond Credit Trust, Class A, Series 2018-P2, 3.47%, 10/15/25‡ |
| 63,920 |
| 64,152 | ||
CPS Auto Receivables Trust, Class C, Series 2020-A, 2.54%, 12/15/25‡ |
| 175,000 |
| 176,844 | ||
CPS Auto Receivables Trust, Class C, Series 2020-B, 3.30%, 04/15/26‡ |
| 170,000 |
| 174,542 | ||
CPS Auto Receivables Trust, Class D, Series 2018-D, 4.34%, 09/16/24‡ |
| 210,000 |
| 215,854 | ||
Credit Acceptance Auto Loan Trust, Class A, Series 2018-1A, 3.01%, 02/16/27‡ |
| 148,154 |
| 149,089 | ||
Credit Acceptance Auto Loan Trust, Class A, Series 2019-1A, 3.33%, 02/15/28‡ |
| 280,000 |
| 286,676 | ||
Diamond Resorts Owner Trust, Class B, Series 2019-1A, 3.53%, 02/20/32‡ |
| 156,455 |
| 150,393 | ||
Drive Auto Receivables Trust, Class C, Series 2019-3, 2.90%, 08/15/25 |
| 240,000 |
| 243,868 | ||
DT Auto Owner Trust, Class C, Series 2018-1A, 3.47%, 12/15/23‡ |
| 172,743 |
| 173,549 | ||
See accompanying Notes to Financial Statements.
62
ADVISORSHARES NEWFLEET MULTI-SECTOR INCOME ETF June 30, 2020 |
Investments | Principal | Value | ||||
ASSET BACKED SECURITIES (continued) | ||||||
DT Auto Owner Trust, Class C, Series 2019-1A, 3.61%, 11/15/24‡ | $ | 210,000 | $ | 214,552 | ||
DT Auto Owner Trust, Class C, Series 2019-4A, 2.73%, 07/15/25‡ |
| 220,000 |
| 222,494 | ||
DT Auto Owner Trust, Class C, Series 2020-2A, 3.28%, 03/16/26‡ |
| 165,000 |
| 170,452 | ||
Exeter Automobile Receivables Trust, Class B, Series 2017-3A, 2.81%, 09/15/22‡ |
| 118,587 |
| 119,047 | ||
Exeter Automobile Receivables Trust, Class C, Series 2018-3A, 3.71%, 06/15/23‡ |
| 160,000 |
| 162,253 | ||
Exeter Automobile Receivables Trust, Class C, Series 2019-4A, 2.44%, 09/16/24‡ |
| 220,000 |
| 221,786 | ||
Exeter Automobile Receivables Trust, Class D, Series 2018-4A, 4.35%, 09/16/24‡ |
| 175,000 |
| 182,298 | ||
Fair Square Issuance Trust, Class A, Series 2020-AA, 2.90%, 09/20/24‡ |
| 210,000 |
| 209,585 | ||
First Investors Auto Owner Trust, Class C, Series 2016-2A, 2.53%, 07/15/22‡ |
| 290,843 |
| 292,075 | ||
First Investors Auto Owner Trust, Class C, Series 2019-1A, 3.26%, 03/17/25‡ |
| 305,000 |
| 312,977 | ||
First Investors Auto Owner Trust, Class D, Series 2017-1A, 3.60%, 04/17/23‡ |
| 145,000 |
| 147,440 | ||
Flagship Credit Auto Trust, Class B, Series 2016-2, 3.84%, 09/15/22‡ |
| 3,852 |
| 3,858 | ||
Flagship Credit Auto Trust, Class C, Series 2020-1, 2.24%, 01/15/26‡ |
| 210,000 |
| 211,268 | ||
Foundation Finance Trust, Class A, Series 2017-1A, 3.30%, 07/15/33‡ |
| 202,680 |
| 204,424 | ||
FREED ABS Trust, Class B, Series 2018-2, 4.61%, 10/20/25‡ |
| 250,000 |
| 248,295 | ||
FREED ABS Trust, Class B, Series 2019-2, 3.19%, 11/18/26‡ |
| 220,000 |
| 211,197 | ||
Investments | Principal | Value | ||||
ASSET BACKED SECURITIES (continued) | ||||||
GLS Auto Receivables Issuer Trust, Class A, Series 2019-2A, 3.06%, 04/17/23‡ | $ | 171,052 | $ | 172,932 | ||
GLS Auto Receivables Issuer Trust, Class B, Series 2019-3A, 2.72%, 06/17/24‡ |
| 220,000 |
| 222,851 | ||
GLS Auto Receivables Issuer Trust, Class B, Series 2020-1A, 2.43%, 11/15/24‡ |
| 245,000 |
| 247,158 | ||
GLS Auto Receivables Issuer Trust, Class B, Series 2020-2A, 3.16%, 06/16/25‡ |
| 180,000 |
| 185,295 | ||
GLS Auto Receivables Issuer Trust, Class C, Series 2018-3A, 4.18%, 07/15/24‡ |
| 235,000 |
| 243,633 | ||
Gold Key Resorts LLC, Class A, Series 2014-A, 3.22%, 03/17/31‡ |
| 72,509 |
| 72,505 | ||
Hardee’s Funding LLC, Class A2I, Series 2018-1A, 4.25%, 06/20/48‡ |
| 201,413 |
| 204,945 | ||
Hertz Vehicle Financing II LP, Class A, Series 2015-3A, 2.67%, 09/25/21‡ |
| 81,172 |
| 80,125 | ||
Hertz Vehicle Financing II LP, Class A, Series 2016-4A, 2.65%, 07/25/22‡ |
| 236,587 |
| 233,273 | ||
Kabbage Funding LLC, Class A, Series 2019-1, 3.83%, 03/15/24‡ |
| 64,685 |
| 63,945 | ||
Lendmark Funding Trust, Class A, Series 2018-2A, 4.23%, 04/20/27‡ |
| 390,000 |
| 391,882 | ||
Marlette Funding Trust, Class A, Series 2019-2A, 3.13%, 07/16/29‡ |
| 139,639 |
| 140,913 | ||
Marlette Funding Trust, Class A, Series 2019-4A, 2.39%, 12/17/29‡ |
| 148,159 |
| 148,814 | ||
MVW Owner Trust, Class A, Series 2019-1A, 2.89%, 11/20/36‡ |
| 194,526 |
| 198,274 | ||
MVW Owner Trust, Class A, Series 2019-2A, 2.22%, 10/20/38‡ |
| 187,271 |
| 187,594 | ||
MVW Owner Trust, Class B, Series 2015-1A, 2.96%, 12/20/32‡ |
| 103,521 |
| 101,189 | ||
See accompanying Notes to Financial Statements.
63
ADVISORSHARES NEWFLEET MULTI-SECTOR INCOME ETF June 30, 2020 |
Investments | Principal | Value | ||||
ASSET BACKED SECURITIES (continued) | ||||||
NextGear Floorplan Master Owner Trust, Class A2, Series 2017-2A, 2.56%, 10/17/22‡ | $ | 283,000 | $ | 284,129 | ||
NextGear Floorplan Master Owner Trust, Class A2, Series 2018-1A, 3.22%, 02/15/23‡ |
| 145,000 |
| 145,761 | ||
NMEF Funding LLC, Class B, Series 2019-A, 3.06%, 08/17/26‡ |
| 175,000 |
| 177,558 | ||
Octane Receivables Trust, Class A, Series 2019-1A, 3.16%, 09/20/23‡ |
| 122,013 |
| 121,658 | ||
OneMain Direct Auto Receivables Trust, Class C, Series 2018-1A, 3.85%, 10/14/25‡ |
| 250,000 |
| 251,883 | ||
OneMain Financial Issuance Trust, Class A, Series 2019-1A, 3.48%, 02/14/31‡ |
| 215,000 |
| 218,816 | ||
Oportun Funding IX LLC, Class A, Series 2018-B, 3.91%, 07/08/24‡ |
| 390,000 |
| 393,257 | ||
Orange Lake Timeshare Trust, Class A, Series 2015-AA, 2.88%, 09/08/27‡ |
| 106,145 |
| 105,663 | ||
Orange Lake Timeshare Trust, Class B, Series 2019-A, 3.36%, 04/09/38‡ |
| 165,727 |
| 158,296 | ||
Prosper Marketplace Issuance Trust, Class A, Series 2019-3A, 3.19%, 07/15/25‡ |
| 69,889 |
| 70,176 | ||
Santander Drive Auto Receivables Trust, Class C, Series 2017-1, 2.58%, 05/16/22 |
| 12,891 |
| 12,903 | ||
Skopos Auto Receivables Trust, Class C, Series 2019-1A, 3.63%, 09/16/24‡ |
| 180,000 |
| 174,067 | ||
Sofi Consumer Loan Program LLC, Class A, Series 2016-3, 3.05%, 12/26/25‡ |
| 17,097 |
| 17,115 | ||
Sofi Consumer Loan Program LLC, Class A, Series 2017-1, 3.28%, 01/26/26‡ |
| 59,703 |
| 59,923 | ||
Sofi Consumer Loan Program Trust, Class A2, Series 2018-2, 3.35%, 04/26/27‡ |
| 161,855 |
| 163,188 | ||
Taco Bell Funding LLC, Class A23, Series 2016-1A, 4.97%, 05/25/46‡ |
| 169,750 |
| 180,450 | ||
Investments | Principal | Value | ||||
ASSET BACKED SECURITIES (continued) | ||||||
Tesla Auto Lease Trust, Class B, Series 2018-B, 4.12%, 10/20/21‡ | $ | 310,000 | $ | 316,308 | ||
Tidewater Auto Receivables Trust, Class B, Series 2018-AA, 3.45%, 11/15/24‡ |
| 490,981 |
| 493,768 | ||
Tricolor Auto Securitization Trust, Class B, Series 2018-2A, 4.76%, 02/15/22‡ |
| 304,711 |
| 306,871 | ||
TRIP Rail Master Funding LLC, Class A1, Series 2017-1A, 2.71%, 08/15/47‡ |
| 237,386 |
| 237,794 | ||
United Auto Credit Securitization Trust, Class D, Series 2019-1, 3.47%, 08/12/24‡ |
| 205,000 |
| 206,860 | ||
Upstart Securitization Trust, Class A, Series 2019-2, 2.90%, 09/20/29‡ |
| 123,708 |
| 124,242 | ||
Upstart Securitization Trust, Class A, Series 2019-3, 2.68%, 01/21/30‡ |
| 154,261 |
| 155,194 | ||
US Auto Funding LLC, Class B, Series 2019-1A, 3.99%, 12/15/22‡ |
| 305,000 |
| 308,732 | ||
Welk Resorts LLC, Class A, Series 2015-AA, 2.79%, 06/16/31‡ |
| 122,395 |
| 121,993 | ||
Westgate Resorts LLC, Class A, Series 2018-1A, 3.38%, 12/20/31‡ |
| 256,584 |
| 257,751 | ||
Westlake Automobile Receivables Trust, Class C, Series 2018-3A, 3.61%, 10/16/23‡ |
| 380,000 |
| 387,225 | ||
Westlake Automobile Receivables Trust, Class D, Series 2018-2A, 4.00%, 01/16/24‡ |
| 215,000 |
| 218,619 | ||
Total Asset Backed Securities |
|
| 17,302,159 | |||
CORPORATE BONDS — 24.6% | ||||||
Communication Services — 1.8% | ||||||
CenturyLink, Inc., 4.00%, 02/15/27‡ |
| 30,000 |
| 29,206 | ||
Crown Castle International Corp., 4.88%, 04/15/22 |
| 230,000 |
| 245,812 | ||
Level 3 Financing, Inc., 4.25%, 07/01/28‡ |
| 85,000 |
| 85,327 | ||
Live Nation Entertainment, Inc., 4.75%, 10/15/27‡ |
| 25,000 |
| 21,565 | ||
See accompanying Notes to Financial Statements.
64
ADVISORSHARES NEWFLEET MULTI-SECTOR INCOME ETF June 30, 2020 |
Investments | Principal | Value | ||||
CORPORATE BONDS (continued) | ||||||
Communication Services (continued) | ||||||
Sirius XM Radio, Inc., 4.63%, 07/15/24‡ | $ | 45,000 | $ | 46,209 | ||
Sprint Corp., 7.88%, 09/15/23 |
| 75,000 |
| 84,562 | ||
Sprint Spectrum Co. LLC / Sprint Spectrum Co. II LLC / Sprint Spectrum Co. III LLC, 4.74%, 03/20/25‡ |
| 200,000 |
| 217,773 | ||
T-Mobile USA, Inc., 2.05%, 02/15/28‡ |
| 85,000 |
| 85,253 | ||
Verizon Communications, Inc., 1.49%, (3-Month USD LIBOR + 1.10%), 05/15/25@ |
| 207,000 |
| 209,664 | ||
Total Communication Services |
|
| 1,025,371 | |||
Consumer Discretionary — 2.1% | ||||||
Aptiv Corp., 4.15%, 03/15/24 |
| 215,000 |
| 229,620 | ||
Expedia Group, Inc., 6.25%, 05/01/25‡ |
| 55,000 |
| 58,707 | ||
Ford Motor Credit Co. LLC, 3.20%, 01/15/21 |
| 360,000 |
| 355,500 | ||
General Motors Co., 6.13%, 10/01/25 |
| 120,000 |
| 134,993 | ||
Hanesbrands, Inc., 5.38%, 05/15/25‡ |
| 115,000 |
| 116,509 | ||
Marriott Ownership Resorts, Inc., 6.13%, 09/15/25‡ |
| 40,000 |
| 41,075 | ||
MGM Growth Properties Operating Partnership LP / Mgp Finance Co.-Issuer, Inc., 4.63%, 06/15/25‡ |
| 20,000 |
| 19,633 | ||
TRI Pointe Group, Inc. / TRI Pointe Homes, Inc., 5.88%, 06/15/24 |
| 190,000 |
| 195,824 | ||
VF Corp., 2.40%, 04/23/25 |
| 71,000 |
| 74,825 | ||
Total Consumer Discretionary |
|
| 1,226,686 | |||
Consumer Staples — 0.9% |
|
| ||||
Altria Group, Inc., 3.80%, 02/14/24 |
| 158,000 |
| 172,869 | ||
Conagra Brands, Inc., 4.30%, 05/01/24 |
| 200,000 |
| 221,313 | ||
Kraft Heinz Foods Co., 3.88%, 05/15/27‡ |
| 105,000 |
| 109,884 | ||
Total Consumer Staples |
|
| 504,066 | |||
Energy — 1.2% |
|
| ||||
Boardwalk Pipelines LP, 4.95%, 12/15/24 |
| 150,000 |
| 160,803 | ||
Crownrock LP / Crownrock Finance, Inc., 5.63%, 10/15/25‡ |
| 60,000 |
| 53,962 | ||
Investments | Principal | Value | ||||
CORPORATE BONDS (continued) | ||||||
Energy (continued) | ||||||
EQM Midstream Partners LP, 6.00%, 07/01/25‡(a) | $ | 15,000 | $ | 15,231 | ||
EQM Midstream Partners LP, 6.50%, 07/01/27‡ |
| 20,000 |
| 20,534 | ||
Kinder Morgan, Inc., 5.63%, 11/15/23‡ |
| 145,000 |
| 163,629 | ||
MPLX LP, 3.50%, 12/01/22 |
| 85,000 |
| 88,608 | ||
Sabine Pass Liquefaction LLC, 6.25%, 03/15/22 |
| 100,000 |
| 106,612 | ||
Targa Resources Partners LP / Targa Resources Partners Finance Corp., 5.88%, 04/15/26 |
| 85,000 |
| 84,349 | ||
Total Energy |
|
| 693,728 | |||
Financials — 9.7% |
|
| ||||
Ares Capital Corp., 3.50%, 02/10/23 |
| 195,000 |
| 196,161 | ||
Athene Global Funding, 2.80%, 05/26/23‡ |
| 120,000 |
| 122,478 | ||
Aviation Capital Group LLC, 3.88%, 05/01/23‡ |
| 306,000 |
| 290,960 | ||
Bank of America Corp., 2.02%, (3-Month USD LIBOR + 1.00%), 04/24/23@ |
| 285,000 |
| 286,550 | ||
Bank of America Corp., 1.31%, (3-Month USD LIBOR + 0.77%), 02/05/26@ |
| 153,000 |
| 151,103 | ||
Bank of New York Mellon Corp. (The), Series E, 3.73%, (3-Month USD LIBOR + 3.42%)#@ |
| 360,000 |
| 341,564 | ||
Capital One Financial Corp., 3.75%, 07/28/26 |
| 190,000 |
| 207,778 | ||
Charles Schwab Corp. (The), Series G, 5.38%, (US 5 Year CMT T-Note + 4.97%)#@ |
| 109,000 |
| 116,719 | ||
Citadel LP, 4.88%, 01/15/27‡ |
| 75,000 |
| 77,518 | ||
Citigroup, Inc., 1.95%, (3-Month USD LIBOR + 0.96%), 04/25/22@ |
| 215,000 |
| 216,234 | ||
Goldman Sachs Group, Inc. (The), 3.00%, 04/26/22 |
| 330,000 |
| 336,431 | ||
Goldman Sachs Group, Inc. (The), 1.96%, (3-Month USD LIBOR + 1.60%), 11/29/23@ |
| 170,000 |
| 172,715 | ||
Goldman Sachs Group, Inc. (The), 2.64%, (3-Month USD LIBOR + 1.75%), 10/28/27@ |
| 170,000 |
| 172,413 | ||
See accompanying Notes to Financial Statements.
65
ADVISORSHARES NEWFLEET MULTI-SECTOR INCOME ETF June 30, 2020 |
Investments | Principal | Value | ||||
CORPORATE BONDS (continued) | ||||||
Financials (continued) |
|
| ||||
Icahn Enterprises LP / Icahn Enterprises Finance Corp., 6.25%, 05/15/26 | $ | 140,000 | $ | 140,426 | ||
JPMorgan Chase & Co., Series Z, 4.49%, (3-Month USD LIBOR + 3.80%)#@ |
| 430,000 |
| 407,926 | ||
JPMorgan Chase & Co., Series HH, 4.60%, (SOFR + 3.13%)#@ |
| 182,000 |
| 162,663 | ||
Ladder Capital Finance Holdings LLLP / Ladder Capital Finance Corp., 4.25%, 02/01/27‡ |
| 105,000 |
| 84,263 | ||
Lincoln National Corp., 3.18%, (3-Month USD LIBOR + 2.04%), 04/20/67@ |
| 60,000 |
| 39,555 | ||
Morgan Stanley, 2.42%, (3-Month USD LIBOR + 1.40%), 10/24/23@ |
| 445,000 |
| 450,541 | ||
Morgan Stanley, Series F, 3.88%, 04/29/24 |
| 275,000 |
| 304,252 | ||
Navient Corp., 5.88%, 10/25/24 |
| 170,000 |
| 160,224 | ||
Prudential Financial, Inc., 5.63%, (3-Month USD LIBOR + 3.92%), 06/15/43@ |
| 84,000 |
| 89,519 | ||
Santander Holdings USA, Inc., 3.70%, 03/28/22 |
| 205,000 |
| 211,172 | ||
Santander Holdings USA, Inc., Series FXD, 3.50%, 06/07/24 |
| 240,000 |
| 252,583 | ||
Synchrony Financial, 4.38%, 03/19/24 |
| 315,000 |
| 329,879 | ||
Wells Fargo & Co., 1.65%, (SOFR + 1.60%), 06/02/24@ |
| 120,000 |
| 121,949 | ||
Wells Fargo & Co., 4.10%, 06/03/26 |
| 140,000 |
| 158,006 | ||
Total Financials |
|
| 5,601,582 | |||
Health Care — 1.2% |
|
| ||||
HCA, Inc., 5.38%, 02/01/25 |
| 130,000 |
| 139,627 | ||
Mylan NV, 3.95%, 06/15/26 |
| 215,000 |
| 240,567 | ||
Perrigo Finance Unlimited Co., 3.90%, 12/15/24 |
| 200,000 |
| 212,934 | ||
Tenet Healthcare Corp., 7.50%, 04/01/25‡ |
| 10,000 |
| 10,681 | ||
Tenet Healthcare Corp., 4.88%, 01/01/26‡ |
| 105,000 |
| 102,404 | ||
Total Health Care |
|
| 706,213 | |||
Investments | Principal | Value | ||||
CORPORATE BONDS (continued) | ||||||
Industrials — 1.9% |
|
| ||||
Boeing Co. (The), 2.35%, 10/30/21 | $ | 60,000 | $ | 60,768 | ||
Boeing Co. (The), 4.88%, 05/01/25 |
| 45,000 |
| 49,093 | ||
Boeing Co. (The), 5.04%, 05/01/27 |
| 67,000 |
| 73,994 | ||
CNH Industrial Capital LLC, 4.20%, 01/15/24 |
| 280,000 |
| 298,587 | ||
General Electric Co., Series D, 5.00%, (3-Month USD LIBOR + 3.33%)#@ |
| 175,000 |
| 136,957 | ||
Howmet Aerospace, Inc., 6.88%, 05/01/25 |
| 40,000 |
| 43,439 | ||
Penske Truck Leasing Co. LP/PTL Finance Corp., 4.13%, 08/01/23‡ |
| 165,000 |
| 176,350 | ||
Stanley Black & Decker, Inc., 4.00%, (US 5 Year CMT T-Note + 2.66%), 03/15/60@ |
| 190,000 |
| 190,298 | ||
TransDigm, Inc., 6.25%, 03/15/26‡ |
| 70,000 |
| 69,947 | ||
WESCO Distribution, Inc., 7.13%, 06/15/25‡ |
| 15,000 |
| 15,834 | ||
Total Industrials |
|
| 1,115,267 | |||
Information Technology — 2.1% | ||||||
Broadcom, Inc., 3.15%, 11/15/25‡ |
| 145,000 |
| 154,515 | ||
Dell International LLC / EMC Corp., 4.00%, 07/15/24‡ |
| 145,000 |
| 156,476 | ||
Flex Ltd., 3.75%, 02/01/26 |
| 116,000 |
| 123,079 | ||
Hewlett Packard Enterprise Co., 2.25%, 04/01/23 |
| 180,000 |
| 185,465 | ||
HP, Inc., 2.20%, 06/17/25 |
| 53,000 |
| 54,768 | ||
HP, Inc., 3.00%, 06/17/27 |
| 95,000 |
| 99,753 | ||
Leidos, Inc., 3.63%, 05/15/25‡ |
| 119,000 |
| 130,196 | ||
Microchip Technology, Inc., 2.67%, 09/01/23‡ |
| 150,000 |
| 154,509 | ||
VMware, Inc., 4.50%, 05/15/25 |
| 145,000 |
| 158,815 | ||
Total Information Technology |
|
| 1,217,576 | |||
Materials — 0.4% |
|
| ||||
Ardagh Packaging Finance PLC / Ardagh Holdings USA, Inc., 4.13%, 08/15/26‡ |
| 200,000 |
| 197,114 | ||
See accompanying Notes to Financial Statements.
66
ADVISORSHARES NEWFLEET MULTI-SECTOR INCOME ETF June 30, 2020 |
Investments | Principal | Value | ||||
CORPORATE BONDS (continued) | ||||||
Real Estate — 0.5% |
|
| ||||
GLP Capital LP / GLP Financing II, Inc., 5.25%, 06/01/25 | $ | 55,000 | $ | 59,978 | ||
iStar, Inc., 4.25%, 08/01/25 |
| 70,000 |
| 63,525 | ||
Service Properties Trust, 4.65%, 03/15/24 |
| 195,000 |
| 176,340 | ||
Total Real Estate |
|
| 299,843 | |||
Utilities — 2.8% |
|
| ||||
Avangrid, Inc., 3.20%, 04/15/25 |
| 93,000 |
| 101,819 | ||
DPL, Inc., 4.35%, 04/15/29(a) |
| 250,000 |
| 253,574 | ||
DTE Energy Co., Series C, 2.53%, 10/01/24 |
| 179,000 |
| 187,528 | ||
Exelon Corp., 3.50%, 06/01/22 |
| 212,000 |
| 221,930 | ||
NRG Energy, Inc., 3.75%, 06/15/24‡ |
| 140,000 |
| 148,723 | ||
PSEG Power LLC, 3.85%, 06/01/23 |
| 330,000 |
| 357,091 | ||
Terraform Power Operating LLC, 5.00%, 01/31/28‡ |
| 100,000 |
| 104,481 | ||
Vistra Operations Co. LLC, 3.55%, 07/15/24‡ |
| 235,000 |
| 242,692 | ||
Total Utilities |
|
| 1,617,838 | |||
Total Corporate Bonds |
|
| 14,205,284 | |||
MORTGAGE BACKED SECURITIES — 21.8% | ||||||
Commercial Mortgage Backed Securities — 2.4% | ||||||
Bayview Commercial Asset Trust, Class A2, Series 2006-2A, 0.45%, (1-Month USD LIBOR + 0.28%), 07/25/36@‡ |
| 134,702 |
| 122,069 | ||
BX Trust, Class B, Series 2018-GW, 1.20%, (1-Month USD LIBOR + 1.02%), 05/15/35@‡ |
| 700,000 |
| 654,580 | ||
Commercial Mortgage Trust, Class B, Series 2020-CBM, 3.10%, 02/10/37‡ |
| 150,000 |
| 142,561 | ||
GS Mortgage Securities Trust, Class AS, Series 2020-GC45, 3.17%, 02/13/53 |
| 175,000 |
| 189,159 | ||
Sutherland Commercial Mortgage Loans, Class A, Series 2017-SBC6, 3.19%, 05/25/37@‡* |
| 112,295 |
| 112,793 | ||
Velocity Commercial Capital Loan Trust, Class AFX, Series 2017-1, 3.00%, 05/25/47@‡* |
| 42,353 |
| 42,255 | ||
Investments | Principal | Value | ||||
MORTGAGE BACKED SECURITIES (continued) | ||||||
Commercial Mortgage Backed Securities (continued) | ||||||
Velocity Commercial Capital Loan Trust, Class AFX, Series 2020-1, 2.61%, 02/25/50@‡* | $ | 133,892 | $ | 134,827 | ||
Total Commercial Mortgage Backed Securities |
|
| 1,398,244 | |||
Residential Mortgage Backed Securities — 19.4% | ||||||
Ajax Mortgage Loan Trust, Class A, Series 2017-B, 3.16%, 09/25/56@‡* |
| 201,809 |
| 202,538 | ||
Arroyo Mortgage Trust, Class A1, Series 2019-2, 3.35%, 04/25/49@‡* |
| 113,232 |
| 116,365 | ||
Banc of America Funding Trust, Class 1A1, Series 2005-1, 5.50%, 02/25/35 |
| 113,566 |
| 116,315 | ||
Bayview Koitere Fund Trust, Class A, Series 2017-RT4, 3.50%, 07/28/57@‡* |
| 132,683 |
| 137,680 | ||
Bayview Opportunity Master Fund IVb Trust, Class A, Series 2017-SPL4, 3.50%, 01/28/55@‡* |
| 264,361 |
| 270,434 | ||
Centex Home Equity Loan Trust, Class AF5, Series 2004-D, 5.20%, 09/25/34 |
| 114,669 |
| 116,748 | ||
Citigroup Mortgage Loan Trust, Inc., Class A, Series 2014-A, 4.00%, 01/25/35@‡* |
| 232,188 |
| 245,409 | ||
Citigroup Mortgage Loan Trust, Inc., Class A1, Series 2015-PS1, 3.75%, 09/25/42@‡* |
| 123,619 |
| 127,680 | ||
Citigroup Mortgage Loan Trust, Inc., Class A1, Series 2015-A, 3.50%, 06/25/58@‡* |
| 195,011 |
| 201,520 | ||
Citigroup Mortgage Loan Trust, Inc., Class A1, Series 2018-RP1, 3.00%, 09/25/64@‡* |
| 150,502 |
| 157,316 | ||
COLT Mortgage Loan Trust, Class A1, Series 2018-2, 3.47%, 07/27/48@‡* |
| 77,060 |
| 77,957 | ||
COLT Mortgage Loan Trust, Class A1, Series 2020-1, 2.49%, 02/25/50@‡* |
| 125,018 |
| 126,688 | ||
Credit Suisse Commercial Mortgage Trust, Class A16, Series 2013-HYB1, 2.97%, 04/25/43@‡* |
| 125,116 |
| 128,306 | ||
See accompanying Notes to Financial Statements.
67
ADVISORSHARES NEWFLEET MULTI-SECTOR INCOME ETF June 30, 2020 |
Investments | Principal | Value | ||||
MORTGAGE BACKED SECURITIES (continued) | ||||||
Residential Mortgage Backed Securities (continued) | ||||||
Credit Suisse Commercial Mortgage Trust, Class A2, Series 2014-IVR2, 3.76%, 04/25/44@‡* | $ | 339,406 | $ | 357,646 | ||
Credit Suisse First Boston Mortgage Securities Corp., Class 6A1, Series 2004-AR8, 3.85%, 09/25/34@* |
| 17,928 |
| 18,041 | ||
Credit Suisse First Boston Mortgage-Backed Pass-Through Certificates, Class 5A1, Series 2003-AR30, 3.67%, 01/25/34@* |
| 73,606 |
| 74,959 | ||
Deephaven Residential Mortgage Trust, Class A3, Series 2017-3A, 2.81%, 10/25/47@‡* |
| 42,714 |
| 43,187 | ||
Deephaven Residential Mortgage Trust, Class A1, Series 2019-1A, 3.74%, 01/25/59@‡* |
| 243,068 |
| 244,411 | ||
Ellington Financial Mortgage Trust, Class A3, Series 2019-2, 3.05%, 11/25/59@‡* |
| 85,827 |
| 86,329 | ||
Galton Funding Mortgage Trust, Class A21, Series 2017-1, 3.50%, 07/25/56@‡* |
| 313,510 |
| 323,247 | ||
Galton Funding Mortgage Trust, Class A41, Series 2018-2, 4.50%, 10/25/58@‡* |
| 73,766 |
| 75,806 | ||
Galton Funding Mortgage Trust, Class A1, Series 2020-H1, 2.31%, 01/25/60@‡* |
| 163,003 |
| 163,992 | ||
GCAT LLC, Class A1, Series 2019-NQM1, 2.99%, 02/25/59‡ |
| 451,601 |
| 457,817 | ||
GSAA Trust, Class AF4, Series 2005-1, 5.62%, 11/25/34 |
| 2,581 |
| 2,582 | ||
GSR Mortgage Loan Trust, Class 1A6, Series 2003-3F, 6.00%, 04/25/33 |
| 141,429 |
| 148,191 | ||
GSR Mortgage Loan Trust, Class 3A1, Series 2004-7, 2.80%, 06/25/34@* |
| 124,052 |
| 119,569 | ||
Homeward Opportunities Fund I Trust, Class A1, Series 2018-1, 3.77%, 06/25/48@‡* |
| 210,487 |
| 215,266 | ||
Investments | Principal | Value | ||||
MORTGAGE BACKED SECURITIES (continued) | ||||||
Residential Mortgage Backed Securities (continued) | ||||||
Homeward Opportunities Fund I Trust, Class A1, Series 2019-1, 3.45%, 01/25/59@‡* | $ | 212,990 | $ | 217,371 | ||
Homeward Opportunities Fund I Trust, Class A1, Series 2019-3, 2.68%, 11/25/59@‡* |
| 150,156 |
| 151,975 | ||
JPMorgan Mortgage Trust, Class AM, Series 2014-2, 3.34%, 06/25/29@‡* |
| 364,737 |
| 374,955 | ||
JPMorgan Mortgage Trust, Class 2A2, Series 2014-2, 3.50%, 06/25/29@‡* |
| 180,195 |
| 186,133 | ||
JPMorgan Mortgage Trust, Class 4A1, Series 2006-A2, 3.60%, 08/25/34@* |
| 73,396 |
| 74,024 | ||
JPMorgan Mortgage Trust, Class 4A1, Series 2005-A2, 3.65%, 04/25/35@* |
| 267,496 |
| 255,753 | ||
JPMorgan Mortgage Trust, Class A2, Series 2015-5, 2.76%, 05/25/45@‡* |
| 251,252 |
| 258,653 | ||
LHOME Mortgage Trust, Class A1, Series 2019-RTL1, 4.58%, 10/25/23‡ |
| 315,000 |
| 314,742 | ||
MASTR Alternative Loan Trust, Class 6A1, Series 2004-4, 5.50%, 04/25/34 |
| 182,917 |
| 190,896 | ||
MASTR Alternative Loan Trust, Class 2A1, Series 2005-2, 6.00%, 01/25/35 |
| 121,990 |
| 130,536 | ||
MASTR Specialized Loan Trust, Class A2, Series 2005-3, 5.70%, 11/25/35‡ |
| 55,761 |
| 56,095 | ||
National City Mortgage Capital Trust, Class 2A1, Series 2008-1, 6.00%, 03/25/38 |
| 83,820 |
| 85,207 | ||
New Residential Mortgage Loan Trust, Class A1, Series 2019-NQM1, 3.67%, 01/25/49@‡* |
| 60,163 |
| 60,526 | ||
New Residential Mortgage Loan Trust, Class A3, Series 2014-2A, 3.75%, 05/25/54@‡* |
| 103,811 |
| 111,702 | ||
New Residential Mortgage Loan Trust, Class AFX3, Series 2014-3A, 3.75%, 11/25/54@‡* |
| 180,584 |
| 194,132 | ||
See accompanying Notes to Financial Statements.
68
ADVISORSHARES NEWFLEET MULTI-SECTOR INCOME ETF June 30, 2020 |
Investments | Principal | Value | ||||
MORTGAGE BACKED SECURITIES (continued) | ||||||
Residential Mortgage Backed Securities (continued) | ||||||
New Residential Mortgage Loan Trust, Class A1, Series 2016-3A, 3.75%, 09/25/56@‡* | $ | 417,000 | $ | 445,718 | ||
New Residential Mortgage Loan Trust, Class A1, Series 2016-4A, 3.75%, 11/25/56@‡* |
| 288,318 |
| 308,595 | ||
OBX Trust, Class A3, Series 2019-INV1, 4.50%, 11/25/48@‡* |
| 186,865 |
| 195,781 | ||
OBX Trust, Class 1A8, Series 2019-EXP3, 3.50%, 10/25/59@‡* |
| 134,921 |
| 138,930 | ||
RCKT Mortgage Trust, Class A1, Series 2020-1, 3.00%, 02/25/50@‡* |
| 169,537 |
| 174,744 | ||
RCO V Mortgage LLC, Class A1, Series 2019-1, 3.72%, 05/24/24‡ |
| 173,055 |
| 173,862 | ||
Residential Mortgage Loan Trust, Class A1, Series 2019-1, 3.94%, 10/25/58@‡* |
| 165,129 |
| 166,875 | ||
SG Residential Mortgage Trust, Class A1, Series 2019-3, 2.70%, 09/25/59@‡* |
| 170,193 |
| 172,017 | ||
Spruce Hill Mortgage Loan Trust, Class A1, Series 2019-SH1, 3.40%, 04/29/49@‡* |
| 101,759 |
| 102,861 | ||
Structured Asset Securities Corp., Class A3A, Series 2004-4XS, 5.50%, 02/25/34 |
| 341,256 |
| 358,491 | ||
Structured Asset Securities Corp. Mortgage Pass-Through Certificates, Class 6A, Series 2003-34A, 3.85%, 11/25/33@* |
| 140,843 |
| 133,629 | ||
Towd Point HE Trust, Class A1, Series 2019-HE1, 1.08%, (1-Month USD LIBOR + 0.90%), 04/25/48@‡ |
| 97,494 |
| 96,112 | ||
Towd Point Mortgage Trust, Class A2, Series 2015-5, 3.50%, 05/25/55@‡* |
| 250,000 |
| 261,077 | ||
Verus Securitization Trust, Class A1, Series 2017-1A, 2.85%, 01/25/47@‡* |
| 37,881 |
| 37,909 | ||
Verus Securitization Trust, Class A3, Series 2018-INV1, 4.05%, 03/25/58@‡* |
| 52,867 |
| 53,058 | ||
Investments | Principal | Value | ||||
MORTGAGE BACKED SECURITIES (continued) | ||||||
Residential Mortgage Backed Securities (continued) | ||||||
Verus Securitization Trust, Class B1, Series 2018-2, 4.43%, 06/01/58@‡* | $ | 180,000 | $ | 179,376 | ||
Verus Securitization Trust, Class A1, Series 2018-3, 4.11%, 10/25/58@‡* |
| 111,383 |
| 114,365 | ||
Verus Securitization Trust, Class A1, Series 2019-2, 3.21%, 05/25/59@‡* |
| 409,809 |
| 418,379 | ||
Verus Securitization Trust, Class A1, Series 2019-INV1, 3.40%, 12/25/59@‡* |
| 220,548 |
| 226,463 | ||
WaMu Mortgage Pass-Through Certificates Trust, Class A1, Series 2003-AR6, 3.10%, 06/25/33@* |
| 84,344 |
| 83,235 | ||
Washington Mutual MSC Mortgage Pass-Through Certificates Trust, Class 2A1, Series 2003-AR4, 3.57%, 08/25/33@* |
| 31,569 |
| 30,580 | ||
Wells Fargo Mortgage Backed Securities Trust, Class 2A12, Series 2004-K, 3.32%, 07/25/34@* |
| 37,486 |
| 37,403 | ||
Wells Fargo Mortgage Backed Securities Trust, Class 1A2, Series 2004-K, 3.01%, 07/25/34@* |
| 102,708 |
| 102,071 | ||
Wells Fargo Mortgage Backed Securities Trust, Class A1, Series 2004-U, 4.33%, 10/25/34@* |
| 144,127 |
| 143,623 | ||
Total Residential Mortgage Backed Securities |
|
| 11,173,853 | |||
Total Mortgage Backed Securities |
|
| 12,572,097 | |||
U.S. TREASURY NOTES — 7.7% | ||||||
U.S. Treasury Note, 2.25%, 03/31/21 |
| 880,000 |
| 893,750 | ||
U.S. Treasury Note, 0.13%, 05/31/22 |
| 1,110,000 |
| 1,109,263 | ||
U.S. Treasury Note, 1.75%, 06/15/22 |
| 1,650,000 |
| 1,701,305 | ||
U.S. Treasury Note, 0.50%, 03/31/25 |
| 455,000 |
| 459,914 | ||
U.S. Treasury Note, 2.63%, 02/15/29 |
| 235,000 |
| 275,423 | ||
Total U.S. Treasury Notes |
|
| 4,439,655 | |||
See accompanying Notes to Financial Statements.
69
ADVISORSHARES NEWFLEET MULTI-SECTOR INCOME ETF June 30, 2020 |
Investments | Principal | Value | ||||
FOREIGN BONDS — 5.6% |
|
| ||||
Consumer Staples — 0.4% |
|
| ||||
BAT Capital Corp. (United Kingdom), 2.76%, 08/15/22 | $ | 255,000 | $ | 264,147 | ||
Energy — 0.5% |
|
| ||||
BP Capital Markets PLC (United Kingdom), 4.88%, (US 5 Year CMT T-Note + 4.40%)#@ |
| 80,000 |
| 82,800 | ||
CNOOC Finance 2013 Ltd. (China), 3.00%, 05/09/23 |
| 200,000 |
| 208,940 | ||
Total Energy |
|
| 291,740 | |||
Financials — 1.1% |
|
| ||||
AerCap Ireland Capital DAC / AerCap Global Aviation Trust (Ireland), 3.95%, 02/01/22 |
| 150,000 |
| 150,114 | ||
Banco Santander (Chile), 2.70%, 01/10/25‡ |
| 150,000 |
| 154,314 | ||
Industrial & Commercial Bank of China Ltd. (China), 2.96%, 11/08/22 |
| 250,000 |
| 259,721 | ||
Toronto-Dominion Bank (The) (Canada), 2.65%, 06/12/24 |
| 57,000 |
| 61,029 | ||
Total Financials |
|
| 625,178 | |||
Industrials — 1.3% |
|
| ||||
Ashtead Capital, Inc. (United Kingdom), 4.38%, 08/15/27‡ |
| 200,000 |
| 206,072 | ||
Avolon Holdings Funding Ltd. (Ireland), 3.95%, 07/01/24‡ |
| 249,000 |
| 216,529 | ||
Doric Nimrod Air Finance Alpha Ltd. Class A Pass-Through Trust, Series 2012-1A (Guernsey), 5.13%, 11/30/22‡ |
| 331,043 |
| 306,498 | ||
Total Industrials |
|
| 729,099 | |||
Information Technology — 0.2% | ||||||
Open Text Corp. (Canada), 3.88%, 02/15/28‡ |
| 140,000 |
| 135,034 | ||
Materials — 0.3% |
|
| ||||
NOVA Chemicals Corp. (Canada), 5.00%, 05/01/25‡ |
| 200,000 |
| 184,021 | ||
Oil & Gas — 0.3% |
|
| ||||
Petroleos Mexicanos (Mexico), 4.63%, 09/21/23 |
| 180,000 |
| 173,134 | ||
Investments | Principal | Value | ||||
FOREIGN BONDS (continued) |
| |||||
Sovereign Government — 1.5% |
| |||||
Indonesia Government International Bond (Indonesia), 5.88%, 01/15/24‡ | $ | 200,000 | $ | 227,266 | ||
Qatar Government International Bond (Qatar), 3.40%, 04/16/25‡ |
| 200,000 |
| 218,001 | ||
Republic of South Africa Government International Bond (South Africa), 5.88%, 09/16/25 |
| 200,000 |
| 212,656 | ||
Turkey Government International Bond (Turkey), 7.38%, 02/05/25 |
| 185,000 |
| 195,314 | ||
Total Sovereign Government |
|
| 853,237 | |||
Total Foreign Bonds |
|
| 3,255,590 | |||
TERM LOANS — 4.2% |
|
| ||||
Aerospace — 0.4% |
|
| ||||
Kestrel Bidco, Inc., 4.00%, (1-Month USD LIBOR + 3.00%), 12/11/26@ |
| 69,650 |
| 56,591 | ||
Mileage Plus Holdings LLC, 06/25/27(b) |
| 45,000 |
| 44,723 | ||
TransDigm, Inc., 2.43%, (1-Month USD LIBOR + 2.25%), 08/22/24@ |
| 164,938 |
| 149,968 | ||
Total Aerospace |
|
| 251,282 | |||
Chemicals — 0.4% |
|
| ||||
Ineos US Finance LLC, 2.18%, (1-Month USD LIBOR + 2.00%), 04/01/24@ |
| 242,617 |
| 230,563 | ||
Financials — 0.3% |
|
| ||||
Delos Finance S.a.r.l., 2.06%, (3-Month USD LIBOR + 1.75%), 10/06/23@ |
| 153,300 |
| 147,216 | ||
Food/Tobacco — 0.3% |
|
| ||||
Aramark Servies, Inc., 1.93%, (1-Month USD LIBOR + 1.75%), 03/28/24@ |
| 202,310 |
| 192,118 | ||
Forest Prod/Containers — 0.0%** | ||||||
Reynolds Consumer Products LLC, 1.93%, (3-Month USD LIBOR + 1.75%), 02/04/27@ |
| 19,950 |
| 19,280 | ||
See accompanying Notes to Financial Statements.
70
ADVISORSHARES NEWFLEET MULTI-SECTOR INCOME ETF June 30, 2020 |
Investments |
| Value | ||||
TERM LOANS (continued) |
| |||||
Gaming/Leisure — 0.1% |
|
| ||||
Aristocrat International Pty Ltd., 4.75%, (3-Month USD LIBOR + 3.75%), 10/19/24@ | $ | 15,000 | $ | 14,915 | ||
Station Casinos LLC, 2.50%, (1-Month USD LIBOR + 2.25%), 02/08/27@ |
| 49,674 |
| 45,514 | ||
Total Gaming/Leisure |
|
| 60,429 | |||
Health Care — 0.5% |
|
| ||||
Elanco Animal Health, Inc., 02/04/27(b) |
| 15,000 |
| 14,344 | ||
Valeant Pharmaceuticals International, Inc., 3.19%, (1-Month USD LIBOR + 3.00%), 06/02/25@ |
| 253,001 |
| 246,613 | ||
Total Health Care |
|
| 260,957 | |||
Information Technology — 0.2% |
| |||||
Science Applications International Corp., 2.43%, (1-Month USD LIBOR + 2.25%), 03/12/27@ |
| 45,850 |
| 44,818 | ||
SS&C Technologies, Inc., 1.93%, (1-Month USD LIBOR + 1.75%), 04/16/25@ |
| 59,846 |
| 57,323 | ||
Total Information Technology |
|
| 102,141 | |||
Manufacturing — 0.1% |
|
| ||||
Gardner Denver, Inc., 03/01/27(b) |
| 5,000 |
| 4,872 | ||
Ingersoll-Rand Services Co., 1.93%, (1-Month USD LIBOR + 1.75%), 03/01/27@ |
| 59,850 |
| 57,195 | ||
NCR Corp., 2.68%, (1-Month USD LIBOR + 2.50%), 08/28/26@ |
| 14,962 |
| 14,513 | ||
Total Manufacturing |
|
| 76,580 | |||
Media/Telecom – Broadcasting — 0.2% |
| |||||
Nexstar Media Group, Inc., 2.92%, (3-Month USD LIBOR + 2.75%), 09/18/26@ |
| 100,866 |
| 96,309 | ||
Media/Telecom – Cable/Wireless Video — 0.6% | ||||||
CSC Holdings, LLC (fka CSC Holdings, Inc. (Cablevision)), 2.43%, (1-Month USD LIBOR + 2.25%), 07/17/25@ |
| 184,514 |
| 175,201 | ||
Virgin Media Bristol LLC, 2.68%, (3-Month USD LIBOR + 2.50%), 01/31/28@ |
| 145,000 |
| 138,856 | ||
Total Media/Telecom – Cable/Wireless Video |
|
| 314,057 | |||
Investments | Principal/ | Value | ||||
TERM LOANS (continued) |
| |||||
Media/Telecom – Diversified Media — 0.2% | ||||||
Clear Channel, 4.26%, (1-Month USD LIBOR + 3.50%), 08/21/26@ | $ | 109,175 | $ | 99,568 | ||
Media/Telecom – Telecommunications — 0.1% | ||||||
CenturyLink, Inc., 2.43%, (1-Month USD LIBOR + 2.25%), 03/15/27@ |
| 64,650 |
| 61,180 | ||
Media/Telecom – Wireless Communications — 0.3% | ||||||
CommScope Holding Co., Inc., 3.43%, (1-Month USD LIBOR + 3.25%), 04/06/26@ |
| 24,813 |
| 23,593 | ||
T-Mobile USA, Inc., 3.18%, (1-Month USD LIBOR + 3.00%), 04/01/27@ |
| 175,000 |
| 174,920 | ||
Total Media/Telecom – Wireless Communications |
|
| 198,513 | |||
Transportation – Land Transportation — 0.0%** | ||||||
Genesse & Wyoming Inc., 2.31%, (1-Month USD LIBOR + 2.00%), 12/30/26@ |
| 24,938 |
| 24,078 | ||
Utility — 0.5% |
|
| ||||
Calpine Corp., 2.43%, (3-Month USD LIBOR + 2.25%), 01/15/24@ |
| 278,882 |
| 269,934 | ||
Total Term Loans |
|
| 2,404,205 | |||
EXCHANGE TRADED FUND — 1.1% |
| |||||
Debt Fund — 1.1% |
|
| ||||
iShares iBoxx $ High Yield Corporate Bond ETF |
| 8,185 |
| 668,060 | ||
FEDERAL HOME LOAN MORTGAGE CORPORATION — 0.9% | ||||||
Federal National Mortgage Association, 3.50%, 07/01/49 |
| 476,671 |
| 501,131 | ||
MONEY MARKET FUND — 6.6% |
| |||||
JPMorgan U.S. Government Money Market Fund – Institutional Class, 0.07%(c) |
| 3,828,174 |
| 3,828,174 | ||
See accompanying Notes to Financial Statements.
71
ADVISORSHARES NEWFLEET MULTI-SECTOR INCOME ETF June 30, 2020 |
Investments | Principal | Value | |||||
REPURCHASE AGREEMENT — 0.1%(d) |
| ||||||
Citibank NA, dated 06/30/20, due 07/01/20, 0.09%, total to be received $49,826, (collateralized by various U.S. Government Agency Obligations, 0.00%-4.50%, 07/01/24-12/01/48, totaling $50,727) | $ | 49,826 | $ | 49,826 |
| ||
Total Investments – 102.5% |
|
| 59,226,181 |
| |||
Liabilities in Excess of Other Assets — (2.5%) |
|
| (1,459,081 | ) | |||
Net Assets — 100.0% |
| $ | 57,767,100 |
| |||
____________
ETF — Exchange Traded Fund
LIBOR — London Interbank Offered Rate
LP — Limited Partnership
PLC — Public Limited Company
SOFR — Secured Overnight Financing Rate
# Perpetual security with no stated maturity date.
@ Variable rate instrument. The interest rate shown reflects the rate in effect at June 30, 2020.
* Adjustable rate security with an interest rate that is not based on a published reference index and spread. The rate is based on the structure of the agreement and current market conditions.
** Less than 0.05%.
‡ Security was purchased pursuant to Rule 144A under the Securities Act of 1933 and may not be resold subject to that rule except to qualified institutional buyers. Unless otherwise noted, 144A securities are deemed to be liquid.
(a) All or a portion of security is on loan. The aggregate market value of the securities on loan is $48,185; the aggregate market value of the collateral held by the fund is $49,826.
(b) This loan will settle after June 30, 2020 at which time the interest rate will be determined.
(c) Rate shown reflects the 7-day yield as of June 30, 2020.
(d) Collateral received from brokers for securities lending was invested in these short-term investments.
Fair Value Measurements
The following is a summary of the inputs used, as of June 30, 2020, in valuing the Fund’s assets and liabilities carried at fair value. These inputs are summarized in three broad levels. Level 1 includes quoted prices in active markets for identical securities. Level 2 includes other significant observable inputs (including quoted prices for similar securities, interest rates, prepayment speeds and credit risk). Level 3 includes significant unobservable inputs (including the Fund’s own assumptions in determining the fair value of investments). The level assigned to the securities valuations may not be an indication of the risk or liquidity associated with investing in those securities.
Assets | Level 1 | Level 2 | Level 3 | Total | ||||||||
Asset Backed Securities | $ | — | $ | 17,302,159 | $ | — | $ | 17,302,159 | ||||
Corporate Bonds |
| — |
| 14,205,284 |
| — |
| 14,205,284 | ||||
Mortgage Backed Securities |
| — |
| 12,572,097 |
| — |
| 12,572,097 | ||||
U.S. Treasury Notes |
| — |
| 4,439,655 |
| — |
| 4,439,655 | ||||
Foreign Bonds |
| — |
| 3,255,590 |
| — |
| 3,255,590 | ||||
Term Loans |
| — |
| 2,404,205 |
| — |
| 2,404,205 | ||||
Exchange Traded Fund |
| 668,060 |
| — |
| — |
| 668,060 | ||||
Federal Home Loan Mortgage Corporation |
| — |
| 501,131 |
| — |
| 501,131 | ||||
Money Market Fund |
| 3,828,174 |
| — |
| — |
| 3,828,174 | ||||
Repurchase Agreement |
| — |
| 49,826 |
| — |
| 49,826 | ||||
Total | $ | 4,496,234 | $ | 54,729,947 | $ | — | $ | 59,226,181 | ||||
See accompanying Notes to Financial Statements.
72
ADVISORSHARES NEWFLEET MULTI-SECTOR INCOME ETF June 30, 2020 |
SUMMARY OF SCHEDULE OF INVESTMENTS
% of | |||
Aerospace | 0.4 | % | |
Asset Backed Securities | 29.9 |
| |
Chemicals | 0.4 |
| |
Commercial Mortgage Backed Securities | 2.4 |
| |
Communication Services | 1.8 |
| |
Consumer Discretionary | 2.1 |
| |
Consumer Staples | 1.3 |
| |
Debt Fund | 1.1 |
| |
Energy | 1.7 |
| |
Federal Home Loan Mortgage Corporation | 0.9 |
| |
Financials | 11.1 |
| |
Food/Tobacco | 0.3 |
| |
Forest Prod/Containers | 0.0 | ** | |
Gaming/Leisure | 0.1 |
| |
Health Care | 1.7 |
| |
Industrials | 3.2 |
| |
Information Technology | 2.5 |
| |
Manufacturing | 0.1 |
| |
Materials | 0.7 |
| |
SUMMARY OF SCHEDULE OF INVESTMENTS (continued)
% of | |||
Media/Telecom – Broadcasting | 0.2 | % | |
Media/Telecom – Cable/Wireless Video | 0.6 |
| |
Media/Telecom – Diversified Media | 0.2 |
| |
Media/Telecom – Telecommunications | 0.1 |
| |
Media/Telecom – Wireless Communications | 0.3 |
| |
Oil & Gas | 0.3 |
| |
Real Estate | 0.5 |
| |
Residential Mortgage Backed Securities | 19.4 |
| |
Sovereign Government | 1.5 |
| |
Transportation – Land Transportation | 0.0 | ** | |
U.S. Treasury Notes | 7.7 |
| |
Utilities | 2.8 |
| |
Utility | 0.5 |
| |
Money Market | 6.6 |
| |
Repurchase Agreements | 0.1 |
| |
Total Investments | 102.5 |
| |
Liabilities in Excess of Other Assets | (2.5 | ) | |
Net Assets | 100.0 | % | |
____________
** Less than 0.05%.
See accompanying Notes to Financial Statements.
73
Investments |
| Value | |||
COMMON STOCKS — 78.7% |
| ||||
Agriculture — 9.1% |
| ||||
Village Farms International, Inc. (Canada)*(a) | 866,893 | $ | 4,152,418 | ||
Biotechnology — 5.7% |
| ||||
Arena Pharmaceuticals, Inc.* | 40,905 |
| 2,574,970 | ||
Distributors — 2.5% |
| ||||
Greenlane Holdings, Inc., Class A* | 288,656 |
| 1,148,851 | ||
Investment Companies — 2.0% |
| ||||
Canopy Rivers, Inc. (Canada)* | 1,100,004 |
| 896,479 | ||
Pharmaceuticals — 45.1% |
| ||||
Aleafia Health, Inc. (Canada)* | 2,623,468 |
| 953,463 | ||
Aphria, Inc. (Canada)*(a) | 567,756 |
| 2,435,673 | ||
Aurora Cannabis, Inc. (Canada)* | 11,874 |
| 147,475 | ||
Canopy Growth Corp. (Canada)*(a) | 98,420 |
| 1,590,467 | ||
Cardiol Therapeutics, Inc., Class A (Canada)*(a) | 243,504 |
| 423,718 | ||
cbdMD, Inc.*(a) | 438,146 |
| 836,859 | ||
Charlottes Web Holdings, Inc.*(a) | 256,731 |
| 985,832 | ||
Corbus Pharmaceuticals Holdings, Inc.* | 189,814 |
| 1,592,539 | ||
Emerald Health Therapeutics, Inc. (Canada)* | 1,355,210 |
| 169,153 | ||
Green Organic Dutchman Holdings Ltd. (The) (Canada)*(a) | 558,632 |
| 149,707 | ||
GW Pharmaceuticals PLC (United Kingdom)*(a)(b) | 29,758 |
| 3,651,902 | ||
HEXO Corp. (Canada)*(a) | 157,680 |
| 116,462 | ||
Intec Pharma Ltd. (Israel)* | 452,288 |
| 128,133 | ||
Khiron Life Sciences Corp. (Canada)*(a) | 543,329 |
| 215,417 | ||
MediPharm Labs Corp. (Canada)*(a) | 467,734 |
| 394,930 | ||
Neptune Wellness Solutions, Inc. (Canada)*(a) | 426,672 |
| 1,194,682 | ||
Organigram Holdings, Inc. (Canada)*(a) | 1,221,438 |
| 1,901,210 | ||
Supreme Cannabis Co., Inc. (The) (Canada)*(a) | 821,958 |
| 153,891 | ||
Tilray, Inc., Class 2 (Canada)*(a) | 12,365 |
| 87,915 | ||
Valens Co., Inc. (The) (Canada)*(a) | 1,055,428 |
| 1,859,785 | ||
WeedMD, Inc. (Canada)*(a) | 587,544 |
| 209,221 | ||
Zynerba Pharmaceuticals, Inc.*(a) | 380,685 |
| 1,282,908 | ||
Total Pharmaceuticals |
| 20,481,342 | |||
Investments | Shares/ | Value | ||||
COMMON STOCKS (continued) |
| |||||
REITS — 9.4% |
|
| ||||
Innovative Industrial Properties, Inc. |
| 48,420 | $ | 4,261,928 | ||
Specialty Retail — 4.9% |
|
| ||||
GrowGeneration Corp.*(a) |
| 327,239 |
| 2,238,315 | ||
Total Common Stocks |
|
| 35,754,303 | |||
MONEY MARKET FUND — 7.9% |
| |||||
BlackRock Liquidity Funds Treasury Trust Fund Portfolio, Institutional Class, 0.06%(c) |
| 3,608,987 |
| 3,608,987 | ||
REPURCHASE AGREEMENTS — 28.1%(d) |
| |||||
Citigroup Global Markets, Inc., dated 06/30/20, due 07/01/20, 0.09%, total to be received $2,980,101, (collateralized by various U.S. Government Agency Obligations, 0.50% – 7.50%, 07/31/21 – 05/20/70, totaling $3,027,762) | $ | 2,980,094 |
| 2,980,094 | ||
Daiwa Capital Markets America, dated 06/30/20, due 07/01/20, 0.10%, total to be received $2,980,102, (collateralized by various U.S. Government Agency Obligations, 0.00% – 6.50%, 07/28/20 – 03/01/52, totaling $3,031,625) |
| 2,980,094 |
| 2,980,094 | ||
HSBC Securities USA, Inc., dated 06/30/20, due 07/01/20, 0.08%, total to be received $3,050,674, (collateralized by various U.S. Government Agency Obligations, 0.00% – 4.50%, 05/15/44 – 03/20/50, totaling $3,103,366) |
| 3,050,667 |
| 3,050,667 | ||
JP Morgan Securities LLC, dated 06/30/20, due 07/01/20, 0.07%, total to be received $812,864, (collateralized by various U.S. Government Agency Obligations, 0.00% – 2.50%, 10/08/20 – 04/30/23, totaling $828,751) |
| 812,862 |
| 812,862 | ||
See accompanying Notes to Financial Statements.
74
ADVISORSHARES PURE CANNABIS ETF June 30, 2020 |
Investments | Principal | Value | |||||
REPURCHASE AGREEMENTS (continued) |
|
| |||||
RBC Dominion Securities, Inc., dated 06/30/20, due 07/01/20, 0.09%, total to be received $2,980,101, (collateralized by various U.S. Government Agency Obligations, 0.00% – 7.00%, 07/31/20 – 07/01/50, totaling $3,032,571) | $ | 2,980,094 | $ | 2,980,094 |
| ||
Total Repurchase Agreements |
|
| 12,803,811 |
| |||
Total Investments — 114.7% |
|
| 52,167,101 |
| |||
Liabilities in Excess of Other Assets — (14.7%) |
|
| (6,664,273 | ) | |||
Net Assets — 100.0% |
| $ | 45,502,828 |
| |||
____________
PLC — Public Limited Company
REITS — Real Estate Investment Trusts
* Non-income producing security.
(a) All or a portion of security is on loan. The aggregate market value of the securities on loan is $14,994,905; the aggregate market value of the collateral held by the fund is $17,321,990. The aggregate market value of the collateral includes non-cash U.S. Treasury securities collateral having a value of $4,518,179.
(b) American Depositary Receipt.
(c) Rate shown reflects the 7-day yield as of June 30, 2020.
(d) Collateral received from brokers for securities lending was invested in these short-term investments.
Fair Value Measurements
The following is a summary of the inputs used, as of June 30, 2020, in valuing the Fund’s assets and liabilities carried at fair value. These inputs are summarized in three broad levels. Level 1 includes quoted prices in active markets for identical securities. Level 2 includes other significant observable inputs (including quoted prices for similar securities, interest rates, prepayment speeds and credit risk). Level 3 includes significant unobservable inputs (including the Fund’s own assumptions in determining the fair value of investments). The level assigned to the securities valuations may not be an indication of the risk or liquidity associated with investing in those securities.
Assets | Level 1 | Level 2 | Level 3 | Total | ||||||||
Common Stocks | $ | 35,754,303 | $ | — | $ | — | $ | 35,754,303 | ||||
Money Market Fund |
| 3,608,987 |
| — |
| — |
| 3,608,987 | ||||
Repurchase Agreements |
| — |
| 12,803,811 |
| — |
| 12,803,811 | ||||
Swaps† |
| — |
| 265,830 |
| — |
| 265,830 | ||||
Total | $ | 39,363,290 | $ | 13,069,641 | $ | — | $ | 52,432,931 | ||||
Liabilities | Level 1 | Level 2 | Level 3 | Total | ||||||||||
Swaps† | $ | — | $ | (5,008 | ) | $ | — | $ | (5,008 | ) | ||||
Total | $ | — | $ | (5,008 | ) | $ | — | $ | (5,008 | ) | ||||
____________
†Derivative instruments, including swap contracts and futures contracts, are valued at the net unrealized gain (loss) on the instrument.
See accompanying Notes to Financial Statements.
75
ADVISORSHARES PURE CANNABIS ETF June 30, 2020 |
SUMMARY OF SCHEDULE OF INVESTMENTS
% of | |||
Agriculture | 9.1 | % | |
Biotechnology | 5.7 |
| |
Distributors | 2.5 |
| |
Investment Companies | 2.0 |
| |
Pharmaceuticals | 45.1 |
| |
REITS | 9.4 |
| |
Specialty Retail | 4.9 |
| |
Money Market Fund | 7.9 |
| |
Repurchase Agreements | 28.1 |
| |
Total Investments | 114.7 |
| |
Liabilities in Excess of Other Assets | (14.7 | ) | |
Net Assets | 100.0 | % | |
Total Return Swap contracts outstanding as of June 30, 2020:
Reference Entity | Number of | Annual | Payment | Termination | Notional | Fair | Unrealized | |||||||||||
Cresco Labs ORD | 106,823 | 1-month USD LIBOR + 1.00% | Quarterly | 7/01/2021 | $ | 428,861 | $ | 440,111 | $ | 11,250 |
| |||||||
Curaleaf Holdings SUB VOT ORD | 464,700 | 1-month USD LIBOR + 1.00% | Quarterly | 7/01/2021 |
| 2,739,682 |
| 2,834,670 |
| 94,988 |
| |||||||
Green Thumb Industries SUB VOT ORD | 300,600 | 1-month USD LIBOR + 1.00% | Quarterly | 7/01/2021 |
| 2,909,598 |
| 3,005,248 |
| 95,650 |
| |||||||
Ianthus ORD | 464,000 | 1-month USD LIBOR + 1.00% | Quarterly | 7/01/2021 |
| 88,528 |
| 83,520 |
| (5,008 | ) | |||||||
Trulieve Cannabis ORD | 218,500 | 1-month USD LIBOR + 1.00% | Quarterly | 7/01/2021 |
| 2,680,418 |
| 2,744,360 |
| 63,942 |
| |||||||
Net Unrealized Appreciation |
|
| $ | 260,822 |
| |||||||||||||
Cowen acts as the counterparty to the total return swap contracts listed above. The Fund either receives fees from, or pays fees to, the counterparty, depending upon the total return of the benchmark, and the agreed-upon floating financing rate. As of June 30, 2020, cash in the amount of $6,100,000 has been segregated as collateral from the broker for swap contracts.
See accompanying Notes to Financial Statements.
76
Investments | Shares | Value | |||||
EXCHANGE TRADED FUND — 39.5% |
| ||||||
Debt Fund — 39.5% |
|
|
| ||||
AdvisorShares Sage Core Reserves ETF† | 650,000 |
| $ | 63,930,750 |
| ||
MONEY MARKET FUNDS — 75.6% |
|
|
| ||||
BlackRock Liquidity Funds FedFund Portfolio, Institutional Class, 0.10%(a) | 91,406,161 |
|
| 91,406,161 |
| ||
Fidelity Institutional Money Market Government Portfolio – Class III, 0.01%(a) | 30,624,111 |
|
| 30,624,111 |
| ||
Morgan Stanley Institutional Liquidity Funds – Government Portfolio, 0.06%(a) | 500,000 |
|
| 500,000 |
| ||
Total Money Market Funds |
|
| 122,530,272 |
| |||
Total Investments Before Securities Sold, Not Yet Purchased |
|
| 186,461,022 |
| |||
Securities Sold, Not Yet Purchased — (102.7)%(b) |
| ||||||
COMMON STOCKS — (102.7)% |
|
|
| ||||
Aerospace/Defense — (1.4)% |
|
|
| ||||
TransDigm Group, Inc. | (5,000 | ) |
| (2,210,250 | ) | ||
Agriculture — (1.8)% |
|
|
| ||||
Altria Group, Inc. | (73,000 | ) |
| (2,865,250 | ) | ||
Airlines — (1.4)% |
|
|
| ||||
Allegiant Travel Co. | (21,000 | ) |
| (2,293,410 | ) | ||
Apparel — (2.7)% |
|
|
| ||||
Canada Goose Holdings, Inc. (Canada)* | (125,000 | ) |
| (2,896,250 | ) | ||
Capri Holdings Ltd.* | (90,000 | ) |
| (1,406,700 | ) | ||
Total Apparel |
|
| (4,302,950 | ) | |||
Banks — (5.2)% |
|
|
| ||||
HSBC Holdings PLC (United Kingdom)(c) | (200,000 | ) |
| (4,666,000 | ) | ||
Wells Fargo & Co. | (150,000 | ) |
| (3,840,000 | ) | ||
Total Banks |
|
| (8,506,000 | ) | |||
Chemicals — (1.4)% |
|
|
| ||||
Mosaic Co. (The) | (175,000 | ) |
| (2,189,250 | ) | ||
Commercial Services — (2.6)% |
|
|
| ||||
GreenSky, Inc., Class A* | (300,000 | ) |
| (1,470,000 | ) | ||
Monro, Inc. | (50,000 | ) |
| (2,747,000 | ) | ||
Total Commercial Services |
|
| (4,217,000 | ) | |||
Investments | Shares | Value | |||||
COMMON STOCKS (continued) |
|
|
| ||||
Computers — (3.7)% |
|
|
| ||||
Cubic Corp. | (50,000 | ) | $ | (2,401,500 | ) | ||
NetApp, Inc. | (50,000 | ) |
| (2,218,500 | ) | ||
Stratasys Ltd.* | (90,000 | ) |
| (1,427,400 | ) | ||
Total Computers |
|
| (6,047,400 | ) | |||
Distribution/Wholesale — (1.2)% |
|
|
| ||||
IAA, Inc.* | (50,000 | ) |
| (1,928,500 | ) | ||
Diversified Financial Services — (6.3)% |
|
|
| ||||
Air Lease Corp. | (31,000 | ) |
| (907,990 | ) | ||
Capital One Financial Corp. | (30,000 | ) |
| (1,877,700 | ) | ||
Credit Acceptance Corp.* | (6,500 | ) |
| (2,723,565 | ) | ||
Pagseguro Digital Ltd., Class A (Brazil)* | (70,000 | ) |
| (2,473,800 | ) | ||
Synchrony Financial | (100,000 | ) |
| (2,216,000 | ) | ||
Total Diversified Financial Services |
|
| (10,199,055 | ) | |||
Electric — (4.4)% |
|
|
| ||||
CenterPoint Energy, Inc. | (135,000 | ) |
| (2,520,450 | ) | ||
OGE Energy Corp. | (65,000 | ) |
| (1,973,400 | ) | ||
Sempra Energy | (22,000 | ) |
| (2,579,060 | ) | ||
Total Electric |
|
| (7,072,910 | ) | |||
Electrical Components & Equipment — (3.3)% |
| ||||||
Acuity Brands, Inc. | (25,000 | ) |
| (2,393,500 | ) | ||
Universal Display Corp. | (20,000 | ) |
| (2,992,400 | ) | ||
Total Electrical Components & Equipment |
|
| (5,385,900 | ) | |||
Engineering & Construction — (1.5)% |
|
|
| ||||
Granite Construction, Inc. | (125,000 | ) |
| (2,392,500 | ) | ||
Entertainment — (2.3)% |
|
|
| ||||
Cinemark Holdings, Inc. | (200,000 | ) |
| (2,310,000 | ) | ||
Madison Square Garden Sports Corp.* | (10,000 | ) |
| (1,468,900 | ) | ||
Total Entertainment |
|
| (3,778,900 | ) | |||
Food — (3.0)% |
|
|
| ||||
Performance Food Group Co.* | (85,000 | ) |
| (2,476,900 | ) | ||
Tyson Foods, Inc., Class A | (40,000 | ) |
| (2,388,400 | ) | ||
Total Food |
|
| (4,865,300 | ) | |||
Food Service — (1.7)% |
|
|
| ||||
Aramark | (120,000 | ) |
| (2,708,400 | ) | ||
Hand/Machine Tools — (2.6)% |
|
|
| ||||
Snap-on, Inc. | (30,000 | ) |
| (4,155,300 | ) | ||
See accompanying Notes to Financial Statements.
77
ADVISORSHARES RANGER EQUITY BEAR ETF June 30, 2020 |
Investments | Shares | Value | |||||
COMMON STOCKS (continued) |
|
|
| ||||
Internet — (4.0)% |
|
|
| ||||
Eventbrite, Inc., Class A* | (200,000 | ) | $ | (1,714,000 | ) | ||
HealthStream, Inc.* | (100,000 | ) |
| (2,213,000 | ) | ||
RealReal, Inc. (The)* | (200,000 | ) |
| (2,558,000 | ) | ||
Total Internet |
|
| (6,485,000 | ) | |||
Iron/Steel — (1.4)% |
|
|
| ||||
Cleveland-Cliffs, Inc. | (400,000 | ) |
| (2,208,000 | ) | ||
Lodging — (3.0)% |
|
|
| ||||
Extended Stay America, Inc. | (200,000 | ) |
| (2,238,000 | ) | ||
Hilton Grand Vacations, Inc.* | (100,000 | ) |
| (1,955,000 | ) | ||
MGM Resorts International | (40,000 | ) |
| (672,000 | ) | ||
Total Lodging |
|
| (4,865,000 | ) | |||
Machinery – Diversified — (1.1)% |
|
|
| ||||
Welbilt, Inc.* | (300,000 | ) |
| (1,827,000 | ) | ||
Media — (2.4)% |
|
|
| ||||
Discovery, Inc., Class A* | (100,000 | ) |
| (2,110,000 | ) | ||
ViacomCBS, Inc., Class B | (75,000 | ) |
| (1,749,000 | ) | ||
Total Media |
|
| (3,859,000 | ) | |||
Office/Business Equipment — (2.2)% |
|
|
| ||||
Canon, Inc. (Japan)(c) | (182,500 | ) |
| (3,644,525 | ) | ||
Oil & Gas — (2.6)% |
|
|
| ||||
Cenovus Energy, Inc. (Canada) | (350,000 | ) |
| (1,634,500 | ) | ||
Noble Energy, Inc. | (280,000 | ) |
| (2,508,800 | ) | ||
Total Oil & Gas |
|
| (4,143,300 | ) | |||
Oil & Gas Services — (1.7)% |
|
|
| ||||
National Oilwell Varco, Inc. | (220,000 | ) |
| (2,695,000 | ) | ||
Packaging & Containers — (1.6)% |
|
|
| ||||
Sonoco Products Co. | (50,000 | ) |
| (2,614,500 | ) | ||
Pipelines — (2.7)% |
|
|
| ||||
Cheniere Energy, Inc.* | (40,000 | ) |
| (1,932,800 | ) | ||
Targa Resources Corp. | (120,000 | ) |
| (2,408,400 | ) | ||
Total Pipelines |
|
| (4,341,200 | ) | |||
REITS — (10.4)% |
|
|
| ||||
Boston Properties, Inc. | (20,000 | ) |
| (1,807,600 | ) | ||
Camden Property Trust | (40,000 | ) |
| (3,648,800 | ) | ||
EastGroup Properties, Inc. | (18,000 | ) |
| (2,134,980 | ) | ||
EPR Properties | (60,000 | ) |
| (1,987,800 | ) | ||
Kilroy Realty Corp. | (50,000 | ) |
| (2,935,000 | ) | ||
Mack-Cali Realty Corp. | (135,000 | ) |
| (2,064,150 | ) | ||
Vornado Realty Trust | (60,000 | ) |
| (2,292,600 | ) | ||
Total REITS |
|
| (16,870,930 | ) | |||
Investments | Shares | Value | |||||
COMMON STOCKS (continued) |
|
|
| ||||
Retail — (9.7)% |
|
|
| ||||
Foot Locker, Inc. | (110,000 | ) | $ | (3,207,600 | ) | ||
Jack in the Box, Inc. | (40,100 | ) |
| (2,971,009 | ) | ||
L Brands, Inc. | (205,000 | ) |
| (3,068,850 | ) | ||
Restaurant Brands International, Inc. (Canada) | (65,000 | ) |
| (3,550,950 | ) | ||
Starbucks Corp. | (40,000 | ) |
| (2,943,600 | ) | ||
Total Retail |
|
| (15,742,009 | ) | |||
Software — (5.6)% |
|
|
| ||||
J2 Global, Inc.* | (30,000 | ) |
| (1,896,300 | ) | ||
PROS Holdings, Inc.* | (50,000 | ) |
| (2,221,500 | ) | ||
PTC, Inc.* | (35,000 | ) |
| (2,722,650 | ) | ||
Smartsheet, Inc., Class A* | (45,000 | ) |
| (2,291,400 | ) | ||
Total Software |
|
| (9,131,850 | ) | |||
Telecommunications — (6.5)% |
|
|
| ||||
AT&T, Inc. | (120,000 | ) |
| (3,627,600 | ) | ||
Motorola Solutions, Inc. | (30,000 | ) |
| (4,203,900 | ) | ||
ViaSat, Inc.* | (72,000 | ) |
| (2,762,640 | ) | ||
Total Telecommunications |
|
| (10,594,140 | ) | |||
Transportation — (1.3)% |
|
|
| ||||
Golar LNG Ltd. (Cameroon)* | (300,000 | ) |
| (2,172,000 | ) | ||
Total Securities Sold, Not Yet Purchased [Proceeds Received $(164,349,252)] |
|
| (166,311,729 | ) | |||
Total Investments — 12.4% |
|
| 20,149,293 |
| |||
Other Assets in Excess of Liabilities — 87.6% |
|
| 141,870,030 |
| |||
Net Assets — 100.0% |
| $ | 162,019,323 |
| |||
____________
ETF — Exchange Traded Fund
PLC — Public Limited Company
REITS — Real Estate Investment Trusts
* Non-income producing security.
† Affiliated Company.
(a) Rate shown reflects the 7-day yield as of June 30, 2020.
(b) As of June 30, 2020 cash in the amount of $146,481,250 has been segregated as collateral from the broker for securities sold short.
(c) American Depositary Receipt.
See accompanying Notes to Financial Statements.
78
ADVISORSHARES RANGER EQUITY BEAR ETF June 30, 2020 |
Fair Value Measurements
The following is a summary of the inputs used, as of June 30, 2020, in valuing the Fund’s assets and liabilities carried at fair value. These inputs are summarized in three broad levels. Level 1 includes quoted prices in active markets for identical securities. Level 2 includes other significant observable inputs (including quoted prices for similar securities, interest rates, prepayment speeds and credit risk). Level 3 includes significant unobservable inputs (including the Fund’s own assumptions in determining the fair value of investments). The level assigned to the securities valuations may not be an indication of the risk or liquidity associated with investing in those securities.
Assets | Level 1 | Level 2 | Level 3 | Total | ||||||||
Exchange Traded Fund | $ | 63,930,750 | $ | — | $ | — | $ | 63,930,750 | ||||
Money Market Funds |
| 122,530,272 |
| — |
| — |
| 122,530,272 | ||||
Total | $ | 186,461,022 | $ | — | $ | — | $ | 186,461,022 | ||||
Liabilities | Level 1 | Level 2 | Level 3 | Total | ||||||||||
Common Stocks | $ | (166,311,729 | ) | $ | — | $ | — | $ | (166,311,729 | ) | ||||
Total | $ | (166,311,729 | ) | $ | — | $ | — | $ | (166,311,729 | ) | ||||
SUMMARY OF SCHEDULE OF INVESTMENTS
% of | |||
Aerospace/Defense | (1.4 | )% | |
Agriculture | (1.8 | ) | |
Airlines | (1.4 | ) | |
Apparel | (2.7 | ) | |
Banks | (5.2 | ) | |
Chemicals | (1.4 | ) | |
Commercial Services | (2.6 | ) | |
Computers | (3.7 | ) | |
Debt Fund | 39.5 |
| |
Distribution/Wholesale | (1.2 | ) | |
Diversified Financial Services | (6.3 | ) | |
Electric | (4.4 | ) | |
Electrical Components & Equipment | (3.3 | ) | |
Engineering & Construction | (1.5 | ) | |
Entertainment | (2.3 | ) | |
Food | (3.0 | ) | |
Food Service | (1.7 | ) | |
Hand / Machine Tools | (2.6 | ) | |
Internet | (4.0 | ) | |
SUMMARY OF SCHEDULE OF INVESTMENTS (continued)
% of | |||
Iron/Steel | (1.4 | )% | |
Lodging | (3.0 | ) | |
Machinery – Diversified | (1.1 | ) | |
Media | (2.4 | ) | |
Office/Business Equipment | (2.2 | ) | |
Oil & Gas | (2.6 | ) | |
Oil & Gas Services | (1.7 | ) | |
Packaging & Containers | (1.6 | ) | |
Pipelines | (2.7 | ) | |
REITS | (10.4 | ) | |
Retail | (9.7 | ) | |
Software | (5.6 | ) | |
Telecommunications | (6.5 | ) | |
Transportation | (1.3 | ) | |
Money Market Funds | 75.6 | % | |
Total Investments | 12.4 |
| |
Other Assets in Excess of Liabilities | 87.6 |
| |
Net Assets | 100.0 | % | |
Affiliated holdings are funds which are managed by the Trust or an affiliate of the Trust. Transactions with affiliated companies during the year ended June 30, 2020 were as follows:
Affiliated Fund Name | Value at | Purchases/ Additions | Sales/ | Realized | Change in | Number of | Value at | Dividend | ||||||||||||||||||
AdvisorShares Sage Core Reserves ETF | $ | 54,785,500 | $ | 34,968,500 | $ | (24,964,754 | ) | $ | (12,747 | ) | $ | (845,749 | ) | 650,000 | $ | 63,930,750 | $ | 1,419,149 | ||||||||
See accompanying Notes to Financial Statements.
79
Investments | Principal | Value | ||||
CORPORATE BONDS — 53.1% | ||||||
Airlines — 1.9% |
|
| ||||
Delta Air Lines, Inc., 2.60%, 12/04/20 | $ | 1,930,000 | $ | 1,898,481 | ||
Auto Manufacturers — 1.9% |
|
| ||||
General Motors Co., 1.27%, (3-Month USD LIBOR + 0.80%), 08/07/20@ |
| 1,907,000 |
| 1,906,584 | ||
Banks — 9.0% |
|
| ||||
Bank of America Corp., Series MTN, 3.50%, (3-Month USD LIBOR + 0.63%), 05/17/22@ |
| 2,813,000 |
| 2,881,815 | ||
Bank of New York Mellon Corp. (The), Series MTN, 2.05%, 05/03/21 |
| 10,000 |
| 10,129 | ||
Citigroup, Inc., 2.65%, 10/26/20 |
| 940,000 |
| 946,592 | ||
Citigroup, Inc., 1.39%, (3-Month USD LIBOR + 1.07%), 12/08/21@ |
| 1,433,000 |
| 1,444,530 | ||
Goldman Sachs Group, Inc. (The), 2.60%, 12/27/20 |
| 1,632,000 |
| 1,649,319 | ||
JPMorgan Chase & Co., 2.55%, 10/29/20 |
| 120,000 |
| 120,616 | ||
JPMorgan Chase & Co., Series MTN, 2.30%, 08/15/21 |
| 470,000 |
| 470,994 | ||
Manufacturers & Traders Trust Co., Series BKNT, 1.26%, (3-Month USD LIBOR + 0.27%), 01/25/21@ |
| 520,000 |
| 520,778 | ||
Morgan Stanley, Series GMTN, 5.50%, 07/24/20 |
| 250,000 |
| 250,768 | ||
Truist Bank, Series BKNT, 2.85%, 04/01/21 |
| 311,000 |
| 315,932 | ||
Wells Fargo & Co., Series MTN, 2.55%, 12/07/20 |
| 500,000 |
| 504,686 | ||
Total Banks |
|
| 9,116,159 | |||
Beverages — 0.7% |
|
| ||||
PepsiCo, Inc., 2.15%, 10/14/20 |
| 750,000 |
| 753,045 | ||
Biotechnology — 0.2% |
|
| ||||
Gilead Sciences, Inc., 2.55%, 09/01/20 |
| 255,000 |
| 255,927 | ||
Investments | Principal | Value | ||||
CORPORATE BONDS (continued) | ||||||
Commercial Services — 2.2% |
|
| ||||
Equifax, Inc., 2.30%, 06/01/21 | $ | 200,000 | $ | 202,893 | ||
Equifax, Inc., 1.26%, (3-Month USD LIBOR + 0.87%), 08/15/21@ |
| 570,000 |
| 569,295 | ||
Equifax, Inc., 3.60%, 08/15/21 |
| 1,420,000 |
| 1,466,231 | ||
Total Commercial Services |
|
| 2,238,419 | |||
Computers — 4.8% |
|
| ||||
Apple, Inc., 2.00%, 11/13/20 |
| 410,000 |
| 412,621 | ||
Dell International LLC/EMC Corp., 4.42%, 06/15/21‡ |
| 1,035,000 |
| 1,064,019 | ||
Dell, Inc., 4.63%, 04/01/21(a) |
| 1,415,000 |
| 1,441,354 | ||
Hewlett Packard Enterprise Co., 3.60%, 10/15/20 |
| 1,914,000 |
| 1,926,079 | ||
Total Computers |
|
| 4,844,073 | |||
Diversified Financial Services — 3.5% | ||||||
Air Lease Corp., 3.50%, 01/15/22 |
| 1,420,000 |
| 1,435,089 | ||
American Express Credit Corp., Series F, 1.36%, (3-Month USD LIBOR + 1.05%), 09/14/20@(a) |
| 611,000 |
| 611,721 | ||
International Lease Finance Corp., 8.25%, 12/15/20 |
| 1,437,000 |
| 1,471,109 | ||
Total Diversified Financial Services |
|
| 3,517,919 | |||
Electric — 3.4% |
|
| ||||
Edison International, 2.40%, 09/15/22(a) |
| 2,415,000 |
| 2,447,617 | ||
Entergy Corp., 4.00%, 07/15/22 |
| 930,000 |
| 987,439 | ||
Total Electric |
|
| 3,435,056 | |||
Food — 0.2% |
|
| ||||
General Mills, Inc., 3.20%, 04/16/21 |
| 160,000 |
| 163,460 | ||
Healthcare – Products — 0.5% | ||||||
Zimmer Biomet Holdings, Inc., 1.07%, (3-Month USD LIBOR + 0.75%), 03/19/21@ |
| 485,000 |
| 484,955 | ||
Healthcare – Services — 2.3% | ||||||
Anthem, Inc., 2.50%, 11/21/20 |
| 1,555,000 |
| 1,567,454 | ||
Humana, Inc., 2.50%, 12/15/20 |
| 705,000 |
| 711,436 | ||
Total Healthcare – Services |
|
| 2,278,890 | |||
See accompanying Notes to Financial Statements.
80
ADVISORSHARES SAGE CORE RESERVES ETF June 30, 2020 |
Investments | Principal | Value | ||||
CORPORATE BONDS (continued) | ||||||
Insurance — 0.5% |
|
| ||||
American International Group, Inc., 3.38%, 08/15/20 | $ | 473,000 | $ | 474,616 | ||
Internet — 0.6% |
|
| ||||
Expedia Group, Inc., 5.95%, 08/15/20 |
| 660,000 |
| 661,953 | ||
Investment Companies — 0.9% | ||||||
Ares Capital Corp., 3.63%, 01/19/22 |
| 946,000 |
| 962,287 | ||
Media — 2.1% |
|
| ||||
Comcast Corp., 3.13%, 07/15/22 |
| 1,350,000 |
| 1,425,168 | ||
DISH DBS Corp., 6.75%, 06/01/21 |
| 654,000 |
| 667,341 | ||
Total Media |
|
| 2,092,509 | |||
Oil & Gas — 3.2% |
|
| ||||
Occidental Petroleum Corp., 2.60%, 08/13/21 |
| 2,265,000 |
| 2,219,643 | ||
Phillips 66, 0.96%, (3-Month USD LIBOR + 0.60%), 02/26/21@ |
| 970,000 |
| 968,645 | ||
Total Oil & Gas |
|
| 3,188,288 | |||
Pharmaceuticals — 2.5% |
|
| ||||
Elanco Animal Health, Inc., 4.66%, 08/27/21 |
| 1,890,000 |
| 1,936,069 | ||
Mylan NV, 3.15%, 06/15/21 |
| 550,000 |
| 561,547 | ||
Total Pharmaceuticals |
|
| 2,497,616 | |||
Pipelines — 6.7% |
|
| ||||
Buckeye Partners LP, 4.88%, 02/01/21 |
| 1,910,000 |
| 1,896,869 | ||
Energy Transfer Operating LP, 4.65%, 06/01/21 |
| 500,000 |
| 510,725 | ||
Enterprise Products Operating LLC, 5.20%, 09/01/20 |
| 955,000 |
| 962,253 | ||
Kinder Morgan Energy Partners LP, 3.50%, 03/01/21 |
| 1,670,000 |
| 1,691,013 | ||
NGPL PipeCo LLC, 4.38%, 08/15/22‡ |
| 465,000 |
| 479,937 | ||
Plains All American Pipeline LP/PAA Finance Corp., 3.65%, 06/01/22 |
| 1,182,000 |
| 1,208,730 | ||
Total Pipelines |
|
| 6,749,527 | |||
REITS — 0.8% |
|
| ||||
Corporate Office Properties LP, 3.70%, 06/15/21 |
| 783,000 |
| 795,980 | ||
Retail — 1.9% |
|
| ||||
QVC, Inc., 4.38%, 03/15/23 |
| 1,870,000 |
| 1,879,163 | ||
Investments | Principal | Value | ||||
CORPORATE BONDS (continued) | ||||||
Semiconductors — 0.5% |
|
| ||||
Xilinx, Inc., 3.00%, 03/15/21 | $ | 500,000 | $ | 508,146 | ||
Telecommunications — 2.6% |
|
| ||||
AT&T, Inc., 2.17%, (3-Month USD LIBOR + 0.95%), 07/15/21@ |
| 1,425,000 |
| 1,436,836 | ||
Sprint Corp., 7.25%, 09/15/21 |
| 1,140,000 |
| 1,196,435 | ||
Total Telecommunications |
|
| 2,633,271 | |||
Trucking & Leasing — 0.2% |
|
| ||||
Aviation Capital Group LLC, 1.43%, (3-Month USD LIBOR + 0.67%), 07/30/21@‡ |
| 270,000 |
| 254,636 | ||
Total Corporate Bonds |
|
| 53,590,960 | |||
U.S. TREASURY NOTES — 18.9% | ||||||
U.S. Treasury Note, 1.75%, 10/31/20 |
| 969,000 |
| 974,039 | ||
U.S. Treasury Note, 1.13%, 02/28/21 |
| 5,628,000 |
| 5,662,845 | ||
U.S. Treasury Note, 1.25%, 03/31/21 |
| 5,618,000 |
| 5,663,646 | ||
U.S. Treasury Note, 1.38%, 04/30/21 |
| 3,738,000 |
| 3,775,088 | ||
U.S. Treasury Note, 0.26%, 04/30/22@ |
| 2,950,000 |
| 2,952,264 | ||
Total U.S. Treasury Notes |
|
| 19,027,882 | |||
ASSET BACKED SECURITIES — 14.1% | ||||||
Diversified Financial Services — 14.1% | ||||||
Ally Master Owner Trust, Class A, Series 2018-2, 3.29%, 05/15/23 |
| 975,000 |
| 996,794 | ||
American Express Credit Account Master Trust, Class A, Series 2017-6, 2.04%, 05/15/23 |
| 2,150,000 |
| 2,160,464 | ||
BA Credit Card Trust, Class A2, Series 2018-A2, 3.00%, 09/15/23 |
| 375,000 |
| 382,716 | ||
Capital One Multi-Asset Execution Trust, Class A4, Series 2017-A4, 1.99%, 07/17/23 |
| 1,400,000 |
| 1,404,655 | ||
Carmax Auto Owner Trust, Class A2A, Series 2019-2, 2.69%, 07/15/22 |
| 1,016,490 |
| 1,025,582 | ||
See accompanying Notes to Financial Statements.
81
ADVISORSHARES SAGE CORE RESERVES ETF June 30, 2020 |
Investments | Principal | Value | ||||
ASSET BACKED SECURITIES (continued) | ||||||
Diversified Financial Services (continued) | ||||||
CarMax Auto Owner Trust, Class A3, Series 2018-1, 2.48%, 11/15/22 | $ | 827,627 | $ | 836,842 | ||
Citibank Credit Card Issuance Trust, Class A1, Series 2018-A1, 2.49%, 01/20/23 |
| 935,000 |
| 946,232 | ||
Discover Card Execution Note Trust, Class A3, Series 2016-A3, 1.85%, 10/16/23 |
| 840,000 |
| 850,006 | ||
GM Financial Automobile Leasing Trust, Class C, Series 2018-2, 3.50%, 04/20/22 |
| 437,000 |
| 441,119 | ||
GM Financial Consumer Automobile Receivables Trust, Class B, Series 2017-3A, 2.33%, 03/16/23‡ |
| 735,000 |
| 743,117 | ||
Honda Auto Receivables Owner Trust, Class A3, Series 2017-1, 1.72%, 07/21/21 |
| 55,176 |
| 55,260 | ||
Huntington Auto Trust, Class A4, Series 2016-1, 1.93%, 04/15/22 |
| 730,996 |
| 731,259 | ||
Hyundai Auto Receivables Trust, Class B, Series 2016-B, 1.82%, 11/15/22 |
| 520,000 |
| 522,896 | ||
Santander Drive Auto Receivables Trust, Class C, Series 2017-3, 2.76%, 12/15/22 |
| 469,827 |
| 471,845 | ||
SoFi Consumer Loan Program Trust, Class A, Series 2020-1, 2.02%, 01/25/29‡ |
| 356,248 |
| 360,180 | ||
Verizon Owner Trust, Class A, Series 2017-2A, 1.92%, 12/20/21‡ |
| 139,975 |
| 140,108 | ||
World Financial Network Credit Card Master Trust, Class A, Series 2015-B, 2.55%, 06/17/24 |
| 997,000 |
| 999,234 | ||
World Omni Auto Receivables Trust, Class A2, Series 2018-C, 2.80%, 01/18/22 |
| 110,280 |
| 110,389 | ||
World Omni Auto Receivables Trust, Class A2, Series 2020-A, 1.71%, 11/15/22 |
| 1,030,000 |
| 1,040,525 | ||
Total Asset Backed Securities |
|
| 14,219,223 | |||
Investments | Principal | Value | ||||
FOREIGN BONDS — 7.8% |
|
| ||||
Banks — 4.4% |
|
| ||||
Banco Bradesco SA, 5.90%, 01/16/21 (Brazil)‡ | $ | 940,000 | $ | 957,634 | ||
Credit Suisse Group Funding Guernsey Ltd., 3.13%, 12/10/20 (Switzerland) |
| 1,920,000 |
| 1,942,211 | ||
HSBC Holdings PLC, 4.00%, 03/30/22 (United Kingdom) |
| 910,000 |
| 960,578 | ||
Sumitomo Mitsui Financial Group, Inc., 1.99%, (3-Month USD LIBOR + 1.68%), 03/09/21 (Japan)@ |
| 615,000 |
| 621,164 | ||
Total Banks |
|
| 4,481,587 | |||
Oil & Gas — 2.2% |
|
| ||||
Ecopetrol SA, 5.88%, 09/18/23 (Colombia) |
| 1,320,000 |
| 1,417,212 | ||
Petroleos Mexicanos, 5.50%, 01/21/21 (Mexico) |
| 775,000 |
| 775,000 | ||
Total Oil & Gas |
|
| 2,192,212 | |||
Pharmaceuticals — 1.2% |
|
| ||||
Bayer US Finance II LLC, 0.93%, (3-Month USD LIBOR + 0.63%), 06/25/21 (Germany)@‡ |
| 260,000 |
| 259,719 | ||
Teva Pharmaceutical Finance Netherlands III BV, 2.20%, 07/21/21 (Israel) |
| 1,000,000 |
| 981,915 | ||
Total Pharmaceuticals |
|
| 1,241,634 | |||
Total Foreign Bonds |
|
| 7,915,433 | |||
MUNICIPAL BONDS — 1.1% |
|
| ||||
Metropolitan Transportation Authority, Series E, 4.00%, 09/01/20 |
| 585,000 |
| 586,053 | ||
New Jersey Transportation Trust Fund Authority, Series C, 6.10%, 12/15/28 |
| 500,000 |
| 511,660 | ||
Total Municipal Bonds |
|
| 1,097,713 | |||
MORTGAGE BACKED SECURITIES — 0.1% | ||||||
Commercial Mortgage Backed Securities — 0.1% | ||||||
Fannie Mae – Aces, Class A1, Series 2016-M1, 2.43%, 01/25/26 |
| 116,314 |
| 118,568 | ||
Freddie Mac REMICS, Class ED, Series 2010-3645, 2.50%, 12/15/20 |
| 446 |
| 446 | ||
Total Mortgage Backed Securities |
|
| 119,014 | |||
See accompanying Notes to Financial Statements.
82
ADVISORSHARES SAGE CORE RESERVES ETF June 30, 2020 |
Investments | Shares/ | Value | ||||
MONEY MARKET FUND — 4.4% | ||||||
JPMorgan U.S. Government Money Market Fund – Institutional Class, 0.07%(b) |
| 4,413,068 | $ | 4,413,068 | ||
REPURCHASE AGREEMENTS — 2.3%(c) | ||||||
Citigroup Global Markets, Inc., dated 06/30/20, due 07/01/20, 0.09%, total to be received $540,148, (collateralized by various U.S. Government Agency Obligations, 0.50% – 7.50%, 07/31/21 – 05/20/70, totaling $548,787) | $ | 540,147 |
| 540,147 | ||
Daiwa Capital Markets America, dated 06/30/20, due 07/01/20, 0.10%, total to be received $540,149, (collateralized by various U.S. Government Agency Obligations, 0.00% – 6.50%, 07/28/20 – 03/01/52, totaling $549,487) |
| 540,147 |
| 540,147 | ||
HSBC Securities USA, Inc., dated 06/30/20, due 07/01/20, 0.08%, total to be received $540,148, (collateralized by various U.S. Government Agency Obligations, 0.00% – 4.50%, 05/15/44 – 03/20/50, totaling $549,478) |
| 540,147 |
| 540,147 | ||
JP Morgan Securities LLC, dated 06/30/20, due 07/01/20, 0.07%, total to be received $160,117, (collateralized by various U.S. Government Agency Obligations, 0.00% – 2.50%, 10/08/20 – 04/30/23, totaling $163,247) |
| 160,117 |
| 160,117 | ||
Investments |
| Value | |||||
REPURCHASE AGREEMENTS (continued) |
| ||||||
RBC Dominion Securities, Inc., dated 06/30/20, due 07/01/20, 0.09%, total to be received $540,148, (collateralized by various U.S. Government Agency Obligations, 0.00% – 7.00%, 07/31/20 – 07/01/50, totaling $549,659) | $ | 540,147 | $ | 540,147 |
| ||
Total Repurchase Agreements |
|
| 2,320,705 |
| |||
Total Investments — 101.8% |
|
| 102,703,998 |
| |||
Liabilities in Excess of Other Assets — (1.8%) |
|
| (1,783,095 | ) | |||
Net Assets — 100.0% |
| $ | 100,920,903 |
| |||
____________
LIBOR — London Interbank Offered Rate
LP — Limited Partnership
PLC — Public Limited Company
REITS — Real Estate Investment Trusts
@ Variable rate instrument. The interest rate shown reflects the rate in effect at June 30, 2020.
‡ Security was purchased pursuant to Rule 144A under the Securities Act of 1933 and may not be resold subject to that rule except to qualified institutional buyers. Unless otherwise noted, 144A securities are deemed to be liquid.
(a) All or a portion of security is on loan. The aggregate market value of the securities on loan is $2,242,016; the aggregate market value of the collateral held by the fund is $2,320,705.
(b) Rate shown reflects the 7-day yield as of June 30, 2020.
(c) Collateral received from brokers for securities lending was invested in these short-term investments.
See accompanying Notes to Financial Statements.
83
ADVISORSHARES SAGE CORE RESERVES ETF June 30, 2020 |
Fair Value Measurements
The following is a summary of the inputs used, as of June 30, 2020, in valuing the Fund’s assets and liabilities carried at fair value. These inputs are summarized in three broad levels. Level 1 includes quoted prices in active markets for identical securities. Level 2 includes other significant observable inputs (including quoted prices for similar securities, interest rates, prepayment speeds and credit risk). Level 3 includes significant unobservable inputs (including the Fund’s own assumptions in determining the fair value of investments). The level assigned to the securities valuations may not be an indication of the risk or liquidity associated with investing in those securities.
Assets | Level 1 | Level 2 | Level 3 | Total | ||||||||
Corporate Bonds | $ | — | $ | 53,590,960 | $ | — | $ | 53,590,960 | ||||
U.S. Treasury Notes |
| — |
| 19,027,882 |
| — |
| 19,027,882 | ||||
Asset Backed Securities |
| — |
| 14,219,223 |
| — |
| 14,219,223 | ||||
Foreign Bonds |
| — |
| 7,915,433 |
| — |
| 7,915,433 | ||||
Municipal Bonds |
| — |
| 1,097,713 |
| — |
| 1,097,713 | ||||
Mortgage Backed Securities |
| — |
| 119,014 |
| — |
| 119,014 | ||||
Money Market Fund |
| 4,413,068 |
| — |
| — |
| 4,413,068 | ||||
Repurchase Agreements |
| — |
| 2,320,705 |
| — |
| 2,320,705 | ||||
Total | $ | 4,413,068 | $ | 98,290,930 | $ | — | $ | 102,703,998 | ||||
SUMMARY OF SCHEDULE OF INVESTMENTS
% of | |||
Airlines | 1.9 | % | |
Auto Manufacturers | 1.9 |
| |
Banks | 13.4 |
| |
Beverages | 0.7 |
| |
Biotechnology | 0.2 |
| |
Commercial Mortgage Backed Securities | 0.1 |
| |
Commercial Services | 2.2 |
| |
Computers | 4.8 |
| |
Diversified Financial Services | 17.6 |
| |
Electric | 3.4 |
| |
Food | 0.2 |
| |
Healthcare – Products | 0.5 |
| |
Healthcare – Services | 2.3 |
| |
Insurance | 0.5 |
| |
Internet | 0.6 |
| |
Investment Companies | 0.9 |
| |
SUMMARY OF SCHEDULE OF INVESTMENTS (continued)
% of | |||
Media | 2.1 | % | |
Municipal | 1.1 |
| |
Oil & Gas | 5.4 |
| |
Pharmaceuticals | 3.7 |
| |
Pipelines | 6.7 |
| |
REITS | 0.8 |
| |
Retail | 1.9 |
| |
Semiconductors | 0.5 |
| |
Telecommunications | 2.6 |
| |
Trucking & Leasing | 0.2 |
| |
U.S. Treasury Notes | 18.9 |
| |
Money Market Fund | 4.4 |
| |
Repurchase Agreements | 2.3 |
| |
Total Investments | 101.8 |
| |
Liabilities in Excess of Other Assets | (1.8 | ) | |
Net Assets | 100.0 | % | |
See accompanying Notes to Financial Statements.
84
Investments |
| Value | |||
EXCHANGE TRADED FUNDS — 95.1% | |||||
Debt Fund — 19.2% |
| ||||
First Trust Low Duration Opportunities ETF(a) | 9,481 | $ | 489,978 | ||
iShares Core U.S. Aggregate Bond ETF(a) | 4,192 |
| 495,536 | ||
iShares Short-Term Corporate Bond ETF(a) | 9,124 |
| 499,174 | ||
JPMorgan Ultra-Short Income ETF(a) | 9,735 |
| 493,857 | ||
PIMCO Enhanced Short Maturity Active ETF(a) | 4,866 |
| 494,824 | ||
Total Debt Fund |
| 2,473,369 | |||
Equity Fund — 75.9% |
| ||||
Communication Services Select Sector SPDR Fund | 8,877 |
| 479,713 | ||
Consumer Staples Select Sector SPDR Fund | 7,533 |
| 441,735 | ||
Health Care Select Sector SPDR Fund | 6,492 |
| 649,655 | ||
iShares MSCI EAFE ETF | 11,168 |
| 679,796 | ||
SPDR S&P 500 ETF Trust | 21,254 |
| 6,553,884 | ||
Technology Select Sector SPDR Fund | 5,656 |
| 590,995 | ||
X-trackers MSCI Europe Hedged Equity ETF | 14,047 |
| 387,135 | ||
Total Equity Fund |
| 9,782,913 | |||
Total Exchange Traded Funds |
| 12,256,282 | |||
MONEY MARKET FUND — 5.1% | |||||
BlackRock Liquidity Funds T-Fund Portfolio, Institutional Class, 0.11%(b) | 654,960 |
| 654,960 | ||
Total Investments Before Written Options — 100.2% |
| 12,911,242 | |||
Investments | Notional |
| Value | |||||||
WRITTEN CALL OPTION — (0.0)%** |
| |||||||||
SPDR S&P 500 ETF Trust, expiring 07/17/20, Strike Price $339.00 | $ | 5,390,100 | (159 | ) | $ | (2,306 | ) | |||
[Premium Received $(16,661)] |
|
|
| |||||||
Total Investments — 100.2% |
|
| 12,908,936 |
| ||||||
Liabilities in Excess of Other Assets — (0.2%) |
|
| (27,200 | ) | ||||||
Net Assets — 100.0% |
| $ | 12,881,736 |
| ||||||
____________
ETF — Exchange Traded Fund
** Less than 0.05%.
(a) All or a portion of this security has been pledged as collateral for option contracts. The aggregate market value of the collateral was $2,740,694 as of June 30, 2020.
(b) Rate shown reflects the 7-day yield as of June 30, 2020.
See accompanying Notes to Financial Statements.
85
ADVISORSHARES STAR GLOBAL BUY-WRITE ETF June 30, 2020 |
Fair Value Measurements
The following is a summary of the inputs used, as of June 30, 2020, in valuing the Fund’s assets and liabilities carried at fair value. These inputs are summarized in three broad levels. Level 1 includes quoted prices in active markets for identical securities. Level 2 includes other significant observable inputs (including quoted prices for similar securities, interest rates, prepayment speeds and credit risk). Level 3 includes significant unobservable inputs (including the Fund’s own assumptions in determining the fair value of investments). The level assigned to the securities valuations may not be an indication of the risk or liquidity associated with investing in those securities.
Assets | Level 1 | Level 2 | Level 3 | Total | ||||||||
Exchange Traded Funds | $ | 12,256,282 | $ | — | $ | — | $ | 12,256,282 | ||||
Money Market Fund |
| 654,960 |
| — |
| — |
| 654,960 | ||||
Total | $ | 12,911,242 | $ | — | $ | — | $ | 12,911,242 | ||||
Liabilities | Level 1 | Level 2 | Level 3 | Total | ||||||||||
Written Call Option | $ | (2,306 | ) | $ | — | $ | — | $ | (2,306 | ) | ||||
Total | $ | (2,306 | ) | $ | — | $ | — | $ | (2,306 | ) | ||||
SUMMARY OF SCHEDULE OF INVESTMENTS
| |||
Debt Fund | 19.2 | % | |
Equity Fund | 75.9 |
| |
Written Call Option | (0.0 | )** | |
Money Market Fund | 5.1 |
| |
Total Investments | 100.2 |
| |
Liabilities in Excess of Other Assets | (0.2 | ) | |
Net Assets | 100.0 | % | |
____________
** Less than 0.05%.
See accompanying Notes to Financial Statements.
86
Investments |
| Value | |||
COMMON STOCKS — 99.7% |
| ||||
Agriculture — 15.1% |
| ||||
Altria Group, Inc. | 4,775 | $ | 187,419 | ||
British American Tobacco PLC (United Kingdom)(a)(b) | 4,978 |
| 193,246 | ||
Imperial Brands PLC (United Kingdom)(b) | 9,306 |
| 177,140 | ||
Philip Morris International, Inc. | 2,873 |
| 201,282 | ||
Turning Point Brands, Inc.(a) | 9,902 |
| 246,659 | ||
Universal Corp. | 4,920 |
| 209,149 | ||
Vector Group Ltd. | 15,975 |
| 160,708 | ||
Total Agriculture |
| 1,375,603 | |||
Apparel — 5.2% |
| ||||
LVMH Moet Hennessy Louis Vuitton SE (France)(b) | 5,355 |
| 473,543 | ||
Beverages — 30.2% |
| ||||
Ambev SA (Brazil)(b) | 55,796 |
| 147,301 | ||
Anheuser-Busch InBev SA/NV (Belgium)(b) | 1,762 |
| 86,867 | ||
Boston Beer Co., Inc. (The), Class A*(a) | 1,250 |
| 670,812 | ||
Brown-Forman Corp., Class B(a) | 7,040 |
| 448,166 | ||
Constellation Brands, Inc., Class A | 1,066 |
| 186,497 | ||
Craft Brew Alliance, Inc.* | 21,183 |
| 326,006 | ||
Diageo PLC (United Kingdom)(a)(b) | 1,238 |
| 166,375 | ||
MGP Ingredients, Inc. | 11,583 |
| 425,154 | ||
Molson Coors Beverage Co., Class B | 2,696 |
| 92,635 | ||
New Age Beverages Corp.* | 64,067 |
| 98,023 | ||
Pernod Ricard SA (France)(b) | 3,335 |
| 105,653 | ||
Total Beverages |
| 2,753,489 | |||
Electronics — 5.6% |
| ||||
PerkinElmer, Inc. | 5,200 |
| 510,068 | ||
Entertainment — 2.4% |
| ||||
RCI Hospitality Holdings, Inc. | 16,060 |
| 222,592 | ||
Healthcare – Products — 14.2% | |||||
Abbott Laboratories | 6,414 |
| 586,432 | ||
Thermo Fisher Scientific, Inc. | 1,962 |
| 710,911 | ||
Total Healthcare — Products |
| 1,297,343 | |||
Healthcare – Services — 3.8% | |||||
Catalent, Inc.* | 4,800 |
| 351,840 | ||
Housewares — 3.5% |
| ||||
Scotts Miracle-Gro Co. (The) | 2,349 |
| 315,870 | ||
Investments | Shares/ | Value | |||||
COMMON STOCKS (continued) |
| ||||||
Pharmaceuticals — 11.8% |
|
|
| ||||
AbbVie, Inc. |
| 6,185 | $ | 607,243 |
| ||
Novartis AG (Switzerland)(b) |
| 5,386 |
| 470,413 |
| ||
Total Pharmaceuticals |
|
| 1,077,656 |
| |||
Retail — 7.9% |
|
|
| ||||
BJ’s Restaurants, Inc. |
| 11,709 |
| 245,186 |
| ||
Darden Restaurants, Inc. |
| 3,442 |
| 260,800 |
| ||
Dave & Buster’s Entertainment, Inc.(a) |
| 16,296 |
| 217,226 |
| ||
Total Retail |
|
| 723,212 |
| |||
Total Common Stocks |
|
| 9,101,216 |
| |||
MONEY MARKET FUND — 0.6% |
| ||||||
BlackRock Liquidity Funds Treasury Trust Fund Portfolio, Institutional Class, 0.10%(c) |
| 52,945 |
| 52,945 |
| ||
REPURCHASE AGREEMENTS — 3.2%(d) |
| ||||||
Citigroup Global Markets, Inc., dated 06/30/20, due 07/01/20, 0.09%, total to be received $40,877, (collateralized by various U.S. Government Agency Obligations, 0.00% – 4.50%, 07/01/24 – 12/01/48, totaling $41,616) | $ | 40,877 |
| 40,877 |
| ||
RBC Dominion Securities, Inc., dated 06/30/20, due 07/01/20, 0.09%, total to be received $249,001, (collateralized by various U.S. Government Agency Obligations, 0.00% – 7.00%, 07/31/20 – 07/01/50, totaling $253,385) |
| 249,000 |
| 249,000 |
| ||
Total Repurchase Agreements |
|
| 289,877 |
| |||
Total Investments — 103.5% |
|
| 9,444,038 |
| |||
Liabilities in Excess of Other Assets — (3.5%) |
|
| (318,461 | ) | |||
Net Assets — 100.0% |
| $ | 9,125,577 |
| |||
____________
PLC — Public Limited Company
* Non-income producing security.
(a) All or a portion of security is on loan. The aggregate market value of the securities on loan is $1,552,873; the aggregate market value of the collateral held by the fund is $1,596,178. The aggregate market value of the collateral includes non-cash U.S. Treasury securities collateral having a value of $1,306,301.
(b) American Depositary Receipt.
(c) Rate shown reflects the 7-day yield as of June 30, 2020.
(d) Collateral received from brokers for securities lending was invested in these short-term investments.
See accompanying Notes to Financial Statements.
87
ADVISORSHARES VICE ETF June 30, 2020 |
Fair Value Measurements
The following is a summary of the inputs used, as of June 30, 2020, in valuing the Fund’s assets and liabilities carried at fair value. These inputs are summarized in three broad levels. Level 1 includes quoted prices in active markets for identical securities. Level 2 includes other significant observable inputs (including quoted prices for similar securities, interest rates, prepayment speeds and credit risk). Level 3 includes significant unobservable inputs (including the Fund’s own assumptions in determining the fair value of investments). The level assigned to the securities valuations may not be an indication of the risk or liquidity associated with investing in those securities.
Assets | Level 1 | Level 2 | Level 3 | Total | ||||||||
Common Stocks | $ | 9,101,216 | $ | — | $ | — | $ | 9,101,216 | ||||
Money Market Fund |
| 52,945 |
| — |
| — |
| 52,945 | ||||
Repurchase Agreements |
| — |
| 289,877 |
| — |
| 289,877 | ||||
Total | $ | 9,154,161 | $ | 289,877 | $ | — | $ | 9,444,038 | ||||
SUMMARY OF SCHEDULE OF INVESTMENTS
% of | |||
Agriculture | 15.1 | % | |
Apparel | 5.2 |
| |
Beverages | 30.2 |
| |
Electronics | 5.6 |
| |
Entertainment | 2.4 |
| |
Healthcare – Products | 14.2 |
| |
Healthcare – Services | 3.8 |
| |
Housewares | 3.5 |
| |
Pharmaceuticals | 11.8 |
| |
Retail | 7.9 |
| |
Money Market Fund | 0.6 |
| |
Repurchase Agreements | 3.2 |
| |
Total Investments | 103.5 |
| |
Liabilities in Excess of Other Assets | (3.5 | ) | |
Net Assets | 100.0 | % | |
See accompanying Notes to Financial Statements.
88
[THIS PAGE INTENTIONALLY LEFT BLANK.]
AdvisorShares | AdvisorShares | AdvisorShares | |||||||||
ASSETS |
|
|
|
|
| ||||||
Investments, at Cost | $ | 55,430,713 |
| $ | 36,053,125 |
| $ | 69,332,493 | |||
Investments in Affiliates, at Cost (Note 8) |
| — |
|
| — |
|
| — | |||
Repurchase Agreements, at Cost (Note 2) |
| 8,735,618 |
|
| 218,120 |
|
| 22,322,213 | |||
Total Cost of Investments |
| 64,166,331 |
|
| 36,271,245 |
|
| 91,654,706 | |||
Investments, at Market Value (including securities on loan) (Note 2)(a) |
| 75,955,873 |
|
| 39,365,909 |
|
| 73,688,390 | |||
Investments in Affiliates, at Market Value (Note 8) |
| — |
|
| — |
|
| — | |||
Repurchase Agreements, at Market Value (Note 2) |
| 8,735,618 |
|
| 218,120 |
|
| 22,322,213 | |||
Total Market Value of Investments |
| 84,691,491 |
|
| 39,584,029 |
|
| 96,010,603 | |||
Cash |
| — |
|
| — |
|
| — | |||
Cash collateral held at brokers |
| — |
|
| — |
|
| — | |||
Dividends and Interest Receivable |
| 43,337 |
|
| 13,931 |
|
| 67,555 | |||
Receivable from Securities Sold |
| — |
|
| — |
|
| — | |||
Capital Shares Receivable |
| — |
|
| — |
|
| — | |||
Reclaim Receivable |
| 26,796 |
|
| — |
|
| — | |||
Due from Investment Advisor |
| — |
|
| — |
|
| — | |||
Prepaid Organizational Fees |
| — |
|
| 9,907 |
|
| 9,335 | |||
Prepaid Expenses |
| — |
|
| — |
|
| — | |||
Total Assets |
| 84,761,624 |
|
| 39,607,867 |
|
| 96,087,493 | |||
LIABILITIES |
|
|
|
|
| ||||||
Cash collateral for securities on loan(b) |
| 8,735,618 |
|
| 218,120 |
|
| 22,322,213 | |||
Advisory Fees Payable |
| 70,333 |
|
| 20,379 |
|
| 43,767 | |||
Trustee Fees Payable |
| 593 |
|
| 308 |
|
| 328 | |||
Securities Sold, Not Yet Purchased(c) |
| — |
|
| — |
|
| — | |||
Payable for Securities Purchased |
| — |
|
| — |
|
| — | |||
CCO Fees Payable |
| 68 |
|
| 195 |
|
| 143 | |||
Dividend Payable on Securities Sold, Not Yet Purchased |
| — |
|
| — |
|
| — | |||
Accrued Expenses |
| 75,690 |
|
| 35,510 |
|
| 36,246 | |||
Total Liabilities |
| 8,882,302 |
|
| 274,512 |
|
| 22,402,697 | |||
NET ASSETS | $ | 75,879,322 |
| $ | 39,333,355 |
| $ | 73,684,796 | |||
COMPONENTS OF NET ASSETS |
|
|
|
|
| ||||||
Capital Stock at Zero Par Value | $ | 118,128,611 |
| $ | 45,523,873 |
| $ | 69,302,385 | |||
Total Distributable Earnings / Accumulated (Loss) |
| (42,249,289 | ) |
| (6,190,518 | ) |
| 4,382,411 | |||
NET ASSETS | $ | 75,879,322 |
| $ | 39,333,355 |
| $ | 73,684,796 | |||
SHARES ISSUED AND OUTSTANDING |
|
|
|
|
| ||||||
Shares Outstanding (Unlimited Shares Authorized) |
| 1,425,000 |
|
| 1,925,000 |
|
| 2,625,000 | |||
Net Asset Value (NAV) Per Share | $ | 53.25 |
| $ | 20.43 |
| $ | 28.07 | |||
|
|
|
|
| |||||||
(a) Market value of securities on loan | $ | 13,819,242 |
| $ | 2,177,883 |
| $ | 36,785,437 | |||
(b) Non-cash collateral for securities on loan | $ | 5,249,852 |
| $ | 2,012,047 |
| $ | 14,490,856 | |||
(c) Proceeds Received from Securities Sold, Not Yet Purchased | $ | — |
| $ | — |
| $ | — | |||
See accompanying Notes to Financial Statements.
90
ADVISORSHARES TRUST June 30, 2020 |
AdvisorShares | AdvisorShares | AdvisorShares | AdvisorShares | AdvisorShares | ||||||||||||
|
|
|
|
|
|
|
| |||||||||
$ | 43,498,379 | $ | 1,655,135 |
| $ | 96,503,312 |
| $ | 40,090,544 |
| $ | 16,380,544 | ||||
| — |
| — |
|
| 17,451,005 |
|
| — |
|
| — | ||||
| 22,860,641 |
| 275,942 |
|
| — |
|
| — |
|
| — | ||||
| 66,359,020 |
| 1,931,077 |
|
| 113,954,317 |
|
| 40,090,544 |
|
| 16,380,544 | ||||
| 46,777,919 |
| 2,150,909 |
|
| 96,503,312 |
|
| 41,464,723 |
|
| 19,649,720 | ||||
| — |
| — |
|
| 17,212,125 |
|
| — |
|
| — | ||||
| 22,860,641 |
| 275,942 |
|
| — |
|
| — |
|
| — | ||||
| 69,638,560 |
| 2,426,851 |
|
| 113,715,437 |
|
| 41,464,723 |
|
| 19,649,720 | ||||
| — |
| 116 |
|
| — |
|
| — |
|
| — | ||||
| — |
| — |
|
| 107,102,220 |
|
| — |
|
| — | ||||
| 43,939 |
| 1,112 |
|
| 6,208 |
|
| 51,693 |
|
| 8,872 | ||||
| — |
| — |
|
| — |
|
| 410,774 |
|
| — | ||||
| — |
| — |
|
| 2,439,191 |
|
| — |
|
| — | ||||
| — |
| — |
|
| — |
|
| — |
|
| — | ||||
| — |
| — |
|
| — |
|
| — |
|
| 245 | ||||
| 9,335 |
| — |
|
| — |
|
| — |
|
| — | ||||
| — |
| — |
|
| 1,625 |
|
| 3,953 |
|
| 4,357 | ||||
| 69,691,834 |
| 2,428,079 |
|
| 223,264,681 |
|
| 41,931,143 |
|
| 19,663,194 | ||||
|
|
|
|
|
|
|
| |||||||||
| 22,860,641 |
| 275,942 |
|
| — |
|
| — |
|
| — | ||||
| 27,592 |
| 498 |
|
| 15,546 |
|
| 22,500 |
|
| — | ||||
| 301 |
| 97 |
|
| 215 |
|
| 475 |
|
| 546 | ||||
| — |
| — |
|
| 109,955,954 |
|
| — |
|
| — | ||||
| — |
| — |
|
| — |
|
| 367,939 |
|
| — | ||||
| 302 |
| 47 |
|
| 314 |
|
| 122 |
|
| 17 | ||||
| — |
| — |
|
| 151,537 |
|
| — |
|
| — | ||||
| 35,749 |
| 39,698 |
|
| 43,016 |
|
| 56,866 |
|
| 46,172 | ||||
| 22,924,585 |
| 316,282 |
|
| 110,166,582 |
|
| 447,902 |
|
| 46,735 | ||||
$ | 46,767,249 | $ | 2,111,797 |
| $ | 113,098,099 |
| $ | 41,483,241 |
| $ | 19,616,459 | ||||
|
|
|
|
|
|
|
| |||||||||
$ | 43,385,185 | $ | 2,817,938 |
| $ | 152,974,031 |
| $ | 72,431,169 |
| $ | 17,033,003 | ||||
| 3,382,064 |
| (706,141 | ) |
| (39,875,932 | ) |
| (30,947,928 | ) |
| 2,583,456 | ||||
$ | 46,767,249 | $ | 2,111,797 |
| $ | 113,098,099 |
| $ | 41,483,241 |
| $ | 19,616,459 | ||||
|
|
|
|
|
|
|
| |||||||||
| 1,700,000 |
| 100,000 |
|
| 5,850,000 |
|
| 625,000 |
|
| 550,000 | ||||
$ | 27.51 | $ | 21.12 |
| $ | 19.33 |
| $ | 66.37 |
| $ | 35.67 | ||||
|
|
|
|
|
|
|
| |||||||||
$ | 23,044,589 | $ | 508,908 |
| $ | — |
| $ | 758,337 |
| $ | 476,316 | ||||
$ | 196,518 | $ | 241,004 |
| $ | — |
| $ | 753,568 |
| $ | 478,436 | ||||
$ | — | $ | — |
| $ | 129,073,560 |
| $ | — |
| $ | — | ||||
See accompanying Notes to Financial Statements.
91
ADVISORSHARES TRUST June 30, 2020 |
AdvisorShares | AdvisorShares | AdvisorShares | ||||||||||
ASSETS |
|
|
|
|
|
| ||||||
Investments, at Cost | $ | 8,329,215 |
| $ | 58,897,745 |
| $ | 62,994,980 |
| |||
Investments in Affiliates, at Cost (Note 8) |
| — |
|
| — |
|
| — |
| |||
Repurchase Agreements, at Cost (Note 2) |
| 1,361,786 |
|
| 49,826 |
|
| 12,803,811 |
| |||
Total Cost of Investments |
| 9,691,001 |
|
| 58,947,571 |
|
| 75,798,791 |
| |||
Investments, at Market Value (including securities on loan) (Note 2)(a) |
| 8,397,012 |
|
| 59,176,355 |
|
| 39,363,290 |
| |||
Investments in Affiliates, at Market Value (Note 8) |
| — |
|
| — |
|
| — |
| |||
Repurchase Agreements, at Market Value (Note 2) |
| 1,361,786 |
|
| 49,826 |
|
| 12,803,811 |
| |||
Total Market Value of Investments |
| 9,758,798 |
|
| 59,226,181 |
|
| 52,167,101 |
| |||
Cash |
| — |
|
| 6,140 |
|
| 299,977 |
| |||
Foreign currency(b) |
| — |
|
| — |
|
| 197,642 |
| |||
Cash collateral held at brokers |
| — |
|
| — |
|
| 6,100,000 |
| |||
Unrealized Appreciation on Swaps Contracts |
| — |
|
| — |
|
| 265,830 |
| |||
Dividends and Interest Receivable |
| 214 |
|
| 216,613 |
|
| 256,449 |
| |||
Receivable from Securities Sold |
| 702,301 |
|
| 179,168 |
|
| — |
| |||
Reclaim Receivable |
| — |
|
| — |
|
| — |
| |||
Due from Investment Advisor |
| — |
|
| — |
|
| — |
| |||
Prepaid Expenses |
| 2,240 |
|
| 795 |
|
| 4,344 |
| |||
Total Assets |
| 10,463,553 |
|
| 59,628,897 |
|
| 59,291,343 |
| |||
LIABILITIES |
|
|
|
|
|
| ||||||
Unrealized Depreciation on Swaps Contracts |
| — |
|
| — |
|
| 5,008 |
| |||
Cash collateral for securities on loan(c) |
| 1,361,786 |
|
| 49,826 |
|
| 12,803,811 |
| |||
Advisory Fees Payable |
| 3,597 |
|
| 27,730 |
|
| 4,253 |
| |||
Trustee Fees Payable |
| 15 |
|
| 172 |
|
| 71 |
| |||
Securities Sold, Not Yet Purchased(d) |
| — |
|
| — |
|
| — |
| |||
Payable for Securities Purchased |
| 754,769 |
|
| 1,711,454 |
|
| 499,313 |
| |||
Options Written, at value(e) |
| — |
|
| — |
|
| — |
| |||
CCO Fees Payable |
| 30 |
|
| 374 |
|
| 92 |
| |||
Due to Broker |
| — |
|
| — |
|
| 443,919 |
| |||
Dividend Payable |
| — |
|
| — |
|
| — |
| |||
Dividend Payable on Securities Sold, Not Yet Purchased |
| — |
|
| — |
|
| — |
| |||
Accrued Expenses |
| 31,374 |
|
| 72,241 |
|
| 32,048 |
| |||
Total Liabilities |
| 2,151,571 |
|
| 1,861,797 |
|
| 13,788,515 |
| |||
NET ASSETS | $ | 8,311,982 |
| $ | 57,767,100 |
| $ | 45,502,828 |
| |||
COMPONENTS OF NET ASSETS |
|
|
|
|
|
| ||||||
Capital Stock at Zero Par Value | $ | 9,371,227 |
| $ | 65,538,830 |
| $ | 92,122,475 |
| |||
Total Distributable Earnings/Accumulated (Loss) |
| (1,059,245 | ) |
| (7,771,730 | ) |
| (46,619,647 | ) | |||
NET ASSETS | $ | 8,311,982 |
| $ | 57,767,100 |
| $ | 45,502,828 |
| |||
SHARES ISSUED AND OUTSTANDING |
|
|
|
|
|
| ||||||
Shares Outstanding (Unlimited Shares Authorized) |
| 325,000 |
|
| 1,200,000 |
|
| 4,475,000 |
| |||
Net Asset Value (NAV) Per Share | $ | 25.58 |
| $ | 48.14 |
| $ | 10.17 |
| |||
|
|
|
|
|
| |||||||
(a) Market value of securities on loan | $ | 1,334,528 |
| $ | 48,185 |
| $ | 14,994,905 |
| |||
(b) Foreign currency at cost | $ | — |
| $ | — |
| $ | 197,636 |
| |||
(c) Non-cash collateral for securities on loan | $ | — |
| $ | — |
| $ | 4,518,179 |
| |||
(d) Proceeds Received from Securities Sold, Not Yet Purchased | $ | — |
| $ | — |
| $ | — |
| |||
(e) Premiums received for options written | $ | — |
| $ | — |
| $ | — |
| |||
See accompanying Notes to Financial Statements.
92
ADVISORSHARES TRUST June 30, 2020 |
|
|
|
| ||||||||||
|
|
|
|
|
|
| |||||||
$ | 122,530,272 |
| $ | 100,279,617 |
| $ | 10,642,429 | $ | 9,559,658 |
| |||
| 64,679,499 |
|
| — |
|
| — |
| — |
| |||
| — |
|
| 2,320,705 |
|
| — |
| 289,877 |
| |||
| 187,209,771 |
|
| 102,600,322 |
|
| 10,642,429 |
| 9,849,535 |
| |||
| 122,530,272 |
|
| 100,383,293 |
|
| 12,911,242 |
| 9,154,161 |
| |||
| 63,930,750 |
|
| — |
|
| — |
| — |
| |||
| — |
|
| 2,320,705 |
|
| — |
| 289,877 |
| |||
| 186,461,022 |
|
| 102,703,998 |
|
| 12,911,242 |
| 9,444,038 |
| |||
| — |
|
| — |
|
| 916 |
| — |
| |||
| — |
|
| — |
|
| — |
| — |
| |||
| 146,481,250 |
|
| — |
|
| — |
| — |
| |||
| — |
|
| — |
|
| — |
| — |
| |||
| 6,680 |
|
| 608,453 |
|
| 34,629 |
| 14,213 |
| |||
| 5,468,991 |
|
| — |
|
| — |
| — |
| |||
| — |
|
| — |
|
| — |
| 2,778 |
| |||
| — |
|
| — |
|
| — |
| 1,450 |
| |||
| 5,763 |
|
| 3,039 |
|
| 3,441 |
| 210 |
| |||
| 338,423,706 |
|
| 103,315,490 |
|
| 12,950,228 |
| 9,462,689 |
| |||
|
|
|
|
|
|
| |||||||
| — |
|
| — |
|
| — |
| — |
| |||
| — |
|
| 2,320,705 |
|
| — |
| 289,877 |
| |||
| 184,067 |
|
| 11,577 |
|
| 12,071 |
| — |
| |||
| 384 |
|
| 255 |
|
| 371 |
| 162 |
| |||
| 166,311,729 |
|
| — |
|
| — |
| — |
| |||
| 9,518,772 |
|
| — |
|
| — |
| — |
| |||
| — |
|
| — |
|
| 2,306 |
| — |
| |||
| 116 |
|
| 76 |
|
| 46 |
| 180 |
| |||
| — |
|
| — |
|
| 9,145 |
| — |
| |||
| — |
|
| — |
|
| — |
| — |
| |||
| 318,900 |
|
| — |
|
| — |
| — |
| |||
| 70,415 |
|
| 61,974 |
|
| 44,553 |
| 46,893 |
| |||
| 176,404,383 |
|
| 2,394,587 |
|
| 68,492 |
| 337,112 |
| |||
$ | 162,019,323 |
| $ | 100,920,903 |
| $ | 12,881,736 | $ | 9,125,577 |
| |||
|
|
|
|
|
|
| |||||||
$ | 469,757,736 |
| $ | 102,164,344 |
| $ | 11,962,723 | $ | 10,868,770 |
| |||
| (307,738,413 | ) |
| (1,243,441 | ) |
| 919,013 |
| (1,743,193 | ) | |||
$ | 162,019,323 |
| $ | 100,920,903 |
| $ | 12,881,736 | $ | 9,125,577 |
| |||
|
|
|
|
|
|
| |||||||
| 33,375,000 |
|
| 1,025,000 |
|
| 400,000 |
| 400,000 |
| |||
$ | 4.85 |
| $ | 98.46 |
| $ | 32.20 | $ | 22.81 |
| |||
|
|
|
|
|
|
| |||||||
$ | — |
| $ | 2,242,016 |
| $ | — | $ | 1,552,873 |
| |||
$ | — |
| $ | — |
| $ | — | $ | — |
| |||
$ | — |
| $ | — |
| $ | — | $ | 1,306,301 |
| |||
$ | 164,349,252 |
| $ | — |
| $ | — | $ | — |
| |||
$ | — |
| $ | — |
| $ | 16,661 | $ | — |
| |||
See accompanying Notes to Financial Statements.
93
AdvisorShares | AdvisorShares | AdvisorShares | ||||||||||
INVESTMENT INCOME: |
|
|
|
|
|
| ||||||
Dividend Income | $ | 979,447 |
| $ | 161,457 |
| $ | 135,624 |
| |||
Dividend Income from Affiliates |
| — |
|
| — |
|
| — |
| |||
Interest Income |
| — |
|
| — |
|
| — |
| |||
Securities lending income (net) (Note 2) |
| 49,297 |
|
| 2,032 |
|
| 9,032 |
| |||
Foreign withholding tax |
| (83,731 | ) |
| — |
|
| — |
| |||
Total Investment Income |
| 945,013 |
|
| 163,489 |
|
| 144,656 |
| |||
|
|
|
|
|
| |||||||
EXPENSES: |
|
|
|
|
|
| ||||||
Advisory Fees |
| 735,743 |
|
| 113,260 |
|
| 132,103 |
| |||
Accounting & Administration Fees |
| 76,186 |
|
| 13,738 |
|
| 12,469 |
| |||
Professional Fees |
| 55,941 |
|
| 25,004 |
|
| 24,678 |
| |||
Exchange Listing Fees |
| 8,751 |
|
| 1,085 |
|
| 335 |
| |||
Custody Fees |
| 7,409 |
|
| 2,215 |
|
| 1,760 |
| |||
Report to Shareholders |
| 16,192 |
|
| 5,283 |
|
| 5,874 |
| |||
Trustee Fees |
| 6,956 |
|
| 3,029 |
|
| 3,029 |
| |||
CCO Fees |
| 14,171 |
|
| 2,082 |
|
| 1,984 |
| |||
Pricing Fees |
| 1,285 |
|
| 2,490 |
|
| 2,641 |
| |||
Transfer Agent Fees |
| 7,357 |
|
| 1,132 |
|
| 1,328 |
| |||
Insurance Fees |
| 9,356 |
|
| — |
|
| — |
| |||
Dividend Expense |
| — |
|
| — |
|
| — |
| |||
Organizational Fees |
| — |
|
| 9,800 |
|
| 9,234 |
| |||
Miscellaneous Fees |
| 9,278 |
|
| 1,388 |
|
| 1,365 |
| |||
Total Expenses |
| 948,625 |
|
| 180,506 |
|
| 196,800 |
| |||
|
|
|
|
|
| |||||||
Advisory Fees Waived/Recoupment |
| 51,436 |
|
| (31,003 | ) |
| (22,184 | ) | |||
Expense Reimbursement |
| — |
|
| — |
|
| — |
| |||
Net Expenses |
| 1,000,061 |
|
| 149,503 |
|
| 174,616 |
| |||
Net Investment Income (Loss) |
| (55,048 | ) |
| 13,986 |
|
| (29,960 | ) | |||
|
|
|
|
|
| |||||||
REALIZED AND UNREALIZED GAIN (LOSS) ON: |
|
|
|
|
|
| ||||||
Net Realized Gain (Loss) on: |
|
|
|
|
|
| ||||||
Investments |
| (13,901,531 | ) |
| (9,519,290 | ) |
| 56,474 |
| |||
In-Kind Redemptions |
| 6,600,451 |
|
| 162,049 |
|
| 487,191 |
| |||
Short Sales |
| — |
|
| — |
|
| — |
| |||
Net Change in Unrealized Appreciation (Depreciation) on: |
|
|
|
|
|
| ||||||
Investments |
| 6,505,899 |
|
| 3,312,784 |
|
| 4,355,897 |
| |||
Investments in Affiliates |
| — |
|
| — |
|
| — |
| |||
Short Sales |
| — |
|
| — |
|
| — |
| |||
Net Realized and Unrealized Gain (Loss) |
| (795,181 | ) |
| (6,044,457 | ) |
| 4,899,562 |
| |||
NET INCREASE (DECREASE) IN NET ASSETS RESULTING FROM OPERATIONS | $ | (850,229 | ) | $ | (6,030,471 | ) | $ | 4,869,602 |
| |||
____________
(1) Represents the period December 26, 2019 (commencement of operations) to June 30, 2020.
See accompanying Notes to Financial Statements.
94
ADVISORSHARES TRUST Year Ended June 30, 2020 |
AdvisorShares | AdvisorShares | AdvisorShares | AdvisorShares | AdvisorShares | ||||||||||||||
|
|
|
|
|
|
|
|
|
| |||||||||
$ | 209,817 |
| $ | 18,464 |
| $ | 231,883 |
| $ | 1,137,623 |
| $ | 221,987 |
| ||||
| — |
|
| — |
|
| 211,958 |
|
| — |
|
| — |
| ||||
| — |
|
| — |
|
| 131,843 |
|
| — |
|
| — |
| ||||
| 10,937 |
|
| 4,349 |
|
| — |
|
| 1,200 |
|
| 1,219 |
| ||||
| — |
|
| (192 | ) |
| — |
|
| (11,625 | ) |
| — |
| ||||
| 220,754 |
|
| 22,621 |
|
| 575,684 |
|
| 1,127,198 |
|
| 223,206 |
| ||||
|
|
|
|
|
|
|
|
|
| |||||||||
|
|
|
|
|
|
|
|
|
| |||||||||
| 121,835 |
|
| 15,224 |
|
| 440,572 |
|
| 379,112 |
|
| 146,061 |
| ||||
| 12,727 |
|
| 59,166 |
|
| 57,211 |
|
| 73,479 |
|
| 72,401 |
| ||||
| 25,058 |
|
| 16,502 |
|
| 29,515 |
|
| 75,626 |
|
| 26,148 |
| ||||
| 991 |
|
| — |
|
| 3,825 |
|
| 5,500 |
|
| 4,641 |
| ||||
| 1,550 |
|
| 2,202 |
|
| 4,524 |
|
| 5,427 |
|
| 1,494 |
| ||||
| 5,080 |
|
| 1,308 |
|
| 8,681 |
|
| 9,775 |
|
| 4,868 |
| ||||
| 3,005 |
|
| 5,550 |
|
| 6,172 |
|
| 6,329 |
|
| 6,209 |
| ||||
| 2,243 |
|
| 339 |
|
| 8,094 |
|
| 8,096 |
|
| 2,689 |
| ||||
| 2,640 |
|
| 25 |
|
| 430 |
|
| 2,037 |
|
| 3,303 |
| ||||
| 1,218 |
|
| 152 |
|
| 4,406 |
|
| 4,062 |
|
| 1,420 |
| ||||
| — |
|
| — |
|
| 1,368 |
|
| 4,186 |
|
| 1,086 |
| ||||
| — |
|
| — |
|
| 1,452,927 |
|
| — |
|
| — |
| ||||
| 9,234 |
|
| — |
|
| — |
|
| — |
|
| — |
| ||||
| 1,388 |
|
| 612 |
|
| 1,889 |
|
| 5,172 |
|
| 1,468 |
| ||||
| 186,969 |
|
| 101,080 |
|
| 2,019,614 |
|
| 578,801 |
|
| 271,788 |
| ||||
|
|
|
|
|
|
|
|
|
| |||||||||
| (26,148 | ) |
| (15,224 | ) |
| 70,194 |
|
| (91,371 | ) |
| (125,698 | ) | ||||
| — |
|
| (62,139 | ) |
| — |
|
| — |
|
| — |
| ||||
| 160,821 |
|
| 23,717 |
|
| 2,089,808 |
|
| 487,430 |
|
| 146,090 |
| ||||
| 59,933 |
|
| (1,096 | ) |
| (1,514,124 | ) |
| 639,768 |
|
| 77,116 |
| ||||
|
|
|
|
|
|
|
|
|
| |||||||||
|
|
|
|
|
|
|
|
|
| |||||||||
|
|
|
|
|
|
|
|
|
| |||||||||
| 42,591 |
|
| (537,845 | ) |
| — |
|
| (1,573,685 | ) |
| (108,296 | ) | ||||
| 399,456 |
|
| 238,720 |
|
| — |
|
| 1,122,726 |
|
| 1,253,336 |
| ||||
| — |
|
| — |
|
| (55,052,518 | ) |
| — |
|
| — |
| ||||
|
|
|
|
|
|
|
|
|
| |||||||||
| 3,279,540 |
|
| 183,938 |
|
| — |
|
| (2,093,528 | ) |
| (641,830 | ) | ||||
| — |
|
| — |
|
| (243,880 | ) |
| — |
|
| — |
| ||||
| — |
|
| — |
|
| 17,919,285 |
|
| — |
|
| — |
| ||||
| 3,721,587 |
|
| (115,187 | ) |
| (37,377,113 | ) |
| (2,544,487 | ) |
| 503,210 |
| ||||
$ | 3,781,520 |
| $ | (116,283 | ) | $ | (38,891,237 | ) | $ | (1,904,719 | ) | $ | 580,326 |
| ||||
See accompanying Notes to Financial Statements.
95
ADVISORSHARES TRUST Year Ended June 30, 2020 |
AdvisorShares | AdvisorShares | AdvisorShares | ||||||||||
INVESTMENT INCOME: |
|
|
|
|
|
| ||||||
Dividend Income | $ | 284,750 |
| $ | 23,942 |
| $ | 222,495 |
| |||
Dividend Income from Affiliates |
| — |
|
| — |
|
| — |
| |||
Interest Income |
| — |
|
| 2,184,425 |
|
| — |
| |||
Securities lending income (net) (Note 2) |
| 7,849 |
|
| 951 |
|
| 2,692,560 |
| |||
Foreign withholding tax |
| — |
|
| — |
|
| — |
| |||
Total Investment Income |
| 292,599 |
|
| 2,209,318 |
|
| 2,915,055 |
| |||
|
|
|
|
|
| |||||||
EXPENSES: |
|
|
|
|
|
| ||||||
Advisory Fees |
| 35,750 |
|
| 339,067 |
|
| 273,012 |
| |||
Accounting & Administration Fees |
| 28,634 |
|
| 109,630 |
|
| 28,193 |
| |||
Professional Fees |
| 20,447 |
|
| 42,047 |
|
| 128,467 |
| |||
Exchange Listing Fees |
| 9,924 |
|
| 8,751 |
|
| 5,547 |
| |||
Custody Fees |
| 627 |
|
| 8,960 |
|
| 30,594 |
| |||
Report to Shareholders |
| 1,038 |
|
| 6,066 |
|
| 35,077 |
| |||
Trustee Fees |
| 5,725 |
|
| 6,666 |
|
| 6,345 |
| |||
CCO Fees |
| 1,150 |
|
| 12,152 |
|
| 7,271 |
| |||
Pricing Fees |
| 1,888 |
|
| 7,158 |
|
| 9,879 |
| |||
Transfer Agent Fees |
| 536 |
|
| 5,086 |
|
| 3,411 |
| |||
Insurance Fees |
| 501 |
|
| 5,636 |
|
| 3,146 |
| |||
Dividend Expense |
| — |
|
| — |
|
| — |
| |||
Miscellaneous Fees |
| 762 |
|
| 7,840 |
|
| 1,867 |
| |||
Total Expenses |
| 106,982 |
|
| 559,059 |
|
| 532,809 |
| |||
|
|
|
|
|
| |||||||
Advisory Fees Waived/Recoupment |
| (35,750 | ) |
| (50,459 | ) |
| (196,096 | ) | |||
Expense Reimbursement |
| (3,307 | ) |
| — |
|
| — |
| |||
Net Expenses |
| 67,925 |
|
| 508,600 |
|
| 336,713 |
| |||
Net Investment Income (Loss) |
| 224,674 |
|
| 1,700,718 |
|
| 2,578,342 |
| |||
|
|
|
|
|
| |||||||
REALIZED AND UNREALIZED GAIN (LOSS) ON: |
|
|
|
|
|
| ||||||
Net Realized Gain (Loss) on: |
|
|
|
|
|
| ||||||
Investments |
| (23,241 | ) |
| (22,978 | ) |
| (18,002,671 | ) | |||
Investments in Affiliates |
| — |
|
| — |
|
| — |
| |||
In-Kind Redemptions |
| — |
|
| — |
|
| — |
| |||
Swaps |
| — |
|
| — |
|
| (4,020,660 | ) | |||
Futures |
| — |
|
| — |
|
| — |
| |||
Short Sales |
| — |
|
| — |
|
| — |
| |||
Foreign Currency Transactions |
| — |
|
| — |
|
| (8,102 | ) | |||
Options Written |
| — |
|
| — |
|
| — |
| |||
Net Change in Unrealized Appreciation (Depreciation) on: |
|
|
|
|
|
| ||||||
Investments |
| (32,321 | ) |
| (468,929 | ) |
| (19,407,567 | ) | |||
Investments in Affiliates |
| — |
|
| — |
|
| — |
| |||
Short Sales |
| — |
|
| — |
|
| — |
| |||
Options Written |
| — |
|
| — |
|
| — |
| |||
Swaps |
| — |
|
| — |
|
| 464,310 |
| |||
Foreign Currency Translations |
| — |
|
| — |
|
| 11 |
| |||
Net Realized and Unrealized Gain (Loss) |
| (55,562 | ) |
| (491,907 | ) |
| (40,974,679 | ) | |||
NET INCREASE (DECREASE) IN NET ASSETS RESULTING FROM OPERATIONS | $ | 169,112 |
| $ | 1,208,811 |
| $ | (38,396,337 | ) | |||
See accompanying Notes to Financial Statements.
96
ADVISORSHARES TRUST Year Ended June 30, 2020 |
|
|
|
| |||||||||||
|
|
|
|
|
|
|
| |||||||
$ | 1,191,072 |
| $ | 26,298 |
| $ | 293,942 |
| $ | 290,857 |
| |||
| 1,419,149 |
|
| — |
|
| — |
|
| — |
| |||
| 374,828 |
|
| 2,214,044 |
|
| — |
|
| — |
| |||
| — |
|
| 27,880 |
|
| — |
|
| 23,346 |
| |||
| — |
|
| — |
|
| — |
|
| (5,846 | ) | |||
| 2,985,049 |
|
| 2,268,222 |
|
| 293,942 |
|
| 308,357 |
| |||
|
|
|
|
|
|
|
| |||||||
|
|
|
|
|
|
|
| |||||||
| 2,202,563 |
|
| 283,646 |
|
| 187,760 |
|
| 69,336 |
| |||
| 75,453 |
|
| 80,614 |
|
| 71,004 |
|
| 64,892 |
| |||
| 68,735 |
|
| 50,456 |
|
| 25,222 |
|
| 23,287 |
| |||
| 5,460 |
|
| 6,814 |
|
| 5,472 |
|
| — |
| |||
| 11,373 |
|
| 10,477 |
|
| 1,286 |
|
| 2,226 |
| |||
| 34,261 |
|
| 12,971 |
|
| 2,960 |
|
| 11,172 |
| |||
| 8,418 |
|
| 6,583 |
|
| 5,913 |
|
| 6,018 |
| |||
| 23,922 |
|
| 14,910 |
|
| 1,759 |
|
| 2,107 |
| |||
| 2,807 |
|
| 11,529 |
|
| 1,735 |
|
| 1,267 |
| |||
| 11,011 |
|
| 7,091 |
|
| 1,043 |
|
| 867 |
| |||
| 10,091 |
|
| 4,817 |
|
| 975 |
|
| 784 |
| |||
| 2,084,696 |
|
| — |
|
| — |
|
| — |
| |||
| 16,041 |
|
| 6,580 |
|
| 1,543 |
|
| 1,216 |
| |||
| 4,554,831 |
|
| 496,488 |
|
| 306,672 |
|
| 183,172 |
| |||
|
|
|
|
|
|
|
| |||||||
| — |
|
| (165,567 | ) |
| (49,370 | ) |
| (69,336 | ) | |||
| — |
|
| — |
|
| — |
|
| (9,952 | ) | |||
| 4,554,831 |
|
| 330,921 |
|
| 257,302 |
|
| 103,884 |
| |||
| (1,569,782 | ) |
| 1,937,301 |
|
| 36,640 |
|
| 204,473 |
| |||
|
|
|
|
|
|
|
| |||||||
|
|
|
|
|
|
|
| |||||||
|
|
|
|
|
|
|
| |||||||
| — |
|
| (1,125,474 | ) |
| (199,045 | ) |
| (766,604 | ) | |||
| (12,747 | ) |
| — |
|
| — |
|
| — |
| |||
| — |
|
| — |
|
| 392,694 |
|
| 479,561 |
| |||
| — |
|
| — |
|
| — |
|
| — |
| |||
| — |
|
| (2,469 | ) |
| — |
|
| — |
| |||
| (47,321,141 | ) |
| — |
|
| — |
|
| — |
| |||
| — |
|
| — |
|
| — |
|
| — |
| |||
| — |
|
| — |
|
| (257,534 | ) |
| — |
| |||
|
|
|
|
|
|
|
| |||||||
| — |
|
| (49,554 | ) |
| 178,708 |
|
| (726,546 | ) | |||
| (845,749 | ) |
| — |
|
| — |
|
| — |
| |||
| 350,317 |
|
| — |
|
| — |
|
| — |
| |||
| — |
|
| — |
|
| 8,137 |
|
| — |
| |||
| — |
|
| — |
|
| — |
|
| — |
| |||
| — |
|
| — |
|
| — |
|
| — |
| |||
| (47,829,320 | ) |
| (1,177,497 | ) |
| 122,960 |
|
| (1,013,589 | ) | |||
$ | (49,399,102 | ) | $ | 759,804 |
| $ | 159,600 |
| $ | (809,116 | ) | |||
See accompanying Notes to Financial Statements.
97
| ||||||||
|
| |||||||
INCREASE (DECREASE) IN NET ASSETS OPERATIONS |
|
|
|
| ||||
Net Investment Income (Loss) | $ | (55,048 | ) | $ | 671,886 |
| ||
Net Realized Gain (Loss) |
| (7,301,080 | ) |
| (29,152,407 | ) | ||
Net Change in Unrealized Appreciation (Depreciation) |
| 6,505,899 |
|
| 7,499,640 |
| ||
Net Increase (Decrease) In Net Assets Resulting From Operations |
| (850,229 | ) |
| (20,980,881 | ) | ||
DISTRIBUTIONS TO SHAREHOLDERS |
|
|
|
| ||||
Distributions |
| (18,253 | ) |
| (669,735 | ) | ||
Total Distributions |
| (18,253 | ) |
| (669,735 | ) | ||
CAPITAL STOCK TRANSACTIONS |
|
|
|
| ||||
Proceeds from Shares Issued |
| 21,728,373 |
|
| 10,215,051 |
| ||
Value of Shares Redeemed |
| (53,178,644 | ) |
| (127,066,943 | ) | ||
Net Increase (Decrease) From Capital Stock Transactions |
| (31,450,271 | ) |
| (116,851,892 | ) | ||
Net Increase (Decrease) in Net Assets |
| (32,318,753 | ) |
| (138,502,508 | ) | ||
Net Assets: |
|
|
|
| ||||
Beginning of Year/Period |
| 108,198,075 |
|
| 246,700,583 |
| ||
End of Year/Period | $ | 75,879,322 |
| $ | 108,198,075 |
| ||
Changes in Shares Outstanding |
|
|
|
| ||||
Shares Outstanding, Beginning of Year/Period |
| 2,175,000 |
|
| 4,625,000 |
| ||
Shares Sold |
| 400,000 |
|
| 225,000 |
| ||
Shares Repurchased |
| (1,150,000 | ) |
| (2,675,000 | ) | ||
Shares Outstanding, End of Year/Period |
| 1,425,000 |
|
| 2,175,000 |
| ||
____________
* Commencement of operations.
See accompanying Notes to Financial Statements.
98
ADVISORSHARES TRUST |
AdvisorShares | AdvisorShares | AdvisorShares | ||||||||
For the period | For the period | For the period | ||||||||
|
|
|
|
|
| |||||
$ | 13,986 |
| $ | (29,960 | ) | $ | 59,933 |
| ||
| (9,357,241 | ) |
| 543,665 |
|
| 442,047 |
| ||
| 3,312,784 |
|
| 4,355,897 |
|
| 3,279,540 |
| ||
|
| ) |
|
|
|
|
|
| ||
|
|
|
|
|
| |||||
| — |
|
| — |
|
| — |
| ||
| — |
|
| — |
|
| — |
| ||
|
|
|
|
|
| |||||
| 52,473,131 |
|
| 84,936,967 |
|
| 61,741,061 |
| ||
| (7,109,305 | ) |
| (16,121,773 | ) |
| (18,755,332 | ) | ||
| 45,363,826 |
|
| 68,815,194 |
|
| 42,985,729 |
| ||
| 39,333,355 |
|
| 73,684,796 |
|
| 46,767,249 |
| ||
|
|
|
|
|
| |||||
| — |
|
| — |
|
| — |
| ||
$ | 39,333,355 |
| $ | 73,684,796 |
| $ | 46,767,249 |
| ||
|
|
|
|
|
| |||||
| — |
|
| — |
|
| — |
| ||
| 2,250,000 |
|
| 3,250,000 |
|
| 2,425,000 |
| ||
| (325,000 | ) |
| (625,000 | ) |
| (725,000 | ) | ||
| 1,925,000 |
|
| 2,625,000 |
|
| 1,700,000 |
| ||
See accompanying Notes to Financial Statements.
99
ADVISORSHARES TRUST |
AdvisorShares Dorsey | ||||||||
Year ended | For the period | |||||||
INCREASE (DECREASE) IN NET ASSETS OPERATIONS |
|
|
|
| ||||
Net Investment Income (Loss) | $ | (1,096 | ) | $ | (2,561 | ) | ||
Net Realized Gain (Loss) |
| (299,125 | ) |
| (651,231 | ) | ||
Net Change in Unrealized Appreciation (Depreciation) |
| 183,938 |
|
| 311,836 |
| ||
Net Increase (Decrease) In Net Assets Resulting From Operations |
| (116,283 | ) |
| (341,956 | ) | ||
DISTRIBUTIONS TO SHAREHOLDERS |
|
|
|
| ||||
Distributions |
| (1,775 | ) |
| — |
| ||
Total Distributions |
| (1,775 | ) |
| — |
| ||
CAPITAL STOCK TRANSACTIONS |
|
|
|
| ||||
Proceeds from Shares Issued |
| 1,098,972 |
|
| 4,158,184 |
| ||
Value of Shares Redeemed |
| (1,172,715 | ) |
| (1,512,630 | ) | ||
Net Increase (Decrease) From Capital Stock Transactions |
| (73,743 | ) |
| 2,645,554 |
| ||
Net Increase (Decrease) in Net Assets |
| (191,801 | ) |
| 2,303,598 |
| ||
Net Assets: |
|
|
|
| ||||
Beginning of Year/Period |
| 2,303,598 |
|
| — |
| ||
End of Year/Period | $ | 2,111,797 |
| $ | 2,303,598 |
| ||
Changes in Shares Outstanding |
|
|
|
| ||||
Shares Outstanding, Beginning of Year/Period |
| 100,000 |
|
| — |
| ||
Shares Sold |
| 50,000 |
|
| 175,000 |
| ||
Shares Repurchased |
| (50,000 | ) |
| (75,000 | ) | ||
Shares Outstanding, End of Year/Period |
| 100,000 |
|
| 100,000 |
| ||
____________
* Commencement of operations.
See accompanying Notes to Financial Statements.
100
ADVISORSHARES TRUST |
AdvisorShares Dorsey | AdvisorShares DoubleLine | AdvisorShares Focused | ||||||||||||||||||||
Year ended | For the period | Year ended | Year ended | Year ended | Year ended | |||||||||||||||||
|
|
|
|
|
|
|
|
|
|
|
| |||||||||||
$ | (1,514,124 | ) | $ | 65,289 |
| $ | 639,768 |
| $ | 695,083 |
| $ | 77,116 |
| $ | 74,174 |
| |||||
| (55,052,518 | ) |
| (2,276,599 | ) |
| (450,959 | ) |
| (5,293,435 | ) |
| 1,145,040 |
|
| (614,208 | ) | |||||
| 17,675,405 |
|
| 1,203,321 |
|
| (2,093,528 | ) |
| 4,571,285 |
|
| (641,830 | ) |
| 2,250,694 |
| |||||
|
| ) |
|
| ) |
|
| ) |
|
| ) |
|
|
|
|
|
| |||||
|
|
|
|
|
|
|
|
|
|
|
| |||||||||||
| (64,055 | ) |
| (17,152 | ) |
| (652,256 | ) |
| (830,880 | ) |
| (80,515 | ) |
| (337,572 | ) | |||||
| (64,055 | ) |
| (17,152 | ) |
| (652,256 | ) |
| (830,880 | ) |
| (80,515 | ) |
| (337,572 | ) | |||||
|
|
|
|
|
|
|
|
|
|
|
| |||||||||||
| 226,951,360 |
|
| 46,950,851 |
|
| — |
|
| — |
|
| 6,471,068 |
|
| 1,526,590 |
| |||||
| (99,178,487 | ) |
| (21,645,192 | ) |
| (17,345,515 | ) |
| (32,790,377 | ) |
| (4,565,446 | ) |
| — |
| |||||
| 127,772,873 |
|
| 25,305,659 |
|
| (17,345,515 | ) |
| (32,790,377 | ) |
| 1,905,622 |
|
| 1,526,590 |
| |||||
| 88,817,581 |
|
| 24,280,518 |
|
| (19,902,490 | ) |
| (33,648,324 | ) |
| 2,405,433 |
|
| 2,899,678 |
| |||||
|
|
|
|
|
|
|
|
|
|
|
| |||||||||||
| 24,280,518 |
|
| — |
|
| 61,385,731 |
|
| 95,034,055 |
|
| 17,211,026 |
|
| 14,311,348 |
| |||||
$ | 113,098,099 |
| $ | 24,280,518 |
| $ | 41,483,241 |
| $ | 61,385,731 |
| $ | 19,616,459 |
| $ | 17,211,026 |
| |||||
|
|
|
|
|
|
|
|
|
|
|
| |||||||||||
| 975,000 |
|
| — |
|
| 900,000 |
|
| 1,400,000 |
|
| 500,000 |
|
| 450,000 |
| |||||
| 8,500,000 |
|
| 1,800,000 |
|
| — |
|
| — |
|
| 175,000 |
|
| 50,000 |
| |||||
| (3,625,000 | ) |
| (825,000 | ) |
| (275,000 | ) |
| (500,000 | ) |
| (125,000 | ) |
| — |
| |||||
| 5,850,000 |
|
| 975,000 |
|
| 625,000 |
|
| 900,000 |
|
| 550,000 |
|
| 500,000 |
| |||||
See accompanying Notes to Financial Statements.
101
ADVISORSHARES TRUST |
AdvisorShares FolioBeyond | ||||||||
|
| |||||||
INCREASE (DECREASE) IN NET ASSETS OPERATIONS |
|
|
|
| ||||
Net Investment Income (Loss) | $ | 224,674 |
| $ | 637,678 |
| ||
Net Realized Gain (Loss) |
| (23,241 | ) |
| (127,355 | ) | ||
Net Change in Unrealized Appreciation (Depreciation) |
| (32,321 | ) |
| 187,184 |
| ||
Net Increase (Decrease) In Net Assets Resulting From Operations |
| 169,112 |
|
| 697,507 |
| ||
DISTRIBUTIONS TO SHAREHOLDERS |
|
|
|
| ||||
Distributions |
| (224,781 | ) |
| (659,376 | ) | ||
Total Distributions |
| (224,781 | ) |
| (659,376 | ) | ||
CAPITAL STOCK TRANSACTIONS |
|
|
|
| ||||
Proceeds from Shares Issued |
| 2,582,984 |
|
| — |
| ||
Value of Shares Redeemed |
| — |
|
| (12,658,809 | ) | ||
Net Increase (Decrease) From Capital Stock Transactions |
| 2,582,984 |
|
| (12,658,809 | ) | ||
Net Increase (Decrease) in Net Assets |
| 2,527,315 |
|
| (12,620,678 | ) | ||
Net Assets: |
|
|
|
| ||||
Beginning of Year/Period |
| 5,784,667 |
|
| 18,405,345 |
| ||
End of Year/Period | $ | 8,311,982 |
| $ | 5,784,667 |
| ||
Changes in Shares Outstanding |
|
|
|
| ||||
Shares Outstanding, Beginning of Year/Period |
| 225,000 |
|
| 725,000 |
| ||
Shares Sold |
| 100,000 |
|
| — |
| ||
Shares Repurchased |
| — |
|
| (500,000 | ) | ||
Shares Outstanding, End of Year/Period |
| 325,000 |
|
| 225,000 |
| ||
____________
* Commencement of operations.
See accompanying Notes to Financial Statements.
102
ADVISORSHARES TRUST |
AdvisorShares Newfleet | AdvisorShares Pure | AdvisorShares Ranger | ||||||||||||||||||||
Year ended | Year ended | Year ended | For the period | Year ended | Year ended | |||||||||||||||||
|
|
|
|
|
|
|
|
|
|
|
| |||||||||||
$ | 1,700,718 |
| $ | 3,286,760 |
| $ | 2,578,342 |
| $ | 123,089 |
| $ | (1,569,782 | ) | $ | 237,976 |
| |||||
| (22,978 | ) |
| (723,197 | ) |
| (22,031,433 | ) |
| (1,047,973 | ) |
| (47,333,888 | ) |
| (28,825,802 | ) | |||||
| (468,929 | ) |
| 1,817,966 |
|
| (18,943,246 | ) |
| (4,427,616 | ) |
| (495,432 | ) |
| 658,109 |
| |||||
|
|
|
|
|
|
|
| ) |
|
| ) |
|
| ) |
|
| ) | |||||
|
|
|
|
|
|
|
|
|
|
|
| |||||||||||
| (1,814,609 | ) |
| (3,385,118 | ) |
| (2,875,940 | ) |
| — |
|
| (241,821 | ) |
| — |
| |||||
| (1,814,609 | ) |
| (3,385,118 | ) |
| (2,875,940 | ) |
| — |
|
| (241,821 | ) |
| — |
| |||||
|
|
|
|
|
|
|
|
|
|
|
| |||||||||||
| 2,415,315 |
|
| 2,408,357 |
|
| 27,013,111 |
|
| 65,114,494 |
|
| 256,014,517 |
|
| 108,950,893 |
| |||||
| (19,122,227 | ) |
| (83,853,788 | ) |
| — |
|
| — |
|
| (180,168,550 | ) |
| (78,793,948 | ) | |||||
| (16,706,912 | ) |
| (81,445,431 | ) |
| 27,013,111 |
|
| 65,114,494 |
|
| 75,845,967 |
|
| 30,156,945 |
| |||||
| (17,312,710 | ) |
| (80,449,020 | ) |
| (14,259,166 | ) |
| 59,761,994 |
|
| 26,205,044 |
|
| 2,227,228 |
| |||||
|
|
|
|
|
|
|
|
|
|
|
| |||||||||||
| 75,079,810 |
|
| 155,528,830 |
|
| 59,761,994 |
|
| — |
|
| 135,814,279 |
|
| 133,587,051 |
| |||||
$ | 57,767,100 |
| $ | 75,079,810 |
| $ | 45,502,828 |
| $ | 59,761,994 |
| $ | 162,019,323 |
| $ | 135,814,279 |
| |||||
|
|
|
|
|
|
|
|
|
|
|
| |||||||||||
| 1,550,000 |
|
| 3,250,000 |
|
| 2,600,000 |
|
| — |
|
| 21,275,000 |
|
| 17,125,000 |
| |||||
| 50,000 |
|
| 50,000 |
|
| 1,875,000 |
|
| 2,600,000 |
|
| 41,200,000 |
|
| 14,850,000 |
| |||||
| (400,000 | ) |
| (1,750,000 | ) |
| — |
|
| — |
|
| (29,100,000 | ) |
| (10,700,000 | ) | |||||
| 1,200,000 |
|
| 1,550,000 |
|
| 4,475,000 |
|
| 2,600,000 |
|
| 33,375,000 |
|
| 21,275,000 |
| |||||
See accompanying Notes to Financial Statements.
103
ADVISORSHARES TRUST |
AdvisorShares Sage Core | ||||||||
Year ended | Year ended | |||||||
INCREASE (DECREASE) IN NET ASSETS OPERATIONS |
|
|
|
| ||||
Net Investment Income (Loss) | $ | 1,937,301 |
| $ | 1,551,236 |
| ||
Net Realized Gain (Loss) |
| (1,127,943 | ) |
| 45,009 |
| ||
Net Change in Unrealized Appreciation (Depreciation) |
| (49,554 | ) |
| 179,195 |
| ||
Net Increase (Decrease) In Net Assets Resulting From Operations |
| 759,804 |
|
| 1,775,440 |
| ||
DISTRIBUTIONS TO SHAREHOLDERS |
|
|
|
| ||||
Distributions |
| (1,939,526 | ) |
| (1,508,500 | ) | ||
Total Distributions |
| (1,939,526 | ) |
| (1,508,500 | ) | ||
CAPITAL STOCK TRANSACTIONS |
|
|
|
| ||||
Proceeds from Shares Issued |
| 54,828,438 |
|
| 19,886,389 |
| ||
Value of Shares Redeemed |
| (24,967,941 | ) |
| — |
| ||
Net Increase (Decrease) From Capital Stock Transactions |
| 29,860,497 |
|
| 19,886,389 |
| ||
Net Increase (Decrease) in Net Assets |
| 28,680,775 |
|
| 20,153,329 |
| ||
Net Assets: |
|
|
|
| ||||
Beginning of Year/Period |
| 72,240,128 |
|
| 52,086,799 |
| ||
End of Year/Period | $ | 100,920,903 |
| $ | 72,240,128 |
| ||
Changes in Shares Outstanding |
|
|
|
| ||||
Shares Outstanding, Beginning of Year/Period |
| 725,000 |
|
| 525,000 |
| ||
Shares Sold |
| 550,000 |
|
| 200,000 |
| ||
Shares Repurchased |
| (250,000 | ) |
| — |
| ||
Shares Outstanding, End of Year/Period |
| 1,025,000 |
|
| 725,000 |
| ||
See accompanying Notes to Financial Statements.
104
ADVISORSHARES TRUST |
AdvisorShares STAR Global | AdvisorShares | |||||||||||||
Year ended | Year ended | Year ended | Year ended | |||||||||||
|
|
|
|
|
|
|
| |||||||
$ | 36,640 |
| $ | 67,960 |
| $ | 204,473 |
| $ | 236,447 |
| |||
| (63,885 | ) |
| 605,667 |
|
| (287,043 | ) |
| (765,936 | ) | |||
| 186,845 |
|
| (1,829 | ) |
| (726,546 | ) |
| 389,973 |
| |||
|
|
|
|
|
|
|
| ) |
|
| ) | |||
|
|
|
|
|
|
|
| |||||||
| (67,959 | ) |
| (64,625 | ) |
| (294,624 | ) |
| (193,320 | ) | |||
| (67,959 | ) |
| (64,625 | ) |
| (294,624 | ) |
| (193,320 | ) | |||
|
|
|
|
|
|
|
| |||||||
| — |
|
| — |
|
| 634,444 |
|
| 2,584,978 |
| |||
| (1,736,947 | ) |
| (3,127,207 | ) |
| (3,588,098 | ) |
| (1,868,954 | ) | |||
| (1,736,947 | ) |
| (3,127,207 | ) |
| (2,953,654 | ) |
| 716,024 |
| |||
| (1,645,306 | ) |
| (2,520,034 | ) |
| (4,057,394 | ) |
| 383,188 |
| |||
|
|
|
|
|
|
|
| |||||||
| 14,527,042 |
|
| 17,047,076 |
|
| 13,182,971 |
|
| 12,799,783 |
| |||
$ | 12,881,736 |
| $ | 14,527,042 |
| $ | 9,125,577 |
| $ | 13,182,971 |
| |||
|
|
|
|
|
|
|
| |||||||
| 450,000 |
|
| 550,000 |
|
| 525,000 |
|
| 500,000 |
| |||
| — |
|
| — |
|
| 25,000 |
|
| 100,000 |
| |||
| (50,000 | ) |
| (100,000 | ) |
| (150,000 | ) |
| (75,000 | ) | |||
| 400,000 |
|
| 450,000 |
|
| 400,000 |
|
| 525,000 |
| |||
See accompanying Notes to Financial Statements.
105
| ||||||||||||||||||||
|
|
|
|
| ||||||||||||||||
Selected Data for a Share of Capital Stock Outstanding |
|
|
|
|
|
|
|
|
|
| ||||||||||
Net Asset Value, Beginning of Year/Period | $ | 49.75 |
| $ | 53.34 |
| $ | 46.56 |
| $ | 39.06 |
| $ | 38.86 |
| |||||
Investment Operations |
|
|
|
|
|
|
|
|
|
| ||||||||||
Net Investment Income (Loss)(1) |
| (0.03 | ) |
| 0.23 |
|
| 0.55 |
|
| 0.68 |
|
| 0.17 |
| |||||
Net Realized and Unrealized Gain (Loss) |
| 3.54 |
|
| (3.51 | ) |
| 6.66 |
|
| 7.27 |
|
| 0.23 |
| |||||
Net Increase (Decrease) in Net Assets Resulting from Investment Operations(3) |
| 3.51 |
|
| (3.28 | ) |
| 7.21 |
|
| 7.95 |
|
| 0.40 |
| |||||
Distributions from Net Investment Income |
| (0.01 | ) |
| (0.31 | ) |
| (0.43 | ) |
| (0.45 | ) |
| (0.20 | ) | |||||
Total Distributions |
| (0.01 | ) |
| (0.31 | ) |
| (0.43 | ) |
| (0.45 | ) |
| (0.20 | ) | |||||
Net Asset Value, End of Year/Period | $ | 53.25 |
| $ | 49.75 |
| $ | 53.34 |
| $ | 46.56 |
| $ | 39.06 |
| |||||
Market Value, End of Year/Period | $ | 52.97 |
| $ | 49.69 |
| $ | 53.19 |
| $ | 46.61 |
| $ | 39.06 |
| |||||
|
|
|
|
|
|
|
|
|
| |||||||||||
Total Return |
|
|
|
|
|
|
|
|
|
| ||||||||||
Total Investment Return Based on Net Asset Value(4) |
| 7.06 | % |
| (6.16 | )% |
| 15.45 | % |
| 20.43 | % |
| 1.05 | % | |||||
Total Investment Return Based on Market(4) |
| 6.62 | % |
| (6.00 | )% |
| 15.01 | % |
| 20.55 | % |
| 1.27 | % | |||||
Ratios/Supplemental Data |
|
|
|
|
|
|
|
|
|
| ||||||||||
Net Assets, End of Year/Period (000’s omitted) | $ | 75,879 |
| $ | 108,198 |
| $ | 246,701 |
| $ | 65,185 |
| $ | 14,648 |
| |||||
Ratio to Average Net Assets of:(5) |
|
|
|
|
|
|
|
|
|
| ||||||||||
Expenses, net of expense waivers and reimbursements(6) |
| 1.02 | % |
| 0.88 | % |
| 1.02 | % |
| 1.25 | % |
| 1.25 | % | |||||
Expenses, prior to expense waivers and reimbursements(6) |
| 0.97 | % |
| 1.07 | % |
| 0.95 | % |
| 1.43 | % |
| 1.62 | % | |||||
Net Investment Income (Loss)(6) |
| (0.06 | )% |
| 0.47 | % |
| 0.96 | % |
| 1.55 | % |
| 0.44 | % | |||||
Portfolio Turnover Rate(9) |
| 48 | % |
| 120 | % |
| 71 | % |
| 108 | %(10) |
| 25 | % | |||||
See accompanying Notes to Financial Statements.
106
ADVISORSHARES TRUST |
AdvisorShares | AdvisorShares | AdvisorShares |
| |||||||||||||||
For the period | For the period | For the period | Year ended | For the period | ||||||||||||||
| |
|
| |
|
| |
|
|
|
|
| ||||||
$ | 25.09 |
| $ | 25.12 |
| $ | 25.14 |
| $ | 23.04 |
| $ | 24.71 |
| ||||
|
|
|
|
|
|
|
|
|
| |||||||||
| 0.01 |
|
| (0.02 | ) |
| 0.05 |
|
| (0.01 | ) |
| (0.02 | ) | ||||
| (4.67 | ) |
| 2.97 |
|
| 2.32 |
|
| (1.89 | ) |
| (1.65 | ) | ||||
|
| ) |
|
|
|
|
|
|
|
| ) |
|
| ) | ||||
| — |
|
| — |
|
| — |
|
| (0.02 | ) |
| — |
| ||||
| — |
|
| — |
|
| — |
|
| (0.02 | ) |
| — |
| ||||
$ | 20.43 |
| $ | 28.07 |
| $ | 27.51 |
| $ | 21.12 |
| $ | 23.04 |
| ||||
$ | 20.44 |
| $ | 28.07 |
| $ | 27.46 |
| $ | 20.80 |
| $ | 23.02 |
| ||||
|
|
|
|
|
|
|
|
|
| |||||||||
|
|
|
|
|
|
|
|
|
| |||||||||
|
| )% |
|
| % |
|
| % |
|
| )% |
|
| )% | ||||
| (18.53 | )% |
| 11.74 | % |
| 9.23 | % |
| (9.58 | )% |
| (6.86 | )% | ||||
|
|
|
|
|
|
|
|
|
| |||||||||
$ | 39,333 |
| $ | 73,685 |
| $ | 46,767 |
| $ | 2,112 |
| $ | 2,304 |
| ||||
|
|
|
|
|
|
|
|
|
| |||||||||
|
| % |
|
| % |
|
| % |
|
| % |
|
| % | ||||
|
| % |
|
| % |
|
| % |
|
| % |
|
| % | ||||
| 0.09 | % |
| (0.17 | )% |
| 0.37 | % |
| (0.05 | )% |
| (0.11 | )% | ||||
| 147 | % |
| 46 | % |
| 53 | % |
| 119 | % |
| 103 | % | ||||
See accompanying Notes to Financial Statements.
107
ADVISORSHARES TRUST |
AdvisorShares Dorsey Wright | ||||||||
Year ended | For the period | |||||||
Selected Data for a Share of Capital Stock Outstanding |
|
|
|
| ||||
Net Asset Value, Beginning of Year/Period | $ | 24.90 |
| $ | 25.00 |
| ||
Investment Operations |
|
|
|
| ||||
Net Investment Income (Loss)(1) |
| (0.65 | ) |
| 0.13 |
| ||
Net Realized and Unrealized Gain (Loss) |
| (4.89 | ) |
| (0.19 | ) | ||
Net Increase (Decrease) in Net Assets Resulting from Investment Operations(3) |
| (5.54 | ) |
| (0.06 | ) | ||
Distributions from Net Investment Income |
| (0.03 | ) |
| (0.04 | ) | ||
Total Distributions |
| (0.03 | ) |
| (0.04 | ) | ||
Net Asset Value, End of Year/Period | $ | 19.33 |
| $ | 24.90 |
| ||
Market Value, End of Year/Period | $ | 19.36 |
| $ | 24.93 |
| ||
|
|
|
| |||||
Total Return |
|
|
|
| ||||
Total Investment Return Based on Net Asset Value(4) |
| (22.26 | )% |
| (0.27 | )% | ||
Total Investment Return Based on Market(4) |
| (22.24 | )% |
| (0.18 | )% | ||
Ratios/Supplemental Data |
|
|
|
| ||||
Net Assets, End of Year/Period (000’s omitted) | $ | 113,098 |
| $ | 24,281 |
| ||
Ratio to Average Net Assets of:(5) |
|
|
|
| ||||
Expenses, net of expense waivers and reimbursements(6) |
| 3.56 | % |
| 2.70 | %(7) | ||
Expenses, prior to expense waivers and reimbursements(6) |
| 3.56 | % |
| 3.26 | %(7) | ||
Net Investment Income (Loss)(6) |
| (2.58 | )% |
| 0.53 | % | ||
Portfolio Turnover Rate(9) |
| 555 | % |
| 357 | % | ||
See accompanying Notes to Financial Statements.
108
ADVISORSHARES TRUST |
| ||||||||||||||||||
|
|
|
|
| ||||||||||||||
|
|
|
|
|
|
|
|
|
| |||||||||
$ | 68.21 |
| $ | 67.88 |
| $ | 66.23 |
| $ | 55.56 |
| $ | 57.05 |
| ||||
|
|
|
|
|
|
|
|
|
| |||||||||
| 0.82 |
|
| 0.62 |
|
| 0.53 |
|
| 0.47 |
|
| 0.47 |
| ||||
| (1.84 | ) |
| 0.45 |
|
| 1.59 |
|
| 10.93 |
|
| (1.54 | ) | ||||
| (1.02 | ) |
| 1.07 |
|
| 2.12 |
|
| 11.40 |
|
| (1.07 | ) | ||||
| (0.82 | ) |
| (0.74 | ) |
| (0.47 | ) |
| (0.73 | ) |
| (0.42 | ) | ||||
| (0.82 | ) |
| (0.74 | ) |
| (0.47 | ) |
| (0.73 | ) |
| (0.42 | ) | ||||
$ | 66.37 |
| $ | 68.21 |
| $ | 67.88 |
| $ | 66.23 |
| $ | 55.56 |
| ||||
$ | 66.28 |
| $ | 68.13 |
| $ | 67.88 |
| $ | 66.17 |
| $ | 55.53 |
| ||||
|
|
|
|
|
|
|
|
|
| |||||||||
|
|
|
|
|
|
|
|
|
| |||||||||
| (1.63 | )% |
| 1.74 | % |
| 3.15 | % |
| 20.55 | % |
| (1.87 | )% | ||||
| (1.65 | )% |
| 1.63 | % |
| 3.26 | % |
| 20.52 | % |
| (1.91 | )% | ||||
|
|
|
|
|
|
|
|
|
| |||||||||
$ | 41,483 |
| $ | 61,386 |
| $ | 95,034 |
| $ | 142,400 |
| $ | 155,570 |
| ||||
|
|
|
|
|
|
|
|
|
| |||||||||
| 0.90 | % |
| 0.90 | % |
| 0.87 | % |
| 0.90 | % |
| 0.99 | % | ||||
| 1.07 | % |
| 1.17 | % |
| 1.07 | % |
| 1.07 | % |
| 1.21 | % | ||||
| 1.18 | % |
| 0.93 | % |
| 0.77 | % |
| 0.76 | % |
| 0.86 | % | ||||
| 93 | % |
| 218 | % |
| 171 | % |
| 180 | % |
| 196 | % | ||||
See accompanying Notes to Financial Statements.
109
ADVISORSHARES TRUST |
| ||||||||||||||||
Year ended | Year ended | Year ended | For the period | |||||||||||||
Selected Data for a Share of Capital Stock Outstanding |
|
|
|
|
|
|
|
| ||||||||
Net Asset Value, Beginning of Year/Period | $ | 34.42 |
| $ | 31.80 |
| $ | 28.59 |
| $ | 25.00 |
| ||||
Investment Operations |
|
|
|
|
|
|
|
| ||||||||
Net Investment Income (Loss)(1) |
| 0.14 |
|
| 0.16 |
|
| 0.13 |
|
| 0.06 |
| ||||
Net Realized and Unrealized Gain (Loss) |
| 1.26 |
|
| 3.21 |
|
| 3.17 |
|
| 3.54 |
| ||||
Distributions of Net Realized Gains by other investment companies |
| — |
|
| — |
|
| — |
|
| — |
| ||||
Net Increase (Decrease) in Net Assets Resulting from Investment Operations(3) |
| 1.40 |
|
| 3.37 |
|
| 3.30 |
|
| 3.60 |
| ||||
Distributions from Net Investment Income |
| (0.15 | ) |
| (0.16 | ) |
| (0.09 | ) |
| (0.01 | ) | ||||
Distributions from Realized Capital Gains |
| — |
|
| (0.59 | ) |
| — |
|
| — |
| ||||
Total Distributions |
| (0.15 | ) |
| (0.75 | ) |
| (0.09 | ) |
| (0.01 | ) | ||||
Net Asset Value, End of Year/Period | $ | 35.67 |
| $ | 34.42 |
| $ | 31.80 |
| $ | 28.59 |
| ||||
Market Value, End of Year/Period | $ | 34.88 |
| $ | 34.31 |
| $ | 31.79 |
| $ | 28.59 |
| ||||
|
|
|
|
|
|
|
| |||||||||
Total Return |
|
|
|
|
|
|
|
| ||||||||
Total Investment Return Based on Net Asset Value(4) |
| 4.02 | % |
| 11.09 | % |
| 11.57 | % |
| 14.39 | % | ||||
Total Investment Return Based on Market(4) |
| 2.06 | % |
| 10.74 | % |
| 11.51 | % |
| 14.40 | % | ||||
Ratios/Supplemental Data |
|
|
|
|
|
|
|
| ||||||||
Net Assets, End of Year/Period (000’s omitted) | $ | 19,616 |
| $ | 17,211 |
| $ | 14,311 |
| $ | 12,150 |
| ||||
Ratio to Average Net Assets of:(5) |
|
|
|
|
|
|
|
| ||||||||
Expenses, net of expense waivers and reimbursements(6) |
| 0.77 | % |
| 0.72 | % |
| 0.68 | % |
| 0.75 | % | ||||
Expenses, prior to expense waivers and reimbursements(6) |
| 1.43 | % |
| 1.63 | % |
| 1.39 | % |
| 2.04 | % | ||||
Net Investment Income (Loss)(6) |
| 0.41 | % |
| 0.49 | % |
| 0.42 | % |
| 0.28 | % | ||||
Portfolio Turnover Rate(9) |
| 23 | % |
| 19 | % |
| 26 | % |
| 36 | % | ||||
See accompanying Notes to Financial Statements.
110
ADVISORSHARES TRUST |
| ||||||||||||||||||
|
|
|
|
| ||||||||||||||
|
|
|
|
|
|
|
|
|
| |||||||||
$ | 25.71 |
| $ | 25.39 |
| $ | 25.88 |
| $ | 25.61 |
| $ | 24.97 |
| ||||
|
|
|
|
|
|
|
|
|
| |||||||||
| 0.81 |
|
| 1.04 |
|
| 0.90 |
|
| 0.81 |
|
| 0.75 |
| ||||
| (0.10 | ) |
| 0.38 |
|
| (0.50 | ) |
| 0.25 |
|
| 0.59 |
| ||||
|
|
|
|
|
|
|
|
|
|
|
|
|
|
| ||||
| |
|
|
|
|
|
|
|
|
|
|
|
|
| ||||
| (0.84 | ) |
| (1.10 | ) |
| (0.89 | ) |
| (0.80 | ) |
| (0.76 | ) | ||||
| — |
|
| — |
|
| — |
|
| — |
|
| — |
| ||||
| (0.84 | ) |
| (1.10 | ) |
| (0.89 | ) |
| (0.80 | ) |
| (0.76 | ) | ||||
$ | 25.58 |
| $ | 25.71 |
| $ | 25.39 |
| $ | 25.88 |
| $ | 25.61 |
| ||||
$ | 25.57 |
| $ | 25.70 |
| $ | 25.38 |
| $ | 25.89 |
| $ | 25.62 |
| ||||
|
|
|
|
|
|
|
|
|
| |||||||||
|
|
|
|
|
|
|
|
|
| |||||||||
| 2.73 | % |
| 5.82 | % |
| 1.55 | % |
| 4.23 | % |
| 5.76 | % | ||||
| 2.75 | % |
| 5.80 | % |
| 1.47 | % |
| 4.24 | % |
| 5.84 | % | ||||
|
|
|
|
|
|
|
|
|
| |||||||||
$ | 8,312 |
| $ | 5,785 |
| $ | 18,405 |
| $ | 17,466 |
| $ | 20,488 |
| ||||
|
|
|
|
|
|
|
|
|
| |||||||||
| 0.95 | % |
| 0.95 | % |
| 0.95 | % |
| 0.95 | % |
| 0.95 | % | ||||
| 1.50 | % |
| 1.49 | % |
| 1.22 | % |
| 1.20 | % |
| 1.05 | % | ||||
| 3.14 | % |
| 4.14 | % |
| 3.47 | % |
| 3.15 | % |
| 3.01 | % | ||||
| 765 | % |
| 150 | % |
| 39 | % |
| 21 | % |
| 24 | % | ||||
See accompanying Notes to Financial Statements.
111
ADVISORSHARES TRUST |
| ||||||||||||||||||||
|
|
|
|
| ||||||||||||||||
Selected Data for a Share of Capital Stock Outstanding |
|
|
|
|
|
|
|
|
|
| ||||||||||
Net Asset Value, Beginning of Year/Period | $ | 48.44 |
| $ | 47.86 |
| $ | 48.68 |
| $ | 48.83 |
| $ | 49.08 |
| |||||
Investment Operations |
|
|
|
|
|
|
|
|
|
| ||||||||||
Net Investment Income (Loss)(1) |
| 1.21 |
|
| 1.35 |
|
| 1.05 |
|
| 0.74 |
|
| 1.25 |
| |||||
Net Realized and Unrealized Gain (Loss) |
| (0.22 | ) |
| 0.65 |
|
| (0.62 | ) |
| 0.38 |
|
| (0.13 | ) | |||||
Distributions of Net Realized Gains by other investment companies |
| — |
|
| — |
|
| — |
|
| 0.00 | (2) |
| — |
| |||||
Net Increase (Decrease) in Net Assets Resulting from Investment Operations(3) |
| 0.99 |
|
| 2.00 |
|
| 0.43 |
|
| 1.12 |
|
| 1.12 |
| |||||
Distributions from Net Investment Income |
| (1.29 | ) |
| (1.42 | ) |
| (1.25 | ) |
| (1.27 | ) |
| (1.37 | ) | |||||
Distributions from Realized Capital Gains |
| — |
|
| — |
|
| — |
|
| — |
|
| — |
| |||||
Total Distributions |
| (1.29 | ) |
| (1.42 | ) |
| (1.25 | ) |
| (1.27 | ) |
| (1.37 | ) | |||||
Net Asset Value, End of Year/Period | $ | 48.14 |
| $ | 48.44 |
| $ | 47.86 |
| $ | 48.68 |
| $ | 48.83 |
| |||||
Market Value, End of Year/Period | $ | 48.17 |
| $ | 48.38 |
| $ | 47.79 |
| $ | 48.70 |
| $ | 48.82 |
| |||||
|
|
|
|
|
|
|
|
|
| |||||||||||
Total Return |
|
|
|
|
|
|
|
|
|
| ||||||||||
Total Investment Return Based on Net Asset Value(4) |
| 2.10 | % |
| 4.27 | % |
| 0.87 | % |
| 2.30 | % |
| 2.33 | % | |||||
Total Investment Return Based on Market(4) |
| 2.28 | % |
| 4.29 | % |
| 0.70 | % |
| 2.37 | % |
| 2.39 | % | |||||
Ratios/Supplemental Data |
|
|
|
|
|
|
|
|
|
| ||||||||||
Net Assets, End of Year/Period (000’s omitted) | $ | 57,767 |
| $ | 75,080 |
| $ | 155,529 |
| $ | 258,005 |
| $ | 261,263 |
| |||||
Ratio to Average Net Assets of:(5) |
|
|
|
|
|
|
|
|
|
| ||||||||||
Expenses, net of expense waivers and reimbursements(6) |
| 0.75 | % |
| 0.75 | % |
| 0.75 | % |
| 0.75 | % |
| 0.75 | % | |||||
Expenses, prior to expense waivers and reimbursements(6) |
| 0.82 | % |
| 0.96 | % |
| 0.84 | % |
| 0.80 | % |
| 0.81 | % | |||||
Net Investment Income (Loss)(6) |
| 2.51 | % |
| 2.81 | % |
| 2.17 | % |
| 1.53 | % |
| 2.57 | % | |||||
Portfolio Turnover Rate(9) |
| 63 | % |
| 40 | % |
| 66 | % |
| 63 | % |
| 51 | % | |||||
See accompanying Notes to Financial Statements.
112
ADVISORSHARES TRUST |
AdvisorShares Pure |
| |||||||||||||||||||||||||
| For the period |
|
|
|
|
| ||||||||||||||||||||
| |
|
| |
|
| |
|
|
|
|
|
|
|
|
| ||||||||||
$ | 22.99 |
| $ | 25.00 |
| $ | 6.38 |
| $ | 7.80 |
| $ | 8.56 |
| $ | 10.60 |
| $ | 10.88 |
| ||||||
|
|
|
|
|
|
|
|
|
|
|
|
|
| |||||||||||||
| 0.70 |
|
| 0.06 |
|
| (0.06 | ) |
| 0.01 |
|
| (0.13 | ) |
| (0.20 | ) |
| (0.27 | ) | ||||||
| (12.75 | ) |
| (2.07 | ) |
| (1.46 | ) |
| (1.43 | ) |
| (0.63 | ) |
| (1.84 | ) |
| (0.01 | ) | ||||||
|
|
|
|
|
|
|
|
|
|
|
|
|
|
|
|
|
|
|
|
| ||||||
| | ) |
|
| ) |
|
| ) |
|
| ) |
|
| ) |
|
| ) |
|
| ) | ||||||
| (0.70 | ) |
| — |
|
| (0.01 | ) |
| — |
|
| — |
|
| — |
|
| — |
| ||||||
| (0.07 | ) |
| — |
|
| — |
|
| — |
|
| — |
|
| — |
|
| — |
| ||||||
| (0.77 | ) |
| — |
|
| (0.01 | ) |
| — |
|
| — |
|
| — |
|
| — |
| ||||||
$ | 10.17 |
| $ | 22.99 |
| $ | 4.85 |
| $ | 6.38 |
| $ | 7.80 |
| $ | 8.56 |
| $ | 10.60 |
| ||||||
$ | 10.18 |
| $ | 23.02 |
| $ | 4.85 |
| $ | 6.39 |
| $ | 7.78 |
| $ | 8.55 |
| $ | 10.61 |
| ||||||
|
|
|
|
|
|
|
|
|
|
|
|
|
| |||||||||||||
|
|
|
|
|
|
|
|
|
|
|
|
|
| |||||||||||||
|
| )% |
|
| )% |
|
| )% |
|
| )% |
|
| )% |
|
| )% |
|
| )% | ||||||
| (52.70 | )% |
| (7.92 | )% |
| (23.94 | )% |
| (17.87 | )% |
| (9.01 | )% |
| (19.42 | )% |
| (2.48 | )% | ||||||
|
|
|
|
|
|
|
|
|
|
|
|
|
| |||||||||||||
$ | 45,503 |
| $ | 59,762 |
| $ | 162,019 |
| $ | 135,814 |
| $ | 133,587 |
| $ | 174,504 |
| $ | 213,948 |
| ||||||
|
|
|
|
|
|
|
|
|
|
|
|
|
| |||||||||||||
| | % |
|
| % |
|
| %(8) |
|
| %(8) |
|
| %(8) |
|
| %(8) |
|
| %(8) | ||||||
|
| % |
|
| % |
|
| %(8) |
|
| %(8) |
|
| %(8) |
|
| %(8) |
|
| %(8) | ||||||
| 5.67 | % |
| 1.35 | % |
| (1.07 | )% |
| 0.18 | % |
| (1.63 | )% |
| (2.15 | )% |
| (2.49 | )% | ||||||
| 59 | % |
| 26 | % |
| 593 | % |
| 338 | % |
| 301 | % |
| 245 | % |
| 402 | % | ||||||
See accompanying Notes to Financial Statements.
113
ADVISORSHARES TRUST |
| ||||||||||||||||||||
|
|
|
|
| ||||||||||||||||
Selected Data for a Share of Capital Stock Outstanding |
|
|
|
|
|
|
|
|
|
| ||||||||||
Net Asset Value, Beginning of Year/Period | $ | 99.64 |
| $ | 99.21 |
| $ | 99.43 |
| $ | 99.43 |
| $ | 99.38 |
| |||||
Investment Operations |
|
|
|
|
|
|
|
|
|
| ||||||||||
Net Investment Income (Loss)(1) |
| 2.03 |
|
| 2.37 |
|
| 1.53 |
|
| 0.97 |
|
| 0.69 |
| |||||
Net Realized and Unrealized Gain (Loss) |
| (1.19 | ) |
| 0.33 |
|
| (0.16 | ) |
| 0.11 |
|
| 0.12 |
| |||||
Distributions of Net Realized Gains by other investment companies |
| — |
|
| — |
|
| — |
|
| — |
|
| — |
| |||||
Net Increase (Decrease) in Net Assets Resulting from Investment Operations(3) |
| 0.84 |
|
| 2.70 |
|
| 1.37 |
|
| 1.08 |
|
| 0.81 |
| |||||
Distributions from Net Investment Income |
| (2.02 | ) |
| (2.27 | ) |
| (1.59 | ) |
| (1.08 | ) |
| (0.76 | ) | |||||
Total Distributions |
| (2.02 | ) |
| (2.27 | ) |
| (1.59 | ) |
| (1.08 | ) |
| (0.76 | ) | |||||
Net Asset Value, End of Year/Period | $ | 98.46 |
| $ | 99.64 |
| $ | 99.21 |
| $ | 99.43 |
| $ | 99.43 |
| |||||
Market Value, End of Year/Period | $ | 98.35 |
| $ | 99.61 |
| $ | 99.19 |
| $ | 99.44 |
| $ | 99.63 |
| |||||
|
|
|
|
|
|
|
|
|
| |||||||||||
Total Return |
|
|
|
|
|
|
|
|
|
| ||||||||||
Total Investment Return Based on Net Asset Value(4) |
| 0.83 | % |
| 2.74 | % |
| 1.38 | % |
| 1.08 | % |
| 0.83 | % | |||||
Total Investment Return Based on Market(4) |
| 0.75 | % |
| 2.74 | % |
| 1.34 | % |
| 0.88 | % |
| 1.00 | % | |||||
Ratios/Supplemental Data |
|
|
|
|
|
|
|
|
|
| ||||||||||
Net Assets, End of Year/Period (000’s omitted) | $ | 100,921 |
| $ | 72,240 |
| $ | 52,087 |
| $ | 84,519 |
| $ | 111,862 |
| |||||
Ratio to Average Net Assets of:(5) |
|
|
|
|
|
|
|
|
|
| ||||||||||
Expenses, net of expense waivers and reimbursements(6) |
| 0.35 | % |
| 0.35 | % |
| 0.35 | % |
| 0.35 | % |
| 0.35 | % | |||||
Expenses, prior to expense waivers and reimbursements(6) |
| 0.53 | % |
| 0.65 | % |
| 0.65 | % |
| 0.50 | % |
| 0.55 | % | |||||
Net Investment Income (Loss)(6) |
| 2.05 | % |
| 2.39 | % |
| 1.53 | % |
| 0.97 | % |
| 0.70 | % | |||||
Portfolio Turnover Rate(9) |
| 101 | % |
| 91 | % |
| 74 | % |
| 81 | % |
| 72 | % | |||||
See accompanying Notes to Financial Statements.
114
ADVISORSHARES TRUST |
| ||||||||||||||||||
|
|
|
|
| ||||||||||||||
| |
|
|
|
| |
|
| |
|
|
| ||||||
$ | 32.28 |
| $ | 30.99 |
| $ | 29.13 |
| $ | 26.77 |
| $ | 26.60 |
| ||||
|
|
|
|
|
|
|
|
|
| |||||||||
| 0.09 |
|
| 0.13 |
|
| 0.11 |
|
| 0.09 |
|
| 0.10 |
| ||||
| (0.02 | ) |
| 1.29 |
|
| 1.75 |
|
| 2.48 |
|
| 0.07 |
| ||||
| |
|
|
|
|
|
| (2) |
|
|
|
|
| (2) | ||||
| |
|
|
|
|
|
|
|
|
|
|
|
|
| ||||
| (0.15 | ) |
| (0.13 | ) |
| — |
|
| (0.22 | ) |
| — |
| ||||
| (0.15 | ) |
| (0.13 | ) |
| — |
|
| (0.22 | ) |
| — |
| ||||
$ | 32.20 |
| $ | 32.28 |
| $ | 30.99 |
| $ | 29.13 |
| $ | 26.77 |
| ||||
$ | 32.25 |
| $ | 32.19 |
| $ | 31.01 |
| $ | 29.13 |
| $ | 26.76 |
| ||||
|
|
|
|
|
|
|
|
|
| |||||||||
|
|
|
|
|
|
|
|
|
| |||||||||
| | % |
| 4.62 | % |
| 6.41 | % |
| 9.70 | % |
| 0.64 | % | ||||
| 0.63 | % |
| 4.27 | % |
| 6.45 | % |
| 9.74 | % |
| 0.56 | % | ||||
|
|
|
|
|
|
|
|
|
| |||||||||
$ | 12,882 |
| $ | 14,527 |
| $ | 17,047 |
| $ | 17,477 |
| $ | 17,400 |
| ||||
|
|
|
|
|
|
|
|
|
| |||||||||
| | % |
|
| % |
|
| % |
|
| % |
|
| % | ||||
| | % |
|
| % |
|
| % |
|
| % |
|
| % | ||||
| 0.26 | % |
| 0.43 | % |
| 0.38 | % |
| 0.32 | % |
| 0.38 | % | ||||
| 47 | % |
| 49 | % |
| 12 | % |
| 26 | % |
| 58 | % | ||||
See accompanying Notes to Financial Statements.
115
ADVISORSHARES TRUST |
| ||||||||||||
|
| For the period | ||||||||||
Selected Data for a Share of Capital Stock Outstanding |
|
|
|
|
|
| ||||||
Net Asset Value, Beginning of Year/Period | $ | 25.11 |
| $ | 25.60 |
| $ | 25.00 |
| |||
Investment Operations |
|
|
|
|
|
| ||||||
Net Investment Income (Loss)(1) |
| 0.42 |
|
| 0.45 |
|
| 0.23 |
| |||
Net Realized and Unrealized Gain (Loss) |
| (2.10 | ) |
| (0.57 | ) |
| 0.41 |
| |||
Net Increase (Decrease) in Net Assets Resulting from Investment Operations(3) |
| (1.68 | ) |
| (0.12 | ) |
| 0.64 |
| |||
Distributions from Net Investment Income |
| (0.62 | ) |
| (0.37 | ) |
| (0.04 | ) | |||
Total Distributions |
| (0.62 | ) |
| (0.37 | ) |
| (0.04 | ) | |||
Net Asset Value, End of Year/Period | $ | 22.81 |
| $ | 25.11 |
| $ | 25.60 |
| |||
Market Value, End of Year/Period | $ | 22.80 |
| $ | 25.12 |
| $ | 25.68 |
| |||
|
|
|
|
|
| |||||||
Total Return |
|
|
|
|
|
| ||||||
Total Investment Return Based on Net Asset Value(4) |
| (6.91 | )% |
| (0.22 | )% |
| 2.58 | % | |||
Total Investment Return Based on Market(4) |
| (6.99 | )% |
| (0.50 | )% |
| 2.89 | % | |||
Ratios/Supplemental Data |
|
|
|
|
|
| ||||||
Net Assets, End of Year/Period (000’s omitted) | $ | 9,126 |
| $ | 13,183 |
| $ | 12,800 |
| |||
Ratio to Average Net Assets of:(5) |
|
|
|
|
|
| ||||||
Expenses, net of expense waivers and reimbursements(6) |
| 0.90 | % |
| 0.75 | % |
| 0.75 | % | |||
Expenses, prior to expense waivers and reimbursements(6) |
| 1.59 | % |
| 1.43 | % |
| 2.18 | % | |||
Net Investment Income (Loss)(6) |
| 1.77 | % |
| 1.79 | % |
| 1.64 | % | |||
Portfolio Turnover Rate(9) |
| 41 | % |
| 76 | % |
| 25 | % | |||
____________
* Commencement of operations.
(1) Based on average shares outstanding.
(2) Amount represents less than $0.005 or 0.005%.
(3) The amount shown for a share distribution throughout the period may not correlate with the Statement of Operations for the period due to the timing of sales and repurchases of Fund Shares in relation to income earned and/or fluctuating fair value of the investments of the Fund.
(4) Net asset value total investment return is calculated assuming an initial investment made at the net asset value at the beginning of the period, reinvestment of all dividends and distributions on ex-date, if any, at net asset value during the period, and redemption on the last day of the period. Periods less than one year are not annualized. Market value total return is calculated assuming an initial investment made at the market value at the beginning of the period, reinvestment of all dividends and distributions at market value during the period on pay date, and sale at the market value on the last day of the period.
(5) The AdvisorShares Dorsey Wright FSM All Cap World ETF, the AdvisorShares Dorsey Wright FSM US Core ETF, the AdvisorShares FolioBeyond Smart Core Bond ETF Fund and the AdvisorShares STAR Global Buy-Write ETF Fund invest in other funds and indirectly bear their proportionate shares of fees and expenses incurred by the funds in which the Funds are invested. These ratios do not include these indirect fees and expenses.
(6) Ratios of periods of less than one year have been annualized. Excludes expenses incurred by the underlying investments in other funds.
(7) The expense ratio includes dividend expense on short sales of 2.47% and 1.71% for the period ended and June 30, 2019.
(8) The expense ratio includes interest and dividend expenses on short sales of 1.42%, 1.22%, 0.84%, 1.03% and 1.05% for the periods ended June 30, 2020, June 30, 2019, June 30, 2018, June 30, 2017 and June 30, 2016, respectively.
(9) Portfolio turnover rate is not annualized and excludes the value of portfolio securities received or delivered as in-kind creations or redemptions of the Fund’s capital shares.
(10) During the year, the Fund underwent a sub-advisor change. As a result, investment transactions were increased during the period, which caused a higher than normal portfolio rate.
See accompanying Notes to Financial Statements.
116
AdvisorShares Trust (the “Trust”) was organized as a Delaware statutory trust on July 30, 2007 and has authorized capital of unlimited shares. The Funds are investment companies and accordingly follow the investment company accounting and reporting guidance of the Financial Accounting Standards Board (“FASB”) Accounting Standard Codification Topic 946 “Financial Services — Investment Companies”.
The Trust is an open-end management investment company, registered under the Investment Company Act of 1940, as amended (the “Act”). The Trust is comprised of 15 active funds (the “Funds” or “ETFs” and individually, the “Fund” or “ETF”):
Fund | Ticker | Commencement | ||
AdvisorShares Dorsey Wright ADR ETF | AADR | July 21, 2010 | ||
AdvisorShares Dorsey Wright Alpha Equal Weight ETF | DWEQ | December 26, 2019 | ||
AdvisorShares Dorsey Wright FSM All Cap World ETF | DWAW | December 26, 2019 | ||
AdvisorShares Dorsey Wright FSM US Core ETF | DWUS | December 26, 2019 | ||
AdvisorShares Dorsey Wright Micro-Cap ETF | DWMC | July 10, 2018 | ||
AdvisorShares Dorsey Wright Short ETF | DWSH | July 10, 2018 | ||
AdvisorShares DoubleLine Value Equity ETF | DBLV | October 4, 2011 | ||
AdvisorShares Focused Equity ETF | CWS | September 20, 2016 | ||
AdvisorShares FolioBeyond Smart Core Bond ETF | FWDB | June 21, 2011 | ||
AdvisorShares Newfleet Multi-Sector Income ETF | MINC | March 19, 2013 | ||
AdvisorShares Pure Cannabis ETF | YOLO | April 17, 2019 | ||
AdvisorShares Ranger Equity Bear ETF | HDGE | January 27, 2011 | ||
AdvisorShares Sage Core Reserves ETF | HOLD | January 14, 2014 | ||
AdvisorShares STAR Global Buy-Write ETF | VEGA | September 17, 2012 | ||
AdvisorShares Vice ETF | ACT | December 12, 2017 |
AdvisorShares Dorsey Wright ADR ETF (“Dorsey Wright ADR ETF”) seeks to achieve the Fund’s investment objective by selecting primarily a portfolio of U.S. traded securities of non-U.S. organizations, most often ADRs. The Fund invests in developed and emerging markets and may invest in securities of any market capitalization.
AdvisorShares Dorsey Wright Alpha Equal Weight ETF (“Dorsey Wright Alpha Equal Weight ETF”) seeks to achieve its investment objective by investing in a concentrated portfolio of 50 US equity securities selected from a universe of the largest 1,000 US equity securities based on market capitalization.
AdvisorShares Dorsey Wright FSM All Cap World ETF (“Dorsey Wright FSM All Cap World ETF”) seeks to provide long-term capital appreciation with capital preservation as a secondary objective.
AdvisorShares Dorsey Wright FSM US Core ETF (“Dorsey Wright FSM US Core ETF”) seeks to provide long-term capital appreciation with capital preservation as a secondary objective.
AdvisorShares Dorsey Wright Micro-Cap ETF (“Dorsey Wright Micro-Cap ETF”) seeks to achieve its investment objective by investing primarily in U.S. traded equity securities consisting of common and preferred stock and ADRs. The Fund invests in micro-cap securities.
AdvisorShares Dorsey Wright Short ETF (“Dorsey Wright Short ETF”) seeks to achieve the Fund’s investment objective by obtaining short exposure to investment returns of the broad U.S. large-capitalization equity market by engaging in short sales of U.S. traded equity securities and ETFs. The Fund invests primarily in investments that create or result in short exposure to U.S. equity securities.
117
ADVISORSHARES TRUST June 30, 2020 |
1. Organization – (continued) |
AdvisorShares DoubleLine Value Equity ETF (‘‘DoubleLine Value Equity ETF”) seeks to achieve its investment objective by primarily investing in the broad U.S. equity market, including through ADRs. The Fund invests in stocks with fundamental characteristics that are historically associated with superior long-term performance.
AdvisorShares Focused Equity ETF (“Focused Equity ETF”) seeks long-term capital appreciation. CWS invests primarily in a focused group of U.S. exchange-listed equity securities that the portfolio manager believes have favorable fundamental attributes.
AdvisorShares FolioBeyond Smart Core Bond ETF (‘‘FolioBeyond Smart Core Bond ETF’’) seeks investment results that exceed the price and yield performance of its benchmark, the Bloomberg Barclays U.S. Aggregate Bond Index. The Portfolio Manager seeks to achieve this objective by selecting a diversified portfolio of fixed income exchange-traded products (ETPs), including but not limited to, exchange-traded notes (ETNs), exchange-traded currency trusts and exchange-traded commodity pools. FWDB invests in at least 20 distinct global bond classes that cover the entire global investable bond universe. The Portfolio Manager constructs FWDB’s portfolio using a weighted allocation system based on historic yield curve analysis and a mean reversion strategy.
AdvisorShares Newfleet Multi-Sector Income ETF (‘‘Newfleet Multi-Sector Income ETF’’) seeks to provide current income consistent with preservation of capital, while limiting fluctuations in net asset value (‘‘NAV’’) due to changes in interest rates. In seeking to achieve the Fund’s investment objective, the Sub-Advisor applies a time-tested approach and extensive credit research to capitalize on opportunities across undervalued areas of the bond markets. The Fund principally invests in investment-grade securities, which are securities with credit ratings within the four highest rating categories of a nationally recognized statistical rating organization or, if unrated, those securities that the Sub-Advisor determines to be of comparable quality.
AdvisorShares Pure Cannabis ETF (“Pure Cannabis ETF”) seeks long-term capital appreciation. The Fund primarily will invest in exchange-listed equity securities, including common and preferred stock, of mid- and small-capitalization companies. The Fund also may use derivatives, including total return swaps, index swaps, equity basket swaps, or futures, to seek exposure to such U.S. and foreign securities. The Advisor may use a variety of methods for security selection. As the Fund primarily focuses on certain industries, the Advisor intends to select companies with dominant positions in their respective markets, or those in unique positions for growth and expansion.
AdvisorShares Ranger Equity Bear ETF (‘‘Ranger Equity Bear ETF’’) seeks capital appreciation through short sales of domestically traded equity securities. The portfolio management team implements a bottom-up, fundamental, research driven security selection process. In selecting short positions, the Fund seeks to identify securities with low earnings quality or aggressive accounting which may be intended on the part of company management to mask operational deterioration and bolster the reported earnings per share over a short time period. In addition, the portfolio management team seeks to identify earnings driven events that may act as a catalyst to the price decline of a security, such as downwards earnings revisions or reduced forward guidance.
AdvisorShares Sage Core Reserves ETF (‘‘Sage Core Reserves ETF’’) seeks to preserve capital while maximizing income. The Sub-Advisor seeks to achieve the fund’s investment objective by investing in a variety of fixed income securities, including bonds, forwards and instruments issued by U.S. and foreign issuers. It will invest in U.S. dollar-denominated investment grade debt securities, including mortgage- or asset-backed securities, rated Baa- or higher by Moody’s Investors Service, Inc. (‘‘Moody’s’’), or equivalently rated by Standard & Poor’s Ratings Services (‘‘S&P’’) or Fitch, Inc. (‘‘Fitch’’), or, if unrated, determined by the Sub-Advisor to be of comparable quality.
118
ADVISORSHARES TRUST June 30, 2020 |
1. Organization – (continued) |
AdvisorShares STAR Global Buy-Write ETF (‘‘STAR Global Buy-Write ETF’’) seeks consistent repeatable returns across all market cycles. The Portfolio Manager seeks to achieve this investment objective by using a proprietary strategy known as Volatility Enhanced Global Appreciation (VEGA). VEGA employs a ‘‘Buy-Write’’ or ‘‘Covered Call’’ overlay for their global allocation strategy using ETPs. The strategy simultaneously writes (sells) a call option against each position in order to seek cumulative price appreciation from the portfolio’s global exposure, while generating a consistent income stream from the sale of covered call and/or cash-secured put options. When volatility is low the portfolio manager buys protective put options to manage downside risk.
AdvisorShares Vice ETF (“Vice ETF”) seeks to achieve its investment objective by investing in securities of companies that derive at least 50% of their net revenue from tobacco and alcoholic beverages and companies that derive at least 50% of their net revenue from the marijuana and hemp industry or have at least 50% of their company assets dedicated to lawful research and development of cannabis or cannabinoid-related products. The Fund will invest primarily in U.S. exchange listed equity securities, including common and preferred stock and ADRs.
Some of the Funds are considered “fund of funds” and seek to achieve their investment objectives by investing primarily in other affiliated and unaffiliated exchange-traded funds (“ETFs”), as well as other exchange-traded products (“ETPs”), including, but not limited to, exchange-traded notes (“ETNs”) and closed-end funds (collectively with ETFs, ETNs, and ETPs), that offer diversified exposure to various global regions, credit qualities, durations and maturity dates.
For the year ended June 30, 2020, the Funds held significant positions (greater than 25% of net assets), except those invested in short term money market instruments, in other funds as follows:
Funds | Security Name | Market Value | % of Fund | Reference location | ||||||
Dorsey Wright FSM All Cap World ETF | Invesco QQQ Trust Series 1 | $ | 37,536,160 | 50.9 | % | https://www.invesco.com | ||||
iShares Morningstar Large-Cap Growth ETF |
| 36,048,955 | 48.9 |
| https://www.ishares.com | |||||
Dorsey Wright FSM US Core ETF | Invesco QQQ Trust Series 1 |
| 23,648,276 | 50.6 |
| https://www.invesco.com | ||||
iShares Edge MSCI USA Momentum Factor |
| 22,904,695 | 49.0 |
| https://www.ishares.com | |||||
FolioBeyond Smart Core Bond ETF | iShares Agency Bond ETF |
| 2,574,344 | 31.0 |
| https://www.ishares.com | ||||
iShares Short Treasury Bond ETF |
| 2,516,898 | 30.3 |
| https://www.ishares.com | |||||
Ranger Equity Bear ETF | AdvisorShares Sage Core Reserves ETF |
| 63,930,750 | 39.5 |
| Contained within this report. | ||||
STAR Global Buy-Write ETF | SPDR S&P 500 ETF Trust |
| 6,553,884 | 50.9 |
| https://us.spdrs.com | ||||
119
ADVISORSHARES TRUST June 30, 2020 |
2. Summary of Significant Accounting Policies
These financial statements are prepared in accordance with U.S. generally accepted accounting principles (‘‘GAAP’’) which require management to make estimates and assumptions that affect the reported amounts of assets and liabilities and disclosures of contingent assets and liabilities at the date of the financial statements and the reported amounts of increases and decreases in net assets from operations during the reporting period. Actual results could differ from those estimates.
Investment Valuation
In computing each Fund’s NAV, the Fund’s securities holdings are valued based on their last readily available market price. Price information on listed securities, including Underlying ETFs, is taken from the exchange where the security is primarily traded. Securities regularly traded in an Over-the-Counter (“OTC”) market are valued at the latest quoted sales price on the primary exchange or national securities market on which such securities are traded. Securities not listed on an exchange or national securities market, or securities in which there was no last reported sales price, are valued at the most recent bid price. Other portfolio securities and assets for which market quotations are not readily available are valued based on fair value as determined in good faith by the Board of Trustees of the Trust.
Investment Transactions
Investment transactions are accounted for on the trade date. Realized gains and losses on sales of investment securities are calculated using the identified cost method. Dividend income and distributions to shareholders are recognized on the ex-dividend date and interest income and expenses are recognized on the accrual basis. Premiums and discounts are amortized over the life of the bond using the effective interest method.
Distributions received from investments in Real Estate Investment Trusts (“REITs”) are recorded as dividend income on ex-dividend date, subject to reclassification upon notice of the character of such distributions by the issuer. The portion of dividend attributable to the return of capital is recorded against the cost basis of the security.
Foreign Taxes
The Funds may be subject to foreign taxes (a portion of which may be reclaimable) on income, capital gains on investments, certain foreign currency transactions or other corporate events. All foreign taxes are recorded in accordance with the applicable foreign tax regulations and rates that exist in the foreign jurisdictions in which the Funds invest. These foreign taxes, if any, are paid by the Funds and are reflected in their Statements of Operations.
Expenses
Expenses of the Trust, which are directly identifiable to a specific Fund, are applied to that Fund. Expenses which are not readily identifiable to a specific Fund are allocated in such a manner as deemed equitable, taking into consideration the nature and type of expense and the relative net assets of each Fund.
Futures Contracts
Certain Funds may invest in futures contracts (‘‘futures’’), in order to hedge its investments against fluctuations in value caused by changes in prevailing interest rates or market conditions. Such Funds may invest in futures as a primary investment strategy. Investments in futures may increase or leverage exposure to a particular market risk, thereby increasing price volatility of derivative
120
ADVISORSHARES TRUST June 30, 2020 |
2. Summary of Significant Accounting Policies – (continued) |
instruments a Fund holds. No monies are paid or received by a Fund upon the purchase or sale of a futures contract. Initially, a Fund will be required to deposit with the broker an amount of cash or cash equivalents, known as initial margin, based on the value of the contract. Subsequent payments, called variation margin, to and from the broker, will be made on a daily basis as the price of the underlying instruments fluctuates, making the long and short positions in the futures contract more or less valuable, a process known as ‘marking-to-the-market’. Once a final determination of variation margin is made, additional cash is required to be paid by or released to a Fund, and a Fund will realize a loss or gain. The Funds may be subject to the risk that the change in the value of the futures contract may not correlate perfectly with the underlying index. Use of long futures contracts subjects the Funds to risk of loss in excess of the amounts shown on the Statements of Assets and Liabilities, up to the notional value of the futures contracts. Use of short futures contracts subjects the Funds to unlimited risk of loss. The Funds may enter into futures contracts only on exchanges or boards of trade. The exchange or board of trade acts as the counterparty to each futures contract; therefore, the Funds’ credit risk is limited to failure of the exchange or board of trade. Under some circumstances, futures exchanges may establish daily limits on the amount that the price of a futures contract can vary from the previous day’s settlement price, which could effectively prevent liquidation of unfavorable positions.
Swap Agreements
Certain funds may invest in equity swaps to obtain exposure to the underlying referenced security, obtain leverage or enjoy the returns from ownership without actually owning equity. Equity swaps are two-party contracts that generally obligate one party to pay the positive return and the other party to pay the negative return on a specified reference security, basket of securities, security index or index component during the period of the swap. Equity swap contracts are marked to market daily based on the value of the underlying security and the change, if any, is recorded as an unrealized gain or loss.
Equity swaps normally do not involve the delivery of securities or other underlying assets. Accordingly, the risk of loss with respect to equity swaps is normally limited to the net amount of payments that a Fund is contractually obligated to make. If the other party to an equity swap defaults a Fund’s risk of loss consists of the net amount of payments that the Fund is contractually entitled to receive, if any.
Equity swaps are derivatives and their value can be very volatile. To the extent that the Advisor or Sub-Advisor, as applicable, do not accurately analyze and predict future market trends, the values of assets or economic factors, the Funds may suffer a loss, which may be substantial. The swap markets in which many types of swap transactions are traded have grown substantially in recent years, with a large number of banks and investment banking firms acting both as principals and as agents. As a result, the markets for certain types of swaps have become relatively liquid. Periodic payments received or paid by the Funds are recorded as realized gains or losses.
Repurchase Agreements
The Funds may enter into repurchase agreements provided that the value of the underlying collateral, including accrued interest, will equal or exceed the value of the repurchase agreement during the term of the agreement. The underlying collateral for all repurchase agreements is held in safekeeping by the Fund’s custodian or at the Federal Reserve Bank. If the seller defaults and the value of the collateral declines, or if bankruptcy proceedings commence with respect to the seller of the security, realization of the collateral by the Fund may be delayed or limited.
At June 30, 2020, the market values of repurchase agreements outstanding are included as cash collateral for securities on loan on the Statements of Assets and Liabilities.
121
ADVISORSHARES TRUST June 30, 2020 |
2. Summary of Significant Accounting Policies – (continued) |
Short Sales
Certain Funds may sell securities it does not own as a hedge against some of its long positions and/or in anticipation of a decline in the market value of that security (short sale). When the Funds make a short sale, it must borrow the security sold short and deliver it to the broker-dealer through which it made the short sale. The Funds may have to pay a fee to borrow the particular security and may be obligated to remit any interest or dividends received on such borrowed securities. Dividends declared on short positions open are recorded on the ex-date as an expense. A gain, limited to the price at which the Funds sold the security short, or a loss, unlimited in magnitude, will be recognized upon the termination of a short sale if the market price at termination is less than or greater than, respectively, the proceeds originally received. The Funds are also subject to the risk that it may be unable to reacquire a security to terminate a short position except at a price substantially in excess of the last quoted price.
The Funds are required to pledge cash or securities to the broker as collateral for the securities sold short. Collateral requirements are calculated daily based on the current market value of the short positions. Cash deposited with broker for collateral for securities sold short is recorded as an asset on the Statements of Assets and Liabilities and securities segregated as collateral are denoted in the Schedule of Investments. The Funds may receive or pay the net of the following amounts: (i) a portion of the income from the investment of cash collateral; (ii) the broker’s fee on the borrowed securities; and (iii) a financing charge for the difference in the market value of the short position and cash collateral deposited with the broker. This income or fee is calculated daily based upon the market value of each borrowed security and a variable rate that is dependent on the availability of the security. The net amount of income or fees paid to Ranger Equity Bear ETF for the year ended June 30, 2020 was $374,828, which is included as Interest Income in the Statements of Operations.
Deposits with brokers and segregated cash for securities sold short represent cash balances on deposit with the Funds’ prime brokers and custodian. The Funds are subject to credit risk should the prime brokers be unable to meet its obligations to the Funds.
Term Loans
Certain Funds invests in senior secured corporate loans or bank loans, some of which may be partially or entirely unfunded and purchased on a when-issued or delayed delivery basis, that pay interest at rates which are periodically reset by reference to a base lending rate plus a spread. Bank loans generally pay interest at rates which are periodically determined by reference to a base lending rate plus a premium. All loans carry a variable rate of interest. These base lending rates are generally (i) the Prime Rate offered by one or more major United States banks, (ii) the lending rate offered by one or more European banks such as the London Interbank Offered Rate (“LIBOR”) or (iii) the Certificate of Deposit rate. Bank Loans, while exempt from registration, under the Securities Act of 1933, contain certain restrictions on resale and cannot be sold publicly. Floating rate bank loans often require prepayments from excess cash flow or permit the borrower to repay at its election. The degree to which borrowers repay, whether as a contractual requirement or at their election, cannot be predicted with accuracy. As a result, actual maturity may be substantially less than the stated maturity. Bank loans in which the Fund invests are generally readily marketable, but may be subject to certain restrictions on resale.
122
ADVISORSHARES TRUST June 30, 2020 |
2. Summary of Significant Accounting Policies – (continued) |
Options
Certain Funds are authorized to write and purchase put and call options. When a Fund writes an option, an amount equal to the premium received by the Fund is reflected as an asset and an equivalent liability. The amount of the liability is subsequently marked to market to reflect the current market value of the option written. When a security is purchased or sold through an exercise of an option, the related premium paid (or received) is added to (or deducted from) the basis of the security acquired or deducted from (or added to) the proceeds of the security sold. When an option expires (or the Fund enters into a closing transaction), the Fund realizes a gain or loss on the option to the extent of the premiums received or paid (or gain or loss to the extent the cost of the closing transaction exceeds the premium paid or received). The Fund, as writer of an option, bears the market risk of an unfavorable change in the price of the security underlying the written option. Written and purchased options are non-income producing investments.
Short-Term Investments
Each Fund may invest in high-quality short-term debt securities and money market instruments on an ongoing basis to maintain liquidity or pending selection of investments in accordance with its policies. These short-term debt securities and money market instruments include shares of other mutual funds, commercial paper, certificates of deposit, bankers’ acceptances, U.S. Government securities and repurchase agreements.
Securities Lending
The Funds participate in a securities lending program offered by The Bank of New York Mellon (‘‘BNYM’’) (the ‘‘Program’’), providing for the lending of securities to qualified brokers. Securities lending income includes earnings of such temporary cash investments, plus or minus any rebate to a borrower. These earnings (after any rebate) are then divided between BNYM, as a fee for its services under the Program, and the Funds, according to agreed-upon rates. Collateral on all securities loaned is accepted as cash and non-cash and is maintained at a minimum level of 102% (105% in the case of certain foreign securities) of the market value, plus interest, if applicable, of investments on loan. It is the Fund’s policy to obtain additional collateral from or return excess collateral to the borrower by the end of the next business day, following the valuation date of the securities loaned. Therefore, the value of the collateral held may be temporarily less than the value of the securities on loan. Lending securities entails a risk of loss to the Funds if and to the extent that the market value of the securities loaned were to increase and the borrower did not increase the collateral accordingly, and the borrower fails to return the securities. Under the terms of the Program, the Funds are indemnified for such losses by BNYM. Cash collateral is held in a separate account managed by BNYM, who is authorized to exclusively enter into money market instruments and overnight repurchase agreements, which are collateralized at 102% with securities issued or fully guaranteed by the U.S. Treasury; U.S. Government or any agency, instrumentality or authority of the U.S. government. The securities purchased with cash collateral received are reflected in the Schedule of Investments. BNYM bears the risk of any deficiency in the amount of the cash collateral available for return to the borrower due to any loss on the collateral invested.
The money market instruments and repurchase agreements income related to the Program earned by the Funds is disclosed on the Statements of Operations.
123
ADVISORSHARES TRUST June 30, 2020 |
2. Summary of Significant Accounting Policies – (continued) |
The value of loaned securities and related collateral outstanding at June 30, 2020 are shown in the Schedules of Investments and Statements of Assets and Liabilities. Non-cash collateral received by the Funds may not be sold or re-pledged except to satisfy a borrower default. Therefore, non-cash collateral is not included on the Fund’s Schedules of Investments or Statements of Asset and Liabilities.
Fund and Description | Gross | Gross | Net Amounts | Gross Amounts not offset | Net | ||||||||||||||||
Financial | Collateral | ||||||||||||||||||||
Dorsey Wright ADR ETF |
|
|
|
|
|
|
|
|
| ||||||||||||
Securities Lending | $ | (8,735,618 | ) | $ | — | $ | (8,735,618 | ) | $ | 8,735,618 | (1) | $ | — | $ | — | ||||||
Repurchase Agreements |
| 8,735,618 |
|
| — |
| 8,735,618 |
|
| 8,735,618 | (2) |
| — |
| — | ||||||
Dorsey Wright Alpha Equal Weight ETF |
|
|
|
|
|
|
|
|
| ||||||||||||
Securities Lending |
| (218,120 | ) |
| — |
| (218,120 | ) |
| 218,120 | (1) |
| — |
| — | ||||||
Repurchase Agreements |
| 218,120 |
|
| — |
| 218,120 |
|
| 218,120 | (2) |
| — |
| — | ||||||
Dorsey Wright FSM All Cap World ETF |
|
|
|
|
|
|
|
|
| ||||||||||||
Securities Lending |
| (22,322,213 | ) |
| — |
| (22,322,213 | ) |
| 22,322,213 | (1) |
| — |
| — | ||||||
Repurchase Agreements |
| 22,322,213 |
|
| — |
| 22,322,213 |
|
| 22,322,213 | (2) |
| — |
| — | ||||||
Dorsey Wright FSM US Core ETF |
|
|
|
|
|
|
|
|
| ||||||||||||
Securities Lending |
| (22,860,641 | ) |
| — |
| (22,860,641 | ) |
| 22,860,641 | (1) |
| — |
| — | ||||||
Repurchase Agreements |
| 22,860,641 |
|
| — |
| 22,860,641 |
|
| 22,860,641 | (2) |
| — |
| — | ||||||
Dorsey Wright Micro-Cap ETF |
|
|
|
|
|
|
|
|
| ||||||||||||
Securities Lending |
| (275,942 | ) |
| — |
| (275,942 | ) |
| 275,942 | (1) |
| — |
| — | ||||||
Repurchase Agreements |
| 275,942 |
|
| — |
| 275,942 |
|
| 275,942 | (2) |
| — |
| — | ||||||
FolioBeyond Smart Core Bond ETF |
|
|
|
|
|
|
|
|
| ||||||||||||
Securities Lending |
| (1,361,786 | ) |
| — |
| (1,361,786 | ) |
| 1,361,786 | (1) |
| — |
| — | ||||||
Repurchase Agreements |
| 1,361,786 |
|
| — |
| 1,361,786 |
|
| 1,361,786 | (2) |
| — |
| — | ||||||
Newfleet Multi-Sector Income ETF |
|
|
|
|
|
|
|
|
| ||||||||||||
Securities Lending |
| (49,826 | ) |
| — |
| (49,826 | ) |
| 49,826 | (1) |
| — |
| — | ||||||
Repurchase Agreements |
| 49,826 |
|
| — |
| 49,826 |
|
| 49,826 | (2) |
| — |
| — | ||||||
Pure Cannabis ETF |
|
|
|
|
|
|
|
|
| ||||||||||||
Securities Lending |
| (12,803,811 | ) |
| — |
| (12,803,811 | ) |
| 12,803,811 | (1) |
| — |
| — | ||||||
Repurchase Agreements |
| 12,803,811 |
|
| — |
| 12,803,811 |
|
| 12,803,811 | (2) |
| — |
| — | ||||||
Swaps |
| 260,822 |
|
| — |
| 260,822 |
|
| — |
|
|
| 260,822 | |||||||
Sage Core Reserves ETF |
|
|
|
|
|
|
|
| — |
| — | ||||||||||
Securities Lending |
| (2,320,705 | ) |
| — |
| (2,320,705 | ) |
| 2,320,705 | (1) |
| — |
| — | ||||||
Repurchase Agreements |
| 2,320,705 |
|
| — |
| 2,320,705 |
|
| 2,320,705 | (2) |
| — |
| — | ||||||
Vice ETF |
|
|
|
|
|
|
|
|
| ||||||||||||
Securities Lending |
| (289,877 | ) |
| — |
| (289,877 | ) |
| 289,877 | (1) |
| — |
| — | ||||||
Repurchase Agreements |
| 289,877 |
|
| — |
| 289,877 |
|
| 289,877 | (2) |
| — |
| — | ||||||
____________
(1) Collateral for securities on loan is included in the Schedules of Investments and consists of Repurchase Agreements and shares of Money Market instruments.
(2) Repurchase agreements are collateralized by U.S. Government Agency Obligations in the event the other party to the repurchase agreement defaults on its obligation.
124
ADVISORSHARES TRUST June 30, 2020 |
2. Summary of Significant Accounting Policies – (continued) |
Dividends and Distributions
Each Fund will generally pay out dividends to shareholders at least annually. Each Fund will distribute its net capital gains, if any, to shareholders annually. Income and capital gain distributions are determined in accordance with income tax regulations which may differ from U.S. generally accepted accounting principles. Distributions are recorded on ex-dividend date.
Indemnifications
In the normal course of business, each Fund enters into contracts that contain a variety of representations which provide general indemnifications. The Trust’s maximum exposure under these arrangements cannot be known; however, the Trust expects any risk of loss to be remote.
Recent Accounting Pronouncement
Accounting Standards Update 2017-08 Premium Amortization on Purchased Callable Debt Securities
In March 2017, the Financial Accounting Standards Board issued Accounting Standards Update (ASU) No. 2017-08 Premium Amortization on Purchased Callable Debt Securities. ASU No. 2017-08 updates the accounting standards to shorten the amortization period for certain purchased callable debt securities, held at a premium, to be amortized to the earliest call date. The update applies to securities with explicit, noncontingent call features that are callable at fixed prices and on preset dates. The standard is effective for annual periods beginning after December 15, 2018 and interim periods within those fiscal years. Management has implemented this guidance and there is no material impact on the financial statement amounts and footnote disclosures.
3. Investment Advisory Agreement and Other Agreements
Investment Advisory Agreement
Each Fund has entered into an investment advisory agreement with AdvisorShares Investments, LLC (the ‘‘Advisor’’) pursuant to which the Advisor acts as the Fund’s investment advisor. Pursuant to the agreement, the Advisor has overall supervisory responsibility for the general management and investment of each Fund’s securities portfolio, and has ultimate responsibility (subject to oversight by the Trust’s Board of Trustees) for oversight of the Trust’s sub-advisors. For its services, each Fund pays the Advisor an annual management fee and which is calculated daily and paid monthly based on average daily net assets. From time to time, the Advisor may waive all or a portion of its fee.
125
ADVISORSHARES TRUST June 30, 2020 |
3. Investment Advisory Agreement and Other Agreements – (continued) |
The Advisor’s annual management fee for each Fund is as follows:
Fund: | Rate: | |||||
Dorsey Wright ADR ETF | 0.75% | |||||
Dorsey Wright Alpha Equal Weight ETF | 0.75% | |||||
Dorsey Wright FSM All Cap World ETF | 0.75% | |||||
Dorsey Wright FSM US Core ETF | 0.75% | |||||
Dorsey Wright Micro-Cap ETF | 0.75% | |||||
Dorsey Wright Short ETF | 0.75% | |||||
DoubleLine Value Equity ETF | 0.70% | |||||
Focused Equity ETF | 0.75%(a) | |||||
FolioBeyond Smart Core Bond ETF | 0.50% | |||||
Newfleet Multi-Sector Income ETF | 0.50% | |||||
Pure Cannabis ETF | 0.60% | |||||
Ranger Equity Bear ETF | 1.50% | |||||
Sage Core Reserves ETF | 0.30% | |||||
STAR Global Buy-Write ETF | 1.35% | |||||
Vice ETF | 0.60% |
____________
(a) The actual fee paid may vary from the contractual fee based on the Fund’s performance to its benchmark. Accordingly, the Advisor’s annual advisory fee will range from 0.65% to 0.85% of the Fund’s average daily net assets.
Pursuant to an investment advisory agreement between the Focused Equity ETF and the Advisor, the Advisor is entitled to receive, on a monthly basis, an annual advisory fee based on the average daily net assets of the Fund. The Advisor’s advisory fee has two components — the base fee and the performance fee adjustment. The base fee is the pre-determined rate at which the Advisor is paid when the Fund’s net performance is in line with Fund’s pre-determined performance benchmark. The base fee is subject to an upward or downward adjustment by the performance fee. If the Fund outperforms the performance benchmark, the Advisor may receive an upward fee adjustment. If the Fund underperforms the performance benchmark, the Advisor may receive a downward fee adjustment.
The Advisor’s annual base fee is 0.75% of the Fund’s average daily net assets. The performance fee adjustment is derived by comparing the Fund’s performance over a rolling twelve-month period to its performance benchmark, the S&P 500 Index. The base fee is adjusted at a rate of 0.02% for every 0.25% to 0.50% of out-performance or under-performance compared to the performance benchmark, but only up to 2.00% of the performance benchmark. As a result, the maximum possible performance fee adjustment, up or down, to the base fee is 0.10%. Accordingly, the Advisor’s annual advisory fee may range from 0.65% to 0.85% of the Fund’s average daily net assets. For the year ended June 30, 2020, the performance fee adjustment was 0.02%, resulting in a net advisory fee of 0.77%.
Sub-Advisory Agreements
Each Fund’s investment sub-advisor provides investment advice and management services to the Fund. AdvisorShares supervises the day-to-day investment and reinvestment of the assets in the Fund and is responsible for monitoring the Fund’s adherence to its investment mandate. Pursuant to an investment sub-advisory agreement between each sub-advisor and the Advisor, the sub-advisor is entitled to a
126
ADVISORSHARES TRUST June 30, 2020 |
3. Investment Advisory Agreement and Other Agreements – (continued) |
fee, which is not an additional expense of the Funds, and is calculated daily and paid monthly by the Advisor, at an annual rate based on the average daily net assets of its respective Fund(s) as follows:
Fund | Sub-Advisor | Sub-Advisory | ||
AdvisorShares Dorsey Wright ADR ETF | Dorsey, Wright & Associates, LLC | 0.25% | ||
AdvisorShares Dorsey Wright Micro Cap ETF | Dorsey, Wright & Associates, LLC | 0.25% | ||
AdvisorShares Dorsey Wright Short ETF | Dorsey, Wright & Associates, LLC | 0.25% | ||
AdvisorShares Double Line Value ETF | Doubleline Equity LP | 0.35% | ||
AdvisorShares Newfleet Multi-Sector Income ETF | Newfleet Asset Management, LLC | 0.25% | ||
AdvisorShares Ranger Equity Bear ETF | Ranger Alternative Management, L.P. | 1.00% | ||
AdvisorShares Sage Core Reserves ETF | Sage Advisory Services, Ltd. Co. | 0.15% | ||
AdvisorShares STAR Global Buy-Write ETF | Partnervest Advisory Services LLC | 0.85% |
From time to time, each sub-advisor may waive all or a portion of its fee.
Expense Limitation Agreement
The Advisor has contractually agreed to reduce their fees and reimburse expenses in order to keep net expenses (excluding interest, taxes, brokerage commissions, acquired fund fees and expenses, and extraordinary expenses) from exceeding a specified amount for each Fund’s average daily net assets. The expense limitation agreement will be terminated upon termination of the investment advisory agreement between the Advisor and the Fund. The investment advisory agreement may only be terminated with the approval of the Fund’s Board. The expense caps in effect for each Fund during the year ended June 30, 2020 were as follows:
Fund: | Rate: | |||||
Dorsey Wright ADR ETF | 1.10%(a) | |||||
Dorsey Wright Alpha Equal Weight ETF | 0.99% | |||||
Dorsey Wright FSM All Cap World ETF | 0.99% | |||||
Dorsey Wright FSM US Core ETF | 0.99% | |||||
Dorsey Wright Micro-Cap ETF | 1.25%(b) | |||||
Dorsey Wright Short ETF | 1.25%(b) | |||||
DoubleLine Value Equity ETF | 0.90% | |||||
Focused Equity ETF | 0.75%(c) | |||||
FolioBeyond Smart Core Bond ETF | 0.95% | |||||
Newfleet Multi-Sector Income ETF | 0.75% | |||||
Pure Cannabis ETF | 0.74% | |||||
Ranger Equity Bear ETF | 1.85% | |||||
Sage Core Reserves ETF | 0.35% | |||||
STAR Global Buy-Write ETF | 1.85% | |||||
Vice ETF | 0.99%(d) |
____________
(a) Prior to November 1, 2019, the expense limit was 0.88%.
(b) Prior to November 1, 2019, the expense limit was 0.99%.
127
ADVISORSHARES TRUST June 30, 2020 |
3. Investment Advisory Agreement and Other Agreements – (continued) |
(c) The Advisor has contractually agreed to waive its fees and/or reimburse expenses in order to keep net expenses (excluding amounts payable pursuant to any plan adopted in accordance with Rule 12b-1, interest expense, taxes, brokerage commissions, acquired fund fees and expenses, other expenditures which are capitalized in accordance with generally accepted accounting principles, and extraordinary expenses) from exceeding a percentage of the Fund’s average daily net assets equal to the monthly calculated rate of the management fee, which can range from 0.65% to 0.85%.
(d) Prior to November 1, 2019, the expense limit was 0.75%.
The Advisor may recapture operating expenses waived and/or reimbursed within three years after the date on which such waiver or reimbursement occurred. The Funds must pay their ordinary operating expenses before the Advisor is permitted to recapture and must remain in compliance with any applicable expense limitation, as well as with, the expense limitation in effect at the time of the waiver or reimbursement, if different. All or a portion of the following Advisor waived and/or reimbursed expenses may be recaptured during the fiscal years indicated:
Fund | Expenses | Recoupment | Recoupment | Year | ||||
Dorsey Wright ADR ETF | 30,817 | — | 6/30/2021 | 2018 | ||||
272,312 | 220,876 | 6/30/2022 | 2019 | |||||
Total | 303,129 | 220,876 | ||||||
Dorsey Wright Alpha Equal Weight ETF | 31,003 | 31,003 | 6/30/2023 | 2020 | ||||
Total | 31,003 | 31,003 | ||||||
Dorsey Wright FSM All Cap World ETF | 22,184 | 22,184 | 6/30/2023 | 2020 | ||||
Total | 22,184 | 22,184 | ||||||
Dorsey Wright FSM US Core ETF | 26,148 | 26,148 | 6/30/2023 | 2020 | ||||
Total | 26,148 | 26,148 | ||||||
Dorsey Wright Micro Cap ETF | 86,234 | 86,234 | 6/30/2022 | 2019 | ||||
77,363 | 77,363 | 6/30/2023 | 2020 | |||||
Total | 163,597 | 163,597 | ||||||
Dorsey Wright Short ETF | 70,194 | — | 6/30/2022 | 2019 | ||||
Total | 70,194 | — | ||||||
DoubleLine Value Equity ETF | 240,281 | 240,281 | 6/30/2021 | 2018 | ||||
200,619 | 200,619 | 6/30/2022 | 2019 | |||||
91,371 | 91,371 | 6/30/2023 | 2020 | |||||
Total | 532,271 | 532,271 | ||||||
Focused Equity ETF | 94,062 | 94,062 | 6/30/2021 | 2018 | ||||
136,738 | 136,738 | 6/30/2022 | 2019 | |||||
125,698 | 125,698 | 6/30/2023 | 2020 | |||||
Total | 356,498 | 356,498 | ||||||
128
ADVISORSHARES TRUST June 30, 2020 |
3. Investment Advisory Agreement and Other Agreements – (continued) |
Fund | Expenses | Recoupment | Recoupment | Year | ||||
FolioBeyond Smart Core Bond ETF | 50,120 | 50,120 | 6/30/2021 | 2018 | ||||
82,792 | 82,792 | 6/30/2022 | 2019 | |||||
39,057 | 39,057 | 6/30/2023 | 2020 | |||||
Total | 171,969 | 171,969 | ||||||
Newfleet Multi-Sector Income ETF | 204,737 | 204,737 | 6/30/2021 | 2018 | ||||
249,159 | 249,159 | 6/30/2022 | 2019 | |||||
50,459 | 50,459 | 6/30/2023 | 2020 | |||||
Total | 504,355 | 504,355 | ||||||
Pure Cannabis ETF | 33,071 | 33,071 | 6/30/2022 | 2019 | ||||
196,096 | 196,096 | 6/30/2023 | 2020 | |||||
Total | 229,167 | 229,167 | ||||||
Sage Core Reserves ETF | 202,791 | 202,791 | 6/30/2021 | 2018 | ||||
192,747 | 192,747 | 6/30/2022 | 2019 | |||||
165,567 | 165,567 | 6/30/2023 | 2020 | |||||
Total | 561,105 | 561,105 | ||||||
STAR Global Buy-Write ETF | 56,242 | 56,242 | 6/30/2021 | 2018 | ||||
77,386 | 77,386 | 6/30/2022 | 2019 | |||||
49,370 | 49,370 | 6/30/2023 | 2020 | |||||
Total | 182,998 | 182,998 | ||||||
Vice ETF | 103,464 | 103,464 | 6/30/2021 | 2018 | ||||
89,372 | 89,372 | 6/30/2022 | 2019 | |||||
79,288 | 79,288 | 6/30/2023 | 2020 | |||||
Total | 272,124 | 272,124 |
Administrator, Custodian, Fund Accountant and Transfer Agent
The Bank of New York Mellon (‘‘BNYM’’) (in each capacity, the ‘‘Administrator’’, ‘‘Custodian’’, ‘‘Fund Accountant’’ or ‘‘Transfer Agent’’), serves as the Fund’s Administrator, Custodian, Fund Accountant and Transfer Agent pursuant to a certain Fund Administration and Accounting Agreement, a Custody Agreement or a Transfer Agency and Service Agreement, as the case may be.
Distribution and Service (12b-1) Plan
Foreside Fund Services, LLC (the ‘‘Distributor’’) serves as the Fund’s distributor of Creation Units for the Fund pursuant to the distribution agreement. The Distributor does not maintain any secondary market shares. The Funds have adopted a Distribution and Service Plan (‘‘Plan’’) pursuant to Rule 12b-1 under the 1940 Act. In accordance with its Plan, each Fund is authorized to pay an amount up to 0.25% of its average daily net assets each year for certain distribution-related activities. No fees are currently paid by each Fund under the Plan, and there are no current plans to impose these fees. However, in the event Rule 12b-1 fees were charged, over time they would increase the cost of an investment in each Fund.
129
ADVISORSHARES TRUST June 30, 2020 |
4. Creation and Redemption Transactions
The Funds issue and redeem shares on a continuous basis at NAV in groups of 25,000 shares, at minimum, called ‘‘Creation Units.’’ Except when aggregated in Creation Units, shares are not redeemable securities of a Fund. Only ‘‘Authorized Participants’’ may purchase or redeem shares directly from each Fund. An Authorized Participant is either (i) a broker-dealer or other participant in the clearing process through the Continuous Net Settlement System of the National Securities Clearing Corporation or (ii) a DTC participant and, in each case, must have executed a Participant Agreement with the Distributor. Most retail investors will not qualify as Authorized Participants or have the resources to buy and sell whole Creation Units. Therefore, they will be unable to purchase or redeem the shares directly from the Fund. Rather, most retail investors will purchase shares in the secondary market with the assistance of a broker and will be subject to customary brokerage commissions or fees.
5. Summary of Fair Value Disclosure
The Financial Accounting Standard Board’s (‘‘FASB’’) Accounting Standards Codification (‘‘ASC’’) 820-10, Fair Value Measurements and Disclosures, defines fair value, establishes an authoritative framework for measuring fair value in accordance with generally accepted accounting principles, and expands disclosure about fair value measurements. Various inputs are used in determining the value of the Fund’s investments. These inputs are summarized in the three broad levels listed below:
Level 1 — Unadjusted quoted prices in active markets for identical assets or liabilities that the company has the ability to access.
Level 2 — Observable inputs other than quoted prices included in Level 1 that are observable for the asset or liability either directly or indirectly. These inputs may include quoted prices for the identical instrument on an inactive market, prices for similar instruments, interest rates, prepayment speeds, credit risk, yield curves, default rates, and similar data.
Level 3 — Unobservable inputs for the asset or liability to the extent that relevant observable inputs are not available, representing the company’s own assumptions about the assumptions that a market participant would use in valuing the asset or liability, and that would be based on the best information available.
Investments that use Level 2 or Level 3 inputs may include, but are not limited to: (i) an unlisted security related to corporate actions; (ii) a restricted security (e.g., one that may not be publicly sold without registration under the Securities Act of 1933 as amended); (iii) a security whose trading has been suspended or which has been de-listed from its primary trading exchange; (iv) a security that is thinly traded; (v) a security in default or bankruptcy proceedings for which there is no current market quotation; (vi) a security affected by currency controls or restrictions; and (vii) a security affected by a significant event (e.g., an event that occurs after the close of the markets on which the security is traded but before the time as of which a Fund’s net asset value is computed and that may materially affect the value of the Fund’s investment). Examples of events that may be ‘‘significant events’’ are government actions, natural disasters, armed conflicts and acts of terrorism. The inputs or methodology used for valuing securities are not necessarily an indication of the risk associated with investing in those securities.
For more detailed categories, see the accompanying Schedules of Investments.
130
ADVISORSHARES TRUST June 30, 2020 |
6. Derivative Instruments
The Funds have adopted authoritative standards of accounting for derivative instruments which establish enhanced disclosure requirements. These standards improve financial reporting for derivative instruments by requiring enhanced disclosures that enables investors to understand how and why a fund uses derivative instruments, how derivative instruments are accounted for and how derivative instruments affect a fund’s financial position and results of operations. The Funds use derivative instruments as part of their principal investment strategy to achieve their investment objective.
At June 30, 2020, the fair values of derivative instruments were as follows:
Statements of Assets and Liabilities:
Fund: | Asset Derivatives: | Equity Risk | |||
Pure Cannabis ETF | Unrealized Appreciation on Swaps Contracts | $ | 265,830 | ||
Fund: | Liability Derivatives: | Equity Risk | ||||
Pure Cannabis ETF | Unrealized Depreciation on Swaps Contracts | $ | (5,008 | ) | ||
STAR Global Buy-Write ETF | Options Written, at value |
| (2,306 | ) | ||
Transactions in derivative instruments during the year ended June 30, 2020, were as follows:
Statements of Operations:
Fund: | Realized Gain (Loss): | Equity Risk | Credit Risk | |||||||
Pure Cannabis ETF | Swaps | $ | (4,020,660 | ) | $ | — |
| |||
Sage Core Reserves ETF | Futures |
| — |
|
| (2,469 | ) | |||
STAR Global Buy-Write ETF | Options Written |
| (257,534 | ) |
| — |
| |||
Fund: | Change in Unrealized Gain (Loss): | Equity Risk | Credit Risk | |||||
Pure Cannabis ETF | Swaps | $ | 464,310 | $ | — | |||
STAR Global Buy-Write ETF | Options Written |
| — |
| — | |||
For the year ended June 30, 2020, the average volume of the derivatives opened by the Funds was as follows:
Pure | Sage Core | STAR Global | |||||||
Futures Contracts | $ | — | $ | 18,888,393 | $ | — | |||
Long Swaps Contracts |
| 20,067,753 |
| — |
| — | |||
Purchased Options Contracts |
| — |
| — |
| 23,145 | |||
Written Options Contracts |
| — |
| — |
| 12,033 | |||
131
ADVISORSHARES TRUST June 30, 2020 |
7. Federal Income Tax
Each Fund intends to qualify as a ‘‘regulated investment company’’ under Sub-chapter M of the Internal Revenue Code of 1986, as amended. If so qualified, the Funds will not be subject to Federal income tax to the extent it distributes substantially all of its net investment income and net capital gains to its shareholders. Accounting for Uncertainty in Income Taxes provides guidance for how uncertain tax positions should be recognized, measured, presented and disclosed in the financial statements, and requires the evaluation of tax positions taken or expected to be taken in the course of preparing a Fund’s tax returns to determine whether the tax positions are ‘‘more-likely-than-not’’ of being sustained by the applicable tax authority. Tax positions not deemed to meet the more-than-likely-than-not threshold would be recorded as a tax benefit or expense in the current year. Interest and penalty related to income taxes would be recorded as income tax expense. Management of the Funds is required to analyze all open tax years (2017 − 2019), as defined by IRS statute of limitations, for all major jurisdictions, including federal tax authorities and certain state tax authorities. As of June 30, 2020, the Funds did not have a liability for any unrecognized tax benefits. The Funds have no examination in progress and is not aware of any tax positions for which it is reasonably possible that the amounts of unrecognized tax benefits will significantly change in the next twelve months.
At June 30, 2020, the approximate cost of investments, excluding short positions, and net unrealized appreciation (depreciation) for federal income tax purposes was as follows:
Fund | Cost | Gross | Gross | Net | Other | ||||||||||||||
Dorsey Wright ADR ETF | $ | 64,184,696 | $ | 21,035,853 |
| $ | (529,058 | ) | $ | 20,506,795 |
| $ | — |
| |||||
Dorsey Wright Alpha Equal Weight ETF |
| 36,307,304 |
| 3,663,778 |
|
| (387,053 | ) |
| 3,276,725 |
|
| — |
| |||||
Dorsey Wright FSM All Cap World ETF |
| 91,654,706 |
| 4,360,230 |
|
| (4,333 | ) |
| 4,355,897 |
|
| — |
| |||||
Dorsey Wright FSM US Core ETF |
| 66,392,226 |
| 3,499,216 |
|
| (252,882 | ) |
| 3,246,334 |
|
| — |
| |||||
Dorsey Wright Micro-Cap ETF |
| 1,931,651 |
| 531,650 |
|
| (36,450 | ) |
| 495,200 |
|
| — |
| |||||
Dorsey Wright Short ETF |
| 113,954,317 |
| 27,204,018 |
|
| (27,442,898 | ) |
| (238,880 | ) |
| (10,807,084 | ) | |||||
DoubleLine Value Equity ETF |
| 41,111,241 |
| 3,651,967 |
|
| (3,298,485 | ) |
| 353,482 |
|
| — |
| |||||
Focused Equity ETF |
| 16,404,636 |
| 4,124,753 |
|
| (879,669 | ) |
| 3,245,084 |
|
| — |
| |||||
FolioBeyond Smart Core Bond ETF |
| 9,856,460 |
| (6,969 | ) |
| (90,693 | ) |
| (97,662 | ) |
| — |
| |||||
Newfleet Multi-Sector Income ETF |
| 58,948,575 |
| 910,087 |
|
| (632,481 | ) |
| 277,606 |
|
| — |
| |||||
Pure Cannabis ETF |
| 78,887,088 |
| 11,451,083 |
|
| (38,171,070 | ) |
| (26,719,987 | ) |
| 260,828 |
| |||||
Ranger Equity Bear ETF |
| 187,209,771 |
| 4,951,518 |
|
| (5,700,267 | ) |
| (748,749 | ) |
| (8,228,866 | ) | |||||
Sage Core Reserves ETF |
| 102,603,711 |
| 371,666 |
|
| (271,379 | ) |
| 100,287 |
|
| — |
| |||||
STAR Global Buy-Write ETF |
| 10,642,894 |
| 2,281,420 |
|
| (13,072 | ) |
| 2,268,348 |
|
| 14,355 |
| |||||
Vice ETF |
| 10,045,468 |
| 1,420,107 |
|
| (2,021,537 | ) |
| (601,430 | ) |
| — |
| |||||
132
ADVISORSHARES TRUST June 30, 2020 |
7. Federal Income Tax – (continued) |
At June 30, 2020, the components of distributable earnings/loss on a tax basis were as follows:
Fund | Undistributed | Undistributed | Capital Loss | Timing | Post-October/ | Net | Total | |||||||||||||||||||
Dorsey Wright ADR ETF | $ | — | $ | — | $ | (62,738,485 | ) | $ | — |
| $ | (17,599 | ) | $ | 20,506,795 |
| $ | (42,249,289 | ) | |||||||
Dorsey Wright Alpha Equal Weight ETF |
| 14,012 |
| — |
| (9,481,255 | ) |
|
|
| — |
|
| 3,276,725 |
|
| (6,190,518 | ) | ||||||||
Dorsey Wright FSM All Cap World ETF |
| 26,514 |
| — |
| — |
|
| — |
|
| — |
|
| 4,355,897 |
|
| 4,382,411 |
| |||||||
Dorsey Wright FSM US Core ETF |
| 135,730 |
| — |
| — |
|
| — |
|
| — |
|
| 3,246,334 |
|
| 3,382,064 |
| |||||||
Dorsey Wright Micro-Cap ETF |
| — |
| — |
| (1,198,439 | ) |
| — |
|
| (2,902 | ) |
| 495,200 |
|
| (706,141 | ) | |||||||
Dorsey Wright Short ETF |
| — |
| — |
| (27,703,905 | ) |
| — |
|
| (1,126,063 | ) |
| (11,045,964 | ) |
| (39,875,932 | ) | |||||||
DoubleLine Value Equity ETF |
| 398,869 |
| — |
| (31,700,279 | ) |
| — |
|
| — |
|
| 353,482 |
|
| (30,947,928 | ) | |||||||
Focused Equity ETF |
| 33,904 |
| — |
| (695,532 | ) |
| — |
|
| — |
|
| 3,245,084 |
|
| 2,583,456 |
| |||||||
FolioBeyond Smart Core Bond ETF |
| 31 |
| — |
| (961,614 | ) |
| — |
|
| — |
|
| (97,662 | ) |
| (1,059,245 | ) | |||||||
Newfleet Multi-Sector Income ETF |
| 31,035 |
| — |
| (8,080,371 | ) |
| — |
|
| — |
|
| 277,606 |
|
| (7,771,730 | ) | |||||||
Pure Cannabis ETF |
| 103,660 |
| — |
| (20,264,148 | ) |
|
|
|
|
| (26,459,159 | ) |
| (46,619,647 | ) | |||||||||
Ranger Equity Bear ETF |
| — |
| — |
| (297,632,227 | ) |
| — |
|
| (1,128,571 | ) |
| (8,977,615 | ) |
| (307,738,413 | ) | |||||||
Sage Core Reserves ETF |
| 31,793 |
| — |
| (1,375,521 | ) |
| — |
|
| — |
|
| 100,287 |
|
| (1,243,441 | ) | |||||||
STAR Global Buy-Write ETF |
| 36,638 |
| — |
| (663,174 | ) |
| (737,154 | ) |
| — |
|
| 2,282,703 |
|
| 919,013 |
| |||||||
Vice ETF |
| 58,079 |
| — |
| (1,199,842 | ) |
|
|
| — |
|
| (601,430 | ) |
| (1,743,193 | ) | ||||||||
The differences between book and tax basis components of net assets are primarily attributed to wash sale loss deferrals and other book/tax differences.
At June 30, 2020, the effect of permanent book/tax reclassifications resulted in increases/(decreases) to the components of net assets as follows:
Fund | Distributable | Paid-in | ||||
Dorsey Wright ADR ETF | (6,533,142 | ) | 6,533,142 |
| ||
Dorsey Wright Alpha Equal Weight ETF | (160,047 | ) | 160,047 |
| ||
Dorsey Wright FSM All Cap World ETF | (487,191 | ) | 487,191 |
| ||
Dorsey Wright FSM US Core ETF | (399,456 | ) | 399,456 |
| ||
Dorsey Wright Micro-CAP ETF | (237,863 | ) | 237,863 |
| ||
Dorsey Wright Short ETF | 106,289 |
| (106,289 | ) | ||
DoubleLine Value Equity ETF | (779,733 | ) | 779,733 |
| ||
Focused Equity ETF | (1,239,711 | ) | 1,239,711 |
| ||
FolioBeyond Smart Core Bond ETF | — |
| — |
| ||
Newfleet Multi-Sector Income ETF | — |
| — |
| ||
Pure Cannabis ETF | 1,553 |
| (1,553 | ) | ||
Ranger Equity Bear ETF | — |
| — |
| ||
Sage Core Reserves ETF | — |
| — |
| ||
STAR Global Buy-Write ETF | (392,694 | ) | 392,694 |
| ||
Vice ETF | (335,518 | ) | 335,518 |
| ||
133
ADVISORSHARES TRUST June 30, 2020 |
7. Federal Income Tax – (continued) |
For financial reporting purposes, capital accounts are adjusted to reflect the tax character of permanent book/tax differences. Reclassifications are primarily due to the tax treatment of net operating losses and distributions reclassifications.
The tax character of distributions paid during the fiscal years ended June 30, 2020 and 2019 were as follows:
Fund | 2020 | 2020 | 2019 | 2019 | ||||||||
Dorsey Wright ADR ETF | $ | 18,253 | $ | — | $ | 669,735 | $ | — | ||||
Dorsey Wright Alpha Equal Weight ETF |
| — |
| — |
| — |
| — | ||||
Dorsey Wright FSM All Cap World ETF |
| — |
| — |
| — |
| — | ||||
Dorsey Wright FSM US Core ETF |
| — |
| — |
| — |
| — | ||||
Dorsey Wright Micro-CAP ETF |
| 1,775 |
| — |
| — |
| — | ||||
Dorsey Wright Short ETF |
| 64,055 |
| — |
| 17,152 |
| — | ||||
DoubleLine Value Equity ETF |
| 652,256 |
| — |
| 830,880 |
| — | ||||
Focused Equity ETF |
| 80,515 |
| — |
| 170,257 |
| 167,315 | ||||
FolioBeyond Smart Core Bond ETF |
| 224,781 |
| — |
| 659,376 |
| — | ||||
Newfleet Multi-Sector Income ETF |
| 1,814,609 |
| — |
| 3,385,118 |
| — | ||||
Pure Cannabis ETF |
| 2,875,940 |
| — |
| — |
| — | ||||
Ranger Equity Bear ETF |
| 241,821 |
| — |
| — |
| — | ||||
Sage Core Reserves ETF |
| 1,939,526 |
| — |
| 1,508,500 |
| — | ||||
STAR Global Buy-Write ETF |
| 67,959 |
| — |
| 64,625 |
| — | ||||
Vice ETF |
| 294,624 |
| — |
| 193,320 |
| — | ||||
Under current tax regulations, capital losses on securities transactions realized after October 31 (‘‘Post-October Losses’’) may be deferred and treated as occurring on the first business day of the following fiscal year. Under the recently enacted Regulated Investment Company Modernization Act of 2010, the Funds will be permitted to defer taxable ordinary income losses incurred after December 31 and treat as occurring on the first business day of the following fiscal year. Post-October losses and ordinary income losses deferred to July 1, 2020 are as follows:
Fund | Late Year | Short-Term | Long-Term | ||||||
Dorsey Wright ADR ETF | $ | 17,599 | $ | — | $ | — | |||
Dorsey Wright Alpha Equal Weight ETF |
| — |
| — |
| — | |||
Dorsey Wright FSM All Cap World ETF |
| — |
| — |
| — | |||
Dorsey Wright FSM US Core ETF |
| — |
| — |
| — | |||
Dorsey Wright Micro-CAP ETF |
| 2,902 |
| — |
| — | |||
Dorsey Wright Short ETF |
| 1,126,063 |
| — |
| — | |||
DoubleLine Value Equity ETF |
| — |
| — |
| — | |||
Focused Equity ETF |
| — |
| — |
| — | |||
FolioBeyond Smart Core Bond ETF |
| — |
| — |
| — | |||
Newfleet Multi-Sector Income ETF |
| — |
| — |
| — | |||
Pure Cannabis ETF |
| — |
| — |
| — | |||
Ranger Equity Bear ETF |
| 1,128,571 |
| — |
| — | |||
Sage Core Reserves ETF |
| — |
| — |
| — | |||
STAR Global Buy-Write ETF |
| — |
| — |
| — | |||
Vice ETF |
| — |
| — |
| — | |||
134
ADVISORSHARES TRUST June 30, 2020 |
7. Federal Income Tax – (continued) |
The following Funds have capital loss carryforwards available to offset future realized gains of:
Fund | Short-Term | Long-Term | Total | ||||||
Dorsey Wright ADR ETF | $ | 60,038,766 | $ | 2,699,719 | $ | 62,738,485 | |||
Dorsey Wright Alpha Equal Weight ETF |
| 9,481,255 |
| — |
| 9,481,255 | |||
Dorsey Wright FSM All Cap World ETF |
| — |
| — |
| — | |||
Dorsey Wright FSM US Core ETF |
| — |
| — |
| — | |||
Dorsey Wright Micro-CAP ETF |
| 1,144,343 |
| 54,096 |
| 1,198,439 | |||
Dorsey Wright Short ETF |
| 27,703,905 |
| — |
| 27,703,905 | |||
DoubleLine Value Equity ETF |
| 29,810,781 |
| 1,889,498 |
| 31,700,279 | |||
Focused Equity ETF |
| 252,483 |
| 443,049 |
| 695,532 | |||
FolioBeyond Smart Core Bond ETF |
| 223,655 |
| 737,959 |
| 961,614 | |||
Newfleet Multi-Sector Income ETF |
| 1,929,690 |
| 6,150,681 |
| 8,080,371 | |||
Pure Cannabis ETF |
| 19,940,470 |
| 323,678 |
| 20,264,148 | |||
Ranger Equity Bear ETF |
| 297,425,011 |
| 207,216 |
| 297,632,227 | |||
Sage Core Reserves ETF |
| 1,220,340 |
| 155,181 |
| 1,375,521 | |||
STAR Global Buy-Write ETF |
| — |
| 663,174 |
| 663,174 | |||
Vice ETF |
| 751,851 |
| 447,991 |
| 1,199,842 | |||
The following Funds utilized capital loss carryforwards to offset taxable gains realized during the year ended June 30, 2020:
Fund | Utilized | ||
Dorsey Wright ADR ETF | $ | — | |
Dorsey Wright Alpha Equal Weight ETF |
| — | |
Dorsey Wright FSM All Cap World ETF |
| — | |
Dorsey Wright FSM US Core ETF |
| — | |
Dorsey Wright Micro-CAP ETF |
| — | |
Dorsey Wright Short ETF |
| — | |
DoubleLine Value Equity ETF |
| — | |
Focused Equity ETF |
| — | |
FolioBeyond Smart Core Bond ETF |
| 142,218 | |
Newfleet Multi-Sector Income ETF |
| — | |
Pure Cannabis ETF |
| — | |
Ranger Equity Bear ETF |
| — | |
Sage Core Reserves ETF |
| — | |
STAR Global Buy-Write ETF |
| — | |
Vice ETF |
| — | |
135
ADVISORSHARES TRUST June 30, 2020 |
8. Investment Transactions
Purchases and sales of investments and securities sold short (excluding short term securities) for the year ended June 30, 2020 were as follows:
Purchases | Sales | |||||||||||||||||
Fund | Long Term | U.S. | In-Kind | Long Term | U.S. | In-Kind | ||||||||||||
Dorsey Wright ADR ETF | $ | 46,407,412 | $ | — | $ | 21,667,779 | $ | 47,010,156 | $ | — | $ | 52,617,418 | ||||||
Dorsey Wright Alpha Equal Weight ETF |
| 36,797,764 |
| — |
| 49,950,679 |
| 38,179,857 |
| — |
| 3,491,104 | ||||||
Dorsey Wright FSM All Cap World ETF |
| 14,851,224 |
| — |
| 84,848,897 |
| 14,824,537 |
| — |
| 16,190,031 | ||||||
Dorsey Wright FSM US Core ETF |
| 15,429,290 |
| — |
| 61,609,995 |
| 15,345,289 |
| — |
| 18,862,613 | ||||||
Dorsey Wright Micro-Cap ETF |
| 2,473,487 |
| — |
| 1,089,064 |
| 2,446,271 |
| — |
| 1,162,147 | ||||||
Dorsey Wright Short ETF |
| 379,785,797 |
| — |
| — |
| 412,622,818 |
| — |
| — | ||||||
DoubleLine Value Equity ETF |
| 48,360,288 |
| — |
| — |
| 49,573,159 |
| — |
| 16,692,599 | ||||||
Focused Equity ETF |
| 4,264,173 |
| — |
| 6,443,794 |
| 4,543,489 |
| — |
| 4,189,606 | ||||||
FolioBeyond Smart Core Bond ETF |
| 54,705,056 |
| — |
| 2,567,713 |
| 54,675,882 |
| — |
| — | ||||||
Newfleet Multi-Sector Income ETF |
| 30,572,984 |
| 10,620,864 |
| — |
| 50,964,311 |
| 7,137,070 |
| — | ||||||
Pure Cannabis ETF |
| 21,504,650 |
| — |
| 20,729,873 |
| 21,655,332 |
| — |
| — | ||||||
Ranger Equity Bear ETF |
| 1,255,356,706 |
| — |
| — |
| 1,230,337,550 |
| — |
| — | ||||||
Sage Core Reserves ETF |
| 84,643,634 |
| 2,951,536 |
| — |
| 70,002,139 |
| — |
| — | ||||||
STAR Global Buy-Write ETF |
| 6,668,726 |
| — |
| — |
| 5,965,824 |
| — |
| 1,585,852 | ||||||
Vice ETF |
| 4,629,554 |
| — |
| 632,993 |
| 4,741,092 |
| — |
| 3,558,469 | ||||||
9. Risks Involved with Investing in the Funds
The Funds are subject to the principal risks described below, some or all of these risks may adversely affect the Funds’ NAV, trading price, yield, total return and ability to meet its investment objective. As with any investment, an investment in each Fund could result in a loss or the performance of each Fund could be inferior to that of other investments.
Credit Risk
Credit risk is the risk that an issuer or guarantor of debt instruments or the counterparty to a financial transaction, including derivatives contracts, repurchase agreements or loans of portfolio securities, is unable or unwilling to make timely interest and/or principal payments or to otherwise honor its obligations. The Fund’s, and its affiliates, manage counterparty credit risk by entering into transactions only with counterparties that they believe have the financial resources to honor their obligations and by monitoring the financial stability of those counterparties. Financial assets, which potentially expose the Funds to issuer and counterparty credit risks, consist principally of financial instruments and receivables due from counterparties. The extent of each Fund’s exposure to credit and counterparty risks with respect to those financial assets is approximated by their value recorded in its Statements of Assets and Liabilities. High yield securities may also be subject to greater levels of credit or default risk than higher-rated securities and high yield securities may be less liquid and more difficult to sell at an advantageous time or price or to value than higher-rated securities. In particular, high yield securities are often issued by smaller, less creditworthy companies or by highly leveraged (indebted) companies, which are generally less able than more financially stable companies to make scheduled payments of interest and principal.
136
ADVISORSHARES TRUST June 30, 2020 |
9. Risks Involved with Investing in the Funds – (continued) |
Fund of Funds Risk
Some of the Funds’ investment performance, because they are fund of funds, depends on the investment performance of the Underlying ETFs in which they invest. An investment in these Funds is subject to the risk associated with the Underlying ETFs that comprise their Underlying Index. The Funds will indirectly pay a proportional share of the asset-based fees, if any, of the Underlying ETFs in which they invest.
Liquidity Risk
In certain circumstances, it may be difficult for the Fund to purchase and sell particular investments within a reasonable time at a fair price. To the extent that there is not an established retail market for instruments in which the Fund may invest, trading in such instruments may be relatively inactive. Trading in shares may be halted because of market conditions or for reasons that, in the view of the Exchange, make trading in shares inadvisable. In addition, trading in shares is subject to trading halts caused by extraordinary market volatility pursuant to ‘‘circuit breaker’’ rules. There can be no assurance that the requirements necessary to maintain the listing of the shares of the Fund will continue to be met or will remain unchanged.
Market Risk
Investments in securities, in general, are subject to market risks that may cause their prices to fluctuate over time. The Fund’s investments may decline in value due to factors affecting securities markets generally, or particular countries, segments, economic sectors, industries or companies within those markets. The value of a security held in a short position may increase due to general economic and market conditions which are not specifically related to a particular issuer, such as real or perceived positive economic conditions or changes in interest or currency rates. Because the market value of ETF shares may differ from their net asset value, the shares may trade at a premium or discount. An investment in the Fund may lose money.
A novel strain of coronavirus (COVID-19) outbreak was declared a pandemic by the World Health Organization on March 11, 2020. The situation is evolving with various cities and countries around the world responding in different ways to address the outbreak. There are direct and indirect economic effects developing for various industries and individual companies throughout the world. Management will continue to monitor the impact COVID-19 has on the Funds and reflect the consequences as appropriate in the Funds’ accounting and financial reporting. The recent pandemic spread of the novel coronavirus and related geopolitical events could lead to increased market volatility, disruption to U.S. and world economies and markets and may have significant adverse effects on the Funds and their investments.
New Fund Risk
Some of the Funds are new funds. As new funds, there can be no assurance that the Funds will grow to or maintain an economically viable size, in which case the Funds may experience greater tracking error to their Underlying Index than it otherwise would be at higher asset levels or it could ultimately liquidate.
137
ADVISORSHARES TRUST June 30, 2020 |
9. Risks Involved with Investing in the Funds – (continued) |
Cannabis-Related Company Risk
Cannabis-related companies are subject to various laws and regulations that may differ at the state/local and federal level. These laws and regulations may (i) significantly affect a cannabis-related company’s ability to secure financing, (ii) impact the market for marijuana industry sales and services, and (iii) set limitations on marijuana use, production, transportation, and storage. Cannabis-related companies may also be required to secure permits and authorizations from government agencies to cultivate or research marijuana. In addition, cannabis-related companies are subject to the risks associated with the greater agricultural industry, including changes to or trends that affect commodity prices, labor costs, weather conditions, and laws and regulations related to environmental protection, health and safety. Cannabis-related companies may also be subject to risks associated with the biotechnology and pharmaceutical industries. These risks include increased government regulation, the use and enforcement of intellectual property rights and patents, technological change and obsolescence, product liability lawsuits, and the risk that research and development may not necessarily lead to commercially successful products.
10. Subsequent Events
The Funds have evaluated subsequent events through the issuance of the financial statements and determined that no events have occurred that require additional disclosure.
11. Unaudited Tax Information
Qualified Dividend Income — Certain dividends paid by the Funds may be subject to a minimum tax rate of 15%, as provided by the Jobs and Growth Tax Relief Reconciliation Act of 2003. The percentage of ordinary income distributions for the year ended June 30, 2020, taxed at a minimum rate of 15% were as follows:
Fund | Percentage | ||
Dorsey Wright ADR ETF | 11.78 | % | |
Dorsey Wright Alpha Equal Weight ETF | 0.00 | % | |
Dorsey Wright FSM All Cap World ETF | 0.00 | % | |
Dorsey Wright FSM US Core ETF | 0.00 | % | |
Dorsey Wright Micro-Cap ETF | 100.00 | % | |
Dorsey Wright Short ETF | 0.00 | % | |
DoubleLine Value Equity ETF | 100.00 | % | |
Focused Equity ETF | 100.00 | % | |
FolioBeyond Smart Core Bond ETF | 54.00 | % | |
Newfleet Multi-Sector Income ETF | 0.00 | % | |
Pure Cannabis ETF | 1.47 | % | |
Ranger Equity Bear ETF | 0.00 | % | |
Sage Core Reserves ETF | 0.00 | % | |
STAR Global Buy-Write ETF | 100.00 | % | |
Vice ETF | 100.00 | % | |
138
ADVISORSHARES TRUST June 30, 2020 |
11. Unaudited Tax Information – (continued) |
Dividends Received Deduction — For corporate shareholders, the percentage of ordinary income distributions for the year ended June 30, 2020 that qualifies for the dividends received deduction were as follows:
Fund | Percentage | ||
Dorsey Wright ADR ETF | 0.00 | % | |
Dorsey Wright Alpha Equal Weight ETF | 0.00 | % | |
Dorsey Wright FSM All Cap World ETF | 0.00 | % | |
Dorsey Wright FSM US Core ETF | 0.00 | % | |
Dorsey Wright Micro-Cap ETF | 100.00 | % | |
Dorsey Wright Short ETF | 0.00 | % | |
DoubleLine Value Equity ETF | 100.00 | % | |
Focused Equity ETF | 100.00 | % | |
FolioBeyond Smart Core Bond ETF | 0.01 | % | |
Newfleet Multi-Sector Income ETF | 0.00 | % | |
Pure Cannabis ETF | 2.32 | % | |
Ranger Equity Bear ETF | 0.00 | % | |
Sage Core Reserves ETF | 0.00 | % | |
STAR Global Buy-Write ETF | 100.00 | % | |
Vice ETF | 80.76 | % | |
Qualified Interest Income — For nonresident alien shareholders, the percentage of ordinary income distributions for the year ended June 30, 2020 that qualified interest income were as follows:
Fund | Percentage | ||
Dorsey Wright ADR ETF | 0.00 | % | |
Dorsey Wright Alpha Equal Weight ETF | 0.00 | % | |
Dorsey Wright FSM All Cap World ETF | 0.00 | % | |
Dorsey Wright FSM US Core ETF | 0.00 | % | |
Dorsey Wright Micro-Cap ETF | 0.00 | % | |
Dorsey Wright Short ETF | 0.00 | % | |
DoubleLine Value Equity ETF | 0.00 | % | |
Focused Equity ETF | 0.00 | % | |
FolioBeyond Smart Core Bond ETF | 57.71 | % | |
Newfleet Multi-Sector Income ETF | 96.33 | % | |
Pure Cannabis ETF | 0.00 | % | |
Ranger Equity Bear ETF | 0.00 | % | |
Sage Core Reserves ETF | 100.00 | % | |
STAR Global Buy-Write ETF | 0.00 | % | |
Vice ETF | 0.00 | % | |
139
ADVISORSHARES TRUST June 30, 2020 |
11. Unaudited Tax Information – (continued) |
The following Funds intend to elect to pass through to shareholders the credit for taxes paid to foreign countries. The gross foreign source income and foreign taxes paid were as follows:
Fund | Foreign | Gross | ||||
Dorsey Wright ADR ETF | $ | — | $ | — | ||
Dorsey Wright Alpha Equal Weight ETF |
| — |
| — | ||
Dorsey Wright FSM All Cap World ETF |
| — |
| — | ||
Dorsey Wright FSM US Core ETF |
| — |
| — | ||
Dorsey Wright Micro-Cap ETF |
| — |
| — | ||
Dorsey Wright Short ETF |
| — |
| — | ||
DoubleLine Value Equity ETF |
| — |
| — | ||
Focused Equity ETF |
| — |
| — | ||
FolioBeyond Smart Core Bond ETF |
| — |
| — | ||
Newfleet Multi-Sector Income ETF |
| — |
| — | ||
Pure Cannabis ETF |
| — |
| — | ||
Ranger Equity Bear ETF |
| — |
| — | ||
Sage Core Reserves ETF |
| — |
| — | ||
STAR Global Buy-Write ETF |
| 1,915 |
| 26,189 | ||
Vice ETF |
| — |
| — | ||
140

REPORT OF INDEPENDENT REGISTERED PUBLIC ACCOUNTING FIRM
To the Shareholders and Board of Trustees
of AdvisorShares Trust
Opinion on the Financial Statements
We have audited the accompanying statements of assets and liabilities of the Dorsey Wright ADR ETF, Dorsey Wright Alpha Equal Weight ETF, Dorsey Wright FSM All Cap World ETF, Dorsey Wright FSM US Core ETF, Dorsey Wright Micro-Cap ETF, Dorsey Wright Short ETF, DoubleLine Value Equity ETF, Focused Equity ETF, FolioBeyond Smart Core Bond ETF, Newfleet Multi-Sector Income ETF, Pure Cannabis ETF, Ranger Equity Bear ETF, Sage Core Reserves ETF, STAR Global Buy-Write ETF and Vice ETF, each a series of AdvisorShares Trust (the “Trust”), including the schedules of investments, as of June 30, 2020, the related statements of operations, the statements of changes in net assets, and financial highlights for each of the periods indicated in the table below, and the related notes (collectively referred to as the “financial statements”). In our opinion, the financial statements present fairly, in all material respects, the financial position of the Funds as of June 30, 2020, the results of their operations, the changes in their net assets and their financial highlights for each of the periods indicated in the table below, in conformity with accounting principles generally accepted in the United States of America.
Individual Funds | Statement of operations | Statements of | Financial highlights | |||
Dorsey Wright ADR ETF, DoubleLine Value Equity ETF, FolioBeyond Smart Core Bond ETF, Newfleet Multi-Sector Income ETF, Ranger Equity Bear ETF, Sage Core Reserves ETF, STAR Global Buy-Write ETF | For the year ended June 30, 2020 | For each of the two years in the period ended June 30, 2020 | For each of the five years in the period ended June 30, 2020 | |||
Focused Equity ETF | For the year ended June 30, 2020 | For each of the two years in the period ended June 30, 2020 | For each of the three years in the period ended June 30, 2020 and for the period from September 20, 2016 (commencement of operations) through June 30, 2017 | |||
Vice ETF | For the year ended June 30, 2020 | For each of the two years in the period ended June 30, 2020 | For each of the two years in the period ended June 30, 2020 and for the period December 12, 2017 (commencement of operations) through June 30, 2018 | |||
Dorsey Wright Micro-Cap ETF, Dorsey Wright Short ETF | For the year ended June 30, 2020 | For the year ended June 30, 2020 and the period July 11, 2018 through June 30, 2019 | For the year ended June 30, 2020 and for the period July 11, 2018 (commencement of operations) through June 30, 2019 | |||
Pure Cannabis ETF | For the year ended June 30, 2020 | For the year ended June 30, 2020 and the period April 17, 2019 through June 30, 2019 | For the year ended June 30, 2020 and for the period April 17, 2019 (commencement of operations) through June 30, 2019 | |||
Dorsey Wright Alpha Equal Weight ETF, Dorsey Wright FSM All Cap World ETF, Dorsey Wright FSM US Core ETF | For the period December 26, 2019 through June 30, 2020 | For the period December 26, 2019 through June 30, 2020 | For the period December 26, 2019 (commencement of operations) through June 30, 2020 |
141
REPORT OF INDEPENDENT REGISTERED PUBLIC ACCOUNTING FIRM (Continued) |
Basis for Opinion
These financial statements are the responsibility of the Trust’s management. Our responsibility is to express an opinion on the Funds’ financial statements based on our audits. We are a public accounting firm registered with the Public Company Accounting Oversight Board (United States) (“PCAOB”) and are required to be independent with respect to the Funds in accordance with the U.S. federal securities laws and the applicable rules and regulations of the Securities and Exchange Commission and the PCAOB. We have served as the auditor of one or more of the funds in the Trust since 2009.
We conducted our audits in accordance with the standards of the PCAOB. Those standards require that we plan and perform the audits to obtain reasonable assurance about whether the financial statements are free of material misstatement, whether due to error or fraud. The Funds are not required to have, nor were we engaged to perform, an audit of the Funds’ internal control over financial reporting. As part of our audits we are required to obtain an understanding of internal control over financial reporting, but not for the purpose of expressing an opinion on the effectiveness of the Funds’ internal control over financial reporting. Accordingly, we express no such opinion.
Our audits included performing procedures to assess the risks of material misstatement of the financial statements, whether due to error or fraud, and performing procedures that respond to those risks. Such procedures included examining, on a test basis, evidence regarding the amounts and disclosures in the financial statements. Our audits also included evaluating the accounting principles used and significant estimates made by management, as well as evaluating the overall presentation of the financial statements. Our procedures included confirmation of securities owned as of June 30, 2020 by correspondence with the custodian and brokers; when replies were not received from brokers, we performed other auditing procedures. We believe that our audits provide a reasonable basis for our opinion.
TAIT, WELLER & BAKER LLP | ||
Philadelphia, Pennsylvania | ||
August 26, 2020 |
142
In accordance with Rule 22e-4 (the “Liquidity Rule”) under the Investment Company Act of 1940 (the “1940 Act”), your Fund has adopted a liquidity risk management program (the “Program”), and the Board has designated AdvisorShares Investments LLC (“Advisor”) as Program administrator. The Program is designed to assess and manage your Fund’s liquidity risk (the risk that the Fund would be unable to meet requests to redeem shares of the Fund without significant dilution of remaining investors’ interests in the Fund). The Advisor has designated its investment management and trading committee (the “Committee”) that is responsible for the implementation and ongoing administration of the Program, which includes assessing the Fund’s liquidity risk under both normal and reasonably foreseeable stressed conditions. Under the Program, every investment held by a Fund is classified on a daily basis into one of four liquidity categories based on calculations of the investment’s ability to be sold during designated timeframes in current market conditions without significantly changing the investment’s market value.
143
Renewal of the Advisory Agreement for Each Fund and the Sub-Advisory Agreements for the AdvisorShares Newfleet Multi-Sector Income ETF and AdvisorShares Sage Core Reserves ETF
At a meeting of the Board of Trustees (the “Board”) of AdvisorShares Trust (the “Trust”) held on May 18, 2020, the Board, including those trustees who are not “interested persons” of the Trust, as that term is defined in the Investment Company Act of 1940 (the “1940 Act”) (the “Independent Trustees”), considered the approval of the renewal of (a) separate sub-advisory agreements (collectively, the “Sub-Advisory Agreements”) between AdvisorShares Investments, LLC (the “Advisor”) and (1) Newfleet Asset Management, on behalf of the AdvisorShares Newfleet Multi-Sector Income ETF and (2) Sage Advisory Services Ltd. Co., on behalf of the AdvisorShares Sage Core Reserves ETF (together, the “Sub-Advisors”), pursuant to which the Sub-Advisors perform portfolio management and related services, and (b) the investment advisory agreement between the Advisor and the Trust (together with the Sub-Advisory Agreements, the “Advisory Agreements”), on behalf of each series of the Trust (each a “Fund” and, collectively, the “Funds”).
Pursuant to Section 15 of the 1940 Act, to continue after their initial two-year term, the Advisory Agreements must be approved annually: (i) by the vote of the Board or by a vote of the shareholders of the Funds and (ii) by the vote of a majority of the Independent Trustees cast in person at a meeting called for the purpose of voting on such approval. Each year, the Board calls and holds a meeting to decide whether to renew the Advisory Agreements for an additional one-year term. In preparation for the meeting, the Board requests and reviews a wide variety of information from the Advisor and Sub-Advisors. The Board uses this information, as well as other information that the Advisor, Sub-Advisors and other service providers may submit to the Board at the meeting and over the course of the prior year, to help evaluate the Advisor’s and each Sub-Advisor’s fee and other aspects of the Advisory Agreements and decide whether to renew the Advisory Agreements for an additional year.
As discussed in further detail below, prior to and at the meeting, the Board, including the Independent Trustees, reviewed written materials from the Advisor and each Sub-Advisor regarding, among other things: (i) the nature, extent and quality of the services provided by the Advisor and each Sub-Advisor; (ii) the performance by the Advisor and each Sub-Advisor of its duties; (iii) the investment performance of each Fund; (iv) the costs of the services provided and profits realized by the Advisor and each Sub-Advisor; (v) the potential for economies of scale for the benefit of each Fund’s shareholders; and (vi) any ancillary benefits to the Adviser and each Sub-Advisor.
At the meeting, the Board was presented with additional information to help it evaluate the Advisor’s and each Sub-Advisor’s fee and other aspects of the Advisory Agreements. The Board received an overview of the Advisor’s and each Sub-Advisor’s operations and management of the Funds, including comparative fee data and profitability analysis for each Fund, and was also provided with information with respect to compliance oversight. The Board reviewed the management of each Fund, including the Fund’s strategy, the focus in the markets, the Fund’s positioning in the market, and its attractive and unique offering. The Board reviewed the Advisor’s and each Sub-Advisor’s overall business generally, including any noteworthy personnel changes.
The Board deliberated on the renewal of the Advisory Agreements in light of the written materials that it received before the meeting, information it received at the meeting, and information it had received at prior board meetings. In its deliberations, the Board considered the factors and reached the conclusions described below relating to the selection of the Advisor and each Sub-Advisor and the renewal of each Advisory Agreement. The Board did not identify any single piece of information discussed below that was paramount, controlling or determinative of its decision.
Nature, Extent and Quality of Services. In considering the nature, extent and quality of the services provided by the Advisor and each Sub-Advisor, the Board reviewed the services provided to each Fund by the Advisor and applicable Sub-Advisor, noting that these services include, among other things, furnishing a continuous investment program for the Fund, including arranging for, or implementing, the purchase and sale of portfolio securities, the provision of related services, such as portfolio
144
BOARD REVIEW OF INVESTMENT ADVISORY AND SUB-ADVISORY AGREEMENTS (Continued) |
management compliance services, and the preparation and filing of certain reports on behalf of the Trust. The Trustees reviewed the extensive responsibilities that the Advisor has as investment advisor to each Fund, including the oversight of the activities and operations of the Sub-Advisors, as applicable, and other service providers, oversight of general fund compliance with federal and state laws, and the implementation of Board directives as they relate to the Funds. The Board also considered, among other things, the professional experience and qualifications of the senior management and key professional personnel of the Advisor and Sub-Advisors, including those individuals responsible for portfolio management. The Board also considered the Advisor’s and Sub-Advisors’ operational capabilities and resources and their experience in managing investment portfolios. The most recent Form ADV for the Advisor and each Sub-Advisor was provided to the Board, as were responses to a detailed series of questions that, among other things, requested information about their business, services, and compensation. Based on its review, within the context of its full deliberations, the Board determined that it was satisfied with the nature, extent and quality of the services provided to the Funds by the Advisor and each Sub-Advisor.
Performance of the Funds. The Board was provided with information regarding each Fund’s performance for various periods, as well as comparative performance information. The Advisor and each Sub-Advisor provided information regarding factors impacting the performance of the Funds, outlining current market conditions, and explaining its expectations and strategies for the future. Based on this information, the Board concluded that it was satisfied with the investment results that the Advisor and each Sub-Advisor had been able to achieve for its respective Fund.
Cost of Services and Profitability. In considering whether the advisory and sub-advisory fees payable with respect to each Fund are reasonable, the Board reviewed the advisory fee paid by each Fund to the Advisor, the sub-advisory fee paid by the Advisor to each Sub-Advisor, the fees waived and/or expenses reimbursed by the Advisor and each Sub-Advisor over the period, the costs and other expenses incurred by the Advisor and each Sub-Advisor in providing advisory services, and the Advisor’s and each Sub-Advisor’s, as applicable, profitability analysis with respect to each Fund. In discussing the fee arrangements between the Advisor and each Sub-Advisor, the Board noted that the Advisor pays each Sub-Advisor out of the advisory fee it receives from the respective Fund. The Board also reviewed information comparing each Fund’s fee to the fee paid by comparable funds. The Board also considered the Advisor’s contractual arrangement to waive its advisory fee and/or reimburse expenses in an effort to control the expense ratios of the Funds. Based on its review, in the context of its full deliberations, the Board concluded for each Fund that the advisory fees appear to be reasonable in light of the services rendered.
Economies of Scale. The Board considered for each Fund whether economies of scale were realized, noting any fee waivers and/or expense reimbursements by the Advisor and Sub-Advisors and whether the Advisor’s and/or Sub-Advisors’ fees include breakpoints. The Board determined to continue to assess on an ongoing basis whether the aggregate advisory fee for each Fund appropriately takes into account any economies of scale that had been realized as a result of any significant asset growth of a Fund.
Ancillary Benefits. The Board noted the potential benefits to be received by the Advisor and each Sub-Advisor as a result of its relationship with a Fund (other than the advisory or sub-advisory fee), including the intangible benefits of its association with the Trust generally and any favorable publicity arising in connection with a Fund’s performance.
Conclusion. Based on its deliberations and evaluation of the information described above, the Board, including the Independent Trustees, unanimously: (i) concluded that the terms of each Advisory Agreement are fair and reasonable; (ii) concluded that the Advisor’s fees are reasonable in light of the services that it provides to the Funds; (iii) concluded that each Sub-Advisor’s fees are reasonable in light of the services that it provides to its respective Fund; and (iv) agreed to renew each Advisory Agreement for another year.
145
The business of the Trust is managed under the direction of the Trust’s Board of Trustees. The Board elects the officers of the Trust who are responsible for administering the Trust’s day-to-day operations. Each Trustee serves until his or her successor is duly elected or appointed and qualified.
The name, age, address, and principal occupations during the past five years for each Trustee and officer of the Trust is set forth below, along with the other public directorships held by the Trustees. More information about the Trustees is in the Trust’s Statement of Additional Information, which is available without charge by calling 1-877-843-3831.
Name, Address, | Position(s) Held | Principal Occupation(s) | Number of | Other | ||||
Interested Trustee | ||||||||
Noah Hamman* | Trustee (no set | Chief Executive Officer, President, and Founder of AdvisorShares Investments, LLC (2006–present). | 16 | None | ||||
Independent Trustees | ||||||||
Elizabeth (“Betsy”) | Trustee (no set | President of ASAE Business Services, Inc. (2017–present), ASAE Insurance Company (2020–present), ASAE Investments, LLC (2018–present), ASAE Real Estate (2017–present) (ASAE (American Society of Association Executives) is a membership organization serving the association and non-profit community); President of P/B Wealth Consulting (2017–present); Vice-President/Chief Operating Officer of NADA Retirement Administrators, Inc. (2009–2017). | 16 | None | ||||
William G. McVay | Trustee (no set | Principal of Red Tortoise LLC (a boutique investment counseling firm) (May 2017–present); Founder of RDK Strategies, LLC (2007–present). | 16 | None | ||||
Officers | ||||||||
Noah Hamman | President (no set | Chief Executive Officer, President, and Founder of AdvisorShares Investments, LLC (2006–present). | N/A | N/A | ||||
Dan Ahrens | Secretary & | Managing Director of AdvisorShares Investments, LLC (2013–present); Chief Compliance Officer of the Trust (2009–2013); Executive Vice President of AdvisorShares Investments, LLC (2008–2013). | N/A | N/A | ||||
Stefanie Little | Chief Compliance | Founder of Chenery Compliance Group, LLC (2015-present); Chief Compliance Officer of AdvisorShares Investments, LLC and the Trust (2013–present); President of LCG Compliance Alliance (2011–present). | N/A | N/A |
____________
* Mr. Hamman is an “interested” person of the Trust, as that term is defined in the 1940 Act, by virtue of his ownership and controlling interest in the Advisor.
146
Quarterly Portfolio Holdings Information
The Funds are required to file their complete schedule of portfolio holdings with the SEC for their first and third quarters as an exhibit to its reports on Form N-PORT. Copies of the filings are available without charge on the SEC’s website at www.sec.gov.
Proxy Voting Information
A description of the Funds proxy voting policies and procedures, as well as a record of how the Funds voted proxies during the most recent 12-month period ended June 30, is available without charge upon request by calling 1-877-843-3831. This information is also available on the SEC’s website at www.sec.gov.
Premium/Discount Information
Information about the differences between the daily market price on the secondary market for the shares of a Fund and the Fund’s net asset value may be found on the Fund’s website at www.advisorshares.com.
147
ADVISORSHARES TRUST |
Investment Advisor |
AdvisorShares Investments, LLC |
Sub-Advisors |
Ranger Alternative Management, L.P. |
Newfleet Asset Management, LLC |
Partnervest Advisory Services, LLC |
Sage Advisory Services, Ltd. Co. |
Dorsey, Wright & Associates, LLC |
DoubleLine Equity LP |
Distributor |
Foreside Fund Services, LLC |
Custodian/Fund Administrator/Transfer Agent |
The Bank of New York Mellon |
Legal Counsel |
Morgan, Lewis & Bockius LLP |
Independent Registered Public Accounting Firm |
Tait, Weller & Baker LLP |
This report is submitted for the general information of the shareholders of each Fund. It is not authorized for distribution to prospective investors unless preceded or accompanied by an effective prospectus, which includes information regarding a Fund’s risks, objectives, fees and expenses, experience of management and other information.
![]()
Item 2. Code of Ethics.
| (a) | The registrant, as of the end of the period covered by this report, has adopted a code of ethics that applies to the registrant’s principal executive officer, principal financial officer, principal accounting officer or controller, or persons performing similar functions, regardless of whether these individuals are employed by the registrant or a third party. |
| (c) | There have been no amendments, during the period covered by this report, to a provision of the code of ethics that applies to the registrant’s principal executive officer, principal financial officer, principal accounting officer or controller, or persons performing similar functions, regardless of whether these individuals are employed by the registrant or a third party, and that relates to any element of the code of ethics description. |
| (d) | The registrant has not granted any waivers, including an implicit waiver, from a provision of the code of ethics that applies to the registrant’s principal executive officer, principal financial officer, principal accounting officer or controller, or persons performing similar functions, regardless of whether these individuals are employed by the registrant or a third party, that relates to one or more of the items set forth in paragraph (b) of this item’s instructions. |
Item 3. Audit Committee Financial Expert.
The Registrant’s Board of Trustees has one audit committee financial expert serving on its audit committee, an “independent” Trustee, Elizabeth Piper/Bach. Under applicable securities laws, a person who is determined to be an audit committee financial expert will not be deemed an “expert” for any purpose, including without limitation for the purposes of Section 11 of the Securities Act of 1933, as a result of being designated or identified as an audit committee financial expert. The designation or identification of a person as an audit committee financial expert does not impose on such person any duties, obligations, or liabilities that are greater than the duties, obligations, and liabilities imposed on such person as a member of the audit committee and Board of Trustees in the absence of such designation or identification.
Item 4. Principal Accountant Fees and Services.
Audit Fees
| (a) | The aggregate fees billed for each of the last two fiscal years for professional services rendered by the principal accountant for the audit of the registrant's annual financial statements or services that are normally provided by the accountant in connection with statutory and regulatory filings or engagements for those fiscal years are $232,500 for 2020 and $249,750 for 2019. |
Audit-Related Fees
| (b) | The aggregate fees billed in each of the last two fiscal years for assurance and related services by the principal accountant that are reasonably related to the performance of the audit of the registrant's financial statements and are not reported under paragraph (a) of this Item are $0 for 2020 and $0 for 2019. |
Tax Fees
| (c) | The aggregate fees billed in each of the last two fiscal years for professional services rendered by the principal accountant for tax compliance, tax advice, and tax planning are $45,000 for 2020 and $48,000 for 2019. |
All Other Fees
| (d) | The aggregate fees billed in each of the last two fiscal years for products and services provided by the principal accountant, other than the services reported in paragraphs (a) through (c) of this Item are $0 for 2020 and $0 for 2019. |
| (e)(1) | Disclose the audit committee's pre-approval policies and procedures described in paragraph (c)(7) of Rule 2-01 of Regulation S-X. |
Per Rule 2-01(c)(7)(A), the Audit Committee pre-approves all of the Audit, Audit-Related, Tax and Other Fees of the Registrant.
| (e)(2) | The percentage of services described in each of paragraphs (b) through (d) of this Item that were approved by the audit committee pursuant to paragraph (c)(7)(i)(C) of Rule 2-01 of Regulation S-X are as follows: |
(b) N/A
(c) 100%
(d) N/A
| (f) | The percentage of hours expended on the principal accountant's engagement to audit the registrant's financial statements for the most recent fiscal year that were attributed to work performed by persons other than the principal accountant's full-time, permanent employees was less than fifty percent. |
| (g) | The aggregate non-audit fees billed by the registrant's accountant for services rendered to the registrant, and rendered to the registrant's investment adviser (not including any sub-adviser whose role is primarily portfolio management and is subcontracted with or overseen by another investment adviser), and any entity controlling, controlled by, or under common control with the adviser that provides ongoing services to the registrant for each of the last two fiscal years of the registrant was $0 for 2020 and $0 for 2019. |
| (h) | Not applicable. |
Item 5. Audit Committee of Listed Registrants.
| (a) | The Fund has a designated Audit Committee in accordance with Section 3(a)(58)(A) of the Securities and Exchange Act of 1934 (the “Exchange Act”) and the member of such committee is Elizabeth Piper/Bach and William G. McVay. |
| (b) | Not applicable. |
Item 6. Investments.
| (a) | Schedule of Investments in securities of unaffiliated issuers as of the close of the reporting period is included as part of the report to shareholders filed under Item 1 of this form. |
| (b) | Not applicable. |
Item 7. Disclosure of Proxy Voting Policies and Procedures for Closed-End Management Investment Companies.
Not applicable.
Item 8. Portfolio Managers of Closed-End Management Investment Companies.
Not applicable.
Item 9. Purchases of Equity Securities by Closed-End Management Investment Company and Affiliated Purchasers.
Not applicable.
Item 10. Submission of Matters to a Vote of Security Holders.
Not applicable.
Item 11. Controls and Procedures.
| (a) | The registrant’s principal executive and principal financial officers, or persons performing similar functions, have concluded that the registrant’s disclosure controls and procedures (as defined in Rule 30a-3(c) under the Investment Company Act of 1940, as amended (the “1940 Act”) (17 CFR 270.30a-3(c))) are effective, as of a date within 90 days of the filing date of the report that includes the disclosure required by this paragraph, based on their evaluation of these controls and procedures required by Rule 30a-3(b) under the 1940 Act (17 CFR 270.30a-3(b)) and Rules 13a-15(b) or 15d-15(b) under the Securities Exchange Act of 1934, as amended (17 CFR 240.13a-15(b) or 240.15d-15(b)). |
| (b) | There were no changes in the registrant’s internal control over financial reporting (as defined in Rule 30a-3(d) under the 1940 Act (17 CFR 270.30a-3(d))) that occurred during the period covered by this report that has materially affected, or is reasonably likely to materially affect, the registrant’s internal control over financial reporting. |
Item 12. Disclosure of Securities Lending Activities for Closed-End Management Investment Companies.
Not applicable.
Item 13. Exhibits.
| (a)(3) | Not applicable. |
| (a)(4) | Not applicable. |
SIGNATURES
Pursuant to the requirements of the Securities Exchange Act of 1934 and the Investment Company Act of 1940, the registrant has duly caused this report to be signed on its behalf by the undersigned, thereunto duly authorized.
| (Registrant) | AdvisorShares Trust |
| By (Signature and Title)* | /s/ Noah Hamman | |
| Noah Hamman, Chief Executive Officer | ||
| (principal executive officer) |
| Date | September 3, 2020 |
Pursuant to the requirements of the Securities Exchange Act of 1934 and the Investment Company Act of 1940, this report has been signed below by the following persons on behalf of the registrant and in the capacities and on the dates indicated.
| By (Signature and Title)* | /s/ Noah Hamman | |
| Noah Hamman, Chief Executive Officer | ||
| (principal executive officer) |
| Date | September 3, 2020 |
| By (Signature and Title)* | /s/ Dan Ahrens | |
| Dan Ahrens, Treasurer | ||
| (principal financial officer) |
| Date | September 3, 2020 |
* Print the name and title of each signing officer under his or her signature.