Washington, D.C. 20549
Form N-CSR is to be used by management investment companies to file reports with the Commission not later than 10 days after the transmission to stockholders of any report that is required to be transmitted to stockholders under Rule 30e-1 under the Investment Company Act of 1940 (17 CFR 270.30e-1). The Commission may use the information provided on Form N-CSR in its regulatory, disclosure review, inspection, and policymaking roles.
A registrant is required to disclose the information specified by Form N-CSR, and the Commission will make this information public. A registrant is not required to respond to the collection of information contained in Form N-CSR unless the Form displays a currently valid Office of Management and Budget ("OMB") control number. Please direct comments concerning the accuracy of the information collection burden estimate and any suggestions for reducing the burden to Secretary, Securities and Exchange Commission, 450 Fifth Street, NW, Washington, DC 20549-0609. The OMB has reviewed this collection of information under the clearance requirements of 44 U.S.C. § 3507.
Item 1. Reports to Stockholders.
The Report to Shareholders is attached herewith.

ADVISORSHARES TRUST
4800 Montgomery Lane
Suite 150
Bethesda, Maryland 20814
www.advisorshares.com
1.877.843.3831
Annual Report
June30, 2019
Beginning on January1, 2021, as permitted by regulations adopted by the U.S. Securities and Exchange Commission, paper copies of the Fund’s shareholder reports will no longer be sent by mail, unless you specifically request paper copies of the reports from your financial intermediary, such as a broker-dealer or bank. Instead, the reports will be made available on a website, and you will be notified by mail each time a report is posted and provided with a website link to access the report. If you already elected to receive shareholder reports electronically, you will not be affected by this change and you need not take any action. Please contact your financial intermediary to elect to receive shareholder reports and other communications electronically. You may elect to receive all future reports in paper free of charge. Please contact your financial intermediary to continue receiving paper copies of your shareholder reports and for information about whether your election to receive reports in paper will apply to all funds held with your financial intermediary.
ADVISORSHARES TRUST
Letter from the CEO of AdvisorShares Investments, LLC
It has been a volatile fiscal year. We witnessed significant market declines in the 4th quarter of 2018, only to see the market rocket back up over the first two quarters of 2019. Our largest ETF experienced some significant outflows due to under performance. And, while we have a diverse product line-up including both long and short strategies, the market declines of late 2018 drove many investors to the sidelines instead of making a greater allocation to our short ETFs.
During fiscal 2019, we made several changes to our ETF products. The Madrona Domestic ETF (ticker: FWDD) and the Madrona International Equity ETF (ticker: FWDI) were both closed. The Madrona Global Bond ETF (ticker: FWDB) changed to a new investment strategy based on the use of automated asset allocation algorithms provided by FolioBeyond. While AdvisorShares serves as the portfolio manager for FWDB, we leverage the expertise and investing guidelines of the FolioBeyond investment team and changed the ETF name, accordingly, to the FolioBeyond Smart Core Bond ETF. High profile investment manager DoubleLine chose us as their partner for their first equity ETF, taking over the sub-advisory duties of the Wilshire Buyback ETF, which was renamed the DoubleLine Value Equity ETF (ticker: DBLV). As the name indicates, the investment strategy was changed to focus on DoubleLine’s unique, fundamental value approach to equities.
Several new, innovative ETFs were launched over the last 12months. We partnered with Nasdaq Dorsey Wright in launching the Dorsey Wright Short ETF (ticker: DWSH) and the Dorsey Wright Micro-Cap ETF (ticker: DWMC). DWSH is an all-short equity strategy that uses an opposite approach to Dorsey Wright traditional relative strength model, shorting large cap U.S. equities that demonstrate the greatest relative weakness according to their proprietary methodology. DWMC invests in micro-cap stocks that exhibit superior relative strength within their model. Our most notable launch this year was the Pure Cannabis ETF (ticker: YOLO) managed by our own Dan Ahrens, who is also Portfolio Manager of the AdvisorShares Vice ETF (ticker: ACT). At launch, this was the first, actively managed cannabis ETF domiciled and listed in the U.S. and remains the only cannabis ETF with a federally chartered custodial banking relationship and investments in multi-state operators. Combined, these new ETFs have added nearly $100million to our assets under management.
Going forward, we remain tremendously optimistic about our ETF suite, as well as the prospects for our growth in the ETF industry. We expect to continue to grow our existing lineup of ETFs through new product innovation and development. Currently, we have plans to expand our exemptive relief capabilities, including licensing the use of non- or less-transparent actively managed ETFs. We look forward to continuing to serve you, our shareholders, and thank you for your ongoing support and interest in AdvisorShares.
Best regards,
Noah Hamman
CEO, AdvisorShares Investments
An investment in the Funds is subject to risk, including the possible loss of principal amount invested. ADRs are subject to the risk of change in political or economic conditions and exchange rates in foreign countries. Certain funds may participate in leveraged transactions to include selling securities short which creates the risk of magnified capital losses. Under certain market conditions, short sales can increase the volatility and decrease the liquidity of certain securities or positions and may lower the Fund’s return or result in a loss. There is no guarantee that the individualFund’s will achieve the stated investment objectives. The risks associated with each Fund include the risks associated with the underlying ETFs, which can result in higher volatility, and are detailed in each Fund’s prospectus and on each Fund’s webpage.
The views in this report were those of the Fund’s CEO as of June30, 2019 and may not reflect his views on the date that this report is first published or anytime thereafter. These views are intended to assist shareholders in understanding their investments and do not constitute investment advice.
1
ADVISORSHARES TRUST
AdvisorShares Cornerstone Small Cap ETF (SCAP)
For the 12month period ending June30, 2019, the AdvisorShares Cornerstone Small Cap ETF (SCAP) returned-4.55% on a NAV basis and-4.65% on a Market Price basis. For the same period, the Russell 2000 Index returned-3.31%.
While the broader market was up in the last year, small cap stocks were much weaker than large capitalization peers during the period, as investors focused on companies that were perceived to be lower risk or driven by sustained growth opportunities. Additionally, many small capitalization companies have material exposure to China on both an import and export basis, and extended trade disputes with China and other countries have been a headwind. This divergence was particularly visible during the drawdown periods in October, December, and May.
SCAP seeks to identify companies which are demonstrating improving fundamentals and quality balance sheets. However, market sentiment appeared to focus on the macroeconomic exposure of many individual securities at the expense of their current fundamental performance. Within the portfolio, stock selection was the driver of our underperformance during the period, partly offset by our relative allocation to better-performing sectors. On a sector basis, our overweight position to Information Technology and underweight position to Health Care, as well as stock selection in Financials, Real Estate, and Communication Services were positive contributors to performance. Top contributing holdings included online health insurance marketplace eHealth, action vehicle component manufacturer Fox Factory, and communications software platform Bandwidth. Our underweight position to Utilities, overweight position to Energy, and stock selection in Consumer Discretionary and Information Technology more than offset our positive performance. Top detracting holdings included enhanced oil recovery company Denbury Resources, natural gas company CNX Resources, and Puerto Rican insurance company Triple-S Management.
Looking forward, we continue to believe that SCAP is well positioned for long-term success. We continue to face a changing environment, with some economic and policy uncertainty. We believe we have developed a methodical, disciplined, and diversified approach to managing small cap stocks with a focus on those companies which are demonstrating fundamental strength, which should continue to be an attractive way to invest in the asset class.
HYPOTHETICAL GROWTH OF $10,000 INVESTMENT
For the period July 6, 2016* to June 30, 2019

2
HISTORICAL PERFORMANCE
Total Return as of June 30, 2019
| | 1 Year | | Since
Inception
7/6/2016* | | Predecessor
3 Year** | | Predecessor
5 Year** | | Predecessor
Since
Inception
6/30/2012** |
AdvisorShares Cornerstone Small Cap
ETF NAV | | -4.55 | % | | 14.01 | % | | 13.83 | % | | 9.34 | % | | 14.23 | % |
AdvisorShares Cornerstone Small Cap
ETF Market Price** | | -4.65 | % | | 13.99 | % | | N/A | | | N/A | | | N/A | |
Russell 2000 Index | | -3.31 | % | | 12.52 | % | | 12.30 | % | | 7.06 | % | | 11.38 | % |
Performance data quoted represents past performance and is no guarantee of future results. Current performance may be lower or higher than the performance data quoted. Investment return and principal value will fluctuate so that an investor’s shares, when redeemed, may be worth more or less than original cost. Fund NAV returns are calculated using the Fund’s daily 4:00 p.m. NAV. Returns shown include the reinvestment of all dividends and other distributions. Index returns do not include expenses. As stated in the current prospectus, the Fund’s annual operating expense ratio (gross) is 3.06% and the net expense ratio is 0.90%. (Actual expenses can be referenced in the Financial Highlights section later in this report.) The Fund’s advisor has agreed to waive a portion of its fees and/or reimburse expenses to the extent necessary to keep the Fund’s expenses from exceeding 0.90%. Returns less than one year are not annualized. The performance table and graph do not reflect the deduction of taxes that a shareholder would pay on Fund distributions or theredemption of Fund shares. For the Fund’s most recent month end performance, please call 1-877-843-3831.
The Russell 2000 Index is an index measuring the performance approximately 2,000 small-cap companies in the Russell 3000 Index, which is made up of 3,000 of the biggest U.S. stocks. One cannot invest directly in an index.
3
ADVISORSHARES TRUST
AdvisorShares Dorsey Wright ADR ETF (AADR)
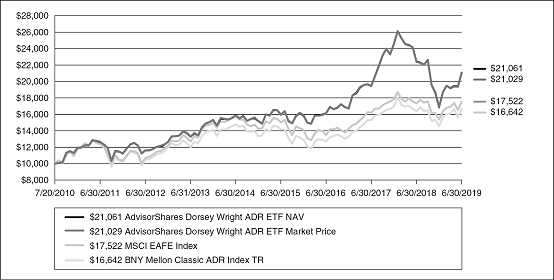
The AdvisorShares Dorsey Wright ADR (AADR) ETF finished the year ended 6/30/2019 behind its benchmark, the BNY Mellon Classic ADR Index, after a very volatile 12months of performance. It was really a tale of two different performance cycles as AADR underperformed during the broader momentum underperformance at the end of calendar 2018 but rebounded to begin the current calendar year.
The last six months of 2018 were very poor for AADR and momentum strategies in general. Fears of a global trade war combined with a surprise increase in the U.S. Dollar caused Emerging Markets to underperform their Developed Markets counterparts. We had been heavily invested in Emerging Markets because of the intermediate-term strength on a trailing basis. The weakness caused us to pare back our exposure and move to a more balanced allocation between Developed and Emerging Markets.
After global markets bottomed in December 2018, AADR rebounded nicely. We outperformed our benchmark over the prior six months, which has brought our relative performance closer to our benchmark. The health of momentum markets looks positive, and leaders have been outperforming laggards. This trend is more pronounced in Emerging rather than Developed markets, and that has helped the Fund’s performance. Our indicators are pointing to a more constructive environment for momentum, and we have a positive outlook for the Fund.
HYPOTHETICAL GROWTH OF $10,000 INVESTMENT
For the period July20, 2010* to June 30, 2019
4
HISTORICAL PERFORMANCE
Total Return as of June 30, 2019
| | 1 Year | | 3 Year | | 5 Year | | Since
Inception
7/20/2010* |
AdvisorShares Dorsey Wright ADR ETF NAV | | -6.16 | % | | 9.27 | % | | 5.76 | % | | 8.68 | % |
AdvisorShares Dorsey Wright ADR ETF Market Price** | | -6.00 | % | | 9.23 | % | | 5.74 | % | | 8.66 | % |
MSCI EAFE Index (Net) | | 1.08 | % | | 9.11 | % | | 2.25 | % | | 6.47 | % |
BNY Mellon Classic ADR Index TR | | 1.69 | % | | 9.46 | % | | 2.42 | % | | 5.86 | % |
Performance data quoted represents past performance and is no guarantee of future results. Current performance may be lower or higher than the performance data quoted. Investment return and principal value will fluctuate so that an investor’s shares, when redeemed, may be worth more or less than original cost. Fund NAV returns are calculated using the Fund’s daily 4:00 p.m. NAV. Returns shown include the reinvestment of all dividends and other distributions. Index returns do not include expenses. As stated in the current prospectus, the Fund’s annual operating expense ratio (gross) is 0.96% and the net expense ratio is 0.88%. (Actual expenses can be referenced in the Financial Highlights section later in this report.) The Fund’s advisor has agreed to waive a portion of its fees and/or reimburse expenses to the extent necessary to keep the Fund’s expenses from exceeding 0.88%. Returns less than one year are not annualized. The performance table and graph do not reflect the deduction of taxes that a shareholder would pay on Fund distributions or the redemption of Fund shares. For the Fund’s most recent month end performance, please call 1-877-843-3831.
The MSCI EAFE Index is an unmanaged free float-adjusted market capitalization index that is designed to measure the equity market performance of developed markets, excluding the U.S. & Canada. One cannot invest directly in an index.
The BNY Mellon Classic ADR Index combines the over the counter (OTC) traded ADRs with exchange-listed ADRs bringing transparency to the available universe of American Depositary Receipts, including those issued by many of the world’s premier companies. One cannot invest directly in an index.
5
ADVISORSHARES TRUST
AdvisorShares Dorsey Wright Micro-Cap ETF (DWMC)
The AdvisorShares Dorsey Wright Micro-Cap ETF (DWMC) finished the year ended 6/30/2019 ahead of its benchmark, the Russell Micro-Cap Index. The Fund launched in a difficult environment where Micro Cap stocks underperformed Large Cap stocks by a large margin over the trailing year. Despite the relative weakness in Micro Caps, the Fund’s allocation to small companies with positive momentum characteristics allowed it to outperform.
The past fiscal year for the Fund was characterized by two distinct periods. The first period, which lasted from the Fund’s launch date to early 2019 was not a good environment for momentum stocks. During this period, stocks with poor momentum characteristics outperformed those with positive momentum. We saw this across the board in all cap ranges, as well as, internationally. The Fund underperformed its benchmark during this time. Momentum stocks performed much better from early 2019 to the Fund’s fiscal year end. With this backdrop, the Fund outperformed its benchmark by a wide margin and made up the underperformance difference from earlier in the year. The Fund continues to overweight growth areas like Technology and Healthcare where we can find small, dynamic companies that can deliver superior returns over time.
We are very positive on the outlook for the Fund over the coming months. We are in the part of the economic cycle when momentum stocks tend to perform very well. We also feel our momentum approach to stock selection works very well in the micro cap space. Small and micro cap stocks have underperformed large caps for quite some time, and we aren’t sure when that trend will reverse. We will continue to focus on the smallest capitalization stocks in our universe, so when leadership moves back to smaller companies, we will be well positioned.
HYPOTHETICAL GROWTH OF $10,000 INVESTMENT
For the period July 10, 2018* to June 30, 2019

6
HISTORICAL PERFORMANCE
Total Return as of June 30, 2019
| | Since
Inception
7/10/2018* |
AdvisorShares Dorsey Wright Micro-Cap ETF | | -6.79 | % |
AdvisorShares Dorsey Wright Micro-Cap ETF Market Price** | | -6.86 | % |
Russell Micro-Cap Index | | -12.82 | % |
Performance data quoted represents past performance and is no guarantee of future results. Current performance may be lower or higher than the performance data quoted. Investment return and principal value will fluctuate so that an investor’s shares, when redeemed, may be worth more or less than original cost. Fund NAV returns are calculated using the Fund’s daily 4:00 p.m. NAV. Returns shown include the reinvestment of all dividends and other distributions. Index returns do not include expenses. As stated in the current prospectus, the Fund’s annual operating expense ratio (gross) is 1.12% and the net expense ratio is 0.99%. (Actual expenses can be referenced in the Financial Highlights section later in this report.) The Fund’s advisor has agreed to waive a portion of its fees and/or reimburse expenses to the extent necessary to keep the Fund’s expenses from exceeding 0.99%. Returns less than one year are not annualized. The performance table and graph do not reflect the deduction of taxes that a shareholder would pay on Fund distributions or the redemption of Fund shares. For the Fund’s most recent month end performance, please call 1-877-843-3831.
The Russell Micro-Cap Index measures the performance of the micro cap segment of the U.S. equity market. It includes 1,000 of the smallest securities in the Russell 2000 Index based on a combination of their market cap and current index membership and it also includes up to the next 1,000 stocks.
7
ADVISORSHARES TRUST
AdvisorShares Dorsey Wright Short ETF (DWSH)
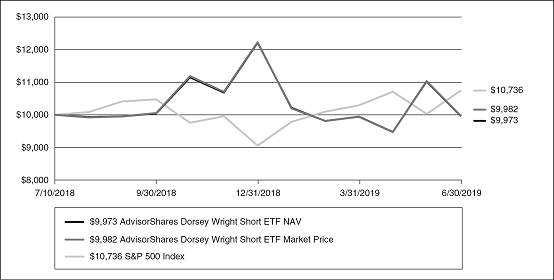
The AdvisorShares Dorsey Wright Short ETF (DWSH) finished the year ended 6/30/2019 in-line with its benchmark, the S&P 500 Index. The past year was very volatile for equities in general, and that affected the performance of the Fund.
The Fund launched in a weak equity market in the latter half of 2018. As equity prices declined, the Fund’s short positions appreciated providing an effective hedge against declining equity prices. When the market rebounded, the Fund underperformed for a short period. The rebound was characterized by the momentum laggards performing better than the leaders. Our methodology is designed to bet against the laggards, so this is what caused the performance drag. As the recovery unfolded, the momentum laggards began to underperform once again and that caused the Fund to perform much better on a relative basis. Heading into the end of the fiscal year, the momentum leaders were outperforming the laggards by a wide margin, which is an ideal condition for the strategy.
We are generally bullish on equity prices looking out through the rest of the year. However, we are in the part of the economic cycle where momentum tends to perform well, and the laggards tend to perform poorly. Even if the broad equity market continues to rise, the Fund can perform relatively well because we are focused on betting against the momentum laggards. Should the broad equity market begin to decline, the last year proved the Fund can be a very effective hedge in those conditions.
HYPOTHETICAL GROWTH OF $10,000 INVESTMENT
For the period July 10, 2018* to June 30, 2019
8
HISTORICAL PERFORMANCE
Total Return as of June 30, 2019
| | Since
Inception
7/10/2018* |
AdvisorShares Dorsey Wright Short ETF | | -0.27 | % |
AdvisorShares Dorsey Wright Short ETF Market Price** | | -0.18 | % |
S&P 500 Index | | 7.36 | % |
Performance data quoted represents past performance and is no guarantee of future results. Current performance may be lower or higher than the performance data quoted. Investment return and principal value will fluctuate so that an investor’s shares, when redeemed, may be worth more or less than original cost. Fund NAV returns are calculated using the Fund’s daily 4:00 p.m. NAV. Returns shown include the reinvestment of all dividends and other distributions. Index returns do not include expenses. As stated in the current prospectus, the Fund’s annual operating expense ratio (gross) is 1.12% and the net expense ratio is 0.99%. (Actual expenses can be referenced in the Financial Highlights section later in this report.) The Fund’s advisor has agreed to waive a portion of its fees and/or reimburse expenses to the extent necessary to keep the Fund’s expenses from exceeding 0.99%. Returns less than one year are not annualized. The performance table and graph do not reflect the deduction of taxes that a shareholder would pay on Fund distributions or the redemption of Fund shares. For the Fund’s most recent month end performance, please call 1-877-843-3831.
The S&P 500 Index is a broad-based, unmanaged measurement of changes in stock market conditions based on the average of 500 widely held common stocks. One cannot invest directly in an index.
9
ADVISORSHARES TRUST
AdvisorShares DoubleLine Value Equity ETF (DBLV)
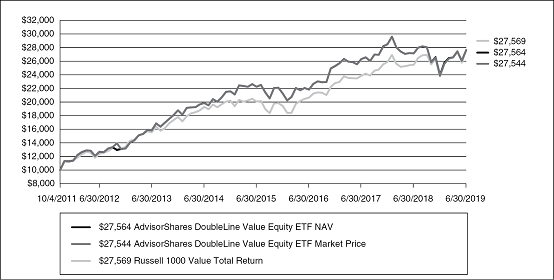
For the year ended June30, 2019, the AdvisorShares DoubleLine Value Equity ETF (DBLV) posted a return of 1.74% (NAV) while the Russell 1000 Value Index, its benchmark, returned 8.46%. On October11, 2018, the AdvisorShares Wilshire Buyback ETF (the “Predecessor Fund”) was renamed the AdvisorShares DoubleLine Value Equity ETF, reflecting a change in portfolio managers and investment strategy. Since October12, 2018 through June30, 2019, DBLV was up 5.88% (NAV), lagging the Russell 1000 Value Total Return Index, by 1.88%.
Since the portfolio management change in October 2018, DBLV benefitted from favorable individual stock performance, on average, but was adversely impacted by sector allocations. On a relative sector basis, the Fund’s overweight in Information Technology was a positive contributor to performance while underweights in the Financials, Real Estate and Utilities sectors, along with a modest overweight in the Energy sector, detracted from performance. From a stock perspective, the top 3 contributors to relative performance were Willis Towers Watson, PayPal and Dollar General, while the top 3 detractors from performance were Bayer AG, CVS Health and Halliburton. The Fund’s sector exposures primarily reflect the investment team’s fundamental, bottom-up investment process, which places an emphasis on individual stock selection.
Late in 2018, the markets pulled back significantly on concerns that the pace of interest rate tightening by the Fed was occurring too fast and threatening an economy already showing signs of deceleration from stagnating overseas growth, an ongoing trade war and a government shutdown. This was followed by a sharp rally since early 2019, driven largely by a dramatic reversal in Fed monetary policy, as Fed Chairman Jerome Powell pivoted to a more accommodative stance, fueling expectations for multiple rate cuts over the next two years. Even as the markets are near peaks or making new all-time highs currently, the U.S. economy remains as dependent as ever on government support to grow, which is far from ideal for equities. We view a cautious and defensive stance as prudent in the current environment since we are likely in the late innings of the current economic and market cycle; as of the beginning of July, the current expansion is now officially the longest in recorded U.S. economic history. That said, we remain constructive on the long-term outlook for the U.S. equity market and we continue to believe that lower-multiple value stocks should post better relative performance over the long run, especially after having lagged growth stocks for nearly a decade.
HYPOTHETICAL GROWTH OF $10,000 INVESTMENT
For the period October 4, 2011* to June 30, 2019
10
HISTORICAL PERFORMANCE
Total Return as of June 30, 2019
| | 1 Year | | 3 Year | | 5 Year | | Since
Inception
10/4/2011* |
AdvisorShares DoubleLine Value Equity ETF | | 1.74 | % | | 8.16 | % | | 6.83 | % | | 14.00 | % |
AdvisorShares DoubleLine Value Equity ETF Market Price** | | 1.63 | % | | 8.14 | % | | 6.80 | % | | 13.99 | % |
Russell 1000 Value Total Return | | 8.46 | % | | 10.19 | % | | 7.46 | % | | 14.00 | % |
Performance data quoted represents past performance and is no guarantee of future results. Current performance may be lower or higher than the performance data quoted. Investment return and principal value will fluctuate so that an investor’s shares, when redeemed, may be worth more or less than original cost. Fund NAV returns are calculated using the Fund’s daily 4:00 p.m. NAV. Returns shown include the reinvestment of all dividends and other distributions. Index returns do not include expenses. As stated in the current prospectus, the Fund’s annual operating expense ratio (gross) and net expense ratio is 0.90%. (Actual expenses can be referenced in the Financial Highlights section later in this report.) The Fund’s advisor has agreed to waive a portion of its fees and/or reimburse expenses to the extent necessary to keep the Fund’s expenses from exceeding 0.90%. Returns less than one year are not annualized. The performance table and graph do not reflect the deduction of taxes that a shareholder would pay on Fund distributions or the redemption of Fund shares. For the Fund’s most recent month end performance, please call 1-877-843-3831.
The Russell 1000 Value Total Return Index measures the performance of the large-cap value segment of the U.S. equity market. It includes those Russell 1000 companies with lower price-to-book ratios and lower expected and historical growth rates.
11
ADVISORSHARES TRUST
AdvisorShares Focused Equity ETF (CWS)
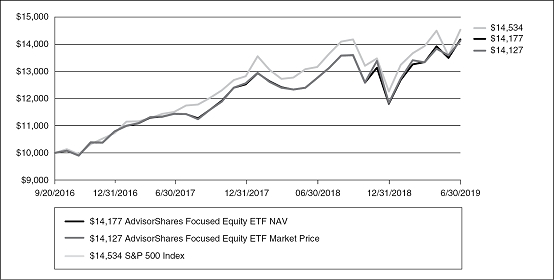
The AdvisorShares Focused Equity ETF (CWS) had solid 12-month performance over the period from July1, 2018 to June30, 2019. The Fund was aided by a healthy economic climate, low unemployment and stable inflation.
In the fourth quarter of 2018, the Fund dropped along with the rest of the stock market as investors recoiled from the Fed’s higher interest rate policy. However, once it became clear that the central bank would hold off on more interest rate hikes, CWS recovered impressively. The Fund continued to rally as it became clear that the Fed was leaning towards cutting interest rates. The ETF made new all-time highs into the middle of 2019. The portfolio was aided by a series of higher-than-expected earnings reports combined with increased guidance. Additionally, the fund’s conservative profile kept daily volatility below that of the overall market.
CWS performed especially well compared with the rest of the market in the spring of 2019. This is due to the Fund’s emphasis on high-quality defensive stocks. The climate is very advantageous for CWS to perform well for the rest of 2019 and into 2020. The U.S. economy continues to show impressive strength. Consumer spending remains robust while the corporate sector has demonstrated some weakness. Our concentrated portfolio is focused on sectors that will thrive even if the economy begins to falter as we head into the eleventh year of the U.S. economic expansion.
HYPOTHETICAL GROWTH OF $10,000 INVESTMENT
For the period September 20, 2016* to June 30, 2019
12
HISTORICAL PERFORMANCE
Total Return as of June 30, 2019
| | 1 Year | | Since
Inception
9/20/2016* |
AdvisorShares Focused Equity ETF NAV | | 11.09 | % | | 13.40 | % |
AdvisorShares Focused Equity ETF Market Price** | | 10.74 | % | | 13.26 | % |
S&P 500 Index | | 10.42 | % | | 14.42 | % |
Performance data quoted represents past performance and is no guarantee of future results. Current performance may be lower or higher than the performance data quoted. Investment return and principal value will fluctuate so that an investor’s shares, when redeemed, may be worth more or less than original cost. Fund NAV returns are calculated using the Fund’s daily 4:00 p.m. NAV. Returns shown include the reinvestment of all dividends and other distributions. Index returns do not include expenses. As stated in the current prospectus, the Fund’s annual operating expense ratio (gross) is 1.39% and the net expense ratio is 0.68%. (Actual expenses can be referenced in the Financial Highlights section later in this report.) The Fund’s advisor has agreed to waive a portion of its fees and/or reimburse expenses to the extent necessary to keep the Fund’s expenses from exceeding 0.75%. Returns less than one year are not annualized. The performance table and graph do not reflect the deduction of taxes that a shareholder would pay on Fund distributions or the redemption of Fund shares. For the Fund’s most recent month end performance, please call 1-877-843-3831.
The S&P 500 Index is a broad-based, unmanaged measurement of changes in stock market conditions based on the average of 500 widely held common stocks. One cannot invest directly in an index.
13
ADVISORSHARES TRUST
AdvisorShares FolioBeyond Smart Core Bond ETF (FWDB)
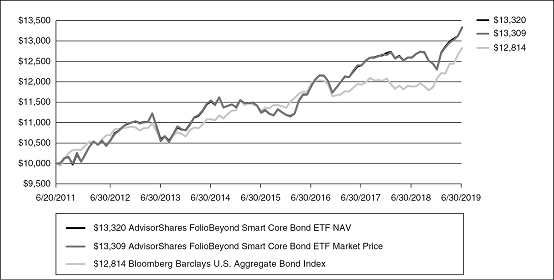
The AdvisorShares FolioBeyond Smart Core Bond ETF (FWDB) returned 5.82%, based on NAV and 5.80%, based on Market Price as compared to 7.87% for the Bloomberg Barclays U.S. Aggregate Bond Index for the 1-year period ended June 30th 2019. The current portfolio team took over management of the Fund on April1, 2019. The Fund was previously known as the AdvisorShares Madrona Global Bond ETF.
FWDB’s positive performance was generated primarily from municipal credit, long duration Treasuries, short-dated high yield corporate credit, and bank loans. The portfolio was rebalanced on average once a month as relative value relationships and other model factors varied over time.
We believe FolioBeyond’s automated asset allocation model is well-positioned to dynamically allocate to the most attractive asset classes in the fixed income markets, subject to constraints for return volatility, risk and subsector exposures. The algorithm optimizes exposure to the major factors that affect performance in the fixed income markets including value, momentum and volatility. Liquidity and tail risk are also captured through stress testing. Given the growth and breadth of large, liquid fixed income index ETFs in the marketplace, FolioBeyond is able to automatically optimize portfolio construction and dynamically rebalance across 20+ subsectors in an effort to extract significant positive alpha over the long run.
HYPOTHETICAL GROWTH OF $10,000 INVESTMENT
For the period June20, 2011* to June 30, 2019
14
HISTORICAL PERFORMANCE
Total Return as of June 30, 2019
| | 1 Year | | 3 Year | | 5 Year | | Since
Inception
6/20/2011* |
AdvisorShares FolioBeyond Smart Core Bond ETF NAV | | 5.82 | % | | 3.85 | % | | 2.95 | % | | 3.64 | % |
AdvisorShares FolioBeyond Smart Core Bond ETF Market Price** | | 5.80 | % | | 3.82 | % | | 2.89 | % | | 3.63 | % |
Bloomberg Barclays U.S. Aggregate Bond Index | | 7.87 | % | | 2.31 | % | | 2.95 | % | | 3.14 | % |
Performance data quoted represents past performance and is no guarantee of future results. Current performance may be lower or higher than the performance data quoted. Investment return and principal value will fluctuate so that an investor’s shares, when redeemed, may be worth more or less than original cost. FundNAV returns are calculated using the Fund’s daily 4:00 p.m. NAV. Returns shown include the reinvestment of all dividends and other distributions. Index returns do not include expenses. As stated in the current prospectus, the Fund’s annual operating expense ratio (gross) is 1.68% and the net expense ratio is 1.41%. (Actual expenses can be referenced in the Financial Highlights section later in this report.) The Fund’s advisor has agreed to waive a portion of its fees and/or reimburse expenses to the extent necessary to keep the Fund’s expenses from exceeding 0.95%. Returns less than one year are not annualized. The performance table and graph do not reflect the deduction of taxes that a shareholder would pay on Fund distributions or the redemption of Fund shares. For the Fund’s most recent month end performance, please call 1-877-843-3831.
Bloomberg Barclays U.S. Aggregate Bond Index measures the performance of the U.S. investment grade bond market. One cannot invest directly in an index.
15
ADVISORSHARES TRUST
AdvisorShares New Tech and Media ETF (FNG)
The AdvisorShares New Tech and Media ETF (FNG) returned-39.39% (NAV) for the fiscal year ended June30, 2019 while the S&P 500 returned 10.42% for the same time frame.
From October1, 2018 through December31, 2018, the Fund lost over 30%, recovered (with the rest of the market) in the first quarter of 2019, but then turned negative again between March and June. The Fund’s turnover was exceptionally high throughout the fiscal year, and we saw a whipsaw effect on a number of trades that were executed throughout the fiscal year. Additionally, the portfolio went through great periods of time without any allocation to the core FANG names and was traded on a more technical rather than fundamental basis.
For these reasons and others, FNG’s portfolio manager was replaced in June 2019 by Scott Freeze, the sub-advisor’s Chief Investment Officer. Upon taking over management duties, Freeze rebalanced FNG’s portfolio to reflect the core values of the Fund, namely holding the “FANG” names, and refocused on long term growth and greater fundamental stock selection. Under the new portfolio manager, FNG’s portfolio has become more concentrated, but also more balanced with a few exceptions.
For example, while Facebook (FB), Amazon (AMZN) and Netflix (NFLX) are well represented, you will see that Alphabet, Inc (GOOG) aka Google, is a very de-minimus percentage of FNG. This is based on portfolio management’s belief that GOOG is currently in a value phase as markets wait to see how the U.S. government’s pressure shakes out. At the same time Trade Desk (TTD) has been added to the portfolio to fill the gap that GOOG may see from decreased ad revenues. Since FB’s planned cryptocurrency project is still far off and isn’t a direct monetization platform, we do not have the same concerns of government intervention or of it having any impact on FB’s stock price or price growth in the near term. So it remains relatively weighted.
We would expect the current fiscal year to show a vastly different management style than the previous year. One with reduced holdings turnover and where portfolio changes are based on fundamental decision-making and company guidance, rather than short term technicals.
HYPOTHETICAL GROWTH OF $10,000 INVESTMENT
For the period July 11, 2017* to June 30, 2019

16
HISTORICAL PERFORMANCE
Total Return as of June 30, 2019
| | 1 Year | | Since
Inception
7/11/2017* |
AdvisorShares New Tech and Media ETF NAV | | -39.39 | % | | -20.11 | % |
AdvisorShares New Tech and Media ETF Market Price** | | -39.89 | % | | -20.43 | % |
S&P 500 Index | | 10.42 | % | | 12.49 | % |
Performance data quoted represents past performance and is no guarantee of future results. Current performance may be lower or higher than the performance data quoted. Investment return and principal value will fluctuate so that an investor’s shares, when redeemed, may be worth more or less than original cost. Fund NAV returns are calculated using the Fund’s daily 4:00 p.m. NAV. Returns shown include the reinvestment of all dividends and other distributions. Index returns do not include expenses. As stated in the current prospectus, the Fund’s annual operating expense ratio (gross) is 1.01% and the net expense ratio is 0.86%. (Actual expenses can be referenced in the Financial Highlights section later in this report.) The Fund’s advisor has agreed to waive a portion of its fees and/or reimburse expenses to the extent necessary to keep the Fund’s expenses from exceeding 0.85%. Returns less than one year are not annualized. The performance table and graph do not reflect the deduction of taxes that a shareholder would pay on Fund distributions or the redemption of Fund shares. For the Fund’s most recent month end performance, please call 1-877-843-3831.
The S&P 500 Index is a broad-based, unmanaged measurement of changes in stock market conditions based on the average of 500 widely held common stocks. One cannot invest directly in an index.
17
ADVISORSHARES TRUST
AdvisorShares Newfleet Multi-Sector Income ETF (MINC)
The AdvisorShares Newfleet Multi-Sector Income ETF (MINC) posted a return of 4.27%, based on NAV and 4.29%, based on Market Price as compared to 7.87% for the Bloomberg Barclays U.S. Aggregate Bond Index or 5.37% for the BofA Merrill Lynch 1-5 Year U.S. Corporate & Government Bond Index for the 1-year period ended June 30th 2019. The indices mentioned are the two that are commonly referenced when comparing MINC’s performance relative to that of the overall bond market.
Positively, MINC benefitted from its multi-sector style of management in its ability to access different sectors of the bond market with domestic corporate High Yield and Investment Grade being the biggest contributors to overall performance. To the downside, although the Securitized sectors (Asset Backed, Residential Mortgage Backed and Commercial Mortgage Backed) delivered positive returns, they all underperformed relative to the benchmark(s). All three of those sectors constitute a large percentage of the portfolio’s weighting whereas the benchmark is more heavily weighted in Agency Mortgage Backed securities and U.S. Treasuries which both posted greater relative returns. With the decrease in rates over the past year, which saw rates decline almost 100 bps on the five year U.S. Treasury, MINC’s shorter duration relative to the benchmark was the largest detractor to performance. Lastly, the Fund’s small allocation to cash, for liquidity purposes, hurt performance as the portfolio would have been off being fully invested.
In the short to intermediate term, we are still constructive on credit spread sectors as the U.S. economy settles into what is commonly referred to as a Goldilocks growth rate of around 2% with little to no inflation present. The Federal Reserve, along with other major Central Banks across the globe, have pivoted towards more accommodation going forward, hoping they can collectively stem off any further weakening that has started to appear in economic data. In other words, the path of interest rates is more likely lower rather than higher moving forward which will have implications for our sector weightings as we transition away from a period where rising rates were the forecasted norm. We continue to like the Securitized sectors of the bond market along with concurrently not being fearful of corporate credit, carefully choosing our spots to invest within the Investment Grade, High Yield and Leveraged Loan sectors. Lastly there could be pockets of opportunity in the Emerging Markets sector, but that will be more focused on a few select opportunities that we screen as being cheap from a relative value perspective.
HYPOTHETICAL GROWTH OF $10,000 INVESTMENT
For the period March 19, 2013* to June 30, 2019

18
HISTORICAL PERFORMANCE
Total Return as of June 30, 2019
| | 1 Year | | 3 Year | | 5 Year | | Since
Inception
3/19/2013* |
AdvisorShares Newfleet Multi-Sector Income
ETF NAV | | 4.27 | % | | 2.47 | % | | 2.16 | % | | 2.22 | % |
AdvisorShares Newfleet Multi-Sector Income
ETF Market Price** | | 4.29 | % | | 2.45 | % | | 2.13 | % | | 2.20 | % |
Bloomberg Barclays Aggregate Bond Index | | 7.87 | % | | 2.31 | % | | 2.95 | % | | 2.67 | % |
BofA Merrill Lynch 1-5 Year U.S. Corporate & Government Bond Index | | 5.37 | % | | 1.75 | % | | 1.85 | % | | 1.66 | % |
Performance data quoted represents past performance and is no guarantee of future results. Currentperformance may be lower or higher than the performance data quoted. Investment return and principal value will fluctuate so that an investor’s shares, when redeemed, may be worth more or less than original cost. Fund NAV returns are calculated using the Fund’s daily 4:00 p.m. NAV. Returns shown include the reinvestment of all dividends and other distributions. Index returns do not include expenses. As stated in the current prospectus, the Fund’s annual operating expense ratio (gross) and net expense ratio is 0.69%. (Actual expenses can be referenced in the Financial Highlights section later in this report.) The Fund’s advisor has agreed to waive a portion of its fees and/or reimburse expenses to the extent necessary to keep the Fund’s expenses from exceeding 0.75%. Returns less than one year are not annualized. The performance table and graph do not reflect the deduction of taxes that a shareholder would pay on Fund distributions or the redemption of Fund shares. For the Fund’s most recent month end performance, please call 1-877-843-3831.
The Bloomberg Barclays Aggregate Bond Index measures the performance of the U.S. investment grade bond market. One cannot invest directly in an index.
The BofA Merrill Lynch 1-5 Year U.S. Corporate & Government Bond Index tracks the performance of US dollar denominated investment grade debt publicly issued in the US domestic market, including US Treasury, US agency, foreign government, supranational and corporate securities, with a remaining term to final maturity less than 5 years, calculated on a total return basis. One cannot invest directly in an index.
19
ADVISORSHARES TRUST
AdvisorShares Pacific Asset Enhanced Floating Rate ETF (FLRT)
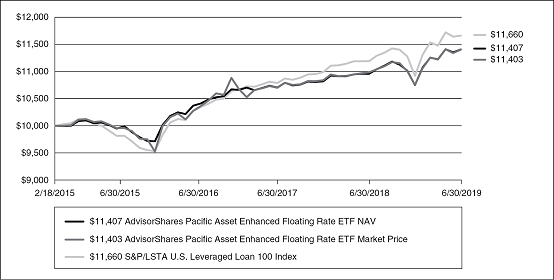
The AdvisorShares Pacific Asset Enhanced Floating Rate ETF (FLRT) returned 3.82% on a market price basis and 4.09% on a NAV basis for the year ended June30, 2019, net of fees. The S&P/LSTA U.S. Leveraged Loan 100 Index gained 4.18%.
The Fund’s portfolio return was driven by our significant overweight to high yield bonds, which provide both increased return potential and liquidity to the portfolio. Security selection within the loan allocation was also a positive contributor to returns. The Retail sector performed well, with Neiman Marcus, Petsmart and Petco all providing strong returns after a difficult period the year before. Restaurants were also positive, driven by Chuck E Cheese and Golden Nugget. Our underweight to the Technology sector was negative for returns, as was our overweight to insurance brokers.
Looking ahead, we have a somewhat cautious outlook for the remainder of 2019. Business disruptions related to trade issues have slowed economic activity, especially in Europe and Asia. However, the U.S. consumer remains in good shape and low unemployment should continue to underpin solid consumer spending. Thus, we have a modestly defensive position in the FLRT portfolio and will look to gradually reduce our exposure to more cyclical names going forward.
HYPOTHETICAL GROWTH OF $10,000 INVESTMENT
For the period February 18, 2015* to June 30, 2019
20
HISTORICAL PERFORMANCE
Total Return as of June 30, 2019
| | 1 Year | | 3 Year | | Since
Inception
2/18/2015* |
AdvisorShares Pacific Asset Enhanced Floating Rate ETF NAV | | 4.09 | % | | 3.74 | % | | 3.06 | % |
AdvisorShares Pacific Asset Enhanced Floating Rate ETF Market Price** | | 3.82 | % | | 4.07 | % | | 3.06 | % |
S&P/LSTA U.S. Leveraged Loan 100 Index | | 4.18 | % | | 4.88 | % | | 3.60 | % |
S&P 500 Index | | 10.42 | % | | 14.19 | % | | 10.28 | % |
Performance data quoted represents past performance and is no guarantee of future results. Current performance may be lower or higher than the performance data quoted. Investment return and principal value will fluctuate so that an investor’s shares, when redeemed, may be worth more or less than original cost. Fund NAV returns are calculated using the Fund’s daily 4:00 p.m. NAV. Returns shown include the reinvestment of all dividends and other distributions. Index returns do not include expenses. As stated in the current prospectus, the Fund’s annual operating expense ratio (gross) is 1.66% and the net expense ratio is 1.14%. (Actual expenses can be referenced in the Financial Highlights section later in this report.) The Fund’s advisor has agreed to waive a portion of its fees and/or reimburse expenses to the extent necessary to keep the Fund’s expenses from exceeding 1.10%. Returns less than one year are not annualized. The performance table and graph do not reflect the deduction of taxes that a shareholder would pay on Fund distributions or the redemption of Fund shares. For the Fund’s most recent month end performance, please call 1-877-843-3831.
The S&P/LSTA U.S. Leveraged Loan 100 Index is designed to track the market-weighted performance of the largest institutional leveraged loans based on market weightings, spreads and interest payments. One cannot invest directly in an index.
The S&P 500 Index is a broad-based, unmanaged measurement of changes in stock market conditions based on the average of 500 widely held common stocks. One cannot invest directly in an index.
Bank Loan: funds that invest primarily in floating-rate bank loans instead of bonds. In exchange for their credit risk, they offer high interest payments that typically float above a common short-term benchmark.
21
ADVISORSHARES TRUST
AdvisorShares Pure Cannabis ETF (YOLO)
The AdvisorShares Pure Cannabis ETF (YOLO) was launched on April17, 2019 and therefore does not have a full 12-month period of performance. For the partial period since inception through June30, 2019, the Fund declined 7.92% based on market return and 8.06% based on Net Asset Value. Cannabis stocks as a whole have been quite negative in this short period since fund launch.
Cannabis stocks are extremely volatile, and individual security selection is extremely important. Positive performance came from one of the Fund’s top holdings in a U.S. based REIT, and from pharmaceutical or biotech companies. In this short period, the Canadian domiciled cannabis cultivators were mostly all negative.
As a specialty area of investing, cannabis stocks as a whole can perform with low correlation to the overall market. Following a sell-off and underperformance mid-2019, we are very bullish on cannabis growth prospects long term, and think they are poised for good performance in the next fiscal year with legislative and market developments. Additionally, as compared to existing competitor marijuana or cannabis funds, we feel that AdvisorShares Pure Cannabis ETF should out-perform in a positive market for cannabis stocks due to our active security selection and pure cannabis exposure.
HISTORICAL PERFORMANCE
Total Return as of June 30, 2019
| | Since
Inception
4/17/2019* |
AdvisorShares Pure Cannabis ETF NAV | | -8.06% |
AdvisorShares Pure Cannabis ETF Market Price** | | -7.92% |
S&P 500 Index | | 1.83% |
Performance data quoted represents past performance and is no guarantee of future results. Current performance may be lower or higher than the performance data quoted. Investment return and principal value will fluctuate so that an investor’s shares, when redeemed, may be worth more or less than original cost. Fund NAV returns are calculated using the Fund’s daily 4:00 p.m. NAV. Returns shown include the reinvestment of all dividends and other distributions. Index returns do not include expenses. As stated in the current prospectus, the Fund’s annual operating expense ratio (gross) and net expense ratio is 0.74%. (Actual expenses can be referenced in the Financial Highlights section later in this report.) The Fund’s advisor has agreed to waive a portion of its fees and/or reimburse expenses to the extent necessary to keep the Fund’s expenses from exceeding 0.74%. Returns less than one year are not annualized. The performance table and graph do not reflect the deduction of taxes that a shareholder would pay on Fund distributions or the redemption of Fund shares. For the Fund’s most recent month end performance, please call 1-877-843-3831.
The S&P 500 Index is a broad-based, unmanaged measurement of changes in stock market conditions based on the average of 500 widely held common stocks. One cannot invest directly in an index.
22
ADVISORSHARES TRUST
AdvisorShares Ranger Equity Bear ETF (HDGE)
For the 12-month period ended June30, 2019, the AdvisorShares Ranger Equity Bear ETF (HDGE) performance based on the NAV and market price were-18.16% and-17.87%, respectively.
After a strong start to the period, performance was negatively impacted by a dramatic and historical rebound in stocks in the first several months of 2019. In particular, low quality stocks out-performed other strategies such as value stocks by a wide margin. As the Fund shorts low quality stocks, the rebound in these securities served as a drag on performance.
In our view, three factors will drive market returns going forward. First, interest rates. Second, trade wars. Third, earnings growth. The focus of the Fund is on individual securities and thus the third factor will play an important role in the Fund’s performance. In particular, earnings growth has been driven by historical stock buybacks in the face of moderating revenue growth and peak profit margins. Identifying companies in a weak position to be able to buy back stock will help performance, in our view. In addition, given the expectations around interest rates, changes in trade policy, and peak profit margins, we expect there to be more volatility than in prior years.
HYPOTHETICAL GROWTH OF $10,000 INVESTMENT
For the period January26, 2011* to June 30, 2019

23
HISTORICAL PERFORMANCE
Total Return as of June 30, 2019
| | 1 Year | | 3 Year | | 5 Year | | Since
Inception
1/26/2011* |
AdvisorShares Ranger Equity Bear ETF NAV | | -18.16 | % | | -15.56 | % | | -11.53 | % | | -14.96 | % |
AdvisorShares Ranger Equity Bear ETF Market Price** | | -17.87 | % | | -15.55 | % | | -11.53 | % | | -14.95 | % |
S&P 500 Index | | 10.42 | % | | 14.19 | % | | 10.71 | % | | 12.55 | % |
Performance data quoted represents past performance and is no guarantee of future results. Current performance may be lower or higher than the performance data quoted. Investment return and principal value will fluctuate so that an investor’s shares, when redeemed, may be worth more or less than original cost. Fund NAV returns are calculated using the Fund’s daily 4:00 p.m. NAV. Returns shown include the reinvestment of all dividends and other distributions. Index returns do not include expenses. As stated in the current prospectus, the Fund’s annual operating expense ratio (gross) and net expense ratio is 2.72%. (Actual expenses can be referenced in the Financial Highlights section later in this report.) The Fund’s advisor has agreed to waive a portion of its fees and/or reimburse expenses to the extent necessary to keep the Fund’s expenses from exceeding 1.85%. Returns less than one year are not annualized. The performance table and graph do not reflect the deduction of taxes that a shareholder would pay on Fund distributions or the redemption of Fund shares. For the Fund’s most recent month end performance, please call 1-877-843-3831.
The S&P 500 Index is a broad-based, unmanaged measurement of changes in stock market conditions based on the average of 500 widely held common stocks. One cannot invest directly in an index.
24
ADVISORSHARES TRUST
AdvisorShares Sabretooth ETF (BKCH)
The AdvisorShares Sabretooth ETF (BKCH) launched on February6, 2019 and performance from inception through June30, 2019 was up 8.16% based on NAV. The S&P 500 returned 8.61% for the same time frame.
The Fund’s allocation has remained fairly balanced since inception and has had de minimus turnover. The initial portfolio was designed to be allocated to approximately 65% cloud securities and 35% blockchain securities. Within the Blockchain allocation, the primary focus was on financials and payment companies as we believe these companies may see an accretive reduction in costs by using blockchain technology. The portfolio was designed for the long term and has the flexibility to add new companies as they enter the market via IPO and warrant inclusion, however, we do not envision the new fiscal year to bring many portfolio changes. Since inception, we added Crowdstrike Holdings (CRWD) – as an IPO – and Service Now (NOW) to the Cloud portion and StoneCo (STNE) into the Blockchain portion of the portfolio.
While both the Cloud and Blockchain portions of the portfolio have had positive performance, the Cloud holdings have outperformed the Blockchain holdings through June30, 2019. We would expect the Cloud holdings to continue to outperform and become the driver for performance during the next twelve months.
HISTORICAL PERFORMANCE
Total Return as of June 30, 2019
| | Since
Inception
2/6/2019* |
AdvisorShares Sabretooth ETF NAV | | 8.16 | % |
AdvisorShares Sabretooth ETF Market Price** | | 8.22 | % |
S&P 500 Index | | 8.61 | % |
Performance data quoted represents past performance and is no guarantee of future results. Current performance may be lower or higher than the performance data quoted. Investment return and principal value will fluctuate so that an investor’s shares, when redeemed, may be worth more or less than original cost. Fund NAV returns are calculated using the Fund’s daily 4:00 p.m. NAV. Returns shown include the reinvestment of all dividends and other distributions. Index returns do not include expenses. As stated in the current prospectus, the Fund’s annual operating expense ratio (gross) is 0.97% and the net expense ratio is 0.85%. (Actual expenses can be referenced in the Financial Highlights section later in this report.) The Fund’s advisor has agreed to waive a portion of its fees and/or reimburse expenses to the extent necessary to keep the Fund’sexpenses from exceeding 0.85%. Returns less than one year are not annualized. The performance table and graph do not reflect the deduction of taxes that a shareholder would pay on Fund distributions or the redemption of Fund shares. For the Fund’s most recent month end performance, please call 1-877-843-3831.
The S&P 500 Index is a broad-based, unmanaged measurement of changes in stock market conditions based on the average of 500 widely held common stocks. One cannot invest directly in an index.
25
ADVISORSHARES TRUST
AdvisorShares Sage Core Reserves ETF (HOLD)
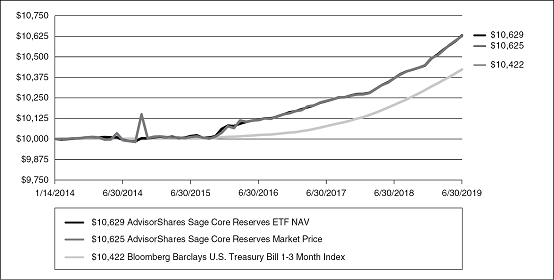
The AdvisorShares Sage Core Reserves ETF (HOLD) had a NAV based return of 2.74% during the one year period ending June30, 2019. This compares to the Bloomberg Barclays 1-3month T-bill Index, which returned 2.27% during the same time period.
The outperformance of the Fund was driven by both excess carry and slightly longer duration. The excess carry was achieved through the use of sectors outside the Bloomberg Barclays 1-3month T-bill Index, including corporate credit, asset-backed securities, and agency mortgage backed securities (MBS). Within each of these sectors there was a small allocation to floating rate securities which benefited from rising rates in the second half of 2018. The duration on the Fund was increased in the first part of 2019 in expectation of the Federal Reserve’s inability to hike rates as expected. This slightly longer duration benefited the Fund as rates declined significantly in the second quarter.
While the start of 2019 was flush with expectations for Fed rate hikes, things have played out much differently. Due to deteriorating economic conditions, the market is now pricing in multiple rate cuts during the remainder of 2019, which has caused a significant rally in rates across the curve. Risk assets have also benefited from both lower rates in the U.S. and, more broadly, the large amount of negative yielding debt worldwide. Rate cuts from the Fed will likely continue to drive risk assets tighter, at least in the near term. As the remainder of 2019 unfolds, it will be important to monitor economic changes and their implications on central bank policy, which may prove to be the primary driver of returns.
HYPOTHETICAL GROWTH OF $10,000 INVESTMENT
For the period January 14, 2014* to June 30, 2019
26
HISTORICAL PERFORMANCE
Total Return as of June 30, 2019
| | 1 Year | | 3 Year | | 5 Year | | Since
Inception
1/14/2014* |
AdvisorShares Sage Core Reserves ETF NAV | | 2.74 | % | | 1.74 | % | | 1.21 | % | | 1.13 | % |
AdvisorShares Sage Core Reserves ETF Market Price** | | 2.74 | % | | 1.65 | % | | 1.20 | % | | 1.12 | % |
Bloomberg Barclays U.S. Treasury Bill 1-3 Month Index | | 2.27 | % | | 1.33 | % | | 0.83 | % | | 0.76 | % |
Performance data quoted represents past performance and is no guarantee of future results. Current performance may be lower or higher than the performance data quoted. Investment return and principal value will fluctuate so that an investor’s shares, when redeemed, may be worth more or less than original cost. Fund NAV returns are calculated using the Fund’s daily 4:00 p.m. NAV. Returns shown include the reinvestment of all dividends and other distributions. Index returns do not include expenses. As stated in the current prospectus, the Fund’s annual operating expense ratio (gross) is 0.65% and the net expense ratio is 0.35%. (Actual expenses can be referenced in the Financial Highlights section later in this report.) The Fund’s advisor has agreed to waive a portion of its fees and/or reimburse expenses to the extent necessary to keep the Fund’s expenses from exceeding 0.35%. Returns less than one year are not annualized. The performance table and graph do not reflect the deduction of taxes that a shareholder would pay on Fund distributions or the redemption of Fund shares. For the Fund’s most recent month end performance, please call 1-877-843-3831.
The Bloomberg Barclays U.S. Treasury Bill 1-3 Month Index includes all publicly issued zero-coupon U.S. Treasury Bills that have a remaining maturity of less than 3months and more than 1month, are rated investment grade, and have $250million or more of outstanding face value. The Bloomberg Barclays U.S. 1-3 Month Treasury Bill Index is an unmanaged index considered representative of the performance of the U.S. Treasury Bill issued by the U.S. Government. One cannot invest directly in an index.
27
ADVISORSHARES TRUST
AdvisorShares STAR Global Buy-Write ETF (VEGA)
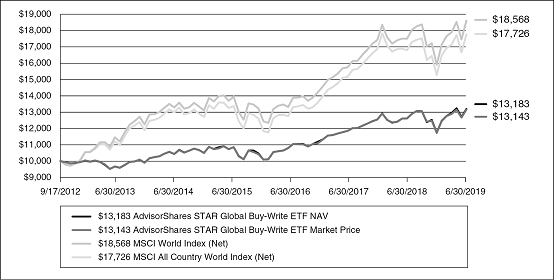
The AdvisorShares STAR Global Buy-Write ETF (VEGA) had a return of 4.62%, for NAV and 4.27%, for market price for the year ended June30, 2019. This compares to the returns of the MSCI World Index (net) of 6.33%, the MSCI ACWI Index (net) of 5.74%, the CBOE S&P 500 BuyWrite Index of 3.18% and the Bloomberg Barclays U.S. Aggregate Bond Index of 7.87%. While VEGA is global in nature, it has maintained a steady overweight in U.S. equities for some time now and VEGA’s outperformance versus the CBOE S&P 500 BuyWrite is significant during the period. The benchmarks referenced are given because each represents a component of VEGA’s strategy, though no one benchmark encapsulates the Fund’s strategy in its entirety.
VEGA was able to add alpha to performance through the use of option strategies in the portfolio. Specifically, using dynamic Covered Call writing, Protective Put usage and Volatility-Based Reinvestment. Those three differentiators were pivotal in VEGA’s performance, particularly in the Fourth Quarter of 2018, in which the Protective Puts were sold for gains twice and the Fund’s underlying portfolio was rebuilt by repurchasing back into the market when it was in decline. Those actions coupled with the continue Covered Call writing and dynamic hedging use, which allowed for price appreciation, were the contributing factors to VEGA’s performance during the period.
In the short to intermediate time horizon, we believe volatility will play a large factor in both the Equity and Fixed Income markets. This is why, after March 2019, we de-risked the portfolio, sidelining a portion of U.S. equity and non-U.S. equity positions into cash and keeping our Fixed Income duration low. As the market navigates the period ahead, we will look to the CBOE Volatility Index (VIX) for opportune moments of reinvestment back into the underlying portfolio. As we believe the Fixed Income market has overshot itself and will need to concede some of the recent gains, we expect to continue to target low duration for the Fixed Income portion of the portfolio.
HYPOTHETICAL GROWTH OF $10,000 INVESTMENT
For the period September 17, 2012* to June 30, 2019
28
HISTORICAL PERFORMANCE
Total Return as of June 30, 2019
| | 1 Year | | 3 Year | | 5 Year | | Since
Inception
9/17/2012* |
AdvisorShares STAR Global Buy-Write ETF NAV | | 4.62 | % | | 6.89 | % | | 4.54 | % | | 4.16 | % |
AdvisorShares STAR Global Buy-Write ETF Market Price** | | 4.27 | % | | 6.80 | % | | 4.45 | % | | 4.11 | % |
MSCI World Index (Net) | | 6.33 | % | | 11.77 | % | | 6.60 | % | | 9.55 | % |
MSCI All Country World Index (Net) | | 5.74 | % | | 11.62 | % | | 6.16 | % | | 8.80 | % |
Performance data quoted represents past performance and is no guarantee of future results. Current performance may be lower or higher than the performance data quoted. Investment return and principal value will fluctuate so that an investor’s shares, when redeemed, may be worth more or less than original cost. FundNAV returns are calculated using the Fund’s daily 4:00 p.m. NAV. Returns shown include the einvestment of all dividends and other distributions. Index returns do not include expenses. As stated in the current prospectus, the Fund’s annual operating expense ratio (gross) is 2.39% and the net expense ratio is 2.06%. (Actual expenses can be referenced in the Financial Highlights section later in this report.) The Fund’s advisor has agreed to waive a portion of its fees and/or reimburse expenses to the extent necessary to keep the Fund’s expenses from exceeding 1.85%. Returns less than one year are not annualized. The performance table and graph do not reflect the deduction of taxes that a shareholder would pay on Fund distributions or the redemption of Fund shares. For the Fund’s most recent month end performance, please call 1-877-843-3831.
The MSCI World Index (Net) is a free float-adjusted market capitalization weighted index that is designed to measure the equity market performance of developed markets. One cannot invest directly in an index.
The MSCI All Country World Index (Net) is an unmanaged free float-adjusted market capitalization weighted index that is designed to measure the equity market performance of developed and emerging markets. One cannot invest directly in an index.
29
ADVISORSHARES TRUST
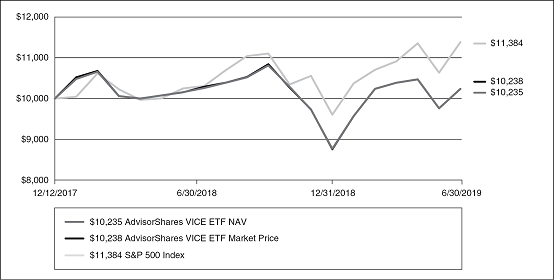
AdvisorShares Vice ETF (ACT)
The AdvisorShares Vice ETF (ACT) was launched with an inception date of December12, 2017. It now has a full fiscal year period of performance for the first time. For the 12-month timeframe July1, 2018 through June30, 2019, the Fund returned-0.50% market return and-0.22% based on Net Asset Value. During the same timeframe, the Standard & Poor’s 500 Index returned was positive. In the first 6months of 2019, the Fund had good gains of 16.95% market return and 16.70% on its Net Asset Value.
ACT focuses primarily on alcohol, tobacco and cannabis-related stocks. Its performance is subject in large part to the overall performance of those areas, although we aim for outperformance relative to those areas through good individual security selection and successful trading techniques. Top contributors to performance came primarily from certain alcohol producers and sellers, cannabis-related pharmaceutical or healthcare companies, and two particular tobacco companies overlapping seriously into cannabis that we have highly weighted.
On the other hand, the primary drag to performance was caused by the largest tobacco companies, known as “big tobacco”, particularly in the last half of 2018 when tobacco stock prices dropped very uncharacteristically. While everyone knows tobacco use continues to fall, tobacco company products remain wildly profitable, and the stocks themselves usually act very steady and dependable.
The overall market has continued in an extended bull market, and we should not expect “vice stocks” to keep up with technology-heavy growth stocks in an up market. In negative or stagnant markets, alcohol and tobacco stocks can often look attractive and show their “market-resistant” qualities. Cannabis-related stocks (as compared to actual cannabis growers and sellers), continue to show growth promise. We expect ACT to normally perform much like it has in early 2019, rather than its unusual underperformance in late 2018.
HYPOTHETICAL GROWTH OF $10,000 INVESTMENT
For the period December 12, 2017* to June 30, 2019
30
HISTORICAL PERFORMANCE
Total Return as of June 30, 2019
| | 1 Year | | Since
Inception
12/12/2017* |
AdvisorShares VICE ETF NAV | | -0.22 | % | | 1.51 | % |
AdvisorShares VICE ETF Market Price** | | -0.50 | % | | 1.53 | % |
S&P 500 Index | | 10.42 | % | | 8.73 | % |
Performance data quoted represents past performance and is no guarantee of future results. Current performance may be lower or higher than the performance data quoted. Investment return and principal value will fluctuate so that an investor’s shares, when redeemed, may be worth more or less than original cost. Fund NAV returns are calculated using the Fund’s daily 4:00 p.m. NAV. Returns shown include the reinvestment of all dividends and other distributions. Index returns do not include expenses. As stated in the current prospectus, the Fund’s annual operating expense ratio (gross) is 2.18% and the net expense ratio is 0.75%. (Actual expenses can be referenced in the Financial Highlights section later in this report.) The Fund’s advisor has agreed to waive a portion of its fees and/or reimburse expenses to the extent necessary to keep the Fund’s expenses from exceeding 0.75%. Returns less than one year are not annualized. The performance table and graph do not reflect the deduction of taxes that a shareholder would pay on Fund distributions or the redemption of Fund shares. For the Fund’s most recent month end performance, please call 1-877-843-3831.
The S&P 500 Index is a broad-based, unmanaged measurement of changes in stock market conditions based on the average of 500 widely held common stocks. One cannot invest directly in an index.
31
ADVISORSHARES TRUST
Shareholder Expense Examples
As a shareholder of the Fund, you incur transaction cost and ongoing costs, including management fees and other Fund expenses. The following example is intended to help you understand your ongoing costs (in dollars and cents) of investing in the Fund and to compare these costs with the ongoing costs of investing in other funds. The examples are based on an initial investment of $1,000 invested at January1, 2019 and held for the period ended June30, 2019.
Actual Expenses
The first line under each Fund in the table below provides information about actual account values and actual expenses. You may use the information, together with the amount you invested, to estimate the expenses that you incurred over the period. Simply divide your account value by $1,000 (for example, an $8,600 account value divided by $1,000 = 8.6), then multiply the result by the number under the heading entitled “Expenses Paid” to estimate the expenses attributable to your account during this period.
Hypothetical Example for Comparison Purposes
The second line under each Fund in the table provides information about hypothetical account values and hypothetical expenses based on the Fund’s actual expense ratio and an assumed rate of return of 5% per year before expenses, which is not the Fund’s actual return. The hypothetical account values and expenses may not be used to estimate the actual ending account balance or expenses for the period. You may use this information to compare the ongoing costs of investing in the Funds and other ETF funds. To do so, compare this 5% hypothetical example with the 5% hypothetical examples that appear in the shareholder reports of other funds.
Please note that the expenses shown in the table are meant to highlight your ongoing costs only and do not reflect any transactional costs. Therefore, the hypothetical example is useful in comparing ongoing costs only, and will not help you determine the relative total costs of owning different funds.
In addition, if these transactional costs were included, your costs would have been higher.
Fund Name | | Beginning
Account Value
1/1/2019 | | Ending
Account Value
6/30/2019 | | Annualized
Expense
Ratiofor
the Period | | Expenses
Paid(1) |
AdvisorShares Cornerstone Small Cap ETF | | | | | | | | | | | |
Actual | | $ | 1,000.00 | | $ | 1,141.00 | | 0.90% | | $ | 4.78 |
Hypothetical (assuming a 5% return before expenses) | | $ | 1,000.00 | | $ | 1,020.33 | | 0.90% | | $ | 4.51 |
AdvisorShares Dorsey Wright ADR ETF | | | | | | | | | | | |
Actual | | $ | 1,000.00 | | $ | 1,245.80 | | 0.88% | | $ | 4.90 |
Hypothetical (assuming a 5% return before expenses) | | $ | 1,000.00 | | $ | 1,020.43 | | 0.88% | | $ | 4.41 |
AdvisorShares Dorsey Wright Micro-Cap ETF | | | | | | | | | | | |
Actual | | $ | 1,000.00 | | $ | 1,222.20 | | 0.99% | | $ | 5.45 |
Hypothetical (assuming a 5% return before expenses) | | $ | 1,000.00 | | $ | 1,019.89 | | 0.99% | | $ | 4.96 |
AdvisorShares Dorsey Wright Short ETF | | | | | | | | | | | |
Actual | | $ | 1,000.00 | | $ | 816.50 | | 0.99% | | $ | 4.46 |
Hypothetical (assuming a 5% return before expenses) | | $ | 1,000.00 | | $ | 1,019.89 | | 0.99% | | $ | 4.96 |
AdvisorShares DoubleLine Value Equity ETF | | | | | | | | | | | |
Actual | | $ | 1,000.00 | | $ | 1,151.00 | | 0.90% | | $ | 4.80 |
Hypothetical (assuming a 5% return before expenses) | | $ | 1,000.00 | | $ | 1,020.33 | | 0.90% | | $ | 4.51 |
32
ADVISORSHARES TRUST
Shareholder Expense Examples (continued)
Fund Name | | Beginning
Account Value
1/1/2019 | | Ending
Account Value
6/30/2019 | | Annualized
Expense
Ratiofor
the Period | | Expenses
Paid(1) |
AdvisorShares Focused Equity ETF | | | | | | | | | | | | |
Actual | | $ | 1,000.00 | | $ | 1,200.40 | | 0.74% | | $ | 4.04 | |
Hypothetical (assuming a 5% return before expenses) | | $ | 1,000.00 | | $ | 1,021.12 | | 0.74% | | $ | 3.71 | |
AdvisorShares FolioBeyond Smart Core Bond ETF(4) | | | | | | | | | | | | |
Actual | | $ | 1,000.00 | | $ | 1,083.00 | | 0.95% | | $ | 4.91 | |
Hypothetical (assuming a 5% return before expenses) | | $ | 1,000.00 | | $ | 1,020.08 | | 0.95% | | $ | 4.76 | |
AdvisorShares New Tech and Media ETF | | | | | | | | | | | | |
Actual | | $ | 1,000.00 | | $ | 823.20 | | 0.85% | | $ | 3.84 | |
Hypothetical (assuming a 5% return before expenses) | | $ | 1,000.00 | | $ | 1,020.58 | | 0.85% | | $ | 4.26 | |
AdvisorShares Newfleet Multi-Sector Income ETF | | | | | | | | | | | | |
Actual | | $ | 1,000.00 | | $ | 1,037.70 | | 0.75% | | $ | 3.79 | |
Hypothetical (assuming a 5% return before expenses) | | $ | 1,000.00 | | $ | 1,021.08 | | 0.75% | | $ | 3.76 | |
AdvisorShares Pacific Asset Enhanced Floating Rate ETF | | | | | | | | | | | | |
Actual | | $ | 1,000.00 | | $ | 1,061.30 | | 1.10% | | $ | 5.62 | |
Hypothetical (assuming a 5% return before expenses) | | $ | 1,000.00 | | $ | 1,019.34 | | 1.10% | | $ | 5.51 | |
AdvisorShares Pure Cannabis ETF | | | | | | | | | | | | |
Actual | | $ | 1,000.00 | | $ | 919.40 | | 0.74% | | $ | 1.44 | (2) |
Hypothetical (assuming a 5% return before expenses) | | $ | 1,000.00 | | $ | 1,021.12 | | 0.74% | | $ | 3.71 | |
AdvisorShares Ranger Equity Bear ETF | | | | | | | | | | | | |
Actual | | $ | 1,000.00 | | $ | 757.60 | | 1.73% | | $ | 7.54 | |
Hypothetical (assuming a 5% return before expenses) | | $ | 1,000.00 | | $ | 1,016.22 | | 1.73% | | $ | 8.65 | |
AdvisorShares Sabretooth ETF | | | | | | | | | | | | |
Actual | | $ | 1,000.00 | | $ | 1,081.60 | | 0.85% | | $ | 3.49 | (3) |
Hypothetical (assuming a 5% return before expenses) | | $ | 1,000.00 | | $ | 1,020.58 | | 0.85% | | $ | 4.26 | |
AdvisorShares Sage Core Reserves ETF | | | | | | | | | | | | |
Actual | | $ | 1,000.00 | | $ | 1,017.50 | | 0.35% | | $ | 1.75 | |
Hypothetical (assuming a 5% return before expenses) | | $ | 1,000.00 | | $ | 1,023.06 | | 0.35% | | $ | 1.76 | |
AdvisorShares STAR Global Buy-Write ETF(4) | | | | | | | | | | | | |
Actual | | $ | 1,000.00 | | $ | 1,123.20 | | 1.85% | | $ | 9.74 | |
Hypothetical (assuming a 5% return before expenses) | | $ | 1,000.00 | | $ | 1,015.62 | | 1.85% | | $ | 9.25 | |
AdvisorShares Vice ETF | | | | | | | | | | | | |
Actual | | $ | 1,000.00 | | $ | 1,167.00 | | 0.75% | | $ | 4.03 | |
Hypothetical (assuming a 5% return before expenses) | | $ | 1,000.00 | | $ | 1,021.08 | | 0.75% | | $ | 3.76 | |
33
ADVISORSHARES CORNERSTONE SMALL CAP ETF
Schedule of Investments June30, 2019 |
Investments | | Shares | | Value |
COMMON STOCKS — 100.7% |
Aerospace/Defense — 0.3% | | | | | |
AeroVironment, Inc.*(a) | | 237 | | $ | 13,455 |
Airlines — 1.6% | | | | | |
SkyWest, Inc. | | 1,043 | | | 63,279 |
Spirit Airlines, Inc.* | | 368 | | | 17,564 |
Total Airlines | | | | | 80,843 |
Apparel — 0.3% | | | | | |
Crocs, Inc.*(a) | | 729 | | | 14,398 |
Auto Parts & Equipment — 0.4% |
Methode Electronics, Inc. | | 739 | | | 21,113 |
Banks — 6.8% | | | | | |
Cadence BanCorp | | 902 | | | 18,762 |
Community Trust Bancorp, Inc. | | 436 | | | 18,438 |
Eagle Bancorp, Inc. | | 549 | | | 29,717 |
First BanCorp (Puerto Rico) | | 2,319 | | | 25,602 |
First Bancorp/Southern Pines NC | | 523 | | | 19,048 |
First Financial Corp. | | 406 | | | 16,305 |
First Mid Bancshares, Inc. | | 426 | | | 14,876 |
Flagstar Bancorp, Inc. | | 539 | | | 17,862 |
Great Southern Bancorp, Inc. | | 349 | | | 20,888 |
Live Oak Bancshares, Inc. | | 1,107 | | | 18,985 |
Metropolitan Bank Holding Corp.* | | 448 | | | 19,712 |
National Bank Holdings Corp., Class A | | 477 | | | 17,315 |
Nicolet Bankshares, Inc.* | | 384 | | | 23,831 |
OFG Bancorp (Puerto Rico) | | 1,274 | | | 30,283 |
PCSB Financial Corp. | | 1,113 | | | 22,538 |
TriState Capital Holdings, Inc.* | | 1,097 | | | 23,410 |
Total Banks | | | | | 337,572 |
Beverages — 0.8% | | | | | |
Boston Beer Co., Inc. (The), Class A*(a) | | 59 | | | 22,288 |
MGP Ingredients, Inc.(a) | | 291 | | | 19,296 |
Total Beverages | | | | | 41,584 |
Biotechnology — 4.8% | | | | | |
Acorda Therapeutics, Inc.*(a) | | 710 | | | 5,446 |
Arcus Biosciences, Inc.*(a) | | 1,899 | | | 15,097 |
Arena Pharmaceuticals, Inc.* | | 486 | | | 28,494 |
Halozyme Therapeutics, Inc.* | | 1,131 | | | 19,431 |
Innoviva, Inc.*(a) | | 1,262 | | | 18,375 |
Ligand Pharmaceuticals, Inc.*(a) | | 122 | | | 13,926 |
Myriad Genetics, Inc.*(a) | | 659 | | | 18,307 |
NeoGenomics, Inc.*(a) | | 1,156 | | | 25,363 |
NuCana PLC (UnitedKingdom)*(a)(b) | | 1,353 | | | 14,044 |
Investments | | Shares | | Value |
COMMON STOCKS(continued) |
Biotechnology(continued) | | | | | |
PDL BioPharma, Inc.* | | 6,260 | | $ | 19,656 |
Veracyte, Inc.* | | 1,020 | | | 29,080 |
Zymeworks, Inc. (Canada)* | | 1,434 | | | 31,548 |
Total Biotechnology | | | | | 238,767 |
Building Materials — 0.9% | | | | | |
Caesarstone Ltd. | | 1,273 | | | 19,133 |
Gibraltar Industries, Inc.* | | 586 | | | 23,651 |
Total Building Materials | | | | | 42,784 |
Chemicals — 2.0% | | | | | |
Balchem Corp. | | 189 | | | 18,894 |
Innospec, Inc. | | 221 | | | 20,164 |
Intrepid Potash, Inc.* | | 5,801 | | | 19,492 |
Materion Corp. | | 342 | | | 23,191 |
Rogers Corp.* | | 104 | | | 17,948 |
Total Chemicals | | | | | 99,689 |
Coal — 0.3% | | | | | |
Natural Resource Partners LP | | 454 | | | 16,099 |
Commercial Services — 5.1% | | | | | |
2U, Inc.*(a) | | 451 | | | 16,976 |
Adtalem Global Education, Inc.* | | 280 | | | 12,614 |
Barrett Business Services, Inc. | | 210 | | | 17,346 |
Cardtronics PLC, Class A* | | 549 | | | 14,999 |
Career Education Corp.* | | 1,294 | | | 24,677 |
FTI Consulting, Inc.* | | 266 | | | 22,301 |
Heidrick & Struggles International, Inc. | | 472 | | | 14,146 |
HMS Holdings Corp.* | | 869 | | | 28,147 |
Kelly Services, Inc., Class A | | 745 | | | 19,512 |
LiveRamp Holdings, Inc.* | | 362 | | | 17,550 |
Medifast, Inc. | | 95 | | | 12,188 |
Rent-A-Center, Inc.* | | 1,053 | | | 28,041 |
Rosetta Stone, Inc.* | | 1,006 | | | 23,017 |
Total Commercial Services | | | | | 251,514 |
Computers — 4.3% | | | | | |
Carbon Black, Inc.* | | 1,070 | | | 17,890 |
Endava PLC (United Kingdom)*(b) | | 837 | | | 33,681 |
Globant SA (Argentina)* | | 212 | | | 21,423 |
Insight Enterprises, Inc.* | | 390 | | | 22,698 |
OneSpan, Inc.* | | 1,106 | | | 15,672 |
Qualys, Inc.*(a) | | 348 | | | 30,304 |
Rapid7, Inc.*(a) | | 448 | | | 25,912 |
Stratasys Ltd.*(a) | | 862 | | | 25,317 |
Tenable Holdings, Inc.* | | 717 | | | 20,463 |
Total Computers | | | | | 213,360 |
See accompanying Notes to Financial Statements.
34
ADVISORSHARES CORNERSTONE SMALL CAP ETF
Schedule of Investments (continued) June30, 2019 |
Investments | | Shares | | Value |
COMMON STOCKS(continued) |
Cosmetics/Personal Care — 0.5% |
Inter Parfums, Inc. | | 358 | | $ | 23,803 |
Distribution/Wholesale — 1.3% |
Core-Mark Holding Co., Inc. | | 608 | | | 24,150 |
Fossil Group, Inc.*(a) | | 798 | | | 9,177 |
G-III Apparel Group Ltd.*(a) | | 443 | | | 13,033 |
Triton International Ltd. (Bermuda) | | 488 | | | 15,987 |
Total Distribution/Wholesale | | | | | 62,347 |
Diversified Financial Services — 2.5% |
Blucora, Inc.* | | 690 | | | 20,955 |
Columbia Financial, Inc.* | | 1,166 | | | 17,607 |
Encore Capital Group, Inc.*(a) | | 435 | | | 14,733 |
Jianpu Technology, Inc. (China)*(b) | | 3,694 | | | 13,816 |
Navient Corp.(a) | | 1,519 | | | 20,734 |
Nelnet, Inc., Class A | | 307 | | | 18,180 |
Waddell & Reed Financial, Inc., Class A | | 1,065 | | | 17,754 |
Total Diversified Financial Services | | | | | 123,779 |
Electric — 1.4% | | | | | |
Ameresco, Inc., Class A* | | 1,622 | | | 23,892 |
El Paso Electric Co. | | 339 | | | 22,171 |
PNM Resources, Inc. | | 475 | | | 24,182 |
Total Electric | | | | | 70,245 |
Electrical Components & Equipment — 1.3% |
Encore Wire Corp. | | 355 | | | 20,796 |
Novanta, Inc.* | | 265 | | | 24,989 |
Powell Industries, Inc. | | 494 | | | 18,772 |
Total Electrical Components & Equipment | | | | | 64,557 |
Electronics — 3.7% | | | | | |
Alarm.com Holdings, Inc.*(a) | | 507 | | | 27,125 |
Brady Corp., Class A | | 437 | | | 21,553 |
Comtech Telecommunications Corp. | | 1,014 | | | 28,504 |
Fitbit, Inc., Class A*(a) | | 3,665 | | | 16,126 |
KEMET Corp.(a) | | 1,070 | | | 20,127 |
Napco Security Technologies,Inc.*(a) | | 1,052 | | | 31,223 |
Sanmina Corp.* | | 616 | | | 18,652 |
Vishay Precision Group, Inc.* | | 464 | | | 18,852 |
Total Electronics | | | | | 182,162 |
Energy – Alternate Sources — 0.4% |
Clean Energy Fuels Corp.* | | 6,523 | | | 17,416 |
Investments | | Shares | | Value |
COMMON STOCKS(continued) |
Engineering & Construction — 2.6% |
Arcosa, Inc. | | 708 | | $ | 26,642 |
Construction Partners, Inc., Class A* | | 1,314 | | | 19,736 |
Exponent, Inc. | | 560 | | | 32,783 |
Great Lakes Dredge & Dock Corp.* | | 2,627 | | | 29,002 |
MYR Group, Inc.* | | 615 | | | 22,970 |
Total Engineering & Construction | | | | | 131,133 |
Entertainment — 0.7% | | | | | |
Everi Holdings, Inc.* | | 1,648 | | | 19,661 |
IMAX Corp.* | | 787 | | | 15,897 |
Total Entertainment | | | | | 35,558 |
Food — 1.3% | | | | | |
Cal-Maine Foods, Inc. | | 437 | | | 18,232 |
John B Sanfilippo & Son, Inc. | | 235 | | | 18,727 |
Sanderson Farms, Inc. | | 177 | | | 24,171 |
United Natural Foods, Inc.*(a) | | 459 | | | 4,117 |
Total Food | | | | | 65,247 |
Hand/Machine Tools — 0.4% | | | | | |
Kennametal, Inc. | | 496 | | | 18,347 |
Healthcare – Products — 6.0% |
Cardiovascular Systems, Inc.*(a) | | 566 | | | 24,298 |
CONMED Corp. | | 310 | | | 26,527 |
Genomic Health, Inc.* | | 250 | | | 14,543 |
Lantheus Holdings, Inc.* | | 899 | | | 25,442 |
LeMaitre Vascular, Inc.(a) | | 675 | | | 18,887 |
Merit Medical Systems, Inc.*(a) | | 849 | | | 50,566 |
OraSure Technologies, Inc.* | | 2,169 | | | 20,128 |
Orthofix Medical, Inc.* | | 319 | | | 16,869 |
Oxford Immunotec Global PLC* | | 1,203 | | | 16,553 |
Repligen Corp.* | | 296 | | | 25,441 |
Surmodics, Inc.* | | 466 | | | 20,117 |
Tactile Systems Technology, Inc.*(a) | | 660 | | | 37,567 |
Total Healthcare – Products | | | | | 296,938 |
Healthcare – Services — 2.1% | | | | | |
Ensign Group, Inc. (The) | | 438 | | | 24,931 |
LHC Group, Inc.* | | 322 | | | 38,505 |
Providence Service Corp. (The)* | | 274 | | | 15,711 |
Tivity Health, Inc.*(a) | | 582 | | | 9,568 |
Triple-S Management Corp., Class B (Puerto Rico)* | | 678 | | | 16,170 |
Total Healthcare – Services | | | | | 104,885 |
See accompanying Notes to Financial Statements.
35
ADVISORSHARES CORNERSTONE SMALL CAP ETF
Schedule of Investments (continued) June30, 2019 |
Investments | | Shares | | Value |
COMMON STOCKS(continued) |
Home Builders — 0.8% | | | | | |
LCI Industries(a) | | 210 | | $ | 18,900 |
Taylor Morrison Home Corp.* | | 893 | | | 18,717 |
Total Home Builders | | | | | 37,617 |
Home Furnishings — 0.7% | | | | | |
Ethan Allen Interiors, Inc. | | 818 | | | 17,227 |
iRobot Corp.*(a) | | 175 | | | 16,037 |
Total Home Furnishings | | | | | 33,264 |
Household Products/Wares — 0.4% |
Central Garden & Pet Co.*(a) | | 706 | | | 19,027 |
Insurance — 2.3% | | | | | |
Argo Group International Holdings Ltd. | | 329 | | | 24,363 |
FGL Holdings | | 2,076 | | | 17,438 |
NMI Holdings, Inc., Class A* | | 1,070 | | | 30,377 |
Safety Insurance Group, Inc. | | 252 | | | 23,973 |
White Mountains Insurance Group Ltd. | | 19 | | | 19,408 |
Total Insurance | | | | | 115,559 |
Internet — 3.2% | | | | | |
1-800-Flowers.com, Inc.,
Class A* | | 1,243 | | | 23,468 |
FireEye, Inc.*(a) | | 1,152 | | | 17,061 |
Meet Group, Inc. (The)*(a) | | 4,096 | | | 14,254 |
Perficient, Inc.* | | 858 | | | 29,446 |
Rubicon Project, Inc. (The)* | | 3,061 | | | 19,468 |
Sogou, Inc. (China)*(a)(b) | | 3,857 | | | 15,814 |
Stitch Fix, Inc., Class A*(a) | | 716 | | | 22,905 |
Yelp, Inc.*(a) | | 465 | | | 15,894 |
Total Internet | | | | | 158,310 |
Iron/Steel — 0.4% | | | | | |
Schnitzer Steel Industries, Inc., Class A | | 743 | | | 19,444 |
Leisure Time — 3.5% | | | | | |
Clarus Corp. | | 1,846 | | | 26,656 |
Fox Factory Holding Corp.*(a) | | 616 | | | 50,826 |
Johnson Outdoors, Inc., Class A | | 226 | | | 16,853 |
Lindblad Expeditions Holdings, Inc.* | | 1,139 | | | 20,445 |
Malibu Boats, Inc., Class A* | | 438 | | | 17,017 |
Marine Products Corp. | | 1,280 | | | 19,763 |
YETI Holdings, Inc.*(a) | | 737 | | | 21,336 |
Total Leisure Time | | | | | 172,896 |
Investments | | Shares | | Value |
COMMON STOCKS(continued) |
Machinery – Diversified — 1.7% |
Alamo Group, Inc. | | 221 | | $ | 22,085 |
Chart Industries, Inc.* | | 458 | | | 35,211 |
CSW Industrials, Inc. | | 390 | | | 26,578 |
Total Machinery - Diversified | | | | | 83,874 |
Media — 0.3% | | | | | |
Tribune Publishing Co. | | 1,727 | | | 13,764 |
Miscellaneous Manufacturing — 3.2% |
American Outdoor Brands Corp.* | | 1,398 | | | 12,596 |
Axon Enterprise, Inc.* | | 304 | | | 19,520 |
ESCO Technologies, Inc. | | 335 | | | 27,678 |
Fabrinet (Thailand)* | | 367 | | | 18,229 |
Federal Signal Corp. | | 758 | | | 20,276 |
John Bean Technologies Corp.(a) | | 351 | | | 42,516 |
Myers Industries, Inc. | | 1,036 | | | 19,964 |
Total Miscellaneous Manufacturing | | | | | 160,779 |
Office Furnishings — 0.4% | | | | | |
Herman Miller, Inc. | | 489 | | | 21,858 |
Oil & Gas — 1.4% | | | | | |
Antero Resources Corp.*(a) | | 2,539 | | | 14,041 |
CNX Resources Corp.* | | 1,257 | | | 9,189 |
Montage Resources Corp.* | | 1,759 | | | 10,730 |
Par Pacific Holdings, Inc.* | | 1,276 | | | 26,183 |
PDC Energy, Inc.*(a) | | 266 | | | 9,592 |
Total Oil & Gas | | | | | 69,735 |
Oil & Gas Services — 2.7% | | | | | |
Archrock, Inc. | | 2,241 | | | 23,755 |
C&J Energy Services, Inc.* | | 1,258 | | | 14,819 |
DMC Global, Inc. | | 260 | | | 16,471 |
Dril-Quip, Inc.*(a) | | 491 | | | 23,568 |
Helix Energy Solutions Group, Inc.* | | 2,391 | | | 20,634 |
McDermott International, Inc.*(a) | | 891 | | | 8,607 |
USA Compression Partners LP(a) | | 1,402 | | | 24,914 |
Total Oil & Gas Services | | | | | 132,768 |
Packaging & Containers — 0.3% | | | |
Greif, Inc., Class A | | 388 | | | 12,629 |
Pharmaceuticals — 1.9% | | | | | |
Collegium Pharmaceutical, Inc.* | | 1,518 | | | 19,962 |
Enanta Pharmaceuticals, Inc.*(a) | | 419 | | | 35,355 |
Pacira BioSciences, Inc.* | | 457 | | | 19,875 |
Xencor, Inc.*(a) | | 496 | | | 20,301 |
Total Pharmaceuticals | | | | | 95,493 |
See accompanying Notes to Financial Statements.
36
ADVISORSHARES CORNERSTONE SMALL CAP ETF
Schedule of Investments (continued) June30, 2019 |
Investments | | Shares | | Value |
COMMON STOCKS(continued) |
Real Estate — 0.9% | | | | | |
Forestar Group, Inc.* | | 1,000 | | $ | 19,550 |
McGrath RentCorp | | 366 | | | 22,747 |
Total Real Estate | | | | | 42,297 |
REITS — 4.0% | | | | | |
AG Mortgage Investment Trust, Inc. | | 924 | | | 14,692 |
Agree Realty Corp. | | 399 | | | 25,556 |
American Assets Trust, Inc. | | 401 | | | 18,895 |
Global Medical REIT, Inc. | | 1,680 | | | 17,640 |
iStar, Inc.(a) | | 1,277 | | | 15,860 |
Mack-Cali Realty Corp. | | 808 | | | 18,818 |
Physicians Realty Trust | | 991 | | | 17,283 |
Rexford Industrial Realty, Inc. | | 541 | | | 21,840 |
STAG Industrial, Inc. | | 703 | | | 21,259 |
Terreno Realty Corp. | | 545 | | | 26,727 |
Total REITS | | | | | 198,570 |
Retail — 5.8% | | | | | |
Abercrombie & Fitch Co., Class A(a) | | 712 | | | 11,420 |
America’s Car-Mart, Inc.* | | 292 | | | 25,135 |
Bed Bath & Beyond, Inc.(a) | | 1,263 | | | 14,676 |
BJ’s Restaurants, Inc.(a) | | 357 | | | 15,687 |
Boot Barn Holdings, Inc.*(a) | | 799 | | | 28,476 |
Conn’s, Inc.* | | 620 | | | 11,048 |
Dillard’s, Inc., Class A | | 238 | | | 14,823 |
Hibbett Sports, Inc.*(a) | | 912 | | | 16,598 |
La-Z-Boy, Inc. | | 660 | | | 20,236 |
Lovesac Co. (The)* | | 480 | | | 14,914 |
Movado Group, Inc.(a) | | 620 | | | 16,740 |
PC Connection, Inc. | | 591 | | | 20,673 |
PCM, Inc.* | | 647 | | | 22,671 |
Shoe Carnival, Inc. | | 522 | | | 14,407 |
Vera Bradley, Inc.*(a) | | 1,352 | | | 16,224 |
Zumiez, Inc.*(a) | | 925 | | | 24,143 |
Total Retail | | | | | 287,871 |
Savings & Loans — 0.8% | | | | | |
Meridian Bancorp, Inc. | | 1,152 | | | 20,609 |
OceanFirst Financial Corp. | | 738 | | | 18,340 |
Total Savings & Loans | | | | | 38,949 |
Semiconductors — 1.7% | | | | | |
Cabot Microelectronics Corp. | | 199 | | | 21,906 |
Diodes, Inc.* | | 605 | | | 22,004 |
Nanometrics, Inc.* | | 558 | | | 19,368 |
Rudolph Technologies, Inc.* | | 793 | | | 21,911 |
Total Semiconductors | | | | | 85,189 |
Investments | | Shares | | Value |
COMMON STOCKS(continued) |
Software — 6.4% | | | | | |
American Software, Inc., Class A | | 1,401 | | $ | 18,423 |
Bandwidth, Inc., Class A* | | 224 | | | 16,805 |
Blackline, Inc.*(a) | | 395 | | | 21,136 |
Brightcove, Inc.* | | 1,784 | | | 18,429 |
Castlight Health, Inc., Class B* | | 5,583 | | | 18,033 |
Ebix, Inc.(a) | | 458 | | | 23,001 |
Five9, Inc.*(a) | | 649 | | | 33,287 |
Glu Mobile, Inc.* | | 4,701 | | | 33,753 |
ManTech International Corp., Class A | | 344 | | | 22,652 |
Monotype Imaging Holdings, Inc. | | 927 | | | 15,611 |
Omnicell, Inc.* | | 266 | | | 22,884 |
Radware Ltd. (Israel)* | | 755 | | | 18,671 |
Sapiens International Corp. NV (Israel) | | 1,826 | | | 30,348 |
SPS Commerce, Inc.* | | 232 | | | 23,713 |
Total Software | | | | | 316,746 |
Telecommunications — 2.2% | | | | | |
Acacia Communications, Inc.* | | 548 | | | 25,844 |
ADTRAN, Inc. | | 1,147 | | | 17,492 |
Shenandoah Telecommunications Co. | | 560 | | | 21,571 |
VEON Ltd. (Russia)(b) | | 7,493 | | | 20,980 |
Viavi Solutions, Inc.*(a) | | 1,838 | | | 24,427 |
Total Telecommunications | | | | | 110,314 |
Textiles — 0.4% | | | | | |
UniFirst Corp. | | 108 | | | 20,366 |
Transportation — 2.8% | | | | | |
Covenant Transportation Group, Inc., Class A* | | 674 | | | 9,915 |
Echo Global Logistics, Inc.* | | 690 | | | 14,400 |
Frontline Ltd. (Norway)*(a) | | 2,935 | | | 23,480 |
Marten Transport Ltd. | | 899 | | | 16,317 |
Scorpio Tankers, Inc. (Monaco) | | 683 | | | 20,162 |
SEACOR Holdings, Inc.* | | 348 | | | 16,534 |
Tidewater, Inc.* | | 916 | | | 21,508 |
Werner Enterprises, Inc. | | 556 | | | 17,280 |
Total Transportation | | | | | 139,596 |
Trucking & Leasing — 0.7% | | | | | |
Fly Leasing Ltd. (Ireland)*(b) | | 1,104 | | | 19,221 |
GATX Corp.(a) | | 189 | | | 14,986 |
Total Trucking & Leasing | | | | | 34,207 |
Total Common Stocks
(Cost $4,485,198) | | | | | 4,988,717 |
See accompanying Notes to Financial Statements.
37
ADVISORSHARES CORNERSTONE SMALL CAP ETF
Schedule of Investments (continued) June30, 2019 |
Investments | | Shares/
Principal | | Value |
MONEY MARKET FUND — 0.2% | |
STIT – Government & Agency Portfolio, Institutional Class, 2.27%(c)
(Cost $11,599) | | | 11,599 | | $ | 11,599 | |
REPURCHASE AGREEMENT — 4.2%(d) | |
HSBC Securities USA, Inc., dated 06/28/19, due 07/01/19, 2.50%, total to be received $206,770, (collateralized by various U.S. Government Agency Obligations,0.00% – 4.38%,08/15/20 – 11/15/46,totaling $209,300) (Cost $206,727) | | $ | 206,727 | | | 206,727 | |
Total Investments — 105.1%
(Cost $4,703,524) | | | | | | 5,207,043 | |
Liabilities in Excess of Other Assets — (5.1%) | | | | | | (252,055 | ) |
Net Assets — 100.0% | | | | | $ | 4,954,988 | |
Fair Value Measurements
The following is a summary of the inputs used, as of June30, 2019, in valuing the Fund’s assets and liabilities carried at fair value. These inputs are summarized in three broad levels. Level 1 includes quoted prices in active markets for identical securities. Level 2 includes other significant observable inputs (including quoted prices for similar securities, interest rates, prepayment speeds and credit risk). Level 3 includes significant unobservable inputs (including the Fund’s own assumptions in determining the fair value of investments). The level assigned to the securities valuations may not be an indication of the risk or liquidity associated with investing in those securities.
Assets | | Level 1 | | Level 2 | | Level 3 | | Total |
Common Stocks | | $ | 4,988,717 | | $ | — | | $ | — | | $ | 4,988,717 |
Money Market Fund | | | 11,599 | | | — | | | — | | | 11,599 |
Repurchase Agreement | | | — | | | 206,727 | | | — | | | 206,727 |
Total | | $ | 5,000,316 | | $ | 206,727 | | $ | — | | $ | 5,207,043 |
See accompanying Notes to Financial Statements.
38
ADVISORSHARES CORNERSTONE SMALL CAP ETF
Schedule of Investments (continued) June30, 2019 |
SUMMARY OF SCHEDULE OF INVESTMENTS
| |
% of
Net Assets
|
Aerospace/Defense | | 0.3 | % |
Airlines | | 1.6 | |
Apparel | | 0.3 | |
Auto Parts & Equipment | | 0.4 | |
Banks | | 6.8 | |
Beverages | | 0.8 | |
Biotechnology | | 4.8 | |
Building Materials | | 0.9 | |
Chemicals | | 2.0 | |
Coal | | 0.3 | |
Commercial Services | | 5.1 | |
Computers | | 4.3 | |
Cosmetics/Personal Care | | 0.5 | |
Distribution/Wholesale | | 1.3 | |
Diversified Financial Services | �� | 2.5 | |
Electric | | 1.4 | |
Electrical Components & Equipment | | 1.3 | |
Electronics | | 3.7 | |
Energy – Alternate Sources | | 0.4 | |
Engineering & Construction | | 2.6 | |
Entertainment | | 0.7 | |
Food | | 1.3 | |
Hand/Machine Tools | | 0.4 | |
Healthcare – Products | | 6.0 | |
Healthcare – Services | | 2.1 | |
Home Builders | | 0.8 | |
Home Furnishings | | 0.7 | |
Household Products/Wares | | 0.4 | |
SUMMARY OF SCHEDULE OF INVESTMENTS
(continued)
| | % of
Net Assets |
Insurance | | 2.3 | % |
Internet | | 3.2 | |
Iron/Steel | | 0.4 | |
Leisure Time | | 3.5 | |
Machinery – Diversified | | 1.7 | |
Media | | 0.3 | |
Miscellaneous Manufacturing | | 3.2 | |
Office Furnishings | | 0.4 | |
Oil & Gas | | 1.4 | |
Oil & Gas Services | | 2.7 | |
Packaging & Containers | | 0.3 | |
Pharmaceuticals | | 1.9 | |
Real Estate | | 0.9 | |
REITS | | 4.0 | |
Retail | | 5.8 | |
Savings & Loans | | 0.8 | |
Semiconductors | | 1.7 | |
Software | | 6.4 | |
Telecommunications | | 2.2 | |
Textiles | | 0.4 | |
Transportation | | 2.8 | |
Trucking & Leasing | | 0.7 | |
Money Market Fund | | 0.2 | |
Repurchase Agreement | | 4.2 | |
Total Investments | | 105.1 | |
Liabilities in Excess of Other Assets | | (5.1 | ) |
Net Assets | | 100.0 | % |
See accompanying Notes to Financial Statements.
39
ADVISORSHARES DORSEY WRIGHT ADR ETF
Schedule of Investments June30, 2019 |
Investments | | Shares | | Value |
COMMON STOCKS — 99.8% | | | | | |
Aerospace/Defense — 3.5% | | | | | |
Airbus SE (France)(a) | | 107,004 | | $ | 3,783,661 |
Airlines — 2.9% | | | | | |
Gol Linhas Aereas Inteligentes SA (Brazil)*(a)(b) | | 183,558 | | | 3,098,459 |
Apparel — 3.2% | | | | | |
LVMH Moet Hennessy Louis Vuitton SE (France)(a) | | 41,308 | | | 3,515,724 |
Beverages — 4.7% | | | | | |
Cia Cervecerias Unidas SA (Chile)(a) | | 87,776 | | | 2,479,672 |
Diageo PLC (United Kingdom)(a)(b) | | 15,445 | | | 2,661,482 |
Total Beverages | | | | | 5,141,154 |
Biotechnology — 3.7% | | | | | |
Argenx SE (Netherlands)*(a) | | 28,017 | | | 3,966,647 |
Commercial Services — 4.3% | | | | | |
New Oriental Education & Technology Group, Inc. (China)*(a) | | 22,452 | | | 2,168,414 |
TAL Education Group (China)*(a) | | 64,899 | | | 2,472,652 |
Total Commercial Services | | | | | 4,641,066 |
Computers — 7.8% | | | | | |
Check Point Software Technologies Ltd. (Israel)* | | 21,660 | | | 2,504,113 |
Infosys Ltd. (India)(a)(b) | | 274,060 | | | 2,932,442 |
WNS Holdings Ltd. (India)*(a) | | 50,191 | | | 2,971,307 |
Total Computers | | | | | 8,407,862 |
Electric — 4.4% | | | | | |
Centrais Eletricas Brasileiras SA (Brazil)(a) | | 262,721 | | | 2,396,016 |
Cia Energetica de Minas Gerais (Brazil)(a)(b) | | 628,099 | | | 2,393,057 |
Total Electric | | | | | 4,789,073 |
Electronics — 3.2% | | | | | |
Allegion PLC | | 31,323 | | | 3,462,758 |
Food — 7.7% | | | | | |
Cia Brasileira de Distribuicao (Brazil)(a) | | 110,286 | | | 2,699,801 |
Cosan Ltd., Class A (Brazil)* | | 208,425 | | | 2,784,558 |
Nestle SA (Switzerland)(a) | | 28,058 | | | 2,901,197 |
Total Food | | | | | 8,385,556 |
Investments | | Shares | | Value |
COMMON STOCKS(continued) |
Healthcare – Products — 2.9% |
Alcon, Inc. (Switzerland)*(b) | | 5,482 | | $ | 340,158 |
Smith & Nephew PLC (United Kingdom)(a) | | 63,802 | | | 2,777,939 |
Total Healthcare – Products | | | | | 3,118,097 |
Healthcare – Services — 2.8% | | | | | |
ICON PLC (Ireland)* | | 19,405 | | | 2,987,788 |
Internet — 5.8% | | | | | |
MercadoLibre, Inc. (Argentina)* | | 6,685 | | | 4,089,683 |
Tencent Holdings Ltd. (China)(a) | | 48,682 | | | 2,203,347 |
Total Internet | | | | | 6,293,030 |
Iron/Steel — 2.5% | | | | | |
Cia Siderurgica Nacional SA (Brazil)(a) | | 634,538 | | | 2,734,859 |
Mining — 12.7% | | | | | |
AngloGold Ashanti Ltd. (South Africa)(a) | | 184,302 | | | 3,282,419 |
BHP Group Ltd. (Australia)(a)(b) | | 41,326 | | | 2,401,454 |
Cia de Minas Buenaventura SAA (Peru)(a)(b) | | 141,865 | | | 2,364,889 |
Gold Fields Ltd. (South Africa)(a) | | 604,556 | | | 3,270,648 |
Rio Tinto PLC (Australia)(a)(b) | | 38,726 | | | 2,414,179 |
Total Mining | | | | | 13,733,589 |
Oil & Gas — 3.3% | | | | | |
CNOOC Ltd. (China)(a) | | 20,705 | | | 3,527,097 |
Pharmaceuticals — 10.1% | | | | | |
AstraZeneca PLC (United Kingdom)(a)(b) | | 64,812 | | | 2,675,439 |
Dr Reddy’s Laboratories Ltd. (India)(a)(b) | | 51,078 | | | 1,913,893 |
Galapagos NV (Belgium)*(a) | | 29,596 | | | 3,815,812 |
Novartis AG (Switzerland)(a) | | 27,410 | | | 2,502,807 |
Total Pharmaceuticals | | | | | 10,907,951 |
Semiconductors — 2.3% | | | | | |
ASML Holding NV (Netherlands) | | 11,732 | | | 2,439,435 |
Software — 2.2% | | | | | |
SAP SE (Germany)(a) | | 17,400 | | | 2,380,320 |
Telecommunications — 7.2% | | | | | |
Nice Ltd. (Israel)*(a) | | 35,125 | | | 4,812,125 |
Telefonaktiebolaget LM Ericsson (Sweden)(a) | | 316,461 | | | 3,006,379 |
Total Telecommunications | | | | | 7,818,504 |
See accompanying Notes to Financial Statements.
40
ADVISORSHARES DORSEY WRIGHT ADR ETF
Schedule of Investments (continued) June30, 2019 |
Investments | | Shares/
Principal | | Value |
COMMON STOCKS(continued) |
Transportation — 2.6% | | | | | | |
ZTO Express Cayman, Inc. (China)(a)(b) | | | 149,480 | | $ | 2,858,058 |
Total Common Stocks
(Cost $93,971,427) | | | | | | 107,990,688 |
MONEY MARKET FUND — 0.1% |
Invesco Government & Agency Portfolio – Private Investment Class, 1.97%(c) (Cost $76,589) | | | 76,589 | | | 76,589 |
REPURCHASE AGREEMENTS — 5.9%(d) |
BNP Paribas Securities Corp., dated 06/28/19, due 07/01/19, 2.49%, total to be received $1,486,776, (collateralized by various U.S. Government Agency Obligations, 0.00% – 8.75%, 07/18/19 – 09/09/49, totaling $1,510,126) | | $ | 1,486,468 | | | 1,486,468 |
Citigroup Global Markets, Inc., dated 06/28/19, due 07/01/19, 2.50%, total to be received $1,486,778, (collateralized by various U.S. Government Agency Obligations, 0.00% – 9.50%, 07/02/19 – 01/20/63, totaling $1,510,546) | | | 1,486,468 | | | 1,486,468 |
Daiwa Capital Markets America, dated 06/28/19, due 07/01/19, 2.53%, total to be received $1,486,781, (collateralized by various U.S. Government Agency Obligations, 0.00% – 6.50%, 07/05/19 – 09/09/49, totaling $1,511,138) | | | 1,486,468 | | | 1,486,468 |
JP Morgan Securities LLC, dated 06/28/19, due 07/01/19, 2.53%, total to be received $440,329, (collateralized by various U.S. Government Agency Obligations, 0.88% – 1.75%, 07/31/19 – 06/30/22, totaling $446,501) | | | 440,236 | | | 440,236 |
Investments
| | Principal | | Value |
REPURCHASE AGREEMENTS(continued) | |
RBC Dominion Securities, Inc., dated 06/28/19, due 07/01/19, 2.51%, total to be received $1,486,779, (collateralized by various U.S. Government Agency Obligations, 0.00% – 7.00%, 07/18/19 – 09/09/49, totaling $1,511,425) | | $ | 1,486,468 | | $ | 1,486,468 | |
Total Repurchase Agreements (Cost $6,386,108) | | | | | | 6,386,108 | |
Total Investments — 105.8% (Cost $100,434,124) | | | | | | 114,453,385 | |
Liabilities in Excess of Other Assets — (5.8%) | | | | | | (6,255,310 | ) |
Net Assets — 100.0% | | | | | $ | 108,198,075 | |
See accompanying Notes to Financial Statements.
41
ADVISORSHARES DORSEY WRIGHT ADR ETF
Schedule of Investments (continued) June30, 2019 |
Fair Value Measurements
The following is a summary of the inputs used, as of June30, 2019, in valuing the Fund’s assets and liabilities carried at fair value. These inputs are summarized in three broad levels. Level 1 includes quoted prices in active markets for identical securities. Level 2 includes other significant observable inputs (including quoted prices for similar securities, interest rates, prepayment speeds and credit risk). Level 3 includes significant unobservable inputs (including the Fund’s own assumptions in determining the fair value of investments). The level assigned to the securities valuations may not be an indication of the risk or liquidity associated with investing in those securities.
Assets | | Level 1 | | Level 2 | | Level 3 | | Total |
Common Stocks | | $ | 107,990,688 | | $ | — | | $ | — | | $ | 107,990,688 |
Money Market Fund | | | 76,589 | | | — | | | — | | | 76,589 |
Repurchase Agreements | | | — | | | 6,386,108 | | | — | | | 6,386,108 |
Total | | $ | 108,067,277 | | $ | 6,386,108 | | $ | — | | $ | 114,453,385 |
SUMMARY OF SCHEDULE OF INVESTMENTS
| | % of
Net Assets |
Aerospace/Defense | | 3.5 | % |
Airlines | | 2.9 | |
Apparel | | 3.2 | |
Beverages | | 4.7 | |
Biotechnology | | 3.7 | |
Commercial Services | | 4.3 | |
Computers | | 7.8 | |
Electric | | 4.4 | |
Electronics | | 3.2 | |
Food | | 7.7 | |
Healthcare – Products | | 2.9 | |
Healthcare – Services | | 2.8 | |
Internet | | 5.8 | |
Iron/Steel | | 2.5 | |
Mining | | 12.7 | |
Oil & Gas | | 3.3 | |
Pharmaceuticals | | 10.1 | |
Semiconductors | | 2.3 | |
Software | | 2.2 | |
Telecommunications | | 7.2 | |
Transportation | | 2.6 | |
Money Market Fund | | 0.1 | |
Repurchase Agreements | | 5.9 | |
Total Investments | | 105.8 | |
Liabilities in Excess of Other Assets | | (5.8 | ) |
Net Assets | | 100.0 | % |
See accompanying Notes to Financial Statements.
42
ADVISORSHARES DORSEY WRIGHT MICRO-CAP ETF
Schedule of Investments June30, 2019 |
Investments | | Shares | | Value |
COMMON STOCKS — 99.2% | | | | | |
Advertising — 1.3% | | | | | |
Boston Omaha Corp., Class A* | | 421 | | $ | 9,746 |
National CineMedia, Inc. | | 1,250 | | | 8,200 |
Telaria, Inc.* | | 1,588 | | | 11,942 |
Total Advertising | | | | | 29,888 |
Aerospace/Defense — 0.6% | | | | | |
Ducommun, Inc.* | | 304 | | | 13,701 |
Agriculture — 0.8% | | | | | |
Turning Point Brands, Inc.(a) | | 372 | | | 18,220 |
Airlines — 1.1% | | | | | |
SkyWest, Inc. | | 428 | | | 25,967 |
Apparel — 0.5% | | | | | |
Rocky Brands, Inc. | | 436 | | | 11,894 |
Auto Parts & Equipment — 0.5% |
Miller Industries, Inc. | | 352 | | | 10,824 |
Banks — 4.2% | | | | | |
Bank of Marin Bancorp | | 241 | | | 9,886 |
Baycom Corp.*(a) | | 428 | | | 9,373 |
First Community Bankshares, Inc. | | 309 | | | 10,432 |
Independent Bank Corp. | | 584 | | | 12,725 |
Macatawa Bank Corp. | | 1,144 | | | 11,738 |
OFG Bancorp (Puerto Rico) | | 828 | | | 19,682 |
Parke Bancorp, Inc. | | 452 | | | 10,825 |
United Security Bancshares | | 1,000 | | | 11,390 |
Total Banks | | | | | 96,051 |
Biotechnology — 6.8% | | | | | |
Adverum Biotechnologies, Inc.* | | 1,188 | | | 14,125 |
Albireo Pharma, Inc.*(a) | | 342 | | | 11,026 |
ArQule, Inc.* | | 1,796 | | | 19,774 |
Cara Therapeutics, Inc.*(a) | | 566 | | | 12,169 |
Krystal Biotech, Inc.*(a) | | 457 | | | 18,403 |
Magenta Therapeutics, Inc.* | | 640 | | | 9,440 |
MeiraGTx Holdings PLC* | | 569 | | | 15,295 |
Veracyte, Inc.* | | 770 | | | 21,953 |
Vericel Corp.*(a) | | 637 | | | 12,033 |
XBiotech, Inc.* | | 1,050 | | | 7,959 |
ZIOPHARM Oncology, Inc.*(a) | | 2,450 | | | 14,284 |
Total Biotechnology | | | | | 156,461 |
Chemicals — 0.9% | | | | | |
Codexis, Inc.*(a) | | 1,176 | | | 21,674 |
Coal — 0.9% | | | | | |
Advanced Emissions Solutions, Inc. | | 914 | | | 11,553 |
Natural Resource Partners LP | | 256 | | | 9,078 |
Total Coal | | | | | 20,631 |
Investments | | Shares | | Value |
COMMON STOCKS (continued) |
Commercial Services — 4.7% | | | | | |
Career Education Corp.* | | 1,232 | | $ | 23,494 |
Chegg, Inc.*(a) | | 696 | | | 26,859 |
Collectors Universe, Inc. | | 558 | | | 11,908 |
Evo Payments, Inc., Class A* | | 418 | | | 13,179 |
Heidrick & Struggles International, Inc. | | 280 | | | 8,392 |
International Money Express, Inc.* | | 849 | | | 11,971 |
Vectrus, Inc.* | | 293 | | | 11,884 |
Total Commercial Services | | | | | 107,687 |
Computers — 2.0% | | | | | |
Agilysys, Inc.* | | 530 | | | 11,379 |
Kornit Digital Ltd. (Israel)* | | 404 | | | 12,790 |
PAR Technology Corp.*(a) | | 804 | | | 22,673 |
Total Computers | | | | | 46,842 |
Diversified Financial Services — 3.7% |
America First Multifamily Investors LP | | 1,606 | | | 11,435 |
Blucora, Inc.* | | 412 | | | 12,512 |
Hamilton Lane, Inc., Class A | | 284 | | | 16,205 |
Oppenheimer Holdings, Inc., Class A | | 376 | | | 10,235 |
Paysign, Inc.*(a) | | 1,413 | | | 18,892 |
World Acceptance Corp.*(a) | | 96 | | | 15,754 |
Total Diversified Financial Services | | | | | 85,033 |
Electric — 1.1% | | | | | |
Ameresco, Inc., Class A* | | 856 | | | 12,609 |
Genie Energy Ltd., Class B | | 1,241 | | | 13,216 |
Total Electric | | | | | 25,825 |
Electrical Components & Equipment — 1.3% |
Novanta, Inc.* | | 308 | | | 29,044 |
Electronics — 4.0% | | | | | |
Camtek Ltd. (Israel)* | | 1,152 | | | 9,734 |
Fluidigm Corp.* | | 1,290 | | | 15,893 |
Ituran Location and Control Ltd. (Israel) | | 325 | | | 9,779 |
Mesa Laboratories, Inc. | | 61 | | | 14,905 |
Napco Security Technologies, Inc.*(a) | | 522 | | | 15,493 |
Stoneridge, Inc.* | | 360 | | | 11,358 |
Vishay Precision Group, Inc.* | | 392 | | | 15,927 |
Total Electronics | | | | | 93,089 |
Energy – Alternate Sources — 2.4% |
Enphase Energy, Inc.* | | 1,488 | | | 27,126 |
Sunrun, Inc.* | | 900 | | | 16,884 |
See accompanying Notes to Financial Statements.
43
ADVISORSHARES DORSEY WRIGHT MICRO-CAP ETF
Schedule of Investments (continued) June30, 2019 |
Investments | | Shares | | Value |
COMMON STOCKS (continued) |
Energy — Alternate Sources (continued) |
Vivint Solar, Inc.*(a) | | 1,562 | | $ | 11,403 |
Total Energy — Alternate Sources | | | 55,413 |
Engineering & Construction — 0.7% |
Great Lakes Dredge & Dock Corp.* | | 1,373 | | | 15,158 |
Entertainment — 2.8% | | | | | |
Eldorado Resorts, Inc.*(a) | | 920 | | | 42,385 |
Everi Holdings, Inc.* | | 1,125 | | | 13,421 |
Monarch Casino & Resort, Inc.* | | 208 | | | 8,890 |
Total Entertainment | | | | | 64,696 |
Environmental Control — 3.8% |
AquaVenture Holdings Ltd.* | | 576 | | | 11,503 |
Casella Waste Systems, Inc., Class A* | | 1,028 | | | 40,739 |
Energy Recovery, Inc.* | | 1,109 | | | 11,556 |
Heritage-Crystal Clean, Inc.* | | 410 | | | 10,787 |
Pure Cycle Corp.* | | 1,172 | | | 12,423 |
Total Environmental Control | | | | | 87,008 |
Food — 0.6% | | | | | |
Chefs’ Warehouse, Inc. (The)* | | 420 | | | 14,729 |
Gas — 0.5% | | | | | |
Global Partners LP(a) | | 588 | | | 11,707 |
Healthcare – Products — 5.0% |
BioLife Solutions, Inc.* | | 577 | | | 9,780 |
Conformis, Inc.* | | 2,537 | | | 11,061 |
Hanger, Inc.* | | 470 | | | 9,000 |
Lantheus Holdings, Inc.* | | 472 | | | 13,358 |
NanoString Technologies, Inc.* | | 756 | | | 22,945 |
OrthoPediatrics Corp.* | | 426 | | | 16,614 |
Quanterix Corp.* | | 490 | | | 16,557 |
Quotient Ltd.*(a) | | 1,608 | | | 15,035 |
Total Healthcare – Products | | | | | 114,350 |
Healthcare – Services — 3.2% | | | | | |
Addus HomeCare Corp.* | | 212 | | | 15,889 |
Catasys, Inc.*(a) | | 842 | | | 16,183 |
Joint Corp. (The)* | | 668 | | | 12,158 |
R1 RCM, Inc.* | | 1,332 | | | 16,757 |
RadNet, Inc.* | | 948 | | | 13,073 |
Total Healthcare – Services | | | | | 74,060 |
Insurance — 3.2% | | | | | |
eHealth, Inc.*(a) | | 400 | | | 34,440 |
Goosehead Insurance, Inc., Class A | | 289 | | | 13,814 |
Kinsale Capital Group, Inc. | | 280 | | | 25,615 |
Total Insurance | | | | | 73,869 |
Investments | | Shares | | Value |
COMMON STOCKS (continued) |
Internet — 2.6% | | | | | |
1-800-Flowers.com, Inc., Class A* | | 637 | | $ | 12,026 |
DHI Group, Inc.* | | 2,649 | | | 9,457 |
Rubicon Project, Inc. (The)* | | 2,274 | | | 14,463 |
Travelzoo* | | 636 | | | 9,820 |
Zix Corp.* | | 1,486 | | | 13,508 |
Total Internet | | | | | 59,274 |
Iron/Steel — 0.8% | | | | | |
Mesabi Trust(a) | | 596 | | | 17,606 |
Leisure Time — 1.8% | | | | | |
Clarus Corp. | | 1,040 | | | 15,018 |
Lindblad Expeditions Holdings, Inc.* | | 852 | | | 15,293 |
Malibu Boats, Inc., Class A* | | 320 | | | 12,432 |
Total Leisure Time | | | | | 42,743 |
Metal Fabricate/Hardware — 0.9% |
Northwest Pipe Co.* | | 440 | | | 11,343 |
Omega Flex, Inc. | | 124 | | | 9,525 |
Total Metal Fabricate/Hardware | | | | | 20,868 |
Office/Business Equipment — 0.5% |
AstroNova, Inc. | | 425 | | | 10,982 |
Oil & Gas — 1.4% | | | | | |
Geopark Ltd. (Colombia)* | | 1,092 | | | 20,246 |
Sabine Royalty Trust | | 232 | | | 11,175 |
Total Oil & Gas | | | | | 31,421 |
Oil & Gas Services — 1.6% | | | | | |
DMC Global, Inc. | | 440 | | | 27,874 |
Matrix Service Co.* | | 509 | | | 10,312 |
Total Oil & Gas Services | | | | | 38,186 |
Pharmaceuticals — 4.0% | | | | | |
Axsome Therapeutics, Inc.* | | 1,057 | | | 27,218 |
BioDelivery Sciences International, Inc.* | | 2,510 | | | 11,671 |
BioSpecifics Technologies Corp.* | | 158 | | | 9,434 |
Chiasma, Inc.* | | 1,512 | | | 11,295 |
Ra Pharmaceuticals, Inc.* | | 722 | | | 21,711 |
Zynerba Pharmaceuticals, Inc.*(a) | | 804 | | | 10,894 |
Total Pharmaceuticals | | | | | 92,223 |
Pipelines — 0.5% | | | | | |
Oasis Midstream Partners LP | | 492 | | | 10,578 |
Real Estate — 1.0% | | | | | |
Landmark Infrastructure Partners LP | | 708 | | | 11,930 |
Safehold, Inc. | | 396 | | | 11,959 |
Total Real Estate | | | | | 23,889 |
See accompanying Notes to Financial Statements.
44
ADVISORSHARES DORSEY WRIGHT MICRO-CAP ETF
Schedule of Investments (continued) June30, 2019 |
Investments | |
Shares | | Value |
COMMON STOCKS (continued) |
REITS — 6.5% | | | | | |
Arbor Realty Trust, Inc.(a) | | 1,066 | | $ | 12,920 |
Ares Commercial Real Estate Corp. | | 726 | | | 10,788 |
Cherry Hill Mortgage Investment Corp. | | 548 | | | 8,768 |
Community Healthcare Trust, Inc.(a) | | 348 | | | 13,715 |
Global Medical REIT, Inc. | | 1,004 | | | 10,542 |
Granite Point Mortgage Trust, Inc. | | 538 | | | 10,324 |
Innovative Industrial Properties, Inc. | | 316 | | | 39,045 |
Jernigan Capital, Inc. | | 438 | | | 8,979 |
NexPoint Residential Trust, Inc. | | 350 | | | 14,490 |
NorthStar Realty Europe Corp.(a) | | 597 | | | 9,809 |
One Liberty Properties, Inc. | | 385 | | | 11,149 |
Total REITS | | | | | 150,529 |
Retail — 2.1% | | | | | |
America’s Car-Mart, Inc.* | | 197 | | | 16,958 |
Foundation Building Materials, Inc.* | | 706 | | | 12,552 |
PetIQ, Inc.*(a) | | 332 | | | 10,943 |
Ruth’s Hospitality Group, Inc. | | 392 | | | 8,902 |
Total Retail | | | | | 49,355 |
Semiconductors — 0.9% | | | | | |
ACM Research, Inc., Class A* | | 594 | | | 9,272 |
DSP Group, Inc.* | | 765 | | | 10,986 |
Total Semiconductors | | | | | 20,258 |
Software — 11.7% | | | | | |
AppFolio, Inc., Class A* | | 272 | | | 27,817 |
Avid Technology, Inc.* | | 1,404 | | | 12,804 |
Bandwidth, Inc., Class A* | | 286 | | | 21,456 |
Brightcove, Inc.* | | 1,113 | | | 11,497 |
Digital Turbine, Inc.*(a) | | 2,340 | | | 11,700 |
eGain Corp.* | | 1,077 | | | 8,767 |
Everbridge, Inc.*(a) | | 312 | | | 27,899 |
Five9, Inc.*(a) | | 788 | | | 40,417 |
LivePerson, Inc.*(a) | | 628 | | | 17,609 |
MobileIron, Inc.* | | 1,940 | | | 12,028 |
Sapiens International Corp. NV (Israel) | | 730 | | | 12,133 |
Simulations Plus, Inc. | | 576 | | | 16,451 |
Telenav, Inc.* | | 1,762 | | | 14,096 |
Upland Software, Inc.*(a) | | 544 | | | 24,768 |
Verra Mobility Corp.*(a) | | 858 | | | 11,231 |
Total Software | | | | | 270,673 |
Investments | | Shares/
Principal | | Value |
COMMON STOCKS (continued) | | | | | | | |
Telecommunications — 2.8% | | | | | | | |
Airgain, Inc.* | | | 709 | | $ | 10,033 | |
AudioCodes Ltd. (Israel) | | | 1,234 | | | 19,102 | |
Harmonic, Inc.*(a) | | | 2,104 | | | 11,677 | |
Inseego Corp.*(a) | | | 2,230 | | | 10,682 | |
pdvWireless, Inc.* | | | 268 | | | 12,596 | |
Total Telecommunications | | | | | | 64,090 | |
Toys/Games/Hobbies — 0.6% | |
Funko, Inc., Class A*(a) | | | 540 | | | 13,079 | |
Transportation — 2.3% | | | | | | | |
CryoPort, Inc.*(a) | | | 798 | | | 14,619 | |
DHT Holdings, Inc. | | | 2,034 | | | 12,021 | |
Hoegh LNG Partners LP (Bermuda)(a) | | | 566 | | | 9,792 | |
PAM Transportation Services, Inc.* | | | 260 | | | 16,120 | |
Total Transportation | | | | | | 52,552 | |
Water — 0.6% | | | | | | | |
Middlesex Water Co. | | | 217 | | | 12,857 | |
Total Common Stocks
(Cost $1,973,148) | | | | | | 2,284,984 | |
MONEY MARKET FUND — 2.2% | | | | | | | |
STIT – Government & Agency Portfolio, Institutional Class, 2.27%(b)
(Cost $51,101) | | | 51,101 | | | 51,101 | |
REPURCHASE AGREEMENT — 7.3%(c) | |
RBC Dominion Securities, Inc., dated 06/28/19, due 07/01/19, 2.51%, total to be received $167,543, (collateralized by various U.S. Government Agency Obligations, 0.00% – 7.00%, 07/18/19 – 09/09/49, totaling $170,320)
(Cost $167,508) | | $ | 167,508 | | | 167,508 | |
Total Investments — 108.7% (Cost $2,191,757) | | | | | | 2,503,593 | |
Liabilities in Excess of Other Assets — (8.7%) | | | | | | (199,995 | ) |
Net Assets — 100.0% | | | | | $ | 2,303,598 | |
See accompanying Notes to Financial Statements.
45
ADVISORSHARES DORSEY WRIGHT MICRO-CAP ETF
Schedule of Investments (continued) June30, 2019 |
Fair Value Measurements
The following is a summary of the inputs used, as of June30, 2019, in valuing the Fund’s assets and liabilities carried at fair value. These inputs are summarized in three broad levels. Level 1 includes quoted prices in active markets for identical securities. Level 2 includes other significant observable inputs (including quoted prices for similar securities, interest rates, prepayment speeds and credit risk). Level 3 includes significant unobservable inputs (including the Fund’s own assumptions in determining the fair value of investments). The level assigned to the securities valuations may not be an indication of the risk or liquidity associated with investing in those securities.
Assets | | Level 1 | | Level 2 | | Level 3 | | Total |
Common Stocks | | $ | 2,284,984 | | $ | — | | $ | — | | $ | 2,284,984 |
Money Market Fund | | | 51,101 | | | — | | | — | | | 51,101 |
Repurchase Agreement | | | — | | | 167,508 | | | — | | | 167,508 |
Total | | $ | 2,336,085 | | $ | 167,508 | | $ | — | | $ | 2,503,593 |
SUMMARY OF SCHEDULE OF INVESTMENTS | | | | SUMMARY OF SCHEDULE OF INVESTMENTS
(continued) |
| | | % of
Net Assets | | | | % of
Net Assets |
Advertising | | 1.3 | % | | Internet | | 2.6 | % |
Aerospace/Defense | | 0.6 | | | Iron/Steel | | 0.8 | |
Agriculture | | 0.8 | | | Leisure Time | | 1.8 | |
Airlines | | 1.1 | | | Metal Fabricate/Hardware | | 0.9 | |
Apparel | | 0.5 | | | Office/Business Equipment | | 0.5 | |
Auto Parts & Equipment | | 0.5 | | | Oil & Gas | | 1.4 | |
Banks | | 4.2 | | | Oil & Gas Services | | 1.6 | |
Biotechnology | | 6.8 | | | Pharmaceuticals | | 4.0 | |
Chemicals | | 0.9 | | | Pipelines | | 0.5 | |
Coal | | 0.9 | | | Real Estate | | 1.0 | |
Commercial Services | | 4.7 | | | REITS | | 6.5 | |
Computers | | 2.0 | | | Retail | | 2.1 | |
Diversified Financial Services | | 3.7 | | | Semiconductors | | 0.9 | |
Electric | | 1.1 | | | Software | | 11.7 | |
Electrical Components & Equipment | | 1.3 | | | Telecommunications | | 2.8 | |
Electronics | | 4.0 | | | Toys/Games/Hobbies | | 0.6 | |
Energy – Alternate Sources | | 2.4 | | | Transportation | | 2.3 | |
Engineering & Construction | | 0.7 | | | Water | | 0.6 | |
Entertainment | | 2.8 | | | Money Market Fund | | 2.2 | |
Environmental Control | | 3.8 | | | Repurchase Agreement | | 7.3 | |
Food | | 0.6 | | | Total Investments | | 108.7 | |
Gas | | 0.5 | | | Liabilities in Excess of Other Assets | | (8.7 | ) |
Healthcare – Products | | 5.0 | | | Net Assets | | 100.0 | % |
Healthcare – Services | | 3.2 | | | |
Insurance | | 3.2 | | |
See accompanying Notes to Financial Statements.
46
ADVISORSHARES DORSEY WRIGHT SHORT ETF
Schedule of Investments June30, 2019 |
Investments | | Shares | | Value |
EXCHANGE TRADED FUND — 10.2% | |
Debt Fund — 10.2% | | | | | | | |
AdvisorShares Sage Core Reserves ETF†
(Cost $2,485,250) | | 25,000 | | | $ | 2,490,250 | |
MONEY MARKET FUND — 52.6% | |
STIT — Government & Agency Portfolio, Institutional Class, 2.27%(a)
(Cost $12,769,870) | | 12,769,870 | | | | 12,769,870 | |
Total Investments Before Securities Sold, Not Yet Purchased
(Cost $15,255,120) | | | | | | 15,260,120 | |
Securities Sold, Not Yet Purchased — (103.0)%(b) | |
COMMON STOCKS — (103.0)% | |
Agriculture — (1.2)% | | | | | | | |
Bunge Ltd. | | (5,240 | ) | | | (291,920 | ) |
Apparel — (1.1)% | | | | | | | |
Tapestry, Inc. | | (8,154 | ) | | | (258,726 | ) |
Auto Manufacturers — (0.8)% | |
Tesla, Inc.* | | (912 | ) | | | (203,796 | ) |
Auto Parts & Equipment — (3.6)% | |
Adient PLC | | (16,594 | ) | | | (402,737 | ) |
Goodyear Tire & Rubber Co. (The) | | (11,573 | ) | | | (177,067 | ) |
Visteon Corp.* | | (5,004 | ) | | | (293,134 | ) |
Total Auto Parts & Equipment | | | | | | (872,938 | ) |
Banks — (3.7)% | | | | | | | |
Bank OZK | | (7,198 | ) | | | (216,588 | ) |
State Street Corp. | | (3,356 | ) | | | (188,137 | ) |
Synovus Financial Corp. | | (7,002 | ) | | | (245,070 | ) |
Texas Capital Bancshares, Inc.* | | (4,143 | ) | | | (254,256 | ) |
Total Banks | | | | | | (904,051 | ) |
Beverages — (0.8)% | | | | | | | |
National Beverage Corp. | | (4,509 | ) | | | (201,237 | ) |
Biotechnology — (2.0)% | | | | | | | |
Biogen, Inc.* | | (1,064 | ) | | | (248,838 | ) |
United Therapeutics Corp.* | | (2,955 | ) | | | (230,667 | ) |
Total Biotechnology | | | | | | (479,505 | ) |
Building Materials — (2.4)% | | | | | | | |
JELD-WEN Holding, Inc.* | | (15,563 | ) | | | (330,403 | ) |
Owens Corning | | (4,235 | ) | | | (246,477 | ) |
Total Building Materials | | | | | | (576,880 | ) |
Investments | | Shares | | Value |
COMMON STOCKS (continued) | |
Chemicals — (7.5)% | | | | | | | |
Albemarle Corp. | | (3,639 | ) | | $ | (256,222 | ) |
Cabot Corp. | | (5,859 | ) | | | (279,533 | ) |
Huntsman Corp. | | (12,775 | ) | | | (261,121 | ) |
Mosaic Co. (The) | | (10,470 | ) | | | (262,064 | ) |
Olin Corp. | | (12,387 | ) | | | (271,399 | ) |
Univar, Inc.* | | (11,383 | ) | | | (250,881 | ) |
Westlake Chemical Corp. | | (3,552 | ) | | | (246,722 | ) |
Total Chemicals | | | | | | (1,827,942 | ) |
Coal — (1.1)% | | | | | | | |
Peabody Energy Corp. | | (11,193 | ) | | | (269,751 | ) |
Commercial Services — (4.4)% | |
2U, Inc.* | | (6,661 | ) | | | (250,720 | ) |
Cimpress NV (Netherlands)* | | (3,449 | ) | | | (313,480 | ) |
Healthcare Services Group, Inc. | | (8,218 | ) | | | (249,170 | ) |
Weight Watchers International, Inc.* | | (12,943 | ) | | | (247,211 | ) |
Total Commercial Services | | | | | | (1,060,581 | ) |
Computers — (2.2)% | | | | | | | |
DXC Technology Co. | | (4,089 | ) | | | (225,508 | ) |
Western Digital Corp. | | (6,299 | ) | | | (299,518 | ) |
Total Computers | | | | | | (525,026 | ) |
Diversified Financial Services — (1.9)% | |
Affiliated Managers Group, Inc. | | (2,739 | ) | | | (252,372 | ) |
Alliance Data Systems Corp. | | (1,549 | ) | | | (217,061 | ) |
Total Diversified Financial Services | | | | | | (469,433 | ) |
Electric — (1.4)% | | | | | | | |
PG&E Corp.* | | (15,049 | ) | | | (344,923 | ) |
Electronics — (1.0)% | | | | | | | |
Coherent, Inc.* | | (1,858 | ) | | | (253,375 | ) |
Engineering & Construction — (1.0)% | |
Fluor Corp. | | (6,900 | ) | | | (232,461 | ) |
Entertainment — (0.9)% | | | | | | | |
Scientific Games Corp.* | | (10,842 | ) | | | (214,888 | ) |
Food — (3.0)% | | | | | | | |
Hain Celestial Group, Inc. (The)* | | (10,281 | ) | | | (225,154 | ) |
Ingredion, Inc. | | (3,071 | ) | | | (253,327 | ) |
Kraft Heinz Co. (The) | | (7,900 | ) | | | (245,216 | ) |
Total Food | | | | | | (723,697 | ) |
See accompanying Notes to Financial Statements.
47
ADVISORSHARES DORSEY WRIGHT SHORT ETF
Schedule of Investments (continued) June30, 2019 |
Investments | | Shares | | Value |
COMMON STOCKS (continued) | |
Healthcare – Products — (2.4)% | |
ABIOMED, Inc.* | | (929 | ) | | $ | (241,995 | ) |
Cantel Medical Corp. | | (4,136 | ) | | | (333,527 | ) |
Total Healthcare – Products | | | | | | (575,522 | ) |
Healthcare – Services — (2.2)% | |
DaVita Inc.* | | (4,985 | ) | | | (280,456 | ) |
MEDNAX, Inc.* | | (10,474 | ) | | | (264,259 | ) |
Total Healthcare – Services | | | | | | (544,715 | ) |
Home Builders — (1.0)% | | | | | | | |
Thor Industries, Inc. | | (4,339 | ) | | | (253,615 | ) |
Housewares — (1.1)% | | | | | | | |
Newell Brands, Inc. | | (16,862 | ) | | | (260,012 | ) |
Insurance — (2.2)% | | | | | | | |
Brighthouse Financial, Inc.* | | (7,463 | ) | | | (273,818 | ) |
Unum Group | | (7,933 | ) | | | (266,152 | ) |
Total Insurance | | | | | | (539,970 | ) |
Internet — (1.1)% | | | | | | | |
GrubHub, Inc.* | | (3,476 | ) | | | (271,093 | ) |
Iron/Steel — (2.0)% | | | | | | | |
Steel Dynamics, Inc. | | (8,300 | ) | | | (250,660 | ) |
United States Steel Corp. | | (15,771 | ) | | | (241,454 | ) |
Total Iron/Steel | | | | | | (492,114 | ) |
Machinery — Construction & Mining — (2.3)% | |
BWX Technologies, Inc. | | (5,632 | ) | | | (293,427 | ) |
Terex Corp. | | (8,258 | ) | | | (259,301 | ) |
Total Machinery — Construction & Mining | | | | | | (552,728 | ) |
Machinery — Diversified — (1.1)% | |
Wabtec Corp. | | (3,632 | ) | | | (260,632 | ) |
Mining — (0.8)% | | | | | | | |
Alcoa Corp.* | | (7,950 | ) | | | (186,110 | ) |
Miscellaneous Manufacturing — (1.0)% | |
General Electric Co. | | (23,336 | ) | | | (245,028 | ) |
Oil & Gas — (11.9)% | | | | | | | |
Antero Resources Corp.* | | (37,547 | ) | | | (207,635 | ) |
Apache Corp. | | (7,656 | ) | | | (221,794 | ) |
Centennial Resource Development, Inc., Class A* | | (36,158 | ) | | | (274,439 | ) |
Cimarex Energy Co. | | (3,437 | ) | | | (203,917 | ) |
Concho Resources, Inc. | | (2,519 | ) | | | (259,910 | ) |
EQT Corp. | | (16,402 | ) | | | (259,316 | ) |
HollyFrontier Corp. | | (5,758 | ) | | | (266,480 | ) |
Investments | | Shares | | Value |
COMMON STOCKS (continued) | |
Oil & Gas (continued) | | | | | | | |
Noble Energy, Inc. | | (11,717 | ) | | $ | (262,461 | ) |
Occidental Petroleum Corp. | | (4,907 | ) | | | (246,724 | ) |
Parsley Energy, Inc., Class A* | | (12,178 | ) | | | (231,504 | ) |
Transocean Ltd.* | | (33,313 | ) | | | (213,536 | ) |
WPX Energy, Inc.* | | (20,401 | ) | | | (234,816 | ) |
Total Oil & Gas | | | | | | (2,882,532 | ) |
Oil & Gas Services — (6.2)% | | | | | | | |
Baker Hughes a GE Co. | | (10,521 | ) | | | (259,132 | ) |
Core Laboratories N.V. | | (3,702 | ) | | | (193,541 | ) |
Halliburton Co. | | (9,903 | ) | | | (225,194 | ) |
National Oilwell Varco, Inc. | | (9,176 | ) | | | (203,983 | ) |
Patterson-UTI Energy, Inc. | | (15,785 | ) | | | (181,685 | ) |
RPC, Inc. | | (29,695 | ) | | | (214,101 | ) |
Schlumberger Ltd. | | (5,997 | ) | | | (238,321 | ) |
Total Oil & Gas Services | | | | | | (1,515,957 | ) |
Packaging & Containers — (0.8)% | |
Westrock Co. | | (5,464 | ) | | | (199,272 | ) |
Pharmaceuticals — (7.2)% | | | | | | | |
Agios Pharmaceuticals, Inc.* | | (4,919 | ) | | | (245,360 | ) |
Alkermes PLC* | | (9,782 | ) | | | (220,486 | ) |
Cigna Corp. | | (1,734 | ) | | | (273,192 | ) |
CVS Health Corp. | | (5,171 | ) | | | (281,768 | ) |
Mylan NV* | | (11,994 | ) | | | (228,366 | ) |
Nektar Therapeutics* | | (6,739 | ) | | | (239,773 | ) |
Perrigo Co. PLC | | (5,294 | ) | | | (252,100 | ) |
Total Pharmaceuticals | | | | | | (1,741,045 | ) |
REITS — (3.2)% | | | | | | | |
Macerich Co. (The) | | (6,893 | ) | | | (230,847 | ) |
Senior Housing Properties Trust | | (33,773 | ) | | | (279,303 | ) |
Weyerhaeuser Co. | | (10,042 | ) | | | (264,506 | ) |
Total REITS | | | | | | (774,656 | ) |
Retail — (6.7)% | | | | | | | |
L Brands, Inc. | | (9,848 | ) | | | (257,033 | ) |
Macy’s, Inc. | | (10,916 | ) | | | (234,257 | ) |
Michaels Cos., Inc. (The)* | | (23,297 | ) | | | (202,684 | ) |
Nordstrom, Inc. | | (6,797 | ) | | | (216,552 | ) |
Nu Skin Enterprises, Inc., Class A | | (5,471 | ) | | | (269,830 | ) |
Qurate Retail, Inc.* | | (15,013 | ) | | | (186,011 | ) |
Walgreens Boots Alliance, Inc. | | (4,909 | ) | | | (268,375 | ) |
Total Retail | | | | | | (1,634,742 | ) |
Semiconductors — (1.2)% | | | | | | | |
NVIDIA Corp. | | (1,809 | ) | | | (297,092 | ) |
See accompanying Notes to Financial Statements.
48
ADVISORSHARES DORSEY WRIGHT SHORT ETF
Schedule of Investments (continued) June30, 2019 |
Investments | | Shares | | Value |
COMMON STOCKS (continued) | |
Software — (2.3)% | | | | | | | |
Activision Blizzard, Inc. | | (5,650 | ) | | $ | (266,680 | ) |
Electronic Arts, Inc.* | | (2,886 | ) | | | (292,236 | ) |
Total Software | | | | | | (558,916 | ) |
Telecommunications — (2.0)% | |
CenturyLink, Inc. | | (22,125 | ) | | | (260,190 | ) |
CommScope Holding Co., Inc.* | | (14,310 | ) | | | (225,096 | ) |
Total Telecommunications | | | | | | (485,286 | ) |
Textiles — (1.3)% | | | | | | | |
Mohawk Industries, Inc.* | | (2,127 | ) | | | (313,669 | ) |
Toys/Games/Hobbies — (1.0)% | |
Mattel, Inc.* | | (21,894 | ) | | | (245,432 | ) |
Transportation — (2.0)% | | | | | | | |
FedEx Corp. | | (1,469 | ) | | | (241,195 | ) |
XPO Logistics, Inc.* | | (4,108 | ) | | | (237,484 | ) |
Total Transportation | | | | | | (478,679 | ) |
Investments | | Shares | | Value |
COMMON STOCKS (continued) | |
Total Securities Sold, Not Yet Purchased [Proceeds Received $(26,218,268)] | | | | | (25,019,947 | ) |
Total Investments — (40.2)%
(Cost $(10,963,148)) | | | | | (9,759,827 | ) |
Other Assets in Excess of Liabilities — 140.2% | | | | | 34,040,345 | |
Net Assets — 100.0% | | | | $ | 24,280,518 | |
The following is a summary of the inputs used, as of June30, 2019, in valuing the Fund’s assets and liabilities carried at fair value. These inputs are summarized in three broad levels. Level 1 includes quoted prices in active markets for identical securities. Level 2 includes other significant observable inputs (including quoted prices for similar securities, interest rates, prepayment speeds and credit risk). Level 3 includes significant unobservable inputs (including the Fund’s own assumptions in determining the fair value of investments). The level assigned to the securities valuations may not be an indication of the risk or liquidity associated with investing in those securities.
Assets | | Level 1 | | Level 2 | | Level 3 | | Total |
Exchange Traded Fund | | $ | 2,490,250 | | $ | — | | $ | — | | $ | 2,490,250 |
Money Market Fund | | | 12,769,870 | | | — | | | — | | | 12,769,870 |
Total | | $ | 15,260,120 | | $ | — | | $ | — | | $ | 15,260,120 |
Liabilities | | Level 1 | | Level 2 | | Level 3 | | Total |
Common Stocks | | $ | (25,019,947 | ) | | $ | — | | $ | — | | $ | (25,019,947 | ) |
Total | | $ | (25,019,947 | ) | | $ | — | | $ | — | | $ | (25,019,947 | ) |
See accompanying Notes to Financial Statements.
49
ADVISORSHARES DORSEY WRIGHT SHORT ETF
Schedule of Investments (continued) June30, 2019 |
SUMMARY OF SCHEDULE OF INVESTMENTS
| | % of
Net Assets |
Agriculture | | (1.2 | )% |
Apparel | | (1.1 | ) |
Auto Manufacturers | | (0.8 | ) |
Auto Parts & Equipment | | (3.6 | ) |
Banks | | (3.7 | ) |
Beverages | | (0.8 | ) |
Biotechnology | | (2.0 | ) |
Building Materials | | (2.4 | ) |
Chemicals | | (7.5 | ) |
Coal | | (1.1 | ) |
Commercial Services | | (4.4 | ) |
Computers | | (2.2 | ) |
Debt Fund | | 10.2 | |
Diversified Financial Services | | (1.9 | ) |
Electric | | (1.4 | ) |
Electronics | | (1.0 | ) |
Engineering & Construction | | (1.0 | ) |
Entertainment | | (0.9 | ) |
Food | | (3.0 | ) |
Healthcare – Products | | (2.4 | ) |
Healthcare – Services | | (2.2 | ) |
Home Builders | | (1.0 | ) |
Housewares | | (1.1 | ) |
SUMMARY OF SCHEDULE OF INVESTMENTS
(continued)
| | % of
Net Assets |
Insurance | | (2.2 | )% |
Internet | | (1.1 | ) |
Iron/Steel | | (2.0 | ) |
Machinery – Construction & Mining | | (2.3 | ) |
Machinery – Diversified | | (1.1 | ) |
Mining | | (0.8 | ) |
Miscellaneous Manufacturing | | (1.0 | ) |
Oil & Gas | | (11.9 | ) |
Oil & Gas Services | | (6.2 | ) |
Packaging & Containers | | (0.8 | ) |
Pharmaceuticals | | (7.2 | ) |
REITS | | (3.2 | ) |
Retail | | (6.7 | ) |
Semiconductors | | (1.2 | ) |
Software | | (2.3 | ) |
Telecommunications | | (2.0 | ) |
Textiles | | (1.3 | ) |
Toys/Games/Hobbies | | (1.0 | ) |
Transportation | | (2.0 | ) |
Money Market Fund | | 52.6 | |
Total Investments | | (40.2 | ) |
Other Assets in Excess of Liabilities | | 140.2 | |
Net Assets | | 100.0 | % |
Affiliated holdings are funds which are managed by the Trust or an affiliate of the Trust. Transactions with affiliated companies during the year ended June30, 2019 were as follows:
Affiliated Fund Name | | Value at
6/30/2018 | | Purchases/
Additions | | Sales/
Reductions | | Realized
Gain (Loss) | | Change in
Unrealized
Gain (Loss) | | Number of
Shares at
6/30/2019 | | Value at
6/30/2019 | | Dividend
Income |
AdvisorShares Sage Core Reserves ETF | | $ | — | | $ | 2,485,250 | | $ | — | | $ | — | | $ | 5,000 | | 25,000 | | $ | 2,490,250 | | $ | 44,294 |
See accompanying Notes to Financial Statements.
50
ADVISORSHARES DOUBLELINE VALUE EQUITY ETF
(Formerly known as AdvisorShares Wilshire Buyback ETF)
Schedule of Investments
June30, 2019 |
Investments | | Shares | | Value |
COMMON STOCKS — 97.3% | | | | | |
Aerospace/Defense — 6.3% | | | | | |
Boeing Co. (The) | | 3,300 | | $ | 1,201,233 |
General Dynamics Corp. | | 6,929 | | | 1,259,831 |
Northrop Grumman Corp. | | 4,317 | | | 1,394,866 |
Total Aerospace/Defense | | | | | 3,855,930 |
Agriculture — 3.3% | | | | | |
Philip Morris International, Inc. | | 25,390 | | | 1,993,877 |
Auto Manufacturers — 1.0% | | | | | |
General Motors Co. | | 16,408 | | | 632,200 |
Banks — 9.6% | | | | | |
Bank of America Corp. | | 50,206 | | | 1,455,974 |
Bank of New York Mellon Corp. (The) | | 26,112 | | | 1,152,845 |
JPMorgan Chase & Co. | | 15,799 | | | 1,766,328 |
PNC Financial Services Group, Inc. (The) | | 10,937 | | | 1,501,431 |
Total Banks | | | | | 5,876,578 |
Commercial Services — 4.1% | | | | | |
IHS Markit Ltd.* | | 16,608 | | | 1,058,262 |
PayPal Holdings, Inc.* | | 12,833 | | | 1,468,865 |
Total Commercial Services | | | | | 2,527,127 |
Diversified Financial Services — 5.1% |
Intercontinental Exchange, Inc. | | 18,016 | | | 1,548,295 |
Visa, Inc., Class A(a) | | 8,945 | | | 1,552,405 |
Total Diversified Financial Services | | | | | 3,100,700 |
Electric — 2.3% | | | | | |
American Electric Power Co., Inc. | | 8,364 | | | 736,116 |
Xcel Energy, Inc. | | 11,752 | | | 699,126 |
Total Electric | | | | | 1,435,242 |
Food — 2.8% | | | | | |
US Foods Holding Corp.* | | 48,791 | | | 1,744,766 |
Healthcare – Products — 0.4% |
Alcon, Inc. (Switzerland)*(a) | | 3,441 | | | 213,514 |
Healthcare – Services — 3.1% | | | | | |
Anthem, Inc. | | 6,785 | | | 1,914,795 |
Insurance — 4.0% | | | | | |
Chubb Ltd. | | 6,893 | | | 1,015,270 |
Willis Towers Watson PLC | | 7,483 | | | 1,433,294 |
Total Insurance | | | | | 2,448,564 |
Investments | | Shares | | Value |
COMMON STOCKS (continued) |
Internet — 5.1% | | | | | |
Alibaba Group Holding Ltd. (China)*(b) | | 7,038 | | $ | 1,192,589 |
Alphabet, Inc., Class A* | | 1,015 | | | 1,099,042 |
Amazon.com, Inc.* | | 441 | | | 835,091 |
Total Internet | | | | | 3,126,722 |
Media — 2.7% | | | | | |
Comcast Corp., Class A | | 39,695 | | | 1,678,305 |
Oil & Gas — 9.2% | | | | | |
Anadarko Petroleum Corp. | | 5,928 | | | 418,280 |
Chevron Corp. | | 18,273 | | | 2,273,892 |
EOG Resources, Inc. | | 10,823 | | | 1,008,271 |
Marathon Oil Corp. | | 50,784 | | | 721,640 |
Pioneer Natural Resources Co. | | 7,804 | | | 1,200,723 |
Total Oil & Gas | | | | | 5,622,806 |
Oil & Gas Services — 1.1% | | | | | |
Halliburton Co. | | 30,352 | | | 690,204 |
Pharmaceuticals — 13.0% | | | | | |
AstraZeneca PLC (United Kingdom)(a)(b) | | 43,839 | | | 1,809,674 |
Bayer AG (Germany)(b) | | 51,485 | | | 898,413 |
Cigna Corp. | | 6,771 | | | 1,066,771 |
CVS Health Corp. | | 20,744 | | | 1,130,341 |
Novartis AG (Switzerland)(a)(b) | | 17,211 | | | 1,571,536 |
Sanofi (France)(b) | | 34,864 | | | 1,508,565 |
Total Pharmaceuticals | | | | | 7,985,300 |
REITS — 3.9% | | | | | |
American Tower Corp. | | 11,554 | | | 2,362,215 |
Retail — 6.3% | | | | | |
Dollar General Corp. | | 10,469 | | | 1,414,990 |
Target Corp. | | 14,796 | | | 1,281,482 |
TJX Cos., Inc. (The) | | 22,650 | | | 1,197,732 |
Total Retail | | | | | 3,894,204 |
Software — 5.4% | | | | | |
Fidelity National Information Services, Inc.(a) | | 14,003 | | | 1,717,888 |
Microsoft Corp. | | 12,102 | | | 1,621,184 |
Total Software | | | | | 3,339,072 |
Telecommunications — 7.4% | | | | | |
Motorola Solutions, Inc. | | 8,124 | | | 1,354,515 |
Telefonaktiebolaget LM Ericsson (Sweden)(b) | | 101,128 | | | 960,716 |
Verizon Communications, Inc. | | 38,649 | | | 2,208,017 |
Total Telecommunications | | | | | 4,523,248 |
See accompanying Notes to Financial Statements.
51
ADVISORSHARES DOUBLELINE VALUE EQUITY ETF
(Formerly known as AdvisorShares Wilshire Buyback ETF)
Schedule of Investments (continued)
June30, 2019 |
Investments | | Shares/
Principal | | Value |
COMMON STOCKS (continued) | |
Transportation — 1.2% | | | | | | | |
FedEx Corp. | | | 4,478 | | $ | 735,243 | |
Total Common Stocks
(Cost $56,232,905) | | | | | | 59,700,612 | |
MONEY MARKET FUND — 2.7% | |
Wells Fargo Advantage Government Money Market Fund – Institutional Class, 2.27%(c)
(Cost $1,681,050) | | | 1,681,050 | | | 1,681,050 | |
REPURCHASE AGREEMENT — 0.2%(d) | |
RBC Dominion Securities, Inc., dated 06/28/19, due 07/01/19, 2.51%, total to be received $139,606, (collateralized by various U.S. Government Agency Obligations, 0.00% – 7.00%, 07/18/19 – 09/09/49, totaling $141,920)
(Cost $139,577) | | $ | 139,577 | | | 139,577 | |
Total Investments — 100.2% (Cost $58,053,532) | | | | | | 61,521,239 | |
Liabilities in Excess of Other Assets — (0.2%) | | | | | | (135,508 | ) |
Net Assets — 100.0% | | | | | $ | 61,385,731 | |
See accompanying Notes to Financial Statements.
52
ADVISORSHARES DOUBLELINE VALUE EQUITY ETF
(Formerly known as AdvisorShares Wilshire Buyback ETF)
Schedule of Investments (continued)
June30, 2019 |
Fair Value Measurements
The following is a summary of the inputs used, as of June30, 2019, in valuing the Fund’s assets and liabilities carried at fair value. These inputs are summarized in three broad levels. Level 1 includes quoted prices in active markets for identical securities. Level 2 includes other significant observable inputs (including quoted prices for similar securities, interest rates, prepayment speeds and credit risk). Level 3 includes significant unobservable inputs (including the Fund’s own assumptions in determining the fair value of investments). The level assigned to the securities valuations may not be an indication of the risk or liquidity associated with investing in those securities.
Assets | | Level 1 | | Level 2 | | Level 3 | | Total |
Common Stocks | | $ | 59,700,612 | | $ | — | | $ | — | | $ | 59,700,612 |
Money Market Fund | | | 1,681,050 | | | — | | | — | | | 1,681,050 |
Repurchase Agreement | | | — | | | 139,577 | | | — | | | 139,577 |
Total | | $ | 61,381,662 | | $ | 139,577 | | $ | — | | $ | 61,521,239 |
SUMMARY OF SCHEDULE OF INVESTMENTS
| | % of
Net Assets |
Aerospace/Defense | | 6.3 | % |
Agriculture | | 3.3 | |
Auto Manufacturers | | 1.0 | |
Banks | | 9.6 | |
Commercial Services | | 4.1 | |
Diversified Financial Services | | 5.1 | |
Electric | | 2.3 | |
Food | | 2.8 | |
Healthcare – Products | | 0.4 | |
Healthcare – Services | | 3.1 | |
Insurance | | 4.0 | |
Internet | | 5.1 | |
Media | | 2.7 | |
Oil & Gas | | 9.2 | |
Oil & Gas Services | | 1.1 | |
Pharmaceuticals | | 13.0 | |
REITS | | 3.9 | |
Retail | | 6.3 | |
Software | | 5.4 | |
Telecommunications | | 7.4 | |
Transportation | | 1.2 | |
Money Market Fund | | 2.7 | |
Repurchase Agreement | | 0.2 | |
Total Investments | | 100.2 | |
Liabilities in Excess of Other Assets | | (0.2 | ) |
Net Assets | | 100.0 | % |
See accompanying Notes to Financial Statements.
53
ADVISORSHARES FOCUSED EQUITY ETF
Schedule of Investments June30, 2019 |
Investments | | Shares | | Value |
COMMON STOCKS — 99.4% | | | | | |
Aerospace/Defense — 3.8% | | | | | |
Raytheon Co. | | 3,762 | | $ | 654,137 |
Banks — 7.4% | | | | | |
Eagle Bancorp, Inc. | | 11,614 | | | 628,666 |
Signature Bank | | 5,362 | | | 647,944 |
Total Banks | | | | | 1,276,610 |
Building Materials — 3.4% | | | | | |
Continental Building Products, Inc.* | | 22,166 | | | 588,951 |
Chemicals — 7.3% | | | | | |
RPM International, Inc. | | 9,738 | | | 595,089 |
Sherwin-Williams Co. (The) | | 1,451 | | | 664,979 |
Total Chemicals | | | | | 1,260,068 |
Commercial Services — 4.7% | | | | | |
Moody’s Corp. | | 4,120 | | | 804,677 |
Computers — 7.0% | | | | | |
Check Point Software Technologies Ltd. (Israel)* | | 5,423 | | | 626,953 |
Cognizant Technology Solutions Corp., Class A | | 9,013 | | | 571,334 |
Total Computers | | | | | 1,198,287 |
Diversified Financial Services — 3.8% |
Intercontinental Exchange, Inc. | | 7,693 | | | 661,137 |
Food — 11.2% | | | | | |
Hershey Co. (The) | | 5,285 | | | 708,348 |
Hormel Foods Corp. | | 13,242 | | | 536,831 |
JM Smucker Co. (The) | | 5,883 | | | 677,663 |
Total Food | | | | | 1,922,842 |
Healthcare – Products — 12.9% |
Becton Dickinson and Co. | | 2,582 | | | 650,690 |
Danaher Corp. | | 5,639 | | | 805,926 |
Stryker Corp. | | 3,719 | | | 764,552 |
Total Healthcare– Products | | | | | 2,221,168 |
Household Products/Wares — 3.7% |
Church & Dwight Co., Inc. | | 8,669 | | | 633,357 |
Investments | | Shares | | Value |
COMMON STOCKS (continued) | |
Insurance — 8.1% | | | | | | |
Aflac, Inc. | | 12,783 | | $ | 700,636 | |
Torchmark Corp. | | 7,684 | | | 687,411 | |
Total Insurance | | | | | 1,388,047 | |
Media — 9.0% | | | | | | |
FactSet Research Systems, Inc.(a) | | 2,834 | | | 812,111 | |
Walt Disney Co. (The) | | 5,313 | | | 741,907 | |
Total Media | | | | | 1,554,018 | |
Retail — 3.9% | | | | | | |
Ross Stores, Inc. | | 6,853 | | | 679,269 | |
Software — 13.2% | | | | | | |
Broadridge Financial Solutions, Inc. | | 5,870 | | | 749,482 | |
Cerner Corp. | | 10,988 | | | 805,420 | |
Fiserv, Inc.*(a) | | 7,790 | | | 710,136 | |
Total Software | | | | | 2,265,038 | |
Total Common Stocks
(Cost $13,196,600) | | | | | 17,107,606 | |
MONEY MARKET FUND — 0.9% | |
BlackRock Liquidity Funds Treasury Trust Fund Portfolio, Institutional Class, 2.15%(b)
(Cost $150,790) | | 150,790 | | | 150,790 | |
Total Investments — 100.3%
(Cost $13,347,390) | | | | | 17,258,396 | |
Liabilities in Excess of Other Assets — (0.3%) | | | | | (47,370 | ) |
Net Assets — 100.0% | | | | $ | 17,211,026 | |
See accompanying Notes to Financial Statements.
54
ADVISORSHARES FOCUSED EQUITY ETF
Schedule of Investments (continued) June30, 2019 |
Fair Value Measurements
The following is a summary of the inputs used, as of June30, 2019, in valuing the Fund’s assets and liabilities carried at fair value. These inputs are summarized in three broad levels. Level 1 includes quoted prices in active markets for identical securities. Level 2 includes other significant observable inputs (including quoted prices for similar securities, interest rates, prepayment speeds and credit risk). Level 3 includes significant unobservable inputs (including the Fund’s own assumptions in determining the fair value of investments). The level assigned to the securities valuations may not be an indication of the risk or liquidity associated with investing in those securities.
Assets | | Level 1 | | Level 2 | | Level 3 | | Total |
Common Stocks | | $ | 17,107,606 | | $ | — | | $ | — | | $ | 17,107,606 |
Money Market Fund | | | 150,790 | | | — | | | — | | | 150,790 |
Total | | $ | 17,258,396 | | $ | — | | $ | — | | $ | 17,258,396 |
SUMMARY OF SCHEDULE OF INVESTMENTS
| | % of
Net Assets |
Aerospace/Defense | | 3.8 | % |
Banks | | 7.4 | |
Building Materials | | 3.4 | |
Chemicals | | 7.3 | |
Commercial Services | | 4.7 | |
Computers | | 7.0 | |
Diversified Financial Services | | 3.8 | |
Food | | 11.2 | |
Healthcare – Products | | 12.9 | |
Household Products/Wares | | 3.7 | |
Insurance | | 8.1 | |
Media | | 9.0 | |
Retail | | 3.9 | |
Software | | 13.2 | |
Money Market Fund | | 0.9 | |
Total Investments | | 100.3 | |
Liabilities in Excess of Other Assets | | (0.3 | ) |
Net Assets | | 100.0 | % |
See accompanying Notes to Financial Statements.
55
ADVISORSHARES FOLIOBEYOND SMART CORE BOND ETF
(Formerly known as AdvisorShares Madrona Global Bond ETF)
Schedule of Investments
June30, 2019 |
Investments | | Shares/
Principal | | Value |
EXCHANGE TRADED FUNDS — 99.7% |
Debt Fund — 70.0% | | | | | | |
Invesco Senior Loan ETF(a) | | | 3,791 | | $ | 85,904 |
iShares 0-5 Year High Yield Corporate Bond ETF | | | 10,986 | | | 513,046 |
iShares 20+ Year Treasury Bond ETF(a) | | | 3,917 | | | 520,217 |
SPDR Bloomberg Barclays Short Term High Yield Bond ETF | | | 43,905 | | | 1,195,533 |
SPDR Nuveen S&P High Yield Municipal Bond ETF | | | 8,927 | | | 521,783 |
VanEck Vectors High-Yield Municipal Index ETF(a) | | | 19,080 | | | 1,216,923 |
Total Debt Fund | | | | | | 4,053,406 |
Equity Fund — 29.7% | | | | | | |
iShares Mortgage Real Estate ETF | | | 40,700 | | | 1,716,726 |
Total Exchange Traded Funds
(Cost $5,670,014) | | | | | | 5,770,132 |
MONEY MARKET FUND — 0.7% |
BlackRock Liquidity Funds FedFund Portfolio, Institutional Class, 2.29%(b) (Cost $37,605) | | | 37,605 | | | 37,605 |
REPURCHASE AGREEMENTS — 11.0%(c) |
BNP Paribas Securities Corp., dated 06/28/19, due 07/01/19, 2.48%, total to be received $133,850, (collateralized by various U.S. Government Agency Obligations, 0.00% – 8.13%, 06/30/19 – 02/15/49, totaling $136,216) | | $ | 133,822 | | | 133,822 |
Daiwa Capital Markets America, dated 06/28/19, due 07/01/19, 2.53%, total to be received $250,053, (collateralized by various U.S. Government Agency Obligations, 0.00% – 6.50%, 07/05/19 – 09/09/49, totaling $254,149) | | | 250,000 | | | 250,000 |
Investments | |
Principal
| | Value |
REPURCHASE AGREEMENTS (continued) | |
RBC Dominion Securities, Inc., dated 06/28/19, due 07/01/19, 2.51%, total to be received $250,052, (collateralized by various U.S. Government Agency Obligations, 0.00% – 7.00%, 07/18/19 – 09/09/49, totaling $254,197) | | $ | 250,000 | | $ | 250,000 | |
Total Repurchase Agreements
(Cost $633,822) | | | | | | 633,822 | |
Total Investments — 111.4%
(Cost $6,341,441) | | | | | | 6,441,559 | |
Liabilities in Excess of Other Assets — (11.4%) | | | | | | (656,892 | ) |
Net Assets — 100.0% | | | | | $ | 5,784,667 | |
See accompanying Notes to Financial Statements.
56
ADVISORSHARES FOLIOBEYOND SMART CORE BOND ETF
(Formerly known as AdvisorShares Madrona Global Bond ETF)
Schedule of Investments (continued)
June30, 2019 |
Fair Value Measurements
The following is a summary of the inputs used, as of June30, 2019, in valuing the Fund’s assets and liabilities carried at fair value. These inputs are summarized in three broad levels. Level 1 includes quoted prices in active markets for identical securities. Level 2 includes other significant observable inputs (including quoted prices for similar securities, interest rates, prepayment speeds and credit risk). Level 3 includes significant unobservable inputs (including the Fund’s own assumptions in determining the fair value of investments). The level assigned to the securities valuations may not be an indication of the risk or liquidity associated with investing in those securities.
Assets | | Level 1 | | Level 2 | | Level 3 | | Total |
Exchange Traded Funds | | $ | 5,770,132 | | $ | — | | $ | — | | $ | 5,770,132 |
Money Market Fund | | | 37,605 | | | — | | | — | | | 37,605 |
Repurchase Agreements | | | — | | | 633,822 | | | — | | | 633,822 |
Total | | $ | 5,807,737 | | $ | 633,822 | | $ | — | | $ | 6,441,559 |
SUMMARY OF SCHEDULE OF INVESTMENTS
| | % of
Net Assets |
Debt Fund | | 70.0 | % |
Equity Fund | | 29.7 | |
Money Market Fund | | 0.7 | |
Repurchase Agreements | | 11.0 | |
Total Investments | | 111.4 | |
Liabilities in Excess of Other Assets | | (11.4 | ) |
Net Assets | | 100.0 | % |
See accompanying Notes to Financial Statements.
57
ADVISORSHARES NEW TECH AND MEDIA ETF
Schedule of Investments June30, 2019 |
Investments | | Shares | | Value |
COMMON STOCKS — 82.4% | | | | | |
Advertising — 4.5% | | | | | |
Trade Desk, Inc. (The),
Class A*(a) | | 2,871 | | $ | 653,956 |
Biotechnology — 19.0% | | | | | |
Amarin Corp. PLC (Ireland)*(a)(b) | | 141,138 | | | 2,736,666 |
Internet — 36.4% | | | | | |
Alphabet, Inc., Class C* | | 51 | | | 55,127 |
Amazon.com, Inc.* | | 780 | | | 1,477,032 |
Facebook, Inc., Class A* | | 3,059 | | | 590,387 |
Netflix, Inc.* | | 1,712 | | | 628,852 |
Okta, Inc.* | | 5,073 | | | 626,566 |
Shopify, Inc., Class A (Canada)* | | 1,956 | | | 587,093 |
Zendesk, Inc.* | | 7,179 | | | 639,146 |
Zscaler, Inc.*(a) | | 8,614 | | | 660,177 |
Total Internet | | | | | 5,264,380 |
Semiconductors — 4.1% | | | | | |
Advanced Micro Devices, Inc.*(a) | | 19,565 | | | 594,189 |
Software — 18.4% | | | | | |
Microsoft Corp. | | 3,685 | | | 493,642 |
MongoDB, Inc.*(a) | | 3,308 | | | 503,114 |
Slack Technologies, Inc.,
Class A* | | 17,608 | | | 660,300 |
Twilio, Inc., Class A*(a) | | 2,679 | | | 365,282 |
Zoom Video Communications, Inc., Class A* | | 7,179 | | | 637,423 |
Total Software | | | | | 2,659,761 |
Total Common Stocks
(Cost $11,649,166) | | | | | 11,908,952 |
EXCHANGE TRADED FUND — 12.1% |
Equity Fund — 12.1% | | | | | |
AdvisorShares Sabretooth ETF*†(a)
(Cost $1,709,786) | | 64,896 | | | 1,752,192 |
MONEY MARKET FUND — 2.8% |
Dreyfus Institutional Treasury and Agency Cash Advantage Fund, 2.27%(c) (Cost $408,887) | | 408,887 | | | 408,887 |
Investments | | Principal | | Value |
REPURCHASE AGREEMENTS — 22.4%(d) | |
BofA Securities, Inc., dated 06/28/19, due 07/01/19, 2.50%, total to be received $755,718, (collateralized by various U.S. Government Agency Obligations, 3.30% – 4.50%, 06/01/46 – 07/01/49, totaling $768,532) | | $ | 755,561 | | $ | 755,561 | |
Citigroup Global Markets, Inc., dated 06/28/19, due 07/01/19, 2.50%, total to be received $755,718, (collateralized by various U.S. Government Agency Obligations, 0.00% – 9.50%, 07/02/19 – 01/20/63, totaling $767,800) | | | 755,561 | | | 755,561 | |
Daiwa Capital Markets America, dated 06/28/19, due 07/01/19, 2.53%, total to be received $755,720, (collateralized by various U.S. Government Agency Obligations, 0.00% – 6.50%, 07/05/19 – 09/09/49, totaling $768,101) | | | 755,561 | | | 755,561 | |
JP Morgan Securities LLC, dated 06/28/19, due 07/01/19, 2.53%, total to be received $223,824, (collateralized by various U.S. Government Agency Obligations, 0.88% – 1.75%, 07/31/19 – 06/30/22, totaling $226,962) | | | 223,777 | | | 223,777 | |
RBC Dominion Securities, Inc., dated 06/28/19, due 07/01/19, 2.51%, total to be received $755,719, (collateralized by various U.S. Government Agency Obligations, 0.00% – 7.00%, 07/18/19 – 09/09/49, totaling $768,246) | | | 755,561 | | | 755,561 | |
Total Repurchase Agreements
(Cost $3,246,021) | | | | | | 3,246,021 | |
Total Investments — 119.7%
(Cost $17,013,860) | | | | | | 17,316,052 | |
Liabilities in Excess of Other Assets — (19.7%) | | | | | | (2,859,767 | ) |
Net Assets — 100.0% | | | | | $ | 14,456,285 | |
See accompanying Notes to Financial Statements.
58
ADVISORSHARES NEW TECH AND MEDIA ETF
Schedule of Investments (continued) June30, 2019 |
Fair Value Measurements
The following is a summary of the inputs used, as of June30, 2019, in valuing the Fund’s assets and liabilities carried at fair value. These inputs are summarized in three broad levels. Level 1 includes quoted prices in active markets for identical securities. Level 2 includes other significant observable inputs (including quoted prices for similar securities, interest rates, prepayment speeds and credit risk). Level 3 includes significant unobservable inputs (including the Fund’s own assumptions in determining the fair value of investments). The level assigned to the securities valuations may not be an indication of the risk or liquidity associated with investing in those securities.
Assets | | Level 1 | | Level 2 | | Level 3 | | Total |
Common Stocks | | $ | 11,908,952 | | $ | — | | $ | — | | $ | 11,908,952 |
Exchange Traded Fund | | | 1,752,192 | | | — | | | — | | | 1,752,192 |
Money Market Fund | | | 408,887 | | | — | | | — | | | 408,887 |
Repurchase Agreements | | | — | | | 3,246,021 | | | — | | | 3,246,021 |
Total | | $ | 14,070,031 | | $ | 3,246,021 | | $ | — | | $ | 17,316,052 |
SUMMARY OF SCHEDULE OF INVESTMENTS
| | % of
Net Assets | | |
Advertising | | 4.5 | % | |
Biotechnology | | 19.0 | | |
Equity Fund | | 12.1 | | |
Internet | | 36.4 | | |
Semiconductors | | 4.1 | | |
Software | | 18.4 | | |
Money Market Fund | | 2.8 | | |
Repurchase Agreements | | 22.4 | | |
Total Investments | | 119.7 | | |
Liabilities in Excess of Other Assets | | (19.7 | ) | |
Net Assets | | 100.0 | % | |
Affiliated holdings are funds which are managed by the Trust or an affiliate of the Trust. Transactions with affiliated companies during the year ended June30, 2019 were as follows:
Affiliated Fund Name | | Value at
6/30/2018 | | Purchases/
Additions | | Sales/
Reductions | | Realized
Gain (Loss) | | Change in
Unrealized
Gain (Loss) | | Number of
Shares at
6/30/2019 | | Value at
6/30/2019 | | Dividend
Income |
AdvisorShares Dorsey Wright Short ETF | | $ | — | | $ | 2,506,000 | | $ | (2,495,073 | ) | | $ | (10,927 | ) | | $ | — | | — | | $ | — | | $ | — |
AdvsorShares Sabretooth ETF | | | — | | | 9,316,461 | | | (7,611,439 | ) | | | 4,764 | | | | 42,406 | | 64,896 | | | 1,752,192 | | | — |
Total | | $ | — | | $ | 11,822,461 | | $ | (10,106,512 | ) | | $ | (6,163 | ) | | $ | 42,406 | | 64,896 | | $ | 1,752,192 | | $ | — |
See accompanying Notes to Financial Statements.
59
ADVISORSHARES NEWFLEET MULTI-SECTOR INCOME ETF
Schedule of Investments June30, 2019 |
Investments | | Principal | | Value |
MORTGAGE BACKED SECURITIES — 33.1% |
Commercial Mortgage Backed Securities — 4.2% |
Access Point Funding I LLC, Class A, Series 2017-A, 3.06%, 04/15/29‡ | | $ | 248,682 | | $ | 248,570 |
Aventura Mall Trust, Class C, Series 2013-AVM, 3.87%, 12/05/32@‡* | | | 250,000 | | | 253,687 |
Bayview Commercial Asset Trust, Class A2, Series 2006-2A, 2.68%, (1-Month USD LIBOR + 0.28%), 07/25/36@‡ | | | 157,667 | | | 152,460 |
BX Trust, Class B, Series 2018-GW, 3.41%, (1-Month USD LIBOR + 1.02%), 05/15/35@‡ | | | 700,000 | | | 700,492 |
Caesars Palace Las Vegas Trust, Class C, Series 2017-VICI, 4.14%, 10/15/34‡ | | | 445,000 | | | 465,050 |
Commercial Mortgage Lease-Backed Certificates, Class A3, Series 2001-CMLB, 7.47%, 06/20/31@‡* | | | 460,000 | | | 474,649 |
Sutherland Commercial Mortgage Loans, Class A, Series 2017-SBC6, 3.19%, 05/25/37@‡* | | | 195,710 | | | 196,593 |
Sutherland Commercial Mortgage Loans, Class A, Series 2018-SBC7, 4.72%, 05/25/39@‡* | | | 299,863 | | | 303,209 |
Velocity Commercial Capital Loan Trust, Class AFX, Series 2017-1, 3.00%, 05/25/47@‡* | | | 114,582 | | | 114,185 |
Wells Fargo Commercial Mortgage Trust, Class A5, Series 2015-LC20, 3.18%, 04/15/50 | | | 255,000 | | | 264,323 |
Total Commercial Mortgage Backed Securities | | | | | | 3,173,218 |
Residential Mortgage Backed Securities — 28.9% |
Ajax Mortgage Loan Trust, Class A, Series 2017-B, 3.16%, 09/25/56@‡* | | | 243,372 | | | 245,656 |
Alternative Loan Trust, Class 1A1, Series 2004-22CB, 6.00%, 10/25/34 | | | 87,678 | | | 90,326 |
Angel Oak Mortgage Trust I LLC, Class A1, Series 2018-1, 3.26%, 04/27/48@‡* | | | 165,177 | | | 166,431 |
Angel Oak Mortgage Trust I LLC, Class A1, Series 2018-2, 3.67%, 07/27/48@‡* | | | 112,341 | | | 114,481 |
Arroyo Mortgage Trust, Class A1, Series 2019-2, 3.35%, 04/25/49@‡* | | | 147,060 | | | 149,580 |
Investments | | Principal | | Value |
MORTGAGE BACKED SECURITIES (continued) |
Residential Mortgage Backed Securities (continued) |
Asset Backed Funding Certificates Trust, Class A6, Series 2005-AQ1, 4.74%, 01/25/35 | | $ | 50,827 | | $ | 52,676 |
Banc of America Funding Trust, Class 5A1, Series 2004-A, 5.00%, 07/20/34@* | | | 152,598 | | | 155,704 |
Banc of America Funding Trust, Class 1A1, Series 2005-1, 5.50%, 02/25/35 | | | 138,979 | | | 142,690 |
Bayview Financial Acquisition Trust, Class 1A2, Series 2007-A, 6.21%, 05/28/37 | | | 87,533 | | | 87,856 |
Bayview Koitere Fund Trust, Class A, Series 2017-RT4, 3.50%, 07/28/57@‡* | | | 170,376 | | | 174,585 |
Bayview Opportunity Master Fund IVb Trust, Class A, Series 2017-SPL4, 3.50%, 01/28/55@‡* | | | 344,163 | | | 351,448 |
Bear Stearns ALT-A Trust, Class 3A1, Series 2004-5, 4.65%, 06/25/34@* | | | 224,425 | | | 231,894 |
Bear Stearns ARM Trust, Class 21A1, Series 2004-10, 4.56%, 01/25/35@* | | | 502,186 | | | 515,140 |
Bunker Hill Loan Depositary Trust, Class A1, Series 2019-1, 3.61%, 10/26/48‡ | | | 151,311 | | | 155,125 |
Centex Home Equity Loan Trust, Class AF5, Series 2004-D, 5.85%, 09/25/34 | | | 164,352 | | | 166,930 |
Chase Home Lending Mortgage Trust, Class A4, Series 2019-ATR1, 4.00%, 04/25/49@‡* | | | 462,540 | | | 472,176 |
Citigroup Mortgage Loan Trust, Inc., Class A, Series 2014-A, 4.00%, 01/25/35@‡* | | | 324,505 | | | 338,909 |
Citigroup Mortgage Loan Trust, Inc., Class A, Series 2013-A, 3.00%, 05/25/42@‡* | | | 665,939 | | | 658,657 |
Citigroup Mortgage Loan Trust, Inc., Class A1, Series 2015-PS1, 3.75%, 09/25/42@‡* | | | 181,643 | | | 186,686 |
Citigroup Mortgage Loan Trust, Inc., Class A1, Series 2015-A, 3.50%, 06/25/58@‡* | | | 339,958 | | | 344,877 |
Citigroup Mortgage Loan Trust, Inc., Class A1, Series 2018-RP3, 3.25%, 03/25/61@‡* | | | 337,630 | | | 345,022 |
See accompanying Notes to Financial Statements.
60
ADVISORSHARES NEWFLEET MULTI-SECTOR INCOME ETF
Schedule of Investments (continued) June30, 2019 |
Investments | | Principal | | Value |
MORTGAGE BACKED SECURITIES (continued) |
Residential Mortgage Backed Securities (continued) |
Citigroup Mortgage Loan Trust, Inc., Class A1, Series 2018-RP1, 3.00%, 09/25/64@‡* | | $ | 176,646 | | $ | 179,594 |
COLT Mortgage Loan Trust, Class A1, Series 2018-2, 3.47%, 07/27/48@‡* | | | 175,833 | | | 176,928 |
COLT Mortgage Loan Trust, Class A1, Series 2019-1, 3.71%, 03/25/49@‡* | | | 399,381 | | | 406,951 |
Corevest American Finance Trust, Class A, Series
2018-1, 3.80%, 06/15/51‡ | | | 290,976 | | | 301,364 |
Countrywide Asset-Backed Certificates, Class A3, Series 2004-S1, 5.12%, 02/25/35 | | | 170,252 | | | 172,142 |
Credit Suisse Commercial Mortgage Trust, Class A16, Series 2013-HYB1, 3.01%, 04/25/43@‡* | | | 316,093 | | | 316,216 |
Credit Suisse Commercial Mortgage Trust, Class A2, Series 2014-IVR2, 3.76%, 04/25/44@‡* | | | 422,987 | | | 425,234 |
Credit Suisse First Boston Mortgage Securities Corp., Class 6A1, Series 2004-AR8, 4.37%, 09/25/34@* | | | 49,125 | | | 50,185 |
Credit Suisse First Boston Mortgage-Backed
Pass-Through Certificates, Class 6A1, Series 2004-8, 4.50%, 12/25/19 | | | 23,583 | | | 23,561 |
Credit Suisse First Boston Mortgage-Backed Pass-Through Certificates, Class 5A1, Series 2003-AR30, 4.50%, 01/25/34@* | | | 114,929 | | | 120,211 |
Deephaven Residential Mortgage Trust, Class A1, Series 2017-2A, 2.45%, 06/25/47@‡* | | | 87,385 | | | 87,546 |
Deephaven Residential Mortgage Trust, Class A3, Series 2017-3A, 2.81%, 10/25/47@‡* | | | 96,107 | | | 96,132 |
Deephaven Residential Mortgage Trust, Class A1, Series 2019-1A, 3.74%, 01/25/59@‡* | | | 280,688 | | | 284,398 |
Ellington Financial Mortgage Trust, Class A1, Series 2017-1, 2.69%, 10/25/47@‡* | | | 224,783 | | | 224,621 |
Galton Funding Mortgage Trust, Class A21, Series 2017-1, 3.50%, 07/25/56@‡* | | | 519,938 | | | 526,504 |
Investments | | Principal | | Value |
MORTGAGE BACKED SECURITIES (continued) |
Residential Mortgage Backed Securities (continued) |
Galton Funding Mortgage Trust, Class A41, Series 2018-2, 4.50%, 10/25/58@‡* | | $ | 143,456 | | $ | 147,635 |
GSAA Trust, Class AF4, Series 2005-1, 5.62%, 11/25/34 | | | 26,688 | | | 26,835 |
GSR Mortgage Loan Trust, Class 1A6, Series 2003-3F, 6.00%, 04/25/33 | | | 199,041 | | | 212,161 |
GSR Mortgage Loan Trust, Class 3A1, Series 2004-7, 4.09%, 06/25/34@* | | | 187,012 | | | 187,117 |
Homeward Opportunities Fund I Trust, Class A1, Series 2018-1, 3.77%, 06/25/48@‡* | | | 334,802 | | | 342,021 |
Homeward Opportunities Fund I Trust, Class A1, Series 2019-1, 3.45%, 01/25/59@‡* | | | 337,551 | | | 342,887 |
JPMorgan Mortgage Trust, Class AM, Series 2014-2, 3.37%, 06/25/29@‡* | | | 478,666 | | | 486,696 |
JPMorgan Mortgage Trust, Class 2A2, Series 2014-2, 3.50%, 06/25/29@‡* | | | 257,667 | | | 264,173 |
JPMorgan Mortgage Trust, Class 4A1, Series 2006-A2, 4.70%, 08/25/34@* | | | 123,620 | | | 129,674 |
JPMorgan Mortgage Trust, Class 4A1, Series 2005-A2, 4.60%, 04/25/35@* | | | 295,525 | | | 302,191 |
JPMorgan Mortgage Trust, Class AM1, Series 2015-1, 3.66%, 12/25/44@‡* | | | 211,503 | | | 211,503 |
JPMorgan Mortgage Trust, Class A2, Series 2015-5, 3.34%, 05/25/45@‡* | | | 420,515 | | | 421,427 |
LHOME Mortgage Trust, Class A1, Series 2019-RTL1, 4.58%, 10/25/23‡ | | | 315,000 | | | 323,219 |
MASTR Alternative Loan Trust, Class 6A1, Series 2004-4, 5.50%, 04/25/34 | | | 207,890 | | | 220,770 |
MASTR Alternative Loan Trust, Class 2A1, Series 2005-2, 6.00%, 01/25/35 | | | 146,424 | | | 156,298 |
MASTR Specialized Loan Trust, Class A2, Series 2005-3, 5.70%, 11/25/35‡ | | | 128,356 | | | 130,299 |
Merrill Lynch Mortgage Investors Trust, Class A1, Series 2004-A4, 4.35%, 08/25/34@* | | | 403,519 | | | 408,404 |
Mill City Mortgage Loan Trust, Class A1, Series 2016-1, 2.50%, 04/25/57@‡* | | | 391,166 | | | 391,785 |
National City Mortgage Capital Trust, Class 2A1, Series 2008-1, 6.00%, 03/25/38 | | | 107,905 | | | 112,672 |
See accompanying Notes to Financial Statements.
61
ADVISORSHARES NEWFLEET MULTI-SECTOR INCOME ETF
Schedule of Investments (continued) June30, 2019 |
Investments | | Principal | | Value |
MORTGAGE BACKED SECURITIES (continued) |
Residential Mortgage Backed Securities (continued) |
New Residential Mortgage Loan Trust, Class A1, Series 2019-NQM1, 3.67%, 01/25/49@‡* | | $ | 105,717 | | $ | 108,074 |
New Residential Mortgage Loan Trust, Class A3, Series 2014-2A, 3.75%, 05/25/54@‡* | | | 130,907 | | | 133,738 |
New Residential Mortgage Loan Trust, Class A1, Series 2016-3A, 3.75%, 09/25/56@‡* | | | 534,371 | | | 553,971 |
New Residential Mortgage Loan Trust, Class A1, Series 2016-4A, 3.75%, 11/25/56@‡* | | | 354,248 | | | 367,624 |
OBX Trust, Class A3, Series 2019-INV1, 4.50%, 11/25/48@‡* | | | 280,021 | | | 289,908 |
Pretium Mortgage Credit Partners I LLC, Class A1, Series 2018-NPL3, 4.13%, 08/25/33‡ | | | 177,148 | | | 178,794 |
PRPM LLC, Class A1, Series 2019-2A, 3.97%, 04/25/24‡ | | | 250,622 | | | 254,577 |
RASC Series Trust, Class AI6, Series 2004-KS2, 4.30%, 03/25/34@* | | | 10,593 | | | 10,656 |
RCO V Mortgage LLC, Class A1, Series 2019-1, 3.72%, 05/24/24‡ | | | 203,129 | | | 205,068 |
Residential Mortgage Loan Trust, Class A1, Series 2019-1, 3.94%, 10/25/58@‡* | | | 269,448 | | | 274,674 |
Starwood Waypoint Homes Trust, Class A, Series 2017-1, 3.34%, (1-Month USD LIBOR + 0.95%), 01/17/35@‡ | | | 491,150 | | | 491,228 |
Structured Adjustable Rate Mortgage Loan Trust, Class 6A, Series 2004-1, 4.74%, 02/25/34@* | | | 211,884 | | | 216,085 |
Structured Adjustable Rate Mortgage Loan Trust, Class 3A1, Series 2004-4, 4.71%, 04/25/34@* | | | 58,608 | | | 60,963 |
Structured Adjustable Rate Mortgage Loan Trust, Class 3A2, Series 2004-4, 4.71%, 04/25/34@* | | | 312,119 | | | 325,334 |
Structured Asset Securities Corp., Class 2A, Series 2003-37A, 4.53%, 12/25/33@* | | | 134,230 | | | 137,831 |
Investments | | Principal | | Value |
MORTGAGE BACKED SECURITIES (continued) |
Residential Mortgage Backed Securities (continued) |
Structured Asset Securities Corp., Class A3A, Series 2004-4XS, 5.21%, 02/25/34 | | $ | 394,191 | | $ | 414,697 |
Structured Asset Securities Corp. Mortgage Pass-Through Certificates, Class 6A, Series 2003-34A, 4.82%, 11/25/33@* | | | 160,172 | | | 163,214 |
Towd Point HE Trust, Class A1, Series 2019-HE1, 3.34%, (1-Month USD LIBOR + 0.90%), 04/25/48@‡ | | | 160,000 | | | 159,491 |
Towd Point Mortgage Trust, Class A2, Series 2015-5, 3.50%, 05/25/55@‡* | | | 250,000 | | | 257,062 |
Towd Point Mortgage Trust, Class A1, Series 2016-3, 2.25%, 04/25/56@‡* | | | 315,839 | | | 314,794 |
Towd Point Mortgage Trust, Class A1, Series 2016-4, 2.25%, 07/25/56@‡* | | | 359,473 | | | 358,333 |
Towd Point Mortgage Trust, Class A1, Series 2017-1, 2.75%, 10/25/56@‡* | | | 211,547 | | | 212,915 |
Vericrest Opportunity Loan Trust, Class A1, Series 2019-NPL2, 3.97%, 02/25/49‡ | | | 217,520 | | | 220,107 |
Verus Securitization Trust, Class A1, Series 2017-1A, 2.85%, 01/25/47@‡* | | | 78,581 | | | 78,910 |
Verus Securitization Trust, Class A1, Series 2018-1, 2.93%, 02/25/48@‡* | | | 252,689 | | | 253,452 |
Verus Securitization Trust, Class A3, Series 2018-INV1, 4.05%, 03/25/58@‡* | | | 77,788 | | | 79,396 |
Verus Securitization Trust, Class A1, Series 2018-3, 4.11%, 10/25/58@‡* | | | 179,148 | | | 183,755 |
Verus Securitization Trust, Class A1, Series 2019-2, 3.21%, 04/25/59@‡* | | | 197,509 | | | 199,310 |
Verus Securitization Trust, Class A1, Series 2019-INV1, 3.40%, 12/25/59@‡* | | | 288,748 | | | 292,681 |
VOLT LXXI LLC, Class A1A, Series 2018-NPL7, 3.97%, 09/25/48‡ | | | 127,764 | | | 129,065 |
VOLT LXXV LLC, Class A1A, Series 2019-NPL1, 4.34%, 01/25/49‡ | | | 287,071 | | | 291,793 |
See accompanying Notes to Financial Statements.
62
ADVISORSHARES NEWFLEET MULTI-SECTOR INCOME ETF
Schedule of Investments (continued) June30, 2019 |
Investments | | Principal | | Value |
MORTGAGE BACKED SECURITIES (continued) |
Residential Mortgage Backed Securities (continued) |
WaMu Mortgage Pass-Through Certificates Trust, Class A1, Series 2003-AR6, 4.72%, 06/25/33@* | | $ | 107,550 | | $ | 111,233 |
Washington Mutual MSC Mortgage Pass-Through Certificates Trust, Class 2A1, Series 2003-AR4, 4.08%, 08/25/33@* | | | 63,443 | | | 63,044 |
Wells Fargo Mortgage Backed Securities Trust, Class A1, Series 2003-G, 4.55%, 06/25/33@* | | | 14,360 | | | 14,849 |
Wells Fargo Mortgage Backed Securities Trust, Class 5A1, Series 2003-J, 4.62%, 10/25/33@* | | | 98,978 | | | 102,616 |
Wells Fargo Mortgage Backed Securities Trust, Class 2A1, Series 2003-J, 4.58%, 10/25/33@* | | | 87,831 | | | 90,267 |
Wells Fargo Mortgage Backed Securities Trust, Class A1, Series 2004-A, 5.01%, 02/25/34@* | | | 160,850 | | | 168,175 |
Wells Fargo Mortgage Backed Securities Trust, Class 1A2, Series 2004-K, 4.99%, 07/25/34@* | | | 155,633 | | | 160,367 |
Wells Fargo Mortgage Backed Securities Trust, Class 2A12, Series 2004-K, 4.94%, 07/25/34@* | | | 48,331 | | | 50,476 |
Wells Fargo Mortgage Backed Securities Trust, Class A1, Series 2004-U, 4.86%, 10/25/34@* | | | 214,174 | | | 218,986 |
Wells Fargo Mortgage Backed Securities Trust, Class 2A1, Series 2004-Z, 4.97%, 12/25/34@* | | | 46,107 | | | 47,439 |
Wells Fargo Mortgage Backed Securities Trust, Class 2A1, Series 2005-14, 5.50%, 12/25/35 | | | 50,176 | | | 52,897 |
Total Residential Mortgage Backed Securities | | | | | | 21,654,052 |
Total Mortgage Backed Securities(Cost $24,597,325) | | | | | | 24,827,270 |
ASSET BACKED SECURITIES — 31.4% |
ACC Trust, Class A, Series 2018-1, 3.70%, 12/21/20‡ | | | 115,062 | | | 115,241 |
ACC Trust, Class A, Series 2019-1, 3.75%, 05/20/22‡ | | | 260,769 | | | 263,444 |
Investments | | Principal | | Value |
ASSET BACKED SECURITIES (continued) |
American Credit Acceptance Receivables Trust, Class B, Series 2019-1, 3.32%, 04/12/23‡ | | $ | 155,000 | | $ | 156,909 |
American Credit Acceptance Receivables Trust, Class C, Series 2017-2, 2.86%, 06/12/23‡ | | | 368,617 | | | 368,660 |
American Credit Acceptance Receivables Trust, Class C, Series 2018-3, 3.75%, 10/15/24‡ | | | 415,000 | | | 419,503 |
American Credit Acceptance Receivables Trust, Class C, Series 2018-4, 3.97%, 01/13/25‡ | | | 380,000 | | | 387,825 |
American Credit Acceptance Receivables Trust, Class C, Series 2019-2, 3.17%, 06/12/25‡ | | | 205,000 | | | 206,818 |
AmeriCredit Automobile Receivables Trust, Class B, Series 2016-1, 2.30%, 03/08/21 | | | 111,652 | | | 111,639 |
AmeriCredit Automobile Receivables Trust, Class B, Series 2016-2, 2.21%, 05/10/21 | | | 105,169 | | | 105,135 |
AmeriCredit Automobile Receivables Trust, Class C, Series 2015-4, 2.88%, 07/08/21 | | | 634,177 | | | 634,880 |
AmeriCredit Automobile Receivables Trust, Class D, Series 2018-1, 3.82%, 03/18/24 | | | 285,000 | | | 293,311 |
Avid Automobile Receivables Trust, Class A, Series 2018-1, 2.84%, 08/15/23‡ | | | 214,058 | | | 213,811 |
AXIS Equipment Finance Receivables VI LLC, Class A2, Series 2018-2A, 3.89%, 07/20/22‡ | | | 370,000 | | | 375,947 |
BRE Grand Islander Timeshare Issuer LLC, Class A, Series 2017-1A, 2.94%, 05/25/29‡ | | | 347,694 | | | 349,475 |
BXG Receivables Note Trust, Class A, Series 2013-A, 3.01%, 12/04/28‡ | | | 76,627 | | | 76,326 |
BXG Receivables Note Trust, Class A, Series 2015-A, 2.88%, 05/02/30‡ | | | 377,981 | | | 377,107 |
CarFinance Capital Auto Trust, Class B, Series 2015-1A, 2.91%, 06/15/21‡ | | | 120,645 | | | 120,645 |
Centre Point Funding LLC, Class 1, Series 2012-2A, 2.61%, 08/20/21‡ | | | 224,081 | | | 222,930 |
See accompanying Notes to Financial Statements.
63
ADVISORSHARES NEWFLEET MULTI-SECTOR INCOME ETF
Schedule of Investments (continued) June30, 2019 |
Investments | | Principal | | Value |
ASSET BACKED SECURITIES (continued) |
Chrysler Capital Auto Receivables Trust, Class D, Series 2015-BA, 4.17%, 01/16/23‡ | | $ | 635,000 | | $ | 638,278 |
Conn’s Receivables Funding LLC, Class B, Series 2018-A, 4.65%, 01/15/23‡ | | | 211,961 | | | 213,521 |
Consumer Loan Underlying Bond Credit Trust, Class A, Series 2018-P2, 3.47%, 10/15/25‡ | | | 241,870 | | | 243,339 |
CPS Auto Receivables Trust, Class B, Series 2017-D, 2.43%, 01/18/22‡ | | | 305,000 | | | 304,728 |
Dell Equipment Finance Trust, Class A3, Series 2017-2, 2.19%, 10/24/22‡ | | | 615,000 | | | 614,397 |
DRB Prime Student Loan Trust, Class A3, Series 2015-D, 2.50%, 01/25/36‡ | | | 46,683 | | | 46,680 |
Drive Auto Receivables Trust, Class C, Series 2016-CA, 3.02%, 11/15/21‡ | | | 206,958 | | | 207,121 |
Drive Auto Receivables Trust, Class C, Series 2017-2, 2.75%, 09/15/23 | | | 452,277 | | | 452,575 |
Drive Auto Receivables Trust, Class C, Series 2019-3, 2.90%, 08/15/25 | | | 240,000 | | | 241,305 |
Drug Royalty II LP, Class A2, Series 2014-1, 3.48%, 07/15/23‡ | | | 42,674 | | | 42,650 |
DT Auto Owner Trust, Class C, Series 2018-3A, 3.79%, 07/15/24‡ | | | 280,000 | | | 285,740 |
DT Auto Owner Trust, Class C, Series 2019-1A, 3.61%, 11/15/24‡ | | | 210,000 | | | 213,768 |
Exeter Automobile Receivables Trust, Class B, Series 2017-1A, 3.00%, 12/15/21‡ | | | 263,893 | | | 264,460 |
Exeter Automobile Receivables Trust, Class B, Series 2017-2A, 2.82%, 05/16/22‡ | | | 676,131 | | | 676,738 |
Exeter Automobile Receivables Trust, Class B, Series 2017-3A, 2.81%, 09/15/22‡ | | | 270,000 | | | 271,107 |
Exeter Automobile Receivables Trust, Class C, Series 2018-1A, 3.03%, 01/17/23‡ | | | 465,000 | | | 468,527 |
Investments | | Principal | | Value |
ASSET BACKED SECURITIES (continued) |
Exeter Automobile Receivables Trust, Class C, Series 2018-2A, 3.69%, 03/15/23‡ | | $ | 445,000 | | $ | 451,053 |
Exeter Automobile Receivables Trust, Class C, Series 2019-1A, 3.82%, 12/16/24‡ | | | 345,000 | | | 353,676 |
First Investors Auto Owner Trust, Class B, Series 2017-2A, 2.65%, 11/15/22‡ | | | 650,000 | | | 651,250 |
First Investors Auto Owner Trust, Class C, Series 2016-2A, 2.53%, 07/15/22‡ | | | 355,000 | | | 354,176 |
First Investors Auto Owner Trust, Class C, Series 2019-1A, 3.26%, 03/17/25‡ | | | 305,000 | | | 310,343 |
Flagship Credit Auto Trust, Class B, Series 2016-2, 3.84%, 09/15/22‡ | | | 185,000 | | | 186,025 |
Foundation Finance Trust, Class A, Series 2017-1A, 3.30%, 07/15/33‡ | | | 322,137 | | | 323,467 |
Foursight Capital Automobile Receivables Trust, Class A2, Series 2016-1, 2.87%, 10/15/21‡ | | | 128,867 | | | 128,977 |
Foursight Capital Automobile Receivables Trust, Class C, Series 2018-1, 3.68%, 08/15/23‡ | | | 445,000 | | | 454,818 |
GLS Auto Receivables Trust, Class B, Series 2017-1A, 2.98%, 12/15/21‡ | | | 770,000 | | | 771,595 |
Gold Key Resorts LLC, Class A, Series 2014-A, 3.22%, 03/17/31‡ | | | 119,022 | | | 119,082 |
Hertz Vehicle Financing II LP, Class A, Series 2016-4A, 2.65%, 07/25/22‡ | | | 295,000 | | | 295,297 |
Hyundai Auto Lease Securitization Trust, Class A2A, Series 2018-A, 2.55%, 08/17/20‡ | | | 227,103 | | | 227,112 |
Lendmark Funding Trust, Class A, Series 2018-2A, 4.23%, 04/20/27‡ | | | 390,000 | | | 405,052 |
Marlette Funding Trust, Class A, Series 2019-2A, 3.13%, 07/16/29‡ | | | 305,000 | | | 306,853 |
Marriott Vacation Club Owner Trust, Class A, Series 2012-1A, 2.51%, 05/20/30‡ | | | 208,282 | | | 208,844 |
See accompanying Notes to Financial Statements.
64
ADVISORSHARES NEWFLEET MULTI-SECTOR INCOME ETF
Schedule of Investments (continued) June30, 2019 |
Investments | | Principal | | Value |
ASSET BACKED SECURITIES (continued) |
MVW Owner Trust, Class A, Series 2019-1A, 2.89%, 11/20/36‡ | | $ | 245,000 | | $ | 248,440 |
MVW Owner Trust, Class B, Series 2015-1A, 2.96%, 12/20/32‡ | | | 152,622 | | | 152,752 |
Nextgear Floorplan Master Owner Trust, Class A2, Series 2018-1A, 3.22%, 02/15/23‡ | | | 145,000 | | | 147,065 |
OneMain Direct Auto Receivables Trust, Class C, Series 2018-1A, 3.85%, 10/14/25‡ | | | 250,000 | | | 255,855 |
Oportun Funding IX LLC, Class A, Series 2018-B, 3.91%, 07/08/24‡ | | | 390,000 | | | 397,179 |
Orange Lake Timeshare Trust, Class A, Series 2015-AA, 2.88%, 09/08/27‡ | | | 162,907 | | | 163,436 |
Orange Lake Timeshare Trust, Class B, Series 2019-A, 3.36%, 04/09/38‡ | | | 238,191 | | | 241,759 |
Prosper Marketplace Issuance Trust, Class A, Series 2018-1A, 3.11%, 06/17/24‡ | | | 50,658 | | | 50,688 |
Prosper Marketplace Issuance Trust, Class A, Series 2019-3A, 3.19%, 07/15/25‡ | | | 190,000 | | | 191,108 |
Santander Drive Auto Receivables Trust, Class C, Series 2017-1, 2.58%, 05/16/22 | | | 650,000 | | | 649,950 |
Skopos Auto Receivables Trust, Class A, Series 2018-1A, 3.19%, 09/15/21‡ | | | 113,699 | | | 113,760 |
SLM Private Education Loan Trust, Class A2A, Series 2013-B, 1.85%, 06/17/30‡ | | | 62,017 | | | 61,940 |
SLM Private Education Loan Trust, Class A2A, Series 2013-C, 2.94%, 10/15/31‡ | | | 17,687 | | | 17,688 |
Sofi Consumer Loan Program LLC, Class A, Series 2016-3, 3.05%, 12/26/25‡ | | | 247,161 | | | 248,325 |
Sofi Consumer Loan Program LLC, Class A, Series 2017-1, 3.28%, 01/26/26‡ | | | 258,631 | | | 260,777 |
Sofi Consumer Loan Program Trust, Class A, Series 2019-3, 2.90%, 05/25/28‡ | | | 245,000 | | | 246,352 |
Sofi Consumer Loan Program Trust, Class A1, Series 2018-3, 3.20%, 08/25/27‡ | | | 287,309 | | | 288,275 |
Investments | | Principal | | Value |
ASSET BACKED SECURITIES (continued) |
Sofi Consumer Loan Program Trust, Class A2, Series 2018-2, 3.35%, 04/26/27‡ | | $ | 305,000 | | $ | 308,156 |
Sofi Professional Loan Program LLC, Class A2A, Series 2017-C, 1.75%, 07/25/40‡ | | | 120,821 | | | 120,465 |
SoFi Professional Loan Program LLC, Class A1FX, Series 2017-B, 1.83%, 05/25/40‡ | | | 42,377 | | | 42,369 |
Tesla Auto Lease Trust, Class A, Series 2018-A, 2.32%, 12/20/19‡ | | | 112,021 | | | 111,977 |
Tesla Auto Lease Trust, Class B, Series 2018-B, 4.12%, 10/20/21‡ | | | 310,000 | | | 318,189 |
Tidewater Auto Receivables Trust, Class B, Series 2018-AA, 3.45%, 11/15/24‡ | | | 525,000 | | | 530,644 |
Tricolor Auto Securitization Trust, Class B, Series 2018-2A, 4.76%, 02/15/22‡ | | | 308,465 | | | 321,285 |
TRIP Rail Master Funding LLC, Class A1, Series 2017-1A, 2.71%, 08/15/47‡ | | | 424,188 | | | 424,441 |
United Auto Credit Securitization Trust, Class D, Series 2019-1, 3.47%, 08/12/24‡ | | | 205,000 | | | 206,824 |
Upstart Securitization Trust, Class A, Series 2019-1, 3.45%, 04/20/26‡ | | | 164,155 | | | 164,865 |
Upstart Securitization Trust, Class B, Series 2017-2, 3.75%, 03/20/25‡ | | | 298,542 | | | 299,268 |
US Auto Funding LLC, Class B, Series 2019-1A, 3.99%, 12/15/22‡ | | | 305,000 | | | 311,100 |
Welk Resorts LLC, Class A, Series 2015-AA, 2.79%, 06/16/31‡ | | | 187,573 | | | 187,640 |
Westgate Resorts LLC, Class A, Series 2016-1A, 3.50%, 12/20/28‡ | | | 168,426 | | | 169,129 |
Westgate Resorts LLC, Class A, Series 2018-1A, 3.38%, 12/20/31‡ | | | 377,157 | | | 381,297 |
Westlake Automobile Receivables Trust, Class C, Series 2018-3A, 3.61%, 10/16/23‡ | | | 380,000 | | | 385,640 |
Total Asset Backed Securities(Cost $23,356,862) | | | | | | 23,550,798 |
See accompanying Notes to Financial Statements.
65
ADVISORSHARES NEWFLEET MULTI-SECTOR INCOME ETF
Schedule of Investments (continued) June30, 2019 |
Investments | | Principal | | Value |
CORPORATE BONDS — 21.4% |
Communication Services — 1.2% |
AT&T, Inc., 3.62%, (3-Month USD LIBOR + 1.18%), 06/12/24@ | | $ | 190,000 | | $ | 192,524 |
Crown Castle International Corp., 4.88%, 04/15/22 | | | 230,000 | | | 244,617 |
Sprint Spectrum Co. LLC/Sprint Spectrum Co. II LLC/Sprint Spectrum Co. III LLC, 4.74%, 03/20/25‡ | | | 200,000 | | | 208,000 |
Verizon Communications, Inc., 3.62%, (3-Month USD LIBOR + 1.10%), 05/15/25@ | | | 267,000 | | | 270,655 |
Total Communication Services | | | | | | 915,796 |
Consumer Discretionary — 1.8% |
Aptiv Corp., 4.15%, 03/15/24 | | | 215,000 | | | 226,457 |
Bunge Ltd. Finance Corp., 4.35%, 03/15/24 | | | 245,000 | | | 255,762 |
DR Horton, Inc., 4.75%, 02/15/23 | | | 265,000 | | | 279,505 |
Ford Motor Credit Co. LLC, 3.20%, 01/15/21 | | | 360,000 | | | 361,232 |
Sirius XM Radio, Inc., 4.63%, 07/15/24‡ | | | 45,000 | | | 46,160 |
TRI Pointe Group, Inc./TRI Pointe Homes, Inc., 5.88%, 06/15/24 | | | 190,000 | | | 196,593 |
Total Consumer Discretionary | | | | | | 1,365,709 |
Consumer Staples — 1.6% | | | | | | |
Altria Group, Inc., 3.49%, 02/14/22 | | | 18,000 | | | 18,519 |
Altria Group, Inc., 3.80%, 02/14/24 | | | 313,000 | | | 326,501 |
Altria Group, Inc., 4.40%, 02/14/26 | | | 30,000 | | | 32,127 |
Campbell Soup Co., 3.65%, 03/15/23 | | | 290,000 | | | 298,762 |
Conagra Brands, Inc., 4.30%, 05/01/24 | | | 200,000 | | | 212,308 |
CVS Health Corp., 3.17%, (3-Month USD LIBOR + 0.72%), 03/09/21@ | | | 80,000 | | | 80,379 |
CVS Health Corp., 3.70%, 03/09/23 | | | 247,000 | | | 255,606 |
Total Consumer Staples | | | | | | 1,224,202 |
Energy — 0.5% | | | | | | |
Kinder Morgan, Inc., 5.63%, 11/15/23‡ | | | 355,000 | | | 393,316 |
Financials — 10.1% | | | | | | |
Ares Capital Corp., 3.50%, 02/10/23 | | | 195,000 | | | 194,184 |
Investments | | Principal | | Value |
CORPORATE BONDS (continued) |
Financials (continued) | | | | | | |
Aviation Capital Group LLC, 3.88%, 05/01/23‡ | | $ | 306,000 | | $ | 316,261 |
Bank of America Corp., 3.58%, (3-Month USD LIBOR + 1.00%), 04/24/23@ | | | 345,000 | | | 347,889 |
Bank of America Corp., 3.34%, (3-Month USD LIBOR + 0.77%), 02/05/26@ | | | 153,000 | | | 150,971 |
Bank of New York Mellon Corp. (The), Series E, 4.95%, (3-Month USD LIBOR + 3.42%)#@ | | | 360,000 | | | 365,756 |
Citigroup, Inc., 3.54%, (3-Month USD LIBOR + 0.96%), 04/25/22@ | | | 215,000 | | | 216,895 |
Citigroup, Inc., 3.57%, (3-Month USD LIBOR + 1.25%), 07/01/26@ | | | 275,000 | | | 277,182 |
Fs KKR Capital Corp., 4.25%, 01/15/20 | | | 202,000 | | | 202,585 |
Goldman Sachs Group, Inc. (The), 2.35%, 11/15/21 | | | 105,000 | | | 104,936 |
Goldman Sachs Group, Inc. (The), 3.00%, 04/26/22 | | | 330,000 | | | 333,238 |
Goldman Sachs Group, Inc. (The), 4.12%, (3-Month USD LIBOR + 1.60%), 11/29/23@ | | | 170,000 | | | 174,676 |
Goldman Sachs Group, Inc. (The), 3.69%, (3-Month USD LIBOR + 1.17%), 05/15/26@ | | | 270,000 | | | 266,448 |
Goldman Sachs Group, Inc. (The), 4.33%, (3-Month USD LIBOR + 1.75%), 10/28/27@ | | | 170,000 | | | 173,595 |
iStar, Inc., 6.00%, 04/01/22 | | | 235,000 | | | 241,462 |
JPMorgan Chase & Co., Series Z, 5.30%, (3-Month USD LIBOR + 3.80%)#@ | | | 430,000 | | | 435,068 |
JPMorgan Chase & Co., 3.48%, (3-Month USD LIBOR + 0.90%), 04/25/23@ | | | 255,000 | | | 256,313 |
Lincoln National Corp., 4.63%, (3-Month USD LIBOR + 2.04%), 04/20/67@ | | | 60,000 | | | 47,341 |
Morgan Stanley, 3.98%, (3-Month USD LIBOR + 1.40%), 10/24/23@ | | | 870,000 | | | 887,126 |
Navient Corp., 5.88%, 10/25/24 | | | 200,000 | | | 203,250 |
Prudential Financial, Inc., 5.63%, (3-Month USD LIBOR + 3.92%), 06/15/43@ | | | 14,000 | | | 14,831 |
See accompanying Notes to Financial Statements.
66
ADVISORSHARES NEWFLEET MULTI-SECTOR INCOME ETF
Schedule of Investments (continued) June30, 2019 |
Investments | | Principal | | Value |
CORPORATE BONDS (continued) |
Financials (continued) | | | | | | |
Santander Holdings USA, Inc., 3.70%, 03/28/22 | | $ | 205,000 | | $ | 210,049 |
Santander Holdings USA, Inc., Series FXD, 3.50%, 06/07/24 | | | 240,000 | | | 243,929 |
SBA Tower Trust, 2.88%, 07/09/21‡ | | | 780,000 | | | 782,389 |
SBA Tower Trust, 3.17%, 04/11/22‡ | | | 780,000 | | | 786,590 |
Synchrony Financial, 4.38%, 03/19/24(a) | | | 315,000 | | | 330,070 |
Total Financials | | | | | | 7,563,034 |
Health Care — 1.4% | | | | | | |
Becton Dickinson and Co., 2.89%, 06/06/22 | | | 397,000 | | | 402,541 |
Cigna Corp., 3.06%, (3-Month USD LIBOR + 0.65%), 09/17/21@‡ | | | 350,000 | | | 350,160 |
Mylan NV, 3.95%, 06/15/26 | | | 275,000 | | | 266,161 |
Total Health Care | | | | | | 1,018,862 |
Industrials — 1.7% | | | | | | |
CNH Industrial Capital LLC, 4.20%, 01/15/24 | | | 280,000 | | | 291,622 |
Continental Airlines Class C-2 Pass-Through Trust, Series AMBC, 6.24%, 03/15/20 | | | 15,229 | | | 15,571 |
General Electric Co., Series D, 5.00%, (3-Month USD LIBOR + 3.33%)#@ | | | 175,000 | | | 169,046 |
Penske Truck Leasing Co. LP/PTL Finance Corp., 4.13%, 08/01/23‡ | | | 250,000 | | | 263,079 |
TransDigm, Inc., 6.50%, 07/15/24 | | | 200,000 | | | 203,000 |
UAL Pass-Through Trust, Series 071A, 6.64%, 07/02/22 | | | 317,796 | | | 337,928 |
Total Industrials | | | | | | 1,280,246 |
Information Technology — 0.9% |
Broadcom, Inc., 3.63%, 10/15/24‡ | | | 425,000 | | | 427,414 |
Dell International LLC/EMC Corp., 4.00%, 07/15/24‡ | | | 250,000 | | | 256,718 |
Motorola Solutions, Inc., 3.75%, 05/15/22 | | | 15,173 | | | 15,598 |
Total Information Technology | | | | | | 699,730 |
Materials — 0.3% | | | | | | |
Reynolds Group Issuer, Inc./Reynolds Group Issuer LLC/Reynolds Group Issuer Lu, 6.10%, (3-Month USD LIBOR + 3.50%), 07/15/21@‡ | | | 200,000 | | | 200,500 |
Investments | | Principal | | Value |
CORPORATE BONDS (continued) |
Real Estate — 0.5% | | | | | | |
Hospitality Properties Trust, 4.65%, 03/15/24 | | $ | 330,000 | | $ | 339,785 |
Utilities — 1.4% | | | | | | |
DPL, Inc., 4.35%, 04/15/29‡ | | | 250,000 | | | 254,704 |
NRG Energy, Inc., 3.75%, 06/15/24‡ | | | 204,000 | | | 209,767 |
PSEG Power LLC, 3.85%, 06/01/23 | | | 330,000 | | | 344,070 |
Vistra Operations Co. LLC, 3.55%, 07/15/24‡ | | | 235,000 | | | 236,649 |
Total Utilities | | | | | | 1,045,190 |
Total Corporate Bonds (Cost $15,789,281) | | | | | | 16,046,370 |
TERM LOANS — 5.8% | | | | | | |
Aerospace — 0.2% | | | | | | |
TransDigm, Inc., 4.83%, (3-Month USD LIBOR + 2.50%), 08/22/24@ | | | 166,613 | | | 163,419 |
Chemicals — 0.3% | | | | | | |
Ineos US Finance LLC, 4.40%, (1-Month USD LIBOR + 2.00%), 04/01/24@ | | | 245,106 | | | 242,321 |
Energy — 0.5% | | | | | | |
Medallion Midland Acquisition, LLC, 5.65%, (1-Month USD LIBOR + 3.25%), 10/30/24@ | | | 345,195 | | | 337,285 |
Financials — 0.3% | | | | | | |
Delos Finance S.a.r.l., 4.08%, (3-Month USD LIBOR + 1.75%), 10/06/23@ | | | 182,500 | | | 182,490 |
Food and Drug — 0.3% | | | | | | |
Albertson’s LLC, 5.40%, (1-Month USD LIBOR + 3.00%), 11/17/25@ | | | 200,839 | | | 200,086 |
Food/Tobacco — 0.4% | | | | | | |
Aramark Servies, Inc., 4.08%, (3-Month USD LIBOR + 1.75%), 03/28/24@ | | | 275,167 | | | 274,823 |
Gaming/Leisure — 1.1% | | | | | | |
Eldorado Resorts, Inc., 4.69%, (1-Month USD LIBOR + 2.25%), 04/17/24@ | | | 319,085 | | | 318,536 |
Seminole Tribe of Florida, 4.15%, (1-Month USD LIBOR + 1.75%), 07/08/24@ | | | 274,209 | | | 274,752 |
See accompanying Notes to Financial Statements.
67
ADVISORSHARES NEWFLEET MULTI-SECTOR INCOME ETF
Schedule of Investments (continued) June30, 2019 |
Investments | | Principal | | Value |
TERM LOANS (continued) |
Gaming/Leisure (continued) | | | | | | |
StationCasinos LLC, 4.91%, (1-Month USD LIBOR + 2.50%), 06/08/23@ | | $ | 262,342 | | $ | 261,597 |
Total Gaming/Leisure | | | | | | 854,885 |
Health Care — 0.4% | | | | | | |
Valeant Pharmaceuticals International, Inc., 5.41%, (1-Month USD LIBOR + 3.00%), 06/02/25@ | | | 299,545 | | | 299,764 |
Media/Telecom – Broadcasting — 0.1% |
Nexstar Media Group, Inc., 06/19/26@(b) | | | 105,000 | | | 104,738 |
Media/Telecom – Cable/Wireless Video — 0.7% |
CSC Holdings, LLC (fka CSC Holdings, Inc. (Cablevision)), 4.64%, (1-Month USD LIBOR + 2.25%), 07/17/25@ | | | 226,260 | | | 223,024 |
Virgin Media Bristol LLC, 4.89%, (1-Month USD LIBOR + 2.50%), 01/15/26@ | | | 320,000 | | | 319,200 |
Total Media/Telecom – Cable/Wireless Video | | | | | | 542,224 |
Media/Telecom – Diversified Media — 0.1% |
Meredith Corp., 5.15%, (1-Month USD LIBOR + 2.75%), 01/31/25@ | | | 85,473 | | | 85,513 |
Media/Telecom – Telecommunications — 0.7% |
CenturyLink, Inc., 5.15%, (1-Month USD LIBOR + 2.75%), 01/31/25@ | | | 255,480 | | | 250,017 |
Frontier Communications Corp., 6.16%, (1-Month USD LIBOR + 3.75%), 06/15/24@ | | | 295,477 | | | 290,430 |
Total Media/Telecom – Telecommunications | | | | | | 540,447 |
Media/Telecom – Wireless Communications — 0.1% |
CommScope Holding Co., Inc., 5.65%, (1-Month USD LIBOR + 3.25%), 04/06/26@ | | | 65,000 | | | 64,902 |
Transportation – Automotive — 0.2% |
Panther BF Aggregator 2 LP, 5.90%, (1-Month USD LIBOR + 3.50%), 04/30/26@ | | | 170,000 | | | 168,991 |
Utilities — 0.4% | | | | | | |
Calpine Corp., 4.83%, (3-Month USD LIBOR + 2.50%), 01/15/24@ | | | 281,817 | | | 280,748 |
Total Term Loans
(Cost $4,358,893) | | | | | | 4,342,636 |
Investments | | Principal | | Value |
FOREIGN BONDS — 4.5% | | | | | | |
Consumer Staples — 0.9% | | | | | | |
Anheuser-Busch InBev Worldwide, Inc. (Belgium), 4.15%, 01/23/25 | | $ | 368,000 | | $ | 398,891 |
BAT Capital Corp. (United Kingdom), 2.76%, 08/15/22 | | | 255,000 | | | 255,483 |
Total Consumer Staples | | | | | | 654,374 |
Financials — 1.1% | | | | | | |
AerCap Ireland Capital DAC/AerCap Global Aviation Trust (Ireland), 4.50%, 05/15/21 | | | 250,000 | | | 257,884 |
AerCap Ireland Capital DAC/AerCap Global Aviation Trust (Ireland), 3.95%, 02/01/22 | | | 150,000 | | | 154,384 |
Guanay Finance Ltd. (Chile), 6.00%, 12/15/20‡ | | | 326,071 | | | 331,778 |
Toronto-Dominion Bank (The) (Canada), 2.65%, 06/12/24 | | | 57,000 | | | 57,555 |
Total Financials | | | | | | 801,601 |
Health Care — 0.4% | | | | | | |
Bayer US Finance II LLC (Germany), 2.98%, (3-Month USD LIBOR + 0.63%), 06/25/21@‡ | | | 310,000 | | | 308,022 |
Industrials — 1.0% | | | | | | |
Avolon Holdings Funding Ltd. (Ireland), 3.95%, 07/01/24‡ | | | 304,000 | | | 311,852 |
Doric Nimrod Air Finance Alpha Ltd. Class A Pass-Through Trust, Series 2012-1A (Guernsey), 5.13%, 11/30/22‡ | | | 452,432 | | | 471,488 |
Total Industrials | | | | | | 783,340 |
Materials — 1.1% | | | | | | |
ArcelorMittal (Luxembourg), 6.13%, 06/01/25 | | | 150,000 | | | 170,649 |
Glencore Funding LLC (Switzerland), 4.13%, 05/30/23‡ | | | 410,000 | | | 426,557 |
NOVA Chemicals Corp. (Canada), 5.00%, 05/01/25‡ | | | 200,000 | | | 209,750 |
Total Materials | | | | | | 806,956 |
Total Foreign Bonds
(Cost $3,271,467) | | | | | | 3,354,293 |
See accompanying Notes to Financial Statements.
68
ADVISORSHARES NEWFLEET MULTI-SECTOR INCOME ETF
Schedule of Investments (continued) June30, 2019 |
Investments | | Principal/
Shares | | Value |
MONEY MARKET FUND — 3.5% | |
JPMorgan U.S. Government Money Market Fund – Institutional Class, 2.23%(c) (Cost $2,665,083) | | | 2,665,083 | | $ | 2,665,083 | |
REPURCHASE AGREEMENTS — 0.4%(d) | |
BNP Paribas Securities Corp., dated 06/28/19, due 07/01/19, 2.48%, total to be received $250,052, (collateralized by various U.S. Government Agency Obligations, 0.00% – 8.13%, 06/30/19 – 02/15/49, totaling $254,472) | | $ | 250,000 | | | 250,000 | |
RBC Dominion Securities, Inc., dated 06/28/19, due 07/01/19, 2.51%, total to be received $73,660, (collateralized by various U.S. Government Agency Obligations, 0.00% – 7.00%, 07/18/19 – 09/09/49, totaling $74,881) | | | 73,645 | | | 73,645 | |
Total Repurchase Agreements (Cost $323,645) | | | | | | 323,645 | |
Total Investments — 100.1%
(Cost $74,362,556) | | | | | | 75,110,095 | |
Liabilities in Excess of Other Assets — (0.1%) | | | | | | (30,285 | ) |
Net Assets — 100.0% | | | | | $ | 75,079,810 | |
See accompanying Notes to Financial Statements.
69
ADVISORSHARES NEWFLEET MULTI-SECTOR INCOME ETF
Schedule of Investments (continued) June30, 2019 |
Fair Value Measurements
The following is a summary of the inputs used, as of June30, 2019, in valuing the Fund’s assets and liabilities carried at fair value. These inputs are summarized in three broad levels. Level 1 includes quoted prices in active markets for identical securities. Level 2 includes other significant observable inputs (including quoted prices for similar securities, interest rates, prepayment speeds and credit risk). Level 3 includes significant unobservable inputs (including the Fund’s own assumptions in determining the fair value of investments). The level assigned to the securities valuations may not be an indication of the risk or liquidity associated with investing in those securities.
Assets | | Level 1 | | Level 2 | | Level 3 | | Total |
Mortgage Backed Securities | | $ | — | | $ | 24,827,270 | | $ | — | | $ | 24,827,270 |
Asset Backed Securities | | | — | | | 23,550,798 | | | — | | | 23,550,798 |
Corporate Bonds | | | — | | | 16,046,370 | | | — | | | 16,046,370 |
Term Loans | | | — | | | 4,342,636 | | | — | | | 4,342,636 |
Foreign Bonds | | | — | | | 3,354,293 | | | — | | | 3,354,293 |
Money Market Fund | | | 2,665,083 | | | — | | | — | | | 2,665,083 |
Repurchase Agreements | | | — | | | 323,645 | | | — | | | 323,645 |
Total | | $ | 2,665,083 | | $ | 72,445,012 | | $ | — | | $ | 75,110,095 |
SUMMARY OF SCHEDULE OF INVESTMENTS
| | % of
Net Assets |
Aerospace | | 0.2 | % |
Asset Backed Securities | | 31.4 | |
Chemicals | | 0.3 | |
Commercial Mortgage Backed Securities | | 4.2 | |
Communication Services | | 1.2 | |
Consumer Discretionary | | 1.8 | |
Consumer Staples | | 2.5 | |
Energy | | 1.0 | |
Financials | | 11.5 | |
Food and Drug | | 0.3 | |
Food/Tobacco | | 0.4 | |
Gaming/Leisure | | 1.1 | |
Health Care | | 2.2 | |
Industrials | | 2.7 | |
Information Technology | | 0.9 | |
Materials | | 1.4 | |
Media/Telecom – Broadcasting | | 0.1 | |
Media/Telecom – Cable/Wireless Video | | 0.7 | |
Media/Telecom – Diversified Media | | 0.1 | |
Media/Telecom – Telecommunications | | 0.7 | |
Media/Telecom – Wireless Communications | | 0.1 | |
Real Estate | | 0.5 | |
Residential Mortgage Backed Securities | | 28.9 | |
Transportation – Automotive | | 0.2 | |
Utilities | | 1.8 | |
Money Market | | 3.5 | |
Repurchase Agreements | | 0.4 | |
Total Investments | | 100.1 | |
Liabilities in Excess of Other Assets | | (0.1 | ) |
Net Assets | | 100.0 | % |
See accompanying Notes to Financial Statements.
70
ADVISORSHARES PACIFIC ASSET ENHANCED FLOATING RATE ETF
Schedule of Investments June30, 2019 |
Investments | | Principal | | Value |
TERM LOANS — 84.9% | | | | | | |
Aerospace/Defense — 1.4% | | | | | | |
TransDigm, Inc., 4.83%, (3-Month USD LIBOR + 2.50%), 06/09/23@ | | $ | 427,010 | | $ | 419,872 |
Auto Manufacturers — 0.8% | | | | | | |
Navistar, Inc., 5.91%, (1-Month USD LIBOR + 3.50%), 11/06/24@ | | | 246,875 | | | 246,682 |
Building Materials — 1.7% | | | | | | |
Quikrete Holdings, Inc., 5.15%, (1-Month USD LIBOR + 2.75%), 11/15/23@ | | | 491,593 | | | 483,742 |
Chemicals — 2.5% | | | | | | |
Solenis International LP, 6.52%, (3-Month USD LIBOR + 4.00%), 06/26/25@ | | | 247,500 | | | 244,901 |
Starfruit US Holdco LLC, 5.67%, (1-Month USD LIBOR + 3.25%), 10/01/25 (Netherlands)@ | | | 498,750 | | | 492,204 |
Total Chemicals | | | | | | 737,105 |
Coal — 0.8% | | | | | | |
Arch Coal, Inc., 5.15%, (1-Month USD LIBOR + 2.75%), 03/07/24@ | | | 244,987 | | | 244,375 |
Commercial Services — 3.0% | | | | | | |
Allied Universal Holdco LLC, 6.15%, (1-Month USD LIBOR + 3.75%), 07/28/22@ | | | 244,937 | | | 244,835 |
Allied Universal Holdco LLC, 6.65%, (1-Month USD LIBOR + 4.25%), 07/28/22@ | | | 248,750 | | | 248,790 |
Camelot Finance LP, 5.65%, (1-Month USD LIBOR + 3.25%), 10/03/23@ | | | 134,786 | | | 135,303 |
Garda World Security Corp., 6.02%, (3-Month USD LIBOR + 3.50%), 05/24/24 (Canada)@ | | | 244,987 | | | 243,813 |
Garda World Security Corp., 8.00%, (Prime + 2.50%), 05/24/24 (Canada)@ | | | 627 | | | 624 |
Total Commercial Services | | | | | | 873,365 |
Computers — 1.9% | | | | | | |
McAfee LLC, 6.15%, (1-Month USD LIBOR + 3.75%), 09/30/24@ | | | 242,892 | | | 242,930 |
Western Digital Corp., 4.15%, (1-Month USD LIBOR + 1.75%), 05/01/23@ | | | 323,269 | | | 317,208 |
Total Computers | | | | | | 560,138 |
Investments | | Principal | | Value |
TERM LOANS (continued) |
Distribution/Wholesale — 2.7% |
Spin Holdco, Inc., 5.85%, (3-Month USD LIBOR + 3.25%), 11/14/22@ | | $ | 479,575 | | $ | 470,883 |
Univar USA, Inc., 4.65%, (1-Month USD LIBOR + 2.25%), 07/01/24@ | | | 308,599 | | | 308,140 |
Total Distribution/Wholesale | | | | | | 779,023 |
Electric — 0.8% | | | | | | |
Talen Energy Supply LLC, 6.40%, (1-Month USD LIBOR + 4.00%), 04/15/24@ | | | 244,702 | | | 244,970 |
Engineering & Construction — 1.6% |
Brand Industrial Services, Inc., 6.58%, (3-Month USD LIBOR + 4.25%), 06/21/24@ | | | 2,532 | | | 2,452 |
Brand Industrial Services, Inc., 6.73%, (2-Month USD LIBOR + 4.25%), 06/21/24@ | | | 231,993 | | | 224,743 |
Brand Industrial Services, Inc., 6.84%, (3-Month USD LIBOR + 4.25%), 06/21/24@ | | | 261,678 | | | 253,501 |
Total Engineering & Construction | | | | | | 480,696 |
Entertainment — 4.4% | | | | | | |
Cineworld Finance US, Inc., 4.65%, (1-Month USD LIBOR + 2.25%), 02/28/25@ | | | 308,282 | | | 303,674 |
Formula One Management Ltd., 4.90%, (1-Month USD LIBOR + 2.50%), 02/01/24 (United Kingdom)@ | | | 500,000 | | | 490,500 |
Scientific Games International, Inc., 5.15%, (1-Month USD LIBOR + 2.75%), 08/14/24@ | | | 96,300 | | | 94,969 |
Scientific Games International, Inc., 5.23%, (2-Month USD LIBOR + 2.75%), 08/14/24@ | | | 399,931 | | | 394,404 |
Total Entertainment | | | | | | 1,283,547 |
Food — 2.8% | | | | | | |
Albertson’s LLC, 5.40%, (1-Month USD LIBOR + 3.00%), 06/22/23@ | | | 341,254 | | | 341,340 |
U.S. Foods, Inc., 4.40%, (1-Month USD LIBOR + 2.00%), 06/27/23@ | | | 478,845 | | | 476,180 |
Total Food | | | | | | 817,520 |
Hand/Machine Tools — 1.5% |
Apex Tool Group LLC, 6.15%, (1-Month USD LIBOR + 3.75%), 02/01/22@ | | | 460,220 | | | 443,730 |
See accompanying Notes to Financial Statements.
71
ADVISORSHARES PACIFIC ASSET ENHANCED FLOATING RATE ETF
Schedule of Investments (continued) June30, 2019 |
Investments | | Principal | | Value |
TERM LOANS (continued) |
Healthcare – Products — 0.3% |
Avantor, Inc., 5.44%, (1-Month USD LIBOR + 3.00%), 11/21/24@ | | $ | 95,322 | | $ | 95,829 |
Healthcare – Services — 4.2% | | | | | | |
Air Medical Group Holdings, Inc., 5.64%, (1-Month USD LIBOR + 3.25%), 04/28/22@ | | | 244,994 | | | 231,432 |
HCA, Inc., 4.33%, (3-Month USD LIBOR + 2.00%), 03/13/25@ | | | 494,987 | | | 495,802 |
Jaguar Holding Co. II, 4.90%, (1-Month USD LIBOR + 2.50%), 08/18/22@ | | | 497,409 | | | 495,263 |
Total Healthcare – Services | | | | | | 1,222,497 |
Household Products/Wares — 1.0% |
Prestige Brands, Inc., 4.40%, (1-Month USD LIBOR + 2.00%), 01/26/24@ | | | 295,232 | | | 294,199 |
Insurance — 2.1% | | | | | | |
HUB International, Ltd., 5.59%, (3-Month USD LIBOR + 3.00%), 04/25/25@ | | | 247,500 | | | 241,748 |
USI, Inc., 5.33%, (3-Month USD LIBOR + 3.00%), 05/16/24@ | | | 393,000 | | | 383,841 |
Total Insurance | | | | | | 625,589 |
Internet — 3.4% | | | | | | |
Uber Technologies, Inc., 5.90%, (1-Month USD LIBOR + 3.50%), 07/13/23@ | | | 486,250 | | | 486,503 |
Zayo Group LLC, 4.65%, (1-Month USD LIBOR + 2.25%), 01/19/24@ | | | 500,000 | | | 500,312 |
Total Internet | | | | | | 986,815 |
Leisure Time — 2.4% | | | | | | |
BRP US, Inc., 4.40%, (1-Month USD LIBOR + 2.00%), 05/23/25 (Canada)@ | | | 244,405 | | | 241,503 |
ClubCorp Holdings, Inc., 5.08%, (3-Month USD LIBOR + 2.75%), 09/18/24@ | | | 489,634 | | | 456,280 |
Total Leisure Time | | | | | | 697,783 |
Lodging — 4.1% | | | | | | |
Caesars Resort Collection LLC, 5.15%, (1-Month USD LIBOR + 2.75%), 12/23/24@ | | | 492,500 | | | 484,753 |
Hilton Worldwide Finance LLC, 4.15%, (1-Month USD LIBOR + 1.75%), 06/21/26@ | | | 461,991 | | | 462,779 |
Investments | | Principal | | Value |
TERM LOANS (continued) |
Lodging (continued) | | | | | | |
Playa Resorts Holding BV, 5.15%, (1-Month USD LIBOR + 2.75%), 04/29/24@ | | $ | 245,006 | | $ | 235,389 |
Total Lodging | | | | | | 1,182,921 |
Machinery – Diversified — 2.3% |
RBS Global, Inc., 4.40%, (1-Month USD LIBOR + 2.00%), 08/21/24@ | | | 188,251 | | | 188,298 |
Titan Acquisition Ltd., 5.40%, (1-Month USD LIBOR + 3.00%), 03/28/25 (Canada)@ | | | 496,231 | | | 475,072 |
Total Machinery – Diversified | | | | | | 663,370 |
Media — 1.7% | | | | | | |
CSC Holdings LLC, 4.64%, (1-Month USD LIBOR + 2.25%), 07/17/25@ | | | 497,462 | | | 490,348 |
Miscellaneous Manufacturing — 1.0% |
Gates Global LLC, 5.15%, (1-Month USD LIBOR + 2.75%), 04/01/24@ | | | 293,956 | | | 292,670 |
Packaging & Containers — 4.7% |
Kloeckner Pentaplast of America, Inc., 6.65%, (1-Month USD LIBOR + 4.25%), 06/30/22 (Luxembourg)@ | | | 246,241 | | | 219,277 |
Plastipak Holdings, Inc., 4.90%, (1-Month USD LIBOR + 2.50%), 10/14/24@ | | | 245,625 | | | 244,167 |
Proampac PG Borrower LLC, 5.88%, (1-Month USD LIBOR + 3.50%), 11/20/23@ | | | 178,165 | | | 171,095 |
Proampac PG Borrower LLC, 6.02%, (3-Month USD LIBOR + 3.50%), 11/20/23@ | | | 106,668 | | | 102,435 |
Proampac PG Borrower LLC, 6.07%, (3-Month USD LIBOR + 3.50%), 11/20/23@ | | | 122,492 | | | 117,631 |
Proampac PG Borrower LLC, 6.08%, (3-Month USD LIBOR + 3.50%), 11/20/23@ | | | 80,174 | | | 76,993 |
Reynolds Group Holdings, Inc., 5.15%, (1-Month USD LIBOR + 2.75%), 02/06/23@ | | | 437,993 | | | 435,373 |
Total Packaging & Containers | | | | | | 1,366,971 |
Pharmaceuticals — 3.3% | | | | | | |
NVA Holdings, Inc., 02/02/25(a) | | | 498,744 | | | 498,534 |
Valeant Pharmaceuticals International, Inc., 5.41%, (1-Month USD LIBOR + 3.00%), 06/02/25@ | | | 453,837 | | | 454,168 |
Total Pharmaceuticals | | | | | | 952,702 |
See accompanying Notes to Financial Statements.
72
ADVISORSHARES PACIFIC ASSET ENHANCED FLOATING RATE ETF
Schedule of Investments (continued) June30, 2019 |
Investments | | Principal | | Value |
TERM LOANS (continued) |
Retail — 10.6% | | | | | | |
1011778 BC ULC, 4.65%, (1-Month USD LIBOR + 2.25%), 02/16/24 (Canada)@ | | $ | 365,347 | | $ | 363,217 |
Bass Pro Group LLC, 7.40%, (1-Month USD LIBOR + 5.00%), 09/25/24@ | | | 496,225 | | | 475,031 |
CEC Entertainment, Inc., 5.65%, (1-Month USD LIBOR + 3.25%), 02/15/21@ | | | 477,330 | | | 474,645 |
GYP Holdings III Corp., 5.15%, (1-Month USD LIBOR + 2.75%), 06/02/25@ | | | 479,024 | | | 467,647 |
Michaels Stores, Inc., 4.90%, (1-Month USD LIBOR + 2.50%), 01/30/23@ | | | 442,315 | | | 429,601 |
NPC International, Inc., 5.94%, (1-Month USD LIBOR + 3.50%), 04/19/24@ | | | 250,000 | | | 202,812 |
PetSmart, Inc., 5.42%, (1-Month USD LIBOR + 3.00%), 03/11/22@ | | | 480,000 | | | 456,401 |
SRS Distribution, Inc., 5.65%, (1-Month USD LIBOR + 3.25%), 05/23/25@ | | | 248,125 | | | 238,510 |
Total Retail | | | | | | 3,107,864 |
Semiconductors — 0.6% | | | | | | |
ON Semiconductor Corp., 4.15%, (1-Month USD LIBOR + 1.75%), 03/31/23@ | | | 178,350 | | | 176,294 |
Software — 9.1% | | | | | | |
CCC Information Services, Inc., 5.16%, (1-Month USD LIBOR + 2.75%), 04/29/24@ | | | 245,614 | | | 242,912 |
Dun & Bradstreet Corp. (The), 7.40%, (1-Month USD LIBOR + 5.00%), 02/06/26@ | | | 500,000 | | | 500,782 |
First Data Corp., 4.40%, (1-Month USD LIBOR + 2.00%), 04/26/24@ | | | 500,000 | | | 500,000 |
Infor US, Inc., 5.08%, (3-Month USD LIBOR + 2.75%), 02/01/22@ | | | 423,638 | | | 423,223 |
Kronos, Inc., 5.58%, (1-Month USD LIBOR + 3.00%), 11/01/23@ | | | 493,875 | | | 493,414 |
Press Ganey Holdings, Inc., 10/23/23(a) | | | 498,721 | | | 498,754 |
Total Software | | | | | | 2,659,085 |
Investments | | Principal | | Value |
TERM LOANS (continued) |
Telecommunications — 7.1% | | | | | | |
Avaya, Inc., 6.65%, (1-Month USD LIBOR + 4.25%), 12/16/24@ | | $ | 369,375 | | $ | 354,138 |
Frontier Communications Corp., 6.16%, (1-Month USD LIBOR + 3.75%), 06/17/24@ | | | 245,000 | | | 240,815 |
Intelsat Jackson Holdings SA, 6.15%, (1-Month USD LIBOR + 3.75%), 11/27/23 (Luxembourg)@ | | | 500,000 | | | 495,548 |
Level 3 Parent LLC, 4.65%, (1-Month USD LIBOR + 2.25%), 02/22/24@ | | | 500,000 | | | 496,688 |
Telesat LLC, 4.83%, (3-Month USD LIBOR + 2.50%), 11/17/23 (Canada)@ | | | 496,231 | | | 491,477 |
Total Telecommunications | | | | | | 2,078,666 |
Trucking & Leasing — 1.1% | | | | | | |
Avolon TLB Borrower 1 US LLC, 4.13%, (1-Month USD LIBOR + 1.75%), 01/15/25 (Ireland)@ | | | 317,025 | | | 317,058 |
Total Term Loans(Cost $25,050,806) | | | | | | 24,825,426 |
CORPORATE BONDS — 8.5% | | | | | | |
Advertising — 0.5% | | | | | | |
Outfront Media Capital LLC/Outfront Media Capital Corp., 5.88%, 03/15/25 | | | 125,000 | | | 129,687 |
Commercial Services — 1.0% | | | | | | |
Ahern Rentals, Inc., 7.38%, 05/15/23‡ | | | 250,000 | | | 223,125 |
Prime Security Services Borrower LLC/Prime Finance, Inc., 9.25%, 05/15/23‡ | | | 72,000 | | | 75,749 |
Total Commercial Services | | | | | | 298,874 |
Home Builders — 0.4% | | | | | | |
Taylor Morrison Communities, Inc., 6.63%, 05/15/22 | | | 125,000 | | | 129,375 |
Media — 1.8% | | | | | | |
CSC Holdings LLC, 6.63%, 10/15/25‡ | | | 250,000 | | | 268,125 |
Sirius XM Radio, Inc., 4.63%, 07/15/24‡ | | | 250,000 | | | 256,445 |
Total Media | | | | | | 524,570 |
See accompanying Notes to Financial Statements.
73
ADVISORSHARES PACIFIC ASSET ENHANCED FLOATING RATE ETF
Schedule of Investments (continued) June30, 2019 |
Investments | | Principal/
Shares | | Value |
CORPORATE BONDS (continued) |
Mining — 0.4% | | | | | | |
Constellium NV, 5.75%, 05/15/24‡ | | $ | 125,000 | | $ | 128,750 |
Real Estate — 0.9% | | | | | | |
Howard Hughes Corp. (The), 5.38%, 03/15/25‡ | | | 250,000 | | | 259,550 |
Retail — 1.3% | | | | | | |
Golden Nugget, Inc., 6.75%, 10/15/24‡ | | | 250,000 | | | 258,125 |
Men’s Wearhouse, Inc. (The), 7.00%, 07/01/22(b) | | | 125,000 | | | 120,938 |
Total Retail | | | | | | 379,063 |
Telecommunications — 1.8% | | | | | | |
Sprint Communications, Inc., 6.00%, 11/15/22 | | | 250,000 | | | 261,250 |
T-Mobile USA, Inc., 6.38%, 03/01/25 | | | 250,000 | | | 260,250 |
Total Telecommunications | | | | | | 521,500 |
Toys/Games/Hobbies — 0.4% |
Mattel, Inc., 2.35%, 08/15/21(b) | | | 125,000 | | | 121,250 |
Total Corporate Bonds
(Cost $2,462,264) | | | | | | 2,492,619 |
FOREIGN BONDS — 2.4% | | | | | | |
Diversified Financial Services — 0.9% |
Park Aerospace Holdings Ltd., 5.25%, 08/15/22 (Ireland)‡ | | | 250,000 | | | 264,575 |
Packaging & Containers — 0.7% |
Ardagh Packaging Finance PLC/Ardagh Holdings USA, Inc., 7.25%, 05/15/24 (Ireland)‡ | | | 200,000 | | | 211,500 |
Pharmaceuticals — 0.8% | | | | | | |
Teva Pharmaceutical Finance Netherlands III BV, 2.20%, 07/21/21 (Israel) | | | 250,000 | | | 238,125 |
Total Foreign Bonds
(Cost $692,445) | | | | | | 714,200 |
EXCHANGE TRADED FUND — 0.1% |
Closed-End Funds — 0.1% | | | | | | |
Eagle Point Credit Co., Inc.(b) | | | | | | |
(Cost $33,494) | | | 1,905 | | | 34,081 |
Investments | | Principal/
Shares | | Value |
MONEY MARKET FUND — 8.2% | |
JPMorgan U.S. Government Money Market Fund – Institutional Class, 2.23%(c) (Cost $2,383,662) | | | 2,383,662 | | $ | 2,383,662 | |
REPURCHASE AGREEMENTS — 0.9%(d) | |
HSBC Securities USA, Inc., dated 06/28/19, due 07/01/19, 2.52%, total to be received $250,053, (collateralized by various U.S. Government Agency Obligations,2.00% – 6.50%, 04/01/21 – 06/01/49, totaling $254,236) | | $ | 250,000 | | | 250,000 | |
RBC Dominion Securities, Inc., dated 06/28/19, due 07/01/19, 2.50%, total to be received $12,083, (collateralized by various U.S. Government Agency Obligations, 0.00% – 7.00%, 07/18/19 – 09/09/49, totaling $12,283) | | | 12,080 | | | 12,080 | |
Total Repurchase Agreements(Cost $262,080) | | | | | | 262,080 | |
Total Investments — 105.0% (Cost $30,884,751) | | | | | | 30,712,068 | |
Liabilities in Excess of Other Assets — (5.0%) | | | | | | (1,471,940 | ) |
Net Assets — 100.0% | | | | | $ | 29,240,128 | |
See accompanying Notes to Financial Statements.
74
ADVISORSHARES PACIFIC ASSET ENHANCED FLOATING RATE ETF
Schedule of Investments (continued) June30, 2019 |
Fair Value Measurements
The following is a summary of the inputs used, as of June30, 2019, in valuing the Fund’s assets and liabilities carried at fair value. These inputs are summarized in three broad levels. Level 1 includes quoted prices in active markets for identical securities. Level 2 includes other significant observable inputs (including quoted prices for similar securities, interest rates, prepayment speeds and credit risk). Level 3 includes significant unobservable inputs (including the Fund’s own assumptions in determining the fair value of investments). The level assigned to the securities valuations may not be an indication of the risk or liquidity associated with investing in those securities.
Assets | | Level 1 | | Level 2 | | Level 3 | | Total |
Term Loans | | $ | — | | $ | 24,825,426 | | $ | — | | $ | 24,825,426 |
Corporate Bonds | | | — | | | 2,492,619 | | | — | | | 2,492,619 |
Foreign Bonds | | | — | | | 714,200 | | | — | | | 714,200 |
Exchange Traded Fund | | | 34,081 | | | — | | | — | | | 34,081 |
Money Market Fund | | | 2,383,662 | | | — | | | — | | | 2,383,662 |
Repurchase Agreements | | | — | | | 262,080 | | | — | | | 262,080 |
Total | | $ | 2,417,743 | | $ | 28,294,325 | | $ | — | | $ | 30,712,068 |
SUMMARY OF SCHEDULE OF INVESTMENTS
| |
% of
Net Assets
|
Advertising | | 0.5 | % |
Aerospace/Defense | | 1.4 | |
Auto Manufacturers | | 0.8 | |
Building Materials | | 1.7 | |
Chemicals | | 2.5 | |
Closed-End Funds | | 0.1 | |
Coal | | 0.8 | |
Commercial Services | | 4.0 | |
Computers | | 1.9 | |
Distribution/Wholesale | | 2.7 | |
Diversified Financial Services | | 0.9 | |
Electric | | 0.8 | |
Engineering & Construction | | 1.6 | |
Entertainment | | 4.4 | |
Food | | 2.8 | |
Hand/Machine Tools | | 1.5 | |
Healthcare – Products | | 0.3 | |
Healthcare – Services | | 4.2 | |
Home Builders | | 0.4 | |
Household Products/Wares | | 1.0 | |
Insurance | | 2.1 | |
SUMMARY OF SCHEDULE OF INVESTMENTS
(continued)
| | % of
Net Assets |
Internet | | 3.4 | % |
Leisure Time | | 2.4 | |
Lodging | | 4.1 | |
Machinery – Diversified | | 2.3 | |
Media | | 3.5 | |
Mining | | 0.4 | |
Miscellaneous Manufacturing | | 1.0 | |
Packaging & Containers | | 5.4 | |
Pharmaceuticals | | 4.1 | |
Real Estate | | 0.9 | |
Retail | | 11.9 | |
Semiconductors | | 0.6 | |
Software | | 9.1 | |
Telecommunications | | 8.9 | |
Toys/Games/Hobbies | | 0.4 | |
Trucking & Leasing | | 1.1 | |
Money Market Fund | | 8.2 | |
Repurchase Agreements | | 0.9 | |
Total Investments | | 105.0 | |
Liabilities in Excess of Other Assets | | (5.0 | ) |
Net Assets | | 100.0 | % |
See accompanying Notes to Financial Statements.
75
ADVISORSHARES PURE CANNABIS ETF
Schedule of Investments June30, 2019 |
Investments | |
Shares
| | Value |
COMMON STOCKS — 88.0% | | | | | |
Agriculture —6.2% | | | | | |
Pyxus International, Inc.*(a) | | 63,440 | | $ | 964,288 |
Village Farms International, Inc. (Canada)* | | 239,823 | | | 2,743,575 |
Total Agriculture | | | | | 3,707,863 |
Biotechnology — 7.4% | | | | | |
Arena Pharmaceuticals, Inc.*(a) | | 36,266 | | | 2,126,276 |
Cara Therapeutics, Inc.*(a) | | 107,927 | | | 2,320,430 |
Total Biotechnology | | | | | 4,446,706 |
Household Products/Wares —1.2% |
Greenlane Holdings, Inc.,
Class A*(a) | | 73,344 | | | 703,369 |
Investment Companies — 2.3% |
Canopy Rivers, Inc. (Canada)* | | 552,076 | | | 1,347,712 |
Pharmaceuticals —63.6% | | | | | |
Aleafia Health, Inc. (Canada)*(a) | | 2,027,858 | | | 2,048,420 |
Aphria, Inc. (Canada)*(a) | | 529,816 | | | 3,714,010 |
Aurora Cannabis, Inc. (Canada)*(a) | | 241,965 | | | 1,892,166 |
CannTrust Holdings, Inc. (Canada)*(a) | | 680,765 | | | 3,417,440 |
Canopy Growth Corp. (Canada)*(a) | | 67,600 | | | 2,724,956 |
Charlottes Web Holdings, Inc.*(a) | | 129,065 | | | 1,888,443 |
Corbus Pharmaceuticals Holdings, Inc.*(a) | | 214,756 | | | 1,488,259 |
Emerald Health Therapeutics, Inc. (Canada)*(a) | | 786,968 | | | 1,439,337 |
Green Organic Dutchman Holdings Ltd. (The) (Canada)*(a) | | 825,144 | | | 2,039,575 |
HEXO Corp. (Canada)* | | 555,092 | | | 2,953,090 |
Intec Pharma Ltd. (Israel)*(a) | | 262,611 | | | 1,139,732 |
Khiron Life Sciences Corp. (Canada)* | | 651,201 | | | 1,136,207 |
Neptune Wellness Solutions, Inc. (Canada)*(a) | | 460,057 | | | 2,001,248 |
Organigram Holdings, Inc. (Canada)*(a) | | 576,727 | | | 3,720,535 |
Supreme Cannabis Co., Inc. (The) (Canada)*(a) | | 1,033,072 | | | 1,233,283 |
Tilray, Inc., Class 2 (Canada)*(a) | | 43,150 | | | 2,009,064 |
WeedMD, Inc. (Canada)* | | 1,268,790 | | | 1,524,393 |
Investments | | Shares/Principal | | Value |
COMMON STOCKS (continued) |
Pharmaceuticals (continued) | | | | | | |
Zynerba Pharmaceuticals, Inc.*(a) | | | 120,128 | | $ | 1,627,734 |
Total Pharmaceuticals | | | | | | 37,997,892 |
REITS — 7.3% | | | | | | |
Innovative Industrial Properties, Inc. | | | 35,463 | | | 4,381,808 |
Total Common Stocks
(Cost $56,809,473) | | | | | | 52,585,350 |
MONEY MARKET FUND — 6.6% |
BlackRock Liquidity Funds Treasury Trust Fund Portfolio, Institutional Class, 2.15%(b)
(Cost $3,939,002) | | | 3,939,002 | | | 3,939,002 |
REPURCHASE AGREEMENTS — 42.0% |
BofA Securities, Inc., dated 06/28/19, due 07/01/19, 2.50%, total to be received $5,838,776, (collateralized by various U.S. Government Agency Obligations, 3.30% – 4.50%, 06/01/46 – 07/01/49, totaling $5,937,776) | | $ | 5,837,560 | | | 5,837,560 |
Citigroup Global Markets, Inc., dated 06/28/19, due 07/01/19, 2.50%, total to be received $5,838,776, (collateralized by various U.S. Government Agency Obligations, 0.00% – 9.50%, 07/02/19 – 01/20/63, totaling $5,932,118) | | | 5,837,560 | | | 5,837,560 |
Daiwa Capital Markets America, dated 06/28/19, due 07/01/19, 2.53%, total to be received $5,838,791, (collateralized by various U.S. Government Agency Obligations, 0.00% – 6.50%, 07/05/19 – 09/09/49, totaling $5,934,443) | | | 5,837,560 | | | 5,837,560 |
JP Morgan Securities LLC, dated 06/28/19, due 07/01/19, 2.53%, total to be received $1,729,231, (collateralized by various U.S. Government Agency Obligations, 0.88% – 1.75%, 07/31/19 – 06/30/22, totaling $1,753,471) | | | 1,728,866 | | | 1,728,866 |
See accompanying Notes to Financial Statements.
76
ADVISORSHARES PURE CANNABIS ETF
Schedule of Investments (continued) June30, 2019 |
Investments | | Principal | | Value |
REPURCHASE AGREEMENTS (continued) | |
RBC Dominion Securities, Inc., dated 06/28/19, due 07/01/19, 2.51%, total to be received $5,838,781, (collateralized by various U.S. Government Agency Obligations, 0.00% – 7.00%, 07/18/19 – 09/09/49, totaling $5,935,569) | | $ | 5,837,560 | | $ | 5,837,560 | |
Total Repurchase Agreements
(Cost $25,079,106) | | | | | | 25,079,106 | |
Total Investments — 136.6%
(Cost $85,827,581) | | | | | | 81,603,458 | |
Liabilities in Excess of Other Assets — (36.6%) | | | | | | (21,841,464 | ) |
Net Assets — 100.0% | | | | | $ | 59,761,994 | |
Fair Value Measurements
The following is a summary of the inputs used, as of June30, 2019, in valuing the Fund’s assets and liabilities carried at fair value. These inputs are summarized in three broad levels. Level 1 includes quoted prices in active markets for identical securities. Level 2 includes other significant observable inputs (including quoted prices for similar securities, interest rates, prepayment speeds and credit risk). Level 3 includes significant unobservable inputs (including the Fund’s own assumptions in determining the fair value of investments). The level assigned to the securities valuations may not be an indication of the risk or liquidity associated with investing in those securities.
Assets | | Level 1 | | Level 2 | | Level 3 | | Total |
Common Stocks | | $ | 52,585,350 | | $ | — | | $ | — | | $ | 52,585,350 |
Money Market Fund | | | 3,939,002 | | | — | | | — | | | 3,939,002 |
Repurchase Agreements | | | — | | | 25,079,106 | | | — | | | 25,079,106 |
Swaps† | | | — | | | 59,722 | | | — | | | 59,722 |
Total | | $ | 56,524,352 | | $ | 25,138,828 | | $ | — | | $ | 81,663,180 |
Liabilities | | Level 1 | | Level 2 | | Level 3 | | Total |
Swaps† | | $ | — | | $ | (263,210 | ) | | $ | — | | $ | (263,210 | ) |
Total | | $ | — | | $ | (263,210 | ) | | $ | — | | $ | (263,210 | ) |
See accompanying Notes to Financial Statements.
77
ADVISORSHARES PURE CANNABIS ETF
Schedule of Investments (continued) June30, 2019 |
SUMMARY OF SCHEDULE OF INVESTMENTS
| | % of
Net Assets |
Agriculture | | 6.2 | % |
Biotechnology | | 7.4 | |
Household Products/Wares | | 1.2 | |
Investment Companies | | 2.3 | |
Pharmaceuticals | | 63.6 | |
REITS | | 7.3 | |
Money Market Fund | | 6.6 | |
Repurchase Agreements | | 42.0 | |
Total Investments | | 136.6 | |
Liabilities in Excess of Other Assets | | (36.6 | ) |
Net Assets | | 100.0 | % |
Total Return Swap contracts outstanding as of June 30, 2019:
Reference Entity | | Number of Contracts | | Annual Financing
Rate Paid | | Payment Frequency | | Termination Date | | Notional Amounts | | Fair
Value | | Unrealized Appreciation/(Depreciation) |
Cresco Labs ORD | | 108,100 | | 1-month USD LIBOR + 1.00% | | Quarterly | | 6/24/2020 | | $ | 1,192,844 | | $ | 1,111,268 | | $ | (81,576 | ) |
Curaleaf Holdings SUB VOT ORD | | 150,400 | | 1-month USD LIBOR + 1.00% | | Quarterly | | 6/24/2020 | | | 1,193,869 | | | 1,078,368 | | | (115,501 | ) |
Green Thumb Industries SUB VOT ORD | | 112,600 | | 1-month USD LIBOR + 1.00% | | Quarterly | | 6/24/2020 | | | 1,217,556 | | | 1,254,646 | | | 37,090 | |
GW Pharmaceuticals ADR ORD | | 7,500 | | 1-month USD LIBOR + 1.00% | | Quarterly | | 6/24/2020 | | | 1,337,531 | | | 1,292,925 | | | (44,606 | ) |
Ianthus ORD | | 320,500 | | 1-month USD LIBOR + 1.00% | | Quarterly | | 6/24/2020 | | | 1,059,697 | | | 1,082,329 | | | 22,632 | |
Trulieve Cannabis ORD | | 95,200 | | 1-month USD LIBOR + 1.00% | | Quarterly | | 6/24/2020 | | | 1,067,775 | | | 1,046,248 | | | (21,527 | ) |
Net Unrealized Depreciation | | | | | | | | | | | | | | $ | (203,488 | ) |
Cowen acts as the counterparty to the total return swap contracts listed above. The Fund either receives fees from, or pays fees to, the counterparty, depending upon the total return of the benchmark, and the agreed-upon floating financing rate. As of June30, 2019 cash in the amount of $3,220,000 has been segregated as collateral from the broker for Swap contracts.
See accompanying Notes to Financial Statements.
78
ADVISORSHARES RANGER EQUITY BEAR ETF
Schedule of Investments June30, 2019 |
Investments | | Shares | | Value |
EXCHANGE TRADED FUND — 40.3% | |
Debt Fund — 40.3% | | | | | | | |
AdvisorShares Sage Core Reserves ETF† | | | | | | | |
(Cost $54,688,500) | | 550,000 | | | $ | 54,785,500 | |
MONEY MARKET FUNDS— 46.4% | |
BlackRock Liquidity Funds FedFund Portfolio, Institutional Class, 2.29%(a) | | 41,333,112 | | | | 41,333,112 | |
Dreyfus Treasury Securities Cash Management, 2.10%(a) | | 3,778,072 | | | | 3,778,072 | |
Fidelity Institutional Money Market Government Portfolio – Class III, 2.00%(a) | | 17,334,173 | | | | 17,334,173 | |
Morgan Stanley Institutional Liquidity Funds – Government Portfolio, 2.19%(a) | | 500,000 | | | | 500,000 | |
Total Money Market Funds(Cost $62,945,357) | | | | | | 62,945,357 | |
Total Investments Before Securities Sold, Not
Yet Purchased
(Cost $117,633,857) | | | | | | 117,730,857 | |
Securities Sold, Not Yet Purchased — (98.9)%(b) | |
COMMON STOCKS — (98.9)% | |
Agriculture — (3.8)% | | | | | | | |
Altria Group, Inc. | | (60,000 | ) | | | (2,841,000 | ) |
Bunge Ltd. | | (42,000 | ) | | | (2,339,820 | ) |
Total Agriculture | | | | | | (5,180,820 | ) |
Apparel — (3.7)% | | | | | | | |
Hanesbrands, Inc. | | (122,000 | ) | | | (2,100,840 | ) |
VF Corp. | | (34,000 | ) | | | (2,969,900 | ) |
Total Apparel | | | | | | (5,070,740 | ) |
Auto Parts & Equipment — (1.4)% | |
Goodyear Tire & Rubber Co. (The) | | (120,000 | ) | | | (1,836,000 | ) |
Banks — (3.4)% | | | | | | | |
SVB Financial Group* | | (10,000 | ) | | | (2,245,900 | ) |
Webster Financial Corp. | | (51,000 | ) | | | (2,436,270 | ) |
Total Banks | | | | | | (4,682,170 | ) |
Chemicals — (5.3)% | | | | | | | |
Albemarle Corp. | | (40,000 | ) | | | (2,816,400 | ) |
Chemours Co. (The) | | (80,000 | ) | | | (1,920,000 | ) |
Westlake Chemical Corp. | | (35,000 | ) | | | (2,431,100 | ) |
Total Chemicals | | | | | | (7,167,500 | ) |
Investments | | Shares | | Value |
COMMON STOCKS (continued) | |
Commercial Services — (2.0)% | |
Adtalem Global Education, Inc.* | | (60,000 | ) | | $ | (2,703,000 | ) |
Computers — (2.8)% | | | | | | | |
Cubic Corp. | | (34,000 | ) | | | (2,192,320 | ) |
NetScout Systems, Inc.* | | (61,000 | ) | | | (1,548,790 | ) |
Total Computers | | | | | | (3,741,110 | ) |
Distribution/Wholesale — (1.5)% | |
Watsco, Inc. | | (12,500 | ) | | | (2,044,125 | ) |
Diversified Financial Services — (1.7)% | |
Eaton Vance Corp. | | (54,000 | ) | | | (2,329,020 | ) |
Electronics — (1.4)% | | | | | | | |
KEMET Corp. | | (100,000 | ) | | | (1,881,000 | ) |
Engineering & Construction — (1.9)% | |
Fluor Corp. | | (77,000 | ) | | | (2,594,130 | ) |
Food — (1.8)% | | | | | | | |
Kellogg Co. | | (46,000 | ) | | | (2,464,220 | ) |
Hand/Machine Tools — (2.0)% | |
Snap-on, Inc. | | (16,000 | ) | | | (2,650,240 | ) |
Healthcare – Products — (1.8)% | |
Avanos Medical, Inc.* | | (56,000 | ) | | | (2,442,160 | ) |
Healthcare – Services — (2.8)% | |
Humana, Inc. | | (9,000 | ) | | | (2,387,700 | ) |
Molina Healthcare, Inc.* | | (10,000 | ) | | | (1,431,400 | ) |
Total Healthcare – Services | | | | | | (3,819,100 | ) |
Home Builders — (1.7)% | | | | | | | |
Thor Industries, Inc. | | (40,000 | ) | | | (2,338,000 | ) |
Home Furnishings — (1.4)% | | | | | |
Dolby Laboratories, Inc., Class A | | (30,000 | ) | | | (1,938,000 | ) |
Household Products/Wares — (1.6)% | |
Spectrum Brands Holdings, Inc. | | (40,000 | ) | | | (2,150,800 | ) |
Housewares — (1.5)% | | | | | | | |
Tupperware Brands Corp. | | (105,000 | ) | | | (1,998,150 | ) |
Iron/Steel — (5.1)% | | | | | | | |
Commercial Metals Co. | | (162,000 | ) | | | (2,891,700 | ) |
United States Steel Corp. | | (150,000 | ) | | | (2,296,500 | ) |
Vale SA (Brazil)(c) | | (125,000 | ) | | | (1,680,000 | ) |
Total Iron/Steel | | | | | | (6,868,200 | ) |
See accompanying Notes to Financial Statements.
79
ADVISORSHARES RANGER EQUITY BEAR ETF
Schedule of Investments (continued) June30, 2019 |
Investments | | Shares | | Value |
COMMON STOCKS (continued) | |
Leisure Time — (4.6)% | | | | | | | |
Brunswick Corp. | | (75,000 | ) | | $ | (3,441,750 | ) |
Harley-Davidson, Inc. | | (79,000 | ) | | | (2,830,570 | ) |
Total Leisure Time | | | | | | (6,272,320 | ) |
Lodging — (1.8)% | | | | | | | |
Hilton Grand Vacations, Inc.* | | (75,000 | ) | | | (2,386,500 | ) |
Machinery – Construction & Mining — (3.4)% | |
BWX Technologies, Inc. | | (43,500 | ) | | | (2,266,350 | ) |
Terex Corp. | | (75,000 | ) | | | (2,355,000 | ) |
Total Machinery – Construction & Mining | | | | | | (4,621,350 | ) |
Machinery – Diversified — (7.7)% | |
Deere & Co. | | (15,000 | ) | | | (2,485,650 | ) |
GrafTech International Ltd. | | (250,000 | ) | | | (2,875,000 | ) |
Wabtec Corp. | | (40,000 | ) | | | (2,870,400 | ) |
Welbilt, Inc.* | | (135,000 | ) | | | (2,254,500 | ) |
Total Machinery – Diversified | | | | | | (10,485,550 | ) |
Media — (1.4)% | | | | | | | |
Discovery, Inc., Class A* | | (60,000 | ) | | | (1,842,000 | ) |
Mining — (1.8)% | | | | | | | |
Alcoa Corp.* | | (105,000 | ) | | | (2,458,050 | ) |
Office/Business Equipment — (2.2)% | | | | | |
Canon, Inc. (Japan)(c) | | (100,000 | ) | | | (2,927,000 | ) |
Oil & Gas — (10.0)% | | | | | | | |
Callon Petroleum Co.* | | (300,000 | ) | | | (1,977,000 | ) |
China Petroleum & Chemical Corp. (China)(c) | | (30,000 | ) | | | (2,046,000 | ) |
Concho Resources, Inc. | | (25,000 | ) | | | (2,579,500 | ) |
HollyFrontier Corp. | | (50,000 | ) | | | (2,314,000 | ) |
Parsley Energy, Inc., Class A* | | (150,000 | ) | | | (2,851,500 | ) |
Whiting Petroleum Corp.* | | (100,000 | ) | | | (1,868,000 | ) |
Total Oil & Gas | | | | | | (13,636,000 | ) |
Oil & Gas Services — (1.8)% | | | | | | | |
Baker Hughes, a GE Co. | | (100,000 | ) | | | (2,463,000 | ) |
Pharmaceuticals — (3.6)% | | | | | | | |
Phibro Animal Health Corp., Class A | | (75,000 | ) | | | (2,382,750 | ) |
Prestige Consumer Healthcare, Inc.* | | (77,000 | ) | | | (2,439,360 | ) |
Total Pharmaceuticals | | | | | | (4,822,110 | ) |
Investments | | Shares | | Value |
COMMON STOCKS (continued) | |
Pipelines — (1.3)% | | | | | | | |
Antero Midstream Corp. | | (160,000 | ) | | $ | (1,833,600 | ) |
REITS — (1.8)% | | | | | | | |
Macerich Co. (The) | | (75,000 | ) | | | (2,511,750 | ) |
Software — (2.6)% | | | | | | | |
PTC, Inc.* | | (40,000 | ) | | | (3,590,400 | ) |
Telecommunications— (1.4)% | | | | | |
Loral Space & Communications, Inc.* | | (56,000 | ) | | | (1,932,560 | ) |
Transportation — (2.7)% | | | | | | | |
United Parcel Service, Inc., Class B | | (36,000 | ) | | | (3,717,720 | ) |
Trucking & Leasing — (2.2)% | | | | | |
Greenbrier Cos., Inc. (The) | | (97,300 | ) | | | (2,957,920 | ) |
Total Securities Sold, Not Yet Purchased [Proceeds Received $(132,043,521)] | | | | | | (134,356,315 | ) |
Total Investments— (12.2)% | | | | | | | |
(Cost $(14,409,664)) | | | | | | (16,625,458 | ) |
Other Assets in Excess of Liabilities — 112.2% | | | | | | 152,439,737 | |
Net Assets — 100.0% | | | | | $ | 135,814,279 | |
See accompanying Notes to Financial Statements.
80
ADVISORSHARES RANGER EQUITY BEAR ETF
Schedule of Investments (continued) June30, 2019 |
Fair Value Measurements
The following is a summary of the inputs used, as of June30, 2019, in valuing the Fund’s assets and liabilities carried at fair value. These inputs are summarized in three broad levels. Level 1 includes quoted prices in active markets for identical securities. Level 2 includes other significant observable inputs (including quoted prices for similar securities, interest rates, prepayment speeds and credit risk). Level 3 includes significant unobservable inputs (including the Fund’s own assumptions in determining the fair value of investments). The level assigned to the securities valuations may not be an indication of the risk or liquidity associated with investing in those securities.
Assets | | Level 1 | | Level 2 | | Level 3 | | Total |
Exchange Traded Fund | | $ | 54,785,500 | | $ | — | | $ | — | | $ | 54,785,500 |
Money Market Funds | | | 62,945,357 | | | — | | | — | | | 62,945,357 |
Total | | $ | 117,730,857 | | $ | — | | $ | — | | $ | 117,730,857 |
Liabilities | | | Level 1 | | | | Level 2 | | | Level 3 | | | Total | |
Common Stocks | | $ | (134,356,315 | ) | | $ | — | | $ | — | | $ | (134,356,315 | ) |
Total | | $ | (134,356,315 | ) | | $ | — | | $ | — | | $ | (134,356,315 | ) |
SUMMARY OF SCHEDULE OF INVESTMENTS |
| | |
% of
Net Assets
|
Agriculture | | (3.8 | )% |
Apparel | | (3.7 | ) |
Auto Parts & Equipment | | (1.4 | ) |
Banks | | (3.4 | ) |
Chemicals | | (5.3 | ) |
Commercial Services | | (2.0 | ) |
Computers | | (2.8 | ) |
Debt Fund | | 40.3 | |
Distribution/Wholesale | | (1.5 | ) |
Diversified Financial Services | | (1.7 | ) |
Electronics | | (1.4 | ) |
Engineering & Construction | | (1.9 | ) |
Food | | (1.8 | ) |
Hand/Machine Tools | | (2.0 | ) |
Healthcare – Products | | (1.8 | ) |
Healthcare – Services | | (2.8 | ) |
Home Builders | | (1.7 | ) |
Home Furnishings | | (1.4 | ) |
Household Products/Wares | | (1.6 | ) |
Housewares | | (1.5 | ) |
Iron/Steel | | (5.1 | ) |
SUMMARY OF SCHEDULE OF INVESTMENTS
(continued) |
| | | % of
Net Assets |
Leisure Time | | (4.6 | )% |
Lodging | | (1.8) | |
Machinery – Construction & Mining | | (3.4 | ) |
Machinery – Diversified | | (7.7 | ) |
Media | | (1.4 | ) |
Mining | | (1.8 | ) |
Office/Business Equipment | | (2.2 | ) |
Oil & Gas | | (10.0 | ) |
Oil & Gas Services | | (1.8 | ) |
Pharmaceuticals | | (3.6 | ) |
Pipelines | | (1.3 | ) |
REITS | | (1.8 | ) |
Software | | (2.6 | ) |
Telecommunications | | (1.4 | ) |
Transportation | | (2.7 | ) |
Trucking & Leasing | | (2.2 | ) |
Money Market Funds | | 46.4 | |
Total Investments | | (12.2 | ) |
Other Assets in Excess of Liabilities | | 112.2 | |
Net Assets | | 100.0 | % |
Affiliated holdings are funds which are managed by the Trust or an affiliate of the Trust. Transactions with affiliated companies during the year ended June30, 2019 were as follows:
Affiliated Fund Name | | Value at
6/30/2018 | | Purchases/
Additions | | Sales/
Reductions | | Realized
Gain (Loss) | | Change in
Unrealized
Gain (Loss) | | Number of
Shares at
6/30/2019 | | Value at
6/30/2019 | | Dividend
Income |
AdvisorShares Sage Core Reserves ETF | | $ | 44,635,500 | | $ | 9,945,000 | | $ | — | | $ | — | | $ | 205,000 | | 550,000 | | $ | 54,785,500 | | $ | 1,211,079 |
See accompanying Notes to Financial Statements.
81
ADVISORSHARES SABRETOOTH ETF
Schedule of Investments June30, 2019 |
Investments | |
Shares | | Value |
COMMON STOCKS — 98.3% | | | | | |
Banks — 6.1% | | | | | |
Goldman Sachs Group, Inc. (The) | | 392 | | $ | 80,203 |
JPMorgan Chase & Co. | | 755 | | | 84,409 |
Total Banks | | | | | 164,612 |
Commercial Services — 8.7% | | | | | |
PayPal Holdings, Inc.* | | 847 | | | 96,947 |
Square, Inc., Class A*(a) | | 1,074 | | | 77,897 |
StoneCo Ltd., Class A (Brazil)* | | 2,022 | | | 59,811 |
Total Commercial Services | | | | | 234,655 |
Computers — 3.8% | | | | | |
CrowdStrike Holdings, Inc., Class A* | | 931 | | | 63,578 |
Nutanix, Inc., Class A* | | 1,482 | | | 38,443 |
Total Computers | | | | | 102,021 |
Diversified Financial Services — 13.7% |
American Express Co. | | 755 | | | 93,197 |
Mastercard, Inc., Class A | | 364 | | | 96,289 |
Nasdaq, Inc. | | 891 | | | 85,688 |
Visa, Inc., Class A | | 548 | | | 95,105 |
Total Diversified Financial Services | | | | | 370,279 |
Internet — 22.2% | | | | | |
Alibaba Group Holding Ltd. (China)*(b) | | 456 | | | 77,269 |
Alphabet, Inc., Class C* | | 68 | | | 73,502 |
Amazon.com, Inc.* | | 64 | | | 121,192 |
F5 Networks, Inc.* | | 480 | | | 69,903 |
Facebook, Inc., Class A* | | 200 | | | 38,600 |
Okta, Inc.* | | 955 | | | 117,952 |
Zendesk, Inc.* | | 1,138 | | | 101,316 |
Total Internet | | | | | 599,734 |
REITS — 3.3% | | | | | |
Equinix, Inc. | | 176 | | | 88,755 |
Software — 37.1% | | | | | |
Adobe, Inc.* | | 309 | | | 91,047 |
Alteryx, Inc., Class A*(a) | | 1,106 | | | 120,687 |
Microsoft Corp. | | 728 | | | 97,523 |
MongoDB, Inc.*(a) | | 807 | | | 122,736 |
New Relic, Inc.* | | 739 | | | 63,931 |
salesforce.com, Inc.* | | 492 | | | 74,651 |
ServiceNow, Inc.* | | 340 | | | 93,354 |
Investments | | Shares/
Principal | | Value |
COMMON STOCKS (continued) |
Software (continued) | | | | | | |
Splunk, Inc.* | | | 604 | | $ | 75,953 |
Twilio, Inc., Class A*(a) | | | 688 | | | 93,809 |
VMware, Inc., Class A | | | 500 | | | 83,605 |
Workday, Inc., Class A* | | | 412 | | | 84,699 |
Total Software | | | | | | 1,001,995 |
Telecommunications — 3.4% | | | | | | |
Arista Networks, Inc.* | | | 348 | | | 90,348 |
Total Common Stocks
(Cost $2,585,291) | | | | | | 2,652,399 |
REPURCHASE AGREEMENT — 0.0%**(c) |
RBC Dominion Securities, Inc., dated 06/28/19, due 07/01/19, 0.00%, total to be received $65, (collateralized by various U.S. Government Agency Obligations, 0.00% – 7.00%, 07/18/19 – 09/09/49, totaling $66) (Cost $65) | | $ | 65 | | | 65 |
Total Investments — 98.3%
(Cost $2,585,356) | | | | | | 2,652,464 |
Other Assets in Excess of Liabilities — 1.7% | | | | | | 45,927 |
Net Assets— 100.0% | | | | | $ | 2,698,391 |
See accompanying Notes to Financial Statements.
82
ADVISORSHARES SABRETOOTH ETF
Schedule of Investments (continued) June30, 2019 |
Fair Value Measurements
The following is a summary of the inputs used, as of June30, 2019, in valuing the Fund’s assets and liabilities carried at fair value. These inputs are summarized in three broad levels. Level 1 includes quoted prices in active markets for identical securities. Level 2 includes other significant observable inputs (including quoted prices for similar securities, interest rates, prepayment speeds and credit risk). Level 3 includes significant unobservable inputs (including the Fund’s own assumptions in determining the fair value of investments). The level assigned to the securities valuations may not be an indication of the risk or liquidity associated with investing in those securities.
Assets | | Level 1 | | Level 2 | | Level 3 | | Total |
Common Stocks | | $ | 2,652,399 | | $ | — | | $ | — | | $ | 2,652,399 |
Repurchase Agreement | | | — | | | 65 | | | — | | | 65 |
Total | | $ | 2,652,399 | | $ | 65 | | $ | — | | $ | 2,652,464 |
SUMMARY OF SCHEDULE OF INVESTMENTS
| | % of
Net Assets |
Banks | | 6.1 | % |
Commercial Services | | 8.7 | |
Computers | | 3.8 | |
Diversified Financial Services | | 13.7 | |
Internet | | 22.2 | |
REITS | | 3.3 | |
Software | | 37.1 | |
Telecommunications | | 3.4 | |
Repurchase Agreement | | 0.0 | ** |
Total Investments | | 98.3 | |
Other Assets in Excess of Liabilities | | 1.7 | |
Net Assets | | 100.0 | % |
See accompanying Notes to Financial Statements.
83
ADVISORSHARES SAGE CORE RESERVES ETF
Schedule of Investments June30, 2019 |
Investments | | Principal | | Value |
CORPORATE BONDS — 60.6% |
Aerospace/Defense — 1.7% | | | | | | |
Spirit AeroSystems, Inc., 3.21%, (3-Month USD LIBOR + 0.80%), 06/15/21@ | | $ | 639,000 | | $ | 634,964 |
United Technologies Corp., 1.50%, 11/01/19 | | | 570,000 | | | 568,149 |
Total Aerospace/Defense | | | | | | 1,203,113 |
Auto Manufacturers — 1.2% | | | | | | |
General Motors Co., 3.37%, (3-Month USD LIBOR + 0.80%), 08/07/20@ | | | 517,000 | | | 517,751 |
General Motors Financial Co., Inc., 2.65%, 04/13/20 | | | 345,000 | | | 344,957 |
Total Auto Manufacturers | | | | | | 862,708 |
Banks — 12.2% | | | | | | |
Bank of America Corp., Series L, 2.25%, 04/21/20 | | | 1,395,000 | | | 1,394,971 |
Bank of New York Mellon Corp. (The), Series G, 2.15%, 02/24/20 | | | 940,000 | | | 939,054 |
Branch Banking & Trust Co., 3.05%, (3-Month USD LIBOR + 0.45%), 01/15/20@ | | | 475,000 | | | 475,845 |
Branch Banking & Trust Co., Series BKNT, 2.74%, (3-Month USD LIBOR + 0.22%), 06/01/20@ | | | 400,000 | | | 400,386 |
Citigroup, Inc., 2.40%, 02/18/20 | | | 315,000 | | | 315,048 |
Citigroup, Inc., 3.52%, (3-Month USD LIBOR + 1.07%), 12/08/21@ | | | 770,000 | | | 778,495 |
Goldman Sachs Group, Inc. (The), Series GMTN, 5.38%, 03/15/20 | | | 1,495,000 | | | 1,526,095 |
Goldman Sachs Group, Inc. (The), Series FRN, 4.29%, (3-Month USD LIBOR + 1.77%), 02/25/21@ | | | 1,065,000 | | | 1,089,301 |
JPMorgan Chase & Co., 4.00%, (3-Month USD LIBOR + 1.48%), 03/01/21@ | | | 630,000 | | | 641,341 |
Manufacturers & Traders Trust Co., Series BKNT, 2.85%, (3-Month USD LIBOR + 0.27%), 01/25/21@ | | | 520,000 | | | 519,193 |
Morgan Stanley, 2.80%, 06/16/20 | | | 695,000 | | | 698,350 |
Total Banks | | | | | | 8,778,079 |
Beverages — 0.9% | | | | | | |
Constellation Brands, Inc., 2.00%, 11/07/19 | | | 650,000 | | | 648,616 |
Investments | | Principal | | Value |
CORPORATE BONDS (continued) |
Building Materials — 1.5% | | | | | | |
Vulcan Materials Co., 3.01%, (3-Month USD LIBOR + 0.60%), 06/15/20@ | | $ | 430,000 | | $ | 430,112 |
Vulcan Materials Co., 3.17%, (3-Month USD LIBOR + 0.65%), 03/01/21@ | | | 625,000 | | | 625,683 |
Total Building Materials | | | | | | 1,055,795 |
Chemicals — 0.5% | | | | | | |
Eastman Chemical Co., 2.70%, 01/15/20 | | | 129,000 | | | 128,975 |
Monsanto Co., 2.13%, 07/15/19 | | | 264,000 | | | 263,893 |
Total Chemicals | | | | | | 392,868 |
Commercial Services — 1.5% | | | | | | |
Equifax, Inc., 3.39%, (3-Month USD LIBOR + 0.87%), 08/15/21@ | | | 570,000 | | | 568,709 |
Equifax, Inc., 3.60%, 08/15/21 | | | 515,000 | | | 525,054 |
Total Commercial Services | | | | | | 1,093,763 |
Computers — 4.0% | | | | | | |
EMC Corp., 2.65%, 06/01/20 | | | 1,445,000 | | | 1,437,325 |
Hewlett Packard Enterprise Co., 3.60%, 10/15/20 | | | 1,419,000 | | | 1,437,950 |
Total Computers | | | | | | 2,875,275 |
Diversified Financial Services — 5.9% |
Air Lease Corp., 2.13%, 01/15/20 | | | 1,035,000 | | | 1,032,653 |
American Express Credit Corp., Series GMTN, 2.25%, 08/15/19 | | | 420,000 | | | 419,913 |
American Express Credit Corp., Series MTN, 2.20%, 03/03/20 | | | 345,000 | | | 344,711 |
American Express Credit Corp., Series F, 3.48%, (3-Month USD LIBOR + 1.05%), 09/14/20@ | | | 540,000 | | | 544,972 |
Capital One Financial Corp., 2.50%, 05/12/20 | | | 695,000 | | | 695,827 |
Charles Schwab Corp. (The), 2.84%, (3-Month USD LIBOR + 0.32%), 05/21/21@ | | | 500,000 | | | 500,805 |
Jefferies Group LLC, 8.50%, 07/15/19 | | | 520,000 | | | 521,104 |
Synchrony Financial, 2.70%, 02/03/20 | | | 195,000 | | | 195,041 |
Total Diversified Financial Services | | | | | | 4,255,026 |
See accompanying Notes to Financial Statements.
84
ADVISORSHARES SAGE CORE RESERVES ETF
Schedule of Investments (continued) June30, 2019 |
Investments | | Principal | | Value |
CORPORATE BONDS (continued) |
Electric — 1.1% | | | | | | |
Exelon Generation Co. LLC, 2.95%, 01/15/20 | | $ | 153,000 | | $ | 153,187 |
Florida Power & Light Co., 2.97%, (3-Month USD LIBOR + 0.40%), 05/06/22@ | | | 627,000 | | | 627,315 |
Total Electric | | | | | | 780,502 |
Food — 3.5% | | | | | | |
General Mills, Inc., 2.20%, 10/21/19 | | | 673,000 | | | 672,168 |
JM Smucker Co. (The), 2.50%, 03/15/20 | | | 660,000 | | | 659,988 |
Kraft Heinz Foods Co., 2.98%, (3-Month USD LIBOR + 0.42%), 08/09/19@ | | | 525,000 | | | 525,104 |
Tyson Foods, Inc., 3.07%, (3-Month USD LIBOR + 0.55%), 06/02/20@(a) | | | 692,000 | | | 692,811 |
Total Food | | | | | | 2,550,071 |
Healthcare – Products — 2.6% |
Becton Dickinson and Co., 3.19%, (3-Month USD LIBOR + 0.88%), 12/29/20@ | | | 367,000 | | | 367,060 |
Zimmer Biomet Holdings, Inc., 2.70%, 04/01/20 | | | 1,080,000 | | | 1,081,484 |
Zimmer Biomet Holdings, Inc., 3.17%, (3-Month USD LIBOR + 0.75%), 03/19/21@ | | | 390,000 | | | 389,714 |
Total Healthcare – Products | | | | | | 1,838,258 |
Healthcare – Services — 2.5% |
Anthem, Inc., 2.25%, 08/15/19 | | | 629,000 | | | 628,786 |
HCA, Inc., 6.50%, 02/15/20 | | | 925,000 | | | 946,347 |
Humana, Inc., 2.63%, 10/01/19 | | | 260,000 | | | 260,099 |
Total Healthcare – Services | | | | | | 1,835,232 |
Home Builders — 1.0% | | | | | | |
D.R. Horton, Inc., 4.00%, 02/15/20 | | | 280,000 | | | 282,036 |
KB Home, 8.00%, 03/15/20 | | | 390,000 | | | 403,728 |
Total Home Builders | | | | | | 685,764 |
Internet — 0.8% | | | | | | |
eBay, Inc., 2.20%, 08/01/19 | | | 522,000 | | | 521,838 |
Expedia Group, Inc., 5.95%, 08/15/20 | | | 60,000 | | | 62,174 |
Total Internet | | | | | | 584,012 |
Media — 0.4% | | | | | | |
NBCUniversal Media LLC, 5.15%, 04/30/20 | | | 308,000 | | | 315,066 |
Investments | | Principal | | Value |
CORPORATE BONDS (continued) |
Oil & Gas — 0.3% | | | | | | |
Phillips 66, 3.12%, (3-Month USD LIBOR + 0.60%), 02/26/21@ | | $ | 200,000 | | $ | 200,008 |
Pharmaceuticals — 1.6% | | | | | | |
Allergan Funding SCS, 3.69%, (3-Month USD LIBOR + 1.26%), 03/12/20@ | | | 855,000 | | | 860,642 |
Allergan Funding SCS, 3.00%, 03/12/20 | | | 323,000 | | | 324,008 |
Total Pharmaceuticals | | | | | | 1,184,650 |
Pipelines — 6.6% | | | | | | |
Buckeye Partners LP, 4.88%, 02/01/21 | | | 890,000 | | | 904,534 |
Enbridge Energy Partners LP, 5.20%, 03/15/20 | | | 790,000 | | | 803,770 |
Energy Transfer Operating LP, 7.50%, 10/15/20 | | | 1,365,000 | | | 1,448,316 |
Midcontinent Express Pipeline LLC, 6.70%, 09/15/19‡ | | | 537,000 | | | 542,184 |
NuStar Logistics LP, 6.75%, 02/01/21 | | | 400,000 | | | 420,000 |
Williams Cos., Inc. (The), 5.25%, 03/15/20 | | | 665,000 | | | 677,429 |
Total Pipelines | | | | | | 4,796,233 |
REITS — 5.4% | | | | | | |
Alexandria Real Estate Equities, Inc., 2.75%, 01/15/20 | | | 675,000 | | | 675,357 |
American Campus Communities Operating Partnership LP, 3.35%, 10/01/20 | | | 1,425,000 | | | 1,440,393 |
ERP Operating LP, 2.38%, 07/01/19 | | | 740,000 | | | 740,000 |
Liberty Property LP, 4.75%, 10/01/20 | | | 635,000 | | | 649,648 |
Ventas Realty LP / Ventas Capital Corp., 2.70%, 04/01/20 | | | 385,000 | | | 385,539 |
Total REITS | | | | | | 3,890,937 |
Retail — 2.5% | | | | | | |
Dollar Tree, Inc., 3.29%, (3-Month USD LIBOR + 0.70%), 04/17/20@ | | | 270,000 | | | 270,032 |
Penske Automotive Group, Inc., 3.75%, 08/15/20 | | | 800,000 | | | 804,000 |
Walgreens Boots Alliance, Inc., 2.70%, 11/18/19 | | | 744,000 | | | 744,164 |
Total Retail | | | | | | 1,818,196 |
See accompanying Notes to Financial Statements.
85
ADVISORSHARES SAGE CORE RESERVES ETF
Schedule of Investments (continued) June30, 2019 |
Investments | | Principal | | Value |
CORPORATE BONDS (continued) |
Telecommunications — 2.5% | | | | | | |
AT&T, Inc., 3.26%, (3-Month USD LIBOR + 0.93%), 06/30/20@ | | $ | 636,000 | | $ | 640,585 |
AT&T, Inc., 3.55%, (3-Month USD LIBOR + 0.95%), 07/15/21@ | | | 785,000 | | | 792,114 |
Juniper Networks, Inc., 3.30%, 06/15/20 | | | 400,000 | | | 402,416 |
Total Telecommunications | | | | | | 1,835,115 |
Trucking & Leasing — 0.4% | | | | | | |
Aviation Capital Group LLC, 3.25%, (3-Month USD LIBOR + 0.67%), 07/30/21@‡ | | | 270,000 | | | 269,167 |
Total Corporate Bonds (Cost $43,623,161) | | | | | | 43,748,454 |
ASSET BACKED SECURITIES — 13.9% |
Diversified Financial Services — 13.9% |
Ally Auto Receivables Trust, Class B, Series 2016-2, 2.15%, 04/15/21 | | | 1,000,000 | | | 999,089 |
Cabela’s Credit Card Master Note Trust, Class A2, Series 2015-1A, 2.93%, (1-Month USD LIBOR + 0.54%), 03/15/23@ | | | 285,000 | | | 285,708 |
CarMax Auto Owner Trust, Class A3, Series 2015-4, 1.56%, 11/16/20 | | | 1,930 | | | 1,929 |
CarMax Auto Owner Trust, Class A3, Series 2016-3, 1.39%, 05/17/21 | | | 704,031 | | | 702,575 |
Citibank Credit Card Issuance Trust, Class A3, Series 2017-A3, 1.92%, 04/07/22 | | | 1,445,000 | | | 1,442,125 |
Citibank Credit Card Issuance Trust, Class A6, Series 2014-A6, 2.15%, 07/15/21 | | | 645,000 | | | 644,934 |
Ford Credit Auto Owner Trust, Class A2B, Series 2017-C, 2.51%, (1-Month USD LIBOR + 0.12%), 09/15/20@ | | | 23,143 | | | 23,170 |
Ford Credit Floorplan Master Owner Trust A, Class A1, Series 2016-5, 1.95%, 11/15/21 | | | 640,000 | | | 638,953 |
Honda Auto Receivables Owner Trust, Class A3, Series 2017-1, 1.72%, 07/21/21 | | | 366,633 | | | 365,579 |
Investments | | Principal | | Value |
ASSET BACKED SECURITIES (continued) |
Diversified Financial Services (continued) |
Honda Auto Receivables Owner Trust, Class A3, Series 2016-4, 1.21%, 12/18/20 | | $ | 485,236 | | $ | 483,412 |
Hyundai Auto Receivables Trust, Class A3, Series 2016-A, 1.56%, 09/15/20 | | | 74,331 | | | 74,301 |
Nissan Auto Receivables Owner Trust, Class A3, Series 2016-A, 1.34%, 10/15/20 | | | 64,904 | | | 64,830 |
Nissan Auto Receivables Owner Trust, Class A3, Series 2016-C, 1.18%, 01/15/21 | | | 481,480 | | | 479,804 |
Synchrony Credit Card Master Note Trust, Class A, Series 2015-1, 2.37%, 03/15/23 | | | 665,000 | | | 665,171 |
Tesla Auto Lease Trust, Class A, Series 2018-A, 2.32%, 12/20/19‡ | | | 60,011 | | | 59,988 |
Toyota Auto Receivables Owner Trust, Class A2B, Series 2017-C, 2.47%, (1-Month USD LIBOR + 0.08%), 07/15/20@ | | | 15,552 | | | 15,551 |
Toyota Auto Receivables Owner Trust, Class A3, Series 2016-D, 1.23%, 10/15/20 | | | 412,432 | | | 411,531 |
Verizon Owner Trust, Class A, Series 2016-1A, 1.42%, 01/20/21‡ | | | 135,527 | | | 135,582 |
Verizon Owner Trust, Class A, Series 2017-2A, 1.92%, 12/20/21‡ | | | 1,310,000 | | | 1,307,521 |
World Omni Auto Receivables Trust, Class A3, Series2016-A, 1.77%, 09/15/21 | | | 296,930 | | | 296,325 |
World Omni Auto Receivables Trust, Class A2, Series 2018-C, 2.80%, 01/18/22 | | | 934,674 | | | 936,529 |
Total Asset Backed Securities (Cost $10,026,020) | | | | | | 10,034,607 |
FOREIGN BONDS — 10.5% | | | | | | |
Banks — 5.4% | | | | | | |
Barclays Bank PLC, Series GMTN, 3.12%, (3-Month USD LIBOR + 0.55%), 08/07/19 (United Kingdom)@ | | | 420,000 | | | 420,114 |
Barclays Bank PLC, 5.14%, 10/14/20 (United Kingdom) | | | 395,000 | | | 406,298 |
See accompanying Notes to Financial Statements.
86
ADVISORSHARES SAGE CORE RESERVES ETF
Schedule of Investments (continued) June30, 2019 |
Investments | |
Principal | | Value |
FOREIGN BONDS (continued) |
Banks (continued) |
Credit Suisse AG, 5.40%, 01/14/20 (Switzerland) | | $ | 1,980,000 | | $ | 2,009,185 |
HSBC Holdings PLC, 3.12%, (3-Month USD LIBOR + 0.60%), 05/18/21 (United Kingdom)@ | | | 260,000 | | | 260,247 |
Sumitomo Mitsui Financial Group, Inc., 4.13%, (3-Month USD LIBOR + 1.68%), 03/09/21 (Japan)@ | | | 615,000 | | | 627,869 |
Toronto-Dominion Bank (The), 2.73%, (3-Month USD LIBOR + 0.15%), 10/24/19 (Canada)@ | | | 150,000 | | | 150,070 |
Total Banks | | | | | | 3,873,783 |
Diversified Financial Services — 1.9% |
Nomura Holdings, Inc., 6.70%, 03/04/20 (Japan) | | | 1,326,000 | | | 1,363,571 |
Oil & Gas — 1.0% | | | | | | |
Petroleos Mexicanos, 6.00%, 03/05/20 (Mexico) | | | 700,000 | | | 709,625 |
Pharmaceuticals — 1.4% | | | | | | |
Bayer US Finance II LLC, 2.98%, (3-Month USD LIBOR + 0.63%), 06/25/21 (Germany)@‡ | | | 260,000 | | | 258,341 |
Teva Pharmaceutical Finance IV LLC, 2.25%, 03/18/20 (Israel) | | | 775,000 | | | 770,156 |
Total Pharmaceuticals | | | | | | 1,028,497 |
Retail — 0.1% | | | | | | |
Alimentation Couche-Tard, Inc., 2.95%, (3-Month USD LIBOR + 0.50%), 12/13/19 (Canada)@‡ | | | 102,000 | | | 102,029 |
Semiconductors — 0.7% | | | | | | |
NXP BV/NXP Funding LLC, 4.13%, 06/15/20 (Netherlands)‡ | | | 530,000 | | | 535,888 |
Total Foreign Bonds(Cost $7,594,341) | | | | | | 7,613,393 |
Investments | | Shares/
Principal | | Value |
U.S. TREASURY NOTES — 10.1% |
U.S. Treasury Note, 1.00%, 11/15/19(a) | | $ | 3,630,000 | | $ | 3,614,828 |
U.S. Treasury Note, 1.38%, 12/15/19(a) | | | 1,015,000 | | | 1,011,828 |
U.S. Treasury Note, 1.38%, 05/31/20 | | | 2,695,000 | | | 2,679,630 |
Total U.S. Treasury Notes (Cost $7,304,540) | | | | | | 7,306,286 |
MORTGAGE BACKED SECURITIES — 2.0% |
Commercial Mortgage Backed Securities — 2.0% |
Fannie Mae Connecticut Avenue Securities, Class 1M1, Series 2017-C05, 2.95%, (1-Month USD LIBOR + 0.55%), 01/25/30@ | | | 136,480 | | | 136,438 |
Fannie Mae Connecticut Avenue Securities, Class 1M1, Series 2018-C05, 3.12%, (1-Month USD LIBOR + 0.72%), 01/25/31@ | | | 255,444 | | | 255,612 |
Freddie Mac REMICS, Class ED, Series 2010-3645, 2.50%, 12/15/20 | | | 37,305 | | | 37,181 |
Freddie Mac Structured Agency Credit Risk Debt Notes, Class M1, Series 2018-DNA1, 2.85%, (1-Month USD LIBOR + 0.45%), 07/25/30@ | | | 443,583 | | | 442,837 |
Freddie Mac Structured Agency Credit Risk Debt Notes, Class M1, Series 2018-HQA1, 3.10%, (1-Month USD LIBOR + 0.70%), 09/25/30@ | | | 556,694 | | | 557,079 |
Total Mortgage Backed Securities (Cost $1,430,595) | | | | | | 1,429,147 |
MONEY MARKET FUND — 2.0% |
JPMorgan U.S. Government Money Market Fund – Institutional Class, 2.23%(b) (Cost $1,443,094) | | | 1,443,094 | | | 1,443,094 |
See accompanying Notes to Financial Statements.
87
ADVISORSHARES SAGE CORE RESERVES ETF
Schedule of Investments (continued) June30, 2019 |
Investments | | Principal | | Value |
REPURCHASE AGREEMENTS — 6.8%(c) | |
BNP Paribas Securities Corp., dated 06/28/19, due 07/01/19, 2.49%, total to be received $1,146,594, (collateralized by various U.S. Government Agency Obligations, 0.00% – 8.75%, 07/18/19 – 09/09/49, totaling $1,164,601) | | $ | 1,146,356 | | $ | 1,146,356 | |
Citigroup Global Markets, Inc., dated 06/28/19, due 07/01/19, 2.50%, total to be received $1,146,595, (collateralized by various U.S. Government Agency Obligations, 0.00% – 9.50%, 07/02/19 – 01/20/63, totaling $1,164,925) | | | 1,146,356 | | | 1,146,356 | |
Daiwa Capital Markets America, dated 06/28/19, due 07/01/19, 2.53%, total to be received $1,146,598, (collateralized by various U.S. Government Agency Obligations, 0.00% – 6.50%, 07/05/19 – 09/09/49, totaling $1,165,381) | | | 1,146,356 | | | 1,146,356 | |
JP Morgan Securities LLC, dated 06/28/19, due 07/01/19, 2.53%, total to be received $337,292, (collateralized by various U.S. Government Agency Obligations, 0.88% – 1.75%, 07/31/19 – 06/30/22, totaling $342,020) | | | 337,221 | | | 337,221 | |
RBC Dominion Securities, Inc., dated 06/28/19, due 07/01/19, 2.51%, total to be received $1,146,596, (collateralized by various U.S. Government Agency Obligations, 0.00% – 7.00%, 07/18/19 – 09/09/49, totaling $1,165,603) | | | 1,146,356 | | | 1,146,356 | |
Total Repurchase Agreements (Cost $4,922,645) | | | | | | 4,922,645 | |
Total Investments — 105.9% (Cost $76,344,396) | | | | | | 76,497,626 | |
Liabilities in Excess of Other Assets — (5.9%) | | | | | | (4,257,498 | ) |
Net Assets — 100.0% | | | | | $ | 72,240,128 | |
See accompanying Notes to Financial Statements.
88
ADVISORSHARES SAGE CORE RESERVES ETF
Schedule of Investments (continued) June30, 2019 |
Fair Value Measurements
The following is a summary of the inputs used, as of June30, 2019, in valuing the Fund’s assets and liabilities carried at fair value. These inputs are summarized in three broad levels. Level 1 includes quoted prices in active markets for identical securities. Level 2 includes other significant observable inputs (including quoted prices for similar securities, interest rates, prepayment speeds and credit risk). Level 3 includes significant unobservable inputs (including the Fund’s own assumptions in determining the fair value of investments). The level assigned to the securities valuations may not be an indication of the risk or liquidity associated with investing in those securities.
Assets | | Level 1 | | Level 2 | | Level 3 | | Total |
Corporate Bonds | | $ | — | | $ | 43,748,454 | | $ | — | | $ | 43,748,454 |
Asset Backed Securities | | | — | | | 10,034,607 | | | — | | | 10,034,607 |
Foreign Bonds | | | — | | | 7,613,393 | | | — | | | 7,613,393 |
U.S. Treasury Notes | | | — | | | 7,306,286 | | | — | | | 7,306,286 |
Mortgage Backed Securities | | | — | | | 1,429,147 | | | — | | | 1,429,147 |
Money Market Fund | | | 1,443,094 | | | — | | | — | | | 1,443,094 |
Repurchase Agreements | | | — | | | 4,922,645 | | | — | | | 4,922,645 |
Total | | $ | 1,443,094 | | $ | 75,054,532 | | $ | — | | $ | 76,497,626 |
SUMMARY OF SCHEDULE OF INVESTMENTS |
| | |
% of
Net Assets
|
Aerospace/Defense | | 1.7 | % |
Auto Manufacturers | | 1.2 | |
Banks | | 17.6 | |
Beverages | | 0.9 | |
Building Materials | | 1.5 | |
Chemicals | | 0.5 | |
Commercial Mortgage Backed Securities | | 2.0 | |
Commercial Services | | 1.5 | |
Computers | | 4.0 | |
Diversified Financial Services | | 21.7 | |
Electric | | 1.1 | |
Food | | 3.5 | |
Healthcare – Products | | 2.6 | |
Healthcare – Services | | 2.5 | |
Home Builders | | 1.0 | |
Internet | | 0.8 | |
Media | | 0.4 | |
Oil & Gas | | 1.3 | |
Pharmaceuticals | | 3.0 | |
Pipelines | | 6.6 | |
SUMMARY OF SCHEDULE OF INVESTMENTS
(continued) |
| | | % of
Net Assets |
REITS | | 5.4 | % |
Retail | | 2.6 | |
Semiconductors | | 0.7 | |
Telecommunications | | 2.5 | |
Trucking & Leasing | | 0.4 | |
U.S. Treasury Notes | | 10.1 | |
Money Market Fund | | 2.0 | |
Repurchase Agreements | | 6.8 | |
Total Investments | | 105.9 | |
Liabilities in Excess of Other Assets | | (5.9 | )% |
Net Assets | | 100.0 | % |
See accompanying Notes to Financial Statements.
89
ADVISORSHARES STAR GLOBAL BUY-WRITE ETF
Schedule of Investments June30, 2019 |
Investments | |
Shares
| | Value |
EXCHANGE TRADED FUNDS — 88.4% | | | |
Debt Fund — 18.5% | | | | | |
First Trust Low Duration Opportunities ETF(a) | | 10,313 | | $ | 532,976 |
Invesco Senior Loan ETF(a) | | 23,622 | | | 535,274 |
iShares Core U.S. Aggregate Bond ETF(a) | | 2,482 | | | 276,371 |
iShares Interest Rate Hedged High Yield Bond ETF(a) | | 6,008 | | | 532,910 |
iShares Short-Term Corporate Bond ETF(a) | | 15,287 | | | 816,937 |
Total Debt Fund | | | | | 2,694,468 |
Equity Fund — 69.9% | | | | | |
Consumer Discretionary Select Sector SPDR Fund | | 4,436 | | | 528,771 |
Consumer Staples Select Sector SPDR Fund | | 9,004 | | | 522,862 |
Health Care Select Sector SPDR Fund | | 5,300 | | | 490,992 |
iShares MSCI EAFE ETF | | 21,146 | | | 1,389,927 |
iShares Russell 2000 ETF | | 2,769 | | | 430,580 |
SPDR S&P 500 ETF Trust | | 21,282 | | | 6,235,626 |
Technology Select Sector SPDR Fund | | 7,028 | | | 548,465 |
Total Equity Fund | | | | | 10,147,223 |
Total Exchange Traded Funds
(Cost $10,739,123) | | | | | 12,841,691 |
MONEY MARKET FUND — 11.8% | | | |
BlackRock Liquidity Funds T-Fund Portfolio, Institutional Class, 2.26%(b) (Cost $1,715,728) | | 1,715,728 | | | 1,715,728 |
Investments | | | Notional
Amount | | | Contracts | | Value |
PURCHASED PUT OPTION — 0.1% | | | | | |
SPDR S&P 500 ETF Trust, Option expiring 12/20/19, Strike Price $230.00
(Cost $29,686) | | $ | 3,059,000 | | | 133 | | | $ | 17,223 | |
Total Investments Before Written Options — 100.3%
(Cost $12,484,537) | | | | 14,574,642 | |
WRITTEN CALL OPTIONS — (0.0)%** | | | | | |
iShares MSCI EAFE ETF, expiring 07/19/19, Strike Price $67.00 | | | (710,200 | ) | | (106 | ) | | | (1,378 | ) |
SPDR S&P 500 ETF Trust, expiring 07/19/19, Strike Price $303.00 | | | (4,181,400 | ) | | (138 | ) | | | (7,659 | ) |
Total Written Options | | | | | | | | |
[Premiums Received $(15,255)] | | | | | | | (9,037 | ) |
Total Investments — 100.3% (Cost $12,469,282) | | | | | | | 14,565,605 | |
Liabilities in Excess of Other Assets — (0.3%) | | | | | | | (38,563 | ) |
Net Assets — 100.0% | | | | | | $ | 14,527,042 | |
See accompanying Notes to Financial Statements.
90
ADVISORSHARES STAR GLOBAL BUY-WRITE ETF
Schedule of Investments (continued) June30, 2019 |
Fair Value Measurements
The following is a summary of the inputs used, as of June30, 2019, in valuing the Fund’s assets and liabilities carried at fair value. These inputs are summarized in three broad levels. Level 1 includes quoted prices in active markets for identical securities. Level 2 includes other significant observable inputs (including quoted prices for similar securities, interest rates, prepayment speeds and credit risk). Level 3 includes significant unobservable inputs (including the Fund’s own assumptions in determining the fair value of investments). The level assigned to the securities valuations may not be an indication of the risk or liquidity associated with investing in those securities.
Assets | | Level 1 | | Level 2 | | Level 3 | | Total |
Exchange Traded Funds | | $ | 12,841,691 | | $ | — | | $ | — | | $ | 12,841,691 |
Purchased Put Option | | | 17,223 | | | — | | | — | | | 17,223 |
Money Market Fund | | | 1,715,728 | | | — | | | — | | | 1,715,728 |
Total | | $ | 14,574,642 | | $ | — | | $ | — | | $ | 14,574,642 |
Liabilities | | Level 1 | | Level 2 | | Level 3 | | Total |
Written Call Options | | $ | (9,037 | ) | | $ | — | | $ | — | | $ | (9,037 | ) |
Total | | $ | (9,037 | ) | | $ | — | | $ | — | | $ | (9,037 | ) |
SUMMARY OF SCHEDULE OF INVESTMENTS
| | % of
Net Assets |
Debt Fund | | 18.5 | % |
Equity Fund | | 69.9 | |
Purchased Put Option | | 0.1 | |
Written Call Options | | (0.0 | )** |
Money Market Fund | | 11.8 | |
Total Investments | | 100.3 | |
Liabilities in Excess of Other Assets | | (0.3 | ) |
Net Assets | | 100.0 | % |
See accompanying Notes to Financial Statements.
91
ADVISORSHARES VICE ETF
Schedule of Investments June30, 2019 |
Investments | |
Shares | | Value |
COMMON STOCKS — 99.8% | | | | | |
Agriculture — 25.0% | | | | | |
Altria Group, Inc. | | 9,638 | | $ | 456,359 |
British American Tobacco PLC (United Kingdom)(a) | | 11,106 | | | 387,266 |
Imperial Brands PLC (United Kingdom)(a) | | 23,288 | | | 547,967 |
Philip Morris International, Inc. | | 6,386 | | | 501,493 |
Turning Point Brands, Inc.(b) | | 15,069 | | | 738,080 |
Universal Corp. | | 6,458 | | | 392,453 |
Vector Group Ltd.(b) | | 27,970 | | | 272,707 |
Total Agriculture | | | | | 3,296,325 |
Apparel — 3.8% | | | | | |
LVMH Moet Hennessy Louis Vuitton SE (France)(a) | | 5,884 | | | 500,787 |
Beverages — 31.2% | | | | | |
Ambev SA (Brazil)(a) | | 18,323 | | | 85,568 |
Anheuser-Busch InBev SA/NV (Belgium)(a) | | 2,312 | | | 204,635 |
Boston Beer Co., Inc. (The), Class A*(b) | | 2,171 | | | 820,117 |
Brown-Forman Corp., Class B(b) | | 7,479 | | | 414,561 |
Cia Cervecerias Unidas SA (Chile)(a) | | 16,822 | | | 475,222 |
Constellation Brands, Inc., Class A | | 1,396 | | | 274,928 |
Craft Brew Alliance, Inc.* | | 13,676 | | | 191,327 |
Diageo PLC (United Kingdom)(a)(b) | | 2,787 | | | 480,256 |
MGP Ingredients, Inc.(b) | | 6,184 | | | 410,061 |
Molson Coors Brewing Co., Class B | | 3,541 | | | 198,296 |
New Age Beverages Corp.*(b) | | 84,094 | | | 391,878 |
Pernod Ricard SA (France)(a) | | 4,375 | | | 161,525 |
Total Beverages | | | | | 4,108,374 |
Entertainment — 3.6% | | | | | |
RCI Hospitality Holdings, Inc. | | 27,416 | | | 480,054 |
Healthcare – Products — 11.1% |
Abbott Laboratories | | 8,419 | | | 708,038 |
Thermo Fisher Scientific, Inc. | | 2,577 | | | 756,813 |
Total Healthcare – Products | | | | | 1,464,851 |
Healthcare – Services — 3.3% | | | | | |
Catalent, Inc.* | | 7,902 | | | 428,368 |
Housewares — 1.1% | | | | | |
Scotts Miracle-Gro Co. (The)(b) | | 1,402 | | | 138,097 |
Investments | | Shares/
Principal | | Value |
COMMON STOCKS (continued) |
Pharmaceuticals — 9.5% | | | | | | |
AbbVie, Inc. | | | 9,717 | | $ | 706,620 |
Novartis AG (Switzerland)(a) | | | 6,034 | | | 550,965 |
Total Pharmaceuticals | | | | | | 1,257,585 |
Retail — 11.2% | | | | | | |
BJ’s Restaurants, Inc.(b) | | | 6,753 | | | 296,727 |
Darden Restaurants, Inc. | | | 5,880 | | | 715,772 |
Dave & Buster’s Entertainment, Inc. | | | 11,487 | | | 464,879 |
Total Retail | | | | | | 1,477,378 |
Total Common Stocks
(Cost $12,830,770) | | | | | | 13,151,819 |
MONEY MARKET FUND — 0.2% | | | |
BlackRock Liquidity Funds Treasury Trust Fund Portfolio, Institutional Class, 2.29%(c)
(Cost $28,317) | | | 28,317 | | | 28,317 |
REPURCHASE AGREEMENTS — 6.1%(d) | | | |
BofA Securities, Inc., dated 06/28/19, due 07/01/19, 2.50%, total to be received $249,052, (collateralized by various U.S. Government Agency Obligations,
3.30% – 4.50%,
06/01/46 – 07/01/49, totaling $253,275) | | $ | 249,000 | | | 249,000 |
Daiwa Capital Markets America, dated 06/28/19, due 07/01/19, 2.53%, total to be received $249,053, (collateralized by various U.S. Government Agency Obligations,
0.00% – 6.50%,
07/05/19 – 09/09/49, totaling $253,133) | | | 249,000 | | | 249,000 |
Nomura Securities International, Inc., dated 06/28/19, due 07/01/19, 2.48%, total to be received $48,754, (collateralized by various U.S. Government Agency Obligations, 0.00% – 3.38%, 07/18/19 – 09/09/49, totaling $49,671) | | | 48,744 | | | 48,744 |
See accompanying Notes to Financial Statements.
92
ADVISORSHARES VICE ETF
Schedule of Investments (continued) June30, 2019 |
Investments | | Principal | | Value |
REPURCHASE AGREEMENTS (continued) | | | | |
RBC Dominion Securities, Inc., dated 06/28/19, due 07/01/19, 2.51%, total to be received $249,052, (collateralized by various U.S. Government Agency Obligations, 0.00%-7.00%, 07/18/19-09/09/49, totaling $253,180) | | $ | 249,000 | | $ | 249,000 | |
Total Repurchase Agreements
(Cost $795,744) | | | 795,744 | |
Total Investments — 106.1%
(Cost $13,654,831) | | | | | | 13,975,880 | |
Liabilities in Excess of Other Assets — (6.1%) | | | | | | (792,909 | ) |
Net Assets — 100.0% | | | | | $ | 13,182,971 | |
Fair Value Measurements
The following is a summary of the inputs used, as of June30, 2019, in valuing the Fund’s assets and liabilities carried at fair value. These inputs are summarized in three broad levels. Level 1 includes quoted prices in active markets for identical securities. Level 2 includes other significant observable inputs (including quoted prices for similar securities, interest rates, prepayment speeds and credit risk). Level 3 includes significant unobservable inputs (including the Fund’s own assumptions in determining the fair value of investments). The level assigned to the securities valuations may not be an indication of the risk or liquidity associated with investing in those securities.
Assets | | Level 1 | | Level 2 | | Level 3 | | Total |
Common Stocks | | $ | 13,151,819 | | $ | — | | $ | — | | $ | 13,151,819 |
Money Market Fund | | | 28,317 | | | — | | | — | | | 28,317 |
Repurchase Agreements | | | — | | | 795,744 | | | — | | | 795,744 |
Total | | $ | 13,180,136 | | $ | 795,744 | | $ | — | | $ | 13,975,880 |
See accompanying Notes to Financial Statements.
93
ADVISORSHARES VICE ETF
Schedule of Investments (continued) June30, 2019 |
SUMMARY OF SCHEDULE OF INVESTMENTS |
| | | % of
Net Assets |
Agriculture | | 25.0 | % |
Apparel | | 3.8 | |
Beverages | | 31.2 | |
Entertainment | | 3.6 | |
Healthcare – Products | | 11.1 | |
Healthcare – Services | | 3.3 | |
Housewares | | 1.1 | |
Pharmaceuticals | | 9.5 | |
Retail | | 11.2 | |
Money Market Fund | | 0.2 | |
Repurchase Agreements | | 6.1 | |
Total Investments | | 106.1 | |
Liabilities in Excess of Other Assets | | (6.1 | ) |
Net Assets | | 100.0 | % |
See accompanying Notes to Financial Statements.
94
ADVISORSHARES TRUST
Statements of Assets and Liabilities June30, 2019 |
| | AdvisorShares
Cornerstone
Small Cap ETF | | AdvisorShares
Dorsey Wright
ADR ETF | | AdvisorShares
Dorsey Wright
Micro-Cap ETF |
ASSETS | | | | | | | | | | | | |
Investments, at Cost | | $ | 4,496,797 | | | $ | 94,048,016 | | | $ | 2,024,249 | |
Investments in Affiliates, at Cost (Note 8) | | | — | | | | — | | | | — | |
Repurchase Agreements, at Cost (Note 2) | | | 206,727 | | | | 6,386,108 | | | | 167,508 | |
Total Cost of Investments | | | 4,703,524 | | | | 100,434,124 | | | | 2,191,757 | |
Investments, at Market Value (including securities on loan) (Note 2)(a) | | | 5,000,316 | | | | 108,067,277 | | | | 2,336,085 | |
Investments in Affiliates, at Market Value (Note 8) | | | — | | | | — | | | | — | |
Repurchase Agreements, at Market Value (Note 2) | | | 206,727 | | | | 6,386,108 | | | | 167,508 | |
Total Market Value of Investments | | | 5,207,043 | | | | 114,453,385 | | | | 2,503,593 | |
Cash | | | — | | | | — | | | | — | |
Cash collateral held at brokers | | | — | | | | — | | | | — | |
Dividends and Interest Receivable | | | 6,409 | | | | 291,343 | | | | 2,220 | |
Receivable from Securities Sold | | | — | | | | — | | | | — | |
Reclaim Receivable | | | — | | | | 21,186 | | | | — | |
Due from Investment Advisor | | | 9,117 | | | | — | | | | 309 | |
Prepaid CCO Fees | | | — | | | | — | | | | — | |
Prepaid Expenses | | | 375 | | | | 1,546 | | | | 48 | |
Total Assets | | | 5,222,944 | | | | 114,767,460 | | | | 2,506,170 | |
LIABILITIES | | | | | | | | | | | | |
Cash collateral for securities on loan(b) | | | 206,727 | | | | 6,386,108 | | | | 167,508 | |
Advisory Fees Payable | | | — | | | | 60,307 | | | | — | |
Trustee Fees Payable | | | — | | | | 778 | | | | — | |
Securities Sold, Not Yet Purchased(c) | | | — | | | | — | | | | — | |
Payable for Securities Purchased | | | — | | | | — | | | | — | |
Capital Shares Payable | | | — | | | | — | | | | — | |
CCO Fees Payable | | | 86 | | | | 1,289 | | | | 15 | |
Due to Custodian | | | 625 | | | | 625 | | | | 625 | |
Dividend Payable on Securities Sold, Not Yet Purchased | | | — | | | | — | | | | — | |
Accrued Expenses | | | 60,518 | | | | 120,278 | | | | 34,424 | |
Total Liabilities | | | 267,956 | | | | 6,569,385 | | | | 202,572 | |
NET ASSETS | | $ | 4,954,988 | | | $ | 108,198,075 | | | $ | 2,303,598 | |
COMPONENTS OF NET ASSETS | | | | | | | | | | | | |
Capital Stock at Zero Par Value | | $ | 5,087,654 | | | $ | 143,045,740 | | | $ | 2,653,818 | |
Total Distributable Earnings/Accumulated (Loss) | | | (132,666 | ) | | | (34,847,665 | ) | | | (350,220 | ) |
NET ASSETS | | $ | 4,954,988 | | | $ | 108,198,075 | | | $ | 2,303,598 | |
SHARES ISSUED AND OUTSTANDING | | | | | | | | | | | | |
Shares Outstanding (Unlimited Shares Authorized) | | | 136,476 | | | | 2,175,000 | | | | 100,000 | |
Net Asset Value (NAV) Per Share | | $ | 36.31 | | | $ | 49.75 | | | $ | 23.04 | |
(a) Market value of securities on loan | | $ | 1,164,113 | | | $ | 17,229,413 | | | $ | 509,529 | |
(b) Non-cash collateral for securities on loan | | $ | 983,338 | | | $ | 11,346,317 | | | $ | 354,339 | |
(c) Proceeds Received from Securities Sold, Not Yet Purchased | | $ | — | | | $ | — | | | $ | — | |
See accompanying Notes to Financial Statements.
95
ADVISORSHARES TRUST
Statements of Assets and Liabilities June30, 2019 |
AdvisorShares
Dorsey Wright
Short ETF | | AdvisorShares
DoubleLine Value
Equity ETF(1) | | AdvisorShares
Focused
Equity ETF | | AdvisorShares
FolioBeyond Smart
Core Bond ETF(2) | | AdvisorShares
New Tech and
Media ETF |
| | | | | | | | | | | | | | | | | |
$ | 12,769,870 | | | $ | 57,913,955 | | | $ | 13,347,390 | | $ | 5,707,619 | | | $ | 12,058,053 | |
| 2,485,250 | | | | — | | | | — | | | — | | | | 1,709,786 | |
| — | | | | 139,577 | | | | — | | | 633,822 | | | | 3,246,021 | |
| 15,255,120 | | | | 58,053,532 | | | | 13,347,390 | | | 6,341,441 | | | | 17,013,860 | |
| 12,769,870 | | | | 61,381,662 | | | | 17,258,396 | | | 5,807,737 | | | | 12,317,839 | |
| 2,490,250 | | | | — | | | | — | | | — | | | | 1,752,192 | |
| — | | | | 139,577 | | | | — | | | 633,822 | | | | 3,246,021 | |
| 15,260,120 | | | | 61,521,239 | | | | 17,258,396 | | | 6,441,559 | | | | 17,316,052 | |
| 10,099,375 | | | | — | | | | — | | | — | | | | 576,472 | |
| 23,958,082 | | | | — | | | | — | | | — | | | | — | |
| 53,821 | | | | 58,415 | | | | 8,139 | | | 1,788 | | | | 3,548 | |
| — | | | | — | | | | — | | | — | | | | 738,159 | |
| — | | | | — | | | | — | | | — | | | | 3,349 | |
| — | | | | — | | | | 4,917 | | | 19,272 | | | | 28,597 | |
| — | | | | — | | | | — | | | 61 | | | | — | |
| 7 | | | | 30,815 | | | | 105 | | | 363 | | | | 359 | |
| 49,371,405 | | | | 61,610,469 | | | | 17,271,557 | | | 6,463,043 | | | | 18,666,536 | |
| | | | | | | | | | | | | | | | | |
| — | | | | 139,577 | | | | — | | | 633,822 | | | | 3,246,021 | |
| 11,196 | | | | 10,711 | | | | — | | | — | | | | — | |
| — | | | | 477 | | | | 13 | | | — | | | | — | |
| 25,019,947 | | | | — | | | | — | | | — | | | | — | |
| — | | | | — | | | | — | | | — | | | | 577,097 | |
| — | | | | — | | | | — | | | — | | | | 321,249 | |
| 46 | | | | 526 | | | | 185 | | | — | | | | 280 | |
| — | | | | 625 | | | | 1,250 | | | 625 | | | | — | |
| 24,712 | | | | — | | | | — | | | — | | | | — | |
| 34,986 | | | | 72,822 | | | | 59,083 | | | 43,929 | | | | 65,604 | |
| 25,090,887 | | | | 224,738 | | | | 60,531 | | | 678,376 | | | | 4,210,251 | |
$ | 24,280,518 | | | $ | 61,385,731 | | | $ | 17,211,026 | | $ | 5,784,667 | | | $ | 14,456,285 | |
| | | | | | | | | | | | | | | | | |
$ | 25,307,447 | | | $ | 88,996,951 | | | $ | 13,887,670 | | $ | 6,788,243 | | | $ | 30,370,607 | |
| (1,026,929 | ) | | | (27,611,220 | ) | | | 3,323,356 | | | (1,003,576 | ) | | | (15,914,322 | ) |
$ | 24,280,518 | | | $ | 61,385,731 | | | $ | 17,211,026 | | $ | 5,784,667 | | | $ | 14,456,285 | |
| | | | | | | | | | | | | | | | | |
| 975,000 | | | | 900,000 | | | | 500,000 | | | 225,000 | | | | 1,125,000 | |
$ | 24.90 | | | $ | 68.21 | | | $ | 34.42 | | $ | 25.71 | | | $ | 12.85 | |
$ | — | | | $ | 5,266,581 | | | $ | 1,223,688 | | $ | 1,138,218 | | | $ | 5,459,691 | |
$ | — | | | $ | 5,234,788 | | | $ | 1,253,085 | | $ | 531,104 | | | $ | 2,352,477 | |
$ | 26,218,268 | | | $ | — | | | $ | — | | $ | — | | | $ | — | |
See accompanying Notes to Financial Statements.
96
ADVISORSHARES TRUST
Statements of Assets and Liabilities June30, 2019 |
| | AdvisorShares
Newfleet Multi-
Sector Income ETF | | AdvisorShares
Pacific Asset
Enhanced
Floating Rate ETF | | AdvisorShares
Pure Cannabis ETF |
ASSETS | | | | | | | | | | | | |
Investments, at Cost | | $ | 74,038,911 | | | $ | 30,622,671 | | | $ | 60,748,475 | |
Investments in Affiliates, at Cost (Note 8) | | | — | | | | — | | | | — | |
Repurchase Agreements, at Cost (Note 2) | | | 323,645 | | | | 262,080 | | | | 25,079,106 | |
Total Cost of Investments | | | 74,362,556 | | | | 30,884,751 | | | | 85,827,581 | |
Investments, at Market Value (including securities on loan) (Note 2)(a) | | | 74,786,450 | | | | 30,449,988 | | | | 56,524,352 | |
Investments in Affiliates, at Market Value (Note 8) | | | — | | | | — | | | | — | |
Repurchase Agreements, at Market Value (Note 2) | | | 323,645 | | | | 262,080 | | | | 25,079,106 | |
Total Market Value of Investments | | | 75,110,095 | | | | 30,712,068 | | | | 81,603,458 | |
Cash | | | 71,936 | | | | 19,307 | | | | — | |
Cash collateral held at brokers | | | — | | | | — | | | | 3,220,000 | |
Foreign Currency(e) | | | — | | | | — | | | | 152,550 | |
Unrealized Appreciation on Swaps Contracts | | | — | | | | — | | | | 59,722 | |
Dividends and Interest Receivable | | | 262,168 | | | | 88,814 | | | | 190,347 | |
Receivable from Securities Sold | | | 411,151 | | | | — | | | | — | |
Capital Shares Receivable | | | — | | | | — | | | | 292,235 | |
Reclaim Receivable | | | — | | | | — | | | | — | |
Due from Investment Advisor | | | — | | | | — | | | | — | |
Prepaid CCO Fees | | | 1,158 | | | | — | | | | 110 | |
Prepaid Expenses | | | 1,172 | | | | 504 | | | | 60,394 | |
Total Assets | | | 75,857,680 | | | | 30,820,693 | | | | 85,578,816 | |
LIABILITIES | | | | | | | | | | | | |
Unrealized Depreciation on Swaps Contracts | | | — | | | | — | | | | 263,210 | |
Cash collateral for securities on loan(b) | | | 323,645 | | | | 262,080 | | | | 25,079,106 | |
Advisory Fees Payable | | | 30,027 | | | | 1,499 | | | | 1,413 | |
Trustee Fees Payable | | | 35 | | | | — | | | | — | |
Securities Sold, Not Yet Purchased(c) | | | — | | | | — | | | | — | |
Payable for Securities Purchased | | | 306,400 | | | | 1,248,400 | | | | 445,399 | |
Options Written, at value(d) | | | — | | | | — | | | | — | |
CCO Fees Payable | | | — | | | | 191 | | | | — | |
Due to Custodian | | | — | | | | — | | | | 1,250 | |
Due to Broker | | | — | | | | — | | | | — | |
Dividend Payable on Securities Sold, Not Yet Purchased | | | — | | | | — | | | | — | |
Accrued Expenses | | | 117,763 | | | | 68,395 | | | | 26,444 | |
Total Liabilities | | | 777,870 | | | | 1,580,565 | | | | 25,816,822 | |
NET ASSETS | | $ | 75,079,810 | | | $ | 29,240,128 | | | $ | 59,761,994 | |
COMPONENTS OF NET ASSETS | | | | | | | | | | | | |
Capital Stock at Zero Par Value | | $ | 82,245,742 | | | $ | 29,958,384 | | | $ | 65,110,917 | |
Total Distributable Earnings/Accumulated (Loss) | | | (7,165,932 | ) | | | (718,256 | ) | | | (5,348,923 | ) |
NET ASSETS | | $ | 75,079,810 | | | $ | 29,240,128 | | | $ | 59,761,994 | |
SHARES ISSUED AND OUTSTANDING | | | | | | | | | | | | |
Shares Outstanding (Unlimited Shares Authorized) | | | 1,550,000 | | | | 600,000 | | | | 2,600,000 | |
Net Asset Value (NAV) Per Share | | $ | 48.44 | | | $ | 48.73 | | | $ | 22.99 | |
(a) Market value of securities on loan | | $ | 316,882 | | | $ | 255,235 | | | $ | 25,631,395 | |
(b) Non-cash collateral for securities on loan | | $ | — | | | $ | — | | | $ | 1,457,478 | |
(c) Proceeds Received from Securities Sold, Not Yet Purchased | | $ | — | | | $ | — | | | $ | — | |
(d) Premiums received for options written | | $ | — | | | $ | — | | | $ | — | |
(e) Foreign currency at cost | | $ | — | | | $ | — | | | $ | 152,555 | |
See accompanying Notes to Financial Statements.
97
ADVISORSHARES TRUST
Statements of Assets and Liabilities June30, 2019 |
AdvisorShares
Ranger Equity
Bear ETF
| | AdvisorShares
Sabretooth ETF | | AdvisorShares
Sage Core
Reserves ETF | | AdvisorShares
STAR Global
Buy-Write ETF | | AdvisorShares
Vice ETF |
| | | | | | | | | | | | | | | | |
$ | 62,945,357 | | | $ | 2,585,291 | | $ | 71,421,751 | | | $ | 12,484,537 | | $ | 12,859,087 | |
| 54,688,500 | | | | — | | | — | | | | — | | | — | |
| — | | | | 65 | | | 4,922,645 | | | | — | | | 795,744 | |
| 117,633,857 | | | | 2,585,356 | | | 76,344,396 | | | | 12,484,537 | | | 13,654,831 | |
| 62,945,357 | | | | 2,652,399 | | | 71,574,981 | | | | 14,574,642 | | | 13,180,136 | |
| 54,785,500 | | | | — | | | — | | | | — | | | — | |
| — | | | | 65 | | | 4,922,645 | | | | — | | | 795,744 | |
| 117,730,857 | | | | 2,652,464 | | | 76,497,626 | | | | 14,574,642 | | | 13,975,880 | |
| 11,999,375 | | | | 31,474 | | | — | | | | 2,922 | | | — | |
| 139,766,302 | | | | — | | | 222,369 | | | | — | | | — | |
| — | | | | — | | | — | | | | — | | | — | |
| — | | | | — | | | — | | | | — | | | — | |
| 352,231 | | | | 54 | | | 508,712 | | | | 35,218 | | | 40,428 | |
| 7,007,289 | | | | — | | | — | | | | — | | | — | |
| — | | | | — | | | — | | | | — | | | — | |
| — | | | | — | | | — | | | | — | | | 2,817 | |
| — | | | | 9,900 | | | 6,767 | | | | — | | | 10,262 | |
| 1,554 | | | | — | | | 784 | | | | — | | | 123 | |
| 1,395 | | | | 39,273 | | | 403 | | | | 128 | | | 311 | |
| 276,859,003 | | | | 2,733,165 | | | 77,236,661 | | | | 14,612,910 | | | 14,029,821 | |
| | | | | | | | | | | | | | | | |
| — | | | | — | | | — | | | | — | | | — | |
| — | | | | 65 | | | 4,922,645 | | | | — | | | 795,744 | |
| 182,465 | | | | — | | | — | | | | 5,959 | | | — | |
| — | | | | — | | | 498 | | | | 69 | | | — | |
| 134,356,315 | | | | — | | | — | | | | — | | | — | |
| 6,319,647 | | | | — | | | — | | | | — | | | — | |
| — | | | | — | | | — | | | | 9,037 | | | — | |
| — | | | | 253 | | | — | | | | 430 | | | — | |
| — | | | | — | | | 625 | | | | — | | | 1,250 | |
| — | | | | — | | | — | | | | 6,436 | | | — | |
| 92,170 | | | | — | | | — | | | | — | | | — | |
| 94,127 | | | | 34,456 | | | 72,765 | | | | 63,937 | | | 49,856 | |
| 141,044,724 | | | | 34,774 | | | 4,996,533 | | | | 85,868 | | | 846,850 | |
$ | 135,814,279 | | | $ | 2,698,391 | | $ | 72,240,128 | | | $ | 14,527,042 | | $ | 13,182,971 | |
| | | | | | | | | | | | | | | | |
$ | 393,911,769 | | | $ | 2,683,303 | | $ | 72,303,847 | | | $ | 13,306,976 | | $ | 13,486,906 | |
| (258,097,490 | ) | | | 15,088 | | | (63,719 | ) | | | 1,220,066 | | | (303,935 | ) |
$ | 135,814,279 | | | $ | 2,698,391 | | $ | 72,240,128 | | | $ | 14,527,042 | | $ | 13,182,971 | |
| | | | | | | | | | | | | | | | |
| 21,275,000 | | | | 100,000 | | | 725,000 | | | | 450,000 | | | 525,000 | |
$ | 6.38 | | | $ | 26.98 | | $ | 99.64 | | | $ | 32.28 | | $ | 25.11 | |
$ | — | | | $ | 287,268 | | $ | 4,820,878 | | | $ | — | | $ | 3,204,776 | |
$ | — | | | $ | 293,421 | | $ | — | | | $ | — | | $ | 2,491,709 | |
$ | 132,043,521 | | | $ | — | | $ | — | | | $ | — | | $ | — | |
$ | — | | | $ | — | | $ | — | | | $ | 15,255 | | $ | — | |
$ | — | | | $ | — | | $ | — | | | $ | — | | $ | — | |
See accompanying Notes to Financial Statements.
98
ADVISORSHARES TRUST
Statements of Operations Year Ended June30, 2019 |
| | AdvisorShares
Cornerstone
Small Cap ETF | | AdvisorShares
Dorsey Wright
ADR ETF | | AdvisorShares
Dorsey Wright
Micro-Cap ETF(1) |
INVESTMENT INCOME: | | | | | | | | | | | | |
Dividend Income | | $ | 49,008 | | | $ | 2,040,519 | | | $ | 16,820 | |
Dividend Income from Affiliates | | | — | | | | — | | | | — | |
Interest Income | | | — | | | | — | | | | — | |
Securities lending income (net) (Note 2) | | | 3,234 | | | | 103,358 | | | | 3,152 | |
Foreign withholding tax | | | (147 | ) | | | (212,083 | ) | | | (84 | ) |
Total Investment Income | | | 52,095 | | | | 1,931,794 | | | | 19,888 | |
| | | | | | | | | | | | | |
EXPENSES: | | | | | | | | | | | | |
Advisory Fees | | | 32,560 | | | | 1,073,783 | | | | 17,006 | |
Accounting & Administration Fees | | | 82,603 | | | | 130,378 | | | | 15,219 | |
Professional Fees | | | 20,343 | | | | 98,801 | | | | 50,397 | |
Exchange Listing Fees | | | 11,090 | | | | 11,676 | | | | 7,501 | |
Custody Fees | | | 5,733 | | | | 12,566 | | | | 3,822 | |
Report to Shareholders | | | 1,400 | | | | 108,371 | | | | 3,400 | |
Trustee Fees | | | 5,024 | | | | 9,288 | | | | 4,945 | |
CCO Fees | | | 1,085 | | | | 20,669 | | | | 399 | |
Pricing Fees | | | 7,537 | | | | 8,517 | | | | 4,000 | |
Transfer Agent Fees | | | 376 | | | | 11,389 | | | | 170 | |
Insurance Fees | | | 350 | | | | 15,502 | | | | 977 | |
Dividend Expense | | | — | | | | — | | | | — | |
Licensing Fees | | | — | | | | 17,877 | | | | — | |
Miscellaneous Fees | | | 1,558 | | | | 13,402 | | | | 847 | |
Total Expenses | | | 169,659 | | | | 1,532,219 | | | | 108,683 | |
| | | | | | | | | | | | | |
Advisory Fees Waived/Recoupment | | | (32,560 | ) | | | (272,311 | ) | | | (17,006 | ) |
Expense Reimbursement | | | (92,016 | ) | | | — | | | | (69,228 | ) |
Net Expenses | | | 45,083 | | | | 1,259,908 | | | | 22,449 | |
Net Investment Income (Loss) | | | 7,012 | | | | 671,886 | | | | (2,561 | ) |
| | | | | | | | | | | | | |
REALIZED AND UNREALIZED GAIN (LOSS) ON: | | | | | | | | | | | | |
Net Realized Gain (Loss) on: | | | | | | | | | | | | |
Investments | | | (344,300 | ) | | | (33,545,476 | ) | | | (662,587 | ) |
Investments in Affiliates | | | — | | | | — | | | | — | |
In-Kind Redemptions | | | 588,105 | | | | 4,393,069 | | | | 11,356 | |
In-Kind Redemptions in Affiliates | | | — | | | | — | | | | — | |
Short Sales | | | — | | | | — | | | | — | |
Net Change in Unrealized Appreciation (Depreciation) on: | | | | | | | | | | | | |
Investments | | | (476,176 | ) | | | 7,499,640 | | | | 311,836 | |
Investments in Affiliates | | | — | | | | — | | | | — | |
Short Sales | | | — | | | | — | | | | — | |
Net Realized and Unrealized Gain (Loss) | | | (232,371 | ) | | | (21,652,767 | ) | | | (339,395 | ) |
NET INCREASE (DECREASE) IN NET ASSETS RESULTING FROM OPERATIONS | | $ | (225,359 | ) | | $ | (20,980,881 | ) | | $ | (341,956 | ) |
See accompanying Notes to Financial Statements.
99
ADVISORSHARES TRUST
Statements of Operations Year Ended June30, 2019 |
AdvisorShares
Dorsey Wright
Short ETF(1) | | AdvisorShares
DoubleLine Value
Equity ETF(2) | | AdvisorShares
Focused
Equity ETF | | AdvisorShares
FolioBeyond Smart
Core Bond ETF(3) | | AdvisorShares
New Tech and
Media ETF |
| | | | | | | | | | | | | | | | | | |
$ | 116,264 | | | $ | 1,397,567 | | | $ | 182,891 | | | $ | 704,390 | | | $ | 102,581 | |
| 44,294 | | | | — | | | | — | | | | — | | | | — | |
| 238,816 | | | | — | | | | — | | | | — | | | | — | |
| — | | | | 2,428 | | | | 1,165 | | | | 79,718 | | | | 11,755 | |
| — | | | | (30,174 | ) | | | — | | | | — | | | | — | |
| 399,374 | | | | 1,369,821 | | | | 184,056 | | | | 784,108 | | | | 114,336 | |
| | | | | | | | | | | | | | | | | | |
| | | | | | | | | | | | | | | | | | |
| 92,884 | | | | 577,325 | | | | 109,894 | | | | 77,069 | | | | 164,986 | |
| 14,823 | | | | 87,773 | | | | 75,322 | | | | 63,946 | | | | 56,349 | |
| 53,482 | | | | 84,231 | | | | 24,454 | | | | 41,916 | | | | 33,623 | |
| 8,618 | | | | 14,165 | | | | 11,819 | | | | 11,370 | | | | 12,203 | |
| 1,272 | | | | 6,708 | | | | 1,620 | | | | 1,254 | | | | 7,988 | |
| 6,000 | | | | 55,223 | | | | 7,168 | | | | 10,762 | | | | 26,969 | |
| 5,143 | | | | 7,138 | | | | 5,266 | | | | 5,041 | | | | 5,511 | |
| 1,799 | | | | 11,090 | | | | 2,560 | | | | 2,449 | | | | 4,362 | |
| 4,000 | | | | 8,778 | | | | 5,241 | | | | 10,472 | | | | 10,101 | |
| 929 | | | | 8,173 | | | | 1,138 | | | | 1,406 | | | | 2,062 | |
| 897 | | | | 6,775 | | | | 948 | | | | 1,247 | | | | 2,518 | |
| 211,479 | | | | — | | | | — | | | | — | | | | — | |
| — | | | | — | | | | — | | | | — | | | | — | |
| 2,953 | | | | 7,978 | | | | 1,190 | | | | 2,291 | | | | 4,400 | |
| 404,279 | | | | 875,357 | | | | 246,620 | | | | 229,223 | | | | 331,072 | |
| | | | | | | | | | | | | | | | | | |
| (70,194 | ) | | | (200,619 | ) | | | (109,894 | ) | | | (77,069 | ) | | | (97,343 | ) |
| — | | | | — | | | | (26,844 | ) | | | (5,724 | ) | | | — | |
| 334,085 | | | | 674,738 | | | | 109,882 | | | | 146,430 | | | | 233,729 | |
| 65,289 | | | | 695,083 | | | | 74,174 | | | | 637,678 | | | | (119,393 | ) |
| | | | | | | | | | | | | | | | | | |
| | | | | | | | | | | | | | | | | | |
| | | | | | | | | | | | | | | | | | |
| — | | | | (6,166,498 | ) | | | (614,208 | ) | | | (142,457 | ) | | | (11,910,658 | ) |
| — | | | | — | | | | — | | | | — | | | | (18,917 | ) |
| — | | | | 873,063 | | | | — | | | | 15,102 | | | | 1,796,570 | |
| — | | | | — | | | | — | | | | — | | | | 12,754 | |
| (2,276,599 | ) | | | — | | | | — | | | | — | | | | — | |
| | | | | | | | | | | | | | | | | | |
| — | | | | 4,571,285 | | | | 2,250,694 | | | | 187,184 | | | | (1,546,500 | ) |
| 5,000 | | | | — | | | | — | | | | — | | | | 42,406 | |
| 1,198,321 | | | | — | | | | — | | | | — | | | | — | |
| (1,073,278 | ) | | | (722,150 | ) | | | 1,636,486 | | | | 59,829 | | | | (11,624,345 | ) |
$ |
(1,007,989
| ) | | $ |
(27,067
| ) | | $ |
1,710,660
| | | $ |
697,507
| | | $ |
(11,743,738
| ) |
See accompanying Notes to Financial Statements.
100
ADVISORSHARES TRUST
Statements of Operations Year Ended June30, 2019 |
| | AdvisorShares
Newfleet Multi-
Sector Income ETF | | AdvisorShares
Pacific Asset
Enhanced
Floating Rate ETF | | AdvisorShares
Pure Cannabis ETF(1) |
INVESTMENT INCOME: | | | | | | | | | | | | |
Dividend Income | | $ | 70,561 | | | $ | 63,664 | | | $ | 23,019 | |
Dividend Income from Affiliates | | | — | | | | — | | | | — | |
Interest Income | | | 4,090,245 | | | | 1,516,276 | | | | — | |
Securities lending income (net) (Note 2) | | | 3,058 | | | | 2,002 | | | | 167,709 | |
Foreign withholding tax | | | — | | | | — | | | | — | |
Total Investment Income | | | 4,163,864 | | | | 1,581,942 | | | | 190,728 | |
| | | | | | | | | | | | | |
EXPENSES: | | | | | | | | | | | | |
Advisory Fees | | | 713,961 | | | | 277,982 | | | | 54,843 | |
Accounting & Administration Fees | | | 141,438 | | | | 103,616 | | | | 3,859 | |
Professional Fees | | | 80,420 | | | | 31,789 | | | | 24,832 | |
Exchange Listing Fees | | | 11,890 | | | | 11,388 | | | | 5,621 | |
Custody Fees | | | 15,846 | | | | 9,842 | | | | 1,497 | |
Report to Shareholders | | | 89,651 | | | | 12,625 | | | | 6,028 | |
Trustee Fees | | | 7,762 | | | | 5,265 | | | | 1,214 | |
CCO Fees | | | 15,409 | | | | 4,519 | | | | 705 | |
Pricing Fees | | | 17,519 | | | | 13,394 | | | | 811 | |
Transfer Agent Fees | | | 10,672 | | | | 2,195 | | | | 685 | |
Insurance Fees | | | 11,065 | | | | 1,959 | | | | — | |
Dividend Expense | | | — | | | | — | | | | — | |
Miscellaneous Fees | | | 10,630 | | | | 2,186 | | | | 615 | |
Total Expenses | | | 1,126,263 | | | | 476,760 | | | | 100,710 | |
| | | | | | | | | | | | | |
Advisory Fees Waived/Recoupment | | | (249,159 | ) | | | (154,886 | ) | | | (33,071 | ) |
Expense Reimbursement | | | — | | | | — | | | | — | |
Net Expenses | | | 877,104 | | | | 321,874 | | | | 67,639 | |
Net Investment Income (Loss) | | | 3,286,760 | | | | 1,260,068 | | | | 123,089 | |
| | | | | | | | | | | | | |
REALIZED AND UNREALIZED GAIN (LOSS) ON: | | | | | | | | | | | | |
Net Realized Gain (Loss) on: | | | | | | | | | | | | |
Investments | | | (723,442 | ) | | | (319,261 | ) | | | (1,053,245 | ) |
In-Kind Redemptions | | | — | | | | — | | | | — | |
Swaps | | | — | | | | (10,447 | ) | | | — | |
Short Sales | | | — | | | | — | | | | — | |
Foreign Currency Transactions | | | 245 | | | | — | | | | 5,272 | |
Options Written | | | — | | | | — | | | | — | |
Net Change in Unrealized Appreciation (Depreciation) on: | | | | | | | | | | | | |
Investments | | | 1,817,966 | | | | 292,766 | | | | (4,224,123 | ) |
Investments in Affiliates | | | — | | | | — | | | | — | |
Short Sales | | | — | | | | — | | | | — | |
Options Written | | | — | | | | — | | | | — | |
Swaps | | | — | | | | (48,964 | ) | | | (203,488 | ) |
Foreign Currency Translations | | | — | | | | — | | | | (5 | ) |
Net Realized and Unrealized Gain (Loss) | | | 1,094,769 | | | | (85,906 | ) | | | (5,475,589 | ) |
NET INCREASE (DECREASE) IN NET ASSETS RESULTING FROM OPERATIONS | | $ | 4,381,529 | | | $ | 1,174,162 | | | $ | (5,352,500 | ) |
See accompanying Notes to Financial Statements.
101
ADVISORSHARES TRUST
Statements of Operations Year Ended June30, 2019 |
AdvisorShares
Ranger Equity
Bear ETF
| | AdvisorShares
Sabretooth ETF(2) | | AdvisorShares
Sage Core
Reserves ETF | | AdvisorShares
STAR Global
Buy-Write ETF | | AdvisorShares
Vice ETF |
| | | | | | | | | | | | | | | | | | |
$ | 1,223,345 | | | $ | 4,613 | | | $ | 29,784 | | | $ | 359,250 | | | $ | 294,710 | |
| 1,211,079 | | | | — | | | | — | | | | — | | | | — | |
| 1,750,195 | | | | — | | | | 1,742,337 | | | | — | | | | — | |
| — | | | | 200 | | | | 6,421 | | | | — | | | | 55,749 | |
| — | | | | — | | | | — | | | | — | | | | (15,101 | ) |
| 4,184,619 | | | | 4,813 | | | | 1,778,542 | | | | 359,250 | | | | 335,358 | |
| | | | | | | | | | | | | | | | | | |
| | | | | | | | | | | | | | | | | | |
| 2,016,364 | | | | 6,294 | | | | 194,834 | | | | 212,563 | | | | 79,129 | |
| 69,858 | | | | 2,819 | | | | 100,469 | | | | 83,880 | | | | 44,023 | |
| 73,769 | | | | 48,149 | | | | 44,520 | | | | 25,167 | | | | 32,743 | |
| 11,888 | | | | 7,499 | | | | 11,864 | | | | 11,888 | | | | 11,479 | |
| 4,456 | | | | 1,379 | | | | 4,975 | | | | 1,256 | | | | 1,910 | |
| 68,853 | | | | 6,249 | | | | 21,190 | | | | 7,865 | | | | 3,607 | |
| 7,362 | | | | 2,400 | | | | 6,754 | | | | 5,340 | | | | 4,937 | |
| 17,104 | | | | 401 | | | | 8,496 | | | | 2,905 | | | | 1,986 | |
| 14,123 | | | | 2,999 | | | | 14,022 | | | | 13,812 | | | | 5,725 | |
| 7,583 | | | | 79 | | | | 4,871 | | | | 1,396 | | | | 989 | |
| 9,147 | | | | — | | | | 3,732 | | | | 1,169 | | | | 284 | |
| 1,634,591 | | | | — | | | | — | | | | — | | | | — | |
| 11,545 | | | | 1,076 | | | | 4,326 | | | | 1,435 | | | | 1,471 | |
| 3,946,643 | | | | 79,344 | | | | 420,053 | | | | 368,676 | | | | 188,283 | |
| | | | | | | | | | | | | | | | | | |
| — | | | | (6,294 | ) | | | (192,747 | ) | | | (77,386 | ) | | | (79,129 | ) |
| — | | | | (64,133 | ) | | | — | | | | — | | | | (10,243 | ) |
| 3,946,643 | | | | 8,917 | | | | 227,306 | | | | 291,290 | | | | 98,911 | |
| 237,976 | | | | (4,104 | ) | | | 1,551,236 | | | | 67,960 | | | | 236,447 | |
| | | | | | | | | | | | | | | | | | |
| | | | | | | | | | | | | | | | | | |
| | | | | | | | | | | | | | | | | | |
| — | | | | (47,916 | ) | | | 45,009 | | | | 307,036 | | | | (946,327 | ) |
| — | | | | 219,693 | | | | — | | | | 460,506 | | | | 180,391 | |
| — | | | | — | | | | — | | | | — | | | | — | |
| (28,825,802 | ) | | | — | | | | — | | | | — | | | | — | |
| — | | | | — | | | | — | | | | — | | | | — | |
| — | | | | — | | | | — | | | | (161,875 | ) | | | — | |
| | | | | | | | | | | | | | | | | | |
| — | | | | 67,108 | | | | 179,195 | | | | 8,437 | | | | 389,973 | |
| 205,000 | | | | — | | | | — | | | | — | | | | — | |
| 453,109 | | | | — | | | | — | | | | — | | | | — | |
| — | | | | — | | | | — | | | | (10,266 | ) | | | — | |
| — | | | | — | | | | — | | | | — | | | | — | |
| — | | | | — | | | | — | | | | — | | | | — | |
| (28,167,693 | ) | | | 238,885 | | | | 224,204 | | | | 603,838 | | | | (375,963 | ) |
$ |
(27,929,717
| ) | | $ |
234,781
| | | $ |
1,775,440
| | | $ |
671,798
| | | $ |
(139,516
| ) |
See accompanying Notes to Financial Statements.
102
ADVISORSHARES TRUST
Statements of Changes in Net Assets |
| |
AdvisorShares Cornerstone
Small Cap ETF
|
| | |
Year ended
June 30, 2019
| | Year ended
June 30, 2018 |
INCREASE (DECREASE) IN NET ASSETS | | | | | | | | |
OPERATIONS | | | | | | | | |
Net Investment Income (Loss) | | $ | 7,012 | | | $ | 10,049 | |
Net Realized Gain (Loss) | | | 243,805 | | | | 541,262 | |
Net Change in Unrealized Appreciation (Depreciation) | | | (476,176 | ) | | | 465,077 | |
Net Increase (Decrease) In Net Assets Resulting From
Operations | | | (225,359 | ) | | | 1,016,388 | |
DISTRIBUTIONS TO SHAREHOLDERS | | | | | | | | |
Distributions | | | (6,840 | ) | | | (101,078 | ) |
Total Distributions | | | (6,840 | ) | | | (101,078 | )** |
CAPITAL STOCK TRANSACTIONS | | | | | | | | |
Proceeds from Shares Issued | | | 2,818,966 | | | | 4,224,145 | |
Value of Shares Redeemed | | | (2,831,352 | ) | | | (4,226,206 | ) |
Net Increase (Decrease) From Capital Stock Transactions | | | (12,386 | ) | | | (2,061 | ) |
Net Increase (Decrease) in Net Assets | | | (244,585 | ) | | | 913,249 | |
Net Assets: | | | | | | | | |
Beginning of Year/Period | | | 5,199,573 | | | | 4,286,324 | |
End of Year/Period | | $ | 4,954,988 | | | $ | 5,199,573 | *** |
Changes in Shares Outstanding | | | | | | | | |
Shares Outstanding, Beginning of Year/Period | | | 136,476 | | | | 136,476 | |
Shares Sold | | | 75,000 | | | | 125,000 | |
Shares Repurchased | | | (75,000 | ) | | | (125,000 | ) |
Shares Outstanding, End of Year/Period | | | 136,476 | | | | 136,476 | |
See accompanying Notes to Financial Statements.
103
ADVISORSHARES TRUST
Statements of Changes in Net Assets |
AdvisorShares
Dorsey Wright ADR ETF | | AdvisorShares
Dorsey Wright
Micro-Cap ETF | | AdvisorShares
Dorsey Wright
Short ETF |
Year ended
June 30, 2019 | | Year ended
June 30, 2018 | | For the period
July 10,
2018* to
June 30, 2019 | | For the period
July 10,
2018* to
June 30, 2019 |
| | | | | | | | | | | | | | |
| | | | | | | | | | | | | | |
$ | 671,886 | | | $ | 1,672,098 | | | $ | (2,561 | ) | | $ | 65,289 | |
| (29,152,407 | ) | | | (8,747,826 | ) | | | (651,231 | ) | | | (2,276,599 | ) |
| 7,499,640 | | | | 2,258,827 | | | | 311,836 | | | | 1,203,321 | |
|
(20,980,881
| ) | | | (4,816,901 | ) | | | (341,956 | ) | | | (1,007,989 | ) |
| | | | | | | | | | | | | | |
| (669,735 | ) | | | (1,740,860 | ) | | | — | | | | (17,152 | ) |
| (669,735 | ) | | | (1,740,860 | )** | | | — | | | | (17,152 | ) |
| | | | | | | | | | | | | | |
| 10,215,051 | | | | 199,194,895 | | | | 4,158,184 | | | | 46,950,851 | |
| (127,066,943 | ) | | | (11,121,388 | ) | | | (1,512,630 | ) | | | (21,645,192 | ) |
| (116,851,892 | ) | | | 188,073,507 | | | | 2,645,554 | | | | 25,305,659 | |
| (138,502,508 | ) | | | 181,515,746 | | | | 2,303,598 | | | | 24,280,518 | |
| | | | | | | | | | | | | | |
| 246,700,583 | | | | 65,184,837 | | | | — | | | | — | |
$ | 108,198,075 | | | $ | 246,700,583 | *** | | $ | 2,303,598 | | | $ | 24,280,518 | |
| | | | | | | | | | | | | | |
| 4,625,000 | | | | 1,400,000 | | | | — | | | | — | |
| 225,000 | | | | 3,425,000 | | | | 175,000 | | | | 1,800,000 | |
| (2,675,000 | ) | | | (200,000 | ) | | | (75,000 | ) | | | (825,000 | ) |
| 2,175,000 | | | | 4,625,000 | | | | 100,000 | | | | 975,000 | |
See accompanying Notes to Financial Statements.
104
ADVISORSHARES TRUST
Statements of Changes in Net Assets |
| | AdvisorShares DoubleLine Value
Equity ETF(1) |
| | |
Year ended
June 30, 2019
| | Year ended
June 30, 2018 |
INCREASE (DECREASE) IN NET ASSETS | | | | | | | | |
OPERATIONS | | | | | | | | |
Net Investment Income (Loss) | | $ | 695,083 | | | $ | 939,806 | |
Net Realized Gain (Loss) | | | (5,293,435 | ) | | | 13,569,018 | |
Net Change in Unrealized Appreciation (Depreciation) | | | 4,571,285 | | | | (9,297,731 | ) |
Net Increase (Decrease) In Net Assets Resulting From Operations | | | (27,067 | ) | | | 5,211,093 | |
DISTRIBUTIONS TO SHAREHOLDERS | | | | | | | | |
Distributions | | | (830,880 | ) | | | (815,430 | ) |
Total Distributions | | | (830,880 | ) | | | (815,430 | )** |
CAPITAL STOCK TRANSACTIONS | | | | | | | | |
Proceeds from Shares Issued | | | — | | | | 91,394,853 | |
Value of Shares Redeemed | | | (32,790,377 | ) | | | (143,155,981 | ) |
Net Increase (Decrease) From Capital Stock Transactions | | | (32,790,377 | ) | | | (51,761,128 | ) |
Net Increase (Decrease) in Net Assets | | | (33,648,324 | ) | | | (47,365,465 | ) |
Net Assets: | | | | | | | | |
Beginning of Year/Period | | | 95,034,055 | | | | 142,399,520 | |
End of Year/Period | | $ | 61,385,731 | | | $ | 95,034,055 | *** |
Changes in Shares Outstanding | | | | | | | | |
Shares Outstanding, Beginning of Year/Period | | | 1,400,000 | | | | 2,150,000 | |
Shares Sold | | | — | | | | 1,325,000 | |
Shares Repurchased | | | (500,000 | ) | | | (2,075,000 | ) |
Shares Outstanding, End of Year/Period | | | 900,000 | | | | 1,400,000 | |
See accompanying Notes to Financial Statements.
105
ADVISORSHARES TRUST
Statements of Changes in Net Assets |
AdvisorShares Focused
Equity ETF | | AdvisorShares FolioBeyond Smart
Core Bond ETF(2) | | AdvisorShares New Tech and
Media ETF |
Year ended
June 30, 2019 | | Year ended
June 30, 2018 | | Year ended
June 30, 2019 | | Year ended
June 30, 2018 | | Year ended
June 30, 2019 | | For the period
July 11,
2017* to
June 30, 2018 |
| | | | | | | | | | | | | | | | | | | | | | |
| | | | | | | | | | | | | | | | | | | | | | |
$ | 74,174 | | | $ | 55,719 | | | $ | 637,678 | | | $ | 635,849 | | | $ | (119,393 | ) | | $ | (86,032 | ) |
| (614,208 | ) | | | 788,582 | | | | (127,355 | ) | | | (33,892 | ) | | | (10,120,251 | ) | | | (3,767,425 | ) |
| 2,250,694 | | | | 595,369 | | | | 187,184 | | | | (330,982 | ) | | | (1,504,094 | ) | | | 1,806,286 | |
|
1,710,660
| | | |
1,439,670
| | | |
697,507
| | | |
270,975
| | | |
(11,743,738
| ) | | |
(2,047,171
| ) |
| | | | | | | | | | | | | | | | | | | | | | |
| (337,572 | ) | | | (38,174 | ) | | | (659,376 | ) | | | (631,268 | ) | | | — | | | | — | |
| (337,572 | ) | | | (38,174 | )** | | | (659,376 | ) | | | (631,268 | )** | | | — | | | | — | ** |
| | | | | | | | | | | | | | | | | | | | | | |
| 1,526,590 | | | | 3,109,438 | | | | — | | | | 1,299,426 | | | | 10,696,746 | | | | 70,494,864 | |
| — | | | | (2,349,193 | ) | | | (12,658,809 | ) | | | — | | | | (31,670,090 | ) | | | (21,274,326 | ) |
| 1,526,590 | | | | 760,245 | | | | (12,658,809 | ) | | | 1,299,426 | | | | (20,973,344 | ) | | | 49,220,538 | |
| 2,899,678 | | | | 2,161,741 | | | | (12,620,678 | ) | | | 939,133 | | | | (32,717,082 | ) | | | 47,173,367 | |
| | | | | | | | | | | | | | | | | | | | | | |
| 14,311,348 | | | | 12,149,607 | | | | 18,405,345 | | | | 17,466,212 | | | | 47,173,367 | | | | — | |
$ | 17,211,026 | | | $ | 14,311,348 | *** | | $ | 5,784,667 | | | $ | 18,405,345 | *** | | $ | 14,456,285 | | | $ | 47,173,367 | *** |
| | | | | | | | | | | | | | | | | | | | | | |
| 450,000 | | | | 425,000 | | | | 725,000 | | | | 675,000 | | | | 2,225,000 | | | | — | |
| 50,000 | | | | 100,000 | | | | — | | | | 50,000 | | | | 625,000 | | | | 3,200,000 | |
| — | | | | (75,000 | ) | | | (500,000 | ) | | | — | | | | (1,725,000 | ) | | | (975,000 | ) |
| 500,000 | | | | 450,000 | | | | 225,000 | | | | 725,000 | | | | 1,125,000 | | | | 2,225,000 | |
See accompanying Notes to Financial Statements.
106
ADVISORSHARES TRUST
Statements of Changes in Net Assets |
| | AdvisorShares Newfleet
Multi-Sector Income ETF |
| | |
Year ended
June 30, 2019
| | Year ended
June 30, 2018 |
INCREASE (DECREASE) IN NET ASSETS | | | | | | | | |
OPERATIONS | | | | | | | | |
Net Investment Income (Loss) | | $ | 3,286,760 | | | $ | 4,692,575 | |
Net Realized Gain (Loss) | | | (723,197 | ) | | | (873,781 | ) |
Net Change in Unrealized Appreciation (Depreciation) | | | 1,817,966 | | | | (1,599,553 | ) |
Net Increase (Decrease) In Net Assets Resulting From Operations | | | 4,381,529 | | | | 2,219,241 | |
DISTRIBUTIONS TO SHAREHOLDERS | | | | | | | | |
Distributions | | | (3,385,118 | ) | | | (5,480,339 | ) |
Total Distributions | | | (3,385,118 | ) | | | (5,480,339 | )** |
CAPITAL STOCK TRANSACTIONS | | | | | | | | |
Proceeds from Shares Issued | | | 2,408,357 | | | | 17,006,336 | |
Value of Shares Redeemed | | | (83,853,788 | ) | | | (116,221,531 | ) |
Net Increase (Decrease) From Capital Stock Transactions | | | (81,445,431 | ) | | | (99,215,195 | ) |
Net Increase (Decrease) in Net Assets | | | (80,449,020 | ) | | | (102,476,293 | ) |
Net Assets: | | | | | | | | |
Beginning of Year/Period | | | 155,528,830 | | | | 258,005,123 | |
End of Year/Period | | $ | 75,079,810 | | | $ | 155,528,830 | *** |
Changes in Shares Outstanding | | | | | | | | |
Shares Outstanding, Beginning of Year/Period | | | 3,250,000 | | | | 5,300,000 | |
Shares Sold | | | 50,000 | | | | 350,000 | |
Shares Repurchased | | | (1,750,000 | ) | | | (2,400,000 | ) |
Shares Outstanding, End of Year/Period | | | 1,550,000 | | | | 3,250,000 | |
See accompanying Notes to Financial Statements.
107
ADVISORSHARES TRUST
Statements of Changes in Net Assets |
AdvisorShares Pacific Asset Enhanced
Floating Rate ETF | | AdvisorShares
Pure Cannabis ETF | | AdvisorShares Ranger
Equity Bear ETF |
Year ended
June 30, 2019 | | Year ended
June 30, 2018 | | For the period
April 17,
2019* to
June 30, 2019 | | Year ended
June 30, 2019 | | Year ended
June 30, 2018 |
| | | | | | | | | | | | | | | | | | |
| | | | | | | | | | | | | | | | | | |
$ | 1,260,068 | | | $ | 1,013,603 | | | $ | 123,089 | | | $ | 237,976 | | | $ | (2,538,725 | ) |
| (329,708 | ) | | | (109,583 | ) | | | (1,047,973 | ) | | | (28,825,802 | ) | | | (16,222,916 | ) |
| 243,802 | | | | (261,668 | ) | | | (4,427,616 | ) | | | 658,109 | | | | 2,616,588 | |
|
1,174,162
| | | | 642,352 | | | | (5,352,500 | ) | | | (27,929,717 | ) | | | (16,145,053 | ) |
| | | | | | | | | | | | | | | | | | |
| (1,256,592 | ) | | | (932,851 | ) | | | — | | | | — | | | | — | |
| (1,256,592 | ) | | | (932,851 | )** | | | — | | | | — | | | | — | ** |
| | | | | | | | | | | | | | | | | | |
| — | | | | 2,469,990 | | | | 65,114,494 | | | | 108,950,893 | | | | 41,997,327 | |
| — | | | | — | | | | — | | | | (78,793,948 | ) | | | (66,769,640 | ) |
| — | | | | 2,469,990 | | | | 65,114,494 | | | | 30,156,945 | | | | (24,772,313 | ) |
| (82,430 | ) | | | 2,179,491 | | | | 59,761,994 | | | | 2,227,228 | | | | (40,917,366 | ) |
| | | | | | | | | | | | | | | | | | |
| 29,322,558 | | | | 27,143,067 | | | | — | | | | 133,587,051 | | | | 174,504,417 | |
$ | 29,240,128 | | | $ | 29,322,558 | *** | | $ | 59,761,994 | | | $ | 135,814,279 | | | $ | 133,587,051 | *** |
| | | | | | | | | | | | | | | | | | |
| 600,000 | | | | 550,000 | | | | — | | | | 17,125,000 | | | | 20,375,000 | |
| — | | | | 50,000 | | | | 2,600,000 | | | | 14,850,000 | | | | 5,050,000 | |
| — | | | | — | | | | — | | | | (10,700,000 | ) | | | (8,300,000 | ) |
| 600,000 | | | | 600,000 | | | | 2,600,000 | | | | 21,275,000 | | | | 17,125,000 | |
See accompanying Notes to Financial Statements.
108
ADVISORSHARES TRUST
Statements of Changes in Net Assets |
| | AdvisorShares
Sabretooth ETF | | AdvisorShares Sage Core
Reserves ETF |
| | | For the period
February 6,
2019* to
June 30, 2019 | | Year ended
June 30, 2019 | | Year ended
June 30, 2018 |
INCREASE (DECREASE) IN NET ASSETS | | | | | | | | | | | | |
OPERATIONS | | | | | | | | | | | | |
Net Investment Income (Loss) | | $ | (4,104 | ) | | $ | 1,551,236 | | | $ | 1,028,805 | |
Net Realized Gain (Loss) | | | 171,777 | | | | 45,009 | | | | 7,393 | |
Net Change in Unrealized Appreciation (Depreciation) | | | 67,108 | | | | 179,195 | | | | (142,203 | ) |
Net Increase (Decrease) In Net Assets Resulting From Operations | | | 234,781 | | | | 1,775,440 | | | | 893,995 | |
DISTRIBUTIONS TO SHAREHOLDERS | | | | | | | | | | | | |
Distributions | | | — | | | | (1,508,500 | ) | | | (1,031,706 | ) |
Total Distributions | | | — | | | | (1,508,500 | ) | | | (1,031,706 | )** |
CAPITAL STOCK TRANSACTIONS | | | | | | | | | | | | |
Proceeds from Shares Issued | | | 6,405,859 | | | | 19,886,389 | | | | — | |
Value of Shares Redeemed | | | (3,942,249 | ) | | | — | | | | (32,298,232 | ) |
Payments by Affiliates | | | — | | | | — | | | | 3,373 | |
Net Increase (Decrease) From Capital Stock Transactions | | | 2,463,610 | | | | 19,886,389 | | | | (32,294,859 | ) |
Net Increase (Decrease) in Net Assets | | | 2,698,391 | | | | 20,153,329 | | | | (32,432,570 | ) |
Net Assets: | | | | | | | | | | | | |
Beginning of Year/Period | | | — | | | | 52,086,799 | | | | 84,519,369 | |
End of Year/Period | | $ | 2,698,391 | | | $ | 72,240,128 | | | $ | 52,086,799 | *** |
Changes in Shares Outstanding | | | | | | | | | | | | |
Shares Outstanding, Beginning of Year/Period | | | — | | | | 525,000 | | | | 850,000 | |
Shares Sold | | | 250,000 | | | | 200,000 | | | | — | |
Shares Repurchased | | | (150,000 | ) | | | — | | | | (325,000 | ) |
Shares Outstanding, End of Year/Period | | | 100,000 | | | | 725,000 | | | | 525,000 | |
See accompanying Notes to Financial Statements.
109
ADVISORSHARES TRUST
Statements of Changes in Net Assets |
AdvisorShares STAR
Global Buy-Write ETF | | AdvisorShares
Vice ETF |
Year ended
June 30, 2019 | | Year ended
June 30, 2018 | | Year ended
June 30, 2019 | | For the period
December 12,
2017* to
June 30, 2018 |
| | | | | | | | | | | | | | |
| | | | | | | | | | | | | | |
$ | 67,960 | | | $ | 64,622 | | | $ | 236,447 | | | $ | 118,534 | |
| 605,667 | | | | 431,162 | | | | (765,936 | ) | | | (185,440 | ) |
|
(1,829
| ) | | | 571,775 | | | | 389,973 | | | | (68,924 | ) |
|
671,798
| | | | 1,067,559 | | | | (139,516 | ) | | | (135,830 | ) |
| | | | | | | | | | | | | | |
| (64,625 | ) | | | — | | | | (193,320 | ) | | | (13,431 | ) |
| (64,625 | ) | | | — | ** | | | (193,320 | ) | | | (13,431 | )** |
| | | | | | | | | | | | | | |
| — | | | | 774,479 | | | | 2,584,978 | | | | 15,506,105 | |
| (3,127,207 | ) | | | (2,271,473 | ) | | | (1,868,954 | ) | | | (2,557,061 | ) |
| — | | | | — | | | | — | | | | — | |
|
(3,127,207
| ) | | | (1,496,994 | ) | | | 716,024 | | | | 12,949,044 | |
| (2,520,034 | ) | | | (429,435 | ) | | | 383,188 | | | | 12,799,783 | |
| | | | | | | | | | | | | | |
| 17,047,076 | | | | 17,476,511 | | | | 12,799,783 | | | | — | |
$ | 14,527,042 | | | $ | 17,047,076 | *** | | $ | 13,182,971 | | | $ | 12,799,783 | *** |
| | | | | | | | | | | | | | |
| 550,000 | | | | 600,000 | | | | 500,000 | | | | — | |
| — | | | | 25,000 | | | | 100,000 | | | | 600,000 | |
| (100,000 | ) | | | (75,000 | ) | | | (75,000 | ) | | | (100,000 | ) |
| 450,000 | | | | 550,000 | | | | 525,000 | | | | 500,000 | |
See accompanying Notes to Financial Statements.
110
ADVISORSHARES TRUST
Financial Highlights |
| |
AdvisorShares Cornerstone
Small Cap ETF
|
| | | Year ended
June 30, 2019 | | Year ended
June 30, 2018 | | For the period
July 6,
2016* to
June 30, 2017 |
Selected Data for aShare of Capital Stock Outstanding | | | | | | | | | | | | |
Net Asset Value, Beginning ofYear/Period | | $ | 38.10 | | | $ | 31.41 | | | $ | 25.15 | |
Investment Operations | | | | | | | | | | | | |
Net InvestmentIncome (Loss)(3) | | | 0.05 | | | | 0.07 | | | | 0.03 | |
Net Realized and Unrealized Gain (Loss) | | | (1.79 | ) | | | 7.36 | | | | 6.26 | |
Distributions of Net Realized Gains by other investment companies | | | — | | | | — | | | | — | |
Net Increase (Decrease) in NetAssets Resulting from Investment Operations(5) | | | (1.74 | ) | | | 7.43 | | | | 6.29 | |
Distributionsfrom Net Investment Income | | | (0.05 | ) | | | (0.03 | ) | | | (0.03 | ) |
Distributions from Realized Capital Gains | | | — | | | | (0.71 | ) | | | — | |
Total Distributions | | | (0.05 | ) | | | (0.74 | ) | | | (0.03 | ) |
Net Asset Value, End of Year/Period | | $ | 36.31 | | | $ | 38.10 | | | $ | 31.41 | |
Market Value, End of Year/Period | | $ | 36.29 | | | $ | 38.12 | | | $ | 31.40 | |
| | | | | | | | | | | | | |
Total Return | | | | | | | | | | | | |
Total Investment Return Basedon Net Asset Value(6) | | | (4.55 | )% | | | 23.93 | % | | | 25.00 | % |
Total Investment Return Based on Market(6) | | | (4.65 | )% | | | 24.04 | % | | | 24.98 | % |
Ratios/Supplemental Data | | | | | | | | | | | | |
Net Assets, End of Year/Period (000’somitted) | | $ | 4,955 | | | $ | 5,200 | | | $ | 4,286 | |
Ratio to Average Net Assets of(12): | | | | | | | | | | | | |
Expenses, net of expense waivers and reimbursements(7) | | | 0.90 | % | | | 0.90 | % | | | 0.90 | % |
Expenses, prior to expense waivers and reimbursements(7) | | | 3.39 | % | | | 3.06 | % | | | 3.91 | % |
Net Investment Income (Loss)(7) | | | 0.14 | % | | | 0.22 | % | | | 0.09 | % |
Portfolio Turnover Rate(10) | | | 96 | % | | | 95 | % | | | 93 | % |
See accompanying Notes to Financial Statements.
111
ADVISORSHARES TRUST
Financial Highlights |
AdvisorShares Dorsey Wright ADR ETF | | AdvisorShares
Dorsey Wright
Micro-Cap ETF | | AdvisorShares
Dorsey Wright
Short ETF |
Year ended
June 30, 2019 | | Year ended
June 30, 2018 | | Year ended
June 30, 2017 | | Year ended
June 30, 2016 | | Year ended
June 30, 2015 | | For the period
July 10,
2018* to
June 30, 2019 | | For the period
July 10,
2018* to
June 30, 2019 |
| | | | | | | | | | | | | | | | | | | | | | | | | | |
$ | 53.34 | | | $ | 46.56 | | | $ | 39.06 | | | $ | 38.86 | | | $ | 38.95 | | | $ | 24.71 | | | $ | 25.00 | |
| | | | | | | | | | | | | | | | | | | | | | | | | | |
| 0.23 | | | | 0.55 | | | | 0.68 | | | | 0.17 | | | | 0.34 | | | | (0.02 | ) | | | 0.13 | |
| (3.51 | ) | | | 6.66 | | | | 7.27 | | | | 0.23 | | | | (0.20 | ) | | | (1.65 | ) | | | (0.19 | ) |
| — | | | | — | | | | — | | | | — | | | | — | | | | — | | | | — | |
| (3.28 | ) | | | 7.21 | | | | 7.95 | | | | 0.40 | | | | 0.14 | | | | (1.67 | ) | | | (0.06 | ) |
| (0.31 | ) | | | (0.43 | ) | | | (0.45 | ) | | | (0.20 | ) | | | (0.23 | ) | | | — | | | | (0.04 | ) |
| — | | | | — | | | | — | | | | — | | | | — | | | | — | | | | — | |
| (0.31 | ) | | | (0.43 | ) | | | (0.45 | ) | | | (0.20 | ) | | | (0.23 | ) | | | — | | | | (0.04 | ) |
$ | 49.75 | | | $ | 53.34 | | | $ | 46.56 | | | $ | 39.06 | | | $ | 38.86 | | | $ | 23.04 | | | $ | 24.90 | |
$ | 49.69 | | | $ | 53.19 | | | $ | 46.61 | | | $ | 39.06 | | | $ | 38.77 | | | $ | 23.02 | | | $ | 24.93 | |
| | | | | | | | | | | | | | | | | | | | | | | | | | |
| | | | | | | | | | | | | | | | | | | | | | | | | | |
| (6.16 | )% | | | 15.45 | % | | | 20.43 | % | | | 1.05 | % | | | 0.36 | % | | | (6.79 | )% | | | (0.27 | )% |
| (6.00 | )% | | | 15.01 | % | | | 20.55 | % | | | 1.27 | % | | | 0.19 | % | | | (6.86 | )% | | | (0.18 | )% |
| | | | | | | | | | | | | | | | | | | | | | | | | | |
$ | 108,198 | | | $ | 246,701 | | | $ | 65,185 | | | $ | 14,648 | | | $ | 15,543 | | | $ | 2,304 | | | $ | 24,281 | |
| | | | | | | | | | | | | | | | | | | | | | | | | | |
| 0.88 | % | | | 1.02 | % | | | 1.25 | % | | | 1.25 | % | | | 1.25 | % | | | 0.99 | % | | | 2.70 | %(8) |
| 1.07 | % | | | 0.95 | % | | | 1.43 | % | | | 1.62 | % | | | 1.63 | % | | | 4.79 | % | | | 3.26 | %(8) |
| 0.47 | % | | | 0.96 | % | | | 1.55 | % | | | 0.44 | % | | | 0.88 | % | | | (0.11 | )% | | | 0.53 | % |
| 120 | % | | | 71 | % | | | 108 | %(11) | | | 25 | % | | | 27 | % | | | 103 | % | | | 357 | % |
See accompanying Notes to Financial Statements.
112
ADVISORSHARES TRUST
Financial Highlights |
| |
AdvisorShares DoubleLine Value Equity ETF(1)
|
| | |
Year ended
June 30, 2019
| |
Year ended
June 30, 2018
| |
Year ended
June 30, 2017
| |
Year ended
June 30, 2016
| |
Year ended
June 30, 2015
|
Selected Data for a Share of Capital Stock Outstanding | | | | | | | | | | | | | | | | | | | | |
Net Asset Value, Beginning of Year/Period | | $ | 67.88 | | | $ | 66.23 | | | $ | 55.56 | | | $ | 57.05 | | | $ | 51.22 | |
Investment Operations | | | | | | | | | | | | | | | | | | | | |
Net Investment Income (Loss)(3) | | | 0.62 | | | | 0.53 | | | | 0.47 | | | | 0.47 | | | | 0.42 | |
Net Realized and Unrealized Gain (Loss) | | | 0.45 | | | | 1.59 | | | | 10.93 | | | | (1.54 | ) | | | 5.75 | |
Distributions of Net Realized Gains by other investment companies | | | — | | | | — | | | | — | | | | — | | | | — | |
Net Increase (Decrease) in Net Assets Resulting from Investment Operations(5) | | | 1.07 | | | | 2.12 | | | | 11.40 | | | | (1.07 | ) | | | 6.17 | |
Distributions from Net Investment Income | | | (0.74) | | | | (0.47 | ) | | | (0.73 | ) | | | (0.42 | ) | | | (0.34 | ) |
Distributions from Realized Capital Gains | | | — | | | | — | | | | — | | | | — | | | | — | |
Total Distributions | | | (0.74 | ) | | | (0.47 | ) | | | (0.73 | ) | | | (0.42 | ) | | | (0.34 | ) |
Net Asset Value, End of Year/Period | | $ | 68.21 | | | $ | 67.88 | | | $ | 66.23 | | | $ | 55.56 | | | $ | 57.05 | |
Market Value, End of Year/Period | | $ | 68.13 | | | $ | 67.88 | | | $ | 66.17 | | | $ | 55.53 | | | $ | 57.05 | |
| | | | | | | | | | | | | | | | | | | | | |
Total Return | | | | | | | | | | | | | | | | | | | | |
Total Investment Return Based on Net Asset Value(6) | | | 1.74 | % | | | 3.15 | % | | | 20.55 | % | | | (1.87 | )% | | | 12.06 | % |
Total Investment Return Based on Market(6) | | | 1.63 | % | | | 3.26 | % | | | 20.52 | % | | | (1.91 | )% | | | 11.99 | % |
Ratios/Supplemental Data | | | | | | | | | | | | | | | | | | | | |
Net Assets, End of Year/Period (000’s omitted) | | $ | 61,386 | | | $ | 95,034 | | | $ | 142,400 | | | $ | 155,570 | | | $ | 242,472 | |
Ratio to Average Net Assets of(12): | | | | | | | | | | | | | | | | | | | | |
Expenses, net of expense waivers and reimbursements(7) | | | 0.90 | % | | | 0.87 | % | | | 0.90 | % | | | 0.99 | % | | | 0.99 | % |
Expenses, prior to expense waivers and reimbursements(7) | | | 1.17 | % | | | 1.07 | % | | | 1.07 | % | | | 1.21 | % | | | 1.11 | % |
Net Investment Income (Loss)(7) | | | 0.93 | % | | | 0.77 | % | | | 0.76 | % | | | 0.86 | % | | | 0.76 | % |
Portfolio Turnover Rate(10) | | | 218 | % | | | 171 | % | | | 180 | % | | | 196 | % | | | 52 | % |
See accompanying Notes to Financial Statements.
113
ADVISORSHARES TRUST
Financial Highlights |
AdvisorShares Focused Equity ETF | | AdvisorShares FolioBeyond Smart Core Bond ETF(2) | | AdvisorShares
New Tech and Media ETF |
Year ended
June 30,
2019 | | Year ended
June 30,
2018 | | For the period
September 20,
2016* to
June 30, 2017 | | Year ended
June 30,
2019 | | Year ended
June 30,
2018 | | Year ended
June 30,
2017 | | Year ended
June 30,
2016 | | Year ended
June 30,
2015 | | Year ended
June 30,
2019 | | For the period
July 11,
2017* to
June 30, 2018 |
|
| | | | | | | | | | | | | | | | | | | | | | | | | | | | | | | | | | | | | |
$ | 31.80 | | | $ | 28.59 | | | $ | 25.00 | | | $ | 25.39 | | | $ | 25.88 | | | $ | 25.61 | | | $ | 24.97 | | | $ | 26.36 | | | $ | 21.20 | | | $ | 20.00 | |
| | | | | | | | | | | | | | | | | | | | | | | | | | | | | | | | | | | | | | |
| 0.16 | | | | 0.13 | | | | 0.06 | | | | 1.04 | | | | 0.90 | | | | 0.81 | | | | 0.75 | | | | 0.74 | | | | (0.08 | ) | | | (0.05 | ) |
| 3.21 | | | | 3.17 | | | | 3.54 | | | | 0.38 | | | | (0.50 | ) | | | 0.25 | | | | 0.59 | | | | (1.39 | ) | | | (8.27 | ) | | | 1.25 | |
|
—
| | | | — | | | | — | | | | — | | | | — | | | | 0.01 | | | | 0.06 | | | | 0.04 | | | | — | | | | — | |
|
3.37
| | | | 3.30 | | | | 3.60 | | | | 1.42 | | | | 0.40 | | | | 1.07 | | | | 1.40 | | | | (0.61 | ) | | | (8.35 | ) | | | 1.20 | |
| (0.16 | ) | | | (0.09 | ) | | | (0.01 | ) | | | (1.10 | ) | | | (0.89 | ) | | | (0.80 | ) | | | (0.76 | ) | | | (0.78 | ) | | | — | | | | — | |
| (0.59 | ) | | | — | | | | — | | | | — | | | | — | | | | — | | | | — | | | | — | | | | — | | | | — | |
| (0.75 | ) | | | (0.09 | ) | | | (0.01 | ) | | | (1.10 | ) | | | (0.89 | ) | | | (0.80 | ) | | | (0.76 | ) | | | (0.78 | ) | | | — | | | | — | |
$ | 34.42 | | | $ | 31.80 | | | $ | 28.59 | | | $ | 25.71 | | | $ | 25.39 | | | $ | 25.88 | | | $ | 25.61 | | | $ | 24.97 | | | $ | 12.85 | | | $ | 21.20 | |
$ | 34.31 | | | $ | 31.79 | | | $ | 28.59 | | | $ | 25.70 | | | $ | 25.38 | | | $ | 25.89 | | | $ | 25.62 | | | $ | 24.96 | | | $ | 12.75 | | | $ | 21.21 | |
| | | | | | | | | | | | | | | | | | | | | | | | | | | | | | | | | | | | | | |
| | | | | | | | | | | | | | | | | | | | | | | | | | | | | | | | | | | | | | |
| 11.09 | % | | | 11.57 | % | | | 14.39 | % | | | 5.82 | % | | | 1.55 | % | | | 4.23 | % | | | 5.76 | % | | | (2.37 | )% | | | (39.39 | )% | | | 6.01 | % |
| 10.74 | % | | | 11.51 | % | | | 14.40 | % | | | 5.80 | % | | | 1.47 | % | | | 4.24 | % | | | 5.84 | % | | | (2.63 | )% | | | (39.89 | )% | | | 6.05 | % |
| | | | | | | | | | | | | | | | | | | | | | | | | | | | | | | | | | | | | | |
$ | 17,211 | | | $ | 14,311 | | | $ | 12,150 | | | $ | 5,785 | | | $ | 18,405 | | | $ | 17,466 | | | $ | 20,488 | | | $ | 28,096 | | | $ | 14,456 | | | $ | 47,173 | |
| | | | | | | | | | | | | | | | | | | | | | | | | | | | | | | | | | | | | | |
| 0.72 | % | | | 0.68 | % | | | 0.75 | % | | | 0.95 | % | | | 0.95 | % | | | 0.95 | % | | | 0.95 | % | | | 0.95 | % | | | 0.85 | % | | | 0.82 | % |
|
1.63
| % | | | 1.39 | % | | | 2.04 | % | | | 1.49 | % | | | 1.22 | % | | | 1.20 | % | | | 1.05 | % | | | 0.99 | % | | | 1.20 | % | | | 0.97 | % |
|
0.49
| % | | | 0.42 | % | | | 0.28 | % | | | 4.14 | % | | | 3.47 | % | | | 3.15 | % | | | 3.01 | % | | | 2.88 | % | | | (0.43 | )% | | | (0.23 | )% |
| 19 | % | | | 26 | % | | | 36 | % | | | 150 | % | | | 39 | % | | | 21 | % | | | 24 | % | | | 34 | % | | | 1928 | % | | | 799 | % |
See accompanying Notes to Financial Statements.
114
ADVISORSHARES TRUST
Financial Highlights |
| |
AdvisorShares Newfleet Multi-Sector Income ETF
|
| | |
Year ended
June 30,
2019
| | Year ended
June 30,
2018 | | Year ended
June 30,
2017 | | Year ended
June 30,
2016 | | Year ended
June 30,
2015 |
Selected Data for a Share of Capital Stock Outstanding | | | | | | | | | | | | | | | | | | | | |
Net Asset Value, Beginning of Year/Period | | $ | 47.86 | | | $ | 48.68 | | | $ | 48.83 | | | $ | 49.08 | | | $ | 49.94 | |
Investment Operations | | | | | | | | | | | | | | | | | | | | |
Net Investment Income (Loss)(3) | | | 1.35 | | | | 1.05 | | | | 0.74 | | | | 1.25 | | | | 1.28 | |
Net Realized and Unrealized Gain (Loss) | | | 0.65 | | | | (0.62 | ) | | | 0.38 | | | | (0.13 | ) | | | (0.77 | ) |
Distributions of Net Realized Gains by other investment companies | | | — | | | | — | | | | 0.00 | (4) | | | — | | | | — | |
Net Increase (Decrease) in Net Assets Resulting from Investment Operations(5) | | | 2.00 | | | | 0.43 | | | | 1.12 | | | | 1.12 | | | | 0.51 | |
Distributions from Net Investment Income | | | (1.42 | ) | | | (1.25 | ) | | | (1.27 | ) | | | (1.37 | ) | | | (1.37 | ) |
Distributions from Realized Capital Gains | | | — | | | | — | | | | — | | | | — | | | | — | |
Total Distributions | | | (1.42 | ) | | | (1.25 | ) | | | (1.27 | ) | | | (1.37 | ) | | | (1.37 | ) |
Net Asset Value, End of Year/Period | | $ | 48.44 | | | $ | 47.86 | | | $ | 48.68 | | | $ | 48.83 | | | $ | 49.08 | |
Market Value, End of Year/Period | | $ | 48.38 | | | $ | 47.79 | | | $ | 48.70 | | | $ | 48.82 | | | $ | 49.04 | |
| | | | | | | | | | | | | | | | | | | | | |
Total Return | | | | | | | | | | | | | | | | | | | | |
Total Investment Return Based on Net Asset Value(6) | | | 4.27 | % | | | 0.87 | % | | | 2.30 | % | | | 2.33 | % | | | 1.04 | % |
Total Investment Return Based on Market(6) | | | 4.29 | % | | | 0.70 | % | | | 2.37 | % | | | 2.39 | % | | | 0.95 | % |
Ratios/Supplemental Data | | | | | | | | | | | | | | | | | | | | |
Net Assets, End of Year/Period (000’s omitted) | | $ | 75,080 | | | $ | 155,529 | | | $ | 258,005 | | | $ | 261,263 | | | $ | 215,941 | |
Ratio to Average Net Assets of(12): | | | | | | | | | | | | | | | | | | | | |
Expenses, net of expense waivers and reimbursements(7) | | | 0.75 | % | | | 0.75 | % | | | 0.75 | % | | | 0.75 | % | | | 0.75 | % |
Expenses, prior to expense waivers and reimbursements(7) | | | 0.96 | % | | | 0.84 | % | | | 0.80 | % | | | 0.81 | % | | | 0.82 | % |
Net Investment Income (Loss)(7) | | | 2.81 | % | | | 2.17 | % | | | 1.53 | % | | | 2.57 | % | | | 2.60 | % |
Portfolio Turnover Rate(10) | | | 40 | % | | | 66 | % | | | 63 | % | | | 51 | % | | | 49 | % |
See accompanying Notes to Financial Statements.
115
ADVISORSHARES TRUST
Financial Highlights |
AdvisorShares Pacific Asset Enhanced Floating Rate ETF | | AdvisorShares
Pure Cannabis ETF |
Year ended
June 30,
2019 | | Year ended
June 30,
2018 | | Year ended
June 30,
2017 | | Year ended
June 30,
2016 | | For the period
February 18,
2015* to
June 30, 2015 | | For the period
April 17,
2019* to
June 30, 2019 |
|
| | | | | | | | | | | | | | | | | | | | | |
$ | 48.87 | | | $ | 49.35 | | | $ | 48.73 | | | $ | 49.66 | | | $ | 50.00 | | | $ | 25.00 | |
| | | | | | | | | | | | | | | | | | | | | | |
| 2.10 | | | | 1.78 | | | | 1.73 | | | | 1.74 | | | | 0.62 | | | | 0.06 | |
| (0.15 | ) | | | (0.63 | ) | | | 0.58 | | | | (0.95 | ) | | | (0.38 | ) | | | (2.07 | ) |
|
—
| | | | — | | | | — | | | | — | | | | — | | | | — | |
|
1.95
| | | | 1.15 | | | | 2.31 | | | | 0.79 | | | | 0.24 | | | | (2.01 | ) |
| (2.09 | ) | | | (1.63 | ) | | | (1.69 | ) | | | (1.72 | ) | | | (0.58 | ) | | | — | |
| — | | | | — | | | | — | | | | — | | | | — | | | | — | |
| (2.09 | ) | | | (1.63 | ) | | | (1.69 | ) | | | (1.72 | ) | | | (0.58 | ) | | | — | |
$ | 48.73 | | | $ | 48.87 | | | $ | 49.35 | | | $ | 48.73 | | | $ | 49.66 | | | $ | 22.99 | |
$ | 48.72 | | | $ | 48.99 | | | $ | 49.33 | | | $ | 48.26 | | | $ | 49.78 | | | $ | 23.02 | |
| | | | | | | | | | | | | | | | | | | | | | |
| | | | | | | | | | | | | | | | | | | | | | |
| 4.09 | % | | | 2.36 | % | | | 4.78 | % | | | 1.69 | % | | | 0.47 | % | | | (8.06 | )% |
| 3.82 | % | | | 2.65 | % | | | 5.75 | % | | | 0.46 | % | | | 0.71 | % | | | (7.92 | )% |
| | | | | | | | | | | | | | | | | | | | | | |
$ | 29,240 | | | $ | 29,323 | | | $ | 27,143 | | | $ | 26,800 | | | $ | 27,312 | | | $ | 59,762 | |
| | | | | | | | | | | | | | | | | | | | | | |
|
1.10
| % | | | 1.10 | % | | | 1.10 | % | | | 1.10 | % | | | 1.10 | % | | | 0.74 | % |
|
1.63
| % | | | 1.62 | % | | | 1.39 | % | | | 1.51 | % | | | 1.41 | % | | | 1.10 | % |
| 4.31 | % | | | 3.61 | % | | | 3.49 | % | | | 3.58 | % | | | 3.46 | % | | | 1.35 | % |
| 70 | % | | | 73 | % | | | 52 | % | | | 27 | % | | | 102 | % | | | 26 | % |
See accompanying Notes to Financial Statements.
116
ADVISORSHARES TRUST
Financial Highlights |
| |
AdvisorShares Ranger Equity Bear ETF
|
| | |
Year ended
June 30,
2019
| |
Year ended
June 30,
2018
| |
Year ended
June 30,
2017
| |
Year ended
June 30,
2016
| |
Year ended
June 30,
2015
|
Selected Data for a Share of Capital Stock Outstanding | | | | | | | | | | | | | | | | | | | | |
Net Asset Value, Beginning of Year/Period | | $ | 7.80 | | | $ | 8.56 | | | $ | 10.60 | | | $ | 10.88 | | | $ | 11.78 | |
Investment Operations | | | | | | | | | | | | | | | | | | | | |
Net Investment Income (Loss)(3) | | | 0.01 | | | | (0.13 | ) | | | (0.20 | ) | | | (0.27 | ) | | | (0.31 | ) |
Net Realized and Unrealized Gain (Loss) | | | (1.43 | ) | | | (0.63 | ) | | | (1.84 | ) | | | (0.01 | ) | | | (0.59 | ) |
Distributions of Net Realized Gains by other investment companies | | | — | | | | — | | | | — | | | | — | | | | — | |
Net Increase (Decrease) in Net Assets Resulting from Investment Operations(5) | | | (1.42 | ) | | | (0.76 | ) | | | (2.04 | ) | | | (0.28 | ) | | | (0.90 | ) |
Distributions from Net Investment Income | | | — | | | | — | | | | — | | | | — | | | | — | |
Distributions from Realized Capital Gains | | | — | | | | — | | | | — | | | | — | | | | — | |
Total Distributions | | | — | | | | — | | | | — | | | | — | | | | — | |
Net Asset Value, End of Year/Period | | $ | 6.38 | | | $ | 7.80 | | | $ | 8.56 | | | $ | 10.60 | | | $ | 10.88 | |
Market Value, End of Year/Period | | $ | 6.39 | | | $ | 7.78 | | | $ | 8.55 | | | $ | 10.61 | | | $ | 10.88 | |
| | | | | | | | | | | | | | | | | | | | | |
Total Return | | | | | | | | | | | | | | | | | | | | |
Total Investment Return Based on Net Asset Value(6) | | | (18.16 | )% | | | (8.92 | )% | | | (19.24 | )% | | | (2.53 | )% | | | (7.64 | )% |
Total Investment Return Based on Market(6) | | | (17.87 | )% | | | (9.01 | )% | | | (19.42 | )% | | | (2.48 | )% | | | (7.72 | )% |
Ratios/Supplemental Data | | | | | | | | | | | | | | | | | | | | |
Net Assets, End of Year/Period (000’s omitted) | | $ | 135,814 | | | $ | 133,587 | | | $ | 174,504 | | | $ | 213,948 | | | $ | 128,059 | |
Ratio to Average Net Assets of(12): | | | | | | | | | | | | | | | | | | | | |
Expenses, net of expense waivers and reimbursements(7) | | | 2.94 | %(9) | | | 2.52 | %(9) | | | 2.67 | %(9) | | | 2.68 | %(9) | | | 2.80 | %(9) |
Expenses, prior to expense waivers and reimbursements(7) | | | 2.94 | %(9) | | | 2.52 | %(9) | | | 2.67 | %(9) | | | 2.68 | %(9) | | | 2.80 | %(9) |
Net Investment Income (Loss)(7) | | | 0.18 | % | | | (1.63 | )% | | | (2.15 | )% | | | (2.49 | )% | | | (2.72 | )% |
Portfolio Turnover Rate(10) | | | 338 | % | | | 301 | % | | | 245 | % | | | 402 | % | | | 419 | % |
See accompanying Notes to Financial Statements.
117
ADVISORSHARES TRUST
Financial Highlights |
AdvisorShares
Sabretooth ETF | | AdvisorShares Sage Core Reserves ETF |
For the period
February 6,
2019* to
June 30, 2019 | | Year ended
June 30,
2019 | | Year ended
June 30,
2018 | | Year ended
June 30,
2017 | | Year ended
June 30,
2016 | | Year ended
June 30,
2015 |
|
| | | | | | | | | | | | | | | | | | | | | |
$ | 24.95 | | | $ | 99.21 | | | $ | 99.43 | | | $ | 99.43 | | | $ | 99.38 | | | $ | 99.78 | |
| | | | | | | | | | | | | | | | | | | | | | |
| (0.04 | ) | | | 2.37 | | | | 1.53 | | | | 0.97 | | | | 0.69 | | | | 0.12 | |
| 2.07 | | | | 0.33 | | | | (0.16 | ) | | | 0.11 | | | | 0.12 | | | | (0.12 | ) |
|
—
| | | | — | | | | — | | | | — | | | | — | | | | — | |
|
2.03
| | | | 2.70 | | | | 1.37 | | | | 1.08 | | | | 0.81 | | | | — | |
| — | | | | (2.27 | ) | | | (1.59 | ) | | | (1.08 | ) | | | (0.76 | ) | | | (0.40 | ) |
| — | | | | — | | | | — | | | | — | | | | — | | | | — | |
| — | | | | (2.27 | ) | | | (1.59 | ) | | | (1.08 | ) | | | (0.76 | ) | | | (0.40 | ) |
$ | 26.98 | | | $ | 99.64 | | | $ | 99.21 | | | $ | 99.43 | | | $ | 99.43 | | | $ | 99.38 | |
$ | 27.00 | | | $ | 99.61 | | | $ | 99.19 | | | $ | 99.44 | | | $ | 99.63 | | | $ | 99.40 | |
| | | | | | | | | | | | | | | | | | | | | | |
| | | | | | | | | | | | | | | | | | | | | | |
|
8.16
| % | | | 2.74 | % | | | 1.38 | % | | | 1.08 | % | | | 0.83 | % | | | 0.00 | %(4) |
| 8.22 | % | | | 2.74 | % | | | 1.34 | % | | | 0.88 | % | | | 1.00 | % | | | 0.00 | %(4) |
| | | | | | | | | | | | | | | | | | | | | | |
$ | 2,698 | | | $ | 72,240 | | | $ | 52,087 | | | $ | 84,519 | | | $ | 111,862 | | | $ | 34,783 | |
| | | | | | | | | | | | | | | | | | | | | | |
|
0.85
| % | | | 0.35 | % | | | 0.35 | % | | | 0.35 | % | | | 0.35 | % | | | 0.35 | % |
|
7.56
| % | | | 0.65 | % | | | 0.65 | % | | | 0.50 | % | | | 0.55 | % | | | 0.73 | % |
| (0.39 | )% | | | 2.39 | % | | | 1.53 | % | | | 0.97 | % | | | 0.70 | % | | | 0.12 | % |
| 24 | % | | | 91 | % | | | 74 | % | | | 81 | % | | | 72 | % | | | 59 | % |
See accompanying Notes to Financial Statements.
118
ADVISORSHARES TRUST
Financial Highlights |
| | AdvisorShares STAR Global Buy-Write ETF | | AdvisorShares Vice ETF |
| | | Year ended
June 30, 2019 | | Year ended
June 30, 2018 | | Year ended
June 30, 2017 | | Year ended
June 30, 2016 | | Year ended
June 30, 2015 | | Year ended
June 30, 2019 | | For the period
December 12,
2017* to
June 30, 2018 |
Selected Data for a Share of Capital Stock Outstanding | | | | | | | | | | | | | | | | | | | | | | | | | | | | |
Net Asset Value, Beginning of
Year/Period | | $ | 30.99 | | | $ | 29.13 | | | $ | 26.77 | | | $ | 26.60 | | | $ | 26.18 | | | $ | 25.60 | | | $ | 25.00 | |
Investment Operations | | | | | | | | | | | | | | | | | | | | | | | | | | | | |
Net Investment Income (Loss)(3) | | | 0.13 | | | | 0.11 | | | | 0.09 | | | | 0.10 | | | | 0.01 | | | | 0.45 | | | | 0.23 | |
Net Realized and Unrealized Gain (Loss) | | | 1.29 | | | | 1.75 | | | | 2.48 | | | | 0.07 | | | | 0.41 | | | | (0.57 | ) | | | 0.41 | |
Distributions of Net Realized Gains by other investment companies | | | — | | | | 0.00 | (4) | | | 0.01 | | | | 0.00 | (4) | | | — | | | | — | | | | — | |
Net Increase (Decrease) in Net Assets Resulting from Investment
Operations(5) | | | 1.42 | | | | 1.86 | | | | 2.58 | | | | 0.17 | | | | 0.42 | | | | (0.12 | ) | | | 0.64 | |
Distributions from Net Investment Income | | | (0.13 | ) | | | — | | | | (0.22 | ) | | | — | | | | — | | | | (0.37 | ) | | | (0.04 | ) |
Distributions from Realized Capital Gains | | | — | | | | — | | | | — | | | | — | | | | — | | | | — | | | | — | |
Total Distributions | | | (0.13 | ) | | | — | | | | (0.22 | ) | | | — | | | | — | | | | (0.37 | ) | | | (0.04 | ) |
Net Asset Value, End of Year/Period | | $ | 32.28 | | | $ | 30.99 | | | $ | 29.13 | | | $ | 26.77 | | | $ | 26.60 | | | $ | 25.11 | | | $ | 25.60 | |
Market Value, End of Year/Period | | $ | 32.19 | | | $ | 31.01 | | | $ | 29.13 | | | $ | 26.76 | | | $ | 26.61 | | | $ | 25.12 | | | $ | 25.68 | |
| | | | | | | | | | | | | | | | | | | | | | | | | | | | | |
Total Return | | | | | | | | | | | | | | | | | | | | | | | | | | | | |
Total Investment Return Based on Net Asset Value(6) | | | 4.62 | % | | | 6.41 | % | | | 9.70 | % | | | 0.64 | % | | | 1.60 | % | | | (0.22 | )% | | | 2.58 | % |
Total Investment Return Based on Market(6) | | | 4.27 | % | | | 6.45 | % | | | 9.74 | % | | | 0.56 | % | | | 1.49 | % | | | (0.50 | )% | | | 2.89 | % |
Ratios/Supplemental Data | | | | | | | | | | | | | | | | | | | | | | | | | | | | |
Net Assets, End of Year/Period (000’s omitted) | | $ | 14,527 | | | $ | 17,047 | | | $ | 17,477 | | | $ | 17,400 | | | $ | 26,597 | | | $ | 13,183 | | | $ | 12,800 | |
Ratio to Average Net Assets of(12): | | | | | | | | | | | | | | | | | | | | | | | | | | | | |
Expenses, net of expense waivers and reimbursements(7) | | | 1.85 | % | | | 1.85 | % | | | 1.85 | % | | | 1.85 | % | | | 1.85 | % | | | 0.75 | % | | | 0.75 | % |
Expenses, prior to expense waivers
and reimbursements(7) | | | 2.34 | % | | | 2.18 | % | | | 2.14 | % | | | 1.97 | % | | | 1.87 | % | | | 1.43 | % | | | 2.18 | % |
Net Investment Income (Loss)(7) | | | 0.43 | % | | | 0.38 | % | | | 0.32 | % | | | 0.38 | % | | | 0.03 | % | | | 1.79 | % | | | 1.64 | % |
Portfolio Turnover Rate(10) | | | 49 | % | | | 12 | % | | | 26 | % | | | 58 | % | | | 45 | % | | | 76 | % | | | 25 | % |
See accompanying Notes to Financial Statements.
119
ADVISORSHARES TRUST
Notes to Financial Statements June30, 2019 |
1. Organization |
AdvisorShares Trust (the “Trust”) was organized as a Delaware statutory trust on July30, 2007 and has authorized capital of unlimited shares. The Funds are investment companies and accordingly follow the investment company accounting and reporting guidance of the Financial Accounting Standards Board (“FASB”) Accounting Standard Codification Topic 946 “Financial Services — Investment Companies”.
The Trust is an open-end management investment company, registered under the Investment Company Act of 1940, as amended (the “Act”). The Trust is comprised of 16 active funds (the “Funds” or “ETFs” and individually, the “Fund” or “ETF”):
Fund | | Ticker | | Commencement
of Operations |
AdvisorShares Cornerstone Small Cap ETF | | SCAP | | July 6, 2016 |
AdvisorShares Dorsey Wright ADR ETF | | AADR | | July 20, 2010 |
AdvisorShares Dorsey Wright Micro-Cap ETF | | DWMC | | July 10, 2018 |
AdvisorShares Dorsey Wright Short ETF | | DWSH | | July 10, 2018 |
AdvisorShares DoubleLine Value Equity ETF(1) | | DBLV | | October 4, 2011 |
AdvisorShares Focused Equity ETF | | CWS | | September 20, 2016 |
AdvisorShares FolioBeyond Smart Core Bond ETF(2) | | FWDB | | June 20, 2011 |
AdvisorShares New Tech and Media ETF | | FNG | | July 11, 2017 |
AdvisorShares Newfleet Multi-Sector Income ETF | | MINC | | March 19, 2013 |
AdvisorShares Pacific Asset Enhanced Floating Rate ETF | | FLRT | | February 18, 2015 |
AdvisorShares Pure Cannabis ETF | | YOLO | | April 17, 2019 |
AdvisorShares Ranger Equity Bear ETF | | HDGE | | January 26, 2011 |
AdvisorShares Sabretooth ETF | | BKCH | | February 6, 2019 |
AdvisorShares Sage Core Reserves ETF | | HOLD | | January 14, 2014 |
AdvisorShares STAR Global Buy-Write ETF | | VEGA | | September 17, 2012 |
AdvisorShares Vice ETF | | ACT | | December 12, 2017 |
AdvisorShares Cornerstone Small Cap ETF (“Cornerstone Small Cap ETF”) seeks to provide total return through long-term capital appreciation and current income. The Portfolio Manager invests in a diversified group of U.S.-traded equity securities, including common and preferred stock, American Depositary Receipts (“ADRs”), and publicly-traded REITs.
AdvisorShares Dorsey Wright ADR ETF (“Dorsey Wright ADR ETF”) seeks to achieve the Fund’s investment objective by selecting primarily a portfolio of U.S. traded securities of non-U.S. organizations, most often ADRs. The Fund invests in developed and emerging markets and may invest in securities of any market capitalization.
AdvisorShares Dorsey Wright Micro-Cap ETF (“Dorsey Wright Micro-Cap ETF”) seeks to achieve its investment objective by investing primarily in U.S. traded equity securities consisting of common and preferred stock and ADRs. The Fund invests in micro-cap securities.
AdvisorShares Dorsey Wright Short ETF (“Dorsey Wright Short ETF”) seeks to achieve the Fund’s investment objective by obtaining short exposure to investment returns of the broad U.S. large-capitalization equity market by engaging in short sales of U.S. traded equity securities and ETFs. The Fund invests primarily in investments that create or result in short exposure to U.S. equity securities.
120
ADVISORSHARES TRUST
Notes to Financial Statements (Continued) June30, 2019 |
1. Organization – (continued) |
AdvisorShares DoubleLine Value Equity ETF (‘‘DoubleLine Value Equity ETF”) seeks to achieve its investment objective by primarily investing in the broad U.S. equity market, including through ADRs. The Fund invests in stocks with fundamental characteristics that are historically associated with superior long-term performance.
AdvisorShares Focused Equity ETF (“Focused Equity ETF”) seeks long-term capital appreciation. CWS invests primarily in a focused group of U.S. exchange-listed equity securities that the portfolio manager believes have favorable fundamental attributes.
AdvisorShares FolioBeyond Smart Core Bond ETF (“FolioBeyond Smart Core Bond ETF”) seeks investment results that exceed the price and yield performance of its benchmark, the Bloomberg Barclays U.S. Aggregate Bond Index. The Portfolio Manager seeks to achieve this objective by selecting a diversified portfolio of fixed income exchange-traded products (ETPs), including but not limited to, exchange-traded notes (ETNs), exchange-traded currency trusts and exchange-traded commodity pools. FWDB invests in at least 20 distinct global bond classes that cover the entire global investable bond universe. The Portfolio Manager constructs FWDB’s portfolio using a weighted allocation system based on historic yield curve analysis and a mean reversion strategy.
AdvisorShares New Tech and Media ETF (“New Tech and Media ETF”) seeks to achieve its investment objective by investing, under normal circumstances, at least 80% of its net assets (plus any borrowings for investment purposes) in securities of technology and media companies. The Fund will invest primarily in U.S. exchange-listed equity securities, including common and preferred stock and ADRs, of technology and technology-related companies, including innovative and fast-growing technologies such as social media companies and internet retail companies. The Fund will concentrate its investments in the software and services industry within the information technology sector.
AdvisorShares Newfleet Multi-Sector Income ETF (‘‘Newfleet Multi-Sector Income ETF’’) seeks to provide current income consistent with preservation of capital, while limiting fluctuations in net asset value (‘‘NAV’’) due to changes in interest rates. In seeking to achieve the Fund’s investment objective, the Sub-Advisor applies a time-tested approach and extensive credit research to capitalize on opportunities across undervalued areas of the bond markets. The Fund principally invests in investment-grade securities, which are securities with credit ratings within the four highest rating categories of a nationally recognized statistical rating organization or, if unrated, those securities that the Sub-Advisor determines to be of comparable quality.
AdvisorShares Pacific Asset Enhanced Floating Rate ETF (‘‘Pacific Asset Enhanced Floating Rate ETF’’) seeks to provide a high level of current income. The fund seeks to achieve its investment objective by selecting a focused portfolio comprised primarily of income producing floating rate loans and floating rate debt securities.
AdvisorShares Pure Cannabis ETF (“Pure Cannabis ETF”) seeks long-term capital appreciation. The Fund primarily will invest in exchange-listed equity securities, including common and preferred stock, of mid- and small-capitalization companies. The Fund also may use derivatives, including total return swaps, index swaps, equity basket swaps, or futures, to seek exposure to such U.S. and foreign securities. The Advisor may use a variety of methods for security selection. As the Fund primarily focuses on certain industries, the Advisor intends to select companies with dominant positions in their respective markets, or those in unique positions for growth and expansion.
121
ADVISORSHARES TRUST
Notes to Financial Statements (Continued) June30, 2019 |
1. Organization – (continued) |
AdvisorShares Ranger Equity Bear ETF (‘‘Ranger Equity Bear ETF’’) seeks capital appreciation through short sales of domestically traded equity securities. The portfolio management team implements a bottom-up, fundamental, research driven security selection process. In selecting short positions, the Fund seeks to identify securities with low earnings quality or aggressive accounting which may be intended on the part of company management to mask operational deterioration and bolster the reported earnings per share over a short time period. In addition, the portfolio management team seeks to identify earnings driven events that may act as a catalyst to the price decline of a security, such as downwards earnings revisions or reduced forward guidance.
AdvisorShares Sabretooth ETF (“Sabretooth ETF”) seeks long-term capital appreciation. The Fund will invest primarily in U.S. exchange-listed equity securities, including common and preferred stock and ADRs. The Fund will concentrate its investments in the software and services industry group within the information technology sector. The Fund is non-diversified and may invest a greater percentage of its assets in a particular issuer than a diversified fund.
AdvisorShares Sage Core Reserves ETF (‘‘Sage Core Reserves ETF’’) seeks to preserve capital while maximizing income. The Sub-Advisor seeks to achieve the fund’s investment objective by investing in a variety of fixed income securities, including bonds, forwards and instruments issued by U.S. and foreign issuers. It will invest in U.S. dollar-denominated investment grade debt securities, including mortgage- or asset-backed securities, rated Baa- or higher by Moody’s Investors Service, Inc. (‘‘Moody’s’’), or equivalently rated by Standard & Poor’s Ratings Services (‘‘S&P’’) or Fitch, Inc. (‘‘Fitch’’), or, if unrated, determined by the Sub-Advisor to be of comparable quality.
AdvisorShares STAR Global Buy-Write ETF (‘‘STAR Global Buy-Write ETF’’) seeks consistent repeatable returns across all market cycles. The Portfolio Manager seeks to achieve this investment objective by using a proprietary strategy known as Volatility Enhanced Global Appreciation (VEGA). VEGA employs a ‘‘Buy-Write’’ or ‘‘Covered Call’’ overlay for their global allocation strategy using ETPs. The strategy simultaneously writes (sells) a call option against each position in order to seek cumulative price appreciation from the portfolio’s global exposure, while generating a consistent income stream from the sale of covered call and/or cash-secured put options. When volatility is low the portfolio manager buys protective put options to manage downside risk.
AdvisorShares Vice ETF (“Vice ETF”) seeks to achieve its investment objective by investing in securities of companies that derive at least 50% of their net revenue from tobacco and alcoholic beverages and companies that derive at least 50% of their net revenue from the marijuana and hemp industry or have at least 50% of their company assets dedicated to lawful research and development of cannabis or cannabinoid-related products. The Fund will invest primarily in U.S. exchange listed equity securities, including common and preferred stock and ADRs.
Some of the Funds are considered “fund of funds” and seek to achieve their investment objectives by investing primarily in other affiliated and unaffiliated exchange-traded funds (“ETFs”), as well as other exchange-traded products (“ETPs”), including, but not limited to, exchange-traded notes (“ETNs”) and closed-end funds (collectively with ETFs, ETNs, and ETPs), that offer diversified exposure to various global regions, credit qualities, durations and maturity dates.
122
ADVISORSHARES TRUST
Notes to Financial Statements (Continued) June30, 2019 |
1. Organization – (continued) |
For the year ended June30, 2019, the Funds held significant positions (greater than 25% of net assets), except those invested in short term money market instruments, in other funds as follows:
Funds | | Security Name | | Market Value
as of
June 30, 2019 | | % of Fund
Net Assets
as of
June 30,
2019 | | Reference location |
Ranger Equity Bear
ETF | | AdvisorShares Sage Core Reserves ETF | | $ | 54,785,500 | | 40.3 | % | | Contained within this report. |
| | | | | | | | | | | |
STAR Global
Buy-Write ETF | | SPDR S&P 500 ETF Trust | | | 6,235,626 | | 42.9 | | | https://us.spdrs.com |
2. Summary of Significant Accounting Policies
These financial statements are prepared in accordance with U.S. generally accepted accounting principles (‘‘GAAP’’) which require management to make estimates and assumptions that affect the reported amounts of assets and liabilities and disclosures of contingent assets and liabilities at the date of the financial statements and the reported amounts of increases and decreases in net assets from operations during the reporting period. Actual results could differ from those estimates.
Investment Valuation
In computing each Fund’s NAV, the Fund’s securities holdings are valued based on their last readily available market price. Price information on listed securities, including Underlying ETFs, is taken from the exchange where the security is primarily traded. Securities regularly traded in an Over-the-Counter (“OTC”) market are valued at the latest quoted sales price on the primary exchange or national securities market on which such securities are traded. Securities not listed on an exchange or national securities market, or securities in which there was no last reported sales price, are valued at the most recent bid price. Other portfolio securities and assets for which market quotations are not readily available are valued based on fair value as determined in good faith by the Board of Trustees of the Trust.
InvestmentTransactions
Investment transactions are accounted for on the trade date. Realized gains and losses on sales of investment securities are calculated using the identified cost method. Dividend income and distributions to shareholders are recognized on the ex-dividend date and interest income and expenses are recognized on the accrual basis. Premiums and discounts are amortized over the life of the bond using the effective interest method.
In October 2018, the Securities and Exchange Commission adopted amendments to certain disclosure requirements in Securities Act Release No. 33-10532, Disclosure Update and Simplification, which is intended to facilitate the disclosure of information to investors and simplify compliance without significantly altering the total mix of information provided to investors. Effective with the current reporting period, the Funds adopted the amendments with the impacts being that the Funds are no longer required to present components of distributable earnings on the Statement of Assets and Liabilities or the sources of distributable earnings and the amount of undistributed net investment income on the Statements of Changes in Net Assets.
123
ADVISORSHARES TRUST
Notes to Financial Statements (Continued) June30, 2019 |
2. Summary of Significant Accounting Policies – (continued) |
The following is a break-out of the components of Distributions for Shareholders for the year ended June30, 2018.
Fund | | Net Investment
Income | | Net Realized
Gains | | Total
Distributions |
Cornerstone Small Cap ETF | | $ | (4,326 | ) | | $ | (96,752 | ) | | $ | (101,078 | ) |
Dorsey Wright ADR ETF | | | (1,740,860 | ) | | | — | | | | (1,740,860 | ) |
DoubleLine Value Equity ETF | | | (815,430 | ) | | | — | | | | (815,430 | ) |
Focused Equity ETF | | | (38,174 | ) | | | — | | | | (38,174 | ) |
FolioBeyond Smart Core Bond ETF | | | (631,268 | ) | | | — | | | | (631,268 | ) |
New Tech and Media ETF | | | — | | | | — | | | | — | |
Newfleet Multi-Sector Income ETF | | | (5,480,339 | ) | | | — | | | | (5,480,339 | ) |
Pacific Asset Enhanced Floating Rate ETF | | | (932,851 | ) | | | — | | | | (932,851 | ) |
Ranger Equity Bear ETF | | | — | | | | — | | | | — | |
Sage Core Reserves ETF | | | (1,031,706 | ) | | | — | | | | (1,031,706 | ) |
STAR Global Buy-Write ETF | | | — | | | | — | | | | — | |
Vice ETF | | | (13,431 | ) | | | — | | | | (13,431 | ) |
The following is the Undistributed (Accumulated) Net Investment Income (Loss) for the year ended June30, 2018.
Fund | | Undistributed
(Accumulated)
Net Investment
Income (Loss) |
Cornerstone Small Cap ETF | | $ | 6,873 | |
Dorsey Wright ADR ETF | | | — | |
DoubleLine Value Equity ETF | | | 547,154 | |
Focused Equity ETF | | | 32,966 | |
FolioBeyond Smart Core Bond ETF | | | 21,836 | |
New Tech and Media ETF | | | (24,351 | ) |
Newfleet Multi-Sector Income ETF | | | 66,412 | |
Pacific Asset Enhanced Floating Rate ETF | | | 19,995 | |
Ranger Equity Bear ETF | | | (798,572 | ) |
Sage Core Reserves ETF | | | 16,312 | |
STAR Global Buy-Write ETF | | | 64,622 | |
Vice ETF | | | 105,103 | |
Distributions received from investments in Real Estate Investment Trusts (“REITs”) are recorded as dividend income on ex-dividend date, subject to reclassification upon notice of the character of such distributions by the issuer. The portion of dividend attributable to the return of capital is recorded against the cost basis of the security.
ForeignTaxes
The Funds may be subject to foreign taxes (a portion of which may be reclaimable) on income, capital gains on investments, certain foreign currency transactions or other corporate events. All foreign taxes are recorded in accordance with the applicable foreign tax regulations and rates that exist in the foreign jurisdictions in which the Funds invest. These foreign taxes, if any, are paid by the Funds and are reflected in their Statements of Operations.
124
ADVISORSHARES TRUST
Notes to Financial Statements (Continued) June30, 2019 |
2. Summary of Significant Accounting Policies – (continued) |
Expenses
Expenses of the Trust, which are directly identifiable to a specific Fund, are applied to that Fund. Expenses which are not readily identifiable to a specific Fund are allocated in such a manner as deemed equitable, taking into consideration the nature and type of expense and the relative net assets of each Fund.
Swap Agreements
Certain funds may invest in equity swaps to obtain exposure to the underlying referenced security, obtain leverage or enjoy the returns from ownership without actually owning equity. Equity swaps are two-party contracts that generally obligate one party to pay the positive return and the other party to pay the negative return on a specified reference security, basket of securities, security index or index component during the period of the swap. Equity swap contracts are marked to market daily based on the value of the underlying security and the change, if any, is recorded as an unrealized gain or loss.
Equity swaps normally do not involve the delivery of securities or other underlying assets. Accordingly, the risk of loss with respect to equity swaps is normally limited to the net amount of payments that a Fund is contractually obligated to make. If the other party to an equity swap defaults a Fund’s risk of loss consists of the net amount of payments that the Fund is contractually entitled to receive, if any.
Equity swaps are derivatives and their value can be very volatile. To the extent that the Advisor or Sub-Advisor, as applicable, do not accurately analyze and predict future market trends, the values of assets or economic factors, the Funds may suffer a loss, which may be substantial. The swap markets in which many types of swap transactions are traded have grown substantially in recent years, with a large number of banks and investment banking firms acting both as principals and as agents. As a result, the markets for certain types of swaps have become relatively liquid. Periodic payments received or paid by the Funds are recorded as realized gains or losses.
Repurchase Agreements
The Funds may enter into repurchase agreements provided that the value of the underlying collateral, including accrued interest, will equal or exceed the value of the repurchase agreement during the term of the agreement. The underlying collateral for all repurchase agreements is held in safekeeping by the Fund’s custodian or at the Federal Reserve Bank. If the seller defaults and the value of the collateral declines, or if bankruptcy proceedings commence with respect to the seller of the security, realization of the collateral by the Fund may be delayed or limited.
At June30, 2019 the market values of repurchase agreements outstanding are included as cash collateral for securities on loan on the Statements of Assets and Liabilities.
Short Sales
Certain Funds may sell securities it does not own as a hedge against some of its long positions and/ or in anticipation of a decline in the market value of that security (short sale). When the Funds make a short sale, it must borrow the security sold short and deliver it to the broker-dealer through which it made the short sale. The Funds may have to pay a fee to borrow the particular security and may be obligated to remit any interest or dividends received on such borrowed securities. Dividends declared on short positions open are recorded on the ex-date as an expense. A gain, limited to the price at which the Funds sold the security short, or a loss, unlimited in magnitude, will be recognized upon the termination of a short sale if the market price at termination is less than or greater than, respectively,
125
ADVISORSHARES TRUST
Notes to Financial Statements (Continued) June30, 2019 |
2. Summary of Significant Accounting Policies – (continued) |
the proceeds originally received. The Funds are also subject to the risk that it may be unable to reacquire a security to terminate a short position except at a price substantially in excess of the last quoted price.
The Funds are required to pledge cash or securities to the broker as collateral for the securities sold short. Collateral requirements are calculated daily based on the current market value of the short positions. Cash deposited with broker for collateral for securities sold short is recorded as an asset on the Statements of Assets and Liabilities and securities segregated as collateral are denoted in the Schedule of Investments. The Funds may receive or pay the net of the following amounts: (i) a portion of the income from the investment of cash collateral; (ii) the broker’s fee on the borrowed securities; and (iii) a financing charge for the difference in the market value of the short position and cash collateral deposited with the broker. This income or fee is calculated daily based upon the market value of each borrowed security and a variable rate that is dependent on the availability of the security. The net amount of income or fees paid to Ranger Equity Bear ETF for the year ended June30, 2019 was $1,750,195, which is included as Interest Income in the Statements of Operations.
Deposits with brokers and segregated cash for securities sold short represent cash balances on deposit with the Funds’ prime brokers and custodian. The Funds are subject to credit risk should the prime brokers be unable to meet its obligations to the Funds.
TermLoans
Certain Funds invests in senior secured corporate loans or bank loans, some of which may be partially or entirely unfunded and purchased on a when-issued or delayed delivery basis, that pay interest at rates which are periodically reset by reference to a base lending rate plus a spread. Bank loans generally pay interest at rates which are periodically determined by reference to a base lending rate plus a premium. All loans carry a variable rate of interest. These base lending rates are generally (i) the Prime Rate offered by one or more major United States banks, (ii) the lending rate offered by one or more European banks such as the London Interbank Offered Rate (“LIBOR”) or (iii) the Certificate of Deposit rate. Bank Loans, while exempt from registration, under the Securities Act of 1933, contain certain restrictions on resale and cannot be sold publicly. Floating rate bank loans often require prepayments from excess cash flow or permit the borrower to repay at its election. The degree to which borrowers repay, whether as a contractual requirement or at their election, cannot be predicted with accuracy. As a result, actual maturity may be substantially less than the stated maturity. Bank loans in which the Fund invests are generally readily marketable, but may be subject to certain restrictions on resale.
Options
Certain Funds are authorized to write and purchase put and call options. When a Fund writes an option, an amount equal to the premium received by the Fund is reflected as an asset and an equivalent liability. The amount of the liability is subsequently marked to market to reflect the current market value of the option written. When a security is purchased or sold through an exercise of an option, the related premium paid (or received) is added to (or deducted from) the basis of the security acquired or deducted from (or added to) the proceeds of the security sold. When an option expires (or the Fund enters into a closing transaction), the Fund realizes a gain or loss on the option to the extent of the premiums received or paid (or gain or loss to the extent the cost of the closing transaction exceeds the premium paid or received). The Fund, as writer of an option, bears the market risk of an unfavorable change in the price of the security underlying the written option. Written and purchased options are non-income producing investments.
126
ADVISORSHARES TRUST
Notes to Financial Statements (Continued) June30, 2019 |
2. Summary of Significant Accounting Policies – (continued) |
Short-TermInvestments
Each Fund may invest in high-quality short-term debt securities and money market instruments on an ongoing basis to maintain liquidity or pending selection of investments in accordance with its policies. These short-term debt securities and money market instruments include shares of other mutual funds, commercial paper, certificates of deposit, bankers’ acceptances, U.S. Government securities and repurchase agreements.
Securities Lending
The Funds participate in a securities lending program offered by The Bank of New York Mellon (‘‘BNYM’’) (the ‘‘Program’’), providing for the lending of securities to qualified brokers. Securities lending income includes earnings of such temporary cash investments, plus or minus any rebate to a borrower. These earnings (after any rebate) are then divided between BNYM, as a fee for its services under the Program, and the Funds, according to agreed-upon rates. Collateral on all securities loaned is accepted as cash and non-cash and is maintained at a minimum level of 102% (105% in the case of certain foreign securities) of the market value, plus interest, if applicable, of investments on loan. It is the Fund’s policy to obtain additional collateral from or return excess collateral to the borrower by the end of the next business day, following the valuation date of the securities loaned. Therefore, the value of the collateral held may be temporarily less than the value of the securities on loan. Lending securities entails a risk of loss to the Funds if and to the extent that the market value of the securities loaned were to increase and the borrower did not increase the collateral accordingly, and the borrower fails to return the securities. Under the terms of the Program, the Funds are indemnified for such losses by BNYM. Cash collateral is held in a separate account managed by BNYM, who is authorized to exclusively enter into money market instruments and overnight repurchase agreements, which are collateralized at 102% with securities issued or fully guaranteed by the U.S. Treasury; U.S. Government or any agency, instrumentality or authority of the U.S. government. The securities purchased with cash collateral received are reflected in the Schedule of Investments. BNYM bears the risk of any deficiency in the amount of the cash collateral available for return to the borrower due to any loss on the collateral invested.
The money market instruments and repurchase agreements income related to the Program earned by the Funds is disclosed on the Statements of Operations.
The value of loaned securities and related collateral outstanding at June30, 2019 are shown in the Schedules of Investments and Statements of Assets and Liabilities. Non-cash collateral received by the Funds may not be sold or re-pledged except to satisfy a borrower default. Therefore, non-cash collateral is not included on the Fund’s Schedules of Investments or Statements of Assets and Liabilities.
127
ADVISORSHARES TRUST
Notes to Financial Statements (Continued) June30, 2019 |
2. Summary of Significant Accounting Policies – (continued) |
Fund and Description | | Gross
Amounts of
Recognized
Assets
(Liabilities) | | Gross
Amounts
Offset in the
Statements
of Assets
and
(Liabilities) | | Net Amounts
Presented
in the
Statements
of Assets and
(Liabilities) | | Gross Amounts not offset
in the Statements of Assets
and Liabilities | | |
Financial
Instruments | | Collateral
Pledged/
Received | | Net
Amount |
Cornerstone Small Cap ETF | | | | | | | | | | | | | | | | | | | | | | |
Securities Lending | | $ | (206,727 | ) | | $ | — | | $ | (206,727 | ) | | $ | 206,727 | (1) | | $ | — | | $ | — | |
Repurchase Agreements | | | 206,727 | | | | — | | | 206,727 | | | | 206,727 | (2) | | | — | | | — | |
Dorsey Wright ADR ETF | | | | | | | | | | | | | | | | | | | | | | |
Securities Lending | | | (6,386,108 | ) | | | — | | | (6,386,108 | ) | | | 6,386,108 | (1) | | | — | | | — | |
Repurchase Agreements | | | 6,386,108 | | | | — | | | 6,386,108 | | | | 6,386,108 | (2) | | | — | | | — | |
Dorsey Wright Micro-Cap ETF | | | | | | | | | | | | | | | | | | | | | | |
Securities Lending | | | (167,508 | ) | | | — | | | (167,508 | ) | | | 167,508 | (1) | | | — | | | — | |
Repurchase Agreements | | | 167,508 | | | | — | | | 167,508 | | | | 167,508 | (2) | | | — | | | — | |
DoubleLine Value Equity ETF | | | | | | | | | | | | | | | | | | | | | | |
Securities Lending | | | (139,577 | ) | | | — | | | (139,577 | ) | | | 139,577 | (1) | | | — | | | — | |
Repurchase Agreements | | | 139,577 | | | | — | | | 139,577 | | | | 139,577 | (2) | | | — | | | — | |
FolioBeyond Smart Core Bond ETF | | | | | | | | | | | | | | | | | | | | | | |
Securities Lending | | | (633,822 | ) | | | — | | | (633,822 | ) | | | 633,822 | (1) | | | — | | | — | |
Repurchase Agreements | | | 633,822 | | | | — | | | 633,822 | | | | 633,822 | (2) | | | — | | | — | |
New Tech and Media ETF | | | | | | | | | | | | | | | | | | | | | | |
Securities Lending | | | (3,246,021 | ) | | | — | | | (3,246,021 | ) | | | 3,246,021 | (1) | | | — | | | — | |
Repurchase Agreements | | | 3,246,021 | | | | — | | | 3,246,021 | | | | 3,246,021 | (2) | | | — | | | — | |
Newfleet Multi-Sector Income ETF | | | | | | | | | | | | | | | | | | | | | | |
Securities Lending | | | (323,645 | ) | | | — | | | (323,645 | ) | | | 323,645 | (1) | | | — | | | — | |
Repurchase Agreements | | | 323,645 | | | | — | | | 323,645 | | | | 323,645 | (2) | | | — | | | — | |
Pacific Asset Enhanced Floating Rate ETF | | | | | | | | | | | | | | | | | | | | | | |
Securities Lending | | | (262,080 | ) | | | — | | | (262,080 | ) | | | 262,080 | (1) | | | — | | | — | |
Repurchase Agreements | | | 262,080 | | | | — | | | 262,080 | | | | 262,080 | (2) | | | — | | | — | |
Pure Cannabis ETF | | | | | | | | | | | | | | | | | | | | | | |
Securities Lending | | | (25,079,106 | ) | | | — | | | (25,079,106 | ) | | | 25,079,106 | (1) | | | — | | | — | |
Repurchase Agreements | | | 25,079,106 | | | | — | | | 25,079,106 | | | | 25,079,106 | (2) | | | — | | | — | |
Swaps | | | (203,488 | ) | | | — | | | (203,488 | ) | | | — | | | | — | | | (203,488 | ) |
Sabretooth ETF | | | | | | | | | | | | | | | | | | | | | | |
Securities Lending | | | (65 | ) | | | — | | | (65 | ) | | | 65 | (1) | | | — | | | — | |
Repurchase Agreements | | | 65 | | | | — | | | 65 | | | | 65 | (2) | | | — | | | — | |
Sage Core Reserves ETF | | | | | | | | | | | | | | | | | | | | | | |
Securities Lending | | | (4,922,645 | ) | | | — | | | (4,922,645 | ) | | | 4,922,645 | (1) | | | — | | | — | |
Repurchase Agreements | | | 4,922,645 | | | | — | | | 4,922,645 | | | | 4,922,645 | (2) | | | — | | | — | |
Vice ETF | | | | | | | | | | | | | | | | | | | | | | |
Securities Lending | | | (795,744 | ) | | | — | | | (795,744 | ) | | | 795,744 | (1) | | | — | | | — | |
Repurchase Agreements | | | 795,744 | | | | — | | | 795,744 | | | | 795,744 | (2) | | | — | | | — | |
128
ADVISORSHARES TRUST
Notes to Financial Statements (Continued) June30, 2019 |
2. Summary of Significant Accounting Policies – (continued) |
DividendsandDistributions
Each Fund will generally pay out dividends to shareholders at least annually. Each Fund will distribute its net capital gains, if any, to shareholders annually. Income and capital gain distributions are determined in accordance with income tax regulations which may differ from U.S. generally accepted accounting principles. Distributions are recorded on ex-dividend date.
Indemnifications
In the normal course of business, each Fund enters into contracts that contain a variety of representations which provide general indemnifications. The Trust’s maximum exposure under these arrangements cannot be known; however, the Trust expects any risk of loss to be remote.
3.InvestmentAdvisoryAgreementandOtherAgreements
InvestmentAdvisoryAgreement
Each Fund has entered into an investment advisory agreement with AdvisorShares Investments, LLC (the ‘‘Advisor’’) pursuant to which the Advisor acts as the Fund’s investment advisor. Pursuant to the agreement, the Advisor has overall supervisory responsibility for the general management and investment of each Fund’s securities portfolio, and has ultimate responsibility (subject to oversight by the Trust’s Board of Trustees) for oversight of the Trust’s sub-advisors. For its services, the Advisor is entitled to an annual management fee, which is calculated daily and paid monthly based on a Fund’s average daily net assets. From time to time, the Advisor may waive all or a portion of its fee.
The Advisor’s annual management fee for each Fund is as follows:
| | Fund: | | Rate: | | |
Cornerstone Small Cap ETF | | 0.65% | |
Dorsey Wright ADR ETF | | 0.75% | |
Dorsey Wright Micro-Cap ETF | | 0.75% | |
Dorsey Wright Short ETF | | 0.75% | |
DoubleLine Value Equity ETF | | 0.70%(a) | |
Focused Equity ETF | | 0.75%(b) | |
FolioBeyond Smart Core Bond ETF | | 0.50% | |
New Tech and Media ETF | | 0.60% | |
Newfleet Multi-Sector Income ETF | | 0.50%(c) | |
Pacific Asset Enhanced Floating Rate ETF | | 0.95% | |
Pure Cannabis ETF | | 0.60% | |
Ranger Equity Bear ETF | | 1.50% | |
Sabretooth ETF | | 0.60% | |
Sage Core Reserves ETF | | 0.30% | |
STAR Global Buy-Write ETF | | 1.35% | |
Vice ETF | | 0.60% | |
129
ADVISORSHARES TRUST
Notes to Financial Statements (Continued) June30, 2019 |
3.InvestmentAdvisoryAgreementandOtherAgreements – (continued) |
Pursuant to an investment advisory agreement between the Focused Equity ETF and the Advisor, the Advisor is entitled to receive, on a monthly basis, an annual advisory fee based on the average daily net assets of the Fund. The Advisor’s advisory fee has two components — the base fee and the performance fee adjustment. The base fee is the pre-determined rate at which the Advisor is paid when the Fund’s net performance is in line with Fund’s pre-determined performance benchmark. The base fee is subject to an upward or downward adjustment by the performance fee. If the Fund outperforms the performance benchmark, the Advisor may receive an upward fee adjustment. If the Fund underperforms the performance benchmark, the Advisor may receive a downward fee adjustment.
The Advisor’s annual base fee is 0.75% of the Fund’s average daily net assets. The performance fee adjustment is derived by comparing the Fund’s performance over a rolling twelve-month period to its performance benchmark, the S&P 500 Index. The base fee is adjusted at a rate of 0.02% for every 0.25% to 0.50% of out-performance or under-performance compared to the performance benchmark, but only up to 2.00% of the performance benchmark. As a result, the maximum possible performance fee adjustment, up or down, to the base fee is 0.10%. Accordingly, the Advisor’s annual advisory fee may range from 0.65% to 0.85% of the Fund’s average daily net assets. For the year ended June30, 2019, the performance fee adjustment was –0.03%, resulting in a net advisory fee of 0.72%.
Sub-Advisory Agreements
Each Fund’s investment sub-advisor provides investment advice and management services to the Fund. AdvisorShares supervises the day-to-day investment and reinvestment of the assets in the Fund and is responsible for monitoring the Fund’s adherence to its investment mandate. Pursuant to an investment sub-advisory agreement between each sub-advisor and the Advisor, the sub-advisor is entitled to a fee, which is not an additional expense of the Funds, and is calculated daily and paid monthly by the Advisor, at an annual rate based on the average daily net assets of its respective Fund(s) as follows:
Fund | | Sub-Advisor | | Sub-Advisory Fee Rate |
AdvisorShares Cornerstone Small Cap ETF | | Cornerstone Investment Partners, LLC | | 0.35% |
AdvisorShares Dorsey Wright ADR ETF | | Dorsey, Wright & Associates, LLC | | 0.25% |
AdvisorShares Dorsey Wright Micro-Cap ETF | | Dorsey, Wright & Associates, LLC | | 0.25% |
AdvisorShares Dorsey Wright Short ETF | | Dorsey, Wright & Associates, LLC | | 0.25% |
AdvisorShares DoubleLine Value Equity ETF | | DoubleLine Equity LP | | 0.35% |
AdvisorShares New Tech and Media ETF | | Sabretooth Advisors, LLC | | 0.30% |
AdvisorShares Newfleet Multi-Sector Income ETF | | Newfleet Asset Management, LLC | | 0.25% |
AdvisorShares Pacific Asset Enhanced Floating Rate ETF | | Pacific Asset Management | | 0.60% |
AdvisorShares Ranger Equity Bear ETF | | Ranger Alternative Management, L.P. | | 1.00% |
AdvisorShares Sabretooth ETF | | Sabretooth Advisors, LLC | | 0.30% |
AdvisorShares Sage Core Reserves ETF | | Sage Advisory Services, Ltd. Co. | | 0.15% |
AdvisorShares STAR Global Buy-Write ETF | | Partnervest Advisory Services LLC | | 0.85% |
From time to time, each sub-advisor may waive all or a portion of its fee.
ExpenseLimitationAgreement
The Advisor has contractually agreed to reduce their fees and reimburse expenses in order to keep net expenses (excluding interest, taxes, brokerage commissions, acquired fund fees and expenses, and extraordinary expenses) from exceeding a specified amount for each Fund’s average daily net assets.
130
ADVISORSHARES TRUST
Notes to Financial Statements (Continued) June30, 2019 |
3.InvestmentAdvisoryAgreementandOtherAgreements – (continued) |
The expense limitation agreement will be terminated upon termination of the investment advisory agreement between the Advisor and the Fund. The investment advisory agreement may only be terminated with the approval of the Fund’s Board. The expense caps in effect for each Fund during the year ended June30, 2019 were as follows:
| | Fund: | | Rate: | | |
Cornerstone Small Cap ETF | | 0.90% | |
Dorsey Wright ADR ETF | | 0.88% | |
Dorsey Wright Micro-Cap ETF | | 0.99% | |
Dorsey Wright Short ETF | | 0.99% | |
DoubleLine Value Equity ETF | | 0.90% | |
Focused Equity ETF | | 0.75%(a) | |
FolioBeyond Smart Core Bond ETF | | 0.95% | |
New Tech and Media ETF | | 0.85% | |
Newfleet Multi-Sector Income ETF | | 0.75% | |
Pacific Asset Enhanced Floating Rate ETF | | 1.10% | |
Pure Cannabis ETF | | 0.74% | |
Ranger Equity Bear ETF | | 1.85% | |
Sabretooth ETF | | 0.85% | |
Sage Core Reserves ETF | | 0.35% | |
STAR Global Buy-Write ETF | | 1.85% | |
Vice ETF | | 0.75% | |
For the year ended June30, 2019, the Advisor waived fees and reimbursed expenses for each Fund as follows. Each Fund may recoup such waivers until the date indicated, or for a maximum of three years from reimbursement, whichever is sooner.
Fund | | Recoupment
Balance | | Recoupment
Expiration | | Year
Incurred |
Cornerstone Small Cap ETF | | $ | 101,317 | | 6/30/2020 | | 2017 |
| | | | 100,635 | | 6/30/2021 | | 2018 |
| | | | 124,576 | | 6/30/2022 | | 2019 |
Total | | | 326,528 | | | | |
| | | | | | | | |
Dorsey Wright ADR ETF | | | 46,955 | | 6/30/2020 | | 2017 |
| | | | 272,311 | | 6/30/2022 | | 2019 |
Total | | | 319,266 | | | | |
| | | | | | | | |
Dorsey Wright Micro-Cap ETF | | | 86,234 | | 6/30/2022 | | 2019 |
Total | | | 86,234 | | | | |
| | | | | | | | |
Dorsey Wright Short ETF | | | 70,194 | | 6/30/2022 | | 2019 |
Total | | | 70,194 | | | | |
131
ADVISORSHARES TRUST
Notes to Financial Statements (Continued) June30, 2019 |
3.InvestmentAdvisoryAgreementandOtherAgreements – (continued) |
Fund | | Recoupment
Balance | | Recoupment
Expiration | | Year
Incurred |
DoubleLine Value Equity ETF | | $ | 244,904 | | 6/30/2020 | | 2017 |
| | | | 240,281 | | 6/30/2021 | | 2018 |
| | | | 200,619 | | 6/30/2022 | | 2019 |
Total | | | 685,804 | | | | |
| | | | | | | | |
Focused Equity ETF | | | 83,821 | | 6/30/2020 | | 2017 |
| | | | 94,062 | | 6/30/2021 | | 2018 |
| | | | 136,738 | | 6/30/2022 | | 2019 |
Total | | | 314,621 | | | | |
| | | | | | | | |
FolioBeyond Smart Core Bond ETF | | | 46,960 | | 6/30/2020 | | 2017 |
| | | | 50,120 | | 6/30/2021 | | 2018 |
| | | | 82,793 | | 6/30/2022 | | 2019 |
Total | | | 179,873 | | | | |
| | | | | | | | |
New Tech and Media ETF | | | 56,539 | | 6/30/2021 | | 2018 |
| | | | 97,343 | | 6/30/2022 | | 2019 |
Total | | | 153,882 | | | | |
| | | | | | | | |
Newfleet Multi-Sector Income ETF | | | 133,302 | | 6/30/2020 | | 2017 |
| | | | 204,737 | | 6/30/2021 | | 2018 |
| | | | 249,159 | | 6/30/2022 | | 2019 |
Total | | | 587,198 | | | | |
| | | | | | | | |
Pacific Asset Enhanced Floating Rate ETF | | | 79,534 | | 6/30/2020 | | 2017 |
| | | | 146,217 | | 6/30/2021 | | 2018 |
| | | | 154,886 | | 6/30/2022 | | 2019 |
Total | | | 380,637 | | | | |
| | | | | | | | |
Pure Cannabis ETF | | | 33,071 | | 6/30/2022 | | 2019 |
Total | | | 33,071 | | | | |
| | | | | | | | |
Sabretooth ETF | | | 70,427 | | 6/30/2022 | | 2019 |
Total | | | 70,427 | | | | |
| | | | | | | | |
Sage Core Reserves ETF | | | 141,505 | | 6/30/2020 | | 2017 |
| | | | 202,791 | | 6/30/2021 | | 2018 |
| | | | 192,747 | | 6/30/2022 | | 2019 |
Total | | | 537,043 | | | | |
| | | | | | | | |
STAR Global Buy-Write ETF | | | 50,044 | | 6/30/2020 | | 2017 |
| | | | 56,242 | | 6/30/2021 | | 2018 |
| | | | 77,386 | | 6/30/2022 | | 2019 |
Total | | | 183,672 | | | | |
| | | | | | | | |
Vice ETF | | | 103,464 | | 6/30/2021 | | 2018 |
| | | | 89,372 | | 6/30/2022 | | 2019 |
Total | | | 192,836 | | | | |
132
ADVISORSHARES TRUST
Notes to Financial Statements (Continued) June30, 2019 |
3.InvestmentAdvisoryAgreementandOtherAgreements – (continued) |
Administrator,Custodian,FundAccountantandTransferAgent
The Bank of New York Mellon (‘‘BNYM’’) (in each capacity, the ‘‘Administrator’’, ‘‘Custodian’’, ‘‘Fund Accountant’’ or ‘‘Transfer Agent’’), serves as the Fund’s Administrator, Custodian, Fund Accountant and Transfer Agent pursuant to a certain Fund Administration and Accounting Agreement, a Custody Agreement or a Transfer Agency and Service Agreement, as the case may be.
DistributionandService(12b-1)Plan
Foreside Fund Services, LLC (the ‘‘Distributor’’) serves as the Fund’s distributor of Creation Units for the Fund pursuant to the distribution agreement. The Distributor does not maintain any secondary market shares. The Funds have adopted a Distribution and Service Plan (‘‘Plan’’) pursuant to Rule 12b-1 under the 1940 Act. In accordance with its Plan, each Fund is authorized to pay an amount up to 0.25% of its average daily net assets each year for certain distribution-related activities. No fees are currently paid by each Fund under the Plan, and there are no current plans to impose these fees. However, in the event Rule 12b-1 fees were charged, over time they would increase the cost of an investment in each Fund.
4. Creation and Redemption Transactions
The Funds issue and redeem shares on a continuous basis at NAV in groups of 25,000shares, at minimum, called ‘‘Creation Units.’’ Except when aggregated in Creation Units, shares are not redeemable securities of a Fund. Only ‘‘Authorized Participants’’ may purchase or redeem shares directly from each Fund. An Authorized Participant is either (i) a broker-dealer or other participant in the clearing process through the Continuous Net Settlement System of the National Securities Clearing Corporation or (ii) a DTC participant and, in each case, must have executed a Participant Agreement with the Distributor. Most retail investors will not qualify as Authorized Participants or have the resources to buy and sell whole Creation Units. Therefore, they will be unable to purchase or redeem the shares directly from the Fund. Rather, most retail investors will purchase shares in the secondary market with the assistance of a broker and will be subject to customary brokerage commissions or fees.
5.SummaryofFairValueDisclosure
The Financial Accounting Standard Board’s (‘‘FASB’’) Accounting Standards Codification (‘‘ASC’’) 820-10,Fair Value Measurements and Disclosures, defines fair value, establishes an authoritative framework for measuring fair value in accordance with generally accepted accounting principles, and expands disclosure about fair value measurements. Various inputs are used in determining the value of the Fund’s investments. These inputs are summarized in the three broad levels listed below:
• Level 1 — Unadjusted quoted prices in active markets for identical assets or liabilities that the company has the ability to access.
• Level 2 — Observable inputs other than quoted prices included in Level 1 that are observable for the asset or liability either directly or indirectly. These inputs may include quoted prices for the identical instrument on an inactive market, prices for similar instruments, interest rates, prepayment speeds, credit risk, yield curves, default rates, and similar data.
• Level 3 — Unobservable inputs for the asset or liability to the extent that relevant observable inputs are not available, representing the company’s own assumptions about the assumptions that a market participant would use in valuing the asset or liability, and that would be based on the best information available.
133
ADVISORSHARES TRUST
Notes to Financial Statements (Continued) June30, 2019 |
5.SummaryofFairValueDisclosure – (continued) |
Investments that use Level 2 or Level 3 inputs may include, but are not limited to: (i) an unlisted security related to corporate actions; (ii) a restricted security (e.g., one that may not be publicly sold without registration under the Securities Act of 1933 as amended); (iii) a security whose trading has been suspended or which has been de-listed from its primary trading exchange; (iv) a security that is thinly traded; (v) a security in default or bankruptcy proceedings for which there is no current market quotation; (vi) a security affected by currency controls or restrictions; and (vii) a security affected by a significant event (e.g., an event that occurs after the close of the markets on which the security is traded but before the time as of which a Fund’s net asset value is computed and that may materially affect the value of the Fund’s investment). Examples of events that may be ‘‘significant events’’ are government actions, natural disasters, armed conflicts and acts of terrorism. The inputs or methodology used for valuing securities are not necessarily an indication of the risk associated with investing in those securities.
For more detailed categories, see the accompanying Schedules of Investments.
6.DerivativeInstruments
The Funds have adopted authoritative standards of accounting for derivative instruments which establish enhanced disclosure requirements. These standards improve financial reporting for derivative instruments by requiring enhanced disclosures that enables investors to understand how and why a fund uses derivative instruments, how derivative instruments are accounted for and how derivative instruments affect a fund’s financial position and results of operations. The Funds use derivative instruments as part of their principal investment strategy to achieve their investment objective.
At June30, 2019, the fair values of derivative instruments were as follows:
Statements of Assets and Liabilities:
Fund: | | Asset Derivatives: | | Equity Risk |
Pure Cannabis ETF | | Unrealized Appreciation on Swaps Contracts | | $ | 59,722 |
STAR Global Buy-Write ETF | | Investments – Options Purchased | | | 17,223 |
Fund: | | Liability Derivatives: | | Equity Risk |
Pure Cannabis ETF | | Unrealized Depreciation on Swaps Contracts | | $ | (263,210 | ) |
STAR Global Buy-Write ETF | | Options Written, at value | | | (9,037 | ) |
Transactions in derivative instruments during the year ended June30, 2019, were as follows:
Statements of Operations:
Fund: | | Realized Gain (Loss): | | Equity Risk | | Credit Risk |
Pacific Asset Enhanced Floating Rate
ETF | | Swaps | | $ | — | | | $ | (10,447 | ) |
STAR Global Buy-Write ETF | | Investments – Options Purchased | | | 47,237 | | | | — | |
STAR Global Buy-Write ETF | | Options Written | | | (161,875 | ) | | | — | |
Fund: | | Change in Unrealized Gain (Loss): | | Equity Risk | | Credit Risk |
Pacific Asset Enhanced Floating Rate
ETF | | Swaps | | $ | — | | | $ | (48,964 | ) |
Pure Cannabis ETF | | Swaps | | | (203,488 | ) | | | — | |
STAR Global Buy-Write ETF | | Investments – Options Purchased | | | (12,463 | ) | | | — | |
STAR Global Buy-Write ETF | | Options Written | | | (10,266 | ) | | | — | |
134
ADVISORSHARES TRUST
Notes to Financial Statements (Continued) June30, 2019 |
6.DerivativeInstruments – (continued) |
For the year ended June30, 2019, the average volume of the derivatives opened by the Funds were as follows:
| | Pacific Asset
Enhanced
Floating
Rate ETF | | Pure
Cannabis ETF | | STAR Global Buy-Write ETF |
Long Swap Contracts | | $ | 4,000,000 | | $ | 794,300 | | $ | — |
Purchased Option Contracts | | | — | | | — | | | 570 |
Written Option Contracts | | | — | | | — | | | 4,521 |
7.FederalIncomeTax
Each Fund intends to qualify as a ‘‘regulated investment company’’ under Sub-chapter M of the Internal Revenue Code of 1986, as amended. If so qualified, the Funds will not be subject to Federal income tax to the extent it distributes substantially all of its net investment income and net capital gains to its shareholders. Accounting for Uncertainty in Income Taxes provides guidance for how uncertain tax positions should be recognized, measured, presented and disclosed in the financial statements, and requires the evaluation of tax positions taken or expected to be taken in the course of preparing a Fund’s tax returns to determine whether the tax positions are ‘‘more-likely-than-not’’ of being sustained by the applicable tax authority. Tax positions not deemed to meet the more-than-likely-than-not threshold would be recorded as a tax benefit or expense in the current year. Interest and penalty related to income taxes would be recorded as income tax expense. Management of the Funds is required to analyze all open tax years (2016 − 2019), as defined by IRS statute of limitations, for all major jurisdictions, including federal tax authorities and certain state tax authorities. As of June30, 2019, the Funds did not have a liability for any unrecognized tax benefits. The Funds have no examination in progress and is not aware of any tax positions for which it is reasonably possible that the amounts of unrecognized tax benefits will significantly change in the next twelve months.
At June30, 2019, the approximate cost of investments, excluding short positions, and net unrealized appreciation (depreciation) for federal income tax purposes was as follows:
Fund | | Cost | | Gross Unrealized Appreciation | | Gross Unrealized (Depreciation) | | Net Unrealized Appreciation (Depreciation) | | Other Derivatives Net Unrealized Appreciation (Depreciation) |
Cornerstone Small Cap ETF | | $ | 4,808,155 | | $ | 753,117 | | $ | (354,229 | ) | | $ | 398,888 | | | $ | — | |
Dorsey Wright ADR ETF | | | 100,448,059 | | | 14,634,437 | | | (629,111 | ) | | | 14,005,326 | | | | — | |
Dorsey Wright Micro-Cap ETF | | | 2,191,757 | | | 355,078 | | | (43,242 | ) | | | 311,836 | | | | — | |
Dorsey Wright Short ETF | | | 15,255,120 | | | 1,313,440 | | | (1,308,440 | ) | | | 5,000 | | | | 700,964 | |
DoubleLine Value Equity ETF | | | 58,053,532 | | | 6,318,590 | | | (2,850,883 | ) | | | 3,467,707 | | | | — | |
Focused Equity ETF | | | 13,364,290 | | | 4,064,941 | | | (170,835 | ) | | | 3,894,106 | | | | — | |
FolioBeyond Smart Core Bond ETF | | | 6,341,441 | | | 100,270 | | | (152 | ) | | | 100,118 | | | | — | |
New Tech and Media ETF | | | 19,308,786 | | | 96,029 | | | (2,088,763 | ) | | | (1,992,734 | ) | | | — | |
Newfleet Multi-Sector Income ETF | | | 74,362,992 | | | 919,423 | | | (172,320 | ) | | | 747,103 | | | | — | |
Pacific Asset Enhanced Floating Rate ETF | | | 30,884,751 | | | 176,074 | | | (348,757 | ) | | | (172,683 | ) | | | — | |
Pure Cannabis ETF | | | 87,162,846 | | | 9,342,082 | | | (14,901,470 | ) | | | (5,559,388 | ) | | | (203,493 | ) |
Ranger Equity Bear ETF | | | 117,633,857 | | | 3,531,084 | | | (3,434,084 | ) | | | 97,000 | | | | (3,291,635 | ) |
Sabretooth ETF | | | 2,585,356 | | | 168,836 | | | (101,728 | ) | | | 67,108 | | | | — | |
Sage Core Reserves ETF | | | 76,344,396 | | | 173,735 | | | (20,505 | ) | | | 153,230 | | | | — | |
STAR Global Buy-Write ETF | | | 12,469,747 | | | 2,105,435 | | | (15,795 | ) | | | 2,089,640 | | | | 6,218 | |
Vice ETF | | | 13,900,642 | | | 1,671,290 | | | (1,596,052 | ) | | | 75,238 | | | | — | |
135
ADVISORSHARES TRUST
Notes to Financial Statements (Continued) June30, 2019 |
7.FederalIncomeTax – (continued) |
At June30, 2019, the components of distributable earnings/loss on a tax basis were as follows:
Fund | | Undistributed
Ordinary
Income | | Undistributed
Long-Term
Capital Gains | | Capital Loss
Carryforward | | Timing
Differences | | Post-
October/
Late-year
Ordinary
Deferrals | | Net
Unrealized
Appreciation
(Depreciation) | | Total Earnings
(Losses) |
Cornerstone Small Cap ETF | | $ | 6,733 | | $ | — | | $ | (538,287 | ) | | $ | — | | | $ | — | | | $ | 398,888 | | | $ | (132,666 | ) |
Dorsey Wright ADR ETF | | | 2,151 | | | — | | | (48,855,142 | ) | | | — | | | | — | | | | 14,005,326 | | | | (34,847,665 | ) |
Dorsey Wright Micro-Cap ETF | | | — | | | — | | | (662,056 | ) | | | — | | | | — | | | | 311,836 | | | | (350,220 | ) |
Dorsey Wright Short ETF | | | 64,037 | | | — | | | (1,796,930 | ) | | | — | | | | — | | | | 705,964 | | | | (1,026,929 | ) |
DoubleLine Value Equity ETF | | | 411,357 | | | — | | | (31,490,284 | ) | | | — | | | | — | | | | 3,467,707 | | | | (27,611,220 | ) |
Focused Equity ETF | | | 37,303 | | | — | | | (608,053 | ) | | | — | | | | — | | | | 3,894,106 | | | | 3,323,356 | |
FolioBeyond Smart Core Bond ETF | | | 138 | | | — | | | (1,103,832 | ) | | | — | | | | — | | | | 100,118 | | | | (1,003,576 | ) |
New Tech and Media ETF | | | — | | | — | | | (13,870,090 | ) | | | — | | | | (51,498 | ) | | | (1,992,734 | ) | | | (15,914,322 | ) |
Newfleet Multi-Sector Income ETF | | | 45,480 | | | — | | | (7,958,515 | ) | | | — | | | | — | | | | 747,103 | | | | (7,165,932 | ) |
Pacific Asset Enhanced Floating Rate ETF | | | 28,796 | | | — | | | (574,369 | ) | | | — | | | | — | | | | (172,683 | ) | | | (718,256 | ) |
Pure Cannabis ETF | | | 413,958 | | | — | | | — | | | | — | | | | — | | | | (5,762,881 | ) | | | (5,348,923 | ) |
Ranger Equity Bear ETF | | | — | | | — | | | (254,902,855 | ) | | | — | | | | — | | | | (3,194,635 | ) | | | (258,097,490 | ) |
Sabretooth ETF | | | — | | | — | | | (47,916 | ) | | | — | | | | (4,104 | ) | | | 67,108 | | | | 15,088 | |
Sage Core Reserves ETF | | | 34,018 | | | — | | | (250,967 | ) | | | — | | | | — | | | | 153,230 | | | | (63,719 | ) |
STAR Global Buy-Write ETF | | | 67,957 | | | — | | | (223,644 | ) | | | (720,105 | ) | | | — | | | | 2,095,858 | | | | 1,220,066 | |
Vice ETF | | | 148,230 | | | — | | | (527,403 | ) | | | — | | | | — | | | | 75,238 | | | | (303,935 | ) |
The differences between book and tax basis components of net assets are primarily attributed to wash sale loss deferrals and other book/tax differences.
At June30, 2019, the effect of permanent book/tax reclassifications resulted in increases/(decreases) to the components of net assets as follows:
Fund | | Distributable
Earnings (Loss) | | Paid-in Capital |
Cornerstone Small Cap ETF | | $ | (576,734 | ) | | $ | 576,734 | |
Dorsey Wright ADR ETF | | | (4,348,840 | ) | | | 4,348,840 | |
Dorsey Wright Micro-Cap ETF | | | (8,264 | ) | | | 8,264 | |
Dorsey Wright Short ETF | | | (1,788 | ) | | | 1,788 | |
DoubleLine Value Equity ETF | | | (724,161 | ) | | | 724,161 | |
Focused Equity ETF | | | — | | | | — | |
FolioBeyond Smart Core Bond ETF | | | (15,102 | ) | | | 15,102 | |
New Tech and Media ETF | | | (303,141 | ) | | | 303,141 | |
Newfleet Multi-Sector Income ETF | | | — | | | | — | |
Pacific Asset Enhanced Floating Rate ETF | | | (23 | ) | | | 23 | |
Pure Cannabis ETF | | | 3,577 | | | | (3,577 | ) |
Ranger Equity Bear ETF | | | 231,421 | | | | (231,421 | ) |
Sabretooth ETF | | | (219,693 | ) | | | 219,693 | |
Sage Core Reserves ETF | | | — | | | | — | |
STAR Global Buy-Write ETF | | | (460,441 | ) | | | 460,441 | |
Vice ETF | | | 230,549 | | | | (230,549 | ) |
For financial reporting purposes, capital accounts are adjusted to reflect the tax character of permanent book/tax differences. Reclassifications are primarily due to the tax treatment of net operating losses and distributions reclassifications.
136
ADVISORSHARES TRUST
Notes to Financial Statements (Continued) June30, 2019 |
7.FederalIncomeTax – (continued) |
The tax character of distributions paid during the fiscal years ended June30, 2019 and 2018 were as follows:
Fund | | 2019 Ordinary
Income | | 2019 Long Term
Capital Gains | | 2018 Ordinary
Income | | 2018 Long Term
Capital Gains |
Cornerstone Small Cap ETF | | $ | 6,840 | | $ | — | | $ | 87,198 | | $ | 13,880 |
Dorsey Wright ADR ETF | | | 669,735 | | | — | | | 1,740,860 | | | — |
Dorsey Wright Short ETF | | | 17,152 | | | — | | | — | | | — |
DoubleLine Value Equity ETF | | | 830,880 | | | — | | | 815,430 | | | — |
Focused Equity ETF | | | 170,257 | | | 167,315 | | | 38,174 | | | — |
FolioBeyond Smart Core Bond ETF | | | 659,376 | | | — | | | 631,268 | | | — |
Newfleet Multi-Sector Income ETF | | | 3,385,118 | | | — | | | 5,480,339 | | | — |
Pacific Asset Enhanced Floating RateETF | | | 1,256,592 | | | — | | | 932,851 | | | — |
Sage Core Reserves ETF | | | 1,508,500 | | | — | | | 1,031,706 | | | — |
STAR Global Buy-Write ETF | | | 64,625 | | | — | | | — | | | — |
Vice ETF | | | 193,320 | | | — | | | 13,431 | | | — |
Under current tax regulations, capital losses on securities transactions realized after October 31 (‘‘Post-October Losses’’) may be deferred and treated as occurring on the first business day of the following fiscal year. Under the recently enacted Regulated Investment Company Modernization Act of 2010, the Funds will be permitted to defer taxable ordinary income losses incurred after December 31 and treat as occurring on the first business day of the following fiscal year. Post-October losses and ordinary income losses deferred to July1, 2019 are as follows:
Fund | | Late Year Ordinary Loss Deferral | | Short-Term Capital
Post-October Loss | | Long-Term Capital
Post-October Loss |
New Tech and Media ETF | | $ | 51,498 | | $ | — | | $ | — |
Sabretooth ETF | | | 4,104 | | | — | | | — |
137
ADVISORSHARES TRUST
Notes to Financial Statements (Continued) June30, 2019 |
7.FederalIncomeTax – (continued) |
The following Funds have capital loss carryforwards available to offset future realized gains of:
Fund | | Short-Term
No Expiration | | Long-Term
No Expiration | | Total |
Cornerstone Small Cap ETF | | $ | 538,287 | | $ | — | | $ | 538,287 |
Dorsey Wright ADR ETF | | | 48,855,142 | | | — | | | 48,855,142 |
Dorsey Wright Micro-Cap ETF | | | 662,056 | | | — | | | 662,056 |
Dorsey Wright Short ETF | | | 1,796,930 | | | — | | | 1,796,930 |
DoubleLine Value Equity ETF | | | 31,105,852 | | | 384,432 | | | 31,490,284 |
Focused Equity ETF | | | 258,620 | | | 349,433 | | | 608,053 |
FolioBeyond Smart Core Bond ETF | | | 378,665 | | | 725,167 | | | 1,103,832 |
New Tech and Media ETF | | | 13,870,090 | | | — | | | 13,870,090 |
Newfleet Multi-Sector Income ETF | | | 1,899,664 | | | 6,058,851 | | | 7,958,515 |
Pacific Asset Enhanced Floating Rate ETF | | | 207,813 | | | 366,556 | | | 574,369 |
Ranger Equity Bear ETF | | | 254,695,639 | | | 207,216 | | | 254,902,855 |
Sabretooth ETF | | | 47,916 | | | — | | | 47,916 |
Sage Core Reserves ETF | | | 128,809 | | | 122,158 | | | 250,967 |
STAR Global Buy-Write ETF | | | — | | | 223,644 | | | 223,644 |
Vice ETF | | | 406,525 | | | 120,878 | | | 527,403 |
The following Funds utilized capital loss carryforwards to offset taxable gains realized during the year ended June30, 2019:
Fund | | Utilized Amount |
Sage Core Reserves ETF | | $ | 69,817 |
STAR Global Buy-Write ETF | | | 269,019 |
8. Investment Transactions
Purchases and sales of investments and securities sold short (excluding short term securities) for the year ended June30, 2019 were as follows:
| | Purchases | | Sales |
Fund | | Long Term | | U.S.
Government | | In-Kind | | Long Term | | U.S.
Government | | In-Kind |
Cornerstone Small Cap ETF | | $ | 4,814,592 | | $ | — | | $ | 2,821,951 | | $ | 5,364,109 | | $ | — | | $ | 2,209,499 |
Dorsey Wright ADR ETF | | | 173,400,979 | | | — | | | 10,097,552 | | | 173,560,090 | | | — | | | 125,854,783 |
Dorsey Wright Micro-Cap ETF | | | 2,450,051 | | | — | | | 4,097,087 | | | 2,426,933 | | | — | | | 1,493,136 |
Dorsey Wright Short ETF | | | 49,133,698 | | | — | | | — | | | 70,590,116 | | | — | | | — |
DoubleLine Value Equity ETF | | | 157,899,305 | | | — | | | — | | | 158,201,529 | | | — | | | 31,608,380 |
Focused Equity ETF | | | 2,805,201 | | | — | | | 1,519,399 | | | 3,022,631 | | | — | | | — |
FolioBeyond Smart Core Bond ETF | | | 22,864,306 | | | — | | | — | | | 22,594,642 | | | — | | | 12,639,424 |
New Tech and Media ETF | | | 499,921,243 | | | — | | | 10,067,169 | | | 493,585,263 | | | — | | | 29,140,229 |
Newfleet Multi-Sector Income ETF | | | 44,062,735 | | | — | | | — | | | 121,331,130 | | | — | | | — |
Pacific Asset Enhanced Floating RateETF | | | 21,040,109 | | | — | | | — | | | 18,858,847 | | | — | | | — |
Pure Cannabis ETF | | | 9,309,211 | | | — | | | 61,298,492 | | | 12,744,985 | | | — | | | — |
Ranger Equity Bear ETF | | | 637,062,823 | | | — | | | — | | | 606,877,651 | | | — | | | — |
Sabretooth ETF | | | 649,189 | | | — | | | 6,198,960 | | | 602,918 | | | — | | | 3,831,716 |
Sage Core Reserves ETF | | | 52,323,509 | | | — | | | — | | | 44,521,867 | | | 523,870 | | | — |
STAR Global Buy-Write ETF | | | 7,105,971 | | | — | | | — | | | 8,059,435 | | | — | | | 2,889,513 |
Vice ETF | | | 10,540,728 | | | — | | | 2,086,112 | | | 9,978,757 | | | — | | | 1,848,210 |
138
ADVISORSHARES TRUST
Notes to Financial Statements (Continued) June30, 2019 |
| |
9. Risks Involved with Investing in the Funds
The Funds are subject to the principal risks described below, some or all of these risks may adversely affect the Funds’ NAV, trading price, yield, total return and ability to meet its investment objective. As with any investment, an investment in each Fund could result in a loss or the performance of each Fund could be inferior to that of other investments.
Credit Risk
Credit risk is the risk that an issuer or guarantor of debt instruments or the counterparty to a financial transaction, including derivatives contracts, repurchase agreements or loans of portfolio securities, is unable or unwilling to make timely interest and/or principal payments or to otherwise honor its obligations. The Fund’s, and its affiliates, manage counterparty credit risk by entering into transactions only with counterparties that they believe have the financial resources to honor their obligations and by monitoring the financial stability of those counterparties. Financial assets, which potentially expose the Funds to issuer and counterparty credit risks, consist principally of financial instruments and receivables due from counterparties. The extent of each Fund’s exposure to credit and counterparty risks with respect to those financial assets is approximated by their value recorded in its Statements of Assets and Liabilities. High yield securities may also be subject to greater levels of credit or default risk than higher-rated securities and high yield securities may be less liquid and more difficult to sell at an advantageous time or price or to value than higher-rated securities. In particular, high yield securities are often issued by smaller, less creditworthy companies or by highly leveraged (indebted) companies, which are generally less able than more financially stable companies to make scheduled payments of interest and principal.
Fund of Funds Risk
Some of the Funds’ investment performance, because they are fund of funds, depends on the investment performance of the Underlying ETFs in which they invest. An investment in these Funds is subject to the risk associated with the Underlying ETFs that comprise their Underlying Index. The Funds will indirectly pay a proportional share of the asset-based fees, if any, of the Underlying ETFs in which they invest.
Liquidity Risk
In certain circumstances, it may be difficult for the Fund to purchase and sell particular investments within a reasonable time at a fair price. To the extent that there is not an established retail market for instruments in which the Fund may invest, trading in such instruments may be relatively inactive.
Trading in shares may be halted because of market conditions or for reasons that, in the view of the Exchange, make trading in shares inadvisable. In addition, trading in shares is subject to trading halts caused by extraordinary market volatility pursuant to ‘‘circuit breaker’’ rules. There can be no assurance that the requirements necessary to maintain the listing of the shares of the Fund will continue to be met or will remain unchanged.
139
ADVISORSHARES TRUST
Notes to Financial Statements (Continued) June30, 2019 |
9. Risks Involved with Investing in the Funds – (continued) |
Market Risk
Investments in securities, in general, are subject to market risks that may cause their prices to fluctuate over time. The Fund’s investments may decline in value due to factors affecting securities markets generally, or particular countries, segments, economic sectors, industries or companies within those markets. The value of a security held in a short position may increase due to general economic and market conditions which are not specifically related to a particular issuer, such as real or perceived positive economic conditions or changes in interest or currency rates. Because the market value ofETF shares may differ from their net asset value, the shares may trade at a premium or discount. An investment in the Fund may lose money.
New Fund Risk
Some of the Funds are new funds. As new funds, there can be no assurance that the Funds will grow to or maintain an economically viable size, in which case the Funds may experience greater tracking error to their Underlying Index than it otherwise would be at higher asset levels or it could ultimately liquidate.
Cannabis-Related Company Risk
Cannabis-related companies are subject to various laws and regulations that may differ at the state/local and federal level. These laws and regulations may (i) significantly affect a cannabis-related company’s ability to secure financing, (ii) impact the market for marijuana industry sales and services, and (iii) set limitations on marijuana use, production, transportation, and storage. Cannabis-related companies may also be required to secure permits and authorizations from government agencies to cultivate or research marijuana. In addition, cannabis-related companies are subject to the risks associated with the greater agricultural industry, including changes to or trends that affect commodity prices, labor costs, weather conditions, and laws and regulations related to environmental protection, health and safety. Cannabis-related companies may also be subject to risks associated with the biotechnology and pharmaceutical industries. These risks include increased government regulation, the use and enforcement of intellectual property rights and patents, technological change and obsolescence, product liability lawsuits, and the risk that research and development may not necessarily lead to commercially successful products.
10. Subsequent Events
The Funds have evaluated subsequent events through the issuance of the financial statements and determined that no events have occurred that require additional disclosure.
140
ADVISORSHARES TRUST
Notes to Financial Statements (Continued) June30, 2019 |
| |
11. Unaudited Tax Information
Qualified Dividend Income — Certain dividends paid by the Funds may be subject to a minimum tax rate of 15%, as provided by the Jobs and Growth Tax Relief Reconciliation Act of 2003. The percentage of ordinary income distributions for the year ended June30, 2019, taxed at a minimum rate of 15% were as follows:
Fund | | Percentage |
Cornerstone Small Cap ETF | | 100.00 | % |
Dorsey Wright ADR ETF | | 100.00 | |
Dorsey Wright Micro-Cap ETF | | 0.00 | |
Dorsey Wright Short ETF | | 0.00 | |
DoubleLine Value Equity ETF | | 100.00 | |
Focused Equity ETF | | 93.11 | |
FolioBeyond Smart Core Bond ETF | | 23.78 | |
New Tech and Media ETF | | 0.00 | |
Newfleet Multi-Sector Income ETF | | 0.00 | |
Pacific Asset Enhanced Floating Rate ETF | | 0.00 | |
Pure Cannabis ETF | | 0.00 | |
Ranger Equity Bear ETF | | 0.00 | |
Sabretooth ETF | | 0.00 | |
Sage Core Reserves ETF | | 0.00 | |
STAR Global Buy-Write ETF | | 100.00 | |
Vice ETF | | 100.00 | |
Dividends Received Deduction — For corporate shareholders, the percentage of ordinary income distributions for the year ended June30, 2019 that qualifies for the dividends received deduction were as follows:
Fund | | Percentage |
Cornerstone Small Cap ETF | | 100.00 | % |
Dorsey Wright ADR ETF | | 0.00 | |
Dorsey Wright Micro-Cap ETF | | 0.00 | |
Dorsey Wright Short ETF | | 0.00 | |
DoubleLine Value Equity ETF | | 100.00 | |
Focused Equity ETF | | 93.11 | |
FolioBeyond Smart Core Bond ETF | | 19.79 | |
New Tech and Media ETF | | 0.00 | |
Newfleet Multi-Sector Income ETF | | 0.00 | |
Pacific Asset Enhanced Floating Rate ETF | | 0.00 | |
Pure Cannabis ETF | | 0.00 | |
Ranger Equity Bear ETF | | 0.00 | |
Sabretooth ETF | | 0.00 | |
Sage Core Reserves ETF | | 0.00 | |
STAR Global Buy-Write ETF | | 100.00 | |
Vice ETF | | 85.85 | |
141
ADVISORSHARES TRUST
Notes to Financial Statements (Continued) June30, 2019 |
11. Unaudited Tax Information – (continued) |
Qualified Interest Income — For nonresident alien shareholders, the percentage of ordinary income distributions for the year ended June30, 2019 that qualified interest income were as follows:
Fund | | Percentage |
Cornerstone Small Cap ETF | | 0.00 | % |
Dorsey Wright ADR ETF | | 0.00 | |
Dorsey Wright Micro-Cap ETF | | 0.00 | |
Dorsey Wright Short ETF | | 0.00 | |
DoubleLine Value Equity ETF | | 0.00 | |
Focused Equity ETF | | 0.00 | |
FolioBeyond Smart Core Bond ETF | | 44.98 | |
New Tech and Media ETF | | 0.00 | |
Newfleet Multi-Sector Income ETF | | 96.59 | |
Pacific Asset Enhanced Floating Rate ETF | | 98.13 | |
Pure Cannabis ETF | | 0.00 | |
Ranger Equity Bear ETF | | 0.00 | |
Sabretooth ETF | | 0.00 | |
Sage Core Reserves ETF | | 99.43 | |
STAR Global Buy-Write ETF | | 0.00 | |
Vice ETF | | 0.00 | |
The following Funds intend to elect to pass through to shareholders the credit for taxes paid to foreign countries. The gross foreign source income and foreign taxes paid were as follows:
Fund | | Foreign Taxes
Paid | | Gross Foreign
Income |
Cornerstone Small Cap ETF | | $ | — | | $ | — |
Dorsey Wright ADR ETF | | | 125,858 | | | 1,986,954 |
Dorsey Wright Micro-Cap ETF | | | — | | | — |
Dorsey Wright Short ETF | | | — | | | — |
DoubleLine Value Equity ETF | | | — | | | — |
Focused Equity ETF | | | — | | | — |
FolioBeyond Smart Core Bond ETF | | | — | | | — |
New Tech and Media ETF | | | — | | | — |
Newfleet Multi-Sector Income ETF | | | — | | | — |
Pacific Asset Enhanced Floating Rate ETF | | | — | | | — |
Pure Cannabis ETF | | | — | | | — |
Ranger Equity Bear ETF | | | — | | | — |
Sabretooth ETF | | | — | | | — |
Sage Core Reserves ETF | | | — | | | — |
STAR Global Buy-Write ETF | | | 3,792 | | | 51,445 |
Vice ETF | | | — | | | — |
142
REPORT OF INDEPENDENT REGISTERED PUBLIC ACCOUNTING FIRM |
To the Shareholders and Board of Trustees of AdvisorShares Trust
Opinion on the Financial Statements
We have audited the accompanying statements of assets and liabilities of Cornerstone Small Cap ETF, Dorsey Wright ADR ETF, Dorsey Wright Micro-Cap ETF, Dorsey Wright Short ETF, DoubleLine Value Equity (formerly known as Wilshire Buyback ETF), Focused Equity ETF, FolioBeyond Smart Core Bond ETF (formerly known as Madrona Global Bond ETF), New Tech and Media ETF, Newfleet Multi-Sector Income ETF, Pacific Asset Enhanced Floating Rate ETF, Pure Cannabis ETF, Ranger Equity Bear ETF, Sabretooth ETF, Sage Core Reserves ETF, STAR Global Buy-Write ETF, and Vice ETF (the “Funds”), each a series of AdvisorShares Trust (the “Trust”), including the schedules of investments, as of June30, 2019, the related statements of operations, the statements of changes in net assets and financial highlights for the periods indicated thereon, and the related notes (collectively referred to as the “financial statements”). In our opinion, the financial statements present fairly, in all material respects, the financial position of the Funds as of June30, 2019, the results of their operations, the changes in their net assets, and their financial highlights for the periods indicated thereon, in conformity with accounting principles generally accepted in the United States of America.
Basis for Opinion
These financial statements are the responsibility of the Funds’ management. Our responsibility is to express an opinion on the Funds’ financial statements based on our audits. We are a public accounting firm registered with the Public Company Accounting Oversight Board (United States) (“PCAOB”) and are required to be independent with respect to the Funds in accordance with the U.S. federal securities laws and the applicable rules and regulations of the Securities and Exchange Commission and the PCAOB. We have served as the auditor of one or more of the funds in the Trust since 2009.
We conducted our audits in accordance with the standards of the PCAOB. Those standards require that we plan and perform the audits to obtain reasonable assurance about whether the financial statements are free of material misstatement, whether due to error or fraud. The Funds are not required to have, nor were we engaged to perform, an audit of the Funds’ internal control over financial reporting. As part of our audits we are required to obtain an understanding of internal control over financial reporting, but not for the purpose of expressing an opinion on the effectiveness of the Funds’ internal control over financial reporting. Accordingly, we express no such opinion.
Our audits included performing procedures to assess the risks of material misstatement of the financial statements, whether due to error or fraud, and performing procedures that respond to those risks. Such procedures included examining, on a test basis, evidence regarding the amounts and disclosures in the financial statements. Our audits also included evaluating the accounting principles used and significant estimates made by management, as well as evaluating the overall presentation of the financial statements. Our procedures included confirmation of securities owned as of June30, 2019 by correspondence with the custodian, agent banks and brokers; when replies were not received, we performed other auditing procedures. We believe that our audits provide a reasonable basis for our opinion.
| | TAIT, WELLER & BAKER LLP |
Philadelphia, Pennsylvania | | |
August 26, 2019 | | |
143
BOARD REVIEW OF INVESTMENT ADVISORY AND SUB-ADVISORY AGREEMENTS |
Renewal of the Advisory Agreement for Each Fund and the Sub-Advisory Agreement for the AdvisorShares Newfleet Multi-Sector Income ETF, AdvisorShares Sage Core Reserves ETF, AdvisorShares New Tech and Media ETF, and AdvisorShares Cornerstone Small Cap ETF
At meetings of the Board of Trustees (the “Board”) of AdvisorShares Trust (the “Trust”) held on February20, 2019 and May16, 2019, the Board, including those trustees who are not “interested persons” of the Trust, as that term is defined in the Investment Company Act of 1940 (the “1940 Act”) (the “Independent Trustees”), considered the approval of the renewal of (a) separate sub-advisory agreements (collectively, the “Sub-Advisory Agreements”) between AdvisorShares Investments, LLC (the “Advisor”) and (1) Newfleet Asset Management, on behalf of the AdvisorShares Newfleet Multi-Sector Income ETF, (2) Sage Advisory Services Ltd. Co., on behalf of the AdvisorShares Sage Core Reserves ETF, (3) Sabretooth Advisors, LLC, relating to the AdvisorShares New Tech and Media ETF, and (4) Cornerstone Investment Partners, LLC, relating to the AdvisorShares Cornerstone Small Cap ETF (collectively, the “Sub-Advisors”), pursuant to which the Sub-Advisors perform portfolio management and related services, and (b) the investment advisory agreement between the Advisor and the Trust (together with the Sub-Advisory Agreements, the “Advisory Agreements”), on behalf of each series of the Trust (each a “Fund” and, collectively, the “Funds”).
Pursuant to Section 15 of the 1940 Act, to continue after their initial two-year term, the Advisory Agreements must be approved annually: (i) by the vote of the Board or by a vote of the shareholders of the Funds and (ii) by the vote of a majority of the Independent Trustees cast in person at a meeting called for the purpose of voting on such approval. Each year, the Board calls and holds meetings to decide whether to renew the Advisory Agreements for an additional one-year term. In preparation for the meetings, the Board requests and reviews a wide variety of information from the Advisor and Sub-Advisors. The Board uses this information, as well as other information that the Advisor, Sub-Advisors and other service providers may submit to the Board at the meetings and over the course of the prior year, to help decide whether to renew the Advisory Agreements for an additional year.
As discussed in further detail below, prior to the meetings, the Board, including the Independent Trustees, reviewed written materials from the Advisor and each Sub-Advisor regarding, among other things: (i) the nature, extent and quality of the services provided by the Advisor and each Sub-Advisor; (ii) the performance of its duties with respect to personnel and operations of each Sub-Advisor; (iii) the investment performance of each Fund; (iv) the costs of the services provided and profits and other benefits realized by the Advisor, each Sub-Advisor, and any affiliates from the relationship with each Fund; (v) the extent to which economies of scale would be realized as each Fund grows; and (vi) whether fee levels reflect the sharing of these economies of scale for the benefit of each Fund’s shareholders.
At the meetings, the Board was presented with additional information to help it evaluate the Advisor’s and each Sub-Advisor’s fee and other aspects of the Advisory Agreements. The Board received an overview of the Advisor’s and each Sub-Advisor’s operations and management of the Funds, including comparative fee data and profitability analysis for each Fund, and was also provided with information with respect to compliance oversight. The Board reviewed the management of each Fund, including the Fund’s strategy, the focus in the markets, the Fund’s positioning in the market, and its attractive and unique offering. The Board reviewed the Advisor’s and each Sub-Advisor’s overall business generally, including any noteworthy personnel changes.
The Board deliberated on the renewal of the Advisory Agreements in light of the written materials that it received before the meetings, information it received at the meetings, and information it had received at prior board meetings. In its deliberations, the Board considered the factors and reached the conclusions described below relating to the selection of the Advisor and each Sub-Advisor and the renewal of each Advisory Agreement. The Board did not identify any single piece of information discussed below that was paramount, controlling or determinative of its decision.
144
BOARD REVIEW OF INVESTMENT ADVISORY AND SUB-ADVISORY AGREEMENTS (Continued) |
Nature, Extent and Quality of Services.In considering the nature, extent and quality of the services provided by the Advisor and each Sub-Advisor, the Board reviewed the services provided to each Fund by the Advisor and applicable Sub-Advisor, noting that these services include, among other things, furnishing a continuous investment program for the Fund, including arranging for, or implementing, the purchase and sale of portfolio securities, the provision of related services, such as portfolio management compliance services, and the preparation and filing of certain reports on behalf of the Trust. The Trustees reviewed the extensive responsibilities that the Advisor has as investment advisor to each Fund, including the oversight of the activities and operations of the Sub-Advisors, as applicable, and other service providers, oversight of general fund compliance with federal and state laws, and the implementation of Board directives as they relate to the Funds. The Board also considered, among other things, the professional experience and qualifications of the senior management and key professional personnel of the Advisor and Sub-Advisors, including those individuals responsible for portfolio management. The Board also considered the Advisor’s and Sub-Advisors’ operational capabilities and resources and their experience in managing investment portfolios. The most recent Form ADV for the Advisor and each Sub-Advisor was provided to the Board, as were responses to a detailed series of questions that, among other things, requested information about their business, services, and compensation. Based on its review, within the context of its full deliberations, the Board determined that it was satisfied with the nature, extent and quality of the services provided to the Funds by the Advisor and each Sub-Advisor.
Performance of the Funds. The Board was provided with information regarding each Fund’s performance for various periods, as well as comparative performance information. The Advisor and each Sub-Advisor provided information regarding factors impacting the performance of the Funds, outlining current market conditions, and explaining its expectations and strategies for the future. Based on this information, the Board concluded that it was satisfied with the investment results that the Advisor and each Sub-Advisor had been able to achieve for its respective Fund.
Cost of Advisory Services and Profitability.In considering whether the advisory and sub-advisory fees payable with respect to each Fund were reasonable, the Board reviewed the advisory fees paid by each Fund to the Advisor, the sub-advisory fees paid by the Advisor to each Sub-Advisor, the fees waived and/or expenses reimbursed by the Advisor and each Sub-Advisor over the period, the costs and other expenses incurred by the Advisor and each Sub-Advisor in providing advisory services, and the profitability analysis with respect to each Fund. In discussing the fee arrangements between the Advisor and each Sub-Advisor, the Board noted that the Advisor pays each Sub-Advisor out of the advisory fee it receives from the respective Fund. The Board also reviewed information provided by the Advisor comparing the advisory fees paid by each Fund to those paid by comparable funds. The Board also considered the Advisor’s contractual arrangement to waive its advisory fee and/or reimburse expenses in an effort to control the expense ratios of the Funds. Based on its review, in the context of its full deliberations, the Board concluded for each Fund that the advisory fees appear to be reasonable in light of the services rendered.
Economies of Scale.The Board considered for each Fund whether economies of scale were realized, noting any fee waivers and/or expense reimbursements by the Advisor and Sub-Advisors and whether the Advisor’s and/or Sub-Advisors’ fees included breakpoints. The Board determined to continue to assess on an ongoing basis whether the advisory fees appropriately took into account any economies of scale that had been realized as a result of any significant asset growth of the Funds.
Ancillary Benefits.The Board noted the potential benefits to be received by the Advisor and each Sub-Advisor as a result of its relationship with a Fund (other than the advisory or sub-advisory fee), including the intangible benefits of its association with the Trust generally and any favorable publicity arising in connection with a Fund’s performance.
Conclusion.Based on its deliberations and evaluation of the information described above, the Board, including the Independent Trustees, unanimously: (i) concluded that the terms of each Advisory Agreement are fair and reasonable; (ii) concluded that the Advisor’s fees are reasonable in light of
145
BOARD REVIEW OF INVESTMENT ADVISORY AND SUB-ADVISORY AGREEMENTS (Continued) |
the services that it provides to the Funds; (iii) concluded that each Sub-Advisor’s fees are reasonable in light of the services that it provides to its respective Fund; and (iv) agreed to renew each Advisory Agreement for another year.
Approval of the Advisory and Sub-Advisory Agreements for
AdvisorShares Sabretooth ETF
At a meeting held on August14, 2018, the Board, including the Independent Trustees, considered the approval of the investment advisory agreement (the “Advisory Agreement”) between the Trust and the Advisor on behalf of the AdvisorShares Sabretooth ETF (the “Fund”). The Board noted that the Advisor provides investment advisory services to the other series of the Trust and that an annual in-depth review of the Advisor with respect to those series had recently been conducted in May 2018. The Board also considered the approval of a separate sub-advisory agreement (the “Sub-Advisory Agreement” and collectively with the Advisory Agreement, the “Agreements”) between the Advisor and Sabretooth Advisors, LLC (the “Sub-Advisor”), on behalf of the Fund, pursuant to which the Sub-Advisor would perform portfolio management and related services for the Fund. The Board noted that the Sub-Advisor provides investment sub-advisory services to another series of the Trust and that the Board had conducted an in-depth review of the Sub-Advisor at its May 2017 meeting in connection with its initial approval of the Sub-Advisor for that series, and has received ongoing information relating to the Sub-Advisor since that series’ launch.
In connection with its consideration of the Agreements, the Board, including the Independent Trustees, requested, received and evaluated materials from the Advisor and Sub-Advisor about the Agreements and the services proposed to be provided thereunder, including information about the key features of the Fund and related matters. The Board also reviewed information regarding the proposed investment advisory fee rates and various other materials that it considered relevant to its consideration and approval of the proposed agreements.
In considering each of the Agreements, the Board considered and discussed information and analysis provided by the Advisor and Sub-Advisor. In its deliberations, the Board did not identify any single piece of information that was paramount or controlling and individual trustees may have attributed different weights to various factors.
Nature, Extent and Quality of Services.In considering the nature, extent and quality of the services to be provided by the Advisor and Sub-Advisor to the Fund, the Board reviewed the services to be provided by the Advisor and Sub-Advisor, noting that these services include, among other things, furnishing a continuous investment program for the Fund, including arranging for, or implementing, the purchase and sale of portfolio securities, the provision of related services such as portfolio management compliance services, and the preparation and filing of certain reports on behalf of the Trust. The Trustees reviewed the extensive responsibilities that the Advisor will have as investment advisor to the Fund, including the oversight of the activities and operations of the Sub-Advisor and other service providers, oversight of general fund compliance with federal and state laws, and the implementation of Board directives as they relate to the Fund. The Board also considered, among other things, the professional experience and qualifications of the senior management and key professional personnel of the Advisor and Sub-Advisor, including those individuals responsible for portfolio management. The Board also considered the Advisor’s and Sub-Advisor’s operational capabilities and resources and their experience in managing investment portfolios. The Board concluded that, within the context of its full deliberations, it was satisfied with the nature, extent and quality of the services expected to be provided to the Fund by the Advisor and the Sub-Advisor.
Performance. In connection with the assessment of the ability of each of the Advisor and Sub-Advisor to perform its duties under its Agreement, the Board considered its investment performance and experience generally and whether it has the resources necessary to carry out its functions. The Board concluded that each of the Advisor and Sub-Advisor has the resources necessary to perform its obligations under its Agreement.
146
BOARD REVIEW OF INVESTMENT ADVISORY AND SUB-ADVISORY AGREEMENTS (Continued) |
Cost of Services and Profitability.The Board considered the cost of the services to be provided by the Advisor and Sub-Advisor, reviewed the fees to be paid pursuant to the Agreements, and considered the estimated profitability projected by each of the Advisor and Sub-Advisor from its relationship with the Fund. In addition, the Board discussed the fee arrangement between the Advisor and Sub-Advisor, noting that the Advisor would pay the Sub-Advisor out of the advisory fee it receives from the Fund. The Board also reviewed information provided by the Advisor regarding advisory fees of comparable funds, and evaluated the proposed fee arrangements in light of this information and the factors that judicial decisions have specified as pertinent generally. The Board also considered the Advisor’s contractual arrangement to waive its advisory fee and/or reimburse expenses in an effort to control the expense ratios of the Fund. Based on its review, within the context of its full deliberations, the Board determined that the fees proposed to be paid to the Advisor and Sub-Advisor appear to be reasonable in light of the services to be provided.
Economies of Scale. The Board considered the potential for economies of scale and determined that it would reconsider this factor at an appropriate time in the future. In the event there were to be significant asset growth in the Fund, the Board determined to reassess whether the investment advisory and sub-advisory fees appropriately took into account any economies of scale that had been realized as a result of that growth. The Board also considered the Advisor’s willingness to enter into a contractual expense limitation agreement for the Fund, noting that this would protect shareholders from high operational costs.
Ancillary Benefits.The Board noted the potential benefits to be received by each of the Advisor and Sub-Advisor as a result of its relationship with the Fund (other than the advisory or sub-advisory fee), including the intangible benefits of its association with the Trust generally and any favorable publicity arising in connection with the Fund’s performance.
Conclusion. Based on its deliberations and evaluation of the information described above, the Board, including the Independent Trustees, unanimously: (i) concluded that the terms of the Agreements are fair and reasonable; (ii) concluded that the fee to be paid to the Advisor is fair and reasonable in light of the services that it will provide to the Fund; (iii) concluded that the fee to be paid to the Sub-Advisor is fair and reasonable in light of the services that the Sub-Advisor will provide to the Fund; and (iv) agreed to approve each of the Agreements for an initial term of two years.
Approval of the Advisory Agreement for AdvisorShares Pure Cannabis ETF
At a meeting held on February20, 2019, the Board, including the Independent Trustees, considered the approval of the investment advisory agreement (the “Advisory Agreement”) between the Trust and the Advisor on behalf of the AdvisorShares Pure Cannabis ETF (the “Fund”). The Board noted that the Advisor provides investment advisory services to the other series of the Trust and that an annual in-depth review of the Advisor with respect to those series had recently been conducted in May 2018.
In connection with its consideration of the Advisory Agreement, the Board, including the Independent Trustees, requested, received and evaluated materials from the Advisor about the services proposed to be provided thereunder, including information about the key features of the Fund and related matters. The Board also reviewed information regarding the proposed investment advisory fee rate and various other materials that it considered relevant to its consideration and approval of the proposed agreement.
In considering the Advisory Agreement, the Board considered and discussed information and analysis provided by the Advisor. In its deliberations, the Board did not identify any single piece of information that was paramount or controlling and individual trustees may have attributed different weights to various factors.
147
BOARD REVIEW OF INVESTMENT ADVISORY AND SUB-ADVISORY AGREEMENTS (Continued) |
Nature, Extent and Quality of Services. In considering the nature, extent and quality of the services to be provided by the Advisor to the Fund, the Board reviewed the services to be provided by the Advisor, noting that these services include, among other things, furnishing a continuous investment program for the Fund, including arranging for, or implementing, the purchase and sale of portfolio securities, the provision of related services such as portfolio management compliance services, and the preparation and filing of certain reports on behalf of the Trust. The Trustees reviewed the extensive responsibilities that the Advisor will have as investment advisor to the Fund, including the oversight of service providers, oversight of general fund compliance with federal and state laws, and the implementation of Board directives as they relate to the Fund. The Board also considered, among other things, the professional experience and qualifications of the senior management and key professional personnel of the Advisor, including those individuals responsible for portfolio management. The Board also considered the Advisor’s operational capabilities and resources and its experience in managing investment portfolios. The Board concluded that, within the context of its full deliberations, it was satisfied with the nature, extent and quality of the services expected to be provided to the Fund by the Advisor.
Performance. In connection with the assessment of the ability of the Advisor to perform its duties under the Advisory Agreement, the Board considered its investment performance and experience generally and whether it has the resources necessary to carry out its functions. The Board concluded that the Advisor has the resources necessary to perform its obligations under the Advisory Agreement.
Cost of Services and Profitability. The Board considered the cost of the services to be provided by the Advisor, reviewed the fee to be paid pursuant to the Advisory Agreement, and considered the estimated profitability projected by the Advisor from its relationship with the Fund. The Board also reviewed information provided by the Advisor regarding advisory fees of comparable funds, and evaluated the proposed fee arrangement in light of this information and the factors that judicial decisions have specified as pertinent generally. The Board also considered the Advisor’s contractual arrangement to waive its advisory fee and/or reimburse expenses in an effort to control the expense ratio of the Fund. Based on its review, within the context of its full deliberations, the Board determined that the fee proposed to be paid to the Advisor appears to be reasonable in light of the services to be provided.
Economies of Scale. The Board considered the potential for economies of scale and determined that it would reconsider this factor at an appropriate time in the future. In the event there were to be significant asset growth in the Fund, the Board determined to reassess whether the investment advisory fee appropriately took into account any economies of scale that had been realized as a result of that growth. The Board also considered the Advisor’s willingness to enter into a contractual expense limitation agreement for the Fund, noting that this would protect shareholders from high operational costs.
Ancillary Benefits.The Board noted the potential benefits to be received by the Advisor as a result of its relationship with the Fund (other than the advisory or sub-advisory fee), including the intangible benefits of its association with the Trust generally and any favorable publicity arising in connection with the Fund’s performance.
Conclusion. Based on its deliberations and evaluation of the information described above, the Board, including the Independent Trustees, unanimously: (i) concluded that the terms of the Advisory Agreement are fair and reasonable; (ii) concluded that the fee to be paid to the Advisor is fair and reasonable in light of the services that it will provide to the Fund; and (iii) agreed to approve the Advisory Agreement for an initial term of two years.
148
Board of Trustees and Officers (Unaudited) |
The business of the Trust is managed under the direction of the Trust’s Board of Trustees. The Board elects the officers of the Trust who are responsible for administering the Trust’s day-to-day operations. Each Trustee serves until his or her successor is duly elected or appointed and qualified.
The name, age, address, and principal occupations during the past five years for each Trustee and officer of the Trust is set forth below, along with the other public directorships held by the Trustees. More information about the Trustees is in the Trust’s Statement of Additional Information, which is available without charge by calling 1-877-843-3831.
Name, Address,
and Date of Birth of
Trustee/Officer | | Position(s) Held
with the Trust,
Term of Office
and Length of
Time Served | | Principal Occupation(s)
During Past 5 Years | | Number of
Portfolios in
Fund Complex
Overseen by
Trustee | | Other
Directorships
Held by Trustee
During Past
5 Years |
Interested Trustee | | | | | | | | |
Noah Hamman*
4800 Montgomery Lane,
Suite 150 Bethesda,
MD 20814
(1968) | | Trustee (no set term);served since 2009 | | Chief Executive Officer, President, and Founder of AdvisorShares Investments, LLC (2006–present). | | 16 | | None |
Independent Trustees | | | | | | | | |
Elizabeth (“Betsy”)
Piper/Bach
4800 Montgomery Lane,
Suite 150 Bethesda,
MD 20814
(1952) | | Trustee (no set term);served since 2009 | | Vice-President/Chief Operating Officer of NADA Retirement Administrators, Inc. (2009–present). | | 16 | | None |
William G. McVay
4800 Montgomery Lane,
Suite 150 Bethesda,
MD 20814
(1954) | | Trustee (no set term); served since 2011 | | Principal of Red Tortoise LLC (May 2017–present); Founderof RDK Strategies, LLC (2007–present). | | 16 | | None |
Officers | | | | | | | | |
Noah Hamman
4800 Montgomery Lane,
Suite 150 Bethesda,
MD 20814
(1968) | | President (no set term); served since 2009 | | Chief Executive Officer, President, and Founder of AdvisorShares Investments, LLC (2006–present). | | N/A | | N/A |
Dan Ahrens
4144 N. Central Expressway, Suite 600
Dallas, TX 75204
(1966) | | Secretary & Treasurer (no set terms); served since 2009 | | Managing Director of AdvisorShares Investments, LLC (2013–present); Chief Compliance Officer of the Trust (2009–2013); Executive Vice President of AdvisorShares Investments, LLC (2008–2013). | | N/A | | N/A |
Stefanie Little
11 Gina Marie Lane
Elkton, MD 21921
(1967) | | Chief Compliance Officer (no set term); served since 2013 | | Founder of Chenery Compliance Group, LLC (2015-present); Chief Compliance Officer of AdvisorShares Investments, LLC and the Trust (2013–present); President of LCG Compliance Alliance (2011–present). | | N/A | | N/A |
149
Quarterly Portfolio Holdings Information
The Funds are required to file their complete schedule of portfolio holdings with the SEC for their first and third quarters as an exhibit to its reports on Form N-PORT. Copies of the filings are available without charge on the SEC’s website at www.sec.gov.
Proxy Voting Information
A description of the Funds proxy voting policies and procedures, as well as a record of how the Funds voted proxies during the most recent 12-month period ended June30, is available without charge upon request by calling 1-877-843-3831. This information is also available on the SEC’s website at www.sec.gov.
Premium/Discount Information
Information about the differences between the daily market price on the secondary market for the shares of a Fund and the Fund’s net asset value may be found on the Fund’s website at www.advisorshares.com.
150
Investment Advisor |
AdvisorShares Investments, LLC
4800 Montgomery Lane, Suite 150
Bethesda, MD 20814 |
Sub-Advisors |
Ranger Alternative Management, L.P.
2828 N. Harwood Street, Suite 1900
Dallas, TX 75201 |
Newfleet Asset Management, LLC
100 Pearl Street
Hartford, CT 06103 |
Partnervest Advisory Services, LLC
1216 State Street, 3rd Floor
Santa Barbara, CA 93101 |
Sage Advisory Services, Ltd. Co.
5900 Southwest Parkway, Building I
Austin, TX 78735 |
Pacific Life Fund Advisors, LLC
700 Newport Center Drive
Newport Beach, CA 92660 |
Cornerstone Investment Partners, LLC
3438 Peachtree Road NE, Suite 900
Atlanta, GA 30326 |
Dorsey, Wright & Associates, LLC
1101 Boulder Spring Drive, Suite 150
Richmond, VA 23225 |
DoubleLine Equity LP
505 N. Brand Boulevard, Suite 860
Glendale, CA 91203 |
Sabretooth Advisors, LLC
2600 Philmont Avenue, Suite 215
Huntington Valley, PA 19006 |
Distributor |
Foreside Fund Services, LLC
Three Canal Plaza, Suite 100
Portland, ME 04101 |
Custodian/Fund Administrator/Transfer Agent |
The Bank of New York Mellon
240 Greenwich Street
New York, NY 10286 |
Legal Counsel |
Morgan, Lewis & Bockius LLP
1111 Pennsylvania Avenue, NW
Washington, D.C. 20004 |
Independent Registered Public Accounting Firm |
Tait, Weller & Baker LLP
50 South 16th Street, Suite 2900
Philadelphia, PA 19102 |
| |
| |
| |
| |
| |
| |
This report is submitted for the general information of the shareholders of each Fund. It is not authorized for distribution to prospective investors unless preceded or accompanied by an effective prospectus, which includes information regarding a Fund’s risks, objectives, fees and expenses, experience of management and other information.
The Registrant’s Board of Trustees has one audit committee financial expert serving on its audit committee, an “independent” Trustee, Elizabeth Piper/Bach. Under applicable securities laws, a person who is determined to be an audit committee financial expert will not be deemed an “expert” for any purpose, including without limitation for the purposes of Section 11 of the Securities Act of 1933, as a result of being designated or identified as an audit committee financial expert. The designation or identification of a person as an audit committee financial expert does not impose on such person any duties, obligations, or liabilities that are greater than the duties, obligations, and liabilities imposed on such person as a member of the audit committee and Board of Trustees in the absence of such designation or identification.
Per Rule 2-01(c)(7)(A), the Audit Committee pre-approves all of the Audit, Audit-Related, Tax and Other Fees of the Registrant.
Not applicable.
Not applicable.
Not applicable.
Not applicable.
Not applicable.
Pursuant to the requirements of the Securities Exchange Act of 1934 and the Investment Company Act of 1940, the registrant has duly caused this report to be signed on its behalf by the undersigned, thereunto duly authorized.
Pursuant to the requirements of the Securities Exchange Act of 1934 and the Investment Company Act of 1940, this report has been signed below by the following persons on behalf of the registrant and in the capacities and on the dates indicated.