Table of Contents
UNITED STATES
SECURITIES AND EXCHANGE COMMISSION
Washington, D.C. 20549
FORM N-CSR
CERTIFIED SHAREHOLDER REPORT OF REGISTERED
MANAGEMENT INVESTMENT COMPANIES
Investment Company Act file number: 811-22132
Aberdeen Funds
(Exact name of registrant as specified in charter)
1735 Market Street, 32nd Floor
Philadelphia, PA 19103
(Address of principal executive offices) (Zip code)
Ms. Andrea Melia
Aberdeen Asset Management Inc.
1735 Market Street, 32nd Floor
Philadelphia, PA 19103
(Name and address of agent for service)
Registrant’s telephone number, including area code: 866-667-9231
Date of fiscal year end: October 31
Date of reporting period: October 31, 2014
Table of Contents
Item 1. Reports to Shareholders.
Table of Contents

Aberdeen Funds
Equity Series
Annual Report
October 31, 2014
Aberdeen Asia-Pacific (ex-Japan) Equity Fund
Aberdeen Asia-Pacific Smaller Companies Fund
Aberdeen China Opportunities Fund
Aberdeen Emerging Markets Fund
Aberdeen Equity Long-Short Fund
Aberdeen Global Natural Resources Fund
Aberdeen Global Small Cap Fund
Aberdeen International Equity Fund
Aberdeen Latin American Equity Fund

Table of Contents
| Page 1 | ||||
| Page 2 | ||||
| Page 3 | ||||
| Page 9 | ||||
| Page 16 | ||||
| Page 21 | ||||
| Page 28 | ||||
| Page 36 | ||||
| Page 42 | ||||
| Page 48 | ||||
| Page 53 | ||||
| Page 59 | ||||
| Page 65 | ||||
| Page 70 | ||||
| Page 75 | ||||
| Page 80 | ||||
| Page 130 | ||||
| Page 150 | ||||
| Page 152 | ||||
| Page 153 | ||||
| Page 155 | ||||
| Page 159 | ||||
Investors should carefully consider a fund’s investment objectives, risks, fees, charges and expenses before investing any money. To obtain this and other fund information, please call 866-667-9231 to request a prospectus, or download a prospectus at www.aberdeen-asset.us. Please read it carefully before investing any money.
Investing in mutual funds involves risk, including possible loss of principal.
Aberdeen Funds is distributed by Aberdeen Fund Distributors LLC, Member FINRA, 1735 Market Street, 32nd Floor, Philadelphia, PA 19103.
Aberdeen Asset Management Inc. (AAMI) has been registered as an investment adviser under the Investment Advisers Act of 1940 since August 23, 1995.
Statement Regarding Availability of Quarterly Portfolio Schedule.
The complete schedule of portfolio holdings for each Fund of Aberdeen Funds is included in the Funds’ semi-annual and annual reports to shareholders. Aberdeen Funds also files complete schedules of portfolio holdings for each Fund with the Securities and Exchange Commission (the “Commission”) for the first and third quarters of each fiscal year on Form N-Q. The Funds’ Form N-Q filings are available on the Commission’s website at http://www.sec.gov. The Funds’ Form N-Q filings may be reviewed and copied at the Commission’s Public Reference Room in Washington, DC, and information on the operation of the Public Reference Room may be obtained by calling 800-SEC-0330; and the Funds make the information on Form N-Q available to shareholders on www.aberdeen-asset.us or upon request without charge.
Statement Regarding Availability of Proxy Voting Record.
Information regarding the policies and procedures that the Funds use to determine how to vote proxies relating to portfolio securities is available without charge, upon request, by calling 1-866-667-9231. The information is also included in the Funds’ Statement of Additional Information, which is available on the Funds’ website at www.aberdeen-asset.us and on the Commission’s website at www.sec.gov.
Information relating to how each Fund voted proxies relating to portfolio securities held during the most recent twelve months ended June 30 is available by August 30 of the relevant year: (i) upon request and without charge by calling 1-866-667-9231; and (ii) on the Commission’s website at www.sec.gov.
Table of Contents
October 31, 2014
Dear Valued Shareholder,
Welcome to the Aberdeen Funds Annual Report covering the activities for the twelve-month period ended October 31, 2014.
Market overview
Global equity markets continued to be dominated by concerns over global economic growth levels during the reporting period, lagging their U.S. counterparts. Strong U.S. equity market performance buoyed global markets as deflationary pressures continued to cause headwinds in Europe. Meanwhile, emerging markets finished the period with weak returns as a strong sell-off in September overshadowed gains from earlier in the year. The fixed income universe was volatile over the period, as investment-grade core and total return bond markets delivered modest returns against the backdrop of struggling global equity markets and falling commodity prices. Meanwhile, the global high yield bond market came under significant pressure during the period after yields and spreads made new lows in late June.
Markets continue to brace for more headwinds as we enter 2015 given the environment of slow global growth, a potential U.S. interest rate hike on the horizon and falling oil prices. In the U.S., voters elected eight new Republican senators as the GOP will take control of both houses of Congress in January 2015. The implications of this shift remain unclear, but dramatic legislative moves are likely to be made regarding healthcare and government spending. In emerging markets, the election of pro-business candidate Narendra Modi as the new Prime Minister of India has buoyed the outlook for the world’s 10th largest economy. In Europe, tensions between Russia and the West continue to hinder Russian markets.
Anne Richards, Aberdeen Asset Management PLC’s (Aberdeen) Global Chief Investment Officer, provides you with a detailed insight on the investment marketplace in the Global Market Review and Outlook on the following page.
Aberdeen developments
As of April 1, 2014, Aberdeen Asset Management PLC completed the acquisition of Scottish Widows Investment Partnership (SWIP) from Lloyds Banking Group in the UK. During the period, the integration of SWIP into the wider Aberdeen group continued to progress. The acquisition combines Aberdeen and SWIP’s strengths across fixed income, real estate, active and quantitative equities, investment solutions and alternatives. The acquisition of SWIP will not have a direct impact on any funds in the Aberdeen Fund family but will significantly add to Aberdeen’s global investment capabilities.
During the period, Aberdeen reached an agreement with the European Tour and the Scottish Government to extend our sponsorship of the Aberdeen Asset Management Scottish Open through 2020.
Aberdeen received several industry awards during the period, including 12 Mutual Fund Education Association (MFEA) STAR Awards for financial communications in both digital and direct marketing categories.
Thank you for choosing Aberdeen Funds. We value your investment with us.
Kind Regards,
Yours sincerely,
/s/ Bev Hendry
Bev Hendry
President
Aberdeen Funds
2014 Annual Report
1
Table of Contents
In our opinion, the performances of the major global equity markets for the 12-month period ended October 31, 2014, might be best described as “all over the map” – literally. There was marked divergence in stock returns among geographical regions. On the surface, it appeared that global equities generally posted respectable gains, with the MSCI World Index, the developed-market benchmark, rising 9.3% (in U.S. dollars) over the period. However, the strength in the markets was concentrated on the western side of the Atlantic Ocean, with the U.S. broader-market S&P 500 Index climbing 17.3%. In contrast, the MSCI World ex US Index was up just 0.2% during the period, dragged down mainly by investors’ concerns about economic growth in Europe and the continued rise in the U.S. dollar against most major global currencies. Both the euro and the Japanese yen declined sharply against the U.S. dollar over the period, with the latter currency experiencing particular weakness. The upturn in the U.S. market was the primary contributor to the outperformance of developed markets versus their emerging counterparts, as measured by the MSCI Emerging Markets Index, which returned 1.0% for the reporting period. The sharp decline in oil prices over the annual period had a mixed effect on the global markets: Importing nations were notable beneficiaries, whereas exporters such as Russia came under pressure as lower oil prices may aggravate revenue shortfalls caused by a raft of Western sanctions.
Unlike many other regions, the U.S. equity market benefited from a generally improving economy over the reporting period. Healthy gross domestic product (GDP) growth in the fourth quarter of 2013 and the second and third quarters of 2014 offset a decline in the first quarter of the year, most likely attributable to bad weather-induced weakness in consumer spending. Additionally, the unemployment rate fell substantially during the period, although the labor participation rate declined to its lowest level in 36 years. Investors remained focused on U.S. monetary policy for much of the period. Former Federal Reserve (Fed) vice chair Janet Yellen succeeded Ben Bernanke as head of the Fed in February 2014. The Fed began to reduce its $85 billion-per-month asset purchase program in $10 billion increments in January 2014, and ended its tapering in late October.
United Kingdom (UK) stocks saw marginal gains while European equities ended the period modestly lower. Economic recovery in the Eurozone1 remains fragile and much slower-paced than in the U.S. and UK. The European labor market has continued to improve, albeit unevenly, as has household confidence; however, inflation expectations are dangerously low for the region. Late in the reporting period, the European Central Bank (ECB) announced that, if required, it would use “unconventional policy instruments” in support of the Eurozone economy. However, there are doubts over the scale and potential effectiveness of such measures. In Japan, the yen’s weakness lifted equity markets overall, but gains were pared because of doubts over the efficacy of Prime Minister Shinzo Abe’s “third arrow” stimulus measures, as well as the impact of the consumption tax hike that was implemented in April 2014.
Within the global emerging equity markets, strong performance in India and, to a lesser extent, China, was counterbalanced by notable weakness in Latin America and Russia. Indian stocks rallied after the business-friendly Bharatiya Janata Party (BJP), headed by Narendra Modi, swept into power as that country’s first single-party majority in 25 years. The Chinese market was bolstered by signs of an upturn in economic growth. Additionally, investors appeared to take a favorable view of a proposed pilot program for mutual market connectivity between Hong Kong and Shanghai, as it was seen as a significant step towards cross-border capital market integration. The program commenced operations shortly after the end of the reporting period in mid-November. In Latin America, Brazilian equities were hampered as investor sentiment soured in reaction to the nation’s bitterly-contested presidential election. Brazil’s incumbent president, Dilma Rousseff, whose policies generally are perceived as unfriendly to business, edged out her opponent, Aecio Neves, to secure a second term. Ongoing geopolitical tensions surrounding Russia’s expanded military presence in Ukraine had a negative impact on the Russian market for the period.
The global bond markets experienced periods of volatility over the reporting period, which increased more significantly in August and October. Concerns over faltering global economic growth, combined with heightened fears of potential deflation in Europe, drove much of the uncertainty. Nonetheless, the global fixed income markets collectively finished in positive territory for the period. Investment-grade bonds outperformed high yield securities, with the Bank of America Merrill Lynch Global Broad Market Corporate Index advancing 6.4% versus the 5.9% return of the Bank of America Merrill Lynch Global High Yield Constrained Index. Emerging markets debt, as measured by the J.P. Morgan EMBI Global Diversified Index, was the strongest-performing segment within the global fixed income universe, climbing 8.6% for the period, as investors focused on the yield differential between emerging and developed markets, rather than the geopolitical tensions between Russia and Ukraine.
Outlook
In our opinion, the global economic and monetary environment remains supportive of equities relative to fixed income and cash. We believe that the end to U.S. quantitative easing in late October, higher interest rates in 2015, and improvement in the U.S. economy could lead to continued strengthening of the U.S. dollar. Our overall view on interest rates is that they will remain low for an extended period. Confidence in the global recovery has improved somewhat, given the pick-up in U.S. economic activity. However, we feel that the picture is less rosy elsewhere in the developed world. The Eurozone continues to suffer from high debt and unemployment. We remain cautious about Japan, as the recovery in household consumption has been slower than expected. However, these conditions have led to unprecedented monetary stimulus in both regions, which we think may potentially create investment opportunities. We believe that prospects for emerging economies also remain mixed, with recent market developments highlighting sensitivities to U.S. monetary policy. At the corporate level, we observe efforts to boost margins through cost-cuts and reorganization, although this has yet to translate into a broader trend of improving profitability.
Anne Richards
Chief Investment Officer
Aberdeen Asset Management
| 1 | The Eurozone comprises 18 European Union member states that have adopted the euro as their common currency. |
Indexes are unmanaged and have been provided for comparison purposes only. No fees or expenses are reflected. You cannot invest directly in an index.
Annual Report 2014
2
Table of Contents
Aberdeen Asia-Pacific (ex-Japan) Equity Fund (Unaudited)
The Aberdeen Asia-Pacific (ex-Japan) Equity Fund (Class A shares at net asset value net of fees) returned 2.43% for the year ended October 31, 2014, versus the 4.24% return of its benchmark, the MSCI AC Asia Pacific ex-Japan Index, during the same period. For broader comparison, the average return of the Fund’s Lipper peer category of Pacific ex-Japan Funds (consisting of 50 funds) was 5.76% for the period.
Asian equities, ex-Japan, as measured by the MSCI AC Asia Pacific ex-Japan Index, posted gains over the reporting period. Political change in the Asia-Pacific region, global economic growth concerns and monetary policy from major global central banks continued to dictate market direction. The strongest performer in the region was the Indian market, which had fared poorly in 2013. The opposition Bharatiya Janata Party’s landslide election victory and hopes that the new government would accelerate reforms bolstered the local market to new highs. The Thai market extended gains as the military coup and the installation of coup leader general Prayuth Chan-ocha as prime minister brought some stability to a domestic situation that had previously been rocked by turmoil. China, as measured by the MSCI Zhong Hua Index, also outperformed the MSCI AC Asia Pacific ex-Japan Index despite investors’ persistent growth worries. Conversely, share prices in Australia fell on the back of weaker commodity prices, while market sentiment in Hong Kong was pressured by a disruptive pro-democracy movement and Singapore was dogged by worries over economic recovery. Indonesia also lagged, although voters elected market-friendly Joko Widodo as the country’s new president. Over the reporting period, equity markets priced in the gradual end to the U.S. Federal Reserve’s quantitative easing program, but the Bank of Japan’s surprise decision at the end of the period to expand its already massive stimulus plan provided a late jolt of confidence.
The Indian market performed well as election-related euphoria pushed the MSCI India Index1 to all-time highs. The Fund has a large exposure to the Indian market, which enhanced its performance over the reporting period relative to the Fund’s benchmark. Many of the Fund’s stocks also performed well. Top contributors to performance included holdings in Housing Development Finance Corp. (HDFC), UltraTech Cement and Hero MotoCorp. Mortgage lender HDFC was further lifted by hopes of better loan growth, while UltraTech gained on expectations of increased infrastructure spending. Meanwhile, motorcycle maker Hero MotoCorp enjoyed solid sales growth amid signs it was winning back market share from competitors. In contrast, the Korean market declined in the face of poor economic growth. Consequently, the Fund’s small position relative to the benchmark in this region bolstered performance for the period.
The biggest detractor from Fund performance among individual holdings was Standard Chartered. In October 2014, the lender issued its third profit warning in a year as it delivered its nine-month results, citing high impairment charges as some clients were hurt by weakening commodity markets. Investor sentiment was also dampened by speculation that U.S. regulators could reinvestigate alleged sanction violations against Standard Chartered. However, the company has peerless focus on emerging markets, replete with banking licenses and long-term customer relationships, in our opinion. Another detractor was Australia’s QBE Insurance. The company reported a net loss of US$254 million for the year ended December 2013 on the back of additional provisions, restructuring charges and a goodwill write-down in North America. Later, the company allocated additional reserves in Argentina. Nevertheless, we were encouraged that other parts of QBE continued to operate within expectations. The stock recouped some losses after management bolstered the company’s balance sheet with the placement of new shares and the chairman appointed new members to its board of directors.
Regarding significant changes to the Fund over the reporting period, we introduced three new holdings. In our view, Indian conglomerate ITC has a dominant position in the cigarettes sector and has been using robust cash flows from this business to invest in other growth opportunities such as fast-moving consumer goods. Yum! Brands is a leading multi-brand, quick-service restaurant operator, which generates more than half its revenues from Asia and, we believe, has good long-term potential in key markets such as China and India. In our view, the stock trades at a reasonable valuation relative to the sector, with a 2% yield. Another new holding was Australia-listed CSL, a leading player in the global plasma products market. We feel that the company has robust quality control and enjoys superior growth and returns because of its highly efficient collection and processing system, coupled with its commitment to research and development. The company is financially strong, in our opinion, and any excess free cash flows have been used for share buybacks. Elsewhere, we participated in the rights issues of both Bank of the Philippine Islands and Oversea-Chinese Banking Corp. Ltd. (OCBC), as we felt that they were attractively discounted. We believe that Bank of the Philippine Islands is poised to benefit from healthy loan demand, while Singapore’s OCBC is looking to bolster its balance sheet after acquiring Wing Hang Bank.
Conversely, we took profits from our positions in India following the local market’s solid performance. We sold GlaxoSmithKline Pharmaceuticals in India after the successful tender offer by its parent company, UK-based GlaxoSmithKline. We also exited Singapore Airlines. Although we think the company has a robust balance sheet and an enviable brand, we feel the challenging operating environment is not expected to improve soon. We believe there are better opportunities in a regional portfolio.
The divergence between major central banks’ monetary policies has become more pronounced, although how that translates into global capital flows is uncertain. In Asia, the slowdown in China remains a key concern and, in our opinion, should continue to sway market sentiment. In our opinion, weaker demand in mainland China has hurt major trading partners, and activity may potentially moderate further
| 1 | The MSCI India Index is designed to measure the performance of the large- and mid-cap segments of the Indian market. With 73 constituents, the index covers approximately 85% of the Indian equity universe. Indexes are unmanaged and have been provided for comparison purposes only. No fees or expenses are reflected. You cannot invest directly in an index. |
2014 Annual Report
3
Table of Contents
Aberdeen Asia-Pacific (ex-Japan) Equity Fund (Unaudited) (concluded)
with the Chinese government trying to prevent runaway credit expansion. However, we believe that the government has the resources to employ selective stimulus to cushion the slowdown. Ultimately, in our view, selective stimulus may improve the quality of growth, even if it takes longer to achieve. Meanwhile, falling global oil prices have brought some reprieve to oil importing nations. In particular, India and Indonesia now have greater room to revise subsidies. We believe this may potentially help resolve fiscal imbalances that, until recently, have handcuffed government spending on crucial areas such as infrastructure. India did just that, hiking gas prices while eliminating diesel subsidies. Indonesia, under newly elected president Joko Widodo, has made tackling fuel subsidies a cornerstone of its economic rejuvenation plan. We think that Japan also may benefit as lower oil prices mitigate the impact of the weaker yen on energy imports.
Portfolio Management:
Aberdeen Asia-Pacific Equity Team
PAST PERFORMANCE DOES NOT GUARANTEE FUTURE RESULTS.
The performance data quoted represents past performance and current returns may be lower or higher. Class A Shares have up to a 5.75% front-end sales charge and a 0.25% 12b-1 fee. The investment return and principal value will fluctuate so that an investor’s shares, when redeemed, may be worth more or less than the original cost. To obtain performance information current to the most recent month-end, which may be higher or lower than the performance shown above, please call 866-667-9231 or go to www.aberdeen-asset.us.
Investing in mutual funds involves risk, including the possible loss of principal.
Indexes are unmanaged and have been provided for comparison purposes only. No fees or expenses are reflected. You cannot invest directly in an index.
Lipper is a leading global provider of mutual fund information and analysis to fund companies, financial intermediaries and media organizations.
Risk Considerations
Concentrating investments in the Asia-Pacific region subjects the Fund to more volatility and greater risk of loss than geographically diverse mutual funds.
Parts of the Asian-Pacific region may be subject to a greater degree of economic, political and social instability than is the case in the United States and Europe. Some Asian countries can be characterized as emerging markets or newly industrialized and may experience more volatile economic cycles than developed countries.
Foreign securities are more volatile, harder to price and less liquid than U.S. securities. They are subject to different accounting and regulatory standards, and political and economic risks. These risks are enhanced in emerging markets countries.
Equity stocks of small and mid-cap companies carry greater risk and more volatility than equity stocks of larger, more established companies.
Please read the prospectus for more detailed information regarding these and other risks.
Annual Report 2014
4
Table of Contents
Aberdeen Asia-Pacific (ex-Japan) Equity Fund (Unaudited)
Average Annual Total Return (For periods ended October 31, 2014) | 1 Yr. | Inception1 | ||||||||
Class A2 | w/o SC | 2.43% | 6.86% | |||||||
| w/SC3 | (3.44% | ) | 5.59% | |||||||
Class C2 | w/o SC | 1.67% | 6.44% | |||||||
| w/SC4 | 0.67% | 6.44% | ||||||||
Class R2,5 | w/o SC | 2.06% | 6.70% | |||||||
Institutional Service Class5 | w/o SC | 2.59% | 6.96% | |||||||
Institutional Class5 | w/o SC | 2.64% | 6.99% | |||||||
All figures showing the effect of a sales charge (SC) reflect the maximum charge possible because it has the most significant effect on performance data. The total returns shown above do not include the impact of financial statement rounding of the net asset value per share and/or financial statement adjustments.
| 1 | Fund commenced operations on November 16, 2009. |
| 2 | Returns before the first offering of Class A, Class C and Class R (February 28, 2012) are based on the previous performance of the Institutional Class. The performance of the Institutional Class is substantially similar to what Class A, Class C and Class R would have produced because all classes invest in the same portfolio of securities. Returns for Class A, Class C and Class R shares would only differ to the extent of the differences in expenses of the classes. |
| 3 | A 5.75% front-end sales charge was deducted. |
| 4 | A 1.00% contingent deferred sales charge (CDSC) was deducted from the one year return because it is charged when Class C shares are sold within the first year after purchase. |
| 5 | Not subject to any sales charges. |
2014 Annual Report
5
Table of Contents
Aberdeen Asia-Pacific (ex-Japan) Equity Fund (Unaudited)
Performance of a $10,000 Investment (as of October 31, 2014)
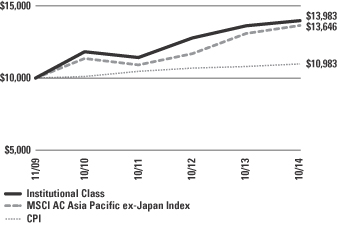
Comparative performance of $10,000 invested in Institutional Class shares of the Aberdeen Asia-Pacific (ex-Japan) Equity Fund, the Morgan Stanley Capital International All Country (MSCI AC) Asia Pacific ex-Japan Index and the Consumer Price Index (CPI) since inception. Unlike the Fund, the returns for these unmanaged indexes do not reflect any fees, expenses, or sales charges. Investors cannot invest directly in market indexes.
The MSCI AC Asia Pacific ex-Japan Index is a free float-adjusted, market capitalization-weighted index that captures large and mid cap representation in the Asia Pacific region excluding Japan. The MSCI AC Asia Pacific ex-Japan Index consists of the following developed markets countries: Australia, Hong Kong, New Zealand and Singapore; and the following emerging markets countries: China, India, Indonesia, Korea, Malaysia, the Philippines, Taiwan and Thailand.
The CPI represents changes in prices of a basket of goods and services purchased for consumption by urban households.
Investment return and principal value will fluctuate, and when redeemed, shares may be worth more or less than original cost. Past performance is no guarantee of future results. The Average Annual Total Return table and Performance graph do not reflect the deduction of taxes that a shareholder would pay on fund distributions or the redemption of fund shares. Investing in mutual funds involves market risk, including loss of principal. Performance returns assume the reinvestment of all distributions. Total returns reflect waivers and reimbursements in effect, without which returns would have been lower.
Portfolio Summary
October 31, 2014 (Unaudited)
| Asset Allocation | ||||
Common Stocks | 91.7% | |||
Preferred Stocks | 5.4% | |||
Repurchase Agreement | 3.2% | |||
Liabilities in excess of other assets | (0.3% | ) | ||
| 100.0% | ||||
The following chart summarizes the composition of the Fund’s portfolio, in industry classification standard sectors, expressed as a percentage of net assets. An industry classification standard sector can include more than one industry group. As of October 31, 2014, the Fund did not have more than 25% of its assets invested in any industry group. The sectors, as classified by S&P’s Global Industry Classification Standard Sectors, are comprised of several industry groups.
| Top Sectors | ||||
Financials | 39.3% | |||
Information Technology | 12.7% | |||
Materials | 11.9% | |||
Industrials | 9.9% | |||
Telecommunication Services | 7.4% | |||
Consumer Staples | 6.8% | |||
Consumer Discretionary | 4.5% | |||
Energy | 4.0% | |||
Health Care | 0.6% | |||
Other | 2.9% | |||
| 100.0% | ||||
| Top Holdings* | ||||
Samsung Electronics Co. Ltd., Preferred Shares | 5.4% | |||
Oversea-Chinese Banking Corp. Ltd. | 4.2% | |||
Jardine Strategic Holdings Ltd. | 3.8% | |||
Housing Development Finance Corp. Ltd. | 3.7% | |||
HSBC Holdings PLC | 3.6% | |||
BHP Billiton – London Listing | 3.6% | |||
Rio Tinto – London Listing | 3.5% | |||
Taiwan Semiconductor Manufacturing Co. Ltd. | 3.4% | |||
AIA Group Ltd. | 3.3% | |||
QBE Insurance Group Ltd. | 3.1% | |||
Other | 62.4% | |||
| 100.0% | ||||
| Top Countries | ||||
Hong Kong | 21.4% | |||
Singapore | 19.6% | |||
Australia | 12.8% | |||
India | 11.0% | |||
Republic of South Korea | 6.6% | |||
China | 6.1% | |||
Taiwan | 5.3% | |||
United States | 4.8% | |||
Thailand | 3.5% | |||
Philippines | 3.0% | |||
Other | 5.9% | |||
| 100.0% | ||||
| * | For the purpose of listing top holdings, repurchase agreements are included as part of Other. |
Annual Report 2014
6
Table of Contents
Statement of Investments
October 31, 2014
Aberdeen Asia-Pacific (ex-Japan) Equity Fund
| Shares or Principal Amount | Value | |||||||
COMMON STOCKS (91.7%) | ||||||||
AUSTRALIA (12.8%) | ||||||||
Consumer Staples (2.0%) | ||||||||
Woolworths Ltd. (a) | 683,056 | $ | 21,677,162 | |||||
Financials (3.1%) | ||||||||
QBE Insurance Group Ltd. (a) | 3,282,150 | 33,339,761 | ||||||
Health Care (0.6%) | ||||||||
CSL Ltd. (a) | 95,000 | 6,707,274 | ||||||
Materials (7.1%) | ||||||||
BHP Billiton — London Listing (a) | 1,470,073 | 37,981,691 | ||||||
Rio Tinto — London Listing (a) | 791,740 | 37,672,135 | ||||||
| 75,653,826 | ||||||||
| 137,378,023 | ||||||||
CHINA (6.1%) | ||||||||
Energy (3.1%) | ||||||||
PetroChina Co. Ltd., H Shares (a) | 26,448,000 | 33,145,500 | ||||||
Telecommunication Services (3.0%) | ||||||||
China Mobile Ltd. (a) | 2,581,000 | 32,180,677 | ||||||
| 65,326,177 | ||||||||
HONG KONG (21.4%) | ||||||||
Consumer Discretionary (1.7%) | ||||||||
Global Brands Group Holding Ltd. (b) | 9,218,000 | 2,032,556 | ||||||
Li & Fung Ltd. (a) | 13,368,000 | 16,309,324 | ||||||
| 18,341,880 | ||||||||
Consumer Staples (1.5%) | ||||||||
Dairy Farm International Holdings Ltd. | 1,694,700 | 16,269,120 | ||||||
Financials (13.6%) | ||||||||
AIA Group Ltd. (a) | 6,365,800 | 35,523,868 | ||||||
Hang Lung Group Ltd. (a) | 2,827,000 | 14,222,817 | ||||||
Hang Lung Properties Ltd. (a) | 4,825,000 | 15,067,166 | ||||||
HSBC Holdings PLC (a) | 3,838,476 | 39,277,590 | ||||||
Swire Pacific Ltd., Class A (a) | 2,445,500 | 32,108,074 | ||||||
Swire Pacific Ltd., Class B (a) | 2,465,000 | 5,983,034 | ||||||
Swire Properties Ltd. (a) | 1,373,900 | 4,402,401 | ||||||
| 146,584,950 | ||||||||
Industrials (3.8%) | ||||||||
Jardine Strategic Holdings Ltd. (a) | 1,138,000 | 40,565,915 | ||||||
Information Technology (0.8%) | ||||||||
ASM Pacific Technology Ltd. (a) | 779,200 | 8,586,659 | ||||||
| 230,348,524 | ||||||||
INDIA (11.0%) | ||||||||
Consumer Discretionary (1.2%) | ||||||||
Hero MotoCorp Ltd. (a) | 257,000 | 12,829,140 | ||||||
Consumer Staples (0.5%) | ||||||||
ITC Ltd. (a) | 1,000,000 | 5,774,239 | ||||||
Financials (4.4%) | ||||||||
Housing Development Finance Corp. Ltd. (a) | 2,214,799 | 39,734,974 | ||||||
ICICI Bank Ltd. (a) | 246,200 | $ | 6,532,630 | |||||
ICICI Bank Ltd., ADR | 26,800 | 1,510,448 | ||||||
| 47,778,052 | ||||||||
Information Technology (2.7%) | ||||||||
Infosys Ltd. (a) | 432,250 | 28,673,558 | ||||||
Materials (2.2%) | ||||||||
Grasim Industries Ltd. (a) | 42,024 | 2,398,323 | ||||||
Grasim Industries Ltd., GDR (c) | 20,080 | 1,151,186 | ||||||
UltraTech Cement Ltd. (a) | 488,142 | 20,248,428 | ||||||
UltraTech Cement Ltd., GDR (c) | 330 | 13,705 | ||||||
| 23,811,642 | ||||||||
| 118,866,631 | ||||||||
INDONESIA (0.6%) | ||||||||
Consumer Staples (0.6%) | ||||||||
Unilever Indonesia Tbk PT (a) | 2,699,500 | 6,796,711 | ||||||
MALAYSIA (2.7%) | ||||||||
Consumer Staples (1.0%) | ||||||||
British American Tobacco Bhd (a) | 504,500 | 10,667,049 | ||||||
Financials (1.7%) | ||||||||
CIMB Group Holdings Bhd (a) | 6,020,999 | 11,889,312 | ||||||
Public Bank Bhd | 1,174,500 | 6,620,120 | ||||||
| 18,509,432 | ||||||||
| 29,176,481 | ||||||||
PHILIPPINES (3.0%) | ||||||||
Financials (3.0%) | ||||||||
Ayala Corp. (a) | 1,104,780 | 16,980,250 | ||||||
Ayala Land, Inc. (a) | 4,812,700 | 3,596,159 | ||||||
Bank of Philippine Islands (a) | 5,518,225 | 11,693,087 | ||||||
| 32,269,496 | ||||||||
REPUBLIC OF SOUTH KOREA (1.2%) | ||||||||
Consumer Staples (1.2%) | ||||||||
E-Mart Co. Ltd. (a) | 71,440 | 13,255,619 | ||||||
SINGAPORE (19.6%) | ||||||||
Financials (10.7%) | ||||||||
City Developments Ltd. (a) | 4,489,000 | 33,038,690 | ||||||
DBS Group Holdings Ltd. (a) | 1,102,075 | 15,853,806 | ||||||
Oversea-Chinese Banking Corp. Ltd. (a) | 5,836,829 | 44,961,716 | ||||||
United Overseas Bank Ltd. (a) | 1,173,235 | 21,019,291 | ||||||
| 114,873,503 | ||||||||
Industrials (6.0%) | ||||||||
Jardine Matheson Holdings Ltd. (a) | 155,200 | 9,300,812 | ||||||
Keppel Corp. Ltd. (a) | 3,894,000 | 28,555,529 | ||||||
Singapore Technologies Engineering Ltd. (a) | 9,323,000 | 27,218,937 | ||||||
| 65,075,278 | ||||||||
Information Technology (0.4%) | ||||||||
Venture Corp. Ltd. (a) | 738,000 | 4,445,270 | ||||||
See accompanying Notes to Financial Statements.
2014 Annual Report
7
Table of Contents
Statement of Investments (concluded)
October 31, 2014
Aberdeen Asia-Pacific (ex-Japan) Equity Fund
| Shares or Principal Amount | Value | |||||||
Telecommunication Services (2.5%) | ||||||||
Singapore Telecommunications Ltd. (a) | 9,073,000 | $ | 26,698,259 | |||||
| 211,092,310 | ||||||||
TAIWAN (5.3%) | ||||||||
Information Technology (3.4%) | ||||||||
Taiwan Semiconductor Manufacturing Co. Ltd. (a) | 8,488,000 | 36,794,381 | ||||||
Telecommunication Services (1.9%) | ||||||||
Taiwan Mobile Co. Ltd. | 6,234,100 | 20,229,338 | ||||||
| 57,023,719 | ||||||||
THAILAND (3.5%) | ||||||||
Energy (0.9%) | ||||||||
PTT Exploration & Production PCL, Foreign Shares (a) | 2,197,000 | 9,877,491 | ||||||
Materials (2.6%) | ||||||||
Siam Cement PCL, Foreign Shares (a) | 2,005,200 | 27,852,106 | ||||||
| 37,729,597 | ||||||||
UNITED KINGDOM (2.8%) | ||||||||
Financials (2.8%) | ||||||||
Standard Chartered PLC (a) | 1,969,676 | 29,648,855 | ||||||
UNITED STATES (1.6%) | ||||||||
Consumer Discretionary (1.6%) | ||||||||
Yum! Brands, Inc. | 240,000 | 17,239,200 | ||||||
Total Common Stocks | 986,151,343 | |||||||
PREFERRED STOCKS (5.4%) | ||||||||
REPUBLIC OF SOUTH KOREA (5.4%) | ||||||||
Information Technology (5.4%) | ||||||||
Samsung Electronics Co. Ltd., Preferred Shares (a) | 63,350 | 58,476,039 | ||||||
Total Preferred Stocks | 58,476,039 | |||||||
REPURCHASE AGREEMENT (3.2%) | ||||||||
UNITED STATES (3.2%) | ||||||||
Repurchase Agreement, Fixed Income Clearing Corp., 0.00%, dated 10/31/2014, due 11/03/2014, repurchase price $33,785,000 collateralized by U.S. Treasury Note, maturing 10/31/2021; total market value of $34,465,364 | $ | 33,785,000 | 33,785,000 | |||||
Total Repurchase Agreement | 33,785,000 | |||||||
Total Investments | 1,078,412,382 | |||||||
Liabilities in excess of other assets—(0.3)% | (2,999,997 | ) | ||||||
Net Assets—100.0% | $ | 1,075,412,385 | ||||||
| (a) | Fair Valued Security. Fair Values are determined pursuant to procedures approved by the Fund’s Board of Trustees. See Note 2(a) of the accompanying Notes to Financial Statements. |
| (b) | Non-income producing security. |
| (c) | Denotes a security issued under Regulation S or Rule 144A. |
| (d) | See Notes to Financial Statements for tax unrealized appreciation/depreciation of securities. |
| ADR | American Depositary Receipt |
| GDR | Global Depositary Receipt |
See accompanying Notes to Financial Statements.
Annual Report 2014
8
Table of Contents
Aberdeen Asia-Pacific Smaller Companies Fund (Unaudited)
The Aberdeen Asia-Pacific Smaller Companies Fund (Class A shares at net asset value net of fees) returned 1.78% for the year ended October 31, 2014, versus the 2.68% return of its benchmark, the MSCI AC Asia Pacific ex-Japan Small Cap Index, during the same period. For broader comparison, the average return of the Fund’s Lipper peer category of Pacific Region Funds (consisting of 23 funds) was 2.96% for the period.
The MSCI AC Asia Pacific ex-Japan Small Cap Index rose during the reporting period. Political change in the Asia-Pacific region, global economic growth concerns and monetary policy from major global central banks continued to dictate market direction. The strongest performer in the region was the Indian market, which had fared poorly in 2013. The opposition Bharatiya Janata Party’s landslide election victory and hopes that the new government would accelerate reforms bolstered the local market to new highs. The Thai market extended gains as the military coup and the installation of coup leader general Prayuth Chan-ocha as prime minister brought some stability to a domestic situation that had previously been rocked by turmoil. China, as measured by the MSCI Zhong Hua Index, also outperformed the MSCI AC Asia Pacific ex-Japan Small Cap Index, despite investors’ persistent growth worries. Conversely, share prices in Australia fell on the back of weaker commodity prices, while market sentiment in Hong Kong was pressured by a disruptive pro-democracy movement and Singapore was dogged by worries over economic recovery. Indonesia also lagged, although voters elected market-friendly Joko Widodo as the country’s new president. Over the reporting period, equity markets priced in the gradual end to the U.S. Federal Reserve’s quantitative easing program, but the Bank of Japan’s surprise decision at the end of the period to expand its already massive stimulus plan provided a late jolt of confidence.
Fund performance for the reporting period benefited from its holdings in India and Thailand, which performed well. Holdings in Indian companies were among the biggest contributors to performance as election-related euphoria on the hopes of long overdue infrastructure reforms pushed local share prices to all-time highs, as evidenced by Fund holdings Container Corp. of India and Ramco Cements. Meanwhile, auto-related materials stocks Kansai Nerolac Paints and Castrol India were buoyant on investor expectations of a pick-up in consumer demand and industrial growth. Thai holdings, such as Hana Microelectronics and Bumrungrad Hospital, also enjoyed a good year despite the troubled domestic political situation.
Conversely, Giordano International was the biggest detractor from Fund performance. The apparel retailer’s share price fell amid weak retail conditions in China, one of its core markets. Nevertheless, we believe that its healthy balance sheet may provide a buffer against market downturn. Pacific Basin Shipping experienced subdued dry bulk rates amid sluggish demand, but the company has historically been disciplined in managing its assets within a highly cyclical industry and rates have started to improve.
Notable changes to the Fund during the period included the sale of industrial property company BWP Trust, Thai shopping mall owner Central Pattana, Singapore software solutions provider Silverlake Axis, and nickel producer Vale Indonesia. We felt that Australia exchange-listed BWP Trust’s growth prospects were diminishing, while the stock was trading above the company’s net asset value. Silverlake Axis and Central Pattana’s valuations were becoming less appealing, in our view. Regarding Vale Indonesia, in our view, the country’s regulatory regime had become increasingly uncertain.
Conversely, we initiated a position in Tesco Lotus Retail Growth Freehold & Leasehold Property, a fund that invests in Tesco Lotus shopping malls. We feel that it offers an attractive yield and stands to benefit from a recovery in Thai retail spending. Additionally, we supported the rights issues of Bank OCBC NISP and BS Financial. We felt that the rights issues would provide both banks with the capital flexibility to grow in the Indonesian and Korean markets, respectively, particularly for BS Financial after its acquisition of Kyongnam Bank.
The divergence between major central banks’ monetary policies has become more pronounced, although how that translates into global capital flows is uncertain. In Asia, the slowdown in China remains a key concern and, in our opinion, should continue to sway market sentiment. Weaker demand in mainland China has hurt major trading partners, and activity may potentially moderate further with the Chinese government trying to prevent runaway credit expansion. However, we believe that the government has the resources to employ selective stimulus to cushion the slowdown. Ultimately, in our view, the selective stimulus may improve the quality of growth, even if it takes longer to achieve. Meanwhile, falling global oil prices have brought some reprieve to oil importing nations. In particular, India and Indonesia now have greater room to revise subsidies. This may potentially help resolve fiscal imbalances that, until recently, have handcuffed government spending on crucial areas such as infrastructure. India did just that, hiking gas prices while eliminating diesel subsidies. Indonesia, under newly elected president Joko Widodo, has made tackling fuel subsidies a cornerstone of its economic rejuvenation plan. We think that Japan also may benefit as lower oil prices mitigate the impact of the weaker yen on energy imports.
Portfolio Management:
Aberdeen Asia-Pacific Equity Team
PAST PERFORMANCE DOES NOT GUARANTEE FUTURE RESULTS.
The performance data quoted represents past performance and current returns may be lower or higher. Class A Shares have up to a 5.75% front-end sales charge and a 0.25% 12b-1 fee. The investment return and principal value will fluctuate so that an investor’s shares, when redeemed, may be worth more or less than the original cost. To obtain performance information current to the most recent month-end, which may be higher or lower than the performance shown above, please call 866-667-9231 or go to www.aberdeen-asset.us.
Investing in mutual funds involves risk, including the possible loss of principal.
Indexes are unmanaged and have been provided for comparison purposes only. No fees or expenses are reflected. You cannot invest directly in an index.
Lipper is a leading global provider of mutual fund information and analysis to fund companies, financial intermediaries and media organizations.
2014 Annual Report
9
Table of Contents
Aberdeen Asia-Pacific Smaller Companies Fund (Unaudited) (concluded)
Risk Considerations
Concentrating investments in the Asia-Pacific region subjects the Fund to more volatility and greater risk of loss than geographically diverse mutual funds.
Parts of the Asian-Pacific region may be subject to a greater degree of economic, political and social instability than is the case in the United States and Europe. Some Asian countries can be characterized as emerging markets or newly industrialized and may experience more volatile economic cycles than developed countries.
Foreign securities are more volatile, harder to price and less liquid than U.S. securities. They are subject to different accounting and regulatory standards, and political and economic risks. These risks are enhanced in emerging markets countries.
Equity stocks of small-cap companies carry greater risk, and more volatility than equity stocks of larger, more established companies.
Please read the prospectus for more detailed information regarding these and other risks.
Annual Report 2014
10
Table of Contents
Aberdeen Asia-Pacific Smaller Companies Fund (Unaudited)
Average Annual Total Return (For periods ended October 31, 2014) | 1 Yr. | Inception1 | ||||||||
Class A | w/o SC | 1.78% | 6.96% | |||||||
| w/SC2 | (4.04% | ) | 5.09% | |||||||
Class C | w/o SC | 1.16% | 6.19% | |||||||
| w/SC3 | 0.31% | 6.19% | ||||||||
Class R4 | w/o SC | 1.41% | 6.48% | |||||||
Institutional Service Class4 | w/o SC | 2.09% | 7.60% | |||||||
Institutional Class4 | w/o SC | 2.12% | 7.26% | |||||||
All figures showing the effect of a sales charge (SC) reflect the maximum charge possible because it has the most significant effect on performance data. The total returns shown above do not include the impact of financial statement rounding of the net asset value per share and/or financial statement adjustments.
| 1 | Fund commenced operations on June 28, 2011. |
| 2 | A 5.75% front-end sales charge was deducted. |
| 3 | A 1.00% contingent deferred sales charge (CDSC) was deducted from the one year return because it is charged when Class C shares are sold within the first year after purchase. |
| 4 | Not subject to any sales charges. |
2014 Annual Report
11
Table of Contents
Aberdeen Asia-Pacific Smaller Companies Fund (Unaudited)
Performance of a $10,000 Investment (as of October 31, 2014)
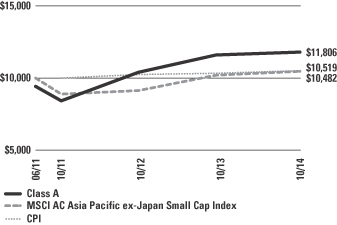
Comparative performance of $10,000 invested in Class A shares of the Aberdeen Asia-Pacific Smaller Companies Fund, Morgan Stanley Capital International All Country (MSCI AC) Asia Pacific ex-Japan Small Cap Index and the Consumer Price Index (CPI) since inception. Unlike the Fund, the returns for these unmanaged indexes do not reflect any fees, expenses, or sales charges. Investors cannot invest directly in market indexes.
The MSCI AC Asia Pacific ex-Japan Small Cap Index is a free float-adjusted, small market capitalization-weighted index that captures small cap representation across the Asia Pacific region excluding Japan including the following developed markets countries: Australia, Hong Kong, New Zealand and Singapore; and the following emerging markets countries: China, India, Indonesia, Korea, Malaysia, the Philippines, Taiwan and Thailand.
The CPI represents changes in prices of a basket of goods and services purchased for consumption by urban households.
Investment return and principal value will fluctuate, and when redeemed, shares may be worth more or less than original cost. Past performance is no guarantee of future results. The Average Annual Total Return table and Performance graph do not reflect the deduction of taxes that a shareholder would pay on fund distributions or the redemption of fund shares. Investing in mutual funds involves market risk, including loss of principal. Performance returns assume the reinvestment of all distributions. Total returns reflect waivers and reimbursements in effect, without which returns would have been lower.
Portfolio Summary (as a percentage of net assets)
October 31, 2014 (Unaudited)
| Asset Allocation | ||||
Common Stocks | 97.4% | |||
Repurchase Agreement | 2.7% | |||
Warrants | —% | |||
Liabilities in excess of other assets | (0.1% | ) | ||
| 100.0% | ||||
Amounts listed as “–” are 0% or round to 0%.
The following chart summarizes the composition of the Fund’s portfolio, in industry classification standard sectors, expressed as a percentage of net assets. An industry classification standard sector can include more than one industry group. As of October 31, 2014, the Fund did not have more than 25% of its assets invested in any industry group. The sectors, as classified by S&P’s Global Industry Classification Standard Sectors, are comprised of several industry groups.
| Top Sectors | ||||
Financials | 26.2% | |||
Consumer Discretionary | 21.6% | |||
Industrials | 14.6% | |||
Materials | 10.2% | |||
Consumer Staples | 9.9% | |||
Information Technology | 6.5% | |||
Health Care | 5.6% | |||
Utilities | 1.5% | |||
Telecommunication Services | 0.7% | |||
Energy | 0.6% | |||
Other | 2.6% | |||
| 100.0% | ||||
| Top Holdings* | ||||
Millennium & Copthorne Hotels PLC | 3.2% | |||
Aeon Co. (M) Bhd | 3.0% | |||
Dah Sing Financial Holdings Ltd. | 2.9% | |||
Venture Corp. Ltd. | 2.1% | |||
Oriental Holdings Bhd | 2.0% | |||
BS Financial Group, Inc. | 2.0% | |||
Shinsegae Co. Ltd. | 2.0% | |||
DGB Financial Group, Inc. | 1.9% | |||
Petra Foods Ltd. | 1.9% | |||
United Plantations Bhd | 1.9% | |||
Other | 77.1% | |||
| 100.0% | ||||
| Top Countries | ||||
Malaysia | 16.0% | |||
Singapore | 14.8% | |||
India | 12.3% | |||
Hong Kong | 11.7% | |||
Thailand | 10.8% | |||
Indonesia | 9.4% | |||
Republic of South Korea | 5.9% | |||
Australia | 3.9% | |||
United Kingdom | 3.2% | |||
China | 3.1% | |||
Other | 8.9% | |||
| 100.0% | ||||
| * | For the purpose of listing top holdings, repurchase agreements are included as part of Other. |
Annual Report 2014
12
Table of Contents
Statement of Investments
October 31, 2014
Aberdeen Asia-Pacific Smaller Companies Fund
| Shares or Principal Amount | Value | |||||||
COMMON STOCKS (97.4%) | ||||||||
AUSTRALIA (3.9%) | ||||||||
Consumer Discretionary (1.1%) | ||||||||
ARB Corp. Ltd. (a) | 28,845 | $ | 334,604 | |||||
Financials (1.4%) | ||||||||
Shopping Centres Australasia Property Group, REIT (a) | 271,000 | 432,556 | ||||||
Industrials (1.4%) | ||||||||
Cabcharge Australia Ltd. (a) | 102,416 | 446,631 | ||||||
| 1,213,791 | ||||||||
CHINA (3.1%) | ||||||||
Energy (0.6%) | ||||||||
Green Dragon Gas Ltd. (b) | 22,576 | 180,574 | ||||||
Greka Engineering & Technology Ltd. (b) | 121,761 | 3,409 | ||||||
| 183,983 | ||||||||
Financials (1.3%) | ||||||||
Yanlord Land Group Ltd. (a) | 460,000 | 392,401 | ||||||
Materials (1.2%) | ||||||||
Yingde Gases Group Co. Ltd. (a) | 500,000 | 390,421 | ||||||
| 966,805 | ||||||||
HONG KONG (11.7%) | ||||||||
Consumer Discretionary (4.3%) | ||||||||
Cafe de Coral Holdings Ltd. (a) | 30,000 | 107,566 | ||||||
Giordano International Ltd. (a) | 800,000 | 407,552 | ||||||
Hongkong & Shanghai Hotels Ltd. (The) (a) | 355,520 | 562,990 | ||||||
Texwinca Holdings Ltd. (a) | 298,000 | 261,530 | ||||||
| 1,339,638 | ||||||||
Consumer Staples (1.0%) | ||||||||
Convenience Retail Asia Ltd. | 460,000 | 306,661 | ||||||
Financials (3.4%) | ||||||||
AEON Credit Service (Asia) Co. Ltd. (a) | 82,000 | 67,033 | ||||||
Dah Sing Financial Holdings Ltd. (a) | 141,738 | 882,563 | ||||||
Public Financial Holdings Ltd. (a) | 214,000 | 102,199 | ||||||
| 1,051,795 | ||||||||
Industrials (2.3%) | ||||||||
Hong Kong Aircraft Engineering Co. Ltd. (a) | 12,400 | 136,241 | ||||||
Pacific Basin Shipping Ltd. (a) | 1,218,000 | 582,994 | ||||||
| 719,235 | ||||||||
Telecommunication Services (0.7%) | ||||||||
Asia Satellite Telecommunications Holdings Ltd. (a) | 63,000 | 219,446 | ||||||
| 3,636,775 | ||||||||
INDIA (12.3%) | ||||||||
Consumer Staples (1.6%) | ||||||||
Godrej Consumer Products Ltd. | 31,887 | 499,598 | ||||||
Health Care (2.6%) | ||||||||
Piramal Enterprises Ltd. | 19,500 | 255,977 | ||||||
Sanofi India Ltd. | 9,993 | 539,549 | ||||||
| 795,526 | ||||||||
Industrials (1.6%) | ||||||||
Container Corp. of India (a) | 22,203 | 486,709 | ||||||
Information Technology (2.4%) | ||||||||
CMC Ltd. | 14,834 | 468,697 | ||||||
MphasiS Ltd. (a) | 45,196 | 294,475 | ||||||
| 763,172 | ||||||||
Materials (3.7%) | ||||||||
Castrol (India) Ltd. (a) | 57,485 | 386,152 | ||||||
Kansai Nerolac Paints Ltd. | 9,668 | 303,109 | ||||||
Ramco Cements Ltd. (The) | 82,732 | 465,806 | ||||||
| 1,155,067 | ||||||||
Utilities (0.4%) | ||||||||
Gujarat Gas Co. Ltd. | 14,500 | 114,205 | ||||||
| 3,814,277 | ||||||||
INDONESIA (9.4%) | ||||||||
Consumer Discretionary (1.1%) | ||||||||
Astra Otoparts Tbk PT (a) | 1,031,900 | 335,927 | ||||||
Consumer Staples (3.8%) | ||||||||
M.P. Evans Group PLC | 37,345 | 270,028 | ||||||
Multi Bintang Indonesia Tbk PT | 3,000 | 310,302 | ||||||
Petra Foods Ltd. | 197,000 | 584,238 | ||||||
| 1,164,568 | ||||||||
Financials (1.6%) | ||||||||
Bank OCBC NISP Tbk PT (b) | 1,496,895 | 160,713 | ||||||
Bank Permata Tbk PT | 2,613,561 | 320,072 | ||||||
| 480,785 | ||||||||
Industrials (1.4%) | ||||||||
AKR Corporindo Tbk PT (a) | 1,070,300 | 436,059 | ||||||
Materials (1.5%) | ||||||||
Holcim Indonesia Tbk PT (a) | 2,470,400 | 480,312 | ||||||
| 2,897,651 | ||||||||
MALAYSIA (16.0%) | ||||||||
Consumer Discretionary (6.4%) | ||||||||
Aeon Co. (M) Bhd | 815,200 | 929,391 | ||||||
Oriental Holdings Bhd | 283,900 | 630,937 | ||||||
Panasonic Manufacturing Malaysia Bhd | 23,600 | 136,323 | ||||||
Shangri-La Hotels Malaysia Bhd | 123,400 | 264,489 | ||||||
| 1,961,140 | ||||||||
Consumer Staples (3.5%) | ||||||||
Carlsberg Brewery Malaysia Bhd | 40,000 | 134,985 | ||||||
Guinness Anchor Bhd (a) | 34,300 | 134,961 | ||||||
United Malacca Bhd | 114,000 | 236,370 | ||||||
See accompanying Notes to Financial Statements.
2014 Annual Report
13
Table of Contents
Statement of Investments (continued)
October 31, 2014
Aberdeen Asia-Pacific Smaller Companies Fund
| Shares or Principal Amount | Value | |||||||
United Plantations Bhd (a) | 75,000 | $ | 583,846 | |||||
| 1,090,162 | ||||||||
Financials (3.4%) | ||||||||
Alliance Financial Group Bhd (a) | 321,600 | 468,723 | ||||||
Bursa Malaysia Bhd (a) | 59,600 | 146,677 | ||||||
SP Setia Bhd | 292,626 | 292,693 | ||||||
YNH Property Bhd | 234,993 | 147,886 | ||||||
| 1,055,979 | ||||||||
Industrials (1.1%) | ||||||||
Pos Malaysia Bhd (a) | 217,700 | 334,354 | ||||||
Materials (1.6%) | ||||||||
Batu Kawan Bhd (a) | 29,000 | 162,611 | ||||||
Tasek Corp. Bhd | 66,400 | 337,123 | ||||||
| 499,734 | ||||||||
| 4,941,369 | ||||||||
NETHERLANDS (0.6%) | ||||||||
Information Technology (0.6%) | ||||||||
ASM International NV (a) | 4,300 | 172,313 | ||||||
PHILIPPINES (2.8%) | ||||||||
Consumer Discretionary (0.8%) | ||||||||
Jollibee Foods Corp. (a) | 59,420 | 259,494 | ||||||
Financials (0.5%) | ||||||||
Cebu Holdings, Inc. | 1,329,500 | 152,726 | ||||||
Industrials (0.4%) | ||||||||
Asian Terminals, Inc. (a) | 444,200 | 123,644 | ||||||
Utilities (1.1%) | ||||||||
Manila Water Co., Inc. | 505,400 | 325,483 | ||||||
| 861,347 | ||||||||
REPUBLIC OF SOUTH KOREA (5.9%) | ||||||||
Consumer Discretionary (2.0%) | ||||||||
Shinsegae Co. Ltd. (a) | 3,240 | 601,042 | ||||||
Financials (3.9%) | ||||||||
BS Financial Group, Inc. (a) | 40,144 | 624,667 | ||||||
DGB Financial Group, Inc. (a) | 41,400 | 590,370 | ||||||
| 1,215,037 | ||||||||
| 1,816,079 | ||||||||
SINGAPORE (14.8%) | ||||||||
Financials (6.3%) | ||||||||
Ascendas Hospitality Trust, REIT | 405,000 | 222,250 | ||||||
Bukit Sembawang Estates Ltd. (a) | 110,000 | 454,745 | ||||||
CDL Hospitality Trusts, REIT (a) | 240,000 | 322,641 | ||||||
Far East Hospitality Trust, REIT | 650,000 | 419,942 | ||||||
Hong Leong Finance Ltd. (a) | 25,000 | 50,637 | ||||||
Wheelock Properties (Singapore) Ltd. (a) | 205,000 | 287,676 | ||||||
Yoma Strategic Holdings Ltd. (a)(b) | 346,000 | 180,422 | ||||||
| 1,938,313 | ||||||||
Health Care (1.9%) | ||||||||
Eu Yan Sang International Ltd. | 170,000 | 99,906 | ||||||
Raffles Medical Group Ltd. (a) | 165,315 | 489,421 | ||||||
| 589,327 | ||||||||
Industrials (3.9%) | ||||||||
ComfortDelGro Corp. Ltd. (a) | 230,000 | 472,881 | ||||||
SATS Ltd. (a) | 144,000 | 347,523 | ||||||
SBS Transit Ltd. | 9,500 | 12,275 | ||||||
Singapore Post Ltd. (a) | 241,000 | 369,904 | ||||||
| 1,202,583 | ||||||||
Information Technology (2.1%) | ||||||||
Venture Corp. Ltd. (a) | 110,000 | 662,574 | ||||||
Materials (0.6%) | ||||||||
Straits Trading Co. Ltd. (a) | 90,500 | 203,312 | ||||||
| 4,596,109 | ||||||||
SRI LANKA (2.9%) | ||||||||
Financials (0.4%) | ||||||||
Commercial Bank of Ceylon PLC (a) | 109,646 | 139,257 | ||||||
Industrials (2.5%) | ||||||||
Aitken Spence & Co. PLC | 234,381 | 188,186 | ||||||
John Keells Holdings PLC (a) | 292,192 | 575,720 | ||||||
| 763,906 | ||||||||
| 903,163 | ||||||||
THAILAND (10.8%) | ||||||||
Consumer Discretionary (2.7%) | ||||||||
BEC World PCL, Foreign Shares (a) | 318,200 | 471,522 | ||||||
Minor International PCL, Foreign Shares (a) | 330,000 | 352,043 | ||||||
| 823,565 | ||||||||
Financials (4.0%) | ||||||||
AEON Thana Sinsap Thailand PCL, NVDR | 119,000 | 396,423 | ||||||
Tesco Lotus Retail Growth Freehold & Leasehold Property Fund (c) | 390,000 | 153,270 | ||||||
Tisco Financial Group PCL, Foreign Shares (a) | 282,000 | 385,533 | ||||||
Tisco Financial Group PCL, NVDR (a) | 220,000 | 300,771 | ||||||
| 1,235,997 | ||||||||
Health Care (1.1%) | ||||||||
Bumrungrad Hospital PCL, Foreign Shares (a) | 85,700 | 350,002 | ||||||
Information Technology (1.4%) | ||||||||
Hana Microelectronics PCL, Foreign Shares (a) | 330,900 | 441,945 | ||||||
Materials (1.6%) | ||||||||
Siam City Cement PCL, Foreign Shares (a) | 39,000 | 502,932 | ||||||
| 3,354,441 | ||||||||
UNITED KINGDOM (3.2%) | ||||||||
Consumer Discretionary (3.2%) | ||||||||
Millennium & Copthorne Hotels PLC | 109,682 | 996,603 | ||||||
Total Common Stocks | 30,170,723 | |||||||
See accompanying Notes to Financial Statements.
Annual Report 2014
14
Table of Contents
Statement of Investments (concluded)
October 31, 2014
Aberdeen Asia-Pacific Smaller Companies Fund
| Shares or Principal Amount | Value | |||||||
WARRANTS (0.0%) | ||||||||
SRI LANKA (0.0%) | ||||||||
Industrials (0.0%) | ||||||||
John Keells Holdings PLC, expires 11/11/16 (b) | 7,564 | $ | 4,627 | |||||
John Keells Holdings PLC, expires 11/12/15 (b) | 7,564 | 4,338 | ||||||
| 8,965 | ||||||||
THAILAND (0.0%) | ||||||||
Consumer Discretionary (0.0%) | ||||||||
Minor International PLC, expires 11/03/17 (b) | 16,500 | 0 | ||||||
Total Warrants | 8,965 | |||||||
REPURCHASE AGREEMENT (2.7%) | ||||||||
UNITED STATES (2.7%) | ||||||||
Repurchase Agreement, Fixed Income Clearing Corp., 0.00%, dated 10/31/2014, due 11/03/2014, repurchase price $831,000, collateralized by U.S. Treasury Note, maturing 10/31/2021; total market value of $847,795 | $ | 831,000 | 831,000 | |||||
Total Repurchase Agreement | 831,000 | |||||||
Total Investments | 31,010,688 | |||||||
Liabilities in excess of other assets—(0.1)% | (37,368 | ) | ||||||
Net Assets—100.0% | $ | 30,973,320 | ||||||
| (a) | Fair Valued Security. Fair Values are determined pursuant to procedures approved by the Fund’s Board of Trustees. See Note 2(a) of the accompanying Notes to Financial Statements. |
| (b) | Non-income producing security. |
| (c) | As of October 31, 2014, security is a closed-end fund incorporated in Thailand. |
| (d) | See Notes to Financial Statements for tax unrealized appreciation/depreciation of securities. |
| NVDR | Non-Voting Depositary Receipt |
| REIT | Real Estate Investment Trust |
See accompanying Notes to Financial Statements.
2014 Annual Report
15
Table of Contents
Aberdeen China Opportunities Fund (Unaudited)
The Aberdeen China Opportunities Fund (Class A shares at net asset value net of fees) returned -0.82% for the 12-month period ended October 31, 2014, versus the 7.87% return of its benchmark, the MSCI Zhong Hua Index, during the same period. For broader comparison, the average return of the Fund’s Lipper peer category of China Region Funds (consisting of 47 funds) was 6.19% for the period.
Equity markets in China and Hong Kong rallied during the reporting period. Stocks initially were boosted by optimism over details about the Chinese government’s Third Plenum1 reforms, which included liberalizing the financial sector. Towards the end of the first half of the period, however, the contraction in China’s manufacturing activity dragged equity markets lower. Liquidity was tight in the mainland, prompting the central bank to pump funds into the financial system. Concerns over shadow banking2 persisted, exacerbated by a landmark bond default. Further uncertainty was fuelled by the tumble of the yuan, the nation’s currency unit. But confidence recovered following the reform of state-owned enterprises. Investors were also excited over pilot schemes for the China (Shanghai) Pilot Free-Trade Zone as well as the Shanghai–Hong Kong Stock Connect program,3 as these were seen as significant steps towards cross-border capital market integration. On the economic front, China’s better-than-expected gross domestic product (GDP) growth data for the first half of 2014 also reassured markets, albeit this was driven by state-backed investment and lending. Gains were pared in anticipation of the end of quantitative easing in the U.S., which happened at the end of the reporting period, as well as political jitters over the ongoing pro-democracy protests in Hong Kong.
The lack of exposure to Tencent was the most notable detractor from Fund performance over the reporting period, relative to the Fund’s benchmark. The Chinese Internet company’s shares rallied as investors expected mobile gaming revenues to boost its growth prospects. Market sentiment towards the stock also strengthened after it bought a stake in a Chinese logistics operator in a bid to boost its e-commerce business, as well as in response to reports that it may invest in a restaurant and entertainment guide website. However, we feel that its valuation since has become more stretched and we remain cautious on the sector given our concerns regarding the variable interest entity4 structure.
Other detractors from Fund performance for the period included retailer Giordano, which was hurt by the challenging macroeconomic environment, as well as Standard Chartered. The lender’s stock price weakened after the third profit warning in a year as it delivered its results for the first nine months of its 2014 fiscal year. Management cited high impairment charges as some corporate and institutional clients were hurt by weakening commodity markets. Investor sentiment was also dampened by speculation that U.S. regulators could reinvestigate alleged sanction violations against Standard Chartered. Some of its problems are cyclical and, we believe, may be resolved in the medium term. In our opinion, more structural difficulties may require management to reprioritize investments, divest non-core businesses and streamline riskier portfolios.
The primary contributors to the Fund’s relative return for the review period included Green Dragon Gas (GDG) and Samsonite International. GDG’s shares climbed sharply after it agreed to a deal with China National Offshore Oil Corporation (CNOOC) regarding five of its production sharing contracts in China. The agreement will secure GDG’s interest and revenue share of approximately 1,600 wells drilled by CNOOC’s subsidiary, China United Coalbed Methane Corporation. Samsonite International saw healthy growth during the period across all businesses, particularly in Asia and the American Tourister brand.
The absence of a position in Industrial & Commercial Bank of China also had a positive impact on performance, relative to the Fund’s benchmark, as Chinese banks were dogged by worries over asset quality, particularly focused on the banks’ off-balance sheet items, which may potentially be de facto liabilities due to implicit guarantees. The lack of transparency on shadow banking assets also makes it difficult for investors to quantify potential losses, in our view.
During the reporting period, we initiated a position in global logistics company Kerry Logistics. We like the company for its integrated capabilities, which are hard to replicate, in our opinion. Additionally, the group continues to increase its substantial exposure to China, where it has the largest distribution network.
Against this, we exited the Fund’s position in Wing Hang Bank following its takeover by OCBC. We also exited the position in China Vanke’s H-shares,5 which rose substantially after being converted from the B-shares. We retain exposure to the company through its A-shares, which trade at a significant discount.
A fundamental restructuring of China’s economy lies ahead and this means a prolonged period of slower growth, in our opinion. Poor economic data arising from this may continue to sway market sentiment. Despite market movements, we feel that policymakers are unlikely to implement aggressive fiscal or credit policies. We think that monetary policy may continue to accommodate economic transition, while averting liquidity crises. Recently, the Chinese central bank raised the reference rate for the yuan, while the
| 1 | The Third Plenum of the 18th Chinese Communist Party Congress was held in November 2013. This plenum has historically been a platform for Chinese leaders to present their long-term vision for the economy. |
| 2 | Shadow banking refers to the financial intermediaries involved in facilitating the creation of credit across the global financial system, but whose members are not subject to regulatory oversight. The shadow banking system also refers to unregulated activities by regulated institutions. |
| 3 | Shanghai–Hong Kong Stock Connect is a pilot program that links the stock markets in Shanghai and Hong Kong. Under the program, investors in Hong Kong and Mainland China can trade and settle shares listed on the other market via the exchange and clearing house in their home market. |
| 4 | An entity in which equity investors do not have the characteristics of a controlling financial interest (i.e., they lack certain decision-making ability) or do not have sufficient equity at risk for the entity to finance its activities without additional subordinated financial support. |
| 5 | Shares of a company incorporated in the Chinese mainland that is listed on the Hong Kong Stock Exchange or other foreign exchange. |
Annual Report 2014
16
Table of Contents
Aberdeen China Opportunities Fund (Unaudited) (concluded)
Hong Kong Monetary Authority scrapped the yuan-conversion limit, both of which may potentially strengthen the currency and boost its global standing.
In our view, the developments that will be keenly monitored include the commencement of the Shanghai-Hong Kong Stock Connect program, which marks the first step towards the internationalization of the mainland’s capital markets. It expands investment choices for investors on both sides of the border and paves the way for the further opening up of the renminbi and China’s capital account.6 This may enhance Hong Kong’s position as the world’s primary offshore renminbi center and reinforces it as the gateway between China and international markets.
The ensuing euphoria resulting from the Shanghai-Hong Kong Stock Connect program will not change the way we identify investment opportunities. We have always followed a bottom-up, long-term investment strategy based on the thorough assessment of a company’s merits. However, we are carefully monitoring the impact of this new program on our holding in Hong Kong Exchanges and Clearing. If the new program is successful, there is scope for an expansion that includes the cross-border trading of even more asset classes.
Portfolio Management:
Aberdeen Asia-Pacific Equity Team
PAST PERFORMANCE DOES NOT GUARANTEE FUTURE RESULTS.
The performance data quoted represents past performance and current returns may be lower or higher. Class A Shares have up to a 5.75% front-end sales charge and a 0.25% 12b-1 fee. The investment return and principal value will fluctuate so that an investor’s shares, when redeemed, may be worth more or less than the original cost. To obtain performance information current to the most recent month-end, which may be higher or lower than the performance shown above, please call 866-667-9231 or go to www.aberdeen-asset.us.
Investing in mutual funds involves risk, including the possible loss of principal.
Indexes are unmanaged and have been provided for comparison purposes only. No fees or expenses are reflected. You cannot invest directly in an index.
Lipper is a leading global provider of mutual fund information and analysis to fund companies, financial intermediaries and media organizations.
Risk Considerations
Concentrating investments in China and Hong Kong subjects the Fund to more volatility and greater risk of loss than geographically diverse mutual funds.
Additional risks associated with investments in China and Hong Kong include exposure to currency fluctuations, less liquidity, expropriation, confiscatory taxation, nationalization, exchange control regulations (including currency blockage) and differing legal standards.
Foreign securities are more volatile, harder to price and less liquid than U.S. securities. They are subject to different accounting and regulatory standards, and political and economic risks. These risks are enhanced in emerging markets countries.
Equity stocks of small and mid-cap companies carry greater risk, and more volatility than equity stocks of larger, more established companies.
Please read the prospectus for more detailed information regarding these and other risks.
| 6 | Under China’s closed capital account, companies, banks and individuals cannot move money in or out of the country except in accordance with strict rules. The limit for individuals is currently $50,000 a year, while corporate investments need government approval. |
2014 Annual Report
17
Table of Contents
Aberdeen China Opportunities Fund (Unaudited)
Average Annual Total Return1 (For periods ended October 31, 2014) | 1 Yr. | 5 Yr. | 10 Yr. | |||||||||||
Class A | w/o SC | (0.82% | ) | 5.24% | 11.46% | |||||||||
| w/SC2 | (6.51% | ) | 4.00% | 10.80% | ||||||||||
Class C | w/o SC | (1.57% | ) | 4.49% | 10.64% | |||||||||
| w/SC3 | (2.55% | ) | 4.49% | 10.64% | ||||||||||
Class R4 | w/o SC | (1.25% | ) | 4.90% | 11.13% | |||||||||
Institutional Service Class4 | w/o SC | (0.56% | ) | 5.54% | 11.73% | |||||||||
Institutional Class4 | w/o SC | (0.65% | ) | 5.47% | 11.73% | |||||||||
All figures showing the effect of a sales charge (SC) reflect the maximum charge possible because it has the most significant effect on performance data. The total returns shown above do not include the impact of financial statement rounding of the net asset value per share and/or financial statement adjustments.
| 1 | Returns incorporate the performance of a predecessor fund (the “Predecessor Fund”) from inception to June 23, 2008. The Fund and the Predecessor Fund have substantially similar investment objectives and strategies. Please consult the Fund’s prospectus for more detail. |
| 2 | A 5.75% front-end sales charge was deducted. |
| 3 | A 1.00% contingent deferred sales charge (CDSC) was deducted from the one year return because it is charged when Class C shares are sold within the first year after purchase. |
| 4 | Not subject to any sales charges. |
Annual Report 2014
18
Table of Contents
Aberdeen China Opportunities Fund (Unaudited)
Performance of a $10,000 Investment (as of October 31, 2014)
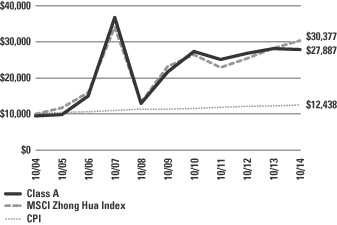
Comparative performance of $10,000 invested in Class A shares of the Aberdeen China Opportunities Fund, Morgan Stanley Capital International (MSCI) Zhong Hua Index and the Consumer Price Index (CPI) over a 10-year period ended October 31, 2014. Unlike the Fund, the returns for these unmanaged indexes do not reflect any fees, expenses, or sales charges. Investors cannot invest directly in market indexes.
The MSCI Zhong Hua Index is a free float-adjusted, market capitalization-weighted index that is an aggregate of the MSCI Hong Kong Index and the MSCI China Index. The MSCI Hong Kong Index is designed to measure the performance of the large and mid cap segments of the Hong Kong market. The MSCI China Index captures large and mid capitalization across China H shares, B shares, Red chips, and P chips.
The CPI represents changes in prices of a basket of goods and services purchased for consumption by urban households.
Investment returns and principal value will fluctuate, and when redeemed, shares may be worth more or less than original cost. Past performance is no guarantee of future results. The Average Annual Total Return table and Performance graph do not reflect the deduction of taxes that a shareholder would pay on fund distributions or the redemption of fund shares. Investing in mutual funds involves market risk, including loss of principal. Performance returns assume the reinvestment of all distributions. Total returns reflect waivers and reimbursements in effect, without which returns would have been lower.
Portfolio Summary (as a percentage of net assets)
October 31, 2014 (Unaudited)
| Asset Allocation | ||||
Common Stocks | 99.0% | |||
Repurchase Agreement | 0.4% | |||
Other assets in excess of liabilities | 0.6% | |||
| 100.0% | ||||
The following chart summarizes the composition of the Fund’s portfolio, in industry classification standard sectors, expressed as a percentage of net assets. An industry classification standard sector can include more than one industry group. As of October 31, 2014, the Fund did not have more than 25% of its assets invested in any industry group. The sectors, as classified by S&P’s Global Industry Classification Standard Sectors, are comprised of several industry groups.
| Top Sectors | ||||
Financials | 36.9% | |||
Consumer Discretionary | 17.9% | |||
Industrials | 17.9% | |||
Energy | 8.7% | |||
Consumer Staples | 5.5% | |||
Telecommunication Services | 4.8% | |||
Materials | 3.2% | |||
Information Technology | 2.5% | |||
Utilities | 1.6% | |||
Other | 1.0% | |||
| 100.0% | ||||
| Top Holdings* | ||||
Jardine Strategic Holdings Ltd. | 8.3% | |||
Swire Pacific Ltd., Class B | 6.6% | |||
AIA Group Ltd. | 5.7% | |||
MTR Corp. Ltd. | 5.0% | |||
HSBC Holdings PLC | 4.8% | |||
Hang Lung Group Ltd. | 4.2% | |||
China Mobile Ltd. | 3.9% | |||
PetroChina Co. Ltd., H Shares | 3.7% | |||
CNOOC Ltd. | 3.4% | |||
Hongkong & Shanghai Hotels Ltd. (The) | 3.0% | |||
Other | 51.4% | |||
| 100.0% | ||||
| Top Countries | ||||
Hong Kong | 71.8% | |||
China | 24.4% | |||
United States | 3.2% | |||
Other | 0.6% | |||
| 100.0% | ||||
| * | For the purpose of listing top holdings, repurchase agreements are included as part of Other. |
2014 Annual Report
19
Table of Contents
Statement of Investments
October 31, 2014
Aberdeen China Opportunities Fund
| Shares or Principal Amount | Value | |||||||
COMMON STOCKS (99.0%) | ||||||||
CHINA (24.4%) | ||||||||
Consumer Staples (2.8%) | ||||||||
China Resources Enterprise Ltd. (a) | 360,000 | $ | 856,257 | |||||
Energy (8.7%) | ||||||||
CNOOC Ltd. (a) | 651,000 | 1,017,720 | ||||||
Green Dragon Gas Ltd. (b) | 58,000 | 463,913 | ||||||
Greka Drilling Ltd. (a)(b) | 225,000 | 30,827 | ||||||
Greka Engineering & Technology Ltd. (b) | 174,000 | 4,871 | ||||||
PetroChina Co. Ltd., H Shares (a) | 894,000 | 1,120,390 | ||||||
| 2,637,721 | ||||||||
Financials (6.4%) | ||||||||
China Merchants Bank Co. Ltd., A Shares (a)(c) | 453,000 | 800,795 | ||||||
China Vanke Co. Ltd., A Shares (a)(c) | 438,000 | 673,003 | ||||||
Yanlord Land Group Ltd. (a) | 550,000 | 469,175 | ||||||
| 1,942,973 | ||||||||
Materials (2.6%) | ||||||||
Huaxin Cement Co. Ltd., B Shares | 298,240 | 321,503 | ||||||
Yingde Gases Group Co. Ltd. (a) | 597,000 | 466,162 | ||||||
| 787,665 | ||||||||
Telecommunication Services (3.9%) | ||||||||
China Mobile Ltd. (a) | 94,500 | 1,178,254 | ||||||
| 7,402,870 | ||||||||
HONG KONG (71.8%) | ||||||||
Consumer Discretionary (15.1%) | ||||||||
AEON Stores (Hong Kong) Co. Ltd. | 286,500 | 358,349 | ||||||
Giordano International Ltd. (a) | 1,124,000 | 572,611 | ||||||
Global Brands Group Holding Ltd. (b) | 554,380 | 122,240 | ||||||
Hongkong & Shanghai Hotels Ltd. (The) (a) | 572,757 | 906,999 | ||||||
Li & Fung Ltd. (a) | 614,380 | 749,560 | ||||||
Samsonite International SA (a) | 257,300 | 854,937 | ||||||
Shangri-La Asia Ltd. (a) | 474,000 | 689,472 | ||||||
Texwinca Holdings Ltd. (a) | 386,000 | 338,760 | ||||||
| 4,592,928 | ||||||||
Consumer Staples (2.7%) | ||||||||
Convenience Retail Asia Ltd. | 122,000 | 81,332 | ||||||
Dairy Farm International Holdings Ltd. | 76,500 | 734,400 | ||||||
| 815,732 | ||||||||
Financials (30.5%) | ||||||||
AIA Group Ltd. (a) | 312,400 | 1,743,325 | ||||||
Dah Sing Banking Group Ltd. (a) | 289,440 | 525,892 | ||||||
Hang Lung Group Ltd. (a) | 252,000 | 1,267,828 | ||||||
Hang Lung Properties Ltd. (a) | 46,000 | 143,646 | ||||||
Hong Kong Exchanges and Clearing Ltd. (a) | 25,800 | 572,843 | ||||||
HSBC Holdings PLC (a) | 141,872 | 1,451,719 | ||||||
Standard Chartered PLC (HK Listing) (a) | 58,240 | 901,403 | ||||||
Swire Pacific Ltd., Class A (a) | 2,000 | 26,259 | ||||||
Swire Pacific Ltd., Class B (a) | 825,000 | 2,002,435 | ||||||
Swire Properties Ltd. (a) | 195,400 | 626,122 | ||||||
| 9,261,472 | ||||||||
Industrials (17.9%) | ||||||||
Hong Kong Aircraft Engineering Co. Ltd. (a) | 43,200 | 474,646 | ||||||
Jardine Strategic Holdings Ltd. (a) | 70,500 | 2,513,091 | ||||||
Kerry Logistics Network Ltd. (a) | 258,000 | 420,641 | ||||||
MTR Corp. Ltd. (a) | 369,844 | 1,508,032 | ||||||
Pacific Basin Shipping Ltd. (a) | 1,096,000 | 524,599 | ||||||
| 5,441,009 | ||||||||
Information Technology (2.5%) | ||||||||
ASM Pacific Technology Ltd. (a) | 67,600 | 744,941 | ||||||
Materials (0.6%) | ||||||||
Hung Hing Printing Group Ltd. | 1,288,000 | 187,674 | ||||||
Telecommunication Services (0.9%) | ||||||||
Asia Satellite Telecommunications Holdings Ltd. (a) | 75,500 | 262,987 | ||||||
Utilities (1.6%) | ||||||||
Hong Kong & China Gas Co. Ltd. (a) | 211,900 | 494,826 | ||||||
| 21,801,569 | ||||||||
UNITED STATES (2.8%) | ||||||||
Consumer Discretionary (2.8%) | ||||||||
Yum! Brands, Inc. | 11,974 | 860,093 | ||||||
Total Common Stocks | 30,064,532 | |||||||
REPURCHASE AGREEMENT (0.4%) | ||||||||
UNITED STATES (0.4%) | ||||||||
Repurchase Agreement, Fixed Income Clearing Corp., 0.00%, dated 10/31/2014, due 11/03/2014, repurchase price $130,000 collateralized by U.S. Treasury Note, maturing 10/31/2021; total market value of $134,650 | $ | 130,000 | 130,000 | |||||
Total Repurchase Agreement | 130,000 | |||||||
Total Investments | 30,194,532 | |||||||
Other assets in excess of liabilities—0.6% | 170,696 | |||||||
Net Assets—100.0% | $ | 30,365,228 | ||||||
| (a) | Fair Valued Security. Fair Values are determined pursuant to procedures approved by the Fund’s Board of Trustees. See Note 2(a) of the accompanying Notes to Financial Statements. |
| (b) | Non-income producing security. |
| (c) | China A shares. These shares are issued in local currency, traded in the local stock markets and are held through a qualified foreign institutional investor license. |
| (d) | See Notes to Financial Statements for tax unrealized appreciation/depreciation of securities. |
See accompanying Notes to Financial Statements.
Annual Report 2014
20
Table of Contents
Aberdeen Emerging Markets Fund (Unaudited)
The Aberdeen Emerging Markets Fund (Class A shares at net asset value net of fees) returned -1.37% for the 12-month period ended October 31, 2014, versus the 0.98% return of its benchmark, the MSCI Emerging Markets Index, during the same period. For broader comparison, the average return of the Fund’s Lipper peer category of Emerging Markets Funds (consisting of 318 funds) was 1.23% for the period.
Emerging market equities, as measured by the MSCI Emerging Markets Index, rose in the year under review. Despite an initial pullback because of early concerns over the U.S. Federal Reserve’s (Fed) withdrawal of its monetary stimulus and China’s slowing economic growth, markets subsequently resumed their uptrend, as it appeared that investors took the Fed’s gradual reduction of its asset purchases in stride. Hopes of political change in key developing economies and continued monetary largesse from the world’s major central banks provided further impetus to markets. The gains, however, were capped by renewed worries of an earlier-than-expected U.S. interest rate hike. In our view, a continued deceleration of growth in China and Europe also cast doubts over the global recovery, while the protests in Hong Kong exacerbated already-heightened geopolitical tensions caused by the crises in Ukraine and the Middle East.
The top contributors to the Fund’s relative performance during the reporting period included Indian holdings such as Housing Development Finance Corp. (HDFC), ICICI Bank, UltraTech Cement, and Hero MotoCorp. These companies were beneficiaries of the election-related euphoria that pushed the Indian market to all-time highs. Shares of ICICI Bank and mortgage lender HDFC were further lifted by hopes of better loan growth, while UltraTech Cement gained on expectations of increased infrastructure spending. Motorcycle manufacturer Hero MotoCorp enjoyed solid sales growth over the period amid signs it was winning back market share from competitors.
South Korean technology company Samsung Electronics was another key contributor to performance. The Fund holds the company’s preferred shares, which outperformed the ordinary shares of the company. The stock performed well on the back of record-high operating profits, but came under pressure when management warned of weaker handset margins in the second half of 2014. While we are aware that Samsung is facing increasing competition from mid- to low-end Chinese smartphone rivals, we believe it remains well placed, given its vertically integrated operation. Additionally, we are beginning to see a turnaround in the memory division, a key business segment.
The main performance laggards at the stock level for the reporting period were Standard Chartered and Vale. Emerging markets lender Standard Chartered’s shares weakened after the third profit warning in a year as the bank delivered its nine-month results for its 2014 fiscal year. Management cited high impairment charges as some corporate and institutional clients were hurt by weakening commodity markets. Investor sentiment was also dampened by speculation that U.S. regulators could reinvestigate alleged sanction violations against Standard Chartered. Some of its problems are cyclical and should be resolved in the medium term, in our view. More structural difficulties may potentially require management to reprioritize investments, divest non-core businesses and streamline riskier portfolios. Declining iron ore prices hurt Vale; the Brazilian miner swung to a loss in the third quarter because of sustained weakness in commodity prices and a depreciating local currency, the Brazilian real.
The absence of a position in Hong Kong-listed Chinese Internet company Tencent also detracted from Fund performance, relative to the Fund’s benchmark. Shares of the Chinese Internet company were buoyed by good results and a number of acquisitions that were expected to boost its market share in the online search and e-commerce segments. However, we remain deterred by what we feel is Tencent’s opaque ownership structure, in addition to its high valuation.
Regarding Fund activity during the reporting period, we initiated a position in Jeronimo Martins, a well-run retailer with an established franchise in Poland at an attractive valuation, in our opinion. We also added to several holdings, including leading Russian food retailer Magnit, on valuation grounds. Magnit’s share price had declined along with the local stock market amid tensions over the political crisis in Ukraine. Its operational results earlier in the calendar year also did not meet the market’s expectations. However, robust gross margins and lower operating expenses supported the company’s most recent quarterly results, prompting management to upgrade its full-year 2014 sales and earnings forecasts. Conversely, we sold the Fund’s shares in GlaxoSmithKline Pharmaceuticals of India following the successful tender offer by its parent company, United Kingdom-based GlaxoSmithKline, and trimmed Brazilian fuels and chemicals company Ultrapar, global specialist steel-pipe maker Tenaris, Indian mortgage lender HDFC, and Turkish lender Akbank.
The divergence in monetary policy across the world is becoming more pronounced, with other major central banks accelerating quantitative easing at a time when the Fed has just concluded its asset purchases. The European Central Bank has begun to purchase covered bonds* in an effort to revive growth and keep deflation in check, while the Bank of Japan is injecting trillions of yen in a bid to boost the country’s monetary base. How all these translate into capital flows into emerging markets remain to be seen, in our view. Meanwhile, the imminent change in U.S. monetary policy will be closely watched. Although volatility and capital outflows cannot be ruled out when the Fed eventually hikes rates, we think that a prolonged slump in emerging stock markets is unlikely.
Many developing economies, including those most vulnerable to capital flight, are better prepared now than during last year’s “taper tantrums,” in our opinion. Current account deficits have narrowed (or at least have remained unchanged), and real interest rates have generally turned positive. We believe that, should the U.S. raise interest rates because of a sturdier economic rebound, developing
2014 Annual Report
21
| * | Covered bonds are securities backed by assets such as mortgage loans. |
Table of Contents
Aberdeen Emerging Markets Fund (Unaudited) (concluded)
economies, in particular those of the export-driven nations, would benefit. For China, we feel that the return to the previous pace of breakneck expansion appears slim as policymakers continue to balance reform and growth. But the inevitable shift towards a more sustainable consumption-led economy is necessary, in our view, even if this could herald short-term risks.
For us at Aberdeen, investing in companies that we view as fundamentally sound and well managed is an imperative that we believe should help negate the vagaries of market sentiment. Recent earnings from our holdings have been largely steady or met expectations despite the muted economic backdrop. Renewed efforts to boost profits through cost reductions and improving margins are further along, even though it may be some time before a broader rebound is evident. Many of these companies are market leaders and have weathered periods of crises; we think it should be no different this time. With valuations still attractive, in our view, we will be looking to add to favored holdings when opportunities arise.
Portfolio Management:
Aberdeen Global Emerging Markets Equity Team
PAST PERFORMANCE DOES NOT GUARANTEE FUTURE RESULTS.
The performance data quoted represents past performance and current returns may be lower or higher. Class A Shares have up to a 5.75% front-end sales charge and a 0.25% 12b-1 fee. The investment return and principal value will fluctuate so that an investor’s shares, when redeemed, may be worth more or less than the original cost. To obtain performance information current to the most recent month-end, which may be higher or lower than the performance shown above, please call 866-667-9231 or go to www.aberdeen-asset.us.
Investing in mutual funds involves risk, including the possible loss of principal.
Indexes are unmanaged and have been provided for comparison purposes only. No fees or expenses are reflected. You cannot invest directly in an index.
Lipper is a leading global provider of mutual fund information and analysis to fund companies, financial intermediaries and media organizations.
Risk Considerations
Foreign securities are more volatile, harder to price and less liquid than U.S. securities. They are subject to different accounting and regulatory standards, and political and economic risks. These risks are enhanced in emerging markets countries.
Equity stocks of small and mid-cap companies carry greater risk, and more volatility than equity stocks of larger, more established companies.
Please read the prospectus for more detailed information regarding these and other risks.
Annual Report 2014
22
Table of Contents
Aberdeen Emerging Markets Fund (Unaudited)
Average Annual Total Return1 (For periods ended October 31, 2014) | 1 Yr. | 5 Yr. | Inception2 | |||||||||||
Class A3 | w/o SC | (1.37% | ) | 8.11% | 7.44% | |||||||||
| w/SC4 | (7.02% | ) | 6.83% | 6.59% | ||||||||||
Class C3 | w/o SC | (2.04% | ) | 7.75% | 7.20% | |||||||||
| w/SC5 | (3.01% | ) | 7.75% | 7.20% | ||||||||||
Class R3,6 | w/o SC | (1.76% | ) | 7.94% | 7.33% | |||||||||
Institutional Service Class6,7 | w/o SC | (1.29% | ) | 8.08% | 7.43% | |||||||||
Institutional Class6 | w/o SC | (1.01% | ) | 8.29% | 7.56% | |||||||||
All figures showing the effect of a sales charge (SC) reflect the maximum charge possible because it has the most significant effect on performance data. The total returns shown above do not include the impact of financial statement rounding of the net asset value per share and/or financial statement adjustments.
| 1 | Returns prior to November 23, 2009 reflect the performance of a predecessor fund (the “Predecessor Fund”). The Fund and the Predecessor Fund have substantially similar investment objectives and strategies. Please consult the Fund’s prospectus for more detail. |
| 2 | Fund commenced operations on May 11, 2007. |
| 3 | Returns before the first offering of Class A, Class C and Class R (May 21, 2012) are based on the previous performance of the Institutional Class. The performance of the Institutional Class is substantially similar to what Class A, Class C and Class R would have produced because all classes invest in the same portfolio of securities. Returns for Class A, C and R shares would only differ to the extent of the differences in expenses of the classes. |
| 4 | A 5.75% front-end sales charge was deducted. |
| 5 | A 1.00% contingent deferred sales charge (CDSC) was deducted from the one year return because it is charged when Class C shares are sold within the first year after purchase. |
| 6 | Not subject to any sales charges. |
| 7 | Returns before the first offering of the Institutional Service Class (November 23, 2009) are based on the previous performance of the Institutional Class. This performance is substantially similar to what Institutional Service Class would have produced because both classes invest in the same portfolio of securities. Returns for the Institutional Service Class shares would only differ to the extent of the differences in expenses of the two classes. |
2014 Annual Report
23
Table of Contents
Aberdeen Emerging Markets Fund (Unaudited)
Performance of a $10,000 Investment (as of October 31, 2014)
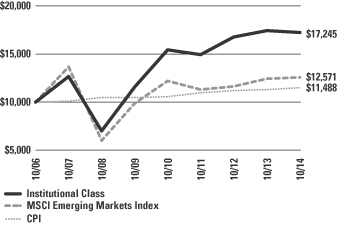
Comparative performance of $10,000 invested in Institutional Class shares of the Aberdeen Emerging Markets Fund, Morgan Stanley Capital International (MSCI) Emerging Markets Index and the Consumer Price Index (CPI) since inception. Unlike the Fund, the returns for these unmanaged indexes do not reflect any fees, expenses, or sales charges. Investors cannot invest directly in market indexes.
The MSCI Emerging Markets Index is a free float-adjusted, market capitalization-weighted index that captures large and mid cap representation across 23 emerging markets countries including: Brazil, Chile, China, Colombia, Czech Republic, Egypt, Greece, Hungary, India, Indonesia, Korea, Malaysia, Mexico, Peru, Philippines, Poland, Qatar, Russia, South Africa, Taiwan, Thailand, Turkey and United Arab Emirates.
The CPI represents changes in prices of a basket of goods and services purchased for consumption by urban households.
Investment return and principal value will fluctuate, and when redeemed, shares may be worth more or less than original cost. Past performance is no guarantee of future results. The Average Annual Total Return table and Performance graph do not reflect the deduction of taxes that a shareholder would pay on fund distributions or the redemption of fund shares. Investing in mutual funds involves market risk, including loss of principal. Performance returns assume the reinvestment of all distributions. Total returns reflect waivers and reimbursements in effect, without which returns would have been lower.
Portfolio Summary (as a percentage of net assets)
October 31, 2014 (Unaudited)
| Asset Allocation | ||||
Common Stocks | 88.5% | |||
Preferred Stocks | 9.1% | |||
Repurchase Agreement | 2.3% | |||
Other assets in excess of liabilities | 0.1% | |||
| 100.0% | ||||
The following chart summarizes the composition of the Fund’s portfolio, in industry classification standard sectors, expressed as a percentage of net assets. An industry classification standard sector can include more than one industry group. As of October 31, 2014, the Fund did not have more than 25% of its assets invested in any industry group. The sectors, as classified by S&P’s Global Industry Classification Standard Sectors, are comprised of several industry groups.
| Top Sectors | ||||
Financials | 35.4% | |||
Consumer Staples | 16.8% | |||
Energy | 11.5% | |||
Information Technology | 11.2% | |||
Consumer Discretionary | 8.2% | |||
Materials | 7.5% | |||
Telecommunication Services | 4.6% | |||
Industrials | 1.3% | |||
Health Care | 1.1% | |||
Other | 2.4% | |||
| 100.0% | ||||
| Top Holdings* | ||||
Samsung Electronics Co. Ltd., Preferred Shares | 4.3% | |||
Taiwan Semiconductor Manufacturing Co. Ltd. | 3.9% | |||
China Mobile Ltd. | 3.4% | |||
Fomento Economico Mexicano SAB de CV, ADR | 3.1% | |||
Infosys Ltd. | 3.0% | |||
Housing Development Finance Corp. Ltd. | 3.0% | |||
Banco Bradesco SA, ADR, Preferred Shares | 3.0% | |||
AIA Group Ltd. | 2.9% | |||
Astra International Tbk PT | 2.7% | |||
Lukoil OAO, ADR | 2.6% | |||
Other | 68.1% | |||
| 100.0% | ||||
| Top Countries | ||||
India | 14.7% | |||
Brazil | 12.5% | |||
Hong Kong | 8.3% | |||
Mexico | 7.3% | |||
South Africa | 5.8% | |||
China | 5.6% | |||
Republic of South Korea | 5.4% | |||
Turkey | 5.3% | |||
Taiwan | 5.1% | |||
Thailand | 5.0% | |||
Other | 25.0% | |||
| 100.0% | ||||
| * | For the purpose of listing top holdings, repurchase agreements are included as part of Other. |
Annual Report 2014
24
Table of Contents
Statement of Investments
October 31, 2014
Aberdeen Emerging Markets Fund
| Shares or Principal Amount | Value | |||||||
COMMON STOCKS (88.5%) | ||||||||
BRAZIL (7.7%) | ||||||||
Consumer Discretionary (1.1%) | ||||||||
Lojas Renner SA | 3,887,710 | $ | 116,416,353 | |||||
Consumer Staples (1.0%) | ||||||||
Souza Cruz SA | 12,070,988 | 97,526,607 | ||||||
Energy (2.4%) | ||||||||
Petroleo Brasileiro SA, ADR | 1,619,000 | 18,942,300 | ||||||
Ultrapar Participacoes SA | 10,099,000 | 220,287,724 | ||||||
| 239,230,024 | ||||||||
Financials (1.0%) | ||||||||
Banco Bradesco SA | 595,600 | 8,768,509 | ||||||
Multiplan Empreendimentos Imobiliarios SA | 4,625,629 | 95,671,127 | ||||||
| 104,439,636 | ||||||||
Materials (2.2%) | ||||||||
Vale SA, ADR | 21,620,901 | 218,154,891 | ||||||
| 775,767,511 | ||||||||
CHILE (1.2%) | ||||||||
Financials (1.2%) | ||||||||
Banco Santander Chile, ADR | 5,840,846 | 123,767,527 | ||||||
CHINA (5.6%) | ||||||||
Energy (2.2%) | ||||||||
PetroChina Co. Ltd., H Shares (a) | 174,648,200 | 218,874,845 | ||||||
Telecommunication Services (3.4%) | ||||||||
China Mobile Ltd. (a) | 27,350,600 | 341,015,430 | ||||||
| 559,890,275 | ||||||||
HONG KONG (8.3%) | ||||||||
Financials (8.3%) | ||||||||
AIA Group Ltd. (a) | 52,060,000 | 290,516,912 | ||||||
Hang Lung Group Ltd. (a) | 25,049,000 | 126,023,113 | ||||||
Hang Lung Properties Ltd. (a) | 38,882,000 | 121,417,940 | ||||||
Swire Pacific Ltd., Class A (a) | 16,401,000 | 215,336,141 | ||||||
Swire Pacific Ltd., Class B (a) | 15,945,000 | 38,701,611 | ||||||
Swire Properties Ltd. (a) | 13,957,100 | 44,722,867 | ||||||
| 836,718,584 | ||||||||
HUNGARY (1.1%) | ||||||||
Consumer Discretionary (0.0%) | ||||||||
Danubius Hotel and Spa PLC (b) | 2,039 | 39,542 | ||||||
Health Care (1.1%) | ||||||||
Richter Gedeon Nyrt (a) | 7,155,840 | 109,160,473 | ||||||
| 109,200,015 | ||||||||
INDIA (14.7%) | ||||||||
Consumer Discretionary (1.5%) | ||||||||
Hero MotoCorp Ltd. (a) | 2,931,597 | 146,341,908 | ||||||
Consumer Staples (3.8%) | ||||||||
Hindustan Unilever Ltd. (a) | 15,700,443 | 188,252,024 | ||||||
ITC Ltd. (a) | 33,429,000 | 193,027,025 | ||||||
| 381,279,049 | ||||||||
Financials (4.4%) | ||||||||
Housing Development Finance Corp. Ltd. (a) | 16,663,000 | 298,945,357 | ||||||
ICICI Bank Ltd. (a) | 5,146,900 | 136,566,987 | ||||||
ICICI Bank Ltd., ADR | 32,100 | 1,809,156 | ||||||
| 437,321,500 | ||||||||
Information Technology (3.0%) | ||||||||
Infosys Ltd. (a) | 4,564,515 | 302,789,790 | ||||||
Materials (2.0%) | ||||||||
Grasim Industries Ltd. (a) | 846,892 | 48,332,385 | ||||||
Grasim Industries Ltd., GDR (c) | 13,359 | 765,871 | ||||||
UltraTech Cement Ltd. (a) | 3,743,118 | 155,266,818 | ||||||
UltraTech Cement Ltd., GDR (c) | 13,918 | 578,015 | ||||||
| 204,943,089 | ||||||||
| 1,472,675,336 | ||||||||
INDONESIA (2.7%) | ||||||||
Consumer Discretionary (2.7%) | ||||||||
Astra International Tbk PT (a) | 492,030,500 | 275,886,912 | ||||||
ITALY (2.1%) | ||||||||
Energy (2.1%) | ||||||||
Tenaris SA, ADR | 5,262,000 | 208,585,680 | ||||||
MALAYSIA (2.2%) | ||||||||
Financials (2.2%) | ||||||||
CIMB Group Holdings Bhd (a) | 46,713,542 | 92,242,477 | ||||||
Public Bank Bhd | 22,182,200 | 125,030,930 | ||||||
| 217,273,407 | ||||||||
MEXICO (7.3%) | ||||||||
Consumer Discretionary (0.0%) | ||||||||
Consorcio ARA SAB de CV (b) | 3,467,000 | 1,580,795 | ||||||
Consumer Staples (3.6%) | ||||||||
Fomento Economico Mexicano SAB de CV, ADR | 3,194,501 | 307,438,776 | ||||||
Organizacion Soriana SAB de CV, Class B | 15,206,779 | 49,811,271 | ||||||
| 357,250,047 | ||||||||
Financials (2.4%) | ||||||||
Grupo Financiero Banorte SAB de CV | 38,072,148 | 243,989,705 | ||||||
Industrials (1.3%) | ||||||||
Grupo Aeroportuario del Sureste SAB de CV, ADR, B Shares | 951,715 | 128,176,976 | ||||||
| 730,997,523 | ||||||||
PHILIPPINES (3.4%) | ||||||||
Financials (3.4%) | ||||||||
Ayala Corp. (a) | 3,958,000 | 60,833,676 | ||||||
Ayala Land, Inc. (a) | 195,247,800 | 145,893,611 | ||||||
Bank of Philippine Islands (a) | 64,725,894 | 137,153,802 | ||||||
| 343,881,089 | ||||||||
See accompanying Notes to Financial Statements.
2014 Annual Report
25
Table of Contents
Statement of Investments (continued)
October 31, 2014
Aberdeen Emerging Markets Fund
| Shares or Principal Amount | Value | |||||||
POLAND (2.5%) | ||||||||
Consumer Staples (0.8%) | ||||||||
Jeronimo Martins SGPS SA (a) | 8,576,556 | $ | 75,058,678 | |||||
Financials (1.7%) | ||||||||
Bank Pekao SA (a) | 3,269,062 | 171,097,427 | ||||||
| 246,156,105 | ||||||||
REPUBLIC OF SOUTH KOREA (1.1%) | ||||||||
Consumer Staples (1.1%) | ||||||||
E-Mart Co. Ltd. (a) | 603,019 | 111,889,555 | ||||||
RUSSIA (4.5%) | ||||||||
Consumer Staples (1.9%) | ||||||||
Magnit OJSC (a) | 692,928 | 190,977,000 | ||||||
Energy (2.6%) | ||||||||
Lukoil OAO, ADR | 5,369,543 | 263,376,084 | ||||||
| 454,353,084 | ||||||||
SOUTH AFRICA (5.8%) | ||||||||
Consumer Discretionary (1.7%) | ||||||||
Truworths International Ltd. (a) | 25,651,395 | 175,797,141 | ||||||
Consumer Staples (3.0%) | ||||||||
Massmart Holdings Ltd. (a) | 8,941,282 | 96,657,786 | ||||||
SABMiller PLC (a) | 3,652,100 | 205,787,542 | ||||||
| 302,445,328 | ||||||||
Materials (1.1%) | ||||||||
BHP Billiton PLC (a) | 4,145,549 | 106,811,277 | ||||||
| 585,053,746 | ||||||||
TAIWAN (5.1%) | ||||||||
Information Technology (3.9%) | ||||||||
Taiwan Semiconductor Manufacturing Co. Ltd. (a) | 90,968,117 | 394,335,005 | ||||||
Telecommunication Services (1.2%) | ||||||||
Taiwan Mobile Co. Ltd. | 37,660,255 | 122,205,618 | ||||||
| 516,540,623 | ||||||||
THAILAND (5.0%) | ||||||||
Energy (0.7%) | ||||||||
PTT Exploration & Production PCL, Foreign Shares (a) | 15,703,800 | 70,602,703 | ||||||
Financials (2.4%) | ||||||||
Siam Commercial Bank PCL, Foreign Shares (a) | 44,670,100 | 243,587,565 | ||||||
Materials (1.9%) | ||||||||
Siam Cement PCL, Foreign Shares (a) | 11,254,200 | 156,320,154 | ||||||
Siam Cement PCL, NVDR (a) | 2,365,300 | 32,694,397 | ||||||
| 189,014,551 | ||||||||
| 503,204,819 | ||||||||
TURKEY (5.3%) | ||||||||
Consumer Staples (1.6%) | ||||||||
BIM Birlesik Magazalar A.S. (a) | 7,056,088 | 161,191,136 | ||||||
Financials (3.7%) | ||||||||
Akbank T.A.S. (a) | 51,647,608 | 186,496,605 | ||||||
Turkiye Garanti Bankasi A.S. (a) | 46,635,599 | 182,013,750 | ||||||
| 368,510,355 | ||||||||
| 529,701,491 | ||||||||
UNITED KINGDOM (1.7%) | ||||||||
Financials (1.7%) | ||||||||
Standard Chartered PLC (a) | 11,427,766 | 172,018,228 | ||||||
UNITED STATES (1.2%) | ||||||||
Consumer Discretionary (1.2%) | ||||||||
Yum! Brands, Inc. | 1,625,000 | 116,723,750 | ||||||
Total Common Stocks | 8,890,285,260 | |||||||
PREFERRED STOCKS (9.1%) | ||||||||
BRAZIL (4.8%) | ||||||||
Energy (1.5%) | ||||||||
Petroleo Brasileiro SA, ADR, Preferred Shares | 12,631,900 | 154,488,137 | ||||||
Financials (3.0%) | ||||||||
Banco Bradesco SA, ADR, Preferred Shares | 19,877,586 | 297,766,239 | ||||||
Materials (0.3%) | ||||||||
Vale SA, ADR, Preferred Shares | 3,716,416 | 32,555,804 | ||||||
| 484,810,180 | ||||||||
REPUBLIC OF SOUTH KOREA (4.3%) | ||||||||
Information Technology (4.3%) | ||||||||
Samsung Electronics Co. Ltd., Preferred Shares (a) | 462,959 | 427,340,306 | ||||||
Total Preferred Stocks | 912,150,486 | |||||||
REPURCHASE AGREEMENT (2.3%) | ||||||||
UNITED STATES (2.3%) | ||||||||
Repurchase Agreement, Fixed Income Clearing Corp., 0.00%, dated 10/31/2014, due 11/03/2014, repurchase price $229,143,000, collateralized by a U.S. Treasury Note, maturing 10/31/2021; total market value of $233,727,135. | $ | 229,143,000 | 229,143,000 | |||||
Total Repurchase Agreement | 229,143,000 | |||||||
Total Investments | 10,031,578,746 | |||||||
Other assets in excess of liabilities—0.1% |
| 10,764,044 | ||||||
Net Assets—100.0% |
| $ | 10,042,342,790 | |||||
See accompanying Notes to Financial Statements.
Annual Report 2014
26
Table of Contents
Statement of Investments (concluded)
October 31, 2014
Aberdeen Emerging Markets Fund
| (a) | Fair Valued Security. Fair Values are determined pursuant to procedures approved by the Fund’s Board of Trustees. See Note 2(a) of the accompanying Notes to Financial Statements. |
| (b) | Non-income producing security. |
| (c) | Denotes a security issued under Regulation S or Rule 144A. |
| (d) | See Notes to Financial Statements for tax unrealized appreciation/depreciation of securities. |
| ADR | American Depositary Receipt |
| GDR | Global Depositary Receipt |
| NVDR | Non-Voting Depositary Receipt |
See accompanying Notes to Financial Statements.
2014 Annual Report
27
Table of Contents
Aberdeen Equity Long-Short Fund (Unaudited)
The Aberdeen Equity Long-Short Fund (Class A shares at net asset value net of fees) returned 2.90% for the 12-month period ended October 31, 2014, versus the 0.04% return for its benchmark, the Citigroup 3-Month Treasury Bill Index, and 17.27% for the broader-market Standard & Poor’s (S&P) 500 Index, for the same period. For broader comparison, the average return of the Fund’s Lipper peer category of Alternative Long/Short Equity Funds (consisting of 119 funds) was 5.51% for the period.
U.S. equity markets moved higher over the 12-month period ended October 31, 2014. Investors’ optimism over the reporting period was buoyed by generally positive corporate earnings reports and steady but moderate overall improvement in economic data. This offset geopolitical concerns in Ukraine and the Middle East and, towards the end of the period, worries over slowing economic growth in Europe and Asia. Shares of large-cap companies, as measured by the broader-market S&P 500 Index, outperformed their small-cap counterparts, as represented by the Russell 2000 Index. Nine of the ten sectors within the S&P 500 Index saw positive returns, led by healthcare and utilities. Energy was the lone sector to post a negative return amid the ongoing sharp declines in oil prices, while consumer discretionary also lagged the overall market amid several periods of weakness in consumer spending. Eight of the ten sectors within the Russell 2000 Index saw positive returns, led by healthcare and utilities. Energy and telecommunication services were the only sectors to post negative returns for the period.
The beginning of the review period was marked by volatility amid speculation concerning the Federal Reserve’s (Fed) possible tapering of monetary policy easing and the change in command at the central bank, as former Fed vice chair Janet Yellen succeeded Ben Bernanke as Fed chief in February. The Fed began to reduce its $85 billion-per-month asset purchase program in $10 billion increments in January 2014 and ended its tapering in late October.
The U.S. economic recovery hit several peaks and valleys during the reporting period, with healthy gross domestic product (GDP) growth in the fourth quarter of 2013 and the second and third quarters of 2014 sandwiched around a contraction in the first quarter of the year, most likely attributable to bad weather-induced weakness in consumer spending. As expected, consumer spending was the primary driver of the upturns and declines in GDP during the period, as it currently comprises more than two-thirds of GDP. The economy added roughly 1.7 million jobs over the 12-month review period, while the unemployment rate fell from 7.2% to 5.8%. At the end of the reporting period, however, the labor force participation rate hovered just above its lowest level in more than 36 years – generally providing further skepticism in the markets regarding the timing of an increase in the federal funds rate by the Fed.
Shortly after the end of the reporting period, in the mid-term U.S. Congressional elections, the Republican Party forged a majority in the U.S. Senate and bolstered their control in the House of Representatives. The change in political leadership in the Senate may potentially influence government policy in the next two years leading up to the presidential election in 2016.
As expected during a market upturn, the Fund’s long positions bolstered performance over the reporting period, most notably in the healthcare and financials sectors. The main individual stock contributors were long holdings in biotechnology firm Gilead Sciences, health benefits provider Aetna, and freight railroad operator Canadian National Railway. Gilead Sciences has continued to benefit from sales of Solvadi, its hepatitis C treatment, which currently comprises over half of the company’s total product sales. Shares of Aetna rose during the period as investors took a favorable view of the company’s earnings growth potential. Canadian National Railway’s operating results for the period were supported by good revenue growth, partly attributable to increased shipments of oil and chemicals.
Conversely, the Fund’s short exposures hampered Fund performance, particularly in the information technology and industrials sectors. The primary detractors among individual positions were short exposures to payment-processing services provider Verifone Systems, asset management firm Legg Mason, and defense contractor Northrop Grumman. Shares of Verifone moved higher mainly on stronger-than-anticipated earnings over the period, thereby weighing on Fund performance. While Legg Mason, which the Fund holds as a paired position against a long holding in asset manager Blackrock, saw generally better-than-expected results over the reporting period, the company still has a net debt balance sheet and structurally lower margins compared to those of most asset managers. The Fund also holds a short exposure to Northrop Grumman as a paired position against a long holding in Lockheed Martin. Northrop posted results that exceeded investors’ expectations over the period, though its earnings were propped up somewhat by share repurchases. Over the reporting period, Lockheed Martin posted a significantly higher return than that of Northrop Grumman, creating a positive return for the Fund from the paired position.
We view the equity market behavior during the reporting period as having two fairly distinct characteristics. The first part of the period resulted in what we believe was the culmination of the valuation expansion portion of the equity market gains that took place during 2012 and 2013. It was characterized by broad-based gains in the market, along with the outperformances of lower-quality companies relative to their high-quality counterparts, and of companies with volatile business models and stock prices. Within that period, the Fund’s short positions outperformed the long holdings as smaller, lower-quality company stocks outperformed shares of larger, higher-quality companies.
Around the time of the Fed’s March 2014 meeting, the nature of equity return drivers shifted toward more company-specific and fundamentally driven activity. Within that period, the Fund’s short positions underperformed the long holdings, aided by company-specific fundamentals. The performance of the long holdings versus the short positions improved consistently between the end of March and the close of the reporting period on October 31.
Notable changes to the Fund over the reporting period included the initiation of long holdings in credit-reporting agency Equifax;
Annual Report 2014
28
Table of Contents
Aberdeen Equity Long-Short Fund (Unaudited) (continued)
International Flavors & Fragrances, a global manufacturer of additives for food and perfumes; payment services and network provider American Express; and PVH Corp., which markets several well-known clothing brands, including Calvin Klein and Tommy Hilfiger; telecom Verizon Communications; global diversified healthcare company Baxter International; contract research organization PAREXEL International; and diversified financial services company Charles Schwab. We exited long positions in integrated energy company Chevron Corp.; packaged foods producer Kraft Foods Group; metal components maker Precision Castparts; analytical instrument manufacturer Waters Corporation (WAT); and specialty retailer Ascena Corp.
Within the short segment of the Fund, we established new exposures to financial services company Comerica as a paired position against the Fund’s long holding in Wells Fargo & Co.; robotics technology firm iRobot Corp.; packaged foods maker B&G Foods; Fastenal Company, a distributor of industrial and construction supplies; organic and natural foods grocer Whole Foods Market; data storage services provider NetApp; IT services provider International Business Machines; financial services company Northern Trust; household products maker The Clorox Co.; and two exchange-traded funds (ETFs): PowerShares QQQ Trust Series, which seeks to replicate the performance of the Nasdaq 100 Index,1 and Select Sector Utilities Select Sector SPDR Fund, which seeks to provide investment results that correspond to those of the utilities sector of the S&P 500 Index. We exited short positions in Badger Meter, a manufacturer of products incorporating flow measurement and control technologies; USG Corp., a manufacturer of building materials; athletic apparel retailer Lululemon Athletica; steel producer United States Steel; as well as iRobot Corp. and Comerica, which we had initiated earlier in the annual period.
We believe that the Fund’s current construction is amenable to capturing a significant amount of company-specific returns without relying on specific macroeconomic or external events such as shifts in interest rates, energy prices, or other elements which are out of the control of the companies in which we invest in an effort to enhance the Fund’s performance.
The Fund ended the reporting period with a net position of about 47% and a gross position of approximately 150%, little changed from the end of September. We believe that the sharp correction in the middle of October created the opportunity for a market rebound, particularly in smaller companies outside of the energy sector.
Economic activity in North America continues to improve modestly, with the overhang, in our view, now being a more tepid economic outlook for many other regions that have typically provided growth to many U.S.-based companies. At the macroeconomic level, the focus has been the rise of geopolitical concerns and the fairly sharp downward move in energy prices. Given that so much of recent capital investment has been focused on domestic energy production and transportation, we think that sustained volatility in commodity markets will be a persistent theme over the next year. On the flip side, the state of U.S. consumers showed improvement late in the period following a fickle start to the year with the view that consumer confidence and spending was helped in part by lower oil prices.
Valuations of the companies we invest in remain justifiable, although not cheap, in our opinion. We think that this is likely to remain the case while yields on 10-year U.S. Treasuries remain below the 3% range and ample liquidity remains. And despite what has appeared to be an increase in volatility over the past several months, share prices of large-cap equities have been hovering near their all-time highs, while small-cap stocks have recaptured much of their underperformance from earlier in 2014.
Moving forward, we believe that, in aggregate, shareholder returns over the next year may be driven by underlying operating earnings growth and distributions rather than further price/earnings multiple2 expansion. Our view is based on our observation that the S&P 500 Index recently has been trading at or above its long-term historical average, against what we feel may prove to be a period of positive but still tepid revenue growth and already high profitability levels for most companies. For further multiple expansion to occur and be sustained, we believe we would need to see an acceleration in global economic growth, while we also note that a stronger U.S. dollar had led to currency translation headwinds for companies with overseas revenues. Nevertheless, absent any macroeconomic events, political wrangling – or other unpredictable factors – we feel that valuations are well supported. The recent volatility has led to more sector and stock dispersion,3 which in our view is good for active managers. We anticipate using this to our advantage by adding to holdings that we feel may be indiscriminately punished by the market.
Portfolio Management:
Aberdeen North American Equity Team
PAST PERFORMANCE DOES NOT GUARANTEE FUTURE RESULTS.
The performance data quoted represents past performance and current returns may be lower or higher. Class A Shares have up to a 5.75% front-end sales charge and a 0.25% 12b-1 fee. The investment return and principal value will fluctuate so that an investor’s shares, when redeemed, may be worth more or less than the original cost. To obtain performance information current to the most recent month-end, which may be higher or lower than the performance shown above, please call 866-667-9231 or go to www.aberdeen-asset.us.
Investing in mutual funds involves risk, including possible loss of principal.
Indexes are unmanaged and have been provided for comparison purposes only. No fees or expenses are reflected. You cannot invest directly in an index.
Lipper is a leading global provider of mutual fund information and analysis to fund companies, financial intermediaries and media organizations.
| 1 | The Nasdaq 100 Index includes 100 of the largest domestic and international non-financial securities listed on the Nasdaq Stock Market based on market capitalization. |
| 2 | The price/earnings multiple is the ratio of a company’s current share price compared to its per-share earnings. |
| 3 | Dispersion is a measure of the variation of the performance of stock or sector relative to a market benchmark. |
2014 Annual Report
29
Table of Contents
Aberdeen Equity Long-Short Fund (Unaudited) (concluded)
Risk Considerations
There are special risks associated with selling securities short. A short position will lose value as the security’s price increases. Theoretically, the loss on a short sale can be unlimited. The use of leverage will also increase market exposure and magnify risk.
Equity stocks of small- and mid-cap companies carry greater risk and more volatility than equity stocks of larger, more established companies.
Please read the prospectus for more detailed information regarding these and other risks.
Annual Report 2014
30
Table of Contents
Aberdeen Equity Long-Short Fund (Unaudited)
Average Annual Total Return1 (For periods ended October 31, 2014) | 1 Yr. | 5 Yr. | 10 Yr. | |||||||||||
Class A | w/o SC | 2.90% | 3.63% | 3.47% | ||||||||||
| w/SC2 | (3.02% | ) | 2.41% | 2.86% | ||||||||||
Class C | w/o SC | 2.26% | 2.92% | 2.74% | ||||||||||
| w/SC3 | 1.26% | 2.92% | 2.74% | |||||||||||
Class R4 | w/o SC | 2.49% | 3.26% | 3.15% | ||||||||||
Institutional Service Class4,5 | w/o SC | 3.03% | 3.74% | 3.66% | ||||||||||
Institutional Class4 | w/o SC | 3.26% | 3.94% | 3.75% | ||||||||||
All figures showing the effect of a sales charge (SC) reflect the maximum charge possible because it has the most significant effect on performance data. The total returns shown above do not include the impact of financial statement rounding of the net asset value per share and/or financial statement adjustments.
| 1 | Returns incorporate the performance of a predecessor fund (the “Predecessor Fund”) from prior to June 23, 2008. The Fund and the Predecessor Fund have substantially similar investment objectives and strategies. Please see footnotes for the relevant classes and consult the Fund’s prospectus for more detail. |
| 2 | A 5.75% front-end sales charge was deducted. |
| 3 | A 1.00% contingent deferred sales charge (CDSC) was deducted from the one year return because it is charged when Class C shares are sold within the first year after purchase. |
| 4 | Not subject to any sales charges. |
| 5 | Returns before the first offering of the Institutional Service Class (November 1, 2009) are based on the previous performance of the Institutional Class. The performance is substantially similar to what the Institutional Service Class would have produced because both classes invest in the same portfolio of securities. Returns for the Institutional Service Class shares have not been adjusted to reflect the expenses of the Institutional Service Class shares. |
2014 Annual Report
31
Table of Contents
Aberdeen Equity Long-Short Fund (Unaudited)
Performance of a $10,000 Investment (as of October 31, 2014)
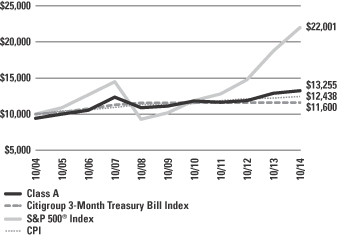
Comparative performance of $10,000 invested in Class A shares of the Aberdeen Equity Long-Short Fund, the S&P 500® Index, the Citigroup 3-Month Treasury Bill Index and the Consumer Price Index (CPI) over a 10-year period ended October 31, 2014. Unlike the Fund, the returns for these unmanaged indexes do not reflect any fees, expenses, or sales charges. Investors cannot invest directly in market indexes.
The S&P 500® Index is a market capitalization-weighted index that includes 500 leading companies in leading industries of the U.S. economy. Focusing on the large-cap segment of the market, the S&P 500® Index covers approximately 80% of available U.S. market capitalization. The Citigroup 3-Month Treasury Bill Index consists of the last three three-month Treasury bill issues and measures monthly return equivalents of yield averages that are not marked to market.
The CPI represents changes in prices of a basket of goods and services purchased for consumption by urban households.
Investment return and principal value will fluctuate, and when redeemed, shares may be worth more or less than original cost. Past performance is no guarantee of future results. The Average Annual Total Return table and Performance graph do not reflect the deduction of taxes that a shareholder would pay on fund distributions or the redemption of fund shares. Investing in mutual funds involves market risk, including loss of principal. Performance returns assume the reinvestment of all distributions. Total returns reflect waivers and reimbursements in effect, without which returns would have been lower.
Portfolio Summary (as a percentage of net assets)
October 31, 2014 (Unaudited)
| Long Positions | ||||
| Asset Allocation | ||||
Common Stocks | 100.2% | |||
Liabilities in excess of other assets | (0.2%) | |||
| 100.0% | ||||
The following chart summarizes the composition of the Fund’s portfolio, in industry classification standard sectors, expressed as a percentage of net assets. An industry classification standard sector can include more than one industry group. As of October 31, 2014, the Fund did not have more than 25% of its assets invested in any industry group. The sectors, as classified by S&P’s Global Industry Classification Standard Sectors, are comprised of several industry groups.
| Top Sectors | ||||
Information Technology | 17.9% | |||
Health Care | 15.0% | |||
Consumer Discretionary | 13.5% | |||
Financials | 13.4% | |||
Consumer Staples | 10.2% | |||
Industrials | 10.1% | |||
Energy | 9.1% | |||
Materials | 8.0% | |||
Telecommunication Services | 3.0% | |||
Other | (0.2%) | |||
| 100.0% | ||||
| Top Holdings | ||||
CVS Health Corp. | 3.4% | |||
Cognizant Technology Solutions Corp., Class A | 3.2% | |||
Pfizer, Inc. | 3.1% | |||
American Express Co. | 3.1% | |||
BorgWarner, Inc. | 3.1% | |||
Verizon Communications, Inc. | 3.0% | |||
Gilead Sciences, Inc. | 2.9% | |||
International Flavors & Fragrances, Inc. | 2.9% | |||
Comcast Corp., Class A | 2.9% | |||
Visa, Inc., Class A | 2.8% | |||
Other | 69.6% | |||
| 100.0% | ||||
| Short Positions | ||||
| Asset Allocation | ||||
Common Stocks | 49.3% | |||
Exchange Traded Funds | 3.8% | |||
Other assets in excess of liabilities | 46.9% | |||
| 100.0% | ||||
Annual Report 2014
32
Table of Contents
Aberdeen Equity Long-Short Fund (Unaudited) (concluded)
| Top Sectors | ||||
Information Technology | 9.7% | |||
Industrials | 9.1% | |||
Consumer Staples | 9.0% | |||
Health Care | 6.6% | |||
Consumer Discretionary | 6.3% | |||
Financials | 5.9% | |||
Energy | 2.7% | |||
Other | 50.7% | |||
| 100.0% | ||||
| Top Holdings | ||||
Boston Scientific Corp. | 2.8% | |||
FactSet Research Systems, Inc. | 2.7% | |||
Fastenal Co. | 2.6% | |||
International Business Machines Corp. | 2.5% | |||
PACCAR, Inc. | 2.3% | |||
Agilent Technologies, Inc. | 2.2% | |||
Northern Trust Corp. | 2.2% | |||
Clorox Co. | 2.1% | |||
VeriFone Systems, Inc. | 2.0% | |||
Allstate Corp. (The) | 2.0% | |||
Other | 76.6% | |||
| 100.0% | ||||
2014 Annual Report
33
Table of Contents
Statement of Investments
October 31, 2014
Aberdeen Equity Long-Short Fund
| Shares or Principal Amount | Value | |||||||
COMMON STOCKS — LONG POSITIONS (100.2%) |
| |||||||
Consumer Discretionary (13.5%) | ||||||||
BorgWarner, Inc. | 185,800 | $ | 10,594,316 | |||||
Comcast Corp., Class A | 182,931 | 10,125,231 | ||||||
PVH Corp. | 80,100 | 9,159,435 | ||||||
Target Corp. | 140,300 | 8,673,346 | ||||||
TJX Cos., Inc. | 133,900 | 8,478,548 | ||||||
| 47,030,876 | ||||||||
Consumer Staples (10.2%) | ||||||||
Costco Wholesale Corp. | 63,128 | 8,419,381 | ||||||
CVS Health Corp. | 139,300 | 11,953,333 | ||||||
PepsiCo, Inc. | 66,100 | 6,356,837 | ||||||
Philip Morris International, Inc. | 100,200 | 8,918,802 | ||||||
| 35,648,353 | ||||||||
Energy (9.1%) | ||||||||
Apache Corp. | 94,200 | 7,272,240 | ||||||
ConocoPhillips | 75,300 | 5,432,895 | ||||||
National Oilwell Varco, Inc. | 99,600 | 7,234,944 | ||||||
Schlumberger Ltd. | 63,600 | 6,274,776 | ||||||
TransCanada Corp. | 112,800 | 5,559,912 | ||||||
| 31,774,767 | ||||||||
Financials (13.4%) | ||||||||
American Express Co. | 119,000 | 10,704,050 | ||||||
BlackRock, Inc. | 24,900 | 8,493,639 | ||||||
Charles Schwab Corp. (The) | 127,500 | 3,655,425 | ||||||
Intercontinental Exchange, Inc. | 46,964 | 9,782,132 | ||||||
Jones Lang LaSalle, Inc. | 38,600 | 5,219,106 | ||||||
Wells Fargo & Co. | 168,826 | 8,962,972 | ||||||
| 46,817,324 | ||||||||
Health Care (15.0%) | ||||||||
Aetna, Inc. | 92,800 | 7,656,928 | ||||||
Baxter International, Inc. | 123,300 | 8,648,262 | ||||||
Gilead Sciences, Inc. (a) | 92,500 | 10,360,000 | ||||||
Johnson & Johnson | 64,000 | 6,897,920 | ||||||
PAREXEL International Corp. (a) | 148,200 | 8,048,742 | ||||||
Pfizer, Inc. | 359,700 | 10,773,015 | ||||||
| 52,384,867 | ||||||||
Industrials (10.1%) | ||||||||
Canadian National Railway Co. | 122,700 | 8,660,166 | ||||||
Deere & Co. | 60,700 | 5,192,278 | ||||||
Emerson Electric Co. | 115,200 | 7,379,712 | ||||||
Equifax, Inc. | 101,000 | 7,649,740 | ||||||
Lockheed Martin Corp. | 33,500 | 6,384,095 | ||||||
| 35,265,991 | ||||||||
Information Technology (17.9%) | ||||||||
Alliance Data Systems Corp. (a) | 24,500 | 6,942,075 | ||||||
Cognizant Technology Solutions Corp., Class A (a) | 230,200 | 11,245,270 | ||||||
EMC Corp. | 260,800 | 7,492,784 | ||||||
FEI Co. | 106,300 | 8,958,964 | ||||||
Oracle Corp. | 225,455 | 8,804,018 | ||||||
QUALCOMM, Inc. | 118,097 | 9,271,795 | ||||||
Visa, Inc., Class A | 41,020 | 9,903,459 | ||||||
| 62,618,365 | ||||||||
Materials (8.0%) | ||||||||
International Flavors & Fragrances, Inc. | 103,000 | 10,212,450 | ||||||
Nucor Corp. | 105,178 | 5,685,923 | ||||||
Potash Corp. of Saskatchewan, Inc. | 194,200 | 6,635,814 | ||||||
Praxair, Inc. | 43,200 | 5,442,768 | ||||||
| 27,976,955 | ||||||||
Telecommunication Services (3.0%) | ||||||||
Verizon Communications, Inc. | 211,100 | 10,607,775 | ||||||
Total Common Stocks — Long Positions | 350,125,273 | |||||||
Total Investments | 350,125,273 | |||||||
Liabilities in excess of other assets—(0.2)% | (650,368 | ) | ||||||
Net Assets—100.0% | $ | 349,474,905 | ||||||
See accompanying Notes to Financial Statements.
Annual Report 2014
34
Table of Contents
Statement of Investments (concluded)
October 31, 2014
Aberdeen Equity Long-Short Fund
| Shares or Principal Amount | Value | |||||||
COMMON STOCKS — SHORT POSITIONS (49.3%) |
| |||||||
Consumer Discretionary (6.3%) | ||||||||
Apollo Education Group, Inc. (a) | 110,400 | $ | 3,164,064 | |||||
Carnival Corp. | 127,100 | 5,103,065 | ||||||
Darden Restaurants, Inc. | 85,000 | 4,401,300 | ||||||
Garmin Ltd. | 68,900 | 3,822,572 | ||||||
Leggett & Platt, Inc. | 138,600 | 5,458,068 | ||||||
| 21,949,069 | ||||||||
Consumer Staples (9.0%) | ||||||||
B&G Foods, Inc. | 230,100 | 6,778,746 | ||||||
Campbell Soup Co. | 148,100 | 6,541,577 | ||||||
Clorox Co. | 73,800 | 7,343,100 | ||||||
United Natural Foods, Inc. (a) | 82,500 | 5,611,650 | ||||||
Whole Foods Market, Inc. | 133,700 | 5,258,421 | ||||||
| 31,533,494 | ||||||||
Energy (2.7%) | ||||||||
Denbury Resources, Inc. | 458,000 | 5,679,200 | ||||||
Patterson-UTI Energy, Inc. | 167,700 | 3,862,131 | ||||||
| 9,541,331 | ||||||||
Financials (5.9%) | ||||||||
Allstate Corp. (The) | 106,100 | 6,880,585 | ||||||
Legg Mason, Inc. | 114,500 | 5,954,000 | ||||||
Northern Trust Corp. | 116,000 | 7,690,800 | ||||||
| 20,525,385 | ||||||||
Health Care (6.6%) | ||||||||
Agilent Technologies, Inc. | 141,900 | 7,844,232 | ||||||
Boston Scientific Corp. (a) | 723,500 | 9,608,080 | ||||||
Cardinal Health, Inc. | 72,100 | 5,658,408 | ||||||
| 23,110,720 | ||||||||
Industrials (9.1%) | ||||||||
Con-way, Inc. | 109,700 | 4,757,689 | ||||||
Fastenal Co. | 202,000 | 8,896,080 | ||||||
Illinois Tool Works, Inc. | 45,400 | 4,133,670 | ||||||
Northrop Grumman Corp. | 42,831 | 5,908,965 | ||||||
PACCAR, Inc. | 124,200 | 8,112,744 | ||||||
| 31,809,148 | ||||||||
Information Technology (9.7%) | ||||||||
CA, Inc. | 104,500 | 3,036,770 | ||||||
FactSet Research Systems, Inc. | 72,300 | 9,503,112 | ||||||
International Business Machines Corp. | 54,100 | 8,894,040 | ||||||
NetApp, Inc. | 124,500 | 5,328,600 | ||||||
VeriFone Systems, Inc. (a) | 188,300 | 7,016,058 | ||||||
| 33,778,580 | ||||||||
Total Common Stocks — Short Positions | 172,247,727 | |||||||
EXCHANGE TRADED FUNDS — SHORT POSITIONS (3.8%) |
| |||||||
Equity Funds (3.8%) | ||||||||
Powershares QQQ Trust, Series 1 | 67,100 | $ | 6,803,940 | |||||
Utilities Select Sector SPDR Fund | 140,000 | 6,365,800 | ||||||
| 13,169,740 | ||||||||
Total Exchange Traded Funds—Short Positions |
| 13,169,740 | ||||||
Total Securities Sold Short | $ | 185,417,467 | ||||||
| (a) | Non-income producing security. |
| (b) | See Notes to Financial Statements for tax unrealized appreciation/depreciation of securities. |
See accompanying Notes to Financial Statements.
2014 Annual Report
35
Table of Contents
Aberdeen European Equity Fund (Unaudited)
The Aberdeen European Equity Fund (Class A shares at net asset value net of fees) returned -3.80% for the 12-month period ended October 31, 2014, versus the -0.73% return of its benchmark, the FTSE World Europe Index, during the same period. For broader comparison, the average return of the Fund’s Lipper peer category of European Region Funds (consisting of 71 funds) was -2.27% for the period.
Pan-European equities dipped in U.S. dollar terms during the reporting period. Initial concerns over the U.S. Federal Reserve’s (Fed) tapering of its quantitative easing program gave way to hope that economic recovery in the U.S. was becoming more sustainable. Also lifting market sentiment were an increase in mergers and acquisitions, hopes that the European Central Bank’s (ECB) unorthodox policies would revive the Eurozone,1 upbeat gross domestic product growth in the United Kingdom (UK) and Scotland’s decision to stay in the UK. However, the gains were pared by a slew of worries, including fears over a hard economic landing in China, geopolitical tensions in Ukraine and the Middle East, Russia’s retaliatory sanctions to Western embargoes, and contagion fears triggered by the woes of Portugal’s second-largest lender, Banco Espirito Santo. Subsequently, stock markets failed to make up for earlier losses, especially after a sell-off late in the reporting period on the back of sluggish economic data and corporate earnings, the ECB’s wavering amid the worsening global backdrop, as well as the end of quantitative easing in the U.S.
Fund performance for the reporting period was hindered by the negative impact of overall stock selection, which outweighed the positive contribution from asset allocation.
At the stock level, contributors to the Fund’s relative return included biopharmaceutical firm Novo-Nordisk, which continued to deliver good profit growth and benefited from a positive regulatory outcome for one of its anti-obesity treatments. Financial services company Prudential posted good first-half 2014 results that reflected good underlying growth in both the U.S. and Asia. Associated British Foods reported better-than-expected results in its sugar business. The company’s restructuring in its grocery segment began to bear fruit and its subsidiary, Primark, continued to see substantial growth.
Conversely, the Fund’s holding in Standard Chartered detracted from performance for the annual period. The lender faced difficult market conditions, including continued financial market weakness and specific challenges in Korea. Management has moved quickly to dispose of non-core businesses and reduce costs. The position in Tesco also had a negative impact on Fund performance, as its shares underperformed the overall market following a downgrade in its profit expectations amid intensifying competition. Additionally, Tesco shares declined on news that its first-half profits and full-year forecast were overstated due to accounting irregularities in its UK food business. Another detractor was Rolls-Royce. Its shares were relatively weak after mid-year 2014 results that were dampened by short-term factors, such as an adverse product mix, as well as higher research and development and restructuring charges.
In key Fund activity, we sold the holding in engineering firm Amec Foster Wheeler after a recent deal increased its leverage and heightened the risk of cyclicality in its business, in our view. We initiated a position in Swiss watch components-maker Swatch, which owns several well-established watch brands, and Experian, a credit scoring and processing business with a number of growing international positions. We also added to the position in defense electronics company Cobham via a share placement,2 from which the company funded what we believe is an attractive acquisition.
Looking ahead, we remain concerned about low inflation in Europe, while we feel that a lack of unity within the ECB does not bode well for good policy-making. While the ECB has introduced stimulus through bond purchases, some investors were left disappointed by the absence of a more aggressive quantitative easing similar to that of Japan. We think that the markets continue to hope for something more concrete than ECB President Mario Draghi’s verbal promises to help lift a still-struggling Eurozone from its present malaise. In our view, only time will tell if the ECB’s present action (or inaction) will suffice in preventing the economy from lapsing back into recession for the third time since the start of the global financial crisis in 2007.
Portfolio Management:
Aberdeen Pan European Equity Team
PAST PERFORMANCE DOES NOT GUARANTEE FUTURE RESULTS.
The performance data quoted represents past performance and current returns may be lower or higher. Class A Shares have up to a 5.75% front-end sales charge and a 0.25% 12b-1 fee. The investment return and principal value will fluctuate so that an investor’s shares, when redeemed, may be worth more or less than the original cost. To obtain performance information current to the most recent month-end, which may be higher or lower than the performance shown above, please call 866-667-9231 or go to www.aberdeen-asset.us.
Investing in mutual funds involves risk, including the possible loss of principal.
Indexes are unmanaged and have been provided for comparison purposes only. No fees or expenses are reflected. You cannot invest directly in an index.
Lipper is a leading global provider of mutual fund information and analysis to fund companies, financial intermediaries and media organizations.
Risk Considerations
Foreign securities may be more volatile, harder to price and less liquid than U.S. securities. They are subject to different accounting and regulatory standards, and political and economic risks. These risks are enhanced in emerging markets countries.
Concentrating investments in Europe subjects the Fund to more volatility and greater risk of loss than geographically diverse mutual funds.
| 1 | The Eurozone comprises 18 European Union member states that have adopted the euro as their common currency. |
| 2 | A share placement comprises the sale of securities to a small number of private investors instead of to the general investing public. |
Annual Report 2014
36
Table of Contents
Aberdeen European Equity Fund (Unaudited) (concluded)
A number of countries in Europe have experienced severe economic and financial difficulties. These difficulties may continue, worsen or spread within and outside Europe.
Equity stocks of small- and mid-cap companies carry greater risk and more volatility than equity stocks of larger, more established companies.
Because the Fund is non-diversified, the Fund may hold larger positions in fewer securities than other funds. As a result, a single security’s increase or decrease in value may have a greater impact on the Fund’s value and total return.
Please read the prospectus for more detailed information regarding these and other risks.
2014 Annual Report
37
Table of Contents
Aberdeen European Equity Fund (Unaudited)
Average Annual Total Return (For periods ended October 31, 2014) | 1 Yr. | Inception1 | ||||||||
Class A | w/o SC | (3.80% | ) | 3.59% | ||||||
| w/SC2 | (9.31% | ) | (0.16% | ) | ||||||
Class C | w/o SC | (4.47% | ) | 2.85% | ||||||
| w/SC3 | (5.41% | ) | 2.24% | |||||||
Class R4 | w/o SC | (3.98% | ) | 3.37% | ||||||
Institutional Service Class4 | w/o SC | (3.54% | ) | 3.86% | ||||||
Institutional Class4 | w/o SC | (3.53% | ) | 3.86% | ||||||
All figures showing the effect of a sales charge (SC) reflect the maximum charge possible because it has the most significant effect on performance data. The total returns shown above do not include the impact of financial statement rounding of the net asset value per share and/or financial statement adjustments.
| 1 | Fund commenced operations on March 25, 2013. |
| 2 | A 5.75% front-end sales charge was deducted. |
| 3 | A 1.00% contingent deferred sales charge (CDSC) was deducted from the one year return because it is charged when Class C shares are sold within the first year after purchase. |
| 4 | Not subject to any sales charges. |
Annual Report 2014
38
Table of Contents
Aberdeen European Equity Fund (Unaudited)
Performance of a $10,000 Investment (as of October 31, 2014)
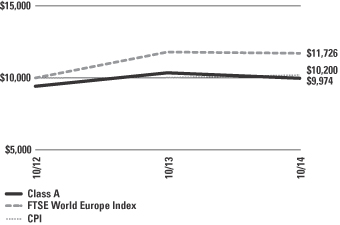
Comparative performance of $10,000 invested in Class A shares of the Aberdeen European Equity Fund, FTSE World Europe Index and the Consumer Price Index (CPI) since inception. Unlike the Fund, the returns for these unmanaged indexes do not reflect any fees, expenses, or sales charges. Investors cannot invest directly in market indexes.
The FTSE World Europe Index is a free-float adjusted market capitalization-weighted index, consisting of large and mid capitalization companies for developed and emerging market segments.
The CPI represents changes in prices of a basket of goods and services purchased for consumption by urban households.
Investment return and principal value will fluctuate, and when redeemed, shares may be worth more or less than original cost. Past performance is no guarantee of future results. The Average Annual Total Return table and Performance graph do not reflect the deduction of taxes that a shareholder would pay on fund distributions or the redemption of fund shares. Investing in mutual funds involves market risk, including loss of principal. Performance returns assume the reinvestment of all distributions. Total returns reflect waiver and reimbursements in effect, without which returns would have been lower.
Portfolio Summary
October 31, 2014 (Unaudited)
| Asset Allocation | ||||
Common Stocks | 96.0% | |||
Repurchase Agreement | 3.1% | |||
Preferred Stocks | 0.1% | |||
Other assets in excess of liabilities | 0.8% | |||
| 100.0% | ||||
The following chart summarizes the composition of the Fund’s portfolio, in industry classification standard sectors, expressed as a percentage of net assets. An industry classification standard sector can include more than one industry group. As of October 31, 2014, the Fund did not have more than 25% of its assets invested in any industry group. The sectors, as classified by S&P’s Global Industry Classification Standard Sectors, are comprised of several industry groups.
| Top Sectors | ||||
Industrials | 24.1% | |||
Consumer Staples | 18.1% | |||
Financials | 14.7% | |||
Materials | 11.0% | |||
Health Care | 9.5% | |||
Energy | 6.8% | |||
Utilities | 5.2% | |||
Consumer Discretionary | 4.7% | |||
Information Technology | 2.0% | |||
Other | 3.9% | |||
| 100.0% | ||||
| Top Holdings* | ||||
Prudential PLC | 4.5% | |||
Roche Holding AG | 4.2% | |||
Linde AG | 3.8% | |||
British American Tobacco PLC | 3.7% | |||
Nestle SA | 3.7% | |||
Nordea Bank AB | 3.6% | |||
Novo Nordisk AS, Class B | 3.5% | |||
Schneider Electric SE | 3.5% | |||
Rolls-Royce Holdings PLC | 3.5% | |||
Centrica PLC | 3.2% | |||
Other | 62.8% | |||
| 100.0% | ||||
| Top Countries | ||||
United Kingdom | 46.4% | |||
Switzerland | 17.0% | |||
Sweden | 11.2% | |||
France | 10.5% | |||
Germany | 3.8% | |||
Denmark | 3.5% | |||
United States | 3.1% | |||
Norway | 1.9% | |||
Italy | 1.8% | |||
Other | 0.8% | |||
| 100.0% | ||||
| * | For the purpose of listing top holdings, repurchase agreements are included as part of Other. |
2014 Annual Report
39
Table of Contents
Statement of Investments
October 31, 2014
Aberdeen European Equity Fund
| Shares or Principal Amount | Value | |||||||
COMMON STOCKS (96.0%) | ||||||||
DENMARK (3.5%) | ||||||||
Health Care (3.5%) | ||||||||
Novo Nordisk AS, Class B (a) | 4,800 | $ | 216,973 | |||||
FRANCE (10.5%) | ||||||||
Consumer Staples (5.0%) | ||||||||
Casino Guichard-Perrachon SA (a) | 1,780 | 182,509 | ||||||
L’Oreal SA (a) | 800 | 125,549 | ||||||
| 308,058 | ||||||||
Industrials (3.5%) | ||||||||
Schneider Electric SE (a) | 2,720 | 214,298 | ||||||
Utilities (2.0%) | ||||||||
GDF Suez (a) | 5,200 | 126,256 | ||||||
| 648,612 | ||||||||
GERMANY (3.8%) | ||||||||
Materials (3.8%) | ||||||||
Linde AG (a) | 1,270 | 234,385 | ||||||
ITALY (1.8%) | ||||||||
Energy (1.8%) | ||||||||
Eni SpA (a) | 5,100 | 108,655 | ||||||
NORWAY (1.9%) | ||||||||
Industrials (1.9%) | ||||||||
Kongsberg Gruppen AS | 5,660 | 114,543 | ||||||
SWEDEN (11.2%) | ||||||||
Financials (3.6%) | ||||||||
Nordea Bank AB (a) | 17,090 | 219,807 | ||||||
Industrials (5.6%) | ||||||||
Assa Abloy AB, Class B (a) | 3,450 | 183,142 | ||||||
Atlas Copco AB, B Shares (a) | 6,130 | 162,370 | ||||||
| 345,512 | ||||||||
Information Technology (2.0%) | ||||||||
Telefonaktiebolaget LM Ericsson, B Shares (a) | 10,600 | 125,254 | ||||||
| 690,573 | ||||||||
SWITZERLAND (17.0%) | ||||||||
Consumer Discretionary (2.1%) | ||||||||
Swatch Group AG (a) | 1,500 | 126,904 | ||||||
Consumer Staples (3.7%) | ||||||||
Nestle SA (a) | 3,090 | 226,602 | ||||||
Financials (1.7%) | ||||||||
Zurich Insurance Group AG (a)(b) | 340 | 102,894 | ||||||
Health Care (4.2%) | ||||||||
Roche Holding AG (a) | 865 | 255,263 | ||||||
Industrials (3.1%) | ||||||||
Schindler Holding AG (a) | 1,380 | 193,044 | ||||||
Materials (2.2%) | ||||||||
Holcim Ltd. (a)(b) | 1,940 | 137,691 | ||||||
| 1,042,398 | ||||||||
UNITED KINGDOM (46.3%) | ||||||||
Consumer Discretionary (2.6%) | ||||||||
Pearson PLC | 8,400 | 157,219 | ||||||
Consumer Staples (9.4%) | ||||||||
Associated British Foods PLC (a) | 2,000 | 88,263 | ||||||
British American Tobacco PLC (a) | 4,000 | 226,710 | ||||||
Tesco PLC (a) | 30,000 | 83,280 | ||||||
Unilever PLC (a) | 4,500 | 181,015 | ||||||
| 579,268 | ||||||||
Energy (5.0%) | ||||||||
BG Group PLC (a) | 8,600 | 143,328 | ||||||
Royal Dutch Shell PLC, A Shares (a) | 4,651 | 166,322 | ||||||
| 309,650 | ||||||||
Financials (9.4%) | ||||||||
Prudential PLC (a) | 12,000 | 277,872 | ||||||
Schroders PLC, Non-Voting Shares (a) | 4,350 | 134,185 | ||||||
Standard Chartered PLC (a) | 11,177 | 168,244 | ||||||
| 580,301 | ||||||||
Health Care (1.8%) | ||||||||
GlaxoSmithKline PLC (a) | 4,930 | 111,487 | ||||||
Industrials (9.9%) | ||||||||
Cobham PLC (a) | 29,616 | 138,149 | ||||||
Experian PLC (a) | 8,000 | 120,289 | ||||||
Rolls-Royce Holdings PLC (a)(b) | 15,700 | 212,648 | ||||||
Weir Group PLC (The) (a) | 3,800 | 138,886 | ||||||
| 609,972 | ||||||||
Materials (5.0%) | ||||||||
BHP Billiton PLC (a) | 5,030 | 129,958 | ||||||
Croda International PLC (a) | 4,800 | 176,478 | ||||||
| 306,436 | ||||||||
Utilities (3.2%) | �� | |||||||
Centrica PLC (a) | 40,000 | 193,999 | ||||||
| 2,848,332 | ||||||||
Total Common Stocks | 5,904,471 | |||||||
PREFERRED STOCKS (0.1%) | ||||||||
UNITED KINGDOM (0.1%) | ||||||||
Industrials (0.1%) | ||||||||
Rolls-Royce Holdings PLC, Preferred Shares | 1,413,000 | 2,261 | ||||||
Total Preferred Stocks | 2,261 | |||||||
See accompanying Notes to Financial Statements.
Annual Report 2014
40
Table of Contents
Statement of Investments (concluded)
October 31, 2014
Aberdeen European Equity Fund
| Shares or Principal Amount | Value | |||||||
REPURCHASE AGREEMENT (3.1%) | ||||||||
UNITED STATES (3.1%) | ||||||||
Repurchase Agreement, Fixed Income Clearing Corp., 0.00%, dated 10/31/2014, due 11/03/2014, repurchase price $192,000, collateralized by U.S. Treasury Note, maturing 10/31/2021; total market value of $199,481 | $ | 192,000 | $ | 192,000 | ||||
Total Repurchase Agreement | 192,000 | |||||||
Total Investments | 6,098,732 | |||||||
Other assets in excess of liabilities—0.8% | 50,042 | |||||||
Net Assets—100.0% |
| $ | 6,148,774 | |||||
| (a) | Fair Valued Security. Fair Values are determined pursuant to procedures approved by the Fund’s Board of Trustees. See Note 2(a) of the accompanying Notes to Financial Statements. |
| (b) | Non-income producing security. |
| (c) | See Notes to Financial Statements for tax unrealized appreciation/depreciation of securities. |
See accompanying Notes to Financial Statements.
2014 Annual Report
41
Table of Contents
Aberdeen Global Equity Fund (Unaudited)
The Aberdeen Global Equity Fund (Class A shares at net asset value net of fees) returned 3.37% for the 12-month period ended October 31, 2014, versus the 9.25% return of its benchmark, the MSCI World Index, during the same period and 8.32% for the Fund’s secondary benchmark, the MSCI All Country World Index, for the period. For broader comparison, the average return of the Fund’s Lipper peer category of Global Large-Cap Core Funds (consisting of 24 funds) was 7.39% for the period.
Global equities, as measured by the MSCI World Index, rallied during the review period, attributable largely to improved economic data in the U.S., as well as loose monetary policy in the developed world. The U.S. Federal Reserve’s (Fed) commitment to keep interest rates low for a longer period, as well as the European Central Bank’s unexpected rate cuts and fresh stimulus measures, reassured investors. In Japan, the yen’s weakness lifted equity markets, but gains were pared owing to doubts over the efficacy of Prime Minister Shinzo Abe’s “third arrow” stimulus measures,1 as well as the impact of the consumption tax hike that was implemented in April 2014. The prospect of rising U.S. interest rates alarmed investors, while worsening geopolitical tensions and generally weak manufacturing and services data in Europe and China also dented market sentiment.
Towards the end of the period, monetary policy was the key theme. Although the Fed officially ended its bond-buying program, the Bank of Japan’s increased stimulus, as well as positive corporate earnings, boosted confidence in the global economy. However, oil prices tumbled to multi-year lows,2 as Saudi Arabia’s move to cut prices for exports exacerbated worries over global demand and rising supplies. The fall in oil prices had a mixed effect on markets. Importing nations were notable beneficiaries, whereas exporters such as Russia came under pressure as the lower oil price may aggravate revenue shortfalls caused by a raft of Western sanctions.
The top detractors from Fund performance for the reporting period included lender Standard Chartered, miner Vale, and Italian exchange-listed pipe-maker Tenaris. Standard Chartered’s stock price weakened after the third profit warning in a year as the company delivered its results for the first nine months of its 2014 fiscal year. Management cited high impairment charges as some corporate and institutional clients were hurt by weakening commodity markets. Investor sentiment was also dampened by speculation that U.S. regulators could reinvestigate alleged sanction violations against Standard Chartered. Some of its problems are cyclical and may be resolved in the medium term, in our opinion. More structural difficulties may potentially require management to reprioritize investments, divest non-core businesses and streamline riskier portfolios. Shares of Vale moved lower as fears of a slowdown in China’s economy weighed on iron ore prices, while Tenaris’s stock price declined on concerns that soft oil prices may weigh on demand for its products.
The main contributors to the Fund’s relative return for the period were U.S. retail drugstore chain operator and pharmacy benefit manager CVS Health, Taiwan Semiconductor Manufacturing Co. (TSMC), and freight railroad operator Canadian National Railway. Shares of CVS Health rallied after the company boosted its dividend and approved a significant share buyback. It also reported better-than-expected earnings over the period. TSMC’s stock price gained ground after the company reported record-high sales over multiple quarters, on robust demand for its products. Finally, Canadian National Railway benefited from better-than-expected profits due to greater market share and increased shipments.
In Fund activity, we initiated a position in U.S. payment-processing services company Visa and UK aircraft engine manufacturer Rolls Royce. In our view, Visa has a high-return business with an established market position and attractive growth drivers. We feel that Rolls Royce has an attractive high recurring revenue model, high barriers to entry and positive structural growth potential.
Conversely, we exited the position in U.S. healthcare company Quest Diagnostics, in view of its increasingly challenging environment and lower growth visibility. We also sold the Fund’s shares in Australia’s QBE Insurance as we feel that there are more attractive investment opportunities elsewhere.
The divergence between major global central banks’ monetary policies has become more pronounced, which we believe may create a more complex and challenging market environment ahead. How that translates into global capital flows is uncertain. Meanwhile, the global economic environment appears mixed; while the U.S. economic engine continues to power on, the Eurozone3 and Japan’s economic health remained anemic. However, the sharp drop in oil prices since June may potentially provide some relief to large net importers such as the Eurozone and Japan. Similarly, the appreciation in the U.S. dollar may increase the trade competitiveness of these economies.
For us at Aberdeen, investing in companies that we view as fundamentally sound and well managed is an imperative that we believe should help negate the vagaries of market sentiment. Recent earnings from our holdings have been largely steady or met expectations despite the muted economic backdrop. Renewed efforts to boost profits through cost cuts and improving margins are further along, even though it may be some time before a broader rebound is evident. Many of these companies are market leaders and have weathered periods of crises; we think it should be no different this time. If we feel that valuations are attractive, we will look to add to favored holdings when opportunities arise.
| 1 | The “third arrow” is the last of Japanese Prime Minister Shinzo Abe’s economic program, comprising structural reforms in an effort to boost Japan’s competitiveness. |
| 2 | Source: Bloomberg, October 2014. |
| 3 | The Eurozone comprises 18 European Union member states that have adopted the euro as their common currency. |
Annual Report 2014
42
Table of Contents
Aberdeen Global Equity Fund (Unaudited) (concluded)
Portfolio Management:
Aberdeen Global Equity Team
PAST PERFORMANCE DOES NOT GUARANTEE FUTURE RESULTS.
The performance data quoted represents past performance and current returns may be lower or higher. Class A Shares have up to a 5.75% front-end sales charge and a 0.25% 12b-1 fee. The investment return and principal value will fluctuate so that an investor’s shares, when redeemed, may be worth more or less than the original cost. To obtain performance information current to the most recent month-end, which may be higher or lower than the performance shown above, please call 866-667-9231 or go to www.aberdeen-asset.us.
Investing in mutual funds involves risk, including the possible loss of principal.
Indexes are unmanaged and have been provided for comparison purposes only. No fees or expenses are reflected. You cannot invest directly in an index.
Lipper is a leading global provider of mutual fund information and analysis to fund companies, financial intermediaries and media organizations.
Risk Considerations
Foreign securities are more volatile, harder to price and less liquid than U.S. securities. They are subject to different accounting and regulatory standards, and political and economic risks. These risks are enhanced in emerging markets countries.
Equity stocks of small- and mid-cap companies carry greater risk and more volatility than equity stocks of larger, more established companies.
Please read the prospectus for more detailed information regarding these and other risks.
2014 Annual Report
43
Table of Contents
Aberdeen Global Equity Fund (Unaudited)
Average Annual Total Return1 (For periods ended October 31, 2014) | 1 Yr. | 5 Yr. | 10 Yr. | |||||||||||
Class A | w/o SC | 3.37% | 9.24% | 7.69% | ||||||||||
| w/SC2 | (2.55% | ) | 7.96% | 7.05% | ||||||||||
Class C | w/o SC | 2.78% | 8.53% | 6.97% | ||||||||||
| w/SC3 | 1.78% | 8.53% | 6.97% | |||||||||||
Class R4 | w/o SC | 3.06% | 9.00% | 7.44% | ||||||||||
Institutional Service Class4,5 | w/o SC | 3.84% | 9.50% | 7.82% | ||||||||||
Institutional Class4 | w/o SC | 3.77% | 9.60% | 7.88% | ||||||||||
All figures showing the effect of a sales charge (SC) reflect the maximum charge possible because it has the most significant effect on performance data. The total returns shown above do not include the impact of financial statement rounding of the net asset value per share and/or financial statement adjustments.
| 1 | Returns prior to June 23, 2008 incorporate the performance of a predecessor fund (the “Predecessor Fund”). The Fund and the Predecessor Fund have substantially similar investment objectives and strategies. Please consult the Fund’s prospectus for more detail. |
| 2 | A 5.75% front-end sales charge was deducted. |
| 3 | A 1.00% contingent deferred sales charge (CDSC) was deducted from the one year return because it is charged when Class C shares are sold within the first year after purchase. |
| 4 | Not subject to any sales charges. |
| 5 | Returns before the first offering of the Institutional Service Class (December 19, 2011) are based on the previous performance of the Institutional Class shares of the Predecessor Fund. The performance of the Institutional Class is substantially similar to what the Institutional Service Class would have produced because both classes invest in the same portfolio of securities. Returns for Institutional Service Class shares would only differ to the extent of the differences in expenses of the classes. |
Annual Report 2014
44
Table of Contents
Aberdeen Global Equity Fund (Unaudited)
Performance of a $10,000 Investment (as of October 31, 2014)
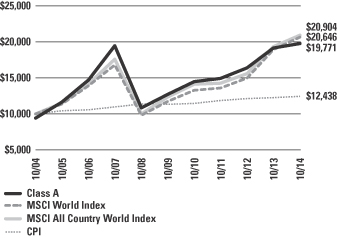
Comparative performance of $10,000 invested in Class A shares of the Aberdeen Global Equity Fund, Morgan Stanley Capital International (MSCI) World Index, MSCI All Country World Index and the Consumer Price Index (CPI) over a 10-year period ended October 31, 2014. Unlike the Fund, the returns for these unmanaged indexes do not reflect any fees, expenses or sales charges. Investors cannot invest directly in market indexes.
The MSCI World Index is a free float-adjusted, market capitalization weighted index that captures large and mid cap representation across 23 developed markets countries including: Australia, Austria, Belgium, Canada, Denmark, Finland, France, Germany, Hong Kong, Ireland, Israel, Italy, Japan, Netherlands, New Zealand, Norway, Portugal, Singapore, Spain, Sweden, Switzerland, the UK and the US.
The MSCI All Country World Index is a free float-adjusted market capitalization-weighted index that captures the large- and mid-cap representation across 23 developed markets and 23 emerging markets. The developed market countries include: Australia, Austria, Belgium, Canada, Denmark, Finland, France, Germany, Hong Kong, Ireland, Israel, Italy, Japan, Netherlands, New Zealand, Norway, Portugal, Singapore, Spain, Sweden, Switzerland, the U.K. and the US. The emerging market countries include: Brazil, Chile, China, Colombia, Czech Republic, Egypt, Greece, Hungary, India, Indonesia, Korea, Malaysia, Mexico, Peru, Philippines, Poland, Qatar, Russia, South Africa, Taiwan, Thailand, Turkey and United Arab Emirates.
The CPI represents changes in prices of a basket of goods and services purchased for consumption by urban households.
Investment return and principal value will fluctuate, and when redeemed, shares may be worth more or less than original cost. Past performance is no guarantee of future results. The Average Annual Total Return table and Performance graph do not reflect the deduction of taxes that a shareholder would pay on fund distributions or the redemption of fund shares. Investing in mutual funds involves market risk, including loss of principal. Performance returns assume the reinvestment of all distributions. Total returns reflect waivers and reimbursements in effect, without which returns would have been lower.
Portfolio Summary (as a percentage of net assets)
October 31, 2014 (Unaudited)
| Asset Allocation | ||||
Common Stocks | 87.4% | |||
Preferred Stocks | 7.8% | |||
Repurchase Agreement | 4.1% | |||
Other assets in excess of liabilities | 0.7% | |||
| 100.0% | ||||
The following chart summarizes the composition of the Fund’s portfolio, in industry classification standard sectors, expressed as a percentage of net assets. An industry classification standard sector can include more than one industry group. As of October 31, 2014, the Fund did not have more than 25% of its assets invested in any industry group. The sectors, as classified by S&P’s Global Industry Classification Standard Sectors, are comprised of several industry groups.
| Top Sectors | ||||
Consumer Staples | 17.3% | |||
Energy | 15.6% | |||
Financials | 15.2% | |||
Health Care | 11.7% | |||
Information Technology | 10.7% | |||
Industrials | 9.5% | |||
Materials | 9.3% | |||
Telecommunication Services | 2.5% | |||
Consumer Discretionary | 2.0% | |||
Utilities | 1.4% | |||
Other | 4.8% | |||
| 100.0% | ||||
| Top Holdings* | ||||
Roche Holding AG | 3.9% | |||
Taiwan Semiconductor Manufacturing Co. Ltd., ADR | 3.2% | |||
CVS Health Corp. | 3.2% | |||
Philip Morris International, Inc. | 3.1% | |||
Johnson & Johnson | 3.0% | |||
British American Tobacco PLC | 2.9% | |||
Novartis AG | 2.9% | |||
Banco Bradesco SA, ADR, Preferred Shares | 2.7% | |||
Royal Dutch Shell PLC, B Shares | 2.7% | |||
Tenaris SA, ADR | 2.6% | |||
Other | 69.8% | |||
| 100.0% | ||||
| Top Countries | ||||
United States | 33.2% | |||
United Kingdom | 14.7% | |||
Switzerland | 11.2% | |||
Japan | 6.5% | |||
Brazil | 5.4% | |||
Sweden | 4.9% | |||
Italy | 4.4% | |||
Canada | 3.9% | |||
Taiwan | 3.2% | |||
Hong Kong | 2.6% | |||
Other | 10.0% | |||
| 100.0% | ||||
| * | For the purpose of listing top holdings, repurchase agreements are included as part of Other. |
2014 Annual Report
45
Table of Contents
Statement of Investments
October 31, 2014
Aberdeen Global Equity Fund
| Shares or Principal Amount | Value | |||||||
COMMON STOCKS (87.4%) | ||||||||
CANADA (3.9%) | ||||||||
Industrials (2.0%) | ||||||||
Canadian National Railway Co. | 44,200 | $ | 3,116,216 | |||||
Materials (1.9%) | ||||||||
Potash Corp. of Saskatchewan, Inc. | 89,600 | 3,058,349 | ||||||
| 6,174,565 | ||||||||
CHINA (1.4%) | ||||||||
Energy (1.4%) | ||||||||
PetroChina Co. Ltd., H Shares (a) | 1,798,300 | 2,253,688 | ||||||
FRANCE (1.0%) | ||||||||
Industrials (1.0%) | ||||||||
Schneider Electric SE (a) | 19,500 | 1,536,329 | ||||||
HONG KONG (2.6%) | ||||||||
Financials (2.6%) | ||||||||
AIA Group Ltd. (a) | 447,600 | 2,497,798 | ||||||
Swire Pacific Ltd., Class A (a) | 119,300 | 1,566,344 | ||||||
| 4,064,142 | ||||||||
ITALY (4.4%) | ||||||||
Energy (4.4%) | ||||||||
Eni SpA (a) | 128,400 | 2,735,548 | ||||||
Tenaris SA, ADR | 104,700 | 4,150,308 | ||||||
| 6,885,856 | ||||||||
JAPAN (6.5%) | ||||||||
Consumer Staples (1.6%) | ||||||||
Japan Tobacco, Inc. (a) | 73,100 | 2,494,101 | ||||||
Financials (1.1%) | ||||||||
Daito Trust Construction Co. Ltd. (a) | 13,300 | 1,657,190 | ||||||
Industrials (1.4%) | ||||||||
FANUC Corp. (a) | 12,800 | 2,255,818 | ||||||
Materials (2.4%) | ||||||||
Shin-Etsu Chemical Co. Ltd. (a) | 58,900 | 3,780,709 | ||||||
| 10,187,818 | ||||||||
MEXICO (2.1%) | ||||||||
Consumer Staples (2.1%) | ||||||||
Fomento Economico Mexicano SAB de CV, ADR | 34,500 | 3,320,280 | ||||||
SINGAPORE (0.9%) | ||||||||
Financials (0.9%) | ||||||||
City Developments Ltd. (a) | 193,800 | 1,426,353 | ||||||
SOUTH AFRICA (1.5%) | ||||||||
Telecommunication Services (1.5%) | ||||||||
MTN Group Ltd. (a) | 109,600 | 2,426,878 | ||||||
SWEDEN (4.9%) | ||||||||
Financials (1.5%) | ||||||||
Nordea Bank AB (a) | 183,600 | 2,361,418 | ||||||
Industrials (2.0%) | ||||||||
Atlas Copco AB, A Shares (a) | 109,400 | 3,168,856 | ||||||
Information Technology (1.4%) | ||||||||
Telefonaktiebolaget LM Ericsson, B Shares (a) | 184,200 | 2,176,580 | ||||||
| 7,706,854 | ||||||||
SWITZERLAND (11.2%) | ||||||||
Consumer Staples (1.9%) | ||||||||
Nestle SA (a) | 42,200 | 3,094,699 | ||||||
Financials (2.5%) | ||||||||
Zurich Insurance Group AG (a)(b) | 12,900 | 3,903,907 | ||||||
Health Care (6.8%) | ||||||||
Novartis AG (a) | 49,200 | 4,565,900 | ||||||
Roche Holding AG (a) | 20,800 | 6,138,109 | ||||||
| 10,704,009 | ||||||||
| 17,702,615 | ||||||||
TAIWAN (3.2%) | ||||||||
Information Technology (3.2%) | ||||||||
Taiwan Semiconductor Manufacturing Co. Ltd., ADR | 229,500 | 5,053,590 | ||||||
UNITED KINGDOM (14.7%) | ||||||||
Consumer Staples (2.9%) | ||||||||
British American Tobacco PLC (a) | 81,700 | 4,630,560 | ||||||
Energy (2.7%) | ||||||||
Royal Dutch Shell PLC, B Shares (a) | 114,000 | 4,211,779 | ||||||
Financials (3.9%) | ||||||||
HSBC Holdings PLC (a) | 305,500 | 3,114,684 | ||||||
Standard Chartered PLC (a) | 196,700 | 2,960,857 | ||||||
| 6,075,541 | ||||||||
Industrials (1.1%) | ||||||||
Rolls-Royce Holdings PLC (a)(b) | 121,940 | 1,651,613 | ||||||
Materials (1.7%) | ||||||||
BHP Billiton PLC (a) | 106,200 | 2,743,847 | ||||||
Telecommunication Services (1.0%) | ||||||||
Vodafone Group PLC (a) | 465,103 | 1,546,679 | ||||||
Utilities (1.4%) | ||||||||
Centrica PLC (a) | 469,900 | 2,279,002 | ||||||
| 23,139,021 | ||||||||
UNITED STATES (29.1%) | ||||||||
Consumer Discretionary (2.0%) | ||||||||
Comcast Corp., Class A | 56,000 | 3,099,600 | ||||||
Consumer Staples (8.8%) | ||||||||
CVS Health Corp. | 58,200 | 4,994,142 | ||||||
PepsiCo, Inc. | 41,400 | 3,981,438 | ||||||
Philip Morris International, Inc. | 55,200 | 4,913,352 | ||||||
| 13,888,932 | ||||||||
See accompanying Notes to Financial Statements.
Annual Report 2014
46
Table of Contents
Statement of Investments (concluded)
October 31, 2014
Aberdeen Global Equity Fund
| Shares or Principal Amount | Value | |||||||
Energy (6.2%) | ||||||||
Chevron Corp. | 19,000 | $ | 2,279,050 | |||||
EOG Resources, Inc. | 39,600 | 3,763,980 | ||||||
Schlumberger Ltd. | 38,800 | 3,828,008 | ||||||
| 9,871,038 | ||||||||
Health Care (4.9%) | ||||||||
Baxter International, Inc. | 43,200 | 3,030,048 | ||||||
Johnson & Johnson | 44,200 | 4,763,876 | ||||||
| 7,793,924 | ||||||||
Industrials (2.0%) | ||||||||
United Technologies Corp. | 29,600 | 3,167,200 | ||||||
Information Technology (3.7%) | ||||||||
Oracle Corp. | 102,200 | 3,990,910 | ||||||
Visa, Inc., Class A | 7,600 | 1,834,868 | ||||||
| 5,825,778 | ||||||||
Materials (1.5%) | ||||||||
Praxair, Inc. | 18,300 | 2,305,617 | ||||||
| 45,952,089 | ||||||||
Total Common Stocks | 137,830,078 | |||||||
PREFERRED STOCKS (7.8%) | ||||||||
BRAZIL (5.4%) | ||||||||
Energy (0.9%) | ||||||||
Petroleo Brasileiro SA, ADR, Preferred Shares | 114,000 | 1,394,220 | ||||||
Financials (2.7%) | ||||||||
Banco Bradesco SA, ADR, Preferred Shares | 293,112 | 4,390,818 | ||||||
Materials (1.8%) | ||||||||
Vale SA, ADR, Preferred Shares | 322,500 | 2,825,100 | ||||||
| 8,610,138 | ||||||||
REPUBLIC OF SOUTH KOREA (2.4%) | ||||||||
Information Technology (2.4%) | ||||||||
Samsung Electronics Co. Ltd., GDR, Preferred Shares (a)(c) | 8,223 | 3,772,474 | ||||||
UNITED KINGDOM (0.0%) | ||||||||
Industrials (0.0%) | ||||||||
Rolls-Royce Holdings PLC, Preferred Shares | 8,865,000 | 14,181 | ||||||
Total Preferred Stocks | 12,396,793 | |||||||
REPURCHASE AGREEMENT (4.1%) | ||||||||
UNITED STATES (4.1%) | ||||||||
Repurchase Agreement, Fixed Income Clearing Corp., 0.00%, dated 10/31/2014, due 11/03/2014, repurchase price $6,474,000, collateralized by U.S. Treasury Note, maturing 10/31/2021; total market value of $6,607,815 | $ | 6,474,000 | $ | 6,474,000 | ||||
Total Repurchase Agreement | 6,474,000 | |||||||
Total Investments | 156,700,871 | |||||||
Other assets in excess of liabilities—0.7% | 1,063,252 | |||||||
Net Assets—100.0% | $ | 157,764,123 | ||||||
| (a) | Fair Valued Security. Fair Values are determined pursuant to procedures approved by the Fund’s Board of Trustees. See Note 2(a) of the accompanying Notes to Financial Statements. |
| (b) | Non-income producing security. |
| (c) | Denotes a security issued under Regulation S or Rule 144A. |
| (d) | See Notes to Financial Statements for tax unrealized appreciation/depreciation of securities. |
| ADR | American Depositary Receipt |
| GDR | Global Depositary Receipt |
See accompanying Notes to Financial Statements.
2014 Annual Report
47
Table of Contents
Aberdeen Global Natural Resources Fund (Unaudited)
The Aberdeen Global Natural Resources Fund (Class A shares at net asset value net of fees) returned -4.75% for the 12-month period ended October 31, 2014, versus the 8.32% returned of its benchmark, MSCI All Country World Index, and the -3.45% return of its secondary benchmark, the S&P Global Natural Resources Index, during the same period. For broader comparison, the average return of the Fund’s Lipper peer category of Global Natural Resources Funds (consisting of 60 funds) was -5.05% for the period.
Global natural resources stocks, as measured by the S&P Global Natural Resources Index, posted losses in volatile trading over the reporting period, underperforming the rise in the broader global stock market, as represented by the MSCI All Country World Index. Market sentiment initially was hurt by renewed turmoil in the emerging markets and the start of the U.S. Federal Reserve’s (Fed) tapering of its quantitative easing program despite mixed U.S. economic data. But risk appetite re-emerged after the European Central Bank cut a key rate to 0% and Fed chairman Janet Yellen reiterated that U.S. interest rates would stay low for an extended period. Elsewhere, targeted stimulus appeared to work in China. The positive momentum, however, reversed sharply towards the period-end, as investors fretted over geopolitical risks, particularly Russia’s incursion into Ukraine and the rise of the Islamic State in both Iraq and Syria, as well as the prospect of higher U.S. rates. China’s economic slowdown clouded the demand outlook for resources.
The New York Mercantile Exchange crude oil price rose as high as US$107 a barrel in late June, owing to supply fears from the intensifying unrest in Iraq. However, the price tumbled to around US$80 a barrel by the end of the reporting period, after the Organization of Petroleum Exporting Countries cut prices in a bid to protect market share and shake out less efficient rivals. This was against a backdrop of a supply glut, compounded by rising U.S. output, and global demand that was forecast to rise at the slowest pace since 2009.1 Meanwhile, gold prices closed 12% lower in volatile trading over the reporting period, as the prospect of Fed monetary policy tightening buoyed the U.S. dollar and dampened gold demand.2 The Fed subsequently ended its asset purchases in late October 2014.
At the stock level, the top contributors to Fund performance included Shin-Etsu Chemical, which benefited from high demand for silicon wafers. Canadian National Railway also boosted Fund performance, as a rebound in its grain business drove impressive quarterly earnings. Additionally, the Fund’s lack of exposure to specialty chemicals producer Syngenta had a positive impact on the Fund’s relative performance, as the stock underperformed the overall market over the period.
Conversely, the Fund’s holding in miner Vale was the largest detractor from the Fund’s return for the period, relative to the Fund’s secondary benchmark. Its share price was hurt by concerns over a sharp drop in iron ore prices and the negative impact from China’s slowing economy, given that the mainland’s steel industry is its biggest customer. Shares of specialty pipe-maker Tenaris declined on concerns that demand would fall if oil prices remained soft. GoldCorp was another key detractor amid falling gold prices, although the company swung to a net profit in the first half of 2014 from losses in the same period a year earlier. The absence of positions in integrated oil and gas company Exxon Mobil and metals producer Alcoa also were a drag on performance, relative to the Fund’s secondary benchmark.
During the period, we sold the holding in Barrick Gold due to our concerns over its prospects, and NOW International, which the Fund received from its spin-off from energy equipment and services provider National Oilwell Varco.
Markets have turned volatile as the global recovery appears to be stalling, in our opinion. China’s most recent economic data was weak. The Fed has highlighted the impact of Europe’s economic malaise on the U.S., which has led to diminished expectations of monetary policy tightening. Oil prices have continued to fall after the International Energy Agency downgraded its forecasts for global demand, while the going remains tough for gold prices amid U.S. dollar strength. Against such a backdrop, we are cautious about the short-term outlook for global natural resources stocks.
Portfolio Management:
Aberdeen Global Equity Team
PAST PERFORMANCE DOES NOT GUARANTEE FUTURE RESULTS.
The performance data quoted represents past performance and current returns may be lower or higher. Class A Shares have up to a 5.75% front-end sales charge and a 0.25% 12b-1 fee. The investment return and principal value will fluctuate so that an investor’s shares, when redeemed, may be worth more or less than the original cost. To obtain performance information current to the most recent month-end, which may be higher or lower than the performance shown above, please call 866-667-9231 or go to www.aberdeen-asset.us.
Investing in mutual funds involves risk, including the possible loss of principal.
Indexes are unmanaged and have been provided for comparison purposes only. No fees or expenses are reflected. You cannot invest directly in an index.
Lipper is a leading global provider of mutual fund information and analysis to fund companies, financial intermediaries and media organizations.
Risk Considerations
Investing 25% or more of the Fund’s net assets in natural resources industries subjects the Fund to greater risk of loss and is considerably more volatile compared to investments that are diversified across a greater number of industries.
The natural resources industry can be significantly affected by events relating to international political and economic developments, energy conservation, the success of exploration projects, commodity prices, and tax and other government regulations. The securities of
| 1 | Source: International Energy Agency, October 2014. |
| 2 | Source: Bloomberg, November 2014. |
Annual Report 2014
48
Table of Contents
Aberdeen Global Natural Resources Fund (Unaudited) (concluded)
companies in the natural resources sector may experience more price volatility than securities of companies in other industries.
Foreign securities are more volatile, harder to price and less liquid than U.S. securities. They are subject to different accounting and regulatory standards, and political and economic risks. These risks are enhanced in emerging markets countries.
Equity stocks of small- and mid-cap companies carry greater risk and more volatility than equity stocks of larger, more established companies.
Please read the prospectus for more detailed information regarding these and other risks.
2014 Annual Report
49
Table of Contents
Aberdeen Global Natural Resources Fund (Unaudited)
Average Annual Total Return1 (For periods ended October 31, 2014) | 1 Yr. | 5 Yr. | 10 Yr. | |||||||||||
Class A | w/o SC | (4.75% | ) | 1.30% | 8.38% | |||||||||
| w/SC2 | (10.24% | ) | 0.11% | 7.74% | ||||||||||
Class C | w/o SC | (5.39% | ) | 0.62% | 7.64% | |||||||||
| w/SC3 | (6.33% | ) | 0.62% | 7.64% | ||||||||||
Class R4 | w/o SC | (4.94% | ) | 1.11% | 8.16% | |||||||||
Institutional Service Class4 | w/o SC | (4.52% | ) | 1.64% | 8.71% | |||||||||
Institutional Class4 | w/o SC | (4.52% | ) | 1.60% | 8.70% | |||||||||
All figures showing the effect of a sales charge (SC) reflect the maximum charge possible because it has the most significant effect on performance data. The total returns shown above do not include the impact of financial statement rounding of the net asset value per share and/or financial statement adjustments.
| 1 | Returns incorporate the performance of a predecessor fund (the “Predecessor Fund”) from inception to June 23, 2008. The Fund and the Predecessor Fund have substantially similar investment objectives and strategies. Please consult the Fund’s prospectus for more detail. |
| 2 | A 5.75% front-end sales charge was deducted. |
| 3 | A 1.00% contingent deferred sales charge (CDSC) was deducted from the one year return because it is charged when Class C shares are sold within the first year after purchase. |
| 4 | Not subject to any sales charges. |
Annual Report 2014
50
Table of Contents
Aberdeen Global Natural Resources Fund (Unaudited)
Performance of a $10,000 Investment (as of October 31, 2014)
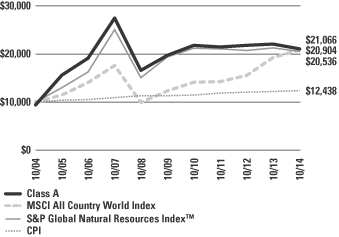
Comparative performance of $10,000 invested in Class A shares of the Aberdeen Global Natural Resources Fund, the Morgan Stanley Capital International (MSCI) All Country World Index, the S&P Global Natural Resources Index™, and the Consumer Price Index (CPI) over a 10-year period ended October 31, 2014. Unlike the Fund, the returns for these unmanaged indexes do not reflect any fees, expenses, or sales charges. Investors cannot invest directly in market indexes.
Effective February 28, 2014, the MSCI All Country World Index replaced the S&P Global Natural Resources Index™ as the Fund’s primary benchmark to reflect a broader securities market. The Adviser believes that the S&P Global Natural Resources Index™, the Fund’s secondary benchmark, remains a meaningful comparison given the Fund’s investment objective.
The MSCI All Country World Index is a free float-adjusted capitalization-weighted index that captures the large- and mid-cap representation across 23 developed markets and 23 emerging markets. The developed market countries include: Australia, Austria, Belgium, Canada, Denmark, Finland, France, Germany, Hong Kong, Ireland, Israel, Italy, Japan, Netherlands, New Zealand, Norway, Portugal, Singapore, Spain, Sweden, Switzerland, the U.K. and the US. The emerging market countries include: Brazil, Chile, China, Colombia, Czech Republic, Egypt, Greece, Hungary, India, Indonesia, Korea, Malaysia, Mexico, Peru, Philippines, Poland, Qatar, Russia, South Africa, Taiwan, Thailand, Turkey and United Arab Emirates.
The S&P Global Natural Resources Index™ includes 90 of the largest publicly-traded companies in natural resources and commodities businesses that meet specific investability requirements, with exposure across 3 primary commodity-related sectors: Agribusiness, Energy, and Metals & Mining.
The CPI represents changes in prices of a basket of goods and services purchased for consumption by urban households.
Investment return and principal value will fluctuate, and when redeemed, shares may be worth more or less than original cost. Past performance is no guarantee of future results. The Average Annual Total Return table and Performance graph do not reflect the deduction of taxes that a shareholder would pay on fund distributions or the redemption of fund shares. Investing in mutual funds involves market risk, including loss of principal. Performance returns assume the reinvestment of all distributions. Total returns reflect waivers and reimbursements in effect, without which returns would have been lower.
Portfolio Summary (as a percentage of net assets)
October 31, 2014 (Unaudited)
| Asset Allocation | ||||
Common Stocks | 95.7% | |||
Preferred Stocks | 2.5% | |||
Repurchase Agreement | 1.6% | |||
Other assets in excess of liabilities | 0.2% | |||
| 100.0% | ||||
The following chart summarizes the composition of the Fund’s portfolio, in industry classification standard sectors, expressed as a percentage of net assets. An industry classification standard sector can include more than one industry group. As of October 31, 2014, the Fund did not have more than 25% of its assets invested in any industry group. The sectors, as classified by S&P’s Global Industry Classification Standard Sectors, are comprised of several industry groups.
| Top Sectors | ||||
Materials | 49.8% | |||
Energy | 42.8% | |||
Industrials | 5.6% | |||
Other | 1.8% | |||
| 100.0% | ||||
| Top Holdings* | ||||
Royal Dutch Shell PLC, B Shares | 6.5% | |||
Vale SA, ADR | 6.5% | |||
BHP Billiton PLC | 6.3% | |||
Tenaris SA, ADR | 6.2% | |||
Praxair, Inc. | 5.4% | |||
Schlumberger Ltd. | 5.3% | |||
Potash Corp. of Saskatchewan, Inc. | 5.2% | |||
EOG Resources, Inc. | 5.0% | |||
Shin-Etsu Chemical Co. Ltd. | 4.7% | |||
Rio Tinto PLC | 4.7% | |||
Other | 44.2% | |||
| 100.0% | ||||
| Top Countries | ||||
United States | 25.8% | |||
United Kingdom | 22.7% | |||
Brazil | 11.5% | |||
Canada | 10.8% | |||
Italy | 10.5% | |||
France | 6.7% | |||
Japan | 4.7% | |||
Germany | 3.6% | |||
Chile | 2.5% | |||
Netherlands | 1.0% | |||
Other | 0.2% | |||
| 100.0% | ||||
| * | For the purpose of listing top holdings, repurchase agreements are included as part of Other. |
2014 Annual Report
51
Table of Contents
Statement of Investments
October 31, 2014
Aberdeen Global Natural Resources Fund
| Shares or Principal Amount | Value | |||||||
COMMON STOCKS (95.7%) | ||||||||
BRAZIL (11.5%) | ||||||||
Energy (1.6%) | ||||||||
Petroleo Brasileiro SA, ADR | 32,900 | $ | 384,930 | |||||
Industrials (3.4%) | ||||||||
Wilson Sons Ltd., BDR | 55,200 | 779,692 | ||||||
Materials (6.5%) | ||||||||
Vale SA, ADR | 148,900 | 1,502,401 | ||||||
| 2,667,023 | ||||||||
CANADA (10.8%) | ||||||||
Industrials (2.2%) | ||||||||
Canadian National Railway Co. | 7,100 | 501,118 | ||||||
Materials (8.6%) | ||||||||
Goldcorp, Inc. | 42,500 | 797,547 | ||||||
Potash Corp. of Saskatchewan, Inc. | 35,400 | 1,209,618 | ||||||
| 2,007,165 | ||||||||
| 2,508,283 | ||||||||
FRANCE (6.7%) | ||||||||
Energy (2.5%) | ||||||||
Total SA (a) | 9,600 | 573,151 | ||||||
Materials (4.2%) | ||||||||
Air Liquide SA (a) | 8,180 | 987,456 | ||||||
| 1,560,607 | ||||||||
GERMANY (3.6%) | ||||||||
Materials (3.6%) | ||||||||
Linde AG (a) | 4,500 | 830,498 | ||||||
ITALY (10.5%) | ||||||||
Energy (10.5%) | ||||||||
Eni SpA (a) | 47,200 | 1,005,591 | ||||||
Tenaris SA, ADR | 36,300 | 1,438,932 | ||||||
| 2,444,523 | ||||||||
JAPAN (4.7%) | ||||||||
Materials (4.7%) | ||||||||
Shin-Etsu Chemical Co. Ltd. (a) | 17,000 | 1,091,206 | ||||||
NETHERLANDS (1.0%) | ||||||||
Energy (1.0%) | ||||||||
Koninklijke Vopak NV (a) | 4,500 | 225,672 | ||||||
UNITED KINGDOM (22.7%) | ||||||||
Energy (11.7%) | ||||||||
BG Group PLC (a) | 40,100 | 668,308 | ||||||
John Wood Group PLC (a) | 51,000 | 541,115 | ||||||
Royal Dutch Shell PLC, B Shares (a) | 40,800 | 1,507,374 | ||||||
| 2,716,797 | ||||||||
Materials (11.0%) | ||||||||
BHP Billiton PLC (a) | 56,600 | 1,462,352 | ||||||
Rio Tinto PLC (a) | 22,500 | 1,070,582 | ||||||
| 2,532,934 | ||||||||
| 5,249,731 | ||||||||
UNITED STATES (24.2%) | ||||||||
Energy (15.5%) | ||||||||
Chevron Corp. | 6,300 | 755,685 | ||||||
EOG Resources, Inc. | 12,100 | 1,150,105 | ||||||
National Oilwell Varco, Inc. | 6,500 | 472,160 | ||||||
Schlumberger Ltd. | 12,400 | 1,223,384 | ||||||
| 3,601,334 | ||||||||
Materials (8.7%) | ||||||||
Monsanto Co. | 6,700 | 770,768 | ||||||
Praxair, Inc. | 9,800 | 1,234,702 | ||||||
| 2,005,470 | ||||||||
| 5,606,804 | ||||||||
Total Common Stocks | 22,184,347 | |||||||
PREFERRED STOCKS (2.5%) | ||||||||
CHILE (2.5%) | ||||||||
Materials (2.5%) | ||||||||
Sociedad Quimica y Minera de Chile SA, ADR, Preferred Shares | 24,300 | 576,639 | ||||||
Total Preferred Stocks | 576,639 | |||||||
REPURCHASE AGREEMENT (1.6%) | ||||||||
UNITED STATES (1.6%) | ||||||||
Repurchase Agreement, Fixed Income Clearing Corp., 0.00%, dated 10/31/2014, due 11/03/2014, repurchase price $369,000 collateralized by U.S. Treasury Note, maturing 10/31/2021; total market value of $379,014 | $ | 369,000 | 369,000 | |||||
Total Repurchase Agreement | 369,000 | |||||||
Total Investments | 23,129,986 | |||||||
Other assets in excess of liabilities—0.2% | 46,931 | |||||||
Net Assets—100.0% |
| $ | 23,176,917 | |||||
| (a) | Fair Valued Security. Fair Values are determined pursuant to procedures approved by the Fund’s Board of Trustees. See Note 2(a) of the accompanying Notes to Financial Statements. |
| (b) | See Notes to Financial Statements for tax unrealized appreciation/depreciation of securities. |
| ADR | American Depositary Receipt |
| BDR | Brazilian Depositary Receipt |
See accompanying Notes to Financial Statements.
Annual Report 2014
52
Table of Contents
Aberdeen Global Small Cap Fund (Unaudited)
The Aberdeen Global Small Cap Fund (Class A shares at NAV net of fees) returned 5.32% for the 12-month period ended October 31, 2014, versus the 5.58% return of its benchmark, the MSCI World Small Cap Index during the same period. For broader comparison, the average return of the Fund’s Lipper peer category of Global Small/Mid-Cap Funds (consisting of 44 funds) was 3.68% for the period.
Global small-cap equities, as measured by the MSCI World Small Cap Index, rose during the reporting period, attributable largely to improved economic data in the U.S., as well as loose monetary policy in the developed world. The U.S. Federal Reserve’s (Fed) commitment to keep interest rates low for a longer period, as well as the European Central Bank’s unexpected rate cuts and fresh stimulus measures, reassured investors. In Japan, the yen’s weakness lifted equity markets, but gains were pared owing to doubts over the efficacy of Prime Minister Shinzo Abe’s “third arrow” stimulus measures,1 as well as the impact of the consumption tax hike that was implemented in April. The prospect of rising U.S. interest rates alarmed investors, while worsening geopolitical tensions and generally weak manufacturing and services data in Europe and China also dented market sentiment.
Towards the end of the period, monetary policy was the key theme. Although the Fed officially ended its bond-buying program, the Bank of Japan’s increased stimulus, as well as positive corporate earnings, boosted confidence in the global economy. However, oil prices tumbled to multi-year lows,2 as Saudi Arabia’s move to cut prices for exports exacerbated worries over global demand and rising supplies. The fall in oil prices had a mixed effect on markets. Importing nations were notable beneficiaries, whereas exporters such as Russia came under pressure as the lower oil price may aggravate revenue shortfalls caused by a raft of Western sanctions.
At the stock level, Chilean Coca-Cola bottler Andina was a key detractor for the reporting period, amid investors’ concerns over its Argentine business, as well as a government proposal to increase taxes on sugary drinks. In Brazil, the consumer sector was hurt by indiscriminate selling, on concerns that interest rate hikes would further dampen spending. Footwear and accessories maker Arezzo was among the hardest hit in the consumer sector, despite earnings that held up relatively well over the period. Retailer Hering also underperformed relative to the overall market. The company recently has faced some headwinds including more foreign competition, a rising cost base and a weaker currency. UK energy company Wood Group was another detractor from relative performance. Its shares declined after management warned that project delays by certain customers were likely to impact near-term profits in its engineering division.
Conversely, shares of U.S. real-estate management and development company Jones Lang LaSalle climbed after it won a major contract and delivered solid full-year 2014 profits. Automotive and industrial lubricant producer Castrol India benefited from speculation that its parent company, BP Plc, would be making a tender offer, although the rumors were later refuted. UK exchange-listed German flavors and fragrances producer Symrise posted consistently positive results over the reporting period, underpinned by good capacity utilization, cost discipline and a focus on high-margin business. Management expects solid demand and positive market development in all regions this year. The Fund’s holding in Asahi Intecc also contributed to the relative return. The Japanese medical device manufacturer delivered solid results during the period that generally met the market’s expectations.
In Fund activity, we exited the position in Bank of the Philippine Islands following the increase in its market capitalization, which lifted it out of the small-cap universe. We also sold the shares of India’s GlaxoSmithKline Pharmaceuticals following a period of share price strength, as well as Singapore’s Wheelock Properties, as we prefer exposure to the real estate sector through the Fund’s holding in Thailand’s Tesco Lotus.
Conversely, we initiated a position in German agricultural seed producer KWS Saat, as we believe it has attractive long-term opportunities, a solid market position and a healthy balance sheet.
The divergence between major global central banks’ monetary policies has become more pronounced, which we believe may create a more complex and challenging market environment ahead. How that translates into global capital flows is uncertain. Meanwhile, the global economic environment appears mixed; while the U.S. economic engine continues to power on, the Eurozone3 and Japan’s economic health remained anemic. However, the sharp drop in oil prices since June may potentially provide some relief to large net importers such as the Eurozone and Japan. Similarly, the appreciation in the U.S. dollar may increase the trade competitiveness of these economies.
For us at Aberdeen, investing in companies that we view as fundamentally sound and well managed is an imperative that we believe should help negate the vagaries of market sentiment. Recent earnings from our holdings have been largely steady or met expectations despite the muted economic backdrop. Renewed efforts to boost profits through cost cuts and improving margins are further along, even though it may be some time before a broader rebound is evident. Many of these companies are market leaders and have weathered periods of crises; we think it should be no different this time. If we feel that valuations are attractive, we will look to add to favored holdings when opportunities arise.
| 1 | The “third arrow” is the last of Japanese Prime Minister Shinzo Abe’s economic program, comprising structural reforms in an effort to boost Japan’s competitiveness. |
| 2 | Source: Bloomberg, October 2014. |
| 3 | The Eurozone comprises 18 European Union member states that have adopted the euro as their common currency. |
2014 Annual Report
53
Table of Contents
Aberdeen Global Small Cap Fund (Unaudited) (concluded)
Portfolio Management:
Aberdeen Global Equity Team
PAST PERFORMANCE DOES NOT GUARANTEE FUTURE RESULTS.
The performance data quoted represents past performance and current returns may be lower or higher. Class A Shares have up to a 5.75% front-end sales charge and a 0.25% 12b-1 fee. The investment return and principal value will fluctuate so that an investor’s shares, when redeemed, may be worth more or less than the original cost. To obtain performance information current to the most recent month-end, which may be higher or lower than the performance shown above, please call 866-667-9231 or go to www.aberdeen-asset.us.
Investing in mutual funds involves risk, including the possible loss of principal.
Indexes are unmanaged and have been provided for comparison purposes only. No fees or expenses are reflected. You cannot invest directly in an index.
Lipper is a leading global provider of mutual fund information and analysis to fund companies, financial intermediaries and media organizations.
Risk Considerations
Smaller company stocks are usually less stable in price and less liquid than those of larger, more established companies, and therefore carry greater risk to investors.
Foreign securities are more volatile, harder to price and less liquid than U.S. securities. They are subject to different accounting and regulatory standards, and political and economic risks. These risks are enhanced in emerging markets countries.
Please read the prospectus for more detailed information regarding these and other risks.
Annual Report 2014
54
Table of Contents
Aberdeen Global Small Cap Fund (Unaudited)
Average Annual Total Return1 (For periods ended October 31, 2014) | 1 Yr. | 5 Yr. | 10 Yr. | |||||||||||
Class A2 | w/o SC | 5.32% | 14.58% | 6.96% | ||||||||||
| w/SC3 | (0.73% | ) | 13.23% | 6.32% | ||||||||||
Class C | w/o SC | 4.60% | 13.77% | 6.19% | ||||||||||
| w/SC4 | 3.60% | 13.77% | 6.19% | |||||||||||
Class R5,6 | w/o SC | 5.07% | 14.31% | 6.69% | ||||||||||
Institutional Service Class 5,7 | w/o SC | 5.41% | 14.75% | 7.05% | ||||||||||
Institutional Class5,8 | w/o SC | 5.67% | 14.86% | 7.10% | ||||||||||
All figures showing the effect of a sales charge (SC) reflect the maximum charge possible because it has the most significant effect on performance data. The total returns shown above do not include the impact of financial statement rounding of the net asset value per share and/or financial statement adjustments.
| 1 | Returns prior to July 20, 2009 reflect the performance of a predecessor fund (the “Predecessor Fund”). The Fund and the Predecessor Fund have substantially similar investment objectives and strategies. Please consult the Fund’s prospectus for more detail. |
| 2 | Class A returns for periods prior to July 20, 2009 are based on the performance of Common Class shares of the Predecessor Fund, which were exchanged for Class A shares of the Fund in the reorganization. Class A and Class B shares of the Predecessor Fund were also exchanged for Class A shares of the Fund in the reorganization. |
| 3 | A 5.75% front-end sales charge was deducted. |
| 4 | A 1.00% contingent deferred sales charge (CDSC) was deducted from the one year return because it is charged when Class C shares are sold within the first year after purchase. |
| 5 | Not subject to any sales charges. |
| 6 | Returns for Class R shares for periods prior to July 20, 2009 are based on the performance of Adviser Class shares of the Predecessor Fund, which were exchanged for Class R shares of the Fund in the reorganization. Excluding the effect of any fee waivers or reimbursements, this performance is substantially similar to what Class R shares would have produced because both classes invest in the same portfolio of securities. Returns have been adjusted to eliminate sales charges that do not apply to Class R shares, but have not been adjusted to reflect its lower expenses. |
| 7 | Returns before the first offering of Institutional Service Class shares (September 16, 2009) are based on the previous performance of Institutional Class shares. Excluding the effect of any fee waivers or reimbursements, this performance is substantially similar to what Institutional Service Class shares would have produced because both classes invest in the same portfolio of securities. Returns for the Institutional Service Class shares would only differ to the extent of the differences in expenses between the two classes. |
| 8 | Returns before the first offering of Institutional Class shares (July 20, 2009) are based on the previous performance of Common Class shares of the Predecessor Fund. Excluding the effect of any fee waivers or reimbursements, this performance is substantially similar to what Institutional Class shares would have produced because both classes invest in the same portfolio of securities. Returns have been adjusted to eliminate sales charges that do not apply to Institutional Class shares, but have not been adjusted to reflect its lower expenses. |
2014 Annual Report
55
Table of Contents
Aberdeen Global Small Cap Fund (Unaudited)
Performance of a $10,000 Investment (as of October 31, 2014)
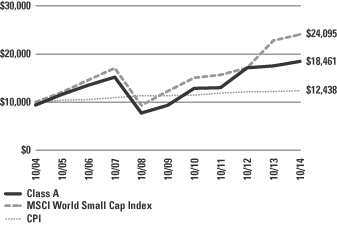
Comparative performance of $10,000 invested in Class A shares of the Aberdeen Global Small Cap Fund, Morgan Stanley Capital International (MSCI) World Small Cap Index and the Consumer Price Index (CPI) over a 10-year period ended October 31, 2014. Unlike the Fund, the returns for these unmanaged indexes do not reflect any fees, expenses, or sales charges. Investors cannot invest directly in market indexes.
The MSCI World Small Cap Index is a free float-adjusted, market capitalization-weighted index comprised of small cap companies from 23 developed markets countries including: Australia, Austria, Belgium, Canada, Denmark, Finland, France, Germany, Hong Kong, Ireland, Israel, Italy, Japan, Netherlands, New Zealand, Norway, Portugal, Singapore, Spain, Sweden, Switzerland, the UK and the US.
The CPI represents changes in prices of a basket of goods and services purchased for consumption by urban households.
Investment return and principal value will fluctuate, and when redeemed, shares may be worth more or less than original cost. Past performance is no guarantee of future results. The Average Annual Total Return table and Performance graph do not reflect the deduction of taxes that a shareholder would pay on fund distributions or the redemption of fund shares. Investing in mutual funds involves market risk, including loss of principal. Performance returns assume the reinvestment of all distributions. Total returns reflect waivers and reimbursements in effect, without which returns would have been lower.
Portfolio Summary (as a percentage of net assets)
October 31, 2014 (Unaudited)
| Asset Allocation | ||||
Common Stocks | 96.6% | |||
Preferred Stocks | 2.5% | |||
Repurchase Agreement | 0.1% | |||
Other assets in excess of liabilities | 0.8% | |||
| 100.0% | ||||
The following chart summarizes the composition of the Fund’s portfolio, in industry classification standard sectors, expressed as a percentage of net assets. An industry classification standard sector can include more than one industry group. As of October 31, 2014, the Fund did not have more than 25% of its assets invested in any industry group. The sectors, as classified by S&P’s Global Industry Classification Standard Sectors, are comprised of several industry groups.
| Top Sectors | ||||
Consumer Staples | 22.1% | |||
Health Care | 14.7% | |||
Materials | 14.6% | |||
Industrials | 13.0% | |||
Financials | 12.8% | |||
Consumer Discretionary | 10.8% | |||
Information Technology | 4.5% | |||
Energy | 3.1% | |||
Telecommunication Services | 2.1% | |||
Utilities | 1.4% | |||
Other | 0.9% | |||
| 100.0% | ||||
| Top Holdings* | ||||
John Wood Group PLC | 3.1% | |||
OdontoPrev SA | 3.0% | |||
Arezzo Industria e Comercio SA | 2.9% | |||
Castrol (India) Ltd. | 2.7% | |||
Barry Callebaut AG | 2.7% | |||
Clicks Group Ltd. | 2.7% | |||
Calbee, Inc. | 2.6% | |||
Jones Lang LaSalle, Inc. | 2.6% | |||
Iguatemi Empresa de Shopping Centers SA | 2.5% | |||
Symrise AG | 2.5% | |||
Other | 72.7% | |||
| 100.0% | ||||
| Top Countries | ||||
United Kingdom | 24.1% | |||
Brazil | 11.4% | |||
United States | 10.8% | |||
Japan | 7.9% | |||
Germany | 7.0% | |||
Hong Kong | 5.1% | |||
Switzerland | 4.7% | |||
India | 4.3% | |||
South Africa | 4.1% | |||
Chile | 3.4% | |||
Other | 17.2% | |||
| 100.0% | ||||
| * | For the purpose of listing top holdings, repurchase agreements are included as part of Other. |
Annual Report 2014
56
Table of Contents
Statement of Investments
October 31, 2014
Aberdeen Global Small Cap Fund
| Shares or Principal Amount | Value | |||||||
COMMON STOCKS (96.6%) | ||||||||
AUSTRALIA (1.6%) | ||||||||
Consumer Discretionary (1.6%) | ||||||||
ARB Corp. Ltd. (a) | 350,000 | $ | 4,060,020 | |||||
BRAZIL (11.4%) | ||||||||
Consumer Discretionary (4.4%) | ||||||||
Arezzo Industria e Comercio SA | 653,400 | 7,567,932 | ||||||
Cia Hering | 375,000 | 3,783,446 | ||||||
| 11,351,378 | ||||||||
Financials (2.5%) | ||||||||
Iguatemi Empresa de Shopping Centers SA | 645,500 | 6,538,621 | ||||||
Health Care (3.0%) | ||||||||
OdontoPrev SA | 2,147,800 | 7,757,702 | ||||||
Industrials (1.5%) | ||||||||
Wilson Sons Ltd., BDR | 271,100 | 3,829,251 | ||||||
| 29,476,952 | ||||||||
CANADA (1.5%) | ||||||||
Financials (1.5%) | ||||||||
Canadian Western Bank | 111,900 | 3,748,037 | ||||||
CHILE (0.9%) | ||||||||
Consumer Staples (0.9%) | ||||||||
Vina Concha y Toro SA | 1,206,800 | 2,307,395 | ||||||
FRANCE (1.6%) | ||||||||
Health Care (1.6%) | ||||||||
Virbac SA (a) | 18,600 | 4,156,220 | ||||||
GERMANY (7.0%) | ||||||||
Consumer Discretionary (0.9%) | ||||||||
Fielmann AG (a) | 37,000 | 2,414,454 | ||||||
Consumer Staples (1.5%) | ||||||||
KWS Saat AG (a) | 11,500 | 3,750,820 | ||||||
Materials (4.6%) | ||||||||
Fuchs Petrolub SE (a) | 148,000 | 5,446,630 | ||||||
Symrise AG (a) | 114,400 | 6,449,791 | ||||||
| 11,896,421 | ||||||||
| 18,061,695 | ||||||||
HONG KONG (5.1%) | ||||||||
Consumer Discretionary (2.0%) | ||||||||
Cafe de Coral Holdings Ltd. (a) | 1,464,000 | 5,249,219 | ||||||
Information Technology (1.0%) | ||||||||
ASM Pacific Technology Ltd. (a) | 234,500 | 2,584,152 | ||||||
Telecommunication Services (2.1%) | ||||||||
Asia Satellite Telecommunications Holdings Ltd. (a) | 1,560,000 | 5,433,907 | ||||||
| 13,267,278 | ||||||||
INDIA (4.3%) | ||||||||
Health Care (1.6%) | ||||||||
Sanofi India Ltd. | 77,200 | 4,168,234 | ||||||
Materials (2.7%) | ||||||||
Castrol (India) Ltd. (a) | 1,048,100 | 7,040,555 | ||||||
| 11,208,789 | ||||||||
ISRAEL (2.7%) | ||||||||
Consumer Staples (2.7%) | ||||||||
Osem Investments Ltd. (a) | 161,100 | 3,098,839 | ||||||
Rami Levi Chain Stores Hashikma Marketing 2006 Ltd. (a) | 85,300 | 3,859,315 | ||||||
| 6,958,154 | ||||||||
JAPAN (7.9%) | ||||||||
Consumer Staples (2.6%) | ||||||||
Calbee, Inc. (a) | 195,700 | 6,854,264 | ||||||
Health Care (4.2%) | ||||||||
Asahi Intecc Co. Ltd. (a) | 113,500 | 5,201,592 | ||||||
Sysmex Corp. (a) | 131,500 | 5,613,752 | ||||||
| 10,815,344 | ||||||||
Industrials (1.1%) | ||||||||
Nabtesco Corp. (a) | 119,200 | 2,884,698 | ||||||
| 20,554,306 | ||||||||
MALAYSIA (1.3%) | ||||||||
Consumer Staples (1.3%) | ||||||||
Carlsberg Brewery Malaysia Bhd | 998,600 | 3,369,905 | ||||||
MEXICO (1.0%) | ||||||||
Industrials (1.0%) | ||||||||
Grupo Aeroportuario del Sureste SAB de CV, Class B | 198,900 | 2,681,540 | ||||||
SINGAPORE (2.3%) | ||||||||
Health Care (2.3%) | ||||||||
Raffles Medical Group Ltd. (a) | 2,046,000 | 6,057,257 | ||||||
SOUTH AFRICA (4.1%) | ||||||||
Consumer Staples (2.7%) | ||||||||
Clicks Group Ltd. | 1,016,000 | 6,917,800 | ||||||
Financials (1.4%) | ||||||||
JSE Ltd. | 385,200 | 3,750,808 | ||||||
| 10,668,608 | ||||||||
SPAIN (2.0%) | ||||||||
Consumer Staples (2.0%) | ||||||||
Viscofan SA (a) | 89,100 | 5,239,130 | ||||||
SWITZERLAND (4.7%) | ||||||||
Consumer Staples (2.7%) | ||||||||
Barry Callebaut AG (a)(b) | 6,600 | 6,927,169 | ||||||
See accompanying Notes to Financial Statements.
2014 Annual Report
57
Table of Contents
Statement of Investments (concluded)
October 31, 2014
Aberdeen Global Small Cap Fund
| Shares or Principal Amount | Value | |||||||
Industrials (2.0%) | ||||||||
Kaba Holding AG, Class B (a)(b) | 10,700 | $ | 5,101,454 | |||||
| 12,028,623 | ||||||||
THAILAND (2.4%) | ||||||||
Financials (1.0%) | ||||||||
Tesco Lotus Retail Growth Freehold & Leasehold Property Fund (d) | 6,325,500 | 2,485,920 | ||||||
Utilities (1.4%) | ||||||||
Electricity Generating PCL, Foreign Shares (a) | 707,700 | 3,737,993 | ||||||
| 6,223,913 | ||||||||
UNITED KINGDOM (24.1%) | ||||||||
Consumer Discretionary (1.9%) | ||||||||
Millennium & Copthorne Hotels PLC | 534,600 | 4,857,535 | ||||||
Consumer Staples (1.4%) | ||||||||
PZ Cussons PLC (a) | 612,400 | 3,632,328 | ||||||
Energy (3.1%) | ||||||||
John Wood Group PLC (a) | 756,900 | 8,030,790 | ||||||
Financials (3.8%) | ||||||||
Close Brothers Group PLC (a) | 216,900 | 5,090,011 | ||||||
Rathbone Brothers PLC | 154,400 | 4,776,860 | ||||||
| 9,866,871 | ||||||||
Health Care (2.0%) | ||||||||
Dechra Pharmaceuticals PLC | 431,300 | 5,229,827 | ||||||
Industrials (5.4%) | ||||||||
Rotork PLC (a) | 115,600 | 4,738,607 | ||||||
Spirax-Sarco Engineering PLC (a) | 107,400 | 4,907,487 | ||||||
Weir Group PLC (The) (a) | 119,500 | 4,367,587 | ||||||
| 14,013,681 | ||||||||
Information Technology (3.5%) | ||||||||
Anite PLC | 3,230,332 | 4,508,699 | ||||||
Oxford Instruments PLC (a) | 252,500 | 4,375,239 | ||||||
| 8,883,938 | ||||||||
Materials (3.0%) | ||||||||
Croda International PLC (a) | 76,700 | 2,819,977 | ||||||
Victrex PLC (a) | 179,900 | 4,886,778 | ||||||
| 7,706,755 | ||||||||
| 62,221,725 | ||||||||
UNITED STATES (10.7%) | ||||||||
Consumer Staples (1.8%) | ||||||||
Casey’s General Stores, Inc. | 56,700 | 4,642,029 | ||||||
Financials (2.6%) | ||||||||
Jones Lang LaSalle, Inc. | 50,400 | 6,814,584 | ||||||
Industrials (2.0%) | ||||||||
RBC Bearings, Inc. | 85,600 | 5,200,200 | ||||||
Materials (4.3%) | ||||||||
Compass Minerals International, Inc. | 54,300 | 4,652,424 | ||||||
Silgan Holdings, Inc. | 129,400 | 6,361,304 | ||||||
| 11,013,728 | ||||||||
| 27,670,541 | ||||||||
Total Common Stocks | 249,960,088 | |||||||
PREFERRED STOCKS (2.5%) | ||||||||
CHILE (2.5%) | ||||||||
Consumer Staples (2.5%) | ||||||||
Embotelladora Andina SA, Class B, Preferred Shares | 2,046,400 | 6,426,696 | ||||||
Total Preferred Stocks | 6,426,696 | |||||||
REPURCHASE AGREEMENT (0.1%) | ||||||||
UNITED STATES (0.1%) | ||||||||
Repurchase Agreement, Fixed Income Clearing Corp., 0.00%, dated 10/31/2014, due 11/03/2014, repurchase price $333,000, collateralized by U.S. Treasury Note, maturing 10/31/2021; total market value of $344,105 | $ | 333,000 | 333,000 | |||||
Total Repurchase Agreement | 333,000 | |||||||
Total Investments | 256,719,784 | |||||||
Other assets in excess of liabilities—0.8% | 2,045,225 | |||||||
Net Assets—100.0% |
| $ | 258,765,009 | |||||
| (a) | Fair Valued Security. Fair Values are determined pursuant to procedures approved by the Fund’s Board of Trustees. See Note 2(a) of the accompanying Notes to Financial Statements. |
| (b) | Non-income producing security. |
| (c) | See Notes to Financial Statements for tax unrealized appreciation/depreciation of securities. |
| (d) | As of October 31, 2014, security is a closed-end fund incorporated in Thailand. |
| BDR | Brazilian Depositary Receipt |
See accompanying Notes to Financial Statements.
Annual Report 2014
58
Table of Contents
Aberdeen International Equity Fund (Unaudited)
The Aberdeen International Equity Fund (Class A shares at net asset value net of fees) returned 0.49% for the 12-month period ended October 31, 2014, versus the 0.49% return of its benchmark, the MSCI All Country World ex-U.S. Index, during the same period. For broader comparison, the average return of the Fund’s Lipper peer category of International Large-Cap Core Funds (consisting of 48 funds) was 0.25% for the period.
International equities, as measured by the MSCI All Country World ex-U.S. Index, posted marginal gains during the review period, attributable largely to improved economic data in the U.S., as well as loose monetary policy in the developed world. The U.S. Federal Reserve’s (Fed) commitment to keep interest rates low for a longer period, as well as the European Central Bank’s unexpected rate cuts and fresh stimulus measures, reassured investors. In Japan, the yen’s weakness lifted equity markets, but gains were pared owing to doubts over the efficacy of Prime Minister Shinzo Abe’s “third arrow” stimulus measures,1 as well as the impact of the consumption tax hike that was implemented in April 2014. The prospect of rising U.S. interest rates alarmed investors, while worsening geopolitical tensions and generally weak manufacturing and services data in Europe and China also dented market sentiment.
Towards the end of the period, monetary policy was the key theme. Although the Fed officially ended its bond-buying program, the Bank of Japan’s increased stimulus, as well as positive corporate earnings, boosted confidence in the global economy. However, oil prices tumbled to multi-year lows,2 as Saudi Arabia’s move to cut prices for exports exacerbated worries over global demand and rising supplies. The fall in oil prices had a mixed effect on markets. Importing nations were notable beneficiaries, whereas exporters such as Russia came under pressure as the lower oil price may aggravate revenue shortfalls caused by a raft of Western sanctions.
The top detractors from Fund performance for the period included lender Standard Chartered, miner Vale, and Italian exchange-listed pipe-maker Tenaris. Standard Chartered’s stock price weakened after the third profit warning in a year as the company delivered its results for the first nine months of its 2014 fiscal year. Management cited high impairment charges as some corporate and institutional clients were hurt by weakening commodity markets. Investor sentiment was also dampened by speculation that U.S. regulators could reinvestigate alleged sanction violations against Standard Charter. Some of its problems are cyclical and may be resolved in the medium term, in our opinion. More structural difficulties may potentially require management to reprioritize investments, divest non-core businesses and streamline riskier portfolios. Shares of Vale moved lower as fears of a slowdown in China’s economy weighed on iron ore prices, while Tenaris’s stock price declined on concerns that soft oil prices may weigh on demand for its products.
The main contributors to the Fund’s relative return for the period were Swiss drug-maker Novartis, Taiwan Semiconductor Manufacturing Co. (TSMC), and freight railroad operator Canadian National Railway. Novartis’ share price reacted positively to favorable drug trial data related to the treatment of heart failure, while its significant three-way transaction with GlaxoSmithKline earlier in the reporting period also supported investor sentiment. TSMC’s stock price gained ground after the company reported record-high sales over multiple quarters, on robust demand for its products. Finally, Canadian National Railway benefited from better-than-expected profits due to greater market share and increased shipments.
In Fund activity, we initiated a position in Singapore conglomerate Jardine Matheson, UK credit and marketing services company Experian, and UK aircraft engine manufacturer Rolls Royce. We believe that Jardine has an attractive collection of assets, and Experian is the largest international operator in a growing industry. Rolls Royce has an attractive high recurring revenue model, high barriers to entry and positive structural growth potential, in our opinion.
Conversely, we exited the Fund’s remaining small position in Australia’s QBE Insurance, as we feel that there are more attractive investment opportunities elsewhere.
The divergence between major global central banks’ monetary policies has become more pronounced, which we believe may create a more complex and challenging market environment ahead. How that translates into global capital flows is uncertain. Meanwhile, the global economic environment appears mixed; while the U.S. economic engine continues to power on, the Eurozone3 and Japan’s economic health remained anemic. However, the sharp drop in oil prices since June 2014 may potentially provide some relief to large net importers such as the Eurozone and Japan. Similarly, the appreciation in the U.S. dollar may increase the trade competitiveness of these economies.
For us at Aberdeen, investing in companies that we view as fundamentally sound and well managed is an imperative that we believe should help negate the vagaries of market sentiment. Recent earnings from our holdings have been largely steady or met expectations despite the muted economic backdrop. Renewed efforts to boost profits through cost cuts and improving margins are further along, even though it may be some time before a broader rebound is evident. Many of these companies are market leaders and have weathered periods of crises; we think it should be no different this time. If we feel that valuations are attractive, we will look to add to favored holdings when opportunities arise.
| 1 | The “third arrow” is the last of Japanese Prime Minister Shinzo Abe’s economic program, comprising structural reforms in an effort to boost Japan’s competitiveness. |
| 2 | Source: Bloomberg, October 2014. |
| 3 | The Eurozone comprises 18 European Union member states that have adopted the euro as their common currency. |
2014 Annual Report
59
Table of Contents
Aberdeen International Equity Fund (Unaudited) (concluded)
Portfolio Management:
Aberdeen Global Equity Team
PAST PERFORMANCE DOES NOT GUARANTEE FUTURE RESULTS.
The performance data quoted represents past performance and current returns may be lower or higher. Class A Shares have up to a 5.75% front-end sales charge and a 0.25% 12b-1 fee. The investment return and principal value will fluctuate so that an investor’s shares, when redeemed, may be worth more or less than the original cost. To obtain performance information current to the most recent month-end, which may be higher or lower than the performance shown above, please call 866-667-9231 or go to www.aberdeen-asset.us.
Investing in mutual funds involves risk, including the possible loss of principal.
Indexes are unmanaged and have been provided for comparison purposes only. No fees or expenses are reflected. You cannot invest directly in an index.
Lipper is a leading global provider of mutual fund information and analysis to fund companies, financial intermediaries and media organizations.
Risk Considerations
Foreign securities are more volatile, harder to price and less liquid than U.S. securities. They are subject to different accounting and regulatory standards, and political and economic risks. These risks are enhanced in emerging markets countries.
Equity stocks of small- and mid-cap companies carry greater risk and more volatility than equity stocks of larger, more established companies.
Please read the prospectus for more detailed information regarding these and other risks.
Annual Report 2014
60
Table of Contents
Aberdeen International Equity Fund (Unaudited)
Average Annual Total Return1 (For periods ended October 31, 2014) | 1 Yr. | 5 Yr. | 10 Yr. | |||||||||||
Class A | w/o SC | 0.49% | 7.96% | 9.01% | ||||||||||
| w/SC2 | (5.31% | ) | 6.69% | 8.36% | ||||||||||
Class C | w/o SC | (0.24% | ) | 7.21% | 8.26% | |||||||||
| w/SC3 | (1.20% | ) | 7.21% | 8.26% | ||||||||||
Class R4 | w/o SC | 0.26% | 7.73% | 8.79% | ||||||||||
Institutional Service Class4 | w/o SC | 0.75% | 8.17% | 9.28% | ||||||||||
Institutional Class4 | w/o SC | 0.81% | 8.29% | 9.34% | ||||||||||
All figures showing the effect of a sales charge (SC) reflect the maximum charge possible because it has the most significant effect on performance data. The total returns shown above do not include the impact of financial statement rounding of the net asset value per share and/or financial statement adjustments.
| 1 | Returns prior to June 23, 2008 incorporate the performance of a predecessor fund (the “Predecessor Fund”). The Fund and the Predecessor Fund have substantially similar investment objectives and strategies. Please consult the Fund’s prospectus for more detail. |
| 2 | A 5.75% front-end sales charge was deducted. |
| 3 | A 1.00% contingent deferred sales charge (CDSC) was deducted from the one year return because it is charged when Class C shares are sold within the first year after purchase. |
| 4 | Not subject to any sales charges. |
2014 Annual Report
61
Table of Contents
Aberdeen International Equity Fund (Unaudited)
Performance of a $10,000 Investment (as of October 31, 2014)
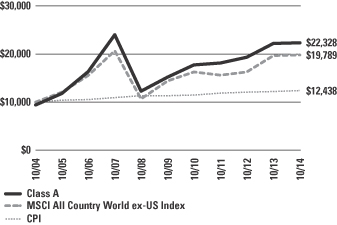
Comparative performance of $10,000 invested in Class A shares of the Aberdeen International Equity Fund, the Morgan Stanley Capital International All Country World (MSCI ACWI) ex-US Index and the Consumer Price Index (CPI) over a 10-year period ending October 31, 2014. Unlike the Fund, the returns for these unmanaged indexes do not reflect any fees, expenses, or sales charges. Investors cannot invest directly in market indexes.
The MSCI ACWI ex-US Index is a free float-adjusted, market capitalization-weighted index that captures large, mid and small capitalization representation across 22 of 23 developed markets countries (excluding the US) including: Australia, Austria, Belgium, Canada, Denmark, Finland, France, Germany, Hong Kong, Ireland, Israel, Italy, Japan, Netherlands, New Zealand, Norway, Portugal, Singapore, Spain, Sweden, Switzerland and the UK; and 23 emerging markets countries including: Brazil, Chile, China, Colombia, Czech Republic, Egypt, Greece, Hungary, India, Indonesia, Korea, Malaysia, Mexico, Peru, Philippines, Poland, Qatar, Russia, South Africa, Taiwan, Thailand, Turkey and United Arab Emirates.
The CPI represents changes in prices of a basket of goods and services purchased for consumption by urban households.
Investment return and principal value will fluctuate, and when redeemed, shares may be worth more or less than original cost. Past performance is no guarantee of future results. The Average Annual Total Return table and Performance graph do not reflect the deduction of taxes that a shareholder would pay on fund distributions or the redemption of fund shares. Investing in mutual funds involves market risk, including loss of principal. Performance returns assume the reinvestment of all distributions. Total returns reflect waivers and reimbursements in effect, without which returns would have been lower.
Portfolio Summary (as a percentage of net assets)
October 31, 2014 (Unaudited)
| Asset Allocation | ||||
Common Stocks | 88.4% | |||
Preferred Stocks | 9.7% | |||
Repurchase Agreement | 1.4% | |||
Other assets in excess of liabilities | 0.5% | |||
| 100.0% | ||||
The following chart summarizes the composition of the Fund’s portfolio, in industry classification standard sectors, expressed as a percentage of net assets. An industry classification standard sector can include more than one industry group. As of October 31, 2014, the Fund did not have more than 25% of its assets invested in any industry group. The sectors, as classified by S&P’s Global Industry Classification Standard Sectors, are comprised of several industry groups.
| Top Sectors | ||||
Financials | 19.9% | |||
Consumer Staples | 14.6% | |||
Industrials | 14.5% | |||
Energy | 11.8% | |||
Materials | 11.1% | |||
Health Care | 9.0% | |||
Information Technology | 8.6% | |||
Telecommunication Services | 6.0% | |||
Utilities | 2.6% | |||
Other | 1.9% | |||
| 100.0% | ||||
| Top Holdings* | ||||
Roche Holding AG | 4.9% | |||
Novartis AG | 4.1% | |||
Samsung Electronics Co. Ltd., GDR, Preferred Shares | 3.6% | |||
Taiwan Semiconductor Manufacturing Co. Ltd. | 3.5% | |||
British American Tobacco PLC | 3.5% | |||
Nestle SA | 3.5% | |||
Zurich Insurance Group AG | 3.2% | |||
Tenaris SA, ADR | 3.1% | |||
Shin-Etsu Chemical Co. Ltd. | 3.0% | |||
Fomento Economico Mexicano SAB de CV, ADR | 2.9% | |||
Other | 64.7% | |||
| 100.0% | ||||
| Top Countries | ||||
United Kingdom | 20.8% | |||
Switzerland | 16.7% | |||
Japan | 9.1% | |||
Singapore | 7.4% | |||
Brazil | 6.1% | |||
Canada | 5.4% | |||
Italy | 5.2% | |||
Sweden | 5.1% | |||
France | 4.2% | |||
Hong Kong | 3.4% | |||
Other | 16.6% | |||
| 100.0% | ||||
| * | For the purpose of listing top holdings, repurchase agreements are included as part of Other. |
Annual Report 2014
62
Table of Contents
Statement of Investments
October 31, 2014
Aberdeen International Equity Fund
| Shares or Principal Amount | Value | |||||||
COMMON STOCKS (88.4%) | ||||||||
CANADA (5.4%) | ||||||||
Industrials (2.2%) | ||||||||
Canadian National Railway Co. | 277,500 | $ | 19,564,483 | |||||
Materials (2.1%) | ||||||||
Potash Corp. of Saskatchewan, Inc. | 540,100 | 18,435,426 | ||||||
Telecommunication Services (1.1%) | ||||||||
TELUS Corp. | 277,100 | 9,930,410 | ||||||
| 47,930,319 | ||||||||
CHINA (1.5%) | ||||||||
Energy (1.5%) | ||||||||
PetroChina Co. Ltd., H Shares (a) | 10,331,900 | 12,948,275 | ||||||
FRANCE (4.2%) | ||||||||
Consumer Staples (2.0%) | ||||||||
Casino Guichard-Perrachon SA (a) | 170,800 | 17,512,695 | ||||||
Industrials (1.1%) | ||||||||
Schneider Electric SE (a) | 121,500 | 9,572,512 | ||||||
Utilities (1.1%) | ||||||||
GDF Suez (a) | 386,900 | 9,393,901 | ||||||
| 36,479,108 | ||||||||
GERMANY (1.5%) | ||||||||
Materials (1.5%) | ||||||||
Linde AG (a) | 70,600 | 13,029,597 | ||||||
HONG KONG (3.4%) | ||||||||
Financials (3.4%) | ||||||||
AIA Group Ltd. (a) | 3,405,100 | 19,001,904 | ||||||
Swire Pacific Ltd., Class A (a) | 818,500 | 10,746,457 | ||||||
| 29,748,361 | ||||||||
ITALY (5.2%) | ||||||||
Energy (5.2%) | ||||||||
Eni SpA (a) | 882,341 | 18,798,181 | ||||||
Tenaris SA, ADR | 686,900 | 27,228,716 | ||||||
| 46,026,897 | ||||||||
JAPAN (9.1%) | ||||||||
Consumer Staples (2.7%) | ||||||||
Japan Tobacco, Inc. (a) | 694,200 | 23,685,436 | ||||||
Financials (1.1%) | ||||||||
Daito Trust Construction Co. Ltd. (a) | 75,200 | 9,369,977 | ||||||
Industrials (2.3%) | ||||||||
FANUC Corp. (a) | 115,800 | 20,408,101 | ||||||
Materials (3.0%) | ||||||||
Shin-Etsu Chemical Co. Ltd. (a) | 415,099 | 26,644,625 | ||||||
| 80,108,139 | ||||||||
MEXICO (2.9%) | ||||||||
Consumer Staples (2.9%) | ||||||||
Fomento Economico Mexicano SAB de CV, ADR | 268,500 | $ | 25,840,440 | |||||
SINGAPORE (7.4%) | ||||||||
Financials (3.7%) | ||||||||
City Developments Ltd. (a) | 1,695,000 | 12,475,068 | ||||||
Oversea-Chinese Banking Corp. Ltd. (a) | 2,654,082 | 20,444,676 | ||||||
| 32,919,744 | ||||||||
Industrials (1.7%) | ||||||||
Jardine Matheson Holdings Ltd. (a) | 240,900 | 14,436,634 | ||||||
Telecommunication Services (2.0%) | ||||||||
Singapore Telecommunications Ltd. (a) | 5,956,000 | 17,530,158 | ||||||
| 64,886,536 | ||||||||
SOUTH AFRICA (1.8%) | ||||||||
Telecommunication Services (1.8%) | ||||||||
MTN Group Ltd. (a) | 730,600 | 16,177,711 | ||||||
SWEDEN (5.1%) | ||||||||
Financials (1.5%) | ||||||||
Nordea Bank AB (a) | 1,012,600 | 13,023,811 | ||||||
Industrials (2.1%) | ||||||||
Atlas Copco AB, A Shares (a) | 644,706 | 18,674,408 | ||||||
Information Technology (1.5%) | ||||||||
Telefonaktiebolaget LM Ericsson, B Shares (a) | 1,107,800 | 13,090,204 | ||||||
| 44,788,423 | ||||||||
SWITZERLAND (16.7%) | ||||||||
Consumer Staples (3.5%) | ||||||||
Nestle SA (a) | 417,300 | 30,602,318 | ||||||
Financials (3.2%) | ||||||||
Zurich Insurance Group AG (a)(b) | 93,900 | 28,416,812 | ||||||
Health Care (9.0%) | ||||||||
Novartis AG (a) | 389,600 | 36,155,992 | ||||||
Roche Holding AG (a) | 146,200 | 43,143,820 | ||||||
| 79,299,812 | ||||||||
Industrials (1.0%) | ||||||||
Schindler Holding AG (a) | 63,000 | 8,812,893 | ||||||
| 147,131,835 | ||||||||
TAIWAN (3.5%) | ||||||||
Information Technology (3.5%) | ||||||||
Taiwan Semiconductor Manufacturing Co. Ltd. (a) | 7,183,000 | 31,137,375 | ||||||
UNITED KINGDOM (20.8%) | ||||||||
Consumer Staples (3.5%) | ||||||||
British American Tobacco PLC (a) | 544,700 | 30,872,288 | ||||||
Energy (4.2%) | ||||||||
John Wood Group PLC (a) | 1,105,400 | 11,728,412 | ||||||
Royal Dutch Shell PLC, B Shares (a) | 687,400 | 25,396,287 | ||||||
| 37,124,699 | ||||||||
See accompanying Notes to Financial Statements.
2014 Annual Report
63
Table of Contents
Statement of Investments (concluded)
October 31, 2014
Aberdeen International Equity Fund
| Shares or Principal Amount | Value | |||||||
Financials (4.1%) | ||||||||
HSBC Holdings PLC (a) | 1,905,800 | $ | 19,430,324 | |||||
Standard Chartered PLC (a) | 1,132,885 | 17,052,928 | ||||||
| 36,483,252 | ||||||||
Industrials (4.2%) | ||||||||
Experian PLC (a) | 823,100 | 12,376,250 | ||||||
Rolls-Royce Holdings PLC (a)(b) | 676,087 | 9,157,243 | ||||||
Weir Group PLC (The) (a) | 429,300 | 15,690,419 | ||||||
| 37,223,912 | ||||||||
Materials (2.2%) | ||||||||
BHP Billiton PLC (a) | 752,200 | 19,434,292 | ||||||
Telecommunication Services (1.1%) | ||||||||
Vodafone Group PLC (a) | 2,790,824 | 9,280,758 | ||||||
Utilities (1.5%) | ||||||||
Centrica PLC (a) | 2,653,100 | 12,867,461 | ||||||
| 183,286,662 | ||||||||
Total Common Stocks | 779,519,678 | |||||||
PREFERRED STOCKS (9.7%) | ||||||||
BRAZIL (6.1%) | ||||||||
Energy (0.9%) | ||||||||
Petroleo Brasileiro SA, ADR, Preferred Shares | 649,400 | 7,942,162 | ||||||
Financials (2.9%) | ||||||||
Banco Bradesco SA, ADR, Preferred Shares | 1,707,579 | 25,579,534 | ||||||
Materials (2.3%) | ||||||||
Vale SA, ADR, Preferred Shares | 2,284,200 | 20,009,592 | ||||||
| 53,531,288 | ||||||||
REPUBLIC OF SOUTH KOREA (3.6%) | ||||||||
Information Technology (3.6%) | ||||||||
Samsung Electronics Co. Ltd., GDR, Preferred Shares (a)(c) | 69,591 | 31,926,328 | ||||||
Samsung Electronics Co. Ltd., GDR, Preferred Shares (c) | 109 | 49,835 | ||||||
| 31,976,163 | ||||||||
UNITED KINGDOM (0.0%) | ||||||||
Industrials (0.0%) | ||||||||
Rolls-Royce Holdings PLC, Preferred Shares (b) | 48,528,000 | 77,630 | ||||||
Total Preferred Stocks | 85,585,081 | |||||||
REPURCHASE AGREEMENT (1.4%) | ||||||||
UNITED STATES (1.4%) | ||||||||
Repurchase Agreement, Fixed Income Clearing Corp., 0.00%, dated 10/31/2014, due 11/03/2014, repurchase price $12,879,000 collateralized by U.S. Treasury Note, maturing 10/31/2021; total market value of $13,140,824 | $ | 12,879,000 | 12,879,000 | |||||
Total Repurchase Agreement | 12,879,000 | |||||||
Total Investments | 877,983,759 | |||||||
Other assets in excess of liabilities—0.5% | 4,178,193 | |||||||
Net Assets—100.0% | $ | 882,161,952 | ||||||
| (a) | Fair Valued Security. Fair Values are determined pursuant to procedures approved by the Fund’s Board of Trustees. See Note 2(a) of the accompanying Notes to Financial Statements. |
| (b) | Non-income producing security. |
| (c) | Denotes a security issued under Regulation S or Rule 144A. |
| (d) | See Notes to Financial Statements for tax unrealized appreciation/depreciation of securities. |
| ADR | American Depositary Receipt |
| GDR | Global Depositary Receipt |
See accompanying Notes to Financial Statements.
Annual Report 2014
64
Table of Contents
Aberdeen Latin American Equity Fund (Unaudited)
The Aberdeen Latin American Equity Fund (Class A shares at net asset value net of fees returned -12.22% for the year ended October 31, 2014, versus the -5.39% return of its benchmark, the MSCI Emerging Markets Latin America 10/40 Index, during the same period. For broader comparison, the average return of the Fund’s Lipper peer category of Latin American Funds (consisting of 31 funds) was -6.95% for the period.
Latin American stock markets, as measured by the MSCI Emerging Markets Latin America 10/40 Index, fell during the reporting period. At the beginning of the period, the U.S. Federal Reserve’s (Fed) announcement that it would start trimming its bond purchases in January 2014 triggered fears of increased outflows from the region. Subsequently, political developments drove a short-lived rally, but gains were ultimately reversed owing to concerns about Chinese economic growth, lower commodity prices and the possibility of a sooner-than-expected U.S. interest rate hike. Mexico was among the strongest-performing Latin American markets, thanks to better-than-expected gross domestic product (GDP) growth and the signing of the energy reform into law. Mexican government authorities estimate that this will attract US$50.5 billion in new private and foreign investment by 2018. Conversely, Chile lagged its regional peers. Against the backdrop of a slowing economy, concerns about the new government’s corporate tax hike and its impact on investment continued to weigh on investor sentiment. Brazil’s stock market was steered by its bitterly-contested presidential elections, which concluded with incumbent Dilma Rousseff edging out Aecio Neves to secure a second term. Her margin of victory was the narrowest since the nation’s transition to democracy three decades ago.
The Fund’s underperformance was driven largely by weakness in some of our Brazilian holdings. In particular, miner Vale’s share price fell as fears of a slowdown in China’s economy weighed on iron ore prices. Cosmetics manufacturer Natura sold off in tandem with the broader consumer-related sectors on concerns that interest rate hikes would further dampen spending. Shares of Retailer Hering also underperformed the overall market as muted domestic demand hampered sales, amid continued restructuring. Chilean Coca-Cola bottler Andina was another detractor, owing to concerns over its Argentine business, as well as a government proposal to increase taxes on sugary drinks. In Mexico, telecom operator America Movil rebounded after it announced plans to divest assets to avoid regulatory restrictions given its dominant market position. The Fund’s lack of exposure to the stock detracted from the relative return.
Conversely, holdings in Mexican airport operators Grupo Aeroportuario del Sureste (ASUR) and Grupo Aeroportuario del Centro Norte (OMA) contributed to the Fund’s relative performance for the reporting period. Both companies benefited from consistently healthy passenger volumes. ASUR saw higher international traffic, whereas OMA posted good growth in domestic travellers. In Brazil, port operator Wilson Sons posted good fiscal-year results attributable to solid volume growth and healthy demand for its tugboats. Shares of motor-maker WEG also performed well, as its earnings were supported by the weaker Brazilian real. Despite the challenging consumer environment, retailer Lojas Renner posted resilient results, in our view, underpinned by impressive sales growth and effective cost control.
In Fund activity, we initiated positions in Peru-based infrastructure company Grana y Montero and Chilean mall operator Parque Arauco, given their solid growth prospects and attractive valuations. We later added to Parque Arauco via its discounted rights issue. We also added to several holdings on valuation grounds, including footwear and accessories maker Arezzo, beverage company Fomento Economico Mexicano (FEMSA), Grana y Montero, and miner Vale. Against this, we reduced positions in Banco Bradesco, oil company Petrobras, and steel pipe-maker Tenaris after a period of share price strength.
We believe that global stock market volatility is likely to persist in the near term, given investors’ preoccupation with the timing of a U.S. interest rate hike and activity indicators heralding a slowdown in Chinese demand. Within Latin America, domestic demand, previously a key driver of economic expansion, has moderated, which in our view reflects a more cautious consumer mindset. However, we feel that a recovery in Mexico’s exports and an increase in formal employment support expectations that the economy is shaking off the sluggishness it experienced in 2013. In Chile, looser monetary policy and increased government spending on infrastructure may potentially boost growth in 2015. In Brazil, we believe that President Rousseff’s narrow victory and smaller coalition in the National Congress means she may be compelled to tighten fiscal policy and roll back controls that deter investment, if she is to restore growth and confidence.
Despite the macroeconomic uncertainty, we see plenty of value in the region. Faced with tougher times and higher cost of capital, companies are focused on managing costs, improving profits and strengthening their balance sheets. We think that any pullback in valuations may provide us with opportunities to add to high-conviction holdings, should their share prices fail to reflect their long-term potential.
Portfolio Management:
Aberdeen Global Emerging Markets Equity Team
PAST PERFORMANCE DOES NOT GUARANTEE FUTURE RESULTS.
The performance data quoted represents past performance and current returns may be lower or higher. Class A Shares have up to a 5.75% front-end sales charge and a 0.25% 12b-1 fee. The investment return and principal value will fluctuate so that an investor’s shares, when redeemed, may be worth more or less than the original cost. To obtain performance information current to the most recent month-end, which may be higher or lower than the performance shown above, please call 866-667-9231 or go to www.aberdeen-asset.us.
Investing in mutual funds involves risk, including the possible loss of principal.
Indexes are unmanaged and have been provided for comparison purposes only. No fees or expenses are reflected. You cannot invest directly in an index.
Lipper is a leading global provider of mutual fund information and analysis to fund companies, financial intermediaries and media organizations.
2014 Annual Report
65
Table of Contents
Aberdeen Latin American Equity Fund (Unaudited) (concluded)
Risk Considerations
Foreign securities are more volatile, harder to price and less liquid than U.S. securities. They are subject to different accounting and regulatory standards, and political and economic risks. These risks are enhanced in emerging markets countries.
Concentrating investments in Latin America subjects the Fund to more volatility and greater risk of loss than geographically diverse mutual funds.
Latin American countries may be subject to a greater degree of political, sovereign and economic instability than is the case in the United States and Europe. Some Latin American countries can be characterized as emerging markets or newly industrialized and may experience more volatile economic cycles than developed countries.
Equity stocks of small- and mid-cap companies carry greater risk and more volatility than equity stocks of larger, more established companies.
Because the Fund is non-diversified, the Fund may hold larger positions in fewer securities than other funds. As a result, a single security’s increase or decrease in value may have a greater impact on the Fund’s value and total return.
Please read the prospectus for more detailed information regarding these and other risks.
Annual Report 2014
66
Table of Contents
Aberdeen Latin American Equity Fund (Unaudited)
Average Annual Total Return (For periods ended October 31, 2014) | 1 Yr. | Inception1 | ||||||||
Class A | w/o SC | (12.22% | ) | (12.36% | ) | |||||
| w/SC2 | (17.26% | ) | (15.53% | ) | ||||||
Class C | w/o SC | (12.83% | ) | (12.97% | ) | |||||
| w/SC3 | (13.70% | ) | (13.51% | ) | ||||||
Class R4 | w/o SC | (12.39% | ) | (12.57% | ) | |||||
Institutional Service Class4 | w/o SC | (11.99% | ) | (12.13% | ) | |||||
Institutional Class4 | w/o SC | (11.99% | ) | (12.13% | ) | |||||
All figures showing the effect of a sales charge (SC) reflect the maximum charge possible because it has the most significant effect on performance data. The total returns shown above do not include the impact of financial statement rounding of the net asset value per share and/or financial statement adjustments.
| 1 | Fund commenced operations on March 25, 2013. |
| 2 | A 5.75% front-end sales charge was deducted. |
| 3 | A 1.00% contingent deferred sales charge (CDSC) was deducted from the one year return because it is charged when Class C shares are sold within the first year after purchase. |
| 4 | Not subject to any sales charges. |
2014 Annual Report
67
Table of Contents
Aberdeen Latin American Equity Fund (Unaudited)
Performance of a $10,000 Investment (as of October 31, 2014)
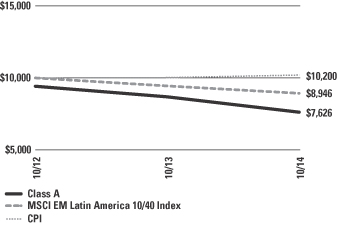
Comparative performance of $10,000 invested in Class A shares of the Aberdeen Latin American Equity Fund, the Morgan Stanley Capital International (MSCI) Emerging Markets (EM) Latin America 10/40 Index and the Consumer Price Index (CPI) since inception. Unlike the Fund, the returns for these unmanaged indexes do not reflect any fees, expenses, or sales charges. Investors cannot invest directly in market indexes.
The MSCI EM Latin America 10/40 Index represents a constrained version of the MSCI EM Latin America Index, which is a free-float adjusted, market capitalization-weighted index that captures large and mid cap representation across 5 emerging markets countries in Latin America: Brazil, Chile, Colombia, Mexico and Peru.
The CPI represents changes in prices of a basket of goods and services purchased for consumption by urban households.
Investment return and principal value will fluctuate, and when redeemed, shares may be worth more or less than original cost. Past performance is no guarantee of future results. The Average Annual Total Return table and Performance graph do not reflect the deduction of taxes that a shareholder would pay on fund distributions or the redemption of fund shares. Investing in mutual funds involves market risk, including loss of principal. Performance returns assume the reinvestment of all distributions. Total returns reflect waivers and reimbursements in effect, without which returns would have been lower.
Portfolio Summary (as a percentage of net assets)
October 31, 2014 (Unaudited)
| Asset Allocation | ||||
Common Stocks | 95.6% | |||
Preferred Stocks | 1.7% | |||
Other assets in excess of liabilities | 2.7% | |||
| 100.0% | ||||
The following chart summarizes the composition of the Fund’s portfolio, in industry classification standard sectors, expressed as a percentage of net assets. An industry classification standard sector can include more than one industry group. As of October 31, 2014, the Fund did not have more than 25% of its assets invested in any industry group. The sectors, as classified by S&P’s Global Industry Classification Standard Sectors, are comprised of several industry groups.
| Top Sectors | ||||
Financials | 29.3% | |||
Consumer Staples | 22.8% | |||
Industrials | 12.6% | |||
Energy | 11.9% | |||
Consumer Discretionary | 10.0% | |||
Materials | 8.2% | |||
Health Care | 1.4% | |||
Information Technology | 1.1% | |||
Other | 2.7% | |||
| 100.0% | ||||
| Top Holdings | ||||
Banco Bradesco SA | 8.4% | |||
Vale SA | 6.5% | |||
Itau Unibanco Holding SA | 6.5% | |||
Petroleo Brasileiro SA | 5.5% | |||
Fomento Economico Mexicano SAB de CV, ADR | 4.9% | |||
Lojas Renner SA | 4.0% | |||
Grupo Financiero Banorte SAB de CV | 4.0% | |||
AMBEV SA | 3.7% | |||
Ultrapar Participacoes SA | 3.6% | |||
Multiplan Empreendimentos Imobiliarios SA | 3.5% | |||
Other | 49.4% | |||
| 100.0% | ||||
| Top Countries | ||||
Brazil | 62.5% | |||
Mexico | 19.4% | |||
Chile | 7.7% | |||
Colombia | 3.3% | |||
Italy | 2.9% | |||
Peru | 1.5% | |||
Other | 2.7% | |||
| 100.0% | ||||
Annual Report 2014
68
Table of Contents
Statement of Investments
As of October 31, 2014
Aberdeen Latin American Equity Fund
| Shares or Principal Amount | Value | |||||||
COMMON STOCKS (95.6%) | ||||||||
BRAZIL (60.8%) | ||||||||
Consumer Discretionary (8.1%) | ||||||||
Arezzo Industria e Comercio SA | 8,501 | $ | 98,462 | |||||
Cia Hering | 6,800 | 68,607 | ||||||
Lojas Renner SA | 5,600 | 167,690 | ||||||
| 334,759 | ||||||||
Consumer Staples (9.2%) | ||||||||
AMBEV SA | 23,028 | 152,411 | ||||||
BRF SA | 2,900 | 75,475 | ||||||
Natura Cosmeticos SA | 5,900 | 85,718 | ||||||
Souza Cruz SA | 8,300 | 67,059 | ||||||
| 380,663 | ||||||||
Energy (9.0%) | ||||||||
Petroleo Brasileiro SA | 38,400 | 227,031 | ||||||
Ultrapar Participacoes SA | 6,800 | 148,327 | ||||||
| 375,358 | ||||||||
Financials (19.8%) | ||||||||
Banco Bradesco SA | 23,710 | 349,062 | ||||||
BM&F Bovespa SA | 13,000 | 57,186 | ||||||
Itau Unibanco Holding SA | 20,427 | 269,568 | ||||||
Multiplan Empreendimentos Imobiliarios SA | 7,000 | 144,780 | ||||||
| 820,596 | ||||||||
Health Care (1.4%) | ||||||||
OdontoPrev SA | 16,400 | 59,236 | ||||||
Industrials (5.7%) | ||||||||
Localiza Rent a Car SA | 4,305 | 62,058 | ||||||
Valid Solucoes e Servicos de Seguranca em Meios de Pagamento e Identificacao SA | 2,600 | 41,740 | ||||||
WEG SA | 4,940 | 58,274 | ||||||
Wilson Sons Ltd., BDR | 5,300 | 74,862 | ||||||
| 236,934 | ||||||||
Information Technology (1.1%) | ||||||||
Totvs SA | 3,000 | 43,731 | ||||||
Materials (6.5%) | ||||||||
Vale SA | 26,800 | 270,390 | ||||||
| 2,521,667 | ||||||||
CHILE (7.7%) | ||||||||
Consumer Discretionary (1.9%) | ||||||||
S.A.C.I. Falabella | 11,100 | 81,038 | ||||||
Consumer Staples (2.0%) | ||||||||
Embotelladora Andina SA, Class A (a) | 32,000 | 82,027 | ||||||
Financials (3.8%) | ||||||||
Banco Santander Chile, ADR | 4,700 | 99,593 | ||||||
Parque Arauco SA | 28,808 | 59,071 | ||||||
| 158,664 | ||||||||
| 321,729 | ||||||||
| Shares or Principal Amount | Value | |||||||
COLOMBIA (3.3%) | ||||||||
Consumer Staples (1.6%) | ||||||||
Almacenes Exito SA | 4,600 | $ | 64,881 | |||||
Financials (1.7%) | ||||||||
Bancolombia SA | 5,300 | 72,641 | ||||||
| 137,522 | ||||||||
ITALY (2.9%) | ||||||||
Energy (2.9%) | ||||||||
Tenaris SA, ADR | 3,000 | 118,920 | ||||||
MEXICO (19.4%) | ||||||||
Consumer Staples (10.0%) | ||||||||
Fomento Economico Mexicano SAB de CV, ADR | 2,100 | 202,104 | ||||||
Kimberly-Clark de Mexico SAB de CV, Class A | 25,100 | 58,415 | ||||||
Organizacion Soriana SAB de CV, Class B | 22,200 | 72,718 | ||||||
Wal-Mart de Mexico SAB de CV, Series V | 35,300 | 81,866 | ||||||
| 415,103 | ||||||||
Financials (4.0%) | ||||||||
Grupo Financiero Banorte SAB de CV | 25,916 | 166,085 | ||||||
Industrials (5.4%) | ||||||||
Grupo Aeroportuario del Centro Norte SAB de CV, ADR (b) | 3,300 | 130,680 | ||||||
Grupo Aeroportuario del Sureste SAB de CV, ADR, B Shares | 700 | 94,276 | ||||||
| 224,956 | ||||||||
| 806,144 | ||||||||
PERU (1.5%) | ||||||||
Industrials (1.5%) | ||||||||
Grana y Montero SA, ADR | 4,522 | 62,042 | ||||||
Total Common Stocks | 3,968,024 | |||||||
PREFERRED STOCKS (1.7%) | ||||||||
BRAZIL (1.7%) | ||||||||
Materials (1.7%) | ||||||||
Bradespar SA, Preferred Shares | 7,500 | 50,668 | ||||||
Vale SA, ADR, Preferred Shares | 2,300 | 20,148 | ||||||
| 70,816 | ||||||||
Total Preferred Stocks | 70,816 | |||||||
Total Investments | 4,038,840 | |||||||
Other assets in excess of liabilities—2.7% | 110,789 | |||||||
Net Assets—100.0% | $ | 4,149,629 | ||||||
| (a) | This share class contains full voting rights and no preference on dividends. The two share classes of this company are formally labeled as preferred. |
| (b) | Non-income producing security. |
| (c) | See Notes to Financial Statements for tax unrealized appreciation/depreciation of securities. |
| ADR | American Depositary Receipt |
| BDR | Brazilian Depositary Receipt |
See accompanying Notes to Financial Statements.
2014 Annual Report
69
Table of Contents
Aberdeen Small Cap Fund (Unaudited)
Aberdeen Small Cap Fund (Class A shares at net asset value net of fees) returned 9.33% for the 12-month period ended October 31, 2014, versus the 8.06% for its benchmark, the Russell 2000 Index, for the same period. For broader comparison, the average return of the Fund’s Lipper peer category of Small-Cap Core Funds (consisting of 289 funds) was 7.69% for the period.
U.S. equity markets moved higher over the 12-month period ended October 31, 2014. Investors’ optimism over the reporting period was buoyed by generally positive corporate earnings reports and steady but moderate overall improvement in economic data. This offset geopolitical concerns in Ukraine and the Middle East and, towards the end of the period, worries over slowing economic growth in Europe and Asia. Shares of small-cap companies, as measured by the Russell 2000 Index, underperformed their large-cap counterparts, as represented by the broader-market S&P 500 Index. Eight of the ten sectors within the Russell 2000 Index saw positive returns, led by healthcare and utilities. The energy sector, which was hampered by sharp declines in oil prices, and telecommunication services were the only sectors to post negative returns for the period.
The beginning of the review period was marked by volatility amid speculation concerning the U.S. Federal Reserve’s (Fed) possible tapering of monetary policy easing and the change in command at the central bank, as former Fed Vice Chair Janet Yellen succeeded Ben Bernanke as Fed Chair in February 2014. The Fed began to reduce its $85 billion-per-month asset purchase program in $10 billion increments in January 2014 and ended its tapering in late October 2014.
The U.S. economic recovery hit several peaks and valleys during the reporting period, with healthy gross domestic product (GDP) growth in the fourth quarter of 2013 and the second and third quarters of 2014 sandwiched around a contraction in the first quarter of the year, most likely attributable to bad weather-induced weakness in consumer spending. As expected, consumer spending was the primary driver of the upturns and declines in GDP during the period, as it comprises more than two-thirds of GDP.1The economy added roughly 1.7 million jobs over the 12-month review period, while the unemployment rate fell from 7.2% to 5.8%. At the end of the reporting period, however, the labor force participation ratehovered just above its lowest level in more than 36 years – generally providing further skepticism in the markets regarding the timing of an increase in the federal funds rate by the Fed.
On the political front, the mid-term U.S. Congressional elections were held in early November 2014, shortly after the end of the reporting period, resulting in the Republican Party forging a majority in the U.S. Senate and enhanced control in the House of Representatives. The change in political leadership in the Senate may potentially influence government policy as well as the stock market over the next two years leading up to the presidential election in 2016.
Fund performance for the reporting period was enhanced by overall stock selection – most notably in the financials and industrials sectors – which was partially offset by the adverse effect of sector allocation. The largest contributors among individual holdings were consumer products label maker Multi-Color Corp., Arkansas-based Bank of the Ozarks, and environmental services provider US Ecology. Multi-Color Corp. witnessed higher gross margins due to operational improvements, while organic growth also proved resilient. Bank of the Ozarks has continued to benefit from robust loan growth and low credit losses. The company also used its strong capital position to make several acquisitions during the review period. US Ecology saw healthy growth in business volumes over the period, bolstered in part by its acquisition of EQ-The Environmental Quality Company in June 2014.
Conversely, stock selection in the healthcare sector had the most significant negative impact on Fund performance for the period. The most notable individual stock detractors included oil and gas exploration and production company Approach Resources, athletic apparel retailer Hibbett Sports, and diversified industrial products company Actuant Corp. Shares of Approach Resources declined along with those of its peers amid weakness in oil prices in the second half of the reporting period. Hibbett Sports posted weaker-than-expected quarterly results over the review period attributable in part to what was generally a difficult backdrop for retailers, as well as increased spending on its ecommerce strategy. Finally, Actuant Corp. experienced mixed results within its diversified business segments during the period.
Turnover within the Fund during the period resulted mainly from numerous company holdings exceeding our definition of “small cap” (i.e., $5 billion) after strong performance and from several holdings receiving acquisition bids. We generally will not consider a company with a market capitalization in excess of $5 billion to be small-cap; however, this maximum market cap may change with market conditions. Some companies may outgrow the definition of a “small-cap” company after the Fund has purchased their shares. During the period, we initiated positions in waste management company Progressive Waste Solutions; lubricant product maker WD-40 Co.; IT services provider Fair Isaac Corp.; biopharmaceutical company Emergent Biosolutions; convenience store distributor Core-Mark, contract research organization PAREXEL International, and colors, flavors and fragrances maker Sensient Technologies. We exited positions in Covance, a contract research organization, real estate management company Jones Lang LaSalle, and electricity transmission company ITC Holdings following a period of strong share price performance as each of these companies exceeded our market capitalization threshold. Other sales included enterprise information solutions provider Micros Systems and property and casualty insurer Aspen Insurance after both companies were subjects of acquisitions bids. Finally, we also exited holdings in auto repair chain operator Monro Muffler Brake, specialty paper products producer Schweitzer-Mauduit International, apparel retailer Ascena Retail Group, and furniture maker and retailer Ethan Allen Interiors.
| 1 | Source: U.S. Department of Commerce, Bureau of Economic Analysis, October 2014. |
Annual Report 2014
70
Table of Contents
Aberdeen Small Cap Fund (Unaudited) (concluded)
Economic activity in North America continues to improve modestly; however, in our view, there is a more tepid economic outlook for many other regions that have typically provided growth to many U.S.-based companies. At the macroeconomic level, the focus has been the rise of geopolitical concerns and the fairly sharp downward move in energy prices. Given that so much of recent capital investment has been focused on domestic energy production and transportation, we think that sustained volatility in commodity markets will be a persistent theme over the next year. On the flip side, the state of U.S. consumers showed improvement late in the period following a fickle start to the year with the view that consumer confidence and spending was helped in part by lower oil prices.
Small-cap stocks significantly underperformed their large-cap counterparts during the review period, as the market generally perceived them to be more expensive relative to large caps. However, shares of small-cap companies rebounded towards the end of the period. Moving forward, we believe that, in aggregate, shareholder returns over the next year will likely be driven by underlying operating earnings growth and distributions rather than material price/earnings multiple2 expansion, the latter of which drove the majority of returns in the 2013 calendar year. We view this to be the case given our observation that Russell 2000 Index recently has been trading roughly in line with its long-term historical average, against what we think is likely to prove to be a period of positive but still tepid revenue growth and already reasonably high levels of profitability – outside of certain sectors, namely energy. For further multiple expansion to occur and be sustained, we believe we would need to see an acceleration in economic growth either in the U.S. or globally, as small-cap companies generate roughly 80% of sales within the U.S. economy.3 Nevertheless, absent any macroeconomic events, political wrangling – or other unpredictable factors – we feel that valuations are well supported.
We maintain our focus on small-cap companies that, in our view, are well positioned to achieve higher profitability with relatively low debt levels. In our opinion, many of the Fund’s holdings are building solid business models, with strong management teams delivering positive results both in the U.S. and overseas. Furthermore, the recent market volatility has led to more sector and stock dispersion, which in our view is good for active managers. We anticipate using this to our advantage by adding to holdings that we believe may be indiscriminately punished by the market.
Portfolio Management:
Aberdeen North American Equity Team
PAST PERFORMANCE DOES NOT GUARANTEE FUTURE RESULTS.
The performance data quoted represents past performance and current returns may be lower or higher. Class A Shares have up to a 5.75% front-end sales charge and a 0.25% 12b-1 fee. The investment return and principal value will fluctuate so that an investor’s shares, when redeemed, may be worth more or less than the original cost. To obtain performance information current to the most recent month-end, which may be higher or lower than the performance shown above, please call 866-667-9231 or go to www.aberdeen-asset.us.
Investing in mutual funds involves risk, including the possible loss of principal.
Indexes are unmanaged and have been provided for comparison purposes only. No fees or expenses are reflected. You cannot invest directly in an index.
Lipper is a leading global provider of mutual fund information and analysis to fund companies, financial intermediaries and media organizations.
Risk Considerations
Equity stocks of small-cap companies carry greater risk and more volatility than equity stocks of larger, more established companies.
Foreign securities are more volatile, harder to price and less liquid than U.S. securities, and are subject to different regulatory standards and political and economic risks. These risks are enhanced in emerging markets countries.
Please read the prospectus for more detailed information regarding these and other risks.
| 2 | The price/earnings multiple is the ratio of a company’s current share price compared to its per-share earnings. |
| 3 | Source: U.S. Department of Commerce, Bureau of Economic Analysis, October 2014. |
2014 Annual Report
71
Table of Contents
Aberdeen Small Cap Fund (Unaudited)
Average Annual Total Return1 (For periods ended October 31, 2014) | 1 Yr. | 5 Yr. | 10 Yr. | |||||||||||
Class A | w/o SC | 9.33% | 17.43% | 10.00% | ||||||||||
| w/SC2 | 3.06% | 16.04% | 9.35% | |||||||||||
Class C | w/o SC | 8.55% | 16.64% | 9.26% | ||||||||||
| w/SC3 | 7.55% | 16.64% | 9.26% | |||||||||||
Class R4 | w/o SC | 9.10% | 17.15% | 9.80% | ||||||||||
Institutional Service Class4 | w/o SC | 9.67% | 17.76% | 10.36% | ||||||||||
Institutional Class4 | w/o SC | 9.68% | 17.78% | 10.34% | ||||||||||
All figures showing the effect of a sales charge (SC) reflect the maximum charge possible because it has the most significant effect on performance data. The total returns shown above do not include the impact of financial statement rounding of the net asset value per share and/or financial statement adjustments.
| 1 | Returns prior to June 23, 2008 incorporate the performance of the predecessor fund (the “Predecessor Fund”). The Fund and the Predecessor Fund have similar investment objectives and strategies. Please consult the Fund’s prospectus for more detail. |
| 2 | A 5.75% front-end sales charge was deducted. |
| 3 | A 1.00% contingent deferred sales charge (CDSC) was deducted from the one year return because it is charged when Class C shares are sold within the first year after purchase. |
| 4 | Not subject to any sales charges. |
Annual Report 2014
72
Table of Contents
Aberdeen Small Cap Fund (Unaudited)
Performance of a $10,000 Investment (as of October 31, 2014)
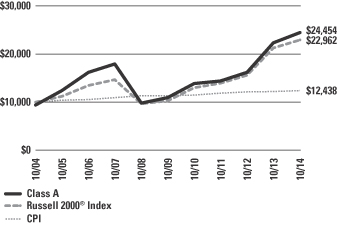
Comparative performance of $10,000 invested in Class A shares of the Aberdeen Small Cap Fund, the Russell 2000® Index and the Consumer Price Index (CPI) over a 10-year period ended October 31, 2014. Unlike the Fund, the returns for these unmanaged indexes do not reflect any fees, expenses, or sales charges. Investors cannot invest directly in market indexes.
The Russell 2000® Index is a small market capitalization-weighted index that measures the performance of the small-cap segment of the U.S. equity universe.
The CPI represents changes in prices of a basket of goods and services purchased for consumption by urban households.
Investment return and principal value will fluctuate, and when redeemed, shares may be worth more or less than original cost. Past performance is no guarantee of future results. The Average Annual Total Return table and Performance graph do not reflect the deduction of taxes that a shareholder would pay on fund distributions or the redemption of fund shares. Investing in mutual funds involves market risk, including loss of principal. Performance returns assume the reinvestment of all distributions. Total returns reflect waivers and reimbursements in effect, without which returns would have been lower.
Portfolio Summary (as a percentage of net assets)
October 31, 2014 (Unaudited)
| Asset Allocation | ||||
Common Stocks | 98.0% | |||
Repurchase Agreement | 2.3% | |||
Liabilities in excess of other assets | (0.3% | ) | ||
| 100.0% | ||||
The following chart summarizes the composition of the Fund’s portfolio, in industry classification standard sectors, expressed as a percentage of net assets. An industry classification standard sector can include more than one industry group. As of October 31, 2014, the Fund did not have more than 25% of its assets invested in any industry group. The sectors, as classified by S&P’s Global Industry Classification Standard Sectors, are comprised of several industry groups.
| Top Sectors | ||||
Financials | 19.7% | |||
Industrials | 18.8% | |||
Information Technology | 18.1% | |||
Materials | 12.8% | |||
Consumer Staples | 9.0% | |||
Health Care | 7.9% | |||
Consumer Discretionary | 7.6% | |||
Telecommunication Services | 2.3% | |||
Utilities | 1.2% | |||
Energy | 0.6% | |||
Other | 2.0% | |||
| 100.0% | ||||
| Top Holdings* | ||||
Multi-Color Corp. | 3.2% | |||
Casey’s General Stores, Inc. | 3.1% | |||
Bank of the Ozarks, Inc. | 3.0% | |||
RBC Bearings, Inc. | 3.0% | |||
CBOE Holdings, Inc. | 2.9% | |||
Littelfuse, Inc. | 2.9% | |||
Worthington Industries, Inc. | 2.8% | |||
Curtiss-Wright Corp. | 2.7% | |||
Quaker Chemical Corp. | 2.7% | |||
Heartland Payment Systems, Inc. | 2.6% | |||
Other | 71.1% | |||
| 100.0% | ||||
| * | For the purpose of listing top holdings, repurchase agreements are included as part of Other. |
2014 Annual Report
73
Table of Contents
Statement of Investments
October 31, 2014
Aberdeen Small Cap Fund
| Shares or Principal Amount | Value | |||||||
COMMON STOCKS (98.0%) | ||||||||
Consumer Discretionary (7.6%) | ||||||||
Core-Mark Holding Co., Inc. | 35,000 | $ | 2,031,050 | |||||
Drew Industries, Inc. | 53,555 | 2,573,853 | ||||||
G-III Apparel Group Ltd. (a) | 37,600 | 2,983,560 | ||||||
Hibbett Sports, Inc. (a) | 56,500 | 2,564,535 | ||||||
| 10,152,998 | ||||||||
Consumer Staples (9.0%) | ||||||||
Casey’s General Stores, Inc. | 50,300 | 4,118,061 | ||||||
J&J Snack Foods Corp. | 24,400 | 2,513,932 | ||||||
TreeHouse Foods, Inc. (a) | 31,500 | 2,682,855 | ||||||
WD-40 Co. | 36,200 | 2,775,454 | ||||||
| 12,090,302 | ||||||||
Energy (0.6%) | ||||||||
Approach Resources, Inc. (a) | 75,300 | 745,470 | ||||||
Financials (19.7%) | ||||||||
AMERISAFE, Inc. | 69,260 | 2,888,142 | ||||||
Bank of the Ozarks, Inc. | 112,520 | 3,965,205 | ||||||
Boston Private Financial Holdings, Inc. | 258,300 | 3,396,645 | ||||||
Canadian Western Bank | 93,700 | 3,138,437 | ||||||
CBOE Holdings, Inc. | 65,800 | 3,878,252 | ||||||
Healthcare Realty Trust, Inc. | 84,308 | 2,231,633 | ||||||
MarketAxess Holdings, Inc. | 27,401 | 1,771,475 | ||||||
Sabra Healthcare REIT, Inc. | 97,204 | 2,777,118 | ||||||
Univest Corp. of Pennsylvania | 118,120 | 2,423,822 | ||||||
| 26,470,729 | ||||||||
Health Care (7.9%) | ||||||||
Emergent Biosolutions, Inc. (a) | 94,400 | 2,135,328 | ||||||
IPC The Hospitalist Co., Inc. (a) | 61,498 | 2,562,007 | ||||||
PAREXEL International Corp. (a) | 48,100 | 2,612,311 | ||||||
Teleflex, Inc. | 29,020 | 3,311,762 | ||||||
| 10,621,408 | ||||||||
Industrials (18.8%) | ||||||||
Actuant Corp., Class A | 102,500 | 3,248,225 | ||||||
Beacon Roofing Supply, Inc. (a) | 81,030 | 2,242,100 | ||||||
Curtiss-Wright Corp. | 53,200 | 3,681,972 | ||||||
Gibraltar Industries, Inc. (a) | 175,851 | 2,681,728 | ||||||
Multi-Color Corp. | 86,000 | 4,239,800 | ||||||
Progressive Waste Solutions Ltd. | 106,000 | 3,098,380 | ||||||
RBC Bearings, Inc. | 65,342 | 3,969,526 | ||||||
US Ecology, Inc. | 42,800 | 2,151,984 | ||||||
| 25,313,715 | ||||||||
Information Technology (18.1%) | ||||||||
Advent Software, Inc. | 89,330 | 3,087,245 | ||||||
Fair Isaac Corp. | 44,600 | 2,778,580 | ||||||
FEI Co. | 34,400 | 2,899,232 | ||||||
Heartland Payment Systems, Inc. | 69,300 | 3,579,345 | ||||||
Littelfuse, Inc. | 39,474 | 3,850,294 | ||||||
Solera Holdings, Inc. | 38,160 | 1,982,412 | ||||||
Syntel, Inc. (a) | 38,400 | 3,325,824 | ||||||
Teradyne, Inc. | 154,200 | 2,837,280 | ||||||
| 24,340,212 | ||||||||
Materials (12.8%) | ||||||||
Compass Minerals International, Inc. | 29,300 | 2,510,424 | ||||||
Kaiser Aluminum Corp. | 41,700 | 2,900,235 | ||||||
Quaker Chemical Corp. | 44,800 | 3,677,184 | ||||||
Sensient Technologies Corp. | 53,300 | 3,154,294 | ||||||
Silgan Holdings, Inc. | 26,086 | 1,282,388 | ||||||
Worthington Industries, Inc. | 95,900 | 3,706,535 | ||||||
| 17,231,060 | ||||||||
Telecommunication Services (2.3%) | ||||||||
Shenandoah Telecommunications Co. | 104,446 | 3,090,557 | ||||||
Utilities (1.2%) | ||||||||
Cleco Corp. | 29,500 | 1,585,920 | ||||||
Total Common Stocks | 131,642,371 | |||||||
REPURCHASE AGREEMENT (2.3%) | ||||||||
Repurchase Agreement, Fixed Income Clearing Corp., 0.00%, dated 10/31/2014, due 11/03/2014, repurchase price $3,031,000, collateralized by U.S. Treasury Note, maturing 10/31/2021; total market value of $3,091,959 | $ | 3,031,000 | 3,031,000 | |||||
Total Repurchase Agreement | 3,031,000 | |||||||
Total Investments | 134,673,371 | |||||||
Liabilities in excess of other assets—(0.3)% | (354,844 | ) | ||||||
Net Assets—100.0% |
| $ | 134,318,527 | |||||
| (a) | Non-income producing security. |
| (b) | See Notes to Financial Statements for tax unrealized appreciation/depreciation of securities. |
| REIT | Real Estate Investment Trust |
See accompanying Notes to Financial Statements.
Annual Report 2014
74
Table of Contents
Aberdeen U.S. Equity Fund (Unaudited)
Aberdeen U.S. Equity Fund (Class A shares at net asset value net of fees) returned 9.87% for the 12-month period ended October 31, 2014, versus 17.27% for its benchmark, the Standard & Poor’s (S&P) 500 Index, for the same period. For broader comparison, the average return of the Fund’s Lipper peer category of Large-Cap Core Funds (consisting of 277 funds) was 14.95% for the period.
U.S. equity markets moved higher over the 12-month period ended October 31, 2014. Over the first several months of the reporting period, major North American equity market indices maintained an upward trajectory, driven in part by continued relaxed U.S. Federal Reserve (Fed) monetary policy and, consequently, asset inflation. Somewhat later in the period, the market experienced stretches of volatility due to a culmination of factors, including rising geopolitical tensions and the outlook for slower and perhaps more imbalanced global growth, which led to sharp price declines in certain commodities, specifically oil. Amid lower oil prices and a generally stable economy, U.S. consumers, which had been what we would characterize as “fickle” for most of 2014, showed improvement in confidence and spending late in the period.
During the reporting period, shares of large-cap companies, as measured by the broader-market S&P 500 Index, outperformed their small-cap counterparts, as represented by the Russell 2000 Index. All 10 sectors within the S&P 500 Index saw positive returns, led by healthcare and utilities. Energy was the lone sector to post a negative return amid the ongoing sharp decline in oil and gas prices, while consumer discretionary also lagged the overall market amid several periods of weakness in consumer spending.
Regarding monetary policy, former Federal Reserve (Fed) Vice Chair Janet Yellen succeeded Ben Bernanke as Fed Chair in February 2014. The Fed began to reduce its $85 billion-per-month asset purchase program in $10 billion increments in January and ended its tapering in late October.
The U.S. economic recovery hit several peaks and valleys during the reporting period, with healthy gross domestic product (GDP) growth in the fourth quarter of 2013 and the second and third quarters of 2014 sandwiched around a contraction in the first quarter of the year, most likely attributable to bad weather-induced weakness in consumer spending. As expected, consumer spending was the primary driver of the upturns and declines in GDP during the period, as it comprises more than two-thirds of GDP. The economy added roughly 1.7 million jobs over the 12-month review period, while the unemployment rate fell from 7.2% to 5.8%. At the end of the reporting period, however, the labor force participation rate hovered just above its lowest level in more than 36 years – generally providing further skepticism in the markets regarding the timing of an increase in the federal funds rate by the Fed.
On the political front, the mid-term U.S. Congressional elections were held in early November 2014, shortly after the end of the reporting period, resulting in the Republican Party forging a majority in the U.S. Senate and enhanced control in the House Representatives. The change in political leadership in the Senate may potentially influence government policy as well as the stock market over the next two years leading up to the presidential election in 2016.
For much of the reporting period, the market rewarded lower-quality companies. This resulted in a difficult backdrop for Aberdeen’s large-cap strategies to outperform, at least within the context of the U.S., given our focus on quality. We believe that high-quality companies – notably those with stable levels of profit growth, defensible industry positions and low levels of debt – can potentially reward investors with relatively stable returns across market cycles. Additionally, the recent strength in the U.S. dollar, as well as ongoing economic weakness in Europe, has had a negative impact on a number of Fund holdings with significant overseas exposure.
Fund performance for the reporting period was hampered mainly by overall positioning in the information technology sector, as well as stock selection in the healthcare sector. The largest individual stock detractors included supplemental life and health insurance company Aflac, oil and gas exploration and production company Apache Corp., and diversified industrial company Emerson Electric, along with the lack of a position in Apple. Aflac experienced slower growth from its core businesses in Japan and the U.S, as well as currency headwinds from a weaker Japanese yen. We reduced the exposure to the company over the period and subsequently exited the position in October 2014. Shares of Apache Corp. fell sharply along with those of its peers as energy prices continued their recent decline. Emerson Electric saw tepid revenue growth despite improving orders. Investors’ concerns over slower growth overseas also weighed on the stock price.
Fund performance was bolstered largely from stock selection in the consumer staples sector and an underweight relative to the benchmark S&P 500 Index in the industrials sector. The most notable contributors among individual holdings were retail drugstore chain operator and pharmacy benefit manager CVS Health (formerly CVS Caremark), biopharmaceutical firm Gilead Sciences, and freight railroad operator Canadian National Railway. CVS Health has seen particular strength in its pharmacy services unit. Gilead Sciences continues to benefit from sales of Solvadi, its hepatitis C treatment, which currently comprises over half of the company’s total product sales. Finally, Canadian National Railway’s operating results during the period were supported by good revenue growth, partly attributable to increased shipments of oil and chemicals.
During the reporting period, we established new holdings in flavors and fragrances developer International Flavors & Fragrances; consumer credit reporting company Equifax; diversified financial American Express; and PVH Corp., which markets several well-known clothing brands, including Calvin Klein and Tommy Hilfiger. We exited positions in packaged foods company Kellogg; office products retailer Staples; personal products maker Procter & Gamble; transportation equipment manufacturer Bombardier; Aflac (as previously noted), and networking equipment maker Cisco Systems.
Economic activity in North America continues to improve modestly; however,, in our view, there is a more tepid economic outlook for many other regions that have typically provided growth to many U.S.-based companies. At the macroeconomic level, the focus has been the rise of geopolitical concerns and the fairly sharp downward
2014 Annual Report
75
Table of Contents
Aberdeen U.S. Equity Fund (Unaudited) (concluded)
move in energy prices. Given that so much of recent capital investment has been focused on domestic energy production and transportation, we think that sustained volatility in commodity markets will be a persistent theme over the next year. On the flip side, the state of U.S. consumers showed improvement late in the period following a fickle start to the year with the view that consumer confidence and spending was helped in part by lower oil prices.
Valuations of the companies we invest in remain justifiable, although not cheap, in our opinion. We think that this is likely to remain the case while yields on 10-year U.S. Treasuries remain below the 3% range and ample liquidity remains. And despite what has appeared to be an increase in volatility over the past several months, share prices of large-cap equities have been hovering near their all-time highs, while small-cap stocks have recaptured much of their underperformance from earlier in 2014.
Moving forward, we believe that, in aggregate, shareholder returns over the next year may be driven by underlying operating earnings growth and distributions rather than further price/earnings multiple expansion. Our view is based on our observation that the S&P 500 Index recently has been trading at or above its long-term historical average, against what we feel may prove to be a period of positive but still tepid revenue growth and already high profitability levels for most companies. For further multiple expansion to occur and be sustained, we believe we would need to see an acceleration in global economic growth, while we also note that a stronger U.S. dollar had led to currency translation headwinds for companies with overseas revenues. Nevertheless, absent any macroeconomic events, political wrangling – or other unpredictable factors – we feel that valuations are well supported. The recent volatility has led to more sector and stock dispersion, which in our view is good for active managers. We anticipate using this to our advantage by adding to holdings that we feel may be indiscriminately punished by the market.
Portfolio Management:
Aberdeen North American Equity Team
PAST PERFORMANCE DOES NOT GUARANTEE FUTURE RESULTS.
The performance data quoted represents past performance and current returns may be lower or higher. Class A Shares have up to a 5.75% front-end sales charge and a 0.25% 12b-1 fee. The investment return and principal value will fluctuate so that an investor’s shares, when redeemed, may be worth more or less than the original cost. To obtain performance information current to the most recent month-end, which may be higher or lower than the performance shown above, please call 866-667-9231 or go to www.aberdeen-asset.us.
Investing in mutual funds involves risk, including the possible loss of principal.
Indexes are unmanaged and have been provided for comparison purposes only. No fees or expenses are reflected. You cannot invest directly in an index.
Lipper is a leading global provider of mutual fund information and analysis to fund companies, financial intermediaries and media organizations.
Risk Considerations
The Fund could lose value if the individual stocks in which it invests or overall stock markets in which such stocks trade decrease in value.
The investment team may select securities that underperform the stock market or other funds with similar investment objectives and strategies.
Please read the prospectus for more detailed information regarding these and other risks.
Annual Report 2014
76
Table of Contents
Aberdeen U.S. Equity Fund (Unaudited)
Average Annual Total Return1 (For periods ended October 31, 2014) | 1 Yr. | 5 Yr. | 10 Yr. | |||||||||||
Class A | w/o SC | 9.87% | 12.74% | 7.29% | ||||||||||
| w/SC2 | 3.53% | 11.43% | 6.65% | |||||||||||
Class C3 | w/o SC | 9.07% | 11.97% | 6.55% | ||||||||||
| w/SC4 | 8.07% | 11.97% | 6.55% | |||||||||||
Class R5 | w/o SC | 9.62% | 12.50% | 7.13% | ||||||||||
Institutional Service Class5,6 | w/o SC | 10.13% | 13.07% | 7.61% | ||||||||||
Institutional Class5 | w/o SC | 10.23% | 13.12% | 7.64% | ||||||||||
All figures showing the effect of a sales charge (SC) reflect the maximum charge possible because it has the most significant effect on performance data. The total returns shown above do not include the impact of financial statement rounding of the net asset value per share and/or financial statement adjustments.
| 1 | Returns from June 23, 2008 to October 9, 2011 reflect the performance of a predecessor fund (the “Predecessor Fund”). After February 28, 2009, in connection with the change in name of the Fund, the Fund no longer used a growth style for investing and became diversified so that it invests in a larger number of companies. The returns prior to June 23, 2008 reflect the performance of another predecessor fund (the “Second Predecessor Fund”), which was acquired by the Predecessor Fund. Please consult the Fund’s prospectus for more detail. |
| 2 | A 5.75% front-end sales charge was deducted. |
| 3 | A front-end sales charge that formerly applied to Class C shares of the Predecessor Fund was eliminated on April 1, 2004. Returns before that date have not been adjusted to eliminate the effect of the sales charge. |
| 4 | A 1.00% contingent deferred sales charge (CDSC) was deducted from the one year return because it is charged when Class C shares are sold within the first year after purchase. |
| 5 | Not subject to any sales charges. |
| 6 | Returns before the first offering of the Institutional Service Class (October 10, 2011) are based on the previous performance of the Institutional Class of the Predecessor Fund and Second Predecessor Fund. The performance of the Institutional Class is substantially similar to what the Institutional Service Class would have produced because both classes invest in the same portfolio of securities. Returns for the Institutional Service Class shares would only differ to the extent of the differences in expenses of the two classes. |
2014 Annual Report
77
Table of Contents
Aberdeen U.S. Equity Fund (Unaudited)
Performance of a $10,000 Investment (as of October 31, 2014)
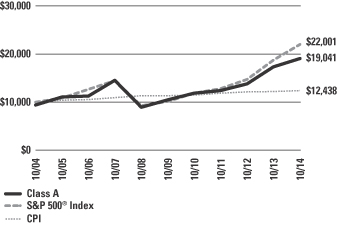
Comparative performance of $10,000 invested in Class A shares of the Aberdeen U.S. Equity Fund, S&P 500® Index and the Consumer Price Index (CPI) over a 10-year period ended October 31, 2014. Unlike the Fund, the returns for these unmanaged indexes do not reflect any fees, expenses, or sales charges. Investors cannot invest directly in market indexes.
The S&P 500® Index is a market capitalization-weighted index that includes 500 leading companies in leading industries of the U.S. economy. Focusing on the large-cap segment of the market, the S&P 500® Index covers approximately 80% of available U.S. market capitalization.
The CPI represents changes in prices of a basket of goods and services purchased for consumption by urban households.
Investment return and principal value will fluctuate, and when redeemed, shares may be worth more or less than original cost. Past performance is no guarantee of future results. The Average Annual Total Return table and Performance graph do not reflect the deduction of taxes that a shareholder would pay on fund distributions or the redemption of fund shares. Investing in mutual funds involves market risk, including loss of principal. Performance returns assume the reinvestment of all distributions. Total returns reflect waivers and reimbursements in effect, without which returns would have been lower.
Portfolio Summary (as a percentage of net assets)
October 31, 2014 (Unaudited)
| Asset Allocation | ||||
Common Stocks | 99.8% | |||
Repurchase Agreement | 0.2% | |||
Liabilities in excess of other assets | —% | |||
| 100.0% | ||||
Amounts listed as “ – ” are 0% or round to 0%.
The following chart summarizes the composition of the Fund’s portfolio, in industry classification standard sectors, expressed as a percentage of net assets. An industry classification standard sector can include more than one industry group. As of October 31, 2014, the Fund did not have more than 25% of its assets invested in any industry group. The sectors, as classified by S&P’s Global Industry Classification Standard Sectors, are comprised of several industry groups.
| Top Sectors | ||||
Information Technology | 15.6% | |||
Health Care | 14.5% | |||
Consumer Discretionary | 14.4% | |||
Consumer Staples | 12.9% | |||
Energy | 11.3% | |||
Financials | 10.9% | |||
Industrials | 9.4% | |||
Materials | 8.9% | |||
Telecommunication Services | 1.9% | |||
Other | 0.2% | |||
| 100.0% | ||||
| Top Holdings* | ||||
CVS Health Corp. | 3.3% | |||
Johnson & Johnson | 3.0% | |||
Comcast Corp., Class A | 2.8% | |||
Visa, Inc., Class A | 2.8% | |||
Baxter International, Inc. | 2.8% | |||
Pfizer, Inc. | 2.8% | |||
American Express Co. | 2.6% | |||
Target Corp. | 2.6% | |||
International Flavors & Fragrances, Inc. | 2.6% | |||
Kraft Foods Group, Inc. | 2.5% | |||
Other | 72.2% | |||
| 100.0% | ||||
| * | For the purpose of listing top holdings, repurchase agreements are included as part of Other. |
Annual Report 2014
78
Table of Contents
Statement of Investments
October 31, 2014
Aberdeen U.S. Equity Fund
| Shares or Principal Amount | Value | |||||||
COMMON STOCKS (99.8%) | ||||||||
Consumer Discretionary (14.4%) | ||||||||
BorgWarner, Inc. | 172,300 | $ | 9,824,546 | |||||
Comcast Corp., Class A | 212,600 | 11,767,410 | ||||||
PVH Corp. | 78,800 | 9,010,780 | ||||||
Starwood Hotels & Resorts Worldwide, Inc. | 107,234 | 8,220,558 | ||||||
Target Corp. | 175,100 | 10,824,682 | ||||||
TJX Cos., Inc. | 165,900 | 10,504,788 | ||||||
| 60,152,764 | ||||||||
Consumer Staples (12.9%) | ||||||||
Costco Wholesale Corp. | 78,100 | 10,416,197 | ||||||
CVS Health Corp. | 162,500 | 13,944,125 | ||||||
Kraft Foods Group, Inc. | 187,900 | 10,588,165 | ||||||
PepsiCo, Inc. | 92,563 | 8,901,784 | ||||||
Philip Morris International, Inc. | 114,979 | 10,234,281 | ||||||
| 54,084,552 | ||||||||
Energy (11.3%) | ||||||||
Apache Corp. | 107,109 | 8,268,815 | ||||||
Chevron Corp. | 85,000 | 10,195,750 | ||||||
ConocoPhillips | 102,600 | 7,402,590 | ||||||
EOG Resources, Inc. | 64,428 | 6,123,881 | ||||||
National Oilwell Varco, Inc. | 112,900 | 8,201,056 | ||||||
Schlumberger Ltd. | 70,812 | 6,986,312 | ||||||
| 47,178,404 | ||||||||
Financials (10.9%) | ||||||||
American Express Co. | 122,200 | 10,991,890 | ||||||
Charles Schwab Corp. (The) | 224,900 | 6,447,883 | ||||||
Intercontinental Exchange, Inc. | 47,227 | 9,836,912 | ||||||
Royal Bank of Canada | 114,411 | 8,122,110 | ||||||
Wells Fargo & Co. | 188,561 | 10,010,703 | ||||||
| 45,409,498 | ||||||||
Health Care (14.5%) | ||||||||
Aetna, Inc. | 107,400 | 8,861,574 | ||||||
Baxter International, Inc. | 164,700 | 11,552,058 | ||||||
Gilead Sciences, Inc. (a) | 86,600 | 9,699,200 | ||||||
Johnson & Johnson | 116,500 | 12,556,370 | ||||||
Pfizer, Inc. | 380,700 | 11,401,965 | ||||||
Quest Diagnostics, Inc. | 100,600 | 6,384,076 | ||||||
| 60,455,243 | ||||||||
Industrials (9.4%) | ||||||||
Canadian National Railway Co. | 133,600 | 9,429,488 | ||||||
Deere & Co. | 67,963 | 5,813,555 | ||||||
Emerson Electric Co. | 131,402 | 8,417,612 | ||||||
Equifax, Inc. | 87,900 | 6,657,546 | ||||||
United Technologies Corp. | 82,700 | 8,848,900 | ||||||
| 39,167,101 | ||||||||
Information Technology (15.6%) | ||||||||
Alliance Data Systems Corp. (a) | 23,922 | 6,778,299 | ||||||
Cognizant Technology Solutions Corp., Class A (a) | 196,300 | 9,589,255 | ||||||
EMC Corp. | 357,400 | 10,268,102 | ||||||
Oracle Corp. | 257,700 | 10,063,185 | ||||||
QUALCOMM, Inc. | 132,400 | 10,394,724 | ||||||
Solera Holdings, Inc. | 123,154 | 6,397,850 | ||||||
Visa, Inc., Class A | 48,300 | 11,661,069 | ||||||
| 65,152,484 | ||||||||
Materials (8.9%) | ||||||||
International Flavors & Fragrances, Inc. | 107,800 | 10,688,370 | ||||||
Monsanto Co. | 69,625 | 8,009,660 | ||||||
Potash Corp. of Saskatchewan, Inc. | 242,100 | 8,272,557 | ||||||
Praxair, Inc. | 80,105 | 10,092,429 | ||||||
| 37,063,016 | ||||||||
Telecommunication Services (1.9%) | ||||||||
TELUS Corp. | 226,468 | 8,116,691 | ||||||
Total Common Stocks | 416,779,753 | |||||||
REPURCHASE AGREEMENT (0.2%) | ||||||||
Repurchase Agreement, Fixed Income Clearing Corp., 0.00%, dated 10/31/2014, due 11/03/2014, repurchase price $749,000, collateralized by U.S. Treasury Note, maturing 10/31/2021; total market value of $768,003 | $ | 749,000 | 749,000 | |||||
Total Repurchase Agreement | 749,000 | |||||||
Total Investments | 417,528,753 | |||||||
Liabilities in excess of other assets—0.0% | (127,841 | ) | ||||||
Net Assets—100.0% | $ | 417,400,912 | ||||||
| (a) | Non-income producing security. |
| (b) | See Notes to Financial Statements for tax unrealized appreciation/depreciation of securities. |
See accompanying Notes to Financial Statements.
2014 Annual Report
79
Table of Contents
Statements of Assets and Liabilities
October 31, 2014
| Aberdeen Asia-Pacific (ex-Japan) Equity Fund | Aberdeen Asia-Pacific Smaller Companies Fund | Aberdeen China Opportunities Fund | Aberdeen Emerging Markets Fund | Aberdeen Equity Long-Short Fund | ||||||||||||||||
Assets: | ||||||||||||||||||||
Investments, at value | $ | 1,044,627,382 | $ | 30,179,688 | $ | 30,064,532 | $ | 9,802,435,746 | $ | 350,125,273 | ||||||||||
Repurchase agreements, at value | 33,785,000 | 831,000 | 130,000 | 229,143,000 | – | |||||||||||||||
|
|
|
|
|
|
|
|
|
| |||||||||||
Total investments | 1,078,412,382 | 31,010,688 | 30,194,532 | 10,031,578,746 | 350,125,273 | |||||||||||||||
|
|
|
|
|
|
|
|
|
| |||||||||||
Cash | 483 | 156 | 388 | 6 | 187,428,818 | * | ||||||||||||||
Foreign currency, at value | 429,181 | 18,683 | 83,061 | 4,238,227 | 8,621 | |||||||||||||||
Cash at broker for China A shares | – | – | 3,154 | – | – | |||||||||||||||
Receivable for capital shares issued | 921,999 | 12,931 | 30,169 | 18,268,302 | 135,696 | |||||||||||||||
Dividends receivable | 575,339 | 12,803 | 25,955 | 14,254,853 | 421,449 | |||||||||||||||
Receivable for investments sold | – | – | 130,730 | – | 6,384,495 | |||||||||||||||
Receivable from Adviser | – | 111 | 10,287 | 383,221 | 23,669 | |||||||||||||||
Prepaid expenses and other assets | 50,453 | 20,609 | 27,924 | 807,056 | 42,864 | |||||||||||||||
|
|
|
|
|
|
|
|
|
| |||||||||||
Total assets | 1,080,389,837 | 31,075,981 | 30,506,200 | 10,069,530,411 | 544,570,885 | |||||||||||||||
|
|
|
|
|
|
|
|
|
| |||||||||||
Liabilities: | ||||||||||||||||||||
Securities sold short, at value | – | – | – | – | 185,417,467 | |||||||||||||||
Payable for capital shares redeemed | 176,306 | 24,268 | 22,292 | 16,855,407 | 1,882,080 | |||||||||||||||
Payable for investments purchased | 2,845,087 | – | 48,191 | 223,076 | 6,348,340 | |||||||||||||||
Due to custodian | – | – | – | – | 642,888 | |||||||||||||||
Accrued foreign capital gains tax | 777,595 | 18,043 | – | 879,554 | – | |||||||||||||||
Payable for dividends on securities sold short | – | – | – | – | 198,069 | |||||||||||||||
Payable for brokers related expenses for securities sold short | – | – | – | – | 99,366 | |||||||||||||||
Distributions payable | – | – | 85 | – | – | |||||||||||||||
Accrued expenses and other payables: | ||||||||||||||||||||
Investment advisory fees | 907,862 | 33,796 | 31,966 | 7,541,640 | 350,892 | |||||||||||||||
Administration fees | 64,983 | 2,079 | 2,046 | 670,368 | 24,410 | |||||||||||||||
Transfer agent fees | 81,303 | 3,098 | 9,978 | 520,444 | 98,873 | |||||||||||||||
Fund accounting fees | 13,913 | 1,488 | 1,512 | 155,126 | 7,560 | |||||||||||||||
Distribution fees | 479 | 355 | 9,843 | 121,444 | 16,739 | |||||||||||||||
Printing fees | 92,987 | 5,706 | 4,093 | 32,405 | 6,084 | |||||||||||||||
Administrative services fees | 187 | 248 | 2,073 | 80,150 | 1,288 | |||||||||||||||
Custodian fees | 3,816 | 378 | 1,153 | 43,658 | 515 | |||||||||||||||
Legal fees | 2,740 | 41 | 101 | 32,706 | 1,409 | |||||||||||||||
Other | 10,194 | 13,161 | 7,639 | 31,643 | – | |||||||||||||||
|
|
|
|
|
|
|
|
|
| |||||||||||
Total liabilities | 4,977,452 | 102,661 | 140,972 | 27,187,621 | 195,095,980 | |||||||||||||||
|
|
|
|
|
|
|
|
|
| |||||||||||
Net Assets | $ | 1,075,412,385 | $ | 30,973,320 | $ | 30,365,228 | $ | 10,042,342,790 | $ | 349,474,905 | ||||||||||
|
|
|
|
|
|
|
|
|
| |||||||||||
Cost: | ||||||||||||||||||||
Investments | $ | 1,002,830,817 | $ | 30,058,359 | $ | 29,822,655 | $ | 9,134,684,791 | $ | 279,990,277 | ||||||||||
Repurchase agreements | 33,785,000 | 831,000 | 130,000 | 229,143,000 | – | |||||||||||||||
Foreign currency | 430,411 | 18,752 | 82,479 | 4,247,992 | 8,618 | |||||||||||||||
Proceeds: | ||||||||||||||||||||
Securities sold short | $ | – | $ | – | $ | – | $ | – | $ | 152,831,218 | ||||||||||
Represented by: | ||||||||||||||||||||
Capital | $ | 1,016,054,044 | $ | 30,351,564 | $ | 41,459,809 | $ | 9,082,493,255 | $ | 267,323,850 | ||||||||||
Accumulated net investment income/(loss) | 1,249,310 | (5,989 | ) | 53,626 | 14,792,780 | (4,152,063 | ) | |||||||||||||
Accumulated net realized gain/(loss) from investments and foreign currency transactions | 17,080,365 | 524,739 | (11,390,695 | ) | 278,326,829 | 48,754,367 | ||||||||||||||
Net unrealized appreciation on investments and translation of assets and liabilities denominated in foreign currencies | 41,028,666 | 103,006 | 242,488 | 666,729,926 | 37,548,751 | |||||||||||||||
|
|
|
|
|
|
|
|
|
| |||||||||||
Net Assets | $ | 1,075,412,385 | $ | 30,973,320 | $ | 30,365,228 | $ | 10,042,342,790 | $ | 349,474,905 | ||||||||||
|
|
|
|
|
|
|
|
|
| |||||||||||
Net Assets: | ||||||||||||||||||||
Class A Shares | $ | 1,173,451 | $ | 1,341,457 | $ | 19,424,875 | $ | 341,483,432 | $ | 30,368,125 | ||||||||||
Class C Shares | 288,485 | 61,415 | 6,063,579 | 45,076,848 | 10,161,877 | |||||||||||||||
Class R Shares | 11,338 | 13,492 | 1,495,476 | 31,720,019 | 3,436,689 | |||||||||||||||
Institutional Service Class Shares | 3,950,354 | 55,069 | 1,777,788 | 234,846,482 | 1,870,518 | |||||||||||||||
Institutional Class Shares | 1,069,988,757 | 29,501,887 | 1,603,510 | 9,389,216,009 | 303,637,696 | |||||||||||||||
|
|
|
|
|
|
|
|
|
| |||||||||||
Total | $ | 1,075,412,385 | $ | 30,973,320 | $ | 30,365,228 | $ | 10,042,342,790 | $ | 349,474,905 | ||||||||||
|
|
|
|
|
|
|
|
|
| |||||||||||
| * | The cash amount reported for the Aberdeen Equity Long-Short Fund is restricted from investing as it represents the amount due to the prime broker relating to the open short positions at October 31, 2014. |
Amounts listed as “–” are $0 or round to $0.
See accompanying Notes to Financial Statements.
Annual Report 2014
80
Table of Contents
Statements of Assets and Liabilities (continued)
October 31, 2014
| Aberdeen Asia-Pacific (ex-Japan) Equity Fund | Aberdeen Asia-Pacific Smaller Companies Fund | Aberdeen China Opportunities Fund | Aberdeen Emerging Markets Fund | Aberdeen Equity Long-Short Fund | ||||||||||||||||
Shares Outstanding (unlimited number of shares authorized): | ||||||||||||||||||||
Class A Shares | 97,120 | 132,411 | 962,323 | 22,942,065 | 2,476,577 | |||||||||||||||
Class C Shares | 23,942 | 6,138 | 310,909 | 3,046,800 | 1,205,787 | |||||||||||||||
Class R Shares | 939 | 1,330 | 75,057 | 2,138,793 | 291,976 | |||||||||||||||
Institutional Service Class Shares | 326,491 | 5,347 | 87,680 | 15,769,968 | 150,415 | |||||||||||||||
Institutional Class Shares | 88,323,078 | 2,900,831 | 79,082 | 630,295,252 | 24,176,583 | |||||||||||||||
|
|
|
|
|
|
|
|
|
| |||||||||||
Total | 88,771,570 | 3,046,057 | 1,515,051 | 674,192,878 | 28,301,338 | |||||||||||||||
|
|
|
|
|
|
|
|
|
| |||||||||||
Net asset value and redemption price per share (Net assets by class divided by shares outstanding by class, respectively): | ||||||||||||||||||||
Class A Shares | $ | 12.08 | $ | 10.13 | $ | 20.19 | $ | 14.88 | $ | 12.26 | ||||||||||
Class C Shares (a) | $ | 12.05 | $ | 10.01 | $ | 19.50 | $ | 14.79 | $ | 8.43 | ||||||||||
Class R Shares | $ | 12.07 | $ | 10.14 | $ | 19.92 | $ | 14.83 | $ | 11.77 | ||||||||||
Institutional Service Class Shares | $ | 12.10 | $ | 10.30 | $ | 20.28 | $ | 14.89 | $ | 12.44 | ||||||||||
Institutional Class Shares | $ | 12.11 | $ | 10.17 | $ | 20.28 | $ | 14.90 | $ | 12.56 | ||||||||||
Maximum offering price per share (100%/(100%-maximum sales charge) of net asset value adjusted to the nearest cent): | ||||||||||||||||||||
Class A Shares | $ | 12.82 | $ | 10.75 | $ | 21.42 | $ | 15.79 | $ | 13.01 | ||||||||||
Maximum Sales Charge: | ||||||||||||||||||||
Class A Shares | 5.75 | % | 5.75 | % | 5.75 | % | 5.75 | % | 5.75 | % | ||||||||||
| (a) | For Class C Shares, the redemption price per share is reduced by 1.00% for shares held less than one year. |
See accompanying Notes to Financial Statements.
2014 Annual Report
81
Table of Contents
Statements of Assets and Liabilities (continued)
October 31, 2014
| Aberdeen European Equity Fund | Aberdeen Global Equity Fund | Aberdeen Global Natural Resources Fund | Aberdeen Global Small Cap Fund | Aberdeen International Equity Fund | ||||||||||||||||
Assets: | ||||||||||||||||||||
Investments, at value | $ | 5,906,732 | $ | 150,226,871 | $ | 22,760,986 | $ | 256,386,784 | $ | 865,104,759 | ||||||||||
Repurchase agreements, at value | 192,000 | 6,474,000 | 369,000 | 333,000 | 12,879,000 | |||||||||||||||
|
|
|
|
|
|
|
|
|
| |||||||||||
Total investments | 6,098,732 | 156,700,871 | 23,129,986 | 256,719,784 | 877,983,759 | |||||||||||||||
|
|
|
|
|
|
|
|
|
| |||||||||||
Foreign currency, at value | 24,734 | 75,696 | – | 1,055,646 | 9,193 | |||||||||||||||
Cash | 31 | 6,681 | 5,466 | 865 | 254 | |||||||||||||||
Dividends receivable | 16,854 | 545,374 | 97,518 | 501,955 | 4,854,454 | |||||||||||||||
Receivable for investments sold | – | – | – | 791,253 | 1,894,985 | |||||||||||||||
Receivable for capital shares issued | – | 1,633,465 | 22,537 | 48,940 | 303,143 | |||||||||||||||
Receivable from Adviser | 14,834 | – | 8,874 | 2,642 | – | |||||||||||||||
Prepaid expenses and other assets | 10,513 | 35,026 | 27,001 | 38,494 | 54,317 | |||||||||||||||
|
|
|
|
|
|
|
|
|
| |||||||||||
Total assets | 6,165,698 | 158,997,113 | 23,291,382 | 259,159,579 | 885,100,105 | |||||||||||||||
|
|
|
|
|
|
|
|
|
| |||||||||||
Liabilities: | ||||||||||||||||||||
Payable for investments purchased | 2,260 | 1,007,704 | – | – | 1,438,760 | |||||||||||||||
Payable for capital shares redeemed | – | 6,067 | 71,967 | 40,975 | 592,113 | |||||||||||||||
Accrued expenses and other payables: | ||||||||||||||||||||
Investment advisory fees | 4,632 | 148,735 | 14,057 | 234,930 | 589,203 | |||||||||||||||
Transfer agent fees | 852 | 14,886 | 9,846 | 52,587 | 98,262 | |||||||||||||||
Distribution fees | 94 | 19,222 | 7,041 | 15,017 | 67,778 | |||||||||||||||
Administration fees | 412 | 10,335 | 1,607 | 17,096 | 58,920 | |||||||||||||||
Administrative services fees | – | 10,345 | 1,272 | 3,276 | 39,298 | |||||||||||||||
Printing fees | 191 | 5,407 | 740 | 17,412 | 29,774 | |||||||||||||||
Fund accounting fees | 1,126 | 3,414 | 804 | 4,925 | 14,604 | |||||||||||||||
Legal fees | 20 | 507 | 83 | 825 | 2,883 | |||||||||||||||
Custodian fees | 137 | 120 | 75 | 300 | 100 | |||||||||||||||
Other | 7,200 | 6,248 | 6,973 | 7,227 | 6,458 | |||||||||||||||
|
|
|
|
|
|
|
|
|
| |||||||||||
Total liabilities | 16,924 | 1,232,990 | 114,465 | 394,570 | 2,938,153 | |||||||||||||||
|
|
|
|
|
|
|
|
|
| |||||||||||
Net Assets | $ | 6,148,774 | $ | 157,764,123 | $ | 23,176,917 | $ | 258,765,009 | $ | 882,161,952 | ||||||||||
|
|
|
|
|
|
|
|
|
| |||||||||||
Cost: | ||||||||||||||||||||
Investments | $ | 5,920,784 | $ | 132,643,413 | $ | 24,059,291 | $ | 237,208,942 | $ | 768,604,516 | ||||||||||
Repurchase agreements | 192,000 | 6,474,000 | 369,000 | 333,000 | 12,879,000 | |||||||||||||||
Foreign currency | 25,047 | 75,703 | – | 1,071,337 | 9,319 | |||||||||||||||
Represented by: | ||||||||||||||||||||
Capital | $ | 6,090,665 | $ | 148,487,882 | $ | 53,467,358 | $ | 226,443,099 | $ | 870,027,599 | ||||||||||
Accumulated net investment income/(loss) | 5,340 | 247,291 | 83,782 | 441,427 | 2,005,521 | |||||||||||||||
Accumulated net realized gain/(loss) from investments and foreign currency transactions | 67,772 | (8,540,402 | ) | (29,075,463 | ) | 12,730,047 | (86,200,625 | ) | ||||||||||||
Net unrealized appreciation/(depreciation) on investments and translation of assets and liabilities denominated in foreign currencies | (15,003 | ) | 17,569,352 | (1,298,760 | ) | 19,150,436 | 96,329,457 | |||||||||||||
|
|
|
|
|
|
|
|
|
| |||||||||||
Net Assets | $ | 6,148,774 | $ | 157,764,123 | $ | 23,176,917 | $ | 258,765,009 | $ | 882,161,952 | ||||||||||
|
|
|
|
|
|
|
|
|
| |||||||||||
Net Assets: | ||||||||||||||||||||
Class A Shares | $ | 386,688 | $ | 73,229,785 | $ | 15,052,911 | $ | 64,188,711 | $ | 148,017,843 | ||||||||||
Class C Shares | 10,460 | 4,165,409 | 2,793,427 | 1,645,728 | 35,696,358 | |||||||||||||||
Class R Shares | 10,544 | 1,985,683 | 3,134,461 | 865,678 | 16,937,934 | |||||||||||||||
Institutional Service Class Shares | 10,629 | 2,176 | 671,709 | 2,201,091 | 185,165,924 | |||||||||||||||
Institutional Class Shares | 5,730,453 | 78,381,070 | 1,524,409 | 189,863,801 | 496,343,893 | |||||||||||||||
|
|
|
|
|
|
|
|
|
| |||||||||||
Total | $ | 6,148,774 | $ | 157,764,123 | $ | 23,176,917 | $ | 258,765,009 | $ | 882,161,952 | ||||||||||
|
|
|
|
|
|
|
|
|
| |||||||||||
Amounts listed as “–” are $0 or round to $0.
See accompanying Notes to Financial Statements.
Annual Report 2014
82
Table of Contents
Statements of Assets and Liabilities (continued)
October 31, 2014
| Aberdeen European Equity Fund | Aberdeen Global Equity Fund | Aberdeen Global Natural Resources Fund | Aberdeen Global Small Cap Fund | Aberdeen International Equity Fund | ||||||||||||||||
Shares Outstanding (unlimited number of shares authorized): | ||||||||||||||||||||
Class A Shares | 37,841 | 5,294,966 | 980,757 | 2,165,253 | 9,964,821 | |||||||||||||||
Class C Shares | 1,026 | 317,263 | 191,507 | 59,174 | 2,547,079 | |||||||||||||||
Class R Shares | 1,031 | 148,799 | 207,511 | 30,305 | 1,191,475 | |||||||||||||||
Institutional Service Class Shares | 1,038 | 157 | 43,191 | 74,268 | 12,216,557 | |||||||||||||||
Institutional Class Shares | 559,514 | 5,661,920 | 97,943 | 6,401,916 | 32,631,041 | |||||||||||||||
|
|
|
|
|
|
|
|
|
| |||||||||||
Total | 600,450 | 11,423,105 | 1,520,909 | 8,730,916 | 58,550,973 | |||||||||||||||
|
|
|
|
|
|
|
|
|
| |||||||||||
Net asset value and redemption price per share (Net assets by class divided by shares outstanding by class, respectively): | ||||||||||||||||||||
Class A Shares | $ | 10.22 | $ | 13.83 | $ | 15.35 | $ | 29.64 | $ | 14.85 | ||||||||||
Class C Shares (a) | $ | 10.19 | $ | 13.13 | $ | 14.59 | $ | 27.81 | $ | 14.01 | ||||||||||
Class R Shares | $ | 10.23 | $ | 13.34 | $ | 15.11 | $ | 28.57 | $ | 14.22 | ||||||||||
Institutional Service Class Shares | $ | 10.24 | $ | 13.86 | $ | 15.55 | $ | 29.64 | $ | 15.16 | ||||||||||
Institutional Class Shares | $ | 10.24 | $ | 13.84 | $ | 15.56 | $ | 29.66 | $ | 15.21 | ||||||||||
Maximum offering price per share (100%/(100%-maximum sales charge) of net asset value adjusted to the nearest cent): | ||||||||||||||||||||
Class A Shares | $ | 10.84 | $ | 14.67 | $ | 16.29 | $ | 31.45 | $ | 15.76 | ||||||||||
Maximum Sales Charge: | ||||||||||||||||||||
Class A Shares | 5.75 | % | 5.75 | % | 5.75 | % | 5.75 | % | 5.75 | % | ||||||||||
| (a) | For Class C Shares, the redemption price per share is reduced by 1.00% for shares held less than one year. |
See accompanying Notes to Financial Statements.
2014 Annual Report
83
Table of Contents
Statements of Assets and Liabilities (continued)
October 31, 2014
| Aberdeen Latin American Equity Fund | Aberdeen Small Cap Fund | Aberdeen U.S. Equity Fund | ||||||||||
Assets: | ||||||||||||
Investments, at value | $ | 4,038,840 | $ | 131,642,371 | $ | 416,779,753 | ||||||
Repurchase agreements, at value | – | 3,031,000 | 749,000 | |||||||||
|
|
|
|
|
| |||||||
Total investments | 4,038,840 | 134,673,371 | 417,528,753 | |||||||||
|
|
|
|
|
| |||||||
Cash | 78,047 | 26,551 | 170,524 | |||||||||
Foreign currency, at value | 11,385 | – | – | |||||||||
Dividends receivable | 5,883 | 23,185 | 348,503 | |||||||||
Receivable for capital shares issued | – | 104,883 | 48,949 | |||||||||
Receivable from Adviser | 14,383 | 9,703 | 7,288 | |||||||||
Prepaid expenses and other assets | 13,685 | 24,389 | 45,562 | |||||||||
|
|
|
|
|
| |||||||
Total assets | 4,162,223 | 134,862,082 | 418,149,579 | |||||||||
|
|
|
|
|
| |||||||
Liabilities: | ||||||||||||
Payable for capital shares redeemed | – | 104,621 | 296,193 | |||||||||
Payable for investments purchased | – | 235,592 | – | |||||||||
Accrued expenses and other payables: | ||||||||||||
Investment advisory fees | 3,873 | 97,162 | 258,492 | |||||||||
Distribution fees | 37 | 39,993 | 64,252 | |||||||||
Transfer agent fees | 782 | 34,869 | 33,585 | |||||||||
Printing fees | 199 | 9,527 | 37,758 | |||||||||
Administration fees | 282 | 8,442 | 27,573 | |||||||||
Administrative services fees | – | 4,553 | 17,900 | |||||||||
Fund accounting fees | 67 | 1,899 | 6,172 | |||||||||
Legal fees | 14 | 403 | 1,314 | |||||||||
Custodian fees | 107 | 54 | 73 | |||||||||
Other | 7,233 | 6,440 | 5,355 | |||||||||
|
|
|
|
|
| |||||||
Total liabilities | 12,594 | 543,555 | 748,667 | |||||||||
|
|
|
|
|
| |||||||
Net Assets | $ | 4,149,629 | $ | 134,318,527 | $ | 417,400,912 | ||||||
|
|
|
|
|
| |||||||
Cost: | ||||||||||||
Investments | $ | 5,086,905 | $ | 99,969,493 | $ | 309,349,658 | ||||||
Repurchase agreements | – | 3,031,000 | 749,000 | |||||||||
Foreign currency | 11,682 | – | – | |||||||||
Represented by: | ||||||||||||
Capital | $ | 5,194,292 | $ | 519,068,658 | $ | 315,636,072 | ||||||
Accumulated net investment income/(loss) | 11,882 | (514,327 | ) | 508,816 | ||||||||
Accumulated net realized loss from investments and foreign currency transactions | (8,020 | ) | (415,908,682 | ) | (6,173,930 | ) | ||||||
Net unrealized appreciation/(depreciation) on investments and translation of assets and liabilities denominated in foreign currencies | (1,048,525 | ) | 31,672,878 | 107,429,954 | ||||||||
|
|
|
|
|
| |||||||
Net Assets | $ | 4,149,629 | $ | 134,318,527 | $ | 417,400,912 | ||||||
|
|
|
|
|
| |||||||
Net Assets: | ||||||||||||
Class A Shares | $ | 57,476 | $ | 72,790,484 | $ | 276,860,799 | ||||||
Class C Shares | 25,128 | 31,345,922 | 8,469,483 | |||||||||
Class R Shares | 8,063 | 1,151,883 | 350,854 | |||||||||
Institutional Service Class Shares | 8,128 | 1,626,261 | 128,282,599 | |||||||||
Institutional Class Shares | 4,050,834 | 27,403,977 | 3,437,177 | |||||||||
|
|
|
|
|
| |||||||
Total | $ | 4,149,629 | $ | 134,318,527 | $ | 417,400,912 | ||||||
|
|
|
|
|
| |||||||
Amounts listed as “–” are $0 or round to $0.
See accompanying Notes to Financial Statements.
Annual Report 2014
84
Table of Contents
Statements of Assets and Liabilities (concluded)
October 31, 2014
| Aberdeen Latin American Equity Fund | Aberdeen Small Cap Fund | Aberdeen U.S. Equity Fund | ||||||||||
Shares Outstanding (unlimited number of shares authorized): | ||||||||||||
Class A Shares | 7,245 | 3,045,758 | 20,657,117 | |||||||||
Class C Shares | 3,177 | 1,478,314 | 689,141 | |||||||||
Class R Shares | 1,017 | 51,661 | 27,302 | |||||||||
Institutional Service Class Shares | 1,024 | 65,145 | 9,179,371 | |||||||||
Institutional Class Shares | 510,015 | 1,099,118 | 245,702 | |||||||||
|
|
|
|
|
| |||||||
Total | 522,478 | 5,739,996 | 30,798,633 | |||||||||
|
|
|
|
|
| |||||||
Net asset value and redemption price per share (Net assets by class divided by shares outstanding by class, respectively): | ||||||||||||
Class A Shares | $ | 7.93 | $ | 23.90 | $ | 13.40 | ||||||
Class C Shares (a) | $ | 7.91 | $ | 21.20 | $ | 12.29 | ||||||
Class R Shares | $ | 7.93 | $ | 22.30 | $ | 12.85 | ||||||
Institutional Service Class Shares | $ | 7.94 | $ | 24.96 | $ | 13.98 | ||||||
Institutional Class Shares | $ | 7.94 | $ | 24.93 | $ | 13.99 | ||||||
Maximum offering price per share (100%/(100%-maximum sales charge) of net asset value adjusted to the nearest cent): | ||||||||||||
Class A Shares | $ | 8.41 | $ | 25.36 | $ | 14.22 | ||||||
Maximum Sales Charge: | ||||||||||||
Class A Shares | 5.75 | % | 5.75 | % | 5.75 | % | ||||||
| (a) | For Class C Shares, the redemption price per share is reduced by 1.00% for shares held less than one year. |
See accompanying Notes to Financial Statements.
2014 Annual Report
85
Table of Contents
Statements of Operations
For the Year Ended October 31, 2014
| Aberdeen Asia-Pacific (ex-Japan) Equity Fund | Aberdeen Asia-Pacific Smaller Companies Fund | Aberdeen China Opportunities Fund | Aberdeen Emerging Markets Fund | Aberdeen Equity Long-Short Fund | ||||||||||||||||
INVESTMENT INCOME: | ||||||||||||||||||||
Dividend income | $ | 23,121,780 | $ | 647,731 | $ | 911,613 | $ | 286,055,846 | $ | 9,141,181 | ||||||||||
Interest income | 26 | 1 | 75 | 445 | – | |||||||||||||||
Foreign tax withholding | (836,319 | ) | (27,627 | ) | (22,418 | ) | (26,226,467 | ) | (157,248 | ) | ||||||||||
Other income | 18,409 | – | 181 | – | 3,274 | |||||||||||||||
|
|
|
|
|
|
|
|
|
| |||||||||||
| 22,303,896 | 620,105 | 889,451 | 259,829,824 | 8,987,207 | ||||||||||||||||
|
|
|
|
|
|
|
|
|
| |||||||||||
Expenses: | ||||||||||||||||||||
Investment advisory fees | 8,647,190 | 293,760 | 413,711 | 95,753,396 | 6,669,954 | |||||||||||||||
Administration fees | 691,775 | 18,077 | 26,477 | 8,511,413 | 463,997 | |||||||||||||||
Distribution fees Class A | 3,363 | 3,116 | 54,531 | 947,844 | 123,465 | |||||||||||||||
Distribution fees Class C | 1,710 | 597 | 66,234 | 455,336 | 111,893 | |||||||||||||||
Distribution fees Class R | 75 | 70 | 7,620 | 138,596 | 15,646 | |||||||||||||||
Administrative services fees Class A | – | 593 | 4,187 | 240,256 | 32,180 | |||||||||||||||
Administrative services fees Class R | – | 10 | 2,313 | 52,971 | 7,402 | |||||||||||||||
Administrative service fees Institutional Service Class | 2,030 | – | 410 | 697,372 | 6,532 | |||||||||||||||
Transfer agent fees | 791,058 | 51,948 | 76,360 | 6,095,148 | 671,953 | |||||||||||||||
Custodian fees | 432,134 | 32,368 | 21,723 | 5,419,730 | 18,358 | |||||||||||||||
Dividend expense for securities sold short | – | – | – | – | 4,055,546 | |||||||||||||||
Broker related expenses for securities sold short | – | – | – | – | 2,225,270 | |||||||||||||||
Fund accounting fees | 82,366 | 8,214 | 8,709 | 984,148 | 54,715 | |||||||||||||||
Trustee fees | 37,845 | 1,004 | 1,472 | 473,872 | 26,674 | |||||||||||||||
Legal fees | 30,411 | 1,598 | 1,200 | 399,039 | 22,465 | |||||||||||||||
Registration and filing fees | 73,880 | 62,383 | 67,796 | 134,547 | 87,727 | |||||||||||||||
Printing fees | 95,378 | 13,370 | 15,246 | 173,700 | 52,876 | |||||||||||||||
Audit fees | 28,448 | 31,734 | 30,388 | 33,705 | 33,595 | |||||||||||||||
Other | 69,437 | 26,187 | 8,055 | 752,427 | 41,300 | |||||||||||||||
|
|
|
|
|
|
|
|
|
| |||||||||||
Total operating expenses before reimbursed/waived expenses | 10,987,100 | 545,029 | 806,432 | 121,263,500 | 14,721,548 | |||||||||||||||
|
|
|
|
|
|
|
|
|
| |||||||||||
Expenses reimbursed | (170,934 | ) | (201,689 | ) | (134,971 | ) | (1,699,198 | ) | (23,669 | ) | ||||||||||
Broker related expenses for securities sold short reduced by Adviser | – | – | – | – | (869,994 | ) | ||||||||||||||
|
|
|
|
|
|
|
|
|
| |||||||||||
Net expenses | 10,816,166 | 343,340 | 671,461 | 119,564,302 | 13,827,885 | |||||||||||||||
|
|
|
|
|
|
|
|
|
| |||||||||||
Net Investment Income/(Loss) | 11,487,730 | 276,765 | 217,990 | 140,265,522 | (4,840,678 | ) | ||||||||||||||
|
|
|
|
|
|
|
|
|
| |||||||||||
REALIZED/UNREALIZED GAIN/(LOSS) FROM INVESTMENTS: | ||||||||||||||||||||
Realized gain on investment transactions and securities sold short (including $(634,853), $(27,570), $0, $(5,087,991) and $0 capital gains tax, respectively) | 16,670,082 | 664,537 | 1,827,369 | 347,213,237 | 52,168,460 | |||||||||||||||
Realized loss on foreign currency transactions | (205,118 | ) | (23,549 | ) | (559 | ) | (266,445 | ) | (4,837 | ) | ||||||||||
|
|
|
|
|
|
|
|
|
| |||||||||||
Net realized gain from investments and foreign currency transactions | 16,464,964 | 640,988 | 1,826,810 | 346,946,792 | 52,163,623 | |||||||||||||||
|
|
|
|
|
|
|
|
|
| |||||||||||
Net change in unrealized appreciation/depreciation on investment transactions (including $1,133,846, $40,647, $0, $25,845,058 and $0 change in deferred capital gains tax, respectively) | (27,560,941 | ) | (1,524,491 | ) | (2,707,350 | ) | (690,307,460 | ) | (49,356,727 | ) | ||||||||||
Net change in unrealized appreciation/depreciation on securities sold short | – | – | – | – | 18,201,617 | |||||||||||||||
Net change in unrealized appreciation/depreciation on translation of assets and liabilities denominated in foreign currencies | 7,816 | (230 | ) | 432 | (123,168 | ) | 3 | |||||||||||||
|
|
|
|
|
|
|
|
|
| |||||||||||
Net change in unrealized appreciation/depreciation from investments and translation of assets and liabilities denominated in foreign currencies | (27,553,125 | ) | (1,524,721 | ) | (2,706,918 | ) | (690,430,628 | ) | (31,155,107 | ) | ||||||||||
|
|
|
|
|
|
|
|
|
| |||||||||||
Net realized/unrealized gain/(loss) from investments and foreign currency transactions | (11,088,161 | ) | (883,733 | ) | (880,108 | ) | (343,483,836 | ) | 21,008,516 | |||||||||||
|
|
|
|
|
|
|
|
|
| |||||||||||
CHANGE IN NET ASSETS RESULTING FROM OPERATIONS | $ | 399,569 | $ | (606,968 | ) | $ | (662,118 | ) | $ | (203,218,314 | ) | $ | 16,167,838 | |||||||
|
|
|
|
|
|
|
|
|
| |||||||||||
Amounts listed as “–” are $0 or round to $0.
See accompanying Notes to Financial Statements.
Annual Report 2014
86
Table of Contents
Statements of Operations (continued)
For the Year Ended October 31, 2014
| Aberdeen European Equity Fund | Aberdeen Global Equity Fund | Aberdeen Global Natural Resources Fund | Aberdeen Global Small Cap Fund | Aberdeen International Equity Fund | ||||||||||||||||
INVESTMENT INCOME: | ||||||||||||||||||||
Dividend income | $ | 209,223 | $ | 7,977,690 | $ | 865,523 | $ | 6,798,265 | $ | 48,760,823 | ||||||||||
Foreign tax withholding | (14,851 | ) | (418,293 | ) | (69,901 | ) | (330,372 | ) | (3,218,852 | ) | ||||||||||
Other income | – | 7,284 | – | 679 | 11,923 | |||||||||||||||
|
|
|
|
|
|
|
|
|
| |||||||||||
| 194,372 | 7,566,681 | 795,622 | 6,468,572 | 45,553,894 | ||||||||||||||||
|
|
|
|
|
|
|
|
|
| |||||||||||
Expenses: | ||||||||||||||||||||
Investment advisory fees | 57,579 | 1,457,079 | 200,267 | 3,087,368 | 7,705,466 | |||||||||||||||
Administration fees | 5,118 | 129,518 | 22,888 | 226,990 | 770,547 | |||||||||||||||
Distribution fees Class A | 584 | 202,718 | 47,126 | 179,436 | 458,148 | |||||||||||||||
Distribution fees Class C | 161 | 47,305 | 34,436 | 19,749 | 386,713 | |||||||||||||||
Distribution fees Class R | 56 | 10,922 | 17,765 | 6,580 | 85,481 | |||||||||||||||
Administrative services fees Class A | – | 94,375 | 13,661 | 34,725 | 95,517 | |||||||||||||||
Administrative services fees Class R | – | 3,583 | 1,498 | 765 | 14,762 | |||||||||||||||
Administrative service fees Institutional Service Class | – | – | 13 | 5,098 | 255,552 | |||||||||||||||
Transfer agent fees | 10,138 | 125,878 | 83,848 | 386,724 | 850,117 | |||||||||||||||
Registration and filing fees | 78,867 | 59,403 | 68,234 | 89,676 | 74,061 | |||||||||||||||
Custodian fees | 5,831 | 27,291 | 6,925 | 94,902 | 154,684 | |||||||||||||||
Printing fees | 5,422 | 19,321 | 12,309 | 41,163 | 83,644 | |||||||||||||||
Fund accounting fees | 6,760 | 20,917 | 4,448 | 31,309 | 89,287 | |||||||||||||||
Audit fees | 30,468 | 29,434 | 27,682 | 29,434 | 33,595 | |||||||||||||||
Trustee fees | 281 | 7,088 | 1,285 | 12,639 | 42,851 | |||||||||||||||
Legal fees | 260 | 6,145 | 1,064 | 11,172 | 36,688 | |||||||||||||||
Other | 2,883 | 12,042 | 7,081 | 42,848 | 97,574 | |||||||||||||||
|
|
|
|
|
|
|
|
|
| |||||||||||
Total operating expenses before reimbursed/waived expenses | 204,408 | 2,253,019 | 550,530 | 4,300,578 | 11,234,687 | |||||||||||||||
|
|
|
|
|
|
|
|
|
| |||||||||||
Expenses reimbursed | (133,233 | ) | – | (104,159 | ) | (365,671 | ) | – | ||||||||||||
Recoupment of expenses previously reimbursed | – | 32,465 | – | – | – | |||||||||||||||
|
|
|
|
|
|
|
|
|
| |||||||||||
Net expenses | 71,175 | 2,285,484 | 446,371 | 3,934,907 | 11,234,687 | |||||||||||||||
|
|
|
|
|
|
|
|
|
| |||||||||||
Net Investment Income | 123,197 | 5,281,197 | 349,251 | 2,533,665 | 34,319,207 | |||||||||||||||
|
|
|
|
|
|
|
|
|
| |||||||||||
REALIZED/UNREALIZED GAIN/(LOSS) FROM INVESTMENTS: | ||||||||||||||||||||
Realized gain on investment transactions and securities sold short (including $0, $0, $0, $(64,443) and $0 capital gains tax, respectively) | 67,773 | 8,675,902 | 864,316 | 14,161,464 | 48,233,336 | |||||||||||||||
Realized gain/(loss) on foreign currency transactions | 2 | 54,682 | (6,001 | ) | 6,743 | 144,027 | ||||||||||||||
|
|
|
|
|
|
|
|
|
| |||||||||||
Net realized gain from investments and foreign currency transactions (including $0, $0, $0, $0 and $0 change in deferred capital gains tax, respectively) | 67,775 | 8,730,584 | 858,315 | 14,168,207 | 48,377,363 | |||||||||||||||
|
|
|
|
|
|
|
|
|
| |||||||||||
Net change in unrealized appreciation/depreciation on investment transactions | (433,770 | ) | (8,047,843 | ) | (2,271,668 | ) | (418,833 | ) | (74,993,397 | ) | ||||||||||
Net change in unrealized appreciation/depreciation on translation of assets and liabilities denominated in foreign currencies | (1,143 | ) | (33,853 | ) | (636 | ) | (26,645 | ) | (284,455 | ) | ||||||||||
|
|
|
|
|
|
|
|
|
| |||||||||||
Net change in unrealized appreciation/depreciation from investments and translation of assets and liabilities denominated in foreign currencies | (434,913 | ) | (8,081,696 | ) | (2,272,304 | ) | (445,478 | ) | (75,277,852 | ) | ||||||||||
|
|
|
|
|
|
|
|
|
| |||||||||||
Net realized/unrealized gain/(loss) from investments and foreign currency transactions | (367,138 | ) | 648,888 | (1,413,989 | ) | 13,722,729 | (26,900,489 | ) | ||||||||||||
|
|
|
|
|
|
|
|
|
| |||||||||||
CHANGE IN NET ASSETS RESULTING FROM OPERATIONS | $ | (243,941 | ) | $ | 5,930,085 | $ | (1,064,738 | ) | $ | 16,256,394 | $ | 7,418,718 | ||||||||
|
|
|
|
|
|
|
|
|
| |||||||||||
Amounts listed as “–” are $0 or round to $0.
See accompanying Notes to Financial Statements.
2014 Annual Report
87
Table of Contents
Statements of Operations (concluded)
For the Year Ended October 31, 2014
| Aberdeen Latin American Equity Fund | Aberdeen Small Cap Fund | Aberdeen U.S. Equity Fund | ||||||||||
INVESTMENT INCOME: | ||||||||||||
Dividend income | $ | 142,482 | $ | 1,681,492 | $ | 9,028,413 | ||||||
Foreign tax withholding | (11,136 | ) | (16,805 | ) | (183,506 | ) | ||||||
Other income | – | 328,252 | 10,703 | |||||||||
|
|
|
|
|
| |||||||
| 131,346 | 1,992,939 | 8,855,610 | ||||||||||
|
|
|
|
|
| |||||||
Expenses: | ||||||||||||
Investment advisory fees | 47,594 | 1,223,193 | 3,184,089 | |||||||||
Administration fees | 3,461 | 107,319 | 339,636 | |||||||||
Distribution fees Class A | 104 | 193,759 | 704,818 | |||||||||
Distribution fees Class C | 135 | 321,900 | 90,363 | |||||||||
Distribution fees Class R | 42 | 6,344 | 1,976 | |||||||||
Administrative services fees Class A | – | 50,703 | 68,102 | |||||||||
Administrative services fees Class R | – | 685 | 21 | |||||||||
Administrative service fees Institutional Service Class | – | 58 | 118,351 | |||||||||
Transfer agent fees | 9,420 | 213,404 | 344,955 | |||||||||
Registration and filing fees | 82,626 | 60,184 | 59,496 | |||||||||
Printing fees | 3,209 | 32,803 | 73,070 | |||||||||
Audit fees | 30,468 | 27,682 | 27,134 | |||||||||
Fund accounting fees | 360 | 11,831 | 38,116 | |||||||||
Custodian fees | 8,975 | 7,550 | 11,369 | |||||||||
Trustee fees | 193 | 5,936 | 18,659 | |||||||||
Legal fees | 145 | 5,095 | 15,386 | |||||||||
Other | 2,782 | 11,320 | 28,452 | |||||||||
|
|
|
|
|
| |||||||
Total operating expenses before reimbursed/waived expenses | 189,514 | 2,279,766 | 5,123,993 | |||||||||
|
|
|
|
|
| |||||||
Expenses reimbursed | (132,985 | ) | (163,603 | ) | (319,455 | ) | ||||||
Reimbursement of administrative service fees | – | – | (62,812 | ) | ||||||||
|
|
|
|
|
| |||||||
Net expenses | 56,529 | 2,116,163 | 4,741,726 | |||||||||
|
|
|
|
|
| |||||||
Net Investment Income | 74,817 | (123,224 | ) | 4,113,884 | ||||||||
|
|
|
|
|
| |||||||
REALIZED/UNREALIZED GAIN/(LOSS) FROM INVESTMENTS: | ||||||||||||
Realized gain/(loss) on investment transactions and securities sold short (including $0, $0 and $0 capital gains tax, respectively) | (8,020 | ) | 17,473,482 | 39,931,048 | ||||||||
Realized gain/(loss) on foreign currency transactions | 113 | (4,029 | ) | 17,879 | ||||||||
|
|
|
|
|
| |||||||
Net realized gain/(loss) from investments and foreign currency transactions | (7,907 | ) | 17,469,453 | 39,948,927 | ||||||||
|
|
|
|
|
| |||||||
Net change in unrealized appreciation/depreciation on investment transactions (including $0, $0 and $0 change in deferred capital gains tax, respectively) | (626,098 | ) | (5,313,911 | ) | (3,814,859 | ) | ||||||
Net change in unrealized appreciation/depreciation on translation of assets and liabilities denominated in foreign currencies | (254 | ) | – | 1,043 | ||||||||
|
|
|
|
|
| |||||||
Net change in unrealized appreciation/depreciation from investments and translation of assets and liabilities denominated in foreign currencies | (626,352 | ) | (5,313,911 | ) | (3,813,816 | ) | ||||||
|
|
|
|
|
| |||||||
Net realized/unrealized gain/(loss) from investments and foreign currency transactions | (634,259 | ) | 12,155,542 | 36,135,111 | ||||||||
|
|
|
|
|
| |||||||
CHANGE IN NET ASSETS RESULTING FROM OPERATIONS | $ | (559,442 | ) | $ | 12,032,318 | $ | 40,248,995 | |||||
|
|
|
|
|
| |||||||
Amounts listed as “–” are $0 or round to $0.
See accompanying Notes to Financial Statements.
Annual Report 2014
88
Table of Contents
Statements of Changes in Net Assets
| Aberdeen Asia-Pacific (ex-Japan) Equity Fund | Aberdeen Asia-Pacific Smaller Companies Fund | Aberdeen China Opportunities Fund | ||||||||||||||||||||||
| Year Ended October 31, 2014 | Year Ended October 31, 2013 | Year Ended October 31, 2014 | Year Ended October 31, 2013 | Year Ended October 31, 2014 | Year Ended October 31, 2013 | |||||||||||||||||||
FROM INVESTMENT ACTIVITIES: | ||||||||||||||||||||||||
Operations: | ||||||||||||||||||||||||
Net investment income | $ | 11,487,730 | $ | 12,838,021 | $ | 276,765 | $ | 683,799 | $ | 217,990 | $ | 217,828 | ||||||||||||
Net realized gain from investments and foreign currency transactions | 16,464,964 | 5,096,041 | 640,988 | 3,476,765 | 1,826,810 | 2,743,393 | ||||||||||||||||||
Net change in unrealized appreciation/depreciation on investments and translation of assets and liabilities denominated in foreign currencies | (27,553,125 | ) | 26,135,039 | (1,524,721 | ) | (676,840 | ) | (2,706,918 | ) | (1,257,669 | ) | |||||||||||||
|
|
|
|
|
|
|
|
|
|
|
| |||||||||||||
Changes in net assets resulting from operations | 399,569 | 44,069,101 | (606,968 | ) | 3,483,724 | (662,118 | ) | 1,703,552 | ||||||||||||||||
|
|
|
|
|
|
|
|
|
|
|
| |||||||||||||
Distributions to Shareholders From: | ||||||||||||||||||||||||
Net investment income: | ||||||||||||||||||||||||
Class A | (16,717 | ) | (21,613 | ) | (20,464 | ) | (13,755 | ) | (204,538 | ) | (80,620 | ) | ||||||||||||
Class C | (1,122 | ) | (597 | ) | (563 | ) | (814 | ) | (20,248 | ) | (7,388 | ) | ||||||||||||
Class R | (189 | ) | (343 | ) | (99 | ) | (922 | ) | (8,946 | ) | (2,838 | ) | ||||||||||||
Institutional Service Class | (55,625 | ) | (95,074 | ) | (620 | ) | (535 | ) | (24,493 | ) | (20,416 | ) | ||||||||||||
Institutional Class | (12,844,331 | ) | (17,550,974 | ) | (352,955 | ) | (872,369 | ) | (9,491 | ) | (8,923 | ) | ||||||||||||
Net realized gains: | ||||||||||||||||||||||||
Class A | (7,850 | ) | (10,353 | ) | (192,269 | ) | (1,878 | ) | – | – | ||||||||||||||
Class C | (793 | ) | (145 | ) | (8,527 | ) | (355 | ) | – | – | ||||||||||||||
Class R | (194 | ) | (145 | ) | (1,697 | ) | (411 | ) | – | – | ||||||||||||||
Institutional Service Class | (20,975 | ) | (56,582 | ) | (4,592 | ) | (109 | ) | – | – | ||||||||||||||
Institutional Class | (5,464,269 | ) | (8,269,423 | ) | (3,329,370 | ) | (228,951 | ) | – | – | ||||||||||||||
|
|
|
|
|
|
|
|
|
|
|
| |||||||||||||
Change in net assets from shareholder distributions | (18,412,065 | ) | (26,005,249 | ) | (3,911,156 | ) | (1,120,099 | ) | (267,716 | ) | (120,185 | ) | ||||||||||||
|
|
|
|
|
|
|
|
|
|
|
| |||||||||||||
Change in net assets from capital transactions | 83,216,083 | 370,609,386 | 8,012,325 | (4,440,579 | ) | (3,323,175 | ) | (5,447,029 | ) | |||||||||||||||
|
|
|
|
|
|
|
|
|
|
|
| |||||||||||||
Change in net assets | 65,203,587 | 388,673,238 | 3,494,201 | (2,076,954 | ) | (4,253,009 | ) | (3,863,662 | ) | |||||||||||||||
|
|
|
|
|
|
|
|
|
|
|
| |||||||||||||
Net Assets: | ||||||||||||||||||||||||
Beginning of year | 1,010,208,798 | 621,535,560 | 27,479,119 | 29,556,073 | 34,618,237 | 38,481,899 | ||||||||||||||||||
|
|
|
|
|
|
|
|
|
|
|
| |||||||||||||
End of year | $ | 1,075,412,385 | $ | 1,010,208,798 | $ | 30,973,320 | $ | 27,479,119 | $ | 30,365,228 | $ | 34,618,237 | ||||||||||||
|
|
|
|
|
|
|
|
|
|
|
| |||||||||||||
Accumulated net investment income/(loss) at end of year | $ | 1,249,310 | $ | 3,536,120 | $ | (5,989 | ) | $ | 89,210 | $ | 53,626 | $ | 104,092 | |||||||||||
|
|
|
|
|
|
|
|
|
|
|
| |||||||||||||
Amounts listed as “–” are $0 or round to $0.
See accompanying Notes to Financial Statements.
2014 Annual Report
89
Table of Contents
Statements of Changes in Net Assets (continued)
| Aberdeen Asia-Pacific (ex-Japan) Equity Fund | Aberdeen Asia-Pacific Smaller Companies Fund | Aberdeen China Opportunities Fund | ||||||||||||||||||||||
| Year Ended October 31, 2014 | Year Ended October 31, 2013 | Year Ended October 31, 2014 | Year Ended October 31, 2013 | Year Ended October 31, 2014 | Year Ended October 31, 2013 | |||||||||||||||||||
CAPITAL TRANSACTIONS: | ||||||||||||||||||||||||
Class A Shares | ||||||||||||||||||||||||
Proceeds from shares issued | $ | 259,573 | $ | 1,135,226 | $ | 754,016 | $ | 1,381,458 | $ | 8,569,767 | $ | 6,054,729 | ||||||||||||
Dividends reinvested | 23,819 | 31,842 | 199,082 | 13,257 | 165,129 | 63,336 | ||||||||||||||||||
Cost of shares redeemed(a) | (460,429 | ) | (183,281 | ) | (771,687 | ) | (172,314 | ) | (10,420,570 | ) | (7,272,260 | ) | ||||||||||||
|
|
|
|
|
|
|
|
|
|
|
| |||||||||||||
Total Class A | (177,037 | ) | 983,787 | 181,411 | 1,222,401 | (1,685,674 | ) | (1,154,195 | ) | |||||||||||||||
|
|
|
|
|
|
|
|
|
|
|
| |||||||||||||
Class C Shares | ||||||||||||||||||||||||
Proceeds from shares issued | 155,400 | 186,223 | – | 143,771 | 200,725 | 598,913 | ||||||||||||||||||
Dividends reinvested | 1,915 | 742 | 9,090 | 1,169 | 11,321 | 4,177 | ||||||||||||||||||
Cost of shares redeemed(a) | (14,415 | ) | (49,765 | ) | – | (103,049 | ) | (1,675,815 | ) | (2,429,709 | ) | |||||||||||||
|
|
|
|
|
|
|
|
|
|
|
| |||||||||||||
Total Class C | 142,900 | 137,200 | 9,090 | 41,891 | (1,463,769 | ) | (1,826,619 | ) | ||||||||||||||||
|
|
|
|
|
|
|
|
|
|
|
| |||||||||||||
Class R Shares | ||||||||||||||||||||||||
Proceeds from shares issued | – | 25,000 | 1,113 | 185,193 | 755,012 | 1,472,953 | ||||||||||||||||||
Dividends reinvested | 383 | 488 | 1,796 | 1,333 | 6,697 | 2,066 | ||||||||||||||||||
Cost of shares redeemed(a) | (23,490 | ) | – | (23,044 | ) | (219,844 | ) | (844,908 | ) | (1,134,164 | ) | |||||||||||||
|
|
|
|
|
|
|
|
|
|
|
| |||||||||||||
Total Class R | (23,107 | ) | 25,488 | (20,135 | ) | (33,318 | ) | (83,199 | ) | 340,855 | ||||||||||||||
|
|
|
|
|
|
|
|
|
|
|
| |||||||||||||
Institutional Service Class Shares | ||||||||||||||||||||||||
Proceeds from shares issued | 1,077,483 | 813,803 | 21,150 | 21,164 | 285,204 | 203,414 | ||||||||||||||||||
Dividends reinvested | 61,577 | 143,784 | 5,211 | 644 | 24,293 | 20,045 | ||||||||||||||||||
Cost of shares redeemed(a) | (1,050,062 | ) | (936,986 | ) | (12 | ) | (3,432 | ) | (871,009 | ) | (2,513,313 | ) | ||||||||||||
|
|
|
|
|
|
|
|
|
|
|
| |||||||||||||
Total Institutional Service Class | 88,998 | 20,601 | 26,349 | 18,376 | (561,512 | ) | (2,289,854 | ) | ||||||||||||||||
|
|
|
|
|
|
|
|
|
|
|
| |||||||||||||
Institutional Class Shares | ||||||||||||||||||||||||
Proceeds from shares issued | 577,871,251 | 508,352,727 | 23,566,650 | 28,029,587 | 6,350,550 | 799,991 | ||||||||||||||||||
Dividends reinvested | 5,225,269 | 8,255,375 | 918,557 | 178,619 | 6,341 | 3,962 | ||||||||||||||||||
Cost of shares redeemed(a) | (499,912,191 | ) | (147,165,792 | ) | (16,669,597 | ) | (33,898,135 | ) | (5,885,912 | ) | (1,321,169 | ) | ||||||||||||
|
|
|
|
|
|
|
|
|
|
|
| |||||||||||||
Total Institutional Class | 83,184,329 | 369,442,310 | 7,815,610 | (5,689,929 | ) | 470,979 | (517,216 | ) | ||||||||||||||||
|
|
|
|
|
|
|
|
|
|
|
| |||||||||||||
Change in net assets from capital transactions: | $ | 83,216,083 | $ | 370,609,386 | $ | 8,012,325 | $ | (4,440,579 | ) | $ | (3,323,175 | ) | $ | (5,447,029 | ) | |||||||||
|
|
|
|
|
|
|
|
|
|
|
| |||||||||||||
| (a) | Includes redemption fees, if any. |
Amounts listed as “–” are $0 or round to $0.
See accompanying Notes to Financial Statements.
Annual Report 2014
90
Table of Contents
Statements of Changes in Net Assets (continued)
| Aberdeen Asia-Pacific (ex-Japan) Equity Fund | Aberdeen Asia-Pacific Smaller Companies Fund | Aberdeen China Opportunities Fund | ||||||||||||||||||||||
| Year Ended October 31, 2014 | Year Ended October 31, 2013 | Year Ended October 31, 2014 | Year Ended October 31, 2013 | Year Ended October 31, 2014 | Year Ended October 31, 2013 | |||||||||||||||||||
SHARE TRANSACTIONS: | ||||||||||||||||||||||||
Class A Shares | ||||||||||||||||||||||||
Issued | 21,843 | 95,658 | 73,778 | 114,842 | 423,689 | 294,803 | ||||||||||||||||||
Reinvested | 2,015 | 2,706 | 21,063 | 1,150 | 8,156 | 3,149 | ||||||||||||||||||
Redeemed | (37,276 | ) | (15,715 | ) | (79,344 | ) | (14,791 | ) | (525,111 | ) | (356,248 | ) | ||||||||||||
|
|
|
|
|
|
|
|
|
|
|
| |||||||||||||
Total Class A Shares | (13,418 | ) | 82,649 | 15,497 | 101,201 | (93,266 | ) | (58,296 | ) | |||||||||||||||
|
|
|
|
|
|
|
|
|
|
|
| |||||||||||||
Class C Shares | ||||||||||||||||||||||||
Issued | 12,824 | 15,487 | – | 12,465 | 10,309 | 30,354 | ||||||||||||||||||
Reinvested | 163 | 64 | 973 | 105 | 590 | 213 | ||||||||||||||||||
Redeemed | (1,185 | ) | (4,307 | ) | – | (8,408 | ) | (87,671 | ) | (122,908 | ) | |||||||||||||
|
|
|
|
|
|
|
|
|
|
|
| |||||||||||||
Total Class C Shares | 11,802 | 11,244 | 973 | 4,162 | (76,772 | ) | (92,341 | ) | ||||||||||||||||
|
|
|
|
|
|
|
|
|
|
|
| |||||||||||||
Class R Shares | ||||||||||||||||||||||||
Issued | – | 2,029 | 113 | 15,662 | 38,178 | 71,253 | ||||||||||||||||||
Reinvested | 33 | 42 | 190 | 119 | 335 | 103 | ||||||||||||||||||
Redeemed | (2,061 | ) | – | (2,011 | ) | (18,822 | ) | (42,285 | ) | (55,577 | ) | |||||||||||||
|
|
|
|
|
|
|
|
|
|
|
| |||||||||||||
Total Class R Shares | (2,028 | ) | 2,071 | (1,708 | ) | (3,041 | ) | (3,772 | ) | 15,779 | ||||||||||||||
|
|
|
|
|
|
|
|
|
|
|
| |||||||||||||
Institutional Service Class Shares | ||||||||||||||||||||||||
Issued | 92,160 | 68,994 | 2,026 | 1,805 | 14,239 | 10,018 | ||||||||||||||||||
Reinvested | 5,171 | 12,136 | 541 | 56 | 1,192 | 999 | ||||||||||||||||||
Redeemed | (90,176 | ) | (78,581 | ) | (1 | ) | (289 | ) | (43,285 | ) | (125,128 | ) | ||||||||||||
|
|
|
|
|
|
|
|
|
|
|
| |||||||||||||
Total Institutional Service Class Shares | 7,155 | 2,549 | 2,566 | 1,572 | (27,854 | ) | (114,111 | ) | ||||||||||||||||
|
|
|
|
|
|
|
|
|
|
|
| |||||||||||||
Institutional Class Shares | ||||||||||||||||||||||||
Issued | 48,650,475 | 42,726,896 | 2,290,620 | 2,330,924 | 308,133 | 38,210 | ||||||||||||||||||
Reinvested | 438,109 | 699,727 | 97,020 | 15,637 | 306 | 197 | ||||||||||||||||||
Redeemed | (44,227,667 | ) | (12,553,270 | ) | (1,665,938 | ) | (2,818,175 | ) | (289,934 | ) | (63,090 | ) | ||||||||||||
|
|
|
|
|
|
|
|
|
|
|
| |||||||||||||
Total Institutional Class Shares | 4,860,917 | 30,873,353 | 721,702 | (471,614 | ) | 18,505 | (24,683 | ) | ||||||||||||||||
|
|
|
|
|
|
|
|
|
|
|
| |||||||||||||
Total change in shares: | 4,864,428 | 30,971,866 | 739,030 | (367,720 | ) | (183,159 | ) | (273,652 | ) | |||||||||||||||
|
|
|
|
|
|
|
|
|
|
|
| |||||||||||||
Amounts listed as “–” are $0 or round to $0.
See accompanying Notes to Financial Statements.
2014 Annual Report
91
Table of Contents
Statements of Changes in Net Assets (continued)
| Aberdeen Emerging Markets Fund | Aberdeen Equity Long-Short Fund | Aberdeen European Equity Fund | ||||||||||||||||||||||
| Year Ended October 31, 2014 | Year Ended October 31, 2013 | Year Ended October 31, 2014 | Year Ended October 31, 2013 | Year Ended October 31, 2014 | Period Ended October 31, 2013(a) | |||||||||||||||||||
FROM INVESTMENT ACTIVITIES: | ||||||||||||||||||||||||
Operations: | ||||||||||||||||||||||||
Net investment income/(loss) | $ | 140,265,522 | $ | 150,397,454 | $ | (4,840,678 | ) | $ | (5,390,015 | ) | $ | 123,197 | $ | 76,125 | ||||||||||
Net realized gain from investments and foreign currency transactions | 346,946,792 | (60,628,278 | ) | 52,163,623 | 9,864,192 | 67,775 | 29,872 | |||||||||||||||||
Net change in unrealized appreciation/depreciation on investments and translation of assets and liabilities denominated in foreign currencies | (690,430,628 | ) | 200,935,442 | (31,155,107 | ) | 46,691,015 | (434,913 | ) | 419,910 | |||||||||||||||
|
|
|
|
|
|
|
|
|
|
|
| |||||||||||||
Changes in net assets resulting from operations | (203,218,314 | ) | 290,704,618 | 16,167,838 | 51,165,192 | (243,941 | ) | 525,907 | ||||||||||||||||
|
|
|
|
|
|
|
|
|
|
|
| |||||||||||||
Distributions to Shareholders From: | ||||||||||||||||||||||||
Net investment income: | ||||||||||||||||||||||||
Class A | (5,420,160 | ) | (5,048,737 | ) | – | – | (5,710 | ) | (140 | ) | ||||||||||||||
Class C | (402,724 | ) | (259,688 | ) | – | – | (367 | ) | (103 | ) | ||||||||||||||
Class R | (319,820 | ) | (153,775 | ) | – | – | (201 | ) | (115 | ) | ||||||||||||||
Institutional Service Class | (4,140,793 | ) | (5,758,390 | ) | – | – | (264 | ) | (126 | ) | ||||||||||||||
Institutional Class | (170,385,442 | ) | (172,424,810 | ) | – | – | (142,710 | ) | (62,585 | ) | ||||||||||||||
Net realized gains: | ||||||||||||||||||||||||
Class A | – | – | (992,853 | ) | (715,656 | ) | (121 | ) | – | |||||||||||||||
Class C | – | – | (288,934 | ) | (203,541 | ) | (21 | ) | – | |||||||||||||||
Class R | – | – | (50,048 | ) | (23,468 | ) | (21 | ) | – | |||||||||||||||
Institutional Service Class | – | – | (59,253 | ) | (19,624 | ) | (21 | ) | – | |||||||||||||||
Institutional Class | – | – | (9,724,006 | ) | (5,267,106 | ) | (11,397 | ) | – | |||||||||||||||
|
|
|
|
|
|
|
|
|
|
|
| |||||||||||||
Change in net assets from shareholder distributions | (180,668,939 | ) | (183,645,400 | ) | (11,115,094 | ) | (6,229,395 | ) | (160,833 | ) | (63,069 | ) | ||||||||||||
|
|
|
|
|
|
|
|
|
|
|
| |||||||||||||
Change in net assets from capital transactions | (1,622,825,484 | ) | 3,689,377,899 | (318,138,777 | ) | 49,583,537 | 531,089 | 5,559,621 | ||||||||||||||||
|
|
|
|
|
|
|
|
|
|
|
| |||||||||||||
Change in net assets | (2,006,712,737 | ) | 3,796,437,117 | (313,086,033 | ) | 94,519,334 | 126,315 | 6,022,459 | ||||||||||||||||
|
|
|
|
|
|
|
|
|
|
|
| |||||||||||||
Net Assets: | ||||||||||||||||||||||||
Beginning of year | 12,049,055,527 | 8,252,618,410 | 662,560,938 | 568,041,604 | 6,022,459 | – | ||||||||||||||||||
|
|
|
|
|
|
|
|
|
|
|
| |||||||||||||
End of year | $ | 10,042,342,790 | $ | 12,049,055,527 | $ | 349,474,905 | $ | 662,560,938 | $ | 6,148,774 | $ | 6,022,459 | ||||||||||||
|
|
|
|
|
|
|
|
|
|
|
| |||||||||||||
Accumulated net investment income/(loss) at end of year | $ | 14,792,780 | $ | 50,848,697 | $ | (4,152,063 | ) | $ | (3,912,128 | ) | $ | 5,340 | $ | 31,393 | ||||||||||
|
|
|
|
|
|
|
|
|
|
|
| |||||||||||||
| (a) | For the period from March 25, 2013 (commencement of operations) through October 31, 2013. |
Amounts listed as “–” are $0 or round to $0.
See accompanying Notes to Financial Statements.
Annual Report 2014
92
Table of Contents
Statements of Changes in Net Assets (continued)
| Aberdeen Emerging Markets Fund | Aberdeen Equity Long-Short Fund | Aberdeen European Equity Fund | ||||||||||||||||||||||
| Year Ended October 31, 2014 | Year Ended October 31, 2013 | Year Ended October 31, 2014 | Year Ended October 31, 2013 | Year Ended October 31, 2014 | Period Ended October 31, 2013(a) | |||||||||||||||||||
CAPITAL TRANSACTIONS: | ||||||||||||||||||||||||
Class A Shares | ||||||||||||||||||||||||
Proceeds from shares issued | $ | 145,865,554 | $ | 330,432,793 | $ | 15,620,464 | $ | 18,447,027 | $ | 367,161 | $ | 61,719 | ||||||||||||
Dividends reinvested | 4,409,897 | 4,241,056 | 854,454 | 596,044 | 5,868 | 140 | ||||||||||||||||||
Cost of shares redeemed(b) | (215,663,301 | ) | (192,004,354 | ) | (49,047,002 | ) | (30,736,583 | ) | (11,047 | ) | (79 | ) | ||||||||||||
|
|
|
|
|
|
|
|
|
|
|
| |||||||||||||
Total Class A | (65,387,850 | ) | 142,669,495 | (32,572,084 | ) | (11,693,512 | ) | 361,982 | 61,780 | |||||||||||||||
|
|
|
|
|
|
|
|
|
|
|
| |||||||||||||
Class C Shares | ||||||||||||||||||||||||
Proceeds from shares issued | 10,221,434 | 39,095,136 | 790,686 | 1,257,209 | 14,873 | 14,974 | ||||||||||||||||||
Dividends reinvested | 218,357 | 174,990 | 131,067 | 84,449 | 388 | 103 | ||||||||||||||||||
Cost of shares redeemed(b) | (13,468,683 | ) | (8,112,094 | ) | (2,811,170 | ) | (3,665,380 | ) | (14,420 | ) | (5,064 | ) | ||||||||||||
|
|
|
|
|
|
|
|
|
|
|
| |||||||||||||
Total Class C | (3,028,892 | ) | 31,158,032 | (1,889,417 | ) | (2,323,722 | ) | 841 | 10,013 | |||||||||||||||
|
|
|
|
|
|
|
|
|
|
|
| |||||||||||||
Class R Shares | ||||||||||||||||||||||||
Proceeds from shares issued | 14,559,029 | 18,397,912 | 1,343,599 | 1,806,122 | – | 10,000 | ||||||||||||||||||
Dividends reinvested | 255,536 | 111,946 | 50,048 | 23,468 | 222 | 115 | ||||||||||||||||||
Cost of shares redeemed(b) | (5,582,668 | ) | (4,582,840 | ) | (746,524 | ) | (1,345,265 | ) | – | – | ||||||||||||||
|
|
|
|
|
|
|
|
|
|
|
| |||||||||||||
Total Class R | 9,231,897 | 13,927,018 | 647,123 | 484,325 | 222 | 10,115 | ||||||||||||||||||
|
|
| �� |
|
|
|
|
|
|
|
| |||||||||||||
Institutional Service Class Shares | ||||||||||||||||||||||||
Proceeds from shares issued | 18,172,691 | 351,463,114 | 456,995 | 2,041,678 | – | 10,000 | ||||||||||||||||||
Dividends reinvested | 4,137,566 | 5,747,629 | 59,253 | 19,624 | 285 | 126 | ||||||||||||||||||
Cost of shares redeemed(b) | (206,739,253 | ) | (212,352,220 | ) | (2,189,907 | ) | (674,696 | ) | – | – | ||||||||||||||
|
|
|
|
|
|
|
|
|
|
|
| |||||||||||||
Total Institutional Service Class | (184,428,996 | ) | 144,858,523 | (1,673,659 | ) | 1,386,606 | 285 | 10,126 | ||||||||||||||||
|
|
|
|
|
|
|
|
|
|
|
| |||||||||||||
Institutional Class Shares | ||||||||||||||||||||||||
Proceeds from shares issued | 1,977,897,554 | 4,703,129,038 | 123,234,177 | 172,025,893 | 25,000 | 5,405,000 | ||||||||||||||||||
Dividends reinvested | 130,234,728 | 139,949,119 | 9,218,417 | 3,617,517 | 154,107 | 62,587 | ||||||||||||||||||
Cost of shares redeemed(b) | (3,487,343,925 | ) | (1,486,313,326 | ) | (415,103,334 | ) | (113,913,570 | ) | (11,348 | ) | – | |||||||||||||
|
|
|
|
|
|
|
|
|
|
|
| |||||||||||||
Total Institutional Class | (1,379,211,643 | ) | 3,356,764,831 | (282,650,740 | ) | 61,729,840 | 167,759 | 5,467,587 | ||||||||||||||||
|
|
|
|
|
|
|
|
|
|
|
| |||||||||||||
Change in net assets from capital transactions: | $ | (1,622,825,484 | ) | $ | 3,689,377,899 | $ | (318,138,777 | ) | $ | 49,583,537 | $ | 531,089 | $ | 5,559,621 | ||||||||||
|
|
|
|
|
|
|
|
|
|
|
| |||||||||||||
| (a) | For the period from March 25, 2013 (commencement of operations) through October 31, 2013. |
| (b) | Includes redemption fees, if any. |
Amounts listed as “–” are $0 or round to $0.
See accompanying Notes to Financial Statements.
2014 Annual Report
93
Table of Contents
Statements of Changes in Net Assets (continued)
| Aberdeen Emerging Markets Fund | Aberdeen Equity Long-Short Fund | Aberdeen European Equity Fund | ||||||||||||||||||||||
| Year Ended October 31, 2014 | Year Ended October 31, 2013 | Year Ended October 31, 2014 | Year Ended October 31, 2013 | Year Ended October 31, 2014 | Period Ended October 31, 2013(a) | |||||||||||||||||||
SHARE TRANSACTIONS: | ||||||||||||||||||||||||
Class A Shares | ||||||||||||||||||||||||
Issued | 9,901,901 | 21,501,416 | 1,303,437 | 1,557,419 | 32,543 | 5,806 | ||||||||||||||||||
Reinvested | 292,976 | 277,875 | 71,027 | 52,608 | 509 | 14 | ||||||||||||||||||
Redeemed | (14,559,227 | ) | (12,745,099 | ) | (4,080,946 | ) | (2,635,279 | ) | (1,024 | ) | (7 | ) | ||||||||||||
|
|
|
|
|
|
|
|
|
|
|
| |||||||||||||
Total Class A Shares | (4,364,350 | ) | 9,034,192 | (2,706,482 | ) | (1,025,252 | ) | 32,028 | 5,813 | |||||||||||||||
|
|
|
|
|
|
|
|
|
|
|
| |||||||||||||
Class C Shares | ||||||||||||||||||||||||
Issued | 695,394 | 2,510,522 | 95,067 | 153,297 | 1,282 | 1,477 | ||||||||||||||||||
Reinvested | 14,738 | 11,394 | 15,753 | 10,622 | 34 | 10 | ||||||||||||||||||
Redeemed | (933,909 | ) | (544,003 | ) | (337,324 | ) | (450,169 | ) | (1,300 | ) | (477 | ) | ||||||||||||
|
|
|
|
|
|
|
|
|
|
|
| |||||||||||||
Total Class C Shares | (223,777 | ) | 1,977,913 | (226,504 | ) | (286,250 | ) | 16 | 1,010 | |||||||||||||||
|
|
|
|
|
|
|
|
|
|
|
| |||||||||||||
Class R Shares | ||||||||||||||||||||||||
Issued | 995,022 | 1,212,154 | 116,132 | 157,458 | – | 1,000 | ||||||||||||||||||
Reinvested | 16,979 | 7,348 | 4,318 | 2,139 | 20 | 11 | ||||||||||||||||||
Redeemed | (377,699 | ) | (303,149 | ) | (64,460 | ) | (117,233 | ) | – | – | ||||||||||||||
|
|
|
|
|
|
|
|
|
|
|
| |||||||||||||
Total Class R Shares | 634,302 | 916,353 | 55,990 | 42,364 | 20 | 1,011 | ||||||||||||||||||
|
|
|
|
|
|
|
|
|
|
|
| |||||||||||||
Institutional Service Class Shares | ||||||||||||||||||||||||
Issued | 1,254,488 | 23,420,313 | 37,398 | 170,253 | – | 1,000 | ||||||||||||||||||
Reinvested | 276,592 | 378,676 | 4,857 | 1,711 | 25 | 13 | ||||||||||||||||||
Redeemed | (14,742,648 | ) | (14,728,530 | ) | (180,961 | ) | (57,146 | ) | – | – | ||||||||||||||
|
|
|
|
|
|
|
|
|
|
|
| |||||||||||||
Total Institutional Service Class Shares | (13,211,568 | ) | 9,070,459 | (138,706 | ) | 114,818 | 25 | 1,013 | ||||||||||||||||
|
|
|
|
|
|
|
|
|
|
|
| |||||||||||||
Institutional Class Shares | ||||||||||||||||||||||||
Issued | 133,602,254 | 305,846,508 | 10,030,261 | 14,422,315 | 2,289 | 538,397 | ||||||||||||||||||
Reinvested | 8,653,424 | 9,205,616 | 750,075 | 313,749 | 13,634 | 6,203 | ||||||||||||||||||
Redeemed | (237,824,889 | ) | (98,650,993 | ) | (33,598,036 | ) | (9,564,705 | ) | (1,009 | ) | – | |||||||||||||
|
|
|
|
|
|
|
|
|
|
|
| |||||||||||||
Total Institutional Class Shares | (95,569,211 | ) | 216,401,131 | (22,817,700 | ) | 5,171,359 | 14,914 | 544,600 | ||||||||||||||||
|
|
|
|
|
|
|
|
|
|
|
| |||||||||||||
Total change in shares: | (112,734,604 | ) | 237,400,048 | (25,833,402 | ) | 4,017,039 | 47,003 | 553,447 | ||||||||||||||||
|
|
|
|
|
|
|
|
|
|
|
| |||||||||||||
| (a) | For the period from March 25, 2013 (commencement of operations) through October 31, 2013. |
Amounts listed as “–” are $0 or round to $0.
See accompanying Notes to Financial Statements.
Annual Report 2014
94
Table of Contents
Statements of Changes in Net Assets (continued)
| Aberdeen Global Equity Fund | Aberdeen Global Natural Resources Fund | Aberdeen Global Small Cap Fund | ||||||||||||||||||||||
| Year Ended October 31, 2014 | Year Ended October 31, 2013 | Year Ended October 31, 2014 | Year Ended October 31, 2013 | Year Ended October 31, 2014 | Year Ended October 31, 2013 | |||||||||||||||||||
FROM INVESTMENT ACTIVITIES: | ||||||||||||||||||||||||
Operations: | ||||||||||||||||||||||||
Net investment income | $ | 5,281,197 | $ | 2,298,104 | $ | 349,251 | $ | 356,997 | $ | 2,533,665 | $ | 1,637,068 | ||||||||||||
Net realized gain from investments and foreign currency transactions | 8,730,584 | 2,741,615 | 858,315 | 1,640,793 | 14,168,207 | 18,734,065 | ||||||||||||||||||
Net change in unrealized appreciation/depreciation on investments and translation of assets and liabilities denominated in foreign currencies | (8,081,696 | ) | 16,378,715 | (2,272,304 | ) | (1,801,741 | ) | (445,478 | ) | (1,112,684 | ) | |||||||||||||
|
|
|
|
|
|
|
|
|
|
|
| |||||||||||||
Changes in net assets resulting from operations | 5,930,085 | 21,418,434 | (1,064,738 | ) | 196,049 | 16,256,394 | 19,258,449 | |||||||||||||||||
|
|
|
|
|
|
|
|
|
|
|
| |||||||||||||
Distributions to Shareholders From: | ||||||||||||||||||||||||
Net investment income: | ||||||||||||||||||||||||
Class A | (2,727,018 | ) | (979,784 | ) | (299,894 | ) | (207,053 | ) | (665,473 | ) | (188,712 | ) | ||||||||||||
Class C | (134,543 | ) | (39,361 | ) | (31,715 | ) | (16,640 | ) | (5,511 | ) | (709 | ) | ||||||||||||
Class R | (70,700 | ) | (27,593 | ) | (48,556 | ) | (30,899 | ) | (9,345 | ) | (1,939 | ) | ||||||||||||
Institutional Service Class | (46 | ) | (17 | ) | (15,060 | ) | (10,586 | ) | (21,925 | ) | (3,023 | ) | ||||||||||||
Institutional Class | (2,598,384 | ) | (957,701 | ) | (38,277 | ) | (43,600 | ) | (2,592,021 | ) | (489,237 | ) | ||||||||||||
Net realized gains: | ||||||||||||||||||||||||
Class A | – | – | – | – | (834,938 | ) | – | |||||||||||||||||
Class C | – | – | – | – | (25,149 | ) | – | |||||||||||||||||
Class R | – | – | – | – | (20,437 | ) | – | |||||||||||||||||
Institutional Service Class | – | – | – | – | (21,216 | ) | – | |||||||||||||||||
Institutional Class | – | – | – | – | (2,375,818 | ) | – | |||||||||||||||||
|
|
|
|
|
|
|
|
|
|
|
| |||||||||||||
Change in net assets from shareholder distributions | (5,530,691 | ) | (2,004,456 | ) | (433,502 | ) | (308,778 | ) | (6,571,833 | ) | (683,620 | ) | ||||||||||||
|
|
|
|
|
|
|
|
|
|
|
| |||||||||||||
Change in net assets from capital transactions | (1,868,165 | ) | 18,177,358 | (8,030,086 | ) | (15,081,451 | ) | (49,512,605 | ) | 194,005,602 | ||||||||||||||
|
|
|
|
|
|
|
|
|
|
|
| |||||||||||||
Change in net assets | (1,468,771 | ) | 37,591,336 | (9,528,326 | ) | (15,194,180 | ) | (39,828,044 | ) | 212,580,431 | ||||||||||||||
|
|
|
|
|
|
|
|
|
|
|
| |||||||||||||
Net Assets: | ||||||||||||||||||||||||
Beginning of year | 159,232,894 | 121,641,558 | 32,705,243 | 47,899,423 | 298,593,053 | 86,012,622 | ||||||||||||||||||
|
|
|
|
|
|
|
|
|
|
|
| |||||||||||||
End of year | $ | 157,764,123 | $ | 159,232,894 | $ | 23,176,917 | $ | 32,705,243 | $ | 258,765,009 | $ | 298,593,053 | ||||||||||||
|
|
|
|
|
|
|
|
|
|
|
| |||||||||||||
Accumulated net investment income/(loss) at end of year | $ | 247,291 | $ | 449,383 | $ | 83,782 | $ | 174,034 | $ | 441,427 | $ | 500,809 | ||||||||||||
|
|
|
|
|
|
|
|
|
|
|
| |||||||||||||
Amounts listed as “–” are $0 or round to $0.
See accompanying Notes to Financial Statements.
2014 Annual Report
95
Table of Contents
Statements of Changes in Net Assets (continued)
| Aberdeen Global Equity Fund | Aberdeen Global Natural Resources Fund | Aberdeen Global Small Cap Fund | ||||||||||||||||||||||
| Year Ended October 31, 2014 | Year Ended October 31, 2013 | Year Ended October 31, 2014 | Year Ended October 31, 2013 | Year Ended October 31, 2014 | Year Ended October 31, 2013 | |||||||||||||||||||
CAPITAL TRANSACTIONS: | ||||||||||||||||||||||||
Class A Shares | ||||||||||||||||||||||||
Proceeds from shares issued | $ | 10,980,438 | $ | 13,426,910 | $ | 2,368,514 | $ | 3,286,264 | $ | 3,357,996 | $ | 45,209,436 | ||||||||||||
Dividends reinvested | 2,647,138 | 937,359 | 245,459 | 167,898 | 1,435,737 | 180,669 | ||||||||||||||||||
Cost of shares redeemed(a) | (24,832,238 | ) | (18,715,827 | ) | (7,980,001 | ) | (10,928,895 | ) | (23,054,155 | ) | (33,274,708 | ) | ||||||||||||
|
|
|
|
|
|
|
|
|
|
|
| |||||||||||||
Total Class A | (11,204,662 | ) | (4,351,558 | ) | (5,366,028 | ) | (7,474,733 | ) | (18,260,422 | ) | 12,115,397 | |||||||||||||
|
|
|
|
|
|
|
|
|
|
|
| |||||||||||||
Class C Shares | ||||||||||||||||||||||||
Proceeds from shares issued | 430,102 | 2,221,481 | 349,086 | 821,888 | 442,184 | 2,254,947 | ||||||||||||||||||
Dividends reinvested | 92,372 | 25,253 | 16,603 | 8,630 | 25,805 | 574 | ||||||||||||||||||
Cost of shares redeemed(a) | (1,631,158 | ) | (890,765 | ) | (1,728,284 | ) | (2,255,624 | ) | (1,099,604 | ) | (670,676 | ) | ||||||||||||
|
|
|
|
|
|
|
|
|
|
|
| |||||||||||||
Total Class C | (1,108,684 | ) | 1,355,969 | (1,362,595 | ) | (1,425,106 | ) | (631,615 | ) | 1,584,845 | ||||||||||||||
|
|
|
|
|
|
|
|
|
|
|
| |||||||||||||
Class R Shares | ||||||||||||||||||||||||
Proceeds from shares issued | 618,551 | 1,216,077 | 1,420,329 | 1,731,608 | 320,172 | 2,078,921 | ||||||||||||||||||
Dividends reinvested | 38,545 | 10,784 | 11,383 | 5,788 | 26,775 | 1,406 | ||||||||||||||||||
Cost of shares redeemed(a) | (990,063 | ) | (1,500,674 | ) | (2,029,119 | ) | (3,050,366 | ) | (1,283,140 | ) | (950,795 | ) | ||||||||||||
|
|
|
|
|
|
|
|
|
|
|
| |||||||||||||
Total Class R | (332,967 | ) | (273,813 | ) | (597,407 | ) | (1,312,970 | ) | (936,193 | ) | 1,129,532 | |||||||||||||
|
|
|
|
|
|
|
|
|
|
|
| |||||||||||||
Institutional Service Class Shares | ||||||||||||||||||||||||
Proceeds from shares issued | 1,000 | – | 2,006 | 6,863 | 1,014,177 | 1,765,934 | ||||||||||||||||||
Dividends reinvested | 46 | 17 | 14,377 | 10,191 | 43,141 | 3,023 | ||||||||||||||||||
Cost of shares redeemed(a) | – | – | (112,955 | ) | (353,904 | ) | (722,941 | ) | (52,009 | ) | ||||||||||||||
|
|
|
|
|
|
|
|
|
|
|
| |||||||||||||
Total Institutional Service Class | 1,046 | 17 | (96,572 | ) | (336,850 | ) | 334,377 | 1,716,948 | ||||||||||||||||
|
|
|
|
|
|
|
|
|
|
|
| |||||||||||||
Institutional Class Shares | ||||||||||||||||||||||||
Proceeds from shares issued | 22,973,717 | 27,535,793 | 985,799 | 934,055 | 33,821,896 | 271,260,592 | ||||||||||||||||||
Dividends reinvested | 2,589,244 | 953,311 | 18,107 | 32,466 | 4,738,277 | 464,209 | ||||||||||||||||||
Cost of shares redeemed(a) | (14,785,859 | ) | (7,042,361 | ) | (1,611,390 | ) | (5,498,313 | ) | (68,578,925 | ) | (94,265,921 | ) | ||||||||||||
|
|
|
|
|
|
|
|
|
|
|
| |||||||||||||
Total Institutional Class | 10,777,102 | 21,446,743 | (607,484 | ) | (4,531,792 | ) | (30,018,752 | ) | 177,458,880 | |||||||||||||||
|
|
|
|
|
|
|
|
|
|
|
| |||||||||||||
Change in net assets from capital transactions: | $ | (1,868,165 | ) | $ | 18,177,358 | $ | (8,030,086 | ) | $ | (15,081,451 | ) | $ | (49,512,605 | ) | $ | 194,005,602 | ||||||||
|
|
|
|
|
|
|
|
|
|
|
| |||||||||||||
| (a) | Includes redemption fees, if any. |
Amounts listed as “–” are $0 or round to $0.
See accompanying Notes to Financial Statements.
Annual Report 2014
96
Table of Contents
Statements of Changes in Net Assets (continued)
| Aberdeen Global Equity Fund | Aberdeen Global Natural Resources Fund | Aberdeen Global Small Cap Fund | ||||||||||||||||||||||
| Year Ended October 31, 2014 | Year Ended October 31, 2013 | Year Ended October 31, 2014 | Year Ended October 31, 2013 | Year Ended October 31, 2014 | Year Ended October 31, 2013 | |||||||||||||||||||
SHARE TRANSACTIONS: | ||||||||||||||||||||||||
Class A Shares | ||||||||||||||||||||||||
Issued | 799,462 | 1,031,376 | 145,015 | 204,819 | 115,345 | 1,643,895 | ||||||||||||||||||
Reinvested | 194,098 | 72,553 | 14,836 | 10,613 | 49,594 | 6,631 | ||||||||||||||||||
Redeemed | (1,759,715 | ) | (1,446,336 | ) | (485,758 | ) | (681,553 | ) | (792,926 | ) | (1,195,543 | ) | ||||||||||||
|
|
|
|
|
|
|
|
|
|
|
| |||||||||||||
Total Class A Shares | (766,155 | ) | (342,407 | ) | (325,907 | ) | (466,121 | ) | (627,987 | ) | 454,983 | |||||||||||||
|
|
|
|
|
|
|
|
|
|
|
| |||||||||||||
Class C Shares | ||||||||||||||||||||||||
Issued | 33,269 | 179,169 | 22,466 | 53,637 | 16,232 | 86,472 | ||||||||||||||||||
Reinvested | 7,140 | 2,057 | 1,046 | 562 | 960 | 23 | ||||||||||||||||||
Redeemed | (124,404 | ) | (72,640 | ) | (111,196 | ) | (147,860 | ) | (39,874 | ) | (25,895 | ) | ||||||||||||
|
|
|
|
|
|
|
|
|
|
|
| |||||||||||||
Total Class C Shares | (83,995 | ) | 108,586 | (87,684 | ) | (93,661 | ) | (22,682 | ) | 60,600 | ||||||||||||||
|
|
|
|
|
|
|
|
|
|
|
| |||||||||||||
Class R Shares | ||||||||||||||||||||||||
Issued | 46,135 | 96,717 | 87,974 | 110,229 | 11,375 | 78,191 | ||||||||||||||||||
Reinvested | 2,928 | 862 | 695 | 370 | 968 | 54 | ||||||||||||||||||
Redeemed | (73,283 | ) | (119,639 | ) | (125,770 | ) | (194,886 | ) | (45,228 | ) | (34,964 | ) | ||||||||||||
|
|
|
|
|
|
|
|
|
|
|
| |||||||||||||
Total Class R Shares | (24,220 | ) | (22,060 | ) | (37,101 | ) | (84,287 | ) | (32,885 | ) | 43,281 | |||||||||||||
|
|
|
|
|
|
|
|
|
|
|
| |||||||||||||
Institutional Service Class Shares | ||||||||||||||||||||||||
Issued | 70 | – | 118 | 422 | 34,587 | 62,743 | ||||||||||||||||||
Reinvested | 3 | 1 | 860 | 639 | 1,485 | 109 | ||||||||||||||||||
Redeemed | – | – | (6,951 | ) | (21,900 | ) | (24,577 | ) | (1,831 | ) | ||||||||||||||
|
|
|
|
|
|
|
|
|
|
|
| |||||||||||||
Total Institutional Service Class Shares | 73 | 1 | (5,973 | ) | (20,839 | ) | 11,495 | 61,021 | ||||||||||||||||
|
|
|
|
|
|
|
|
|
|
|
| |||||||||||||
Institutional Class Shares | ||||||||||||||||||||||||
Issued | 1,610,157 | 2,112,042 | 59,510 | 57,079 | 1,166,694 | 9,822,526 | ||||||||||||||||||
Reinvested | 189,192 | 73,567 | 1,096 | 2,004 | 163,303 | 16,867 | ||||||||||||||||||
Redeemed | (1,038,712 | ) | (539,683 | ) | (95,499 | ) | (336,161 | ) | (2,326,494 | ) | (3,375,220 | ) | ||||||||||||
|
|
|
|
|
|
|
|
|
|
|
| |||||||||||||
Total Institutional Class Shares | 760,637 | 1,645,926 | (34,893 | ) | (277,078 | ) | (996,497 | ) | 6,464,173 | |||||||||||||||
|
|
|
|
|
|
|
|
|
|
|
| |||||||||||||
Total change in shares: | (113,660 | ) | 1,390,046 | (491,558 | ) | (941,986 | ) | (1,668,556 | ) | 7,084,058 | ||||||||||||||
|
|
|
|
|
|
|
|
|
|
|
| |||||||||||||
Amounts listed as “–” are $0 or round to $0.
See accompanying Notes to Financial Statements.
2014 Annual Report
97
Table of Contents
Statements of Changes in Net Assets (continued)
| Aberdeen International Equity Fund | Aberdeen Latin American Equity Fund | Aberdeen Small Cap Fund | ||||||||||||||||||||||
| Year Ended October 31, 2014 | Year Ended October 31, 2013 | Year Ended October 31, 2014 | Period Ended October 31, 2013(a) | Year Ended October 31, 2014 | Year Ended October 31, 2013 | |||||||||||||||||||
FROM INVESTMENT ACTIVITIES: | ||||||||||||||||||||||||
Operations: | ||||||||||||||||||||||||
Net investment income | $ | 34,319,207 | $ | 20,404,557 | $ | 74,817 | $ | 46,422 | $ | (123,224 | ) | $ | 262,690 | |||||||||||
Net realized gain from investments and foreign currency transactions | 48,377,363 | 35,698,938 | (7,907 | ) | (8,655 | ) | 17,469,453 | 26,660,282 | ||||||||||||||||
Net change in unrealized appreciation/depreciation on investments and translation of assets and liabilities denominated in foreign currencies | (75,277,852 | ) | 79,645,916 | (626,352 | ) | (422,173 | ) | (5,313,911 | ) | 17,899,156 | ||||||||||||||
|
|
|
|
|
|
|
|
|
|
|
| |||||||||||||
Changes in net assets resulting from operations | 7,418,718 | 135,749,411 | (559,442 | ) | (384,406 | ) | 12,032,318 | 44,822,128 | ||||||||||||||||
|
|
|
|
|
|
|
|
|
|
|
| |||||||||||||
Distributions to Shareholders From: | ||||||||||||||||||||||||
Net investment income: | ||||||||||||||||||||||||
Class A | (6,710,389 | ) | (3,436,672 | ) | (581 | ) | (72 | ) | – | – | ||||||||||||||
Class C | (1,243,243 | ) | (435,813 | ) | (125 | ) | (18 | ) | – | – | ||||||||||||||
Class R | (609,395 | ) | (207,618 | ) | (109 | ) | (29 | ) | – | – | ||||||||||||||
Institutional Service Class | (7,776,586 | ) | (3,378,869 | ) | (157 | ) | (41 | ) | – | – | ||||||||||||||
Institutional Class | (20,428,050 | ) | (10,389,137 | ) | (77,992 | ) | (20,088 | ) | – | – | ||||||||||||||
Net realized gains: | ||||||||||||||||||||||||
Class A | – | – | (10 | ) | – | – | – | |||||||||||||||||
Class C | – | – | (3 | ) | – | – | – | |||||||||||||||||
Class R | – | – | (3 | ) | – | – | – | |||||||||||||||||
Institutional Service Class | – | – | (3 | ) | – | – | – | |||||||||||||||||
Institutional Class | – | – | (1,629 | ) | – | – | – | |||||||||||||||||
|
|
|
|
|
|
|
|
|
|
|
| |||||||||||||
Change in net assets from shareholder distributions | (36,767,663 | ) | (17,848,109 | ) | (80,612 | ) | (20,248 | ) | – | – | ||||||||||||||
|
|
|
|
|
|
|
|
|
|
|
| |||||||||||||
Change in net assets from capital transactions | (136,126,563 | ) | 15,246,609 | 145,383 | 5,048,954 | (15,114,065 | ) | (47,793,681 | ) | |||||||||||||||
|
|
|
|
|
|
|
|
|
|
|
| |||||||||||||
Change in net assets | (165,475,508 | ) | 133,147,911 | (494,671 | ) | 4,644,300 | (3,081,747 | ) | (2,971,553 | ) | ||||||||||||||
|
|
|
|
|
|
|
|
|
|
|
| |||||||||||||
Net Assets: | ||||||||||||||||||||||||
Beginning of year | 1,047,637,460 | 914,489,549 | 4,644,300 | – | 137,400,274 | 140,371,827 | ||||||||||||||||||
|
|
|
|
|
|
|
|
|
|
|
| |||||||||||||
End of year | $ | 882,161,952 | $ | 1,047,637,460 | $ | 4,149,629 | $ | 4,644,300 | $ | 134,318,527 | $ | 137,400,274 | ||||||||||||
|
|
|
|
|
|
|
|
|
|
|
| |||||||||||||
Accumulated net investment income/(loss) at end of year | $ | 2,005,521 | $ | 4,321,872 | $ | 11,882 | $ | 15,916 | $ | (514,327 | ) | $ | (237,454 | ) | ||||||||||
|
|
|
|
|
|
|
|
|
|
|
| |||||||||||||
| (a) | For the period from March 25, 2013 (commencement of operations) through October 31, 2013. |
Amounts listed as “–” are $0 or round to $0.
See accompanying Notes to Financial Statements.
Annual Report 2014
98
Table of Contents
Statements of Changes in Net Assets (continued)
| Aberdeen International Equity Fund | Aberdeen Latin American Equity Fund | Aberdeen Small Cap Fund | ||||||||||||||||||||||
| Year Ended October 31, 2014 | Year Ended October 31, 2013 | Year Ended October 31, 2014 | Period Ended October 31, 2013(a) | Year Ended October 31, 2014 | Year Ended October 31, 2013 | |||||||||||||||||||
CAPITAL TRANSACTIONS: | ||||||||||||||||||||||||
Class A Shares | ||||||||||||||||||||||||
Proceeds from shares issued | $ | 38,976,545 | $ | 87,658,591 | $ | 42,990 | $ | 28,706 | $ | 10,798,893 | $ | 9,518,949 | ||||||||||||
Dividends reinvested | 5,164,414 | 2,703,363 | 591 | 72 | – | – | ||||||||||||||||||
Cost of shares redeemed(b) | (111,945,534 | ) | (94,124,783 | ) | (8,180 | ) | – | (26,947,757 | ) | (21,775,537 | ) | |||||||||||||
|
|
|
|
|
|
|
|
|
|
|
| |||||||||||||
Total Class A | (67,804,575 | ) | (3,762,829 | ) | 35,401 | 28,778 | (16,148,864 | ) | (12,256,588 | ) | ||||||||||||||
|
|
|
|
|
|
|
|
|
|
|
| |||||||||||||
Class C Shares | ||||||||||||||||||||||||
Proceeds from shares issued | 5,412,036 | 11,604,198 | 19,461 | 10,000 | 1,999,798 | 1,501,616 | ||||||||||||||||||
Dividends reinvested | 733,005 | 266,825 | 128 | 18 | – | – | ||||||||||||||||||
Cost of shares redeemed(b) | (11,975,653 | ) | (9,462,977 | ) | – | – | (5,980,628 | ) | (8,086,938 | ) | ||||||||||||||
|
|
|
|
|
|
|
|
|
|
|
| |||||||||||||
Total Class C | (5,830,612 | ) | 2,408,046 | 19,589 | 10,018 | (3,980,830 | ) | (6,585,322 | ) | |||||||||||||||
|
|
|
|
|
|
|
|
|
|
|
| |||||||||||||
Class R Shares | ||||||||||||||||||||||||
Proceeds from shares issued | 5,443,910 | 9,775,788 | – | 10,000 | 1,661,980 | 2,479,803 | ||||||||||||||||||
Dividends reinvested | 417,212 | 138,887 | 113 | 29 | – | – | ||||||||||||||||||
Cost of shares redeemed(b) | (5,672,725 | ) | (5,953,092 | ) | – | – | (2,138,130 | ) | (3,718,997 | ) | ||||||||||||||
|
|
|
|
|
|
|
|
|
|
|
| |||||||||||||
Total Class R | 188,397 | 3,961,583 | 113 | 10,029 | (476,150 | ) | (1,239,194 | ) | ||||||||||||||||
|
|
|
|
|
|
|
|
|
|
|
| |||||||||||||
Institutional Service Class Shares | ||||||||||||||||||||||||
Proceeds from shares issued | 34,589,305 | 35,867,973 | – | 10,000 | 53,514 | 1,494,835 | ||||||||||||||||||
Dividends reinvested | 7,562,977 | 3,280,108 | 160 | 41 | – | – | ||||||||||||||||||
Cost of shares redeemed(b) | (57,607,741 | ) | (49,735,702 | ) | – | – | (275,763 | ) | (13,650,601 | ) | ||||||||||||||
|
|
|
|
|
|
|
|
|
|
|
| |||||||||||||
Total Institutional Service Class | (15,455,459 | ) | (10,587,621 | ) | 160 | 10,041 | (222,249 | ) | (12,155,766 | ) | ||||||||||||||
|
|
|
|
|
|
|
|
|
|
|
| |||||||||||||
Institutional Class Shares | ||||||||||||||||||||||||
Proceeds from shares issued | 107,856,376 | 186,138,494 | 10,500 | 4,970,000 | 11,907,314 | 8,755,994 | ||||||||||||||||||
Dividends reinvested | 19,711,575 | 10,079,137 | 79,620 | 20,088 | – | – | ||||||||||||||||||
Cost of shares redeemed(b) | (174,792,265 | ) | (172,990,201 | ) | – | – | (6,193,286 | ) | (24,312,805 | ) | ||||||||||||||
|
|
|
|
|
|
|
|
|
|
|
| |||||||||||||
Total Institutional Class | (47,224,314 | ) | 23,227,430 | 90,120 | 4,990,088 | 5,714,028 | (15,556,811 | ) | ||||||||||||||||
|
|
|
|
|
|
|
|
|
|
|
| |||||||||||||
Change in net assets from capital transactions: | $ | (136,126,563 | ) | $ | 15,246,609 | $ | 145,383 | $ | 5,048,954 | $ | (15,114,065 | ) | $ | (47,793,681 | ) | |||||||||
|
|
|
|
|
|
|
|
|
|
|
| |||||||||||||
| (a) | For the period from March 25, 2013 (commencement of operations) through October 31, 2013. |
| (b) | Includes redemption fees, if any. |
Amounts listed as “–” are $0 or round to $0.
See accompanying Notes to Financial Statements.
2014 Annual Report
99
Table of Contents
Statements of Changes in Net Assets (continued)
| Aberdeen International Equity Fund | Aberdeen Latin American Equity Fund | Aberdeen Small Cap Fund | ||||||||||||||||||||||
| Year Ended October 31, 2014 | Year Ended October 31, 2013 | Year Ended October 31, 2014 | Period Ended October 31, 2013(a) | Year Ended October 31, 2014 | Year Ended October 31, 2013 | |||||||||||||||||||
SHARE TRANSACTIONS: | ||||||||||||||||||||||||
Class A Shares | ||||||||||||||||||||||||
Issued | 2,570,144 | 6,051,528 | 5,133 | 2,997 | 476,686 | 510,191 | ||||||||||||||||||
Reinvested | 342,395 | 188,690 | 69 | 8 | – | – | ||||||||||||||||||
Redeemed | (7,438,724 | ) | (6,527,229 | ) | (962 | ) | – | (1,178,468 | ) | (1,190,626 | ) | |||||||||||||
|
|
|
|
|
|
|
|
|
|
|
| |||||||||||||
Total Class A Shares | (4,526,185 | ) | (287,011 | ) | 4,240 | 3,005 | (701,782 | ) | (680,435 | ) | ||||||||||||||
|
|
|
|
|
|
|
|
|
|
|
| |||||||||||||
Class C Shares | ||||||||||||||||||||||||
Issued | 376,112 | 843,066 | 2,160 | 1,000 | 98,547 | 86,665 | ||||||||||||||||||
Reinvested | 51,508 | 19,718 | 15 | 2 | – | – | ||||||||||||||||||
Redeemed | (835,449 | ) | (687,095 | ) | – | – | (292,984 | ) | (499,461 | ) | ||||||||||||||
|
|
|
|
|
|
|
|
|
|
|
| |||||||||||||
Total Class C Shares | (407,829 | ) | 175,689 | 2,175 | 1,002 | (194,437 | ) | (412,796 | ) | |||||||||||||||
|
|
|
|
|
|
|
|
|
|
|
| |||||||||||||
Class R Shares | ||||||||||||||||||||||||
Issued | 372,297 | 708,466 | – | 1,000 | 79,104 | 134,168 | ||||||||||||||||||
Reinvested | 28,872 | 10,116 | 14 | 3 | – | – | ||||||||||||||||||
Redeemed | (386,207 | ) | (427,291 | ) | – | – | (101,176 | ) | (208,171 | ) | ||||||||||||||
|
|
|
|
|
|
|
|
|
|
|
| |||||||||||||
Total Class R Shares | 14,962 | 291,291 | 14 | 1,003 | (22,072 | ) | (74,003 | ) | ||||||||||||||||
|
|
|
|
|
|
|
|
|
|
|
| |||||||||||||
Institutional Service Class Shares | ||||||||||||||||||||||||
Issued | 2,239,070 | 2,485,356 | – | 1,000 | 2,256 | 82,657 | ||||||||||||||||||
Reinvested | 491,085 | 224,291 | 19 | 5 | – | – | ||||||||||||||||||
Redeemed | (3,695,874 | ) | (3,371,504 | ) | – | – | (11,548 | ) | (731,370 | ) | ||||||||||||||
|
|
|
|
|
|
|
|
|
|
|
| |||||||||||||
Total Institutional Service Class Shares | (965,719 | ) | (661,857 | ) | 19 | 1,005 | (9,292 | ) | (648,713 | ) | ||||||||||||||
|
|
|
|
|
|
|
|
|
|
|
| |||||||||||||
Institutional Class Shares | ||||||||||||||||||||||||
Issued | 6,869,145 | 12,600,525 | 1,270 | 497,162 | 496,336 | 455,543 | ||||||||||||||||||
Reinvested | 1,276,474 | 686,863 | 9,326 | 2,257 | – | – | ||||||||||||||||||
Redeemed | (11,125,343 | ) | (11,893,143 | ) | – | – | (260,287 | ) | (1,195,844 | ) | ||||||||||||||
|
|
|
|
|
|
|
|
|
|
|
| |||||||||||||
Total Institutional Class Shares | (2,979,724 | ) | 1,394,245 | 10,596 | 499,419 | 236,049 | (740,301 | ) | ||||||||||||||||
|
|
|
|
|
|
|
|
|
|
|
| |||||||||||||
Total change in shares: | (8,864,495 | ) | 912,357 | 17,044 | 505,434 | (691,534 | ) | (2,556,248 | ) | |||||||||||||||
|
|
|
|
|
|
|
|
|
|
|
| |||||||||||||
| (a) | For the period from March 25, 2013 (commencement of operations) through October 31, 2013. |
| Amounts | listed as “–” are $0 or round to $0. |
See accompanying Notes to Financial Statements.
Annual Report 2014
100
Table of Contents
Statements of Changes in Net Assets (continued)
| Aberdeen U.S. Equity Fund | ||||||||
| Year Ended October 31, 2014 | Year Ended October 31, 2013 | |||||||
FROM INVESTMENT ACTIVITIES: | ||||||||
Operations: | ||||||||
Net investment income | $ | 4,113,884 | $ | 3,851,152 | ||||
Net realized gain from investments and foreign currency transactions | 39,948,927 | 28,626,579 | ||||||
Net change in unrealized appreciation/depreciation on investments and translation of assets and liabilities denominated in foreign currencies | (3,813,816 | ) | 52,759,925 | |||||
|
|
|
| |||||
Changes in net assets resulting from operations | 40,248,995 | 85,237,656 | ||||||
|
|
|
| |||||
Distributions to Shareholders From: | ||||||||
Net investment income: | ||||||||
Class A | (2,839,511 | ) | (2,037,012 | ) | ||||
Class C | (34,084 | ) | (28,839 | ) | ||||
Class R | (3,349 | ) | (2,696 | ) | ||||
Institutional Service Class | (1,471,826 | ) | (1,223,164 | ) | ||||
Institutional Class | (49,723 | ) | (38,320 | ) | ||||
Net realized gains: | ||||||||
Class A | (2,078,777 | ) | – | |||||
Class C | (75,588 | ) | – | |||||
Class R | (3,210 | ) | – | |||||
Institutional Service Class | (906,726 | ) | – | |||||
Institutional Class | (27,677 | ) | – | |||||
|
|
|
| |||||
Change in net assets from shareholder distributions | (7,490,471 | ) | (3,330,031 | ) | ||||
|
|
|
| |||||
Change in net assets from capital transactions | (40,237,320 | ) | 29,707,383 | |||||
|
|
|
| |||||
Change in net assets | (7,478,796 | ) | 111,615,008 | |||||
|
|
|
| |||||
Net Assets: | ||||||||
Beginning of year | 424,879,708 | 313,264,700 | ||||||
|
|
|
| |||||
End of year | $ | 417,400,912 | $ | 424,879,708 | ||||
|
|
|
| |||||
Accumulated net investment income at end of year | $ | 508,816 | $ | 786,249 | ||||
|
|
|
| |||||
Amounts listed as “–” are $0 or round to $0.
See accompanying Notes to Financial Statements.
2014 Annual Report
101
Table of Contents
Statements of Changes in Net Assets (continued)
| Aberdeen U.S. Equity Fund | ||||||||
| Year Ended October 31, 2014 | Year Ended October 31, 2013 | |||||||
CAPITAL TRANSACTIONS: | ||||||||
Class A Shares | ||||||||
Proceeds from shares issued | $ | 4,165,687 | $ | 6,599,247 | ||||
Proceeds of shares issued in connection with fund merger | – | 67,631,922 | ||||||
Dividends reinvested | 4,461,391 | 1,815,113 | ||||||
Cost of shares redeemed(a) | (36,066,289 | ) | (33,331,464 | ) | ||||
|
|
|
| |||||
Total Class A | (27,439,211 | ) | 42,714,818 | |||||
|
|
|
| |||||
Class C Shares | ||||||||
Proceeds from shares issued | 277,456 | 1,036,346 | ||||||
Proceeds of shares issued in connection with fund merger | – | 1,714,810 | ||||||
Dividends reinvested | 57,871 | 12,498 | ||||||
Cost of shares redeemed(a) | (2,180,589 | ) | (2,968,493 | ) | ||||
|
|
|
| |||||
Total Class C | (1,845,262 | ) | (204,839 | ) | ||||
|
|
|
| |||||
Class R Shares | ||||||||
Proceeds from shares issued | 66,151 | 187,787 | ||||||
Dividends reinvested | 137 | 27 | ||||||
Cost of shares redeemed(a) | (153,347 | ) | (282,583 | ) | ||||
|
|
|
| |||||
Total Class R | (87,059 | ) | (94,769 | ) | ||||
|
|
|
| |||||
Institutional Service Class Shares | ||||||||
Proceeds from shares issued | 1,362,395 | 1,900,910 | ||||||
Dividends reinvested | 2,302,572 | 1,175,630 | ||||||
Cost of shares redeemed(a) | (13,827,724 | ) | (16,276,496 | ) | ||||
|
|
|
| |||||
Total Institutional Service Class | (10,162,757 | ) | (13,199,956 | ) | ||||
|
|
|
| |||||
Institutional Class Shares | ||||||||
Proceeds from shares issued | 2,105,844 | 1,987,265 | ||||||
Dividends reinvested | 64,788 | 31,544 | ||||||
Cost of shares redeemed(a) | (2,873,663 | ) | (1,526,680 | ) | ||||
|
|
|
| |||||
Total Institutional Class | (703,031 | ) | 492,129 | |||||
|
|
|
| |||||
Change in net assets from capital transactions: | $ | (40,237,320 | ) | $ | 29,707,383 | |||
|
|
|
| |||||
| (a) | Includes redemption fees, if any. |
Amounts listed as “–” are $0 or round to $0.
See accompanying Notes to Financial Statements.
Annual Report 2014
102
Table of Contents
Statements of Changes in Net Assets (concluded)
| Aberdeen U.S. Equity Fund | ||||||||
| Year Ended October 31, 2014 | Year Ended October 31, 2013 | |||||||
SHARE TRANSACTIONS: | ||||||||
Class A Shares | ||||||||
Issued | 323,263 | 589,004 | ||||||
Issued in connection with fund merger | – | 6,235,828 | ||||||
Reinvested | 349,012 | 162,071 | ||||||
Redeemed | (2,784,392 | ) | (2,989,788 | ) | ||||
|
|
|
| |||||
Total Class A Shares | (2,112,117 | ) | 3,997,115 | |||||
|
|
|
| |||||
Class C Shares | ||||||||
Issued | 23,374 | 100,273 | ||||||
Issued in connection with fund merger | – | 171,858 | ||||||
Reinvested | 4,971 | 1,240 | ||||||
Redeemed | (184,607 | ) | (288,282 | ) | ||||
|
|
|
| |||||
Total Class C Shares | (156,262 | ) | (14,911 | ) | ||||
|
|
|
| |||||
Class R Shares | ||||||||
Issued | 5,355 | 17,442 | ||||||
Reinvested | 11 | 2 | ||||||
Redeemed | (12,026 | ) | (26,925 | ) | ||||
|
|
|
| |||||
Total Class R Shares | (6,660 | ) | (9,481 | ) | ||||
|
|
|
| |||||
Institutional Service Class Shares | ||||||||
Issued | 101,494 | 162,325 | ||||||
Reinvested | 172,508 | 101,665 | ||||||
Redeemed | (1,023,767 | ) | (1,429,336 | ) | ||||
|
|
|
| |||||
Total Institutional Service Class Shares | (749,765 | ) | (1,165,346 | ) | ||||
|
|
|
| |||||
Institutional Class Shares | ||||||||
Issued | 152,613 | 176,313 | ||||||
Reinvested | 4,842 | 2,705 | ||||||
Redeemed | (210,519 | ) | (129,201 | ) | ||||
|
|
|
| |||||
Total Institutional Class Shares | (53,064 | ) | 49,817 | |||||
|
|
|
| |||||
Total change in shares: | (3,077,868 | ) | 2,857,194 | |||||
|
|
|
| |||||
| Amounts | listed as “–” are $0 or round to $0. |
See accompanying Notes to Financial Statements.
2014 Annual Report
103
Table of Contents
Financial Highlights
Selected Data for Each Share of Capital Outstanding Throughout the Periods Indicated
Aberdeen Asia-Pacific (ex-Japan) Equity Fund
| Investment Activities | Distributions | |||||||||||||||||||||||||||||||||||
| Net Asset Value, Beginning of Period | Net Investment Income (a) | Net Realized and Unrealized Gains (Losses) on Investments | Total from Investment Activities | Net Investment Income | Net Realized Gains | Total Distributions | Redemption Fees | Net Asset Value, End of Period | ||||||||||||||||||||||||||||
Class A Shares | ||||||||||||||||||||||||||||||||||||
Year Ended October 31, 2014 | $ | 12.01 | $ | 0.14 | $ | 0.15 | $ | 0.29 | $ | (0.15 | ) | $ | (0.07 | ) | $ | (0.22 | ) | $ | – | $ | 12.08 | |||||||||||||||
Year Ended October 31, 2013 | 11.73 | 0.17 | 0.54 | 0.71 | (0.27 | ) | (0.16 | ) | (0.43 | ) | – | 12.01 | ||||||||||||||||||||||||
Period Ended October 31, 2012(g) | 11.26 | 0.01 | 0.46 | 0.47 | – | – | – | – | 11.73 | |||||||||||||||||||||||||||
Class C Shares | ||||||||||||||||||||||||||||||||||||
Year Ended October 31, 2014 | 12.00 | 0.05 | 0.15 | 0.20 | (0.08 | ) | (0.07 | ) | (0.15 | ) | – | 12.05 | ||||||||||||||||||||||||
Year Ended October 31, 2013 | 11.66 | 0.13 | 0.50 | 0.63 | (0.13 | ) | (0.16 | ) | (0.29 | ) | – | 12.00 | ||||||||||||||||||||||||
Period Ended October 31, 2012(g) | 11.26 | 0.12 | 0.28 | 0.40 | – | – | – | – | 11.66 | |||||||||||||||||||||||||||
Class R Shares | ||||||||||||||||||||||||||||||||||||
Year Ended October 31, 2014 | 12.02 | 0.05 | 0.20 | 0.25 | (0.13 | ) | (0.07 | ) | (0.20 | ) | – | 12.07 | ||||||||||||||||||||||||
Year Ended October 31, 2013 | 11.70 | 0.18 | 0.51 | 0.69 | (0.21 | ) | (0.16 | ) | (0.37 | ) | – | 12.02 | ||||||||||||||||||||||||
Period Ended October 31, 2012(g) | 11.26 | 0.15 | 0.29 | 0.44 | – | – | – | – | 11.70 | |||||||||||||||||||||||||||
Institutional Service Class Shares |
| |||||||||||||||||||||||||||||||||||
Year Ended October 31, 2014 | 12.03 | 0.17 | 0.14 | 0.31 | (0.17 | ) | (0.07 | ) | (0.24 | ) | – | 12.10 | ||||||||||||||||||||||||
Year Ended October 31, 2013 | 11.73 | 0.16 | 0.58 | 0.74 | (0.28 | ) | (0.16 | ) | (0.44 | ) | – | 12.03 | ||||||||||||||||||||||||
Year Ended October 31, 2012 | 11.34 | 0.22 | 0.96 | 1.18 | (0.23 | ) | (0.56 | ) | (0.79 | ) | – | 11.73 | ||||||||||||||||||||||||
Year Ended October 31, 2011 | 11.81 | 0.23 | (0.60 | ) | (0.37 | ) | (0.09 | ) | (0.01 | ) | (0.10 | ) | – | 11.34 | ||||||||||||||||||||||
Period Ended October 31, 2010(h) | 10.00 | 0.21 | 1.60 | 1.81 | – | – | – | – | 11.81 | |||||||||||||||||||||||||||
Institutional Class Shares | ||||||||||||||||||||||||||||||||||||
Year Ended October 31, 2014 | 12.04 | 0.16 | 0.16 | 0.32 | (0.18 | ) | (0.07 | ) | (0.25 | ) | – | 12.11 | ||||||||||||||||||||||||
Year Ended October 31, 2013 | 11.74 | 0.19 | 0.56 | 0.75 | (0.29 | ) | (0.16 | ) | (0.45 | ) | – | 12.04 | ||||||||||||||||||||||||
Year Ended October 31, 2012 | 11.34 | 0.22 | 0.97 | 1.19 | (0.23 | ) | (0.56 | ) | (0.79 | ) | – | 11.74 | ||||||||||||||||||||||||
Year Ended October 31, 2011 | 11.82 | 0.24 | (0.62 | ) | (0.38 | ) | (0.09 | ) | (0.01 | ) | (0.10 | ) | – | 11.34 | ||||||||||||||||||||||
Period Ended October 31, 2010(h) | 10.00 | 0.23 | 1.59 | 1.82 | – | – | – | – | 11.82 | |||||||||||||||||||||||||||
| (a) | Net investment income (loss) is based on average shares outstanding during the period. |
| (b) | Excludes sales charge. |
| (c) | Not annualized for periods less than one year. |
| (d) | Annualized for periods less than one year. |
Amounts listed as “–” are $0 or round to $0.
See accompanying Notes to Financial Statements.
Annual Report 2014
104
Table of Contents
Financial Highlights (continued)
Selected Data for Each Share of Capital Outstanding Throughout the Periods Indicated
Aberdeen Asia-Pacific (ex-Japan) Equity Fund (concluded)
| Ratios/Supplemental Data | ||||||||||||||||||||||
| Total Return (b)(c) | Net Assets at End of Period (000’s) | Ratio of Expenses (d) | Ratio of Net (d) | Ratio of Expenses (d)(e) | Portfolio Turnover (f) | |||||||||||||||||
| 2.43 | % | $ | 1,173 | 1.50 | % | 1.21 | % | 1.52 | % | 36.48 | % | |||||||||||
| 6.12 | % | 1,328 | 1.50 | % | 1.43 | % | 1.51 | % | 3.33 | % | ||||||||||||
| 4.17 | % | 327 | 1.45 | % | 0.19 | % | 1.46 | % | 21.73 | % | ||||||||||||
| 1.67 | % | 288 | 2.25 | % | 0.46 | % | 2.27 | % | 36.48 | % | ||||||||||||
| 5.47 | % | 146 | 2.25 | % | 1.09 | % | 2.26 | % | 3.33 | % | ||||||||||||
| 3.55 | % | 10 | 2.18 | % | 1.56 | % | 2.19 | % | 21.73 | % | ||||||||||||
| 2.06 | % | 11 | 1.76 | % | 0.40 | % | 1.78 | % | 36.48 | % | ||||||||||||
| 5.97 | % | 36 | 1.75 | % | 1.50 | % | 1.76 | % | 3.33 | % | ||||||||||||
| 3.91 | % | 10 | 1.69 | % | 2.05 | % | 1.70 | % | 21.73 | % | ||||||||||||
| 2.59 | % | 3,950 | 1.30 | % | 1.45 | % | 1.32 | % | 36.48 | % | ||||||||||||
| 6.44 | % | 3,841 | 1.28 | % | 1.35 | % | 1.29 | % | 3.33 | % | ||||||||||||
| 11.83 | % | 3,717 | 1.24 | % | 2.00 | % | 1.25 | % | 21.73 | % | ||||||||||||
| (3.20 | %) | 2,584 | 1.23 | % | 1.95 | % | 1.23 | % | 25.31 | % | ||||||||||||
| 18.10 | % | 2,989 | 1.23 | % | 1.94 | % | 1.76 | % | 1.15 | % | ||||||||||||
| 2.64 | % | 1,069,989 | 1.25 | % | 1.32 | % | 1.27 | % | 36.48 | % | ||||||||||||
| 6.48 | % | 1,004,859 | 1.25 | % | 1.59 | % | 1.26 | % | 3.33 | % | ||||||||||||
| 11.92 | % | 617,471 | 1.22 | % | 2.01 | % | 1.23 | % | 21.73 | % | ||||||||||||
| (3.28 | %) | 434,567 | 1.23 | % | 2.04 | % | 1.23 | % | 25.31 | % | ||||||||||||
| 18.20 | % | 351,085 | 1.24 | % | 2.23 | % | 1.30 | % | 1.15 | % | ||||||||||||
| (e) | During the period, certain fees were waived and/or reimbursed. If such waivers/reimbursements had not occurred, the ratios would have been as indicated. |
| (f) | Portfolio turnover is calculated on the basis of the Fund as a whole without distinguishing among the classes of shares. |
| (g) | For the period from February 27, 2012 (commencement of operations) through October 31, 2012. |
| (h) | For the period from November 16, 2009 (commencement of operations) through October 31, 2010. |
2014 Annual Report
105
Table of Contents
Financial Highlights (continued)
Selected Data for Each Share of Capital Outstanding Throughout the Periods Indicated
Aberdeen Asia-Pacific Smaller Companies Fund
| Investment Activities | Distributions | |||||||||||||||||||||||||||||||||||
| Net Asset Value, Beginning of Period | Net Investment Income (a) | Net Realized and Unrealized Gains (Losses) on Investments | Total from Investment Activities | Net Investment Income | Net Realized Gains | Total Distributions | Redemption Fees | Net Asset Value, End of Period | ||||||||||||||||||||||||||||
Class A Shares | ||||||||||||||||||||||||||||||||||||
Year Ended October 31, 2014 | $ | 11.88 | $ | 0.11 | $ | (0.04 | ) | $ | 0.07 | $ | (0.17 | ) | $ | (1.65 | ) | $ | (1.82 | ) | $ | – | $ | 10.13 | ||||||||||||||
Year Ended October 31, 2013 | 11.01 | 0.24 | 1.00 | 1.24 | (0.28 | ) | (0.09 | ) | (0.37 | ) | – | 11.88 | ||||||||||||||||||||||||
Year Ended October 31, 2012 | 8.95 | 0.15 | 1.93 | 2.08 | – | (0.02 | ) | (0.02 | ) | – | 11.01 | |||||||||||||||||||||||||
Period Ended October 31, 2011(g) | 10.00 | 0.01 | (1.06 | ) | (1.05 | ) | – | – | – | – | 8.95 | |||||||||||||||||||||||||
Class C Shares | ||||||||||||||||||||||||||||||||||||
Year Ended October 31, 2014 | 11.76 | 0.05 | (0.05 | ) | – | (0.10 | ) | (1.65 | ) | (1.75 | ) | – | 10.01 | |||||||||||||||||||||||
Year Ended October 31, 2013 | 10.90 | 0.11 | 1.03 | 1.14 | (0.19 | ) | (0.09 | ) | (0.28 | ) | – | 11.76 | ||||||||||||||||||||||||
Year Ended October 31, 2012 | 8.93 | 0.06 | 1.93 | 1.99 | – | (0.02 | ) | (0.02 | ) | – | 10.90 | |||||||||||||||||||||||||
Period Ended October 31, 2011(g) | 10.00 | 0.01 | (1.08 | ) | (1.07 | ) | – | – | – | – | 8.93 | |||||||||||||||||||||||||
Class R Shares | ||||||||||||||||||||||||||||||||||||
Year Ended October 31, 2014 | 11.84 | 0.08 | (0.05 | ) | 0.03 | (0.08 | ) | (1.65 | ) | (1.73 | ) | – | 10.14 | |||||||||||||||||||||||
Year Ended October 31, 2013 | 10.98 | 0.05 | 1.09 | 1.14 | (0.19 | ) | (0.09 | ) | (0.28 | ) | – | 11.84 | ||||||||||||||||||||||||
Year Ended October 31, 2012 | 8.94 | 0.05 | 2.01 | 2.06 | – | (0.02 | ) | (0.02 | ) | – | 10.98 | |||||||||||||||||||||||||
Period Ended October 31, 2011(g) | 10.00 | 0.02 | (1.08 | ) | (1.06 | ) | – | – | – | – | 8.94 | |||||||||||||||||||||||||
Institutional Service Class Shares |
| |||||||||||||||||||||||||||||||||||
Year Ended October 31, 2014 | 12.04 | 0.14 | (0.04 | ) | 0.10 | (0.19 | ) | (1.65 | ) | (1.84 | ) | – | 10.30 | |||||||||||||||||||||||
Year Ended October 31, 2013 | 11.05 | 0.24 | 1.16 | 1.40 | (0.32 | ) | (0.09 | ) | (0.41 | ) | – | 12.04 | ||||||||||||||||||||||||
Year Ended October 31, 2012 | 8.96 | 0.16 | 1.96 | 2.12 | (0.01 | ) | (0.02 | ) | (0.03 | ) | – | 11.05 | ||||||||||||||||||||||||
Period Ended October 31, 2011(g) | 10.00 | 0.04 | (1.08 | ) | (1.04 | ) | – | – | – | – | 8.96 | |||||||||||||||||||||||||
Institutional Class Shares | ||||||||||||||||||||||||||||||||||||
Year Ended October 31, 2014 | 11.91 | 0.13 | (0.03 | ) | 0.10 | (0.19 | ) | (1.65 | ) | (1.84 | ) | – | 10.17 | |||||||||||||||||||||||
Year Ended October 31, 2013 | 11.05 | 0.23 | 1.04 | 1.27 | (0.32 | ) | (0.09 | ) | (0.41 | ) | – | 11.91 | ||||||||||||||||||||||||
Year Ended October 31, 2012 | 8.96 | 0.18 | 1.94 | 2.12 | (0.01 | ) | (0.02 | ) | (0.03 | ) | – | 11.05 | ||||||||||||||||||||||||
Period Ended October 31, 2011(g) | 10.00 | 0.04 | (1.08 | ) | (1.04 | ) | – | – | – | – | 8.96 | |||||||||||||||||||||||||
| (a) | Net investment income (loss) is based on average shares outstanding during the period. |
| (b) | Excludes sales charge. |
| (c) | Not annualized for periods less than one year. |
| (d) | Annualized for periods less than one year. |
Amounts listed as “–” are $0 or round to $0.
See accompanying Notes to Financial Statements.
Annual Report 2014
106
Table of Contents
Financial Highlights (continued)
Selected Data for Each Share of Capital Outstanding Throughout the Periods Indicated
Aberdeen Asia-Pacific Smaller Companies Fund (concluded)
| Ratios/Supplemental Data | ||||||||||||||||||||||
Total Return (b)(c) | Net Assets at End of Period (000’s) | Ratio of Expenses (d) | Ratio of Net (d) | Ratio of Expenses (d)(e) | Portfolio Turnover (f) | |||||||||||||||||
| 1.78 | % | $ | 1,341 | 1.79 | % | 1.12 | % | 2.69 | % | 51.86 | % | |||||||||||
| 11.43 | % | 1,389 | 1.77 | % | 2.08 | % | 2.41 | % | 58.61 | % | ||||||||||||
| 23.41 | % | 173 | 1.95 | % | 1.49 | % | 2.83 | % | 9.52 | % | ||||||||||||
| (10.50 | %) | 123 | 1.95 | % | 0.43 | % | 19.61 | % | 1.68 | % | ||||||||||||
| 1.16 | % | 61 | 2.50 | % | 0.50 | % | 3.39 | % | 51.86 | % | ||||||||||||
| 10.58 | % | 61 | 2.54 | % | 0.96 | % | 3.16 | % | 58.61 | % | ||||||||||||
| 22.38 | %(h) | 11 | 2.70 | % | 0.65 | % | 3.58 | % | 9.52 | % | ||||||||||||
| (10.70 | %) | 9 | 2.70 | % | 0.19 | % | 20.48 | % | 1.68 | % | ||||||||||||
| 1.41 | % | 13 | 2.07 | % | 0.81 | % | 2.96 | % | 51.86 | % | ||||||||||||
| 10.48 | % | 36 | 2.28 | % | 0.45 | % | 2.86 | % | 58.61 | % | ||||||||||||
| 23.16 | % | 67 | 2.39 | % | 0.48 | % | 3.26 | % | 9.52 | % | ||||||||||||
| (10.60 | %) | 9 | 2.20 | % | 0.69 | % | 19.98 | % | 1.68 | % | ||||||||||||
| 2.09 | % | 55 | 1.50 | % | 1.38 | % | 2.39 | % | 51.86 | % | ||||||||||||
| 12.85 | % | 33 | 1.54 | % | 2.00 | % | 2.16 | % | 58.61 | % | ||||||||||||
| 23.77 | %(h) | 13 | 1.70 | % | 1.65 | % | 2.58 | % | 9.52 | % | ||||||||||||
| (10.40 | %) | 9 | 1.70 | % | 1.19 | % | 19.48 | % | 1.68 | % | ||||||||||||
| 2.12 | % | 29,502 | 1.50 | % | 1.23 | % | 2.39 | % | 51.86 | % | ||||||||||||
| 11.63 | % | 25,960 | 1.56 | % | 1.92 | % | 2.16 | % | 58.61 | % | ||||||||||||
| 23.77 | % | 29,292 | 1.70 | % | 1.78 | % | 2.58 | % | 9.52 | % | ||||||||||||
| (10.40 | %) | 1,434 | 1.70 | % | 1.19 | % | 19.48 | % | 1.68 | % | ||||||||||||
| (e) | During the period, certain fees were waived and/or reimbursed. If such waivers/reimbursements had not occurred, the ratios would have been as indicated. |
| (f) | Portfolio turnover is calculated on the basis of the Fund as a whole without distinguishing among the classes of shares. |
| (g) | For the period from June 28, 2011 (commencement of operations) through October 31, 2011. |
| (h) | The total return shown above includes the impact of financial statement rounding of the NAV per share and/or financial statement adjustments. |
2014 Annual Report
107
Table of Contents
Financial Highlights (continued)
Selected Data for Each Share of Capital Outstanding Throughout the Periods Indicated
Aberdeen China Opportunities Fund
| Investment Activities | Distributions | |||||||||||||||||||||||||||||||
| Net Asset Value, Beginning of Period | Net Investment Income (Loss) (a) | Net Realized and Unrealized Gains (Losses) on Investments | Total from Investment Activities | Net Investment Income | Total Distributions | Redemption Fees | Net Asset Value, End of Period | |||||||||||||||||||||||||
Class A Shares | ||||||||||||||||||||||||||||||||
Year Ended October 31, 2014 | $ | 20.54 | $ | 0.16 | $ | (0.33 | ) | $ | (0.17 | ) | $ | (0.18 | ) | $ | (0.18 | ) | $ | – | $ | 20.19 | ||||||||||||
Year Ended October 31, 2013 | 19.64 | 0.15 | 0.82 | 0.97 | (0.08 | ) | (0.08 | ) | 0.01 | 20.54 | ||||||||||||||||||||||
Year Ended October 31, 2012 | 18.81 | 0.35 | 0.88 | 1.23 | (0.41 | ) | (0.41 | ) | 0.01 | 19.64 | ||||||||||||||||||||||
Year Ended October 31, 2011 | 20.66 | 0.21 | (1.91 | ) | (1.70 | ) | (0.16 | ) | (0.16 | ) | 0.01 | 18.81 | ||||||||||||||||||||
Year Ended October 31, 2010 | 16.40 | 0.14 | 4.21 | 4.35 | (0.09 | ) | (0.09 | ) | – | 20.66 | ||||||||||||||||||||||
Class C Shares | ||||||||||||||||||||||||||||||||
Year Ended October 31, 2014 | 19.87 | 0.01 | (0.32 | ) | (0.31 | ) | (0.06 | ) | (0.06 | ) | – | 19.50 | ||||||||||||||||||||
Year Ended October 31, 2013 | 19.09 | (0.01 | ) | 0.81 | 0.80 | (0.02 | ) | (0.02 | ) | – | �� | 19.87 | ||||||||||||||||||||
Year Ended October 31, 2012 | 18.30 | 0.19 | 0.87 | 1.06 | (0.28 | ) | (0.28 | ) | 0.01 | 19.09 | ||||||||||||||||||||||
Year Ended October 31, 2011 | 20.09 | 0.02 | (1.80 | ) | (1.78 | ) | (0.02 | ) | (0.02 | ) | 0.01 | 18.30 | ||||||||||||||||||||
Year Ended October 31, 2010 | 15.97 | 0.01 | 4.11 | 4.12 | – | – | – | 20.09 | ||||||||||||||||||||||||
Class R Shares | ||||||||||||||||||||||||||||||||
Year Ended October 31, 2014 | 20.29 | 0.10 | (0.35 | ) | (0.25 | ) | (0.12 | ) | (0.12 | ) | – | 19.92 | ||||||||||||||||||||
Year Ended October 31, 2013 | 19.43 | 0.10 | 0.79 | 0.89 | (0.03 | ) | (0.03 | ) | – | 20.29 | ||||||||||||||||||||||
Year Ended October 31, 2012 | 18.62 | 0.26 | 0.89 | 1.15 | (0.35 | ) | (0.35 | ) | 0.01 | 19.43 | ||||||||||||||||||||||
Year Ended October 31, 2011 | 20.46 | 0.14 | (1.88 | ) | (1.74 | ) | (0.11 | ) | (0.11 | ) | 0.01 | 18.62 | ||||||||||||||||||||
Year Ended October 31, 2010 | 16.26 | 0.17 | 4.10 | 4.27 | (0.07 | ) | (0.07 | ) | – | 20.46 | ||||||||||||||||||||||
Institutional Service Class Shares |
| |||||||||||||||||||||||||||||||
Year Ended October 31, 2014 | 20.62 | 0.21 | (0.33 | ) | (0.12 | ) | (0.22 | ) | (0.22 | ) | – | 20.28 | ||||||||||||||||||||
Year Ended October 31, 2013 | 19.72 | 0.18 | 0.84 | 1.02 | (0.13 | ) | (0.13 | ) | 0.01 | 20.62 | ||||||||||||||||||||||
Year Ended October 31, 2012 | 18.88 | 0.38 | 0.91 | 1.29 | (0.46 | ) | (0.46 | ) | 0.01 | 19.72 | ||||||||||||||||||||||
Year Ended October 31, 2011 | 20.73 | 0.22 | (1.87 | ) | (1.65 | ) | (0.21 | ) | (0.21 | ) | 0.01 | 18.88 | ||||||||||||||||||||
Year Ended October 31, 2010 | 16.44 | 0.18 | 4.25 | 4.43 | (0.14 | ) | (0.14 | ) | – | 20.73 | ||||||||||||||||||||||
Institutional Class Shares | ||||||||||||||||||||||||||||||||
Year Ended October 31, 2014 | 20.64 | 0.25 | (0.38 | ) | (0.13 | ) | (0.23 | ) | (0.23 | ) | – | 20.28 | ||||||||||||||||||||
Year Ended October 31, 2013 | 19.74 | 0.19 | 0.83 | 1.02 | (0.13 | ) | (0.13 | ) | 0.01 | 20.64 | ||||||||||||||||||||||
Year Ended October 31, 2012 | 18.90 | 0.39 | 0.90 | 1.29 | (0.46 | ) | (0.46 | ) | 0.01 | 19.74 | ||||||||||||||||||||||
Year Ended October 31, 2011 | 20.74 | 0.25 | (1.89 | ) | (1.64 | ) | (0.21 | ) | (0.21 | ) | 0.01 | 18.90 | ||||||||||||||||||||
Year Ended October 31, 2010 | 16.49 | 0.18 | 4.21 | 4.39 | (0.14 | ) | (0.14 | ) | – | 20.74 | ||||||||||||||||||||||
| (a) | Net investment income (loss) is based on average shares outstanding during the period. |
| (b) | Excludes sales charge. |
Amounts listed as “–” are $0 or round to $0.
See accompanying Notes to Financial Statements.
Annual Report 2014
108
Table of Contents
Financial Highlights (continued)
Selected Data for Each Share of Capital Outstanding Throughout the Periods Indicated
Aberdeen China Opportunities Fund (concluded)
| Ratios/Supplemental Data | ||||||||||||||||||||||
Total Return (b) | Net Assets at End of Period (000’s) | Ratio of Expenses to Average Net Assets | Ratio of Net Investment Income (Loss) to Average Net Assets | Ratio of Expenses (c) | Portfolio Turnover (d) | |||||||||||||||||
| (0.82 | %) | $ | 19,425 | 1.89 | % | 0.79 | % | 2.30 | % | 30.61 | % | |||||||||||
| 4.98 | % | 21,682 | 1.89 | % | 0.71 | % | 2.18 | % | 14.51 | % | ||||||||||||
| 6.68 | % | 21,882 | 1.90 | % | 1.81 | % | 2.13 | % | 21.42 | % | ||||||||||||
| (8.20 | %) | 25,086 | 1.89 | % | 1.02 | % | 2.12 | % | 20.44 | % | ||||||||||||
| 26.58 | % | 27,216 | 1.88 | % | 0.77 | % | 2.18 | % | 27.91 | % | ||||||||||||
| (1.57 | %) | 6,064 | 2.62 | % | 0.04 | % | 3.03 | % | 30.61 | % | ||||||||||||
| 4.18 | % | 7,704 | 2.62 | % | (0.06 | %) | 2.91 | % | 14.51 | % | ||||||||||||
| 5.90 | % | 9,164 | 2.62 | % | 1.02 | % | 2.85 | % | 21.42 | % | ||||||||||||
| (8.78 | %) | 9,161 | 2.62 | % | 0.11 | % | 2.84 | % | 20.44 | % | ||||||||||||
| 25.74 | % | 14,438 | 2.62 | % | 0.03 | % | 2.90 | % | 27.91 | % | ||||||||||||
| (1.25 | %) | 1,495 | 2.27 | % | 0.50 | % | 2.68 | % | 30.61 | % | ||||||||||||
| 4.61 | % | 1,599 | 2.25 | % | 0.47 | % | 2.54 | % | 14.51 | % | ||||||||||||
| 6.32 | % | 1,225 | 2.24 | % | 1.36 | % | 2.47 | % | 21.42 | % | ||||||||||||
| (8.44 | %) | 930 | 2.20 | % | 0.71 | % | 2.43 | % | 20.44 | % | ||||||||||||
| 26.30 | % | 578 | 2.12 | % | 0.95 | % | 2.43 | % | 27.91 | % | ||||||||||||
| (0.56 | %) | 1,778 | 1.64 | % | 1.05 | % | 2.05 | % | 30.61 | % | ||||||||||||
| 5.22 | % | 2,383 | 1.62 | % | 0.88 | % | 1.91 | % | 14.51 | % | ||||||||||||
| 6.99 | % | 4,529 | 1.62 | % | 1.99 | % | 1.85 | % | 21.42 | % | ||||||||||||
| (7.92 | %) | 3,498 | 1.62 | % | 1.08 | % | 1.84 | % | 20.44 | % | ||||||||||||
| 27.00 | % | 5,138 | 1.62 | % | 1.03 | % | 1.91 | % | 27.91 | % | ||||||||||||
| (0.65 | %) | 1,604 | 1.62 | % | 1.23 | % | 2.03 | % | 30.61 | % | ||||||||||||
| 5.22 | % | 1,250 | 1.62 | % | 0.90 | % | 1.91 | % | 14.51 | % | ||||||||||||
| 6.99 | % | 1,683 | 1.62 | % | 2.01 | % | 1.85 | % | 21.42 | % | ||||||||||||
| (7.91 | %) | 1,247 | 1.62 | % | 1.20 | % | 1.84 | % | 20.44 | % | ||||||||||||
| 26.73 | % | 1,448 | 1.62 | % | 0.98 | % | 1.87 | % | 27.91 | % | ||||||||||||
| (c) | During the period, certain fees were waived and/or reimbursed. If such waivers/reimbursements had not occurred, the ratios would have been as indicated. |
| (d) | Portfolio turnover is calculated on the basis of the Fund as a whole without distinguishing among the classes of shares. |
2014 Annual Report
109
Table of Contents
Financial Highlights (continued)
Selected Data for Each Share of Capital Outstanding Throughout the Periods Indicated
Aberdeen Emerging Markets Fund
| Investment Activities | Distributions | |||||||||||||||||||||||||||||||||||
| Net Asset Value, Beginning of Period | Net Investment Income (a) | Net Realized and Unrealized Gains (Losses) on Investments | Total from Investment Activities | Net Investment Income | Net Realized Gains | Total Distributions | Redemption Fees | Net Asset Value, End of Period | ||||||||||||||||||||||||||||
Class A Shares | ||||||||||||||||||||||||||||||||||||
Year Ended October 31, 2014 | $ | 15.30 | $ | 0.16 | $ | (0.37 | ) | $ | (0.21 | ) | $ | (0.21 | ) | $ | – | $ | (0.21 | ) | $ | – | $ | 14.88 | ||||||||||||||
Year Ended October 31, 2013 | 15.00 | 0.17 | 0.36 | 0.53 | (0.23 | ) | – | (0.23 | ) | – | 15.30 | |||||||||||||||||||||||||
Period Ended October 31, 2012(g) | 13.07 | 0.09 | 1.84 | 1.93 | – | – | – | – | 15.00 | |||||||||||||||||||||||||||
Class C Shares | ||||||||||||||||||||||||||||||||||||
Year Ended October 31, 2014 | 15.23 | 0.05 | (0.36 | ) | (0.31 | ) | (0.13 | ) | – | (0.13 | ) | – | 14.79 | |||||||||||||||||||||||
Year Ended October 31, 2013 | 14.95 | 0.09 | 0.34 | 0.43 | (0.15 | ) | – | (0.15 | ) | – | 15.23 | |||||||||||||||||||||||||
Period Ended October 31, 2012(g) | 13.07 | 0.05 | 1.83 | 1.88 | – | – | – | – | 14.95 | |||||||||||||||||||||||||||
Class R Shares | ||||||||||||||||||||||||||||||||||||
Year Ended October 31, 2014 | 15.27 | 0.11 | (0.38 | ) | (0.27 | ) | (0.17 | ) | – | (0.17 | ) | – | 14.83 | |||||||||||||||||||||||
Year Ended October 31, 2013 | 14.98 | 0.14 | 0.35 | 0.49 | (0.20 | ) | – | (0.20 | ) | – | 15.27 | |||||||||||||||||||||||||
Period Ended October 31, 2012(g) | 13.07 | 0.08 | 1.83 | 1.91 | – | – | – | – | 14.98 | |||||||||||||||||||||||||||
Institutional Service Class Shares | ||||||||||||||||||||||||||||||||||||
Year Ended October 31, 2014 | 15.30 | 0.13 | (0.33 | ) | (0.20 | ) | (0.21 | ) | – | (0.21 | ) | – | 14.89 | |||||||||||||||||||||||
Year Ended October 31, 2013 | 14.99 | 0.19 | 0.35 | 0.54 | (0.23 | ) | – | (0.23 | ) | – | 15.30 | |||||||||||||||||||||||||
Year Ended October 31, 2012 | 13.68 | 0.18 | 1.40 | 1.58 | (0.15 | ) | (0.12 | ) | (0.27 | ) | – | 14.99 | ||||||||||||||||||||||||
Year Ended October 31, 2011 | 14.29 | 0.22 | (0.70 | ) | (0.48 | ) | (0.13 | ) | – | (0.13 | ) | – | 13.68 | |||||||||||||||||||||||
Period Ended October 31, 2010(h) | 11.65 | 0.08 | 2.78 | 2.86 | (0.22 | ) | – | (0.22 | ) | – | 14.29 | |||||||||||||||||||||||||
Institutional Class Shares | ||||||||||||||||||||||||||||||||||||
Year Ended October 31, 2014 | 15.31 | 0.20 | (0.35 | ) | (0.15 | ) | (0.26 | ) | – | (0.26 | ) | – | 14.90 | |||||||||||||||||||||||
Year Ended October 31, 2013 | 15.02 | 0.22 | 0.36 | 0.58 | (0.29 | ) | – | (0.29 | ) | – | 15.31 | |||||||||||||||||||||||||
Year Ended October 31, 2012 | 13.70 | 0.22 | 1.40 | 1.62 | (0.18 | ) | (0.12 | ) | (0.30 | ) | – | 15.02 | ||||||||||||||||||||||||
Year Ended October 31, 2011 | 14.28 | 0.26 | (0.71 | ) | (0.45 | ) | (0.13 | ) | – | (0.13 | ) | – | 13.70 | |||||||||||||||||||||||
Year Ended October 31, 2010 | 10.92 | 0.21 | 3.37 | 3.58 | (0.22 | ) | – | (0.22 | ) | – | 14.28 | |||||||||||||||||||||||||
| (a) | Net investment income (loss) is based on average shares outstanding during the period. |
| (b) | Excludes sales charge. |
| (c) | Not annualized for periods less than one year. |
| (d) | Annualized for periods less than one year. |
Amounts listed as “–” are $0 or round to $0.
See accompanying Notes to Financial Statements.
Annual Report 2014
110
Table of Contents
Financial Highlights (continued)
Selected Data for Each Share of Capital Outstanding Throughout the Periods Indicated
Aberdeen Emerging Markets Fund (concluded)
| Ratios/Supplemental Data | ||||||||||||||||||||||
Total Return (b)(c) | Net Assets at End of Period (000’s) | Ratio of Expenses (d) | Ratio of Net Investment Income to Average Net Assets (d) | Ratio of Expenses (Prior to Reimbursements) to Average Net Assets (d)(e) | Portfolio Turnover (f) | |||||||||||||||||
| (1.37 | %) | $ | 341,483 | 1.41 | % | 1.05 | % | 1.43 | % | 5.00 | % | |||||||||||
| 3.50 | % | 417,896 | 1.43 | % | 1.13 | % | 1.43 | % | 2.79 | % | ||||||||||||
| 14.77 | % | 274,047 | 1.40 | % | 1.46 | % | 1.40 | % | 1.14 | % | ||||||||||||
| (2.04 | %) | 45,077 | 2.10 | % | 0.36 | % | 2.12 | % | 5.00 | % | ||||||||||||
| 2.85 | % | 49,826 | 2.10 | % | 0.60 | % | 2.10 | % | 2.79 | % | ||||||||||||
| 14.38 | % | 19,328 | 2.09 | % | 0.77 | % | 2.09 | % | 1.14 | % | ||||||||||||
| (1.76 | %) | 31,720 | 1.79 | % | 0.76 | % | 1.81 | % | 5.00 | % | ||||||||||||
| 3.26 | % | 22,968 | 1.74 | % | 0.90 | % | 1.74 | % | 2.79 | % | ||||||||||||
| 14.61 | % | 8,811 | 1.64 | % | 1.19 | % | 1.64 | % | 1.14 | % | ||||||||||||
| (1.29 | %) | 234,846 | 1.34 | % | 0.90 | % | 1.36 | % | 5.00 | % | ||||||||||||
| 3.61 | % | 443,469 | 1.35 | % | 1.22 | % | 1.35 | % | 2.79 | % | ||||||||||||
| 11.94 | % | 298,472 | 1.29 | % | 1.31 | % | 1.29 | % | 1.14 | % | ||||||||||||
| (3.41 | %) | 248,725 | 1.21 | % | 1.55 | % | 1.29 | % | 1.51 | % | ||||||||||||
| 25.04 | % | 145,837 | 0.95 | % | 0.65 | % | 1.04 | % | 1.03 | % | ||||||||||||
| (1.01 | %) | 9,389,216 | 1.10 | % | 1.35 | % | 1.12 | % | 5.00 | % | ||||||||||||
| 3.86 | % | 11,114,896 | 1.10 | % | 1.43 | % | 1.10 | % | 2.79 | % | ||||||||||||
| 12.25 | % | 7,651,960 | 1.05 | % | 1.59 | % | 1.05 | % | 1.14 | % | ||||||||||||
| (3.14 | %) | 4,562,269 | 0.95 | % | 1.87 | % | 1.03 | % | 1.51 | % | ||||||||||||
| 33.20 | % | 2,742,864 | 0.95 | % | 1.70 | % | 1.05 | % | 1.03 | % | ||||||||||||
| (e) | During the period, certain fees were waived and/or reimbursed. If such waivers/reimbursements had not occurred, the ratios would have been as indicated. |
| (f) | Portfolio turnover is calculated on the basis of the Fund as a whole without distinguishing among the classes of shares. |
| (g) | For the period from May 21, 2012 (commencement of operations) through October 31, 2012. |
| (h) | For the period from November 24, 2009 (commencement of operations) through October 31, 2010. |
2014 Annual Report
111
Table of Contents
Financial Highlights (continued)
Selected Data for Each Share of Capital Outstanding Throughout the Periods Indicated
Aberdeen Equity Long-Short Fund
| Investment Activities | Distributions | |||||||||||||||||||||||||||||||
| Net Asset Value, Beginning of Period | Net Investment Income (Loss) (a) | Net Realized and Unrealized Gains on Investments | Total from Investment Activities | Net Realized Gains | Total Distributions | Redemption Fees | Net Asset Value, End of Period | |||||||||||||||||||||||||
Class A Shares | ||||||||||||||||||||||||||||||||
Year Ended October 31, 2014 | $ | 12.12 | $ | (0.13 | ) | $ | 0.48 | $ | 0.35 | $ | (0.21 | ) | $ | (0.21 | ) | $ | – | $ | 12.26 | |||||||||||||
Year Ended October 31, 2013 | 11.29 | (0.14 | ) | 1.10 | 0.96 | (0.13 | ) | (0.13 | ) | – | 12.12 | |||||||||||||||||||||
Year Ended October 31, 2012 | 11.17 | (0.19 | ) | 0.42 | 0.23 | (0.11 | ) | (0.11 | ) | – | 11.29 | |||||||||||||||||||||
Year Ended October 31, 2011 | 11.35 | (0.20 | ) | 0.02 | (0.18 | ) | – | – | – | 11.17 | ||||||||||||||||||||||
Year Ended October 31, 2010 | 10.66 | (0.18 | ) | 0.87 | 0.69 | – | – | – | 11.35 | |||||||||||||||||||||||
Class C Shares | ||||||||||||||||||||||||||||||||
Year Ended October 31, 2014 | 8.45 | (0.15 | ) | 0.34 | 0.19 | (0.21 | ) | (0.21 | ) | – | 8.43 | |||||||||||||||||||||
Year Ended October 31, 2013 | 7.96 | (0.15 | ) | 0.77 | 0.62 | (0.13 | ) | (0.13 | ) | – | 8.45 | |||||||||||||||||||||
Year Ended October 31, 2012 | 7.97 | (0.19 | ) | 0.29 | 0.10 | (0.11 | ) | (0.11 | ) | – | 7.96 | |||||||||||||||||||||
Year Ended October 31, 2011 | 8.16 | (0.20 | ) | 0.01 | (0.19 | ) | – | – | – | 7.97 | ||||||||||||||||||||||
Year Ended October 31, 2010 | 7.71 | (0.19 | ) | 0.64 | 0.45 | – | – | – | 8.16 | |||||||||||||||||||||||
Class R Shares | ||||||||||||||||||||||||||||||||
Year Ended October 31, 2014 | 11.69 | (0.18 | ) | 0.47 | 0.29 | (0.21 | ) | (0.21 | ) | – | 11.77 | |||||||||||||||||||||
Year Ended October 31, 2013 | 10.94 | (0.18 | ) | 1.06 | 0.88 | (0.13 | ) | (0.13 | ) | – | 11.69 | |||||||||||||||||||||
Year Ended October 31, 2012 | 10.88 | (0.23 | ) | 0.40 | 0.17 | (0.11 | ) | (0.11 | ) | – | 10.94 | |||||||||||||||||||||
Year Ended October 31, 2011 | 11.08 | (0.23 | ) | 0.03 | (0.20 | ) | – | – | – | 10.88 | ||||||||||||||||||||||
Year Ended October 31, 2010 | 10.43 | (0.22 | ) | 0.87 | 0.65 | – | – | – | 11.08 | |||||||||||||||||||||||
Institutional Service Class Shares | ||||||||||||||||||||||||||||||||
Year Ended October 31, 2014 | 12.28 | (0.12 | ) | 0.49 | 0.37 | (0.21 | ) | (0.21 | ) | – | 12.44 | |||||||||||||||||||||
Year Ended October 31, 2013 | 11.43 | (0.12 | ) | 1.10 | 0.98 | (0.13 | ) | (0.13 | ) | – | 12.28 | |||||||||||||||||||||
Year Ended October 31, 2012 | 11.30 | (0.18 | ) | 0.42 | 0.24 | (0.11 | ) | (0.11 | ) | – | 11.43 | |||||||||||||||||||||
Year Ended October 31, 2011 | 11.47 | (0.21 | ) | 0.04 | (0.17 | ) | – | – | – | 11.30 | ||||||||||||||||||||||
Period Ended October 31, 2010(i) | 10.79 | (0.10 | ) | 0.78 | 0.68 | – | – | – | 11.47 | |||||||||||||||||||||||
Institutional Class Shares | ||||||||||||||||||||||||||||||||
Year Ended October 31, 2014 | 12.37 | (0.10 | ) | 0.50 | 0.40 | (0.21 | ) | (0.21 | ) | – | 12.56 | |||||||||||||||||||||
Year Ended October 31, 2013 | 11.48 | (0.10 | ) | 1.12 | 1.02 | (0.13 | ) | (0.13 | ) | – | 12.37 | |||||||||||||||||||||
Year Ended October 31, 2012 | 11.33 | (0.16 | ) | 0.42 | 0.26 | (0.11 | ) | (0.11 | ) | – | 11.48 | |||||||||||||||||||||
Year Ended October 31, 2011 | 11.48 | (0.17 | ) | 0.02 | (0.15 | ) | – | – | – | 11.33 | ||||||||||||||||||||||
Year Ended October 31, 2010 | 10.75 | (0.15 | ) | 0.88 | 0.73 | – | – | – | 11.48 | |||||||||||||||||||||||
| (a) | Net investment income (loss) is based on average shares outstanding during the period. |
| (b) | Excludes sales charge. |
| (c) | Not annualized for periods less than one year. |
| (d) | Annualized for periods less than one year. |
Amounts listed as “–” are $0 or round to $0.
See accompanying Notes to Financial Statements.
Annual Report 2014
112
Table of Contents
Financial Highlights (continued)
Selected Data for Each Share of Capital Outstanding Throughout the Periods Indicated
Aberdeen Equity Long-Short Fund (concluded)
| Ratios/Supplemental Data | ||||||||||||||||||||||||||
| Total Return (b)(c) | Net Assets at End of Period (000’s) | Ratio of Expenses to Average Net Assets (d) | Ratio of Net Investment Income (Loss) to Average Net Assets (d) | Ratio of Expenses (Prior to Reimbursements) to Average Net Assets (d)(e) | Dividend Expense (d)(f) | PortfolioTurnover (g) | ||||||||||||||||||||
| 2.90 | % | $ | 30,368 | 2.64 | % | (1.09 | %) | 2.79 | % | 1.08 | %(h) | 31.13 | % | |||||||||||||
| 8.54 | % | 62,819 | 2.62 | % | (1.15 | %) | 2.72 | % | 1.04 | %(h) | 41.95 | % | ||||||||||||||
| 2.10 | % | 70,070 | 2.79 | % | (1.70 | %) | 2.79 | % | 1.10 | %(h) | 47.63 | % | ||||||||||||||
| (1.58 | %) | 93,352 | 2.32 | % | (1.75 | %) | 2.40 | % | 0.63 | % | 62.65 | % | ||||||||||||||
| 6.57 | % | 105,897 | 2.15 | % | (1.61 | %) | 2.15 | % | 0.43 | % | 152.09 | % | ||||||||||||||
| 2.26 | % | 10,162 | 3.36 | % | (1.81 | %) | 3.51 | % | 1.11 | %(h) | 31.13 | % | ||||||||||||||
| 7.83 | % | 12,104 | 3.32 | % | (1.85 | %) | 3.42 | % | 1.05 | %(h) | 41.95 | % | ||||||||||||||
| 1.31 | % | 13,681 | 3.46 | % | (2.36 | %) | 3.46 | % | 1.10 | %(h) | 47.63 | % | ||||||||||||||
| (2.33 | %) | 17,345 | 3.04 | % | (2.47 | %) | 3.13 | % | 0.62 | % | 62.65 | % | ||||||||||||||
| 5.84 | % | 23,685 | 2.88 | % | (2.35 | %) | 2.88 | % | 0.43 | % | 152.09 | % | ||||||||||||||
| 2.49 | % | 3,437 | 3.12 | % | (1.56 | %) | 3.27 | % | 1.12 | %(h) | 31.13 | % | ||||||||||||||
| 8.07 | % | 2,759 | 3.01 | % | (1.55 | %) | 3.12 | % | 1.01 | %(h) | 41.95 | % | ||||||||||||||
| 1.60 | % | 2,118 | 3.22 | % | (2.12 | %) | 3.22 | % | 1.11 | %(h) | 47.63 | % | ||||||||||||||
| (1.81 | %) | 2,245 | 2.61 | % | (2.07 | %) | 2.68 | % | 0.67 | % | 62.65 | % | ||||||||||||||
| 6.23 | % | 1,477 | 2.51 | % | (2.05 | %) | 2.51 | % | 0.51 | % | 152.09 | % | ||||||||||||||
| 3.03 | % | 1,871 | 2.59 | % | (1.02 | %) | 2.75 | % | 1.09 | %(h) | 31.13 | % | ||||||||||||||
| 8.61 | % | 3,551 | 2.47 | % | (1.00 | %) | 2.59 | % | 0.99 | %(h) | 41.95 | % | ||||||||||||||
| 2.17 | % | 1,992 | 2.72 | % | (1.60 | %) | 2.72 | % | 1.11 | %(h) | 47.63 | % | ||||||||||||||
| (1.48 | %) | 8,380 | 2.37 | % | (1.90 | %) | 2.40 | % | 0.77 | % | 62.65 | % | ||||||||||||||
| 6.30 | % | 965 | 2.04 | % | (1.53 | %) | 2.04 | % | 0.43 | % | 152.09 | % | ||||||||||||||
| 3.26 | % | 303,638 | 2.33 | % | (0.78 | %) | 2.49 | % | 1.08 | %(h) | 31.13 | % | ||||||||||||||
| 8.92 | % | 581,327 | 2.29 | % | (0.82 | %) | 2.40 | % | 1.03 | %(h) | 41.95 | % | ||||||||||||||
| 2.34 | % | 480,181 | 2.48 | % | (1.37 | %) | 2.48 | % | 1.11 | %(h) | 47.63 | % | ||||||||||||||
| (1.31 | %) | 382,920 | 2.06 | % | (1.50 | %) | 2.14 | % | 0.64 | % | 62.65 | % | ||||||||||||||
| 6.79 | % | 321,696 | 1.88 | % | (1.36 | %) | 1.88 | % | 0.43 | % | 152.09 | % | ||||||||||||||
| (e) | During the period, certain fees were waived and/or reimbursed. If such waivers/reimbursements had not occurred, the ratios would have been as indicated. |
| (f) | Indicates the dividend expense charged for the period to average net assets. |
| (g) | Portfolio turnover is calculated on the basis of the Fund as a whole without distinguishing among the classes of shares. |
| (h) | Dividend expense ratio includes broker related expenses for securities sold short. |
| (i) | For the period from November 2, 2009 (commencement of operations) through October 31, 2010. |
2014 Annual Report
113
Table of Contents
Financial Highlights (continued)
Selected Data for Each Share of Capital Outstanding Throughout the Periods Indicated
Aberdeen European Equity Fund
| Investment Activities | Distributions | |||||||||||||||||||||||||||||||||||
| Net Asset Value, Beginning of Period | Net Investment Income (a) | Net Realized and Unrealized Gains (Losses) on Investments | Total from Investment Activities | Net Investment Income | Net Realized Gains | Total Distributions | Redemption Fees | Net Asset Value, End of Period | ||||||||||||||||||||||||||||
Class A Shares | ||||||||||||||||||||||||||||||||||||
Year Ended October 31, 2014 | $ | 10.87 | $ | 0.19 | $ | (0.58 | ) | $ | (0.39 | ) | $ | (0.24 | ) | $ | (0.02 | ) | $ | (0.26 | ) | $ | – | $ | 10.22 | |||||||||||||
Period Ended October 31, 2013(g) | 10.00 | 0.08 | 0.91 | 0.99 | (0.12 | ) | – | (0.12 | ) | – | 10.87 | |||||||||||||||||||||||||
Class C Shares | ||||||||||||||||||||||||||||||||||||
Year Ended October 31, 2014 | 10.85 | 0.09 | (0.57 | ) | (0.48 | ) | (0.16 | ) | (0.02 | ) | (0.18 | ) | – | 10.19 | ||||||||||||||||||||||
Period Ended October 31, 2013(g) | 10.00 | 0.08 | 0.87 | 0.95 | (0.10 | ) | – | (0.10 | ) | – | 10.85 | |||||||||||||||||||||||||
Class R Shares | ||||||||||||||||||||||||||||||||||||
Year Ended October 31, 2014 | 10.87 | 0.16 | (0.58 | ) | (0.42 | ) | (0.20 | ) | (0.02 | ) | (0.22 | ) | – | 10.23 | ||||||||||||||||||||||
Period Ended October 31, 2013(g) | 10.00 | 0.12 | 0.86 | 0.98 | (0.11 | ) | – | (0.11 | ) | – | 10.87 | |||||||||||||||||||||||||
Institutional Service Class Shares |
| |||||||||||||||||||||||||||||||||||
Year Ended October 31, 2014 | 10.88 | 0.22 | (0.58 | ) | (0.36 | ) | (0.26 | ) | (0.02 | ) | (0.28 | ) | – | 10.24 | ||||||||||||||||||||||
Period Ended October 31, 2013(g) | 10.00 | 0.15 | 0.86 | 1.01 | (0.13 | ) | – | (0.13 | ) | – | 10.88 | |||||||||||||||||||||||||
Institutional Class Shares | ||||||||||||||||||||||||||||||||||||
Year Ended October 31, 2014 | 10.88 | 0.21 | (0.57 | ) | (0.36 | ) | (0.26 | ) | (0.02 | ) | (0.28 | ) | – | 10.24 | ||||||||||||||||||||||
Period Ended October 31, 2013(g) | 10.00 | 0.15 | 0.86 | 1.01 | (0.13 | ) | – | (0.13 | ) | – | 10.88 | |||||||||||||||||||||||||
| (a) | Net investment income (loss) is based on average shares outstanding during the period. |
| (b) | Excludes sales charge. |
| (c) | Not annualized for periods less than one year. |
| (d) | Annualized for periods less than one year. |
Amounts listed as “–” are $0 or round to $0.
See accompanying Notes to Financial Statements.
Annual Report 2014
114
Table of Contents
Financial Highlights (continued)
Selected Data for Each Share of Capital Outstanding Throughout the Periods Indicated
Aberdeen European Equity Fund (concluded)
| Ratios/Supplemental Data | ||||||||||||||||||||||
| Total Return (b)(c) | Net Assets at End of Period (000’s) | Ratio of Expenses to Average Net Assets (d) | Ratio of Net Investment Income to Average Net Assets (d) | Ratio of Expenses (Prior to Reimbursements) to Average Net Assets (d)(e) | Portfolio Turnover (f) | |||||||||||||||||
| (3.80 | %) | $ | 387 | 1.35 | % | 1.74 | % | 3.43 | % | 7.75 | % | |||||||||||
| 10.00 | % | 63 | 1.35 | % | 1.28 | % | 4.69 | % | 3.35 | %(c) | ||||||||||||
| (4.56 | %)(h) | 10 | 2.10 | % | 0.84 | % | 4.18 | % | 7.75 | % | ||||||||||||
| 9.61 | %(h) | 11 | 2.10 | % | 1.29 | % | 5.43 | % | 3.35 | %(c) | ||||||||||||
| (4.06 | %)(h) | 11 | 1.60 | % | 1.44 | % | 3.68 | % | 7.75 | % | ||||||||||||
| 9.94 | %(h) | 11 | 1.60 | % | 1.92 | % | 4.94 | % | 3.35 | %(c) | ||||||||||||
| (3.54 | %) | 11 | 1.10 | % | 1.94 | % | 3.18 | % | 7.75 | % | ||||||||||||
| 10.16 | % | 11 | 1.10 | % | 2.42 | % | 4.44 | % | 3.35 | %(c) | ||||||||||||
| (3.53 | %) | 5,730 | 1.10 | % | 1.94 | % | 3.18 | % | 7.75 | % | ||||||||||||
| 10.16 | % | 5,926 | 1.10 | % | 2.38 | % | 4.44 | % | 3.35 | %(c) | ||||||||||||
| (e) | During the period, certain fees were waived and/or reimbursed. If such waivers/reimbursements had not occurred, the ratios would have been as indicated. |
| (f) | Portfolio turnover is calculated on the basis of the Fund as a whole without distinguishing among the classes of shares. |
| (g) | For the period from March 25, 2013 (commencement of operations) through October 31, 2013. |
| (h) | The total return shown above includes the impact of financial statement rounding of the NAV per share and/or financial statement adjustments. |
2014 Annual Report
115
Table of Contents
Financial Highlights (continued)
Selected Data for Each Share of Capital Outstanding Throughout the Periods Indicated
Aberdeen Global Equity Fund
| Investment Activities | Distributions | |||||||||||||||||||||||||||||||
| Net Asset Value, Beginning of Period | Net Investment Income (a) | Net Realized and Unrealized Gainson Investments | Total from Investment Activities | Net Investment Income | Total Distributions | Redemption Fees | Net Asset Value, End of Period | |||||||||||||||||||||||||
Class A Shares | ||||||||||||||||||||||||||||||||
Year Ended October 31, 2014 | $ | 13.83 | $ | 0.45 | $ | 0.01 | $ | 0.46 | $ | (0.46 | ) | $ | (0.46 | ) | $ | – | $ | 13.83 | ||||||||||||||
Year Ended October 31, 2013 | 12.01 | 0.18 | 1.80 | 1.98 | (0.16 | ) | (0.16 | ) | – | 13.83 | ||||||||||||||||||||||
Year Ended October 31, 2012 | 11.14 | 0.20 | 0.88 | 1.08 | (0.21 | ) | (0.21 | ) | – | 12.01 | ||||||||||||||||||||||
Year Ended October 31, 2011 | 11.00 | 0.22 | 0.13 | 0.35 | (0.21 | ) | (0.21 | ) | – | 11.14 | ||||||||||||||||||||||
Year Ended October 31, 2010 | 9.82 | 0.16 | 1.19 | 1.35 | (0.17 | ) | (0.17 | ) | – | 11.00 | ||||||||||||||||||||||
Class C Shares | ||||||||||||||||||||||||||||||||
Year Ended October 31, 2014 | 13.15 | 0.33 | 0.03 | 0.36 | (0.38 | ) | (0.38 | ) | – | 13.13 | ||||||||||||||||||||||
Year Ended October 31, 2013 | 11.44 | 0.12 | 1.68 | 1.80 | (0.09 | ) | (0.09 | ) | – | 13.15 | ||||||||||||||||||||||
Year Ended October 31, 2012 | 10.63 | 0.14 | 0.82 | 0.96 | (0.15 | ) | (0.15 | ) | – | 11.44 | ||||||||||||||||||||||
Year Ended October 31, 2011 | 10.50 | 0.13 | 0.13 | 0.26 | (0.13 | ) | (0.13 | ) | – | 10.63 | ||||||||||||||||||||||
Year Ended October 31, 2010 | 9.39 | 0.08 | 1.14 | 1.22 | (0.11 | ) | (0.11 | ) | – | 10.50 | ||||||||||||||||||||||
Class R Shares | ||||||||||||||||||||||||||||||||
Year Ended October 31, 2014 | 13.36 | 0.40 | – | (g) | 0.40 | (0.42 | ) | (0.42 | ) | – | 13.34 | |||||||||||||||||||||
Year Ended October 31, 2013 | 11.61 | 0.16 | 1.73 | 1.89 | (0.14 | ) | (0.14 | ) | – | 13.36 | ||||||||||||||||||||||
Year Ended October 31, 2012 | 10.78 | 0.19 | 0.83 | 1.02 | (0.19 | ) | (0.19 | ) | – | 11.61 | ||||||||||||||||||||||
Year Ended October 31, 2011 | 10.65 | 0.18 | 0.13 | 0.31 | (0.18 | ) | (0.18 | ) | – | 10.78 | ||||||||||||||||||||||
Year Ended October 31, 2010 | 9.51 | 0.14 | 1.16 | 1.30 | (0.16 | ) | (0.16 | ) | – | 10.65 | ||||||||||||||||||||||
Institutional Service Class Shares | ||||||||||||||||||||||||||||||||
Year Ended October 31, 2014 | 13.88 | 0.44 | 0.05 | 0.49 | (0.51 | ) | (0.51 | ) | – | 13.86 | ||||||||||||||||||||||
Year Ended October 31, 2013 | 12.01 | 0.23 | 1.85 | 2.08 | (0.21 | ) | (0.21 | ) | – | 13.88 | ||||||||||||||||||||||
Period Ended October 31, 2012(i)(j) | 10.56 | 0.23 | 1.41 | 1.64 | (0.19 | ) | (0.19 | ) | – | 12.01 | ||||||||||||||||||||||
Institutional Class Shares | ||||||||||||||||||||||||||||||||
Year Ended October 31, 2014 | 13.84 | 0.47 | 0.04 | 0.51 | (0.51 | ) | (0.51 | ) | – | 13.84 | ||||||||||||||||||||||
Year Ended October 31, 2013 | 12.02 | 0.25 | 1.78 | 2.03 | (0.21 | ) | (0.21 | ) | – | 13.84 | ||||||||||||||||||||||
Year Ended October 31, 2012 | 11.15 | 0.23 | 0.89 | 1.12 | (0.25 | ) | (0.25 | ) | – | 12.02 | ||||||||||||||||||||||
Year Ended October 31, 2011 | 11.01 | 0.26 | 0.12 | 0.38 | (0.24 | ) | (0.24 | ) | – | 11.15 | ||||||||||||||||||||||
Year Ended October 31, 2010 | 9.82 | 0.13 | 1.26 | 1.39 | (0.20 | ) | (0.20 | ) | – | 11.01 | ||||||||||||||||||||||
| (a) | Net investment income (loss) is based on average shares outstanding during the period. |
| (b) | Excludes sales charge. |
| (c) | Not annualized for periods less than one year. |
| (d) | Annualized for periods less than one year. |
Amounts listed as “–” are $0 or round to $0.
See accompanying Notes to Financial Statements.
Annual Report 2014
116
Table of Contents
Financial Highlights (continued)
Selected Data for Each Share of Capital Outstanding Throughout the Periods Indicated
Aberdeen Global Equity Fund (concluded)
| Ratios/Supplemental Data | ||||||||||||||||||||||
| Total Return (b)(c) | Net Assets at End of Period (000’s) | Ratio of Expenses to Average Net Assets (d) | Ratio of Net Investment Income to Average Net Assets (d) | Ratio of Expenses (Prior to Reimbursements) to Average Net Assets (d)(e) | Portfolio Turnover (f) | |||||||||||||||||
| 3.37 | % | $ | 73,230 | 1.56 | % | 3.22 | % | 1.56 | % | 24.09 | % | |||||||||||
| 16.59 | % | 83,800 | 1.57 | % | 1.42 | % | 1.57 | % | 12.87 | % | ||||||||||||
| 9.86 | % | 76,894 | 1.49 | % | 1.73 | % | 1.68 | % | 24.83 | % | ||||||||||||
| 3.12 | % | 25,480 | 1.61 | % | 1.89 | % | 1.83 | % | 25.44 | % | ||||||||||||
| 13.97 | % | 27,691 | 1.61 | % | 1.56 | % | 1.96 | % | 23.44 | % | ||||||||||||
| 2.78 | % | 4,165 | 2.19 | % | 2.50 | % | 2.19 | % | 24.09 | % | ||||||||||||
| 15.83 | % | 5,278 | 2.19 | % | 0.96 | % | 2.19 | % | 12.87 | % | ||||||||||||
| 9.11 | % | 3,348 | 2.20 | % | 1.28 | % | 2.39 | % | 24.83 | % | ||||||||||||
| 2.43 | % | 2,437 | 2.32 | % | 1.18 | % | 2.54 | % | 25.44 | % | ||||||||||||
| 13.17 | % | 3,017 | 2.32 | % | 0.85 | % | 2.67 | % | 23.44 | % | ||||||||||||
| 3.06 | % | 1,986 | 1.85 | % | 2.96 | % | 1.85 | % | 24.09 | % | ||||||||||||
| 16.35 | % | 2,312 | 1.76 | % | 1.26 | % | 1.76 | % | 12.87 | % | ||||||||||||
| 9.61 | % | 2,265 | 1.71 | % | 1.70 | % | 1.90 | % | 24.83 | % | ||||||||||||
| 2.85 | % | 595 | 1.82 | % | 1.59 | % | 2.04 | % | 25.44 | % | ||||||||||||
| 13.82 | % | 838 | 1.82 | % | 1.46 | % | 2.18 | % | 23.44 | % | ||||||||||||
| 3.62 | %(h) | 2 | 1.19 | % | 3.12 | % | 1.19 | % | 24.09 | % | ||||||||||||
| 17.44 | %(h) | 1 | 1.19 | % | 1.80 | % | 1.20 | % | 12.87 | % | ||||||||||||
| 15.65 | %(h) | 1 | 1.19 | % | 2.28 | % | 1.39 | % | 24.83 | % | ||||||||||||
| 3.77 | %(h) | 78,381 | 1.19 | % | 3.36 | % | 1.19 | % | 24.09 | % | ||||||||||||
| 17.01 | %(h) | 67,843 | 1.19 | % | 1.89 | % | 1.19 | % | 12.87 | % | ||||||||||||
| 10.16 | % | 39,134 | 1.20 | % | 1.95 | % | 1.39 | % | 24.83 | % | ||||||||||||
| 3.40 | % | 10,491 | 1.32 | % | 2.29 | % | 1.54 | % | 25.44 | % | ||||||||||||
| 14.35 | % | 3,925 | 1.32 | % | 1.30 | % | 1.69 | % | 23.44 | % | ||||||||||||
| (e) | During the period, certain fees were waived and/or reimbursed. If such waivers/reimbursements had not occurred, the ratios would have been as indicated. |
| (f) | Portfolio turnover is calculated on the basis of the Fund as a whole without distinguishing among the classes of shares. |
| (g) | Less than $0.005 per share. |
| (h) | The total return shown above includes the impact of financial statement rounding of the NAV per share and/or financial statement adjustments. |
| (i) | For the period from December 19, 2011 (commencement of operations) through October 31, 2012. |
| (j) | There were no shareholders in the class for the period from April 23, 2009 through December 18, 2011. The financial highlights information presented is for two separate periods of time when shareholders were invested in the class. See Note 6 for Financial Highlight information prior to year ended October 31, 2009. |
2014 Annual Report
117
Table of Contents
Financial Highlights (continued)
Selected Data for Each Share of Capital Outstanding Throughout the Periods Indicated
Aberdeen Global Natural Resources Fund
| Investment Activities | Distributions | |||||||||||||||||||||||||||||||
| Net Asset Value, Beginning of Period | Net Investment Income (Loss) (a) | Net Realized and Unrealized Gains (Losses) on Investments | Total from Investment Activities | Net Investment Income | Total Distributions | Redemption Fees | Net Asset Value, End of Period | |||||||||||||||||||||||||
Class A Shares | ||||||||||||||||||||||||||||||||
Year Ended October 31, 2014 | $ | 16.37 | $ | 0.22 | $ | (0.98 | ) | $ | (0.76 | ) | $ | (0.26 | ) | $ | (0.26 | ) | $ | – | $ | 15.35 | ||||||||||||
Year Ended October 31, 2013 | 16.30 | 0.16 | 0.04 | 0.20 | (0.13 | ) | (0.13 | ) | – | 16.37 | ||||||||||||||||||||||
Year Ended October 31, 2012 | 16.23 | 0.17 | 0.07 | 0.24 | (0.17 | ) | (0.17 | ) | – | 16.30 | ||||||||||||||||||||||
Year Ended October 31, 2011 | 16.60 | 0.17 | (0.41 | ) | (0.24 | ) | (0.13 | ) | (0.13 | ) | – | 16.23 | ||||||||||||||||||||
Year Ended October 31, 2010 | 15.02 | (0.01 | ) | 1.59 | 1.58 | – | – | – | 16.60 | |||||||||||||||||||||||
Class C Shares | ||||||||||||||||||||||||||||||||
Year Ended October 31, 2014 | 15.56 | 0.10 | (0.93 | ) | (0.83 | ) | (0.14 | ) | (0.14 | ) | – | 14.59 | ||||||||||||||||||||
Year Ended October 31, 2013 | 15.52 | 0.05 | 0.04 | 0.09 | (0.05 | ) | (0.05 | ) | – | 15.56 | ||||||||||||||||||||||
Year Ended October 31, 2012 | 15.50 | 0.05 | 0.08 | 0.13 | (0.11 | ) | (0.11 | ) | – | 15.52 | ||||||||||||||||||||||
Year Ended October 31, 2011 | 15.86 | 0.04 | (0.38 | ) | (0.34 | ) | (0.02 | ) | (0.02 | ) | – | 15.50 | ||||||||||||||||||||
Year Ended October 31, 2010 | 14.44 | (0.10 | ) | 1.52 | 1.42 | – | – | – | 15.86 | |||||||||||||||||||||||
Class R Shares | ||||||||||||||||||||||||||||||||
Year Ended October 31, 2014 | 16.11 | 0.18 | (0.96 | ) | (0.78 | ) | (0.22 | ) | (0.22 | ) | – | 15.11 | ||||||||||||||||||||
Year Ended October 31, 2013 | 16.05 | 0.13 | 0.04 | 0.17 | (0.11 | ) | (0.11 | ) | – | 16.11 | ||||||||||||||||||||||
Year Ended October 31, 2012 | 15.99 | 0.14 | 0.07 | 0.21 | (0.15 | ) | (0.15 | ) | – | 16.05 | ||||||||||||||||||||||
Year Ended October 31, 2011 | 16.36 | 0.13 | (0.40 | ) | (0.27 | ) | (0.10 | ) | (0.10 | ) | – | 15.99 | ||||||||||||||||||||
Year Ended October 31, 2010 | 14.82 | (0.03 | ) | 1.57 | 1.54 | – | – | – | 16.36 | |||||||||||||||||||||||
Institutional Service Class Shares | ||||||||||||||||||||||||||||||||
Year Ended October 31, 2014 | 16.60 | 0.28 | (1.01 | ) | (0.73 | ) | (0.32 | ) | (0.32 | ) | – | 15.55 | ||||||||||||||||||||
Year Ended October 31, 2013 | 16.51 | 0.21 | 0.06 | 0.27 | (0.18 | ) | (0.18 | ) | – | 16.60 | ||||||||||||||||||||||
Year Ended October 31, 2012 | 16.43 | 0.22 | 0.08 | 0.30 | (0.22 | ) | (0.22 | ) | – | 16.51 | ||||||||||||||||||||||
Year Ended October 31, 2011 | 16.81 | 0.19 | (0.38 | ) | (0.19 | ) | (0.19 | ) | (0.19 | ) | – | 16.43 | ||||||||||||||||||||
Year Ended October 31, 2010 | 15.15 | 0.05 | 1.61 | 1.66 | – | – | – | 16.81 | ||||||||||||||||||||||||
Institutional Class Shares | ||||||||||||||||||||||||||||||||
Year Ended October 31, 2014 | 16.61 | 0.26 | (0.99 | ) | (0.73 | ) | (0.32 | ) | (0.32 | ) | – | 15.56 | ||||||||||||||||||||
Year Ended October 31, 2013 | 16.54 | 0.18 | 0.07 | 0.25 | (0.18 | ) | (0.18 | ) | – | 16.61 | ||||||||||||||||||||||
Year Ended October 31, 2012 | 16.47 | 0.21 | 0.08 | 0.29 | (0.22 | ) | (0.22 | ) | – | 16.54 | ||||||||||||||||||||||
Year Ended October 31, 2011 | 16.85 | 0.23 | (0.42 | ) | (0.19 | ) | (0.19 | ) | (0.19 | ) | – | 16.47 | ||||||||||||||||||||
Year Ended October 31, 2010 | 15.19 | 0.05 | 1.61 | 1.66 | – | – | – | 16.85 | ||||||||||||||||||||||||
| (a) | Net investment income (loss) is based on average shares outstanding during the period. |
| (b) | Excludes sales charge. |
Amounts listed as “–” are $0 or round to $0.
See accompanying Notes to Financial Statements.
Annual Report 2014
118
Table of Contents
Financial Highlights (continued)
Selected Data for Each Share of Capital Outstanding Throughout the Periods Indicated
Aberdeen Global Natural Resources Fund (concluded)
| Ratios/Supplemental Data | ||||||||||||||||||||||
| Total Return (b) | Net Assets at End of Period (000’s) | Ratio of Expenses to Average Net Assets | Ratio of Net Investment Income (Loss) to Average Net Assets | Ratio of Expenses (Prior to Reimbursements) to Average Net Assets (c) | PortfolioTurnover (d) | |||||||||||||||||
| (4.75 | %) | $ | 15,053 | 1.48 | % | 1.30 | % | 1.84 | % | 2.02 | % | |||||||||||
| 1.28 | % | 21,396 | 1.49 | % | 1.00 | % | 1.64 | % | 12.50 | % | ||||||||||||
| 1.54 | % | 28,898 | 1.48 | % | 1.06 | % | 1.51 | % | 7.98 | % | ||||||||||||
| (1.45 | %) | 34,936 | 1.45 | % | 0.96 | % | 1.49 | % | 6.30 | % | ||||||||||||
| 10.52 | % | 52,490 | 1.42 | % | (0.05 | %) | 1.42 | % | 105.24 | % | ||||||||||||
| (5.39 | %) | 2,793 | 2.16 | % | 0.62 | % | 2.52 | % | 2.02 | % | ||||||||||||
| 0.58 | % | 4,345 | 2.16 | % | 0.32 | % | 2.31 | % | 12.50 | % | ||||||||||||
| 0.86 | % | 5,786 | 2.16 | % | 0.35 | % | 2.19 | % | 7.98 | % | ||||||||||||
| (2.17 | %) | 8,353 | 2.13 | % | 0.24 | % | 2.16 | % | 6.30 | % | ||||||||||||
| 9.83 | % | 14,501 | 2.08 | % | (0.69 | %) | 2.08 | % | 105.24 | % | ||||||||||||
| (4.94 | %) | 3,134 | 1.70 | % | 1.09 | % | 2.06 | % | 2.02 | % | ||||||||||||
| 1.06 | % | 3,942 | 1.70 | % | 0.80 | % | 1.85 | % | 12.50 | % | ||||||||||||
| 1.34 | % | 5,279 | 1.69 | % | 0.90 | % | 1.72 | % | 7.98 | % | ||||||||||||
| (1.69 | %) | 5,677 | 1.67 | % | 0.73 | % | 1.71 | % | 6.30 | % | ||||||||||||
| 10.39 | % | 8,841 | 1.60 | % | (0.20 | %) | 1.60 | % | 105.24 | % | ||||||||||||
| (4.52 | %) | 672 | 1.16 | % | 1.66 | % | 1.53 | % | 2.02 | % | ||||||||||||
| 1.67 | % | 816 | 1.16 | % | 1.31 | % | 1.31 | % | 12.50 | % | ||||||||||||
| 1.90 | % | 1,156 | 1.17 | % | 1.33 | % | 1.20 | % | 7.98 | % | ||||||||||||
| (1.18 | %) | 1,564 | 1.12 | % | 1.09 | % | 1.16 | % | 6.30 | % | ||||||||||||
| 10.96 | % | 3,271 | 1.08 | % | 0.30 | % | 1.08 | % | 105.24 | % | ||||||||||||
| (4.52 | %) | 1,524 | 1.16 | % | 1.54 | % | 1.52 | % | 2.02 | % | ||||||||||||
| 1.55 | % | 2,206 | 1.16 | % | 1.10 | % | 1.31 | % | 12.50 | % | ||||||||||||
| 1.85 | % | 6,781 | 1.16 | % | 1.31 | % | 1.19 | % | 7.98 | % | ||||||||||||
| (1.17 | %) | 9,968 | 1.12 | % | 1.32 | % | 1.16 | % | 6.30 | % | ||||||||||||
| 10.93 | % | 12,686 | 1.08 | % | 0.33 | % | 1.08 | % | 105.24 | % | ||||||||||||
| (c) | During the period, certain fees were waived and/or reimbursed. If such waivers/reimbursements had not occurred, the ratios would have been as indicated. |
| (d) | Portfolio turnover is calculated on the basis of the Fund as a whole without distinguishing among the classes of shares. |
2014 Annual Report
119
Table of Contents
Financial Highlights (continued)
Selected Data for Each Share of Capital Outstanding Throughout the Periods Indicated
Aberdeen Global Small Cap Fund
| Investment Activities | Distributions | |||||||||||||||||||||||||||||||||||
| Net Asset Value, Beginning of Period | Net Investment Income (Loss) (a) | Net Realized and Unrealized Gains (Losses) on Investments | Total from Investment Activities | Net Investment Income | Net Realized Gains | Total Distributions | Redemption Fees | Net Asset Value, End of Period | ||||||||||||||||||||||||||||
Class A Shares | ||||||||||||||||||||||||||||||||||||
Year Ended October 31, 2014 | $ | 28.71 | $ | 0.19 | $ | 1.32 | $ | 1.51 | $ | (0.27 | ) | $ | (0.31 | ) | $ | (0.58 | ) | $ | – | $ | 29.64 | |||||||||||||||
Year Ended October 31, 2013 | 25.95 | 0.17 | 2.65 | 2.82 | (0.07 | ) | – | (0.07 | ) | 0.01 | 28.71 | |||||||||||||||||||||||||
Year Ended October 31, 2012 | 21.68 | 0.14 | 4.48 | 4.62 | (0.35 | ) | – | (0.35 | ) | – | 25.95 | |||||||||||||||||||||||||
Year Ended October 31, 2011 | 21.67 | 0.31 | (0.14 | ) | 0.17 | (0.16 | ) | – | (0.16 | ) | – | 21.68 | ||||||||||||||||||||||||
Year Ended October 31, 2010 | 15.73 | 0.16 | 5.78 | 5.94 | – | – | – | – | 21.67 | |||||||||||||||||||||||||||
Class C Shares | ||||||||||||||||||||||||||||||||||||
Year Ended October 31, 2014 | 26.97 | (0.01 | ) | 1.24 | 1.23 | (0.08 | ) | (0.31 | ) | (0.39 | ) | – | 27.81 | |||||||||||||||||||||||
Year Ended October 31, 2013 | 24.50 | 0.02 | 2.46 | 2.48 | (0.02 | ) | – | (0.02 | ) | 0.01 | 26.97 | |||||||||||||||||||||||||
Year Ended October 31, 2012 | 20.46 | (0.04 | ) | 4.27 | 4.23 | (0.19 | ) | – | (0.19 | ) | – | 24.50 | ||||||||||||||||||||||||
Year Ended October 31, 2011 | 20.47 | 0.17 | (0.16 | ) | 0.01 | (0.02 | ) | – | (0.02 | ) | – | 20.46 | ||||||||||||||||||||||||
Year Ended October 31, 2010 | 14.97 | 0.02 | 5.48 | 5.50 | – | – | – | – | 20.47 | |||||||||||||||||||||||||||
Class R Shares | ||||||||||||||||||||||||||||||||||||
Year Ended October 31, 2014 | 27.68 | 0.09 | 1.30 | 1.39 | (0.19 | ) | (0.31 | ) | (0.50 | ) | – | 28.57 | ||||||||||||||||||||||||
Year Ended October 31, 2013 | 25.06 | 0.15 | 2.51 | 2.66 | (0.05 | ) | – | (0.05 | ) | 0.01 | 27.68 | |||||||||||||||||||||||||
Year Ended October 31, 2012 | 20.95 | 0.06 | 4.34 | 4.40 | (0.29 | ) | – | (0.29 | ) | – | 25.06 | |||||||||||||||||||||||||
Year Ended October 31, 2011 | 20.98 | 0.24 | (0.13 | ) | 0.11 | (0.14 | ) | – | (0.14 | ) | – | 20.95 | ||||||||||||||||||||||||
Year Ended October 31, 2010 | 15.26 | 0.09 | 5.63 | 5.72 | – | – | – | – | 20.98 | |||||||||||||||||||||||||||
Institutional Service Class Shares | ||||||||||||||||||||||||||||||||||||
Year Ended October 31, 2014 | 28.72 | 0.23 | 1.31 | 1.54 | (0.31 | ) | (0.31 | ) | (0.62 | ) | – | 29.64 | ||||||||||||||||||||||||
Year Ended October 31, 2013 | 25.95 | 0.31 | 2.56 | 2.87 | (0.11 | ) | – | (0.11 | ) | 0.01 | 28.72 | |||||||||||||||||||||||||
Year Ended October 31, 2012 | 21.74 | 0.16 | 4.47 | 4.63 | (0.42 | ) | – | (0.42 | ) | – | 25.95 | |||||||||||||||||||||||||
Year Ended October 31, 2011 | 21.60 | 0.24 | 0.11 | 0.35 | (0.21 | ) | – | (0.21 | ) | – | 21.74 | |||||||||||||||||||||||||
Year Ended October 31, 2010 | 15.74 | 0.20 | 5.66 | 5.86 | – | – | – | – | 21.60 | |||||||||||||||||||||||||||
Institutional Class Shares | ||||||||||||||||||||||||||||||||||||
Year Ended October 31, 2014 | 28.74 | 0.29 | 1.32 | 1.61 | (0.38 | ) | (0.31 | ) | (0.69 | ) | – | 29.66 | ||||||||||||||||||||||||
Year Ended October 31, 2013 | 25.98 | 0.25 | 2.66 | 2.91 | (0.16 | ) | – | (0.16 | ) | 0.01 | 28.74 | |||||||||||||||||||||||||
Year Ended October 31, 2012 | 21.72 | 0.20 | 4.48 | 4.68 | (0.42 | ) | – | (0.42 | ) | – | 25.98 | |||||||||||||||||||||||||
Year Ended October 31, 2011 | 21.69 | 0.38 | (0.14 | ) | 0.24 | (0.21 | ) | – | (0.21 | ) | – | 21.72 | ||||||||||||||||||||||||
Year Ended October 31, 2010 | 15.75 | 0.21 | 5.73 | 5.94 | – | – | – | – | 21.69 | |||||||||||||||||||||||||||
| (a) | Net investment income (loss) is based on average shares outstanding during the period. |
| (b) | Excludes sales charge. |
Amounts listed as “–” are $0 or round to $0.
See accompanying Notes to Financial Statements.
Annual Report 2014
120
Table of Contents
Financial Highlights (continued)
Selected Data for Each Share of Capital Outstanding Throughout the Periods Indicated
Aberdeen Global Small Cap Fund (concluded)
| Ratios/Supplemental Data | ||||||||||||||||||||||
Total Return (b) | Net Assets at End of Period (000’s) | Ratio of Expenses to Average Net Assets | Ratio of Net Investment Income (Loss) to Average Net Assets | Ratio of Expenses (Prior to Reimbursements) to Average Net Assets (c) | Portfolio Turnover (d) | |||||||||||||||||
| 5.32 | % | $ | 64,189 | 1.60 | % | 0.65 | % | 1.73 | % | 12.93 | % | |||||||||||
| 10.91 | % | 80,191 | 1.61 | % | 0.63 | % | 1.76 | % | 34.85 | % | ||||||||||||
| 21.77 | % | 60,672 | 1.59 | % | 0.62 | % | 2.04 | % | 22.21 | % | ||||||||||||
| 0.76 | % | 50,797 | 1.56 | % | 1.38 | % | 2.04 | % | 21.77 | % | ||||||||||||
| 37.76 | % | 55,746 | 1.55 | % | 0.88 | % | 2.35 | % | 36.05 | % | ||||||||||||
| 4.60 | % | 1,646 | 2.30 | % | (0.03 | %) | 2.43 | % | 12.93 | % | ||||||||||||
| 10.17 | % | 2,208 | 2.30 | % | 0.08 | % | 2.45 | % | 34.85 | % | ||||||||||||
| 20.92 | % | 521 | 2.30 | % | (0.17 | %) | 2.75 | % | 22.21 | % | ||||||||||||
| 0.04 | % | 240 | 2.30 | % | 0.79 | % | 2.74 | % | 21.77 | % | ||||||||||||
| 36.74 | % | 171 | 2.30 | % | 0.13 | % | 3.09 | % | 36.05 | % | ||||||||||||
| 5.07 | % | 866 | 1.86 | % | 0.32 | % | 1.99 | % | 12.93 | % | ||||||||||||
| 10.67 | % | 1,749 | 1.82 | % | 0.55 | % | 1.97 | % | 34.85 | % | ||||||||||||
| 21.44 | % | 499 | 1.86 | % | 0.25 | % | 2.31 | % | 22.21 | % | ||||||||||||
| 0.53 | % | 184 | 1.85 | % | 1.09 | % | 2.34 | % | 21.77 | % | ||||||||||||
| 37.48 | % | 153 | 1.80 | % | 0.50 | % | 2.60 | % | 36.05 | % | ||||||||||||
| 5.41 | % | 2,201 | 1.54 | % | 0.78 | % | 1.67 | % | 12.93 | % | ||||||||||||
| 11.11 | % | 1,803 | 1.47 | % | 1.10 | % | 1.62 | % | 34.85 | % | ||||||||||||
| 21.88 | % | 45 | 1.54 | % | 0.69 | % | 1.99 | % | 22.21 | % | ||||||||||||
| 0.98 | % | 34 | 1.30 | % | 1.11 | % | 1.80 | % | 21.77 | % | ||||||||||||
| 38.06 | % | 1 | 1.30 | % | 1.13 | % | 2.02 | % | 36.05 | % | ||||||||||||
| 5.67 | % | 189,864 | 1.30 | % | 0.99 | % | 1.43 | % | 12.93 | % | ||||||||||||
| 11.29 | % | 212,642 | 1.30 | % | 0.91 | % | 1.45 | % | 34.85 | % | ||||||||||||
| 22.13 | % | 24,276 | 1.30 | % | 0.87 | % | 1.75 | % | 22.21 | % | ||||||||||||
| 1.03 | % | 3,210 | 1.30 | % | 1.70 | % | 1.74 | % | 21.77 | % | ||||||||||||
| 37.78 | % | 25 | 1.30 | % | 1.09 | % | 2.15 | % | 36.05 | % | ||||||||||||
| (c) | During the period, certain fees were waived and/or reimbursed. If such waivers/reimbursements had not occurred, the ratios would have been as indicated. |
| (d) | Portfolio turnover is calculated on the basis of the Fund as a whole without distinguishing among the classes of shares. |
2014 Annual Report
121
Table of Contents
Financial Highlights (continued)
Selected Data for Each Share of Capital Outstanding Throughout the Periods Indicated
Aberdeen International Equity Fund
| Investment Activities | Distributions | |||||||||||||||||||||||||||||||
| Net Asset Value, Beginning of Period | Net (a) | Net Realized and Unrealized Gains (Losses) on Investments | Total from Investment Activities | Net Investment Income | Total Distributions | Redemption Fees | Net Asset Value, End of Period | |||||||||||||||||||||||||
Class A Shares | ||||||||||||||||||||||||||||||||
Year Ended October 31, 2014 | $ | 15.34 | $ | 0.50 | $ | (0.42 | ) | $ | 0.08 | $ | (0.57 | ) | $ | (0.57 | ) | $ | – | $ | 14.85 | |||||||||||||
Year Ended October 31, 2013 | 13.57 | 0.26 | 1.73 | 1.99 | (0.22 | ) | (0.22 | ) | – | 15.34 | ||||||||||||||||||||||
Year Ended October 31, 2012 | 13.00 | 0.31 | 0.56 | 0.87 | (0.30 | ) | (0.30 | ) | – | 13.57 | ||||||||||||||||||||||
Year Ended October 31, 2011 | 13.02 | 0.30 | (0.04 | ) | 0.26 | (0.28 | ) | (0.28 | ) | – | 13.00 | |||||||||||||||||||||
Year Ended October 31, 2010 | 11.37 | 0.21 | 1.66 | 1.87 | (0.22 | ) | (0.22 | ) | – | 13.02 | ||||||||||||||||||||||
Class C Shares | ||||||||||||||||||||||||||||||||
Year Ended October 31, 2014 | 14.51 | 0.39 | (0.42 | ) | (0.03 | ) | (0.47 | ) | (0.47 | ) | – | 14.01 | ||||||||||||||||||||
Year Ended October 31, 2013 | 12.86 | 0.15 | 1.64 | 1.79 | (0.14 | ) | (0.14 | ) | – | 14.51 | ||||||||||||||||||||||
Year Ended October 31, 2012 | 12.35 | 0.20 | 0.54 | 0.74 | (0.23 | ) | (0.23 | ) | – | 12.86 | ||||||||||||||||||||||
Year Ended October 31, 2011 | 12.38 | 0.19 | (0.03 | ) | 0.16 | (0.19 | ) | (0.19 | ) | – | 12.35 | |||||||||||||||||||||
Year Ended October 31, 2010 | 10.84 | 0.12 | 1.58 | 1.70 | (0.16 | ) | (0.16 | ) | – | 12.38 | ||||||||||||||||||||||
Class R Shares | ||||||||||||||||||||||||||||||||
Year Ended October 31, 2014 | 14.71 | 0.46 | (0.42 | ) | 0.04 | (0.53 | ) | (0.53 | ) | – | 14.22 | |||||||||||||||||||||
Year Ended October 31, 2013 | 13.03 | 0.21 | 1.65 | 1.86 | (0.18 | ) | (0.18 | ) | – | 14.71 | ||||||||||||||||||||||
Year Ended October 31, 2012 | 12.49 | 0.27 | 0.55 | 0.82 | (0.28 | ) | (0.28 | ) | – | 13.03 | ||||||||||||||||||||||
Year Ended October 31, 2011 | 12.51 | 0.25 | (0.01 | ) | 0.24 | (0.26 | ) | (0.26 | ) | – | 12.49 | |||||||||||||||||||||
Year Ended October 31, 2010 | 10.95 | 0.18 | 1.59 | 1.77 | (0.21 | ) | (0.21 | ) | – | 12.51 | ||||||||||||||||||||||
Institutional Service Class Shares | ||||||||||||||||||||||||||||||||
Year Ended October 31, 2014 | 15.64 | 0.56 | (0.44 | ) | 0.12 | (0.60 | ) | (0.60 | ) | – | 15.16 | |||||||||||||||||||||
Year Ended October 31, 2013 | 13.84 | 0.28 | 1.77 | 2.05 | (0.25 | ) | (0.25 | ) | – | 15.64 | ||||||||||||||||||||||
Year Ended October 31, 2012 | 13.25 | 0.35 | 0.56 | 0.91 | (0.32 | ) | (0.32 | ) | – | 13.84 | ||||||||||||||||||||||
Year Ended October 31, 2011 | 13.26 | 0.33 | (0.04 | ) | 0.29 | (0.30 | ) | (0.30 | ) | – | 13.25 | |||||||||||||||||||||
Year Ended October 31, 2010 | 11.58 | 0.24 | 1.69 | 1.93 | (0.25 | ) | (0.25 | ) | – | 13.26 | ||||||||||||||||||||||
Institutional Class Shares | ||||||||||||||||||||||||||||||||
Year Ended October 31, 2014 | 15.70 | 0.58 | (0.45 | ) | 0.13 | (0.62 | ) | (0.62 | ) | – | 15.21 | |||||||||||||||||||||
Year Ended October 31, 2013 | 13.88 | 0.32 | 1.76 | 2.08 | (0.26 | ) | (0.26 | ) | – | 15.70 | ||||||||||||||||||||||
Year Ended October 31, 2012 | 13.29 | 0.41 | 0.51 | 0.92 | (0.33 | ) | (0.33 | ) | – | 13.88 | ||||||||||||||||||||||
Year Ended October 31, 2011 | 13.30 | 0.34 | (0.03 | ) | 0.31 | (0.32 | ) | (0.32 | ) | – | 13.29 | |||||||||||||||||||||
Year Ended October 31, 2010 | 11.59 | 0.29 | 1.65 | 1.94 | (0.23 | ) | (0.23 | ) | – | 13.30 | ||||||||||||||||||||||
| (a) | Net investment income (loss) is based on average shares outstanding during the period. |
| (b) | Excludes sales charge. |
Amounts listed as “–” are $0 or round to $0.
See accompanying Notes to Financial Statements.
Annual Report 2014
122
Table of Contents
Financial Highlights (continued)
Selected Data for Each Share of Capital Outstanding Throughout the Periods Indicated
Aberdeen International Equity Fund (concluded)
| Ratios/Supplemental Data | ||||||||||||||||||||||
| Total Return (b) | Net Assets at End of Period (000’s) | Ratio of Expenses to Average Net Assets | Ratio of Net Investment Income to Average Net Assets | Ratio of Expenses (c) | Portfolio Turnover (d) | |||||||||||||||||
| 0.49 | % | $ | 148,018 | 1.33 | % | 3.30 | % | 1.33 | % | 10.08 | % | |||||||||||
| 14.75 | % | 222,275 | 1.33 | % | 1.77 | % | 1.33 | % | 23.35 | % | ||||||||||||
| 6.84 | % | 200,574 | 1.37 | % | 2.37 | % | 1.37 | % | 15.29 | % | ||||||||||||
| 1.96 | % | 158,454 | 1.57 | % | 2.22 | % | 1.57 | % | 22.15 | % | ||||||||||||
| 16.73 | % | 140,052 | 1.57 | % | 1.73 | % | 1.58 | % | 22.61 | % | ||||||||||||
| (0.24 | %) | 35,696 | 2.03 | % | 2.68 | % | 2.03 | % | 10.08 | % | ||||||||||||
| 14.02 | % | 42,861 | 2.01 | % | 1.08 | % | 2.01 | % | 23.35 | % | ||||||||||||
| 6.09 | % | 35,754 | 2.05 | % | 1.64 | % | 2.05 | % | 15.29 | % | ||||||||||||
| 1.29 | % | 28,322 | 2.24 | % | 1.48 | % | 2.24 | % | 22.15 | % | ||||||||||||
| 15.88 | % | 35,944 | 2.24 | % | 1.06 | % | 2.25 | % | 22.61 | % | ||||||||||||
| 0.26 | % | 16,938 | 1.62 | % | 3.13 | % | 1.62 | % | 10.08 | % | ||||||||||||
| 14.42 | % | 17,303 | 1.59 | % | 1.51 | % | 1.59 | % | 23.35 | % | ||||||||||||
| 6.67 | % | 11,531 | 1.58 | % | 2.10 | % | 1.58 | % | 15.29 | % | ||||||||||||
| 1.87 | % | 10,395 | 1.75 | % | 1.97 | % | 1.75 | % | 22.15 | % | ||||||||||||
| 16.39 | % | 10,195 | 1.74 | % | 1.55 | % | 1.75 | % | 22.61 | % | ||||||||||||
| 0.75 | % | 185,166 | 1.16 | % | 3.57 | % | 1.16 | % | 10.08 | % | ||||||||||||
| 14.91 | % | 206,212 | 1.13 | % | 1.92 | % | 1.13 | % | 23.35 | % | ||||||||||||
| 7.07 | % | 191,580 | 1.17 | % | 2.61 | % | 1.17 | % | 15.29 | % | ||||||||||||
| 2.19 | % | 219,773 | 1.37 | % | 2.38 | % | 1.37 | % | 22.15 | % | ||||||||||||
| 16.91 | % | 211,007 | 1.36 | % | 1.98 | % | 1.36 | % | 22.61 | % | ||||||||||||
| 0.81 | % | 496,344 | 1.03 | % | 3.73 | % | 1.03 | % | 10.08 | % | ||||||||||||
| 15.14 | % | 558,986 | 1.01 | % | 2.13 | % | 1.01 | % | 23.35 | % | ||||||||||||
| 7.18 | % | 475,051 | 1.01 | % | 3.02 | % | 1.01 | % | 15.29 | % | ||||||||||||
| 2.32 | % | 14,491 | 1.24 | % | 2.50 | % | 1.24 | % | 22.15 | % | ||||||||||||
| 16.97 | % | 12,669 | 1.24 | % | 2.41 | % | 1.23 | % | 22.61 | % | ||||||||||||
| (c) | During the period, certain fees were waived and/or reimbursed. If such waivers/reimbursements had not occurred, the ratios would have been as indicated. |
| (d) | Portfolio turnover is calculated on the basis of the Fund as a whole without distinguishing among the classes of shares. |
2014 Annual Report
123
Table of Contents
Financial Highlights (continued)
Selected Data for Each Share of Capital Outstanding Throughout the Periods Indicated
Aberdeen Latin American Equity Fund
| Investment Activities | Distributions | |||||||||||||||||||||||||||||||
| Net Asset Value, Beginning of Period | Net (a) | Net Realized and Unrealized Gains (Losses) on Investments | Total from Investment Activities | Net Investment Income | Net Realized Gains | Total Distributions | Net Asset Value, End of Period | |||||||||||||||||||||||||
Class A Shares | ||||||||||||||||||||||||||||||||
Year Ended October 31, 2014 | $ | 9.18 | $ | 0.12 | $ | (1.24 | ) | $ | (1.12 | ) | $ | (0.13 | ) | $ | – | $ | (0.13 | ) | $ | 7.93 | ||||||||||||
Period Ended October 31, 2013(g) | 10.00 | 0.05 | (0.83 | ) | (0.78 | ) | (0.04 | ) | – | (0.04 | ) | 9.18 | ||||||||||||||||||||
Class C Shares | ||||||||||||||||||||||||||||||||
Year Ended October 31, 2014 | 9.16 | 0.06 | (1.23 | ) | (1.17 | ) | (0.08 | ) | – | (0.08 | ) | 7.91 | ||||||||||||||||||||
Period Ended October 31, 2013(g) | 10.00 | 0.04 | (0.86 | ) | (0.82 | ) | (0.02 | ) | – | (0.02 | ) | 9.16 | ||||||||||||||||||||
Class R Shares | ||||||||||||||||||||||||||||||||
Year Ended October 31, 2014 | 9.18 | 0.11 | (1.25 | ) | (1.14 | ) | (0.11 | ) | – | (0.11 | ) | 7.93 | ||||||||||||||||||||
Period Ended October 31, 2013(g) | 10.00 | 0.06 | (0.85 | ) | (0.79 | ) | (0.03 | ) | – | (0.03 | ) | 9.18 | ||||||||||||||||||||
Institutional Service Class Shares | ||||||||||||||||||||||||||||||||
Year Ended October 31, 2014 | 9.19 | 0.15 | (1.24 | ) | (1.09 | ) | (0.16 | ) | – | (0.16 | ) | 7.94 | ||||||||||||||||||||
Period Ended October 31, 2013(g) | 10.00 | 0.09 | (0.86 | ) | (0.77 | ) | (0.04 | ) | – | (0.04 | ) | 9.19 | ||||||||||||||||||||
Institutional Class Shares | ||||||||||||||||||||||||||||||||
Year Ended October 31, 2014 | 9.19 | 0.15 | (1.24 | ) | (1.09 | ) | (0.16 | ) | – | (0.16 | ) | 7.94 | ||||||||||||||||||||
Period Ended October 31, 2013(g) | 10.00 | 0.09 | (0.86 | ) | (0.77 | ) | (0.04 | ) | – | (0.04 | ) | 9.19 | ||||||||||||||||||||
| (a) | Net investment income (loss) is based on average shares outstanding during the period. |
| (b) | Excludes sales charge. |
| (c) | Not annualized for periods less than one year. |
| (d) | Annualized for periods less than one year. |
Amounts listed as “–” are $0 or round to $0.
See accompanying Notes to Financial Statements.
Annual Report 2014
124
Table of Contents
Financial Highlights (continued)
Selected Data for Each Share of Capital Outstanding Throughout the Periods Indicated
Aberdeen Latin American Equity Fund (concluded)
| Ratios/Supplemental Data | ||||||||||||||||||||||
Total Return (b)(c) | Net Assets at End of Period (000’s) | Ratio of Expenses (d) | Ratio of Net (d) | Ratio of Expenses (d)(e) | Portfolio Turnover (c)(f) | |||||||||||||||||
| (12.22 | %) | $ | 57 | 1.55 | % | 1.47 | % | 4.63 | % | 3.79 | % | |||||||||||
| (7.82 | %) | 28 | 1.55 | % | 1.00 | % | 6.20 | % | 5.04 | % | ||||||||||||
| (12.83 | %) | 25 | 2.31 | % | 0.65 | % | 5.38 | % | 3.79 | % | ||||||||||||
| (8.21 | %) | 9 | 2.30 | % | 0.67 | % | 6.96 | % | 5.04 | % | ||||||||||||
| (12.48 | %)(h) | 8 | 1.77 | % | 1.26 | % | 4.85 | % | 3.79 | % | ||||||||||||
| (7.90 | %)(h) | 9 | 1.80 | % | 1.17 | % | 6.45 | % | 5.04 | % | ||||||||||||
| (11.99 | %) | 8 | 1.29 | % | 1.75 | % | 4.36 | % | 3.79 | % | ||||||||||||
| (7.68 | %) | 9 | 1.30 | % | 1.67 | % | 5.96 | % | 5.04 | % | ||||||||||||
| (11.99 | %) | 4,051 | 1.30 | % | 1.73 | % | 4.36 | % | 3.79 | % | ||||||||||||
| (7.68 | %) | 4,589 | 1.30 | % | 1.67 | % | 5.96 | % | 5.04 | % | ||||||||||||
| (e) | During the period, certain fees were waived and/or reimbursed. If such waivers/reimbursements had not occurred, the ratios would have been as indicated. |
| (f) | Portfolio turnover is calculated on the basis of the Fund as a whole without distinguishing among the classes of shares. |
| (g) | For the period from March 25, 2013 (commencement of operations) through October 31, 2013. |
| (h) | The total return shown above includes the impact of financial statement rounding of the NAV per share and/or financial statement adjustments. |
2014 Annual Report
125
Table of Contents
Financial Highlights (continued)
Selected Data for Each Share of Capital Outstanding Throughout the Periods Indicated
Aberdeen Small Cap Fund
| Investment Activities | Distributions | |||||||||||||||||||||||||||||||
| Net Asset Value, Beginning of Period | Net (a) | Net Realized and Unrealized Gains on Investments | Total from Investment Activities | Net Investment Income | Total Distributions | Redemption Fees | Net Asset Value, End of Period | |||||||||||||||||||||||||
Class A Shares | ||||||||||||||||||||||||||||||||
Year Ended October 31, 2014 | $ | 21.86 | $ | 0.01 | $ | 2.03 | $ | 2.04 | $ | – | $ | – | $ | – | $ | 23.90 | ||||||||||||||||
Year Ended October 31, 2013 | 15.85 | 0.05 | 5.96 | 6.01 | – | – | – | 21.86 | ||||||||||||||||||||||||
Year Ended October 31, 2012 | 14.06 | (0.07 | ) | 1.86 | 1.79 | – | – | – | 15.85 | |||||||||||||||||||||||
Year Ended October 31, 2011 | 13.65 | 0.04 | 0.47 | 0.51 | (0.10 | ) | (0.10 | ) | – | 14.06 | ||||||||||||||||||||||
Year Ended October 31, 2010 | 10.77 | (0.07 | ) | 2.95 | 2.88 | – | – | – | 13.65 | |||||||||||||||||||||||
Class C Shares | ||||||||||||||||||||||||||||||||
Year Ended October 31, 2014 | 19.53 | (0.14 | ) | 1.81 | 1.67 | – | – | – | 21.20 | |||||||||||||||||||||||
Year Ended October 31, 2013 | 14.26 | (0.07 | ) | 5.34 | 5.27 | – | – | – | 19.53 | |||||||||||||||||||||||
Year Ended October 31, 2012 | 12.73 | (0.16 | ) | 1.69 | 1.53 | – | – | – | 14.26 | |||||||||||||||||||||||
Year Ended October 31, 2011 | 12.42 | (0.05 | ) | 0.42 | 0.37 | (0.06 | ) | (0.06 | ) | – | 12.73 | |||||||||||||||||||||
Year Ended October 31, 2010 | 9.86 | (0.14 | ) | 2.70 | 2.56 | – | – | – | 12.42 | |||||||||||||||||||||||
Class R Shares | ||||||||||||||||||||||||||||||||
Year Ended October 31, 2014 | 20.44 | (0.04 | ) | 1.90 | 1.86 | – | – | – | 22.30 | |||||||||||||||||||||||
Year Ended October 31, 2013 | 14.85 | 0.01 | 5.58 | 5.59 | – | – | – | 20.44 | ||||||||||||||||||||||||
Year Ended October 31, 2012 | 13.21 | (0.10 | ) | 1.74 | 1.64 | – | – | – | 14.85 | |||||||||||||||||||||||
Year Ended October 31, 2011 | 12.84 | 0.03 | 0.42 | 0.45 | (0.08 | ) | (0.08 | ) | – | 13.21 | ||||||||||||||||||||||
Year Ended October 31, 2010 | 10.16 | (0.09 | ) | 2.77 | 2.68 | – | – | – | 12.84 | |||||||||||||||||||||||
Institutional Service Class Shares | ||||||||||||||||||||||||||||||||
Year Ended October 31, 2014 | 22.76 | 0.08 | 2.12 | 2.20 | – | – | – | 24.96 | ||||||||||||||||||||||||
Year Ended October 31, 2013 | 16.47 | 0.09 | 6.20 | 6.29 | – | – | – | 22.76 | ||||||||||||||||||||||||
Year Ended October 31, 2012 | 14.56 | (0.02 | ) | 1.93 | 1.91 | – | – | – | 16.47 | |||||||||||||||||||||||
Year Ended October 31, 2011 | 14.10 | 0.06 | 0.51 | 0.57 | (0.11 | ) | (0.11 | ) | – | 14.56 | ||||||||||||||||||||||
Year Ended October 31, 2010 | 11.10 | (0.04 | ) | 3.04 | 3.00 | – | – | – | 14.10 | |||||||||||||||||||||||
Institutional Class Shares | ||||||||||||||||||||||||||||||||
Year Ended October 31, 2014 | 22.73 | 0.07 | 2.13 | 2.20 | – | – | – | 24.93 | ||||||||||||||||||||||||
Year Ended October 31, 2013 | 16.43 | 0.12 | 6.18 | 6.30 | – | – | – | 22.73 | ||||||||||||||||||||||||
Year Ended October 31, 2012 | 14.53 | (0.02 | ) | 1.92 | 1.90 | – | – | – | 16.43 | |||||||||||||||||||||||
Year Ended October 31, 2011 | 14.07 | 0.10 | 0.47 | 0.57 | (0.11 | ) | (0.11 | ) | – | 14.53 | ||||||||||||||||||||||
Year Ended October 31, 2010 | 11.08 | (0.03 | ) | 3.02 | 2.99 | – | – | – | 14.07 | |||||||||||||||||||||||
| (a) | Net investment income (loss) is based on average shares outstanding during the period. |
| (b) | Excludes sales charge. |
Amounts listed as “–” are $0 or round to $0.
See accompanying Notes to Financial Statements.
Annual Report 2014
126
Table of Contents
Financial Highlights (continued)
Selected Data for Each Share of Capital Outstanding Throughout the Periods Indicated
Aberdeen Small Cap Fund (concluded)
| Ratios/Supplemental Data | ||||||||||||||||||||||
Total Return (b) | Net Assets at End of Period (000’s) | Ratio of Expenses to Average Net Assets | Ratio of Net | Ratio of Expenses (c) | Portfolio Turnover (d) | |||||||||||||||||
| 9.33 | % | $ | 72,790 | 1.47 | % | 0.03 | % | 1.59 | % | 29.32 | % | |||||||||||
| 37.92 | % | 81,916 | 1.47 | % | 0.25 | % | 1.58 | % | 39.71 | % | ||||||||||||
| 12.73 | % | 70,189 | 1.47 | % | (0.46 | %) | 1.55 | % | 23.05 | % | ||||||||||||
| 3.65 | % | 92,187 | 1.44 | % | 0.28 | % | 1.59 | % | 41.48 | % | ||||||||||||
| 26.74 | % | 121,975 | 1.35 | % | (0.57 | %) | 1.65 | % | 24.37 | % | ||||||||||||
| 8.55 | % | 31,346 | 2.15 | % | (0.66 | %) | 2.27 | % | 29.32 | % | ||||||||||||
| 36.96 | % | 32,664 | 2.15 | % | (0.42 | %) | 2.26 | % | 39.71 | % | ||||||||||||
| 12.02 | % | 29,734 | 2.15 | % | (1.13 | %) | 2.23 | % | 23.05 | % | ||||||||||||
| 2.94 | % | 35,391 | 2.11 | % | (0.33 | %) | 2.26 | % | 41.48 | % | ||||||||||||
| 25.96 | % | 48,374 | 2.04 | % | (1.27 | %) | 2.35 | % | 24.37 | % | ||||||||||||
| 9.10 | % | 1,152 | 1.70 | % | (0.19 | %) | 1.82 | % | 29.32 | % | ||||||||||||
| 37.64 | % | 1,507 | 1.67 | % | 0.08 | % | 1.78 | % | 39.71 | % | ||||||||||||
| 12.41 | % | 2,195 | 1.73 | % | (0.68 | %) | 1.81 | % | 23.05 | % | ||||||||||||
| 3.45 | % | 3,336 | 1.65 | % | 0.18 | % | 1.80 | % | 41.48 | % | ||||||||||||
| 26.38 | % | 5,622 | 1.55 | % | (0.78 | %) | 1.85 | % | 24.37 | % | ||||||||||||
| 9.67 | % | 1,626 | 1.15 | % | 0.33 | % | 1.27 | % | 29.32 | % | ||||||||||||
| 38.19 | % | 1,694 | 1.15 | % | 0.48 | % | 1.26 | % | 39.71 | % | ||||||||||||
| 13.12 | % | 11,909 | 1.15 | % | (0.13 | %) | 1.23 | % | 23.05 | % | ||||||||||||
| 4.00 | % | 15,100 | 1.12 | % | 0.40 | % | 1.26 | % | 41.48 | % | ||||||||||||
| 27.03 | % | 13,422 | 1.04 | % | (0.31 | %) | 1.35 | % | 24.37 | % | ||||||||||||
| 9.68 | % | 27,404 | 1.15 | % | 0.30 | % | 1.27 | % | 29.32 | % | ||||||||||||
| 38.34 | % | 19,619 | 1.15 | % | 0.61 | % | 1.26 | % | 39.71 | % | ||||||||||||
| 13.08 | % | 26,346 | 1.15 | % | (0.10 | %) | 1.23 | % | 23.05 | % | ||||||||||||
| 4.01 | % | 35,100 | 1.11 | % | 0.67 | % | 1.26 | % | 41.48 | % | ||||||||||||
| 26.99 | % | 52,428 | 1.04 | % | (0.20 | %) | 1.29 | % | 24.37 | % | ||||||||||||
| (c) | During the period, certain fees were waived and/or reimbursed. If such waivers/reimbursements had not occurred, the ratios would have been as indicated. |
| (d) | Portfolio turnover is calculated on the basis of the Fund as a whole without distinguishing among the classes of shares. |
2014 Annual Report
127
Table of Contents
Financial Highlights (continued)
Selected Data for Each Share of Capital Outstanding Throughout the Periods Indicated
Aberdeen U.S. Equity Fund
| Investment Activities | Distributions | |||||||||||||||||||||||||||||||||||
| Net Asset Value, Beginning of Period | Net (a) | Net Realized and Unrealized Gains on Investments | Total from Investment Activities | Net (a) | Net Realized Gains | Total Distributions | Redemption Fees | Net Asset Value, End of Period | ||||||||||||||||||||||||||||
Class A Shares | ||||||||||||||||||||||||||||||||||||
Year Ended October 31, 2014 | $ | 12.41 | $ | 0.12 | $ | 1.09 | $ | 1.21 | $ | (0.13 | ) | $ | (0.09 | ) | $ | (0.22 | ) | $ | – | $ | 13.40 | |||||||||||||||
Year Ended October 31, 2013 | 9.97 | 0.11 | 2.43 | 2.54 | (0.10 | ) | – | (0.10 | ) | – | 12.41 | |||||||||||||||||||||||||
Year Ended October 31, 2012 | 9.04 | 0.08 | 0.91 | 0.99 | (0.06 | ) | – | (0.06 | ) | – | 9.97 | |||||||||||||||||||||||||
Year Ended October 31, 2011 | 8.64 | (0.01 | ) | 0.41 | 0.40 | – | – | – | – | 9.04 | ||||||||||||||||||||||||||
Year Ended October 31, 2010 | 7.60 | (0.01 | ) | 1.05 | 1.04 | – | – | – | – | 8.64 | ||||||||||||||||||||||||||
Class C Shares | ||||||||||||||||||||||||||||||||||||
Year Ended October 31, 2014 | 11.40 | 0.02 | 1.00 | 1.02 | (0.04 | ) | (0.09 | ) | (0.13 | ) | – | 12.29 | ||||||||||||||||||||||||
Year Ended October 31, 2013 | 9.18 | 0.02 | 2.23 | 2.25 | (0.03 | ) | – | (0.03 | ) | – | 11.40 | |||||||||||||||||||||||||
Year Ended October 31, 2012 | 8.34 | 0.01 | 0.84 | 0.85 | (0.01 | ) | – | (0.01 | ) | – | 9.18 | |||||||||||||||||||||||||
Year Ended October 31, 2011 | 8.02 | (0.06 | ) | 0.38 | 0.32 | – | – | – | – | 8.34 | ||||||||||||||||||||||||||
Year Ended October 31, 2010 | 7.10 | (0.05 | ) | 0.97 | 0.92 | – | – | – | – | 8.02 | ||||||||||||||||||||||||||
Class R Shares | ||||||||||||||||||||||||||||||||||||
Year Ended October 31, 2014 | 11.91 | 0.09 | 1.04 | 1.13 | (0.10 | ) | (0.09 | ) | (0.19 | ) | – | 12.85 | ||||||||||||||||||||||||
Year Ended October 31, 2013 | 9.58 | 0.08 | 2.32 | 2.40 | (0.07 | ) | – | (0.07 | ) | – | 11.91 | |||||||||||||||||||||||||
Year Ended October 31, 2012 | 8.67 | 0.05 | 0.89 | 0.94 | (0.03 | ) | – | (0.03 | ) | – | 9.58 | |||||||||||||||||||||||||
Year Ended October 31, 2011 | 8.31 | (0.01 | ) | 0.37 | 0.36 | – | – | – | – | 8.67 | ||||||||||||||||||||||||||
Year Ended October 31, 2010 | 7.32 | (0.02 | ) | 1.01 | 0.99 | – | – | – | – | 8.31 | ||||||||||||||||||||||||||
Institutional Service Class Shares | ||||||||||||||||||||||||||||||||||||
Year Ended October 31, 2014 | 12.93 | 0.15 | 1.14 | 1.29 | (0.15 | ) | (0.09 | ) | (0.24 | ) | – | 13.98 | ||||||||||||||||||||||||
Year Ended October 31, 2013 | 10.38 | 0.14 | 2.53 | 2.67 | (0.12 | ) | – | (0.12 | ) | – | 12.93 | |||||||||||||||||||||||||
Year Ended October 31, 2012 | 9.40 | 0.11 | 0.95 | 1.06 | (0.08 | ) | – | (0.08 | ) | – | 10.38 | |||||||||||||||||||||||||
Period Ended October 31, 2011(g) | 8.61 | – | 0.79 | 0.79 | – | – | – | – | 9.40 | |||||||||||||||||||||||||||
Institutional Class Shares | ||||||||||||||||||||||||||||||||||||
Year Ended October 31, 2014 | 12.94 | 0.16 | 1.15 | 1.31 | (0.17 | ) | (0.09 | ) | (0.26 | ) | – | 13.99 | ||||||||||||||||||||||||
Year Ended October 31, 2013 | 10.38 | 0.14 | 2.54 | 2.68 | (0.12 | ) | – | (0.12 | ) | – | 12.94 | |||||||||||||||||||||||||
Year Ended October 31, 2012 | 9.40 | 0.11 | 0.95 | 1.06 | (0.08 | ) | – | (0.08 | ) | – | 10.38 | |||||||||||||||||||||||||
Year Ended October 31, 2011 | 8.96 | 0.03 | 0.41 | 0.44 | – | – | – | – | 9.40 | |||||||||||||||||||||||||||
Year Ended October 31, 2010 | 7.85 | 0.03 | 1.08 | 1.11 | – | – | – | – | 8.96 | |||||||||||||||||||||||||||
| (a) | Net investment income (loss) is based on average shares outstanding during the period. |
| (b) | Excludes sales charge. |
| (c) | Not annualized for periods less than one year. |
| (d) | Annualized for periods less than one year. |
Amounts listed as “–” are $0 or round to $0.
See accompanying Notes to Financial Statements.
Annual Report 2014
128
Table of Contents
Financial Highlights (concluded)
Selected Data for Each Share of Capital Outstanding Throughout the Periods Indicated
Aberdeen U.S. Equity Fund (concluded)
| Ratios/Supplemental Data | ||||||||||||||||||||||
Total Return (b)(c) | Net Assets at End of Period (000’s) | Ratio of Expenses to Average Net Assets (d) | Ratio of Net (d) | Ratio of Expenses (d)(e) | Portfolio Turnover (f) | |||||||||||||||||
| 9.87 | % | $ | 276,861 | 1.17 | % | 0.92 | % | 1.25 | % | 20.60 | % | |||||||||||
| 25.54 | % | 282,602 | 1.15 | % | 0.94 | % | 1.23 | % | 19.53 | % | ||||||||||||
| 11.03 | % | 187,216 | 1.15 | % | 0.85 | % | 1.28 | % | 27.95 | % | ||||||||||||
| 4.63 | % | 196,095 | 1.41 | % | (0.07 | %) | 1.70 | % | 48.65 | % | ||||||||||||
| 13.68 | % | 23,810 | 1.56 | % | (0.06 | %) | 1.73 | % | 29.02 | % | ||||||||||||
| 9.07 | % | 8,469 | 1.90 | % | 0.19 | % | 1.98 | % | 20.60 | % | ||||||||||||
| 24.60 | % | 9,637 | 1.90 | % | 0.20 | % | 1.95 | % | 19.53 | % | ||||||||||||
| 10.23 | % | 7,899 | 1.90 | % | 0.10 | % | 2.00 | % | 27.95 | % | ||||||||||||
| 3.99 | % | 9,364 | 2.19 | % | (0.65 | %) | 2.44 | % | 48.65 | % | ||||||||||||
| 12.96 | % | 11,179 | 2.21 | % | (0.71 | %) | 2.37 | % | 29.02 | % | ||||||||||||
| 9.62 | % | 351 | 1.40 | % | 0.69 | % | 1.48 | % | 20.60 | % | ||||||||||||
| 25.16 | % | 405 | 1.40 | % | 0.73 | % | 1.45 | % | 19.53 | % | ||||||||||||
| 10.91 | % | 416 | 1.40 | % | 0.56 | % | 1.50 | % | 27.95 | % | ||||||||||||
| 4.33 | % | 865 | 1.70 | % | (0.15 | %) | 1.95 | % | 48.65 | % | ||||||||||||
| 13.52 | % | 986 | 1.71 | % | (0.23 | %) | 1.88 | % | 29.02 | % | ||||||||||||
| 10.13 | % | 128,283 | 0.96 | % | 1.12 | % | 1.07 | % | 20.60 | % | ||||||||||||
| 25.84 | % | 128,368 | 0.90 | % | 1.21 | % | 1.05 | % | 19.53 | % | ||||||||||||
| 11.37 | % | 115,150 | 0.90 | % | 1.10 | % | 1.11 | % | 27.95 | % | ||||||||||||
| 9.18 | % | 123,074 | 0.90 | % | 0.00 | % | 1.13 | % | 48.65 | % | ||||||||||||
| 10.23 | % | 3,437 | 0.90 | % | 1.18 | % | 0.98 | % | 20.60 | % | ||||||||||||
| 26.00 | % | 3,867 | 0.90 | % | 1.21 | % | 0.95 | % | 19.53 | % | ||||||||||||
| 11.37 | % | 2,584 | 0.90 | % | 1.13 | % | 1.00 | % | 27.95 | % | ||||||||||||
| 4.91 | % | 3,330 | 1.19 | % | 0.35 | % | 1.44 | % | 48.65 | % | ||||||||||||
| 14.14 | % | 3,446 | 1.21 | % | 0.32 | % | 1.37 | % | 29.02 | % | ||||||||||||
| (e) | During the period, certain fees were waived and/or reimbursed. If such waivers/reimbursements had not occurred, the ratios would have been as indicated. |
| (f) | Portfolio turnover is calculated on the basis of the Fund as a whole without distinguishing among the classes of shares. |
| (g) | For the period from October 7, 2011 (commencement of operations) through October 31, 2011. |
2014 Annual Report
129
Table of Contents
October 31, 2014
1. Organization
Aberdeen Funds (the “Trust”) was organized as a statutory trust under the laws of the state of Delaware by a Certificate of Trust filed on September 27, 2007 and is registered under the Investment Company Act of 1940, as amended (the “1940 Act”), as an open-end management investment company. As of October 31, 2014, the Trust had authorized an unlimited number of shares of beneficial interest (“shares”) without par value. As of October 31, 2014, the Trust operated twenty-four (24) separate series, or mutual funds, each with its own investment objective(s) and strategies. This report contains the financial statements and financial highlights of the thirteen (13) funds listed below (each a “Fund”; collectively, the “Funds”):
| – | Aberdeen Asia-Pacific (ex-Japan) Equity Fund (“Asia-Pacific (ex-Japan) Equity Fund”) |
| – | Aberdeen Asia-Pacific Smaller Companies Fund (“Asia-Pacific Smaller Companies Fund”) |
| – | Aberdeen China Opportunities Fund (“China Opportunities Fund”) |
| – | Aberdeen Emerging Markets Fund (“Emerging Markets Fund”) |
| – | Aberdeen Equity Long-Short Fund (“Equity Long-Short Fund”) |
| – | Aberdeen European Equity Fund (“European Equity Fund”) |
| – | Aberdeen Global Equity Fund (“Global Equity Fund”) |
| – | Aberdeen Global Natural Resources Fund (“Global Natural Resources Fund”) |
| – | Aberdeen Global Small Cap Fund (“Global Small Cap Fund”) |
| – | Aberdeen International Equity Fund (“International Equity Fund”) |
| – | Aberdeen Latin American Equity Fund (“Latin American Equity Fund”) |
| – | Aberdeen Small Cap Fund (“Small Cap Fund”) |
| – | Aberdeen U.S. Equity Fund (“U.S. Equity Fund”)* |
| * | On February 25, 2013, the U.S. Equity Fund acquired the assets and assumed the liabilities of the Aberdeen U.S. Equity II Fund (the “U.S. Equity II Fund”). The U.S. Equity Fund is considered the accounting survivor of the reorganization. |
In connection with the reorganization, the U.S. Equity II Fund’s Class A and Class C shares were converted into Class A and Class C shares of the U.S. Equity Fund, respectively.
The following is a summary of the net assets converted and net asset value per share issued as of February 25, 2013.
| Shares Issued of the U.S. Equity Fund | Net Assets Reorganized from the U.S. Equity II Fund | Net Asset Value Per Shares Issued of the U.S. Equity Fund | ||||||||||
Class A | 6,235,828 | $ | 67,631,922 | $ | 10.85 | |||||||
Class C | 171,858 | 1,714,810 | 9.98 | |||||||||
2. Summary of Significant Accounting Policies
The following is a summary of significant accounting policies followed by the Funds in the preparation of their financial statements. The policies conform to accounting principles generally accepted in the United States of America (“GAAP”). The preparation of financial statements requires management to make estimates and assumptions that affect the reported amounts of assets and liabilities, disclosure of contingent assets and liabilities at the date of the financial statements, and the reported amounts of income and expenses for the period. Actual results could differ from those estimates. The accounting records of the Funds are maintained in U.S. Dollars.
| a. | Security Valuation |
The Funds value their securities at current market value or fair value, consistent with regulatory requirements. “Fair value” is defined in the Trust’s Valuation and Liquidity Procedures as the price that could be received to sell an asset or paid to transfer a liability in an orderly transaction between willing market participants without a compulsion to contract at the measurement date.
Equity securities that are traded on an exchange are valued at the last quoted sale price on the principal exchange on which the security is traded at the “Valuation Time” subject to application, when appropriate, of the valuation factors described in the paragraph below. The Valuation Time is as of the close of regular trading on the New York Stock Exchange (usually 4:00 p.m. Eastern Time). In the absence of a sale price, the security is valued at the mean of the bid/ask price quoted at the close on the principal exchange on which the security is traded. Securities traded on NASDAQ are valued at the NASDAQ official closing price. Open-end mutual funds are valued at the respective net asset value as reported by such company. The prospectuses for the registered open-end management investment companies in which a
Annual Report 2014
130
Table of Contents
Notes to Financial Statements (continued)
October 31, 2014
Fund invests explain the circumstances under which those companies will use fair value pricing and the effects of using fair value pricing. Closed-end funds and exchange-traded funds (“ETF“s) are valued at the market price of the security at the Valuation Time. A security using any of these pricing methodologies is determined to be a Level 1 investment.
Foreign equity securities that are traded on foreign exchanges that close prior to the Valuation Time are valued by applying valuation factors to the last sale price or the mean price as noted above. Valuation factors are provided by an independent pricing service provider. These valuation factors are used when pricing a Fund’s portfolio holdings to estimate market movements between the time foreign markets close and the time a Fund values such foreign securities. These valuation factors are based on inputs such as depositary receipts, indices, futures, sector indices/ETFs, exchange rates, and local exchange opening and closing prices of each security. When prices with the application of valuation factors are utilized, the value assigned to the foreign securities may not be the same as quoted or published prices of the securities on their primary markets. A security that applies a valuation factor is determined to be a Level 2 investment because the exchange-traded price has been adjusted. Valuation factors are not utilized if the independent pricing service provider is unable to provide a valuation factor or if the valuation factor falls below a predetermined threshold; in such case, the security is determined to be a Level 1 investment.
In the event that a security’s market quotations are not readily available or are deemed unreliable (for reasons other than because the foreign exchange on which it trades closed before the Valuation Time), the security is valued at fair value as determined by a pricing committee (“Pricing Committee”), taking into account the relevant factors and surrounding circumstances using valuation policies and procedures approved by the Trust’s Board of Trustees. A security that has been fair valued by the Pricing Committee may be classified as Level 2 or 3 depending on the nature of the inputs.
In accordance with the authoritative guidance on fair value measurements and disclosures under GAAP, the Funds disclose the fair value of their investments using a three-level hierarchy that classifies the inputs to valuation techniques used to measure the fair value. The hierarchy assigns Level 1 measurements to valuations based upon unadjusted quoted prices in active markets for identical assets, Level 2 measurements to valuations based upon other significant observable inputs, including adjusted quoted prices in active markets for identical assets, and Level 3 measurements to valuations based upon unobservable inputs that are significant to the valuation. Observable inputs are inputs that reflect the assumptions market participants would use in pricing the asset or liability, which are based on market data obtained from sources independent of the reporting entity. Unobservable inputs are inputs that reflect the reporting entity’s own assumptions about the assumptions market participants would use in pricing the asset or liability developed based on the best information available in the circumstances. A financial instrument’s level within the fair value hierarchy is based upon the lowest level of any input that is significant to the fair value measurement. The three-level hierarchy of inputs is summarized below:
| • | Level 1-quoted prices in active markets for identical investments; |
| • | Level 2-other significant observable inputs (including quoted prices for similar securities, interest rates, prepayment speeds, and credit risk); or |
| • | Level 3-significant unobservable inputs (including a Fund’s own assumptions in determining the fair value of investments). |
A summary of standard inputs is listed below:
| Security Type | Standard Inputs | |
Foreign equities utilizing a fair value factor | Depositary receipts, indices, futures, sector indices/ETFs, exchange rates, and local exchange opening and closing prices of each security. |
2014 Annual Report
131
Table of Contents
Notes to Financial Statements (continued)
October 31, 2014
The following is a summary of the inputs used as of October 31, 2014 in valuing the Funds’ investments at fair value. The inputs or methodologies used for valuing securities are not necessarily an indication of the risk associated with investing in those securities.
Please refer to the Statements of Investments for a detailed breakout of the security types:
| Investments, at Value | LEVEL 1–Quoted Prices ($) | LEVEL 2–Other Significant Observable Inputs ($) | LEVEL 3–Significant Unobservable Inputs ($) | Total ($) | ||||||||||||
| Aberdeen Asia-Pacific (ex-Japan) Equity Fund | ||||||||||||||||
| Investments in Securities | ||||||||||||||||
Common Stocks | 65,065,673 | 921,085,670 | – | 986,151,343 | ||||||||||||
Preferred Stocks | – | 58,476,039 | – | 58,476,039 | ||||||||||||
Repurchase Agreement | – | 33,785,000 | – | 33,785,000 | ||||||||||||
|
|
|
|
|
|
|
| |||||||||
| 65,065,673 | 1,013,346,709 | – | 1,078,412,382 | |||||||||||||
|
|
|
|
|
|
|
| |||||||||
| Aberdeen Asia-Pacific Smaller Companies Fund | ||||||||||||||||
| Investments in Securities | ||||||||||||||||
Common Stocks | 10,860,199 | 19,310,524 | – | 30,170,723 | ||||||||||||
Warrants | – | 8,965 | – | 8,965 | ||||||||||||
Repurchase Agreement | – | 831,000 | – | 831,000 | ||||||||||||
|
|
|
|
|
|
|
| |||||||||
| 10,860,199 | 20,150,489 | – | 31,010,688 | |||||||||||||
|
|
|
|
|
|
|
| |||||||||
| Aberdeen China Opportunities Fund | ||||||||||||||||
| Investments in Securities | ||||||||||||||||
Common Stocks | 3,134,375 | 26,930,157 | – | 30,064,532 | ||||||||||||
Repurchase Agreement | – | 130,000 | – | 130,000 | ||||||||||||
|
|
|
|
|
|
|
| |||||||||
| 3,134,375 | 27,060,157 | – | 30,194,532 | |||||||||||||
|
|
|
|
|
|
|
| |||||||||
| Aberdeen Emerging Markets Fund | ||||||||||||||||
| Investments in Securities | ||||||||||||||||
Common Stocks | 2,469,647,207 | 6,420,638,053 | – | 8,890,285,260 | ||||||||||||
Preferred Stocks | 484,810,180 | 427,340,306 | – | 912,150,486 | ||||||||||||
Repurchase Agreement | – | 229,143,000 | – | 229,143,000 | ||||||||||||
|
|
|
|
|
|
|
| |||||||||
| 2,954,457,387 | 7,077,121,359 | – | 10,031,578,746 | |||||||||||||
|
|
|
|
|
|
|
| |||||||||
| Aberdeen Equity Long-Short Fund | ||||||||||||||||
| Investments in Securities | ||||||||||||||||
Common Stocks—Long Positions | 350,125,273 | – | – | 350,125,273 | ||||||||||||
Common Stocks—Short Positions | (172,247,727 | ) | – | – | (172,247,727 | ) | ||||||||||
Exchange Traded Funds—Short Positions | (13,169,740 | ) | – | – | (13,169,740 | ) | ||||||||||
|
|
|
|
|
|
|
| |||||||||
| 164,707,806 | – | – | 164,707,806 | |||||||||||||
|
|
|
|
|
|
|
| |||||||||
| Aberdeen European Equity Fund | ||||||||||||||||
| Investments in Securities | ||||||||||||||||
Common Stocks | 271,762 | 5,632,709 | – | 5,904,471 | ||||||||||||
Preferred Stocks | 2,261 | – | – | 2,261 | ||||||||||||
Repurchase Agreement | – | 192,000 | – | 192,000 | ||||||||||||
|
|
|
|
|
|
|
| |||||||||
| 274,023 | 5,824,709 | – | 6,098,732 | |||||||||||||
|
|
|
|
|
|
|
| |||||||||
Annual Report 2014
132
Table of Contents
Notes to Financial Statements (continued)
October 31, 2014
| Investments, at Value | LEVEL 1–Quoted Prices ($) | LEVEL 2–Other Significant Observable Inputs ($) | LEVEL 3–Significant Unobservable Inputs ($) | Total ($) | ||||||||||||
| Aberdeen Global Equity Fund | ||||||||||||||||
| Investments in Securities | ||||||||||||||||
Common Stocks | 64,650,832 | 73,179,246 | – | 137,830,078 | ||||||||||||
Preferred Stocks | 8,624,319 | 3,772,474 | – | 12,396,793 | ||||||||||||
Repurchase Agreement | – | 6,474,000 | – | 6,474,000 | ||||||||||||
|
|
|
|
|
|
|
| |||||||||
| 73,275,151 | 83,425,720 | – | 156,700,871 | |||||||||||||
|
|
|
|
|
|
|
| |||||||||
| Aberdeen Global Natural Resources Fund | ||||||||||||||||
| Investments in Securities | ||||||||||||||||
Common Stocks | 12,221,042 | 9,963,305 | – | 22,184,347 | ||||||||||||
Preferred Stocks | 576,639 | – | – | 576,639 | ||||||||||||
Repurchase Agreement | – | 369,000 | – | 369,000 | ||||||||||||
|
|
|
|
|
|
|
| |||||||||
| 12,797,681 | 10,332,305 | – | 23,129,986 | |||||||||||||
|
|
|
|
|
|
|
| |||||||||
| Aberdeen Global Small Cap Fund | ||||||||||||||||
| Investments in Securities | ||||||||||||||||
Common Stocks | 105,950,053 | 144,010,035 | – | 249,960,088 | ||||||||||||
Preferred Stocks | 6,426,696 | – | – | 6,426,696 | ||||||||||||
Repurchase Agreement | – | 333,000 | – | 333,000 | ||||||||||||
|
|
|
|
|
|
|
| |||||||||
| 112,376,749 | 144,343,035 | – | 256,719,784 | |||||||||||||
|
|
|
|
|
|
|
| |||||||||
| Aberdeen International Equity Fund | ||||||||||||||||
| Investments in Securities | ||||||||||||||||
Common Stocks | 100,999,475 | 678,520,203 | – | 779,519,678 | ||||||||||||
Preferred Stocks | 53,658,753 | 31,926,328 | – | 85,585,081 | ||||||||||||
Repurchase Agreement | – | 12,879,000 | – | 12,879,000 | ||||||||||||
|
|
|
|
|
|
|
| |||||||||
| 154,658,228 | 723,325,531 | – | 877,983,759 | |||||||||||||
|
|
|
|
|
|
|
| |||||||||
| Aberdeen Latin American Equity Fund | ||||||||||||||||
| Investments in Securities | ||||||||||||||||
Common Stocks | 3,968,024 | – | – | 3,968,024 | ||||||||||||
Preferred Stocks | 70,816 | – | – | 70,816 | ||||||||||||
|
|
|
|
|
|
|
| |||||||||
| 4,038,840 | – | – | 4,038,840 | |||||||||||||
|
|
|
|
|
|
|
| |||||||||
| Aberdeen Small Cap Fund | ||||||||||||||||
| Investments in Securities | ||||||||||||||||
Common Stocks | 131,642,371 | – | – | 131,642,371 | ||||||||||||
Repurchase Agreement | – | 3,031,000 | – | 3,031,000 | ||||||||||||
|
|
|
|
|
|
|
| |||||||||
| 131,642,371 | 3,031,000 | – | 134,673,371 | |||||||||||||
|
|
|
|
|
|
|
| |||||||||
| Aberdeen U.S. Equity Fund | ||||||||||||||||
| Investments in Securities | ||||||||||||||||
Common Stocks | 416,779,753 | – | – | 416,779,753 | ||||||||||||
Repurchase Agreement | – | 749,000 | – | 749,000 | ||||||||||||
|
|
|
|
|
|
|
| |||||||||
| 416,779,753 | 749,000 | – | 417,528,753 | |||||||||||||
|
|
|
|
|
|
|
| |||||||||
2014 Annual Report
133
Table of Contents
Notes to Financial Statements (continued)
October 31, 2014
For movements between the Levels within the fair value hierarchy, the Funds have adopted a policy of recognizing transfers at the end of each period. As described above, certain foreign securities are valued utilizing valuation factors provided by an independent pricing service to reflect any significant market movements between the time foreign markets close and the time the Fund values such foreign securities. The utilization of valuation factors may result in transfers between Level 1 and Level 2. During the year ended October 31, 2014, several Funds had transfers between Level 1 and Level 2 because there was a valuation factor applied at October 31, 2014 not applied at a prior period end, or a valuation factor applied at a prior period end not applied at October 31, 2014. For the year ended October 31, 2014, there have been no significant changes to the fair valuation methodologies. The following is a summary of Funds which had significant transfers:
| Fund | Transfer from Level 1 | Transfer from Level 2 | ||||||
Asia-Pacific (ex-Japan) Equity Fund | $ | 10,667,049 | $ | 21,380,524 | ||||
Asia-Pacific Smaller Companies Fund | 2,293,912 | 5,656,751 | ||||||
China Opportunities Fund | 293,814 | 973,090 | ||||||
Emerging Markets Fund | – | 122,971,489 | ||||||
European Equity Fund | – | 157,219 | ||||||
Global Small Cap Fund | 30,490,208 | 29,660,626 | ||||||
| b. | Repurchase Agreements |
The Funds may enter into repurchase agreements under the terms of a Master Repurchase Agreement. It is each Fund’s policy that its custodian/counterparty segregate the underlying collateral securities, the value of which exceeds the principal amount of the repurchase transaction, including accrued interest. The repurchase price generally equals the price paid by a Fund plus interest negotiated on the basis of current short-term rates. To the extent that any repurchase transaction exceeds one business day, the collateral is valued on a daily basis to determine its adequacy. Under the Master Repurchase Agreement, if the counterparty defaults and the value of the collateral declines, or if bankruptcy proceedings are commenced with respect to the counterparty of the security, realization of the collateral by the Funds may be delayed or limited. Repurchase agreements are subject to contractual netting arrangements with the counterparty, Fixed Income Clearing Corp. For additional information on individual repurchase agreements, see the Statements of Investments.
| c. | Restricted Securities |
Restricted securities are privately-placed securities whose resale is restricted under U.S. securities laws. The Funds may invest in restricted securities, including unregistered securities eligible for resale without registration pursuant to Rule 144A and privately-placed securities of U.S. and non-U.S. issuers offered outside the U.S. without registration pursuant to Regulation S under the Securities Act of 1933. Rule 144A securities may be freely traded among certain qualified institutional investors, such as the Funds, but resale of such securities in the U.S. is permitted only in limited circumstances.
| d. | Foreign Currency Translation |
Foreign currency amounts are translated into U.S. Dollars at the current rate of exchange as of the Valuation Time to determine the value of investments, assets and liabilities. Purchases and sales of securities, and income and expenses are translated at the prevailing rate of exchange on the respective date of these transactions. The Funds do not isolate that portion of the results of operations resulting from changes in foreign exchange rates on investments from fluctuations arising from changes in market prices of securities held. These fluctuations are included with the net realized and unrealized gain or loss from investments and foreign currencies within the Statements of Operations.
Foreign securities, currencies, and other assets and liabilities denominated in foreign currencies are translated into U.S. Dollars at the exchange rate of said currencies against the U.S. Dollar, as of the Valuation Time, as provided by an independent pricing service.
| e. | Warrants |
Certain Funds may hold warrants either through direct purchase or pursuant to corporate actions. Warrants are securities that give the holder the right, but not the obligation, to purchase securities from an issuer at a fixed price within a certain time frame. The Funds hold warrants until exercised, sold or expired. Warrants are valued at the last sale price on the exchange on which they are traded.
| f. | Short Sales |
During the period, the Equity Long-Short Fund engaged in short-selling of portfolio securities, which obligates the Fund to replace any security that it has borrowed by purchasing the security at current market value sometime in the future. The Fund will incur a loss if the price of the security increases between the date of the short sale and the date on which the Fund replaces the borrowed security. The Fund generally will realize a gain if the price of the security declines between these dates. Until the Fund replaces the borrowed security, the Fund
Annual Report 2014
134
Table of Contents
Notes to Financial Statements (continued)
October 31, 2014
will segregate or earmark cash, other liquid assets and/or securities held long to sufficiently cover the Fund’s short position on a daily basis. Dividends declared on securities sold short are recorded as an expense on the ex-dividend date and paid to the counterparty on the dividend pay date. The collateral for securities sold short includes the deposits with brokers and securities held long as shown in the Statement of Investments for the Fund.
| g. | Security Transactions, Investment Income and Expenses |
Security transactions are recorded on the trade date. Realized and unrealized gains/(losses) from security and currency transactions are calculated on the identified cost basis. Dividend income is recorded on the ex-dividend date except for certain dividends on foreign securities, which are recorded as soon as a Fund is informed after the ex-dividend date.
Interest income and expenses are recorded on an accrual basis. Expenses directly attributable to a Fund are charged to that Fund. Expenses not directly attributable to a Fund are allocated proportionately among the relevant Funds based on net assets of each. For each of the Funds, the method for allocating income, fund level expenses, and realized and unrealized gains or losses to a class is based on the total net asset value of that class’s shares in proportion to the total net assets of the relevant Fund. Expenses specific to a class (such as Rule 12b-1 and administrative services fees) are charged to that class.
| h. | Distributions |
Distributions from net investment income, if any, are declared and paid quarterly for all Funds. The Funds will also declare and pay distributions at least annually from net realized gains on investment transactions and net realized foreign exchange gains, if any. Dividends and distributions to shareholders are recorded on the ex-dividend date.
Dividends and distributions to shareholders are determined in accordance with federal income tax regulations, which may differ from GAAP. These differences are primarily due to differing treatments for foreign currencies and loss deferrals.
| i. | Federal Income Taxes |
Each Fund intends to continue to qualify as a “regulated investment company” by complying with the provisions available to certain investment companies, as defined in Subchapter M of the Internal Revenue Code of 1986, as amended, and to make distributions of net investment income and net realized capital gains sufficient to relieve the Funds from all federal income taxes. Therefore, no federal income tax provision is required. Management of the Funds has concluded that there are no significant uncertain tax positions that would require recognition in the financial statements. Since tax authorities can examine previously filed tax returns, the Funds’ U.S. federal and state tax returns for each of the four fiscal years up to the most recent fiscal year ended October 31 are subject to such review.
2014 Annual Report
135
Table of Contents
Notes to Financial Statements (continued)
October 31, 2014
3. Agreements and Transactions with Affiliates
| a. | Investment Adviser |
Under the Investment Advisory Agreement with the Trust, Aberdeen Asset Management Inc. (“Aberdeen” or the “Adviser”) manages the Funds in accordance with the policies and procedures established by the Board.
For services provided under the terms of the current Investment Advisory Agreement, each Fund pays the Adviser an annual management fee paid monthly based on that Fund’s average daily net assets according to the following schedule:
| Fund | Fee Schedule | |||||||
Asia-Pacific (ex-Japan) Equity Fund | On all assets | 1.00% | ||||||
Asia-Pacific Smaller Companies Fund | Up to $500 million | 1.30% | ||||||
| $500 million up to $2 billion | 1.25% | |||||||
| On $2 billion and more | 1.15% | |||||||
China Opportunities Fund | Up to $500 million | 1.25% | ||||||
| $500 million up to $2 billion | 1.20% | |||||||
| On $2 billion and more | 1.15% | |||||||
Emerging Markets Fund | On all assets | 0.90% | ||||||
Equity Long-Short Fund | Up to $1 billion | 1.15% | ||||||
| On $1 billion and more | 1.00% | |||||||
European Equity Fund | Up to $500 million | 0.90% | ||||||
| $500 million up to $2 billion | 0.85% | |||||||
| On $2 billion and more | 0.80% | |||||||
Global Equity Fund | Up to $500 million | 0.90% | ||||||
| $500 million up to $2 billion | 0.85% | |||||||
| On $2 billion and more | 0.80% | |||||||
Global Natural Resources Fund | Up to $500 million | 0.70% | ||||||
| $500 million up to $2 billion | 0.65% | |||||||
| On $2 billion and more | 0.60% | |||||||
Global Small Cap Fund | Up to $100 million | 1.25% | ||||||
| On $100 million and more | 1.00% | |||||||
International Equity Fund | On all assets | 0.80% | ||||||
Latin American Equity Fund | Up to $500 million | 1.10% | ||||||
| $500 million up to $2 billion | 1.05% | |||||||
| On $2 billion and more | 1.00% | |||||||
Small Cap Fund | Up to $100 million | 0.95% | ||||||
| On $100 million and more | 0.80% | |||||||
U.S. Equity Fund | Up to $500 million | 0.75% | ||||||
| $500 million up to $2 billion | 0.70% | |||||||
| On $2 billion and more | 0.65% | |||||||
Annual Report 2014
136
Table of Contents
Notes to Financial Statements (continued)
October 31, 2014
The Adviser has engaged the services of affiliates Aberdeen Asset Management Asia Limited (“AAMAL”) and Aberdeen Asset Managers Limited (“AAML”) as subadvisers (the “Subadvisers”) pursuant to subadvisory agreements. Subadvisers manage a portion of certain Funds’ investments and have the responsibility for making all investment decisions for the portion of a Fund’s assets they manage. Pursuant to the subadvisory agreements, the Adviser pays fees to the Subadvisers, if any. For the year ended October 31, 2014, the Adviser paid the following amounts to the following Subadvisers:
| Fund | Subadviser | Amount | ||||
Asia-Pacific (ex-Japan) Equity Fund | AAMAL | $ | 5,620,674 | |||
Asia-Pacific Smaller Companies Fund | AAMAL | $ | 190,944 | |||
China Opportunities Fund | AAMAL | $ | 268,912 | |||
Emerging Markets Fund | AAMAL and AAML | $ | 62,239,708 | |||
European Equity Fund | AAML | $ | 37,426 | |||
Global Equity Fund | AAML | $ | 947,102 | |||
Global Natural Resources Fund | AAML | $ | 130,173 | |||
Global Small Cap Fund | AAML | $ | 2,006,789 | |||
International Equity Fund | AAML | $ | 5,008,553 | |||
Latin American Equity Fund | AAML | $ | 30,936 | |||
The Trust and Aberdeen have entered into a written contract (“Expense Limitation Agreement”) limiting operating expenses for all classes of the Funds from exceeding the amounts listed below. This limit excludes certain expenses, including any taxes, interest, brokerage fees, short-sale dividend expenses, Acquired Fund Fees and Expenses, Rule 12b-1 fees, administrative services fees and extraordinary expenses. This contract is in effect at least through February 28, 2015 or the effective date of the 2015 annual update to the registration statement, whichever occurs first.
Effective as of February 28, 2014 and through February 28, 2015 or the effective date of the 2015 annual update to the registration statement, whichever occurs first, the Adviser has agreed to reimburse the Equity Long-Short Fund for short sale brokerage expenses at an annual rate of up to 0.15% of the Fund’s average daily net assets. Amounts reimbursed by the Adviser for short sale brokerage expenses are not subject to recoupment at a later date.
| Fund | Limit | |
Asia-Pacific (ex-Japan) Equity Fund | 1.25% | |
Asia-Pacific Smaller Companies Fund | 1.50% | |
China Opportunities Fund | 1.62% | |
Emerging Markets Fund | 1.10% | |
Equity Long-Short Fund | 1.40% | |
European Equity Fund | 1.10% | |
Global Equity Fund | 1.19% | |
Global Natural Resources Fund | 1.16% | |
Global Small Cap Fund | 1.30% | |
International Equity Fund | 1.10% | |
Latin American Equity Fund | 1.30% | |
Small Cap Fund | 1.15% | |
U.S. Equity Fund | 0.90% |
Aberdeen may request and receive reimbursement from a Fund of the advisory fees waived and other expenses reimbursed pursuant to the Expense Limitation Agreement at a later date not to exceed three years from the fiscal year in which the corresponding reimbursement to the Funds was made. However, no reimbursement will be made unless:
(i) the Fund’s assets exceed $100 million;
(ii) the total annual expense ratio of the class making such reimbursement is less than the limit set forth above; and
(iii) the payment of such reimbursement is approved by the Board on a quarterly basis (the “Reimbursement Requirements”).
2014 Annual Report
137
Table of Contents
Notes to Financial Statements (continued)
October 31, 2014
For fees waived after March 1, 2011(except for the Global Small Cap Fund, which is prior to July 20, 2011), no reimbursement will be made unless:
(i) the total annual expense ratio of the class making such reimbursement is less than the limit set forth above; and
(ii) the payment of such reimbursement is approved by the Board on a quarterly basis (the “Reimbursement Requirements”).
If the Board approves any changes in the waiver terms or limitations, reimbursements are only permitted to the extent that the terms of the Expense Limitation Agreement in effect at the time of the waiver are met at the time that reimbursement is approved. Except as provided for in the Expense Limitation Agreement, reimbursement of amounts previously waived or assumed by Aberdeen is not permitted.
As of October 31, 2014, to the extent the Reimbursement Requirements are met, the cumulative potential reimbursements for each Fund, based on expenses reimbursed by Aberdeen would be:
| Fund | Amount Fiscal Year 2012 (Expires 10/31/15) | Amount Fiscal Year 2013 (Expires 10/31/16) | Amount Fiscal Year 2014 (Expires 10/31/17) | Total* | ||||||||||||
Asia-Pacific (ex-Japan) Equity Fund | $ | – | $ | 58,037 | $ | 170,934 | $ | 228,971 | ||||||||
Asia-Pacific Smaller Companies Fund | 152,030 | 216,390 | 201,689 | 570,109 | ||||||||||||
China Opportunities Fund | 93,681 | 114,509 | 134,971 | 343,161 | ||||||||||||
Emerging Markets Fund | 89,836 | – | 1,699,198 | 1,789,034 | ||||||||||||
Equity Long-Short Fund | – | – | 23,669 | 23,669 | ||||||||||||
European Equity Fund | – | 107,240 | 133,233 | 240,473 | ||||||||||||
Global Equity Fund | 130,494 | – | – | 130,494 | ||||||||||||
Global Natural Resources Fund | 17,930 | 59,550 | 104,159 | 181,639 | ||||||||||||
Global Small Cap Fund | 262,698 | 314,856 | 365,671 | 943,225 | ||||||||||||
International Equity Fund | – | – | – | – | ||||||||||||
Latin American Equity Fund | – | 129,774 | 132,985 | 262,759 | ||||||||||||
Small Cap Fund | 125,721 | 161,028 | 163,603 | 450,352 | ||||||||||||
U.S. Equity Fund | 317,092 | 188,906 | 319,455 | 825,453 | ||||||||||||
| * | Amounts reported are due to expire throughout the respective 3-year expiration period presented above. |
Amounts listed as “–” are $0 or round to $0.
In accordance with the Funds’ Expense Limitation Agreement and criteria, as described above, the Adviser recaptured $32,465 from the Global Equity Fund, for which it previously reimbursed the Fund. At October 31, 2014, Global Equity Fund had $32,465 in liabilities payable to the Adviser for recapture.
| b. | Fund Administration |
Under the terms of the Fund Administration Agreement in effect during the period, Aberdeen provides various administrative and accounting services, including daily valuation of the Funds’ shares, preparation of financial statements, tax returns, regulatory reports, and presentation of quarterly reports to the Board. For services provided pursuant to the Fund Administration Agreement, the Funds pay Aberdeen a combined annual fee of 0.08% based on the Trust’s average daily net assets. The fee is then allocated proportionately among all funds within the Trust (including the Funds) in relation to the average daily net assets of each fund. This asset-based fee is subject to a per fund annual minimum fee.
| c. | Distributor |
The Trust and Aberdeen Fund Distributors, LLC (the “Distributor” or “AFD”) are parties to the current Underwriting Agreement (the “Underwriting Agreement”) whereby the Distributor acts as principal underwriter for the Trust’s shares.
The Trust has adopted a Distribution Plan (the “Plan”) pursuant to Rule 12b-1 under the 1940 Act with respect to certain classes of shares. The Plan permits the Funds to compensate AFD, as the Funds’ Distributor, for expenses associated with the distribution of certain classes of
Annual Report 2014
138
Table of Contents
Notes to Financial Statements (continued)
October 31, 2014
shares of the Funds of the Trust. Although actual distribution expenses may be more or less, under the Plan, the Funds of the Trust pay the Distributor an annual fee in an amount that will not exceed the following amounts:
| Fund | Class A Shares | Class C Shares(a) | Class R Shares | |||||||
Asia-Pacific (ex-Japan) Equity Fund | 0.25% | 1.00 | % | 0.50 | % | |||||
Asia-Pacific Smaller Companies Fund | 0.25% | 1.00 | % | 0.50 | % | |||||
China Opportunities Fund | 0.25% | 1.00 | % | 0.50 | % | |||||
Emerging Markets Fund | 0.25% | 1.00 | % | 0.50 | % | |||||
Equity Long-Short Fund | 0.25% | 1.00 | % | 0.50 | % | |||||
European Equity Fund | 0.25% | 1.00 | % | 0.50 | % | |||||
Global Equity Fund | 0.25% | 1.00 | % | 0.50 | % | |||||
Global Natural Resources Fund | 0.25% | 1.00 | % | 0.50 | % | |||||
Global Small Cap Fund | 0.25% | 1.00 | % | 0.50 | % | |||||
International Equity Fund | 0.25% | 1.00 | % | 0.50 | % | |||||
Latin American Equity Fund | 0.25% | 1.00 | % | 0.50 | % | |||||
Small Cap Fund | 0.25% | 1.00 | % | 0.50 | % | |||||
U.S. Equity Fund | 0.25% | 1.00 | % | 0.50 | % | |||||
| (a) | 0.25% of which is service fees. |
The Adviser or an affiliate of the Adviser may pay additional amounts from its own resources to dealers or other financial intermediaries, for aid in distribution or for aid in providing administrative services to shareholders.
Pursuant to the current Underwriting Agreement, the Distributor will also receive the proceeds of contingent deferred sales charges (“CDSCs”) of 1% imposed on certain redemptions of Class C (and up to 1% for certain Class A) shares.
In addition, the Distributor will re-allow to dealers 5.00% of sales charges on Class A shares of the Funds, which have a maximum front-end sales charge of 5.75% and the Distributor or the Adviser may compensate broker dealers or financial intermediaries from its own resources at the rate 1.00% on sales of Class C shares of the Funds, which have a maximum CDSC of 1.00%, (on the CDSC assessed on sales within one year of purchase). For the year ended October 31, 2014, AFD retained commissions of $47,834 from front-end sales charges of Class A shares and $52,255 from CDSC fees from Class C (and certain Class A) shares of the Funds.
Under the terms of the current Administrative Services Plan, a series of the Trust is permitted to enter into Servicing Agreements with servicing organizations, such as any bank, trust company, thrift institution, broker-dealer, insurance company, or other financial institution, which agree to provide certain administrative support services in connection with the Class A, Class R and Institutional Service Class shares of the series of the Trust (as applicable). These fees are based on an annual rate of up to 0.25% of the average daily net assets of Class A, Class R and Institutional Service Class shares of each of the Funds (as applicable). The amount of expenses incurred under the terms of the Administrative Services Plan during the year ended October 31, 2014 was as follows:
| Fund | Amount* | |||
Asia-Pacific (ex-Japan) Equity Fund | $ | 2,030 | ||
Asia-Pacific Smaller Companies Fund | 603 | |||
China Opportunities Fund | 6,910 | |||
Emerging Markets Fund | 990,599 | |||
Equity Long-Short Fund | 46,114 | |||
European Equity Fund | – | |||
Global Equity Fund | 97,958 | |||
Global Natural Resources Fund | 15,172 | |||
Global Small Cap Fund | 40,588 | |||
International Equity Fund | 365,831 | |||
Latin American Equity Fund | – | |||
Small Cap Fund | 51,446 | |||
U.S. Equity Fund | 186,474 | |||
| * | The Adviser has reimbursed the U.S. Equity Fund $62,812 for Administrative Services fees incurred during the year ended October 31, 2014. |
2014 Annual Report
139
Table of Contents
Notes to Financial Statements (continued)
October 31, 2014
4. Short-Term Trading Fees
Prior to February 28, 2014 the Funds assessed a 2.00% redemption fee on all classes of shares that were purchased and sold or exchanged within 90 calendar days of purchase (within 30 calendar days for the U.S. Equity Fund). The redemption fee, if any, was paid directly to the applicable Fund and was designed to offset brokerage commissions and other trading costs, market impact and other costs associated with short-term trading of Fund shares. For purposes of determining whether the redemption fee applied, the shares that were held the longest were redeemed first. This redemption fee was in addition to any CDSCs that were applicable at the time of sale. The redemption fee did not apply in certain circumstances, such as redemptions or exchanges of shares held in certain omnibus accounts or retirement plans that could not implement the redemption fee. The fee did not apply to shares purchased through reinvested dividends or capital gains.
For the year ended October 31, 2014, the Funds had the following contributions to capital due to collection of redemption fees:
| Fund | Class A Shares | Class C Shares | Class R Shares | Institutional Service Class Shares | Institutional Class Shares | |||||||||||||||
Asia-Pacific (ex-Japan) Equity Fund | $ | 198 | $ | 20 | $ | 2 | $ | 523 | $ | 135,699 | ||||||||||
Asia-Pacific Smaller Companies Fund | 98 | 5 | 1 | 3 | 1,489 | |||||||||||||||
China Opportunities Fund | 1,548 | 463 | 100 | 153 | 53 | |||||||||||||||
Emerging Markets Fund | 14,037 | 1,626 | 879 | 12,748 | 365,470 | |||||||||||||||
Equity Long-Short Fund | 2,914 | 516 | 112 | 284 | 27,182 | |||||||||||||||
European Equity Fund | 2 | 1 | 1 | 1 | 146 | |||||||||||||||
Global Equity Fund | 182 | 12 | 5 | – | 156 | |||||||||||||||
Global Natural Resources Fund | 12 | 2 | 2 | 1 | 1 | |||||||||||||||
Global Small Cap Fund | 1,632 | 47 | 37 | 42 | 4,627 | |||||||||||||||
International Equity Fund | 2,214 | 444 | 190 | 2,278 | 5,895 | |||||||||||||||
Latin American Equity Fund | – | – | – | – | – | |||||||||||||||
Small Cap Fund | 976 | 402 | 16 | 20 | 254 | |||||||||||||||
U.S. Equity Fund | 165 | 5 | 1 | 74 | 2 | |||||||||||||||
| Amounts | listed as “–” are $0 or round to $0. |
For the year ended October 31, 2013, the Funds had the following contributions to capital due to collection of redemption fees:
| Fund | Class A Shares | Class C Shares | Class R Shares | Institutional Service Class Shares | Institutional Class Shares | |||||||||||||||
Asia-Pacific (ex-Japan) Equity Fund | $ | 7 | $ | – | $ | – | $ | 23 | $ | 5,350 | ||||||||||
Asia-Pacific Smaller Companies Fund | 121 | 20 | 9 | 4 | 5,667 | |||||||||||||||
China Opportunities Fund | 5,681 | 2,173 | 387 | 1,075 | 487 | |||||||||||||||
Emerging Markets Fund | 20,771 | 2,119 | 815 | 21,134 | 517,197 | |||||||||||||||
Equity Long-Short Fund | 9,958 | 1,957 | 392 | 409 | 83,146 | |||||||||||||||
European Equity Fund | – | – | – | – | – | |||||||||||||||
Global Equity Fund | 1,210 | 78 | 36 | – | 914 | |||||||||||||||
Global Natural Resources Fund | 1,455 | 287 | 275 | 57 | 241 | |||||||||||||||
Global Small Cap Fund | 29,381 | 559 | 538 | 242 | 61,441 | |||||||||||||||
International Equity Fund | 26,055 | 4,848 | 1,851 | 24,279 | 65,094 | |||||||||||||||
Latin American Equity Fund | – | – | – | – | – | |||||||||||||||
Small Cap Fund | 3,735 | 1,539 | 94 | 354 | 1,371 | |||||||||||||||
U.S. Equity Fund | 50 | 2 | – | 29 | 1 | |||||||||||||||
| Amounts | listed as “–” are $0 or round to $0. |
Annual Report 2014
140
Table of Contents
Notes to Financial Statements (continued)
October 31, 2014
5. Investment Transactions
Purchases and sales of securities (excluding short-term securities) for the year ended October 31, 2014, were as follows:
| Fund | Purchases | Sales | ||||||
Asia-Pacific (ex-Japan) Equity Fund | $ | 389,228,306 | $ | 315,457,622 | ||||
Asia-Pacific Smaller Companies Fund | 15,371,571 | 11,537,220 | ||||||
China Opportunities Fund | 9,918,643 | 12,114,029 | ||||||
Emerging Markets Fund | 524,750,620 | 2,039,851,822 | ||||||
Equity Long-Short Fund | 159,805,915 | 421,174,231 | ||||||
European Equity Fund | 896,844 | 475,422 | ||||||
Global Equity Fund | 38,177,930 | 46,278,949 | ||||||
Global Natural Resources Fund | 575,426 | 8,970,488 | ||||||
Global Small Cap Fund | 36,120,004 | 86,708,000 | ||||||
International Equity Fund | 95,683,008 | 215,636,551 | ||||||
Latin American Equity Fund | 355,625 | 158,932 | ||||||
Small Cap Fund | 38,910,354 | 52,910,277 | ||||||
U.S. Equity Fund | 86,783,869 | 122,021,941 | ||||||
6. Financial Highlights
The Global Equity Fund Institutional Service Class Financial Highlights prior to the fiscal year ended October 31, 2009 were as follows:
| Investment Activities | Distributions | Ratios / Supplemental Data | ||||||||||||||||||||||||||||||||||||||||||||||||||||||||||
| Net Asset Value, Beginning of Period | Net Investment Income (Loss) | Net Realized and Unrealized Gain (Loss) on Investments | Total from Investment Activities | Net Investment Income | Tax Return of Capital | Total Distributions | Redemption Fees | Net Asset Value, End of Period | Total Return (a)(b) | Net Assets at End of Period (000’s) | Ratio of Expenses to Average Net Assets (c) | Ratio of Net Investment Income (Loss) to Average Net Assets (c) | Ratio of Expenses (Prior to Reimbur- sements) to Average Net Assets (c)(d) | Portfolio Turnover (e) | ||||||||||||||||||||||||||||||||||||||||||||||
Year Ended October 31, 2008 | $ | 15.55 | 0.06 | (6.91 | ) | (6.85 | ) | (0.06 | ) | (0.01 | ) | (0.07 | ) | – | $ | 8.63 | (44.20 | %) | 15 | 1.35 | % | 0.55 | % | 1.54 | % | 241.73 | % | |||||||||||||||||||||||||||||||||
Year Ended October 31, 2007 | $ | 11.74 | 0.03 | 3.81 | 3.84 | (0.04 | ) | – | (0.04 | ) | 0.01 | $ | 15.55 | 32.84 | % | 39 | 1.42 | % | 0.17 | % | 1.42 | % | 257.25 | % | ||||||||||||||||||||||||||||||||||||
Year Ended October 31, 2006(f) | $ | 9.35 | 0.02 | 2.42 | 2.44 | (0.05 | ) | – | (0.05 | ) | – | $ | 11.74 | 26.17 | % | 20 | 1.65 | % | 0.15 | % | 1.70 | % | 298.51 | % | ||||||||||||||||||||||||||||||||||||
| (a) | Excludes sales charge. |
| (b) | Not annualized for periods less than one year. |
| (c) | Annualized for periods less than one year. |
| (d) | During the period, certain fees were waived and/or reimbursed. If such waivers/reimbursements had not occurred, the ratios would have been as indicated. |
| (e) | Portfolio turnover is calculated on the basis of the Fund as a whole without distinguishing among the classes of shares. |
| (f) | Net investment income (loss) is based on average shares outstanding during the period. |
7. Portfolio Investment Risks
| a. | Concentration Risk |
Investing 25% or more of the Aberdeen Global Natural Resources Fund’s net assets in a select group of companies in natural resources industries could subject the Aberdeen Global Natural Resources Fund to greater risk of loss and could be considerably more volatile than a broad-based market index or other mutual funds that are diversified across a greater number of industries.
| b. | Country/Regional Focus Risk |
Certain Funds may have significant exposure to a single country or geographical region, which involves increased currency, political, regulatory and other risks. Market swings in the targeted country or geographical region likely will have a greater effect on portfolio performance than they would in a more geographically diversified fund.
2014 Annual Report
141
Table of Contents
Notes to Financial Statements (continued)
October 31, 2014
| c. | Emerging Markets Risk |
Certain Funds are subject to Emerging Markets Risk. This is a magnification of the risks that apply to foreign investments. These risks are greater for securities of companies in emerging markets countries because the countries may have less stable governments, more volatile currencies and less established markets (see “Foreign Securities Risk” below).
| d. | Equity-Linked Notes |
Certain Funds may invest in equity-linked notes, which are generally subject to the same risks as the foreign equity securities or the basket of foreign securities they are linked to. If the linked security(ies) declines in value, the note may return a lower amount at maturity. The trading price of an equity-linked note also depends on the value of the linked security(ies).
| e. | Foreign Securities Risk |
Certain Funds are subject to Foreign Securities Risk. Foreign securities may be more volatile, harder to price and less liquid than U.S. securities. Foreign investments also may involve risks relating to the impact of currency exchange rate fluctuations.
Asia-Pacific (ex-Japan) Region. The Asia-Pacific (ex-Japan) region generally refers to the part of the world in or near the Western Pacific Ocean. The area includes much of East Asia, South Asia, Australasia and Oceania, but excludes Japan. Parts of the Asian-Pacific region may be subject to a greater degree of economic, political and social instability, as described below under “– Asian Risk.”
Asian Risk. Parts of the Asian region may be subject to a greater degree of economic, political and social instability than is the case in the United States and Europe. Some Asian countries can be characterized as emerging markets or newly industrialized and may experience more volatile economic cycles than developed countries. The developing nature of securities markets in many countries in the Asian region may lead to a lack of liquidity while some countries have restricted the flow of money in and out of the country. Some countries in Asia have historically experienced political uncertainty, corruption, military intervention and social unrest. A Fund investing heavily in Asia may be more volatile than a fund which is broadly diversified geographically.
China Risk. Certain Funds may concentrate investments in China and Hong Kong, which subjects those Funds to additional risks, and may make it significantly more volatile than geographically diverse mutual funds. Additional risks associated with investments in China and Hong Kong include exposure to currency fluctuations, less liquidity, expropriation, confiscatory taxation, nationalization, exchange control regulations (including currency blockage) and differing legal standards.
Europe – Recent Events. A number of countries in Europe have experienced severe economic and financial difficulties. Many non-governmental issuers, and even certain governments, have defaulted on, or been forced to restructure, their debts; many other issuers have faced difficulties obtaining credit or refinancing existing obligations; financial institutions have in many cases required government or central bank support, have needed to raise capital, and/or have been impaired in their ability to extend credit; and financial markets in Europe and elsewhere have experienced extreme volatility and declines in asset values and liquidity. These difficulties may continue, worsen or spread within and outside Europe. Responses to the financial problems by European governments, central banks and others, including austerity measures and reforms, may not work, may result in social unrest and may limit future growth and economic recovery or have other unintended consequences. Further defaults or restructurings by governments and others of their debt could have additional adverse effects on economies, financial markets and asset valuations around the world. In addition, one or more countries may abandon the euro, the common currency of the European Union, and/or withdraw from the European Union. The impact of these actions, especially if they occur in a disorderly fashion, is not clear but could be significant and far-reaching. Whether or not a Fund invests in securities of issuers located in Europe or with significant exposure to European issuers or countries, these events could negatively affect the value and liquidity of a Fund’s investments.
Latin American Risk. Latin American countries may be subject to a greater degree of political, sovereign and economic instability than is the case in the United States and Europe. Some Latin American countries can be characterized as emerging markets or newly industrialized and may experience more volatile economic cycles than developed countries. The developing nature of securities markets in many countries in the Latin American region may lead to a lack of liquidity. A Fund investing heavily in Latin America may be more volatile than a fund which is broadly diversified geographically.
| f. | Illiquid Securities |
Illiquid securities are assets which may not be sold or disposed of in the ordinary course of business within seven days at approximately the price at which a Fund has valued the investment on its books and may include such securities as those not registered under U.S. securities laws or securities that cannot be sold in public transactions. An inability to sell a portfolio position can adversely affect a Fund’s value or prevent the Fund from being able to take advantage of other investment opportunities.
Annual Report 2014
142
Table of Contents
Notes to Financial Statements (continued)
October 31, 2014
| g. | Impact of Large Redemptions and Purchases of Fund Shares |
Occasionally, shareholders may make large redemptions or purchases of Fund shares, which may cause the Fund to have to sell securities or invest additional cash. These transactions may adversely affect a Fund’s performance and increase transaction costs. In addition, large redemption requests may exceed the cash balance of a Fund and result in credit line borrowing fees and/or overdraft charges to the Fund until the sale of portfolio securities to cover the redemption request settle.
| h. | Long-Short Strategy Risk |
The strategy used by the Aberdeen Equity Long-Short Fund’s investment team may fail to produce the intended result. There is no guarantee that the use of long and short positions will succeed in limiting the Aberdeen Equity Long-Short Fund’s exposure to stock market movements, capitalization, sector swings or other risk factors.
| i. | Market Risk |
Deteriorating market conditions might cause a general weakness in the market that reduces the prices of securities in that market in which the Funds invests.
| j. | Mid-Cap Securities Risk |
Certain Funds are subject to Mid-Cap Securities Risk. Stocks of medium-sized companies tend to be more volatile and less liquid than stocks of larger companies.
| k. | Non-Diversified Fund Risk |
Because the Aberdeen European Equity Fund and Aberdeen Latin American Fund are non-diversified, the Funds may hold larger positions in fewer securities than other funds. As a result, a single security’s increase or decrease in value may have a greater impact on each Fund’s value and total return.
| l. | Securities Selection Risk |
Each Fund’s investment team may take long positions in securities that underperform the stock market or other funds with similar investment objectives and strategies or take short positions in securities that have positive performance.
| m. | Short Sale Risk |
Certain Funds are subject to Short Sale Risk. This is the risk that the price of a security sold short will increase in value between the time of the short sale and the time a Fund must purchase the security to return it to the lender. A Fund’s potential loss on a short sale could theoretically be unlimited in a case where the Fund is unable, for whatever reason, to close out its short position.
| n. | Small-Cap Securities Risk |
Certain Funds are subject to Small-Cap Securities Risk. Smaller companies are usually less stable in price and less liquid than those of larger, more established companies. Therefore, they generally involve greater risk.
| o. | Valuation Risk |
Certain Funds are subject to greater Valuation Risk than other funds. The lack of active trading markets may make it difficult to obtain an accurate price for a security held by a Fund.
Please read the prospectus for more detailed information regarding these and other risks.
8. Contingencies
In the normal course of business, the Funds may provide general indemnifications pursuant to certain contracts and organizational documents. The Funds’ maximum exposure under these arrangements is dependent on future claims that may be made against the Funds, and therefore, cannot be estimated; however, based on experience, the risk of loss from such claims is considered remote.
2014 Annual Report
143
Table of Contents
Notes to Financial Statements (continued)
October 31, 2014
9. Tax Information
As of October 31, 2014, the tax cost of securities and the breakdown of unrealized appreciation/(depreciation) for each Fund were as follows:
| Tax Cost of Securities | Unrealized Appreciation | Unrealized Depreciation | Net Unrealized Appreciation (Depreciation) | |||||||||||||
Asia-Pacific (ex-Japan) Equity Fund | $ | 1,037,009,034 | $ | 88,107,403 | $ | (46,704,055 | ) | $ | 41,403,348 | |||||||
Asia-Pacific Smaller Companies Fund | 31,125,834 | 1,889,217 | (2,004,363 | ) | (115,146 | ) | ||||||||||
China Opportunities Fund | 30,186,160 | 2,694,555 | (2,686,183 | ) | 8,372 | |||||||||||
Emerging Markets Fund | 9,375,383,791 | 1,640,765,838 | (984,570,883 | ) | 656,194,955 | |||||||||||
Equity Long-Short Fund | 280,034,102 | 73,704,249 | (3,613,078 | ) | 70,091,171 | |||||||||||
European Equity Fund | 6,112,799 | 410,962 | (425,029 | ) | (14,067 | ) | ||||||||||
Global Equity Fund | 139,508,403 | 23,050,463 | (5,857,995 | ) | 17,192,468 | |||||||||||
Global Natural Resources Fund | 24,621,408 | 3,402,326 | (4,893,748 | ) | (1,491,422 | ) | ||||||||||
Global Small Cap Fund | 239,503,506 | 30,884,058 | (13,667,780 | ) | 17,216,278 | |||||||||||
International Equity Fund | 783,047,769 | 144,692,610 | (49,756,620 | ) | 94,935,990 | |||||||||||
Latin American Equity Fund | 5,086,905 | 59,635 | (1,107,700 | ) | (1,048,065 | ) | ||||||||||
Small Cap Fund | 103,275,991 | 32,861,073 | (1,463,693 | ) | 31,397,380 | |||||||||||
U.S. Equity Fund | 310,349,565 | 110,288,409 | (3,109,221 | ) | 107,179,188 | |||||||||||
The tax character of distributions paid during the fiscal year ended October 31, 2014 was as follows (total distributions paid may differ from the Statements of Changes in Net Assets because for tax purposes dividends are recognized when actually paid):
| Distributions paid from | ||||||||||||||||||||||||
| Fund | Ordinary Income | Net Long Term Capital Gains | Total Taxable Distributions | Tax Exempt Distributions | Return of Capital | Total Distributions Paid | ||||||||||||||||||
Asia-Pacific (ex-Japan) Equity Fund | $ | 12,917,984 | $ | 5,494,081 | $ | 18,412,065 | $ | – | $ | – | $ | 18,412,065 | ||||||||||||
Asia-Pacific Smaller Companies Fund | 769,513 | 3,141,643 | 3,911,156 | – | – | 3,911,156 | ||||||||||||||||||
China Opportunities Fund | 267,716 | – | 267,716 | – | – | 267,716 | ||||||||||||||||||
Emerging Markets Fund | 180,668,939 | – | 180,668,939 | – | – | 180,668,939 | ||||||||||||||||||
Equity Long-Short Fund | – | 11,115,094 | 11,115,094 | – | – | 11,115,094 | ||||||||||||||||||
European Equity Fund | 160,833 | – | 160,833 | – | – | 160,833 | ||||||||||||||||||
Global Equity Fund | 5,530,691 | – | 5,530,691 | – | – | 5,530,691 | ||||||||||||||||||
Global Natural Resources Fund | 433,502 | – | 433,502 | – | – | 433,502 | ||||||||||||||||||
Global Small Cap Fund | 3,294,275 | 3,277,558 | 6,571,833 | – | – | 6,571,833 | ||||||||||||||||||
International Equity Fund | 36,767,663 | – | 36,767,663 | – | – | 36,767,663 | ||||||||||||||||||
Latin American Equity Fund | 80,612 | – | 80,612 | – | – | 80,612 | ||||||||||||||||||
Small Cap Fund | – | – | – | – | – | – | ||||||||||||||||||
U.S. Equity Fund | 4,398,493 | 3,091,978 | 7,490,471 | – | – | 7,490,471 | ||||||||||||||||||
Amounts listed as “–” are $0 or round to $0.
Annual Report 2014
144
Table of Contents
Notes to Financial Statements (continued)
October 31, 2014
The tax character of distributions paid during the fiscal year ended October 31, 2013 was as follows (total distributions paid may differ from the Statement of Changes in Net Assets because for tax purposes dividends are recognized when actually paid.):
| Distributions paid from | ||||||||||||||||||||||||
| Fund | Ordinary Income | Net Long Term Capital Gain | Total Taxable Distributions | Tax Exempt Distributions | Return of Capital | Total Distributions Paid | ||||||||||||||||||
Asia-Pacific (ex-Japan) Equity Fund | $ | 17,668,601 | $ | 8,336,648 | $ | 26,005,249 | $ | – | $ | – | $ | 26,005,249 | ||||||||||||
Asia-Pacific Smaller Companies Fund | 1,087,978 | 32,121 | 1,120,099 | – | – | 1,120,099 | ||||||||||||||||||
China Opportunities Fund | 120,185 | – | 120,185 | – | – | 120,185 | ||||||||||||||||||
Emerging Markets Fund | 183,645,400 | – | 183,645,400 | – | – | 183,645,400 | ||||||||||||||||||
Equity Long-Short Fund | – | 6,229,395 | 6,229,395 | – | – | 6,229,395 | ||||||||||||||||||
European Equity Fund | 63,069 | – | 63,069 | – | – | 63,069 | ||||||||||||||||||
Global Equity Fund | 2,004,456 | – | 2,004,456 | – | – | 2,004,456 | ||||||||||||||||||
Global Natural Resources Fund | 308,778 | – | 308,778 | – | – | 308,778 | ||||||||||||||||||
Global Small Cap Fund | 683,620 | – | 683,620 | – | – | 683,620 | ||||||||||||||||||
International Equity Fund | 17,848,109 | – | 17,848,109 | – | – | 17,848,109 | ||||||||||||||||||
Latin American Equity Fund | 20,248 | – | 20,248 | – | – | 20,248 | ||||||||||||||||||
Small Cap Fund | – | – | – | – | – | – | ||||||||||||||||||
U.S. Equity Fund | 3,330,031 | – | 3,330,031 | – | – | 3,330,031 | ||||||||||||||||||
Amounts listed as “–” are $0 or round to $0.
As of October 31, 2014, the components of accumulated earnings (deficit) on a tax basis were as follows:
| Fund | Undistributed Tax Exempt Income | Undistributed Ordinary Income | Undistributed Long-Term Capital Gains | Accumulated Earnings | Distributions Payable | Late Year Ordinary and Post- October Capital Loss Deferrals | Other Temporary Differences | Accumulated Capital and Other Losses** | Unrealized Appreciation/ Depreciation* | Total Accumulated Earnings (Deficit) | ||||||||||||||||||||||||||||||
Asia-Pacific (ex-Japan) Equity Fund | $ | – | $ | 1,249,311 | $ | 17,473,584 | $ | 18,722,895 | $ | – | $ | – | $ | – | $ | – | $ | 40,635,449 | $ | 59,358,344 | ||||||||||||||||||||
Asia-Pacific Smaller Companies Fund | – | 90,399 | 664,824 | 755,223 | – | – | – | – | (133,469 | ) | 621,754 | |||||||||||||||||||||||||||||
China Opportunities Fund | – | 53,711 | – | 53,711 | – | – | (82 | ) | (11,157,193 | ) | 8,983 | (11,094,581 | ) | |||||||||||||||||||||||||||
Emerging Markets Fund | – | 17,868,697 | 286,806,912 | 304,675,609 | – | – | – | – | 655,173,926 | 959,849,535 | ||||||||||||||||||||||||||||||
Equity Long-Short Fund | – | – | 50,623,614 | 50,623,614 | – | (4,152,063 | ) | – | – | 35,679,503 | 82,151,054 | |||||||||||||||||||||||||||||
European Equity Fund | – | 40,047 | 33,080 | 73,127 | – | – | – | – | (15,018 | ) | 58,109 | |||||||||||||||||||||||||||||
Global Equity Fund | – | 247,291 | – | 247,291 | – | – | – | (8,149,413 | ) | 17,178,362 | 9,276,240 | |||||||||||||||||||||||||||||
Global Natural Resources Fund | – | 83,782 | – | 83,782 | – | – | – | (28,882,345 | ) | (1,491,878 | ) | (30,290,441 | ) | |||||||||||||||||||||||||||
Global Small Cap Fund | – | 1,598,235 | 13,534,805 | 15,133,040 | – | – | – | – | 17,188,872 | 32,321,912 | ||||||||||||||||||||||||||||||
International Equity Fund | – | 2,005,524 | – | 2,005,524 | – | – | – | (84,636,377 | ) | 94,765,204 | 12,134,351 | |||||||||||||||||||||||||||||
Latin American Equity Fund | – | 11,882 | – | 11,882 | – | – | – | (8,020 | ) | (1,048,525 | ) | (1,044,663 | ) | |||||||||||||||||||||||||||
Small Cap Fund | – | – | – | – | – | (514,327 | ) | – | (415,633,183 | ) | 31,397,380 | (384,750,130 | ) | |||||||||||||||||||||||||||
U.S. Equity Fund | – | 508,816 | 25,770,015 | 26,278,831 | – | – | – | (31,693,036 | ) | 107,179,047 | 101,764,842 | |||||||||||||||||||||||||||||
| * | The difference between the book-basis and tax-basis unrealized appreciation/(depreciation) is attributable primarily to passive foreign investment companies and tax deferral of losses on wash sales. |
2014 Annual Report
145
Table of Contents
Notes to Financial Statements (continued)
October 31, 2014
| ** | As of October 31, 2014, for Federal income tax purposes, the following Funds have capital loss carryforwards available to offset capital gains, if any, to the extent provided by the Treasury regulations, which expire in the years set forth below: |
| Fund | Amount | Expires | ||||
China Opportunities Fund | $ | 11,157,193 | 2017 (Short-Term) | |||
Global Equity Fund | 299,633 | 2016 (Short-Term) | ||||
Global Equity Fund | | 7,300,761 | | 2017 (Short-Term) | ||
Global Equity Fund | 549,019 | Unlimited (Short-Term) | ||||
Global Natural Resources Fund | 28,882,345 | 2017 (Short-Term) | ||||
International Equity Fund | 84,636,377 | 2017 (Short-Term) | ||||
Latin America Equity Fund | 7,129 | Unlimited (Short-Term) | ||||
Latin America Equity Fund | 891 | Unlimited (Long-Term) | ||||
Small Cap Fund | 110,031,073 | 2016 (Short-Term) | ||||
Small Cap Fund | 305,602,110 | 2017 (Short-Term) | ||||
U.S. Equity Fund | 11,408,228 | 2016 (Short-Term) | ||||
U.S. Equity Fund | 20,284,808 | 2017 (Short-Term) | ||||
Amounts listed as “–” are $0 or round to $0.
Under the Regulated Investment Company Modernization Act of 2010, the Funds are permitted to carry forward capital losses incurred in taxable years beginning after December 22, 2010 for an unlimited period. However, any losses incurred during those taxable years will be required to be utilized prior to the losses incurred in pre-enactment taxable years. As a result of this ordering rule, pre-enactment capital loss carryforwards may be more likely to expire unused. Additionally, post-enactment capital losses that are carried forward will retain their character as either short-term or long-term capital losses rather than being considered all short-term as under previous law.
GAAP requires that certain components of net assets be adjusted to reflect permanent differences between financial and tax reporting. Accordingly, the table below details the necessary reclassifications, which are a result of permanent differences primarily attributable to foreign currency transactions, foreign capital gains taxes, passive foreign investment companies, capital loss acquired through reorganizations and net operating losses. These reclassifications have no effect on net assets or net asset values per share.
| Fund | Paid-in Capital | Accumulated Net Investment Income/(Loss) | Accumulated Net Realized Gain/(Loss) | |||||||||
Asia-Pacific (ex-Japan) Equity Fund | $ | – | $ | (856,556 | ) | $ | 856,556 | |||||
Asia-Pacific Smaller Companies Fund | – | 2,737 | (2,737 | ) | ||||||||
China Opportunities Fund | – | (740 | ) | 740 | ||||||||
Emerging Markets Fund | – | 4,347,500 | (4,347,500 | ) | ||||||||
Equity Long-Short Fund | (4,608,854 | ) | 4,600,743 | 8,111 | ||||||||
European Equity Fund | – | 2 | (2 | ) | ||||||||
Global Equity Fund | – | 47,402 | (47,402 | ) | ||||||||
Global Natural Resources Fund | – | (6,001 | ) | 6,001 | ||||||||
Global Small Cap Fund | – | 701,228 | (701,228 | ) | ||||||||
International Equity Fund | – | 132,105 | (132,105 | ) | ||||||||
Latin American Equity Fund | – | 113 | (113 | ) | ||||||||
Small Cap Fund | (178,632 | ) | (153,649 | ) | 332,281 | |||||||
U.S. Equity Fund | – | 7,176 | (7,176 | ) | ||||||||
Annual Report 2014
146
Table of Contents
Notes to Financial Statements (continued)
October 31, 2014
10. Significant Shareholders
As of October 31, 2014, the following Funds had shareholders with the percentage ownership indicated, which are considered significant shareholders (holdings greater than 5.0%) for financial reporting purposes:
| Fund | Record Ownership % | Number of Account Owners | ||||
Asia-Pacific (ex-Japan) Equity Fund | 12.8 | % | 1 | |||
Asia-Pacific Smaller Companies Fund | – | 0 | ||||
China Opportunities Fund | 19.9 | 1 | ||||
Emerging Markets Fund | 49.7 | 4 | ||||
Equity Long-Short Fund | 65.8 | 2 | ||||
European Equity Fund | 98.2 | 3 | ||||
Global Equity Fund | 60.7 | 4 | ||||
Global Natural Resources Fund | 56.2 | 3 | ||||
Global Small Cap Fund | 58.5 | 1 | ||||
International Equity Fund | 43.2 | 3 | ||||
Latin American Equity Fund | 97.2 | 1 | ||||
Small Cap Fund | 33.4 | 4 | ||||
U.S. Equity Fund | 11.9 | 1 | ||||
11. Fund Reorganizations
Effective February 25, 2013, the U.S. Equity Fund acquired all of the assets and assumed all of the liabilities of the U.S. Equity II Fund. The acquisition was accomplished by a tax-free exchange as follows:
4,634,801 shares of the U.S. Equity II Fund, fair valued at $69,346,732, for 6,407,686 shares of the U.S. Equity Fund.
The investment portfolio and cash of the U.S. Equity II Fund with a fair value of $69,346,732 were the principal assets acquired by the U.S. Equity Fund. For financial reporting purposes, assets received and shares issued by the U.S. Equity Fund were recorded at value; however, the cost basis of the investments received from the U.S. Equity II Fund was carried forward to align ongoing reporting of the U.S. Equity Fund’s realized and unrealized gains and losses with amounts distributable to shareholders for tax purposes. The U.S. Equity Fund acquired capital loss carryovers of $21,312,042 (subject to future annual limitations). Immediately prior to the merger, the net assets of the U.S. Equity II Fund were $69,346,732.
Assuming that the U.S. Equity merger had been completed on November 1, 2012, the pro forma results of operations for the year ended October 31, 2013 are as follows:
Net investment income | $ | 4,105,127 | ||
Net realized and unrealized gain from investments | 87,008,662 | |||
Net increase in net assets resulting from operations | 91,113,789 |
Because the combined investment portfolios have been managed as a single integrated portfolio since the merger was completed, it is not practical to separate the amounts of revenue and earnings of the U.S. Equity II Fund that have been reflected in the Statements of Operations since February 25, 2013 for the U.S. Equity Fund.
2014 Annual Report
147
Table of Contents
Notes to Financial Statements (continued)
October 31, 2014
The chart below shows a summary of net assets, shares outstanding, net asset value per share, net unrealized appreciation/(depreciation), and accumulated net realized gains/(losses), before and after the reorganization.
| Before Reorganization | After Reorganization | |||||||||||
| U.S. Equity II Fund | U.S. Equity Fund | U.S. Equity Fund | ||||||||||
| Net Assets: | ||||||||||||
Class A/Class A | $ | 67,631,922 | $ | 195,389,497 | $ | 263,021,419 | ||||||
Class C/Class C | 1,714,810 | 8,052,914 | 9,767,725 | |||||||||
Class R/Class R | – | 452,617 | 452,617 | |||||||||
Institutional Service Class/ Institutional Service Class | – | 118,192,565 | 118,192,565 | |||||||||
Institutional Class/ Institutional Class | – | 3,186,689 | 3,186,689 | |||||||||
| Shares Outstanding: | ||||||||||||
Class A/Class A | 4,489,639 | 18,015,388 | 24,251,217 | |||||||||
Class C/Class C | 145,162 | 807,059 | 978,916 | |||||||||
Class R/Class R | – | 43,465 | 43,465 | |||||||||
Institutional Service Class/ Institutional Service Class | – | 10,469,012 | 10,469,012 | |||||||||
Institutional Class/ Institutional Class | – | 282,257 | 282,257 | |||||||||
| Net Asset Value per Share: | ||||||||||||
Class A/Class A | $ | 15.06 | $ | 10.85 | $ | 10.85 | ||||||
Class C/Class C | 11.81 | 9.98 | 9.98 | |||||||||
Class R/Class R | – | 10.41 | 10.41 | |||||||||
Institutional Service Class/ Institutional Service Class | – | 11.29 | 11.29 | |||||||||
Institutional Class/ Institutional Class | – | 11.29 | 11.29 | |||||||||
Net unrealized appreciation/(depreciation) | 14,177,990 | 66,030,785 | 80,208,775 | |||||||||
Accumulated net realized gain/(loss) | (21,347,109 | ) | (45,490,759 | ) | (45,490,759 | ) | ||||||
12. Line of Credit
Effective August 15, 2014, the Trust, on behalf of each of the funds of the Trust (the “Borrowers”), entered into a credit agreement (the “Agreement”) with State Street Bank and Trust Company (the “Bank”). The Agreement provides for a revolving credit facility (the “Credit Facility”) to be utilized for temporary or emergency purposes to fund shareholder redemptions or other short-term liquidity purposes. The amount of the Credit Facility was $400,000,000 for the period ended October 31, 2014.
Principal on each outstanding loan made under the Agreement bears interest at a variable rate per annum equal to the higher of (a) the Federal Funds Rate as in effect of that day plus 1.25% or (b) the Overnight London Interbank Offered Rate (“LIBOR”) as in effect on that day plus 1.25%. In addition, the Borrowers shall pay to the Bank a commitment fee at the rate of 0.10% per annum on the daily unused portion of the Credit Facility, as applicable, which is allocated among the Borrowers in such manner as is determined by the Board to be reasonable. As of October 31, 2014, the Funds had no borrowings outstanding under the Credit Facility.
13. Recent Accounting Pronouncements
In June 2014, the Financial Accounting Standards Board issued guidance to improve the financial reporting of repurchase agreements and other similar transactions. The guidance includes expanded disclosure requirements for entities that enter into repurchase agreements and similar transactions accounted for as secured borrowings. The guidance is effective for financial statements with fiscal years beginning on or after December 15, 2014 and interim periods within those fiscal years. Management is evaluating the impact, if any, of this guidance on the Funds’ financial statement disclosures.
14. Subsequent Events
On September 8, 2014, the Board of Trustees of the Aberdeen Funds, on behalf of the Global Equity Fund (the “Fund”), approved the reorganization between the Fund and the Aberdeen Global Select Opportunities Fund Inc. (a fund that is not a series of the Trust and has
Annual Report 2014
148
Table of Contents
Notes to Financial Statements (concluded)
October 31, 2014
oversight from a different board than that of the Fund). Aberdeen has determined that the Fund would be considered the accounting and performance survivor of the reorganization. Subject to approval by the shareholders of the Aberdeen Global Select Opportunities Fund Inc., the reorganization is expected to take place at the end of February 2015.
Management has evaluated the need for disclosures and/or adjustments resulting from subsequent events through the date the Financial Statements were issued. Based on this evaluation, no disclosures and/or adjustments other than those described above were required to the Financial Statements as of October 31, 2014.
2014 Annual Report
149
Table of Contents
Shareholder Expense Examples (Unaudited)
As a shareholder of the Aberdeen Funds, you incur two types of costs: (1) transaction costs, including sales charges (loads) paid on purchase payments and (2) ongoing costs, including investment advisory fees, administration fees, transfer agent out-of-pocket expenses, distribution fees and other Fund expenses. The examples below are intended to help you understand your ongoing costs (in dollars) of investing in the Aberdeen Funds and to compare these costs with the ongoing costs of investing in other mutual funds.
The examples assume that you had a $1,000 investment in the Class at the beginning of the reporting period, May 1, 2014 and continued to hold your shares at the end of the reporting period, October 31, 2014.
Actual Expenses
The table below provides information about actual account values and actual expenses. You may use the information together with the amount you invested, to estimate the expenses that you paid over the period. Simply divide your account value by $1,000 (for example, an $8,600 account value divided by $1,000 = 8.6), then multiply the result by the number under the heading entitled “Actual Expenses Paid During Period” for the class of a Fund that you own to estimate the expenses you paid on your account during the period.
Hypothetical Example for Comparison Purposes
The table below provides information about hypothetical account values and hypothetical expenses based on the Class’ actual expense ratio and an assumed rate of return of 5% per year before expenses, which is not the Class’ actual return. The hypothetical account values and expenses may not be used to estimate the actual ending account balance or expenses you paid for the period. You may use this information to compare the ongoing costs of investing in the Class of a Fund and other funds. To do so, compare the 5% hypothetical example with the 5% hypothetical examples that appear in the shareholder reports of the other funds.
Please note that the expenses shown in the table are meant to highlight your ongoing costs only and do not reflect any transaction costs, such as sales charges (loads). Therefore, the information for each Class in the table is useful in comparing ongoing costs only, and will not help you determine the relative total costs of owning different funds. In addition, if these transaction costs were included, your costs would have been higher. The examples also assume all dividends and distributions have been reinvested.
| Beginning Account Value, May 1, 2014 | Actual Ending Account Value, October 31, 2014 | Hypothetical Ending Account Value | Actual Expenses Paid During Period* | Hypothetical Expenses Paid During Period*1 | Annualized Expense Ratio** | |||||||||||||||||||||
Aberdeen Asia-Pacific (ex-Japan) Equity Fund | Class A | $ | 1,000.00 | $ | 1,016.70 | $ | 1,017.69 | $ | 7.57 | $ | 7.58 | 1.49% | ||||||||||||||
| Class C | 1,000.00 | 1,013.50 | 1,013.86 | 11.42 | 11.42 | 2.25% | ||||||||||||||||||||
| Class R | 1,000.00 | 1,015.90 | 1,016.28 | 8.99 | 9.00 | 1.77% | ||||||||||||||||||||
| Institutional Service Class | 1,000.00 | 1,018.10 | 1,018.65 | 6.61 | 6.61 | 1.30% | ||||||||||||||||||||
| Institutional Class | 1,000.00 | 1,018.40 | 1,018.90 | 6.36 | 6.36 | 1.25% | ||||||||||||||||||||
Aberdeen Asia-Pacific Smaller Companies Fund | Class A | 1,000.00 | 1,035.60 | 1,016.03 | 9.34 | 9.25 | 1.82% | |||||||||||||||||||
| Class C | 1,000.00 | 1,032.60 | 1,012.60 | 12.81 | 12.68 | 2.50% | ||||||||||||||||||||
| Class R | 1,000.00 | 1,034.30 | 1,015.07 | 10.31 | 10.21 | 2.01% | ||||||||||||||||||||
| Institutional Service Class | 1,000.00 | 1,036.70 | 1,017.69 | 7.65 | 7.58 | 1.49% | ||||||||||||||||||||
| Institutional Class | 1,000.00 | 1,037.20 | 1,017.64 | 7.70 | 7.63 | 1.50% | ||||||||||||||||||||
Aberdeen China Opportunities Fund | Class A | 1,000.00 | 1,017.10 | 1,015.63 | 9.66 | 9.65 | 1.90% | |||||||||||||||||||
| Class C | 1,000.00 | 1,012.90 | 1,012.00 | 13.29 | 13.29 | 2.62% | ||||||||||||||||||||
| Class R | 1,000.00 | 1,014.70 | 1,013.76 | 11.53 | 11.52 | 2.27% | ||||||||||||||||||||
| Institutional Service Class | 1,000.00 | 1,018.20 | 1,016.89 | 8.39 | 8.39 | 1.65% | ||||||||||||||||||||
| Institutional Class | 1,000.00 | 1,017.40 | 1,017.04 | 8.24 | 8.24 | 1.62% | ||||||||||||||||||||
Aberdeen Emerging Markets Fund | Class A | 1,000.00 | 1,009.50 | 1,018.10 | 7.14 | 7.17 | 1.41% | |||||||||||||||||||
| Class C | 1,000.00 | 1,005.60 | 1,014.62 | 10.62 | 10.66 | 2.10% | ||||||||||||||||||||
| Class R | 1,000.00 | 1,007.30 | 1,016.18 | 9.06 | 9.10 | 1.79% | ||||||||||||||||||||
| Institutional Service Class | 1,000.00 | 1,009.80 | 1,018.45 | 6.79 | 6.82 | 1.34% | ||||||||||||||||||||
| Institutional Class | 1,000.00 | 1,011.60 | 1,019.66 | 5.58 | 5.60 | 1.10% | ||||||||||||||||||||
Aberdeen Equity Long-Short Fund | Class A | 1,000.00 | 1,033.70 | 1,011.04 | 14.40 | 14.24 | 2.81% | |||||||||||||||||||
| Class C | 1,000.00 | 1,030.60 | 1,007.41 | 18.07 | 17.86 | 3.53% | ||||||||||||||||||||
| Class R | 1,000.00 | 1,031.60 | 1,008.62 | 16.85 | 16.66 | 3.29% | ||||||||||||||||||||
| Institutional Service Class | 1,000.00 | 1,034.90 | 1,011.09 | 14.36 | 14.19 | 2.80% | ||||||||||||||||||||
| Institutional Class | 1,000.00 | 1,036.30 | 1,012.70 | 12.73 | 12.58 | 2.48% | ||||||||||||||||||||
Annual Report 2014
150
Table of Contents
Shareholder Expense Examples (Unaudited) (concluded)
| Beginning Account Value, May 1, 2014 | Actual Ending Account Value, October 31, 2014 | Hypothetical Ending Account Value | Actual Expenses Paid During Period* | Hypothetical Expenses Paid During Period*1 | Annualized Expense Ratio** | |||||||||||||||||||||
Aberdeen European Equity Fund | Class A | $ | 1,000.00 | $ | 888.50 | $ | 1,018.40 | $ | 6.43 | $ | 6.87 | 1.35% | ||||||||||||||
| Class C | 1,000.00 | 885.80 | 1,014.62 | 9.98 | 10.66 | 2.10% | ||||||||||||||||||||
| Class R | 1,000.00 | 888.10 | 1,017.19 | 7.57 | 8.08 | 1.59% | ||||||||||||||||||||
| Institutional Service Class | 1,000.00 | 889.70 | 1,019.71 | 5.19 | 5.55 | 1.09% | ||||||||||||||||||||
| Institutional Class | 1,000.00 | 889.70 | 1,019.66 | 5.24 | 5.60 | 1.10% | ||||||||||||||||||||
Aberdeen Global Equity Fund | Class A | 1,000.00 | 983.80 | 1,017.24 | 7.90 | 8.03 | 1.58% | |||||||||||||||||||
| Class C | 1,000.00 | 980.80 | 1,014.07 | 11.03 | 11.22 | 2.21% | ||||||||||||||||||||
| Class R | 1,000.00 | 982.40 | 1,015.78 | 9.34 | 9.50 | 1.87% | ||||||||||||||||||||
| Institutional Service Class | 1,000.00 | 986.50 | 1,019.11 | 6.06 | 6.16 | 1.21% | ||||||||||||||||||||
| Institutional Class | 1,000.00 | 985.80 | 1,019.11 | 6.06 | 6.16 | 1.21% | ||||||||||||||||||||
Aberdeen Global Natural Resources Fund | Class A | 1,000.00 | 910.10 | 1,017.80 | 7.08 | 7.48 | 1.47% | |||||||||||||||||||
| Class C | 1,000.00 | 906.90 | 1,014.32 | 10.38 | 10.97 | 2.16% | ||||||||||||||||||||
| Class R | 1,000.00 | 909.40 | 1,016.64 | 8.18 | 8.64 | 1.70% | ||||||||||||||||||||
| Institutional Service Class | 1,000.00 | 911.10 | 1,019.36 | 5.59 | 5.90 | 1.16% | ||||||||||||||||||||
| Institutional Class | 1,000.00 | 911.20 | 1,019.36 | 5.59 | 5.90 | 1.16% | ||||||||||||||||||||
Aberdeen Global Small Cap Fund | Class A | 1,000.00 | 997.20 | 1,017.19 | 8.00 | 8.08 | 1.59% | |||||||||||||||||||
| Class C | 1,000.00 | 993.70 | 1,013.61 | 11.56 | 11.67 | 2.30% | ||||||||||||||||||||
| Class R | 1,000.00 | 995.70 | 1,015.58 | 9.61 | 9.70 | 1.91% | ||||||||||||||||||||
| Institutional Service Class | 1,000.00 | 997.70 | 1,017.39 | 7.80 | 7.88 | 1.55% | ||||||||||||||||||||
| Institutional Class | 1,000.00 | 999.00 | 1,018.65 | 6.55 | 6.61 | 1.30% | ||||||||||||||||||||
Aberdeen International Equity Fund | Class A | 1,000.00 | 960.10 | 1,018.55 | 6.52 | 6.72 | 1.32% | |||||||||||||||||||
| Class C | 1,000.00 | 956.40 | 1,014.97 | 10.01 | 10.31 | 2.03% | ||||||||||||||||||||
| Class R | 1,000.00 | 959.00 | 1,016.99 | 8.05 | 8.29 | 1.63% | ||||||||||||||||||||
| Institutional Service Class | 1,000.00 | 961.20 | 1,019.36 | 5.73 | 5.90 | 1.16% | ||||||||||||||||||||
| Institutional Class | 1,000.00 | 961.90 | 1,020.01 | 5.09 | 5.24 | 1.03% | ||||||||||||||||||||
Aberdeen Latin American Equity Fund | Class A | 1,000.00 | 939.40 | 1,017.39 | 7.58 | 7.88 | 1.55% | |||||||||||||||||||
| Class C | 1,000.00 | 937.10 | 1,013.61 | 11.23 | 11.67 | 2.30% | ||||||||||||||||||||
| Class R | 1,000.00 | 938.10 | 1,016.23 | 8.70 | 9.05 | 1.78% | ||||||||||||||||||||
| Institutional Service Class | 1,000.00 | 940.70 | 1,018.90 | 6.11 | 6.36 | 1.25% | ||||||||||||||||||||
| Institutional Class | 1,000.00 | 940.70 | 1,018.65 | 6.36 | 6.61 | 1.30% | ||||||||||||||||||||
Aberdeen Small Cap Fund | Class A | 1,000.00 | 1,060.30 | 1,017.85 | 7.58 | 7.43 | 1.46% | |||||||||||||||||||
| Class C | 1,000.00 | 1,056.30 | 1,014.37 | 11.14 | 10.92 | 2.15% | ||||||||||||||||||||
| Class R | 1,000.00 | 1,058.90 | 1,016.59 | 8.87 | 8.69 | 1.71% | ||||||||||||||||||||
| Institutional Service Class | 1,000.00 | 1,061.70 | 1,019.41 | 5.98 | 5.85 | 1.15% | ||||||||||||||||||||
| Institutional Class | 1,000.00 | 1,061.80 | 1,019.41 | 5.98 | 5.85 | 1.15% | ||||||||||||||||||||
Aberdeen U.S. Equity Fund | Class A | 1,000.00 | 1,038.60 | 1,019.31 | 6.01 | 5.96 | 1.17% | |||||||||||||||||||
| Class C | 1,000.00 | 1,034.90 | 1,015.63 | 9.75 | 9.65 | 1.90% | ||||||||||||||||||||
| Class R | 1,000.00 | 1,037.40 | 1,018.10 | 7.24 | 7.17 | 1.41% | ||||||||||||||||||||
| Institutional Service Class | 1,000.00 | 1,040.20 | 1,020.22 | 5.09 | 5.04 | 0.99% | ||||||||||||||||||||
| Institutional Class | 1,000.00 | 1,040.70 | 1,020.67 | 4.63 | 4.58 | 0.90% | ||||||||||||||||||||
| * | Expenses are equal to the Fund’s annualized expense ratio multiplied by the average account value over the period multiplied by 184/365 (to reflect the one-half year period). |
| ** | The expense ratio presented represents a six-month, annualized ratio. |
| 1 | Represents the hypothetical 5% return before expenses. |
2014 Annual Report
151
Table of Contents
Report of Independent Registered Public Accounting Firm
The Board of Trustees and Shareholders of Aberdeen Funds:
We have audited the accompanying statements of assets and liabilities, including the statements of investments, of the Aberdeen Asia-Pacific (ex-Japan) Equity Fund, Aberdeen Asia-Pacific Smaller Companies Fund, Aberdeen China Opportunities Fund, Aberdeen Emerging Markets Fund, Aberdeen Equity Long-Short Fund, Aberdeen European Equity Fund, Aberdeen Global Equity Fund, Aberdeen Global Natural Resources Fund, Aberdeen Global Small Cap Fund, Aberdeen International Equity Fund, Aberdeen Latin American Equity Fund, Aberdeen Small Cap Fund and Aberdeen U.S. Equity Fund, thirteen of the funds comprising Aberdeen Funds (the “Funds”), as of October 31, 2014, and the related statements of operations for the year then ended, the statements of changes in net assets for each of the years in the two-year period then ended and the financial highlights for each of the years or periods in the five-year period then ended. These financial statements and financial highlights are the responsibility of the Funds’ management. Our responsibility is to express an opinion on these financial statements and financial highlights based on our audits.
We conducted our audits in accordance with the standards of the Public Company Accounting Oversight Board (United States). Those standards require that we plan and perform the audit to obtain reasonable assurance about whether the financial statements and financial highlights are free of material misstatement. An audit includes examining, on a test basis, evidence supporting the amounts and disclosures in the financial statements. Our procedures included confirmation of securities owned as of October 31, 2014, by correspondence with custodians and brokers, or by other appropriate auditing procedures. An audit also includes assessing the accounting principles used and significant estimates made by management, as well as evaluating the overall financial statement presentation. We believe that our audits provide a reasonable basis for our opinion.
In our opinion, the financial statements and financial highlights referred to above present fairly, in all material respects, the financial position of the Funds as of October 31, 2014, the results of their operations for the year then ended, the changes in their net assets for each of the years in the two-year period then ended and the financial highlights for each of the years or periods in the five-year period then ended, in conformity with U.S. generally accepted accounting principles.

Philadelphia, Pennsylvania
December 26, 2014
Annual Report 2014
152
Table of Contents
Other Tax Information (Unaudited)
For the period ended October 31, 2014, certain dividends paid by the Funds may be subject to a maximum tax rate of 15% as provided for by the Jobs and Growth Tax Relief Reconciliation Act of 2003. The Funds intend to designate the maximum amount allowable as taxed as a maximum rate of 15%. Complete information will be reported in conjunction with your 2013 Form 1099-DIV.
For the year ended October 31, 2014, the following Funds paid qualified dividend income:
| Fund | Qualified Dividend Income | |||
Asia-Pacific (ex-Japan) Equity Fund | 88.00% | |||
Asia-Pacific Smaller Companies Fund | 90.00% | |||
China Opportunities Fund | 100.00% | |||
Emerging Markets Fund | 77.00% | |||
European Equity Fund | 100.00% | |||
Global Equity Fund | 89.00% | |||
Global Natural Resources Fund | 100.00% | |||
Global Small Cap Fund | 100.00% | |||
International Equity Fund | 100.00% | |||
Latin America Equity Fund | 27.00% | |||
U.S. Equity Fund | 100.00% | |||
For the taxable year ended October 31, 2014, the following percentage of income dividends paid by the Funds qualify for the dividends received deduction available to corporate shareholders:
| Fund | Dividends Received Deduction | |||
Asia-Pacific (ex-Japan) Equity Fund | 1.00% | |||
China Opportunities Fund | 5.00% | |||
Global Equity Fund | 18.00% | |||
Global Natural Resources Fund | 23.00% | |||
Global Small Cap Fund | 10.00% | |||
U.S. Equity Fund | 100.00% | |||
2014 Annual Report
153
Table of Contents
Other Tax Information (Unaudited) (concluded)
The Funds intend to elect to pass through to their shareholders the credit for taxes paid in foreign countries during its fiscal year ended October 31, 2014. In accordance with the current tax laws, the foreign income and foreign tax per share (for a share outstanding as of October 31, 2014) was as follows:
| Fund | Foreign Tax | |||
Asia-Pacific (ex-Japan) Equity Fund | $0.01488 | |||
Asia-Pacific Smaller Companies Fund | $0.01624 | |||
China Opportunities Fund | $0.01480 | |||
Emerging Markets Fund | $0.04305 | |||
European Equity Fund | $0.01757 | |||
Global Equity Fund | $0.03340 | |||
Global Natural Resources Fund | $0.04103 | |||
Global Small Cap Fund | $0.04116 | |||
International Equity Fund | $0.04800 | |||
Latin America Equity Fund | $0.01901 | |||
During the year ended October 31, 2014, the following Funds designated dividends as long-term capital gains:
| Fund | Amount | |||
Asia-Pacific (ex-Japan) Equity Fund | $5,494,081 | |||
Asia-Pacific Smaller Companies Fund | 3,141,643 | |||
Equity Long-Short Fund | 11,115,094 | |||
Global Small Cap Fund | 3,277,558 | |||
U.S. Equity Fund | 3,091,978 | |||
Annual Report 2014
154
Table of Contents
Supplemental Information (Unaudited)
Board of Trustees’ Consideration of Advisory and Sub-Advisory Agreements
At an in-person meeting of the Board of Trustees (the “Board” or the “Trustees”) of the Aberdeen Funds (the “Trust”) held on June 11, 2014, the Board, including a majority of the Trustees who are not considered to be “interested persons” of the Trust (the “Independent Trustees”) under the Investment Company Act of 1940, as amended (the “1940 Act”), approved for an annual period the continuation of the Trust’s advisory agreement (the “Advisory Agreement”) with Aberdeen Asset Management Inc. (“AAMI”) and the applicable sub-advisory agreements (each a “Sub-Advisory Agreement,” and collectively with the Advisory Agreement, the “Agreements”) between: (i) AAMI and Aberdeen Asset Management Asia Limited (“AAMAL”) and (ii) AAMI and Aberdeen Asset Managers Limited (“AAML”) (each a “Sub-Adviser,” and collectively, the “Sub-Advisers”) for each series of the Trust identified below (each a “Fund,” and collectively the “Funds”). AAMAL and AAML are affiliates of AAMI. AAMI and the Sub-Advisers are sometimes referred to collectively as the “Advisers.”
In connection with contract review meetings, the Board reviews a variety of information provided by the Advisers relating to the Funds, the Agreements and the Advisers, including comparative performance, fee and expense information and other information regarding the nature, extent and quality of services provided by the Advisers under their respective Agreements. The materials provided to the Board generally include, among other items: (i) information on the investment performance of the Funds and the performance of peer groups of funds and the Funds’ performance benchmarks; (ii) information on the Funds’ advisory fees and other expenses, including information comparing each Fund’s expenses to those of a peer group of funds and information about any applicable expense limitations and fee “breakpoints”; (iii) sales and redemption data with respect to each Fund; (iv) information about the profitability of the Agreements to the Advisers; (v) a report prepared by the Advisers in response to a request submitted by the Independent Trustees’ independent legal counsel on behalf of such Trustees; and (vi) a memorandum from the Independent Trustees’ independent legal counsel on the responsibilities of the Board of Trustees in considering for approval the investment advisory and investment sub-advisory arrangements under the 1940 Act and Delaware law. The Board of Trustees, including the Independent Trustees, also considers other matters such as: (i) the Advisers’ financial results and financial condition; (ii) each Fund’s investment objective and strategies; (iii) the Advisers’ investment personnel and operations; (iv) arrangements relating to the distribution of the Funds’ shares and the related costs; (v) the procedures employed to determine the value of the Funds’ assets; (vi) the allocation of the Funds’ brokerage, if any, including, if applicable, allocations to brokers affiliated with the Advisers and the use, if any, of “soft” commission dollars to pay Fund expenses and to pay for research and other similar services; (vii) the resources devoted to, and the record of compliance with, the Funds’ investment policies and restrictions, policies on personal securities transactions and other compliance policies; and (viii) possible conflicts of interest. The Board also considers the nature, extent and quality of the services provided to the Funds by AAMI’s affiliates. Throughout the process, the Trustees are afforded the opportunity to ask questions of and request additional materials from AAMI and the Sub-Advisers.
In addition to the materials requested by the Trustees in connection with their annual consideration of the continuation of the Agreements, the Trustees receive materials in advance of each regular quarterly meeting of the Board that provide information relating to the services provided by the Advisers, including detailed information about the Funds’ investment performance. This information generally includes, among other things, third-party performance rankings for various periods (including prior to the Advisers’ management of the Funds) comparing each Fund against its peer group, total return information for various periods, and details of sales and redemptions of Fund shares for the period. The Board also receives periodic presentations from the portfolio management teams in connection with the performance of the Funds.
The Independent Trustees were advised by separate independent legal counsel throughout the process. The Independent Trustees also consulted in executive sessions with counsel to the Independent Trustees regarding consideration of the renewal of the Agreements. In considering whether to approve the continuation of the Agreements, the Board of Trustees, including the Independent Trustees, did not identify any single factor as determinative. Individual Trustees may have evaluated the information presented differently from one another, giving different weights to various factors. Matters considered by the Trustees, including the Independent Trustees, in connection with their approval of the continuation of the Agreements included the factors listed below.
The nature, extent and quality of the services provided to the Funds under the Agreements. The Trustees considered the nature, extent and quality of the services provided by AAMI and the Sub-Advisers, as applicable, to the Funds and the resources dedicated to the Funds by AAMI and its affiliates. The Board considered, among other things, the Advisers’ investment experience. The Board also considered the background and experience of the Advisers’ senior management personnel and the qualifications, background and responsibilities of the portfolio managers that are primarily responsible for the day-to-day portfolio management services for the Funds. The Board also considered the allocation of responsibilities among the Advisers. The Trustees considered not only the advisory services provided by AAMI to the Funds, but also the administrative services provided by AAMI to the Funds under a separate administration agreement. AAMI’s role in coordinating the activities of the Trust’s other service providers was also considered. The Board also considered that it receives information on a regular basis from the Trust’s Chief Compliance Officer regarding the Advisers’ compliance policies and procedures. The Board also considered the Advisers’ risk management processes. The Board was also mindful of the Advisers’ focus on the monitoring of the performance of the Funds and in addressing performance matters. The Trustees also considered the benefits to shareholders of investing in a mutual fund that is part of a family of funds that offers shareholders the right to exchange shares of one type of fund for shares of another type of fund, and provides a variety of fund and shareholder
2014 Annual Report
155
Table of Contents
Supplemental Information (Unaudited) (continued)
services. The Board also took into account its knowledge of management and the quality of the performance of management’s duties through Board meetings, discussion and reports during the preceding year.
After reviewing these and related factors, the Board concluded that the nature, extent and quality of the services provided were extensive in nature and of high quality and supported the renewal of the Agreements.
Investment performance of the Funds and the Advisers. The Trustees received information about the performance of the Funds over various time periods, including information which compared the performance of the Funds to the performance of peer groups of funds and each Fund’s performance benchmark. The Trustees also considered the performance of the Funds compared to the performance of comparable funds or accounts managed by AAMI and its affiliates to the extent available. In addition, the Trustees also reviewed data prepared by an independent third party which analyzed the performance of the Funds using a variety of performance metrics.
The Trustees considered that AAMI and its affiliates commenced management of a number of the Funds only upon those Funds’ reorganization into the Trust. The Trustees also considered AAMI’s and the Sub-Advisers’ performance and reputation generally, the performance of the fund family generally, and the historical responsiveness of AAMI to Trustee concerns about performance and the willingness of AAMI and the Sub-Advisers to take steps intended to improve performance. The Trustees also considered the performance of the Advisers since they commenced management of the Funds.
In addition to the foregoing, the Trustees considered the specific factors set forth below with respect to the performance of each Fund for the periods ended March 31, 2014:
Aberdeen European Equity Fund. The Board noted that the Fund underperformed its peer group average and benchmark for the 1- year period.
Aberdeen Latin American Equity Fund. The Board noted that the Fund underperformed its peer group average and benchmark for the 1- year period.
Aberdeen China Opportunities Fund. The Board noted that the Fund outperformed its peer group average and benchmark for the 5-year period and underperformed its peer group average and benchmark for the 1- and 3-year periods.
Aberdeen Equity Long-Short Fund. The Board noted that the Fund underperformed its peer group average and primary benchmark for the 1-, 3-, 5-and 10-year periods but outperformed its secondary benchmark for the 1-, 3-, 5- and 10-year periods.
Aberdeen Global Equity Fund. The Board noted that the Fund underperformed its peer group average and its benchmark for the 1-, 3- and 5-year periods. The Fund outperformed its peer group and its benchmark for the 10-year period.
Aberdeen Global Small Cap Fund. The Board noted that the Fund outperformed its peer group average for the 3- and 5-year periods and underperformed its peer group average for the 1-,and 10- year periods. The Fund underperformed its benchmark for the 1-, 3-, 5- and 10- year periods. The Board noted the fact that the Advisers commenced managing the Fund on July 20, 2009, and that performance prior to that date represents the performance of the Fund’s previous investment adviser.
Aberdeen International Equity Fund. The Board noted that the Fund outperformed its peer group average and its benchmark for the 3-, 5- and 10-year periods. The Fund underperformed its peer group and its benchmark for the 1-year period.
Aberdeen Global Natural Resources Fund. The Board noted that the Fund underperformed its peer group average and its benchmark for the 1-, 3-and 5-year periods.
Aberdeen Small Cap Fund. The Board noted that the Fund outperformed its peer group average for the 10-year period and underperformed its peer group average for the 1-, 3- and 5-year periods. The Fund outperformed its benchmark for the 1-, 5- and 10- year periods and underperformed its benchmark for the 3-year period. The Board noted that the Adviser began advising the Fund on June 23, 2008, and that performance prior to that date represents the performance of the Fund’s previous investment adviser.
Aberdeen U.S. Equity Fund. The Board noted that the Fund underperformed its peer group average and its benchmark for the 1-, 3-, 5- and 10-year periods.
Aberdeen Emerging Markets Fund. The Board noted that the Fund outperformed its peer group average and benchmark for the 3- and 5-year periods and underperformed its peer group average and its benchmark for the 1-year period.
Aberdeen Asia-Pacific (ex-Japan) Equity Fund. The Board noted that the Fund underperformed its peer group average and benchmark for the 1-year period and outperformed its peer group average and benchmark for the 3-year period.
Annual Report 2014
156
Table of Contents
Supplemental Information (Unaudited) (continued)
Aberdeen Asia-Pacific Smaller Companies Fund. The Board noted that the Fund underperformed its peer group average and benchmark for the 1-year period.
After discussion, the Board concluded that it will continue to monitor the Funds’ performance and any actions taken by AAMI and its affiliates relating to performance.
The costs of the services provided and profits realized by the Advisers and their affiliates from their relationships with the Funds. The Trustees considered the fees charged to the Funds for advisory services as well as the total expense levels of the Funds. This information included comparisons (provided both by management and also by an independent third party) of each Fund’s net management fee and total expense level to those of its peer group (the “Expense Group”) and information about the advisory fees charged by AAMI to any separately managed accounts with a similar strategy. In comparing each Fund’s net management fee to that of comparable funds, the Board noted that such fee includes both advisory and administrative fees. In considering the fees charged to any comparable accounts, the Trustees considered, among other things, management’s discussion of the differences required to manage the different types of accounts. In evaluating the Funds’ advisory fees, the Trustees also took into account the demands, complexity and quality of the investment management of the Funds.
The Trustees also noted that the sub-advisory fees, as applicable, for the Funds would be paid by AAMI, not the Funds, out of its advisory fee. The Board also considered that AAMI had entered into expense limitation agreements with the Funds, pursuant to which AAMI agreed to waive a portion of its advisory fee and/or reimburse certain expenses as a means of limiting each Fund’s total annual operating expenses for a period of time.
The Trustees also considered the compensation directly or indirectly received by AAMI and its affiliates from their relationships with the Funds. The Trustees reviewed information provided by management as to the profitability of AAMI and its affiliates’ relationships with the Funds, such as the engagement of affiliates of AAMI to provide distribution and administrative services to the Funds. The Trustees also examined the profitability of AAMI and its affiliates on a Fund-by-Fund basis. The Trustees also considered information about the allocation of expenses used to calculate profitability. When reviewing profitability, the Trustees also considered information about court cases regarding adviser profitability, the performance of the Funds, the expense levels of the Funds, and whether AAMI had implemented breakpoints and expense limitations with respect to the Funds.
In addition to the foregoing, the Trustees considered the specific factors set forth below with respect to each Fund’s fees and expenses:
Aberdeen European Equity Fund. The Board considered that the Fund’s net management fee and net total expenses after waivers were below the median of the Expense Group.
Aberdeen Latin American Equity Fund. The Board considered that the Fund’s net management fee and net total expenses after waivers were below the median of the Expense Group.
Aberdeen China Opportunities Fund. The Board considered that the Fund’s net management fee and net total expenses after waivers were above the median of the Expense Group.
Aberdeen Equity Long-Short Fund. The Board considered that the Fund’s net management fee was approximately at the median of the Expense Group, that net total expenses excluding investment-related expenses were below the median of the Expense Group and that net total expenses including investment-related expenses were above the median of the Expense Group.
Aberdeen Global Equity Fund. The Board considered that the Fund’s net management fee and net total expenses after waivers were above the median of the Expense Group.
Aberdeen Global Small Cap Fund. The Board considered that the Fund’s net management fee and net total expenses after waivers were above the median of the Expense Group. The Trustees noted that management had implemented breakpoints in the Fund’s advisory fee schedule in 2010.
Aberdeen International Equity Fund. The Board considered that the Fund’s net management fee and net total expenses after waivers were above the median of the Expense Group.
Aberdeen Global Natural Resources Fund. The Board considered that the Fund’s net management fee was below the median of the Expense Group and that the Fund’s net total expenses after waivers were above the median of the Expense Group.
Aberdeen Small Cap Fund. The Board considered that the Fund’s net management fee was equal to the median of the Expense Group and that the Fund’s net total expenses after waivers were above the median of the Expense Group.
Aberdeen U.S. Equity Fund. The Board considered that the Fund’s net management fee was above the median of the Expense Group and that the Fund’s net total expenses after waivers were below the median of the Expense Group.
2014 Annual Report
157
Table of Contents
Supplemental Information (Unaudited) (concluded)
Aberdeen Emerging Markets Fund. The Board considered that the Fund’s net management fee and net total expenses after waivers were each below the median of the Expense Group.
Aberdeen Asia-Pacific (ex-Japan) Equity Fund. The Board considered that the Fund’s net management fee was above the median of the Expense Group and that the Fund’s net total expenses were below the median of the Expense Group.
Aberdeen Asia-Pacific Smaller Companies Fund. The Board considered that the Fund’s net management fee and net total expenses after waivers were each above the median of the Expense Group.
After reviewing these and related factors, including taking into account management’s discussion regarding Fund expenses, the Board concluded that the advisory fee, and as applicable, the sub-advisory fees, were fair and reasonable, and that the costs of these services generally and the related profitability of AAMI and its affiliates from their relationships with the Funds were reasonable and supported the renewal of the Agreements.
Economies of Scale. The Trustees considered the existence of any economies of scale in the provision of services by AAMI and the Sub-Advisers and whether those economies would be shared with the Funds through breakpoints in the investment advisory fees or other means, such as expense waivers or limitations. The Trustees noted that each of the Funds was subject to an expense limitation and that certain Funds were subject to breakpoints. The Board noted management’s discussion of the Funds’ advisory fee structure. The Trustees also took note of the costs of the services provided and the profitability to AAMI and its affiliates from their relationships with the Funds, as discussed above. The Board also considered the potential effect of each Fund’s growth and size on fees, noting that if a Fund’s assets increase over time, the Fund may realize other economies of scale if assets increase proportionally more than some expenses.
After reviewing these and related factors, the Board concluded that the advisory fee, and as applicable, sub-advisory fee structures were reasonable and reflect economies of scale being shared between the Funds and the Advisers, and supported the renewal of the Agreements.
The Trustees also considered other factors, which included but were not limited to the following:
| • | the effect of any market and economic volatility on the performance, asset levels and expense ratios of the Funds. |
| • | whether the Funds have operated in accordance with their investment objectives and the Funds’ record of compliance with their investment restrictions, and the compliance programs of the Trust and AAMI. The Trustees also considered the compliance-related resources AAMI and its affiliates were providing to the Funds. |
| • | the nature, quality, cost and extent of administrative services performed by AAMI under the Advisory Agreement and under a separate agreement covering administrative services. |
| • | so-called “fallout benefits” to AAMI, such as the benefits of research made available to AAMI by reason of brokerage commissions generated by the Funds’ securities transactions or reputational and other indirect benefits. The Trustees considered any possible conflicts of interest associated with these fallout and other benefits, and the reporting, disclosure and other processes in place to disclose and monitor such possible conflicts of interest. |
* * *
Based on their evaluation of all factors that they deemed to be material, including those factors described above, and assisted by the advice of independent counsel, the Trustees, including the Independent Trustees, concluded that renewal of the Agreements would be in the best interest of each of the Funds and its shareholders. Accordingly, the Board, and the Independent Trustees voting separately, approved the Agreements for an additional one-year period.
Annual Report 2014
158
Table of Contents
Management of the Funds (Unaudited)
As of October 31, 2014
The names of the Trustees and officers of the Funds, their addresses, years of birth, and principal occupations during the past five years are provided in the tables below. Trustees that are deemed “interested persons” (as that term is defined in Section 2(a)(19) of the 1940 Act) of the Funds and the investment adviser are included in the table below under the heading “Interested Trustees.” Trustees who are not interested persons as described above are referred to in the table below under the heading “Independent Trustees.”
The Statement of Additional Information includes additional information about the Trustees of the Funds and is available, without charge, on the Funds’ website at www.aberdeen-asset.com/us, or upon request at 1-866-667-9231.
Trustees and Officers of the Trust
| Name, Address, and Year of Birth | Position(s) Held, Length of Time Served and Term of Office* | Principal Occupation During Past 5 Years | Number of Portfolios in Fund Complex Overseen by Trustee** | Other Directorships Held by Trustee During Past 5 Years*** | ||||
Independent Trustees | ||||||||
P. Gerald Malone**** Year of Birth: 1950 | Trustee since December 2007 Chairman of the Board | Mr. Malone is, by profession, a solicitor of some 38 years standing. He has served as a Minister of State in the United Kingdom Government. Mr. Malone currently serves as Independent Chairman of a London AIM-listed company (healthcare software) and a UK based privately-owned pharmaceutical company. He is Chairman of the Board of Trustees of Aberdeen Funds, Chairman of the Board of Directors of Aberdeen Global Income Fund, Inc. and Aberdeen Asia-Pacific Income Fund, Inc. and serves on the boards of Aberdeen Australia Equity Fund, Inc. and Aberdeen Asia-Pacific Income Investment Company Limited. | 27 | None. | ||||
Richard H. McCoy**** Year of Birth: 1942 | Trustee since December 2007 | Prior to retiring in 2003, Mr. McCoy was Vice-Chairman, Investment Banking, at TD Securities Inc. He is currently a Director of Uranium Participation Corp. and Pizza Pizza Royalty Income Fund, Chair of Chorus Aviation Inc. and an Independent Review Committee member of Uranium Participation Corp. Mr. McCoy has also been Chairman of Aberdeen Asia-Pacific Income Investment Company Limited since 2010. | 24 | None. | ||||
Neville J. Miles Year of Birth: 1946 | Trustee since December 2011 | Mr. Miles is, and has been for over ten years, Chairman of Ballyshaw Pty. Ltd. (share trading, real estate development and investment). He is Chairman of the Board of Directors of Aberdeen Australia Equity Fund, Inc. He also is a non-executive director of a number of Australian and overseas companies. | 27 | None. | ||||
2014 Annual Report
159
Table of Contents
Management of the Funds (Unaudited) (continued)
As of October 31, 2014
| Name, Address, and Year of Birth | Position(s) Held, Length of Time Served and Term of Office* | Principal Occupation During Past 5 Years | Number of Portfolios in Fund Complex Overseen by Trustee** | Other Directorships Held by Trustee During Past 5 Years*** | ||||
Peter D. Sacks**** Year of Birth: 1945 | Trustee since December 2007 | Mr. Sacks has been a Director and Founding Partner of Toron AMI International Asset Management (formerly, Toron Investment Management) (investment management) since 1988. He is also a Director and Investment Advisory Committee member of several private and public sector funds in Canada. | 27 | None. | ||||
John T. Sheehy**** Year of Birth: 1942 | Trustee since December 2007 | Mr. Sheehy has been a Senior Managing Director of B.V. Murray and Company (investment banking) since 2001 and Director of Macquarie AIR-serv Holding, Inc. (automotive services) from 2006 to 2013. He was a Managing Member of Pristina Capital Partners, LLC (water purification technology development) from 2007 to 2011, a Director of Smarte Carte, Inc. (airport services) from 2007 to 2010, and Managing Member of The Value Group LLC (venture capital) from 1997 to 2009. | 27 | None. | ||||
Warren C. Smith**** Year of Birth: 1955 | Trustee since December 2007 | Mr. Smith has been a founding partner of MRB Partners Inc. (independent investment research and consultancy firm) since 2010. Mr. Smith was a Managing Editor with The Bank Credit Analyst Research Group (independent publishers of financial market research and publications, including The Bank Credit Analyst) from 1982 to 2009. | 24 | None. | ||||
John F. Solan, Jr.**** Year of Birth: 1939 | Trustee since December 2007 | Prior to retiring, Mr. Solan was Senior Vice President of Strategic Development at The Phoenix Companies, Inc. and Chairman of Phoenix Charter Oak Trust Company from 1998 until 2004. Mr. Solan served in several different positions with Ernst & Young from 1964 to 1998. | 24 | None. |
Annual Report 2014
160
Table of Contents
Management of the Funds (Unaudited) (continued)
As of October 31, 2014
| Name, Address, and Year of Birth | Position(s) Held, Length of Time Served and Term of Office* | Principal Occupation During Past 5 Years | Number of Portfolios in Fund Complex Overseen by Trustee** | Other Directorships Held by Trustee During Past 5 Years*** | ||||
Interested Trustee | ||||||||
Martin Gilbert****† Year of Birth: 1955 | Trustee since December 2007 | Mr. Gilbert is a founding director and shareholder, and Chief Executive of Aberdeen Asset Management PLC, the holding company of the fund management group that was established in 1983 (“Aberdeen Group”). He was a Director (1991–2014) of Aberdeen Asset Management Asia Limited and a Director (2000–2014) of Aberdeen Asset Management Limited. He was a Director (1995–2014) and was President (September 2006–2014) of Aberdeen Asset Management Inc. Mr. Gilbert also serves as officer and/or director of various Aberdeen Group subsidiary companies, Aberdeen-managed investment trusts and funds’ boards. | 28 | None. | ||||
| * | Each Trustee holds office for an indefinite term until his successor is elected and qualified. |
| ** | The Aberdeen Fund Complex consists of the Trust which currently consists of 24 portfolios, Aberdeen Asia-Pacific Income Fund, Inc., Aberdeen Global Income Fund, Inc., Aberdeen Australia Equity Fund, Inc., Aberdeen Chile Fund, Inc., Aberdeen Israel Fund, Inc., Aberdeen Indonesia Fund, Inc., Aberdeen Latin America Equity Fund, Inc., Aberdeen Emerging Markets Smaller Company Opportunities Fund, Inc., Aberdeen Singapore Fund, Inc., The Asia Tigers Fund, Inc., The India Fund, Inc., Aberdeen Greater China Fund, Inc., Aberdeen Japan Equity Fund, Inc., Aberdeen Investment Funds and Aberdeen Global Select Opportunities Fund Inc. |
| *** | Directorships held in (1) any other investment companies registered under the 1940 Act, (2) any company with a class of securities registered pursuant to Section 12 of the Securities Exchange Act of 1934, as amended (the “Exchange Act”) or (3) any company subject to the requirements of Section 15(d) of the Exchange Act. |
| **** | Each Trustee may be contacted by writing to the Trustee c/o Aberdeen Asset Management Inc., 1735 Market Street, 32nd Floor, Philadelphia, Pennsylvania 19103, Attn: Alan Goodson. |
| † | Mr. Gilbert is considered to be an “interested person” of the Trust as defined in the 1940 Act because of his affiliation with the Adviser. |
2014 Annual Report
161
Table of Contents
Management of the Funds (Unaudited) (continued)
As of October 31, 2014
Officers of the Trust
| Name, Address, and Year of Birth | Position(s) Held, Length of Time Served and Term of Office* | Principal Occupation During Past 5 Years | ||
Bev Hendry** Aberdeen Asset Management Inc. 1735 Market Street 32nd Floor Philadelphia, PA 19103 Year of Birth: 1953 | President, Chief Executive Officer and Principal Executive Officer (Since September 2014) | Currently, Co-Head of Americas and Chief Financial Officer for Aberdeen Asset Management Inc. since June 2014. He first joined Aberdeen in 1987 and helped establish Aberdeen’s business in the Americas in Fort Lauderdale. Mr. Hendry left Aberdeen in 2008 when the company moved to consolidate its headquarters in Philadelphia. Mr. Hendry re-joined Aberdeen from Hansberger Global Investors in Fort Lauderdale, Florida, where he worked for six years as Chief Operating Officer. | ||
Jeffrey Cotton** Aberdeen Asset Management Inc. 1735 Market Street 32nd Floor Philadelphia, PA 19103 Year of Birth: 1977 | Vice President and Chief Compliance Officer (Since March 2011) | Currently, Vice President and Head of Compliance– Americas for Aberdeen Asset Management Inc. Mr. Cotton joined Aberdeen in 2010. Prior to joining Aberdeen, Mr. Cotton was a Senior Compliance Officer at Old Mutual Asset Management (2009-2010) supporting its affiliated investment advisers and mutual fund platform. Mr. Cotton was also a Vice President and Senior Compliance Manager at Bank of America/Columbia Management (2006-2009). | ||
Sofia Rosala** Aberdeen Asset Management Inc. 1735 Market Street 32nd Floor Philadelphia, PA 19103 Year of Birth: 1974 | Vice President (since March 2014) and Deputy Chief Compliance Officer (Since December 2013) | Currently, Deputy Fund Chief Compliance Officer and U.S. Counsel for Aberdeen Asset Management Inc. (since July, 2012). Prior to joining Aberdeen, Ms. Rosala was Counsel for Vertex, Inc. from April 2011 to June 2012. She was also an Associate Attorney with Morgan, Lewis and Bockius from May 2008–April 2011. | ||
Andrea Melia** Aberdeen Asset Management Inc. 1735 Market Street 32nd Floor Philadelphia, PA 19103 Year of Birth: 1969 | Treasurer, Chief Financial Officer, and Principal Accounting Officer (Since September 2009) | Currently, Vice President and Head of Fund Administration for Aberdeen Asset Management Inc. (since 2009). Prior to joining Aberdeen, Ms. Melia was Director of Fund Administration and accounting oversight for Princeton Administrators LLC, a division of BlackRock Inc. and had worked with Princeton Administrators since 1992. | ||
Megan Kennedy** Aberdeen Asset Management Inc. 1735 Market Street 32nd Floor Philadelphia, PA 19103 Year of Birth: 1974 | Secretary and Vice President (Since September 2009) | Currently, Head of Product Management for Aberdeen Asset Management Inc. Ms. Kennedy joined Aberdeen Asset Management Inc. in 2005 as a Senior Fund Administrator. Ms. Kennedy was promoted to Assistant Treasurer Collective Funds/North American Mutual Funds in February 2008 and promoted to Treasurer Collective Funds/North American Mutual Funds in July 2008. | ||
Lucia Sitar** Aberdeen Asset Management Inc. 1735 Market Street 32nd Floor Philadelphia, PA 19103 Year of Birth: 1971 | Vice President (Since December 2008) | Currently, Managing U.S. Counsel for Aberdeen Asset Management Inc. Ms. Sitar joined Aberdeen Asset Management Inc. in July 2007. |
Annual Report 2014
162
Table of Contents
Management of the Funds (Unaudited) (continued)
As of October 31, 2014
| Name, Address, and Year of Birth | Position(s) Held, Length of Time Served and Term of Office* | Principal Occupation During Past 5 Years | ||
Brad Crombie Aberdeen Asset Management Bow Bells House 1 Bread Street London EC4M 9HH Year of Birth: 1970 | Vice President (Since June 2013) | Currently, Global Head of Fixed Income for Aberdeen Asset Management PLC. Mr. Crombie re-joined Aberdeen in 2012. Prior to re-joining Aberdeen, Mr. Crombie was a Managing Director at Bank of America Merrill Lynch for the bank’s non-financial corporate and high yield credit research team for the Europe, Middle East and Africa region from 2003 to 2012. | ||
Alan Goodson** Aberdeen Asset Management Inc. 1735 Market Street 32nd Floor Philadelphia, PA 19103 Year of Birth: 1974 | Vice President (Since March 2009) | Currently, Head of Product–US, overseeing Product Management, Product Development and Investor Services for Aberdeen’s registered and unregistered investment companies in the US and Canada. Mr. Goodson is Vice President of Aberdeen Asset Management Inc. and joined Aberdeen in 2000. | ||
Adam McCabe** Aberdeen Asset Management Asia Limited 21 Church Street #01-01 Capital Square Two Singapore 049480 Year of Birth: 1979 | Vice President (Since March 2010) | Currently, Head of Asian Fixed Income on the Fixed Income–Asia Pacific desk, responsible for currency and interest rate strategies in Aberdeen’s Asian fixed income portfolios. Mr. McCabe joined Aberdeen in 2009 following the acquisition of certain asset management businesses from Credit Suisse. Adam worked for Credit Suisse since 2001, where he was an investment manager responsible for the development and implementation of its Asian currency and interest rate strategies. | ||
Jennifer Nichols** Aberdeen Asset Management Inc. 1735 Market Street 32nd Floor Philadelphia, PA 19103 Year of Birth: 1978 | Vice President (Since December 2007) | Currently, Global Head of Legal for Aberdeen Asset Management PLC. Director and Vice President for Aberdeen Asset Management Inc. (since October 2006). | ||
Hugh Young** Aberdeen Asset Management Asia Limited 21 Church Street #01-01 Capital Square Two Singapore 049480 Year of Birth: 1958 | Vice President (Since June 2011) | Currently, Managing Director of Aberdeen Asset Management Asia Limited (since 1991) and member of the Executive Management Committee and Director of Aberdeen Asset Management PLC (since 1991 and 2011, respectively). Mr. Young joined Aberdeen in 1991. | ||
Brian O’Neill** Aberdeen Asset Management Inc. 1735 Market Street 32nd Floor Philadelphia, PA 19103 Year of Birth: 1968 | Assistant Treasurer (Since September 2008) | Currently, Senior Fund Administration Manager–US for Aberdeen Asset Management Inc. Mr. O’Neill joined Aberdeen Asset Management Inc. in 2008. Prior to joining Aberdeen Asset Management Inc., Mr. O’Neill was a Director of Fund Accounting with Nationwide Funds Group (2002-2008). | ||
Eric Olsen Aberdeen Asset Management Inc. 1735 Market Street 32nd Floor Philadelphia, PA 19103 Year of Birth: 1970 | Assistant Treasurer (Since December 2013) | Currently, Deputy Head of Fund Administration–US for Aberdeen Asset Management Inc. Mr. Olsen joined Aberdeen Asset Management Inc. in August 2013. Prior to joining Aberdeen Asset Management Inc., Mr. Olsen was a Director of Financial Reporting for BNY Mellon Asset Servicing and had worked with BNY Mellon since 1998. |
2014 Annual Report
163
Table of Contents
Management of the Funds (Unaudited) (concluded)
As of October 31, 2014
| Name, Address, and Year of Birth | Position(s) Held, Length of Time Served and Term of Office* | Principal Occupation During Past 5 Years | ||
Pamela Wade** Aberdeen Asset Management Inc. 1735 Market Street 32nd Floor Philadelphia, PA 19103 Year of Birth: 1971 | Assistant Secretary (Since March 2013) | Currently, Senior Product Manager for Aberdeen Asset Management Inc. Ms. Wade joined Aberdeen Asset Management Inc. in 2012 as Senior Product Manager. Prior to joining Aberdeen Asset Management Inc., Ms. Wade was a Vice President and Assistant Counsel with BNY Mellon Asset Servicing (2007-2012). |
| * | Each officer holds office for an indefinite term at the pleasure of the Board of Trustees and until his or her successor is elected and qualified. |
| ** | Mr. Hendry, Ms. Melia, Ms. Kennedy, Mr. Goodson, Ms. Nichols, Mr. Cotton, Mr. McCabe, Mr. Young, Ms. Sitar, Mr. O’Neill, Ms. Wade and Ms. Rosala hold officer position(s) in one or more of the following: Aberdeen Asia-Pacific Income Fund, Inc., Aberdeen Australia Equity Fund, Inc., Aberdeen Global Income Fund, Inc., Aberdeen Chile Fund, Inc., Aberdeen Israel Fund, Inc., Aberdeen Indonesia Fund, Inc., Aberdeen Latin America Equity Fund, Inc., Aberdeen Emerging Markets Smaller Company Opportunities Fund, Inc., Aberdeen Singapore Fund, Inc., The Asia Tigers Fund, Inc., The India Fund, Inc., Aberdeen Greater China Fund, Inc., Aberdeen Japan Equity Fund, Inc., Aberdeen Investment Funds and Aberdeen Global Select Opportunities Fund Inc., each of which may also be deemed to be a part of the same “Fund Complex” as the Trust. |
Annual Report 2014
164
Table of Contents
Management Information
Trustees
P. Gerald Malone, Chairman
Martin J. Gilbert
Richard H. McCoy
Neville J. Miles
Peter D. Sacks
John T. Sheehy
Warren C. Smith
John F. Solan, Jr.
Officers
Bev Hendry, President and Chief Executive Officer
Jeffrey Cotton, Chief Compliance Officer and Vice President
Sofia Rosala, Deputy Chief Compliance Officer and Vice President
Andrea Melia, Treasurer and Chief Financial Officer
Megan Kennedy, Secretary and Vice President
Brad Crombie, Vice President
Lucia Sitar, Vice President
Alan Goodson, Vice President
Adam McCabe, Vice President
Jennifer Nichols, Vice President
Hugh Young, Vice President
Eric Olsen, Assistant Treasurer
Brian O’Neill, Assistant Treasurer
Pamela Wade, Assistant Secretary
Investment Manager
Aberdeen Asset Management Inc.
1735 Market Street, 32nd Floor
Philadelphia, PA 19103
Fund Administrator
Aberdeen Asset Management Inc.
1735 Market Street, 32nd Floor
Philadelphia, PA 19103
Transfer Agent
Boston Financial Data Services, Inc.
30 Dan Road
Canton, MA 02021
Distributor
Aberdeen Fund Distributors LLC
1735 Market Street, 32nd Floor
Philadelphia, PA 19103
Sub-Administrator, Custodian & Fund Accountant
State Street Bank and Trust Company
1 Iron Street 5th Floor
Boston, MA 02110
Independent Registered Public Accounting Firm
KPMG LLP
1601 Market Street
Philadelphia, PA 19103
Fund Counsel
Willkie Farr & Gallagher LLP
787 Seventh Avenue
New York, NY 10019
Table of Contents
Aberdeen Asset Management Inc. 1735 Market Street, 32nd Floor Philadelphia, PA 19103 aberdeen-asset.us | |
AOE-0140-AR
Table of Contents

Aberdeen Funds
Asset Allocations Series
Annual Report
October 31, 2014
Aberdeen Diversified Alternatives Fund
Aberdeen Diversified Income Fund
Aberdeen Dynamic Allocation Fund

Table of Contents
| Page 1 | ||||
| Page 2 | ||||
| Page 3 | ||||
| Page 8 | ||||
| Page 13 | ||||
| Page 18 | ||||
| Page 30 | ||||
| Page 43 | ||||
| Page 44 | ||||
| Page 45 | ||||
| Page 46 | ||||
| Page 49 | ||||
Investors should carefully consider a fund’s investment objectives, risks, fees, charges and expenses before investing any money. To obtain this and other fund information, please call 866-667-9231 to request a prospectus, or download a prospectus at www.aberdeen-asset.us. Please read it carefully before investing any money.
Investing in mutual funds involves risk, including possible loss of principal.
Aberdeen Funds is distributed by Aberdeen Fund Distributors LLC, Member FINRA, 1735 Market Street, 32nd Floor, Philadelphia, PA 19103.
Aberdeen Asset Management Inc. (AAMI) has been registered as an investment adviser under the Investment Advisers Act of 1940 since August 23, 1995.
Statement Regarding Availability of Quarterly Portfolio Schedule.
The complete schedule of portfolio holdings for each Fund of Aberdeen Funds is included in the Funds’ semi-annual and annual reports to shareholders. Aberdeen Funds also files complete schedules of portfolio holdings for each Fund with the Securities and Exchange Commission (the “Commission”) for the first and third quarters of each fiscal year on Form N-Q. The Funds’ Form N-Q filings are available on the Commission’s website at http://www.sec.gov. The Funds’ Form N-Q filings may be reviewed and copied at the Commission’s Public Reference Room in Washington, DC, and information on the operation of the Public Reference Room may be obtained by calling 800-SEC-0330; and the Funds make the information on Form N-Q available to shareholders on www.aberdeen-asset.us or upon request without charge.
Statement Regarding Availability of Proxy Voting Record.
Information regarding the policies and procedures that the Funds use to determine how to vote proxies relating to portfolio securities is available without charge, upon request, by calling 1-866-667-9231. The information is also included in the Funds’ Statement of Additional Information, which is available on the Funds’ website at www.aberdeen-asset.us and on the Commission’s website at www.sec.gov.
Information relating to how each Fund voted proxies relating to portfolio securities held during the most recent twelve months ended June 30 is available by August 30 of the relevant year: (i) upon request and without charge by calling 1-866-667-9231; and (ii) on the Commission’s website at www.sec.gov.
Table of Contents
October 31, 2014
Dear Valued Shareholder,
Welcome to the Aberdeen Funds Annual Report covering the activities for the twelve-month period ended October 31, 2014.
Market overview
Global equity markets continued to be dominated by concerns over global economic growth levels during the reporting period, lagging their U.S. counterparts. Strong U.S. equity market performance buoyed global markets as deflationary pressures continued to cause headwinds in Europe. Meanwhile, emerging markets finished the period with weak returns as a strong sell-off in September overshadowed gains from earlier in the year. The fixed income universe was volatile over the period, as investment-grade core and total return bond markets delivered modest returns against the backdrop of struggling global equity markets and falling commodity prices. Meanwhile, the global high yield bond market came under significant pressure during the period after yields and spreads made new lows in late June.
Markets continue to brace for more headwinds as we enter 2015 given the environment of slow global growth, a potential U.S. interest rate hike on the horizon and falling oil prices. In the U.S., voters elected eight new Republican senators as the GOP will take control of both houses of Congress in January 2015. The implications of this shift remain unclear, but dramatic legislative moves are likely to be made regarding healthcare and government spending. In emerging markets, the election of pro-business candidate Narendra Modi as the new Prime Minister of India has buoyed the outlook for the world’s 10th largest economy. In Europe, tensions between Russia and the West continue to hinder Russian markets.
Anne Richards, Aberdeen Asset Management PLC’s (Aberdeen) Global Chief Investment Officer, provides you with a detailed insight on the investment marketplace in the Global Market Review and Outlook on the following page.
Aberdeen developments
As of April 1, 2014, Aberdeen Asset Management PLC completed the acquisition of Scottish Widows Investment Partnership (SWIP) from Lloyds Banking Group in the UK. During the period, the integration of SWIP into the wider Aberdeen group continued to progress. The acquisition combines Aberdeen and SWIP’s strengths across fixed income, real estate, active and quantitative equities, investment solutions and alternatives. The acquisition of SWIP will not have a direct impact on any funds in the Aberdeen Fund family but will significantly add to Aberdeen’s global investment capabilities.
During the period, Aberdeen reached an agreement with the European Tour and the Scottish Government to extend our sponsorship of the Aberdeen Asset Management Scottish Open through 2020.
Aberdeen received several industry awards during the period, including 12 Mutual Fund Education Association (MFEA) STAR Awards for financial communications in both digital and direct marketing categories.
Thank you for choosing Aberdeen Funds. We value your investment with us.
Kind Regards,
Yours sincerely,
/s/ Bev Hendry
Bev Hendry
President
Aberdeen Funds
2014 Annual Report
1
Table of Contents
In our opinion, the performances of the major global equity markets for the 12-month period ended October 31, 2014, might be best described as “all over the map”—literally. There was marked divergence in stock returns among geographical regions. On the surface, it appeared that global equities generally posted respectable gains, with the MSCI World Index, the developed-market benchmark, rising 9.3% (in U.S. dollars) over the period. However, the strength in the markets was concentrated on the western side of the Atlantic Ocean, with the U.S. broader-market S&P 500 Index climbing 17.3%. In contrast, the MSCI World ex US Index was up just 0.2% during the period, dragged down mainly by investors’ concerns about economic growth in Europe and the continued rise in the U.S. dollar against most major global currencies. Both the euro and the Japanese yen declined sharply against the U.S. dollar over the period, with the latter currency experiencing particular weakness. The upturn in the U.S. market was the primary contributor to the outperformance of developed markets versus their emerging counterparts, as measured by the MSCI Emerging Markets Index, which returned 1.0% for the reporting period. The sharp decline in oil prices over the annual period had a mixed effect on the global markets: Importing nations were notable beneficiaries, whereas exporters such as Russia came under pressure as lower oil prices may aggravate revenue shortfalls caused by a raft of Western sanctions.
Unlike many other regions, the U.S. equity market benefited from a generally improving economy over the reporting period. Healthy gross domestic product (GDP) growth in the fourth quarter of 2013 and the second and third quarters of 2014 offset a decline in the first quarter of the year, most likely attributable to bad weather-induced weakness in consumer spending. Additionally, the unemployment rate fell substantially during the period, although the labor participation rate declined to its lowest level in 36 years. Investors remained focused on U.S. monetary policy for much of the period. Former Federal Reserve (Fed) vice chair Janet Yellen succeeded Ben Bernanke as head of the Fed in February 2014. The Fed began to reduce its $85 billion-per-month asset purchase program in $10 billion increments in January 2014, and ended its tapering in late October.
United Kingdom (UK) stocks saw marginal gains while European equities ended the period modestly lower. Economic recovery in the Eurozone1 remains fragile and much slower-paced than in the U.S. and UK. The European labor market has continued to improve, albeit unevenly, as has household confidence; however, inflation expectations are dangerously low for the region. Late in the reporting period, the European Central Bank (ECB) announced that, if required, it would use “unconventional policy instruments” in support of the Eurozone economy. However, there are doubts over the scale and potential effectiveness of such measures. In Japan, the yen’s weakness lifted equity markets overall, but gains were pared because of doubts over the efficacy of Prime Minister Shinzo Abe’s “third arrow” stimulus measures, as well as the impact of the consumption tax hike that was implemented in April 2014.
Within the global emerging equity markets, strong performance in India and, to a lesser extent, China, was counterbalanced by notable weakness in Latin America and Russia. Indian stocks rallied after the business-friendly Bharatiya Janata Party (BJP), headed by Narendra Modi, swept into power as that country’s first single-party majority in 25 years. The Chinese market was bolstered by signs of an upturn in economic growth. Additionally, investors appeared to take a favorable view of a proposed pilot program for mutual market connectivity between Hong Kong and Shanghai, as it was seen as a significant step towards cross-border capital market integration. The program commenced operations shortly after the end of the reporting period in mid-November. In Latin America, Brazilian equities were hampered as investor sentiment soured in reaction to the nation’s bitterly-contested presidential election. Brazil’s incumbent president, Dilma Rousseff, whose policies generally are perceived as unfriendly to business, edged out her opponent, Aecio Neves, to secure a second term. Ongoing geopolitical tensions surrounding Russia’s expanded military presence in Ukraine had a negative impact on the Russian market for the period.
The global bond markets experienced periods of volatility over the reporting period, which increased more significantly in August and October. Concerns over faltering global economic growth, combined with heightened fears of potential deflation in Europe, drove much of the uncertainty. Nonetheless, the global fixed income markets collectively finished in positive territory for the period. Investment-grade bonds outperformed high yield securities, with the Bank of America Merrill Lynch Global Broad Market Corporate Index advancing 6.4% versus the 5.9% return of the Bank of America Merrill Lynch Global High Yield Constrained Index. Emerging markets debt, as measured by the J.P. Morgan EMBI Global Diversified Index, was the strongest-performing segment within the global fixed income universe, climbing 8.6% for the period, as investors focused on the yield differential between emerging and developed markets, rather than the geopolitical tensions between Russia and Ukraine.
Outlook
In our opinion, the global economic and monetary environment remains supportive of equities relative to fixed income and cash. We believe that the end to U.S. quantitative easing in late October, higher interest rates in 2015, and improvement in the U.S. economy could lead to continued strengthening of the U.S. dollar. Our overall view on interest rates is that they will remain low for an extended period. Confidence in the global recovery has improved somewhat, given the pick-up in U.S. economic activity. However, we feel that the picture is less rosy elsewhere in the developed world. The Eurozone continues to suffer from high debt and unemployment. We remain cautious about Japan, as the recovery in household consumption has been slower than expected. However, these conditions have led to unprecedented monetary stimulus in both regions, which we think may potentially create investment opportunities. We believe that prospects for emerging economies also remain mixed, with recent market developments highlighting sensitivities to U.S. monetary policy. At the corporate level, we observe efforts to boost margins through cost-cuts and reorganization, although this has yet to translate into a broader trend of improving profitability.
Anne Richards
Chief Investment Officer
Aberdeen Asset Management
| 1 | The Eurozone comprises 18 European Union member states that have adopted the euro as their common currency. |
Indexes are unmanaged and have been provided for comparison purposes only. No fees or expenses are reflected. You cannot invest directly in an index.
Annual Report 2014
2
Table of Contents
Aberdeen Diversified Alternatives Fund (Unaudited)
The Aberdeen Diversified Alternatives Fund (Class A shares at net asset value net of fees) returned 6.70% for the 12-month period ended October 31, 2014, versus the 0.04% return of its benchmark, the Citigroup 3-Month Treasury Bill Index, for the same period. For broader comparison, the average return of the Fund’s Lipper peer category of Alternative Global Macro Funds (consisting of 302 funds) was 3.01%.
Global asset class performance was somewhat varied at the beginning of the reporting period, with U.S. equities, as measured by the broader-market S&P 500 Index, continuing to outperform other major global equity and non-equity indices. Economic data in the U.S. continued to offer enough indications of positive momentum to keep pushing U.S. stock prices to new record highs. The combination of positive domestic manufacturing data, subdued energy prices and reasonably stable interest rates remained appealing for many investors, especially when viewed relative to the more sluggish global growth outlook. U.S. equities posted strong returns across the board, with smaller-capitalization companies performing particularly well. Emerging markets performance was more mixed, but showed strength in the wake of the dovish comments from Federal Reserve (Fed) Chairwoman nominee (and subsequent appointee), Janet Yellen, and positive growth signs from China’s Third Plenum meetings.
Overall global market returns ended 2013 on a mixed note, with U.S. equities capping a very strong year in which they significantly outperformed most other global asset classes. Economic data in the U.S. continued to suggest a quickening in the pace of economic expansion, with strengthening manufacturing data, subdued energy prices and the expectation of a generally accommodative stance by the Fed helping to maintain a constructive backdrop for economic growth. The S&P 500 Index delivered its best calendar-year performance since 1997, with equity returns strong across the market capitalization range, particularly in the micro-cap segment. Conversely, emerging market equities continued their weak results and finished 2013 with negative overall returns.
Global financial markets began 2014 with a decidedly different tone than the year just ended, as weaker U.S. economic data and continued turbulence in emerging markets contributed to renewed risk-aversion among investors. The S&P 500 Index actually rose to a record high in mid-January and then proceeded to post a negative return for the full month. Persistent concerns about slowing economic growth in China and deflationary pressures in Europe added further to negative investor sentiment. Against this backdrop, “safe–haven” assets such as the 10-year U.S. Treasury found renewed favor with anxious investors.
Despite the significant flight to safety trade to start the year, investors regained some appetite for risk over the course of the first and second quarters. Even with the emergence of significant geopolitical tensions around the Ukraine and lingering uncertainties around economic growth rates in China, risk assets still managed to deliver generally positive performance. An improving job market and signs that economic growth in the US was shaking off the effects of a harsh winter helped offset these concerns as well as anxieties about the continued wind-down of Fed monetary stimulus. Against this backdrop, US stock market performance reflected a shift in investor sentiment toward a somewhat more defensive posture. Larger-company stock indices such as the S&P 500 Index delivered positive returns, although more growth-oriented small-company stocks saw negative performance from this trend.
In contrast to the generally strong first half of 2014, global risk assets ended the reporting period on a challenging note, as markets experienced a somewhat choppy late summer and then saw the extended period of relative calm come to a dramatic end in October. Broad U.S. equity market indices opened the month near record levels only to experience steep mid-month declines, followed by an equally strong rebound to close the period. In our view, this renewed volatility reflected the persistent reality that, while economic fundamentals continued their steady improvement in the U.S., key regions of the global economy continued to struggle with uneven growth trends and persistent deflationary pressures. Reflecting investor’s acute monetary policy sensitivities, the Bank of Japan contributed significantly to the sharp rebound in risk assets with an unexpected month-end announcement sharply increasing the scale and scope of its stimulus activities.
The reporting period was characterized by intervals of market volatility. The Fund’s holding in Gotham Absolute Return Fund was a significant positive contributor to performance, along with positive absolute returns from other long-short holdings, including Robeco Boston Partners Long/Short Research Fund and Aberdeen Equity Long-Short Fund. The AQR Managed Futures Strategy Fund also bolstered Fund performance for the period. The Fund’s opportunistic positioning in the Tortoise MLP & Pipeline Fund added to performance, along with strong returns from U.S. real estate investment trust exposures and currency hedged Japanese equities. The Fund’s fixed income assets also generated positive returns for the period, with both Aberdeen High Yield Fund and Eaton Vance Floating-Rate Note Fund contributing to performance. A notable detractor from Fund performance among the opportunistic holdings was the Aberdeen Asia-Pacific Smaller Companies Fund, which posted a negative return for the reporting period.
The Fund is currently invested consistent with our views on the global macroeconomic outlook, which, in our opinion, is favorably inclined toward risk assets in the medium term given stronger economic results in the U.S., as well as aggressive stimulus policies prevailing in key segments of the global economy like the Eurozone and Japan. The Fund remains highly diversified and has the flexibility to tilt specific allocations based on changes in relative valuations or specific macroeconomic events. In our view, this allows us to respond effectively to changing market conditions and position the Fund’s asset class exposures accordingly.
Portfolio Management
Aberdeen Solutions Team: Richard Fonash, CFA, and Allison Mortensen, CFA
PAST PERFORMANCE DOES NOT GUARANTEE FUTURE RESULTS.
The performance data quoted represents past performance and current returns may be lower or higher. Class A shares have up to a 5.75% front-end
2014 Annual Report
3
Table of Contents
Aberdeen Diversified Alternatives Fund (Unaudited) (concluded)
sales charge and a 0.25% 12b-1 fee. The investment return and principal value will fluctuate so that an investor’s shares, when redeemed, may be worth more or less than the original cost. To obtain performance information current to the most recent month-end, which may be higher or lower than the performance shown above, please call 866-667-9231 or go to www.aberdeen-asset.us.
Investing in mutual funds involves risk, including the possible loss of principal.
Indexes are unmanaged and have been provided for comparison purposes only. No fees or expenses are reflected. You cannot invest directly in an index.
Lipper is a leading global provider of mutual fund information and analysis to fund companies, financial intermediaries and media organizations.
Risk Considerations
The Fund is subject to different levels and combinations of risk, based on its actual allocation among the various asset classes and underlying funds. The Fund will be affected by stock and bond market risks, among others.
Foreign securities are more volatile, harder to price and less liquid than U.S. securities, and are subject to different accounting and regulatory standards, and political and economic risks. These risks are enhanced in emerging market countries.
Fixed income securities are subject to certain risks including, but not limited to: interest rate (changes in interest rates may cause a decline in the market value of an investment), credit (changes in the financial condition of the issuer, borrower, counterparty, or underlying collateral), prepayment (debt issuers may repay or refinance their loans or obligations earlier than anticipated), call (some bonds allow the issuer to call a bond for redemption before it matures), and extension (principal repayments may not occur as quickly as anticipated, causing the expected maturity of a security to increase).
The Fund invests a significant proportion of its assets in non-traditional asset classes, which may involve riskier types of securities or investments than those offered by other asset classes.
Please read the prospectus for more detailed information regarding these and other risks.
Annual Report 2014
4
Table of Contents
Aberdeen Diversified Alternatives Fund (Unaudited)
Average Annual Total Return1 (For periods ended October 31, 2014) | 1 Yr. | 5 Yr. | 10 Yr. | |||||||||||
Class A | w/o SC | 6.70% | 7.62% | 5.96% | ||||||||||
| w/SC2 | 0.57% | 6.36% | 5.33% | |||||||||||
Class C | w/o SC | 5.91% | 6.84% | 5.19% | ||||||||||
| w/SC3 | 4.91% | 6.84% | 5.19% | |||||||||||
Class R4 | w/o SC | 6.45% | 7.28% | 5.66% | ||||||||||
Institutional Service Class4,5 | w/o SC | 7.02% | 7.74% | 6.01% | ||||||||||
Institutional Class4 | w/o SC | 6.94% | 7.89% | 6.25% | ||||||||||
All figures showing the effect of a sales charge (SC) reflect the maximum charge possible because it has the most significant effect on performance data. The total returns shown above do not include the impact of financial statement rounding of the net asset value per share and/or financial statement adjustments.
| 1 | The Fund changed its investment objective and strategy effective September 24, 2012. Performance information for periods prior to September 24, 2012 does not reflect the current investment strategy. Returns incorporate the performance of a predecessor fund (the “Predecessor Fund”) from inception to June 23, 2008. Prior to the change of investment objective and strategy of the Fund effective September 24, 2012, the Fund and the Predecessor Fund had substantially similar investment objectives and strategies. Please consult the Fund’s prospectus for more detail. |
| 2 | A 5.75% front-end sales charge was deducted. |
| 3 | A 1.00% contingent deferred sales charge (CDSC) was deducted from the one year return because it is charged when Class C shares are sold within the first year after purchase. |
| 4 | Not subject to any sales charges. |
| 5 | Returns before the first offering of the Institutional Service Class (September 24, 2012) are based on the performance of Class A shares. This performance is substantially similar to what the Institutional Service Class shares would have produced because both classes invest in the same portfolio of securities. Returns for the Institutional Service Class shares would only differ to the extent of the differences in expenses of the two classes. |
2014 Annual Report
5
Table of Contents
Aberdeen Diversified Alternatives Fund (Unaudited)
Performance of a $10,000 Investment (as of October 31, 2014)
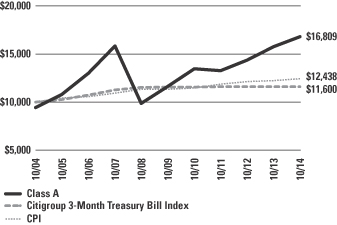
Comparative performance of $10,000 invested in Class A shares of the Aberdeen Diversified Alternatives Fund, the Citigroup 3-Month Treasury Bill Index and the Consumer Price Index (CPI) over a 10-year period ended October 31, 2014. Unlike the Fund, the returns for these unmanaged indexes do not reflect any fees, expenses, or sales charges. Investors cannot invest directly in market indexes.
The Citigroup 3-Month Treasury Bill Index consists of the last three three-month Treasury bill issues and measures monthly returns equivalents of yield averages that are not marked to market.
The CPI represents changes in prices of a basket of goods and services purchased for consumption by urban households.
Investment return and principal value will fluctuate, and when redeemed, shares may be worth more or less than original cost. Past performance is no guarantee of future results. The Average Annual Total Return table and Performance graph do not reflect the deduction of taxes that a shareholder would pay on fund distributions or the redemption of fund shares. Investing in mutual funds involves market risk, including loss of principal. Performance returns assume the reinvestment of all distributions. Performance returns reflect fee waivers and reimbursements in effect, without which returns would have been lower.
Portfolio Summary (as a percentage of net assets)
October 31, 2014 (Unaudited)
| Asset Allocation | ||||
Mutual Funds | 81.7% | |||
Exchange Traded Funds | 14.1% | |||
Repurchase Agreement | 5.7% | |||
Liabilities in excess of other assets | (1.5)% | |||
| 100.0% | ||||
| Top Industries | ||||
Alternative Investment | 59.5% | |||
Equity Funds | 17.9% | |||
Fixed Income Funds | 16.3% | |||
Real Estate Investment Trust (REIT) Funds | 2.1% | |||
Other | 4.2% | |||
| 100.0% | ||||
| Top Holdings* | ||||
Whitebox Tactical Opportunities Fund, Institutional Class | 12.7% | |||
Gotham Absolute Return Fund, Institutional Class | 11.0% | |||
Arbitrage Event Driven Fund, Institutional Class | 10.9% | |||
Robeco Boston Partners Long/Short Research Fund, Institutional Class | 10.2% | |||
AQR Managed Futures Strategy Fund, Class I | 8.0% | |||
Deutsche X-trackers MSCI Japan Hedged Equity ETF | 6.5% | |||
Nuveen Preferred Securities Fund, Institutional Class | 6.2% | |||
Tortoise MLP & Pipeline Fund, Institutional Class | 5.9% | |||
First Trust Health Care AlphaDEX Fund | 5.5% | |||
Aberdeen Equity Long-Short Fund, Institutional Class | 5.2% | |||
Other | 17.9% | |||
| 100.0% | ||||
| * | For the purpose of listing top holdings, repurchase agreements are included as part of Other. |
Annual Report 2014
6
Table of Contents
Statement of Investments
October 31, 2014
Aberdeen Diversified Alternatives Fund
| Shares or Principal Amount | Value | |||||||
MUTUAL FUNDS (81.7%) | ||||||||
Alternative Investment (59.5%) | ||||||||
Aberdeen Equity Long-Short Fund, Institutional Class (a) | 433,337 | $ | 5,442,716 | |||||
AQR Managed Futures Strategy Fund, Class I (b) | 787,589 | 8,246,056 | ||||||
Arbitrage Event Driven Fund, Institutional Class | 1,114,228 | 11,287,133 | ||||||
Gotham Absolute Return Fund, Institutional Class | 822,313 | 11,405,487 | ||||||
Parametric Absolute Return Fund, Institutional Class | 168,956 | 1,615,216 | ||||||
Robeco Boston Partners Long/Short Research Fund, Institutional Class | 698,164 | 10,542,275 | ||||||
Whitebox Tactical Opportunities Fund, Institutional Class | 1,060,944 | 13,123,870 | ||||||
| 61,662,753 | ||||||||
Equity Fund (5.9%) | ||||||||
Tortoise MLP & Pipeline Fund, Institutional Class | 332,301 | 6,120,992 | ||||||
Fixed Income Funds (16.3%) | ||||||||
Aberdeen Asia Bond Fund, Institutional Class (a) | 411,229 | 4,202,756 | ||||||
Aberdeen Global High Income Fund, Class I (a) | 212,963 | 2,097,689 | ||||||
Eaton Vance Floating-Rate Fund, Class I | 461,708 | 4,159,989 | ||||||
Nuveen Preferred Securities Fund, Institutional Class | 367,575 | 6,377,421 | ||||||
| 16,837,855 | ||||||||
Total Mutual Funds | 84,621,600 | |||||||
EXCHANGE TRADED FUNDS (14.1%) | ||||||||
Equity Funds (12.0%) | ||||||||
Deutsche X-trackers MSCI Japan Hedged Equity ETF | 167,032 | 6,793,191 | ||||||
First Trust Health Care AlphaDEX Fund (b) | 96,431 | 5,679,786 | ||||||
| 12,472,977 | ||||||||
Real Estate Investment Trust (REIT) Funds (2.1%) |
| |||||||
iShares Cohen & Steers REIT ETF | 23,178 | 2,170,852 | ||||||
Total Exchange Traded Funds | 14,643,829 | |||||||
REPURCHASE AGREEMENT (5.7%) | ||||||||
Repurchase Agreement, Fixed Income Clearing Corp., 0.00%, dated 10/31/2014, due 11/03/2014, repurchase price $5,853,000, collateralized by U.S. Treasury Note, maturing 10/31/2021; total market value of $5,974,462 | $ | 5,853,000 | 5,853,000 | |||||
Total Repurchase Agreement | 5,853,000 | |||||||
Total Investments | 105,118,429 | |||||||
Liabilities in excess of other assets—(1.5)% | (1,512,632 | ) | ||||||
Net Assets—100.0% | $ | 103,605,797 | ||||||
| (a) | Investment in affiliate. |
| (b) | Non-income producing security. |
| (c) | See Notes to Financial Statements for tax unrealized appreciation/depreciation of securities. |
| ETF | Exchange-Traded Fund |
| REIT | Real Estate Investment Trust |
See accompanying Notes to Financial Statements.
2014 Annual Report
7
Table of Contents
Aberdeen Diversified Income Fund (Unaudited)
The Aberdeen Diversified Income Fund (Class A shares at net asset value net of fees) returned 7.10% for the 12-month period ended October 31, 2014, versus the 4.14% return of its benchmark, the Barclays U.S. Aggregate Bond Index, for the same period and the 6.30% return of its secondary benchmark, 50% MSCI All Country World Index/50% Barclays U.S. Aggregate Bond Index, for the period. For broader comparison, the average return of the Fund’s Lipper peer category of Global Flexible Portfolio Funds (consisting of 482 funds) was 5.44%.
Global asset class performance was somewhat varied at the beginning of the reporting period, with U.S. equities, as measured by the broader-market S&P 500 Index, continuing to outperform other major global equity and non-equity indices. Economic data in the U.S. continued to offer enough indications of positive momentum to keep pushing U.S. stock prices to new record highs. The combination of positive domestic manufacturing data, subdued energy prices and reasonably stable interest rates remained appealing for many investors, especially when viewed relative to the more sluggish global growth outlook. U.S. equities posted strong returns across the board, with smaller-capitalization companies performing particularly well. Emerging markets performance was more mixed, but showed strength in the wake of the dovish comments from Federal Reserve (Fed) Chairwoman nominee (and subsequent appointee) Janet Yellen and positive growth signs from China’s Third Plenum meetings.
Overall global market returns ended 2013 on a mixed note, with U.S. equities capping a very strong year in which they significantly outperformed most other global asset classes. Economic data in the U.S. continued to suggest a quickening in the pace of economic expansion, with strengthening manufacturing data, subdued energy prices and the expectation of a generally accommodative stance by the Fed helping to maintain a constructive backdrop for economic growth. The S&P 500 Index delivered its best calendar-year performance since 1997, with equity returns strong across the market capitalization range, particularly in the micro-cap segment. Conversely, emerging market equities continued their weak results and finished 2013 with negative overall returns.
Global financial markets began 2014 with a decidedly different tone than the year just ended, as weaker U.S. economic data and continued turbulence in emerging markets contributed to renewed risk-aversion among investors. The S&P 500 Index actually rose to a record high in mid-January and then proceeded to post a negative return for the full month. Persistent concerns about slowing economic growth in China and deflationary pressures in Europe added further to negative investor sentiment. Against this backdrop, “safe–haven” assets such as the 10-year U.S. Treasury found renewed favor with anxious investors.
Despite the significant flight to safety trade to start the year, investors regained some appetite for risk over the course of the first and second quarters. Even with the emergence of significant geopolitical tensions surrounding Ukraine and lingering uncertainties regarding economic growth rates in China, risk assets still managed to deliver generally positive performance. An improving job market and signs that economic growth in the U.S. was shaking off the effects of a harsh winter helped offset these concerns as well as anxieties about the continued wind-down of Fed monetary stimulus. Against this backdrop, U.S. stock market performance reflected a shift in investor sentiment toward a somewhat more defensive posture. Larger-company stock indices such as the S&P 500 Index delivered positive returns, although more growth-oriented small-company stocks saw negative performance from this trend.
In contrast to the generally strong first half of 2014, global risk assets ended the reporting period on a challenging note, as markets experienced a somewhat choppy late summer and then saw the extended period of relative calm come to a dramatic end in October. Broad U.S. equity market indices opened the month near record levels only to experience steep mid-month declines, followed by an equally strong rebound to close the period. In our view, this renewed volatility reflected the persistent reality that, while economic fundamentals continued their steady improvement in the U.S., key regions of the global economy continued to struggle with uneven growth trends and persistent deflationary pressures. Reflecting investor’s acute monetary policy sensitivities, the Bank of Japan contributed significantly to the sharp rebound in risk assets with an unexpected month-end announcement sharply increasing the scale and scope of its stimulus activities.
The reporting period was generally favorable in terms of performance across asset classes. The Fund’s holdings in iShares Cohen & Steers REIT ETF, an exchange-traded fund which invests in real estate investment trusts, and iShares Russell Mid Cap ETF were significant contributors to performance, while the Fund’s exposures to healthcare and U.S. energy infrastructure also had a positive impact on performance. With the benign interest rate environment in 2014, the Fund’s fixed income assets also generated positive returns for the reporting period. The holdings in Nuveen Preferred Securities Fund and Aberdeen Core Fixed Income Fund both posted positive returns, while the holdings in Aberdeen High Yield Fund and Eaton Vance Floating Rate Fund were also contributors for the period. A detractor from Fund performance was the holding in Aberdeen Emerging Markets Debt Local Currency Fund, which posted a negative return. There was periodic weakness across the emerging markets asset class during the period amid continuing uncertainty about the pace of global economic growth.
The Fund is currently invested consistent with our views on the global macroeconomic outlook, which, in our opinion, is favorably inclined toward risk assets in the medium term given stronger economic results in the U.S., as well as aggressive stimulus policies prevailing in key segments of the global economy such as the Eurozone1 and Japan. The Fund remains highly diversified4 and has the flexibility to tilt specific allocations based on changes in relative valuations or specific macroeconomic events. In our view, this allows us to respond effectively to changing market conditions and position the Fund’s asset class exposures accordingly.
| 1 | The Eurozone comprises the bloc of nations which has adopted the euro as common currency and legal tender. |
Annual Report 2014
8
Table of Contents
Aberdeen Diversified Income Fund (Unaudited) (concluded)
Portfolio Management
Aberdeen Solutions Team: Richard Fonash, CFA, and Allison Mortensen, CFA
PAST PERFORMANCE DOES NOT GUARANTEE FUTURE RESULTS.
The performance data quoted represents past performance and current returns may be lower or higher. Class A shares have up to a 5.75% front-end sales charge and a 0.25% 12b-1 fee. The investment return and principal value will fluctuate so that an investor’s shares, when redeemed, may be worth more or less than the original cost. To obtain performance information current to the most recent month-end, which may be higher or lower than the performance shown above, please call 866-667-9231 or go to www.aberdeen-asset.us.
Investing in mutual funds involves risk, including the possible loss of principal.
Indexes are unmanaged and have been provided for comparison purposes only. No fees or expenses are reflected. You cannot invest directly in an index.
Lipper is a leading global provider of mutual fund information and analysis to fund companies, financial intermediaries and media organizations.
Risk Considerations
The Fund is subject to different levels and combinations of risk, based on its actual allocation among the various asset classes and underlying funds. The Fund will be affected by stock and bond market risks, among others.
Foreign securities are more volatile, harder to price and less liquid than U.S. securities, and are subject to different accounting and regulatory standards, and political and economic risks. These risks are enhanced in emerging market countries.
Fixed income securities are subject to certain risks including, but not limited to: interest rate (changes in interest rates may cause a decline in the market value of an investment), credit (changes in the financial condition of the issuer, borrower, counterparty, or underlying collateral), prepayment (debt issuers may repay or refinance their loans or obligations earlier than anticipated), call (some bonds allow the issuer to call a bond for redemption before it matures), and extension (principal repayments may not occur as quickly as anticipated, causing the expected maturity of a security to increase). Additionally, non-investment grade debt securities (high-yield/junk bonds) may be subject to greater market fluctuations, risk of default or loss of income and principal than higher-rated securities.
The Fund may allocate its assets, to a limited extent, to alternative investment strategies, which may involve riskier types of securities or investments than those offered by investment in traditional asset classes.
Please read the prospectus for more detailed information regarding these and other risks.
2014 Annual Report
9
Table of Contents
Aberdeen Diversified Income Fund (Unaudited)
Average Annual Total Return1 (For periods ended October 31, 2014) | 1 Yr. | 5 Yr. | 10 Yr. | |||||||||||
Class A | w/o SC | 7.10% | 7.53% | 6.38% | ||||||||||
| w/SC2 | 0.92% | 6.27% | 5.75% | |||||||||||
Class C | w/o SC | 6.42% | 6.76% | 5.59% | ||||||||||
| w/SC3 | 5.42% | 6.76% | 5.59% | |||||||||||
Class R4 | w/o SC | 6.66% | 7.12% | 6.00% | ||||||||||
Institutional Service Class4,5 | w/o SC | 7.40% | 7.65% | 6.44% | ||||||||||
Institutional Class4 | w/o SC | 7.40% | 7.81% | 6.62% | ||||||||||
All figures showing the effect of a sales charge (SC) reflect the maximum charge possible because it has the most significant effect on performance data. The total returns shown above do not include the impact of financial statement rounding of the net asset value per share and/or financial statement adjustments.
| 1 | The Fund changed its investment objective and strategy effective September 24, 2012. Performance information for periods prior to September 24, 2012 does not reflect the current investment strategy. Returns incorporate the performance of a predecessor fund (the “Predecessor Fund”) from inception to June 23, 2008. Prior to the change of investment objective and strategy of the Fund effective September 24, 2012, the Fund and the Predecessor Fund had substantially similar investment objectives and strategies. Please consult the Fund’s prospectus for more detail. |
| 2 | A 5.75% front-end sales charge was deducted. |
| 3 | A 1.00% contingent deferred sales charge (CDSC) was deducted from the one year return because it is charged when Class C shares are sold within the first year after purchase. |
| 4 | Not subject to any sales charges. |
| 5 | Returns before the first offering of the Institutional Service Class (September 24, 2012) are based on the performance of Institutional Class shares. The performance of the Institutional Class is substantially similar to what the Institutional Service Class would have produced because both classes invest in the same portfolio of securities. Returns for the Institutional Service Class shares would only differ to the extent of the differences in expenses of the two classes. |
Annual Report 2014
10
Table of Contents
Aberdeen Diversified Income Fund (Unaudited)
Performance of a $10,000 Investment (as of October 31, 2014)
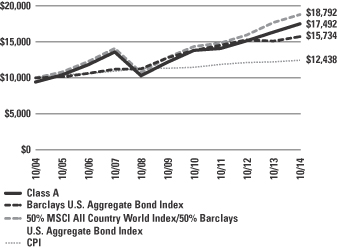
Comparative performance of $10,000 invested in Class A shares of the Aberdeen Diversified Income Fund, Barclays U.S. Aggregate Bond Index, a blended benchmark of 50% Morgan Stanley Capital International All Country (MSCI AC) World Index/50% Barclays U.S. Aggregate Bond Index, and the Consumer Price Index (CPI) over a 10-year period ended October 31, 2014. Unlike the Fund, the returns for these unmanaged indexes do not reflect any fees, expenses, or sales charges. Investors cannot invest directly in market indexes.
The Barclays U.S. Aggregate Bond Index is a broad-based benchmark that measures the investment grade, U.S. dollar-denominated, fixed-rate taxable bond market, including Treasuries, government-related and corporate securities, MBS (agency fixed-rate and hybrid ARM passthroughs), ABS, and CMBS.
The MSCI AC World Index is a free float-adjusted, market capitalization-weighted index that captures large and mid cap representation across 23 developed markets countries and 23 emerging markets, covering approximately 85% of the global investable equity opportunity set.
The CPI represents changes in prices of a basket of goods and services purchased for consumption by urban households.
Investment return and principal value will fluctuate, and when redeemed, shares may be worth more or less than original cost. Past performance is no guarantee of future results. The Average Annual Total Return table and Performance graph do not reflect the deduction of taxes that a shareholder would pay on fund distributions or the redemption of fund shares. Investing in mutual funds involves market risk, including loss of principal. Performance returns assume the reinvestment of all distributions. Performance returns reflect fee waivers and reimbursements in effect, without which returns would have been lower.
Portfolio Summary (as a percentage of net assets)
October 31, 2014 (Unaudited)
| Asset Allocation | ||||
Mutual Funds | 64.0% | |||
Exchange Traded Funds | 33.8% | |||
Repurchase Agreement | 2.1% | |||
Other assets in excess of liabilities | 0.1% | |||
| 100.0% | ||||
| Top Industries | ||||
Fixed Income Funds | 56.3% | |||
Equity Funds | 30.3% | |||
Real Estate Investment Trust (REIT) Funds | 11.2% | |||
Other | 2.2% | |||
| 100.0% | ||||
| Top Holdings* | ||||
Nuveen Preferred Securities Fund, Institutional Class | 13.5% | |||
Eaton Vance Floating-Rate Fund, Class I | 12.5% | |||
Oppenheimer International Bond Fund, Class Y | 7.2% | |||
Vanguard High Dividend Yield ETF | 7.2% | |||
Aberdeen High Yield Fund, Institutional Class | 7.1% | |||
iShares Cohen & Steers REIT ETF | 6.8% | |||
Aberdeen Core Fixed Income Fund, Institutional Class | 6.3% | |||
Aberdeen Asia Bond Fund, Institutional Class | 5.7% | |||
iShares Global Infrastructure ETF | 5.1% | |||
Aberdeen International Equity Fund, Institutional Class | 4.9% | |||
Other | 23.7% | |||
| 100.0% | ||||
| * | For the purpose of listing top holdings, repurchase agreements are included as part of Other. |
2014 Annual Report
11
Table of Contents
Statement of Investments
October 31, 2014
Aberdeen Diversified Income Fund
Shares or Principal Amount | Value | |||||||
MUTUAL FUNDS (64.0%) | ||||||||
Equity Funds (7.7%) | ||||||||
Aberdeen Emerging Markets Fund, Institutional Class (a) | 48,119 | $ | 716,975 | |||||
Aberdeen International Equity Fund, Institutional Class (a) | 81,294 | 1,236,484 | ||||||
| 1,953,459 | ||||||||
Fixed Income Funds (56.3%) | ||||||||
Aberdeen Asia Bond Fund, Institutional Class (a) | 139,646 | 1,427,180 | ||||||
Aberdeen Core Fixed Income Fund, Institutional Class (a) | 145,262 | 1,586,264 | ||||||
Aberdeen Emerging Markets Debt Local Currency Fund, Institutional Class (a) | 116,058 | 1,016,667 | ||||||
Aberdeen High Yield Fund, Institutional Class (a) | 193,781 | 1,784,726 | ||||||
Eaton Vance Floating-Rate Fund, Class I | 348,931 | 3,143,867 | ||||||
Nuveen Preferred Securities Fund, Institutional Class | 196,004 | 3,400,664 | ||||||
Oppenheimer International Bond Fund, Class Y | 302,329 | 1,820,020 | ||||||
| 14,179,388 | ||||||||
Total Mutual Funds | 16,132,847 | |||||||
EXCHANGE TRADED FUNDS (33.8%) |
| |||||||
Equity Funds (22.6%) | ||||||||
ETRACS Alerian MLP Infrastructure Index ETN | 23,484 | 1,011,691 | ||||||
iShares Global Healthcare ETF | 10,788 | 1,079,987 | ||||||
iShares Global Infrastructure ETF | 29,591 | 1,280,699 | ||||||
iShares Russell Midcap ETF | 3,174 | 518,409 | ||||||
Vanguard High Dividend Yield ETF | 26,643 | 1,813,056 | ||||||
| 5,703,842 | ||||||||
Real Estate Investment Trust (REIT) Funds (11.2%) |
| |||||||
iShares Cohen & Steers REIT ETF | 18,206 | 1,705,174 | ||||||
SPDR Dow Jones International Real Estate Fund | 25,334 | 1,102,282 | ||||||
| 2,807,456 | ||||||||
Total Exchange Traded Funds | 8,511,298 | |||||||
REPURCHASE AGREEMENT (2.1%) | ||||||||
Repurchase Agreement, Fixed Income Clearing Corp., 0.00%, dated 10/31/2014, due 11/03/2014, repurchase price $538,000, collateralized by U.S. Treasury Note, maturing 10/31/2021; total market value of $553,560 | $ | 538,000 | 538,000 | |||||
Total Repurchase Agreement | 538,000 | |||||||
Total Investments | 25,182,145 | |||||||
Other assets in excess of liabilities—0.1% | 24,581 | |||||||
Net Assets—100.0% | $ | 25,206,726 | ||||||
| (a) | Investment in affiliate. |
| (b) | See Notes to Financial Statements for tax unrealized appreciation/depreciation of securities. |
| ETF | Exchange-Traded Fund |
| ETN | Exchange Traded Note |
| REIT | Real Estate Investment Trust |
See accompanying Notes to Financial Statements.
Annual Report 2014
12
Table of Contents
Aberdeen Dynamic Allocation Fund (Unaudited)
The Aberdeen Dynamic Allocation Fund (Class A shares at net asset value net of fees) returned 8.03% for the 12-month period ended October 31, 2014, versus the 8.32% return of its benchmark, the MSCI All Country World Index, for the same period and the 6.72% return of its secondary benchmark, 60% MSCI All Country World Index/40% Barclays U.S. Aggregate Bond Index, for the period. For broader comparison, the average return of the Fund’s Lipper peer category of Global Flexible Portfolio Funds (consisting of 482 funds) was 5.44%.
Global asset class performance was somewhat varied to start the reporting period, with US equities, as measured by the broader-market S&P 500 Index, continuing to outperform other major global equity and non-equity indices. Economic data in the US continued to offer enough indications of positive momentum to keep pushing US stock prices to new record highs. The combination of positive domestic manufacturing data, subdued energy prices and reasonably stable interest rates remained appealing for many investors, especially when viewed relative to the more sluggish global growth outlook. US equities posted strong returns across the board, with smaller-capitalization companies in particular performing well. Emerging markets performance was more mixed, but showed strength in the wake of the dovish comments from Federal Reserve (Fed) Chairwoman nominee (and subsequent appointee) Janet Yellen and positive growth signs from China’s Third Plenum meetings.
Overall global market returns ended 2013 on a mixed note, with U.S. equities capping a very strong year in which they significantly outperformed most other global asset classes. Economic data in the U.S. continued to suggest a quickening in the pace of economic expansion, with strengthening manufacturing data, subdued energy prices and the expectation of a generally accommodative stance by the Fed helping to maintain a constructive backdrop for economic growth. The S&P 500 Index delivered its best calendar-year performance since 1997, with equity returns strong across the market capitalization range, particularly in the micro-cap segment. Conversely, emerging market equities continued their weak results and finished 2013 with negative overall returns.
Global financial markets began 2014 with a decidedly different tone than the year just ended, as weaker U.S. economic data and continued turbulence in emerging markets contributed to renewed risk-aversion among investors. The S&P 500 Index actually rose to a record high in mid-January and then proceeded to post a negative return for the full month. Persistent concerns about slowing economic growth in China and deflationary pressures in Europe added further to negative investor sentiment. Against this backdrop, “safe–haven” assets such as the 10-year U.S. Treasury found renewed favor with anxious investors.
Despite the significant flight to safety trade to start the year, investors regained some appetite for risk over the course of the first and second quarters. Even with the emergence of significant geopolitical tensions surrounding Ukraine and lingering uncertainties regarding economic growth rates in China, risk assets still managed to deliver generally positive performance. An improving job market and signs that economic growth in the U.S. was shaking off the effects of a harsh winter helped offset these concerns as well as anxieties about the continued wind-down of Fed monetary stimulus. Against this backdrop, U.S. stock market performance reflected a shift in investor sentiment toward a somewhat more defensive posture. Larger-company stock indices such as the S&P 500 Index delivered positive returns, although more growth-oriented small-company stocks saw negative performance from this trend.
In contrast to the generally strong first half of 2014, global risk assets ended the reporting period on a challenging note, as markets experienced a somewhat choppy late summer and then saw the extended period of relative calm come to a dramatic end in October. Broad U.S. equity market indices opened the month near record levels only to experience steep mid-month declines, followed by an equally strong rebound to close the period. In our view, this renewed volatility reflected the persistent reality that, while economic fundamentals continued their steady improvement in the U.S., key regions of the global economy continued to struggle with uneven growth trends and persistent deflationary pressures. Reflecting investor’s acute monetary policy sensitivities, the Bank of Japan (BOJ) contributed significantly to the sharp rebound in risk assets with an unexpected month-end announcement sharply increasing the scale and scope of its stimulus activities.
The annual period was generally favorable in terms of performance across asset classes. The Fund’s holdings in First Trust Health Care AlphaDEX Fund and iShares Cohen & Steers REIT ETF, an exchange-traded fund which invests in real estate investment trusts, were significant contributors to performance, along with strong overall returns from the Fund’s holdings in U.S. equities, particularly the large- and mid-cap segments of the market. The Fund’s exposure to U.S. energy infrastructure in Tortoise MLP & Pipeline Fund also had a strong positive impact on performance. With the benign interest rate environment in 2014, the Fund’s fixed income assets also generated positive returns for the annual period. The holdings in Aberdeen Core Fixed Income Fund and Oppenheimer International Bond Fund both posted positive returns, while the position in Nuveen Preferred Securities Fund also contributed for the period. A significant detractor from Fund performance for the reporting period was the holding in Credit Suisse Commodity Return Strategy Fund, which posted a significantly negative return. There was notable weakness across the commodities asset class during the period amid continuing uncertainty about the pace of global economic growth.
The Fund is currently invested consistent with our views on the global macroeconomic outlook, which, in our opinion, is favorably inclined toward risk assets in the medium term given stronger economic results in the U.S., as well as aggressive stimulus policies prevailing in key segments of the global economy such as the Eurozone1 and Japan. The Fund remains highly diversified4 and has
| 1 | The Eurozone comprises the bloc of nations which has adopted the euro as common currency and legal tender. |
2014 Annual Report
13
Table of Contents
Aberdeen Dynamic Allocation Fund (Unaudited) (concluded)
the flexibility to tilt specific allocations based on changes in relative valuations or specific macroeconomic events. In our view, this allows us to respond effectively to changing market conditions and position the Fund’s asset class exposures accordingly.
Portfolio Management
Aberdeen Solutions Team: Richard Fonash, CFA, and Allison Mortensen, CFA
PAST PERFORMANCE DOES NOT GUARANTEE FUTURE RESULTS.
The performance data quoted represents past performance and current returns may be lower or higher. Class A shares have up to a 5.75% front-end sales charge and a 0.25% 12b-1 fee. The investment return and principal value will fluctuate so that an investor’s shares, when redeemed, may be worth more or less than the original cost. To obtain performance information current to the most recent month-end, which may be higher or lower than the performance shown above, please call 866-667-9231 or go to www.aberdeen-asset.us.
Investing in mutual funds involves risk, including the possible loss of principal.
Indexes are unmanaged and have been provided for comparison purposes only. No fees or expenses are reflected. You cannot invest directly in an index.
Lipper is a leading global provider of mutual fund information and analysis to fund companies, financial intermediaries and media organizations.
Risk Considerations
The Fund is subject to different levels and combinations of risk, based on its actual allocation among the various asset classes and underlying funds. The Fund will be affected by stock and bond market risks, among others.
Foreign securities are more volatile, harder to price and less liquid than U.S. securities, and are subject to different accounting and regulatory standards, and political and economic risks. These risks are enhanced in emerging market countries.
Fixed income securities are subject to certain risks including, but not limited to: interest rate (changes in interest rates may cause a decline in the market value of an investment), credit (changes in the financial condition of the issuer, borrower, counterparty, or underlying collateral), prepayment (debt issuers may repay or refinance their loans or obligations earlier than anticipated), call (some bonds allow the issuer to call a bond for redemption before it matures), and extension (principal repayments may not occur as quickly as anticipated, causing the expected maturity of a security to increase).
The Fund allocates its assets, to a limited extent, to alternative investment strategies, which may involve riskier types of securities or investments than those offered by investment in traditional asset classes.
Please read the prospectus for more detailed information regarding these and other risks.
Annual Report 2014
14
Table of Contents
Aberdeen Dynamic Allocation Fund (Unaudited)
Average Annual Total Return1 (For periods ended October 31, 2014) | 1 Yr. | 5 Yr. | 10 Yr. | |||||||||||
Class A | w/o SC | 8.03% | 8.64% | 6.58% | ||||||||||
| w/SC2 | 1.84% | 7.36% | 5.95% | |||||||||||
Class C | w/o SC | 7.28% | 7.87% | 5.82% | ||||||||||
| w/SC3 | 6.28% | 7.87% | 5.82% | |||||||||||
Class R4 | w/o SC | 7.52% | 8.33% | 6.26% | ||||||||||
Institutional Service Class4,5 | w/o SC | 8.36% | 8.78% | 6.65% | ||||||||||
Institutional Class4,5 | w/o SC | 8.28% | 8.85% | 6.68% | ||||||||||
All figures showing the effect of a sales charge (SC) reflect the maximum charge possible because it has the most significant effect on performance data. The total returns shown above do not include the impact of financial statement rounding of the net asset value per share and/or financial statement adjustments.
| 1 | The Fund changed its investment objective and strategy effective September 24, 2012. Performance information for periods prior to September 24, 2012 does not reflect the current investment strategy. Returns incorporate the performance of a predecessor fund (the “Predecessor Fund”) from inception to June 23, 2008. Prior to the change of investment objective and strategy of the Fund effective September 24, 2012, the Fund and the Predecessor Fund had substantially similar investment objectives and strategies. Please consult the Fund’s prospectus for more detail. |
| 2 | A 5.75% front-end sales charge was deducted. |
| 3 | A 1.00% contingent deferred sales charge (CDSC) was deducted from the one year return because it is charged when Class C shares are sold within the first year after purchase. |
| 4 | Not subject to any sales charges. |
| 5 | Returns before the first offering of the Institutional Service Class (September 24, 2012) are based on the performance of Institutional Class shares. The performance of the Institutional Class is substantially similar to what the Institutional Service Class shares would have produced because both classes invest in the same portfolio of securities. Returns for the Institutional Service Class shares would only differ to the extent of the differences in expenses of the two classes. |
| 6 | The performance of Institutional Class for the period beginning on April 23, 2009 through July 28, 2009 is based on the performance of Class A shares. During this period Institutional Class did not have any shareholders. The performance of Class A is substantially similar to what the Institutional Class shares would have produced because both classes invest in the same portfolio of securities. Returns for the Institutional Class have not been adjusted to reflect its lower expenses. |
2014 Annual Report
15
Table of Contents
Aberdeen Dynamic Allocation Fund (Unaudited)
Performance of a $10,000 Investment (as of October 31, 2014)
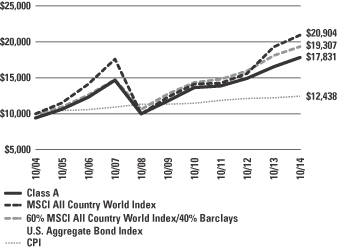
Comparative performance of $10,000 invested in Class A shares of the Aberdeen Dynamic Allocation Fund, the Morgan Stanley Capital International All Country (MSCI AC) World Index, a blended benchmark of 60% MSCI AC World Index/40% Barclays U.S. Aggregate Bond Index, and the Consumer Price Index (CPI) over a 10-year period ended October 31, 2014. Unlike the Fund, the returns for these unmanaged indexes do not reflect any fees, expenses, or sales charges. Investors cannot invest directly in market indexes.
The MSCI AC World Index is a free float-adjusted, market capitalization-weighted index that captures large and mid cap representation across 23 developed markets countries and 23 emerging markets, covering approximately 85% of the global investable equity opportunity set.
The Barclays U.S. Aggregate Bond Index is a broad-based benchmark that measures the investment grade, U.S. dollar-denominated, fixed rate taxable bond market, including Treasuries, government-related and corporate securities, MBS (agency fixed-rate and hybrid ARM passthroughs), ABS, and CMBS.
The CPI represents changes in prices of a basket of goods and services purchased for consumption by urban households.
Investment return and principal value will fluctuate, and when redeemed, shares may be worth more or less than original cost. Past performance is no guarantee of future results. The Average Annual Total Return table and Performance graph do not reflect the deduction of taxes that a shareholder would pay on fund distributions or the redemption of fund shares. Investing in mutual funds involves market risk, including loss of principal. Performance returns assume the reinvestment of all distributions. Performance returns reflect fee waivers and reimbursements in effect, without which returns would have been lower.
Portfolio Summary (as a percentage of net assets)
October 31, 2014 (Unaudited)
| Asset Allocation | ||||
Mutual Funds | 61.9% | |||
Exchange Traded Funds | 34.3% | |||
Repurchase Agreement | 2.6% | |||
Other assets in excess of liabilities | 1.2% | |||
| 100.0% | ||||
| Top Industries | ||||
Equity Funds | 58.6% | |||
Fixed Income Funds | 27.8% | |||
Real Estate Investment Trust (REIT) Funds | 5.0% | |||
Alternative Investment | 4.8% | |||
Other | 3.8% | |||
| 100.0% | ||||
| Top Holdings* | ||||
iShares Core S&P 500 ETF | 9.3% | |||
Aberdeen International Equity Fund, Institutional Class | 9.0% | |||
Tortoise MLP & Pipeline Fund, Institutional Class | 7.9% | |||
First Trust Health Care AlphaDEX Fund | 7.2% | |||
iShares Russell Midcap ETF | 7.1% | |||
Nuveen Preferred Securities Fund, Institutional Class | 6.3% | |||
Aberdeen Small Cap Fund, Institutional Class | 6.2% | |||
Deutsche X-trackers MSCI Japan Hedged Equity ETF | 5.7% | |||
Aberdeen Core Fixed Income Fund, Institutional Class | 5.3% | |||
Aberdeen Asia Bond Fund, Institutional Class | 5.1% | |||
Other | 30.9% | |||
| 100.0% | ||||
| * | For the purpose of listing top holdings, repurchase agreements are included as part of Other. |
Annual Report 2014
16
Table of Contents
Statement of Investments
October 31, 2014
Aberdeen Dynamic Allocation Fund
| Shares or Principal Amount | Value | |||||||
MUTUAL FUNDS (61.9%) | ||||||||
Alternative Investment (4.8%) | ||||||||
AQR Managed Futures Strategy Fund, Class I (a) | 112,095 | $ | 1,173,634 | |||||
Equity Funds (29.3%) | ||||||||
Aberdeen Asia-Pacific Smaller Companies Fund, Institutional Class (b) | 72,925 | 741,649 | ||||||
Aberdeen Emerging Markets Fund, Institutional Class (b) | 50,407 | 751,058 | ||||||
Aberdeen International Equity Fund, Institutional Class (b) | 144,849 | 2,203,155 | ||||||
Aberdeen Small Cap Fund, Institutional Class (a)(b) | 60,900 | 1,518,244 | ||||||
Tortoise MLP & Pipeline Fund, Institutional Class | 104,749 | 1,929,473 | ||||||
| 7,143,579 | ||||||||
Fixed Income Funds (27.8%) | ||||||||
Aberdeen Asia Bond Fund, Institutional Class (b) | 121,408 | 1,240,794 | ||||||
Aberdeen Core Fixed Income Fund, Institutional Class (b) | 117,838 | 1,286,794 | ||||||
Aberdeen Global High Income Fund, Class I (b) | 98,953 | 974,684 | ||||||
Eaton Vance Floating-Rate Fund, Class I | 57,113 | 514,587 | ||||||
Nuveen Preferred Securities Fund, Institutional Class | 88,590 | 1,537,037 | ||||||
Oppenheimer International Bond Fund, Class Y | 205,367 | 1,236,311 | ||||||
| 6,790,207 | ||||||||
Total Mutual Funds | 15,107,420 | |||||||
EXCHANGE TRADED FUNDS (34.3%) | ||||||||
Equity Funds (29.3%) | ||||||||
Deutsche X-trackers MSCI Japan Hedged Equity ETF | 34,273 | 1,393,883 | ||||||
First Trust Health Care AlphaDEX Fund (a) | 29,717 | 1,750,331 | ||||||
iShares Core S&P 500 ETF | 11,152 | 2,263,745 | ||||||
iShares Russell Midcap ETF | 10,677 | 1,743,874 | ||||||
| 7,151,833 | ||||||||
Real Estate Investment Trust (REIT) Funds (5.0%) |
| |||||||
iShares Cohen & Steers REIT ETF | 13,230 | 1,239,122 | ||||||
Total Exchange Traded Funds | 8,390,955 | |||||||
REPURCHASE AGREEMENT (2.6%) | ||||||||
Repurchase Agreement, Fixed Income Clearing Corp., 0.00%, dated 10/31/2014, due 11/03/2014, repurchase price $625,000, collateralized by U.S. Treasury Note, maturing 5/31/2021; total market value of $639,763 | $ | 625,000 | 625,000 | |||||
Total Repurchase Agreement | 625,000 | |||||||
Total Investments | 24,123,375 | |||||||
Other assets in excess of liabilities—1.2% | 293,488 | |||||||
Net Assets—100.0% | $ | 24,416,863 | ||||||
| (a) | Non-income producing security. |
| (b) | Investment in affiliate. |
| (c) | See Notes to Financial Statements for tax unrealized appreciation/depreciation of securities. |
| ETF | Exchange-Traded Fund |
| REIT | Real Estate Investment Trust |
See accompanying Notes to Financial Statements.
2014 Annual Report
17
Table of Contents
Statements of Assets and Liabilities
October 31, 2014
| Aberdeen Diversified Alternatives Fund | Aberdeen Diversified Income Fund | Aberdeen Dynamic Allocation Fund | ||||||||||
Assets: | ||||||||||||
Investments, at value | $ | 87,522,268 | $ | 16,875,849 | $ | 14,781,997 | ||||||
Investments in affiliates, at value | 11,743,161 | 7,768,296 | 8,716,378 | |||||||||
Repurchase agreements, at value | 5,853,000 | 538,000 | 625,000 | |||||||||
|
|
|
|
|
| |||||||
Total investments | 105,118,429 | 25,182,145 | 24,123,375 | |||||||||
|
|
|
|
|
| |||||||
Cash | – | 584 | – | |||||||||
Receivable for Investments Sold | – | – | 723,918 | |||||||||
Receivable from Transfer Agent | – | – | 335,338 | |||||||||
Receivable for capital shares issued | 336,225 | 19,394 | 5,095 | |||||||||
Receivable from Adviser | 36,862 | 13,412 | 16,457 | |||||||||
Interest and dividends receivable | 22,352 | 15,494 | 7,095 | |||||||||
Prepaid expenses | 37,066 | 34,079 | 34,554 | |||||||||
|
|
|
|
|
| |||||||
Total assets | 105,550,934 | 25,265,108 | 25,245,832 | |||||||||
|
|
|
|
|
| |||||||
Liabilities: | ||||||||||||
Payable for investments purchased | 785,543 | 16,870 | 393,640 | |||||||||
Due to custodian | 1,058,455 | – | 336,372 | |||||||||
Payable for capital shares redeemed | 41,276 | 10,524 | 68,575 | |||||||||
Accrued expenses and other payables: | ||||||||||||
Distribution fees | 16,778 | 14,372 | 13,039 | |||||||||
Investment advisory fees | 12,464 | 3,182 | 3,061 | |||||||||
Transfer agent fees | 9,014 | 1,849 | 938 | |||||||||
Printing fees | 5,374 | 2,329 | 3,872 | |||||||||
Administration fees | 6,647 | 1,697 | 1,633 | |||||||||
Fund accounting fees | 1,269 | 382 | 364 | |||||||||
Administrative services fees | 573 | 157 | 252 | |||||||||
Legal fees | 278 | 81 | 78 | |||||||||
Custodian fees | 10 | 20 | 92 | |||||||||
Other | 7,456 | 6,919 | 7,053 | |||||||||
|
|
|
|
|
| |||||||
Total liabilities | 1,945,137 | 58,382 | 828,969 | |||||||||
|
|
|
|
|
| |||||||
Net Assets | $ | 103,605,797 | $ | 25,206,726 | $ | 24,416,863 | ||||||
|
|
|
|
|
| |||||||
Cost: | ||||||||||||
Investments | $ | 84,994,653 | $ | 15,939,638 | $ | 12,617,616 | ||||||
Investments in affiliates | 11,520,204 | 7,919,773 | 8,644,632 | |||||||||
Repurchase agreements | 5,853,000 | 538,000 | 625,000 | |||||||||
Represented by: | ||||||||||||
Capital | $ | 119,515,906 | $ | 23,220,291 | $ | 24,165,839 | ||||||
Accumulated net investment income/(loss) | 75,832 | 89,624 | 35,140 | |||||||||
Accumulated net realized gain/(loss) from investments | (18,736,513 | ) | 1,112,077 | (2,020,243 | ) | |||||||
Net unrealized appreciation on investments | 2,750,572 | 784,734 | 2,236,127 | |||||||||
|
|
|
|
|
| |||||||
Net Assets | $ | 103,605,797 | $ | 25,206,726 | $ | 24,416,863 | ||||||
|
|
|
|
|
| |||||||
Net Assets: | ||||||||||||
Class A Shares | $ | 21,607,526 | $ | 7,542,088 | $ | 9,506,240 | ||||||
Class C Shares | 15,564,684 | 14,905,583 | 12,939,101 | |||||||||
Class R Shares | 348,463 | 408,102 | 453,822 | |||||||||
Institutional Service Class Shares | 11,694 | 11,554 | 11,879 | |||||||||
Institutional Class Shares | 66,073,430 | 2,339,399 | 1,505,821 | |||||||||
|
|
|
|
|
| |||||||
Total | $ | 103,605,797 | $ | 25,206,726 | $ | 24,416,863 | ||||||
|
|
|
|
|
| |||||||
Amounts listed as “–” are $0 or round to $0.
See accompanying Notes to Financial Statements.
Annual Report 2014
18
Table of Contents
Statements of Assets and Liabilities (concluded)
October 31, 2014
| Aberdeen Diversified Alternatives Fund | Aberdeen Diversified Income Fund | Aberdeen Dynamic Allocation Fund | ||||||||||
Shares Outstanding (unlimited number of shares authorized): | ||||||||||||
Class A Shares | 1,622,058 | 580,439 | 714,785 | |||||||||
Class C Shares | 1,207,288 | 1,169,458 | 991,055 | |||||||||
Class R Shares | 26,308 | 31,640 | 34,297 | |||||||||
Institutional Service Class Shares | 870 | 891 | 897 | |||||||||
Institutional Class Shares | 4,919,286 | 180,315 | 113,737 | |||||||||
|
|
|
|
|
| |||||||
Total | 7,775,810 | 1,962,743 | 1,854,771 | |||||||||
|
|
|
|
|
| |||||||
Net asset value and redemption price per share (Net assets by class divided by shares outstanding by class, respectively): | ||||||||||||
Class A Shares | $ | 13.32 | $ | 12.99 | $ | 13.30 | ||||||
Class C Shares (a) | $ | 12.89 | $ | 12.75 | $ | 13.06 | ||||||
Class R Shares | $ | 13.25 | $ | 12.90 | $ | 13.23 | ||||||
Institutional Service Class Shares | $ | 13.44 | $ | 12.97 | $ | 13.24 | (b) | |||||
Institutional Class Shares | $ | 13.43 | $ | 12.97 | $ | 13.24 | ||||||
Maximum offering price per share (100%/(100%-maximum sales charge) of net asset value adjusted to the nearest cent): | ||||||||||||
Class A Shares | $ | 14.13 | $ | 13.78 | $ | 14.11 | ||||||
Maximum Sales Charge: | ||||||||||||
Class A Shares | 5.75 | % | 5.75 | % | 5.75 | % | ||||||
| (a) | For Class C Shares, the redemption price per share is reduced by 1.00% for shares held less than one year. |
| (b) | The NAV shown above differs from the traded NAV on October 31, 2014 due to financial statement adjustments. |
Amounts listed as “–” are $0 or round to $0.
See accompanying Notes to Financial Statements.
2014 Annual Report
19
Table of Contents
Statements of Operations
For the Year Ended October 31, 2014
| Aberdeen Diversified Alternatives Fund | Aberdeen Diversified Income Fund | Aberdeen Dynamic Allocation Fund | ||||||||||
INVESTMENT INCOME: | ||||||||||||
Dividend income | $ | 395,872 | $ | 635,328 | $ | 335,859 | ||||||
Dividend income from affiliates | 127,040 | 309,724 | 197,837 | |||||||||
Other income | – | 110 | – | |||||||||
|
|
|
|
|
| |||||||
| 522,912 | 945,162 | 533,696 | ||||||||||
|
|
|
|
|
| |||||||
Expenses: | ||||||||||||
Investment advisory fees | 91,885 | 39,805 | 38,176 | |||||||||
Administration fees | 49,005 | 21,229 | 20,361 | |||||||||
Distribution fees Class A | 28,119 | 19,618 | 24,414 | |||||||||
Distribution fees Class C | 131,199 | 161,716 | 140,175 | |||||||||
Distribution fees Class R | 1,200 | 1,948 | 2,189 | |||||||||
Administrative services fees Class A | 2,776 | 700 | 2,160 | |||||||||
Administrative services fees Class R | 190 | 846 | 873 | |||||||||
Transfer agent fees | 98,264 | 41,858 | 52,140 | |||||||||
Registration and filing fees | 63,180 | 64,318 | 63,483 | |||||||||
Printing fees | 25,461 | 17,672 | 18,681 | |||||||||
Audit fees | 20,235 | 20,235 | 20,235 | |||||||||
Custodian fees | 6,312 | 2,605 | 3,070 | |||||||||
Fund accounting fees | 5,207 | 2,113 | 2,151 | |||||||||
Legal fees | 3,686 | 2,550 | 2,224 | |||||||||
Trustee fees | 2,468 | 1,175 | 1,124 | |||||||||
Other | 5,859 | 4,124 | 4,109 | |||||||||
|
|
|
|
|
| |||||||
Total operating expenses before reimbursed/waived expenses | 535,046 | 402,512 | 395,565 | |||||||||
Expenses reimbursed | (218,423 | ) | (151,342 | ) | (162,128 | ) | ||||||
|
|
|
|
|
| |||||||
Net expenses | 316,623 | 251,170 | 233,437 | |||||||||
|
|
|
|
|
| |||||||
Net Investment Income | 206,289 | 693,992 | 300,259 | |||||||||
|
|
|
|
|
| |||||||
REALIZED/UNREALIZED GAIN/(LOSS) FROM INVESTMENTS: | ||||||||||||
Realized gain distributions from underlying affiliated funds | 190,060 | 200,058 | 136,947 | |||||||||
Realized gain distributions from underlying non-affiliated funds | 242,832 | 53,019 | 112,103 | |||||||||
Realized gain/(loss) from investment transactions from affiliated funds | (163,383 | ) | 308,403 | 952,507 | ||||||||
Realized gain from investment transactions from non-affiliated funds | 1,588,339 | 1,677,601 | 109,345 | |||||||||
|
|
|
|
|
| |||||||
Net realized gain from investments | 1,857,848 | 2,239,081 | 1,310,902 | |||||||||
|
|
|
|
|
| |||||||
Net change in unrealized appreciation/depreciation on investment transactions | 1,158,420 | (1,247,495 | ) | 242,727 | ||||||||
|
|
|
|
|
| |||||||
Net realized/unrealized gain from investments | 3,016,268 | 991,586 | 1,553,629 | |||||||||
|
|
|
|
|
| |||||||
CHANGE IN NET ASSETS RESULTING FROM OPERATIONS | $ | 3,222,557 | $ | 1,685,578 | $ | 1,853,888 | ||||||
|
|
|
|
|
| |||||||
Amounts listed as “–” are $0 or round to $0.
See accompanying Notes to Financial Statements.
Annual Report 2014
20
Table of Contents
Statements of Changes in Net Assets
Aberdeen Diversified Alternatives Fund | Aberdeen Diversified Income Fund | Aberdeen Dynamic Allocation Fund | ||||||||||||||||||||||
| Year Ended October 31, 2014 | Year Ended October 31, 2013 | Year Ended October 31, 2014 | Year Ended October 31, 2013 | Year Ended October 31, 2014 | Year Ended October 31, 2013 | |||||||||||||||||||
FROM INVESTMENT ACTIVITIES: | ||||||||||||||||||||||||
Operations: | ||||||||||||||||||||||||
Net investment income | $ | 206,289 | $ | 137,440 | $ | 693,992 | $ | 775,544 | $ | 300,259 | $ | 287,535 | ||||||||||||
Net realized gain from investments | 1,857,848 | 1,402,845 | 2,239,081 | 1,823,170 | 1,310,902 | 2,635,394 | ||||||||||||||||||
Net change in unrealized appreciation/depreciation on investments | 1,158,420 | 469,310 | (1,247,495 | ) | (279,844 | ) | 242,727 | (260,415 | ) | |||||||||||||||
|
|
|
|
|
|
|
|
|
|
|
| |||||||||||||
Changes in net assets resulting from operations | 3,222,557 | 2,009,595 | 1,685,578 | 2,318,870 | 1,853,888 | 2,662,514 | ||||||||||||||||||
|
|
|
|
|
|
|
|
|
|
|
| |||||||||||||
Distributions to Shareholders From: | ||||||||||||||||||||||||
Net investment income: | ||||||||||||||||||||||||
Class A | (80,959 | ) | (74,391 | ) | (287,000 | ) | (285,011 | ) | (159,098 | ) | (174,210 | ) | ||||||||||||
Class C | (49,661 | ) | (126,416 | ) | (479,010 | ) | (460,312 | ) | (124,077 | ) | (165,284 | ) | ||||||||||||
Class R | (3,156 | ) | (2,868 | ) | (12,297 | ) | (10,090 | ) | (5,096 | ) | (4,974 | ) | ||||||||||||
Institutional Service Class | (170 | ) | (123 | ) | (434 | ) | (332 | ) | (216 | ) | (195 | ) | ||||||||||||
Institutional Class | (153,831 | ) | (36,814 | ) | (83,432 | ) | (61,395 | ) | (23,269 | ) | (15,944 | ) | ||||||||||||
|
|
|
|
|
|
|
|
|
|
|
| |||||||||||||
Change in net assets from shareholder distributions | (287,777 | ) | (240,612 | ) | (862,173 | ) | (817,140 | ) | (311,756 | ) | (360,607 | ) | ||||||||||||
|
|
|
|
|
|
|
|
|
|
|
| |||||||||||||
Change in net assets from capital transactions | 78,425,759 | (2,566,354 | ) | (4,149,223 | ) | (8,145,204 | ) | (3,824,091 | ) | (5,067,535 | ) | |||||||||||||
|
|
|
|
|
|
|
|
|
|
|
| |||||||||||||
Change in net assets | 81,360,539 | (797,371 | ) | (3,325,818 | ) | (6,643,474 | ) | (2,281,959 | ) | (2,765,628 | ) | |||||||||||||
|
|
|
|
|
|
|
|
|
|
|
| |||||||||||||
Net Assets: | ||||||||||||||||||||||||
Beginning of year | 22,245,258 | 23,042,629 | 28,532,544 | 35,176,018 | 26,698,822 | 29,464,450 | ||||||||||||||||||
|
|
|
|
|
|
|
|
|
|
|
| |||||||||||||
End of year | $ | 103,605,797 | $ | 22,245,258 | $ | 25,206,726 | $ | 28,532,544 | $ | 24,416,863 | $ | 26,698,822 | ||||||||||||
|
|
|
|
|
|
|
|
|
|
|
| |||||||||||||
Accumulated net investment income/(loss) at end of year | $ | 75,832 | $ | – | $ | 89,624 | $ | 107,725 | $ | 35,140 | $ | 22,316 | ||||||||||||
|
|
|
|
|
|
|
|
|
|
|
| |||||||||||||
Amounts listed as “–” are $0 or round to $0.
See accompanying Notes to Financial Statements.
2014 Annual Report
21
Table of Contents
Statements of Changes in Net Assets (continued)
Aberdeen Diversified Alternatives Fund | Aberdeen Diversified Income Fund | Aberdeen Dynamic Allocation Fund | ||||||||||||||||||||||
| Year Ended October 31, 2014 | Year Ended October 31, 2013 | Year Ended October 31, 2014 | Year Ended October 31, 2013 | Year Ended October 31, 2014 | Year Ended October 31, 2013 | |||||||||||||||||||
CAPITAL TRANSACTIONS: | ||||||||||||||||||||||||
Class A Shares | ||||||||||||||||||||||||
Proceeds from shares issued | $ | 17,851,513 | $ | 1,270,665 | $ | 1,001,286 | $ | 1,212,716 | $ | 1,445,024 | $ | 830,182 | ||||||||||||
Dividends reinvested | 55,849 | 44,180 | 207,089 | 202,568 | 123,088 | 133,538 | ||||||||||||||||||
Cost of shares redeemed(a) | (3,001,757 | ) | (2,097,806 | ) | (2,274,714 | ) | (4,045,490 | ) | (2,585,883 | ) | (3,602,163 | ) | ||||||||||||
|
|
|
|
|
|
|
|
|
|
|
| |||||||||||||
Total Class A | 14,905,605 | (782,961 | ) | (1,066,339 | ) | (2,630,206 | ) | (1,017,771 | ) | (2,638,443 | ) | |||||||||||||
|
|
|
|
|
|
|
|
|
|
|
| |||||||||||||
Class C Shares | ||||||||||||||||||||||||
Proceeds from shares issued | 5,004,878 | 1,306,685 | 1,197,980 | 1,426,661 | 460,513 | 908,970 | ||||||||||||||||||
Dividends reinvested | 23,058 | 52,801 | 285,644 | 278,693 | 70,030 | 90,757 | ||||||||||||||||||
Cost of shares redeemed(a) | (2,600,681 | ) | (3,234,506 | ) | (4,908,566 | ) | (7,316,278 | ) | (3,575,862 | ) | (4,073,488 | ) | ||||||||||||
|
|
|
|
|
|
|
|
|
|
|
| |||||||||||||
Total Class C | 2,427,255 | (1,875,020 | ) | (3,424,942 | ) | (5,610,924 | ) | (3,045,319 | ) | (3,073,761 | ) | |||||||||||||
|
|
|
|
|
|
|
|
|
|
|
| |||||||||||||
Class R Shares | ||||||||||||||||||||||||
Proceeds from shares issued | 206,931 | 98,366 | 31,161 | 59,292 | 87,694 | 143,545 | ||||||||||||||||||
Dividends reinvested | – | – | 7,492 | 5,743 | 4,318 | 4,287 | ||||||||||||||||||
Cost of shares redeemed(a) | (244,859 | ) | (29,270 | ) | (30,361 | ) | (80,343 | ) | (68,465 | ) | (59,708 | ) | ||||||||||||
|
|
|
|
|
|
|
|
|
|
|
| |||||||||||||
Total Class R | (37,928 | ) | 69,096 | 8,292 | (15,308 | ) | 23,547 | 88,124 | ||||||||||||||||
|
|
|
|
|
|
|
|
|
|
|
| |||||||||||||
Institutional Service Class Shares | ||||||||||||||||||||||||
Dividends reinvested | 170 | 123 | 434 | 332 | 216 | 195 | ||||||||||||||||||
|
|
|
|
|
|
|
|
|
|
|
| |||||||||||||
Total Institutional Service Class | 170 | 123 | 434 | 332 | 216 | 195 | ||||||||||||||||||
|
|
|
|
|
|
|
|
|
|
|
| |||||||||||||
Institutional Class Shares | ||||||||||||||||||||||||
Proceeds from shares issued | 68,619,815 | 1,047,202 | 798,364 | 860,166 | 837,085 | 808,081 | ||||||||||||||||||
Dividends reinvested | 113,872 | 6,404 | 70,891 | 42,290 | 16,341 | 12,897 | ||||||||||||||||||
Cost of shares redeemed(a) | (7,603,030 | ) | (1,031,198 | ) | (535,923 | ) | (791,554 | ) | (638,190 | ) | (264,628 | ) | ||||||||||||
|
|
|
|
|
|
|
|
|
|
|
| |||||||||||||
Total Institutional Class | 61,130,657 | 22,408 | 333,332 | 110,902 | 215,236 | 556,350 | ||||||||||||||||||
|
|
|
|
|
|
|
|
|
|
|
| |||||||||||||
Change in net assets from capital transactions: | $ | 78,425,759 | $ | (2,566,354 | ) | $ | (4,149,223 | ) | $ | (8,145,204 | ) | $ | (3,824,091 | ) | $ | (5,067,535 | ) | |||||||
|
|
|
|
|
|
|
|
|
|
|
| |||||||||||||
| (a) | Includes redemption fees, if any. |
Amounts listed as “–” are $0 or round to $0.
See accompanying Notes to Financial Statements.
Annual Report 2014
22
Table of Contents
Statements of Changes in Net Assets (concluded)
Aberdeen Diversified Alternatives Fund | Aberdeen Diversified Income Fund | Aberdeen Dynamic Allocation Fund | ||||||||||||||||||||||
| Year Ended October 31, 2014 | Year Ended October 31, 2013 | Year Ended October 31, 2014 | Year Ended October 31, 2013 | Year Ended October 31, 2014 | Year Ended October 31, 2013 | |||||||||||||||||||
SHARE TRANSACTIONS: | ||||||||||||||||||||||||
Class A Shares | ||||||||||||||||||||||||
Issued | 1,361,008 | 103,422 | 78,994 | 98,593 | 112,205 | 69,195 | ||||||||||||||||||
Reinvested | 4,344 | 3,766 | 16,389 | 16,583 | 9,474 | 11,320 | ||||||||||||||||||
Redeemed | (229,073 | ) | (172,621 | ) | (179,245 | ) | (327,145 | ) | (201,191 | ) | (300,491 | ) | ||||||||||||
|
|
|
|
|
|
|
|
|
|
|
| |||||||||||||
Total Class A Shares | 1,136,279 | (65,433 | ) | (83,862 | ) | (211,969 | ) | (79,512 | ) | (219,976 | ) | |||||||||||||
|
|
|
|
|
|
|
|
|
|
|
| |||||||||||||
Class C Shares | ||||||||||||||||||||||||
Issued | 391,108 | 110,250 | 97,141 | 118,270 | 36,493 | 77,207 | ||||||||||||||||||
Reinvested | 1,846 | 4,628 | 23,065 | 23,251 | 5,493 | 7,904 | ||||||||||||||||||
Redeemed | (206,022 | ) | (274,511 | ) | (394,559 | ) | (602,538 | ) | (282,250 | ) | (345,674 | ) | ||||||||||||
|
|
|
|
|
|
|
|
|
|
|
| |||||||||||||
Total Class C Shares | 186,932 | (159,633 | ) | (274,353 | ) | (461,017 | ) | (240,264 | ) | (260,563 | ) | |||||||||||||
|
|
|
|
|
|
|
|
|
|
|
| |||||||||||||
Class R Shares | ||||||||||||||||||||||||
Issued | 15,795 | 8,160 | 2,467 | 4,824 | 6,783 | 12,148 | ||||||||||||||||||
Reinvested | – | – | 596 | 473 | 333 | 367 | ||||||||||||||||||
Redeemed | (19,056 | ) | (2,465 | ) | (2,435 | ) | (6,470 | ) | (5,420 | ) | (5,016 | ) | ||||||||||||
|
|
|
|
|
|
|
|
|
|
|
| |||||||||||||
Total Class R Shares | (3,261 | ) | 5,695 | 628 | (1,173 | ) | 1,696 | 7,499 | ||||||||||||||||
|
|
|
|
|
|
|
|
|
|
|
| |||||||||||||
Institutional Service Class Shares | ||||||||||||||||||||||||
Reinvested | 13 | 10 | 35 | 27 | 17 | 16 | ||||||||||||||||||
|
|
|
|
|
|
|
|
|
|
|
| |||||||||||||
Total Institutional Service Class Shares | 13 | 10 | 35 | 27 | 17 | 16 | ||||||||||||||||||
|
|
|
|
|
|
|
|
|
|
|
| |||||||||||||
Institutional Class Shares | ||||||||||||||||||||||||
Issued | 5,231,802 | 85,803 | 61,922 | 69,825 | 64,327 | 66,809 | ||||||||||||||||||
Reinvested | 8,543 | 542 | 5,595 | 3,463 | 1,259 | 1,092 | ||||||||||||||||||
Redeemed | (576,933 | ) | (83,637 | ) | (42,662 | ) | (64,046 | ) | (50,024 | ) | (21,648 | ) | ||||||||||||
|
|
|
|
|
|
|
|
|
|
|
| |||||||||||||
Total Institutional Class Shares | 4,663,412 | 2,708 | 24,855 | 9,242 | 15,562 | 46,253 | ||||||||||||||||||
|
|
|
|
|
|
|
|
|
|
|
| |||||||||||||
Total change in shares: | 5,983,375 | (216,653 | ) | (332,697 | ) | (664,890 | ) | (302,501 | ) | (426,771 | ) | |||||||||||||
|
|
|
|
|
|
|
|
|
|
|
| |||||||||||||
| (a) | Includes redemption fees, if any. |
Amounts listed as “–” are $0 or round to $0.
See accompanying Notes to Financial Statements.
2014 Annual Report
23
Table of Contents
Financial Highlights
Selected Data for Each Share of Capital Outstanding Throughout the Periods Indicated
Aberdeen Diversified Alternatives Fund
| Investment Activities | Distributions | |||||||||||||||||||||||||||||||
Net Asset Value, Beginning of Period | Net Investment Income (Loss) (a) | Net ments | Total ment | Net ment | Tax Return of Capital | Total butions | Net Asset Value, End of Period | |||||||||||||||||||||||||
Class A Shares | ||||||||||||||||||||||||||||||||
Year Ended October 31, 2014 | $ | 12.63 | $ | 0.05 | $ | 0.79 | $ | 0.84 | $ | (0.15 | ) | $ | – | $ | (0.15 | ) | $ | 13.32 | ||||||||||||||
Year Ended October 31, 2013 | 11.64 | 0.12 | 1.01 | 1.13 | (0.14 | ) | – | (0.14 | ) | 12.63 | ||||||||||||||||||||||
Year Ended October 31, 2012 | 10.93 | 0.18 | 0.70 | 0.88 | (0.17 | ) | – | (0.17 | ) | 11.64 | ||||||||||||||||||||||
Year Ended October 31, 2011 | 11.31 | 0.21 | (0.38 | ) | (0.17 | ) | (0.21 | ) | – | (0.21 | ) | 10.93 | ||||||||||||||||||||
Year Ended October 31, 2010 | 9.89 | 0.13 | 1.42 | 1.55 | (0.12 | ) | (0.01 | ) | (0.13 | ) | 11.31 | |||||||||||||||||||||
Class C Shares | ||||||||||||||||||||||||||||||||
Year Ended October 31, 2014 | 12.22 | (0.05 | ) | 0.77 | 0.72 | (0.05 | ) | – | (0.05 | ) | 12.89 | |||||||||||||||||||||
Year Ended October 31, 2013 | 11.33 | 0.03 | 0.97 | 1.00 | (0.11 | ) | – | (0.11 | ) | 12.22 | ||||||||||||||||||||||
Year Ended October 31, 2012 | 10.67 | 0.10 | 0.68 | 0.78 | (0.12 | ) | – | (0.12 | ) | 11.33 | ||||||||||||||||||||||
Year Ended October 31, 2011 | 11.03 | 0.14 | (0.37 | ) | (0.23 | ) | (0.13 | ) | – | (0.13 | ) | 10.67 | ||||||||||||||||||||
Year Ended October 31, 2010 | 9.66 | 0.04 | 1.39 | 1.43 | (0.05 | ) | (0.01 | ) | (0.06 | ) | 11.03 | |||||||||||||||||||||
Class R Shares | ||||||||||||||||||||||||||||||||
Year Ended October 31, 2014 | 12.56 | 0.02 | 0.78 | 0.80 | (0.11 | ) | – | (0.11 | ) | 13.25 | ||||||||||||||||||||||
Year Ended October 31, 2013 | 11.61 | 0.06 | 1.01 | 1.07 | (0.12 | ) | – | (0.12 | ) | 12.56 | ||||||||||||||||||||||
Year Ended October 31, 2012 | 10.90 | 0.14 | 0.71 | 0.85 | (0.14 | ) | – | (0.14 | ) | 11.61 | ||||||||||||||||||||||
Year Ended October 31, 2011 | 11.26 | 0.21 | (0.42 | ) | (0.21 | ) | (0.15 | ) | – | (0.15 | ) | 10.90 | ||||||||||||||||||||
Year Ended October 31, 2010 | 9.85 | 0.09 | 1.42 | 1.51 | (0.09 | ) | (0.01 | ) | (0.10 | ) | 11.26 | |||||||||||||||||||||
Institutional Service Class Shares | ||||||||||||||||||||||||||||||||
Year Ended October 31, 2014 | 12.75 | 0.09 | 0.80 | 0.89 | (0.20 | ) | – | (0.20 | ) | 13.44 | ||||||||||||||||||||||
Year Ended October 31, 2013 | 11.73 | 0.15 | 1.02 | 1.17 | (0.15 | ) | – | (0.15 | ) | 12.75 | ||||||||||||||||||||||
Period from September 24, 2012 through October 31, 2012(h)(i) | 11.81 | 0.01 | (0.09 | ) | (0.08 | ) | – | – | – | 11.73 | ||||||||||||||||||||||
Period from November 1, 2008 through April 22, 2009(h)(j) | 8.50 | 0.01 | (0.66 | ) | (0.65 | ) | (0.03 | ) | – | (0.03 | ) | 7.82 | ||||||||||||||||||||
Institutional Class Shares | ||||||||||||||||||||||||||||||||
Year Ended October 31, 2014 | 12.75 | 0.08 | 0.80 | 0.88 | (0.20 | ) | – | (0.20 | ) | 13.43 | ||||||||||||||||||||||
Year Ended October 31, 2013 | 11.73 | 0.15 | 1.02 | 1.17 | (0.15 | ) | – | (0.15 | ) | 12.75 | ||||||||||||||||||||||
Year Ended October 31, 2012 | 11.00 | 0.22 | 0.71 | 0.93 | (0.20 | ) | – | (0.20 | ) | 11.73 | ||||||||||||||||||||||
Year Ended October 31, 2011 | 11.38 | 0.25 | (0.39 | ) | (0.14 | ) | (0.24 | ) | – | (0.24 | ) | 11.00 | ||||||||||||||||||||
Year Ended October 31, 2010 | 9.96 | 0.12 | 1.45 | 1.57 | (0.14 | ) | (0.01 | ) | (0.15 | ) | 11.38 | |||||||||||||||||||||
| (a) | Net investment income (loss) is based on average shares outstanding during the period. |
| (b) | Excludes sales charge. |
| (c) | Not annualized for periods less than one year. |
| (d) | Annualized for periods less than one year. |
Amounts listed as “–” are $0 or round to $0.
See accompanying Notes to Financial Statements.
Annual Report 2014
24
Table of Contents
Financial Highlights (continued)
Selected Data for Each Share of Capital Outstanding Throughout the Periods Indicated
Aberdeen Diversified Alternatives Fund (concluded)
| Ratios/Supplemental Data | ||||||||||||||||||||||
Total Return (b)(c) | Net Assets at End of Period (000’s) | Ratio of Expenses (d) | Ratio of Net (d) | Ratio of Expenses (d)(e) | Portfolio Turnover (f) | |||||||||||||||||
| 6.70 | % | $ | 21,608 | 0.52 | % | 0.36 | % | 0.88 | % | 54.26 | % | |||||||||||
| 9.76 | % | 6,135 | 0.52 | % | 1.02 | % | 1.20 | % | 47.20 | % | ||||||||||||
| 8.14 | % | 6,418 | 0.52 | % | 1.65 | % | 1.14 | % | 51.62 | % | ||||||||||||
| (1.52 | %) | 7,624 | 0.51 | % | 1.85 | % | 1.03 | % | 26.76 | % | ||||||||||||
| 15.73 | % | 7,919 | 0.51 | % | 1.21 | % | 1.02 | % | 60.00 | % | ||||||||||||
| 5.91 | % | 15,565 | 1.25 | % | (0.36 | %) | 1.61 | % | 54.26 | % | ||||||||||||
| 8.91 | % | 12,467 | 1.25 | % | 0.26 | % | 1.93 | % | 47.20 | % | ||||||||||||
| 7.39 | % | 13,368 | 1.25 | % | 0.93 | % | 1.87 | % | 51.62 | % | ||||||||||||
| (2.14 | %) | 16,828 | 1.25 | % | 1.27 | % | 1.77 | % | 26.76 | % | ||||||||||||
| 14.84 | % | 23,495 | 1.25 | % | 0.42 | % | 1.76 | % | 60.00 | % | ||||||||||||
| 6.37 | %(g) | 348 | 0.83 | % | 0.14 | % | 1.19 | % | 54.26 | % | ||||||||||||
| 9.32 | %(g) | 371 | 0.88 | % | 0.51 | % | 1.56 | % | 47.20 | % | ||||||||||||
| 7.85 | %(g) | 277 | 0.91 | % | 1.22 | % | 1.53 | % | 51.62 | % | ||||||||||||
| (1.77 | %) | 254 | 0.79 | % | 1.80 | % | 1.32 | % | 26.76 | % | ||||||||||||
| 15.43 | % | 400 | 0.75 | % | 0.91 | % | 1.26 | % | 60.00 | % | ||||||||||||
| 7.02 | % | 12 | 0.25 | % | 0.65 | % | 0.61 | % | 54.26 | % | ||||||||||||
| 10.03 | % | 11 | 0.25 | % | 1.22 | % | 0.93 | % | 47.20 | % | ||||||||||||
| (0.68 | %) | 10 | 0.25 | % | 0.56 | % | 0.87 | % | 51.62 | % | |||||||||||
| (7.67 | %) | 1 | 0.25 | % | 0.17 | % | 1.39 | % | 7.39 | % | ||||||||||||
| 6.94 | % | 66,073 | 0.25 | % | 0.58 | % | 0.61 | % | 54.26 | % | ||||||||||||
| 10.03 | % | 3,261 | 0.25 | % | 1.19 | % | 0.93 | % | 47.20 | % | ||||||||||||
| 8.54 | %(g) | 2,970 | 0.25 | % | 1.95 | % | 0.87 | % | 51.62 | % | ||||||||||||
| (1.17 | %) | 3,032 | 0.25 | % | 2.15 | % | 0.77 | % | 26.76 | % | ||||||||||||
| 15.90 | % | 3,200 | 0.25 | % | 1.13 | % | 0.76 | % | 60.00 | % | ||||||||||||
| (e) | During the period, certain fees were waived and/or reimbursed. If such waivers/reimbursements had not occurred, the ratios would have been as indicated. |
| (f) | Portfolio turnover is calculated on the basis of the Fund as a whole without distinguishing among the classes of shares. |
| (g) | The total return shown above includes the impact of financial statement rounding of the NAV per share and/or financial statement adjustments. |
| (h) | There were no shareholders in the class for the period from April 23, 2009 through September 23, 2012. The financial highlights information presented is for two separate periods of time when shareholders were invested in the class. |
| (i) | For the period from September 24, 2012 (commencement of operations) through October 31, 2012. |
| (j) | See Note 5 for Financial Highlights information prior to year ended October 31, 2009. |
2014 Annual Report
25
Table of Contents
Financial Highlights (continued)
Selected Data for Each Share of Capital Outstanding Throughout the Periods Indicated
Aberdeen Diversified Income Fund
| Investment Activities | Distributions | |||||||||||||||||||||||||||
| Net Asset Value, Beginning of Period | Net (a) | Net ments | Total ment | Net ment | Total butions | Net Asset Value, End of Period | ||||||||||||||||||||||
Class A Shares | ||||||||||||||||||||||||||||
Year Ended October 31, 2014 | $ | 12.58 | $ | 0.39 | $ | 0.48 | $ | 0.87 | $ | (0.46 | ) | $ | (0.46 | ) | $ | 12.99 | ||||||||||||
Year Ended October 31, 2013 | 12.03 | 0.35 | 0.56 | 0.91 | (0.36 | ) | (0.36 | ) | 12.58 | |||||||||||||||||||
Year Ended October 31, 2012 | 11.39 | 0.25 | 0.62 | 0.87 | (0.23 | ) | (0.23 | ) | 12.03 | |||||||||||||||||||
Year Ended October 31, 2011 | 11.42 | 0.23 | (0.03 | ) | 0.20 | (0.23 | ) | (0.23 | ) | 11.39 | ||||||||||||||||||
Year Ended October 31, 2010 | 10.20 | 0.18 | 1.21 | 1.39 | (0.17 | ) | (0.17 | ) | 11.42 | |||||||||||||||||||
Class C Shares | ||||||||||||||||||||||||||||
Year Ended October 31, 2014 | 12.35 | 0.29 | 0.48 | 0.77 | (0.37 | ) | (0.37 | ) | 12.75 | |||||||||||||||||||
Year Ended October 31, 2013 | 11.81 | 0.25 | 0.56 | 0.81 | (0.27 | ) | (0.27 | ) | 12.35 | |||||||||||||||||||
Year Ended October 31, 2012 | 11.18 | 0.17 | 0.61 | 0.78 | (0.15 | ) | (0.15 | ) | 11.81 | |||||||||||||||||||
Year Ended October 31, 2011 | 11.22 | 0.15 | (0.05 | ) | 0.10 | (0.14 | ) | (0.14 | ) | 11.18 | ||||||||||||||||||
Year Ended October 31, 2010 | 10.03 | 0.09 | 1.20 | 1.29 | (0.10 | ) | (0.10 | ) | 11.22 | |||||||||||||||||||
Class R Shares | ||||||||||||||||||||||||||||
Year Ended October 31, 2014 | 12.49 | 0.33 | 0.49 | 0.82 | (0.41 | ) | (0.41 | ) | 12.90 | |||||||||||||||||||
Year Ended October 31, 2013 | 11.94 | 0.29 | 0.57 | 0.86 | (0.31 | ) | (0.31 | ) | 12.49 | |||||||||||||||||||
Year Ended October 31, 2012 | 11.31 | 0.19 | 0.62 | 0.81 | (0.18 | ) | (0.18 | ) | 11.94 | |||||||||||||||||||
Year Ended October 31, 2011 | 11.34 | 0.20 | (0.06 | ) | 0.14 | (0.17 | ) | (0.17 | ) | 11.31 | ||||||||||||||||||
Year Ended October 31, 2010 | 10.13 | 0.10 | 1.26 | 1.36 | (0.15 | ) | (0.15 | ) | 11.34 | |||||||||||||||||||
Institutional Service Class Shares | ||||||||||||||||||||||||||||
Year Ended October 31, 2014 | 12.57 | 0.42 | 0.48 | 0.90 | (0.50 | ) | (0.50 | ) | 12.97 | |||||||||||||||||||
Year Ended October 31, 2013 | 12.01 | 0.39 | 0.57 | 0.96 | (0.40 | ) | (0.40 | ) | 12.57 | |||||||||||||||||||
Period from September 24, 2012 through October 31, 2012(h)(i) | 12.06 | 0.03 | (0.08 | ) | (0.05 | ) | – | – | 12.01 | |||||||||||||||||||
Period from November 1, 2008 through April 22, 2009(h)(j) | 8.77 | 0.06 | (0.24 | ) | (0.18 | ) | (0.08 | ) | (0.08 | ) | 8.51 | |||||||||||||||||
Institutional Class Shares | ||||||||||||||||||||||||||||
Year Ended October 31, 2014 | 12.56 | 0.42 | 0.49 | 0.91 | (0.50 | ) | (0.50 | ) | 12.97 | |||||||||||||||||||
Year Ended October 31, 2013 | 12.01 | 0.38 | 0.57 | 0.95 | (0.40 | ) | (0.40 | ) | 12.56 | |||||||||||||||||||
Year Ended October 31, 2012 | 11.38 | 0.28 | 0.61 | 0.89 | (0.26 | ) | (0.26 | ) | 12.01 | |||||||||||||||||||
Year Ended October 31, 2011 | 11.41 | 0.26 | (0.03 | ) | 0.23 | (0.26 | ) | (0.26 | ) | 11.38 | ||||||||||||||||||
Year Ended October 31, 2010 | 10.19 | 0.17 | 1.25 | 1.42 | (0.20 | ) | (0.20 | ) | 11.41 | |||||||||||||||||||
| (a) | Net investment income (loss) is based on average shares outstanding during the period. |
| (b) | Excludes sales charge. |
| (c) | Not annualized for periods less than one year. |
| (d) | Annualized for periods less than one year. |
Amounts listed as “–” are $0 or round to $0.
See accompanying Notes to Financial Statements.
Annual Report 2014
26
Table of Contents
Financial Highlights (continued)
Selected Data for Each Share of Capital Outstanding Throughout the Periods Indicated
Aberdeen Diversified Income Fund (concluded)
| Ratios/Supplemental Data | ||||||||||||||||||||||
Total Return (b)(c) | Net Assets at End of Period (000’s) | Ratio of Expenses (d) | Ratio of Net (d) | Ratio of Expenses (d)(e) | Portfolio Turnover (f) | |||||||||||||||||
| 7.10 | % | $ | 7,542 | 0.51 | % | 3.06 | % | 1.08 | % | 29.19 | % | |||||||||||
| 7.69 | % | 8,357 | 0.53 | % | 2.82 | % | 1.00 | % | 37.01 | % | ||||||||||||
| 7.73 | %(g) | 10,538 | 0.53 | % | 2.15 | % | 1.00 | % | 65.34 | % | ||||||||||||
| 1.71 | % | 9,220 | 0.53 | % | 1.99 | % | 0.92 | % | 26.55 | % | ||||||||||||
| 13.74 | % | 12,744 | 0.51 | % | 1.66 | % | 0.88 | % | 41.21 | % | ||||||||||||
| 6.34 | %(g) | 14,906 | 1.25 | % | 2.31 | % | 1.82 | % | 29.19 | % | ||||||||||||
| 6.96 | %(g) | 17,824 | 1.25 | % | 2.09 | % | 1.72 | % | 37.01 | % | ||||||||||||
| 7.01 | %(g) | 22,488 | 1.25 | % | 1.45 | % | 1.72 | % | 65.34 | % | ||||||||||||
| 1.01 | % | 20,388 | 1.25 | % | 1.27 | % | 1.65 | % | 26.55 | % | ||||||||||||
| 12.94 | % | 25,853 | 1.25 | % | 0.86 | % | 1.61 | % | 41.21 | % | ||||||||||||
| 6.66 | % | 408 | 0.97 | % | 2.58 | % | 1.54 | % | 29.19 | % | ||||||||||||
| 7.29 | % | 387 | 0.96 | % | 2.39 | % | 1.43 | % | 37.01 | % | ||||||||||||
| 7.20 | % | 384 | 0.99 | % | 1.63 | % | 1.46 | % | 65.34 | % | ||||||||||||
| 1.26 | % | 410 | 0.87 | % | 1.77 | % | 1.27 | % | 26.55 | % | ||||||||||||
| 13.51 | % | 1,205 | 0.78 | % | 0.97 | % | 1.15 | % | 41.21 | % | ||||||||||||
| 7.32 | %(g) | 12 | 0.25 | % | 3.31 | % | 0.82 | % | 29.19 | % | ||||||||||||
| 8.10 | %(g) | 11 | 0.25 | % | 3.10 | % | 0.72 | % | 37.01 | % | ||||||||||||
| (0.41 | %)(g) | 10 | 0.25 | % | 2.52 | % | 0.72 | % | 65.34 | % | ||||||||||||
| (1.99 | %) | 1 | 0.25 | % | 1.50 | % | 0.95 | % | 32.11 | % | ||||||||||||
| 7.40 | % | 2,339 | 0.25 | % | 3.32 | % | 0.82 | % | 29.19 | % | ||||||||||||
| 8.01 | % | 1,953 | 0.25 | % | 3.10 | % | 0.72 | % | 37.01 | % | ||||||||||||
| 7.95 | % | 1,756 | 0.25 | % | 2.39 | % | 0.72 | % | 65.34 | % | ||||||||||||
| 2.00 | % | 1,027 | 0.25 | % | 2.25 | % | 0.64 | % | 26.55 | % | ||||||||||||
| 14.03 | % | 1,447 | 0.25 | % | 1.58 | % | 0.54 | % | 41.21 | % | ||||||||||||
| (e) | During the period, certain fees were waived and/or reimbursed. If such waivers/reimbursements had not occurred, the ratios would have been as indicated. |
| (f) | Portfolio turnover is calculated on the basis of the Fund as a whole without distinguishing among the classes of shares. |
| (g) | The total return shown above includes the impact of financial statement rounding of the NAV per share and/or financial statement adjustments. |
| (h) | There were no shareholders in the class for the period from April 23, 2009 through September 23, 2012. The financial highlights information presented is for two separate periods of time when shareholders were invested in the class. |
| (i) | For the period from September 24, 2012 (commencement of operations) through October 31, 2012. |
| (j) | See Note 5 for Financial Highlights information prior to year ended October 31, 2009. |
2014 Annual Report
27
Table of Contents
Financial Highlights (continued)
Selected Data for Each Share of Capital Outstanding Throughout the Periods Indicated
Aberdeen Dynamic Allocation Fund
| Investment Activities | Distributions | |||||||||||||||||||||||||||
| Net Asset Value, Beginning of Period | Net (a) | Net ments | Total ment | Net ment | Total butions | Net Asset Value, End of Period | ||||||||||||||||||||||
Class A Shares | ||||||||||||||||||||||||||||
Year Ended October 31, 2014 | $ | 12.51 | $ | 0.20 | $ | 0.80 | $ | 1.00 | $ | (0.21 | ) | $ | (0.21 | ) | $ | 13.30 | ||||||||||||
Year Ended October 31, 2013 | 11.52 | 0.17 | 1.01 | 1.18 | (0.19 | ) | (0.19 | ) | 12.51 | |||||||||||||||||||
Year Ended October 31, 2012 | 10.87 | 0.21 | 0.64 | 0.85 | (0.20 | ) | (0.20 | ) | 11.52 | |||||||||||||||||||
Year Ended October 31, 2011 | 10.88 | 0.20 | (0.03 | ) | 0.17 | (0.18 | ) | (0.18 | ) | 10.87 | ||||||||||||||||||
Year Ended October 31, 2010 | 9.50 | 0.12 | 1.37 | 1.49 | (0.11 | ) | (0.11 | ) | 10.88 | |||||||||||||||||||
Class C Shares | ||||||||||||||||||||||||||||
Year Ended October 31, 2014 | 12.28 | 0.11 | 0.78 | 0.89 | (0.11 | ) | (0.11 | ) | 13.06 | |||||||||||||||||||
Year Ended October 31, 2013 | 11.32 | 0.08 | 1.00 | 1.08 | (0.12 | ) | (0.12 | ) | 12.28 | |||||||||||||||||||
Year Ended October 31, 2012 | 10.69 | 0.13 | 0.62 | 0.75 | (0.12 | ) | (0.12 | ) | 11.32 | |||||||||||||||||||
Year Ended October 31, 2011 | 10.72 | 0.12 | (0.03 | ) | 0.09 | (0.12 | ) | (0.12 | ) | 10.69 | ||||||||||||||||||
Year Ended October 31, 2010 | 9.37 | 0.05 | 1.35 | 1.40 | (0.05 | ) | (0.05 | ) | 10.72 | |||||||||||||||||||
Class R Shares | ||||||||||||||||||||||||||||
Year Ended October 31, 2014 | 12.45 | 0.15 | 0.78 | 0.93 | (0.15 | ) | (0.15 | ) | 13.23 | |||||||||||||||||||
Year Ended October 31, 2013 | 11.47 | 0.12 | 1.02 | 1.14 | (0.16 | ) | (0.16 | ) | 12.45 | |||||||||||||||||||
Year Ended October 31, 2012 | 10.83 | 0.15 | 0.66 | 0.81 | (0.17 | ) | (0.17 | ) | 11.47 | |||||||||||||||||||
Year Ended October 31, 2011 | 10.83 | 0.14 | 0.01 | 0.15 | (0.15 | ) | (0.15 | ) | 10.83 | |||||||||||||||||||
Year Ended October 31, 2010 | 9.45 | 0.09 | 1.38 | 1.47 | (0.09 | ) | (0.09 | ) | 10.83 | |||||||||||||||||||
Institutional Service Class Shares | ||||||||||||||||||||||||||||
Year Ended October 31, 2014 | 12.46 | 0.24 | 0.78 | 1.02 | (0.24 | ) | (0.24 | ) | 13.24 | |||||||||||||||||||
Year Ended October 31, 2013 | 11.47 | 0.20 | 1.02 | 1.22 | (0.23 | ) | (0.23 | ) | 12.46 | |||||||||||||||||||
Period from September 24, 2012 through October 31, 2012(h)(i) | 11.58 | 0.01 | (0.12 | ) | (0.11 | ) | – | – | 11.47 | |||||||||||||||||||
Period from November 1, 2008 through April 22, 2009(h)(j) | 8.16 | 0.03 | (0.45 | ) | (0.42 | ) | (0.06 | ) | (0.06 | ) | 7.68 | |||||||||||||||||
Institutional Class Shares | ||||||||||||||||||||||||||||
Year Ended October 31, 2014 | 12.46 | 0.24 | 0.78 | 1.02 | (0.24 | ) | (0.24 | ) | 13.24 | |||||||||||||||||||
Year Ended October 31, 2013 | 11.47 | 0.19 | 1.03 | 1.22 | (0.23 | ) | (0.23 | ) | 12.46 | |||||||||||||||||||
Year Ended October 31, 2012 | 10.83 | 0.19 | 0.68 | 0.87 | (0.23 | ) | (0.23 | ) | 11.47 | |||||||||||||||||||
Year Ended October 31, 2011 | 10.92 | 0.20 | (0.08 | ) | 0.12 | (0.21 | ) | (0.21 | ) | 10.83 | ||||||||||||||||||
Year Ended October 31, 2010 | 9.50 | 0.15 | 1.41 | 1.56 | (0.14 | ) | (0.14 | ) | 10.92 | |||||||||||||||||||
| (a) | Net investment income (loss) is based on average shares outstanding during the period. |
| (b) | Excludes sales charge. |
| (c) | Not annualized for periods less than one year. |
| (d) | Annualized for periods less than one year. |
Amounts listed as “–” are $0 or round to $0.
See accompanying Notes to Financial Statements.
Annual Report 2014
28
Table of Contents
Financial Highlights (concluded)
Selected Data for Each Share of Capital Outstanding Throughout the Periods Indicated
Aberdeen Dynamic Allocation Fund (concluded)
| Ratios/Supplemental Data | ||||||||||||||||||||||
Total Return (b)(c) | Net Assets at End of Period (000’s) | Ratio of Expenses (d) | Ratio of Net to Average Net Assets (d) | Ratio of Expenses (d)(e) | Portfolio Turnover (f) | |||||||||||||||||
| 8.03 | % | $ | 9,506 | 0.52 | % | 1.58 | % | 1.16 | % | 52.34 | % | |||||||||||
| 10.35 | % | 9,937 | 0.52 | % | 1.44 | % | 1.07 | % | 67.49 | % | ||||||||||||
| 7.93 | %(g) | 11,682 | 0.53 | % | 1.90 | % | 1.08 | % | 60.45 | % | ||||||||||||
| 1.67 | % | 10,755 | 0.54 | % | 1.83 | % | 1.00 | % | 20.14 | % | ||||||||||||
| 15.81 | % | 12,684 | 0.53 | % | 1.15 | % | 0.99 | % | 56.29 | % | ||||||||||||
| 7.28 | % | 12,939 | 1.25 | % | 0.85 | % | 1.89 | % | 52.34 | % | ||||||||||||
| 9.58 | % | 15,123 | 1.25 | % | 0.71 | % | 1.80 | % | 67.49 | % | ||||||||||||
| 7.10 | % | 16,890 | 1.25 | % | 1.18 | % | 1.80 | % | 60.45 | % | ||||||||||||
| 0.95 | % | 15,009 | 1.25 | % | 1.12 | % | 1.72 | % | 20.14 | % | ||||||||||||
| 15.03 | % | 17,300 | 1.25 | % | 0.48 | % | 1.71 | % | 56.29 | % | ||||||||||||
| 7.52 | % | 454 | 0.95 | % | 1.15 | % | 1.59 | % | 52.34 | % | ||||||||||||
| 9.99 | % | 406 | 0.92 | % | 1.02 | % | 1.47 | % | 67.49 | % | ||||||||||||
| 7.55 | % | 288 | 0.89 | % | 1.38 | % | 1.44 | % | 60.45 | % | ||||||||||||
| 1.42 | % | 28 | 0.79 | % | 1.23 | % | 1.26 | % | 20.14 | % | ||||||||||||
| 15.68 | % | 18 | 0.75 | % | 0.89 | % | 1.22 | % | 56.29 | % | ||||||||||||
| 8.36 | % | 12 | 0.25 | % | 1.85 | % | 0.89 | % | 52.34 | % | ||||||||||||
| 10.72 | % | 11 | 0.25 | % | 1.68 | % | 0.80 | % | 67.49 | % | ||||||||||||
| (0.95 | %) | 10 | 0.25 | % | 1.13 | % | 0.80 | % | 60.45 | % | ||||||||||||
| (5.19 | %) | 1 | 0.25 | % | 1.54 | % | 1.19 | % | 27.48 | % | ||||||||||||
| 8.28 | % | 1,506 | 0.25 | % | 1.86 | % | 0.89 | % | 52.34 | % | ||||||||||||
| 10.72 | % | 1,223 | 0.25 | % | 1.62 | % | 0.80 | % | 67.49 | % | ||||||||||||
| 8.18 | % | 596 | 0.25 | % | 1.65 | % | 0.80 | % | 60.45 | % | ||||||||||||
| 1.40 | % | 8 | 0.25 | % | 1.83 | % | 0.72 | % | 20.14 | % | ||||||||||||
| 16.18 | % | 2 | 0.25 | % | 1.46 | % | 0.70 | % | 56.29 | % | ||||||||||||
| (e) | During the period, certain fees were waived and/or reimbursed. If such waivers/reimbursements had not occurred, the ratios would have been as indicated. |
| (f) | Portfolio turnover is calculated on the basis of the Fund as a whole without distinguishing among the classes of shares. |
| (g) | The total return shown above includes the impact of financial statement rounding of the NAV per share and/or financial statement adjustments. |
| (h) | There were no shareholders in the class for the period from April 23, 2009 through September 23, 2012. The financial highlights information presented is for two separate periods of time when shareholders were invested in the class. |
| (i) | For the period from September 24, 2012 (commencement of operations) through October 31, 2012. |
| (j) | See Note 5 for Financial Highlights information prior to year ended October 31, 2009. |
2014 Annual Report
29
Table of Contents
October 31, 2014
1. Organization
Aberdeen Funds (the “Trust”) was organized as a statutory trust under the laws of the state of Delaware by a Certificate of Trust filed on September 27, 2007 and is registered under the Investment Company Act of 1940, as amended (the “1940 Act”), as an open-end management investment company. As of October 31, 2014, the Trust had authorized an unlimited number of shares of beneficial interest (“shares”) without par value. As of October 31, 2014, the Trust operated twenty-four (24) separate series, or mutual funds, each with its own investment objective(s) and strategies. This report contains the financial statements and financial highlights of the three (3) funds listed below (each a “Fund”; collectively, the “Funds”):
| – | Aberdeen Diversified Alternatives Fund (“Diversified Alternatives Fund”) |
| – | Aberdeen Diversified Income Fund (“Diversified Income Fund”) |
| – | Aberdeen Dynamic Allocation Fund (“Dynamic Allocation Fund”) |
Each of the Funds is operated as a “fund of funds,” which means that each of these Funds pursues its investment objective primarily by allocating its investments among other affiliated and unaffiliated mutual funds (“Underlying Funds”).
2. Summary of Significant Accounting Policies
The following is a summary of significant accounting policies followed by the Funds in the preparation of their financial statements. The policies conform to accounting principles generally accepted in the United States of America (“GAAP”). The preparation of financial statements requires management to make estimates and assumptions that affect the reported amounts of assets and liabilities, disclosure of contingent assets and liabilities at the date of the financial statements, and the reported amounts of income and expenses for the period. Actual results could differ from those estimates. The accounting records of the Funds are maintained in U.S. Dollars.
| a. | Security Valuation |
The Funds value their securities at current market value or fair value, consistent with regulatory requirements. “Fair value” is defined in the Trust’s Valuation and Liquidity Procedures as the price that could be received to sell an asset or paid to transfer a liability in an orderly transaction between willing market participants without a compulsion to contract at the measurement date.
Equity securities that are traded on an exchange are valued at the last quoted sale price on the principal exchange on which the security is traded at the “Valuation Time” subject to application, when appropriate, of the valuation factors described in the paragraph below. The Valuation Time is as of the close of regular trading on the New York Stock Exchange (usually 4:00 p.m. Eastern Time). In the absence of a sale price, the security is valued at the mean of the bid/ask price quoted at the close on the principal exchange on which the security is traded. Securities traded on NASDAQ are valued at the NASDAQ official closing price. Open-end mutual funds are valued at the respective net asset value as reported by such company. Closed-end funds and exchange-traded funds (“ETF“s) are valued at the market price of the security at the Valuation Time. A security using any of these pricing methodologies is determined to be a Level 1 investment.
In the event that a security’s market quotations are not readily available or are deemed unreliable (for reasons other than because the foreign exchange on which it trades closed before the Valuation Time), the security is valued at fair value as determined by a pricing committee (“Pricing Committee”), taking into account the relevant factors and surrounding circumstances using valuation policies and procedures approved by the Trust’s Board of Trustees (the “Board”). A security that has been fair valued by the Pricing Committee may be classified as Level 2 or 3 depending on the nature of the inputs.
In accordance with the authoritative guidance on fair value measurements and disclosures under GAAP, the Funds disclose the fair value of their investments using a three-level hierarchy that classifies the inputs to valuation techniques used to measure the fair value. The hierarchy assigns Level 1 measurements to valuations based upon unadjusted quoted prices in active markets for identical assets, Level 2 measurements to valuations based upon other significant observable inputs, including adjusted quoted prices in active markets for identical assets, and Level 3 measurements to valuations based upon unobservable inputs that are significant to the valuation. Observable inputs are inputs that reflect the assumptions market participants would use in pricing the asset or liability, which are based on market data obtained from sources independent of the reporting entity. Unobservable inputs are inputs that reflect the reporting entity’s own assumptions about the assumptions market participants would use in pricing the asset or liability developed based on the best information available in the circumstances. A financial instrument’s level within the fair value hierarchy is based upon the lowest level of any input that is significant to the fair value measurement. The three-level hierarchy of inputs is summarized below:
| • | Level 1- quoted prices in active markets for identical investments; |
| • | Level 2- other significant observable inputs (including quoted prices for similar securities, interest rates, prepayment speeds, and credit risk); or |
| • | Level 3- significant unobservable inputs (including a Fund’s own assumptions in determining the fair value of investments). |
Annual Report 2014
30
Table of Contents
Notes to Financial Statements (continued)
October 31, 2014
The following is a summary of the inputs used as of October 31, 2014 in valuing the Funds’ investments at fair value. The inputs or methodologies used for valuing securities are not necessarily an indication of the risk associated with investing in those securities. Please refer to the Statements of Investments for a detailed breakout of the security types:
| Investments, at Value | LEVEL 1–Quoted Prices ($) | LEVEL 2–Other Significant Observable Inputs ($) | LEVEL 3–Significant Unobservable Inputs ($) | Total ($) | ||||||||||||
| Aberdeen Diversified Alternatives Fund | ||||||||||||||||
| Investments in Securities | ||||||||||||||||
Mutual Funds | 84,621,600 | – | – | 84,621,600 | ||||||||||||
Exchange Traded Funds | 14,643,829 | – | – | 14,643,829 | ||||||||||||
Repurchase Agreement | – | 5,853,000 | – | 5,853,000 | ||||||||||||
|
|
|
|
|
|
|
| |||||||||
| 99,265,429 | 5,853,000 | – | 105,118,429 | |||||||||||||
|
|
|
|
|
|
|
| |||||||||
| Aberdeen Diversified Income Fund | ||||||||||||||||
| Investments in Securities | ||||||||||||||||
Mutual Funds | 16,132,847 | – | – | 16,132,847 | ||||||||||||
Exchange Traded Funds | 8,511,298 | – | – | 8,511,298 | ||||||||||||
Repurchase Agreement | – | 538,000 | – | 538,000 | ||||||||||||
|
|
|
|
|
|
|
| |||||||||
| 24,644,145 | 538,000 | – | 25,182,145 | |||||||||||||
|
|
|
|
|
|
|
| |||||||||
| Aberdeen Dynamic Allocation Fund | ||||||||||||||||
| Investments in Securities | ||||||||||||||||
Mutual Funds | 15,107,420 | – | – | 15,107,420 | ||||||||||||
Exchange Traded Funds | 8,390,955 | – | – | 8,390,955 | ||||||||||||
Repurchase Agreement | – | 625,000 | – | 625,000 | ||||||||||||
|
|
|
|
|
|
|
| |||||||||
| 23,498,375 | 625,000 | – | 24,123,375 | |||||||||||||
|
|
|
|
|
|
|
| |||||||||
Amounts listed as “–” are $0 or round to $0.
For movements between the Levels within the fair value hierarchy, the Funds have adopted a policy of recognizing transfers at the end of each period. During the year ended October 31, 2014, there were no transfers between Levels. For the year ended October 31, 2014, there have been no significant changes to the fair valuation methodologies.
| b. | Repurchase Agreements |
The Funds may enter into repurchase agreements under the terms of a Master Repurchase Agreement. It is each Fund’s policy that its custodian/counterparty segregate the underlying collateral securities, the value of which exceeds the principal amount of the repurchase transaction, including accrued interest. The repurchase price generally equals the price paid by a Fund plus interest negotiated on the basis of current short-term rates. To the extent that any repurchase transaction exceeds one business day, the collateral is valued on a daily basis to determine its adequacy. Under the Master Repurchase Agreement, if the counterparty defaults and the value of the collateral declines, or if bankruptcy proceedings are commenced with respect to the counterparty of the security, realization of the collateral by the Funds may be delayed or limited. Repurchase agreements are subject to contractual netting arrangements with the counterparty, Fixed Income Clearing Corp. For additional information on individual repurchase agreements, see the Statements of Investments.
| c. | Restricted Securities |
Restricted securities are privately-placed securities whose resale is restricted under U.S. securities laws. The Funds may invest in restricted securities, including unregistered securities eligible for resale without registration pursuant to Rule 144A and privately-placed securities of U.S. and non-U.S. issuers offered outside the U.S. without registration pursuant to Regulation S under the Securities Act of 1933. Rule 144A securities may be freely traded among certain qualified institutional investors, such as the Funds, but resale of such securities in the U.S. is permitted only in limited circumstances.
| d. | Security Transactions, Investment Income and Expenses |
Security transactions are recorded on the trade date. Realized and unrealized gains/(losses) from security and currency transactions are calculated on the identified cost basis. Dividend income is recorded on the ex-dividend date except for certain dividends on foreign securities, which are recorded as soon as a Fund is informed after the ex-dividend date.
2014 Annual Report
31
Table of Contents
Notes to Financial Statements (continued)
October 31, 2014
Interest income and expenses are recorded on an accrual basis. Expenses directly attributable to a Fund are charged to that Fund. Expenses not directly attributable to a Fund are allocated proportionately among the relevant Funds based on net assets of each. For each of the Funds, the method for allocating income, fund level expenses, and realized and unrealized gains or losses to a class is based on the total net asset value of that class’s shares in proportion to the total net assets of the relevant Fund. Expenses specific to a class (such as Rule 12b-1 and administrative services fees) are charged to that class.
| e. | Distributions |
Distributions from net investment income, if any, are declared and paid quarterly for all Funds. The Funds will also declare and pay distributions at least annually from net realized gains on investment transactions and net realized foreign exchange gains, if any. Dividends and distributions to shareholders are recorded on the ex-dividend date.
Dividends and distributions to shareholders are determined in accordance with federal income tax regulations, which may differ from GAAP. These differences are primarily due to differing treatments for foreign currencies and loss deferrals.
| f. | Federal Income Taxes |
Each Fund intends to continue to qualify as a “regulated investment company” by complying with the provisions available to certain investment companies, as defined in Subchapter M of the Internal Revenue Code of 1986, as amended, and to make distributions of net investment income and net realized capital gains sufficient to relieve the Funds from all federal income taxes. Therefore, no federal income tax provision is required.
Management of the Funds has concluded that there are no significant uncertain tax positions that would require recognition in the financial statements. Since tax authorities can examine previously filed tax returns, the Funds’ U.S. federal and state tax returns for each of the four fiscal years up to the most recent fiscal year ended October 31 are subject to such review.
3. Agreements and Transactions with Affiliates
| a. | Investment Adviser |
Under the Investment Advisory Agreement with the Trust, Aberdeen Asset Management Inc. (“Aberdeen” or the “Adviser”) manages the Funds in accordance with the policies and procedures established by the Board. Under the terms of the Investment Advisory Agreement, each Fund pays Aberdeen an annual management fee paid monthly of 0.15% based on the Funds’ average daily net assets, paid monthly.
The Trust and Aberdeen entered into a written contract (“Expense Limitation Agreement”) limiting operating expenses to 0.25% for all Classes of the Funds at least through February 28, 2015 or the effective date of the 2015 annual update to the registration statement, whichever occurs first. This limit excludes certain expenses, including any taxes, interest, brokerage fees, short-sale dividend expenses, Acquired Fund Fees and Expenses, Rule 12b-1 fees, administrative services fees and extraordinary expenses.
Aberdeen may request and receive reimbursement from a Fund of the advisory fees waived and other expenses reimbursed pursuant to the Expense Limitation Agreement at a later date not to exceed three years from the fiscal year in which the corresponding reimbursement to the Funds was made. However, no reimbursement will be made unless:
(i) the Fund’s assets exceed $100 million;
(ii) the total annual expense ratio of the class making such reimbursement is less than the limit set forth above; and
(iii) the payment of such reimbursement is approved by the Board on a quarterly basis (the “Reimbursement Requirements”).
For fees waived after March 1, 2011, no reimbursement will be made unless:
(i) the total annual expense ratio of the class making such reimbursement is less than the limit set forth above; and
(ii) the payment of such reimbursement is approved by the Board on a quarterly basis (the “Reimbursement Requirements”).
If the Board approves any changes in the waiver terms or limitations, reimbursements are only permitted to the extent that the terms of the Expense Limitation Agreement in effect at the time of the waiver are met at the time that reimbursement is approved. Except as provided for in the Expense Limitation Agreement, reimbursement of amounts previously waived or assumed by Aberdeen is not permitted.
Annual Report 2014
32
Table of Contents
Notes to Financial Statements (continued)
October 31, 2014
As of October 31, 2014, to the extent the Reimbursement Requirements are met, the cumulative potential reimbursements for each Fund, based on expenses reimbursed by Aberdeen would be:
| Fund | Amount Fiscal Year 2012 (Expires 10/31/15) | Amount Fiscal Year 2013 (Expires 10/31/16) | Amount Fiscal Year 2014 (Expires 10/31/17) | Total* | ||||||||||||
Diversified Alternatives Fund | $ | 153,080 | $ | 153,416 | $ | 218,423 | $ | 524,919 | ||||||||
Diversified Income Fund | 141,760 | 153,325 | 151,342 | 446,427 | ||||||||||||
Dynamic Allocation Fund | 134,356 | 153,911 | 162,128 | 450,395 | ||||||||||||
| * | Amounts reported are due to expire throughout the respective 3-year expiration period presented above. |
In accordance with the Funds’ Expense Limitation Agreement and criteria, as described above, the Adviser did not recapture any expenses for which it previously reimbursed the Funds. Accordingly, at October 31, 2014, the Funds did not have liabilities payable to the Adviser for recapture of previously reimbursed expenses.
| b. | Fund Administration |
Under the terms of the Fund Administration Agreement in effect during the period, Aberdeen provides various administrative and accounting services, including daily valuation of the Funds’ shares, preparation of financial statements, tax returns, regulatory reports, and presentation of quarterly reports to the Board. For services provided pursuant to the Fund Administration Agreement, the Funds pay Aberdeen a combined annual fee of 0.08% based on the Trust’s average daily net assets. The fee is then allocated proportionately among all funds within the Trust (including the Funds) in relation to the average daily net assets of each fund. This asset-based fee is subject to a per fund annual minimum fee.
| c. | Distributor |
The Trust and Aberdeen Fund Distributors, LLC (the “Distributor” or “AFD”) are parties to the current Underwriting Agreement (the “Underwriting Agreement”) whereby the Distributor acts as principal underwriter for the Trust’s shares. The Trust has adopted a Distribution Plan (the “Plan”) pursuant to Rule 12b-1 under the 1940 Act with respect to certain classes of shares. The Plan permits the Funds to compensate AFD, as the Funds’ Distributor, for expenses associated with the distribution of certain classes of shares of the Funds of the Trust. Although actual distribution expenses may be more or less, under the Plan, the Funds of the Trust pay the Distributor an annual fee in an amount that will not exceed the following amounts:
| Fund | Class A Shares | Class C Shares (a) | Class R Shares | |||||||||
Diversified Alternatives Fund | 0.25% | 1.00% | 0.50% | |||||||||
Diversified Income Fund | 0.25% | 1.00% | 0.50% | |||||||||
Dynamic Allocation Fund | 0.25% | 1.00% | 0.50% | |||||||||
| (a) | 0.25% of which is service fees |
The Adviser or an affiliate of the Adviser may pay additional amounts from its own resources to dealers or other financial intermediaries, for aid in distribution or for aid in providing administrative services to shareholders.
Pursuant to the current Underwriting Agreement, the Distributor will also receive the proceeds of contingent deferred sales charges (“CDSCs”) of 1% imposed on certain redemptions of Class C (and up to 1% for certain Class A) shares.
In addition, the Distributor will re-allow to dealers 5.00% of sales charges on Class A shares of the Funds, which have a maximum front-end sales charge of 5.75% and the Distributor or the Adviser may compensate broker dealers or financial intermediaries from its own resources at the rate 1.00% on sales of Class C shares of the Funds, which have a maximum CDSC of 1.00%, (on the CDSC assessed on sales within one year of purchase). For the year ended October 31, 2014, AFD retained commissions of $12,518 from front-end sales charges of Class A shares and $6,638 from CDSC fees from Class C (and certain Class A) shares of the Funds.
Under the terms of the current Administrative Services Plan, a series of the Trust is permitted to enter into Servicing Agreements with servicing organizations, such as any bank, trust company, thrift institution, broker-dealer, insurance company, or other financial institution, which agree to provide certain administrative support services in connection with the Class A, Class R and Institutional Service Class shares
2014 Annual Report
33
Table of Contents
Notes to Financial Statements (continued)
October 31, 2014
of the series of the Trust (as applicable). These fees are based on an annual rate of up to 0.25% of the average daily net assets of Class A, Class R and Institutional Service Class shares of each of the Funds (as applicable). The amount of expenses incurred under the terms of the Administrative Services Plan during the year ended October 31, 2014 was as follows:
| Fund | Amount | |||
Diversified Alternatives Fund | $ | 2,966 | ||
Diversified Income Fund | 1,546 | |||
Dynamic Allocation Fund | 3,033 | |||
4. Investment Transactions
Purchases and sales of Underlying Funds for the year ended October 31, 2014, were as follows:
| Fund | Purchases | Sales | ||||||
Diversified Alternatives Fund | $ | 106,296,208 | $ | 32,357,750 | ||||
Diversified Income Fund | 7,600,378 | 12,632,591 | ||||||
Dynamic Allocation Fund | 12,940,422 | 17,251,957 | ||||||
A summary of the Funds’ investments in securities of affiliated issuers for the year ended October 31, 2014 is set forth below:
Diversified Alternatives Fund
| Fund | 10/31/2013 Share | Purchase Cost | Sales Cost | Realized Gain (Loss) | Distributions Received(1) | 10/31/2014 Share Balance | 10/31/2014 Market Value | |||||||||||||||||||||
Aberdeen Asia-Pacific Smaller Companies Fund | 75,678 | $ | 131,902 | $ | 952,432 | $ | (139,438) | $ | 131,902 | – | $ | – | ||||||||||||||||
Aberdeen High Yield Fund | 44,628 | 98,838 | 539,484 | (4,808) | 46,815 | – | – | |||||||||||||||||||||
Aberdeen Equity Long-Short Fund | 144,038 | 3,526,821 | – | – | 32,143 | 433,337 | 5,442,716 | |||||||||||||||||||||
Aberdeen Asia Bond Fund | – | 4,204,216 | – | – | – | 411,229 | 4,202,756 | |||||||||||||||||||||
Aberdeen Global High Income Fund | – | 3,778,667 | 1,617,577 | (19,137) | 106,240 | 212,963 | 2,097,689 | |||||||||||||||||||||
Total | 11,740,444 | 3,109,493 | (163,383) | 317,100 | 11,743,161 | |||||||||||||||||||||||
| (1) | Distributions received includes both Income and Gains Distributions, if any. |
Annual Report 2014
34
Table of Contents
Notes to Financial Statements (continued)
October 31, 2014
Diversified Income Fund
| Fund | 10/31/2013 Share | Purchase Cost | Sales Cost | Realized Gain (Loss) | Distributions Received(1) | 10/31/2014 Share Balance | 10/31/2014 Market Value | |||||||||||||||||||||
Aberdeen Global High Income Fund | – | $ | 564,666 | $ | 564,666 | $ | 2,404 | $ | 5,472 | – | $ | – | ||||||||||||||||
Aberdeen Global Natural Resources Fund | 52,226 | 7,440 | 860,158 | 19,752 | 7,440 | – | – | |||||||||||||||||||||
Aberdeen Emerging Markets Fund | 57,304 | 14,050 | 149,315 | 11,634 | 14,050 | 48,119 | 716,975 | |||||||||||||||||||||
Aberdeen International Equity Fund | 232,984 | 58,781 | 2,071,699 | 315,814 | 58,781 | 81,294 | 1,236,484 | |||||||||||||||||||||
Aberdeen Asia Bond Fund | – | 1,435,097 | – | – | – | 139,646 | 1,427,180 | |||||||||||||||||||||
Aberdeen Core Fixed Income Fund | 166,371 | 88,850 | 333,852 | (18,417) | 48,380 | 145,262 | 1,586,264 | |||||||||||||||||||||
Aberdeen Emerging Markets Debt Local Currency Fund | 67,023 | 499,969 | 56,569 | (3,306) | 7,450 | 116,058 | 1,016,667 | |||||||||||||||||||||
Aberdeen High Yield Fund | 270,775 | 368,209 | 1,123,189 | (19,478) | 368,209 | 193,781 | 1,784,726 | |||||||||||||||||||||
Total | 3,037,062 | 5,159,448 | 308,403 | 509,782 | 7,768,296 | |||||||||||||||||||||||
| (1) | Distributions received includes both Income and Gains Distributions, if any. |
Dynamic Allocation Fund
| Fund | 10/31/2013 Share Balance | Purchase Cost | Sales Cost | Realized Gain (Loss) | Distributions Received(1) | 10/31/2014 Share Balance | 10/31/2014 Market Value | |||||||||||||||||||||
Aberdeen Emerging Markets Debt Local Currency Fund | – | $ | 1,275,732 | $ | 1,275,732 | $ | (57,698) | $ | – | – | $ | – | ||||||||||||||||
Aberdeen Equity Long-Short Fund | 65,120 | 13,551 | 809,552 | 1,796 | 13,551 | – | – | |||||||||||||||||||||
Aberdeen Asia-Pacific Smaller Companies Fund | 68,775 | 302,554 | 310,461 | (78,134) | 125,707 | 72,925 | 741,649 | |||||||||||||||||||||
Aberdeen Emerging Markets Fund | 71,809 | 259,277 | 583,081 | 9,723 | 20,768 | 50,407 | 751,058 | |||||||||||||||||||||
Aberdeen International Equity Fund | 215,187 | 1,002,716 | 1,670,215 | 378,204 | 74,345 | 144,849 | 2,203,155 | |||||||||||||||||||||
Aberdeen Small Cap Fund | 73,746 | 766,880 | 823,586 | 252,984 | – | 60,900 | 1,518,244 | |||||||||||||||||||||
Aberdeen Asia Bond Fund | – | 1,229,867 | – | – | – | 121,408 | 1,240,794 | |||||||||||||||||||||
Aberdeen Core Fixed Income Fund | 117,521 | 139,268 | 143,695 | (5,940) | 38,949 | 117,838 | 1,286,794 | |||||||||||||||||||||
Aberdeen U.S. Equity Fund | 106,112 | 26,219 | 1,010,797 | 457,785 | 26,219 | – | – | |||||||||||||||||||||
Aberdeen Global High Income Fund | – | 1,527,065 | 533,806 | (6,213) | 35,245 | 98,953 | 974,684 | |||||||||||||||||||||
Total | 6,543,129 | 7,160,925 | 952,507 | 334,784 | 8,716,378 | |||||||||||||||||||||||
| (1) | Distributions received includes both Income and Gains Distributions, if any. |
2014 Annual Report
35
Table of Contents
Notes to Financial Statements (continued)
October 31, 2014
5. Financial Highlights
The Financial Highlights of the Institutional Service Class, which was audited by other auditors whose report was unqualified, for each of the Diversified Alternatives Fund, Diversified Income Fund and Dynamic Allocation Fund prior to fiscal year end October 31, 2009 were as follows:
Diversified Alternatives Fund
| Investment Activities | Distributions | Ratios / Supplemental Data | ||||||||||||||||||||||||||||||||||||||||||||||||||||||||||
Net Asset Value, Beginning of Period | Net Invest- ment Income (Loss) | Net Realized and Unrealized Gain (Loss) on Investments | Total from Invest- ment | Net ment | Net Realized Gain (Loss) | Tax Return of Capital | Total butions | Net Asset Value, End of Period | Total Return (a)(b) | Net of Period | Ratio of Expenses to Average Net Assets (c) | Ratio of Net Invest- ment | Ratio of Expenses (Prior to Reimbur- sements) | Portfolio Turnover (e) | ||||||||||||||||||||||||||||||||||||||||||||||
Year Ended October 31, 2008 | $ | 15.43 | 0.62 | (5.80 | ) | (5.18 | ) | (0.86 | ) | (0.79 | ) | (0.10 | ) | (1.75 | ) | $ | 8.50 | (37.39 | %) | $ | 3 | 0.24 | % | 0.70 | % | 0.68 | % | 46.75 | % | |||||||||||||||||||||||||||||||
Year Ended October 31, 2007(f) | $ | 13.24 | 0.14 | 2.66 | 2.80 | (0.47 | ) | (0.14 | ) | – | (0.61 | ) | $ | 15.43 | 21.90 | % | $ | 2 | 0.24 | % | 1.01 | % | 0.46 | % | 24.54 | % | ||||||||||||||||||||||||||||||||||
Year Ended October 31, 2006 | $ | 11.56 | 0.08 | 2.22 | 2.30 | (0.49 | ) | (0.13 | ) | – | (0.62 | ) | $ | 13.24 | 20.63 | % | $ | 1 | 0.34 | % | 0.50 | % | 0.70 | % | 13.76 | % | ||||||||||||||||||||||||||||||||||
Year Ended October 31, 2005 | $ | 10.34 | 0.33 | 1.19 | 1.52 | (0.30 | ) | – | – | (0.30 | ) | $ | 11.56 | 14.92 | % | $ | 1 | 0.33 | % | 2.98 | % | 1.94 | % | 28.77 | % | |||||||||||||||||||||||||||||||||||
| (a) | Excludes sales charge. |
| (b) | Not annualized for periods less than one year. |
| (c) | Annualized for periods less than one year. |
| (d) | During the period, certain fees were waived and/or reimbursed. If such waivers/reimbursements had not occurred, the ratios would have been as indicated. |
| (e) | Portfolio turnover is calculated on the basis of the Fund as a whole without distinguishing among the classes of shares. |
| (f) | Net investment income (loss) is based on average shares outstanding during the period. |
Amounts designated as “–” are $0 or round to $0.
Diversified Income Fund
| Investment Activities | Distributions | Ratios / Supplemental Data | ||||||||||||||||||||||||||||||||||||||||||||||||||||||||||
Net Asset Value, Beginning of Period | Net Invest- ment | Net (Loss) on | Total from ment | Net ment | Net Realized Gain (Loss) | Tax Return of Capital | Total butions | Net Asset Value, End of Period | Total Return (a)(b) | Net Assets at End of Period (000’s) | Ratio of Expenses to Average Net Assets (c) | Ratio of ment | Ratio of Expenses (Prior to Reimbur- sements) | Portfolio Turnover (e) | ||||||||||||||||||||||||||||||||||||||||||||||
Year Ended October 31, 2008 | $ | 13.02 | 0.34 | (3.16 | ) | (2.82 | ) | (0.68 | ) | (0.74 | ) | (0.01 | ) | (1.43 | ) | $ | 8.77 | (24.08 | %) | $ | 1 | 0.26 | % | 2.56 | % | 0.56 | % | 53.11 | % | |||||||||||||||||||||||||||||||
Year Ended October 31, 2007(f) | $ | 11.84 | 0.27 | 1.49 | 1.76 | (0.40 | ) | (0.18 | ) | – | (0.58 | ) | $ | 13.02 | 15.35 | % | $ | 1 | 0.25 | % | 2.22 | % | 0.60 | % | 70.87 | % | ||||||||||||||||||||||||||||||||||
Year Ended October 31, 2006 | $ | 11.04 | 0.24 | 1.21 | 1.45 | (0.54 | ) | (0.11 | ) | – | (0.65 | ) | $ | 11.84 | 13.64 | % | $ | 1 | 0.33 | % | 1.99 | % | 0.85 | % | 34.82 | % | ||||||||||||||||||||||||||||||||||
Year Ended October 31, 2005 | $ | 10.30 | 0.35 | 0.71 | 1.06 | (0.31 | ) | (0.01 | ) | – | (0.32 | ) | $ | 11.04 | 10.39 | % | $ | 1 | 0.34 | % | 2.83 | % | 3.93 | % | 61.59 | % | ||||||||||||||||||||||||||||||||||
| (a) | Excludes sales charge. |
| (b) | Not annualized for periods less than one year. |
| (c) | Annualized for periods less than one year. |
| (d) | During the period, certain fees were waived and/or reimbursed. If such waivers/reimbursements had not occurred, the ratios would have been as indicated. |
| (e) | Portfolio turnover is calculated on the basis of the Fund as a whole without distinguishing among the classes of shares. |
| (f) | Net investment income (loss) is based on average shares outstanding during the period. |
Amounts designated as “–” are $0 or round to $0.
Annual Report 2014
36
Table of Contents
Notes to Financial Statements (continued)
October 31, 2014
Dynamic Allocation Fund
| Investment Activities | Distributions | Ratios / Supplemental Data | ||||||||||||||||||||||||||||||||||||||||||||||||||||||||||
Net Asset Value, Beginning | Net Invest- ment | Net and Unrealized Gain (Loss) on | Total from ment | Net Invest- ment | Net Realized Gain (Loss) | Tax Return of Capital | Total utions | Net Value, | Total Return | Net Assets at End of | Ratio of Expenses to Average Net | Ratio of ment | Ratio of Expenses (Prior to sements) | Portfolio Turnover (e) | ||||||||||||||||||||||||||||||||||||||||||||||
Year Ended October 31, 2008(f) | $ | 13.86 | 0.29 | (4.15 | ) | (3.86 | ) | (0.84 | ) | (0.95 | ) | (0.05 | ) | (1.84 | ) | $ | 8.16 | (31.66 | %) | $ | 1 | 0.25 | % | 1.71 | % | 0.71 | % | 44.74 | % | |||||||||||||||||||||||||||||||
Year Ended October 31, 2007(f) | $ | 12.23 | 0.19 | 2.06 | 2.25 | (0.39 | ) | (0.23 | ) | – | (0.62 | ) | $ | 13.86 | 19.08 | % | $ | 2 | 0.24 | % | 1.52 | % | 0.59 | % | 63.01 | % | ||||||||||||||||||||||||||||||||||
Year Ended October 31, 2006 | $ | 11.23 | 0.17 | 1.56 | 1.73 | (0.58 | ) | (0.15 | ) | – | (0.73 | ) | $ | 12.23 | 16.06 | % | $ | 1 | 0.36 | % | 1.19 | % | 0.91 | % | 32.64 | % | ||||||||||||||||||||||||||||||||||
Year Ended October 31, 2005 | $ | 10.21 | 0.31 | 1.00 | 1.31 | (0.29 | ) | – | – | (0.29 | ) | $ | 11.23 | 13.00 | % | $ | 1 | 0.34 | % | 2.69 | % | 4.45 | % | 47.04 | % | |||||||||||||||||||||||||||||||||||
| (a) | Excludes sales charge. |
| (b) | Not annualized for periods less than one year. |
| (c) | Annualized for periods less than one year. |
| (d) | During the period, certain fees were waived and/or reimbursed. If such waivers/reimbursements had not occurred, the ratios would have been as indicated. |
| (e) | Portfolio turnover is calculated on the basis of the Fund as a whole without distinguishing among the classes of shares. |
| (f) | Net investment income (loss) is based on average shares outstanding during the period. |
Amounts designated as “–” are $0 or round to $0.
6. Portfolio Investment Risks
| Principal Risks of the | Funds |
| a. | Affiliated Funds Risk |
The Funds’ Adviser serves as the adviser of certain Underlying Funds. It is possible that a conflict of interest among the Funds and the Underlying Funds could affect how the Funds’ Adviser fulfills its fiduciary duties to each Fund and the Underlying Funds.
| b. | Asset Allocation Risk |
Each Fund is subject to different levels and combinations of risk, based on its actual allocation among the various asset classes and Underlying Funds. Each Fund will be exposed to risks of the Underlying Funds in which it invests. The Funds will be affected by stock and bond market risks, among others. To the extent a Fund invests in Underlying Funds that expose it to non-traditional or alternative asset classes (which include investments that focus on a specialized asset class (e.g. long-short strategies) as well as specific market sectors within a broader asset class, the Fund will be exposed to the increased risk associated with those asset classes. The potential impact of the risks related to an asset class depends on the size of a Fund’s investment allocation to it.
| c. | Asset Class Variation Risk |
The Underlying Funds invest principally in the securities or investments constituting their asset class. However, under normal market conditions, an Underlying Fund may vary the percentage of its assets in these securities or investments (subject to any applicable regulatory requirements). Depending upon the percentage of securities or investments in a particular asset class held by the Underlying Funds at any given time and the percentage of the Fund’s assets invested in various Underlying Funds, the Fund’s actual exposure to the securities or investments in a particular asset class may vary substantially from its allocation model for that asset class.
| d. | Derivatives Risk |
Derivatives are speculative and may hurt a Fund’s performance. Derivatives present the risk of disproportionately increased losses and/or reduced opportunities for gains when the financial asset or measure to which the derivative is linked changes in unexpected ways. The potential benefits to be derived from a Fund’s derivatives strategy are dependent upon the portfolio managers’ ability to discern pricing inefficiencies and predict trends in markets, which decisions could prove to be inaccurate. This requires different skills and techniques than predicting changes in the price of individual securities, and there can be no assurance that the use of this strategy will be successful.
Hedged Exposure Risk – Losses generated by a derivative or practice used by a Fund for hedging purposes should be offset in part by gains on the hedged investment depending on the degree of correlation between the hedging instrument and the assets hedged. However, while hedging can reduce or eliminate losses, it can also reduce or eliminate gains.
2014 Annual Report
37
Table of Contents
Notes to Financial Statements (continued)
October 31, 2014
Correlation Risk – The Funds are exposed to the risk that changes in the value of a hedging instrument will not match those of the investment being hedged.
Counterparty Risk – Derivative transactions depend on the creditworthiness of the counterparty and the counterparty’s ability to fulfill its contractual obligations.
| e. | Exchange-Traded Notes Risk |
Certain Funds may invest in ETNs. ETNs are a type of unsecured, unsubordinated debt security that have characteristics and risks similar to those of fixed income securities and trade on a major exchange similar to shares of exchange-traded funds. However, this type of debt security differs from other types of bonds and notes because ETN returns are based upon the performance of a financial asset or market index minus applicable fees, no periodic coupon payments are distributed, and no principal protections exist. The purpose of ETNs is to create a type of security that combines the aspects of both bonds and exchange-traded funds. The value of an ETN may be influenced by time to maturity, level of supply and demand for the ETN, volatility and lack of liquidity in underlying commodities or securities markets, changes in the applicable interest rates, changes in the issuer’s credit rating and economic, legal, political or geographic events that affect the referenced asset or index.
| f. | Fund of Funds Risk |
Your cost of investing in one of the Funds, as a fund of funds, may be higher than the cost of investing in a mutual fund that only invests directly in individual securities. An Underlying Fund may change its investment objective or policies without a Fund’s approval, which could force the Fund to withdraw its investment from such Underlying Fund at a time that is unfavorable to the Fund. In addition, one Underlying Fund may buy the same securities that another Underlying Fund sells. Therefore, the Fund would indirectly bear the costs of these trades without accomplishing any investment purpose.
| g. | Impact of Large Redemptions and Purchases of Fund Shares |
Occasionally, shareholders may make large redemptions or purchases of Fund shares, which may cause a Fund to have to sell securities or invest additional cash. These transactions may adversely affect a Fund’s performance and increase transaction costs. In addition, large redemption requests may exceed the cash balance of a Fund and result in credit line borrowing fees and/or overdraft charges to the Fund until the sale of portfolio securities to cover the redemption request settle.
| h. | Performance Risk |
Each Fund’s investment performance is directly tied to the performance of the Underlying Funds and other investments in which the Fund invests. If one or more of the Underlying Funds fails to meet its investment objective, a Fund’s performance could be negatively affected. There can be no assurance that each Fund or any Underlying Fund will achieve its investment objective.
| Principal Risks | of Underlying Funds |
| i. | Alternative Strategies Risk |
Certain Funds invest in Underlying Funds that involve Alternative Strategies Risk. The performance of Underlying Funds that pursue alternative strategies is linked to the performance of highly volatile alternative asset classes (e.g., commodities and currencies) and alternative strategies (e.g., managed futures). To the extent a Fund invests in such Underlying Funds, the Fund’s share price will be exposed to potentially significant fluctuations in value. In addition, Underlying Funds that employ alternative strategies have the risk that anticipated opportunities do not play out as planned, resulting in potentially substantial losses to the Underlying Fund. Furthermore, alternative strategies may employ leverage, involve extensive short positions and/or focus on narrow segments of the market, which may magnify the overall risks and volatility associated with such Underlying Funds’ investments. Depending on the particular alternative strategies used by an Underlying Fund, it may be subject to risks not associated with more traditional investments. These risks may include, but are not limited to, derivatives risk, liquidity risk, credit risk, commodity risk and counterparty risk.
| j. | Commodity Risk |
Certain Funds invest in Underlying Funds that involve Commodity Risk. The value of commodities may be more volatile than the value of equity securities or debt instruments and their value may be affected by changes in overall market movements, commodity index volatility, changes in interest rates, or factors affecting a particular industry or commodity. The price of a commodity may be affected by demand/supply imbalances in the market for the commodity.
| k. | Counterparty and Third Party Risk |
Transactions involving a counterparty or third party (other than the issuer of the instrument) are subject to the counterparty’s or third party’s credit risk and ability to perform in accordance with the terms of the transaction.
Annual Report 2014
38
Table of Contents
Notes to Financial Statements (continued)
October 31, 2014
| l. | Credit Risk |
A debt instrument’s price depends, in part, on the credit quality of the issuer, borrower, counterparty, or underlying collateral and can decline in response to changes in the financial condition of the issuer, borrower, counterparty, or underlying collateral, or changes in specific or general market, economic, industry, political, regulatory, geopolitical, or other conditions. High yield bonds (“junk bonds”) may be subject to an increased risk of default, a more limited secondary market than investment grade bonds, and greater price volatility.
| m. | Currency Risk |
The value of foreign currencies relative to the U.S. Dollar fluctuates in response to market, economic, political, regulatory, geopolitical or other conditions. A decline in the value of a foreign currency versus the U.S. Dollar reduces the value in U.S. Dollars of investments denominated in that foreign currency.
| n. | Derivatives Risk |
Derivatives can be highly volatile and involve risks in addition to the risks of the underlying security. Gains or losses from derivatives can be substantially greater than the derivatives’ original cost and can involve leverage.
| o. | Emerging Markets Risk |
A magnification of the risks that apply to foreign investments. These risks are greater for securities of companies in emerging market countries because the countries may have less stable governments, more volatile currencies and less established markets (see “Foreign Securities Risk” below).
| p. | Floating Rate Loan Risk |
Floating rate loans generally are subject to restrictions on resale. Floating rate loans sometimes trade infrequently in the secondary market. As a result, valuing a floating rate loan can be more difficult and buying and selling a floating rate loan at an acceptable price can be more difficult or delayed. Difficulty in selling a floating rate loan can result in a loss. In addition, a floating rate loan may not be fully collateralized which may cause the floating rate loan to decline significantly in value.
| q. | Foreign Securities Risk |
Foreign securities may be more volatile, harder to price and less liquid than U.S. securities. Foreign investments also may involve risks relating to the impact of currency exchange rate fluctuations.
| r. | High-Yield Bond and Other Lower-Rated Securities Risk |
An Underlying Fund’s investments in high-yield bonds (commonly referred to as “junk bonds”) and other lower-rated securities will subject the Underlying Fund to substantial risk of loss. Investments in high-yield bonds are speculative and issuers of these securities are generally considered to be less financially secure and less able to repay interest and principal than issuers of investment-grade securities. Prices of high-yield bonds tend to be very volatile. These securities are less liquid than investment-grade debt securities and may be difficult to price or sell, particularly in times of negative sentiment toward high-yield securities.
| s. | Illiquid Securities |
Certain Funds invest in Underlying Funds that hold illiquid securities. Illiquid securities are assets which may not be sold or disposed of in the ordinary course of business within seven days at approximately the price at which the Underlying Fund has valued the investment on its books and may include such securities as those not registered under U.S. securities laws or securities that cannot be sold in public transactions. An inability to sell a portfolio position can adversely affect the Underlying Fund’s value or prevent the Underlying Fund from being able to take advantage of other investment opportunities.
| t. | Impact of Large Redemptions and Purchases of Underlying Fund Shares |
Occasionally, shareholders of an Underlying Fund may make large redemptions or purchases of the Underlying Fund’s shares, which may cause the Underlying Fund to have to sell securities or invest additional cash. These transactions may adversely affect the Underlying Fund’s performance and increase transaction costs to Underlying Fund shareholders, including the Fund. In addition, large redemption requests may exceed the cash balance of the Underlying Fund and result in credit line borrowing fees and/or overdraft charges to the Underlying Fund until the sale of portfolio securities to cover the redemption request settle.
| u. | Interest Rate Risk |
Fixed income investments are subject to interest rate risk, which generally causes the value of a fixed income portfolio to decrease when interest rates rise resulting in a decrease in the Underlying Fund’s, and possibly a Fund’s, net assets. An Underlying Fund may be subject to a greater risk of rising interest rates due to the current period of historically low rates and the effect of potential government fiscal policy initiatives and resulting market reaction to those initiatives. Interest rate fluctuations tend to have a greater impact on fixed income-securities with a greater time to maturity and/or lower coupon. In periods of market volatility, the market values of fixed income securities may be more sensitive to changes in interest rates.
2014 Annual Report
39
Table of Contents
Notes to Financial Statements (continued)
October 31, 2014
| v. | Market Risk |
Deteriorating market conditions might cause a general weakness in the market that reduces the prices of securities in that market in which an Underlying Fund invests.
| w. | Mid-Cap Securities Risk |
A Fund may invest in Underlying Funds that hold mid-cap securities. Stocks of medium-sized companies tend to be more volatile and less liquid than stocks of larger companies.
| x. | REIT and Real Estate Risk |
Certain Funds invest in Underlying Funds that are subject to REIT and Real Estate Risk. Investment in REITs and real estate involves the risks that are associated with direct ownership of real estate and with the real estate industry in general. These risks include risks related to general, regional and local economic conditions; fluctuations in interest rates; property tax rates, zoning laws, environmental regulations and other governmental action; cash flow dependency; increased operating expenses; lack of availability of mortgage funds; losses due to natural disasters; changes in property values and rental rates; and other factors.
| y. | Sector Risk |
At times, a Fund may have a significant portion of its assets invested in Underlying Funds that invest primarily in securities of companies conducting business in a broadly related group of industries within an economic sector. Companies in the same economic sector may be similarly affected by economic or market events, making a Fund more vulnerable to unfavorable developments in that economic sector than funds that invest more broadly.
| z. | Short Sale Risk |
Certain Funds invest in Underlying Funds that sell securities short. The risk that the price of a security sold short will increase in value between the time of the short sale and the time the Underlying Fund must purchase the security to return it to the lender. The Underlying Fund’s potential loss on a short sale could theoretically be unlimited in a case where the Underlying Fund is unable, for whatever reason, to close out its short position.
| aa. | Small-Cap Securities Risk |
A Fund may invest in Underlying Funds that hold small-cap securities. Smaller companies are usually less stable in price and less liquid than those of larger, more established companies. Therefore, they generally involve greater risk.
Please read the prospectus for more detailed information regarding these and other risks.
7. Contingencies
In the normal course of business, the Funds may provide general indemnifications pursuant to certain contracts and organizational documents. The Funds’ maximum exposure under these arrangements is dependent on future claims that may be made against the Funds, and therefore, cannot be estimated; however, based on experience, the risk of loss from such claims is considered remote.
8. Tax Information
As of October 31, 2014, the tax cost of securities and the breakdown of unrealized appreciation/(depreciation) for each Fund were as follows:
| Tax Cost of Securities | Unrealized Appreciation | Unrealized Depreciation | Net Unrealized Appreciation (Depreciation) | |||||||||||||
Diversified Alternatives Fund | $ | 102,392,124 | $ | 3,545,272 | $ | (818,967 | ) | $ | 2,726,305 | |||||||
Diversified Income Fund | 24,469,958 | 1,157,873 | (445,686 | ) | 712,187 | |||||||||||
Dynamic Allocation Fund | 21,907,302 | 2,374,432 | (158,359 | ) | 2,216,073 | |||||||||||
Annual Report 2014
40
Table of Contents
Notes to Financial Statements (continued)
October 31, 2014
The tax character of distributions paid during the fiscal year ended October 31, 2014 was as follows (total distributions paid may differ from the Statements of Changes in Net Assets because for tax purposes dividends are recognized when actually paid):
| Distributions paid from | ||||||||||||||||||||||||
| Fund | Ordinary Income | Net Long Term Capital Gains | Total Taxable Distributions | Tax Exempt Distributions | Return of Capital | Total Distributions Paid | ||||||||||||||||||
Diversified Alternatives Fund | $ | 287,777 | $ | – | $ | 287,777 | $ | – | $ | – | $ | 287,777 | ||||||||||||
Diversified Income Fund | 862,173 | – | 862,173 | – | – | 862,173 | ||||||||||||||||||
Dynamic Allocation Fund | 311,756 | – | 311,756 | – | – | 311,756 | ||||||||||||||||||
Amounts listed as “–” are $0 or round to $0.
The tax character of distributions paid during the fiscal year ended October 31, 2013 was as follows (total distributions paid differ from the Statements of Changes in Net Assets because for tax purposes dividends are recognized when actually paid):
| Distributions paid from | ||||||||||||||||||||||||
| Fund | Ordinary Income | Net Long Term Capital Gain | Total Taxable Distributions | Tax Exempt Distributions | Return of Capital | Total Distributions Paid | ||||||||||||||||||
Diversified Alternatives Fund | $ | 240,612 | $ | – | $ | 240,612 | $ | – | $ | – | $ | 240,612 | ||||||||||||
Diversified Income Fund | 817,140 | – | 817,140 | – | – | 817,140 | ||||||||||||||||||
Dynamic Allocation Fund | 360,607 | – | 360,607 | – | – | 360,607 | ||||||||||||||||||
Amounts listed as “–” are $0 or round to $0.
As of October 31, 2014, the components of accumulated earnings (deficit) on a tax basis were as follows:
| Fund | Undistributed Tax Exempt Income | Undistributed Ordinary Income | Undistributed Long-Term Capital Gains | Accumulated Earnings | Distributions Payable | Late Year Ordinary and Post- October Capital Loss Deferrals | Other Temporary Differences | Accumulated Capital and Other Losses* | Unrealized Appreciation/ Depreciation** | Total Accumulated Earnings (Deficit) | ||||||||||||||||||||||||||||||
Diversified Alternatives Fund | $ | – | $ | 75,832 | $ | – | $ | 75,832 | $ | – | $ | – | $ | – | $ | (18,712,246 | ) | $ | 2,726,305 | $ | (15,910,109 | ) | ||||||||||||||||||
Diversified Income Fund | – | 89,622 | 1,184,622 | 1,274,244 | – | – | – | – | 712,188 | 1,986,432 | ||||||||||||||||||||||||||||||
Dynamic Allocation Fund | – | 35,140 | – | 35,140 | – | – | – | (2,000,189 | ) | 2,216,073 | 251,024 | |||||||||||||||||||||||||||||
| * | As of October 31, 2014, for Federal income tax purposes, the following Funds have capital loss carryforwards available to offset capital gains, if any, to the extent provided by the Treasury regulations, which expire in the years set forth below. |
| ** | The difference between the book-basis and tax-basis unrealized appreciation/(depreciation) is attributable primarily to tax deferral of losses on wash sales. |
Amounts listed as “–” are $0 or round to $0.
| Fund | Amount | Expires | ||||||
Diversified Alternatives Fund | $ | 10,674,825 | 2017 (Short-Term) | |||||
Diversified Alternatives Fund | 6,953,184 | 2018 (Short-Term) | ||||||
Diversified Alternatives Fund | 1,084,237 | 2019 (Short-Term) | ||||||
Dynamic Allocation Fund | 468,980 | 2016 (Short-Term) | ||||||
Dynamic Allocation Fund | 234,490 | 2017 (Short-Term) | ||||||
Dynamic Allocation Fund | 1,296,719 | 2018 (Short-Term) | ||||||
Under the Regulated Investment Company Modernization Act of 2010, the Funds are permitted to carry forward capital losses incurred in taxable years beginning after December 22, 2010 for an unlimited period. However, any losses incurred during those taxable years will be required to be
2014 Annual Report
41
Table of Contents
Notes to Financial Statements (concluded)
October 31, 2014
utilized prior to the losses incurred in pre-enactment taxable years. As a result of this ordering rule, pre-enactment capital loss carryforwards may be more likely to expire unused. Additionally, post-enactment capital losses that are carried forward will retain their character as either short-term or long-term capital losses rather than being considered all short-term as under previous law.
GAAP requires that certain components of net assets be adjusted to reflect permanent differences between financial and tax reporting. Accordingly, the table below details the necessary reclassifications, which are a result of permanent differences primarily attributable to reclassification of distributions received from investments in underlying funds. These reclassifications have no effect on net assets or net asset values per share.
| Fund | Paid-in Capital | Accumulated Net Investment | Accumulated Net Realized Gain/(Loss) | |||||||||
Diversified Alternatives Fund | $ | – | $ | 157,320 | $ | (157,320 | ) | |||||
Diversified Income Fund | – | 150,080 | (150,080 | ) | ||||||||
Dynamic Allocation Fund | – | 24,321 | (24,321 | ) | ||||||||
9. Significant Shareholders
As of October 31, 2014, the following Funds had shareholders with the percentage ownership indicated, which are considered significant shareholders (holdings greater than 5.0%) for financial reporting purposes:
| Fund | Record Ownership % | Number of Account Owners | ||||
Diversified Alternatives Fund | 60.9 | % | 3 | |||
Diversified Income Fund | 49.7 | % | 2 | |||
Dynamic Allocation Fund | 42.6 | % | 2 | |||
10. Line of Credit
Effective August 15, 2014, the Trust, on behalf of each of the funds of the Trust (the “Borrowers”), entered into a credit agreement (the “Agreement”) with State Street Bank and Trust Company (the “Bank”). The Agreement provides for a revolving credit facility (the “Credit Facility”) to be utilized for temporary or emergency purposes to fund shareholder redemptions or other short-term liquidity purposes. The amount of the Credit Facility was $400,000,000 for the period ended October 31, 2014.
Principal on each outstanding loan made under the Agreement bears interest at a variable rate per annum equal to the higher of (a) the Federal Funds Rate as in effect of that day plus 1.25% or (b) the Overnight London Interbank Offered Rate (“LIBOR”) as in effect on that day plus 1.25%. In addition, the Borrowers shall pay to the Bank a commitment fee at the rate of 0.10% per annum on the daily unused portion of the Credit Facility, as applicable, which is allocated among the Borrowers in such manner as is determined by the Board to be reasonable. As of October 31, 2014, the Funds had no borrowings outstanding under the Credit Facility.
11. Recent Accounting Pronouncements
In June 2014, the Financial Accounting Standards Board issued guidance to improve the financial reporting of repurchase agreements and other similar transactions. The guidance includes expanded disclosure requirements for entities that enter into repurchase agreements and similar transactions accounted for as secured borrowings. The guidance is effective for financial statements with fiscal years beginning on or after December 15, 2014 and interim periods within those fiscal years. Management is evaluating the impact, if any, of this guidance on the Funds’ financial statement disclosures.
12. Subsequent Events
Management has evaluated the need for disclosures and/or adjustments resulting from subsequent events through the date the financial statements were issued. Based on this evaluation, no disclosures and/or adjustments were required to the financial statements as of October 31, 2014.
Annual Report 2014
42
Table of Contents
Report of Independent Registered Public Accounting Firm
The Board of Trustees and Shareholders of Aberdeen Funds:
We have audited the accompanying statements of assets and liabilities, including the statements of investments, of the Aberdeen Diversified Alternatives Fund, Aberdeen Diversified Income Fund, and Aberdeen Dynamic Allocation Fund, three of the funds comprising Aberdeen Funds (the “Funds”), as of October 31, 2014, and the related statements of operations for the year then ended, the statements of changes in net assets for each of the years in the two-year period then ended and the financial highlights for each of the years or periods in the five-year period then ended. These financial statements and financial highlights are the responsibility of the Funds’ management. Our responsibility is to express an opinion on these financial statements and financial highlights based on our audits.
We conducted our audits in accordance with the standards of the Public Company Accounting Oversight Board (United States). Those standards require that we plan and perform the audit to obtain reasonable assurance about whether the financial statements and financial highlights are free of material misstatement. An audit includes examining, on a test basis, evidence supporting the amounts and disclosures in the financial statements. Our procedures included confirmation of securities owned as of October 31, 2014, by correspondence with the custodian, brokers and transfer agent of the underlying funds or other appropriate auditing procedures. An audit also includes assessing the accounting principles used and significant estimates made by management, as well as evaluating the overall financial statement presentation. We believe that our audits provide a reasonable basis for our opinion.
In our opinion, the financial statements and financial highlights referred to above present fairly, in all material respects, the financial position of the Funds as of October 31, 2014, the results of their operations for the year then ended, the changes in their net assets for each of the years in the two-year period then ended and the financial highlights for each of the years or periods in the five-year period then ended, in conformity with U.S. generally accepted accounting principles.

Philadelphia, Pennsylvania
December 26, 2014
2014 Annual Report
43
Table of Contents
Other Tax Information (Unaudited)
For the period ended October 31, 2014, certain dividends paid by the Funds may be subject to a maximum tax rate of 15% as provided for by the Jobs and Growth Tax Relief Reconciliation Act of 2003. The Funds intend to designate the maximum amount allowable as taxed as a maximum rate of 15%. Complete information will be reported in conjunction with your 2013 Form 1099-DIV.
For the year ended October 31, 2014, the following Funds paid qualified dividend income:
| Fund | Qualified Dividend Income | |||
Diversified Alternatives Fund | 38% | |||
Diversified Income Fund | 35% | |||
Dynamic Allocation Fund | 80% | |||
For the taxable year ended October 31, 2014, the following percentage of income dividends paid by the Funds qualify for the dividends received deduction available to corporate shareholders:
| Fund | Dividend Received Deduction | |||
Diversified Alternatives Fund | 22% | |||
Diversified Income Fund | 13% | |||
Dynamic Allocation Fund | 35% | |||
Annual Report 2014
44
Table of Contents
Shareholder Expense Examples (Unaudited)
As a shareholder of the Aberdeen Funds, you incur two types of costs: (1) transaction costs, including sales charges (loads) paid on purchase payments and (2) ongoing costs, including investment advisory fees, administration fees, transfer agent out-of-pocket expenses, distribution fees and other Fund expenses. The examples below are intended to help you understand your ongoing costs (in dollars) of investing in the Aberdeen Funds and to compare these costs with the ongoing costs of investing in other mutual funds.
The examples assume that you had a $1,000 investment in the Class at the beginning of the reporting period, May 1, 2014 and continued to hold your shares at the end of the reporting period, October 31, 2014.
Actual Expenses
The table below provides information about actual account values and actual expenses. You may use the information together with the amount you invested, to estimate the expenses that you paid over the period. Simply divide your account value by $1,000 (for example, an $8,600 account value divided by $1,000 = 8.6), then multiply the result by the number under the heading entitled “Actual Expenses Paid During Period” for the class of a Fund that you own to estimate the expenses you paid on your account during the period.
Hypothetical Example for Comparison Purposes
The table below provides information about hypothetical account values and hypothetical expenses based on the Class’ actual expense ratio and an assumed rate of return of 5% per year before expenses, which is not the Class’ actual return. The hypothetical account values and expenses may not be used to estimate the actual ending account balance or expenses you paid for the period. You may use this information to compare the ongoing costs of investing in the Class of a Fund and other funds. To do so, compare the 5% hypothetical example with the 5% hypothetical examples that appear in the shareholder reports of the other funds.
Please note that the expenses shown in the table are meant to highlight your ongoing costs only and do not reflect any transaction costs, such as sales charges (loads). Therefore, the information for each Class in the table is useful in comparing ongoing costs only, and will not help you determine the relative total costs of owning different funds. In addition, if these transaction costs were included, your costs would have been higher. The examples also assume all dividends and distributions have been reinvested.
| Beginning Account Value, May 1, 2014 | Actual Ending Account Value, October 31, 2014 | Hypothetical Ending Account Value | Actual Expenses Paid During Period*+ | Hypothetical Expenses Paid During Period*+1 | Annualized Expense Ratio** | |||||||||||||||||||||
Aberdeen Diversified Alternatives Fund | Class A | $ | 1,000.00 | $ | 1,022.40 | $ | 1,022.48 | $ | 2.75 | $ | 2.75 | 0.54% | ||||||||||||||
Class C | $ | 1,000.00 | $ | 1,019.00 | $ | 1,018.90 | $ | 6.36 | $ | 6.36 | 1.25% | |||||||||||||||
Class R | $ | 1,000.00 | $ | 1,022.40 | $ | 1,021.58 | $ | 3.67 | $ | 3.67 | 0.72% | |||||||||||||||
Institutional Service Class | $ | 1,000.00 | $ | 1,024.30 | $ | 1,024.10 | $ | 1.12 | $ | 1.12 | 0.22% | |||||||||||||||
Institutional Class | $ | 1,000.00 | $ | 1,024.30 | $ | 1,023.95 | $ | 1.28 | $ | 1.28 | 0.25% | |||||||||||||||
Aberdeen Diversified Income Fund | Class A | $ | 1,000.00 | $ | 1,028.10 | $ | 1,022.69 | $ | 2.56 | $ | 2.55 | 0.50% | ||||||||||||||
Class C | $ | 1,000.00 | $ | 1,024.60 | $ | 1,018.90 | $ | 6.38 | $ | 6.36 | 1.25% | |||||||||||||||
Class R | $ | 1,000.00 | $ | 1,026.00 | $ | 1,020.37 | $ | 4.90 | $ | 4.89 | 0.96% | |||||||||||||||
Institutional Service Class | $ | 1,000.00 | $ | 1,029.50 | $ | 1,024.00 | $ | 1.23 | $ | 1.22 | 0.24% | |||||||||||||||
Institutional Class | $ | 1,000.00 | $ | 1,029.50 | $ | 1,023.95 | $ | 1.28 | $ | 1.28 | 0.25% | |||||||||||||||
Aberdeen Dynamic Allocation Fund | Class A | $ | 1,000.00 | $ | 1,032.00 | $ | 1,022.58 | $ | 2.66 | $ | 2.65 | 0.52% | ||||||||||||||
Class C | $ | 1,000.00 | $ | 1,028.60 | $ | 1,018.90 | $ | 6.39 | $ | 6.36 | 1.25% | |||||||||||||||
Class R | $ | 1,000.00 | $ | 1,029.90 | $ | 1,020.37 | $ | 4.91 | $ | 4.89 | 0.96% | |||||||||||||||
Institutional Service Class | $ | 1,000.00 | $ | 1,033.50 | $ | 1,024.00 | $ | 1.23 | $ | 1.22 | 0.24% | |||||||||||||||
Institutional Class | $ | 1,000.00 | $ | 1,033.50 | $ | 1,023.95 | $ | 1.28 | $ | 1.28 | 0.25% | |||||||||||||||
| * | Expenses are equal to the Fund’s annualized expense ratio multiplied by the average account value over the period multiplied by 184/365 (to reflect the one-half year period). |
| ** | The expense ratio presented represents a six-month, annualized ratio. |
| + | Expenses are based on the direct expenses of the Fund and do not include the effect of the Underlying Funds’ expenses, which are disclosed in the Fee and expense table and described more fully in a footnote to that table in your Fund Prospectus. |
| 1 | Represents the hypothetical 5% return before expenses. |
2014 Annual Report
45
Table of Contents
Supplemental Information (Unaudited)
Board of Trustees’ Consideration of Advisory Agreement
At an in-person meeting of the Board of Trustees (the “Board” or the “Trustees”) of the Aberdeen Funds (the “Trust”) held on June 11, 2014, the Board, including a majority of the Trustees who are not considered to be “interested persons” of the Trust (the “Independent Trustees”) under the Investment Company Act of 1940, as amended (the “1940 Act”), approved for an annual period the continuation of the Trust’s advisory agreement (the “Advisory Agreement”) with Aberdeen Asset Management Inc. (“AAMI” or the “Adviser”) for each series of the Trust identified below (each a “Fund,” and collectively the “Funds”).
In connection with contract review meetings, the Board reviews a variety of information provided by the Adviser relating to the Funds, the Advisory Agreement and the Adviser, including comparative performance, fee and expense information and other information regarding the nature, extent and quality of services provided by the Adviser under the Advisory Agreement. The materials provided to the Board generally include, among other items: (i) information on the investment performance of the Funds and the performance of peer groups of funds and the Funds’ performance benchmarks; (ii) information on the Funds’ advisory fees and other expenses, including information comparing each Fund’s expenses to those of a peer group of funds and information about any applicable expense limitations and fee “breakpoints”; (iii) sales and redemption data with respect to each Fund; (iv) information about the profitability of the Advisory Agreement to the Adviser; (v) a report prepared by the Adviser in response to a request submitted by the Independent Trustees’ independent legal counsel on behalf of such Trustees; and (vi) a memorandum from the Independent Trustees’ independent legal counsel on the responsibilities of the Board of Trustees in considering for approval the investment advisory arrangement under the 1940 Act and Delaware law. The Board of Trustees, including the Independent Trustees, also considers other matters such as: (i) the Adviser’s financial results and financial condition; (ii) each Fund’s investment objective and strategies; (iii) the Adviser’s investment personnel and operations; (iv) arrangements relating to the distribution of the Funds’ shares and the related costs; (v) the procedures employed to determine the value of the Funds’ assets; (vi) the allocation of the Funds’ brokerage, if any, including, if applicable, allocations to brokers affiliated with the Adviser and the use, if any, of “soft” commission dollars to pay Fund expenses and to pay for research and other similar services; (vii) the resources devoted to, and the record of compliance with, the Funds’ investment policies and restrictions, policies on personal securities transactions and other compliance policies; and (viii) possible conflicts of interest. The Board also considers the nature, extent and quality of the services provided to the Funds by AAMI’s affiliates. Throughout the process, the Trustees are afforded the opportunity to ask questions of and request additional materials from AAMI.
In addition to the materials requested by the Trustees in connection with their annual consideration of the continuation of the Advisory Agreement, the Trustees receive materials in advance of each regular quarterly meeting of the Board that provide information relating to the services provided by the Adviser, including detailed information about the Funds’ investment performance. This information generally includes, among other things, third-party performance rankings for various periods (including prior to the Adviser’s management of the Funds) comparing each Fund against its peer group, total return information for various periods, and details of sales and redemptions of Fund shares for the period. The Board also receives periodic presentations from the portfolio management teams in connection with the performance of the Funds.
The Independent Trustees were advised by separate independent legal counsel throughout the process. The Independent Trustees also consulted in executive sessions with counsel to the Independent Trustees regarding consideration of the renewal of the Advisory Agreement. In considering whether to approve the continuation of the Advisory Agreement, the Board of Trustees, including the Independent Trustees, did not identify any single factor as determinative. Individual Trustees may have evaluated the information presented differently from one another, giving different weights to various factors. Matters considered by the Trustees, including the Independent Trustees, in connection with their approval of the continuation of the Advisory Agreement included the factors listed below.
The nature, extent and quality of the services provided to the Funds under the Advisory Agreement. The Trustees considered the nature, extent and quality of the services provided by AAMI to the Funds and the resources dedicated to the Funds by AAMI and its affiliates. The Board considered, among other things, the Adviser’s investment experience. The Board also considered the background and experience of the Adviser’s senior management personnel and the qualifications, background and responsibilities of the portfolio managers that are primarily responsible for the day-to-day portfolio management services for the Funds. The Trustees considered not only the advisory services provided by AAMI to the Funds, but also the administrative services provided by AAMI to the Funds under a separate administration agreement. AAMI’s role in coordinating the activities of the Trust’s other service providers was also considered. The Board also considered that it receives information on a regular basis from the Trust’s Chief Compliance Officer regarding the Adviser’s compliance policies and procedures. The Board also considered the Adviser’s risk management processes. The Board was also mindful of the Adviser’s focus on the monitoring of the performance of the Funds and in addressing performance matters. The Trustees also considered the benefits to shareholders of investing in a mutual fund that is part of a family of funds that offers shareholders the right to exchange shares of one type of fund for shares of another type of fund, and provides a variety of fund and shareholder services. The Board also took into account its knowledge of management and the quality of the performance of management’s duties through Board meetings, discussion and reports during the preceding year.
After reviewing these and related factors, the Board concluded that the nature, extent and quality of the services provided were extensive in nature and of high quality and supported the renewal of the Advisory Agreement.
Annual Report 2014
46
Table of Contents
Supplemental Information (Unaudited) (continued)
Investment performance of the Funds and the Adviser. The Trustees received information about the performance of the Funds over various time periods, including information which compared the performance of the Funds to the performance of peer groups of funds and each Fund’s performance benchmark. The Trustees also considered the performance of the Funds compared to the performance of comparable funds or accounts managed by AAMI and its affiliates to the extent available. In addition, the Trustees also reviewed data prepared by an independent third party which analyzed the performance of the Funds using a variety of performance metrics.
The Trustees considered AAMI’s performance and reputation generally, the performance of the fund family generally, and the historical responsiveness of AAMI to Trustee concerns about performance and the willingness of AAMI to take steps intended to improve performance. The Trustees also considered the performance of the Adviser since it commenced management of the Funds.
In addition to the foregoing, the Trustees considered the specific factors set forth below with respect to the performance of each Fund for the periods ended March 31, 2014:
Aberdeen Diversified Income Fund. The Board noted that the Fund underperformed its peer group average for the 1- and 3-year periods and outperformed its peer group average for the 5-year period. The Board also noted that the Fund outperformed its benchmark for the 1-, 3- and 5-year periods.
Aberdeen Dynamic Allocation Fund. The Board noted that the Fund outperformed its peer group average for the 5-year period and underperformed its peer group average for the 1- and 3-year periods. The Board also noted that the Fund underperformed its benchmark for the 1-, 3- and 5-year periods.
Aberdeen Diversified Alternatives Fund. The Board noted that the Fund outperformed its peer group average and its benchmark for the 1-, 3- and 5-year periods.
After discussion, the Board concluded that it will continue to monitor the Funds’ performance and any actions taken by AAMI and its affiliates relating to performance.
The costs of the services provided and profits realized by the Adviser and its affiliates from their relationships with the Funds. The Trustees considered the fees charged to the Funds for advisory services as well as the total expense levels of the Funds. This information included comparisons (provided both by management and also by an independent third party) of each Fund’s net management fee and total expense level to those of its peer group (the “Expense Group”) and information about the advisory fees charged by AAMI to any separately managed accounts with a similar strategy. In comparing each Fund’s net management fee to that of comparable funds, the Board noted that such fee includes both advisory and administrative fees. In considering the fees charged to any comparable accounts, the Trustees considered, among other things, management’s discussion of the differences required to manage the different types of accounts. In evaluating the Funds’ advisory fees, the Trustees also took into account the demands, complexity and quality of the investment management of the Funds.
The Trustees also considered that AAMI had entered into expense limitation agreements with the Funds, pursuant to which AAMI agreed to waive a portion of its advisory fee and/or reimburse certain expenses as a means of limiting each Fund’s total annual operating expenses for a period of time.
The Trustees also considered the compensation directly or indirectly received by AAMI and its affiliates from their relationships with the Funds. The Trustees reviewed information provided by management as to the profitability of AAMI and its affiliates’ relationships with the Funds, such as the engagement of affiliates of AAMI to provide distribution and administrative services to the Funds. The Trustees also examined the profitability of AAMI and its affiliates on a Fund-by-Fund basis. The Trustees also considered information about the allocation of expenses used to calculate profitability. When reviewing profitability, the Trustees also considered information about court cases regarding adviser profitability, the performance of the Funds, the expense levels of the Funds, and whether AAMI had implemented breakpoints and expense limitations with respect to the Funds.
In addition to the foregoing, the Trustees considered the specific factors set forth below with respect to each Fund’s fees and expenses:
Aberdeen Diversified Income Fund. The Board considered that the Fund’s net management fee and net total expenses after waivers were each below the median of the Expense Group.
Aberdeen Dynamic Allocation Fund. The Board considered that the Fund’s net management fee was below the median of the Expense Group and net total expenses after waivers were above the median of the Expense Group.
Aberdeen Diversified Alternatives Fund. The Board considered that the Fund’s net management fee was below the median of the Expense Group and net total expenses after waivers were above the median of the Expense Group.
2014 Annual Report
47
Table of Contents
Supplemental Information (Unaudited) (concluded)
After reviewing these and related factors, including taking into account management’s discussion regarding Fund expenses, the Board concluded that the advisory fees were fair and reasonable, and that the costs of these services generally and the related profitability of AAMI and its affiliates from their relationships with the Funds were reasonable and supported the renewal of the Advisory Agreement.
Economies of Scale. The Trustees considered the existence of any economies of scale in the provision of services by AAMI and whether those economies would be shared with the Funds through breakpoints in the investment advisory fees or other means, such as expense waivers or limitations. The Trustees noted that each of the Funds was subject to an expense limitation. The Board noted management’s discussion of the Funds’ advisory fee structure. The Trustees also took note of the costs of the services provided and the profitability to AAMI and its affiliates from their relationships with the Funds, as discussed above. The Board also considered the potential effect of each Fund’s growth and size on fees, noting that if a Fund’s assets increase over time, the Fund may realize other economies of scale if assets increase proportionally more than some expenses.
After reviewing these and related factors, the Board concluded that the advisory fee structure was reasonable and reflect economies of scale being shared between the Funds and the Adviser, and supported the renewal of the Advisory Agreement.
The Trustees also considered other factors, which included but were not limited to the following:
| • | the effect of any market and economic volatility on the performance, asset levels and expense ratios of the Funds. |
| • | whether the Funds have operated in accordance with their investment objectives and the Funds’ record of compliance with their investment restrictions, and the compliance programs of the Trust and AAMI. The Trustees also considered the compliance-related resources AAMI and its affiliates were providing to the Funds. |
| • | the nature, quality, cost and extent of administrative services performed by AAMI under the Advisory Agreement and under a separate agreement covering administrative services. |
| • | so-called “fallout benefits” to AAMI, such as the benefits of research made available to AAMI by reason of brokerage commissions generated by the Funds’ securities transactions or reputational and other indirect benefits. The Trustees considered any possible conflicts of interest associated with these fallout and other benefits, and the reporting, disclosure and other processes in place to disclose and monitor such possible conflicts of interest. |
* * *
Based on their evaluation of all factors that they deemed to be material, including those factors described above, and assisted by the advice of independent counsel, the Trustees, including the Independent Trustees, concluded that renewal of the Advisory Agreement would be in the best interest of each of the Funds and its shareholders. Accordingly, the Board, and the Independent Trustees voting separately, approved the Advisory Agreement for an additional one-year period.
Annual Report 2014
48
Table of Contents
Management of the Funds (Unaudited)
As of October 31, 2014
The names of the Trustees and officers of the Funds, their addresses, years of birth, and principal occupations during the past five years are provided in the tables below. Trustees that are deemed “interested persons” (as that term is defined in Section 2(a)(19) of the 1940 Act) of the Funds and the investment adviser are included in the table below under the heading “Interested Trustees.” Trustees who are not interested persons as described above are referred to in the table below under the heading “Independent Trustees.”
The Statement of Additional Information includes additional information about the Trustees of the Funds and is available, without charge, on the Funds’ website at www.aberdeen-asset.com/us, or upon request at 1-866-667-9231.
Trustees and Officers of the Trust
Name, Address, and Year of Birth | Position(s) Held, Length of Time | Principal Occupation During Past 5 Years | Number of Portfolios in Fund | Other Directorships Held by Trustee 5 Years*** | ||||
Independent Trustees | ||||||||
P. Gerald Malone**** Year of Birth: 1950 | Trustee since December 2007 Chairman of the Board | Mr. Malone is, by profession, a solicitor of some 38 years standing. He has served as a Minister of State in the United Kingdom Government. Mr. Malone currently serves as Independent Chairman of a London AIM-listed company (healthcare software) and a UK based privately-owned pharmaceutical company. He is Chairman of the Board of Trustees of Aberdeen Funds, Chairman of the Board of Directors of Aberdeen Global Income Fund, Inc. and Aberdeen Asia-Pacific Income Fund, Inc. and serves on the boards of Aberdeen Australia Equity Fund, Inc. and Aberdeen Asia-Pacific Income Investment Company Limited. | 27 | None. | ||||
Richard H. McCoy**** Year of Birth: 1942 | Trustee since December 2007 | Prior to retiring in 2003, Mr. McCoy was Vice-Chairman, Investment Banking, at TD Securities Inc. He is currently a Director of Uranium Participation Corp. and Pizza Pizza Royalty Income Fund, Chair of Chorus Aviation Inc. and an Independent Review Committee member of Uranium Participation Corp. Mr. McCoy has also been Chairman of Aberdeen Asia-Pacific Income Investment Company Limited since 2010. | 24 | None. | ||||
Neville J. Miles Year of Birth: 1946 | Trustee since December 2011 | Mr. Miles is, and has been for over ten years, Chairman of Ballyshaw Pty. Ltd. (share trading, real estate development and investment). He is Chairman of the Board of Directors of Aberdeen Australia Equity Fund, Inc. He also is a non-executive director of a number of Australian and overseas companies. | 27 | None. | ||||
2014 Annual Report
49
Table of Contents
Management of the Funds (Unaudited) (continued)
As of October 31, 2014
Name, Address, and Year of Birth | Position(s) Held, Length of Time | Principal Occupation During Past 5 Years | Number of Portfolios in Fund | Other Directorships Held by Trustee 5 Years*** | ||||
Peter D. Sacks**** Year of Birth: 1945 | Trustee since December 2007 | Mr. Sacks has been a Director and Founding Partner of Toron AMI International Asset Management (formerly, Toron Investment Management) (investment management) since 1988. He is also a Director and Investment Advisory Committee member of several private and public sector funds in Canada. | 27 | None. | ||||
John T. Sheehy**** Year of Birth: 1942 | Trustee since December 2007 | Mr. Sheehy has been a Senior Managing Director of B.V. Murray and Company (investment banking) since 2001 and Director of Macquarie AIR-serv Holding, Inc. (automotive services) from 2006 to 2013. He was a Managing Member of Pristina Capital Partners, LLC (water purification technology development) from 2007 to 2011, a Director of Smarte Carte, Inc. (airport services) from 2007 to 2010, and Managing Member of The Value Group LLC (venture capital) from 1997 to 2009. | 27 | None. | ||||
Warren C. Smith**** Year of Birth: 1955 | Trustee since December 2007 | Mr. Smith has been a founding partner of MRB Partners Inc. (independent investment research and consultancy firm) since 2010. Mr. Smith was a Managing Editor with The Bank Credit Analyst Research Group (independent publishers of financial market research and publications, including The Bank Credit Analyst) from 1982 to 2009. | 24 | None. | ||||
John F. Solan, Jr.**** Year of Birth: 1939 | Trustee since December 2007 | Prior to retiring, Mr. Solan was Senior Vice President of Strategic Development at The Phoenix Companies, Inc. and Chairman of Phoenix Charter Oak Trust Company from 1998 until 2004. Mr. Solan served in several different positions with Ernst & Young from 1964 to 1998. | 24 | None. |
Annual Report 2014
50
Table of Contents
Management of the Funds (Unaudited) (continued)
As of October 31, 2014
Name, Address, and Year of Birth | Position(s) Held, Length of Time | Principal Occupation During Past 5 Years | Number of Portfolios in Fund | Other Directorships Held by Trustee 5 Years*** | ||||
| Interested Trustee | ||||||||
Martin Gilbert****† Year of Birth: 1955 | Trustee since December 2007 | Mr. Gilbert is a founding director and shareholder, and Chief Executive of Aberdeen Asset Management PLC, the holding company of the fund management group that was established in 1983 (“Aberdeen Group”). He was a Director (1991–2014) of Aberdeen Asset Management Asia Limited and a Director (2000–2014) of Aberdeen Asset Management Limited. He was a Director (1995–2014) and was President (September 2006–2014) of Aberdeen Asset Management Inc. Mr. Gilbert also serves as officer and/or director of various Aberdeen Group subsidiary companies, Aberdeen-managed investment trusts and funds’ boards. | 28 | None. | ||||
| * | Each Trustee holds office for an indefinite term until his successor is elected and qualified. |
| ** | The Aberdeen Fund Complex consists of the Trust which currently consists of 24 portfolios, Aberdeen Asia-Pacific Income Fund, Inc., Aberdeen Global Income Fund, Inc., Aberdeen Australia Equity Fund, Inc., Aberdeen Chile Fund, Inc., Aberdeen Israel Fund, Inc., Aberdeen Indonesia Fund, Inc., Aberdeen Latin America Equity Fund, Inc., Aberdeen Emerging Markets Smaller Company Opportunities Fund, Inc., Aberdeen Singapore Fund, Inc., The Asia Tigers Fund, Inc., The India Fund, Inc., Aberdeen Greater China Fund, Inc., Aberdeen Japan Equity Fund, Inc., Aberdeen Investment Funds and Aberdeen Global Select Opportunities Fund Inc. |
| *** | Directorships held in (1) any other investment companies registered under the 1940 Act, (2) any company with a class of securities registered pursuant to Section 12 of the Securities Exchange Act of 1934, as amended (the “Exchange Act”) or (3) any company subject to the requirements of Section 15(d) of the Exchange Act. |
| **** | Each Trustee may be contacted by writing to the Trustee c/o Aberdeen Asset Management Inc., 1735 Market Street, 32nd Floor, Philadelphia, Pennsylvania 19103, Attn: Alan Goodson. |
| † | Mr. Gilbert is considered to be an “interested person” of the Trust as defined in the 1940 Act because of his affiliation with the Adviser. |
2014 Annual Report
51
Table of Contents
Management of the Funds (Unaudited) (continued)
As of October 31, 2014
Officers of the Trust
Name, Address, and Year of Birth | Position(s) Held, Length of Time Served and Term of Office* | Principal Occupation During Past 5 Years | ||
Bev Hendry** Aberdeen Asset Management Inc. 1735 Market Street 32nd Floor Philadelphia, PA 19103 Year of Birth: 1953 | President, Chief Executive Officer and Principal Executive Officer (Since September 2014) | Currently, Co-Head of Americas and Chief Financial Officer for Aberdeen Asset Management Inc. since June 2014. He first joined Aberdeen in 1987 and helped establish Aberdeen’s business in the Americas in Fort Lauderdale. Mr. Hendry left Aberdeen in 2008 when the company moved to consolidate its headquarters in Philadelphia. Mr. Hendry re-joined Aberdeen from Hansberger Global Investors in Fort Lauderdale, Florida, where he worked for six years as Chief Operating Officer. | ||
Jeffrey Cotton** Aberdeen Asset Management Inc. 1735 Market Street 32nd Floor Philadelphia, PA 19103 Year of Birth: 1977 | Vice President and Chief Compliance Officer (Since March 2011) | Currently, Vice President and Head of Compliance – Americas for Aberdeen Asset Management Inc. Mr. Cotton joined Aberdeen in 2010. Prior to joining Aberdeen, Mr. Cotton was a Senior Compliance Officer at Old Mutual Asset Management (2009–2010) supporting its affiliated investment advisers and mutual fund platform. Mr. Cotton was also a Vice President and Senior Compliance Manager at Bank of America/Columbia Management (2006–2009). | ||
Sofia Rosala** Aberdeen Asset Management Inc. 1735 Market Street 32nd Floor Philadelphia, PA 19103 Year of Birth: 1974 | Vice President (since March 2014) and Deputy Chief Compliance Officer (Since December 2013) | Currently, Deputy Fund Chief Compliance Officer and U.S. Counsel for Aberdeen Asset Management Inc. (since July, 2012). Prior to joining Aberdeen, Ms. Rosala was Counsel for Vertex, Inc. from April 2011 to June 2012. She was also an Associate Attorney with Morgan, Lewis and Bockius from May 2008–April 2011. | ||
Andrea Melia** Aberdeen Asset Management Inc. 1735 Market Street 32nd Floor Philadelphia, PA 19103 Year of Birth: 1969 | Treasurer, Chief Financial Officer, and Principal Accounting Officer (Since September 2009) | Currently, Vice President and Head of Fund Administration for Aberdeen Asset Management Inc. (since 2009). Prior to joining Aberdeen, Ms. Melia was Director of Fund Administration and accounting oversight for Princeton Administrators LLC, a division of BlackRock Inc. and had worked with Princeton Administrators since 1992. |
Annual Report 2014
52
Table of Contents
Management of the Funds (Unaudited) (continued)
As of October 31, 2014
Name, Address, and Year of Birth | Position(s) Held, Length of Time Served and Term of Office* | Principal Occupation During Past 5 Years | ||
Megan Kennedy** Aberdeen Asset Management Inc. 1735 Market Street 32nd Floor Philadelphia, PA 19103 Year of Birth: 1974 | Secretary and Vice President (Since September 2009) | Currently, Head of Product Management for Aberdeen Asset Management Inc. Ms. Kennedy joined Aberdeen Asset Management Inc. in 2005 as a Senior Fund Administrator. Ms. Kennedy was promoted to Assistant Treasurer Collective Funds/North American Mutual Funds in February 2008 and promoted to Treasurer Collective Funds/North American Mutual Funds in July 2008. | ||
Lucia Sitar** Aberdeen Asset Management Inc. 1735 Market Street 32nd Floor Philadelphia, PA 19103 Year of Birth: 1971 | Vice President (Since December 2008) | Currently, Managing U.S. Counsel for Aberdeen Asset Management Inc. Ms. Sitar joined Aberdeen Asset Management Inc. in July 2007. | ||
Brad Crombie Aberdeen Asset Management Bow Bells House 1 Bread Street London EC4M 9HH Year of Birth: 1970 | Vice President (Since June 2013) | Currently, Global Head of Fixed Income for Aberdeen Asset Management PLC. Mr. Crombie re-joined Aberdeen in 2012. Prior to re-joining Aberdeen, Mr. Crombie was a Managing Director at Bank of America Merrill Lynch for the bank’s non-financial corporate and high yield credit research team for the Europe, Middle East and Africa region from 2003 to 2012. | ||
Alan Goodson** Aberdeen Asset Management Inc. 1735 Market Street 32nd Floor Philadelphia, PA 19103 Year of Birth: 1974 | Vice President (Since March 2009) | Currently, Head of Product – US, overseeing Product Management, Product Development and Investor Services for Aberdeen’s registered and unregistered investment companies in the US and Canada. Mr. Goodson is Vice President of Aberdeen Asset Management Inc. and joined Aberdeen in 2000. | ||
Adam McCabe** Aberdeen Asset Management Asia Limited 21 Church Street #01-01 Capital Square Two Singapore 049480 Year of Birth: 1979 | Vice President (Since March 2010) | Currently, Head of Asian Fixed Income on the Fixed Income – Asia Pacific desk, responsible for currency and interest rate strategies in Aberdeen’s Asian fixed income portfolios. Mr. McCabe joined Aberdeen in 2009 following the acquisition of certain asset management businesses from Credit Suisse. Adam worked for Credit Suisse since 2001, where he was an investment manager responsible for the development and implementation of its Asian currency and interest rate strategies. |
2014 Annual Report
53
Table of Contents
Management of the Funds (Unaudited) (concluded)
As of October 31, 2014
Name, Address, and Year of Birth | Position(s) Held, Length of Time Served and Term of Office* | Principal Occupation During Past 5 Years | ||
Jennifer Nichols** Aberdeen Asset Management Inc. 1735 Market Street 32nd Floor Philadelphia, PA 19103 Year of Birth: 1978 | Vice President (Since December 2007) | Currently, Global Head of Legal for Aberdeen Asset Management PLC. Director and Vice President for Aberdeen Asset Management Inc. (since October 2006). | ||
Hugh Young** Aberdeen Asset Management Asia Limited 21 Church Street #01-01 Capital Square Two Singapore 049480 Year of Birth: 1958 | Vice President (Since June 2011) | Currently, Managing Director of Aberdeen Asset Management Asia Limited (since 1991) and member of the Executive Management Committee and Director of Aberdeen Asset Management PLC (since 1991 and 2011, respectively). Mr. Young joined Aberdeen in 1991. | ||
Brian O’Neill** Aberdeen Asset Management Inc. 1735 Market Street 32nd Floor Philadelphia, PA 19103 Year of Birth: 1968 | Assistant Treasurer (Since September 2008) | Currently, Senior Fund Administration Manager – US for Aberdeen Asset Management Inc. Mr. O’Neill joined Aberdeen Asset Management Inc. in 2008. Prior to joining Aberdeen Asset Management Inc., Mr. O’Neill was a Director of Fund Accounting with Nationwide Funds Group (2002–2008). | ||
Eric Olsen Aberdeen Asset Management Inc. 1735 Market Street 32nd Floor Philadelphia, PA 19103 Year of Birth: 1970 | Assistant Treasurer (Since December 2013) | Currently, Deputy Head of Fund Administration – US for Aberdeen Asset Management Inc. Mr. Olsen joined Aberdeen Asset Management Inc. in August 2013. Prior to joining Aberdeen Asset Management Inc., Mr. Olsen was a Director of Financial Reporting for BNY Mellon Asset Servicing and had worked with BNY Mellon since 1998. | ||
Pamela Wade** Aberdeen Asset Management Inc. 1735 Market Street 32nd Floor Philadelphia, PA 19103 Year of Birth: 1971 | Assistant Secretary (Since March 2013) | Currently, Senior Product Manager for Aberdeen Asset Management Inc. Ms. Wade joined Aberdeen Asset Management Inc. in 2012 as Senior Product Manager. Prior to joining Aberdeen Asset Management Inc., Ms. Wade was a Vice President and Assistant Counsel with BNY Mellon Asset Servicing (2007–2012). |
| * | Each officer holds office for an indefinite term at the pleasure of the Board of Trustees and until his or her successor is elected and qualified. |
| ** | Mr. Hendry, Ms. Melia, Ms. Kennedy, Mr. Goodson, Ms. Nichols, Mr. Cotton, Mr. McCabe, Mr. Young, Ms. Sitar, Mr. O’Neill, Ms. Wade and Ms. Rosala hold officer position(s) in one or more of the following: Aberdeen Asia-Pacific Income Fund, Inc., Aberdeen Australia Equity Fund, Inc., Aberdeen Global Income Fund, Inc., Aberdeen Chile Fund, Inc., Aberdeen Israel Fund, Inc., Aberdeen Indonesia Fund, Inc., Aberdeen Latin America Equity Fund, Inc., Aberdeen Emerging Markets Smaller Company Opportunities Fund, Inc., Aberdeen Singapore Fund, Inc., The Asia Tigers Fund, Inc., The India Fund, Inc., Aberdeen Greater China Fund, Inc., Aberdeen Japan Equity Fund, Inc., Aberdeen Investment Funds and Aberdeen Global Select Opportunities Fund Inc., each of which may also be deemed to be a part of the same “Fund Complex” as the Trust. |
Annual Report 2014
54
Table of Contents
Management Information
Trustees
P. Gerald Malone, Chairman
Martin J. Gilbert
Richard H. McCoy
Neville J. Miles
Peter D. Sacks
John T. Sheehy
Warren C. Smith
John F. Solan, Jr.
Officers
Bev Hendry, President and Chief Executive Officer
Jeffrey Cotton, Chief Compliance Officer and Vice President
Sofia Rosala, Deputy Chief Compliance Officer and Vice President
Andrea Melia, Treasurer and Chief Financial Officer
Megan Kennedy, Secretary and Vice President
Brad Crombie, Vice President
Lucia Sitar, Vice President
Alan Goodson, Vice President
Adam McCabe, Vice President
Jennifer Nichols, Vice President
Hugh Young, Vice President
Eric Olsen, Assistant Treasurer
Brian O’Neill, Assistant Treasurer
Pamela Wade, Assistant Secretary
Investment Manager
Aberdeen Asset Management Inc.
1735 Market Street, 32nd Floor
Philadelphia, PA 19103
Fund Administrator
Aberdeen Asset Management Inc.
1735 Market Street, 32nd Floor
Philadelphia, PA 19103
Transfer Agent
Boston Financial Data Services, Inc.
30 Dan Road
Canton, MA 02021
Distributor
Aberdeen Fund Distributors LLC
1735 Market Street, 32nd Floor
Philadelphia, PA 19103
Sub-Administrator, Custodian & Fund Accountant
State Street Bank and Trust Company
1 Iron Street 5th Floor
Boston, MA 02110
Independent Registered Public Accounting Firm
KPMG LLP
1601 Market Street
Philadelphia, PA 19103
Fund Counsel
Willkie Farr & Gallagher LLP
787 Seventh Avenue
New York, NY 10019
Table of Contents
Aberdeen Asset Management Inc. 1735 Market Street, 32nd Floor Philadelphia, PA 19103 aberdeen-asset.us | |
AOE-0142-AR
Table of Contents

Aberdeen Funds
Fixed Income Series
Annual Report
October 31, 2014
Aberdeen Asia Bond Fund
Aberdeen Core Fixed Income Fund
Aberdeen Emerging Markets Debt Fund
Aberdeen Emerging Markets Debt Local Currency Fund
Aberdeen Global Fixed Income Fund
Aberdeen High Yield Fund
Aberdeen Tax-Free Income Fund
Aberdeen Ultra-Short Duration Bond Fund

Table of Contents
| Page 1 | ||||
| Page 2 | ||||
| Page 3 | ||||
| Page 13 | ||||
| Page 22 | ||||
| Page 30 | ||||
| Page 38 | ||||
| Page 50 | ||||
| Page 58 | ||||
| Page 65 | ||||
| Page 72 | ||||
| Page 104 | ||||
| Page 127 | ||||
| Page 129 | ||||
| Page 130 | ||||
| Page 131 | ||||
| Page 135 | ||||
Investors should carefully consider a fund’s investment objectives, risks, fees, charges and expenses before investing any money. To obtain this and other fund information, please call 866-667-9231 to request a prospectus, or download a prospectus at www.aberdeen-asset.us. Please read it carefully before investing any money.
Investing in mutual funds involves risk, including possible loss of principal.
Aberdeen Funds is distributed by Aberdeen Fund Distributors, LLC, Member FINRA, 1735 Market Street, 32nd Floor, Philadelphia, PA 19103.
Aberdeen Asset Management Inc. (AAMI) has been registered as an investment adviser under the Investment Advisers Act of 1940 since August 23,1995.
Statement Regarding Availability of Quarterly Portfolio Schedule.
The complete schedule of portfolio holdings for each Fund of Aberdeen Funds is included in the Funds’ semi-annual and annual reports to shareholders. Aberdeen Funds also files complete schedules of portfolio holdings for each Fund with the Securities and Exchange Commission (the “Commission”) for the first and third quarters of each fiscal year on Form N-Q. The Funds’ Form N-Q filings are available on the Commission’s website at http://www.sec.gov. The Funds’ Form N-Q filings may be reviewed and copied at the Commission’s Public Reference Room in Washington, DC, and information on the operation of the Public Reference Room may be obtained by calling 800-SEC-0330; and the Funds make the information on Form N-Q available to shareholders on www.aberdeen-asset.us or upon request without charge.
Statement Regarding Availability of Proxy Voting Record.
Information regarding the policies and procedures that the Funds use to determine how to vote proxies relating to portfolio securities is available without charge, upon request, by calling 1-866-667-9231. The information is also included in the Funds’ Statement of Additional Information, which is available on the Funds’ website at www.aberdeen-asset.us and on the Commission’s website at www.sec.gov.
Information relating to how each Fund voted proxies relating to portfolio securities held during the most recent twelve months ended June 30 is available by August 30 of the relevant year: (i) upon request and without charge by calling 1-866-667-9231; and (ii) on the Commission’s website at www.sec.gov.
Table of Contents
October 31, 2014
Dear Valued Shareholder,
Welcome to the Aberdeen Funds Annual Report covering the activities for the twelve-month period ended October 31, 2014.
Market overview
Global equity markets continued to be dominated by concerns over global economic growth levels during the reporting period, lagging their U.S. counterparts. Strong U.S. equity market performance buoyed global markets as deflationary pressures continued to cause headwinds in Europe. Meanwhile, emerging markets finished the period with weak returns as a strong sell-off in September overshadowed gains from earlier in the year. The fixed income universe was volatile over the period, as investment-grade core and total return bond markets delivered modest returns against the backdrop of struggling global equity markets and falling commodity prices. Meanwhile, the global high yield bond market came under significant pressure during the period after yields and spreads made new lows in late June.
Markets continue to brace for more headwinds as we enter 2015 given the environment of slow global growth, a potential U.S. interest rate hike on the horizon and falling oil prices. In the U.S., voters elected eight new Republican senators as the GOP will take control of both houses of Congress in January 2015. The implications of this shift remain unclear, but dramatic legislative moves are likely to be made regarding healthcare and government spending. In emerging markets, the election of pro-business candidate Narendra Modi as the new Prime Minister of India has buoyed the outlook for the world’s 10th-largest economy. In Europe, tensions between Russia and the West continue to hinder Russian markets.
Anne Richards, Aberdeen Asset Management PLC’s (Aberdeen) Global Chief Investment Officer, provides you with a detailed insight on the investment marketplace in the Global Market Review and Outlook on the following page.
Aberdeen developments
As of April 1, 2014, Aberdeen Asset Management PLC completed the acquisition of Scottish Widows Investment Partnership (SWIP) from Lloyds Banking Group in the UK. During the period, the integration of SWIP into the wider Aberdeen group continued to progress. The acquisition combines Aberdeen and SWIP’s strengths across fixed income, real estate, active and quantitative equities, investment solutions and alternatives. The acquisition of SWIP will not have a direct impact on any funds in the Aberdeen Fund family but will significantly add to Aberdeen’s global investment capabilities.
During the period, Aberdeen reached an agreement with the European Tour and the Scottish Government to extend our sponsorship of the Aberdeen Asset Management Scottish Open through 2020.
Aberdeen received several industry awards during the period, including 12 Mutual Fund Education Association (MFEA) STAR Awards for financial communications in both digital and direct marketing categories.
Thank you for choosing Aberdeen Funds. We value your investment with us.
Kind Regards,
Yours sincerely,
/s/ Bev Hendry
Bev Hendry
President
Aberdeen Funds
2014 Annual Report
1
Table of Contents
In our opinion, the performances of the major global equity markets for the 12-month period ended October 31, 2014, might be best described as “all over the map” – literally. There was marked divergence in stock returns among geographical regions. On the surface, it appeared that global equities generally posted respectable gains, with the MSCI World Index, the developed-market benchmark, rising 9.3% (in U.S. dollars) over the period. However, the strength in the markets was concentrated on the western side of the Atlantic Ocean, with the U.S. broader-market S&P 500 Index climbing 17.3%. In contrast, the MSCI World ex US Index was up just 0.2% during the period, dragged down mainly by investors’ concerns about economic growth in Europe and the continued rise in the U.S. dollar against most major global currencies. Both the euro and the Japanese yen declined sharply against the U.S. dollar over the period, with the latter currency experiencing particular weakness. The upturn in the U.S. market was the primary contributor to the outperformance of developed markets versus their emerging counterparts, as measured by the MSCI Emerging Markets Index, which returned 1.0% for the reporting period. The sharp decline in oil prices over the annual period had a mixed effect on the global markets: Importing nations were notable beneficiaries, whereas exporters such as Russia came under pressure as lower oil prices may aggravate revenue shortfalls caused by a raft of Western sanctions.
Unlike many other regions, the U.S. equity market benefited from a generally improving economy over the reporting period. Healthy gross domestic product (GDP) growth in the fourth quarter of 2013 and the second and third quarters of 2014 offset a decline in the first quarter of the year, most likely attributable to bad weather-induced weakness in consumer spending. Additionally, the unemployment rate fell substantially during the period, although the labor participation rate declined to its lowest level in 36 years. Investors remained focused on U.S. monetary policy for much of the period. Former Federal Reserve (Fed) vice chair Janet Yellen succeeded Ben Bernanke as head of the Fed in February 2014. The Fed began to reduce its $85 billion-per-month asset purchase program in $10 billion increments in January 2014, and ended its tapering in late October.
United Kingdom (UK) stocks saw marginal gains while European equities ended the period modestly lower. Economic recovery in the Eurozone1 remains fragile and much slower-paced than in the U.S. and UK. The European labor market has continued to improve, albeit unevenly, as has household confidence; however, inflation expectations are dangerously low for the region. Late in the reporting period, the European Central Bank (ECB) announced that, if required, it would use “unconventional policy instruments” in support of the Eurozone economy. However, there are doubts over the scale and potential effectiveness of such measures. In Japan, the yen’s weakness lifted equity markets overall, but gains were pared because of doubts over the efficacy of Prime Minister Shinzo Abe’s “third arrow” stimulus measures, as well as the impact of the consumption tax hike that was implemented in April 2014.
Within the global emerging equity markets, strong performance in India and, to a lesser extent, China, was counterbalanced by notable weakness in Latin America and Russia. Indian stocks rallied after the business-friendly Bharatiya Janata Party (BJP), headed by Narendra Modi, swept into power as that country’s first single-party majority in 25 years. The Chinese market was bolstered by signs of an upturn in economic growth. Additionally, investors appeared to take a favorable view of a proposed pilot program for mutual market connectivity between Hong Kong and Shanghai, as it was seen as a significant step towards cross-border capital market integration. The program commenced operations shortly after the end of the reporting period in mid-November. In Latin America, Brazilian equities were hampered as investor sentiment soured in reaction to the nation’s bitterly-contested presidential election. Brazil’s incumbent president, Dilma Rousseff, whose policies generally are perceived as unfriendly to business, edged out her opponent, Aecio Neves, to secure a second term. Ongoing geopolitical tensions surrounding Russia’s expanded military presence in Ukraine had a negative impact on the Russian market for the period.
The global bond markets experienced periods of volatility over the reporting period, which increased more significantly in August and October. Concerns over faltering global economic growth, combined with heightened fears of potential deflation in Europe, drove much of the uncertainty. Nonetheless, the global fixed income markets collectively finished in positive territory for the period. Investment-grade bonds outperformed high yield securities, with the Bank of America Merrill Lynch Global Broad Market Corporate Index advancing 6.4% versus the 5.9% return of the Bank of America Merrill Lynch Global High Yield Constrained Index. Emerging markets debt, as measured by the J.P. Morgan EMBI Global Diversified Index, was the strongest-performing segment within the global fixed income universe, climbing 8.6% for the period, as investors focused on the yield differential between emerging and developed markets, rather than the geopolitical tensions between Russia and Ukraine.
Outlook
In our opinion, the global economic and monetary environment remains supportive of equities relative to fixed income and cash. We believe that the end to U.S. quantitative easing in late October, higher interest rates in 2015, and improvement in the U.S. economy could lead to continued strengthening of the U.S. dollar. Our overall view on interest rates is that they will remain low for an extended period. Confidence in the global recovery has improved somewhat, given the pick-up in U.S. economic activity. However, we feel that the picture is less rosy elsewhere in the developed world. The Eurozone continues to suffer from high debt and unemployment. We remain cautious about Japan, as the recovery in household consumption has been slower than expected. However, these conditions have led to unprecedented monetary stimulus in both regions, which we think may potentially create investment opportunities. We believe that prospects for emerging economies also remain mixed, with recent market developments highlighting sensitivities to U.S. monetary policy. At the corporate level, we observe efforts to boost margins through cost-cuts and reorganization, although this has yet to translate into a broader trend of improving profitability.
Anne Richards
Chief Investment Officer
Aberdeen Asset Management
| 1 | The Eurozone comprises 18 European Union member states that have adopted the euro as their common currency. |
Indexes are unmanaged and have been provided for comparison purposes only. No fees or expenses are reflected. You cannot invest directly in an index.
Annual Report 2014
2
Table of Contents
Aberdeen Asia Bond Fund (Unaudited)
The Aberdeen Asia Bond Fund (Class A shares at net asset value net of fees) returned 2.41% for the 12-month period ended October 31, 2014, versus the 2.35% return of its benchmark, the HSBC Asian Local Bond Index, during the same period. For broader comparison, the average return of the Fund’s Lipper peer category of International Income Funds (consisting of 42 funds) was 1.50% for the period.
Asian local currency bond and credit markets posted decent gains, but most regional currencies lost ground as the U.S. dollar strengthened over the reporting period. Monetary policy conditions remained loose, ensuring abundant liquidity, against the backdrop of a tentative global recovery. China’s economy slowed. Japan and the Eurozone1 grappled with deflation risks, but the U.S. recovery gained traction. Consequently, global central bank monetary policy diverged over the period. The U.S. Federal Reserve (Fed) ended its asset purchases, but Japan and Europe took the opposite tack and ramped up quantitative easing (QE) in hopes of reinvigorating growth. Economic data softened across most of Asia, although weak commodity prices led to easing inflation and gave policymakers more room to maneuver. Geopolitical risks increased significantly due to Russia’s incursion into Ukraine as well as the rise of the Islamic State (ISIS) in both Iraq and Syria. There were also concerns over the Ebola outbreak in sub-Saharan Africa.
Asian credit markets, led by high-yield sovereigns, outperformed their local currency bond counterparts over the reporting period. The pipeline of new issues was strong, as companies sought to lock in long-term funding at current interest rate levels. While valuations looked fairly expensive, robust demand reflected the continued chase for yield.
Regarding local currency bond markets, Korea outpaced its regional peers. Yields fell sharply, as the central bank cut interest rates twice to support slowing gross domestic product (GDP) growth. The Korean won faced a more testing time owing to talk of intervention to protect export competitiveness, after the Japanese yen fell sharply following the Bank of Japan’s QE announcement. Thai bonds rose on the back of two rate cuts and a stabilizing political climate, after the ruling military junta consolidated power by naming coup leader Prayuth Chan-ocha as prime minister.
The Chinese bond market was supported by deepening concerns over a sluggish property market, slowing credit growth and weak industrial production. Despite the deceleration of GDP growth from 7.5% to 7.3% in the third quarter, Premier Li Keqiang ruled out any major stimulus and instead emphasized targeted measures in an effort to buttress weaker sectors. Another solid performer was India, where bonds posted gains and the rupee was resilient. Prime Minister Narendra Modi’s landslide election win lifted hopes of the revitalization of a stagnating economy. Reform prospects were further bolstered by election wins in the two key states of Maharashtra and Haryana. Inflation started to ease and the current account deficit narrowed as well.
Conversely, Indonesian bonds and the rupiah (the nation’s currency unit) were the most notable market laggards for the reporting period. While there was initial enthusiasm over the presidential election victory by Joko Widodo, investor sentiment soured following his rough start. Fiscal worries also played a part in dampening sentiment despite indications of potential fuel price hikes that would ease the burden.
Bonds and the peso fell in the Philippines, where the central bank raised benchmark rates amid upbeat economic growth and rising inflation. Malaysian bonds sold off on expectations of rate hikes to fix financial imbalances. The Malaysian ringgit also declined. Markets in Hong Kong and Singapore tracked U.S. Treasury weakness at the short end of the yield curve, while the Singapore dollar was less resilient than its Hong Kong counterpart.
Within the Fund’s Asian local currency bond portfolio, interest rate strategies contributed positively, especially the overweight positions in India, Sri Lanka and China’s onshore market relative to the benchmark HSBC Asian Local Bond Index. Our currency strategy weighed on the Fund’s performance, attributable mainly to positions in the Indian rupee, offshore yuan (Chinese currency which trades outside of the mainland) and the Korean won. In U.S.-dollar denominated Asian credit, the Fund’s underweight to investment-grade industrial bonds and higher-rated quasi-sovereign securities contributed to performance, whereas the underweight to lower-rated quasi-sovereigns detracted from the relative return.
Our use of futures to reduce the Fund’s duration had a negative impact on performance, given the rally in long-term U.S. Treasury yields. The currency forwards also detracted from performance primarily because of the hedges of the Chinese yuan, Indian rupee and Korean won. However, Fund performance benefited from the yen, Singapore dollar and Malaysian ringgit forwards.
Bond futures are used to express interest rate positions, in terms of duration and yield curve exposures. This usage encompasses the hedging of individual physical bond exposures in the Fund, or managing overall duration and yield curve exposure versus the Fund’s benchmark. Bond futures contracts are not used to leverage the Fund in any way.
Overall, the use of derivatives detracted approximately 0.90% from Fund performance, for the year ended October 31, 2014.
In Fund activity during the reporting period, we added to the exposure to China, India, Sri Lanka and Korea, but reduced the country positions elsewhere in Asia. We maintained the Fund’s overall short duration2 stance, although we added duration in the Philippines. Regarding currencies, we increased the exposure to the Indian and Sri Lankan rupees, as well as the yuan. Conversely, we moved the Fund to an underweight position relative to the benchmark in the Thai baht and Philippine peso.
| 1 | The Eurozone comprises the bloc of nations which has adopted the euro as common currency and legal tender. |
| 2 | Duration is an estimate of bond price sensitivity to changes in interest rates. The higher the duration, the greater the change (i.e., high risk) in relation to interest-rate movements. |
2014 Annual Report
3
Table of Contents
Aberdeen Asia Bond Fund (Unaudited) (concluded)
Risk-aversion and volatility accelerated towards the end of the reporting period, given the confluence of risk factors. Consensus expectations are still for the U.S. to begin normalizing interest rates next year, while Europe and Japan embark on an easing path. Complicating the situation is the fragile global outlook – in particular, the stalling Eurozone recovery and geopolitical risks in the Middle East. Across Asia, while conditions have grown more challenging, we think that well-anchored inflation expectations and a conducive policy environment may support bond markets. For some markets, we feel that localized factors may influence sentiment as well. In India and Indonesia, whether the new governments can deliver on much-needed structural reforms remains to be seen, but we think that Prime Minister Modi in India has begun the process admirably. In the currency markets, we expect volatility to remain elevated, as the U.S. begins its policy normalization, while in Asia falling commodity prices are providing support to current account balances (especially in India), and foreign exchange reserves remain ample, in our view.
Portfolio Management:
Aberdeen Asian Fixed Income Team
PAST PERFORMANCE DOES NOT GUARANTEE FUTURE RESULTS.
The performance data quoted represents past performance and current returns may be lower or higher. Class A shares have up to a 4.25% front-end sales charge and a 0.25% 12b-1 fee. The investment return and principal value will fluctuate so that an investor’s shares, when redeemed, may be worth more or less than the original cost. To obtain performance information current to the most recent month-end, which may be higher or lower than the performance shown above, please call 866-667-9231 or go to www.aberdeen-asset.us.
Investing in mutual funds involves risk, including the possible loss of principal.
Indexes are unmanaged and have been provided for comparison purposes only. No fees or expenses are reflected. You cannot invest directly in an index.
Lipper is a leading global provider of mutual fund information and analysis to fund companies, financial intermediaries and media organizations.
Risk Considerations
Concentrating investments in the Asian region subjects the Fund to more volatility and greater risk of loss than geographically diverse mutual funds.
Fixed income securities are subject to certain risks including, but not limited to: interest rate (changes in interest rates may cause a decline in the market value of an investment), credit (changes in the financial condition of the issuer, borrower, counterparty, or underlying collateral), prepayment (debt issuers may repay or refinance their loans or obligations earlier than anticipated), and extension (principal repayments may not occur as quickly as anticipated, causing the expected maturity of a security to increase).
Foreign securities are more volatile, harder to price and less liquid than U.S. securities; and are subject to different accounting and regulatory standards, and political and economic risks. These risks are enhanced in emerging markets countries.
Derivatives are speculative and may hurt the Fund’s performance. They present the risk of disproportionately increased losses and/or reduced gains when the financial asset or measure to which the derivative is linked changes in unexpected ways.
Please read the prospectus for more detailed information regarding these risks.
Annual Report 2014
4
Table of Contents
Aberdeen Asia Bond Fund (Unaudited)
Average Annual Total Return1 (For periods ended October 31, 2014) | 1 Yr. | 5 Yr. | Inception2 | |||||||||||
Class A3 | w/o SC | 2.41% | 4.63% | 4.28% | ||||||||||
| w/SC4 | (1.91% | ) | 3.72% | 3.68% | ||||||||||
Class C3 | w/o SC | 1.66% | 4.23% | 4.01% | ||||||||||
| w/SC5 | 0.69% | 4.23% | 4.01% | |||||||||||
Class R3,6 | w/o SC | 2.14% | 4.47% | 4.17% | ||||||||||
Institutional Service Class6 | w/o SC | 2.54% | 4.60% | 4.25% | ||||||||||
Institutional Class6 | w/o SC | 2.72% | 4.78% | 4.38% | ||||||||||
All figures showing the effect of a sales charge (SC) reflect the maximum charge possible because it has the most significant effect on performance data. The total returns shown above do not include the impact of financial statement rounding of the net asset value per share and/or financial statement adjustments.
| 1 | Returns presented for the Fund for periods prior to July 20, 2009 reflect the performance of the predecessor fund (the “Predecessor Fund”). The Fund and the Predecessor Fund have substantially similar investment objectives and strategies. Please consult the Fund’s prospectus for more detail. |
| 2 | The Fund commenced operations on May 1, 2007. |
| 3 | Returns before the first offering of Class A, Class C and Class R (February 27, 2012) are based on the previous performance of the Institutional Class. The performance of Class A, Class C and Class R is substantially similar to what the Institutional Class would have produced because all classes invest in the same portfolio of securities. Returns for the Class A, Class C and Class R shares would only differ to the extent of the differences in expenses of the classes. |
| 4 | A 4.25% front-end sales charge was deducted. |
| 5 | A 1.00% contingent deferred sales charge (CDSC) was deducted from the one year return because it is charged when Class C shares are sold within the first year after purchase. |
| 6 | Not subject to any sales charges. |
2014 Annual Report
5
Table of Contents
Aberdeen Asia Bond Fund (Unaudited)
Performance of a $10,000 Investment (as October 31, 2014)
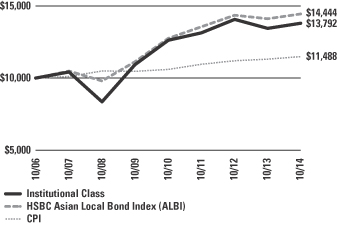
Comparative performance of $10,000 invested in the Institutional Class shares of the Aberdeen Asia Bond Fund, the HSBC Asian Local Bond Index (ALBI) and the Consumer Price Index (CPI) since inception. Unlike the Fund, the returns for these unmanaged indexes do not reflect any fees, expenses, or sales charges. Investors cannot invest directly in market indexes.
The HSBC ALBI is a market capitalization-weighted index that tracks the total return performance of liquid bonds, denominated in local currencies of China, Hong Kong, India, Indonesia, Korea, Malaysia, the Philippines, Singapore, Taiwan, and Thailand. The CPI represents changes in prices of a basket of goods and services purchased for consumption by urban households.
Investment return and principal value will fluctuate, and when redeemed, shares may be worth more or less than original cost. Past performance is no guarantee of future results. The Average Annual Total Return table and Performance graph do not reflect the deduction of taxes that a shareholder would pay on fund distributions or the redemption of fund shares. Investing in mutual funds involves market risk, including loss of principal. Performance returns assume the reinvestment of all distributions. Total returns reflect waivers and reimbursements in effect, without which returns would have been lower.
Portfolio Summary (as a percentage of net assets)
October 31, 2014 (Unaudited)
| Asset Allocation | ||||
Government Bonds | 41.3% | |||
Corporate Bonds | 28.4% | |||
Government Agencies | 13.2% | |||
Repurchase Agreement | 10.9% | |||
Sovereign Agency | 2.2% | |||
Other assets in excess of liabilities | 4.0% | |||
| 100.0% | ||||
The following chart summarizes the composition of the Fund’s portfolio, expressed as a percentage of net assets. The industries listed below may include more than one industry group. As of October 31, 2014, the Fund did not have more than 25% of its assets invested in any industry group.
| Top Industries | ||||
Commercial Banks | 14.4% | |||
Real Estate | 2.3% | |||
Real Estate Management & Development | 2.1% | |||
Electric Utilities | 2.0% | |||
Diversified Financial Services | 1.2% | |||
Oil & Gas Services | 1.0% | |||
Gas Utilities | 0.9% | |||
Diversified Holding Companies | 0.8% | |||
Oil, Gas & Consumable Fuels | 0.7% | |||
Semiconductors | 0.5% | |||
Other | 74.1% | |||
| 100.0% | ||||
| Top Holdings* | ||||
Thailand Government Bond, Series ILB 07/14/2021 | 3.6% | |||
Axis Bank Ltd., Series 21 12/31/2022 | 3.4% | |||
Korea Treasury Bond, Series 1703 03/10/2017 | 2.5% | |||
Korea Treasury Bond, Series 2303 03/10/2023 | 2.3% | |||
Korea Treasury Bond, Series 2106 06/10/2021 | 2.2% | |||
Korea Treasury Bond, Series 2403 03/10/2024 | 2.1% | |||
Malaysia Government Bond, Series 0511 09/28/2018 | 1.9% | |||
Korea Treasury Bond, Series 1803 03/10/2018 | 1.8% | |||
China Development Bank 03/20/2017 | 1.8% | |||
Rural Electrification Corp. Ltd., Series 103 10/19/2016 | 1.8% | |||
Other | 76.6% | |||
| 100.0% | ||||
| Top Countries | ||||
Republic of South Korea | 19.6% | |||
China | 15.4% | |||
India | 12.6% | |||
United States | 10.9% | |||
Indonesia | 9.7% | |||
Malaysia | 7.0% | |||
Thailand | 5.6% | |||
Singapore | 4.8% | |||
Philippines | 4.7% | |||
Hong Kong | 3.8% | |||
Other | 5.9% | |||
| 100.0% | ||||
| * | For the purpose of listing top holdings, repurchase agreements are included as part of Other. |
Annual Report 2014
6
Table of Contents
Statement of Investments
October 31, 2014
Aberdeen Asia Bond Fund
| Shares or Principal Amount | Value (US$) | |||||||
CORPORATE BONDS (28.4%) | ||||||||
CHINA (4.6%) | ||||||||
Food Products (0.2%) | ||||||||
Tingyi Cayman Islands Holding Corp. (USD), 3.88%, 06/20/2017 (a) | $ | 344,000 | $ | 357,619 | ||||
Gas Utilities (0.5%) | ||||||||
ENN Energy Holdings Ltd. (USD), 6.00%, 05/13/2021 (a) | 1,083,000 | 1,210,214 | ||||||
Metals & Mining (0.4%) | ||||||||
China Hongqiao Group Ltd. (USD), 7.63%, 06/26/2017 (a) | 1,000,000 | 1,033,457 | ||||||
Oil & Gas Services (1.0%) | ||||||||
Anton Oilfield Services Group (USD), 7.50%, 11/06/2018 (a) | 670,000 | 666,650 | ||||||
COSL Finance BVI Ltd., 144A (USD), 3.25%, 09/06/2022 (a) | 1,800,000 | 1,714,403 | ||||||
| 2,381,053 | ||||||||
Real Estate (1.5%) | ||||||||
CIFI Holdings Group Co. Ltd. (USD), 12.25%, 04/15/2018 (a) | 800,000 | 900,000 | ||||||
Future Land Development Holdings Ltd. (USD), 10.25%, 07/21/2019 (a) | 549,000 | 538,240 | ||||||
Greenland Hong Kong Holdings Ltd. (USD), 4.75%, 10/18/2016 (a) | 702,000 | 706,422 | ||||||
Trillion Chance Ltd. (USD), 8.50%, 01/10/2019 (a) | 356,000 | 350,436 | ||||||
Wanda Properties Overseas Ltd. (USD), 4.88%, 11/21/2018 (a) | 1,000,000 | 1,015,234 | ||||||
| 3,510,332 | ||||||||
Real Estate Management & Development (0.5%) |
| |||||||
China Overseas Finance Cayman Island II Ltd. (USD), 5.50%, 11/10/2020 (a) | 1,200,000 | 1,288,165 | ||||||
Semiconductors (0.5%) | ||||||||
Semiconductor Manufacturing International Corp. (USD), 4.13%, 10/07/2019 (a) | 1,133,000 | 1,139,815 | ||||||
| 10,920,655 | ||||||||
HONG KONG (3.5%) | ||||||||
Diversified Holding Companies (0.8%) | ||||||||
Hutchison Whampoa International Ltd. | ||||||||
(USD), 1.63%, 10/31/2017 (a) | 720,000 | 718,778 | ||||||
(USD), 7.63%, 04/09/2019 (a) | 200,000 | 243,281 | ||||||
(USD), 4.63%, 01/13/2022 (a) | 500,000 | 537,857 | ||||||
(USD), 7.45%, 11/24/2033 (a) | 300,000 | 426,488 | ||||||
| 1,926,404 | ||||||||
Electrical Components & Equipment (0.5%) | ||||||||
Metropolitan Light International Ltd. (USD), EMTN, 5.25%, 01/17/2018 (a) | 1,100,000 | 1,105,500 | ||||||
Oil, Gas & Consumable Fuels (0.1%) | ||||||||
MIE Holdings Corp. (USD), 7.50%, 04/25/2019 (a) | 219,000 | 214,620 | ||||||
Real Estate (0.1%) | ||||||||
Hong Kong Land Finance Cayman Islands Co. Ltd. (USD), EMTN, 4.50%, 06/01/2022 | $ | 200,000 | $ | 212,330 | ||||
Real Estate Investment Trust (REIT) Funds (0.3%) |
| |||||||
Champion MTN Ltd. (USD), EMTN, 3.75%, 01/17/2023 (a) | 878,000 | 806,850 | ||||||
Real Estate Management & Development (1.6%) |
| |||||||
HLP Finance Ltd. (USD), EMTN, 4.75%, 06/25/2022 (a) | 1,811,000 | 1,855,205 | ||||||
Swire Properties MTN Financing Ltd. | ||||||||
(USD), EMTN, 2.75%, 03/07/2020 (a) | 200,000 | 197,605 | ||||||
(USD), EMTN, 4.38%, 06/18/2022 (a) | 1,800,000 | 1,896,640 | ||||||
| 3,949,450 | ||||||||
Retail (0.1%) | ||||||||
LS Finance 2022 Ltd. (USD), 4.25%, 10/16/2022 (a) | 204,000 | 202,249 | ||||||
| 8,417,403 | ||||||||
INDIA (8.2%) | ||||||||
Commercial Banks (7.0%) | ||||||||
Axis Bank Ltd (USD), 5.13%, 09/05/2017 (a) | 400,000 | 427,380 | ||||||
Axis Bank Ltd., Series 21 (INR), 9.15%, 12/31/2022 | 490,000,000 | 8,098,163 | ||||||
Bank of Baroda | ||||||||
(USD), 5.00%, 08/24/2016 (a) | 550,000 | 576,650 | ||||||
(USD), 4.88%, 07/23/2019 (a) | 200,000 | 211,329 | ||||||
HDFC Bank Ltd. (USD), EMTN, 3.00%, 03/06/2018 (a) | 900,000 | 904,041 | ||||||
ICICI Bank Ltd. | ||||||||
(USD), 4.80%, 05/22/2019 (a) | 735,000 | 780,276 | ||||||
(USD), MTN, 3.50%, 03/18/2020 (a) | 355,000 | 356,181 | ||||||
(INR), 9.15%, 12/31/2022 | 250,000,000 | 4,087,935 | ||||||
(INR), 9.15%, 08/06/2024 | 50,000,000 | 844,552 | ||||||
State Bank of India (USD), 3.62%, 04/17/2019 (a) | 400,000 | 408,302 | ||||||
| 16,694,809 | ||||||||
Diversified Financial Services (1.2%) | ||||||||
Power Finance Corp. Ltd., | 160,000,000 | 2,692,747 | ||||||
| 19,387,556 | ||||||||
INDONESIA (1.7%) | ||||||||
Commercial Banks (1.1%) | ||||||||
Bank OCBC Nisp Tbk PT, Series OB (IDR), 6.90%, 02/19/2015 | 32,000,000,000 | 2,630,699 | ||||||
Electric Utilities (0.6%) | ||||||||
Majapahit Holding BV (USD), 7.88%, 06/29/2037 (a) | 1,200,000 | 1,446,000 | ||||||
| 4,076,699 | ||||||||
See accompanying Notes to Financial Statements.
2014 Annual Report
7
Table of Contents
Statement of Investments (continued)
October 31, 2014
Aberdeen Asia Bond Fund
| Shares or Principal Amount | Value (US$) | |||||||
MALAYSIA (2.0%) | ||||||||
Commercial Banks (1.7%) | ||||||||
AmBank M Bhd (MYR), MTN, 4.95%, 03/25/2015 | $ | 5,000,000 | $ | 1,525,361 | ||||
AMBB Capital (L) Ltd. (USD), 6.77%, 01/27/2016 (b)(c) | 1,000,000 | 1,006,011 | ||||||
Public Bank Bhd (USD), 6.84%, 08/22/2036 (b) | 400,000 | 412,095 | ||||||
SBB Capital Corp. (USD), 6.62%, 11/02/2015 (a)(b)(c) | 1,000,000 | 1,012,468 | ||||||
| 3,955,935 | ||||||||
Oil, Gas & Consumable Fuels (0.3%) | ||||||||
PETRONAS Capital Ltd. (USD), 7.88%, 05/22/2022 (a) | 600,000 | 786,275 | ||||||
| 4,742,210 | ||||||||
NETHERLANDS (0.1%) | ||||||||
Real Estate (0.1%) | ||||||||
Jababeka International BV (USD), 7.50%, 09/24/2019 (a) | 200,000 | 203,676 | ||||||
PHILIPPINES (0.4%) | ||||||||
Diversified Telecommunication Services (0.4%) |
| |||||||
Philippine Long Distance Telephone Co. (USD), EMTN, 8.35%, 03/06/2017 | 800,000 | 917,600 | ||||||
REPUBLIC OF SOUTH KOREA (3.6%) | ||||||||
Commercial Banks (1.8%) | ||||||||
Busan Bank (USD), GMTN, 4.13%, 02/09/2017 (a) | 1,300,000 | 1,363,673 | ||||||
Korea Exchange Bank (USD), 2.50%, 06/12/2019 (a) | 338,000 | 337,841 | ||||||
Shinhan Bank | ||||||||
(USD), 1.88%, 07/30/2018 (a) | 600,000 | 592,330 | ||||||
(USD), 5.66%, 03/02/2035 (a)(b) | 1,300,000 | 1,309,750 | ||||||
Woori Bank Co. Ltd. (USD), 4.75%, 04/30/2024 (a) | 676,000 | 700,558 | ||||||
| 4,304,152 | ||||||||
Electric Utilities (1.4%) | ||||||||
Korea Hydro & Nuclear Power Co. Ltd., 144A (USD), 3.00%, 09/19/2022 (a) | 800,000 | 786,892 | ||||||
Korea Hydro & Nuclear Power Co. Ltd., REG S (USD), 3.00%, 09/19/2022 (a) | 1,200,000 | 1,180,338 | ||||||
Korea South-East Power Co. Ltd. | ||||||||
(USD), 6.00%, 05/25/2016 (a) | 700,000 | 748,489 | ||||||
(USD), EMTN, 3.63%, 01/29/2017 (a) | 450,000 | 468,717 | ||||||
| 3,184,436 | ||||||||
Gas Utilities (0.4%) | ||||||||
Korea Gas Corp. | ||||||||
(USD), 2.25%, 07/25/2017 (a) | 200,000 | 202,272 | ||||||
(USD), 2.88%, 07/29/2018 (a) | 200,000 | 204,152 | ||||||
(USD), 3.50%, 07/02/2026 (a) | 617,000 | 622,883 | ||||||
| 1,029,307 | ||||||||
| 8,517,895 | ||||||||
SINGAPORE (2.2%) | ||||||||
Commercial Banks (1.3%) | ||||||||
Oversea-Chinese Banking Corp. Ltd. | ||||||||
(USD), EMTN, 3.75%, 11/15/2022 (a)(b) | $ | 50,000 | $ | 51,665 | ||||
(USD), 3.15%, 03/11/2023 (a)(b) | 1,300,000 | 1,315,314 | ||||||
United Overseas Bank Ltd. | ||||||||
(USD), EMTN, 2.88%, 10/17/2022 (a)(b) | 1,300,000 | 1,313,390 | ||||||
(USD), EMTN, 3.75%, 09/19/2024 (a)(b) | 353,000 | 356,237 | ||||||
| 3,036,606 | ||||||||
Iron/Steel (0.3%) | ||||||||
ABJA Investment Co. Pte Ltd. (USD), 5.95%, 07/31/2024 (a) | 700,000 | 711,375 | ||||||
Real Estate (0.6%) | ||||||||
CapitaMalls Asia Treasury Ltd. (SGD), EMTN, 3.95%, 08/24/2017 | 1,750,000 | 1,421,945 | ||||||
| 5,169,926 | ||||||||
SRI LANKA (0.2%) | ||||||||
Commercial Banks (0.2%) | ||||||||
Bank of Ceylon (USD), 5.33%, 04/16/2018 (a) | 400,000 | 406,000 | ||||||
THAILAND (1.9%) | ||||||||
Chemicals (0.3%) | ||||||||
PTT Global Chemical PCL, REG S (USD), 4.25%, 09/19/2022 (a) | 829,000 | 846,254 | ||||||
Commercial Banks (1.3%) | ||||||||
Bangkok Bank PCL | ||||||||
(USD), MTN, 5.00%, 10/03/2023 (a) | 400,000 | 441,103 | ||||||
(USD), 9.03%, 03/15/2029 (a) | 50,000 | 69,312 | ||||||
Krung Thai Bank PCL (USD), EMTN, 5.20%, 12/26/2024 (a)(b) | 1,390,000 | 1,434,552 | ||||||
Siam Commercial Bank PCL (USD), MTN, 3.50%, 04/07/2019 (a) | 1,032,000 | 1,057,253 | ||||||
| 3,002,220 | ||||||||
Oil, Gas & Consumable Fuels (0.3%) | ||||||||
PTTEP Canada International Finance Ltd. (USD), EMTN, 5.69%, 04/05/2021 (a) | 700,000 | 794,366 | ||||||
| 4,642,840 | ||||||||
Total Corporate Bonds | 67,402,460 | |||||||
GOVERNMENT BONDS (41.3%) | ||||||||
CHINA (7.9%) | ||||||||
Agriculture Development Bank of China Co., Ltd. (CNH), 3.08%, 01/16/2016 | 5,000,000 | 813,997 | ||||||
China Development Bank | ||||||||
(CNY), 5.80%, 01/03/2016 | 10,000,000 | 1,677,435 | ||||||
(CNH), 3.35%, 03/20/2017 | 26,000,000 | 4,226,104 | ||||||
China Government Bond | ||||||||
Series 1317 (CNY), 3.77%, 08/15/2016 (d) | 1,000,000 | 164,311 | ||||||
Series 2313 (CNY), 3.09%, 05/30/2018 (d) | 10,000,000 | 1,611,411 | ||||||
Series 1216 (CNY), 3.25%, 09/06/2019 (d) | 11,000,000 | 1,769,671 | ||||||
Series 1019 (CNY), 3.41%, 06/24/2020 (d) | 20,000,000 | 3,227,506 | ||||||
Series 1124 (CNY), 3.57%, 11/17/2021 (d) | 22,000,000 | 3,556,933 | ||||||
See accompanying Notes to Financial Statements.
Annual Report 2014
8
Table of Contents
Statement of Investments (continued)
October 31, 2014
Aberdeen Asia Bond Fund
| Shares or Principal Amount | Value (US$) | |||||||
Series 1318 (CNY), 4.08%, 08/22/2023 (d) | $ | 10,000,000 | $ | 1,671,530 | ||||
| 18,718,898 | ||||||||
INDIA (0.7%) | ||||||||
India Government Bond | ||||||||
(INR), 7.28%, 06/03/2019 | 80,000,000 | 1,254,490 | ||||||
(INR), 8.12%, 12/10/2020 | 25,000,000 | 402,477 | ||||||
| 1,656,967 | ||||||||
INDONESIA (5.7%) | ||||||||
Indonesia Government International Bond | ||||||||
(USD), 5.88%, 03/13/2020 (a) | 1,200,000 | 1,342,500 | ||||||
(USD), EMTN, 3.38%, 04/15/2023 (a) | 1,006,000 | 963,245 | ||||||
(USD), 5.25%, 01/17/2042 (a) | 1,000,000 | 1,002,500 | ||||||
(USD), EMTN, 4.63%, 04/15/2043 (a) | 1,800,000 | 1,683,000 | ||||||
Indonesia Treasury Bond | ||||||||
Series FR66 (IDR), 5.25%, 05/15/2018 | 22,400,000,000 | 1,707,331 | ||||||
Series FR54 (IDR), 9.50%, 07/15/2031 | 9,000,000,000 | 809,888 | ||||||
Series FR58 (IDR), 8.25%, 06/15/2032 | 24,800,000,000 | 1,985,498 | ||||||
Series FR68 (IDR), 8.38%, 03/15/2034 | 49,000,000,000 | 4,026,231 | ||||||
| 13,520,193 | ||||||||
MALAYSIA (4.4%) | ||||||||
Malaysia Government Bond | ||||||||
Series 0113 (MYR), 3.17%, 07/15/2016 | 3,550,000 | 1,073,702 | ||||||
Series 0210 (MYR), 4.01%, 09/15/2017 | 2,700,000 | 830,335 | ||||||
Series 0512 (MYR), 3.31%, 10/31/2017 | 12,993,000 | 3,917,362 | ||||||
Series 0511 (MYR), 3.58%, 09/28/2018 | 15,200,000 | 4,616,008 | ||||||
| 10,437,407 | ||||||||
PHILIPPINES (3.2%) | ||||||||
Philippine Government International Bond | ||||||||
(USD), 6.50%, 01/20/2020 | 700,000 | 834,750 | ||||||
Series 1059 (PHP), 4.13%, 08/20/2024 | 170,000,000 | 3,819,395 | ||||||
Series 2020 (PHP), 3.63%, 03/21/2033 | 149,000,000 | 2,907,023 | ||||||
| 7,561,168 | ||||||||
REPUBLIC OF SOUTH KOREA (14.1%) | ||||||||
Korea Treasury Bond | ||||||||
Series 1506 (KRW), 3.25%, 06/10/2015 | 1,400,000,000 | 1,319,127 | ||||||
Series 1703 (KRW), 3.50%, 03/10/2017 | 6,250,000,000 | 6,027,668 | ||||||
Series 1803 (KRW), 2.75%, 03/10/2018 | 4,500,000,000 | 4,284,093 | ||||||
Series 1809 (KRW), 3.25%, 09/10/2018 | 3,600,000,000 | 3,493,825 | ||||||
Series 2106 (KRW), 1.50%, 06/10/2021 (e) | 5,616,993,000 | 5,326,922 | ||||||
Series 2206 (KRW), 3.75%, 06/10/2022 | 900,000,000 | 912,966 | ||||||
Series 2303 (KRW), 3.00%, 03/10/2023 | 5,600,000,000 | 5,404,726 | ||||||
Series 2309 (KRW), 3.38%, 09/10/2023 | 1,700,000,000 | 1,686,963 | ||||||
Series 2403 (KRW), 3.50%, 03/10/2024 | 5,000,000,000 | 5,013,867 | ||||||
| 33,470,157 | ||||||||
SRI LANKA (1.6%) | ||||||||
Sri Lanka Government Bonds | ||||||||
Series A (LKR), 8.50%, 11/01/2015 | 180,000,000 | 1,403,817 | ||||||
Series B (LKR), 8.50%, 07/15/2018 | 273,000,000 | 2,187,590 | ||||||
Series A (LKR), 8.00%, 11/15/2018 | $ | 24,000,000 | $ | 189,536 | ||||
| 3,780,943 | ||||||||
THAILAND (3.7%) | ||||||||
Thailand Government Bond | ||||||||
Series ILB (THB), 1.20%, 07/14/2021 (a)(e) | 295,875,776 | 8,795,187 | ||||||
(THB), 3.63%, 06/16/2023 | 5,000,000 | 159,519 | ||||||
| 8,954,706 | ||||||||
Total Government Bonds | 98,100,439 | |||||||
GOVERNMENT AGENCIES (13.2%) | ||||||||
CHINA (2.9%) | ||||||||
China Railway Resources Huitung Ltd. (USD), 3.85%, 02/05/2023 (a) | 1,101,000 | 1,091,338 | ||||||
CNOOC Finance 2012 Ltd. (USD), 3.88%, 05/02/2022 (a) | 1,230,000 | 1,257,724 | ||||||
CNOOC Finance 2013 Ltd. (USD), 3.00%, 05/09/2023 | 248,000 | 235,250 | ||||||
CRCC Yuxiang Ltd. (USD), 3.50%, 05/16/2023 (a) | 652,000 | 634,150 | ||||||
Export-Import Bank of China | ||||||||
(CNH), 3.25%, 01/17/2021 | 4,000,000 | 652,661 | ||||||
(USD), 3.63%, 07/31/2024 (a) | 469,000 | 471,672 | ||||||
Sinopec Capital 2013 Ltd. (USD), 3.13%, 04/24/2023 (a) | 1,600,000 | 1,527,198 | ||||||
Sinopec Group Overseas Development 2012 Ltd. (USD), 4.88%, 05/17/2042 (a) | 200,000 | 211,864 | ||||||
Sinopec Group Overseas Development 2013 Ltd. (USD), 4.38%, 10/17/2023 (a) | 400,000 | 417,808 | ||||||
Sinopec Group Overseas Development 2014 Ltd. (USD), 4.38%, 04/10/2024 (a) | 303,000 | 316,451 | ||||||
| 6,816,116 | ||||||||
HONG KONG (0.3%) | ||||||||
CNPC General Capital Ltd. | ||||||||
(USD), 2.75%, 05/14/2019 (a) | 200,000 | 199,706 | ||||||
(USD), 3.40%, 04/16/2023 (a) | 518,000 | 503,143 | ||||||
| 702,849 | ||||||||
INDIA (3.7%) | ||||||||
NTPC Ltd. (USD), EMTN, 5.63%, 07/14/2021 (a) | 1,000,000 | 1,089,455 | ||||||
Power Grid Corp. of India Ltd., Series 37B (INR), 9.25%, 12/26/2016 | 216,250,000 | 3,475,659 | ||||||
Rural Electrification Corp. Ltd., Series 103 (INR), 9.35%, 10/19/2016 | 258,000,000 | 4,202,862 | ||||||
| 8,767,976 | ||||||||
INDONESIA (0.9%) | ||||||||
Indonesia Government Bond, Perusahaan Penerbit SBSN (USD), 4.35%, 09/10/2024 (a) | 312,000 | 312,780 | ||||||
Pertamina Persero PT (USD), MTN, 4.30%, 05/20/2023 (a) | 900,000 | 875,250 | ||||||
Perusahaan Listrik Negara PT, 144A (USD), EMTN, 5.25%, 10/24/2042 (a) | 400,000 | 362,000 | ||||||
See accompanying Notes to Financial Statements.
2014 Annual Report
9
Table of Contents
Statement of Investments (continued)
October 31, 2014
Aberdeen Asia Bond Fund
| Shares or Principal Amount | Value (US$) | |||||||
Perusahaan Listrik Negara PT, REG S (USD), EMTN, 5.25%, 10/24/2042 (a) | $ | 731,000 | $ | 661,555 | ||||
| 2,211,585 | ||||||||
MALAYSIA (0.6%) | ||||||||
Bank Pembangunan Malaysia Bhd MTN (MYR), 4.15%, 04/10/2015 | 5,000,000 | 1,524,512 | ||||||
PHILIPPINES (1.1%) | ||||||||
Power Sector Assets & Liabilities Management Corp. | ||||||||
(USD), 7.25%, 05/27/2019 (a)(f) | 1,000,000 | 1,190,000 | ||||||
(USD), 7.39%, 12/02/2024 (a) | 1,080,000 | 1,404,000 | ||||||
| 2,594,000 | ||||||||
REPUBLIC OF SOUTH KOREA (1.1%) | ||||||||
Export-Import Bank of Korea (USD), 4.00%, 01/11/2017 | 50,000 | 52,690 | ||||||
Korea Expressway Corp. | ||||||||
(USD), EMTN, 4.50%, 03/23/2015 (a) | 1,350,000 | 1,368,988 | ||||||
(USD), 1.88%, 10/22/2017 (a) | 250,000 | 249,854 | ||||||
Korea Land & Housing Corp. (USD), 1.88%, 08/02/2017 (a) | 500,000 | 501,635 | ||||||
Minera y Metalergica del Boleo SA de CV (Korea Resources Corp.) (USD), 2.88%, 05/07/2019 (a) | 561,000 | 570,178 | ||||||
| 2,743,345 | ||||||||
SINGAPORE (2.6%) | ||||||||
Housing & Development Board | ||||||||
(SGD), MTN, 2.02%, 02/22/2016 | 3,000,000 | 2,367,854 | ||||||
(SGD), MTN, 1.83%, 11/21/2018 (a) | 2,750,000 | 2,124,236 | ||||||
(SGD), MTN, 3.14%, 03/18/2021 | 2,000,000 | 1,612,347 | ||||||
| 6,104,437 | ||||||||
Total Government Agencies | 31,464,820 | |||||||
SOVEREIGN AGENCY (2.2%) | ||||||||
INDONESIA (1.4%) | ||||||||
Indonesia Government Bonds, Barclays Bank PLC Credit-Linked Notes (IDR), EMTN, 9.50%, 06/17/2015 | 41,000,000,000 | 3,441,829 | ||||||
REPUBLIC OF SOUTH KOREA (0.8%) | ||||||||
Korea Monetary Stabilization Bond, Series 1506 (KRW), 2.76%, 06/02/2015 | 2,000,000,000 | 1,878,946 | ||||||
Total Sovereign Agency | 5,320,775 | |||||||
REPURCHASE AGREEMENT (10.9%) | ||||||||
UNITED STATES (10.9%) | ||||||||
Repurchase Agreement, Fixed Income Clearing Corp., 0.00%, dated 10/31/2014, due 11/03/2014, repurchase price $26,031,771, collateralized by U.S. Treasury Note, maturing 05/31/2021; total market value of $26,552,663 | $ | 26,031,771 | $ | 26,031,771 | ||||
Total Repurchase Agreement | 26,031,771 | |||||||
Total Investments | 228,320,265 | |||||||
Other assets in excess of liabilities—4.0% |
| 9,477,485 | ||||||
Net Assets—100.0% | $ | 237,797,750 | ||||||
| (a) | Denotes a security issued under Regulation S or Rule 144A. |
| (b) | Variable or Floating Rate Security. Rate disclosed is as of October 31, 2014. |
| (c) | Perpetual bond. This is a bond that has no maturity date, is redeemable and pays a steady stream of interest indefinitely. |
| (d) | China A shares. These shares are issued in local currency, traded in the local stock markets and are held through a qualified foreign institutional investor license. |
| (e) | Inflation linked security. |
| (f) | This security is government guaranteed. |
| (g) | See Notes to Financial Statements for tax unrealized appreciation/depreciation of securities. |
| CNH | Chinese Yuan Renminbi Offshore |
| CNY | Chinese Yuan Renminbi |
| EMTN | Euro Medium Term Note |
| EUR | Euro Currency |
| GMTN | Global Medium Term Note |
| IDR | Indonesian Rupiah |
| INR | Indian Rupee |
| JPY | Japanese Yen |
| KRW | South Korean Won |
| LKR | Sri Lanka Rupee |
| MTN | Medium Term Note |
| MYR | Malaysian Ringgit |
| PHP | Philippine Peso |
| REIT | Real Estate Investment Trust |
| SGD | Singapore Dollar |
| THB | Thai Baht |
| USD | U.S. Dollar |
See accompanying Notes to Financial Statements.
Annual Report 2014
10
Table of Contents
Statement of Investments (continued)
October 31, 2014
Aberdeen Asia Bond Fund
At October 31, 2014, the Fund held the following futures contracts:
| Futures Contracts | Counterparty | Number of Contracts Long (Short) | Expiration Date | Unrealized Appreciation/ (Depreciation) | ||||||||||
United States Treasury Note 6%-2 year | UBS | 8 | 12/31/2014 | $ | (902 | ) | ||||||||
United States Treasury Note 6%-5 year | UBS | 23 | 12/31/2014 | (5,628 | ) | |||||||||
United States Treasury Note 6%-10 year | UBS | (301 | ) | 12/19/2014 | (80,765 | ) | ||||||||
United States Treasury Bond 6%-30 year | UBS | 12 | 12/19/2014 | 1,234 | ||||||||||
| $ | (86,061 | ) | ||||||||||||
At October 31, 2014, the Fund’s open forward foreign currency exchange contracts were as follows:
| Purchase Contracts Settlement Date* | Counterparty | Amount Purchased | Amount Sold | Fair Value | Unrealized Appreciation/ (Depreciation) | |||||||||||||||||||||
| Chinese Yuan Renminbi/United States Dollar | ||||||||||||||||||||||||||
03/10/2015 | Credit Suisse | CNY | 43,491,000 | USD | 7,000,000 | $ | 7,045,078 | $ | 45,078 | |||||||||||||||||
03/10/2015 | Deutsche Bank | CNY | 112,538,500 | USD | 18,200,000 | 18,230,036 | 30,036 | |||||||||||||||||||
07/14/2015 | UBS | CNY | 55,300,150 | USD | 8,900,000 | 8,889,898 | (10,102 | ) | ||||||||||||||||||
| Chinese Yuan Renminbi Offshore/United States Dollar | ||||||||||||||||||||||||||
07/14/2015 | Goldman Sachs | CNH | 42,364,000 | USD | 6,800,000 | 6,791,065 | (8,935 | ) | ||||||||||||||||||
07/14/2015 | State Street | CNH | 51,070,500 | USD | 8,100,000 | 8,186,741 | 86,741 | |||||||||||||||||||
| Indonesian Rupiah/United States Dollar | ||||||||||||||||||||||||||
11/14/2014 | UBS | IDR | 86,490,090,000 | USD | 7,030,000 | 7,145,579 | 115,579 | |||||||||||||||||||
| Malaysian Ringgit/United States Dollar | ||||||||||||||||||||||||||
12/04/2014 | Credit Suisse | MYR | 34,524,000 | USD | 10,500,000 | 10,472,767 | (27,233 | ) | ||||||||||||||||||
12/04/2014 | Goldman Sachs | MYR | 12,838,774 | USD | 4,030,000 | 3,894,609 | (135,391 | ) | ||||||||||||||||||
12/04/2014 | Standard Chartered Bank | MYR | 6,591,000 | USD | 2,000,000 | 1,999,363 | (637 | ) | ||||||||||||||||||
| Philippine Peso/United States Dollar | ||||||||||||||||||||||||||
11/10/2014 | Goldman Sachs | PHP | 478,231,220 | USD | 10,930,000 | 10,654,581 | (275,419 | ) | ||||||||||||||||||
| Singapore Dollar/United States Dollar | ||||||||||||||||||||||||||
12/15/2014 | Credit Suisse | SGD | 3,960,755 | USD | 3,100,000 | 3,082,540 | (17,460 | ) | ||||||||||||||||||
12/15/2014 | Goldman Sachs | SGD | 27,090,008 | USD | 21,295,000 | 21,083,359 | (211,641 | ) | ||||||||||||||||||
| South Korean Won/United States Dollar | ||||||||||||||||||||||||||
12/05/2014 | Deutsche Bank | KRW | 4,536,070,000 | USD | 4,300,000 | 4,243,134 | (56,867 | ) | ||||||||||||||||||
12/05/2014 | Standard Chartered Bank | KRW | 1,602,000,000 | USD | 1,500,000 | 1,498,544 | (1,456 | ) | ||||||||||||||||||
12/05/2014 | State Street | KRW | 14,837,125,000 | USD | 14,500,000 | 13,878,953 | (621,048 | ) | ||||||||||||||||||
| Thai Baht/United States Dollar | ||||||||||||||||||||||||||
| 11/14/2014 | Goldman Sachs | THB | 242,879,840 | USD | 7,520,000 | 7,451,155 | (68,845 | ) | ||||||||||||||||||
| $ | 134,547,402 | $ | (1,157,600 | ) | ||||||||||||||||||||||
| * | Certain contracts with different trade dates and like characteristics have been shown net. |
See accompanying Notes to Financial Statements.
2014 Annual Report
11
Table of Contents
Statement of Investments (concluded)
October 31, 2014
Aberdeen Asia Bond Fund
| Sale Contracts Settlement Date* | Counterparty | Amount Purchased | Amount Sold | Fair Value | Unrealized Appreciation/ (Depreciation) | |||||||||||||||||||||
| United States Dollar/Chinese Yuan Renminbi | ||||||||||||||||||||||||||
03/10/2015 | Goldman Sachs | USD | 2,100,000 | CNY | 13,074,600 | $ | 2,117,946 | $ | (17,946 | ) | ||||||||||||||||
03/10/2015 | HSBC | USD | 410,000 | CNY | 2,565,370 | 415,563 | (5,563 | ) | ||||||||||||||||||
03/10/2015 | Standard Chartered Bank | USD | 5,700,000 | CNY | 35,202,060 | 5,702,358 | (2,358 | ) | ||||||||||||||||||
07/14/2015 | Deutsche Bank | USD | 8,800,000 | CNY | 55,008,800 | 8,843,061 | (43,061 | ) | ||||||||||||||||||
| United States Dollar/Chinese Yuan Renminbi Offshore | ||||||||||||||||||||||||||
07/14/2015 | State Street | USD | 11,700,000 | CNH | 73,108,460 | 11,719,486 | (19,486 | ) | ||||||||||||||||||
| United States Dollar/Euro | ||||||||||||||||||||||||||
01/16/2015 | Royal Bank of Canada | USD | 10,400,000 | EUR | 8,087,828 | 10,140,055 | 259,945 | |||||||||||||||||||
| United States Dollar/Japanese Yen | ||||||||||||||||||||||||||
01/16/2015 | Credit Suisse | USD | 5,200,000 | JPY | 564,450,640 | 5,029,770 | 170,230 | |||||||||||||||||||
01/16/2015 | UBS | USD | 10,200,000 | JPY | 1,103,924,890 | 9,836,978 | 363,022 | |||||||||||||||||||
| United States Dollar/Malaysian Ringgit | ||||||||||||||||||||||||||
12/04/2014 | Goldman Sachs | USD | 5,220,000 | MYR | 16,629,876 | 5,044,630 | 175,370 | |||||||||||||||||||
| United States Dollar/Philippine Peso | ||||||||||||||||||||||||||
11/10/2014 | Deutsche Bank | USD | 2,800,000 | PHP | 125,482,000 | 2,795,631 | 4,369 | |||||||||||||||||||
11/10/2014 | Goldman Sachs | USD | 3,200,000 | PHP | 143,616,000 | 3,199,641 | 359 | |||||||||||||||||||
11/10/2014 | State Street | USD | 1,500,000 | PHP | 66,105,000 | 1,472,763 | 27,237 | |||||||||||||||||||
| United States Dollar/Singapore Dollar | ||||||||||||||||||||||||||
12/15/2014 | Goldman Sachs | USD | 1,400,000 | SGD | 1,780,891 | 1,386,015 | 13,985 | |||||||||||||||||||
12/15/2014 | State Street | USD | 4,500,000 | SGD | 5,728,343 | 4,458,201 | 41,799 | |||||||||||||||||||
| United States Dollar/South Korean Won | ||||||||||||||||||||||||||
12/05/2014 | State Street | USD | 9,650,000 | KRW | 9,874,362,500 | 9,236,682 | 413,318 | |||||||||||||||||||
| United States Dollar/Thai Baht | ||||||||||||||||||||||||||
11/14/2014 | Goldman Sachs | USD | 610,000 | THB | 19,637,120 | 602,435 | 7,565 | |||||||||||||||||||
| 11/14/2014 | UBS | USD | 5,200,000 | THB | 168,116,000 | 5,157,523 | 42,477 | |||||||||||||||||||
| $ | 87,158,738 | $ | 1,431,262 | |||||||||||||||||||||||
| * | Certain contracts with different trade dates and like characteristics have been shown net. |
See accompanying Notes to Financial Statements.
Annual Report 2014
12
Table of Contents
Aberdeen Core Fixed Income Fund (Unaudited)
The Aberdeen Core Fixed Income Fund (Class A shares at net asset value net of fees) returned 4.36% for the 12-month period ended October 31, 2014, versus the 4.14% return of its benchmark, the Barclays U.S. Aggregate Bond Index, for the same period. For broader comparison, the average return of the Fund’s Lipper peer category of Core Bond Funds (consisting of 164 funds) was 4.12% for the period.
The U.S. investment-grade fixed income market, as represented by the Barclays U.S. Aggregate Bond Index, gained 4.14% for the 12-month period ended October 31, 2014. The beginning of the review period was marked by volatility amid speculation concerning the U.S. Federal Reserve’s (Fed) possible tapering of monetary policy easing and the change in command at the central bank, as former Fed Vice Chair Janet Yellen succeeded Ben Bernanke as Fed chair in February. The Fed began to reduce its $85 billion-per-month purchases of government and mortgage-backed securities in $10 billion increments ($5 billion for each asset class) in January 2014, and ended its tapering in late October. Interest rates generally tracked investor expectations concerning the central bank’s tapering of its quantitative easing program. Yields rose sharply in December 2013, shortly before the Fed embarked on the tapering of its asset purchase program, only to reverse direction the following month as a harsh winter blanketed the U.S., leading to a dramatic slowdown in economic activity. In March 2014, rates again moved higher as hawkish Fed statements, exhibited by an upward drift in its future rate projections, led investors to bring forward their interest-rate tightening expectations.
In our view, the gyrations in the U.S. Treasury yield curve over the last month of the reporting period in October 2014, might be viewed as a microcosm of the volatility over the 12-month period. Investors had to grasp with continued weakness in Eurozone1 and Chinese growth, the Ebola epidemic, and, earlier in the month, a sharp correction in equity prices. Additionally, the Japanese yen weakened sharply at the end of October, depreciating about 3% in one day, bringing the decline to almost 11% since July 31, 2014. New York Mercantile Exchange (NYMEX) crude oil dropped over $10 a barrel over the month of October and also hit a new five-year low. The price of crude fell nearly 21% over the last four months of the reporting period. The combination of increased supply from the U.S. and global growth concerns has put significant downward pressure on oil and many other commodity prices. Three-, five- and ten-year Treasury yields dipped 34, 41 and 37 basis points (bps)–or 0.34%, 0.41% and 0.37%–respectively, through October 15. However, more than half of the declines erased over the remainder of the month following improving economic data reports and a more hawkish-than-expected statement from the Federal Open Market Committee (FOMC). Ultimately, over the reporting period, the short-term segment of the U.S. Treasury yield curve was virtually flat. There was a dichotomy, however, in performance between the intermediate- and long-term portions of the yield curve. For example, the yield on the five-year Treasury note increased by 31 bps over the period, while the ten-year Treasury yield moved 22 bps lower.
Fund performance for the period was bolstered mainly by security selection in the corporate and non-agency mortgage-backed securities (MBS) sectors. Non-agency MBS also contributed to the Fund’s performance relative to its benchmark.
Conversely, the Fund’s exposure to government-related securities and an overweight relative to its benchmark in the short-term segment of U.S. Treasury yield curve produced negative results over the period.
Regarding the use of derivatives, the Fund employed U.S. Treasury futures as hedges against interest-rate risk during the period, which had a slightly positive impact on performance over the period.
During the period, we reduced the Fund’s exposure to all of the structured products sectors, including MBS, asset-backed securities (ABS) and commercial mortgage-backed securities (CMBS) as well as corporate and taxable municipal securities. Within the corporate sector, we decreased the exposure to all segments. In the MBS portion of the Fund, we trimmed holdings in pass-throughs2 in favor of collateralized mortgage obligations (CMOs). Despite the allocation shifts, at the end of the reporting period, the Fund remained overweight relative to the benchmark in corporate and taxable municipal securities, and in all but one spread sector – MBS, in which there was a notable underweight in U.S. Treasury and government-related securities. The Fund’s largest absolute positions at the end of the period were in U.S. Treasury securities, MBS and corporate bonds.
Despite the fact that the U.S. seems to be on an improving trajectory, the rest of the world is moving in a very different direction, in our opinion. We think that the U.S. is still facing some of the headwinds from the global financial crisis, which have dissipated somewhat but are still lurking in the background. It now appears that some of those headwinds may have been replaced by forces outside of the U.S. Fortunately, the U.S. economy is dependent on the U.S. consumer and relies less on foreign markets (through exports) compared to many of our developed and developing market counterparts. We believe, the uncertainty stems from how the U.S. economy and the Fed handle the impact of the rising U.S. dollar.
Portfolio Management:
Aberdeen North American Fixed Income Team
PAST PERFORMANCE DOES NOT GUARANTEE FUTURE RESULTS.
The performance data quoted represents past performance and current returns may be lower or higher. Class A Shares have up to a 4.25% front-end sales charge and a 0.25% 12b-1 fee. The investment return and principal value will fluctuate so that an investor’s shares, when redeemed, may be worth more or less than the original cost. To obtain performance information current to the most recent month-end, which may be higher or lower than the performance shown above, please call 866-667-9231 or go to www.aberdeen-asset.us.
Investing in mutual funds involves risk, including the possible loss of principal.
Indexes are unmanaged and have been provided for comparison purposes only. No fees or expenses are reflected. You cannot invest directly in an index.
Lipper is a leading global provider of mutual fund information and analysis to fund companies, financial intermediaries and media organizations.
| 1 | The Eurozone comprises the bloc of nations which has adopted the euro as common currency and legal tender. |
| 2 | A pass-through is a security consisting of a pool of residential mortgage loans. All payments of principal and interest are “passed through” to investors each month. |
2014 Annual Report
13
Table of Contents
Aberdeen Core Fixed Income Fund (Unaudited) (concluded)
Risk Considerations
Fixed income securities are subject to certain risks including, but not limited to: interest rate (changes in interest rates may cause a decline in the market value of an investment), credit (changes in the financial condition of the issuer, borrower, counterparty, or underlying collateral), prepayment (debt issuers may repay or refinance their loans or obligations earlier than anticipated), and extension (principal repayments may not occur as quickly as anticipated, causing the expected maturity of a security to increase).
Derivatives are speculative and may hurt the Fund’s performance. They present the risk of disproportionately increased losses and/or reduced gains when the financial asset or measure to which the derivative is linked changes in unexpected ways.
Please read the prospectus for more detailed information regarding these risks.
Annual Report 2014
14
Table of Contents
Aberdeen Core Fixed Income Fund (Unaudited)
Average Annual Total Return1 (For periods ended October 31, 2014) | 1 Yr. | 5 Yr. | 10 Yr. | |||||||||||
Class A | w/o SC | 4.36% | 4.36% | 4.24% | ||||||||||
| w/SC2 | (0.04% | ) | 3.45% | 3.79% | ||||||||||
Class C | w/o SC | 3.61% | 3.61% | 3.48% | ||||||||||
| w/SC3 | 2.61% | 3.61% | 3.48% | |||||||||||
Institutional Service Class4,5 | w/o SC | 4.81% | 4.68% | 4.51% | ||||||||||
Institutional Class4,6 | w/o SC | 4.62% | 4.62% | 4.48% | ||||||||||
All figures showing the effect of a sales charge (SC) reflect the maximum charge possible because it has the most significant effect on performance data. The total returns shown above do not include the impact of financial statement rounding of the net asset value per share and/or financial statement adjustments.
| 1 | Returns prior to July 12, 2010 reflect the performance of a predecessor fund (“the Predecessor Fund”). The Fund and the Predecessor Fund have substantially similar investment objectives and strategies. Please consult the Fund’s prospectus for more detail. |
| 2 | A 4.25% front-end sales charge was deducted. |
| 3 | A 1.00% contingent deferred sales charge (CDSC) was deducted from the one year return because it is charged when Class C shares are sold within the first year after purchase. |
| 4 | Not subject to any sales charges. |
| 5 | Returns before the first offering of the Institutional Service Class Shares (July 12, 2010) are based on the performance of the Class Y shares of the Predecessor Fund. The performance is substantially similar to what Institutional Service Class Shares would have produced because both classes invest in the same portfolio of securities. Returns for the Institutional Service Class shares would only differ to the extent of the differences in expenses of the two classes. |
| 6 | Returns before the first offering of the Institutional Class Shares (July 12, 2010) are based on the performance of Class Y shares of the Predecessor Fund. The performance is substantially similar to what Institutional Class Shares would have produced because both classes invest in the same portfolio of securities. Returns for the Institutional Class shares would only differ to the extent of the differences in expenses of the two classes. |
2014 Annual Report
15
Table of Contents
Aberdeen Core Fixed Income Fund (Unaudited)
Performance of a $10,000 Investment (as of October 31, 2014)
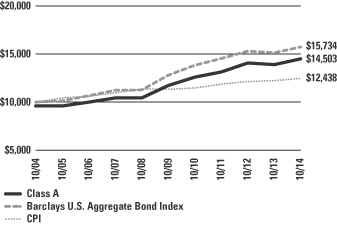
Comparative performance of $10,000 invested in Class A shares of the Aberdeen Core Fixed Income Fund, Barclays U.S. Aggregate Bond Index and the Consumer Price Index (CPI) over a 10-year period ended October 31, 2014. Unlike the Fund, the returns for these unmanaged indexes do not reflect any fees, expenses or sales charges. Investors cannot invest directly in market indexes.
The Barclays U.S. Aggregate Bond Index is a market value-weighted performance benchmark for investment-grade fixed-rate debt issues, including government, corporate, asset-backed and mortgage-backed securities with maturities of at least one year.
The CPI represents changes in prices of a basket of goods and services purchased for consumption by urban households.
Investment return and principal value will fluctuate, and when redeemed, shares may be worth more or less than original cost. Past performance is no guarantee of future results. The Average Annual Total Return table and Performance graph do not reflect the deduction of taxes that a shareholder would pay on fund distributions or the redemption of fund shares. Investing in mutual funds involves market risk, including loss of principal. Performance returns assume the reinvestment of all distributions. Total returns reflect waivers and reimbursements in effect, without which returns would have been lower.
Portfolio Summary
October 31, 2014 (Unaudited)
| Asset Allocation | ||||
U.S. Treasuries | 31.7% | |||
Corporate Bonds | 24.2% | |||
Residential Mortgage Backed Securities | 21.9% | |||
Commercial Mortgage-Backed Securities | 13.4% | |||
Asset-Backed Securities | 5.6% | |||
Municipal Bonds | 1.9% | |||
Repurchase Agreement | 1.7% | |||
Liabilities in excess of other assets | (0.4)% | |||
| 100.0% | ||||
The following chart summarizes the composition of the Fund’s portfolio, expressed as a percentage of net assets. The industries listed below may include more than one industry group. As of October 31, 2014, the Fund did not have more than 25% of its assets invested in any industry group.
| Top Industries | ||||
Commercial Banks | 6.6% | |||
Electric Utilities | 2.5% | |||
Diversified Telecommunication Services | 2.3% | |||
Diversified Financial Services | 1.8% | |||
Energy Equipment & Services | 1.5% | |||
Oil, Gas & Consumable Fuels | 1.4% | |||
Insurance | 1.2% | |||
Media | 1.1% | |||
Food Products | 0.8% | |||
Electronics | 0.6% | |||
Other | 80.2% | |||
| 100.0% | ||||
| Top Holdings* | ||||
U.S. Treasury Notes 09/30/2016 | 11.9% | |||
U.S. Treasury Notes 09/30/2019 | 8.1% | |||
U.S. Treasury Notes 09/30/2021 | 6.1% | |||
U.S. Treasury Bonds 05/15/2044 | 4.5% | |||
Compass Bank 09/29/2017 | 2.1% | |||
Commercial Mortgage Pass Through Certificates, Series 2006-C7, Class AM 06/10/2046 | 1.4% | |||
U.S. Treasury Notes 08/15/2024 | 1.1% | |||
Crown Castle Towers LLC 01/15/2040 | 1.0% | |||
Western Power Distribution Holdings Ltd. 12/15/2017 | 0.9% | |||
Royal Bank of Scotland Group PLC 05/28/2024 | 0.9% | |||
Other | 62.0% | |||
| 100.0% | ||||
| * | For the purpose of listing top holdings, repurchase agreements are included as part of Other. |
Annual Report 2014
16
Table of Contents
Statement of Investments
October 31, 2014
Aberdeen Core Fixed Income Fund
| Shares or Principal Amount | Value (US$) | |||||||
ASSET-BACKED SECURITIES (5.6%) | ||||||||
AUSTRALIA (0.3%) | ||||||||
SMART Trust, Series 2012-4US, Class A4A (USD), 1.25%, 08/14/2018 | $ | 35,000 | $ | 34,956 | ||||
UNITED STATES (5.3%) | ||||||||
Applebee’s/IHOP Funding LLC, Series 2014-1, Class A2 (USD), 4.28%, 09/05/2044 (a) | 50,000 | 49,823 | ||||||
Capital One Multi-Asset Execution Trust, Series 2004-B3, Class B3 (USD), 0.88%, 01/18/2022 (b) | 30,000 | 30,039 | ||||||
Citibank Credit Card Issuance Trust, Series 2014-A5, Class A5 (USD), 2.68%, 06/07/2023 | 100,000 | 100,820 | ||||||
CPS Auto Trust, Series 2011-A, Class A (USD), 2.82%, 04/16/2018 (a) | 12,664 | 12,737 | ||||||
Dominos Pizza Master Issuer LLC, Series 2012-1A, Class A2 (USD), 5.22%, 01/25/2042 (a) | 55,076 | 58,134 | ||||||
Ford Credit Floorplan Master Owner Trust, Series 2013-3, Class C (USD), 1.29%, 06/15/2017 | 40,000 | 40,138 | ||||||
GE Capital Credit Card Master Note Trust, Series 2011-2, Class B (USD), 1.15%, 05/15/2019 (b) | 100,000 | 100,424 | ||||||
Mid-State Trust, Series 2010-1, Class M (USD), 5.25%, 12/15/2045 (a) | 75,280 | 78,017 | ||||||
Santander Drive Auto Receivables Trust, Series 2012-2, Class C (USD), 3.20%, 02/15/2018 | 39,000 | 39,608 | ||||||
SBA Tower Trust, Series 2014-2A, Class C (USD), 3.87%, 10/15/2049 (a) | 35,000 | 35,051 | ||||||
World Financial Network Credit Card Master Trust, Series 2013-A, Class A (USD), 1.61%, 12/15/2021 | 100,000 | 99,589 | ||||||
| 644,380 | ||||||||
Total Asset-Backed Securities | 679,336 | |||||||
COMMERCIAL MORTGAGE-BACKED SECURITIES (13.4%) |
| |||||||
UNITED STATES (13.4%) | ||||||||
Alternative Loan Trust, Series 2003-20CB, Class 2A1 (USD), 5.75%, 10/25/2033 | 27,746 | 28,635 | ||||||
Bear Stearns Commercial Mortgage Securities, Series 2007-PW17, Class AM (USD), 5.89%, 06/11/2050 (b) | 35,000 | 38,600 | ||||||
Citigroup Commercial Mortgage Trust | 35,000 | 37,604 | ||||||
Series 2007-C6, Class AM (USD), 5.71%, 12/10/2049 (b) | 45,000 | 48,494 | ||||||
Citigroup Mortgage Loan Trust, Series 2014-A, Class A (USD), 4.00%, 01/25/2035 (a)(b) | 80,501 | 83,754 | ||||||
Commercial Mortgage Pass Through Certificates | ||||||||
Series 2006-C7, Class AM (USD), 5.78%, 06/10/2046 (b) | 160,000 | 170,401 | ||||||
Series 2014-LC17, Class B (USD), 4.49%, 10/10/2047 (b) | 55,000 | 57,449 | ||||||
Series 2014-CR20, Class AM (USD), 3.94%, 11/10/2047 | 22,000 | 22,459 | ||||||
Credit Suisse First Boston Mortgage Securities Corp. | ||||||||
Series 2003-27, Class 4A4 (USD), 5.75%, 11/25/2033 | 23,310 | 24,507 | ||||||
Series 2005-5, Class 3A2 (USD), 0.45%, 07/25/2035 (b) | $ | 22,417 | $ | 20,875 | ||||
Extended Stay America Trust, Series 2013-ESH7, Class C7 (USD), 3.90%, 12/05/2031 (a) | 100,000 | 100,656 | ||||||
Federal Home Loan Mortgage Association, Series 4363 (USD), 4.00%, 05/15/2033 | 44,479 | 47,994 | ||||||
Federal National Mortgage Association | ||||||||
Series 2014-C02, Class 1M1 (USD), 1.10%, 05/25/2024 (b) | 34,063 | 33,503 | ||||||
Series 2014-C02, Class 2M1 (USD), 1.10%, 05/25/2024 (b) | 33,300 | 32,779 | ||||||
Series 2014-C03, Class 2M1 (USD), 1.35%, 07/25/2024 (b) | 40,419 | 39,960 | ||||||
FREMF Mortgage Trust | ||||||||
Series 2012-K501, Class B (USD), 3.48%, 11/25/2046 (a)(b) | 34,000 | 34,933 | ||||||
Series 2011-K11, Class B (USD), 4.42%, 12/25/2048 (a)(b) | 23,000 | 24,446 | ||||||
Series 2011-K10, Class B (USD), 4.62%, 11/25/2049 (a)(b) | 40,000 | 42,959 | ||||||
Greenwich Capital Commercial Funding Corp., Series 2006-GG7, Class AM (USD), 5.82%, 07/10/2038 (b) | 25,000 | 26,627 | ||||||
GS Mortgage Securities Trust, Series 2013-NYC5, Class E (USD), 3.77%, 01/10/2030 (a)(b) | 100,000 | 100,034 | ||||||
Jefferies & Co., Inc., Series 2009-R9, Class 1A1 (USD), 2.24%, 08/26/2046 (a)(b) | 25,328 | 25,586 | ||||||
JP Morgan Chase Commercial Mortgage Securities Trust, Series 2007-LDPX, Class AM (USD), 5.46%, 01/15/2049 (b) | 50,000 | 52,501 | ||||||
JP Morgan Mortgage Trust, Series 2013-3, Class A3 (USD), 3.48%, 07/25/2043 (a)(b) | 93,075 | 94,357 | ||||||
MASTR Alternative Loans Trust | 58,686 | 62,604 | ||||||
Series 2004-11, Class 7A1 (USD), 6.50%, 10/25/2034 | 26,126 | 27,821 | ||||||
New Residential Mortgage Loan Trust, Series 2014-1A, Class A (USD), 3.75%, 01/25/2054 (a)(b) | 92,502 | 95,433 | ||||||
Structured Asset Securities Corp., Series 2003-A40, Class 3A1 (USD), 2.38%, 01/25/2034 (b) | 30,156 | 29,407 | ||||||
Wachovia Bank Commercial Mortgage Trust, Series 2007-C32, Class A1A (USD), 5.72%, 06/15/2049 (b) | 18,072 | 19,574 | ||||||
WaMu Mortgage Pass-Through Certificates, Series 2004-AR3, Class A2 (USD), 2.37%, 06/25/2034 (b) | 42,792 | 43,465 | ||||||
Wells Fargo Mortgage Backed Securities, Series 2005-AR10, Class 1A1, (USD), 2.61%, 06/25/2035 (b) | 53,177 | 53,913 | ||||||
Wells Fargo Mortgage Backed Securities 2003-H Trust, Series 2003-H, Class A1, CMO (USD), 2.62%, 09/25/2033 (b) | 22,663 | 22,907 | ||||||
Wells Fargo Mortgage Backed Securities 2004-V Trust, Series 2004-V, Class 2A1 (USD), 2.63%, 10/25/2034 (b) | 25,615 | 25,880 | ||||||
See accompanying Notes to Financial Statements.
2014 Annual Report
17
Table of Contents
Statement of Investments (continued)
October 31, 2014
Aberdeen Core Fixed Income Fund
| Shares or Principal Amount | Value (US$) | |||||||
Wells Fargo Mortgage Backed Securities Trust, Series 2003-N, Class 1A1 (USD), 2.48%, 12/25/2033 (b) | $ | 28,249 | $ | 28,091 | ||||
WFRBS Commercial Mortgage Trust 2014-C22, Series 2014-C22, Class AS (USD), 4.07%, 09/15/2057 (b) | 12,000 | 12,461 | ||||||
| 1,610,669 | ||||||||
Total Commercial Mortgage-Backed Securities | 1,610,669 | |||||||
RESIDENTIAL MORTGAGE-BACKED SECURITIES (21.9%) |
| |||||||
UNITED STATES (21.9%) | ||||||||
BCAP LLC Trust, Series 2009-RR6, Class 3A1 (USD), 2.78%, 12/26/2037 (a)(b) | 51,196 | 51,092 | ||||||
Citigroup Mortgage Loan Trust, Inc. | ||||||||
Series 2009-6, Class 6A1 (USD), | 53,317 | 52,327 | ||||||
Series 2009-5, Class 7A1 (USD), | 31,684 | 30,698 | ||||||
Series 2009-6, Class 4A1 (USD), | 20,727 | 20,802 | ||||||
Series 2009-6, Class 11A1 (USD), | 24,860 | 24,528 | ||||||
Credit Suisse Mortgage Capital Certificates | ||||||||
Series 2009-12R, Class 6A1 (USD), | 32,380 | 32,558 | ||||||
Series 2009-2R, Class 2A5 (USD), | 20,160 | 20,247 | ||||||
Series 2009-3R, Class 28A1 (USD), | 8,651 | 8,642 | ||||||
Federal Home Loan Mortgage Corp. | ||||||||
Pool # G14583 (USD), 3.00%, 10/01/2027 | 19,520 | 20,292 | ||||||
Series 4301, Class U (USD), 3.50%, 07/15/2032 | 51,849 | 54,730 | ||||||
Pool # U89032 (USD), 3.00%, 07/01/2033 | 62,786 | 64,132 | ||||||
Pool # G06788 (USD), 5.50%, 10/01/2035 | 17,582 | 19,796 | ||||||
Series 3745, Class GP (USD), | 65,000 | 69,784 | ||||||
Series 3864, Class AB (USD), | 27,033 | 28,761 | ||||||
Series 4323, Class CA (USD), | 58,201 | 62,413 | ||||||
Series 4229, Class MA (USD), | 36,602 | 38,760 | ||||||
Series 4315, Class KU (USD), | 46,820 | 52,532 | ||||||
Pool # 2B1384 (USD), 2.47%, 05/01/2043 (b) | 36,739 | 37,068 | ||||||
Pool # G07626 (USD), 4.00%, 02/01/2044 | 81,013 | 86,962 | ||||||
Pool # G07683 (USD), 4.00%, 03/01/2044 | 49,336 | 52,595 | ||||||
Pool # Q28990 (USD), 3.50%, 10/01/2044 | 25,000 | 25,889 | ||||||
Pool # Q29348 (USD), 3.50%, 11/01/2044 | 35,000 | 36,244 | ||||||
Federal National Mortgage Association | ||||||||
Series 2013-117, Class V (USD), | 37,516 | 39,903 | ||||||
Pool # AK6972 (USD), 3.50%, 03/01/2027 | 32,083 | 34,046 | ||||||
Series 2012-84, Class QG (USD), | 24,484 | 25,107 | ||||||
Pool # AW7399 (USD), 3.50%, 02/01/2032 | 49,429 | 51,927 | ||||||
Pool # AP2109 (USD), 4.00%, 08/01/2032 | 17,113 | 18,430 | ||||||
Series 2013-31, Class ET (USD), | 17,273 | 18,478 | ||||||
Pool # AL3200 (USD), 3.50%, 02/01/2033 | 86,058 | 90,318 | ||||||
Series 2013-17, Class YM (USD), | 27,345 | 29,080 | ||||||
Series 2013-20, Class MC (USD), | 50,223 | 53,642 | ||||||
Series 2013-31, Class NL (USD), | 40,869 | 43,414 | ||||||
Pool # 555424 (USD), 5.50%, 05/01/2033 | 27,132 | 30,530 | ||||||
Series 2013-43, Class MB (USD), | 22,928 | 23,581 | ||||||
Pool # AV9175 (USD), 4.00%, 03/01/2034 | 28,675 | 30,784 | ||||||
Pool # AL5491 (USD), 4.00%, 06/01/2034 | 38,971 | 41,839 | ||||||
Pool # 190354 (USD), 5.50%, 12/01/2034 | 28,534 | 32,044 | ||||||
Series 2013-110, Class QH (USD), | 76,167 | 80,052 | ||||||
Series 2012-92, Class EB (USD), | 40,000 | 41,873 | ||||||
Series 2013-103, Class H, CMO (USD), | 74,513 | 80,947 | ||||||
Series 2013-100, Class CA (USD), | 46,370 | 49,795 | ||||||
Pool # AL0038 (USD), 5.00%, 02/01/2041 | 43,840 | 48,575 | ||||||
Pool # AI0108 (USD), 5.00%, 04/01/2041 | 43,145 | 48,505 | ||||||
Pool # AI5595 (USD), 5.00%, 07/01/2041 | 31,014 | 34,533 | ||||||
Pool # AL0933 (USD), 5.00%, 10/01/2041 | 35,931 | 39,846 | ||||||
Series 2013-100, Class MP (USD), | 64,297 | 70,306 | ||||||
Series 2012-120, Class PA (USD), | 65,669 | 68,868 | ||||||
Pool # AT2710 (USD), 2.27%, 06/01/2043 (b) | 32,366 | 32,409 | ||||||
Pool # AL3845 (USD), 2.44%, 07/01/2043 (b) | 36,743 | 37,170 | ||||||
Pool # AU0600 (USD), 3.50%, 08/01/2043 | 83,323 | 86,449 | ||||||
Series 2014-29, Class PA, CMO (USD), | 56,308 | 59,839 | ||||||
Pool # AL5376 (USD), 4.00%, 05/01/2044 | 53,440 | 57,081 | ||||||
Pool # AS2774 (USD), 3.50%, 07/01/2044 | 49,259 | 51,101 | ||||||
Pool # AS3611 (USD), 3.50%, 10/01/2044 | 74,897 | 77,698 | ||||||
Pool # AS3706 (USD), 3.50%, 11/01/2044 | 70,000 | 72,618 | ||||||
Government National Mortgage Association, Pool # 783356 (USD), 6.00%, 06/20/2041 | 9,519 | 10,727 | ||||||
JP Morgan Re-Remic | ||||||||
Series 2009-7, Class 2A1 (USD), | 52,481 | 53,805 | ||||||
Series 2009-7, Class 13A1 (USD), | 18,253 | 18,254 | ||||||
Series 2009-7, Class 14A1 (USD), | 51,443 | 51,647 | ||||||
MASTR Asset Securitization Trust, Series 2003-8, Class 3A13 (USD), 5.25%, 09/25/2033 | 6,648 | 6,802 | ||||||
| 2,632,875 | ||||||||
Total Residential Mortgage-Backed Securities | 2,632,875 | |||||||
CORPORATE BONDS (24.2%) | ||||||||
AUSTRALIA (0.7%) | ||||||||
Commercial Banks (0.5%) | ||||||||
Macquarie Bank Ltd. (USD), MTN, 1.60%, 10/27/2017 (a) | 60,000 | 59,699 | ||||||
See accompanying Notes to Financial Statements.
Annual Report 2014
18
Table of Contents
Statement of Investments (continued)
October 31, 2014
Aberdeen Core Fixed Income Fund
| Shares or Principal Amount | Value (US$) | |||||||
Metals & Mining (0.2%) | ||||||||
BHP Billiton Finance USA Ltd. (USD), 5.00%, 09/30/2043 | $ | 20,000 | $ | 22,337 | ||||
| 82,036 | ||||||||
CANADA (0.2%) | ||||||||
Chemicals (0.2%) | ||||||||
NOVA Chemicals Corp. (USD), 8.63%, 11/01/2019 | 30,000 | 31,294 | ||||||
FRANCE (0.4%) | ||||||||
Oil, Gas & Consumable Fuels (0.4%) | ||||||||
Total Capital International SA | ||||||||
(USD), 2.70%, 01/25/2023 | 30,000 | 29,113 | ||||||
(USD), 3.75%, 04/10/2024 | 15,000 | 15,568 | ||||||
| 44,681 | ||||||||
MEXICO (0.2%) | ||||||||
Oil, Gas & Consumable Fuels (0.2%) | ||||||||
Petroleos Mexicanos (USD), 4.25%, 01/15/2025 (a) | 20,000 | 20,246 | ||||||
SWITZERLAND (0.2%) | ||||||||
Pharmaceutical (0.2%) | ||||||||
Novartis Capital Corp. (USD), 4.40%, 05/06/2044 | 26,000 | 27,837 | ||||||
UNITED KINGDOM (2.8%) | ||||||||
Commercial Banks (1.7%) | ||||||||
Royal Bank of Scotland Group PLC (USD), 5.13%, 05/28/2024 | 100,000 | 101,317 | ||||||
Royal Bank of Scotland PLC (USD), 1.88%, 03/31/2017 | 100,000 | 100,308 | ||||||
| 201,625 | ||||||||
Electric Utilities (0.9%) | ||||||||
Western Power Distribution Holdings Ltd. (USD), 7.25%, 12/15/2017 (a) | 100,000 | 113,910 | ||||||
Oil, Gas & Consumable Fuels (0.2%) | ||||||||
BP Capital Markets PLC (USD), 2.75%, 05/10/2023 | 25,000 | 23,816 | ||||||
| 339,351 | ||||||||
UNITED STATES (19.7%) | ||||||||
Agriculture (0.1%) | ||||||||
Philip Morris International, Inc. (USD), 4.13%, 03/04/2043 | 20,000 | 19,492 | ||||||
Auto Manufacturers (0.2%) | ||||||||
General Motors Co. (USD), 6.25%, 10/02/2043 | 20,000 | 23,800 | ||||||
Biotechnology (0.1%) | ||||||||
Gilead Sciences, Inc. (USD), 4.80%, 04/01/2044 | 15,000 | 16,259 | ||||||
Commercial Banks (4.4%) | ||||||||
Bank of America Corp. | ||||||||
(USD), MTN, 4.00%, 04/01/2024 | 10,000 | 10,333 | ||||||
(USD), MTN, 5.00%, 01/21/2044 | 25,000 | 27,319 | ||||||
Citigroup, Inc., Series N (USD), 5.80%, 11/15/2019 (b)(c) | 50,000 | 50,100 | ||||||
Compass Bank (USD), 1.85%, 09/29/2017 | 250,000 | 251,003 | ||||||
JPMorgan Chase & Co. |
| |||||||
Series V (USD), 5.00%, 07/01/2019 (b)(c) | 35,000 | 34,431 | ||||||
(USD), 3.88%, 09/10/2024 | 20,000 | 19,870 | ||||||
(USD), 4.85%, 02/01/2044 | 25,000 | 26,880 | ||||||
Morgan Stanley |
| |||||||
Series H (USD), 5.45%, 07/15/2019 (b)(c) | 45,000 | 45,211 | ||||||
Series F (USD), 3.88%, 04/29/2024 | 25,000 | 25,327 | ||||||
Wells Fargo & Co. (USD), MTN, 3.30%, 09/09/2024 | 45,000 | 44,887 | ||||||
| 535,361 | ||||||||
Computers & Peripherals (0.2%) | ||||||||
Apple, Inc. (USD), 3.85%, 05/04/2043 | 25,000 | 23,872 | ||||||
Diversified Financial Services (1.8%) | ||||||||
Apollo Management Holdings LP (USD), 4.00%, 05/30/2024 (a) | 25,000 | 25,198 | ||||||
BlackRock, Inc. (USD), 3.50%, 03/18/2024 | 35,000 | 35,574 | ||||||
Harley-Davidson Funding Corp. (USD), 6.80%, 06/15/2018 (a) | 35,000 | 40,839 | ||||||
HSBC Finance Corp. (USD), 6.68%, 01/15/2021 | 40,000 | 47,139 | ||||||
Legg Mason, Inc. (USD), 5.63%, 01/15/2044 | 15,000 | 16,727 | ||||||
National Rural Utilities Cooperative Finance Corp. (USD), 4.75%, 04/30/2043 (b) | 30,000 | 29,709 | ||||||
Utility Contract Funding LLC (USD), 7.94%, 10/01/2016 (a) | 20,624 | 22,044 | ||||||
| 217,230 | ||||||||
Diversified Telecommunication Services (2.3%) |
| |||||||
Crown Castle Towers LLC (USD), 6.11%, 01/15/2040 (a) | 100,000 | 115,536 | ||||||
Qwest Corp. (USD), 6.88%, 09/15/2033 | 45,000 | 45,351 | ||||||
SBA Tower Trust | ||||||||
(USD), 2.93%, 12/15/2042 (a) | 40,000 | 40,534 | ||||||
(USD), 3.72%, 04/15/2048 (a) | 25,000 | 25,035 | ||||||
Verizon Communications, Inc. | ||||||||
(USD), 5.15%, 09/15/2023 | 15,000 | 16,798 | ||||||
(USD), 5.01%, 08/21/2054 (a) | 33,000 | 33,581 | ||||||
| 276,835 | ||||||||
Electric Utilities (1.6%) | ||||||||
Appalachian Power Co., Series L (USD), 5.80%, 10/01/2035 | 10,000 | 11,884 | ||||||
CMS Energy Corp. (USD), 4.88%, 03/01/2044 | 25,000 | 26,685 | ||||||
Dominion Resources, Inc. (USD), 5.75%, 10/01/2054 (b) | 21,000 | 21,834 | ||||||
Entergy Gulf States, Inc. (USD), 6.20%, 07/01/2033 | 34,000 | 34,088 | ||||||
Exelon Corp. (USD), 5.63%, 06/15/2035 | 10,000 | 11,340 | ||||||
ITC Holdings Corp. (USD), 5.30%, 07/01/2043 | 10,000 | 11,056 | ||||||
Public Service Co. of New Mexico (USD), 7.95%, 05/15/2018 | 25,000 | 29,798 | ||||||
Puget Energy, Inc. (USD), 6.50%, 12/15/2020 | 35,000 | 41,686 | ||||||
| 188,371 | ||||||||
Electronics (0.6%) | ||||||||
Keysight Technologies, Inc. (USD), 4.55%, 10/30/2024 (a) | 70,000 | 69,969 | ||||||
Energy Equipment & Services (1.5%) | ||||||||
El Paso Pipeline Partners Operating Co. LLC | ||||||||
(USD), 6.50%, 04/01/2020 | 15,000 | 17,160 | ||||||
(USD), 4.30%, 05/01/2024 | 40,000 | 40,050 | ||||||
See accompanying Notes to Financial Statements.
2014 Annual Report
19
Table of Contents
Statement of Investments (continued)
October 31, 2014
Aberdeen Core Fixed Income Fund
| Shares or Principal Amount | Value (US$) | |||||||
Energy Transfer Partners LP (USD), 4.15%, 10/01/2020 | $ | 35,000 | $ | 36,481 | ||||
Kinder Morgan Energy Partners LP | ||||||||
(USD), 5.30%, 09/15/2020 | 17,000 | 18,690 | ||||||
(USD), 3.50%, 03/01/2021 | 30,000 | 29,852 | ||||||
Williams Partners LP (USD), 3.90%, 01/15/2025 | 35,000 | 34,722 | ||||||
| 176,955 | ||||||||
Food Products (0.8%) | ||||||||
Sysco Corp. | ||||||||
(USD), 3.00%, 10/02/2021 | 30,000 | 30,425 | ||||||
(USD), 3.50%, 10/02/2024 | 30,000 | 30,443 | ||||||
WM Wrigley Jr Co. (USD), 3.38%, 10/21/2020 (a) | 40,000 | 40,860 | ||||||
| 101,728 | ||||||||
Healthcare Products (0.2%) | ||||||||
Medtronic, Inc. (USD), 4.63%, 03/15/2044 | 20,000 | 20,762 | ||||||
Healthcare Providers & Services (0.3%) | ||||||||
WellPoint, Inc. (USD), 3.50%, 08/15/2024 | 35,000 | 34,741 | ||||||
Insurance (1.2%) | ||||||||
American International Group, Inc. (USD), 4.50%, 07/16/2044 | 30,000 | 30,466 | ||||||
Farmers Exchange Capital II (USD), 6.15%, 11/01/2053 (a)(b) | 35,000 | 38,271 | ||||||
Teachers Insurance & Annuity Association of America (USD), 4.90%, 09/15/2044 (a) | 25,000 | 26,503 | ||||||
TIAA Asset Management Finance Co. LLC (USD), 4.13%, 11/01/2024 (a) | 45,000 | 45,238 | ||||||
| 140,478 | ||||||||
Media (1.1%) | ||||||||
CBS Corp. | ||||||||
(USD), 2.30%, 08/15/2019 | 35,000 | 34,541 | ||||||
(USD), 4.90%, 08/15/2044 | 20,000 | 19,966 | ||||||
Comcast Cable Communications LLC (USD), 8.88%, 05/01/2017 | 30,000 | 35,545 | ||||||
Comcast Corp. (USD), 7.05%, 03/15/2033 | 28,000 | 38,226 | ||||||
| 128,278 | ||||||||
Office/Business Equipment (0.4%) | ||||||||
Xerox Corp. (USD), 3.80%, 05/15/2024 | 45,000 | 44,100 | ||||||
Oil & Gas Services (0.3%) | ||||||||
FMC Technologies, Inc. (USD), 3.45%, 10/01/2022 | 20,000 | 19,566 | ||||||
Freeport-McMoran Oil & Gas LLC/FCX Oil & Gas, Inc. (USD), 6.50%, 11/15/2020 | 15,000 | 16,380 | ||||||
| 35,946 | ||||||||
Oil, Gas & Consumable Fuels (0.6%) | ||||||||
Freeport-McMoran Oil & Gas LLC / FCX Oil & Gas, Inc. (USD), 6.88%, 02/15/2023 | 15,000 | 16,964 | ||||||
Marathon Petroleum Corp. (USD), 4.75%, 09/15/2044 | 20,000 | 20,123 | ||||||
Noble Energy, Inc. (USD), 5.25%, 11/15/2043 | 15,000 | 16,149 | ||||||
Rowan Cos., Inc. (USD), 5.85%, 01/15/2044 | 20,000 | 20,108 | ||||||
| 73,344 | ||||||||
Pharmaceutical (0.2%) | ||||||||
Express Scripts Holding Co. (USD), 6.13%, 11/15/2041 | 20,000 | 24,761 | ||||||
Real Estate (0.5%) | ||||||||
DDR Corp. (USD), 3.38%, 05/15/2023 | 45,000 | 43,586 | ||||||
Kimco Realty Corp. (USD), 3.13%, 06/01/2023 | 20,000 | 19,477 | ||||||
| 63,063 | ||||||||
Retail (0.5%) | ||||||||
CVS Health Corp. (USD), 3.38%, 08/12/2024 | 20,000 | 19,942 | ||||||
Target Corp. (USD), 4.00%, 07/01/2042 | 20,000 | 19,205 | ||||||
Wal-Mart Stores, Inc. (USD), 4.30%, 04/22/2044 | 18,000 | 18,761 | ||||||
| 57,908 | ||||||||
Software (0.4%) | ||||||||
Oracle Corp. | ||||||||
(USD), 2.50%, 10/15/2022 | 20,000 | 19,311 | ||||||
(USD), 3.40%, 07/08/2024 | 35,000 | 35,395 | ||||||
| 54,706 | ||||||||
Transportation (0.4%) |
| |||||||
Burlington Northern Santa Fe LLC | ||||||||
(USD), 5.15%, 09/01/2043 | 20,000 | 22,239 | ||||||
(USD), 4.55%, 09/01/2044 | 22,000 | 22,319 | ||||||
| 44,558 | ||||||||
| 2,372,517 | ||||||||
Total Corporate Bonds | 2,917,962 | |||||||
MUNICIPAL BONDS (1.9%) | ||||||||
UNITED STATES (1.9%) | ||||||||
ARIZONA (0.2%) | ||||||||
La Paz County Industrial Development Authority Revenue Bonds (USD), 7.00%, 03/01/2034 | 25,000 | 25,113 | ||||||
CALIFORNIA (0.5%) | ||||||||
Bay Area Toll Authority Revenue Bonds (Build America Bonds), Series S1 (USD), 6.79%, 04/01/2030 | 45,000 | 57,415 | ||||||
GEORGIA (0.6%) | ||||||||
Municipal Electric Authority of Georgia Revenue Bonds (Build America Bonds) (USD), 6.64%, 04/01/2057 | 55,000 | 70,020 | ||||||
ILLINOIS (0.4%) | ||||||||
Chicago Transit Authority Sales Tax Receipts Revenue Bonds (Build America Bonds), Series B (USD), 6.20%, 12/01/2040 | 45,000 | 52,510 | ||||||
NEW YORK (0.2%) | ||||||||
Port Authority of New York & New Jersey Revenue Bonds (USD), 6.04%, 12/01/2029 | 20,000 | 25,264 | ||||||
| 230,322 | ||||||||
Total Municipal Bonds | 230,322 | |||||||
See accompanying Notes to Financial Statements.
Annual Report 2014
20
Table of Contents
Statement of Investments (concluded)
October 31, 2014
Aberdeen Core Fixed Income Fund
| Shares or Principal Amount | Value (US$) | |||||||
U.S. TREASURIES (31.7%) | ||||||||
UNITED STATES (31.7%) | ||||||||
U.S. Treasury Bonds (USD), 3.38%, 05/15/2044 | $ | 509,000 | $ | 539,977 | ||||
U.S. Treasury Notes | ||||||||
(USD), 2.13%, 05/31/2015 (d) | 5,000 | 5,057 | ||||||
(USD), 0.50%, 09/30/2016 | 1,436,000 | 1,436,674 | ||||||
(USD), 1.75%, 09/30/2019 | 977,000 | 983,488 | ||||||
(USD), 2.13%, 09/30/2021 | 728,000 | 732,095 | ||||||
(USD), 2.38%, 08/15/2024 | 129,000 | 129,504 | ||||||
| 3,826,795 | ||||||||
Total U.S. Treasuries | 3,826,795 | |||||||
REPURCHASE AGREEMENT (1.7%) | ||||||||
UNITED STATES (1.7%) | ||||||||
Repurchase Agreement, Fixed Income Clearing Corp., 0.00%, dated 10/31/2014, due 11/03/2014, repurchase price $200,000, collateralized by U.S. Treasury Note, maturing 10/31/2021; market value of $204,468 | 200,000 | 200,000 | ||||||
Total Repurchase Agreement | 200,000 | |||||||
Total Investments | 12,097,959 | |||||||
Liabilities in excess of other assets—(0.4)% | (45,174 | ) | ||||||
Net Assets—100.0% | $ | 12,052,785 | ||||||
| (a) | Denotes a security issued under Regulation S or Rule 144A. |
| (b) | Variable or Floating Rate Security. Rate disclosed is as of October 31, 2014. |
| (c) | Perpetual bond. This is a bond that has no maturity date, is redeemable and pays a steady stream of interest indefinitely. |
| (d) | A security or a portion of the security was used to cover the margin requirement for futures contracts. |
| (e) | See Notes to Financial Statements for tax unrealized appreciation/depreciation of securities. |
| MTN | Medium Term Note |
| USD | U.S. Dollar |
At October 31, 2014, the Fund held the following futures contracts:
| Futures Contract | Counterparty | Number of Contracts Long (Short) | Expiration Date | Unrealized Depreciation | ||||||||||
United States Treasury Note 6%-2 year | UBS | (5 | ) | 12/31/2014 | $ | (3,527 | ) | |||||||
See accompanying Notes to Financial Statements.
2014 Annual Report
21
Table of Contents
Aberdeen Emerging Markets Debt Fund (Unaudited)
The Aberdeen Emerging Markets Debt Fund (Class A shares at net asset value net of fees) returned 5.64% for the 12-month period ended October 31, 2014, versus the 8.55% return of its benchmark, the J.P. Morgan EMBI Global Diversified Index, for the same period. For broader comparison, the average return of the Fund’s Lipper peer category of Emerging Markets Hard Currency Debt Funds (consisting of 86 funds) was 4.50% for the period.
Emerging markets (EM) debt, as measured by the J.P. Morgan EMBI Global Diversified Index, returned 8.55% for the reporting period, while the benchmark yield spread fell 18 basis points (bps)–that is, 0.18%–to +296 bps over comparable-duration1 U.S. Treasuries over the same period. All regions posted positive returns over the period. In terms of countries, Honduras, Argentina, Belize and Jamaica were the top performers, while Venezuela posted the greatest losses; Russia also performed poorly.
Following the “taper tantrum” earlier in 2013, emerging markets experienced an unexpected, positive surprise at the start of the review period when the U.S. Federal Open Market Committee (FOMC) decided against tapering its asset purchases, given that it remained unconvinced by the scale of the U.S. economic recovery. This sparked a robust rally, as investors appeared to believe that market had reached an equilibrium level and that value had returned to EM assets.
Improved U.S. economic data in November 2013 subsequently led to a growing sense in the market that the U.S. Federal Reserve (Fed) was unlikely to wait too long before starting its tapering. Thereafter, the Fed announced in December that it would start to taper its asset purchases by $10 billion beginning in January 2014. The program was reduced by a further $10 billion monthly, until the end of the period in late October. The Fed’s tapering initially weighed on emerging market sentiment; however, there was a turnaround in February attributable to what we viewed as supportive and pragmatic measures by emerging market central banks, as well as investors’ realization that certain idiosyncratic events were not indicative of wider contagion.
EM debt continued to post gains throughout the summer months, as investors focused on the yield differential between emerging and developed markets, rather than geopolitical tensions between Russia and Ukraine. The key themes of last year, including the “Fragile Five”2 and external vulnerabilities, ceased to be as important, in our opinion, given the clear improvement in the fundamentals of many countries.
While declines in hard currency sovereign3 and corporate bonds were somewhat tempered, emerging market currencies weakened significantly towards September 2014 when the J.P. Morgan Emerging Markets Currency Index4 declined to levels last seen at the height of the credit crunch in 2009. While election and geopolitical risks may have accounted for a decline in the Brazilian real and Russian ruble over the annual period, the broader underperformance relative to developed-market currencies was due to a strengthening U.S. dollar, which reflected the improving U.S. economy and softer growth expectations for China.
While the Fund used derivatives during the reporting period, they had minimal impact on performance.
Emerging market debt rebounded towards the end of the reporting period in October, reversing much of the negativity experienced across the asset class in September. U.S. Treasuries experienced a roller coaster ride, as the yield on the 10-year note fell by 37 bps (and its price consequently rose) over the first half of the month before relinquishing some of these price gains by the end of October.
The Fund underperformed its benchmark, the J.P. Morgan EMBI Global Diversified Index, over the reporting period. Fund performance was hindered primarily by an overweight in Russia towards the beginning of the period, an overweight relative in Brazil, and an underweight in Argentina. Conversely, overweight positioning in Honduras and Kazakhstan were the main contributors to positive Fund performance as well as exposure to the United Arab Emirates, which is not represented in the benchmark index. Positioning in Serbia and currency exposure in India also bolstered Fund performance.
During the reporting period, we heavily shifted the Fund’s Russian position due to sanctions administered as a result of the escalated tensions with Ukraine, and participated in new issues from Mozambique and Paraguay. In the local currency space, we maintained a position in Brazil and, towards the end of the period, initiated some Russian local bond holdings. In the currency space, we reduced the Indian rupee exposure, targeting a 2% position.
With regard to derivatives, the Fund’s use of currency forwards had a negative impact on performance over the reporting period.
As we move into 2015, we have seen a significant number of the major U.S. economists cut their U.S. Treasury yield forecasts, which we feel highlights the upside risks to emerging market debt as the “search for yield” most likely should remain strong. The decline in global commodity prices affects emerging markets in different ways but puts additional pressures on those countries whose fiscal breakeven oil price5 has risen significantly over the last five years. The Ebola pandemic also highlights some of the risks of investing in sub-Saharan African credits as the countries which have suffered the worst outbreaks (Senegal, Guinea, Sierra Leone and Liberia) are in proximity to the three counties (Nigeria, Ghana and Ivory Coast) which produce nearly 60% of global cocoa. We believe that ongoing currency weakness is also a risk as the market is increasingly expressing any negative sentiment in this part of the asset class.
| 1 | Duration is an estimate of bond price sensitivity to changes in interest rates. The higher the duration, the greater the change (i.e., high risk) in relation to interest-rate movements. |
| 2 | The “Fragile Five” economies are those that are considered to have become too dependent on skittish foreign investment to finance their growth ambitions: Turkey, Brazil, India, South Africa and Indonesia. |
| 3 | A sovereign bond is a debt security issued by a national government within a given country and denominated in a foreign currency. |
| 4 | The J.P. Morgan Emerging Markets Currency Index tracks the performance of emerging market currency exchange rates. |
| 5 | The fiscal breakeven oil price is the average price at which the budget of an oil-exporting country is balanced in a given year. |
Annual Report 2014
22
Table of Contents
Aberdeen Emerging Markets Debt Fund (Unaudited) (concluded)
Portfolio Management:
Aberdeen Emerging Markets Debt Team
PAST PERFORMANCE DOES NOT GUARANTEE FUTURE RESULTS.
The performance data quoted represents past performance and current returns may be lower or higher. Class A Shares have up to a 4.25% front-end sales charge and a 0.25% 12b-1 fee. The investment return and principal value will fluctuate so that an investor’s shares, when redeemed, may be worth more or less than the original cost. To obtain performance information current to the most recent month-end, which may be higher or lower than the performance shown above, please call 866-667-9231 or go to www.aberdeen-asset.us.
Investing in mutual funds involves risk, including the possible loss of principal.
Indexes are unmanaged and have been provided for comparison purposes only. No fees or expenses are reflected. You cannot invest directly in an index.
Lipper is a leading global provider of mutual fund information and analysis to fund companies, financial intermediaries and media organizations.
Risk Considerations
Fixed income securities are subject to certain risks including, but not limited to: interest rate (changes in interest rates may cause a decline in the market value of an investment), credit (changes in the financial condition of the issuer, borrower, counterparty, or underlying collateral), prepayment (debt issuers may repay or refinance their loans or obligations earlier than anticipated), and extension (principal repayments may not occur as quickly as anticipated, causing the expected maturity of a security to increase). The Fund’s investments in high yield bonds and other lower-rated securities will subject the Fund to substantial risk of loss.
Foreign securities are more volatile, harder to price and less liquid than U.S. securities and are subject to different accounting and regulatory standards, and political and economic risks. These risks are enhanced in emerging markets countries.
The Fund is non-diversified and may hold larger positions in fewer securities than other funds and have greater risk than more diversified funds.
Derivatives are speculative and may hurt the Fund’s performance. They present the risk of disproportionately increased losses and/or reduced gains when the financial asset or measure to which the derivative is linked changes in unexpected ways.
Please read the prospectus for more detailed information regarding these risks.
2014 Annual Report
23
Table of Contents
Aberdeen Emerging Markets Debt Fund (Unaudited)
Average Annual Total Return (For periods ended October 31, 2014) | 1 Yr. | Inception1 | ||||||||
Class A | w/o SC | 5.64% | 1.53% | |||||||
| w/SC2 | 1.19% | (0.64% | ) | |||||||
Class C | w/o SC | 4.72% | 0.73% | |||||||
| w/SC3 | 3.72% | 0.25% | ||||||||
Class R4 | w/o SC | 5.37% | 1.28% | |||||||
Institutional Service Class4 | w/o SC | 5.91% | 1.77% | |||||||
Institutional Class4 | w/o SC | 5.91% | 1.77% | |||||||
All figures showing the effect of a sales charge (SC) reflect the maximum charge possible because it has the most significant effect on performance data. The total returns shown above do not include the impact of financial statement rounding of the net asset value per share and/or financial statement adjustments.
| 1 | The Fund commenced operations on November 1, 2012. |
| 2 | A 4.25% front-end sales charge was deducted. |
| 3 | A 1.00% contingent deferred sales charge (CDSC) was deducted from the one year return because it is charged when Class C shares are sold within the first year after purchase. |
| 4 | Not subject to any sales charges. |
Annual Report 2014
24
Table of Contents
Aberdeen Emerging Markets Debt Fund (Unaudited)
Performance of a $10,000 Investment (as of October 31, 2014)
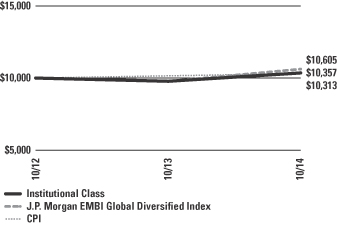
Comparative performance of $10,000 invested in Class A shares of the Aberdeen Emerging Markets Debt Fund, the J.P. Morgan Emerging Markets Bond Index (EMBI) Global Diversified Index and the Consumer Price Index (CPI) since inception. Unlike the Fund, the returns for these unmanaged indexes do not reflect any fees, expenses, or sales charges. Investors cannot invest directly in market indexes.
The J.P. Morgan EMBI Global Diversified Index is an alternatively weighted index that assigns a larger weight to less liquid issues from countries with smaller debt stocks and limits the weights of those index countries with larger debt stocks by only including a specified portion of these countries’ eligible current face amounts of debt outstanding. The index consists of U.S. dollar-denominated Brady bonds, Eurobonds, and traded loans issued by sovereign and quasisovereign entities issued in emerging markets countries.
The CPI represents changes in prices of a basket of goods and services purchased for consumption by urban households.
Investment return and principal value will fluctuate, and when redeemed, shares may be worth more or less than original cost. Past performance is no guarantee of future results. The Average Annual Total Return table and Performance graph do not reflect the deduction of taxes that a shareholder would pay on fund distributions or the redemption of fund shares. Investing in mutual funds involves market risk, including loss of principal. Performance returns assume the reinvestment of all distributions. Total returns reflect waivers and reimbursements in effect, without which returns would have been lower.
Portfolio Summary (as a percentage of net assets)
October 31, 2014 (Unaudited)
| Asset Allocation | ||||
Government Bonds | 71.3% | |||
Corporate Bonds | 17.7% | |||
Government Agencies | 7.6% | |||
Repurchase Agreement | 1.7% | |||
Other assets in excess of liabilities | 1.7% | |||
| 100.0% | ||||
The following chart summarizes the composition of the Fund’s portfolio, expressed as a percentage of net assets. The industries listed below may include more than one industry group. As of October 31, 2014, the Fund did not have more than 25% of its assets invested in any industry group.
| Top Industries | ||||
Commercial Banks | 6.0% | |||
Oil, Gas & Consumable Fuels | 3.7% | |||
Engineering & Construction | 2.1% | |||
Holding Companies-Diversified Operations | 1.7% | |||
Diversified Telecommunication Services | 1.4% | |||
Real Estate Management & Development | 0.9% | |||
Media | 0.7% | |||
Retail | 0.6% | |||
Commercial Services & Supplies | 0.6% | |||
Other | 82.3% | |||
| 100.0% | ||||
| Top Holdings* | ||||
Venezuela Government International Bond 08/23/2022 | 2.9% | |||
Romanian Government International Bond 02/07/2022 | 2.7% | |||
Croatia Government International Bond 07/14/2020 | 2.5% | |||
Brazil Notas do Tesouro Nacional, Series B 08/15/2020 | 2.5% | |||
Mexico Government International Bond 01/11/2040 | 2.3% | |||
Brazil Notas do Tesouro Nacional, Series F 01/01/2017 | 2.1% | |||
Emirate of Dubai Government International Bonds 10/05/2020 | 2.1% | |||
South Africa Government International Bond 05/30/2022 | 2.0% | |||
Kazakhstan Temir Zholy Finance BV 07/10/2042 | 2.0% | |||
Argentina Bonar Bonds, Series X 04/17/2017 | 1.9% | |||
Other | 77.0% | |||
| 100.0% | ||||
| Top Countries | ||||
Brazil | 14.5% | |||
Mexico | 10.1% | |||
Indonesia | 6.8% | |||
South Africa | 5.1% | |||
Venezuela | 4.1% | |||
Russia | 3.9% | |||
Uruguay | 3.8% | |||
Romania | 3.2% | |||
Turkey | 3.0% | |||
Kazakhstan | 3.0% | |||
Other | 42.5% | |||
| 100.0% | ||||
| * | For the purpose of listing top holdings, repurchase agreements are included as part of Other. |
2014 Annual Report
25
Table of Contents
Statement of Investments
October 31, 2014
Aberdeen Emerging Markets Debt Fund
| Shares or Principal Amount | Value (US$) | |||||||
CORPORATE BONDS (17.7%) | ||||||||
BRAZIL (5.4%) | ||||||||
Commercial Banks (1.7%) | ||||||||
Banco do Brasil SA (BRL), 9.75%, 07/18/2017 (a) | $ | 420,000 | $ | 161,870 | ||||
Caixa Economica Federal (USD), 4.50%, 10/03/2018 (a) | 360,000 | 368,604 | ||||||
| 530,474 | ||||||||
Engineering & Construction (2.1%) | ||||||||
OAS Investments GmbH (USD), 8.25%, 10/19/2019 (a) | 200,000 | 194,500 | ||||||
Odebrecht Finance Ltd. | ||||||||
(USD), 7.50%, 09/14/2015 (a)(b) | 240,000 | 241,800 | ||||||
(USD), 7.13%, 06/26/2042 (a) | 200,000 | 209,900 | ||||||
| 646,200 | ||||||||
Oil, Gas & Consumable Fuels (1.6%) | ||||||||
Petrobras International Finance Co. SA | ||||||||
(USD), 7.88%, 03/15/2019 | 194,000 | 222,465 | ||||||
(USD), 5.75%, 01/20/2020 | 17,000 | 17,946 | ||||||
(USD), 6.88%, 01/20/2040 | 260,000 | 272,644 | ||||||
| 513,055 | ||||||||
| 1,689,729 | ||||||||
CHILE (1.3%) | ||||||||
Oil, Gas & Consumable Fuels (0.7%) | ||||||||
Empresa Nacional del Petroleo (USD), 4.38%, 10/30/2024 (a) | 200,000 | 198,250 | ||||||
Retail (0.6%) | ||||||||
SACI Falabella (USD), 3.75%, 04/30/2023 (a) | 200,000 | 197,076 | ||||||
| 395,326 | ||||||||
CHINA (2.2%) | ||||||||
Commercial Banks (1.0%) | ||||||||
Export Import Bank of China (CNH), 3.00%, 05/14/2016 | 2,000,000 | 325,523 | ||||||
Holding Companies-Diversified Operations (0.3%) |
| |||||||
Sinochem Overseas Capital Co. Ltd. (USD), 4.50%, 11/12/2020 (a) | 100,000 | 106,608 | ||||||
Real Estate Management & Development (0.9%) |
| |||||||
China Overseas Finance Cayman Island II Ltd. (USD), 5.50%, 11/10/2020 (a) | 250,000 | 268,368 | ||||||
| 700,499 | ||||||||
COLOMBIA (0.9%) | ||||||||
Oil, Gas & Consumable Fuels (0.9%) | ||||||||
Pacific Rubiales Energy Corp. (USD), 5.38%, 01/26/2019 (a) | 270,000 | 270,675 | ||||||
INDIA (1.7%) | ||||||||
Commercial Banks (1.0%) | ||||||||
State Bank of India (USD), 3.25%, 04/18/2018 (a) | 310,000 | 313,816 | ||||||
Diversified Telecommunication Services (0.7%) |
| |||||||
Bharti Airtel International Netherlands BV (USD), 5.13%, 03/11/2023 (a) | $ | 200,000 | $ | 211,256 | ||||
| 525,072 | ||||||||
MEXICO (1.9%) | ||||||||
Commercial Banks (0.5%) | ||||||||
BBVA Bancomer SA (USD), 6.75%, 09/30/2022 (a) | 150,000 | 169,875 | ||||||
Holding Companies-Diversified Operations (1.4%) |
| |||||||
Alfa SAB de CV | ||||||||
(USD), 5.25%, 03/25/2024 (a) | 200,000 | 217,750 | ||||||
(USD), 6.88%, 03/25/2044 (a) | 200,000 | 225,000 | ||||||
| 442,750 | ||||||||
| 612,625 | ||||||||
RUSSIA (1.5%) | ||||||||
Commercial Banks (0.3%) | ||||||||
Alfa Bank OJSC Via Alfa Bond Issuance PLC (USD), 7.88%, 09/25/2017 (a) | 100,000 | 104,200 | ||||||
Diversified Telecommunication Services (0.7%) |
| |||||||
Vimpel Communications Via VIP Finance Ireland Ltd. OJSC (USD), 7.75%, 02/02/2021 (a) | 200,000 | 203,500 | ||||||
Oil, Gas & Consumable Fuels (0.5%) | ||||||||
Gaz Capital SA for Gazprom (USD), 9.25%, 04/23/2019 (a) | 140,000 | 161,729 | ||||||
| 469,429 | ||||||||
SOUTH AFRICA (0.7%) | ||||||||
Media (0.7%) | ||||||||
Myriad International Holdings BV (USD), | 200,000 | 217,000 | ||||||
SUPRANATIONAL (0.7%) | ||||||||
Commercial Banks (0.7%) | ||||||||
African Export-Import Bank (USD), EMTN, 5.75%, 07/27/2016 (a) | 200,000 | 208,000 | ||||||
TURKEY (0.8%) | ||||||||
Commercial Banks (0.8%) | ||||||||
Turkiye Garanti Bankasi (USD), | 250,000 | 253,750 | ||||||
UNITED ARAB EMIRATES (0.6%) | ||||||||
Commercial Services & Supplies (0.6%) | ||||||||
DP World Ltd. (USD), MTN, 6.85%, 07/02/2037 (a) | 170,000 | 195,075 | ||||||
Total Corporate Bonds | 5,537,180 | |||||||
GOVERNMENT BONDS (71.3%) | ||||||||
ARGENTINA (2.4%) | ||||||||
Argentina Bonar Bonds | ||||||||
Series X (USD), 7.00%, 04/17/2017 | 680,000 | 603,328 | ||||||
(USD), 8.75%, 05/07/2024 | 165,000 | 154,406 | ||||||
| 757,734 | ||||||||
See accompanying Notes to Financial Statements.
Annual Report 2014
26
Table of Contents
Statement of Investments (continued)
October 31, 2014
Aberdeen Emerging Markets Debt Fund
| Shares or Principal Amount | Value (US$) | |||||||
ARMENIA (1.6%) | ||||||||
Republic of Armenia, REG S (USD), 6.00%, 09/30/2020 (a) | $ | 490,000 | $ | 512,050 | ||||
BELARUS (1.0%) | ||||||||
Republic of Belarus (USD), 8.95%, 01/26/2018 (a) | 290,000 | 312,171 | ||||||
BRAZIL (7.8%) | ||||||||
Brazil Notas do Tesouro Nacional | ||||||||
Series F (BRL), 10.00%, 01/01/2017 | 1,700,000 | 655,384 | ||||||
Series B (BRL), 6.00%, 08/15/2020 (c) | 760,000 | 768,130 | ||||||
Series F (BRL), 10.00%, 01/01/2021 | 710,000 | 261,461 | ||||||
Series F (BRL), 10.00%, 01/01/2023 | 600,000 | 216,451 | ||||||
Series F (BRL), 10.00%, 01/01/2025 | 550,000 | 196,414 | ||||||
Brazilian Government International Bond (USD), 7.13%, 01/20/2037 | 256,000 | 323,200 | ||||||
| 2,421,040 | ||||||||
CROATIA (2.5%) | ||||||||
Croatia Government International Bond (USD), 6.63%, 07/14/2020 (a) | 700,000 | 776,566 | ||||||
DOMINICAN REPUBLIC (2.6%) | ||||||||
Dominican Republic International Bond | ||||||||
(USD), 7.50%, 05/06/2021 (a) | 370,000 | 420,875 | ||||||
(USD), 7.45%, 04/30/2044 (a) | 360,000 | 402,300 | ||||||
| 823,175 | ||||||||
EL SALVADOR (1.4%) | ||||||||
El Salvador Government International Bond | ||||||||
(USD), 5.88%, 01/30/2025 (a) | 140,000 | 139,650 | ||||||
(USD), 6.38%, 01/18/2027 (a) | 280,000 | 287,000 | ||||||
| 426,650 | ||||||||
GEORGIA (0.7%) | ||||||||
Georgia Government International Bond (USD), 6.88%, 04/12/2021 (a) | 200,000 | 225,540 | ||||||
GHANA (0.6%) | ||||||||
Republic of Ghana (USD), | 200,000 | 201,000 | ||||||
GUATEMALA (0.9%) | ||||||||
Guatemala Government Bond (USD), 5.75%, 06/06/2022 (a) | 260,000 | 285,350 | ||||||
HONDURAS (1.7%) | ||||||||
Honduras Government International Bond (USD), 7.50%, 03/15/2024 (a) | 490,000 | 527,975 | ||||||
INDONESIA (4.5%) | ||||||||
Indonesia Government International Bond | ||||||||
(USD), 6.88%, 01/17/2018 (a) | 100,000 | 112,880 | ||||||
(USD), 5.88%, 03/13/2020 (a) | 400,000 | 447,500 | ||||||
Indonesia Treasury Bond | ||||||||
Series FR71 (IDR), 9.00%, 03/15/2029 | 3,619,000,000 | 314,531 | ||||||
Series FR68 (IDR), 8.38%, 03/15/2034 | 6,366,000,000 | 523,081 | ||||||
| 1,397,992 | ||||||||
IRAQ (0.9%) | ||||||||
Republic of Iraq (USD), 5.80%, 01/15/2028 (a) | 330,000 | 291,225 | ||||||
IVORY COAST (0.9%) | ||||||||
Ivory Coast Government International Bond (USD), 5.75%, 12/31/2032 (a)(d) | 280,000 | 270,256 | ||||||
KAZAKHSTAN (1.0%) | ||||||||
Kazakhstan Government International Bond (USD), 3.88%, 10/14/2024 (a) | 310,000 | 304,575 | ||||||
LATVIA (0.8%) | ||||||||
Republic of Latvia (USD), 2.75%, 01/12/2020 (a) | 250,000 | 247,188 | ||||||
LITHUANIA (0.4%) | ||||||||
Lithuania Government International Bond (USD), 7.38%, 02/11/2020 (a) | 100,000 | 121,000 | ||||||
MEXICO (7.0%) | ||||||||
Mexican Udibonos, Series S (MXN), 4.50%, 11/22/2035 (c) | 2,110,803 | 184,331 | ||||||
Mexico Fixed Rate Bonds | ||||||||
Series M10 (MXN), 8.50%, 12/13/2018 | 3,490,000 | 294,473 | ||||||
Series M (MXN), 8.00%, 06/11/2020 | 5,220,000 | 439,129 | ||||||
Series M (MXN), 7.75%, 11/13/2042 | 4,960,000 | 411,875 | ||||||
Mexico Government International Bond | ||||||||
(USD), 4.00%, 10/02/2023 | 136,000 | 141,984 | ||||||
(USD), 6.05%, 01/11/2040 | 580,000 | 700,350 | ||||||
| 2,172,142 | ||||||||
MONGOLIA (1.5%) | ||||||||
Development Bank of Mongolia LLC (USD), MTN, 5.75%, 03/21/2017 (a) | 210,000 | 203,700 | ||||||
Mongolia Government International Bond (USD), EMTN, 5.13%, 12/05/2022 (a) | 290,000 | 258,100 | ||||||
| 461,800 | ||||||||
MOZAMBIQUE (1.0%) | ||||||||
Mozambique EMATUM Finance 2020 BV (USD), 6.31%, 09/11/2020 (a) | 310,000 | 309,613 | ||||||
PARAGUAY (1.0%) | ||||||||
Republic of Paraguay (USD), | 300,000 | 321,375 | ||||||
PERU (2.3%) | ||||||||
Peru Government Bond (PEN), 7.84%, 08/12/2020 | 350,000 | 138,682 | ||||||
Peruvian Government International Bond | ||||||||
(PEN), 7.84%, 08/12/2020 (a) | 730,000 | 289,250 | ||||||
(PEN), 6.95%, 08/12/2031 (a) | 408,000 | 148,803 | ||||||
(PEN), 6.90%, 08/12/2037 (a) | 360,000 | 129,637 | ||||||
| 706,372 | ||||||||
QATAR (0.9%) | ||||||||
Qatar Government International Bond (USD), 6.40%, 01/20/2040 (a) | 230,000 | 294,975 | ||||||
ROMANIA (3.2%) | ||||||||
Romanian Government International Bond | ||||||||
(USD), EMTN, 6.75%, 02/07/2022 (a) | 690,000 | 826,620 | ||||||
(USD), 6.13%, 01/22/2044 (a) | 140,000 | 163,975 | ||||||
| 990,595 | ||||||||
See accompanying Notes to Financial Statements.
2014 Annual Report
27
Table of Contents
Statement of Investments (continued)
October 31, 2014
Aberdeen Emerging Markets Debt Fund
| Shares or Principal Amount | Value (US$) | |||||||
RUSSIA (2.0%) | ||||||||
Russian Federal Bond — OFZ, Series 6212 (RUB), 7.05%, 01/19/2028 | $ | 16,300,000 | $ | 302,804 | ||||
Russian Foreign Bond — Eurobond (USD), 7.50%, 03/31/2030 (a)(d) | 294,750 | 334,391 | ||||||
| 637,195 | ||||||||
RWANDA (0.8%) | ||||||||
Rwanda International Government Bond, REG S (USD), 6.63%, 05/02/2023 (a) | 250,000 | 258,800 | ||||||
SENEGAL (1.0%) | ||||||||
Senegal Government International Bond (USD), 8.75%, 05/13/2021 (a) | 270,000 | 309,150 | ||||||
SERBIA (0.7%) | ||||||||
Republic of Serbia (USD), 5.25%, 11/21/2017 (a) | 200,000 | 207,000 | ||||||
SOUTH AFRICA (4.4%) | ||||||||
South Africa Government Bond | ||||||||
Series 204 (ZAR), 8.00%, 12/21/2018 | 3,960,000 | 371,240 | ||||||
Series 2030 (ZAR), 8.00%, 01/31/2030 | 4,440,000 | 392,725 | ||||||
South Africa Government International Bond (USD), 5.88%, 05/30/2022 | 550,000 | 621,500 | ||||||
| 1,385,465 | ||||||||
TANZANIA (1.2%) | ||||||||
Tanzania Government International Bond (USD), 6.33%, 03/09/2020 (a)(d) | 340,000 | 367,625 | ||||||
TURKEY (2.2%) | ||||||||
Turkey Government International Bond | ||||||||
(USD), 7.50%, 07/14/2017 | 130,000 | 146,250 | ||||||
(USD), 6.25%, 09/26/2022 | 480,000 | 544,800 | ||||||
| 691,050 | ||||||||
UNITED ARAB EMIRATES (2.1%) | ||||||||
Emirate of Dubai Government International Bonds (USD), EMTN, 7.75%, 10/05/2020 (a) | 520,000 | 650,000 | ||||||
URUGUAY (3.8%) | ||||||||
Uruguay Government International Bond | ||||||||
(UYU), 5.00%, 09/14/2018 (c) | 4,067,084 | 178,975 | ||||||
(UYU), 4.25%, 04/05/2027 (c) | 9,528,058 | 422,447 | ||||||
PIK (USD), 7.88%, 01/15/2033 | 356,000 | 486,830 | ||||||
(USD), 7.63%, 03/21/2036 | 67,445 | 91,894 | ||||||
| 1,180,146 | ||||||||
VENEZUELA (3.7%) | ||||||||
Venezuela Government International Bond | ||||||||
(USD), 12.75%, 08/23/2022 (a) | 1,150,000 | 914,250 | ||||||
(USD), 11.75%, 10/21/2026 (a) | 240,000 | 175,920 | ||||||
(USD), 11.95%, 08/05/2031 (a) | 85,000 | 61,838 | ||||||
| 1,152,008 | ||||||||
ZAMBIA (0.8%) | ||||||||
Zambia Government International Bond (USD), 8.50%, 04/14/2024 (a) | 220,000 | 251,350 | ||||||
Total Government Bonds | 22,248,148 | |||||||
GOVERNMENT AGENCIES (7.6%) | ||||||||
BRAZIL (1.3%) | ||||||||
Banco Nacional de Desenvolvimento Economico e Social | ||||||||
(USD), 6.50%, 06/10/2019 (a) | 220,000 | 244,640 | ||||||
(USD), 5.50%, 07/12/2020 (a) | 160,000 | 171,200 | ||||||
| 415,840 | ||||||||
INDONESIA (2.3%) | ||||||||
Pertamina Persero PT | ||||||||
(USD), 4.88%, 05/03/2022 (a) | 220,000 | 224,400 | ||||||
(USD), 6.00%, 05/03/2042 (a) | 490,000 | 490,000 | ||||||
| 714,400 | ||||||||
KAZAKHSTAN (2.0%) | ||||||||
Kazakhstan Temir Zholy Finance BV (USD), 6.95%, 07/10/2042 (a) | 550,000 | 613,250 | ||||||
MEXICO (1.2%) | ||||||||
Petroleos Mexicanos | ||||||||
(USD), 6.63%, 06/15/2038 | 170,000 | 197,455 | ||||||
(USD), 6.50%, 06/02/2041 | 110,000 | 128,700 | ||||||
(USD), 6.38%, 01/23/2045 | 50,000 | 57,370 | ||||||
| 383,525 | ||||||||
RUSSIA (0.4%) | ||||||||
Vnesheconombank Via VEB Finance PLC (USD), 6.90%, 07/09/2020 (a) | 120,000 | 122,550 | ||||||
VENEZUELA (0.4%) | ||||||||
Petroleos de Venezuela SA (USD), 8.50%, 11/02/2017 (a) | 180,000 | 136,332 | ||||||
Total Government Agencies | 2,385,897 | |||||||
REPURCHASE AGREEMENT (1.7%) | ||||||||
UNITED STATES (1.7%) | ||||||||
Repurchase Agreement, Fixed Income Clearing Corp., 0.00%, dated 10/31/2014, due 11/03/2014, repurchase price $519,000, collateralized by U.S. Treasury Note, maturing 10/31/2021; total market value of $533,612 | 519,000 | 519,000 | ||||||
Total Repurchase Agreement | 519,000 | |||||||
Total Investments | 30,690,225 | |||||||
Other assets in excess of liabilities—1.7% | 523,424 | |||||||
Net Assets—100.0% | $ | 31,213,649 | ||||||
See accompanying Notes to Financial Statements.
Annual Report 2014
28
Table of Contents
Statement of Investments (concluded)
October 31, 2014
Aberdeen Emerging Markets Debt Fund
| (a) | Denotes a security issued under Regulation S or Rule 144A. |
| (b) | Perpetual bond. This is a bond that has no maturity date, is redeemable and pays a steady stream of interest indefinitely. |
| (c) | Inflation linked security. |
| (d) | Variable or Floating Rate Security. Rate disclosed is as of October 31, 2014. |
| (e) | See Notes to Financial Statements for tax unrealized appreciation/depreciation of securities. |
| ARS | Argentine Peso |
| BRL | Brazilian Real |
| CNH | Chinese Yuan Renminbi Offshore |
| EMTN | Euro Medium Term Note |
| IDR | Indonesian Rupiah |
| INR | Indian Rupee |
| MTN | Medium Term Note |
| MXN | Mexican Peso |
| PEN | Peruvian Nuevo Sol |
| PHP | Philippine Peso |
| PIK | Payment In Kind |
| RUB | New Russian Ruble |
| USD | U.S. Dollar |
| UYU | Uruguayan Peso |
| ZAR | South African Rand |
At October 31, 2014, the Fund’s open forward foreign currency exchange contracts were as follows:
| Purchase Contracts Settlement Date* | Counterparty | Amount Purchased | Amount Sold | Fair Value | Unrealized Appreciation/ (Depreciation) | |||||||||||||||||||||
| Argentine Peso/United States Dollar | ||||||||||||||||||||||||||
05/08/2015 | Barclays Bank | ARS | 1,272,000 | USD | 118,133 | $ | 122,948 | $ | 4,815 | |||||||||||||||||
05/08/2015 | Citibank | ARS | 1,274,000 | USD | 124,414 | 123,141 | (1,273 | ) | ||||||||||||||||||
| Brazilian Real/United States Dollar | ||||||||||||||||||||||||||
11/28/2014 | JPMorgan Chase | BRL | 694,000 | USD | 288,386 | 278,038 | (10,347 | ) | ||||||||||||||||||
| Indian Rupee/United States Dollar | ||||||||||||||||||||||||||
11/28/2014 | HSBC | INR | 56,641,000 | USD | 918,528 | 917,917 | (610 | ) | ||||||||||||||||||
| Mexican Peso/United States Dollar | ||||||||||||||||||||||||||
01/16/2015 | UBS | MXN | 276,000 | USD | 20,404 | 20,411 | 6 | |||||||||||||||||||
| Philippine Peso/United States Dollar | ||||||||||||||||||||||||||
11/28/2014 | Goldman Sachs | PHP | 27,448,000 | USD | 627,928 | 611,167 | (16,762 | ) | ||||||||||||||||||
| South African Rand/United States Dollar | ||||||||||||||||||||||||||
| 01/16/2015 | Barclays Bank | ZAR | 500,000 | USD | 43,883 | 44,778 | 894 | |||||||||||||||||||
| $ | 2,118,400 | $ | (23,277 | ) | ||||||||||||||||||||||
| Sale Contracts Settlement Date* | Counterparty | Amount Purchased | Amount Sold | Fair Value | Unrealized Appreciation/ (Depreciation) | |||||||||||||||||||||
| United States Dollar/Brazilian Real | ||||||||||||||||||||||||||
11/28/2014 | Citibank | USD | 317,023 | BRL | 758,000 | $ | 303,679 | $ | 13,344 | |||||||||||||||||
11/28/2014 | JPMorgan Chase | USD | 1,570,982 | BRL | 3,675,000 | 1,472,320 | 98,662 | |||||||||||||||||||
| United States Dollar/Indonesian Rupiah | ||||||||||||||||||||||||||
11/28/2014 | Citibank | USD | 204,531 | IDR | 2,455,016,000 | 202,382 | 2,149 | |||||||||||||||||||
| United States Dollar/Mexican Peso | ||||||||||||||||||||||||||
01/16/2015 | Citibank | USD | 137,802 | MXN | 1,875,000 | 138,658 | (856 | ) | ||||||||||||||||||
| United States Dollar/Peruvian Nouveau Sol | ||||||||||||||||||||||||||
11/28/2014 | JPMorgan Chase | USD | 567,173 | PEN | 1,654,000 | 564,405 | 2,768 | |||||||||||||||||||
11/28/2014 | UBS | USD | 108,479 | PEN | 310,000 | 105,783 | 2,696 | |||||||||||||||||||
| United States Dollar/South African Rand | ||||||||||||||||||||||||||
| 01/16/2015 | JPMorgan Chase | USD | 746,813 | ZAR | 8,441,000 | 755,934 | (9,121 | ) | ||||||||||||||||||
| $ | 3,543,161 | $ | 109,642 | |||||||||||||||||||||||
| * | Certain contracts with different trade dates and like characteristics have been shown net. |
See accompanying Notes to Financial Statements.
2014 Annual Report
29
Table of Contents
Aberdeen Emerging Markets Debt Local Currency Fund (Unaudited)
The Aberdeen Emerging Markets Debt Local Currency Fund (Class A shares at net asset value net of fees) returned -3.53% for the 12-month period ended October 31, 2014, versus the -2.68% return of its benchmark, the J.P. Morgan GBI-EM Global Diversified Index, for the same period. For broader comparison, the average return of the Fund’s Lipper peer category of Emerging Markets Local Currency Debt Funds (consisting of 35 funds) was 4.50% for the period.
Emerging markets (EM) local currency debt, as measured by the J.P. Morgan GBI-EM Global Diversified Index, returned -2.68% for the reporting period. Country returns were mixed, as Nigeria, Thailand and Mexico were the top performers within the Index, while Russia declined significantly as a result of the poor investor sentiment surrounding the sanctions imposed on the country in the wake of the expansion of its military presence in the Crimea region of Ukraine. Emerging market currencies were the prime cause of the underperformance of the asset class versus its developed-market debt counterparts as none of the constituents of the J.P. Morgan GBI-EM Global Diversified Index had positive currency returns in spot terms.
Following the “taper tantrum” earlier in 2013, emerging markets experienced an unexpected, positive surprise at the start of the review period when the U.S. Federal Open Market Committee (FOMC) decided against tapering its asset purchases, given that it remained unconvinced by the scale of the U.S. economic recovery. This sparked a robust rally, as investors appeared to believe that market had reached an equilibrium level and that value had returned to EM assets.
Improved U.S. economic data in November 2013 subsequently led to a growing sense in the market that the U.S. Federal Reserve (Fed) was unlikely to wait too long before starting its tapering. Thereafter, the Fed announced in December that it would start to taper its asset purchases by $10 billion beginning in January 2014. The program was reduced by a further $10 billion monthly, until the end of the period in late October. The Fed’s tapering initially weighed on emerging market sentiment; however, there was a turnaround in February attributable to what we viewed as supportive and pragmatic measures by emerging market central banks, as well as investors’ realization that certain idiosyncratic events were not indicative of wider contagion.
EM debt continued to post gains throughout the summer months, as investors focused on the yield differential between emerging and developed markets, rather than geopolitical tensions between Russia and Ukraine. The key themes of last year, including the “Fragile Five”1 and external vulnerabilities, ceased to be as important, in our opinion, given the clear improvement in the fundamentals of many countries.
While declines in hard currency sovereign and corporate bonds were somewhat tempered, emerging market currencies weakened significantly towards September 2014 when the J.P. Morgan Emerging Markets Currency Index2 declined to levels last seen at the height of the credit crunch in 2009. While election and geopolitical risks may have accounted for a decline in the Brazilian real and Russian ruble over the annual period, the broader underperformance relative to developed-market currencies was due to a strengthening U.S. dollar, which reflected the improving U.S. economy and softer growth expectations for China.
While the Fund used derivatives during the reporting period, they had minimal impact on performance.
Emerging market debt rebounded towards the end of the reporting period in October, reversing much of the negativity experienced across the asset class in September. U.S. Treasuries experienced a roller coaster ride, as the yield on the 10-year note fell by 37 basis point (and its price consequently rose) over the first half of the month before relinquishing some of these price gains by the end of October.
The Fund outperformed versus the benchmark J.P. Morgan GBI-EM Global Diversified Index over the reporting period. An overweight relative to the benchmark in Russia given the geopolitical crisis was one of the main detractors from performance, along with an overweight in Brazil and a position in Uruguay inflation-linked bonds, which are not represented in the benchmark index. Conversely, Fund performance was bolstered by underweight positions in Poland, Turkey and Hungary, as well as the exposure to the Indian rupee.
With regard to derivatives, the Fund’s use of currency forwards had a negative impact on performance over the reporting period.
In terms of Fund activity during the reporting period, we exited the position in Brazilian global bonds in favor of the country’s local law3 10-year equivalent. We reduced the Fund’s position in Nigerian bonds and the allocation to Russian bonds in an effort to target an underweight position relative to the benchmark. We increased the Fund’s exposure to South Africa, Colombia, Mexico and Peru. In terms of currency exposure, we decreased positions in the Brazilian real and Indian rupee and added to the exposure to the Philippine peso. Additionally, we established a new Argentine peso position and reduced the Fund’s underweight to the Colombian peso.
As we move into 2015, we have seen a significant number of the major U.S. economists cut their U.S. Treasury yield forecasts, which we feel highlights the upside risks to emerging market debt as the “search for yield” most likely should remain strong. The decline in global commodity prices affects emerging markets in different ways but puts additional pressures on those countries whose fiscal breakeven oil price4 has risen significantly over the last five years. The Ebola pandemic also highlights some of the risks of investing in sub-Saharan African credits as the countries which have suffered the
| 1 | The “Fragile Five” economies are those that are considered to have become too dependent on skittish foreign investment to finance their growth ambitions: Turkey, Brazil, India, South Africa and Indonesia. |
| 2 | The J.P. Morgan Emerging Markets Currency Index tracks the performance of emerging market currency exchange rates. Indexes are unmanaged and have been provided for comparison purposes only. No fees or expenses are reflected. You cannot invest directly in an index. |
| 3 | Local law bonds are subject to regulation by the issuing country rather than the countries in which they are sold. |
| 4 | The fiscal breakeven oil price is the average price at which the budget of an oil-exporting country is balanced in a given year. |
Annual Report 2014
30
Table of Contents
Aberdeen Emerging Markets Debt Local Currency Fund (Unaudited) (concluded)
worst outbreaks (Senegal, Guinea, Sierra Leone and Liberia) are in proximity to the three counties (Nigeria, Ghana and Ivory Coast) which produce nearly 60% of global cocoa. We believe that ongoing currency weakness is also a risk as the market is increasingly expressing any negative sentiment in this part of the asset class.
Portfolio Management:
Aberdeen Emerging Markets Debt Team
PAST PERFORMANCE DOES NOT GUARANTEE FUTURE RESULTS.
The performance data quoted represents past performance and current returns may be lower or higher. Class A Shares have up to a 4.25% front-end sales charge and a 0.25% 12b-1 fee. The investment return and principal value will fluctuate so that an investor’s shares, when redeemed, may be worth more or less than the original cost. To obtain performance information current to the most recent month-end, which may be higher or lower than the performance shown above, please call 866-667-9231 or go to www.aberdeen-asset.us.
Investing in mutual funds involves risk, including the possible loss of principal.
Indexes are unmanaged and have been provided for comparison purposes only. No fees or expenses are reflected. You cannot invest directly in an index.
Lipper is a leading global provider of mutual fund information and analysis to fund companies, financial intermediaries and media organizations.
Risk Considerations
Fixed income securities are subject to certain risks including, but not limited to: interest rate (changes in interest rates may cause a decline in the market value of an investment), credit (changes in the financial condition of the issuer, borrower, counterparty, or underlying collateral), prepayment (debt issuers may repay or refinance their loans or obligations earlier than anticipated), and extension (principal repayments may not occur as quickly as anticipated, causing the expected maturity of a security to increase). The Fund’s investments in high-yield bonds and other lower-rated securities will subject the Fund to substantial risk of loss.
Foreign securities are more volatile, harder to price and less liquid than U.S. securities and are subject to different accounting and regulatory standards, and political and economic risks. These risks are enhanced in emerging markets countries.
The Fund is non-diversified and may hold larger positions in fewer securities than other funds and have greater risk than more diversified funds.
Derivatives are speculative and may hurt the Fund’s performance. They present the risk of disproportionately increased losses and/or reduced gains when the financial asset or measure to which the derivative is linked changes in unexpected ways.
Please read the prospectus for more detailed information regarding these and other risks.
2014 Annual Report
31
Table of Contents
Aberdeen Emerging Markets Debt Local Currency Fund (Unaudited)
Average Annual Total Return (For periods ended October 31, 2014) | 1 Yr. | Inception1 | ||||||||
Class A | w/o SC | (3.53% | ) | (1.81% | ) | |||||
| w/SC2 | (7.67% | ) | (3.01% | ) | ||||||
Class C | w/o SC | (4.28% | ) | (2.54% | ) | |||||
| w/SC3 | (5.23% | ) | (2.54% | ) | ||||||
Class R4 | w/o SC | (4.04% | ) | (2.15% | ) | |||||
Institutional Service Class4 | w/o SC | (3.36% | ) | (1.58% | ) | |||||
Institutional Class4 | w/o SC | (3.25% | ) | (1.54% | ) | |||||
All figures showing the effect of a sales charge (SC) reflect the maximum charge possible because it has the most significant effect on performance data. The total returns shown above do not include the impact of financial statement rounding of the net asset value per share and/or financial statement adjustments.
| 1 | The Fund commenced operations on May 2, 2011. |
| 2 | A 4.25% front-end sales charge was deducted. |
| 3 | A 1.00% contingent deferred sales charge (CDSC) was deducted from the one year return because it is charged when Class C shares are sold within the first year after purchase. |
| 4 | Not subject to any sales charges. |
Annual Report 2014
32
Table of Contents
Aberdeen Emerging Markets Debt Local Currency Fund (Unaudited)
Performance of a $10,000 Investment (as of October 31, 2014)
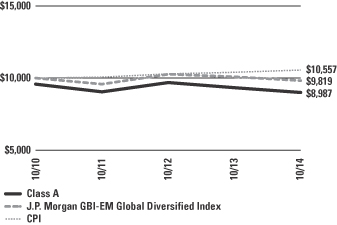
Comparative performance of $10,000 invested in Class A shares of the Aberdeen Emerging Markets Debt Local Currency Fund, J.P. Morgan Government Bond Index Emerging Markets (GBI-EM) Global Diversified Index and the Consumer Price Index (CPI) since inception. Unlike the Fund, the returns for these unmanaged indexes do not reflect and fees, expenses, or sales charges. Investors cannot invest directly in market indexes.
The J.P. Morgan GBI-EM Global Diversified Index is an alternatively weighted index that assigns weightings among countries by limiting the weights of countries with larger debt stocks and redistributes those weights to countries with smaller weights. The index consists of local currency denominated, government debt issued in emerging markets countries including: Brazil, Chile, Colombia, Hungary, Indonesia, Malaysia, Mexico, Nigeria, Peru, Philippines, Poland, Romania, Russia, South Africa, Thailand, and Turkey.
The CPI represents changes in prices of a basket of goods and services purchased for consumption by urban households.
Investment return and principal value will fluctuate, and when redeemed, shares may be worth more or less than original cost. Past performance is no guarantee of future results. The Average Annual Total Return table and Performance graph do not reflect the deduction of taxes that a shareholder would pay on fund distributions or the redemption of fund shares. Investing in mutual funds involves market risk, including loss of principal. Performance returns assume the reinvestment of all distributions. Total returns reflect waivers and reimbursements in effect, without which returns would have been lower.
Portfolio Summary (as a percentage of net assets)
October 31, 2014 (Unaudited)
| Asset Allocation | ||||
Government Bonds | 74.9% | |||
Government Agencies | 10.4% | |||
Corporate Bonds | 10.0% | |||
Repurchase Agreement | 1.2% | |||
Other assets in excess of liabilities | 3.5% | |||
| 100.0% | ||||
The following chart summarizes the composition of the Fund’s portfolio, expressed as a percentage of net assets. The industries listed below may include more than one industry group. As of October 31, 2014, the Fund did not have more than 25% of its assets invested in any industry group.
| Top Industries | ||||
Commercial Banks | 5.1% | |||
Oil, Gas & Consumable Fuels | 4.9% | |||
Other | 90.0% | |||
| 100.0% | ||||
| Top Holdings* | ||||
South Africa Government Bond, Series R207 01/15/2020 | 5.6% | |||
Petrobras Global Finance BV 05/20/2016 | 4.9% | |||
Mexico Fixed Rate Bonds, Series M 06/11/2020 | 4.3% | |||
Brazil Notas do Tesouro Nacional, Series F 01/01/2021 | 3.9% | |||
Turkey Government Bond 06/17/2015 | 3.5% | |||
Colombia Government International Bond 04/14/2021 | 3.3% | |||
Indonesia Treasury Bond, Series FR59 05/15/2027 | 3.3% | |||
RZD Capital PLC 04/02/2019 | 3.2% | |||
Banco Votorantim SA 05/16/2016 | 2.6% | |||
Mexico Fixed Rate Bonds, Series M 11/13/2042 | 2.6% | |||
Other | 62.8% | |||
| 100.0% | ||||
| Top Countries | ||||
Brazil | 18.9% | |||
Mexico | 12.9% | |||
South Africa | 12.6% | |||
Indonesia | 9.4% | |||
Turkey | 8.2% | |||
Russia | 7.0% | |||
Malaysia | 6.5% | |||
Thailand | 4.7% | |||
Colombia | 4.6% | |||
Hungary | 3.3% | |||
Other | 11.9% | |||
| 100.0% | ||||
| * | For the purpose of listing top holdings, repurchase agreements are included as part of Other. |
2014 Annual Report
33
Table of Contents
Statement of Investments
October 31, 2014
Aberdeen Emerging Markets Debt Local Currency Fund
| Shares or Principal Amount | Value (US$) | |||||||
CORPORATE BONDS (10.0%) | ||||||||
BRAZIL (10.0%) | ||||||||
Commercial Banks (5.1%) | ||||||||
Banco do Brasil SA (BRL), 9.75%, 07/18/2017 (a) | $ | 1,985,000 | $ | 765,033 | ||||
Banco Votorantim SA (BRL), EMTN, 6.25%, 05/16/2016 (a)(b) | 1,790,000 | 819,748 | ||||||
| 1,584,781 | ||||||||
Oil, Gas & Consumable Fuels (4.9%) | ||||||||
Petrobras Global Finance BV (USD), 1.85%, 05/20/2016 (c) | 1,535,000 | 1,535,000 | ||||||
| 3,119,781 | ||||||||
Total Corporate Bonds | 3,119,781 | |||||||
GOVERNMENT BONDS (74.9%) | ||||||||
BRAZIL (8.9%) | ||||||||
Brazil Notas do Tesouro Nacional | ||||||||
Series B (BRL), 6.00%, 08/15/2020 (b) | 150,000 | 151,604 | ||||||
Series F (BRL), 10.00%, 01/01/2021 | 3,290,000 | 1,211,557 | ||||||
Series F (BRL), 10.00%, 01/01/2023 | 2,020,000 | 728,717 | ||||||
Series B (BRL), 6.00%, 08/15/2024 (b) | 110,000 | 111,360 | ||||||
Series F (BRL), 10.00%, 01/01/2025 | 1,560,000 | 557,102 | ||||||
| 2,760,340 | ||||||||
COLOMBIA (4.6%) | ||||||||
Colombia Government International Bond | ||||||||
(COP), 7.75%, 04/14/2021 | 1,964,000,000 | 1,038,844 | ||||||
(COP), 4.38%, 03/21/2023 | 570,000,000 | 244,483 | ||||||
(COP), 9.85%, 06/28/2027 | 259,000,000 | 161,090 | ||||||
| 1,444,417 | ||||||||
HUNGARY (3.3%) | ||||||||
Hungary Government Bond | ||||||||
Series 16\C (HUF), 5.50%, 02/12/2016 | 114,500,000 | 488,477 | ||||||
Series 22\A (HUF), 7.00%, 06/24/2022 | 48,300,000 | 238,372 | ||||||
Series 25\B (HUF), 5.50%, 06/24/2025 | 63,010,000 | 290,595 | ||||||
| 1,017,444 | ||||||||
INDONESIA (9.4%) | ||||||||
Indonesia Treasury Bond | ||||||||
Series FR69 (IDR), 7.88%, 04/15/2019 | 1,500,000,000 | 124,245 | ||||||
Series FR59 (IDR), 7.00%, 05/15/2027 | 13,741,000,000 | 1,024,463 | ||||||
Series FR71 (IDR), 9.00%, 03/15/2029 | 7,344,000,000 | 638,275 | ||||||
Series FR54 (IDR), 9.50%, 07/15/2031 | 6,756,000,000 | 607,956 | ||||||
Series FR68 (IDR), 8.38%, 03/15/2034 | 6,203,000,000 | 509,688 | ||||||
| 2,904,627 | ||||||||
MALAYSIA (4.2%) | ||||||||
Malaysia Government Bond | ||||||||
Series 0210 (MYR), 4.01%, 09/15/2017 | 2,400,000 | 738,075 | ||||||
Series 0112 (MYR), 3.42%, 08/15/2022 | 1,930,000 | 570,828 | ||||||
| 1,308,903 | ||||||||
MEXICO (11.0%) | ||||||||
Mexican Bonos, Series M (MXN), 6.50%, 06/10/2021 | 2,750,000 | 214,678 | ||||||
Mexican Udibonos, Series S (MXN), 4.50%, 11/22/2035 (b) | $ | 2,771,242 | $ | 242,005 | ||||
Mexico Fixed Rate Bonds | ||||||||
Series M10 (MXN), 8.50%, 12/13/2018 | 5,800,000 | 489,383 | ||||||
Series M (MXN), 8.00%, 06/11/2020 | 15,770,000 | 1,326,642 | ||||||
Series M30 (MXN), 8.50%, 11/18/2038 | 3,465,000 | 309,776 | ||||||
Series M (MXN), 7.75%, 11/13/2042 | 9,870,000 | 819,597 | ||||||
| 3,402,081 | ||||||||
PERU (2.5%) | ||||||||
Peruvian Government International Bond | ||||||||
(PEN), 5.20%, 09/12/2023 (a) | 725,000 | 244,645 | ||||||
(PEN), 6.95%, 08/12/2031 (a) | 1,465,000 | 534,306 | ||||||
| 778,951 | ||||||||
POLAND (2.2%) | ||||||||
Poland Government Bond | ||||||||
Series 1020 (PLN), 5.25%, 10/25/2020 | 570,000 | 198,780 | ||||||
Series 0429 (PLN), 5.75%, 04/25/2029 | 1,236,000 | 497,107 | ||||||
| 695,887 | ||||||||
RUSSIA (3.8%) | ||||||||
Russian Federal Bond — OFZ | ||||||||
Series 5077 (RUB), 7.35%, 01/20/2016 | 14,100,000 | 319,469 | ||||||
Series 6211 (RUB), 7.00%, 01/25/2023 | 29,250,000 | 573,980 | ||||||
Series 6212 (RUB), 7.05%, 01/19/2028 | 14,940,000 | 277,540 | ||||||
| 1,170,989 | ||||||||
SOUTH AFRICA (10.9%) | ||||||||
South Africa Government Bond | ||||||||
Series R207 (ZAR), 7.25%, 01/15/2020 | 19,020,000 | 1,722,375 | ||||||
Series R186 (ZAR), 10.50%, 12/21/2026 | 2,650,000 | 288,407 | ||||||
Series 2030 (ZAR), 8.00%, 01/31/2030 | 8,850,000 | 782,798 | ||||||
Series R209 (ZAR), 6.25%, 03/31/2036 | 8,310,000 | 587,198 | ||||||
| 3,380,778 | ||||||||
THAILAND (3.4%) | ||||||||
Thailand Government Bond | ||||||||
(THB), 2.80%, 10/10/2017 | 18,948,000 | 587,123 | ||||||
Series ILB (THB), 1.20%, 07/14/2021 (a)(b) | 16,234,463 | 482,585 | ||||||
| 1,069,708 | ||||||||
TURKEY (8.2%) | ||||||||
Turkey Government Bond | ||||||||
(TRY), 10.00%, 06/17/2015 | 2,380,000 | 1,081,234 | ||||||
(TRY), 8.80%, 11/14/2018 | 360,000 | 165,046 | ||||||
Series CPI (TRY), 4.00%, 04/01/2020 (b) | 819,822 | 412,557 | ||||||
(TRY), 9.50%, 01/12/2022 | 520,000 | 246,355 | ||||||
(TRY), 9.00%, 07/24/2024 | 1,350,000 | 626,212 | ||||||
| 2,531,404 | ||||||||
URUGUAY (2.5%) | ||||||||
Uruguay Government International Bond | ||||||||
(UYU), 5.00%, 09/14/2018 (b) | 12,572,674 | 553,271 | ||||||
(UYU), 4.25%, 04/05/2027 (b) | 4,964,619 | 220,117 | ||||||
| 773,388 | ||||||||
Total Government Bonds | 23,238,917 | |||||||
See accompanying Notes to Financial Statements.
Annual Report 2014
34
Table of Contents
Statement of Investments (continued)
October 31, 2014
Aberdeen Emerging Markets Debt Local Currency Fund
| Shares or Principal Amount | Value (US$) | |||||||
GOVERNMENT AGENCIES (10.4%) | ||||||||
MALAYSIA (2.3%) | ||||||||
Cagamas MBS Bhd, Series 4 (MYR), 3.90%, 05/29/2017 | $ | 2,300,000 | $ | 697,400 | ||||
MEXICO (1.9%) | ||||||||
Petroleos Mexicanos (MXN), 9.10%, 01/27/2020 | 7,090,000 | 601,033 | ||||||
RUSSIA (3.2%) | ||||||||
RZD Capital PLC (RUB), | 48,400,000 | 1,005,951 | ||||||
SOUTH AFRICA (1.7%) | ||||||||
Eskom Holdings SOC Ltd., Series E170 (ZAR), | 4,500,000 | 520,172 | ||||||
THAILAND (1.3%) | ||||||||
Bank of Thailand, Series 3YR (THB), 2.95%, 01/14/2016 | 12,700,000 | 393,578 | ||||||
Total Government Agencies | 3,218,134 | |||||||
REPURCHASE AGREEMENT (1.2%) | ||||||||
UNITED STATES (1.2%) | ||||||||
Repurchase Agreement, Fixed Income Clearing Corp., 0.00%, dated 10/31/2014, due 11/03/2014, repurchase price $366,408, collateralized by U.S. Treasury Note, maturing 05/31/2021; total market value of $377,813 | 366,408 | 366,408 | ||||||
Total Repurchase Agreement | 366,408 | |||||||
Total Investments | 29,943,240 | |||||||
Other assets in excess of liabilities—3.5% | 1,090,970 | |||||||
Net Assets—100.0% | $ | 31,034,210 | ||||||
| (a) | Denotes a security issued under Regulation S or Rule 144A. |
| (b) | Inflation linked security. |
| (c) | Variable or Floating Rate Security. Rate disclosed is as of October 31, 2014. |
| (d) | See Notes to Financial Statements for tax unrealized appreciation/depreciation of securities. |
| ARS | Argentine Peso |
| BRL | Brazilian Real |
| COP | Colombian Peso |
| EMTN | Euro Medium Term Note |
| HUF | Hungarian Forint |
| IDR | Indonesian Rupiah |
| INR | Indian Rupee |
| MXN | Mexican Peso |
| MYR | Malaysian Ringgit |
| NGN | Nigerian Naira |
| PEN | Peruvian Nuevo Sol |
| PHP | Philippine Peso |
| PLN | Polish Zloty |
| RUB | New Russian Ruble |
| THB | Thai Baht |
| TRY | Turkish Lira |
| USD | U.S. Dollar |
| UYU | Uruguayan Peso |
| ZAR | South African Rand |
See accompanying Notes to Financial Statements.
2014 Annual Report
35
Table of Contents
Statement of Investments (continued)
October 31, 2014
Aberdeen Emerging Markets Debt Local Currency Fund
At October 31, 2014, the Fund’s open forward foreign currency exchange contracts were as follows:
| Purchase Contracts Settlement Date* | Counterparty | Amount Purchased | Amount Sold | Fair Value | Unrealized Appreciation/ (Depreciation) | |||||||||||||||||||||
| Argentine Peso/United States Dollar | ||||||||||||||||||||||||||
05/08/2015 | Barclays Bank | ARS | 1,189,000 | USD | 110,425 | $ | 114,926 | $ | 4,501 | |||||||||||||||||
05/08/2015 | Citibank | ARS | 4,357,000 | USD | 411,738 | 421,136 | 9,398 | |||||||||||||||||||
| Brazilian Real/United States Dollar | ||||||||||||||||||||||||||
11/28/2014 | Barclays Bank | BRL | 457,000 | USD | 194,908 | 183,089 | (11,819 | ) | ||||||||||||||||||
| Colombian Peso/United States Dollar | ||||||||||||||||||||||||||
11/28/2014 | Barclays Bank | COP | 157,402,000 | USD | 79,196 | 76,303 | (2,893 | ) | ||||||||||||||||||
11/28/2014 | Citibank | COP | 401,266,000 | USD | 207,872 | 194,519 | (13,353 | ) | ||||||||||||||||||
11/28/2014 | UBS | COP | 697,448,000 | USD | 359,639 | 338,096 | (21,543 | ) | ||||||||||||||||||
| Indian Rupee/United States Dollar | ||||||||||||||||||||||||||
11/28/2014 | HSBC | INR | 61,826,000 | USD | 1,002,611 | 1,001,945 | (666 | ) | ||||||||||||||||||
| Indonesian Rupiah/United States Dollar | ||||||||||||||||||||||||||
11/28/2014 | Barclays Bank | IDR | 787,066,000 | USD | 65,452 | 64,882 | (570 | ) | ||||||||||||||||||
| Malaysian Ringgit/United States Dollar | ||||||||||||||||||||||||||
11/28/2014 | HSBC | MYR | 3,008,000 | USD | 944,131 | 912,874 | (31,257 | ) | ||||||||||||||||||
| Mexican Peso/United States Dollar | ||||||||||||||||||||||||||
01/16/2015 | UBS | MXN | 2,646,000 | USD | 195,616 | 195,674 | 58 | |||||||||||||||||||
| New Russian Ruble/United States Dollar | ||||||||||||||||||||||||||
11/28/2014 | Barclays Bank | RUB | 12,386,000 | USD | 312,599 | 286,076 | (26,523 | ) | ||||||||||||||||||
| Nigerian Naira/United States Dollar | ||||||||||||||||||||||||||
11/28/2014 | HSBC | NGN | 27,409,000 | USD | 166,620 | 164,397 | (2,223 | ) | ||||||||||||||||||
| Peruvian Nouveau Sol/United States Dollar | ||||||||||||||||||||||||||
11/28/2014 | Barclays Bank | PEN | 144,000 | USD | 49,281 | 49,138 | (143 | ) | ||||||||||||||||||
| Philippine Peso/United States Dollar | ||||||||||||||||||||||||||
11/28/2014 | Goldman Sachs | PHP | 51,339,000 | USD | 1,174,483 | 1,143,132 | (31,351 | ) | ||||||||||||||||||
| Polish Zloty/United States Dollar | ||||||||||||||||||||||||||
| 01/16/2015 | Citibank | PLN | 7,125,000 | USD | 2,145,189 | 2,108,424 | (36,765 | ) | ||||||||||||||||||
| $ | 7,254,611 | $ | (165,149 | ) | ||||||||||||||||||||||
| * | Certain contracts with different trade dates and like characteristics have been shown net. |
See accompanying Notes to Financial Statements.
Annual Report 2014
36
Table of Contents
Statement of Investments (concluded)
October 31, 2014
Aberdeen Emerging Markets Debt Local Currency Fund
| Sale Contracts Settlement Date* | Counterparty | Amount Purchased | Amount Sold | Fair Value | Unrealized Appreciation/ (Depreciation) | |||||||||||||||||||||
| United States Dollar/Brazilian Real | ||||||||||||||||||||||||||
11/28/2014 | JPMorgan Chase | USD | 1,286,282 | BRL | 3,009,000 | $ | 1,205,500 | $ | 80,782 | |||||||||||||||||
| United States Dollar/Colombian Peso | ||||||||||||||||||||||||||
11/28/2014 | JPMorgan Chase | USD | 91,181 | COP | 185,959,000 | 90,146 | 1,035 | |||||||||||||||||||
| United States Dollar/Hungarian Forint | ||||||||||||||||||||||||||
01/16/2015 | Citibank | USD | 93,216 | HUF | 22,510,000 | 91,407 | 1,809 | |||||||||||||||||||
01/16/2015 | Goldman Sachs | USD | 355,917 | HUF | 86,438,000 | 351,003 | 4,914 | |||||||||||||||||||
| United States Dollar/Indian Rupee | ||||||||||||||||||||||||||
11/28/2014 | UBS | USD | 76,112 | INR | 4,741,000 | 76,832 | (720 | ) | ||||||||||||||||||
| United States Dollar/Indonesian Rupiah | ||||||||||||||||||||||||||
11/28/2014 | Citibank | USD | 86,381 | IDR | 1,050,309,000 | 86,583 | (202 | ) | ||||||||||||||||||
| United States Dollar/Malaysian Ringgit | ||||||||||||||||||||||||||
11/28/2014 | UBS | USD | 168,733 | MYR | 554,000 | 168,129 | 604 | |||||||||||||||||||
| United States Dollar/Mexican Peso | ||||||||||||||||||||||||||
11/28/2014 | Barclays Bank | USD | 165,268 | MXN | 2,228,000 | 165,213 | 55 | |||||||||||||||||||
| United States Dollar/New Russian Ruble | ||||||||||||||||||||||||||
11/28/2014 | JPMorgan Chase | USD | 146,711 | RUB | 5,889,000 | 136,016 | 10,695 | |||||||||||||||||||
| United States Dollar/Nigerian Naira | ||||||||||||||||||||||||||
11/28/2014 | HSBC | USD | 165,663 | NGN | 27,409,000 | 164,397 | 1,266 | |||||||||||||||||||
| United States Dollar/Peruvian Nouveau Sol | ||||||||||||||||||||||||||
11/28/2014 | UBS | USD | 829,338 | PEN | 2,370,000 | 808,730 | 20,608 | |||||||||||||||||||
| United States Dollar/Philippine Peso | ||||||||||||||||||||||||||
11/28/2014 | HSBC | USD | 328,251 | PHP | 14,337,000 | 319,233 | 9,018 | |||||||||||||||||||
11/28/2014 | UBS | USD | 79,790 | PHP | 3,583,000 | 79,780 | 10 | |||||||||||||||||||
| United States Dollar/South African Rand | ||||||||||||||||||||||||||
01/16/2015 | Citibank | USD | 109,781 | ZAR | 1,245,000 | 111,496 | (1,715 | ) | ||||||||||||||||||
01/16/2015 | JPMorgan Chase | USD | 683,111 | ZAR | 7,721,000 | 691,454 | (8,343 | ) | ||||||||||||||||||
| United States Dollar/Thai Baht | ||||||||||||||||||||||||||
01/16/2015 | JPMorgan Chase | USD | 1,259,672 | THB | 41,054,000 | 1,255,201 | 4,471 | |||||||||||||||||||
| United States Dollar/Turkish Lira | ||||||||||||||||||||||||||
| 01/16/2015 | Barclays Bank | USD | 48,859 | TRY | 114,000 | 50,480 | (1,621 | ) | ||||||||||||||||||
| $ | 5,851,600 | $ | 122,666 | |||||||||||||||||||||||
| * | Certain contracts with different trade dates and like characteristics have been shown net. |
See accompanying Notes to Financial Statements.
2014 Annual Report
37
Table of Contents
Aberdeen Global Fixed Income Fund (Unaudited)
The Aberdeen Global Fixed Income Fund (Class A shares at net asset value net of fees) returned -0.05% for the one-year period ended October 31, 2014, versus the 0.22% return for its benchmark, the Barclays Global Aggregate Bond Index, for the same period. For broader comparison, the average return of the Fund’s Lipper peer category of Global Income Funds (consisting of 70 funds) was 2.76% for the period.
The global bond markets experienced continued volatility over the reporting period, which increased more significantly in August and October. Concerns over faltering global economic growth, combined with heightened fear of Europe experiencing potential deflation, drove much of the period’s uncertainty. Furthermore, investors have remained concerned about the Ebola pandemic in terms of its impact on global growth and on geopolitical crises such as those in the Middle East and Ukraine. There was continued evidence that China’s historically high economic growth rates were slowing despite the Chinese government’s best efforts to maintain the robust economic expansion. Finally, Japanese monetary and fiscal authorities surprised markets with another round of quantitative easing (QE), as well as shifts in government–administered pension plans which favor non-Japanese assets such as global equities and global bonds.
In the U.S., the Federal Reserve’s (Fed) Federal Open Market Committee (FOMC) completed its asset purchase program in late October 2014, thereby following through on the final step of tapering its purchases of U.S. Treasuries and mortgage-backed securities (MBS) which had comprised its QE program. However, the Fed and its Chair, Janet Yellen, who assumed the position in February, became increasingly careful in its public commentary on the timing of further reductions in the Fed’s monetary easing policies. By the end of the period, the market’s consensus expectations for initial increases in the federal funds rate moved out to the second half of 2015.
In the United Kingdom (UK), the Bank of England (BoE) removed its forward rate guidance1 policy following the decline in the unemployment rate, which breached the 7.0% threshold sooner than expected. However, despite the overall improvement in the UK economy, the Monetary Policy Committee left its benchmark interest rate and the size of the Asset Purchase Facility2 unchanged at 0.50% and £375 billion (roughly US$465.2 billion) over the reporting period. The British sterling reached multi-year highs in mid-summer 2014, but reversed direction in the lead-up to, and after, the results of the Scottish independence referendum (which the citizens rejected) in September, as investor concern led to several bouts of volatility in sterling assets.
European economic data were mixed throughout the annual period, with fears of deflation and a weaker growth outlook prompting the European Central Bank (ECB) to take further policy action. At the beginning of the period in November 2013, the ECB lowered its main refinancing rate by 25 basis points (0.25%) to 0.25%, asserting that the bank could implement negative deposit rates if it needed. The continued decline in inflation led the ECB to act once again with further cuts of 0.1% over the summer to the main refinancing and deposit rates. Consequently, at the end of the reporting period, the deposit rate had moved into negative territory at -0.2% while the main refinancing rate stood at 0.05%. Quite significantly, however, the ECB initiated an asset-backed securities purchase program towards the end of the reporting period in October.
In Japan, both the government and the Bank of Japan (BoJ) moved to stimulate the economy and to end price deflation. At the end of the reporting period on October 31, 2014, the Government Pension Investment Fund (GPIF) announced details of its long-awaited asset allocation shift that calls for the sale of much of its Japanese government bonds and the resulting reallocation to global bonds, and global and Japanese equities. Concurrently the BoJ announced another round of QE in which it would purchase much if not all of the Japanese government bonds sold by the GPIF. We believe the net impact of these actions is to implement further monetary policy easing (e.g., lower interest rates for Japanese borrowers) and pressure to lower the value of the yen in an effort to assist in driving export growth.
Emerging markets (EM) saw an increase in volatility during the reporting period due partly to the Fed’s actions to reduce monetary accommodation, slowdowns in certain regional economies (e.g., Brazil), and due to rising geopolitical risks (e.g., Ukraine and Syria). We believe that the QE policies of the Fed, the BoE and the BoJ have created a surplus of investable assets worldwide, and those assets have sought to benefit from higher returns in emerging markets. With the Fed ending its QE program in the U.S., the BoE maintaining the current size of the UK’s QE and the BoJ not yet having begun its next round of easing, we believe that EM volatility consequently has increased. Slowing regional economies such as Brazil have experienced particular volatility with opportunities in those markets becoming more interesting, in our opinion, given the adjustment in valuations.
The 12–month reporting period was positive for the performance of the U.S. dollar against most global currencies. The Japanese yen and Swedish krone were the weakest-performing G103 currencies. EM currencies were weaker throughout the period on the back of the Fed tapering its asset purchases, the slowdown in Chinese growth, and increased geopolitical tensions. As such, EM foreign exchange rates were down relative to the U.S. dollar. Notable underperformers versus the dollar over the period were the Argentine peso and Russian ruble, the latter of which fell significantly due to increased economic sanctions in the region imposed by the U.S. and its European allies.
| 1 | Forward rate guidance is the term used by central banks to communicate the direction of their future monetary policy. |
| 2 | The Asset Purchase Facility was created by the Bank of England to purchase high-quality assets financed by the issuance of UK Treasury bills. The goal of the Facility is to improve liquidity in credit markets. |
| 3 | The G-10 is a group of the 10 major industrialized countries whose mission is to create a more stable world economic trading environment through monetary and fiscal policies: Belgium, Canada, France, Germany, Italy, Japan, the Netherlands, Sweden, the UK and the U.S. |
Annual Report 2014
38
Table of Contents
Aberdeen Global Fixed Income Fund (Unaudited) (continued)
Over the year under review, global credit performed well relative to comparable-duration government bonds, especially in the first six months of the period. Company fundamentals remained strong both in the U.S. and in Europe despite the weaker Eurozone4 economies. New issue supply was robust,5 and we believe that process in the market helped validate secondary pricing levels to the benefit of investors.
Global monetary policy remained relatively easy over the reporting period, and this also supported credit. The various central banks continued to offer a credit backstop to the market should the economic recovery falter, leaving risk assets better protected than otherwise. For example, over the summer a major Portuguese bank collapsed, yet corporate bond markets did not experience significant declines.
In what we feel could be characterized as a “tale of two halves,” the Fund modestly underperformed versus its benchmark over the reporting period. The Fund’s overweights relative to the benchmark to corporate and EM debt were the primary contributors to performance in the first half of the reporting period. The rally in risk assets came to a halt when comments from Fed Chair Janet Yellen suggesting that the U.S. high yield market was overheating unsettled the market in July. At the end of the reporting period on October 31, the Fund’s European and U.S. high yield bond valuations remained below the high levels that they reached in July. Outside of the high yield sector, the Fund’s overweight to investment-grade corporate bonds benefited performance amid the market’s expectation of ECB QE.
In interest rate positioning, as of the end of the reporting period, the Fund was overweight to Europe versus the U.S. as relatively weaker economic growth and central bank intervention continue to support lower European bond yields, in our view. Overweight positions versus the benchmark in Ireland and Spain also enhanced Fund performance over the period. Conversely, the Fund’s short duration position relative to the benchmark had a modest negative impact on performance.
In terms of active currency management, we have maintained the Fund’s overweights in the U.S. dollar against the euro, yen and Australian dollar, which contributed significantly to performance during the reporting period, while overweight Norwegian Krone position relative to the dollar was a slight drag on performance.
The Fund may employ a number of derivatives as part of its investment strategy; bond futures may be used to assist in liquidity management while forward contracts are used as part of the Fund’s hedging strategy to manage currency exposure. While, the fund engaged in adopted some derivatives transactions during the reporting period, they did not have a notable impact on performance.
Over the long term, we remain cautious on the European peripheral markets but constructive in the short term as we believe that risk assets generally should be well supported by improving economic data and accommodative global monetary policy. On the credit side, we continue to anticipate low default rates and favorable upgrade/downgrade ratios in terms of quality. These factors may potentially help to provide stability in credit markets, which in turn would be supportive of the Fund’s continued overweight to corporate bonds worldwide.
We think that European rates should continue to outperform their U.S. and UK counterparts. However, with already sizeable depreciation in the trade-weighted currency,6 which we feel should help support export growth and inflation, and global growth beginning to look better as we move towards 2015, yields generally are expected to move higher and steeper.
As we move into 2015, we believe that the “search for yield” will remain strong. The decline in global commodity prices puts additional pressures on those countries whose fiscal breakeven oil price has risen significantly over the last five years. We are carefully monitoring our exposure to affected countries and credits. The Ebola pandemic also highlights some of the risks to investing in certain emerging markets as well as travel-exposed segments in the developed world. In our opinion, ongoing currency weakness is also a risk as the market is increasingly expressing any negative sentiment in this segment of the global fixed income asset class.
Portfolio Management:
Aberdeen Global Fixed Income Team
PAST PERFORMANCE DOES NOT GUARANTEE FUTURE RESULTS.
The performance data quoted represents past performance and current returns may be lower or higher. Class A Shares have up to a 4.25% front-end sales charge and a 0.25% 12b-1 fee. The investment return and principal value will fluctuate so that an investor’s shares, when redeemed, may be worth more or less than the original cost. To obtain performance information current to the most recent month-end, which may be higher or lower than the performance shown above, please call 866-667-9231 or go to www.aberdeen-asset.us.
Investing in mutual funds involves risk, including the possible loss of principal.
Indexes are unmanaged and have been provided for comparison purposes only. No fees or expenses are reflected. You cannot invest directly in an index.
Lipper is a leading global provider of mutual fund information and analysis to fund companies, financial intermediaries and media organizations.
Risk Considerations
Fixed income securities are subject to certain risks including, but not limited to: interest rate (changes in interest rates may cause a decline in the market value of an investment), credit (changes in the financial condition of the issuer, borrower, counterparty, or underlying collateral), prepayment (debt issuers may repay or refinance their loans or obligations earlier than anticipated), and extension (principal repayments may not occur as quickly as anticipated, causing the expected maturity of a security to increase).
| 4 | The Eurozone comprises the bloc of nations which has adopted the euro as common currency and legal tender. |
| 5 | Source: Bloomberg, November 2014 |
| 6 | “Trade-weighted” refers to the foreign exchange value of a currency compared against certain foreign currencies. |
2014 Annual Report
39
Table of Contents
Aberdeen Global Fixed Income Fund (Unaudited) (concluded)
Foreign securities are more volatile, harder to price and less liquid than U.S. securities and are subject to different accounting and regulatory standards, and political and economic risks. These risks are enhanced in emerging markets countries.
Derivatives are speculative and may hurt the Fund’s performance. They present the risk of disproportionately increased losses and/or reduced gains when the financial asset or measure to which the derivative is linked changes in unexpected ways.
Please read the prospectus for more detailed information regarding these risks.
Annual Report 2014
40
Table of Contents
Aberdeen Global Fixed Income Fund (Unaudited)
Average Annual Total Return1 (For periods ended October 31, 2014) | 1 Yr. | 5 Yr. | 10 Yr. | |||||||||||
Class A | w/o SC | (0.05% | ) | 1.97% | 3.41% | |||||||||
| w/SC2 | (4.29% | ) | 1.09% | 2.97% | ||||||||||
Class C | w/o SC | (0.70% | ) | 1.23% | 2.68% | |||||||||
| w/SC3 | (1.69% | ) | 1.23% | 2.68% | ||||||||||
Institutional Service Class4,5 | w/o SC | 0.07% | 2.10% | 3.61% | ||||||||||
Institutional Class4,6 | w/o SC | 0.25% | 2.24% | 3.68% | ||||||||||
All figures showing the effect of a sales charge (SC) reflect the maximum charge possible because it has the most significant effect on performance data. The total returns shown above do not include the impact of financial statement rounding of the net asset value per share and/or financial statement adjustments.
| 1 | Returns prior to July 20, 2009 reflect the performance of the predecessor fund (the “Predecessor Fund”). The Fund and the Predecessor Fund have substantially similar investment objectives and strategies. Please consult the Fund’s prospectus for more detail. |
| 2 | A 4.25% front-end sales charge was deducted. |
| 3 | A 1.00% contingent deferred sales charge (CDSC) was deducted from the one year return because it is charged when Class C shares are sold within the first year after purchase. |
| 4 | Not subject to any sales charges. |
| 5 | Returns before the first offering of the Institutional Service Class Shares (July 20, 2009) are based on the previous performance of Common Class shares of the Predecessor Fund. This performance is substantially similar to what Institutional Service Class shares would have produced because both classes invest in the same portfolio of securities. Returns for the Institutional Service Class shares would only differ to the extent of the differences in expenses of the two classes. |
| 6 | Returns before the first offering of the Institutional Class Shares (July 20, 2009) are based on the previous performance of the Common Class shares of the Predecessor Fund. This performance is substantially similar to what Institutional Class shares would have produced because both classes invest in the same portfolio of securities. Returns for the Institutional Class shares would only differ to the extent of the differences in expenses of the two classes. |
2014 Annual Report
41
Table of Contents
Aberdeen Global Fixed Income Fund (Unaudited)
Performance of a $10,000 Investment (as of October 31, 2014)
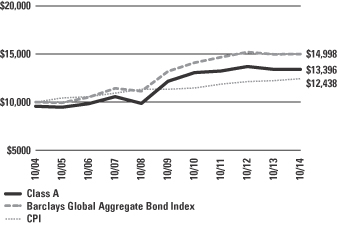
Comparative performance of $10,000 invested in Class A shares of the Aberdeen Global Fixed Income Fund, the Barclays Global Aggregate Bond Index and the Consumer Price Index (CPI) over a 10-year period ended October 31, 2014. Unlike the Fund, the returns for these unmanaged indexes do not reflect any fees, expenses, or sales charges. Investors cannot invest directly in market indexes.
The Barclays Global Aggregate Bond Index is a broad-based index that measures the global investment grade fixed-rate debt markets inclusive of three major components: U.S. Aggregate Bond Index, the Pan-European Aggregate Index, and the Asian-Pacific Aggregate Index.
The CPI represents changes in prices of a basket of goods and services purchased for consumption by urban households.
Investment return and principal value will fluctuate, and when redeemed, shares may be worth more or less than original cost. Past performance is no guarantee of future results. The Average Annual Total Return table and Performance graph do not reflect the deduction of taxes that a shareholder would pay on fund distributions or the redemption of fund shares. Investing in mutual funds involves market risk, including loss of principal. Performance returns assume the reinvestment of all distributions. Total returns reflect waivers and reimbursements in effect, without which returns would have been lower.
Portfolio Summary (as a percentage of net assets)
October 31, 2014 (Unaudited)
| Asset Allocation | ||||
Corporate Bonds | 46.7% | |||
Government Bonds | 34.9% | |||
Residential Mortgage-Backed Securities | 8.6% | |||
Commercial Mortgage-Backed Securities | 2.6% | |||
Repurchase Agreement | 2.5% | |||
U.S. Treasuries | 1.1% | |||
Municipal Bonds | 0.6% | |||
Asset-Backed Securities | 0.5% | |||
Other assets in excess of liabilities | 2.5% | |||
| 100.0% | ||||
The following chart summarizes the composition of the Fund’s portfolio, expressed as a percentage of net assets. The industries listed below may include more than one industry group. As of October 31, 2014, the Fund did not have more than 25% of its assets invested in any industry group.
| Top Industries | ||||
Commercial Banks | 7.6% | |||
Insurance | 6.3% | |||
Oil, Gas & Consumable Fuels | 4.9% | |||
Diversified Telecommunication Services | 3.3% | |||
Diversified Financial Services | 2.8% | |||
Food Products | 2.2% | |||
Electric Utilities | 2.0% | |||
Engineering & Construction | 2.0% | |||
Commercial Services & Supplies | 1.9% | |||
Energy Equipment & Services | 1.5% | |||
Other | 65.5% | |||
| 100.0% | ||||
| Top Holdings* | ||||
New Zealand Government Bond, Series 1217 12/15/2017 | 3.2% | |||
Japan Government 20 Year Bond, Series 112 06/20/2029 | 2.7% | |||
Bundesrepublik Deutschland 05/15/2024 | 2.4% | |||
Japanese Government CPI Linked Bond 03/10/2024 | 2.0% | |||
Bundesrepublik Deutschland, Series 2008 07/04/2018 | 1.7% | |||
Japan Government 5 Year Bond, Series 105 06/20/2017 | 1.7% | |||
Singapore Government Bond 09/01/2020 | 1.6% | |||
Canadian Government Bond 06/01/2017 | 1.6% | |||
Ireland Government Bond 03/18/2024 | 1.2% | |||
Japan Government 30 Year Bond 03/20/2037 | 1.2% | |||
Other | 80.7% | |||
| 100.0% | ||||
| Top Countries | ||||
United States | 27.4% | |||
Japan | 10.0% | |||
United Kingdom | 9.5% | |||
Germany | 6.5% | |||
France | 4.8% | |||
Canada | 4.7% | |||
Brazil | 3.5% | |||
New Zealand | 3.2% | |||
Republic of Ireland | 2.8% | |||
Netherlands | 2.6% | |||
Other | 25.0% | |||
| 100.0% | ||||
| * | For the purpose of listing top holdings, repurchase agreements are included as part of Other. |
Annual Report 2014
42
Table of Contents
Statement of Investments
October 31, 2014
Aberdeen Global Fixed Income Fund
| Shares or Principal Amount | Value (US$) | |||||||
ASSET-BACKED SECURITIES (0.5%) | ||||||||
UNITED STATES (0.5%) | ||||||||
Dominos Pizza Master Issuer LLC, Series 2012-1A, Class A2 (USD), 5.22%, 01/25/2042 (a) | $ | 96,625 | $ | 101,990 | ||||
Total Asset-Backed Securities | 101,990 | |||||||
COMMERCIAL MORTGAGE-BACKED SECURITIES (2.6%) |
| |||||||
UNITED STATES (2.6%) | ||||||||
Americold LLC Trust, Series 2010-ARTA, Class A2FL (USD), 2.50%, 01/14/2029 (a)(b) | 100,000 | 99,131 | ||||||
Commercial Mortgage Pass Through Certificates | ||||||||
Series 2014-LC17, Class B (USD), | 20,000 | 20,890 | ||||||
Series 2014-CR20, Class AM (USD), | 39,000 | 39,813 | ||||||
Series 2007-C9, Class AMFL (USD), | 10,000 | 9,843 | ||||||
Federal Home Loan Mortgage Association, | 54,364 | 58,660 | ||||||
FREMF Mortgage Trust, Series 2011-K10, Class B (USD), 4.62%, 11/25/2049 (a)(b) | 50,000 | 53,699 | ||||||
JP Morgan Chase Commercial Mortgage Securities Trust, Series 2007-CIBC19 (USD), | 96,918 | 105,612 | ||||||
JP Morgan Mortgage Trust, Series 14-IVR3, Class 2A1 (USD), 3.00%, 09/25/2044 (a)(b) | 99,162 | 100,306 | ||||||
Structured Asset Securities Corp., Series 2003-A40, Class 3A1 (USD), 2.38%, 01/25/2034 (b) | 38,995 | 38,026 | ||||||
Wells Fargo Mortgage Backed Securities Trust, | 17,160 | 17,064 | ||||||
| 543,044 | ||||||||
Total Commercial Mortgage-Backed Securities | 543,044 | |||||||
RESIDENTIAL MORTGAGE-BACKED SECURITIES (8.6%) |
| |||||||
UNITED STATES (8.6%) | ||||||||
BCAP LLC Trust | ||||||||
Series 2009-RR4, Class 3A1 (USD), | 11,372 | 11,367 | ||||||
Series 2009-RR6, Class 3A1 (USD), | 30,115 | 30,054 | ||||||
Series 2009-RR2, Class A1 (USD), | 35,479 | 35,661 | ||||||
Credit Suisse Mortgage Capital Certificates | ||||||||
Series 2009-12R, Class 15A1 (USD), | 24,700 | 24,549 | ||||||
Series 2009-8R, Class 5A1 (USD), | 25,903 | 26,683 | ||||||
Federal Home Loan Mortgage Corp. | ||||||||
Pool # G13774 (USD), 5.50%, 12/01/2020 | 18,829 | 20,086 | ||||||
Pool # U89032 (USD), 3.00%, 07/01/2033 | 53,126 | 54,266 | ||||||
Series 3745, Class GP (USD), | 50,000 | 53,680 | ||||||
Series 3864, Class AB (USD), | 13,517 | 14,381 | ||||||
Series 4229, Class MA (USD), | 36,602 | 38,760 | ||||||
Series 4268, Class BP (USD), 4.25%, 08/15/2042 | 48,353 | 52,687 | ||||||
Series 4247, Class AK (USD), 4.50%, 12/15/2042 | 49,403 | 54,250 | ||||||
Pool # 2B1384 (USD), 2.47%, 05/01/2043 (b) | 18,369 | 18,534 | ||||||
Pool # G07626 (USD), 4.00%, 02/01/2044 | 42,889 | 46,039 | ||||||
Pool # G07683 (USD), 4.00%, 03/01/2044 | 49,336 | 52,595 | ||||||
Pool # 849278 (USD), 3.08%, 04/01/2044 (b) | 46,192 | 47,896 | ||||||
Federal National Mortgage Association | ||||||||
Series 2013-117, Class V (USD), | 14,069 | 14,963 | ||||||
Pool # AO3007 (USD), 3.50%, 05/01/2027 | 18,939 | 20,063 | ||||||
Series 2013-90, Class DK (USD), | 41,201 | 43,356 | ||||||
Pool # AW7399 (USD), 3.50%, 02/01/2032 | 64,257 | 67,505 | ||||||
Pool # AQ4861 (USD), 3.50%, 11/01/2032 | 44,162 | 46,350 | ||||||
Series 2013-20, Class DL (USD), | 27,447 | 29,111 | ||||||
Series 2013-20, Class MC (USD), | 36,526 | 39,012 | ||||||
Series 2013-31, Class NL (USD), | 31,787 | 33,767 | ||||||
Series 2013-43, Class MB (USD), | 18,342 | 18,865 | ||||||
Pool # AV9175 (USD), 4.00%, 03/01/2034 | 52,570 | 56,437 | ||||||
Pool # AL5491 (USD), 4.00%, 06/01/2034 | 53,586 | 57,528 | ||||||
Pool # 891386 (USD), 5.50%, 10/01/2035 | 19,354 | 21,697 | ||||||
Series 2013-110, Class QH (USD), | 40,324 | 42,381 | ||||||
Pool # 889050 (USD), 6.00%, 05/01/2037 | 8,679 | 9,869 | ||||||
Series 2014-9 Class A (USD), | 47,340 | 50,849 | ||||||
Pool # 995049 (USD), 5.50%, 02/01/2038 | 7,655 | 8,582 | ||||||
Pool # 929187 (USD), 5.50%, 03/01/2038 | 7,604 | 8,566 | ||||||
Series 2013-103, Class H, CMO (USD), | 41,913 | 45,532 | ||||||
Pool # 995228 (USD), 6.50%, 11/01/2038 | 16,657 | 18,904 | ||||||
Pool # AD0206 (USD), 5.50%, 09/01/2039 | 20,032 | 22,555 | ||||||
Series 2013-94, Class HA (USD), | 60,780 | 65,063 | ||||||
Pool # AL0038 (USD), 5.00%, 02/01/2041 | 45,928 | 50,889 | ||||||
Pool # AI0108 (USD), 5.00%, 04/01/2041 | 17,977 | 20,210 | ||||||
Pool # AJ1422 (USD), 5.00%, 09/01/2041 | 28,283 | 31,387 | ||||||
Pool # AL0933 (USD), 5.00%, 10/01/2041 | 16,909 | 18,751 | ||||||
Series 2013-100, Class MP (USD), | 32,149 | 35,153 | ||||||
Series 2013-15, Class EP (USD), | 26,580 | 28,074 | ||||||
Pool # AB6935 (USD), 3.50%, 11/01/2042 | 17,141 | 17,844 | ||||||
Pool # AT2710 (USD), 2.27%, 06/01/2043 (b) | 18,495 | 18,519 | ||||||
Pool # AS3611 (USD), 3.50%, 10/01/2044 | 79,890 | 82,878 | ||||||
Pool # AS3706 (USD), 3.50%, 11/01/2044 | 70,000 | 72,618 | ||||||
JP Morgan Re-Remic | ||||||||
Series 2009-8, Class A1 (USD), | 19,280 | 19,703 | ||||||
Series 2009-7, Class 2A1 (USD), | 34,988 | 35,870 | ||||||
Series 2009-7, Class 14A1 (USD), | 26,381 | 26,486 | ||||||
Series 2009-7, Class 17A1 (USD), | 42,724 | 41,007 | ||||||
| 1,801,832 | ||||||||
Total Residential Mortgage-Backed Securities |
| 1,801,832 | ||||||
See accompanying Notes to Financial Statements.
2014 Annual Report
43
Table of Contents
Statement of Investments (continued)
October 31, 2014
Aberdeen Global Fixed Income Fund
| Shares or Principal Amount | Value (US$) | |||||||
CORPORATE BONDS (46.7%) |
| |||||||
AUSTRALIA (1.0%) | ||||||||
Insurance (1.0%) | ||||||||
QBE Insurance Group Ltd. (USD), | $ | 200,000 | $ | 200,076 | ||||
AUSTRIA (0.2%) | ||||||||
Building Materials (0.2%) | ||||||||
Wienerberger AG (EUR), 6.50%, 02/09/2021 (b)(c) | 41,000 | 51,867 | ||||||
BRAZIL (3.5%) | ||||||||
Engineering & Construction (2.0%) | ||||||||
OAS Investments GmbH (USD), | 200,000 | 194,500 | ||||||
Odebrecht Finance Ltd. (USD), | 200,000 | 209,900 | ||||||
| 404,400 | ||||||||
Iron/Steel (0.9%) | ||||||||
Samarco Mineracao SA (USD), | 200,000 | 190,250 | ||||||
Oil, Gas & Consumable Fuels (0.6%) | ||||||||
Petrobras International Finance Co. SA | ||||||||
(USD), 7.88%, 03/15/2019 | 50,000 | 57,336 | ||||||
(USD), 6.75%, 01/27/2041 | 70,000 | 72,082 | ||||||
| 129,418 | ||||||||
| 724,068 | ||||||||
CANADA (2.5%) | ||||||||
Diversified Telecommunication Services (0.4%) | ||||||||
Rogers Communications, Inc. (CAD), | 90,000 | 89,998 | ||||||
Media (0.5%) | ||||||||
Shaw Communications, Inc. (CAD), | 90,000 | 96,613 | ||||||
Metals & Mining (0.9%) | ||||||||
First Quantum Minerals Ltd. (USD), | 200,000 | 193,500 | ||||||
Oil, Gas & Consumable Fuels (0.7%) | ||||||||
Pacific Rubiales Energy Corp. (USD), | 160,000 | 152,152 | ||||||
| 532,263 | ||||||||
CAYMAN ISLANDS (1.5%) | ||||||||
Holding Companies-Diversified Operations (0.6%) |
| |||||||
Hutchison Whampoa Europe Finance 13 Ltd. (EUR), | 100,000 | 128,323 | ||||||
Oil & Gas Services (0.9%) | ||||||||
Offshore Group Investment Ltd. (USD), | 220,000 | 181,500 | ||||||
| 309,823 | ||||||||
| Shares or Principal Amount | Value (US$) | |||||||
COLOMBIA (0.4%) | ||||||||
Oil, Gas & Consumable Fuels (0.4%) | ||||||||
Ecopetrol SA (USD), 5.88%, 05/28/2045 | $ | 73,000 | $ | 75,008 | ||||
FRANCE (3.3%) | ||||||||
Commercial Banks (0.7%) | ||||||||
Societe Generale SA (EUR), | 100,000 | 151,819 | ||||||
Commercial Services & Supplies (0.6%) | ||||||||
Cegedim SA (EUR), 6.75%, 04/01/2020 (a) | 100,000 | 136,049 | ||||||
Electric Utilities (0.5%) | ||||||||
Electricite de France SA (USD), | 100,000 | 103,750 | ||||||
Government Development Banks (0.6%) | ||||||||
Agence Francaise de Developpement (EUR), | 100,000 | 130,469 | ||||||
Healthcare Providers & Services (0.9%) | ||||||||
HomeVi SAS (EUR), 6.88%, 08/15/2021 (a) | 140,000 | 178,950 | ||||||
| 701,037 | ||||||||
GERMANY (1.1%) |
| |||||||
Environmental Control (0.5%) |
| |||||||
ALBA Group PLC & Co. KG (EUR), | 100,000 | 100,021 | ||||||
Leisure Time (0.6%) | ||||||||
Safari Holding Verwaltungs GmbH (EUR), | 100,000 | 126,581 | ||||||
| 226,602 | ||||||||
HONG KONG (0.9%) |
| |||||||
Oil, Gas & Consumable Fuels (0.9%) |
| |||||||
MIE Holdings Corp. (USD), 7.50%, 04/25/2019 (a) | 200,000 | 196,000 | ||||||
INDIA (1.0%) | ||||||||
Commercial Banks (1.0%) | ||||||||
ICICI Bank Ltd. (USD), MTN, 3.50%, 03/18/2020 (a) | 200,000 | 200,665 | ||||||
INDONESIA (0.8%) | ||||||||
Coal (0.8%) | ||||||||
Indo Energy Finance II BV (USD), | 200,000 | 161,500 | ||||||
ITALY (0.8%) | ||||||||
Diversified Telecommunication Services (0.3%) | ||||||||
Telecom Italia SpA (EUR), EMTN, | 50,000 | 69,947 | ||||||
Entertainment (0.5%) |
| |||||||
Gamenet SpA (EUR), 7.25%, 08/01/2018 (a) | 100,000 | 105,978 | ||||||
| 175,925 | ||||||||
JERSEY (1.5%) |
| |||||||
Insurance (1.5%) |
| |||||||
Galaxy Bidco Ltd. (GBP), 6.38%, 11/15/2020 (a) | 100,000 | 152,451 | ||||||
Hastings Insurance Group Finance PLC (GBP), | 100,000 | 165,969 | ||||||
| 318,420 | ||||||||
See accompanying Notes to Financial Statements.
Annual Report 2014
44
Table of Contents
Statement of Investments (continued)
October 31, 2014
Aberdeen Global Fixed Income Fund
| Shares or Principal Amount | Value (US$) | |||||||
KAZAKHSTAN (1.0%) |
| |||||||
Oil, Gas & Consumable Fuels (1.0%) |
| |||||||
Zhaikmunai LLP (USD), 7.13%, 11/13/2019 (a) | $ | 200,000 | $ | 208,000 | ||||
LUXEMBOURG (1.7%) | ||||||||
Diversified Telecommunication Services (0.5%) | ||||||||
Intelsat Jackson Holdings SA (USD), | 100,000 | 100,250 | ||||||
Home Furnishings (0.6%) |
| |||||||
Magnolia BC SA (EUR), EMTN, | 100,000 | 120,303 | ||||||
Paper & Forest Products (0.6%) | ||||||||
Lecta SA (EUR), EMTN, 8.88%, 05/15/2019 (a) | 100,000 | 132,207 | ||||||
| 352,760 | ||||||||
MEXICO (0.6%) |
| |||||||
Oil, Gas & Consumable Fuels (0.6%) |
| |||||||
Petroleos Mexicanos | ||||||||
(USD), 5.50%, 01/21/2021 | 95,000 | 105,027 | ||||||
(USD), 4.25%, 01/15/2025 (a) | 30,000 | 30,369 | ||||||
| 135,396 | ||||||||
NETHERLANDS (2.6%) |
| |||||||
Diversified Telecommunication Services (1.1%) |
| |||||||
Bharti Airtel International Netherlands BV (EUR), | 100,000 | 132,868 | ||||||
Bite Finance International BV (EUR), EMTN, | 100,000 | 110,277 | ||||||
| 243,145 | ||||||||
Entertainment (0.6%) |
| |||||||
PortAventura Entertainment Barcelona BV (EUR), | 100,000 | 125,942 | ||||||
Insurance (0.9%) | ||||||||
Aegon (EUR), EMTN, 4.00%, 04/25/2044 (a)(b) | 140,000 | 181,010 | ||||||
| 550,097 | ||||||||
NIGERIA (0.9%) |
| |||||||
Commercial Banks (0.9%) |
| |||||||
Zenith Bank PLC (USD), MTN, | 200,000 | 197,000 | ||||||
REPUBLIC OF IRELAND (1.6%) |
| |||||||
Insurance (0.7%) | ||||||||
Aquarius and Investments PLC for Zurich Insurance Co. Ltd. (EUR), EMTN, 4.25%, 10/02/2043 (a)(b) | 100,000 | 137,815 | ||||||
Packaging & Containers (0.9%) | ||||||||
Ardagh Packaging Finance PLC/Ardagh Holdings USA, Inc. (USD), 3.23%, 12/15/2019 (a)(b) | 200,000 | 195,500 | ||||||
| 333,315 | ||||||||
SUPRANATIONAL (0.4%) |
| |||||||
Supranational (0.4%) |
| |||||||
Eurofima (AUD), MTN, 6.00%, 03/30/2022 | 90,000 | 89,423 | ||||||
SWEDEN (1.0%) |
| |||||||
Commercial Banks (1.0%) | ||||||||
Nordea Bank AB (USD), | 200,000 | 202,000 | ||||||
UNITED KINGDOM (6.9%) |
| |||||||
Commercial Banks (0.9%) |
| |||||||
Abbey National Treasury Services PLC (EUR), EMTN, 0.81%, 05/22/2019 (a)(b) | 150,000 | 188,290 | ||||||
Commercial Services & Supplies (1.3%) | ||||||||
G4S International Finance PLC (EUR), EMTN, 2.88%, 05/02/2017 (a) | 100,000 | 131,719 | ||||||
Rentokil Initial PLC (EUR), EMTN, | 100,000 | 139,651 | ||||||
| 271,370 | ||||||||
Electric Utilities (1.0%) | ||||||||
SSE PLC (USD), 5.63%, 10/01/2017 (a)(b)(c) | 200,000 | 211,650 | ||||||
Food Products (2.2%) | ||||||||
Bakkavor Finance 2 PLC (GBP), | 100,000 | 163,969 | ||||||
Boparan Finance PLC (GBP), 5.25%, 07/15/2019 (a) | 100,000 | 148,262 | ||||||
Iglo Foods Bondco PLC (EUR), | 120,000 | 146,258 | ||||||
| 458,489 | ||||||||
Insurance (1.5%) | ||||||||
Aviva PLC (EUR), EMTN, 6.13%, 07/05/2043 (a)(b) | 100,000 | 148,498 | ||||||
Scottish Widows PLC (GBP), | 100,000 | 167,422 | ||||||
| 315,920 | ||||||||
| 1,445,719 | ||||||||
UNITED STATES (11.5%) | ||||||||
Commercial Banks (3.1%) | ||||||||
Bank of America Corp. (USD), MTN, | 45,000 | 49,174 | ||||||
Goldman Sachs Group, Inc. | ||||||||
(USD), 2.55%, 10/23/2019 | 100,000 | 99,359 | ||||||
(USD), MTN, 4.80%, 07/08/2044 | 120,000 | 123,915 | ||||||
JPMorgan Chase & Co. (USD), 3.88%, 09/10/2024 | 130,000 | 129,154 | ||||||
Morgan Stanley (USD), 3.70%, 10/23/2024 | 70,000 | 69,855 | ||||||
Wells Fargo & Co. | ||||||||
(GBP), EMTN, 5.25%, 08/01/2023 (a) | 50,000 | 90,430 | ||||||
(USD), MTN, 4.10%, 06/03/2026 | 80,000 | 81,142 | ||||||
| 643,029 | ||||||||
Distribution/Wholesale (0.2%) | ||||||||
LKQ Corp. (USD), 4.75%, 05/15/2023 | 50,000 | 48,320 | ||||||
Diversified Financial Services (2.8%) | ||||||||
Ford Motor Credit Co. LLC (USD), | 200,000 | 228,870 | ||||||
HSBC Finance Corp. (USD), 6.68%, 01/15/2021 | 100,000 | 117,848 | ||||||
See accompanying Notes to Financial Statements.
2014 Annual Report
45
Table of Contents
Statement of Investments (continued)
October 31, 2014
Aberdeen Global Fixed Income Fund
| Shares or Principal Amount | Value (US$) | |||||||
Legg Mason, Inc. | ||||||||
(USD), 3.95%, 07/15/2024 | $ | 50,000 | $ | 50,845 | ||||
(USD), 5.63%, 01/15/2044 | 20,000 | 22,303 | ||||||
National Rural Utilities Cooperative Finance Corp. (USD), 4.75%, 04/30/2043 (b) | 65,000 | 64,370 | ||||||
Nationstar Mortgage LLC (USD), | 100,000 | 93,000 | ||||||
| 577,236 | ||||||||
Diversified Telecommunication Services (1.0%) | ||||||||
CenturyLink, Inc., Series W (USD), | 100,000 | 111,000 | ||||||
T-Mobile USA, Inc. (USD), 6.84%, 04/28/2023 | 50,000 | 52,875 | ||||||
Verizon Communications, Inc. | ||||||||
(USD), 6.55%, 09/15/2043 | 20,000 | 25,212 | ||||||
(USD), 5.01%, 08/21/2054 (a) | 19,000 | 19,335 | ||||||
| 208,422 | ||||||||
Electric Utilities (0.5%) | ||||||||
Calpine Corp. (USD), 5.75%, 01/15/2025 | 75,000 | 75,937 | ||||||
Ipalco Enterprises, Inc. (USD), 5.00%, 05/01/2018 | 35,000 | 37,100 | ||||||
| 113,037 | ||||||||
Energy Equipment & Services (1.5%) | ||||||||
Energy Transfer Partners LP (USD), | 50,000 | 54,710 | ||||||
Kinder Morgan Energy Partners LP (USD), | 22,000 | 21,892 | ||||||
Sabine Pass Liquefaction LLC (USD), | 200,000 | 215,500 | ||||||
Williams Partners LP (USD), 3.90%, 01/15/2025 | 32,000 | 31,746 | ||||||
| 323,848 | ||||||||
Insurance (0.7%) | ||||||||
Teachers Insurance & Annuity Association of America (USD), 4.90%, 09/15/2044 (a) | 140,000 | 148,416 | ||||||
Media (0.8%) | ||||||||
Cablevision Systems Corp. (USD), | 120,000 | 122,100 | ||||||
Comcast Corp. (USD), 6.95%, 08/15/2037 | 35,000 | 47,503 | ||||||
| 169,603 | ||||||||
Metals & Mining (0.2%) | ||||||||
Alcoa, Inc. (USD), 5.13%, 10/01/2024 | 38,000 | 40,117 | ||||||
Oil, Gas & Consumable Fuels (0.7%) | ||||||||
Marathon Petroleum Corp. (USD), | 100,000 | 100,618 | ||||||
Rowan Cos., Inc. (USD), 5.85%, 01/15/2044 | 40,000 | 40,216 | ||||||
| 140,834 | ||||||||
| 2,412,862 | ||||||||
Total Corporate Bonds | 9,799,826 | |||||||
MUNICIPAL BONDS (0.6%) | ||||||||
UNITED STATES (0.6%) | ||||||||
GEORGIA (0.3%) | ||||||||
Municipal Electric Authority of Georgia Revenue Bonds (Build America Bonds) (USD), | 55,000 | 70,020 | ||||||
ILLINOIS (0.3%) | ||||||||
Chicago Transit Authority Sales Tax Receipts Revenue Bonds (Build America Bonds), | 55,000 | 64,179 | ||||||
| 134,199 | ||||||||
Total Municipal Bonds | 134,199 | |||||||
GOVERNMENT BONDS (34.9%) | ||||||||
AUSTRALIA (1.0%) | ||||||||
Australia Government Bond | ||||||||
Series 120 (AUD), 6.00%, 02/15/2017 | 115,000 | 108,977 | ||||||
Series 128 (AUD), 5.75%, 07/15/2022 | 100,000 | 103,637 | ||||||
| 212,614 | ||||||||
CANADA (2.2%) | ||||||||
Canadian Government Bond | ||||||||
(CAD), 4.00%, 06/01/2017 | 350,000 | 333,808 | ||||||
Series WL43 (CAD), 5.75%, 06/01/2029 | 110,000 | 138,507 | ||||||
| 472,315 | ||||||||
DENMARK (0.4%) | ||||||||
Denmark Government Bond (DKK), | 300,000 | 78,585 | ||||||
FINLAND (0.2%) | ||||||||
Finland Government Bond (EUR), | 30,000 | 44,757 | ||||||
FRANCE (1.5%) | ||||||||
France Government Bond OAT | ||||||||
(EUR), 3.00%, 04/25/2022 | 50,000 | 73,050 | ||||||
(EUR), 4.25%, 10/25/2023 | 20,000 | 32,119 | ||||||
(EUR), 5.50%, 04/25/2029 | 30,000 | 56,100 | ||||||
(EUR), 4.75%, 04/25/2035 | 50,000 | 91,645 | ||||||
(EUR), 4.50%, 04/25/2041 | 34,000 | 62,471 | ||||||
| 315,385 | ||||||||
GERMANY (5.4%) | ||||||||
Bundesobligation (EUR), 1.00%, 02/22/2019 | 99,000 | 129,084 | ||||||
Bundesrepublik Deutschland | ||||||||
Series 2008 (EUR), 4.25%, 07/04/2018 | 250,000 | 362,239 | ||||||
(EUR), 1.50%, 05/15/2024 | 380,000 | 506,435 | ||||||
Series 98 (EUR), 4.75%, 07/04/2028 | 10,000 | 18,075 | ||||||
Series 00 (EUR), 5.50%, 01/04/2031 | 60,000 | 120,001 | ||||||
| 1,135,834 | ||||||||
ITALY (1.8%) | ||||||||
Buoni Poliennali Del Tesoro | ||||||||
(EUR), 4.50%, 03/01/2026 (a) | 120,000 | 177,730 | ||||||
(EUR), 5.00%, 09/01/2040 (a) | 125,000 | 191,574 | ||||||
| 369,304 | ||||||||
See accompanying Notes to Financial Statements.
Annual Report 2014
46
Table of Contents
Statement of Investments (continued)
October 31, 2014
Aberdeen Global Fixed Income Fund
| Shares or Principal Amount | Value (US$) | |||||||
JAPAN (10.0%) | ||||||||
Japan Government 10 Year Bond, Series 299 (JPY), 1.30%, 03/20/2019 | $ | 10,000,000 | $ | 93,672 | ||||
Japan Government 20 Year Bond | ||||||||
Series 64 (JPY), 1.90%, 09/20/2023 | 15,000,000 | 151,196 | ||||||
Series 112 (JPY), 2.10%, 06/20/2029 | 55,000,000 | 572,725 | ||||||
Japan Government 30 Year Bond | ||||||||
Series 10 (JPY), 1.10%, 03/20/2033 | 3,000,000 | 26,406 | ||||||
(JPY), 2.40%, 03/20/2037 | 23,000,000 | 242,588 | ||||||
(JPY), 1.80%, 03/20/2043 | 25,000,000 | 234,039 | ||||||
Japan Government 5 Year Bond, Series 105 (JPY), 0.20%, 06/20/2017 | 40,000,000 | 357,545 | ||||||
Japanese Government CPI Linked Bond (JPY), 0.10%, 03/10/2024 | 44,967,300 | 428,135 | ||||||
| 2,106,306 | ||||||||
NEW ZEALAND (3.2%) | ||||||||
New Zealand Government Bond, Series 1217 (NZD), 6.00%, 12/15/2017 (a) | 800,000 | 665,319 | ||||||
POLAND (0.4%) | ||||||||
Poland Government Bond, Series 0415 (PLN), 5.50%, 04/25/2015 | 310,000 | 93,654 | ||||||
REPUBLIC OF IRELAND (1.2%) | ||||||||
Ireland Government Bond (EUR), | 170,000 | 243,777 | ||||||
SINGAPORE (1.6%) | ||||||||
Singapore Government Bond (SGD), | 400,000 | 337,753 | ||||||
SPAIN (1.7%) | ||||||||
Spain Government Bond | ||||||||
(EUR), 2.10%, 04/30/2017 | 140,000 | 181,605 | ||||||
(EUR), 4.80%, 01/31/2024 | 40,000 | 62,162 | ||||||
(EUR), 5.15%, 10/31/2044 (a) | 75,000 | 122,854 | ||||||
| 366,621 | ||||||||
SWEDEN (1.7%) | ||||||||
Svensk Exportkredit AB (USD), MTN, | 200,000 | 197,350 | ||||||
Sweden Government Bond, Series 1051 (SEK), | 1,000,000 | 149,171 | ||||||
| 346,521 | ||||||||
UNITED KINGDOM (2.6%) | ||||||||
United Kingdom Treasury Gilt | ||||||||
(GBP), 4.25%, 12/07/2027 (a) | 90,000 | 172,441 | ||||||
(GBP), 4.25%, 03/07/2036 (a) | 60,000 | 117,278 | ||||||
(GBP), 4.25%, 09/07/2039 (a) | 75,000 | 148,321 | ||||||
(GBP), 4.25%, 12/07/2049 (a) | 50,000 | 102,604 | ||||||
| 540,644 | ||||||||
Total Government Bonds | 7,329,389 | |||||||
U.S. TREASURIES (1.1%) | ||||||||
UNITED STATES (1.1%) | ||||||||
U.S. Treasury Notes | ||||||||
(USD), 1.75%, 09/30/2019 | $ | 150,000 | $ | 150,996 | ||||
(USD), 2.13%, 09/30/2021 | 10,000 | 10,056 | ||||||
(USD), 2.38%, 08/15/2024 | 80,000 | 80,313 | ||||||
| 241,365 | ||||||||
Total U.S. Treasuries | 241,365 | |||||||
REPURCHASE AGREEMENT (2.5%) | ||||||||
UNITED STATES (2.5%) | ||||||||
Repurchase Agreement, Fixed Income Clearing Corp., 0.00%, dated 10/31/2014, due 11/03/2014, repurchase price $520,000 collateralized by U.S. Treasury Note, maturing 10/31/2021; total market value of $533,612 | 520,000 | 520,000 | ||||||
Total Repurchase Agreement | 520,000 | |||||||
Total Investments | 20,471,645 | |||||||
Other assets in excess of liabilities—2.5% | 530,495 | |||||||
Net Assets—100.0% | $ | 21,002,140 | ||||||
| (a) | Denotes a security issued under Regulation S or Rule 144A. |
| (b) | Variable or Floating Rate Security. Rate disclosed is as of October 31, 2014. |
| (c) | Perpetual bond. This is a bond that has no maturity date, is redeemable and pays a steady stream of interest indefinitely. |
| (d) | See Notes to Financial Statements for tax unrealized appreciation/depreciation of securities. |
| AUD | Australian Dollar |
| CAD | Canadian Dollar |
| CHF | Swiss Franc |
| CZK | Czech Koruna |
| DKK | Danish Krone |
| EMTN | Euro Medium Term Note |
| EUR | Euro Currency |
| GBP | British Pound Sterling |
| JPY | Japanese Yen |
| KRW | South Korean Won |
| MTN | Medium Term Note |
| MXN | Mexican Peso |
| MYR | Malaysian Ringgit |
| NOK | Norwegian Krone |
| NZD | New Zealand Dollar |
| PLN | Polish Zloty |
| SEK | Swedish Krona |
| SGD | Singapore Dollar |
| USD | U.S. Dollar |
| ZAR | South African Rand |
See accompanying Notes to Financial Statements.
2014 Annual Report
47
Table of Contents
Statement of Investments (continued)
October 31, 2014
Aberdeen Global Fixed Income Fund
At October 31, 2014, the Fund held the following futures contracts:
| Futures Contracts | Counterparty | Number of Contracts Long (Short) | Expiration Date | Unrealized Appreciation/ (Depreciation) | ||||||||||
Euro BOBL Futures | UBS | 1 | 12/08/2014 | $ | 274 | |||||||||
Euro Bond Futures | UBS | 7 | 12/08/2014 | 15,038 | ||||||||||
Long Gilt Bond Future | UBS | (5 | ) | 12/29/2014 | (16,295 | ) | ||||||||
United States Treasury Note 6%-5 year | UBS | (14 | ) | 12/31/2014 | (4,822 | ) | ||||||||
United States Treasury Note 6%-10 year | UBS | (8 | ) | 12/19/2014 | (14,159 | ) | ||||||||
United States Treasury Note 6%-10 year | UBS | 3 | 12/19/2014 | 1,587 | ||||||||||
United States Treasury Bond 6%-30 year | UBS | (2 | ) | 12/19/2014 | (4,006 | ) | ||||||||
United States Treasury Bond 6%-Ultra Long | UBS | 2 | 12/19/2014 | (849 | ) | |||||||||
| $ | (23,232 | ) | ||||||||||||
At October 31, 2014, the Fund’s open forward foreign currency exchange contracts were as follows:
| Purchase Contracts Settlement Date* | Counterparty | Amount Purchased | Amount Sold | Fair Value | Unrealized Appreciation/ (Depreciation) | |||||||||||||||||||||
| British Pound/United States Dollar | ||||||||||||||||||||||||||
| 01/16/2015 | Goldman Sachs | GBP | 33,000 | USD | 53,019 | $ | 52,759 | $ | (260 | ) | ||||||||||||||||
| Crech Koruna/United States Dollar | ||||||||||||||||||||||||||
| 01/16/2015 | Citibank | CZK | 660,000 | USD | 30,463 | 29,757 | (706 | ) | ||||||||||||||||||
| Euro/United States Dollar | ||||||||||||||||||||||||||
| 01/16/2015 | Deutsche Bank | EUR | 100,000 | USD | 126,683 | 125,374 | (1,309 | ) | ||||||||||||||||||
| Japanese Yen/United States Dollar | ||||||||||||||||||||||||||
| 01/16/2015 | Barclays Bank | JPY | 110,372,000 | USD | 1,031,149 | 983,515 | (47,634 | ) | ||||||||||||||||||
| Malaysian Ringgit/United States Dollar | ||||||||||||||||||||||||||
| 11/28/2014 | UBS | MYR | 140,000 | USD | 43,875 | 42,488 | (1,387 | ) | ||||||||||||||||||
| Mexican Peso/United States Dollar | ||||||||||||||||||||||||||
| 01/16/2015 | UBS | MXN | 1,085,000 | USD | 80,286 | 80,237 | (49 | ) | ||||||||||||||||||
| Norwegian Krone/United States Dollar | ||||||||||||||||||||||||||
| 01/16/2015 | Goldman Sachs | NOK | 1,537,000 | USD | 235,967 | 227,319 | (8,648 | ) | ||||||||||||||||||
| South African Rand/United States Dollar | ||||||||||||||||||||||||||
| 01/16/2015 | UBS | ZAR | 631,000 | USD | 56,186 | 56,509 | 323 | |||||||||||||||||||
| South Korean Won/United States Dollar | ||||||||||||||||||||||||||
| 11/28/2014 | Goldman Sachs | KRW | 246,840,000 | USD | 240,297 | 230,914 | (9,383 | ) | ||||||||||||||||||
| $ | 1,828,872 | $ | (69,053 | ) | ||||||||||||||||||||||
| * | Certain contracts with different trade dates and like characteristics have been shown net. |
See accompanying Notes to Financial Statements.
Annual Report 2014
48
Table of Contents
Statement of Investments (concluded)
October 31, 2014
Aberdeen Global Fixed Income Fund
| Sale Contracts Settlement Date* | Counterparty | Amount Purchased | Amount Sold | Fair Value | Unrealized Appreciation/ (Depreciation) | |||||||||||||||||||||
| United States Dollar/Australian Dollar | ||||||||||||||||||||||||||
| 01/16/2015 | JPMorgan Chase | USD | 202,232 | AUD | 232,000 | $ | 203,107 | $ | (875 | ) | ||||||||||||||||
| United States Dollar/British Pound | ||||||||||||||||||||||||||
| 01/16/2015 | Deutsche Bank | USD | 11,265 | GBP | 7,000 | 11,191 | 74 | |||||||||||||||||||
| 01/16/2015 | Royal Bank of Canada | USD | 17,660 | GBP | 11,000 | 17,586 | 74 | |||||||||||||||||||
| United States Dollar/Canadian Dollar | ||||||||||||||||||||||||||
| 01/16/2015 | Barclays Bank | USD | 94,474 | CAD | 106,000 | 93,880 | 594 | |||||||||||||||||||
| United States Dollar/Euro | ||||||||||||||||||||||||||
| 01/16/2015 | Deutsche Bank | USD | 212,588 | EUR | 166,000 | 208,121 | 4,467 | |||||||||||||||||||
| 01/16/2015 | Royal Bank of Canada | USD | 147,279 | EUR | 116,000 | 145,434 | 1,845 | |||||||||||||||||||
| United States Dollar/Japanese Yen | ||||||||||||||||||||||||||
| 01/16/2015 | Deutsche Bank | USD | 185,832 | JPY | 20,740,000 | 184,812 | 1,020 | |||||||||||||||||||
| United States Dollar/New Zealand Dollar | ||||||||||||||||||||||||||
| 01/16/2015 | Deutsche Bank | USD | 647,071 | NZD | 828,000 | 640,838 | 6,233 | |||||||||||||||||||
| United States Dollar/Polish Zloty | ||||||||||||||||||||||||||
| 01/16/2015 | Deutsche Bank | USD | 51,236 | PLN | 170,000 | 50,306 | 930 | |||||||||||||||||||
| United States Dollar/Singapore Dollar | ||||||||||||||||||||||||||
| 01/16/2015 | Goldman Sachs | USD | 244,576 | SGD | 311,000 | 242,040 | 2,536 | |||||||||||||||||||
| United States Dollar/Swedish Krona | ||||||||||||||||||||||||||
| 01/16/2015 | Deutsche Bank | USD | 38,979 | SEK | 280,000 | 37,927 | 1,052 | |||||||||||||||||||
| United States Dollar/Swiss Franc | ||||||||||||||||||||||||||
| 01/16/2015 | Citibank | USD | 666,656 | CHF | 634,000 | 659,434 | 7,222 | |||||||||||||||||||
| $ | 2,494,676 | $ | 25,172 | |||||||||||||||||||||||
| * | Certain contracts with different trade dates and like characteristics have been shown net. |
See accompanying Notes to Financial Statements.
2014 Annual Report
49
Table of Contents
Aberdeen High Yield Fund (Unaudited)
The Aberdeen High Yield Fund (Class A shares at NAV net of fees) returned 1.65% for the 12-month period ended October 31, 2014, versus the 5.85% return of its benchmark, the Bank of America Merrill Lynch (BofA ML) U.S. High Yield Master II Index, during the same period. For broader comparison, the average return of the Fund’s Lipper peer category of High Current Yield Funds (consisting of 31 funds) was 4.45% for the period.
Despite the ebb and flow of speculation regarding the Federal Reserve’s (Fed) tapering of its accommodative monetary policy, as well as the release of relatively mixed economic data, there was diverse performance within the U.S. fixed income markets during the reporting period. The high yield market, as measured by the BofA ML U.S. High Yield Master II Index, was up 5.85% for the period, outperforming the 4.14% return of the Barclays U.S. Aggregate Bond Index,1 the U.S. investment-grade fixed income market benchmark.
The beginning of the period was marked by volatility amid speculation concerning the Fed’s possible tapering of monetary policy easing and the change in command at the central bank, as former Fed Vice Chair Janet Yellen succeeded Ben Bernanke as Fed Chair in February. The Fed began to reduce its $85 billion-per-month asset purchase program in $10 billion increments in January 2014, and ended its tapering in late October. Interest rates rose sharply in December 2013, shortly before the Fed embarked on the tapering of its quantitative easing (QE) asset purchase program, only to reverse direction the following month as a harsh winter blanketed the U.S., leading to a dramatic slowdown in economic activity. In March 2014, yields again moved higher as hawkish Fed statements led investors to bring forward their interest-rate tightening expectations. In our view, the gyrations in the U.S. Treasury yield curve over the last month of the reporting period in October 2014 might be viewed as a microcosm of the volatility over the 12-month period. Investors had to grasp with continued weakness in Eurozone2 and Chinese growth, the Ebola epidemic and, earlier in the month, a sharp correction in equity prices. On October 15, the yield to worst (YTW)3 on the BofA ML U.S. High Yield Master II Index reached 6.45%, with a spread to worst (STW)4 of +518 basis points (bps) – the highest level since July 2013. The tide turned significantly mid-month as the negative headlines turned bullish and buyers emerged. From September 30 to October 15, the BofA ML U.S. High Yield Master II Index lost 1.07%, and then posted a total return of 2.23% between October 16 and 31. At month-end, the YTW and STW on the index stood at 5.86% and +443 bps, respectively.
Default activity in the U.S. high yield market over the reporting period remained relatively benign until April 2014, when electric utility TXU’s much-anticipated default finally occurred, affecting $16.6 billion in bonds and $19.5 billion in institutional loans. This resulted in a spike in the U.S. high yield par-weighted default rate5 from 0.61% to 2.15%. However, the issuer-weighted default rate6 moved up by a much lower margin at that time. At the end of the reporting period on October 31, 2014, the par-weighted and issuer-weighted default rates stood at 2.45% and 1.41%, respectively.
The Fund’s underperformance relative to the benchmark BofA ML U.S. High Yield Master II Index for the review period was attributable to security selection in the relatively weak-performing sectors of basic industry (mostly coal miners) and energy (primarily drillers) amid an environment of declining commodity prices. Holdings in the consumer cyclical sector also detracted from performance.
Conversely, the most notable contributors to Fund performance included security selection in the services and technology as well as media.
While the Fund used derivatives during the reporting period, they had minimal impact on performance.
The Fund’s positioning remained relatively steady over the reporting period. We maintain our focus on issues that we feel offer downside protection first and upside potential second. We strive to keep up with our peers in frothy markets, with the belief that our emphasis on protecting the downside may allow the Fund to potentially outperform versus its peers in market downturns.
In our view, the overriding theme in the U.S. high yield market in October 2014 was the poor trading liquidity and the lack of conviction buying in lower-rated credits that have been the weakest performers during the recent volatility. While “buyers strike” environments such as the one we are currently experiencing have historically been good opportunities for nimble managers to plant the seeds for future alpha,7 in our opinion, we do not anticipate a wave of buying in the near term. In a year in which few funds are beating their benchmarks, we believe that many of our competitors are content to close the books on 2014 and save the risk-taking for 2015.
Nonetheless, we have not altered our bullish view of the market. We think that defaults may remain low for several years and spreads are overcompensating investors for the limited risks that exist.
| 1 | The Barclays U.S. Aggregate Bond Index is a market value-weighted performance benchmark for investment-grade fixed-rate debt issues, including government, corporate, asset-backed, and mortgage-backed securities, with maturities of at least one year. Indexes are unmanaged and have been provided for comparison purposes only. No fees or expenses are reflected. You cannot invest directly in an index. |
| 2 | The Eurozone comprises the bloc of nations which has adopted the euro as common currency and legal tender. |
| 3 | Yield to worst represents the lowest potential yield that can be received on a bond without the issuer actually defaulting. |
| 4 | Spread to worst comprises the difference in overall returns between two different classes of securities, or returns from the same class, but different representative securities. The spread to worst measures the difference from the weakest-performing security to the strongest, and can be seen as a measure of dispersion of returns within a given market or between markets. |
| 5 | The par-weighted default rate is calculated by dividing the dollar value of high yield issues in default by the total dollar value of the overall market. |
| 6 | The issuer-weighted default rate is expressed as a percentage of high yield debt issuers defaulting relative to the total number of issuers in the market. |
| 7 | Alpha is a measure of performance on a risk-adjusted basis. |
50
Annual Report 2014
Table of Contents
Aberdeen High Yield Fund (Unaudited) (concluded)
Portfolio Management:
Aberdeen North American Fixed Income Team
PAST PERFORMANCE DOES NOT GUARANTEE FUTURE RESULTS.
The performance data quoted represents past performance and current returns may be lower or higher. Class A Shares have up to a 4.25% front-end sales charge and a 0.25% 12b-1 fee. The investment return and principal value will fluctuate so that an investor’s shares, when redeemed, may be worth more or less than the original cost. To obtain performance information current to the most recent month-end, which may be higher or lower than the performance shown above, please call 866-667-9231 or go to www.aberdeen-asset.us.
Investing in mutual funds involves risk, including the possible loss of principal.
Indexes are unmanaged and have been provided for illustrative purposes only. No fees or expenses are reflected. You cannot invest directly in an index.
Lipper is a leading global provider of mutual fund information and analysis to fund companies, financial intermediaries and media organizations.
Risk Considerations
Fixed income securities are subject to certain risks including, but not limited to: interest rate (changes in interest rates may cause a decline in the market value of an investment), credit (changes in the financial condition of the issuer, borrower, counterparty, or underlying collateral), prepayment (debt issuers may repay or refinance their loans or obligations earlier than anticipated), call (some bonds allow the issuer to call a bond for redemption before it matures), and extension (principal repayments may not occur as quickly as anticipated, causing the expected maturity of a security to increase).
The Fund’s investments in high-yield bonds (commonly referred to as “junk bonds”) and other lower-rated securities will subject the Fund to substantial risk of loss. Investments in high-yield bonds are speculative and issuers of these securities are generally considered to be less financially secure and less able to repay interest and principal than issuers of investment-grade securities. Prices of high-yield bonds tend to be very volatile. These securities are less liquid than investment-grade debt securities and may be difficult to price or sell, particularly in times of negative sentiment toward high-yield securities.
Derivatives are speculative and may hurt the Fund’s performance. They present the risk of disproportionately increased losses and/or reduced gains when the financial asset or measure to which the derivative is linked changes in unexpected ways.
Please read the prospectus for more detailed information regarding these and other risks.
2014 Annual Report
51
Table of Contents
Aberdeen High Yield Fund (Unaudited)
Average Annual Total Return1 (For periods ended October 31, 2014) | 1 Yr. | Inception | ||||||||
Class A | w/o SC | 1.65% | 6.67% | |||||||
| w/SC2 | (2.66% | ) | 4.97% | |||||||
Class C | w/o SC | 0.83% | 5.93% | |||||||
| w/SC3 | (0.06% | ) | 5.93% | |||||||
Class R4 | w/o SC | 1.33% | 6.46% | |||||||
Institutional Service Class4 | w/o SC | 1.92% | 7.04% | |||||||
Institutional Class4 | w/o SC | 1.92% | 7.04% | |||||||
All figures showing the effect of a sales charge (SC) reflect the maximum charge possible because it has the most significant effect on performance data. The total returns shown above do not include the impact of financial statement rounding of the net asset value per share and/or financial statement adjustments.
| 1 | The Fund commenced operations on February 27, 2012. |
| 2 | A 4.25% front-end sales charge was deducted. |
| 3 | A 1.00% contingent deferred sales charge (CDSC) was deducted from the one year return because it is charged when Class C shares are sold within the first year after purchase. |
| 4 | Not subject to any sales charges. |
Annual Report 2014
52
Table of Contents
Aberdeen High Yield Fund (Unaudited)
Performance of a $10,000 Investment (as of October 31, 2014)
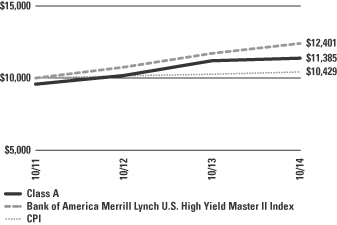
Comparative Performance of $10,000 invested in Class A shares of the Aberdeen High Yield Fund, the Bank of America Merrill Lynch U.S. High Yield Master II Index and the Consumer Price Index (CPI) since inception. Unlike the Fund, the returns for these unmanaged indexes do not reflect any fees, expenses or sales charges. Investors cannot invest directly in market indexes.
The Bank of America Merrill Lynch U.S. High Yield Master II Index is a capitalization-weighted index that tracks the performance of below investment grade corporate debt publicly issued in the U.S. domestic market.
The CPI represents changes in prices of a basket of goods and services purchased for consumption by urban households.
Investment return and principal value will fluctuate, and when redeemed, shares may be worth more or less than original cost. Past performance is no guarantee of future results. The Average Annual Total Return table and Performance graph do not reflect the deduction of taxes that a shareholder would pay on fund distributions or the redemption of fund shares. Investing in mutual funds involves market risk, including loss of principal. Performance returns assume the reinvestment of all distributions. Total returns reflect waivers and reimbursements in effect, without which returns would have been lower.
Portfolio Summary (as a percentage of net assets)
October 31, 2014 (Unaudited)
| Asset Allocation | ||||
Corporate Bonds | 89.4% | |||
Repurchase Agreement | 20.9% | |||
Liabilities in excess of other assets | (10.3% | ) | ||
| 100.0% | ||||
The following chart summarizes the composition of the Fund’s portfolio, expressed as a percentage of net assets. The industries listed below may include more than one industry group. As of October 31, 2014, the Fund did not have more than 25% of its assets invested in any industry group.
| Top Industries | ||||
Oil, Gas & Consumable Fuels | 13.8% | |||
Diversified Telecommunication Services | 10.4% | |||
Media | 6.8% | |||
Electric Utilities | 6.1% | |||
Healthcare Providers & Services | 5.2% | |||
Entertainment | 4.3% | |||
Chemicals | 3.7% | |||
Coal | 3.4% | |||
Auto Parts & Equipment | 2.8% | |||
Metals & Mining | 2.7% | |||
Energy Equipment & Services | 2.5% | |||
Other | 38.3% | |||
| 100.0% | ||||
| Top Holdings* | ||||
Nationstar Mortgage LLC 06/01/2022 | 2.2% | |||
HCA, Inc. 05/01/2023 | 2.2% | |||
Tenet Healthcare Corp. 04/01/2022 | 2.1% | |||
Sprint Communications, Inc. 11/15/2021 | 1.9% | |||
CCO Holdings LLC / CCO Holdings Capital Corp. 01/15/2024 | 1.9% | |||
CITGO Petroleum Corp. 08/15/2022 | 1.9% | |||
NRG Energy, Inc. 05/01/2024 | 1.7% | |||
Tronox Finance LLC 08/15/2020 | 1.7% | |||
Mediacom Broadband LLC / Mediacom Broadband Corp. 04/01/2023 | 1.7% | |||
Cablevision Systems Corp. 09/15/2022 | 1.6% | |||
Other | 81.1% | |||
| 100.0% | ||||
| * | For the purpose of listing top holdings, repurchase agreements are included as part of Other. |
2014 Annual Report
53
Table of Contents
Statement of Investments
October 31, 2014
Aberdeen High Yield Fund
| Shares or Principal Amount | Value (US$) | |||||||
CORPORATE BONDS (89.4%) | ||||||||
AUSTRIA (0.7%) | ||||||||
Paper & Forest Products (0.7%) | ||||||||
Sappi Papier Holding GmbH (USD), | $ | 70,000 | $ | 65,450 | ||||
CANADA (4.9%) | ||||||||
Airlines (1.4%) | ||||||||
Air Canada (USD), 7.75%, 04/15/2021 (a) | 130,000 | 136,175 | ||||||
Entertainment (1.0%) | ||||||||
River Cree Enterprises LP (CAD), | 106,000 | 101,627 | ||||||
Metals & Mining (0.5%) | ||||||||
First Quantum Minerals Ltd. (USD), | 50,000 | 48,375 | ||||||
Oil, Gas & Consumable Fuels (2.0%) | ||||||||
MEG Energy Corp. (USD), 6.38%, 01/30/2023 (a) | 75,000 | 74,250 | ||||||
Teine Energy Ltd. (USD), 6.88%, 09/30/2022 (a) | 125,000 | 118,437 | ||||||
| 192,687 | ||||||||
| 478,864 | ||||||||
CAYMAN ISLANDS (2.2%) | ||||||||
Computers & Peripherals (0.8%) | ||||||||
Seagate HDD Cayman (USD), 4.75%, 06/01/2023 | 80,000 | 82,563 | ||||||
Oil, Gas & Consumable Fuels (1.4%) | ||||||||
Vantage Drilling Co. (USD), 5.50%, 07/15/2043 (a) | 150,000 | 134,906 | ||||||
| 217,469 | ||||||||
LUXEMBOURG (1.2%) | ||||||||
Diversified Telecommunication Services (1.2%) | ||||||||
Intelsat Luxembourg SA (USD), 8.13%, 06/01/2023 | 105,000 | 111,562 | ||||||
MEXICO (0.8%) | ||||||||
Metals & Mining (0.8%) | ||||||||
Cobre Del Mayo SA de CV (USD), | 80,000 | 80,200 | ||||||
UNITED STATES (79.6%) | ||||||||
Aerospace & Defense (1.2%) | ||||||||
TransDigm, Inc. | ||||||||
(USD), 6.00%, 07/15/2022 | 20,000 | 20,225 | ||||||
(USD), 6.50%, 07/15/2024 | 95,000 | 97,850 | ||||||
| 118,075 | ||||||||
Apparel (0.5%) | ||||||||
Quiksilver, Inc. / QS Wholesale, Inc. (USD), | 85,000 | 49,725 | ||||||
Auto Parts & Equipment (2.8%) | ||||||||
Dana Holding Corp. (USD), 6.00%, 09/15/2023 | 120,000 | 126,000 | ||||||
Goodyear Tire & Rubber Co. (The) (USD), | 135,000 | 144,450 | ||||||
| 270,450 | ||||||||
Building Materials (2.0%) | ||||||||
Building Materials Corp. of America (USD), | $ | 69,000 | $ | 69,173 | ||||
Hardwoods Acquisition, Inc. (USD), | 90,000 | 90,900 | ||||||
Masco Corp. (USD), 6.50%, 08/15/2032 | 30,000 | 31,125 | ||||||
| 191,198 | ||||||||
Chemicals (3.7%) | ||||||||
Axiall Corp. (USD), 4.88%, 05/15/2023 | 90,000 | 87,300 | ||||||
Tronox Finance LLC (USD), 6.38%, 08/15/2020 | 165,000 | 169,537 | ||||||
WR Grace & Co-Conn | ||||||||
(USD), 5.13%, 10/01/2021 (a) | 50,000 | 52,094 | ||||||
(USD), 5.63%, 10/01/2024 (a) | 50,000 | 52,688 | ||||||
| 361,619 | ||||||||
Coal (3.4%) | ||||||||
Alpha Natural Resources, Inc. | ||||||||
(USD), 3.75%, 12/15/2017 | 120,000 | 75,975 | ||||||
(USD), 6.25%, 06/01/2021 | 200,000 | 95,000 | ||||||
Arch Coal, Inc. | ||||||||
(USD), 7.25%, 10/01/2020 | 155,000 | 74,400 | ||||||
(USD), 7.25%, 06/15/2021 | 25,000 | 9,250 | ||||||
Peabody Energy Corp. (USD), 6.25%, 11/15/2021 | 80,000 | 75,750 | ||||||
| 330,375 | ||||||||
Commercial Services & Supplies (2.1%) | ||||||||
Iron Mountain, Inc. (USD), 5.75%, 08/15/2024 | 80,000 | 81,600 | ||||||
Mustang Merger Corp. (USD), 8.50%, 08/15/2021 (a) | 120,000 | 121,200 | ||||||
| 202,800 | ||||||||
Distribution/Wholesale (1.1%) | ||||||||
LKQ Corp. (USD), 4.75%, 05/15/2023 | 115,000 | 111,136 | ||||||
Diversified Financial Services (2.2%) | ||||||||
Nationstar Mortgage LLC (USD), 6.50%, 06/01/2022 | 235,000 | 218,550 | ||||||
Diversified Telecommunication Services (9.2%) | ||||||||
CenturyLink, Inc., Series W (USD), | 110,000 | 122,100 | ||||||
Cincinnati Bell, Inc. (USD), 8.38%, 10/15/2020 | 142,000 | 152,295 | ||||||
Frontier Communications Corp. | ||||||||
(USD), 6.25%, 09/15/2021 | 30,000 | 30,994 | ||||||
(USD), 6.88%, 01/15/2025 | 40,000 | 40,500 | ||||||
Qwest Corp. (USD), 6.88%, 09/15/2033 | 65,000 | 65,507 | ||||||
Sprint Communications, Inc. (USD), | 146,000 | 187,610 | ||||||
T-Mobile USA, Inc. (USD), 6.84%, 04/28/2023 | 130,000 | 137,475 | ||||||
Windstream Corp. (USD), 6.38%, 08/01/2023 | 160,000 | 161,200 | ||||||
| 897,681 | ||||||||
Electric Utilities (6.1%) | ||||||||
AES Corp. (USD), 4.88%, 05/15/2023 | 75,000 | 74,812 | ||||||
Calpine Corp. | ||||||||
(USD), 5.38%, 01/15/2023 | 20,000 | 20,200 | ||||||
(USD), 7.88%, 01/15/2023 (a) | 45,000 | 49,838 | ||||||
(USD), 5.75%, 01/15/2025 | 40,000 | 40,500 | ||||||
See accompanying Notes to Financial Statements.
Annual Report 2014
54
Table of Contents
Statement of Investments (continued)
October 31, 2014
Aberdeen High Yield Fund
| Shares or Principal Amount | Value (US$) | |||||||
DPL, Inc. (USD), 6.75%, 10/01/2019 (a) | $ | 35,000 | $ | 36,138 | ||||
Dynegy Finance I, Inc. / Dynegy Finance II, Inc. | ||||||||
(USD), 7.38%, 11/01/2022 (a) | 20,000 | 21,150 | ||||||
(USD), 7.63%, 11/01/2024 (a) | 75,000 | 79,500 | ||||||
GenOn Energy, Inc. (USD), 9.88%, 10/15/2020 | 105,000 | 108,937 | ||||||
NRG Energy, Inc. (USD), 6.25%, 05/01/2024 (a) | 165,000 | 170,362 | ||||||
| 601,437 | ||||||||
Electrical Components & Equipment (0.8%) | ||||||||
Belden, Inc. (USD), 5.25%, 07/15/2024 (a) | 80,000 | 78,600 | ||||||
Energy Equipment & Services (2.5%) | ||||||||
Regency Energy Partners LP / Regency Energy Finance Corp. (USD), 4.50%, 11/01/2023 | 85,000 | 84,362 | ||||||
Sabine Pass Liquefaction LLC (USD), | 155,000 | 160,425 | ||||||
| 244,787 | ||||||||
Entertainment (3.3%) | ||||||||
Greektown Holdings LLC/Greektown Mothership Corp. (USD), 8.88%, 03/15/2019 (a) | 85,000 | 85,425 | ||||||
MGM Resorts International (USD), | 115,000 | 125,925 | ||||||
Penn National Gaming, Inc. (USD), | 120,000 | 114,600 | ||||||
| 325,950 | ||||||||
Food Products (1.0%) | ||||||||
Post Holdings, Inc. (USD), 7.38%, 02/15/2022 | 98,000 | 100,450 | ||||||
Healthcare Providers & Services (5.2%) | ||||||||
CHS/Community Health Systems, Inc. (USD), | 80,000 | 86,200 | ||||||
HCA, Inc. (USD), 4.75%, 05/01/2023 | 215,000 | 218,493 | ||||||
Tenet Healthcare Corp. (USD), 8.13%, 04/01/2022 | 175,000 | 200,594 | ||||||
| 505,287 | ||||||||
Home Builders (1.3%) | ||||||||
KB Home (USD), 7.00%, 12/15/2021 | 70,000 | 74,900 | ||||||
Meritage Homes Corp. (USD), 7.00%, 04/01/2022 | 50,000 | 54,250 | ||||||
| 129,150 | ||||||||
Information Technology Services (1.4%) | ||||||||
SunGard Data Systems, Inc. (USD), | 130,000 | 134,550 | ||||||
Iron/Steel (2.1%) | ||||||||
Steel Dynamics, Inc. | ||||||||
(USD), 5.13%, 10/01/2021 (a) | 15,000 | 15,525 | ||||||
(USD), 5.25%, 04/15/2023 | 95,000 | 99,750 | ||||||
(USD), 5.50%, 10/01/2024 (a) | 85,000 | 89,888 | ||||||
| 205,163 | ||||||||
Machinery-Diversified (1.1%) | ||||||||
Gardner Denver, Inc. (USD), | 100,000 | 104,250 | ||||||
Media (6.8%) | ||||||||
Cablevision Systems Corp. (USD), | 160,000 | 162,800 | ||||||
CCO Holdings LLC / CCO Holdings Capital Corp. (USD), 5.75%, 01/15/2024 | 180,000 | 184,275 | ||||||
Mediacom Broadband LLC / Mediacom Broadband Corp. (USD), 6.38%, 04/01/2023 | 155,000 | 163,525 | ||||||
Sinclair Television Group, Inc. (USD), | 10,000 | 9,875 | ||||||
WideOpenWest Finance LLC / WideOpenWest Capital Corp. (USD), 13.38%, 10/15/2019 | 130,000 | 148,200 | ||||||
| 668,675 | ||||||||
Metals & Mining (1.4%) | ||||||||
American Gilsonite Co. (USD), | 55,000 | 56,925 | ||||||
Compass Minerals International, Inc. (USD), | 80,000 | 78,400 | ||||||
| 135,325 | ||||||||
Miscellaneous Manufacturing (0.8%) | ||||||||
CBC Ammo LLC / CBC FinCo, Inc. (USD), | 75,000 | 74,250 | ||||||
Oil & Gas Services (1.4%) | ||||||||
Forbes Energy Services Ltd. (USD), | 105,000 | 101,325 | ||||||
Light Tower Rentals, Inc. (USD), | 33,000 | 32,505 | ||||||
| 133,830 | ||||||||
Oil, Gas & Consumable Fuels (10.4%) | ||||||||
Approach Resources, Inc. (USD), | 50,000 | 46,000 | ||||||
California Resources Corp. | ||||||||
(USD), 5.50%, 09/15/2021 (a) | 50,000 | 51,000 | ||||||
(USD), 6.00%, 11/15/2024 (a) | 50,000 | 51,000 | ||||||
Carrizo Oil & Gas, Inc. (USD), | 90,000 | 90,900 | ||||||
CITGO Petroleum Corp. (USD), | 180,000 | 183,150 | ||||||
Comstock Resources, Inc. (USD), | 80,000 | 84,400 | ||||||
EXCO Resources, Inc. | ||||||||
(USD), 7.50%, 09/15/2018 | 35,000 | 30,887 | ||||||
(USD), 8.50%, 04/15/2022 | 70,000 | 60,900 | ||||||
Hercules Offshore, Inc. | ||||||||
(USD), 7.50%, 10/01/2021 (a) | 80,000 | 49,800 | ||||||
(USD), 6.75%, 04/01/2022 (a) | 60,000 | 35,400 | ||||||
Hilcorp Energy I LP / Hilcorp Finance Co. (USD), 5.00%, 12/01/2024 (a) | 20,000 | 19,200 | ||||||
PBF Holding Co. LLC / PBF Finance Corp. (USD), 8.25%, 02/15/2020 | 55,000 | 57,544 | ||||||
Rex Energy Corp. (USD), 8.88%, 12/01/2020 | 115,000 | 121,325 | ||||||
Rosetta Resources, Inc. (USD), | 70,000 | 67,200 | ||||||
SandRidge Energy, Inc. (USD), | 75,000 | 66,750 | ||||||
See accompanying Notes to Financial Statements.
2014 Annual Report
55
Table of Contents
Statement of Investments (continued)
October 31, 2014
Aberdeen High Yield Fund
| Shares or Principal Amount | Value (US$) | |||||||
Thunderbird Resources Equity, Inc. (USD), 9.00%, 03/02/2018 (b)(c) | $ | 367,000 | $ | 184 | ||||
| 1,015,640 | ||||||||
Packaging & Containers (2.2%) | ||||||||
Paperworks Industries, Inc. (USD), | 65,000 | 66,462 | ||||||
Sealed Air Corp. | ||||||||
(USD), 8.38%, 09/15/2021 (a) | 54,000 | 61,155 | ||||||
(USD), 5.25%, 04/01/2023 (a) | 90,000 | 92,475 | ||||||
| 220,092 | ||||||||
Real Estate (1.2%) | ||||||||
AAF Holdings LLC/AAF Finance Co., PIK (USD), 12.00%, 07/01/2019 (a) | 120,000 | 120,000 | ||||||
Real Estate Investment Trust (REIT) Funds (1.3%) |
| |||||||
Corrections Corp. of America (USD), | 135,000 | 132,300 | ||||||
Retail (0.9%) | ||||||||
Neiman Marcus Group Ltd., LLC, PIK (USD), 8.75%, 10/15/2021 (a) | 80,000 | 85,600 | ||||||
Trucking & Leasing (0.3%) | ||||||||
Jurassic Holdings III, Inc. (USD), | 25,000 | 25,188 | ||||||
| 7,792,133 | ||||||||
Total Corporate Bonds | 8,745,678 | |||||||
REPURCHASE AGREEMENT (20.9%) | ||||||||
UNITED STATES (20.9%) | ||||||||
Repurchase Agreement, Fixed Income Clearing Corp., 0.00%, dated 10/31/2014, due 11/03/2014, repurchase price $2,049,000 collateralized by U.S. Treasury Note, maturing 05/31/2021; total market value of $2,095,600 | 2,049,000 | 2,049,000 | ||||||
Total Repurchase Agreement | 2,049,000 | |||||||
Total Investments | 10,794,678 | |||||||
Liabilities in excess of other assets—(10.3)% | (1,010,101 | ) | ||||||
Net Assets—100.0% | $ | 9,784,577 | ||||||
| (a) | Denotes a security issued under Regulation S or Rule 144A. |
| (b) | Security is in default. |
| (c) | The Fund’s adviser has deemed this security to be illiquid based upon procedures approved by the Board of Trustees. Illiquid securities held by the Fund represent 0.00% of net assets as of October 31, 2014. (unaudited) |
| (d) | See Notes to Financial Statements for tax unrealized appreciation/depreciation of securities. |
| CAD | Canadian Dollar |
| PIK | Payment In Kind |
| REIT | Real Estate Investment Trust |
| USD | U.S. Dollar |
At October 31, 2014, the Fund’s open forward foreign currency exchange contracts were as follows:
| Sale Contracts Settlement Date* | Counterparty | Amount Purchased | Amount Sold | Fair Value | Unrealized Appreciation | |||||||||||||||||||||
| United States Dollar/Canadian Dollar | ||||||||||||||||||||||||||
| 01/16/2015 | UBS | USD | 98,928 | CAD | 111,000 | $ | 98,308 | $ | 620 | |||||||||||||||||
| * | Certain contracts with different trade dates and like characteristics have been shown net. |
See accompanying Notes to Financial Statements.
Annual Report 2014
56
Table of Contents
Statement of Investments (concluded)
October 31, 2014
Aberdeen High Yield Fund
At October 31, 2014, the Fund held the following credit default swaps:
Buy Protection:
| Counterparty | Expiration Date | Notional Amount | Swap Details | Unrealized Appreciation/ (Depreciation) | Implied Credit Spread* | |||||||||||||
| Deutsche Bank AG | 12/20/2019 | 100,000 | Pay: Fixed rate equal to 5.00% Receive: AK Steel Corp., 5/15/20, 7.63% | $ | (2,653 | ) | 5.95% | |||||||||||
| Deutsche Bank AG | 12/20/2019 | 100,000 | Pay: Fixed rate equal to 5.00% Receive: AK Steel Corp., 5/15/20, 7.63% | (2,626 | ) | 5.95% | ||||||||||||
| $ | (5,279 | ) | ||||||||||||||||
| * | Implied credit spreads, represented in absolute terms, are utilized in determining the market value of credit default swaps agreements on corporate issues or sovereign issues and serve as an indicator of the current status of the payment/performance risk and represent the likelihood or risk of default for the credit derivative. The implied credit spread of particular referenced entity reflects the cost of buying/selling protection and may include upfront payments required to be made prior to entering into the agreement. For credit default swap with asset-backed securities or credit indices as the underlying assets, the quoted market prices and resulting market values serve as an indicator of the current status of the payment/performance risk. Wider credit spreads and increasing market values, in absolute terms when compared to the notional amount of the swap, represent a deterioration of the reference entity’s credit soundness and a greater likelihood or risk of default or other credit event occurring as defined under the terms of the agreement. |
See accompanying Notes to Financial Statements.
2014 Annual Report
57
Table of Contents
Aberdeen Tax-Free Income Fund (Unaudited)
The Aberdeen Tax-Free Income Fund (Class A shares at net asset value net of fees) returned 6.12% for the 12-month period ended October 31, 2014, versus the 7.82% return of its benchmark, the Barclays Municipal Bond Index. For broader comparison, the average return of the Fund’s Lipper peer category of General & Insured Municipal Debt Funds (consisting of 90 funds) was 8.80% for the period.
The 12-month reporting period was highlighted by precedent-setting credit events, interest rate volatility, generally constructive technical trends, and an economic backdrop providing an improved outlook and shift in investor sentiment. The U.S. municipal bond market, as measured by the Barclays Municipal Bond Index, gained 7.82% for the period. The beginning of the review period was marked by volatility amid speculation concerning the U.S. Federal Reserve’s (Fed) possible tapering of monetary policy easing and the change in command at the central bank, as former Fed Vice Chair Janet Yellen succeeded Ben Bernanke as Fed Chair in February. The Fed began to reduce its $85 billion-per-month purchases of government and mortgage-backed securities in $10 billion increments ($5 billion for each asset class) in January 2014, and ended its tapering in late October. Interest rates generally tracked investor expectations concerning the central bank’s tapering of its quantitative easing (QE) program. Yields rose sharply in December 2013, only to reverse direction the following month as a harsh winter blanketed the U.S., leading to a dramatic slowdown in economic activity. In March 2014, rates again moved higher as hawkish Fed statements, exhibited by an upward drift in its future rate projections, led investors to bring forward their interest-rate tightening expectations. Overall, U.S. Treasury rates declined from the beginning of the period to the end of the period contributing to the overall performance of the Fund and its benchmark.
In our view, the gyrations in the U.S. Treasury yield curve over the last month of the reporting period in October 2014, might be viewed as a microcosm of the volatility over the 12-month period. Investors had to grasp with continued weakness in Eurozone and Chinese growth, the Ebola epidemic, and, earlier in the month, a sharp correction in equity prices. Additionally, the Japanese yen weakened sharply at the end of October, depreciating about 3% in one day, bringing the decline to almost 11% since July 31, 2014. New York Mercantile Exchange (NYMEX) crude oil dropped over $10 a barrel over the month and also hit a new five-year low. The price of crude fell nearly 21% over the last four months of the reporting period. The combination of increased supply from the U.S. and global growth concerns has put significant downward pressure on oil and many other commodity prices.
Within the municipal bond market, the headlines were focused primarily on Detroit’s Chapter 9 bankruptcy and the continued financial struggles for Puerto Rico. Following months of public posturing by all parties, in April 2014, mediators for Detroit announced an agreement with creditors that would provide secured bondholders (unlimited general obligation tax bondholders) 74% of the value of their claims. This followed emergency manager Kevyn Orr’s previous proposal, which had implied a much more significant haircut and only a 15-to-20% payout. In early November, shortly after the end of the reporting period, U.S. Bankruptcy Court judge ruled that Detroit’s comprehensive restructuring plan is fair and feasible. The decision essentially provides the city with the legal authority to trim more than $7 billion–roughly one-third–of unsecured debt from its balance sheet and to reduce the cuts in contributions to its employee pension plan.
In late June, the legislature of the Commonwealth of Puerto Rico passed–and the governor signed–legislation that would permit Puerto Rican public corporations to restructure their debts. The law, known as the Public Corporation Debt Enforcement and Recovery Act, does not apply to the general obligation bonds of Puerto Rico or its municipalities, its sales tax financing bonds or the Puerto Rican Development Bank. Consequently, prices for most categories of Puerto Rico bonds declined following the passage of the law. The legislation was quickly challenged in federal court as usurping federal authority to legislate bankruptcy law; the matter was still pending in U.S. federal court as of the end of the reporting period on October 31, 2014. The prices for most municipal debt associated with Puerto Rico declined in value in the second half of the reporting period as Puerto Rico’s financial difficulties have worsened and the rating agencies have downgraded the credit of Puerto Rico and its agencies.
The Fund’s short duration1 relative to that of the benchmark Barclays Municipal Bond Index hampered performance as interest rates declined over the reporting period. Additionally, the Fund’s substantial overweight relative to the benchmark in higher-quality pre-refunded bonds2 also had a negative impact on performance. During the period, municipal bond investors were generally more willing to invest in lower-credit quality, higher-risk securities. More risky municipal bonds generally outperformed their higher-quality counterparts, thereby weighing on Fund performance for the period. The Fund’s underweights relative to the benchmark in state general obligation bonds, water utility bonds, and transportation were the three largest detractors from performance on the sector level.
Conversely, the Fund’s overweight allocations versus the benchmark in education, industrial development and pollution control, and public power bonds (issued by public utilities) were the largest contributors to Fund performance during the period.
We did not employ any derivatives in the Fund over the reporting period.
With the new issue calendar providing limited supply and the improvement in fund flows, market valuations have made the quest for appealing opportunities more challenging, in our view. During the
| 1 | Duration is an estimate of bond price sensitivity to changes in interest rates. The higher the duration, the greater the change (i.e., high risk) in relation to interest-rate movements. |
| 2 | A pre-funded bond’s principal is held in an escrow account, generally invested in U.S. Treasury securities, and is used to fund another callable bond for which the issuer decides to exercise its right to buy its bonds |
58
Annual Report 2014
Table of Contents
Aberdeen Tax-Free Income Fund (Unaudited) (concluded)
12-month reporting period, the yield on 10-year municipal bonds tightened about 72 basis points (bps)–or 0.72%–relative to comparable-duration U.S. Treasuries, with the yield ratio ending at 88% as the Treasury yield fell 22 bps over the annual period. We continue to look for paper secured by specific revenue streams with limited political risk, as we believe that local municipal issuers will continue to face budgetary pressures.
Despite the seemingly alarming headlines, we maintain our view that the technical backdrop in the U.S. market remains robust. The positive inflows into the tax-exempt bond market for the first 10 months of 2014 totalled more than $20 billion.
We do not believe that Congress will lower federal income tax rates anytime soon. U.S. Treasury yields remain low, with Fed action in the front end of the yield curve not likely before mid-2015, in our view. We feel that the transparency and disclosure provided by the Fed is unlikely to yield much in the way of surprises to the investment community. We see further volatility in distressed municipal credits, although we think that the volumes of defaults seen in the 2011-2012 timeframe may not be seen for some time. To that end, we believe that our ability to identify these credit risks and value the risks appropriately is the key to consistent outperformance going forward.
Portfolio Management:
Aberdeen North American Fixed Income Team
PAST PERFORMANCE DOES NOT GUARANTEE FUTURE RESULTS.
The performance data quoted represents past performance and current returns may be lower or higher. Class A Shares have up to a 4.25% front-end sales charge and a 0.25% 12b-1 fee. The investment return and principal value will fluctuate so that an investor’s shares, when redeemed, may be worth more or less than the original cost. To obtain performance information current to the most recent month-end, which may be higher or lower than the performance shown above, please call 866-667-9231 or go to www.aberdeen-asset.us.
Investing in mutual funds involves risk, including the possible loss of principal.
Indexes are unmanaged and have been provided for comparison purposes only. No fees or expenses are reflected. You cannot invest directly in an index.
Lipper is a leading global provider of mutual fund information and analysis to fund companies, financial intermediaries and media organizations.
Risk Considerations
Fixed income securities are subject to certain risks including, but not limited to: interest rate (changes in interest rates may cause a decline in the market value of an investment), credit (changes in the financial condition of the issuer, borrower, counterparty, or underlying collateral), prepayment (debt issuers may repay or refinance their loans or obligations earlier than anticipated), and extension (principal repayments may not occur as quickly as anticipated, causing the expected maturity of a security to increase). Municipal securities can be affected by adverse tax, legislative or political changes and the financial condition of the issuers of municipal securities.
Derivatives are speculative and may hurt the Fund’s performance. They present the risk of disproportionately increased losses and/or reduced gains when the financial asset or measure to which the derivative is linked changes in unexpected ways.
Please read the prospectus for more detailed information regarding these risks.
2014 Annual Report
59
Table of Contents
Aberdeen Tax-Free Income Fund (Unaudited)
Average Annual Total Return1 (For periods ended October 31, 2014) | 1 Yr. | 5 Yr. | 10 Yr. | |||||||||||
Class A | w/o SC | 6.12% | 4.49% | 3.82% | ||||||||||
| w/SC2 | 1.66% | 3.58% | 3.38% | |||||||||||
Class C | w/o SC | 5.34% | 3.74% | 3.07% | ||||||||||
| w/SC3 | 4.34% | 3.74% | 3.07% | |||||||||||
Class R4 | w/o SC | 5.96% | 4.62% | 4.02% | ||||||||||
Institutional Service Class4 | w/o SC | 6.49% | 4.79% | 4.10% | ||||||||||
Institutional Class4,5 | w/o SC | 6.49% | 4.79% | 4.10% | ||||||||||
All figures showing the effect of a sales charge (SC) reflect the maximum charge possible because it has the most significant effect on performance data. The total returns shown above do not include the impact of financial statement rounding of the net asset value per share and/or financial statement adjustments.
| 1 | Returns prior to June 23, 2008 reflect the performance of a predecessor fund (the “Predecessor Fund”). The Fund and the Predecessor Fund have substantially similar investment objectives and strategies. Please consult the Fund’s prospectus for more detail. |
| 2 | A 4.25% front-end sales charge was deducted. |
| 3 | A 1.00% contingent deferred sales charge (CDSC) was deducted from the one year return because it is charged when Class C shares are sold within the first year after purchase. |
| 4 | Not subject to any sales charge. Returns before the first offering of the Class R, Institutional Class and Institutional Service Class shares (February 25, 2013) are based on the previous performance of Class D shares. This performance is substantially similar to what the Class R, Institutional Service Class, and Institutional Class shares would have produced because all classes invest in the same portfolio of securities. Returns for the Class R, Institutional Service Class, and Institutional Class shares would only differ to the extent of the differences in expenses of the classes. |
| 5 | Effective February 25, 2013, all Class D shares of the Fund were converted into Institutional Class shares of the Fund. |
Annual Report 2014
60
Table of Contents
Aberdeen Tax-Free Income Fund (Unaudited)
Performance of a $10,000 Investment (as of October 31, 2014)
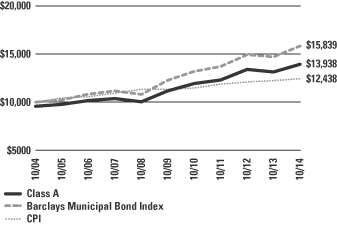
Comparative performance of $10,000 invested in Class A shares of the Aberdeen Tax-Free Income Fund, the Barclays Municipal Bond Index and the Consumer Price Index (CPI) over a 10-year period ended October 31, 2014. Unlike the Fund, the returns for these unmanaged indexes do not reflect any fees, expenses, or sales charges. Investors cannot invest directly in market indexes.
The Barclays Municipal Bond Index is a broad market performance benchmark for the tax-exempt bond market, the bonds included in this index must have a minimum credit rating of at least Baa. They must have an outstanding par value of at least $3 million and be issued as part of a transaction of at least $50 million. The index includes both zero coupon bonds and bonds subject to the Alternative Minimum tax.
The CPI represents changes in prices of a basket of goods and services purchased for consumption by urban households.
Investment return and principal value will fluctuate, and when redeemed, shares may be worth more or less than original cost. Past performance is no guarantee of future results. The Average Annual Total Return table and Performance graph do not reflect the deduction of taxes that a shareholder would pay on fund distributions or the redemption of fund shares. Investing in mutual funds involves market risk, including loss of principal. Performance returns assume the reinvestment of all distributions. Total returns reflect waivers and reimbursements in effect, without which returns would have been lower.
Portfolio Summary (as a percentage of net assets)
October 31, 2014 (Unaudited)
| Asset Allocation | ||||
Municipal Bonds | 98.5% | |||
Repurchase Agreement | 0.4% | |||
Other assets in excess of liabilities | 1.1% | |||
| 100.0% | ||||
| Top Holdings* | ||||
Harris County Health Facilities Development Corp. Revenue Bonds (SCH Health Care System), Prerefunded/Escrowed to Maturity, Series B 07/01/2027 | 6.8% | |||
Pennsylvania Turnpike Commission Revenue Bonds, Series A 07/15/2029 | 5.1% | |||
New York State Dormitory Authority Revenue Bonds (State University Dormitory Facilities), Series A 07/01/2039 | 2.7% | |||
State of Texas General Obligation Unlimited Bonds (Transportation Commission), Unrefunded 04/01/2020 | 2.7% | |||
Fort Bend Independent School District General Obligation Unlimited Bonds, Prerefunded/Escrowed to Maturity 02/15/2018 | 2.6% | |||
University of California Revenue Bonds, Series Q 05/15/2029 | 2.6% | |||
Commonwealth of Massachusetts General Obligation Limited Bonds, Series D 10/01/2018 | 2.3% | |||
State of Washington General Obligation Unlimited Bonds, Series R-2010A 01/01/2022 | 2.3% | |||
New Jersey Economic Development Authority Revenue Bonds (School Facilities Conservation), Series BB 09/01/2024 | 2.2% | |||
County of King General Obligation Limited Bonds 01/01/2025 | 2.2% | |||
Other | 68.5% | |||
| 100.0% | ||||
| * | For the purpose of listing top holdings, repurchase agreements are included as part of Other. |
| Top States | ||||
Texas | 25.3% | |||
California | 13.8% | |||
New York | 7.6% | |||
Pennsylvania | 7.1% | |||
Washington | 6.8% | |||
Massachusetts | 5.7% | |||
Georgia | 4.7% | |||
New Jersey | 3.6% | |||
New Hampshire | 3.4% | |||
Florida | 3.3% | |||
Other | 18.7% | |||
| 100.0% | ||||
2014 Annual Report
61
Table of Contents
Statement of Investments
October 31, 2014
Aberdeen Tax-Free Income Fund
Shares or Principal Amount | Value (US$) | |||||||
MUNICIPAL BONDS (98.5%) | ||||||||
Alaska (1.2%) | ||||||||
City of Valdez Revenue Bonds Pipelines Project, Series B, 5.00%, 01/01/2021 | $ | 1,000,000 | $ | 1,181,170 | ||||
California (13.8%) | ||||||||
Brea Redevelopment Agency Tax Allocation Refunding Bonds, Series A, | 1,000,000 | 602,640 | ||||||
California Educational Facilities Authority Revenue Bonds (California Institute of Technology), 5.00%, 11/01/2039 | 1,000,000 | 1,159,280 | ||||||
Chula Vista Industrial Development Revenue (San Diego Gas & Electric), Series A, | 500,000 | 503,585 | ||||||
Foothill-Eastern Transportation Corridor Agency, Series B2, 5.00%, 01/15/2053 (b) | 1,000,000 | 1,109,120 | ||||||
Los Angeles Community College District General Obligation Unlimited Bonds, Series A, | 1,000,000 | 1,208,780 | ||||||
M-S-R Energy Authority Gas Revenue Bonds, Series B, 6.13%, 11/01/2029 | 500,000 | 638,540 | ||||||
M-S-R Energy Authority Revenue Bonds, Series A, | 500,000 | 684,585 | ||||||
San Francisco City & County Public Utilities Commission Revenue Bonds, Series F, | 300,000 | 356,898 | ||||||
Santa Clara Unified School District General Obligation Unlimited Bonds, | 465,000 | 533,620 | ||||||
State of California General Obligation Unlimited Bonds Series A, | 1,100,000 | 1,180,740 | ||||||
5.00%, 03/01/2026 | 2,000,000 | 2,115,820 | ||||||
Turlock Irrigation District Revenue Bonds, | 1,000,000 | 1,135,060 | ||||||
University of California Revenue Bonds, Series Q, 5.25%, 05/15/2029 | 2,320,000 | 2,590,605 | ||||||
| 13,819,273 | ||||||||
Colorado (1.1%) | ||||||||
Colorado Health Facilities Authority Revenue Bonds (Evangelical Lutheran Good Samaritan Society), 5.00%, 12/01/2042 | 1,000,000 | 1,068,110 | ||||||
Florida (3.3%) | ||||||||
City of Tampa Revenue Bonds (Baycare Health Care System), Series A, 4.00%, 11/15/2033 | 1,000,000 | 1,024,830 | ||||||
CityPlace Community Development District, Special Assessment & Revenue Refunding Bonds, 5.00%, 05/01/2019 | 1,000,000 | 1,112,760 | ||||||
Escambia County, Solid Waste Disposal Revenue Bonds (Gulf Power Company Project), 1.35%, 04/01/2039 (b) | 1,165,000 | 1,168,996 | ||||||
| 3,306,586 | ||||||||
Georgia (4.7%) | ||||||||
Appling County Development Authority Revenue Bonds (Oglethorpe Power Corporation Project), Series A, 2.40%, 01/01/2038 (b) | 1,000,000 | 1,012,170 | ||||||
Burke County Development Authority Revenue Bonds (Georgia Power Company Plant Vogtle Project), 1.75%, 12/01/2049 (b) | 1,000,000 | 1,018,480 | ||||||
Cherokee County General Obligation Unlimited Bonds, 5.00%, 04/01/2021 | 500,000 | 582,690 | ||||||
Forsyth County General Obligation Unlimited Bonds, Series A, 5.00%, 03/01/2028 | 100,000 | 114,593 | ||||||
Municipal Electric Authority of Georgia Revenue Bonds Prerefunded, Series V, | 20,000 | 20,201 | ||||||
Prerefunded/Escrowed to Maturity, Series V, 6.60%, 01/01/2018 | 460,000 | 505,489 | ||||||
Unrefunded, Series V, 6.60%, 01/01/2018 | 1,375,000 | 1,443,874 | ||||||
| 4,697,497 | ||||||||
Illinois (1.1%) | ||||||||
Illinois Finance Authority Revenue Bonds (Carle Foundation), Series A, 6.00%, 08/15/2041 | 500,000 | 553,815 | ||||||
Illinois State Toll Highway Authority Revenue Bonds, Prerefunded, Sr. Priority, Series A-2, 5.00%, 01/01/2027 | 500,000 | 538,170 | ||||||
| 1,091,985 | ||||||||
Indiana (1.4%) | ||||||||
Indiana Toll Road Commission Revenue Bonds, Prerefunded/Escrowed to Maturity, | 1,355,000 | 1,373,577 | ||||||
Kentucky (1.1%) | ||||||||
County of Carroll Pollution Control Revenue Bonds (Utilities Company Project), Series C, | 1,200,000 | 1,100,416 | ||||||
Louisiana (3.0%) | ||||||||
East Baton Rouge Parish Sales Tax Revenue Bonds (Road & Street Improvement), | 540,000 | 614,979 | ||||||
Saint Charles Parish Revenue Bonds (Valero Energy Corp.), 4.00%, 12/01/2040 (b) | 1,250,000 | 1,355,237 | ||||||
Saint John The Baptist Parish Revenue Bonds (Marathon Oil), Series A, 5.13%, 06/01/2037 | 1,000,000 | 1,055,000 | ||||||
| 3,025,216 | ||||||||
Massachusetts (5.7%) | ||||||||
Commonwealth of Massachusetts General Obligation Limited Bonds, Series D | ||||||||
5.50%, 10/01/2016 | 1,000,000 | 1,097,320 | ||||||
5.50%, 10/01/2018 | 2,000,000 | 2,350,580 | ||||||
5.50%, 08/01/2019 | 1,000,000 | 1,198,510 | ||||||
Massachusetts Development Finance Agency Revenue Bonds (Boston Medical Center), Series C, 5.00%, 07/01/2017 | 1,000,000 | 1,093,610 | ||||||
| 5,740,020 | ||||||||
See accompanying Notes to Financial Statements.
Annual Report 2014
62
Table of Contents
Statement of Investments (continued)
October 31, 2014
Aberdeen Tax-Free Income Fund
Shares or Principal Amount | Value (US$) | |||||||
Michigan (1.0%) | ||||||||
Grand Rapids Building Authority Revenue Bonds, 5.00%, 08/01/2020 | $ | 900,000 | $ | 1,046,691 | ||||
Minnesota (0.6%) | ||||||||
University of Minnesota Revenue Bonds, Series A, 5.25%, 04/01/2029 | 500,000 | 578,020 | ||||||
Nebraska (0.9%) | ||||||||
Central Plains Energy Project, Gas Project Revenue Bonds (Project No.3), | 750,000 | 850,297 | ||||||
New Hampshire (3.4%) | ||||||||
New Hampshire Business Finance Authority Pollution Control Refunding Revenue Bonds (United Illuminating Company Project), | 1,230,000 | 1,110,673 | ||||||
New Hampshire Health & Education Facilities Authority Revenue Bonds (Dartmouth College), 5.25%, 06/01/2039 | 1,000,000 | 1,138,500 | ||||||
New Hampshire Health & Education Facilities Authority Revenue Bonds (University Systems), Series A, 5.00%, 07/01/2023 | 1,000,000 | 1,119,000 | ||||||
| 3,368,173 | ||||||||
New Jersey (3.6%) | ||||||||
New Jersey Economic Development Authority Revenue Bonds (School Facilities Conservation), Series BB, | 2,000,000 | 2,246,400 | ||||||
New Jersey State Turnpike Authority Revenue Bonds, Prerefunded/Escrowed to Maturity, Series C, 6.50%, 01/01/2016 | 275,000 | 279,680 | ||||||
New Jersey Transportation Trust Fund Authority Revenue Bonds (Transportation System), | 1,000,000 | 1,115,510 | ||||||
| 3,641,590 | ||||||||
New York (7.6%) | ||||||||
Nassau County Local Economic Assistance Corp. Revenue Bonds (Catholic Health Services), 5.00%, 07/01/2030 | 1,000,000 | 1,124,580 | ||||||
New York State Dormitory Authority Revenue Bonds (State University Dormitory Facilities), Series A, 5.00%, 07/01/2039 | 2,500,000 | 2,749,875 | ||||||
New York State Dormitory Authority Revenue Bonds (State University Educational Facilities 3rd Generation), Series A, 5.50%, 05/15/2023 | 1,160,000 | 1,451,044 | ||||||
Oneida County Industrial Development Agency Revenue Bonds (Hamilton College Civic Facilities), 5.00%, 09/15/2027 | 1,000,000 | 1,132,010 | ||||||
Tompkins County Industrial Development Agency Revenue Bonds (Cornell University Civic Facilities), Series A, 5.25%, 07/01/2030 | 1,000,000 | 1,164,800 | ||||||
| 7,622,309 | ||||||||
North Dakota (1.0%) | ||||||||
City of Grand Forks, Health Care System Revenue Bonds (Altru Health System Obligated Group), 4.50%, 12/01/2032 | 1,000,000 | 1,037,370 | ||||||
Ohio (1.4%) | ||||||||
Jobs Ohio Beverage System Revenue Bonds, Series A, 5.00%, 01/01/2018 | 500,000 | 561,965 | ||||||
Ohio Air Quality Development Authority Revenue Bonds, Prerefunded, Series A, 5.75%, 06/01/2033 (b) | 800,000 | 854,960 | ||||||
| 1,416,925 | ||||||||
Pennsylvania (7.1%) | ||||||||
Pennsylvania Beaver County Industrial Development Authority Revenue Bonds, 3.50%, 04/01/2041 (b) | 1,000,000 | 1,025,980 | ||||||
Pennsylvania Higher Educational Facilities Authority Revenue Bonds (University of Pennsylvania), Series A, 5.00%, 09/01/2019 | 800,000 | 942,832 | ||||||
Pennsylvania Turnpike Commission Revenue Bonds, Series A, 5.25%, 07/15/2029 | 4,100,000 | 5,084,451 | ||||||
| 7,053,263 | ||||||||
Puerto Rico (1.9%) | ||||||||
Puerto Rico Sales Tax Financing Corp. Revenue Bonds | ||||||||
Series C, 5.00%, 08/01/2022 | 750,000 | 713,100 | ||||||
Series A, 0.00%, 08/01/2054 (a) | 15,875,000 | 1,161,574 | ||||||
| 1,874,674 | ||||||||
South Carolina (0.4%) | ||||||||
University of South Carolina Revenue Bonds, Series A, 5.00%, 06/01/2030 | 350,000 | 384,118 | ||||||
Tennessee (0.6%) | ||||||||
Tennessee Energy Acquisition Corp. Revenue Bonds, Series A, 5.25%, 09/01/2023 | 500,000 | 580,725 | ||||||
Texas (25.3%) | ||||||||
City of Houston General Obligation Limited Bonds (Public Improvement), Series A, | 1,575,000 | 1,804,131 | ||||||
Dallas Area Rapid Transit Revenue Bonds, | 1,250,000 | 1,333,887 | ||||||
Dallas/Fort Worth International Airport, Joint Revenue Refunding Bonds, Series B, | 1,000,000 | 1,189,660 | ||||||
Fort Bend Independent School District General Obligation Unlimited Bonds, Prerefunded/Escrowed to Maturity, 5.00%, 02/15/2018 | 2,300,000 | 2,622,322 | ||||||
Harris County Health Facilities Development Corp. Revenue Bonds (SCH Health Care System), Prerefunded/Escrowed to Maturity, Series B, 5.75%, 07/01/2027 | 5,325,000 | 6,774,145 | ||||||
Lower Colorado River Authority Revenue Bonds, Prerefunded/Escrowed to Maturity, Series B, 6.00%, 01/01/2017 | 1,245,000 | 1,390,765 | ||||||
See accompanying Notes to Financial Statements.
2014 Annual Report
63
Table of Contents
Statement of Investments (concluded)
October 31, 2014
Aberdeen Tax-Free Income Fund
Shares or Principal Amount | Value (US$) | |||||||
Matagorda County Navigation District No. 1 Revenue Bond, Series B-1, | $ | 1,000,000 | $ | 1,014,500 | ||||
SA Energy Acquisition Public Facility Corp. Revenue Bonds (Gas Supply), | 500,000 | 532,500 | ||||||
State of Texas General Obligation Unlimited Bonds (Transportation Commission) | ||||||||
Prerefunded, 5.00%, 04/01/2020 | 95,000 | 105,137 | ||||||
Unrefunded, 5.00%, 04/01/2020 | 2,405,000 | 2,664,668 | ||||||
State of Texas General Obligation Unlimited Bonds (Water Financial Assistance), Series C, 5.25%, 08/01/2018 | 1,050,000 | 1,217,549 | ||||||
State of Texas Transportation Commission Revenue Bonds, 5.00%, 04/01/2027 | 1,500,000 | 1,641,870 | ||||||
Texas A&M University Revenue Bonds (Financing System), Series A, 5.00%, 05/15/2025 | 1,065,000 | 1,234,665 | ||||||
Texas Municipal Gas Acquisition & Supply Corp. I Revenue Bonds, Series D, 6.25%, 12/15/2026 | 500,000 | 616,905 | ||||||
University of North Texas Revenue Bonds (Financing System), Series A, | 1,000,000 | 1,142,520 | ||||||
| 25,285,224 | ||||||||
Washington (6.8%) | ||||||||
City of Seattle Municipal Light and Power Revenue Bonds, Unrefunded, (AGM), | 875,000 | 878,185 | ||||||
City of Seattle Water System Revenue Bonds, 5.00%, 02/01/2026 | 1,000,000 | 1,112,910 | ||||||
County of King General Obligation Limited Bonds, 5.00%, 01/01/2025 | 2,000,000 | 2,225,400 | ||||||
State of Washington General Obligation Unlimited Bonds Series R-2010A, | 2,000,000 | 2,309,780 | ||||||
Series C, 5.00%, 01/01/2026 | 200,000 | 226,994 | ||||||
| 6,753,269 | ||||||||
Wisconsin (0.5%) | ||||||||
Wisconsin Health & Educational Facilities Authority Revenue Bonds (Aurora Health Care), Series A, 5.00%, 07/15/2028 | 500,000 | 548,140 | ||||||
Total Municipal Bonds | 98,444,638 | |||||||
REPURCHASE AGREEMENT (0.4%) | ||||||||
United States (0.4%) | ||||||||
Repurchase Agreement, Fixed Income Clearing Corp., 0.00%, dated 10/31/2014, due 11/03/2014, repurchase price $390,000, collateralized by U.S. Treasury Note, maturing 10/31/2021; total market value of $398,962 | 390,000 | 390,000 | ||||||
Total Repurchase Agreement | 390,000 | |||||||
Total Investments | 98,834,638 | |||||||
Other assets in excess of liabilities—1.1% | 1,138,828 | |||||||
Net Assets—100.0% | $ | 99,973,466 | ||||||
| (a) | Issued with a zero coupon. |
| (b) | Variable or Floating Rate Security. Rate disclosed is as of October 31, 2014. |
| (c) | See Notes to Financial Statements for tax unrealized appreciation/depreciation of securities. |
Distribution of investments, as a percentage of securities at value, is as follows:
| Industry | Percent | Value | ||||||
General Obligation | 21.7% | $ | 21,449,383 | |||||
Higher Education | 14.6% | 14,463,189 | ||||||
Medical | 12.3% | 12,130,990 | ||||||
Transportation | 11.3% | 11,142,378 | ||||||
Development | 8.7% | 8,591,197 | ||||||
General | 8.4% | 8,289,057 | ||||||
Power | 5.3% | 5,250,684 | ||||||
Pollution | 5.2% | 5,099,029 | ||||||
Education | 3.4% | 3,405,680 | ||||||
School District | 3.2% | 3,155,942 | ||||||
Utilities | 2.8% | 2,807,641 | ||||||
Water | 1.5% | 1,469,808 | ||||||
Airport | 1.2% | 1,189,660 | ||||||
Cash | 0.4% | 390,000 | ||||||
| 100.0% | 98,834,638 | |||||||
See accompanying Notes to Financial Statements.
Annual Report 2014
64
Table of Contents
Aberdeen Ultra-Short Duration Bond Fund (Unaudited)
The Aberdeen Ultra-Short Duration Bond Fund (Class A shares at net asset value net of fees) returned 0.22% for the 12-month period ended October 31, 2014, versus the 0.28% return of its benchmark, the Bank of America Merrill Lynch 1-Year Treasury Bill Index, for the same period. For broader comparison, the average return of the Fund’s Lipper peer category of Ultra-Short Obligation Funds (consisting of 49 funds) was 0.61% for the period.
We believe that the market environment during the reporting period may be characterized as “erratic” for interest rates and stable for spread assets.1 The beginning of the period was marked by volatility amid speculation concerning the U.S. Federal Reserve’s (Fed) possible tapering of monetary policy easing and the change in command at the central bank, as former Fed Vice Chair Janet Yellen succeeded Ben Bernanke as Fed Chair in February. The Fed began to reduce its $85 billion-per-month asset purchase program in $10 billion increments in January 2014, and ended its tapering in late October.
Interest rates rose sharply in December 2013, shortly before the Fed embarked on the tapering of its quantitative easing (QE) asset purchase program, only to reverse direction the following month as a harsh winter blanketed the U.S., leading to a dramatic slowdown in economic activity. In March 2014, yields again moved higher as hawkish Fed statements, exhibited by an upward drift in its future rate projections, led investors to bring forward their interest-rate tightening expectations. In our view, the gyrations in the U.S. Treasury yield curve over the last month of the reporting period in October 2014 might be viewed as a microcosm of the volatility over the 12-month period. Investors had to grasp with continued weakness in Eurozone2 and Chinese growth, the Ebola epidemic and, earlier in the month, a sharp correction in equity prices. Two- and three-year Treasury yields dipped to an intraday low of 0.25% and 0.56%, respectively, on October 15, before reversing and closing the month at corresponding yields of 0.49% and 0.92% following improving economic data reports and a more hawkish-than-expected statement from the Federal Open Market Committee (FOMC). Ultimately, over the reporting period, the short-term segment of the yield curve was virtually flat. There was a dichotomy, however, in performance between the intermediate- and long-term portions of the yield curve. For example, the yield on the five-year Treasury note increased by 31 basis points (bps)–or 0.31%-over the period, while the ten-year Treasury yield declined by 22 bps.
The U.S. economic recovery hit several peaks and valleys during the reporting period, with healthy gross domestic product (GDP) growth in the fourth quarter of 2013 and the second and third quarters of 2014, sandwiched around a contraction in the first quarter of the year. As expected, consumer spending was the primary driver of the two upturns and the lone decline in GDP during the period. The U.S. economy added roughly 1.7 million jobs over the 12-month review period, while the unemployment rate fell from 7.2% to 5.8%. At the end of the period, however, the labor force participation rate3 hovered just above its lowest level in more than 36 years.
Although fixed income investors remained cognizant of shareholder — rather than debt-holder — friendly events, there was healthy demand for spread assets during the reporting period. This was due to an improving economy, which we feel should help maintain positive corporate fundamentals. The shorter-dated (one- to three-year) segment of the credit market was well supported as Treasury yields remained low and short-duration4 investors continued to reinvest into spread assets in an effort to enhance the yield on their portfolios.
Fund performance for the reporting period was hampered by the allocation to three-year fixed rate assets, as interest rates moved higher in the “belly” of the yield curve5 over the period, while yields on shorter-dated issues were virtually unchanged.
The Fund’s overweight to spread assets added modestly to performance as shorter-dated risk assets exhibited little spread volatility, which had a more significant negative impact on longer-dated risk assets. The largest spread sector contributors to Fund performance were financials and holdings in AAA rated6 auto receivables.
Regarding the use of derivatives, we employed interest rate futures during the reporting period as a hedge against interest rate risk. Over the 12-month, period it detracted 9 bps from the Fund’s total return as interest rates remained low due to relatively tame inflation and geopolitical concerns in Ukraine and the Middle East.
The most significant change to the Fund during the reporting period was the addition of a substantial short interest rate futures position, which we employed solely for hedging interest rate risk. As the business cycle continues to develop, we think that economic data may strengthen further, leading market participants to position for an eventual increase in the fed funds rate. This may potentially put upward pressure on interest rates in the front end of the yield curve. We now believe that the fed funds rate will increase in the second quarter of 2015; therefore, we feel it is prudent to hedge the Fund’s interest rate exposure as two-year Treasury yields–even after their upward move during the review period–remain at relatively low levels.
The conclusion of the Fed’s asset purchase program in October and the transition into tighter monetary policy was the focus of many
| 1 | Spread assets comprise all securities other than U.S. Treasuries, for which principal and interest are guaranteed by the U.S. government. |
| 2 | The Eurozone comprises the bloc of nations which has adopted the euro as common currency and legal tender. |
| 3 | The labor force participation rate is expressed as a percentage of the U.S. population aged 16 years and older working or actively seeking work. |
| 4 | Duration is an estimate of bond price sensitivity to changes in interest rates. The higher the duration, the greater the change (i.e., high risk) in relation to interest-rate movements. |
| 5 | The “belly” of the U.S. Treasury yield curve includes securities with maturities of between three and seven years. |
| 6 | Standard & Poor’s, Moody’s, and Fitch are three international credit rating agencies that evaluate credit risk. Agency credit ratings are expressed as letter grades that range from “AAA” to “D” to communicate the respective agency’s opinion of relative level of credit risk. |
2014 Annual Report
65
Table of Contents
Aberdeen Ultra-Short Duration Bond Fund (Unaudited) (concluded)
investors earlier this year, including Aberdeen. However, as this year has evolved, the migration toward higher interest rates did not occur; rather, the opposite happened. The continued economic slowdown in Europe and China has led many global central banks to view U.S. Treasuries as a cheap asset class relative to the sovereign debt of other developed and peripheral markets. One can hardly argue against this, in our opinion, as U.S. Treasury yields are higher than most of these other markets. This demand by foreign central banks for U.S. Treasury debt has supplanted the demand which has dried up as a result of the end of the Fed’s QE program. However, our outlook for a gradual increase in interest rates has not changed, especially for the shorter-maturity focus of the Fund. Ironically, two- and three-year Treasury yields have actually increased since the beginning of 2014, as these securities are more closely tied to U.S economic data and its implications on Fed policy. We maintain our belief that the low absolute yields of shorter maturities are better skewed toward a sell-off should U.S. economic data surprise to the upside, yet they cannot decline much more (unlike those of longer maturities) if economic data disappoint. Therefore, we intend to remain conservative in our interest rate positioning, favoring floating-rate debt and seeking to enhance yield and return through a larger allocation to spread assets.
Portfolio Management:
Aberdeen North American Fixed Income Team
PAST PERFORMANCE DOES NOT GUARANTEE FUTURE RESULTS.
The performance data quoted represents past performance and current returns may be lower or higher. Class A Shares have up to a 4.25% front-end sales charge and a 0.25% 12b-1 fee. The investment return and principal value will fluctuate so that an investor’s shares, when redeemed, may be worth more or less than the original cost. To obtain performance information current to the most recent month-end, which may be higher or lower than the performance shown above, please call 866-667-9231 or go to www.aberdeen-asset.us.
Investing in mutual funds involves risk, including the possible loss of principal.
Indexes are unmanaged and have been provided for comparison purposes only. No fees or expenses are reflected. You cannot invest directly in an index.
Lipper is a leading global provider of mutual fund information and analysis to fund companies, financial intermediaries and media organizations.
Risk Considerations
Fixed income securities are subject to certain risks including, but not limited to: interest rate (changes in interest rates may cause a decline in the market value of an investment), credit (changes in the financial condition of the issuer, borrower, counterparty, or underlying collateral), prepayment (debt issuers may repay or refinance their loans or obligations earlier than anticipated), and extension (principal repayments may not occur as quickly as anticipated, causing the expected maturity of a security to increase).
Futures are speculative and may hurt the Fund’s performance. They present the risk of disproportionately increased losses and/or reduced gains when the financial asset or measure to which the derivative is linked changes in unexpected ways.
Please read the prospectus for more detailed information regarding these and other risks.
Annual Report 2014
66
Table of Contents
Aberdeen Ultra-Short Duration Bond Fund (Unaudited)
Average Annual Total Return (For periods ended October 31, 2014) | 1 Yr. | Inception1 | ||||||||
Class A2 | w/o SC | 0.22% | 0.58% | |||||||
| w/SC3 | (4.01% | ) | (0.52% | ) | ||||||
Institutional Service Class2,4 | w/o SC | 0.27% | 0.69% | |||||||
Institutional Class4 | w/o SC | 0.27% | 0.69% | |||||||
All figures showing the effect of a sales charge (SC) reflect the maximum charge possible because it has the most significant effect on performance data. The total returns shown above do not include the impact of financial statement rounding of the net asset value per share and/or financial statement adjustments.
| 1 | The Fund commenced operations on November 30, 2010. |
| 2 | Returns before the first offering of Class A (November 22, 2011), and the Institutional Service Class (January 20, 2012) are based on the previous performance of the Institutional Class. This performance of Class A and the Institutional Service Class is substantially similar to what the Class A and Institutional Service Class would have produced because all classes invest in the same portfolio of securities. Returns for the Class A and Institutional Class shares would only differ to the extent of the differences in expenses of the classes. |
| 3 | A 4.25% front-end sales charge was deducted. |
| 4 | Not subject to any sales charges. |
2014 Annual Report
67
Table of Contents
Aberdeen Ultra-Short Duration Bond Fund (Unaudited)
Performance of a $10,000 Investment (as of October 31, 2014)
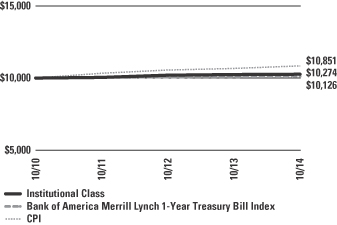
Comparative Performance of $10,000 invested in Institutional Class shares of the Aberdeen Ultra-Short Duration Bond Fund, the Bank of America Merrill Lynch 1-Year Treasury Bill Index and the Consumer Price Index (CPI) since inception. Unlike the Fund, the returns for these unmanaged indexes do not reflect any fees, expenses or sales charges. Investors cannot invest directly in market indexes.
The Bank of America Merrill Lynch 1-Year Treasury Bill Index is a capitalization-weighted index comprised of a single issue purchased at the beginning of the month and held for a full month. At the end of the month that issue is sold and rolled into a newly selected issue. The issue selected at each month-end rebalancing is the outstanding Treasury Bill that matures closest to, but not beyond, 1 year from the rebalancing date.
The CPI represents changes in prices of a basket of goods and services purchased for consumption by urban households.
Investment return and principal value will fluctuate, and when redeemed, shares may be worth more or less than original cost. Past performance is no guarantee of future results. The Average Annual Total Return table and Performance graph do not reflect the deduction of taxes that a shareholder would pay on fund distributions or the redemption of fund shares. Investing in mutual funds involves market risk, including loss of principal. Performance returns assume the reinvestment of all distributions. Total returns reflect waivers and reimbursements in effect, without which returns would have been lower.
Portfolio Summary (as a percentage of net assets)
October 31, 2014 (Unaudited)
| Asset Allocation | ||||
Corporate Bonds | 80.4% | |||
U.S. Agencies | 9.4% | |||
Asset-Backed Securities | 6.1% | |||
U.S. Treasuries | 3.0% | |||
Other assets in excess of liabilities | 1.1% | |||
| 100.0% | ||||
The following chart summarizes the composition of the Fund’s portfolio, expressed as a percentage of net assets. The industries listed below may include more than one industry group. As of October 31, 2014, the Fund did not have more than 25% of its assets invested in any industry group.
| Top Industries | ||||
Commercial Banks | 16.9% | |||
Electric Utilities | 9.6% | |||
Diversified Financial Services | 9.5% | |||
Insurance | 6.6% | |||
Oil, Gas & Consumable Fuels | 6.2% | |||
Pharmaceutical | 5.3% | |||
Metals & Mining | 3.6% | |||
Media | 2.9% | |||
Energy Equipment & Services | 2.7% | |||
Food Products | 2.7% | |||
Other | 34.0% | |||
| 100.0% | ||||
| Top Holdings | ||||
Federal Home Loan Mortgage Corp. 11/17/2014 | 3.5% | |||
Federal National Mortgage Association 02/27/2015 | 3.0% | |||
Federal Home Loan Mortgage Corp. 12/15/2014 | 2.9% | |||
U.S. Treasury Notes 03/31/2016 | 2.5% | |||
TransCanada PipeLines Ltd. 03/02/2015 | 1.7% | |||
Express Scripts Holding Co. 11/21/2014 | 1.7% | |||
TESCO PLC 12/05/2014 | 1.7% | |||
ERAC USA Finance LLC 04/15/2016 | 1.6% | |||
Georgia Power Co. 11/15/2015 | 1.5% | |||
Santander Holdings USA, Inc. 09/24/2015 | 1.5% | |||
Other | 78.4% | |||
| 100.0% | ||||
Annual Report 2014
68
Table of Contents
Statement of Investments
October 31, 2014
Aberdeen Ultra-Short Duration Bond Fund
| Shares or Principal Amount | Value (US$) | |||||||
ASSET-BACKED SECURITIES (6.1%) | ||||||||
AUSTRALIA (2.1%) | ||||||||
SMART Trust | ||||||||
Series 2011-2US, Class A4A (USD), | $ | 137,237 | $ | 137,948 | ||||
Series 2012-4US, Class A3B (USD), | 29,973 | 29,983 | ||||||
Series 2012-4US, Class A4A (USD), | 54,000 | 53,932 | ||||||
| 221,863 | ||||||||
UNITED STATES (4.0%) | ||||||||
Chesapeake Funding LLC, Series 2011-2A, Class A (USD), 1.40%, 04/07/2024 (a)(b) | 121,180 | 122,038 | ||||||
GE Equipment Transportation LLC, | 119,876 | 120,073 | ||||||
Navistar Financial Dealer Note Master Trust, | 100,000 | 100,053 | ||||||
Santander Drive Auto Receivables Trust, | 65,000 | 66,488 | ||||||
| 408,652 | ||||||||
Total Asset-Backed Securities | 630,515 | |||||||
CORPORATE BONDS (80.4%) | ||||||||
AUSTRALIA (2.4%) | ||||||||
Commercial Banks (1.0%) | ||||||||
Westpac Banking Corp. (USD), | 100,000 | 100,429 | ||||||
Metals & Mining (1.4%) | ||||||||
BHP Billiton Finance USA Ltd. (USD), | 150,000 | 150,332 | ||||||
| 250,761 | ||||||||
BELGIUM (1.4%) | ||||||||
Beverages (1.4%) | ||||||||
Anheuser-Busch InBev Finance, Inc. (USD), | 150,000 | 149,837 | ||||||
CANADA (8.2%) | ||||||||
Commercial Banks (4.7%) | ||||||||
Bank of Montreal (USD), MTN, | 100,000 | 100,564 | ||||||
Bank of Nova Scotia (USD), | 125,000 | 125,663 | ||||||
Royal Bank of Canada (USD), GMTN, | 150,000 | 150,399 | ||||||
Toronto-Dominion Bank (The) (USD), GMTN, | 100,000 | 100,499 | ||||||
| 477,125 | ||||||||
Electric Utilities (0.3%) | ||||||||
TransAlta Corp. (USD), | 35,000 | 34,962 | ||||||
Energy Equipment & Services (1.7%) | ||||||||
TransCanada PipeLines Ltd. (USD), | 175,000 | 175,249 | ||||||
Oil, Gas & Consumable Fuels (1.5%) | ||||||||
Total Capital Canada Ltd. (USD), 0.61%, 01/15/2016 (b) | 150,000 | 150,557 | ||||||
| 837,893 | ||||||||
GERMANY (1.5%) | ||||||||
Auto Manufacturers (1.5%) | ||||||||
Daimler Finance North America LLC (USD), | 150,000 | 150,965 | ||||||
NETHERLANDS (1.5%) | ||||||||
Oil, Gas & Consumable Fuels (1.5%) | ||||||||
Shell International Finance BV (USD), | 150,000 | 150,333 | ||||||
SWITZERLAND (0.7%) | ||||||||
Metals & Mining (0.7%) | ||||||||
Glencore Funding LLC (USD), 1.70%, 05/27/2016 (a) | 75,000 | 75,491 | ||||||
UNITED KINGDOM (8.9%) | ||||||||
Commercial Banks (3.2%) | ||||||||
Abbey National Treasury Services PLC (USD), | 140,000 | 146,367 | ||||||
Barclays Bank PLC (USD), 2.75%, 02/23/2015 | 100,000 | 100,696 | ||||||
Royal Bank of Scotland Group PLC (USD), | 85,000 | 86,214 | ||||||
| 333,277 | ||||||||
Food Products (1.7%) | ||||||||
TESCO PLC (USD), 2.00%, 12/05/2014 (a) | 175,000 | 175,134 | ||||||
Metals & Mining (1.5%) | ||||||||
Rio Tinto Finance USA PLC (USD), 1.13%, 03/20/2015 | 150,000 | 150,383 | ||||||
Oil, Gas & Consumable Fuels (1.5%) | ||||||||
BP Capital Markets PLC (USD), 0.66%, 11/07/2016 (b) | 150,000 | 150,478 | ||||||
Pharmaceutical (1.0%) | ||||||||
GlaxoSmithKline Capital, Inc. (USD), | 100,000 | 100,204 | ||||||
| 909,476 | ||||||||
UNITED STATES (55.8%) | ||||||||
Aerospace & Defense (2.4%) | ||||||||
L-3 Communications Corp. (USD), 1.50%, 05/28/2017 | 100,000 | 99,392 | ||||||
Rockwell Collins, Inc. (USD), 0.58%, 12/15/2016 (b) | 150,000 | 150,159 | ||||||
| 249,551 | ||||||||
Commercial Banks (8.0%) | ||||||||
Bank of America Corp. (USD), 1.50%, 10/09/2015 | 150,000 | 151,086 | ||||||
Capital One Financial Corp. (USD), | 100,000 | 100,254 | ||||||
See accompanying Notes to Financial Statements.
2014 Annual Report
69
Table of Contents
Statement of Investments (continued)
October 31, 2014
Aberdeen Ultra-Short Duration Bond Fund
| Shares or Principal Amount | Value (US$) | |||||||
Citigroup, Inc. (USD), 1.30%, 11/15/2016 | $ | 100,000 | $ | 100,219 | ||||
JPMorgan Chase & Co. (USD), GMTN, | 150,000 | 150,493 | ||||||
Morgan Stanley (USD), 1.48%, 02/25/2016 (b) | 100,000 | 101,238 | ||||||
Wells Fargo & Co. | ||||||||
(USD), 1.16%, 06/26/2015 (b) | 68,000 | 68,368 | ||||||
(USD), MTN, 0.53%, 06/02/2017 (b) | 150,000 | 149,732 | ||||||
| 821,390 | ||||||||
Commercial Services & Supplies (1.6%) | ||||||||
ERAC USA Finance LLC (USD), | 159,000 | 160,080 | ||||||
Diversified Financial Services (9.5%) | ||||||||
American Express Credit Corp. (USD), | 100,000 | 100,608 | ||||||
BlackRock, Inc. (USD), 1.38%, 06/01/2015 | 150,000 | 150,861 | ||||||
General Electric Capital Corp. | ||||||||
MTN (USD), 1.10%, 05/09/2016 (b) | 25,000 | 25,252 | ||||||
(USD), GMTN, 0.88%, 07/12/2016 (b) | 150,000 | 151,220 | ||||||
HSBC Finance Corp. (USD), 5.00%, 06/30/2015 | 90,000 | 92,407 | ||||||
John Deere Capital Corp., Series FIX (USD), | 150,000 | 150,530 | ||||||
PACCAR Financial Corp. (USD), MTN, | 150,000 | 150,513 | ||||||
Santander Holdings USA, Inc. (USD), | 149,000 | 151,515 | ||||||
| 972,906 | ||||||||
Diversified Telecommunication Services (1.2%) | ||||||||
Verizon Communications, Inc. (USD), | 125,000 | 127,822 | ||||||
Electric Utilities (9.3%) | ||||||||
Dayton Power & Light Co. (The) (USD), | 35,000 | 35,391 | ||||||
Dominion Gas Holdings LLC (USD), | 120,000 | 119,999 | ||||||
Dominion Resources, Inc. (USD), 1.25%, 03/15/2017 | 125,000 | 124,867 | ||||||
Duke Energy Corp. (USD), 0.61%, 04/03/2017 (b) | 100,000 | 100,335 | ||||||
Duke Energy Indiana, Inc. (USD), 0.58%, 07/11/2016 (b) | 130,000 | 130,227 | ||||||
Entergy Louisiana LLC (USD), 1.88%, 12/15/2014 | 150,000 | 150,253 | ||||||
Georgia Power Co. (USD), 0.63%, 11/15/2015 | 160,000 | 160,114 | ||||||
Oncor Electric Delivery Co. LLC (USD), | 130,000 | 131,498 | ||||||
| 952,684 | ||||||||
Electronics (1.4%) | ||||||||
Thermo Fisher Scientific, Inc. (USD), | 145,000 | 144,829 | ||||||
Energy Equipment & Services (1.0%) | ||||||||
Energy Transfer Partners LP (USD), | 100,000 | 101,207 | ||||||
Food Products (1.0%) | ||||||||
WM Wrigley Jr Co. (USD), 1.40%, 10/21/2016 (a) | 100,000 | 100,531 | ||||||
Gas Utilities (1.0%) | ||||||||
CenterPoint Energy, Inc., Series B (USD), | 100,000 | 103,441 | ||||||
Healthcare Providers & Services (1.4%) | ||||||||
Ventas Realty LP (USD), 1.25%, 04/17/2017 | 145,000 | 144,742 | ||||||
Insurance (6.6%) | ||||||||
Berkshire Hathaway Finance Corp. (USD), | 150,000 | 150,833 | ||||||
CNA Financial Corp. (USD), 5.85%, 12/15/2014 | 143,000 | 143,811 | ||||||
MetLife, Inc. (USD), 1.90%, 12/15/2017 | 25,000 | 25,227 | ||||||
New York Life Global Funding (USD), | 100,000 | 100,158 | ||||||
Principal Life Global Funding II (USD), | 150,000 | 150,747 | ||||||
Transatlantic Holdings, Inc. (USD), | 100,000 | 105,284 | ||||||
| 676,060 | ||||||||
Media (2.9%) | ||||||||
COX Communications, Inc. (USD), | 150,000 | 150,814 | ||||||
NBCUniversal Enterprise, Inc. (USD), | 150,000 | 150,630 | ||||||
| 301,444 | ||||||||
Oil, Gas & Consumable Fuels (1.7%) | ||||||||
Devon Energy Corp. (USD), 0.77%, 12/15/2016 (b) | 100,000 | 100,378 | ||||||
Transocean, Inc. (USD), 5.05%, 12/15/2016 | 70,000 | 73,462 | ||||||
| 173,840 | ||||||||
Pharmaceutical (4.3%) | ||||||||
AbbVie, Inc. (USD), 1.20%, 11/06/2015 | 100,000 | 100,565 | ||||||
Express Scripts Holding Co. (USD), | 175,000 | 175,213 | ||||||
McKesson Corp. (USD), 0.63%, 09/10/2015 (b) | 100,000 | 100,127 | ||||||
Mylan, Inc. (USD), 1.80%, 06/24/2016 | 65,000 | 65,815 | ||||||
| 441,720 | ||||||||
Retail (1.0%) | ||||||||
CVS Health Corp. (USD), | 100,000 | 100,174 | ||||||
Software (1.0%) | ||||||||
Oracle Corp. (USD), | 100,000 | 100,000 | ||||||
Transportation (0.5%) | ||||||||
CSX Corp. (USD), | 50,000 | 51,183 | ||||||
| 5,723,604 | ||||||||
Total Corporate Bonds | 8,248,360 | |||||||
See accompanying Notes to Financial Statements.
Annual Report 2014
70
Table of Contents
Statement of Investments (concluded)
October 31, 2014
Aberdeen Ultra-Short Duration Bond Fund
| Shares or Principal Amount | Value (US$) | |||||||
U.S. AGENCIES (9.4%) | ||||||||
UNITED STATES (9.4%) | ||||||||
Federal Home Loan Mortgage Corp. | ||||||||
(USD), 0.00%, 11/17/2014 (c) | $ | 360,000 | $ | 359,981 | ||||
(USD), 0.00%, 12/15/2014 (c) | 300,000 | 299,945 | ||||||
Federal National Mortgage Association | 300,000 | 300,045 | ||||||
| 959,971 | ||||||||
Total U.S. Agencies | 959,971 | |||||||
U.S. TREASURIES (3.0%) | ||||||||
UNITED STATES (3.0%) | ||||||||
U.S. Treasury Notes | ||||||||
(USD), 2.13%, 05/31/2015 | 50,000 | 50,574 | ||||||
(USD), 2.25%, 03/31/2016 | 250,000 | 256,895 | ||||||
| 307,469 | ||||||||
Total U.S. Treasuries | 307,469 | |||||||
Total Investments | 10,146,315 | |||||||
Other assets in excess of liabilities—1.1% | 112,277 | |||||||
Net Assets—100.0% | $ | 10,258,592 | ||||||
| (a) | Denotes a security issued under Regulation S or Rule 144A. |
| (b) | Variable or Floating Rate Security. Rate disclosed is as of October 31, 2014. |
| (c) | Issued with a zero coupon. |
| (d) | See Notes to Financial Statements for tax unrealized appreciation/depreciation of securities. |
| GMTN | Global Medium Term Note |
| MTN | Medium Term Note |
| USD | U.S. Dollar |
At October 31, 2014, the Fund held the following futures contracts:
| Futures Contract | Counterparty | Number of Contracts Long (Short) | Expiration Date | Unrealized Depreciation | ||||||||||
United States Treasury Note 6%-2 year | UBS | (5 | ) | 12/31/2014 | $ | (2,074 | ) | |||||||
See accompanying Notes to Financial Statements.
2014 Annual Report
71
Table of Contents
Statements of Assets and Liabilities
October 31, 2014
| Aberdeen Asia Bond Fund | Aberdeen Core Fixed Income Fund | Aberdeen Emerging Markets Debt Fund | Aberdeen Emerging Markets Debt Local Currency Fund | Aberdeen Global Fixed Income Fund | ||||||||||||||||
Assets: | ||||||||||||||||||||
Investments, at value | $ | 202,288,494 | $ | 11,897,959 | $ | 30,171,225 | $ | 29,576,832 | $ | 19,951,645 | ||||||||||
Repurchase agreements, at value | 26,031,771 | 200,000 | 519,000 | 366,408 | 520,000 | |||||||||||||||
|
|
|
|
|
|
|
|
|
| |||||||||||
Total investments | 228,320,265 | 12,097,959 | 30,690,225 | 29,943,240 | 20,471,645 | |||||||||||||||
|
|
|
|
|
|
|
|
|
| |||||||||||
Foreign currency, at value | 3,912,368 | – | 788 | 520,060 | 287,510 | |||||||||||||||
Cash | 9,062 | 19,643 | 732 | 1,300 | 9 | |||||||||||||||
Cash collateral pledged for futures | 672,588 | 3,828 | – | – | 112,398 | |||||||||||||||
Due from Broker | 172,594 | – | – | – | – | |||||||||||||||
Cash at broker for China A shares | 17,325 | – | – | – | – | |||||||||||||||
Interest receivable | 3,025,224 | 59,013 | 471,399 | 602,822 | 222,236 | |||||||||||||||
Receivable for capital shares issued | 2,127,851 | – | – | 329 | 25,336 | |||||||||||||||
Unrealized appreciation on forward foreign currency exchange contracts | 1,797,110 | – | 125,334 | 149,224 | 26,370 | |||||||||||||||
Receivable for investments sold | – | 205,474 | – | 682,472 | 297,827 | |||||||||||||||
Receivable from Adviser | 2,676 | 22,253 | 20,958 | 22,566 | 14,363 | |||||||||||||||
Prepaid expenses | 20,955 | 30,539 | 31,736 | 6,748 | 29,450 | |||||||||||||||
|
|
|
|
|
|
|
|
|
| |||||||||||
Total assets | 240,078,018 | 12,438,709 | 31,341,172 | 31,928,761 | 21,487,144 | |||||||||||||||
|
|
|
|
|
|
|
|
|
| |||||||||||
Liabilities: | ||||||||||||||||||||
Payable for investments purchased | 362,380 | 349,840 | 56,472 | 659,647 | 359,048 | |||||||||||||||
Unrealized depreciation on forward foreign currency exchange contracts | 1,523,448 | – | 38,969 | 191,707 | 70,251 | |||||||||||||||
Payable for capital shares redeemed | 104,219 | – | – | 39 | 4,611 | |||||||||||||||
Variation margin payable for futures contracts | 85,958 | 3,516 | – | – | 21,761 | |||||||||||||||
Accrued foreign capital gains tax | 59,294 | – | 186 | 569 | – | |||||||||||||||
Distributions payable | – | 7,033 | – | – | – | |||||||||||||||
Accrued expenses and other payables: | ||||||||||||||||||||
Investment advisory fees | 89,466 | 3,119 | 19,697 | 21,104 | 10,783 | |||||||||||||||
Transfer agent fees | 24,595 | 10,647 | 559 | 5,590 | 2,410 | |||||||||||||||
Administration fees | 14,314 | 832 | 2,101 | 2,110 | 1,438 | |||||||||||||||
Custodian fees | 737 | 400 | 1,188 | 4,454 | 1,002 | |||||||||||||||
Printing fees | 332 | 1,519 | 401 | 642 | 2,680 | |||||||||||||||
Distribution fees | 683 | 2,955 | 15 | 1,241 | 600 | |||||||||||||||
Fund accounting fees | 3,009 | 887 | 456 | 485 | 317 | |||||||||||||||
Administrative services fees | 1,597 | 50 | – | – | 2,973 | |||||||||||||||
Legal fees | 640 | 178 | 96 | 103 | 67 | |||||||||||||||
Other | 9,596 | 4,948 | 7,383 | 6,860 | 7,063 | |||||||||||||||
|
|
|
|
|
|
|
|
|
| |||||||||||
Total liabilities | 2,280,268 | 385,924 | 127,523 | 894,551 | 485,004 | |||||||||||||||
|
|
|
|
|
|
|
|
|
| |||||||||||
Net Assets | $ | 237,797,750 | $ | 12,052,785 | $ | 31,213,649 | $ | 31,034,210 | $ | 21,002,140 | ||||||||||
|
|
|
|
|
|
|
|
|
| |||||||||||
Cost: | ||||||||||||||||||||
Investments | $ | 207,360,743 | $ | 11,794,244 | $ | 30,515,146 | $ | 33,477,284 | $ | 20,542,023 | ||||||||||
Repurchase agreements | 26,031,771 | 200,000 | 519,000 | 366,408 | 520,000 | |||||||||||||||
Foreign currency | 4,055,864 | – | 329 | 525,697 | 290,498 | |||||||||||||||
Represented by: | ||||||||||||||||||||
Capital | $ | 244,939,053 | $ | 11,540,090 | $ | 31,403,571 | $ | 37,101,547 | $ | 21,701,532 | ||||||||||
Accumulated net investment income/(loss) | 307,873 | 117,202 | 243,339 | (545,724 | ) | 159,708 | ||||||||||||||
Accumulated net realized gain/(loss) from investments, futures contracts, swaps and foreign currency transactions | (2,345,648 | ) | 295,305 | (175,340 | ) | (1,550,774 | ) | (190,823 | ) | |||||||||||
Net unrealized appreciation/(depreciation) on investments, futures contracts, forwards and translation of assets and liabilities denominated in foreign currencies | (5,103,528 | ) | 100,188 | (257,921 | ) | (3,970,839 | ) | (668,277 | ) | |||||||||||
|
|
|
|
|
|
|
|
|
| |||||||||||
Net Assets | $ | 237,797,750 | $ | 12,052,785 | $ | 31,213,649 | $ | 31,034,210 | $ | 21,002,140 | ||||||||||
|
|
|
|
|
|
|
|
|
| |||||||||||
Net Assets: | ||||||||||||||||||||
Class A Shares | $ | 823,587 | $ | 3,597,359 | $ | 10,305 | $ | 148,180 | $ | 1,183,225 | ||||||||||
Class C Shares | 597,809 | 2,537,237 | 10,152 | 204,465 | 377,955 | |||||||||||||||
Class R Shares | 10,199 | – | 10,255 | 2,443,229 | – | |||||||||||||||
Institutional Service Class Shares | 11,377,106 | 6,802 | 10,359 | 9,462 | 16,724,193 | |||||||||||||||
Institutional Class Shares | 224,989,049 | 5,911,387 | 31,172,578 | 28,228,874 | 2,716,767 | |||||||||||||||
|
|
|
|
|
|
|
|
|
| |||||||||||
Total | $ | 237,797,750 | $ | 12,052,785 | $ | 31,213,649 | $ | 31,034,210 | $ | 21,002,140 | ||||||||||
|
|
|
|
|
|
|
|
|
| |||||||||||
Amounts listed as “–” are $0 or round to $0.
See accompanying Notes to Financial Statements.
Annual Report 2014
72
Table of Contents
Statements of Assets and Liabilities (continued)
October 31, 2014
| Aberdeen Asia Bond Fund | Aberdeen Core Fixed Income Fund | Aberdeen Emerging Markets Debt Fund | Aberdeen Emerging Markets Debt Local Currency Fund | Aberdeen Global Fixed Income Fund | ||||||||||||||||
Shares Outstanding (unlimited number of shares authorized): | ||||||||||||||||||||
Class A Shares | 80,789 | 331,231 | 1,059 | 16,976 | 116,976 | |||||||||||||||
Class C Shares | 59,208 | 233,980 | 1,044 | 23,686 | 37,547 | |||||||||||||||
Class R Shares | 1,004 | – | 1,054 | 281,803 | – | |||||||||||||||
Institutional Service Class Shares | 1,115,916 | 622 | 1,064 | 1,081 | 1,652,025 | |||||||||||||||
Institutional Class Shares | 22,023,425 | 541,365 | 3,205,150 | 3,224,705 | 267,708 | |||||||||||||||
|
|
|
|
|
|
|
|
|
| |||||||||||
Total | 23,280,342 | 1,107,198 | 3,209,371 | 3,548,251 | 2,074,256 | |||||||||||||||
|
|
|
|
|
|
|
|
|
| |||||||||||
Net asset value and redemption price per share (Net assets by class divided by shares outstanding by class, respectively): | ||||||||||||||||||||
Class A Shares | $ | 10.19 | $ | 10.86 | $ | 9.73 | $ | 8.73 | $ | 10.12 | (a) | |||||||||
Class C Shares (b) | $ | 10.10 | $ | 10.84 | $ | 9.72 | (a) | $ | 8.63 | $ | 10.07 | |||||||||
Class R Shares | $ | 10.16 | $ | – | $ | 9.73 | $ | 8.67 | $ | – | ||||||||||
Institutional Service Class Shares | $ | 10.20 | $ | 10.94 | $ | 9.74 | (a) | $ | 8.75 | $ | 10.12 | |||||||||
Institutional Class Shares | $ | 10.22 | $ | 10.92 | $ | 9.73 | $ | 8.75 | $ | 10.15 | ||||||||||
Maximum offering price per share (100%/(100%-maximum sales charge) of net asset value adjusted to the nearest cent): | ||||||||||||||||||||
Class A Shares | $ | 10.64 | $ | 11.34 | $ | 10.16 | $ | 9.12 | $ | 10.57 | ||||||||||
Maximum Sales Charge: | ||||||||||||||||||||
Class A Shares | 4.25 | % | 4.25 | % | 4.25 | % | 4.25 | % | 4.25 | % | ||||||||||
| (a) | The NAV shown above differs from the traded NAV on October 31, 2014 due to financial statement rounding and/or financial statement adjustments. |
| (b) | For Class C Shares, the redemption price per share is reduced by 1.00% for shares held less than one year due to contingent deferred sales charge. |
Amounts listed as “–” are $0 or round to $0.
See accompanying Notes to Financial Statements.
2014 Annual Report
73
Table of Contents
Statements of Assets and Liabilities (continued)
October 31, 2014
| Aberdeen High Yield Fund | Aberdeen Tax-Free Income Fund | Aberdeen Ultra-Short Duration Bond Fund | ||||||||||
Assets: | ||||||||||||
Investments, at value | $ | 8,745,678 | $ | 98,444,638 | $ | 10,146,315 | ||||||
Repurchase agreements, at value | 2,049,000 | 390,000 | – | |||||||||
|
|
|
|
|
| |||||||
Total investments | 10,794,678 | 98,834,638 | 10,146,315 | |||||||||
|
|
|
|
|
| |||||||
Cash | – | 424 | 52,682 | |||||||||
Cash collateral pledged for futures | – | – | 2,380 | |||||||||
Interest receivable | 161,541 | 1,256,062 | 38,322 | |||||||||
Receivable for investments sold | 108,728 | – | – | |||||||||
Receivable from Adviser | 17,791 | 13,446 | 14,589 | |||||||||
Unrealized appreciation on forward foreign currency exchange contracts | 620 | – | – | |||||||||
Receivable for capital shares issued | – | 50 | – | |||||||||
Open swap contracts, at value | 6,221 | – | – | |||||||||
Prepaid expenses | 13,312 | 22,472 | 18,360 | |||||||||
|
|
|
|
|
| |||||||
Total assets | 11,102,891 | 100,127,092 | 10,272,648 | |||||||||
|
|
|
|
|
| |||||||
Liabilities: | ||||||||||||
Due to custodian | 1,026,501 | – | – | |||||||||
Payable for investments purchased | 277,939 | – | – | |||||||||
Distributions payable | – | 45,944 | 904 | |||||||||
Payable for capital shares redeemed | – | 20,648 | – | |||||||||
Variation margin payable for futures contracts | – | – | 2,063 | |||||||||
Accrued expenses and other payables: | ||||||||||||
Investment advisory fees | 4,954 | 36,134 | 1,743 | |||||||||
Printing fees | 799 | 22,226 | 413 | |||||||||
Transfer agent fees | 875 | 11,026 | 1,240 | |||||||||
Administration fees | 661 | 6,802 | 697 | |||||||||
Distribution fees | 198 | 2,518 | 23 | |||||||||
Fund accounting fees | 156 | 1,458 | 176 | |||||||||
Legal fees | 32 | 309 | 35 | |||||||||
Custodian fees | 40 | 50 | 200 | |||||||||
Administrative services fees | 5 | 219 | – | |||||||||
Other | 6,154 | 6,292 | 6,562 | |||||||||
|
|
|
|
|
| |||||||
Total liabilities | 1,318,314 | 153,626 | 14,056 | |||||||||
|
|
|
|
|
| |||||||
Net Assets | $ | 9,784,577 | $ | 99,973,466 | $ | 10,258,592 | ||||||
|
|
|
|
|
| |||||||
Cost: | ||||||||||||
Investments | $ | 9,190,373 | $ | 89,774,780 | $ | 10,122,262 | ||||||
Repurchase agreements | 2,049,000 | 390,000 | – | |||||||||
Up-front payments received on open swaps | 11,500 | – | – | |||||||||
Represented by: | ||||||||||||
Capital | $ | 10,330,443 | $ | 91,026,291 | $ | 10,237,560 | ||||||
Accumulated net investment income/(loss) | 21,676 | (45,943 | ) | 652 | ||||||||
Accumulated net realized gain/(loss) from investments, futures contracts, swaps and foreign currency transactions | (118,119 | ) | 323,260 | (1,599 | ) | |||||||
Net unrealized appreciation/(depreciation) on investments, futures contracts, forwards and translation of assets and liabilities denominated in foreign currencies | (449,423 | ) | 8,669,858 | 21,979 | ||||||||
|
|
|
|
|
| |||||||
Net Assets | $ | 9,784,577 | $ | 99,973,466 | $ | 10,258,592 | ||||||
|
|
|
|
|
| |||||||
Net Assets: | ||||||||||||
Class A Shares | $ | 388,666 | $ | 9,378,534 | $ | 110,071 | ||||||
Class C Shares | 123,407 | 643,282 | – | |||||||||
Class R Shares | 17,768 | 10,323 | – | |||||||||
Institutional Service Class Shares | 11,988 | 17,246 | 18,798 | |||||||||
Institutional Class Shares | 9,242,748 | 89,924,081 | (a) | 10,129,723 | ||||||||
|
|
|
|
|
| |||||||
Total | $ | 9,784,577 | $ | 99,973,466 | $ | 10,258,592 | ||||||
|
|
|
|
|
| |||||||
Amounts listed as “–” are $0 or round to $0.
See accompanying Notes to Financial Statements.
Annual Report 2014
74
Table of Contents
Statements of Assets and Liabilities (concluded)
October 31, 2014
| Aberdeen High Yield Fund | Aberdeen Tax-Free Income Fund | Aberdeen Ultra-Short Duration Bond Fund | ||||||||||
Shares Outstanding (unlimited number of shares authorized): | ||||||||||||
Class A Shares | 42,255 | 903,213 | 11,063 | |||||||||
Class C Shares | 13,423 | 62,014 | – | |||||||||
Class R Shares | 1,931 | 993 | – | |||||||||
Institutional Service Class Shares | 1,302 | 1,659 | 1,895 | |||||||||
Institutional Class Shares | 1,003,998 | 8,650,563 | (a) | 1,020,918 | ||||||||
|
|
|
|
|
| |||||||
Total | 1,062,909 | 9,618,442 | 1,033,876 | |||||||||
|
|
|
|
|
| |||||||
Net asset value and redemption price per share (Net assets by class divided by shares outstanding by class, respectively): | ||||||||||||
Class A Shares | $ | 9.20 | $ | 10.38 | $ | 9.95 | ||||||
Class C Shares (b) | $ | 9.19 | $ | 10.37 | $ | – | ||||||
Class R Shares | $ | 9.20 | $ | 10.40 | $ | – | ||||||
Institutional Service Class Shares | $ | 9.21 | $ | 10.40 | $ | 9.92 | ||||||
Institutional Class Shares | $ | 9.21 | $ | 10.40 | (a) | $ | 9.92 | |||||
Maximum offering price per share (100%/(100%-maximum sales charge) of net asset value adjusted to the nearest cent): | ||||||||||||
Class A Shares | $ | 9.61 | $ | 10.84 | $ | 10.39 | ||||||
Maximum Sales Charge: | ||||||||||||
Class A Shares | 4.25 | % | 4.25 | % | 4.25 | % | ||||||
| (a) | Formerly Class D shares. |
| (b) | For Class C Shares, the redemption price per share is reduced by 1.00% for shares held less than one year due to contingent deferred sales charge. |
Amounts listed as “–” are $0 or round to $0.
See accompanying Notes to Financial Statements.
2014 Annual Report
75
Table of Contents
Statements of Operations
For the Year Ended October 31, 2014
| Aberdeen Asia Bond Fund | Aberdeen Core Fixed Income Fund | Aberdeen Emerging Markets Debt Fund | Aberdeen Emerging Markets Debt Local Currency Fund | Aberdeen Global Fixed Income Fund | ||||||||||||||||
INVESTMENT INCOME: | ||||||||||||||||||||
Interest income | $ | 10,027,916 | $ | 2,167,098 | $ | 1,148,462 | $ | 2,940,868 | $ | 746,393 | ||||||||||
Foreign tax withholding | (410,145 | ) | – | (4,058 | ) | (28,549 | ) | 202 | ||||||||||||
Other income | 125 | – | 578 | – | – | |||||||||||||||
|
|
|
|
|
|
|
|
|
| |||||||||||
| 9,617,896 | 2,167,098 | 1,144,982 | 2,912,319 | 746,595 | ||||||||||||||||
|
|
|
|
|
|
|
|
|
| |||||||||||
Expenses: | ||||||||||||||||||||
Investment advisory fees | 1,076,723 | 209,538 | 150,983 | 337,245 | 131,599 | |||||||||||||||
Administration fees | 172,275 | 55,877 | 16,105 | 33,724 | 17,547 | |||||||||||||||
Distribution fees Class A | 3,396 | 9,441 | 25 | 1,052 | 3,725 | |||||||||||||||
Distribution fees Class C | 5,979 | 26,150 | 99 | 2,879 | 4,275 | |||||||||||||||
Distribution fees Class R | 50 | – | 50 | 11,629 | – | |||||||||||||||
Administrative services fees Class A | – | 696 | – | 149 | – | |||||||||||||||
Administrative services fees Class R | – | – | – | 5,682 | – | |||||||||||||||
Administrative service fees Institutional Service Class | 25,578 | – | – | – | 29,532 | |||||||||||||||
Transfer agent fees | 197,749 | 85,363 | 12,273 | 45,486 | 16,703 | |||||||||||||||
Registration and filing fees | 68,124 | 62,079 | 83,436 | 54,593 | 63,193 | |||||||||||||||
Custodian fees | 93,731 | 25,496 | 14,419 | 47,178 | 25,569 | |||||||||||||||
Audit fees | 40,533 | 33,266 | 32,758 | 35,238 | 37,319 | |||||||||||||||
Printing fees | 17,691 | 12,989 | 5,897 | 9,380 | 14,060 | |||||||||||||||
Fund accounting fees | 6,420 | 6,211 | 1,738 | 3,257 | 1,756 | |||||||||||||||
Legal fees | 7,689 | 6,072 | 776 | 1,564 | 1,508 | |||||||||||||||
Trustee fees | 9,539 | 3,355 | 821 | 1,921 | 969 | |||||||||||||||
Other | 22,589 | 5,610 | 3,782 | 6,287 | 9,574 | |||||||||||||||
|
|
|
|
|
|
|
|
|
| |||||||||||
Total operating expenses before reimbursed/waived expenses | 1,748,066 | 542,143 | 323,162 | 597,264 | 357,329 | |||||||||||||||
Expenses reimbursed | (205,651 | ) | (156,627 | ) | (141,808 | ) | (196,473 | ) | (133,386 | ) | ||||||||||
|
|
|
|
|
|
|
|
|
| |||||||||||
Net expenses | 1,542,415 | 385,516 | 181,354 | 400,791 | 223,943 | |||||||||||||||
|
|
|
|
|
|
|
|
|
| |||||||||||
Net Investment Income | 8,075,481 | 1,781,582 | 963,628 | 2,511,528 | 522,652 | |||||||||||||||
|
|
|
|
|
|
|
|
|
| |||||||||||
REALIZED/UNREALIZED GAIN/(LOSS) FROM INVESTMENTS: | ||||||||||||||||||||
Realized gain/(loss) on investment transactions | (4,489,451 | ) | 926,793 | (177,658 | ) | (3,297,266 | ) | 551,206 | ||||||||||||
Realized gain/(loss) on futures contracts transactions | (1,987,777 | ) | 34,203 | – | – | (31,552 | ) | |||||||||||||
Realized gain/(loss) on foreign currency transactions | (1,898,863 | ) | – | (13,444 | ) | (35,060 | ) | 43,363 | ||||||||||||
|
|
|
|
|
|
|
|
|
| |||||||||||
Net realized gain/(loss) from investments, futures contracts, swaps and foreign currency transactions | (8,376,091 | ) | 960,996 | (191,102 | ) | (3,332,326 | ) | 563,017 | ||||||||||||
|
|
|
|
|
|
|
|
|
| |||||||||||
Net change in unrealized appreciation/depreciation on investment transactions | 3,961,597 | (57,270 | ) | 123,534 | (197,330 | ) | (987,655 | ) | ||||||||||||
Net change in unrealized appreciation/depreciation on futures contracts | 884,089 | 9,277 | – | – | (4,363 | ) | ||||||||||||||
Net change in unrealized appreciation/depreciation on foreign currency transactions | 483,288 | – | 98,824 | (328,844 | ) | (70,207 | ) | |||||||||||||
|
|
|
|
|
|
|
|
|
| |||||||||||
Net change in unrealized appreciation/depreciation from investments, futures contracts, swaps and translation of assets and liabilities denominated in foreign currencies | 5,328,974 | (47,993 | ) | 222,358 | (526,174 | ) | (1,062,225 | ) | ||||||||||||
|
|
|
|
|
|
|
|
|
| |||||||||||
Net realized/unrealized gain/(loss) from investments, futures contracts, swaps and foreign currency transactions | (3,047,117 | ) | 913,003 | 31,256 | (3,858,500 | ) | (499,208 | ) | ||||||||||||
|
|
|
|
|
|
|
|
|
| |||||||||||
CHANGE IN NET ASSETS RESULTING FROM OPERATIONS | $ | 5,028,364 | $ | 2,694,585 | $ | 994,884 | $ | (1,346,972 | ) | $ | 23,444 | |||||||||
|
|
|
|
|
|
|
|
|
| |||||||||||
Amounts listed as “–” are $0 or round to $0.
See accompanying Notes to Financial Statements.
Annual Report 2014
76
Table of Contents
Statements of Operations (concluded)
For the Year Ended October 31, 2014
| Aberdeen High Yield Fund | Aberdeen Tax-Free Income Fund | Aberdeen Ultra-Short Duration Bond Fund | ||||||||||
INVESTMENT INCOME: | ||||||||||||
Interest income | $ | 789,811 | $ | 4,053,016 | $ | 126,955 | ||||||
|
|
|
|
|
| |||||||
| 789,811 | 4,053,016 | 126,955 | ||||||||||
|
|
|
|
|
| |||||||
Expenses: | ||||||||||||
Investment advisory fees | 65,907 | 429,529 | 27,059 | |||||||||
Administration fees | 8,788 | 80,852 | 10,823 | |||||||||
Distribution fees Class A | 687 | 23,555 | 309 | |||||||||
Distribution fees Class C | 1,462 | 7,013 | – | |||||||||
Distribution fees Class R | 63 | 50 | – | |||||||||
Administrative services fees Class A | 93 | 59 | – | |||||||||
Registration and filing fees | 58,833 | 69,000 | 58,371 | |||||||||
Audit fees | 35,192 | 29,105 | 31,186 | |||||||||
Transfer agent fees | 10,028 | 70,654 | 7,537 | |||||||||
Printing fees | 10,834 | 51,899 | 5,924 | |||||||||
Custodian fees | 8,407 | 5,094 | 6,631 | |||||||||
Fund accounting fees | 894 | 8,398 | 1,209 | |||||||||
Legal fees | 3,118 | 4,072 | 1,196 | |||||||||
Trustee fees | 489 | 4,456 | 612 | |||||||||
Other | 3,601 | 7,893 | 2,370 | |||||||||
|
|
|
|
|
| |||||||
Total operating expenses before reimbursed/waived expenses | 208,396 | 791,629 | 153,227 | |||||||||
Expenses reimbursed | (118,215 | ) | (134,346 | ) | (98,801 | ) | ||||||
|
|
|
|
|
| |||||||
Net expenses | 90,181 | 657,283 | 54,426 | |||||||||
|
|
|
|
|
| |||||||
Net Investment Income | 699,630 | 3,395,733 | 72,529 | |||||||||
|
|
|
|
|
| |||||||
REALIZED/UNREALIZED GAIN/(LOSS) FROM INVESTMENTS: | ||||||||||||
Realized gain/(loss) on investment transactions | (75,034 | ) | 343,296 | 8,682 | ||||||||
Realized gain/(loss) on swap contracts | (43,291 | ) | – | – | ||||||||
Realized gain/(loss) on futures contracts transactions | – | – | (9,488 | ) | ||||||||
Realized gain on foreign currency transactions | 3,951 | – | – | |||||||||
|
|
|
|
|
| |||||||
Net realized gain/(loss) from investments, futures contracts, swaps and foreign currency transactions | (114,374 | ) | 343,296 | (806 | ) | |||||||
|
|
|
|
|
| |||||||
Net change in unrealized appreciation/depreciation on investment transactions | (380,649 | ) | 2,532,911 | (28,787 | ) | |||||||
Net change in unrealized appreciation/depreciation on swap contracts | 31,634 | – | – | |||||||||
Net change in unrealized appreciation/depreciation on futures contracts | – | – | (2,074 | ) | ||||||||
Net change in unrealized appreciation/depreciation on foreign currency transactions | 138 | – | – | |||||||||
|
|
|
|
|
| |||||||
Net change in unrealized appreciation/depreciation from investments, futures contracts, swaps and translation of assets and liabilities denominated in foreign currencies | (348,877 | ) | 2,532,911 | (30,861 | ) | |||||||
|
|
|
|
|
| |||||||
Net realized/unrealized gain/(loss) from investments, futures contracts, swaps and foreign currency transactions | (463,251 | ) | 2,876,207 | (31,667 | ) | |||||||
|
|
|
|
|
| |||||||
CHANGE IN NET ASSETS RESULTING FROM OPERATIONS | $ | 236,379 | $ | 6,271,940 | $ | 40,862 | ||||||
|
|
|
|
|
| |||||||
Amounts listed as “–” are $0 or round to $0.
See accompanying Notes to Financial Statements.
2014 Annual Report
77
Table of Contents
Statements of Changes in Net Assets
| Aberdeen Asia Bond Fund | Aberdeen Core Fixed Income Fund | Aberdeen Emerging Markets Debt Fund | ||||||||||||||||||||||
| Year Ended October 31, 2014 | Year Ended October 31, 2013 | Year Ended October 31, 2014 | Year Ended October 31, 2013 | Year Ended October 31, 2014 | Year Ended October 31, 2013 | |||||||||||||||||||
FROM INVESTMENT ACTIVITIES: | ||||||||||||||||||||||||
Operations: | ||||||||||||||||||||||||
Net investment income | $ | 8,075,481 | $ | 13,524,410 | $ | 1,781,582 | $ | 2,229,141 | $ | 963,628 | $ | 377,744 | ||||||||||||
Net realized gain/(loss) from investments, futures contracts, swaps and foreign currency transactions | (8,376,091 | ) | 4,591,716 | 960,996 | (81,090 | ) | (191,102 | ) | (116,917 | ) | ||||||||||||||
Net change in unrealized appreciation/(depreciation) on investments, futures contracts, swaps and translation of assets and liabilities denominated in foreign currencies | 5,328,974 | (34,514,926 | ) | (47,993 | ) | (2,988,399 | ) | 222,358 | (480,279 | ) | ||||||||||||||
|
|
|
|
|
|
|
|
|
|
|
| |||||||||||||
Changes in net assets resulting from operations | 5,028,364 | (16,398,800 | ) | 2,694,585 | (840,348 | ) | 994,884 | (219,452 | ) | |||||||||||||||
|
|
|
|
|
|
|
|
|
|
|
| |||||||||||||
Distributions to Shareholders From: | ||||||||||||||||||||||||
Net investment income: | ||||||||||||||||||||||||
Class A | (22,883 | ) | (54,787 | ) | (101,876 | ) | (83,189 | ) | (356 | ) | (223 | ) | ||||||||||||
Class C | (6,533 | ) | (9,703 | ) | (52,074 | ) | (35,722 | ) | (268 | ) | (156 | ) | ||||||||||||
Class R | (130 | ) | (215 | ) | – | – | (321 | ) | (200 | ) | ||||||||||||||
Institutional Service Class | (147,874 | ) | (310,654 | ) | (508 | ) | (578 | ) | (375 | ) | (246 | ) | ||||||||||||
Institutional Class | (3,444,636 | ) | (10,970,250 | ) | (1,996,074 | ) | (2,109,930 | ) | (718,443 | ) | (244,810 | ) | ||||||||||||
Net realized gains: | ||||||||||||||||||||||||
Class A | (52,269 | ) | (8,100 | ) | – | (118,288 | ) | – | – | |||||||||||||||
Class C | (19,788 | ) | (3,123 | ) | – | (79,992 | ) | – | – | |||||||||||||||
Class R | (313 | ) | (64 | ) | – | – | – | – | ||||||||||||||||
Institutional Service Class | (332,633 | ) | (81,867 | ) | – | (694 | ) | – | – | |||||||||||||||
Institutional Class | (6,878,756 | ) | (2,871,283 | ) | – | (2,644,606 | ) | – | – | |||||||||||||||
|
|
|
|
|
|
|
|
|
|
|
| |||||||||||||
Change in net assets from shareholder distributions | (10,905,815 | ) | (14,310,046 | ) | (2,150,532 | ) | (5,072,999 | ) | (719,763 | ) | (245,635 | ) | ||||||||||||
|
|
|
|
|
|
|
|
|
|
|
| |||||||||||||
Change in net assets from capital transactions | (2,502,233 | ) | (204,909,316 | ) | (84,542,296 | ) | (8,294,529 | ) | 21,157,980 | 10,245,635 | ||||||||||||||
|
|
|
|
|
|
|
|
|
|
|
| |||||||||||||
Change in net assets | (8,379,684 | ) | (235,618,162 | ) | (83,998,243 | ) | (14,207,876 | ) | 21,433,101 | 9,780,548 | ||||||||||||||
|
|
|
|
|
|
|
|
|
|
|
| |||||||||||||
Net Assets: | ||||||||||||||||||||||||
Beginning of year | 246,177,434 | 481,795,596 | 96,051,028 | 110,258,904 | 9,780,548 | – | ||||||||||||||||||
|
|
|
|
|
|
|
|
|
|
|
| |||||||||||||
End of year | $ | 237,797,750 | $ | 246,177,434 | $ | 12,052,785 | $ | 96,051,028 | $ | 31,213,649 | $ | 9,780,548 | ||||||||||||
|
|
|
|
|
|
|
|
|
|
|
| |||||||||||||
Accumulated net investment income/(loss) at end of year | $ | 307,873 | $ | 988,471 | $ | 117,202 | $ | 344,200 | $ | 243,339 | $ | 96,442 | ||||||||||||
|
|
|
|
|
|
|
|
|
|
|
| |||||||||||||
Amounts listed as “–” are $0 or round to $0.
See accompanying Notes to Financial Statements.
Annual Report 2014
78
Table of Contents
Statements of Changes in Net Assets (continued)
| Aberdeen Asia Bond Fund | Aberdeen Core Fixed Income Fund | Aberdeen Emerging Markets Debt Fund | ||||||||||||||||||||||
| Year Ended October 31, 2014 | Year Ended October 31, 2013 | Year Ended October 31, 2014 | Year Ended October 31, 2013 | Year Ended October 31, 2014 | Year Ended October 31, 2013 | |||||||||||||||||||
CAPITAL TRANSACTIONS: | ||||||||||||||||||||||||
Class A Shares | ||||||||||||||||||||||||
Proceeds from shares issued | $ | 10,971 | $ | 5,250,253 | $ | 235,408 | $ | 903,633 | $ | 1,829 | $ | 10,000 | ||||||||||||
Dividends reinvested | 73,135 | 62,145 | 95,005 | 183,250 | 356 | 223 | ||||||||||||||||||
Cost of shares redeemed(a) | (1,025,713 | ) | (4,358,347 | ) | (692,316 | ) | (1,328,907 | ) | (1,823 | ) | – | |||||||||||||
|
|
|
|
|
|
|
|
|
|
|
| |||||||||||||
Total Class A | (941,607 | ) | 954,051 | (361,903 | ) | (242,024 | ) | 362 | 10,223 | |||||||||||||||
|
|
|
|
|
|
|
|
|
|
|
| |||||||||||||
Class C Shares | ||||||||||||||||||||||||
Proceeds from shares issued | 18,550 | 314,170 | 179,457 | 383,266 | – | 10,000 | ||||||||||||||||||
Dividends reinvested | 22,145 | 6,901 | 52,144 | 113,509 | 268 | 156 | ||||||||||||||||||
Cost of shares redeemed(a) | (62,704 | ) | (28,128 | ) | (449,127 | ) | (518,731 | ) | – | – | ||||||||||||||
|
|
|
|
|
|
|
|
|
|
|
| |||||||||||||
Total Class C | (22,009 | ) | 292,943 | (217,526 | ) | (21,956 | ) | 268 | 10,156 | |||||||||||||||
|
|
|
|
|
|
|
|
|
|
|
| |||||||||||||
Class R Shares | ||||||||||||||||||||||||
Proceeds from shares issued | – | – | – | – | – | 10,000 | ||||||||||||||||||
Dividends reinvested | 443 | 279 | – | – | 322 | 200 | ||||||||||||||||||
|
|
|
|
|
|
|
|
|
|
|
| |||||||||||||
Total Class R | 443 | 279 | – | – | 322 | 10,200 | ||||||||||||||||||
|
|
|
|
|
|
|
|
|
|
|
| |||||||||||||
Institutional Service Class Shares | ||||||||||||||||||||||||
Proceeds from shares issued | 2,598,717 | 5,488,325 | – | – | – | 10,000 | ||||||||||||||||||
Dividends reinvested | 480,507 | 391,820 | 520 | 1,270 | 375 | 246 | ||||||||||||||||||
Cost of shares redeemed(a) | (2,549,378 | ) | (6,113,808 | ) | (19,556 | ) | (29 | ) | – | – | ||||||||||||||
|
|
|
|
|
|
|
|
|
|
|
| |||||||||||||
Total Institutional Service Class | 529,846 | (233,663 | ) | (19,036 | ) | 1,241 | 375 | 10,246 | ||||||||||||||||
|
|
|
|
|
|
|
|
|
|
|
| |||||||||||||
Institutional Class Shares | ||||||||||||||||||||||||
Proceeds from shares issued | 44,645,211 | 192,432,479 | 4,357,405 | 15,320,246 | 20,438,211 | 9,960,000 | ||||||||||||||||||
Dividends reinvested | 9,673,934 | 11,985,396 | 2,030,539 | 4,751,724 | 718,442 | 244,810 | ||||||||||||||||||
Cost of shares redeemed(a) | (56,388,051 | ) | (410,340,801 | ) | (90,331,775 | )(b) | (28,103,760 | ) | – | – | ||||||||||||||
|
|
|
|
|
|
|
|
|
|
|
| |||||||||||||
Total Institutional Class | (2,068,906 | ) | (205,922,926 | ) | (83,943,831 | ) | (8,031,790 | ) | 21,156,653 | 10,204,810 | ||||||||||||||
|
|
|
|
|
|
|
|
|
|
|
| |||||||||||||
Change in net assets from capital transactions: | $ | (2,502,233 | ) | $ | (204,909,316 | ) | $ | (84,542,296 | ) | $ | (8,294,529 | ) | $ | 21,157,980 | $ | 10,245,635 | ||||||||
|
|
|
|
|
|
|
|
|
|
|
| |||||||||||||
| (a) | Includes redemption fees, if any. |
| (b) | See Note 6 (I) in the Notes to Financial Statements. |
Amounts listed as “–” are $0 or round to $0.
See accompanying Notes to Financial Statements.
2014 Annual Report
79
Table of Contents
Statements of Changes in Net Assets (continued)
| Aberdeen Asia Bond Fund | Aberdeen Core Fixed Income Fund | Aberdeen Emerging Markets Debt Fund | ||||||||||||||||||||||
| Year Ended October 31, 2014 | Year Ended October 31, 2013 | Year Ended October 31, 2014 | Year Ended October 31, 2013 | Year Ended October 31, 2014 | Year Ended October 31, 2013 | |||||||||||||||||||
SHARE TRANSACTIONS: | ||||||||||||||||||||||||
Class A Shares | ||||||||||||||||||||||||
Issued | 1,079 | 468,532 | 20,863 | 83,216 | 185 | 1,000 | ||||||||||||||||||
Reinvested | 7,509 | 5,706 | 8,879 | 16,775 | 37 | 23 | ||||||||||||||||||
Redeemed | (101,099 | ) | (414,111 | ) | (64,490 | ) | (123,386 | ) | (185 | ) | – | |||||||||||||
|
|
|
|
|
|
|
|
|
|
|
| |||||||||||||
Total Class A Shares | (92,511 | ) | 60,127 | (34,748 | ) | (23,395 | ) | 37 | 1,023 | |||||||||||||||
|
|
|
|
|
|
|
|
|
|
|
| |||||||||||||
Class C Shares | ||||||||||||||||||||||||
Issued | 1,854 | 28,358 | 15,962 | 34,877 | – | 1,000 | ||||||||||||||||||
Reinvested | 2,281 | 627 | 4,889 | 10,395 | 28 | 16 | ||||||||||||||||||
Redeemed | (6,366 | ) | (2,524 | ) | (42,146 | ) | (48,038 | ) | – | – | ||||||||||||||
|
|
|
|
|
|
|
|
|
|
|
| |||||||||||||
Total Class C Shares | (2,231 | ) | 26,461 | (21,295 | ) | (2,766 | ) | 28 | 1,016 | |||||||||||||||
|
|
|
|
|
|
|
|
|
|
|
| |||||||||||||
Class R Shares | ||||||||||||||||||||||||
Issued | – | – | – | – | – | 1,000 | ||||||||||||||||||
Reinvested | 46 | 25 | – | – | 34 | 20 | ||||||||||||||||||
|
|
|
|
|
|
|
|
|
|
|
| |||||||||||||
Total Class R Shares | 46 | 25 | – | – | 34 | 1,020 | ||||||||||||||||||
|
|
|
|
|
|
|
|
|
|
|
| |||||||||||||
Institutional Service Class Shares | ||||||||||||||||||||||||
Issued | 258,679 | 496,508 | – | – | – | 1,000 | ||||||||||||||||||
Reinvested | 49,333 | 35,573 | 46 | 116 | 39 | 25 | ||||||||||||||||||
Redeemed | (254,451 | ) | (574,735 | ) | (1,809 | ) | (3 | ) | – | – | ||||||||||||||
|
|
|
|
|
|
|
|
|
|
|
| |||||||||||||
Total Institutional Service Class Shares | 53,561 | (42,654 | ) | (1,763 | ) | 113 | 39 | 1,025 | ||||||||||||||||
|
|
|
|
|
|
|
|
|
|
|
| |||||||||||||
Institutional Class Shares | ||||||||||||||||||||||||
Issued | 4,390,995 | 17,328,642 | 406,342 | 1,413,854 | 2,109,539 | 996,000 | ||||||||||||||||||
Reinvested | 993,217 | 1,085,194 | 188,893 | 432,353 | 74,650 | 24,960 | ||||||||||||||||||
Redeemed | (5,628,083 | ) | (37,632,173 | ) | (8,366,247 | ) | (2,566,203 | ) | – | – | ||||||||||||||
|
|
|
|
|
|
|
|
|
|
|
| |||||||||||||
Total Institutional Class Shares | (243,871 | ) | (19,218,337 | ) | (7,771,012 | ) | (719,996 | ) | 2,184,189 | 1,020,960 | ||||||||||||||
|
|
|
|
|
|
|
|
|
|
|
| |||||||||||||
Total change in shares: | (285,006 | ) | (19,174,378 | ) | (7,828,818 | ) | (746,044 | ) | 2,184,327 | 1,025,044 | ||||||||||||||
|
|
|
|
|
|
|
|
|
|
|
| |||||||||||||
Amounts listed as “–” are $0 or round to $0.
See accompanying Notes to Financial Statements.
Annual Report 2014
80
Table of Contents
Statements of Changes in Net Assets (continued)
| Aberdeen Emerging Markets Debt Local Currency Fund | Aberdeen Global Fixed Income Fund | Aberdeen High Yield Fund | ||||||||||||||||||||||
| Year Ended October 31, 2014 | Year Ended October 31, 2013 | Year Ended October 31, 2014 | Year Ended October 31, 2013 | Year Ended October 31, 2014 | Year Ended October 31, 2013 | |||||||||||||||||||
FROM INVESTMENT ACTIVITIES: | ||||||||||||||||||||||||
Operations: | ||||||||||||||||||||||||
Net investment income | $ | 2,511,528 | $ | 2,211,869 | $ | 522,652 | $ | 373,379 | $ | 699,630 | $ | 1,116,806 | ||||||||||||
Net realized gain/(loss) from investments, futures contracts, swaps and foreign currency transactions | (3,332,326 | ) | (1,932,647 | ) | 563,017 | 390,766 | (114,374 | ) | 814,192 | |||||||||||||||
Net change in unrealized appreciation/(depreciation) on investments, futures contracts, swaps and translation of assets and liabilities denominated in foreign currencies | (526,174 | ) | (3,790,521 | ) | (1,062,225 | ) | (1,486,151 | ) | (348,877 | ) | (276,413 | ) | ||||||||||||
|
|
|
|
|
|
|
|
|
|
|
| |||||||||||||
Changes in net assets resulting from operations | (1,346,972 | ) | (3,511,299 | ) | 23,444 | (722,006 | ) | 236,379 | 1,654,585 | |||||||||||||||
|
|
|
|
|
|
|
|
|
|
|
| |||||||||||||
Distributions to Shareholders From: | ||||||||||||||||||||||||
Net investment income: | ||||||||||||||||||||||||
Class A | (6,601 | ) | (10,767 | ) | (39,120 | ) | – | (18,033 | ) | (15,439 | ) | |||||||||||||
Class C | (4,112 | ) | (4,525 | ) | (3,606 | ) | – | (8,152 | ) | (6,341 | ) | |||||||||||||
Class R | (25,295 | ) | (26,161 | ) | – | – | (794 | ) | (696 | ) | ||||||||||||||
Institutional Service Class | (119 | ) | (171 | ) | (483,856 | ) | – | (798 | ) | (759 | ) | |||||||||||||
Institutional Class | (586,432 | ) | (645,582 | ) | (54,660 | ) | – | (689,898 | ) | (1,093,478 | ) | |||||||||||||
Net realized gains: | ||||||||||||||||||||||||
Class A | – | – | – | – | (11,372 | ) | (756 | ) | ||||||||||||||||
Class C | – | – | – | – | (10,175 | ) | (1,015 | ) | ||||||||||||||||
Class R | – | – | – | – | (829 | ) | (114 | ) | ||||||||||||||||
Institutional Service Class | – | – | – | – | (837 | ) | (114 | ) | ||||||||||||||||
Institutional Class | – | – | – | – | (757,304 | ) | (180,638 | ) | ||||||||||||||||
|
|
|
|
|
|
|
|
|
|
|
| |||||||||||||
Change in net assets from shareholder distributions | (622,559 | ) | (687,206 | ) | (581,242 | ) | – | (1,498,192 | ) | (1,299,350 | ) | |||||||||||||
|
|
|
|
|
|
|
|
|
|
|
| |||||||||||||
Change in net assets from capital transactions | (19,299,617 | ) | 25,987,268 | (1,948,037 | ) | (5,536,023 | ) | (1,418,439 | ) | (4,946,600 | ) | |||||||||||||
|
|
|
|
|
|
|
|
|
|
|
| |||||||||||||
Change in net assets | (21,269,148 | ) | 21,788,763 | (2,505,835 | ) | (6,258,029 | ) | (2,680,252 | ) | (4,591,365 | ) | |||||||||||||
|
|
|
|
|
|
|
|
|
|
|
| |||||||||||||
Net Assets: | ||||||||||||||||||||||||
Beginning of year | 52,303,358 | 30,514,595 | 23,507,975 | 29,766,004 | 12,464,829 | 17,056,194 | ||||||||||||||||||
|
|
|
|
|
|
|
|
|
|
|
| |||||||||||||
End of year | $ | 31,034,210 | $ | 52,303,358 | $ | 21,002,140 | $ | 23,507,975 | $ | 9,784,577 | $ | 12,464,829 | ||||||||||||
|
|
|
|
|
|
|
|
|
|
|
| |||||||||||||
Accumulated net investment income/(loss) at end of year | $ | (545,724 | ) | $ | (341,688 | ) | $ | 159,708 | $ | 137,755 | $ | 21,676 | $ | 36,377 | ||||||||||
|
|
|
|
|
|
|
|
|
|
|
| |||||||||||||
Amounts listed as “–” are $0 or round to $0.
See accompanying Notes to Financial Statements.
2014 Annual Report
81
Table of Contents
Statements of Changes in Net Assets (continued)
| Aberdeen Emerging Markets Debt Local Currency Fund | Aberdeen Global Fixed Income Fund | Aberdeen High Yield Fund | ||||||||||||||||||||||
| Year Ended October 31, 2014 | Year Ended October 31, 2013 | Year Ended October 31, 2014 | Year Ended October 31, 2013 | Year Ended October 31, 2014 | Year Ended October 31, 2013 | |||||||||||||||||||
CAPITAL TRANSACTIONS: | ||||||||||||||||||||||||
Class A Shares | ||||||||||||||||||||||||
Proceeds from shares issued | $ | 402,670 | $ | 753,799 | $ | 109,401 | $ | 149,184 | $ | 252,607 | $ | 488,747 | ||||||||||||
Dividends reinvested | 6,320 | 10,605 | 28,329 | – | 29,405 | 15,358 | ||||||||||||||||||
Cost of shares redeemed(a) | (914,351 | ) | (559,121 | ) | (808,496 | ) | (971,619 | ) | (33,869 | ) | (394,757 | ) | ||||||||||||
|
|
|
|
|
|
|
|
|
|
|
| |||||||||||||
Total Class A | (505,361 | ) | 205,283 | (670,766 | ) | (822,435 | ) | 248,143 | 109,348 | |||||||||||||||
|
|
|
|
|
|
|
|
|
|
|
| |||||||||||||
Class C Shares | ||||||||||||||||||||||||
Proceeds from shares issued | 81,458 | 234,240 | 25,996 | 42,340 | 15,892 | 81,191 | ||||||||||||||||||
Dividends reinvested | 3,055 | 3,696 | 3,242 | – | 12,698 | 4,312 | ||||||||||||||||||
Cost of shares redeemed(a) | (188,969 | ) | (152,219 | ) | (162,417 | ) | (462,041 | ) | (31,472 | ) | (1,417 | ) | ||||||||||||
|
|
|
|
|
|
|
|
|
|
|
| |||||||||||||
Total Class C | (104,456 | ) | 85,717 | (133,179 | ) | (419,701 | ) | (2,882 | ) | 84,086 | ||||||||||||||
|
|
|
|
|
|
|
|
|
|
|
| |||||||||||||
Class R Shares | ||||||||||||||||||||||||
Proceeds from shares issued | 988,501 | 2,676,920 | – | – | 6,000 | – | ||||||||||||||||||
Dividends reinvested | 25,295 | 26,161 | – | – | 1,623 | 809 | ||||||||||||||||||
Cost of shares redeemed(a) | (953,633 | ) | (1,253,946 | ) | – | – | – | – | ||||||||||||||||
|
|
|
|
|
|
|
|
|
|
|
| |||||||||||||
Total Class R | 60,163 | 1,449,135 | – | – | 7,623 | 809 | ||||||||||||||||||
|
|
|
|
|
|
|
|
|
|
|
| |||||||||||||
Institutional Service Class Shares | ||||||||||||||||||||||||
Proceeds from shares issued | – | – | 984,133 | 1,141,033 | – | – | ||||||||||||||||||
Dividends reinvested | 119 | 171 | 465,065 | – | 1,635 | 872 | ||||||||||||||||||
Cost of shares redeemed(a) | – | – | (3,839,223 | ) | (6,155,658 | ) | – | – | ||||||||||||||||
|
|
|
|
|
|
|
|
|
|
|
| |||||||||||||
Total Institutional Service Class | 119 | 171 | (2,390,025 | ) | (5,014,625 | ) | 1,635 | 872 | ||||||||||||||||
|
|
|
|
|
|
|
|
|
|
|
| |||||||||||||
Institutional Class Shares | ||||||||||||||||||||||||
Proceeds from shares issued | 7,064,380 | 38,620,966 | 1,760,273 | 1,360,799 | 162,094 | 1,568,692 | ||||||||||||||||||
Dividends reinvested | 586,432 | 551,921 | 54,631 | – | 1,447,202 | 1,268,232 | ||||||||||||||||||
Cost of shares redeemed(a) | (26,400,894 | ) | (14,925,925 | ) | (568,971 | ) | (640,061 | ) | (3,282,254 | ) | (7,978,639 | ) | ||||||||||||
|
|
|
|
|
|
|
|
|
|
|
| |||||||||||||
Total Institutional Class | (18,750,082 | ) | 24,246,962 | 1,245,933 | 720,738 | (1,672,958 | ) | (5,141,715 | ) | |||||||||||||||
|
|
|
|
|
|
|
|
|
|
|
| |||||||||||||
Change in net assets from capital transactions: | $ | (19,299,617 | ) | $ | 25,987,268 | $ | (1,948,037 | ) | $ | (5,536,023 | ) | $ | (1,418,439 | ) | $ | (4,946,600 | ) | |||||||
|
|
|
|
|
|
|
|
|
|
|
| |||||||||||||
| (a) | Includes redemption fees, if any. |
Amounts listed as “–” are $0 or round to $0.
See accompanying Notes to Financial Statements.
Annual Report 2014
82
Table of Contents
Statements of Changes in Net Assets (continued)
| Aberdeen Emerging Markets Debt Local Currency Fund | Aberdeen Global Fixed Income Fund | Aberdeen High Yield Fund | ||||||||||||||||||||||
| Year Ended October 31, 2014 | Year Ended October 31, 2013 | Year Ended October 31, 2014 | Year Ended October 31, 2013 | Year Ended October 31, 2014 | Year Ended October 31, 2013 | |||||||||||||||||||
SHARE TRANSACTIONS: | ||||||||||||||||||||||||
Class A Shares | ||||||||||||||||||||||||
Issued | 45,391 | 77,947 | 10,483 | 14,185 | 26,273 | 46,698 | ||||||||||||||||||
Reinvested | 727 | 1,085 | 2,766 | – | 3,062 | 1,496 | ||||||||||||||||||
Redeemed | (103,298 | ) | (59,614 | ) | (78,348 | ) | (94,186 | ) | (3,495 | ) | (38,756 | ) | ||||||||||||
|
|
|
|
|
|
|
|
|
|
|
| |||||||||||||
Total Class A Shares | (57,180 | ) | 19,418 | (65,099 | ) | (80,001 | ) | 25,840 | 9,438 | |||||||||||||||
|
|
|
|
|
|
|
|
|
|
|
| |||||||||||||
Class C Shares | ||||||||||||||||||||||||
Issued | 9,258 | 23,715 | 2,480 | 4,100 | 1,633 | 7,942 | ||||||||||||||||||
Reinvested | 352 | 376 | 312 | – | 1,319 | 420 | ||||||||||||||||||
Redeemed | �� | (22,278 | ) | (16,174 | ) | (15,894 | ) | (45,134 | ) | (3,360 | ) | (138 | ) | |||||||||||
|
|
|
|
|
|
|
|
|
|
|
| |||||||||||||
Total Class C Shares | (12,668 | ) | 7,917 | (13,102 | ) | (41,034 | ) | (408 | ) | 8,224 | ||||||||||||||
|
|
|
|
|
|
|
|
|
|
|
| |||||||||||||
Class R Shares | ||||||||||||||||||||||||
Issued | 112,213 | 277,046 | – | – | 639 | – | ||||||||||||||||||
Reinvested | 2,914 | 2,677 | – | – | 169 | 79 | ||||||||||||||||||
Redeemed | (109,554 | ) | (137,556 | ) | – | – | – | – | ||||||||||||||||
|
|
|
|
|
|
|
|
|
|
|
| |||||||||||||
Total Class R Shares | 5,573 | 142,167 | – | – | 808 | 79 | ||||||||||||||||||
|
|
|
|
|
|
|
|
|
|
|
| |||||||||||||
Institutional Service Class Shares | ||||||||||||||||||||||||
Issued | – | – | 94,585 | 109,609 | – | – | ||||||||||||||||||
Reinvested | 14 | 17 | 45,313 | – | 170 | 84 | ||||||||||||||||||
Redeemed | – | – | (369,305 | ) | (597,379 | ) | – | – | ||||||||||||||||
|
|
|
|
|
|
|
|
|
|
|
| |||||||||||||
Total Institutional Service Class Shares | 14 | 17 | (229,407 | ) | (487,770 | ) | 170 | 84 | ||||||||||||||||
|
|
|
|
|
|
|
|
|
|
|
| |||||||||||||
Institutional Class Shares | ||||||||||||||||||||||||
Issued | 793,401 | 3,975,153 | 167,657 | 131,867 | 16,758 | 153,194 | ||||||||||||||||||
Reinvested | 67,329 | 56,750 | 5,304 | – | 150,041 | 123,234 | ||||||||||||||||||
Redeemed | (2,954,398 | ) | (1,656,437 | ) | (54,455 | ) | (62,550 | ) | (330,115 | ) | (772,479 | ) | ||||||||||||
|
|
|
|
|
|
|
|
|
|
|
| |||||||||||||
Total Institutional Class Shares | (2,093,668 | ) | 2,375,466 | 118,506 | 69,317 | (163,316 | ) | (496,051 | ) | |||||||||||||||
|
|
|
|
|
|
|
|
|
|
|
| |||||||||||||
Total change in shares: | (2,157,929 | ) | 2,544,985 | (189,102 | ) | (539,488 | ) | (136,906 | ) | (478,226 | ) | |||||||||||||
|
|
|
|
|
|
|
|
|
|
|
| |||||||||||||
Amounts listed as “–” are $0 or round to $0.
See accompanying Notes to Financial Statements.
2014 Annual Report
83
Table of Contents
Statements of Changes in Net Assets (continued)
| Aberdeen Tax-Free Income Fund | Aberdeen Ultra-Short Duration Bond Fund | |||||||||||||||
| Year Ended October 31, 2014 | Year Ended October 31, 2013 | Year Ended October 31, 2014 | Year Ended October 31, 2013 | |||||||||||||
FROM INVESTMENT ACTIVITIES: | ||||||||||||||||
Operations: | ||||||||||||||||
Net investment income | $ | 3,395,733 | $ | 3,667,380 | $ | 72,529 | $ | 105,397 | ||||||||
Net realized gain/(loss) from investments, futures contracts, swaps and foreign currency transactions | 343,296 | 1,500,618 | (806 | ) | 30,606 | |||||||||||
Net change in unrealized appreciation/(depreciation) on investments, futures contracts, swaps and translation of assets and liabilities denominated in foreign currencies | 2,532,911 | (7,123,793 | ) | (30,861 | ) | (65,910 | ) | |||||||||
|
|
|
|
|
|
|
| |||||||||
Changes in net assets resulting from operations | 6,271,940 | (1,955,795 | ) | 40,862 | 70,093 | |||||||||||
|
|
|
|
|
|
|
| |||||||||
Distributions to Shareholders From: | ||||||||||||||||
Net investment income: | ||||||||||||||||
Class A | (295,836 | ) | (325,807 | ) | (400 | ) | (2,009 | ) | ||||||||
Class C | (16,772 | ) | (31,387 | ) | – | – | ||||||||||
Class R | (290 | ) | (187 | )(a) | – | – | ||||||||||
Institutional Service Class | (382 | ) | (221 | )(a) | (101 | ) | (286 | ) | ||||||||
Institutional Class | (3,082,453 | ) | (3,309,777 | )(b) | (76,018 | ) | (103,102 | ) | ||||||||
Net realized gains: | ||||||||||||||||
Class A | (134,136 | ) | (98,516 | ) | (216 | ) | (3,772 | ) | ||||||||
Class C | (15,762 | ) | (20,999 | ) | – | – | ||||||||||
Class R | (140 | ) | – | – | – | |||||||||||
Institutional Service Class | (140 | ) | – | (55 | ) | (214 | ) | |||||||||
Institutional Class | (1,327,565 | ) | (880,763 | )(b) | (29,977 | ) | (126,900 | ) | ||||||||
|
|
|
|
|
|
|
| |||||||||
Change in net assets from shareholder distributions | (4,873,476 | ) | (4,667,657 | ) | (106,767 | ) | (236,283 | ) | ||||||||
|
|
|
|
|
|
|
| |||||||||
Change in net assets from capital transactions | (5,402,274 | ) | (7,543,576 | ) | (3,676,599 | ) | (4,160,762 | ) | ||||||||
|
|
|
|
|
|
|
| |||||||||
Change in net assets | (4,003,810 | ) | (14,167,028 | ) | (3,742,504 | ) | (4,326,952 | ) | ||||||||
|
|
|
|
|
|
|
| |||||||||
Net Assets: | ||||||||||||||||
Beginning of year | 103,977,276 | 118,144,304 | 14,001,096 | 18,328,048 | ||||||||||||
|
|
|
|
|
|
|
| |||||||||
End of year | $ | 99,973,466 | $ | 103,977,276 | $ | 10,258,592 | $ | 14,001,096 | ||||||||
|
|
|
|
|
|
|
| |||||||||
Accumulated net investment income/(loss) at end of year | $ | (45,943 | ) | $ | (65,880 | ) | $ | 652 | $ | 3,867 | ||||||
|
|
|
|
|
|
|
| |||||||||
| (a) | For the period from February 25, 2013 (commencement of operations) through October 31, 2013. |
| (b) | Formerly Class D shares. |
Amounts listed as “–” are $0 or round to $0.
See accompanying Notes to Financial Statements.
Annual Report 2014
84
Table of Contents
Statements of Changes in Net Assets (continued)
| Aberdeen Tax-Free Income Fund | Aberdeen Ultra-Short Duration Bond Fund | |||||||||||||||
| Year Ended October 31, 2014 | Year Ended October 31, 2013 | Year Ended October 31, 2014 | Year Ended October 31, 2013 | |||||||||||||
CAPITAL TRANSACTIONS: | ||||||||||||||||
Class A Shares | ||||||||||||||||
Proceeds from shares issued | $ | 862,048 | $ | 1,097,177 | $ | 23,793 | $ | 121,619 | ||||||||
Dividends reinvested | 330,655 | 311,140 | 555 | 5,747 | ||||||||||||
Cost of shares redeemed(c) | (1,425,538 | ) | (2,707,819 | ) | (379,465 | ) | (31,341 | ) | ||||||||
|
|
|
|
|
|
|
| |||||||||
Total Class A | (232,835 | ) | (1,299,502 | ) | (355,117 | ) | 96,025 | |||||||||
|
|
|
|
|
|
|
| |||||||||
Class C Shares | ||||||||||||||||
Proceeds from shares issued | 465,036 | 378,210 | – | – | ||||||||||||
Dividends reinvested | 20,241 | 16,700 | – | – | ||||||||||||
Cost of shares redeemed(c) | (633,192 | ) | (1,936,762 | ) | – | – | ||||||||||
|
|
|
|
|
|
|
| |||||||||
Total Class C | (147,915 | ) | (1,541,852 | ) | – | – | ||||||||||
|
|
|
|
|
|
|
| |||||||||
Class R Shares | ||||||||||||||||
Proceeds from shares issued | – | 10,000 | (a) | – | – | |||||||||||
Dividends reinvested | 430 | 182 | (a) | – | – | |||||||||||
|
|
|
|
|
|
|
| |||||||||
Total Class R | 430 | 10,182 | (a) | – | – | |||||||||||
|
|
|
|
|
|
|
| |||||||||
Institutional Service Class Shares | ||||||||||||||||
Proceeds from shares issued | 6,770 | 10,000 | (a) | 17,778 | 70,307 | |||||||||||
Dividends reinvested | 522 | 215 | (a) | 150 | 492 | |||||||||||
Cost of shares redeemed(c) | – | – | (25,459 | ) | (70,209 | ) | ||||||||||
|
|
|
|
|
|
|
| |||||||||
Total Institutional Service Class | 7,292 | 10,215 | (a) | (7,531 | ) | 590 | ||||||||||
|
|
|
|
|
|
|
| |||||||||
Institutional Class Shares | ||||||||||||||||
Proceeds from shares issued | 589,737 | 103,345,917 | (b) | 5,516,381 | 10,351,585 | |||||||||||
Dividends reinvested | 3,475,225 | 3,143,000 | (b) | 106,597 | 103,033 | |||||||||||
Cost of shares redeemed(c) | (9,094,208 | ) | (111,211,536 | )(b) | (8,936,929 | ) | (14,711,995 | ) | ||||||||
|
|
|
|
|
|
|
| |||||||||
Total Institutional Class | (5,029,246 | ) | (4,722,619 | )(b) | (3,313,951 | ) | (4,257,377 | ) | ||||||||
|
|
|
|
|
|
|
| |||||||||
Change in net assets from capital transactions: | $ | (5,402,274 | ) | $ | (7,543,576 | ) | $ | (3,676,599 | ) | $ | (4,160,762 | ) | ||||
|
|
|
|
|
|
|
| |||||||||
| (a) | For the period from February 25, 2013 (commencement of operations) through October 31, 2013. |
| (b) | Formerly Class D shares. |
| (c) | Includes redemption fees, if any. |
Amounts listed as “–” are $0 or round to $0.
See accompanying Notes to Financial Statements.
2014 Annual Report
85
Table of Contents
Statements of Changes in Net Assets (concluded)
| Aberdeen Tax-Free Income Fund | Aberdeen Ultra-Short Duration Bond Fund | |||||||||||||||
| Year Ended October 31, 2014 | Year Ended October 31, 2013 | Year Ended October 31, 2014 | Year Ended October 31, 2013 | |||||||||||||
SHARE TRANSACTIONS: | ||||||||||||||||
Class A Shares | ||||||||||||||||
Issued | 83,554 | 103,168 | 2,387 | 12,085 | ||||||||||||
Reinvested | 32,528 | 29,475 | 56 | 575 | ||||||||||||
Redeemed | (138,615 | ) | (258,231 | ) | (38,023 | ) | (3,129 | ) | ||||||||
|
|
|
|
|
|
|
| |||||||||
Total Class A Shares | (22,533 | ) | (125,588 | ) | (35,580 | ) | 9,531 | |||||||||
|
|
|
|
|
|
|
| |||||||||
Class C Shares | ||||||||||||||||
Issued | 45,891 | 36,524 | – | – | ||||||||||||
Reinvested | 2,005 | 1,573 | – | – | ||||||||||||
Redeemed | (62,974 | ) | (183,230 | ) | – | – | ||||||||||
|
|
|
|
|
|
|
| |||||||||
Total Class C Shares | (15,078 | ) | (145,133 | ) | – | – | ||||||||||
|
|
|
|
|
|
|
| |||||||||
Class R Shares | ||||||||||||||||
Issued | – | 933 | (a) | – | – | |||||||||||
Reinvested | 43 | 17 | (a) | – | – | |||||||||||
|
|
|
|
|
|
|
| |||||||||
Total Class R Shares | 43 | 950 | (a) | – | – | |||||||||||
|
|
|
|
|
|
|
| |||||||||
Institutional Service Class Shares | ||||||||||||||||
Issued | 654 | 933 | (a) | 1,789 | 7,038 | |||||||||||
Reinvested | 51 | 21 | (a) | 15 | 49 | |||||||||||
Redeemed | – | – | (2,560 | ) | (7,049 | ) | ||||||||||
|
|
|
|
|
|
|
| |||||||||
Total Institutional Service Class Shares | 705 | 954 | (a) | (756 | ) | 38 | ||||||||||
|
|
|
|
|
|
|
| |||||||||
Institutional Class Shares | ||||||||||||||||
Issued | 57,265 | 9,640,917 | (b) | 554,358 | 1,036,793 | |||||||||||
Reinvested | 341,595 | 297,415 | (b) | 10,722 | 10,326 | |||||||||||
Redeemed | (889,617 | ) | (10,393,368 | )(b) | (899,005 | ) | (1,471,642 | ) | ||||||||
|
|
|
|
|
|
|
| |||||||||
Total Institutional Class Shares | (490,757 | ) | (455,036 | )(b) | (333,925 | ) | (424,523 | ) | ||||||||
|
|
|
|
|
|
|
| |||||||||
Total change in shares: | (527,620 | ) | (723,853 | ) | (370,261 | ) | (414,954 | ) | ||||||||
|
|
|
|
|
|
|
| |||||||||
| (a) | For the period from February 25, 2013 (commencement of operations) through October 31, 2013. |
| (b) | Formerly Class D shares. |
Amounts listed as “–” are $0 or round to $0.
See accompanying Notes to Financial Statements.
Annual Report 2014
86
Table of Contents
This page intentionally left blank.
Table of Contents
Financial Highlights
Selected Data for Each Share of Capital Outstanding Throughout the Periods Indicated
Aberdeen Asia Bond Fund
| Investment Activities | Distributions | |||||||||||||||||||||||||||||||||||
| Net Asset Value, Beginning of Period | Net Investment Income (a) | Net Realized and Unrealized Gains (Losses) on Invest- ments | Total from Invest- ment Activities | Net Invest- ment Income | Net Realized Gains | Total Distri- butions | Redemp- tion Fees | Net Asset Value, End of Period | ||||||||||||||||||||||||||||
Class A Shares | ||||||||||||||||||||||||||||||||||||
Year Ended October 31, 2014 | $ | 10.43 | $ | 0.35 | $ | (0.12 | ) | $ | 0.23 | $ | (0.14 | ) | $ | (0.33 | ) | $ | (0.47 | ) | $ | – | $ | 10.19 | ||||||||||||||
Year Ended October 31, 2013 | 11.26 | 0.34 | (0.85 | ) | (0.51 | ) | (0.25 | ) | (0.07 | ) | (0.32 | ) | – | 10.43 | ||||||||||||||||||||||
Period Ended October 31, 2012(g) | 10.92 | 0.23 | 0.29 | 0.52 | (0.18 | ) | – | (0.18 | ) | – | 11.26 | |||||||||||||||||||||||||
Class C Shares | ||||||||||||||||||||||||||||||||||||
Year Ended October 31, 2014 | 10.37 | 0.28 | (0.11 | ) | 0.17 | (0.11 | ) | (0.33 | ) | (0.44 | ) | – | 10.10 | |||||||||||||||||||||||
Year Ended October 31, 2013 | 11.24 | 0.26 | (0.86 | ) | (0.60 | ) | (0.20 | ) | (0.07 | ) | (0.27 | ) | – | 10.37 | ||||||||||||||||||||||
Period Ended October 31, 2012(g) | 10.92 | 0.17 | 0.31 | 0.48 | (0.16 | ) | – | (0.16 | ) | – | 11.24 | |||||||||||||||||||||||||
Class R Shares | ||||||||||||||||||||||||||||||||||||
Year Ended October 31, 2014 | 10.42 | 0.33 | (0.12 | ) | 0.21 | (0.14 | ) | (0.33 | ) | (0.47 | ) | – | 10.16 | |||||||||||||||||||||||
Year Ended October 31, 2013 | 11.27 | 0.31 | (0.86 | ) | (0.55 | ) | (0.23 | ) | (0.07 | ) | (0.30 | ) | – | 10.42 | ||||||||||||||||||||||
Period Ended October 31, 2012(g) | 10.92 | 0.22 | 0.29 | 0.51 | (0.16 | ) | – | (0.16 | ) | – | 11.27 | |||||||||||||||||||||||||
Institutional Service Class Shares | ||||||||||||||||||||||||||||||||||||
Year Ended October 31, 2014 | 10.43 | 0.35 | (0.10 | ) | 0.25 | (0.15 | ) | (0.33 | ) | (0.48 | ) | – | 10.20 | |||||||||||||||||||||||
Year Ended October 31, 2013 | 11.27 | 0.34 | (0.86 | ) | (0.52 | ) | (0.25 | ) | (0.07 | ) | (0.32 | ) | – | 10.43 | ||||||||||||||||||||||
Year Ended October 31, 2012 | 10.99 | 0.35 | 0.38 | 0.73 | (0.45 | ) | – | (0.45 | ) | – | 11.27 | |||||||||||||||||||||||||
Year Ended October 31, 2011 | 11.44 | 0.39 | 0.03 | 0.42 | (0.87 | ) | – | (0.87 | ) | – | 10.99 | |||||||||||||||||||||||||
Period Ended October 31, 2010(i) | 10.36 | 0.37 | 0.86 | 1.23 | (0.15 | ) | – | (0.15 | ) | – | 11.44 | |||||||||||||||||||||||||
Institutional Class Shares | ||||||||||||||||||||||||||||||||||||
Year Ended October 31, 2014 | 10.45 | 0.38 | (0.12 | ) | 0.26 | (0.16 | ) | (0.33 | ) | (0.49 | ) | – | 10.22 | |||||||||||||||||||||||
Year Ended October 31, 2013 | 11.27 | 0.36 | (0.84 | ) | (0.48 | ) | (0.27 | ) | (0.07 | ) | (0.34 | ) | – | 10.45 | ||||||||||||||||||||||
Year Ended October 31, 2012 | 11.00 | 0.38 | 0.36 | 0.74 | (0.47 | ) | – | (0.47 | ) | – | 11.27 | |||||||||||||||||||||||||
Year Ended October 31, 2011 | 11.44 | 0.42 | 0.03 | 0.45 | (0.89 | ) | – | (0.89 | ) | – | 11.00 | |||||||||||||||||||||||||
Year Ended October 31, 2010 | 10.04 | 0.42 | 1.13 | 1.55 | (0.15 | ) | – | (0.15 | ) | – | 11.44 | |||||||||||||||||||||||||
| (a) | Net investment income (loss) is based on average shares outstanding during the period. |
| (b) | Excludes sales charge. |
| (c) | Not annualized for periods less than one year. |
| (d) | Annualized for periods less than one year. |
Amounts listed as “–” are $0 or round to $0.
See accompanying Notes to Financial Statements.
Annual Report 2014
88
Table of Contents
Financial Highlights (continued)
Selected Data for Each Share of Capital Outstanding Throughout the Periods Indicated
Aberdeen Asia Bond Fund (concluded)
| Ratios/Supplemental Data | ||||||||||||||||||||||
| Total Return (b)(c) | Net Assets at End of Period (000’s) | Ratio of Expenses to Average Net Assets (d) | Ratio of Net Investment Income to Average Net Assets (d) | Ratio of Expenses (Prior to Reimbursements) to Average Net Assets (d)(e) | Portfolio Turnover (f) | |||||||||||||||||
| 2.41 | % | $ | 824 | 0.95 | % | 3.52 | % | 1.05 | % | 57.03 | % | |||||||||||
| (4.64 | %) | 1,807 | �� | 0.95 | % | 3.18 | % | 1.03 | % | 77.93 | % | |||||||||||
| 4.87 | % | 1,275 | 0.92 | % | 3.14 | % | 0.99 | % | 62.96 | % | ||||||||||||
| 1.76 | %(h) | 598 | 1.70 | % | 2.77 | % | 1.80 | % | 57.03 | % | ||||||||||||
| (5.46 | %)(h) | 637 | 1.70 | % | 2.39 | % | 1.78 | % | 77.93 | % | ||||||||||||
| 4.44 | % | 393 | 1.67 | % | 2.31 | % | 1.74 | % | 62.96 | % | ||||||||||||
| 2.14 | % | 10 | 1.20 | % | 3.25 | % | 1.31 | % | 57.03 | % | ||||||||||||
| (5.04 | %) | 10 | 1.20 | % | 2.84 | % | 1.28 | % | 77.93 | % | ||||||||||||
| 4.76 | % | 11 | 1.17 | % | 2.97 | % | 1.24 | % | 62.96 | % | ||||||||||||
| 2.54 | %(h) | 11,377 | 0.94 | % | 3.52 | % | 1.04 | % | 57.03 | % | ||||||||||||
| (4.74 | %) | 11,083 | 0.95 | % | 3.09 | % | 1.03 | % | 77.93 | % | ||||||||||||
| 6.93 | % | 12,449 | 0.93 | % | 3.21 | % | 0.97 | % | 62.96 | % | ||||||||||||
| 3.75 | % | 9,059 | 0.91 | % | 3.57 | % | 0.92 | % | 71.15 | % | ||||||||||||
| 12.20 | % | 1,654 | 0.65 | % | 4.02 | % | 0.80 | % | 42.77 | % | ||||||||||||
| 2.72 | % | 224,989 | 0.70 | % | 3.77 | % | 0.80 | % | 57.03 | % | ||||||||||||
| (4.40 | %)(h) | 232,639 | 0.70 | % | 3.27 | % | 0.78 | % | 77.93 | % | ||||||||||||
| 7.07 | %(h) | 467,668 | 0.69 | % | 3.46 | % | 0.72 | % | 62.96 | % | ||||||||||||
| 3.97 | % | 646,246 | 0.66 | % | 3.84 | % | 0.67 | % | 71.15 | % | ||||||||||||
| 15.55 | % | 536,080 | 0.65 | % | 3.88 | % | 0.71 | % | 42.77 | % | ||||||||||||
| (e) | During the period, certain fees were waived and/or reimbursed. If such waivers/reimbursements had not occurred, the ratios would have been as indicated. |
| (f) | Portfolio turnover is calculated on the basis of the Fund as a whole without distinguishing among the classes of shares. |
| (g) | For the period from February 27, 2012 (commencement of operations) through October 31, 2012. |
| (h) | The total return shown above includes the impact of financial statement rounding of the NAV per share and/or financial statement adjustments. |
| (i) | For the period from January 5, 2010 (commencement of operations) through October 31, 2010. |
2014 Annual Report
89
Table of Contents
Financial Highlights (continued)
Selected Data for Each Share of Capital Outstanding Throughout the Periods Indicated
Aberdeen Core Fixed Income Fund
| Investment Activities | Distributions | |||||||||||||||||||||||||||||||||||
| Net Asset Value, Beginning of Period | Net Investment Income (a) | Net Realized and Unrealized Gains (Losses) on Invest- ments | Total from Invest- ment Activities | Net Invest- ment Income | Net Realized Gains | Total Distri- butions | Redemp- tion Fees | Net Asset Value, End of Period | ||||||||||||||||||||||||||||
Class A Shares(g) | ||||||||||||||||||||||||||||||||||||
Year Ended October 31, 2014 | $ | 10.69 | $ | 0.24 | $ | 0.22 | $ | 0.46 | $ | (0.29 | ) | $ | – | $ | (0.29 | ) | $ | – | $ | 10.86 | ||||||||||||||||
Year Ended October 31, 2013 | 11.32 | 0.21 | (0.33 | ) | (0.12 | ) | (0.21 | ) | (0.30 | ) | (0.51 | ) | – | 10.69 | ||||||||||||||||||||||
Year Ended October 31, 2012 | 10.94 | 0.26 | 0.47 | 0.73 | (0.26 | ) | (0.09 | ) | (0.35 | ) | – | 11.32 | ||||||||||||||||||||||||
Year Ended October 31, 2011 | 11.61 | 0.35 | 0.08 | 0.43 | (0.39 | ) | (0.71 | ) | (1.10 | ) | – | 10.94 | ||||||||||||||||||||||||
Period Ended October 31, 2010(h) | 11.44 | 0.12 | 0.14 | 0.26 | (0.09 | ) | – | (0.09 | ) | – | 11.61 | |||||||||||||||||||||||||
Year Ended July 31, 2010 | 10.99 | 0.41 | 0.43 | 0.84 | (0.38 | ) | (0.01 | ) | (0.39 | ) | – | 11.44 | ||||||||||||||||||||||||
Class C Shares(g) | ||||||||||||||||||||||||||||||||||||
Year Ended October 31, 2014 | 10.67 | 0.16 | 0.22 | 0.38 | (0.21 | ) | – | (0.21 | ) | – | 10.84 | |||||||||||||||||||||||||
Year Ended October 31, 2013 | 11.31 | 0.14 | (0.34 | ) | (0.20 | ) | (0.14 | ) | (0.30 | ) | (0.44 | ) | – | 10.67 | ||||||||||||||||||||||
Year Ended October 31, 2012 | 10.92 | 0.17 | 0.50 | 0.67 | (0.19 | ) | (0.09 | ) | (0.28 | ) | – | 11.31 | ||||||||||||||||||||||||
Year Ended October 31, 2011 | 11.57 | 0.25 | 0.12 | 0.37 | (0.31 | ) | (0.71 | ) | (1.02 | ) | – | 10.92 | ||||||||||||||||||||||||
Period Ended October 31, 2010(h) | 11.42 | 0.09 | 0.13 | 0.22 | (0.07 | ) | – | (0.07 | ) | – | 11.57 | |||||||||||||||||||||||||
Year Ended July 31, 2010 | 10.97 | 0.31 | 0.45 | 0.76 | (0.30 | ) | (0.01 | ) | (0.31 | ) | – | 11.42 | ||||||||||||||||||||||||
Institutional Service Class Shares(g) | ||||||||||||||||||||||||||||||||||||
Year Ended October 31, 2014 | 10.75 | 0.28 | 0.23 | 0.51 | (0.32 | ) | – | (0.32 | ) | – | 10.94 | |||||||||||||||||||||||||
Year Ended October 31, 2013 | 11.39 | 0.25 | (0.34 | ) | (0.09 | ) | (0.25 | ) | (0.30 | ) | (0.55 | ) | – | 10.75 | ||||||||||||||||||||||
Year Ended October 31, 2012 | 10.99 | 0.29 | 0.50 | 0.79 | (0.30 | ) | (0.09 | ) | (0.39 | ) | – | 11.39 | ||||||||||||||||||||||||
Year Ended October 31, 2011 | 11.61 | 0.39 | 0.12 | 0.51 | (0.42 | ) | (0.71 | ) | (1.13 | ) | – | 10.99 | ||||||||||||||||||||||||
Period Ended October 31, 2010(h) | 11.47 | 0.13 | 0.12 | 0.25 | (0.11 | ) | – | (0.11 | ) | – | 11.61 | |||||||||||||||||||||||||
Period Ended July 31, 2010(i) | 11.40 | 0.02 | 0.07 | 0.09 | (0.02 | ) | – | (0.02 | ) | – | 11.47 | |||||||||||||||||||||||||
Institutional Class Shares(g) | ||||||||||||||||||||||||||||||||||||
Year Ended October 31, 2014 | 10.75 | 0.28 | 0.21 | 0.49 | (0.32 | ) | – | (0.32 | ) | – | 10.92 | |||||||||||||||||||||||||
Year Ended October 31, 2013 | 11.39 | 0.25 | (0.34 | ) | (0.09 | ) | (0.25 | ) | (0.30 | ) | (0.55 | ) | – | 10.75 | ||||||||||||||||||||||
Year Ended October 31, 2012 | 11.00 | 0.30 | 0.48 | 0.78 | (0.30 | ) | (0.09 | ) | (0.39 | ) | – | 11.39 | ||||||||||||||||||||||||
Year Ended October 31, 2011 | 11.67 | 0.39 | 0.07 | 0.46 | (0.42 | ) | (0.71 | ) | (1.13 | ) | – | 11.00 | ||||||||||||||||||||||||
Period Ended October 31, 2010(h) | 11.51 | 0.13 | 0.13 | 0.26 | (0.10 | ) | – | (0.10 | ) | – | 11.67 | |||||||||||||||||||||||||
Year Ended July 31, 2010 | 11.05 | 0.41 | 0.47 | 0.88 | (0.41 | ) | (0.01 | ) | (0.42 | ) | – | 11.51 | ||||||||||||||||||||||||
| (a) | Net investment income (loss) is based on average shares outstanding during the period. |
| (b) | Excludes sales charge. |
| (c) | Not annualized for periods less than one year. |
| (d) | Annualized for periods less than one year. |
Amounts listed as “–” are $0 or round to $0.
See accompanying Notes to Financial Statements.
Annual Report 2014
90
Table of Contents
Financial Highlights (continued)
Selected Data for Each Share of Capital Outstanding Throughout the Periods Indicated
Aberdeen Core Fixed Income Fund (concluded)
| Ratios/Supplemental Data | ||||||||||||||||||||||
| Total Return (b)(c) | Net Assets at End of Period (000’s) | Ratio of Expenses to Average Net Assets (d) | Ratio of Net Investment Income to Average Net Assets (d) | Ratio of Expenses (Prior to Reimbursements) to Average Net Assets (d)(e) | Portfolio Turnover (f) | |||||||||||||||||
| 4.36 | % | $ | 3,597 | 0.77 | % | 2.25 | % | 1.00 | % | 322.86 | % | |||||||||||
| (1.01 | %) | 3,912 | 0.77 | % | 1.97 | % | 0.93 | % | 313.91 | % | ||||||||||||
| 6.89 | % | 4,409 | 0.78 | % | 2.38 | % | 0.88 | % | 370.19 | % | ||||||||||||
| 4.24 | % | 4,262 | 0.74 | % | 3.24 | % | 0.79 | % | 377.38 | % | ||||||||||||
| 2.31 | % | 2,985 | 0.72 | % | 4.19 | % | 0.72 | % | 166.80 | % | ||||||||||||
| 7.81 | % | 3,085 | 1.07 | % | 3.38 | % | 1.35 | % | 84.40 | % | ||||||||||||
| 3.61 | % | 2,537 | 1.50 | % | 1.53 | % | 1.73 | % | 322.86 | % | ||||||||||||
| (1.82 | %) | 2,724 | 1.50 | % | 1.24 | % | 1.66 | % | 313.91 | % | ||||||||||||
| 6.23 | % | 2,918 | 1.50 | % | 1.50 | % | 1.61 | % | 370.19 | % | ||||||||||||
| 3.56 | % | 191 | 1.49 | % | 2.37 | % | 1.54 | % | 377.38 | % | ||||||||||||
| 2.04 | % | 17 | 1.47 | % | 3.25 | % | 1.47 | % | 166.80 | % | ||||||||||||
| 7.03 | % | 10 | 1.80 | % | 2.78 | % | 1.95 | % | 84.40 | % | ||||||||||||
| 4.81 | % | 7 | 0.50 | % | 2.59 | % | 0.72 | % | 322.86 | % | ||||||||||||
| (0.81 | %) | 26 | 0.50 | % | 2.25 | % | 0.66 | % | 313.91 | % | ||||||||||||
| 7.26 | % | 26 | 0.50 | % | 2.62 | % | 0.60 | % | 370.19 | % | ||||||||||||
| 4.55 | % | 5 | 0.43 | % | 3.58 | % | 0.54 | % | 377.38 | % | ||||||||||||
| 2.32 | % | 1 | 0.39 | % | 4.58 | % | 0.39 | % | 166.80 | % | ||||||||||||
| 0.79 | % | 1 | 0.33 | % | 3.31 | % | 0.38 | % | 84.40 | % | ||||||||||||
| 4.62 | % | 5,911 | 0.50 | % | 2.61 | % | 0.72 | % | 322.86 | % | ||||||||||||
| (0.81 | %) | 89,390 | 0.50 | % | 2.25 | % | 0.66 | % | 313.91 | % | ||||||||||||
| 7.25 | % | 102,907 | 0.50 | % | 2.66 | % | 0.60 | % | 370.19 | % | ||||||||||||
| 4.49 | % | 99,545 | 0.49 | % | 3.53 | % | 0.54 | % | 377.38 | % | ||||||||||||
| 2.28 | % | 182,775 | 0.47 | % | 4.43 | % | 0.47 | % | 166.80 | % | ||||||||||||
| 8.12 | % | 196,885 | 0.76 | % | 3.64 | % | 0.90 | % | 84.40 | % | ||||||||||||
| (e) | During the period, certain fees were waived and/or reimbursed. If such waivers/reimbursements had not occurred, the ratios would have been as indicated. |
| (f) | Portfolio turnover is calculated on the basis of the Fund as a whole without distinguishing among the classes of shares. |
| (g) | Information presented for the periods prior to July 12, 2010, reflects the Pacific Capital High Grade Core Fixed Income Fund. |
| (h) | The Fund changed its fiscal year end from July 31 to October 31. This line represents the period from August 1, 2010 to October 31, 2010. |
| (i) | For the period from July 12, 2010 (commencement of operations) through July 31, 2010. |
2014 Annual Report
91
Table of Contents
Financial Highlights (continued)
Selected Data for Each Share of Capital Outstanding Throughout the Periods Indicated
Aberdeen Emerging Markets Debt Fund
| Investment Activities | Distributions | |||||||||||||||||||||||||||
| Net Asset Value, Beginning of Period | Net Investment Income (a) | Net Realized and Unrealized Gains (Losses) on Invest- ments | Total from Invest- ment Activities | Net Invest- ment Income | Total Distri- butions | Net Asset Value, End of Period | ||||||||||||||||||||||
Class A Shares | ||||||||||||||||||||||||||||
Year Ended October 31, 2014 | $ | 9.54 | $ | 0.42 | $ | 0.11 | $ | 0.53 | $ | (0.34 | ) | $ | (0.34 | ) | $ | 9.73 | ||||||||||||
Year Ended October 31, 2013 | 10.00 | 0.35 | (0.59 | ) | (0.24 | ) | (0.22 | ) | (0.22 | ) | 9.54 | |||||||||||||||||
Class C Shares | ||||||||||||||||||||||||||||
Year Ended October 31, 2014 | 9.53 | 0.34 | 0.11 | 0.45 | (0.26 | ) | (0.26 | ) | 9.72 | |||||||||||||||||||
Year Ended October 31, 2013 | 10.00 | 0.27 | (0.59 | ) | (0.32 | ) | (0.15 | ) | (0.15 | ) | 9.53 | |||||||||||||||||
Class R Shares | ||||||||||||||||||||||||||||
Year Ended October 31, 2014 | 9.54 | 0.39 | 0.11 | 0.50 | (0.31 | ) | (0.31 | ) | 9.73 | |||||||||||||||||||
Year Ended October 31, 2013 | 10.00 | 0.32 | (0.58 | ) | (0.26 | ) | (0.20 | ) | (0.20 | ) | 9.54 | |||||||||||||||||
Institutional Service Class Shares | ||||||||||||||||||||||||||||
Year Ended October 31, 2014 | 9.55 | 0.44 | 0.11 | 0.55 | (0.36 | ) | (0.36 | ) | 9.74 | |||||||||||||||||||
Year Ended October 31, 2013 | 10.00 | 0.37 | (0.58 | ) | (0.21 | ) | (0.24 | ) | (0.24 | ) | 9.55 | |||||||||||||||||
Institutional Class Shares | ||||||||||||||||||||||||||||
Year Ended October 31, 2014 | 9.54 | 0.47 | 0.08 | 0.55 | (0.36 | ) | (0.36 | ) | 9.73 | |||||||||||||||||||
Year Ended October 31, 2013 | 10.00 | 0.37 | (0.59 | ) | (0.22 | ) | (0.24 | ) | (0.24 | ) | 9.54 | |||||||||||||||||
| (a) | Net investment income (loss) is based on average shares outstanding during the period. |
| (b) | Excludes sales charge. |
Amounts listed as “–” are $0 or round to $0.
See accompanying Notes to Financial Statements.
Annual Report 2014
92
Table of Contents
Financial Highlights (continued)
Selected Data for Each Share of Capital Outstanding Throughout the Periods Indicated
Aberdeen Emerging Markets Debt Fund (concluded)
| Ratios/Supplemental Data | ||||||||||||||||||||||
| Total Return (b) | Net Assets at End of Period (000’s) | Ratio of Expenses to Average Net Assets | Ratio of Net Investment Income to Average Net Assets | Ratio of Expenses (Prior to Reimbursements) to Average Net Assets (c) | Portfolio Turnover (d) | |||||||||||||||||
| 5.64 | % | $ | 10 | 1.15 | % | 4.35 | % | 1.85 | % | 60.31 | % | |||||||||||
| (2.43 | %) | 10 | 1.15 | % | 3.58 | % | 2.57 | % | 55.26 | % | ||||||||||||
| 4.83 | %(e) | 10 | 1.89 | % | 3.60 | % | 2.60 | % | 60.31 | % | ||||||||||||
| (3.20 | %)(e) | 10 | 1.90 | % | 2.83 | % | 3.32 | % | 55.26 | % | ||||||||||||
| 5.37 | % | 10 | 1.40 | % | 4.10 | % | 2.10 | % | 60.31 | % | ||||||||||||
| (2.66 | %) | 10 | 1.40 | % | 3.34 | % | 2.82 | % | 55.26 | % | ||||||||||||
| 5.80 | %(e) | 10 | 0.90 | % | 4.60 | % | 1.60 | % | 60.31 | % | ||||||||||||
| (2.11 | %)(e) | 10 | 0.90 | % | 3.83 | % | 2.32 | % | 55.26 | % | ||||||||||||
| 5.91 | % | 31,173 | 0.90 | % | 4.79 | % | 1.60 | % | 60.31 | % | ||||||||||||
| (2.21 | %) | 9,742 | 0.90 | % | 3.81 | % | 2.32 | % | 55.26 | % | ||||||||||||
| (c) | During the period, certain fees were waived and/or reimbursed. If such waivers/reimbursements had not occurred, the ratios would have been as indicated. |
| (d) | Portfolio turnover is calculated on the basis of the Fund as a whole without distinguishing among the classes of shares. |
| (e) | The total return shown above includes the impact of financial statement rounding of the NAV per share and/or financial statement adjustments. |
2014 Annual Report
93
Table of Contents
Financial Highlights (continued)
Selected Data for Each Share of Capital Outstanding Throughout the Periods Indicated
Aberdeen Emerging Markets Debt Local Currency Fund
| Investment Activities | Distributions | |||||||||||||||||||||||||||||||||||
| Net Asset Value, Beginning of Period | Net Investment Income (a) | Net Realized and Unrealized Gains (Losses) on Invest- ments | Total from Invest- ment Activities | Net Invest- ment Income | Net Realized Gains | Tax Return of Capital | Total Distri- butions | Net Asset Value, End of Period | ||||||||||||||||||||||||||||
Class A Shares | ||||||||||||||||||||||||||||||||||||
Year Ended October 31, 2014 | $ | 9.15 | $ | 0.50 | $ | (0.82 | ) | $ | (0.32 | ) | $ | (0.10 | ) | $ | – | $ | – | $ | (0.10 | ) | $ | 8.73 | ||||||||||||||
Year Ended October 31, 2013 | 9.65 | 0.44 | (0.79 | ) | (0.35 | ) | (0.15 | ) | – | – | (0.15 | ) | 9.15 | |||||||||||||||||||||||
Year Ended October 31, 2012 | 9.30 | 0.49 | 0.15 | 0.64 | (0.05 | ) | (0.10 | ) | (0.14 | ) | (0.29 | ) | 9.65 | |||||||||||||||||||||||
Period Ended October 31, 2011(g) | 10.00 | 0.21 | (0.77 | ) | (0.56 | ) | (0.07 | ) | (0.03 | ) | (0.04 | ) | (0.14 | ) | 9.30 | |||||||||||||||||||||
Class C Shares | ||||||||||||||||||||||||||||||||||||
Year Ended October 31, 2014 | 9.11 | 0.44 | (0.83 | ) | (0.39 | ) | (0.09 | ) | – | – | (0.09 | ) | 8.63 | |||||||||||||||||||||||
Year Ended October 31, 2013 | 9.63 | 0.37 | (0.78 | ) | (0.41 | ) | (0.11 | ) | – | – | (0.11 | ) | 9.11 | |||||||||||||||||||||||
Year Ended October 31, 2012 | 9.28 | 0.42 | 0.14 | 0.56 | (0.01 | ) | (0.10 | ) | (0.10 | ) | (0.21 | ) | 9.63 | |||||||||||||||||||||||
Period Ended October 31, 2011(g) | 10.00 | 0.18 | (0.77 | ) | (0.59 | ) | (0.06 | ) | (0.03 | ) | (0.04 | ) | (0.13 | ) | 9.28 | |||||||||||||||||||||
Class R Shares | ||||||||||||||||||||||||||||||||||||
Year Ended October 31, 2014 | 9.13 | 0.47 | (0.84 | ) | (0.37 | ) | (0.09 | ) | – | – | (0.09 | ) | 8.67 | |||||||||||||||||||||||
Year Ended October 31, 2013 | 9.64 | 0.40 | (0.78 | ) | (0.38 | ) | (0.13 | ) | – | – | (0.13 | ) | 9.13 | |||||||||||||||||||||||
Year Ended October 31, 2012 | 9.30 | 0.44 | 0.18 | 0.62 | (0.04 | ) | (0.10 | ) | (0.14 | ) | (0.28 | ) | 9.64 | |||||||||||||||||||||||
Period Ended October 31, 2011(g) | 10.00 | 0.20 | (0.77 | ) | (0.57 | ) | (0.06 | ) | (0.03 | ) | (0.04 | ) | (0.13 | ) | 9.30 | |||||||||||||||||||||
Institutional Service Class Shares | ||||||||||||||||||||||||||||||||||||
Year Ended October 31, 2014 | 9.17 | 0.53 | (0.84 | ) | (0.31 | ) | (0.11 | ) | – | – | (0.11 | ) | 8.75 | |||||||||||||||||||||||
Year Ended October 31, 2013 | 9.65 | 0.47 | (0.79 | ) | (0.32 | ) | (0.16 | ) | – | – | (0.16 | ) | 9.17 | |||||||||||||||||||||||
Year Ended October 31, 2012 | 9.30 | 0.51 | 0.15 | 0.66 | (0.06 | ) | (0.10 | ) | (0.15 | ) | (0.31 | ) | 9.65 | |||||||||||||||||||||||
Period Ended October 31, 2011(g) | 10.00 | 0.22 | (0.77 | ) | (0.55 | ) | (0.08 | ) | (0.03 | ) | (0.04 | ) | (0.15 | ) | 9.30 | |||||||||||||||||||||
Institutional Class Shares | ||||||||||||||||||||||||||||||||||||
Year Ended October 31, 2014 | 9.17 | 0.53 | (0.84 | ) | (0.31 | ) | (0.11 | ) | – | – | (0.11 | ) | 8.75 | |||||||||||||||||||||||
Year Ended October 31, 2013 | 9.65 | 0.47 | (0.79 | ) | (0.32 | ) | (0.16 | ) | – | – | (0.16 | ) | 9.17 | |||||||||||||||||||||||
Year Ended October 31, 2012 | 9.31 | 0.51 | 0.14 | 0.65 | (0.06 | ) | (0.10 | ) | (0.15 | ) | (0.31 | ) | 9.65 | |||||||||||||||||||||||
Period Ended October 31, 2011(g) | 10.00 | 0.23 | (0.77 | ) | (0.54 | ) | (0.08 | ) | (0.03 | ) | (0.04 | ) | (0.15 | ) | 9.31 | |||||||||||||||||||||
| (a) | Net investment income (loss) is based on average shares outstanding during the period. |
| (b) | Excludes sales charge. |
| (c) | Not annualized for periods less than one year. |
| (d) | Annualized for periods less than one year. |
Amounts listed as “–” are $0 or round to $0.
See accompanying Notes to Financial Statements.
Annual Report 2014
94
Table of Contents
Financial Highlights (continued)
Selected Data for Each Share of Capital Outstanding Throughout the Periods Indicated
Aberdeen Emerging Markets Debt Local Currency Fund (concluded)
| Ratios/Supplemental Data | ||||||||||||||||||||||
| Total Return (b)(c) | Net Assets at End of Period (000’s) | Ratio of Expenses to Average Net Assets (d) | Ratio of Net Investment Income to Average Net Assets (d) | Ratio of Expenses (Prior to Reimbursements) to Average Net Assets (d)(e) | Portfolio Turnover (f) | |||||||||||||||||
| (3.53 | %) | $ | 148 | 1.19 | % | 5.70 | % | 1.65 | % | 46.26 | % | |||||||||||
| (3.77 | %) | 678 | 1.22 | % | 4.61 | % | 1.63 | % | 86.05 | % | ||||||||||||
| 7.05 | % | 528 | 1.17 | % | 5.25 | % | 2.10 | % | 74.49 | % | ||||||||||||
| (5.60 | %) | 76 | 1.15 | % | 4.50 | % | 2.07 | % | 34.36 | % | ||||||||||||
| (4.28 | %) | 204 | 1.90 | % | 5.03 | % | 2.37 | % | 46.26 | % | ||||||||||||
| (4.38 | %) | 331 | 1.90 | % | 3.88 | % | 2.31 | % | 86.05 | % | ||||||||||||
| 6.13 | % | 274 | 1.90 | % | 4.49 | % | 2.83 | % | 74.49 | % | ||||||||||||
| (5.94 | %) | 344 | 1.90 | % | 3.80 | % | 2.80 | % | 34.36 | % | ||||||||||||
| (4.04 | %) | 2,443 | 1.65 | % | 5.34 | % | 2.11 | % | 46.26 | % | ||||||||||||
| (4.06 | %) | 2,521 | 1.63 | % | 4.26 | % | 2.04 | % | 86.05 | % | ||||||||||||
| 6.79 | % | 1,292 | 1.65 | % | 4.67 | % | 2.58 | % | 74.49 | % | ||||||||||||
| (5.73 | %) | 9 | 1.40 | % | 4.11 | % | 2.33 | % | 34.36 | % | ||||||||||||
| (3.36 | %) | 9 | 0.90 | % | 6.00 | % | 1.37 | % | 46.26 | % | ||||||||||||
| (3.39 | %) | 10 | 0.90 | % | 4.87 | % | 1.31 | % | 86.05 | % | ||||||||||||
| 7.26 | % | 10 | 0.90 | % | 5.49 | % | 1.83 | % | 74.49 | % | ||||||||||||
| (5.54 | %) | 9 | 0.90 | % | 4.60 | % | 1.83 | % | 34.36 | % | ||||||||||||
| (3.36 | %)(h) | 28,229 | 0.90 | % | 6.01 | % | 1.37 | % | 46.26 | % | ||||||||||||
| (3.39 | %)(h) | 48,763 | 0.90 | % | 4.91 | % | 1.31 | % | 86.05 | % | ||||||||||||
| 7.15 | %(h) | 28,411 | 0.90 | % | 5.49 | % | 1.83 | % | 74.49 | % | ||||||||||||
| (5.54 | %) | 30,325 | 0.90 | % | 4.67 | % | 1.82 | % | 34.36 | % | ||||||||||||
| (e) | During the period, certain fees were waived and/or reimbursed. If such waivers/reimbursements had not occurred, the ratios would have been as indicated. |
| (f) | Portfolio turnover is calculated on the basis of the Fund as a whole without distinguishing among the classes of shares. |
| (g) | For the period from May 2, 2011 (commencement of operations) through October 31, 2011. |
| (h) | The total return shown above includes the impact of financial statement rounding of the NAV per share and/or financial statement adjustments. |
2014 Annual Report
95
Table of Contents
Financial Highlights (continued)
Selected Data for Each Share of Capital Outstanding Throughout the Periods Indicated
Aberdeen Global Fixed Income Fund
| Investment Activities | Distributions | |||||||||||||||||||||||||||||||
| Net Asset Value, Beginning of Period | Net Investment Income (a) | Net Realized and Unrealized Gains (Losses) on Invest- ments | Total from Investment Activities | Net Investment Income | Total Distributions | Redemption Fees | Net Asset Value, End of Period | |||||||||||||||||||||||||
Class A Shares | ||||||||||||||||||||||||||||||||
Year Ended October 31, 2014 | $ | 10.37 | $ | 0.24 | $ | (0.23 | ) | $ | 0.01 | $ | (0.26 | ) | $ | (0.26 | ) | $ | – | $ | 10.12 | |||||||||||||
Year Ended October 31, 2013 | 10.61 | 0.14 | (0.38 | ) | (0.24 | ) | – | – | – | 10.37 | ||||||||||||||||||||||
Year Ended October 31, 2012 | 10.50 | 0.17 | 0.19 | 0.36 | (0.25 | ) | (0.25 | ) | – | 10.61 | ||||||||||||||||||||||
Year Ended October 31, 2011 | 10.89 | 0.22 | (0.10 | ) | 0.12 | (0.51 | ) | (0.51 | ) | – | 10.50 | |||||||||||||||||||||
Year Ended October 31, 2010 | 10.42 | 0.23 | 0.53 | 0.76 | (0.29 | ) | (0.29 | ) | – | 10.89 | ||||||||||||||||||||||
Class C Shares | ||||||||||||||||||||||||||||||||
Year Ended October 31, 2014 | 10.23 | 0.16 | (0.23 | ) | (0.07 | ) | (0.09 | ) | (0.09 | ) | – | 10.07 | ||||||||||||||||||||
Year Ended October 31, 2013 | 10.55 | 0.06 | (0.38 | ) | (0.32 | ) | – | – | – | 10.23 | ||||||||||||||||||||||
Year Ended October 31, 2012 | 10.44 | 0.09 | 0.21 | 0.30 | (0.19 | ) | (0.19 | ) | – | 10.55 | ||||||||||||||||||||||
Year Ended October 31, 2011 | 10.84 | 0.14 | (0.10 | ) | 0.04 | (0.44 | ) | (0.44 | ) | – | 10.44 | |||||||||||||||||||||
Year Ended October 31, 2010 | 10.38 | 0.15 | 0.54 | 0.69 | (0.23 | ) | (0.23 | ) | – | 10.84 | ||||||||||||||||||||||
Institutional Service Class Shares |
| |||||||||||||||||||||||||||||||
Year Ended October 31, 2014 | 10.39 | 0.25 | (0.24 | ) | 0.01 | (0.28 | ) | (0.28 | ) | – | 10.12 | |||||||||||||||||||||
Year Ended October 31, 2013 | 10.62 | 0.15 | (0.38 | ) | (0.23 | ) | – | – | – | 10.39 | ||||||||||||||||||||||
Year Ended October 31, 2012 | 10.51 | 0.18 | 0.19 | 0.37 | (0.26 | ) | (0.26 | ) | – | 10.62 | ||||||||||||||||||||||
Year Ended October 31, 2011 | 10.90 | 0.24 | (0.09 | ) | 0.15 | (0.54 | ) | (0.54 | ) | – | 10.51 | |||||||||||||||||||||
Year Ended October 31, 2010 | 10.44 | 0.26 | 0.52 | 0.78 | (0.32 | ) | (0.32 | ) | – | 10.90 | ||||||||||||||||||||||
Institutional Class Shares | ||||||||||||||||||||||||||||||||
Year Ended October 31, 2014 | 10.43 | 0.27 | (0.24 | ) | 0.03 | (0.31 | ) | (0.31 | ) | – | 10.15 | |||||||||||||||||||||
Year Ended October 31, 2013 | 10.64 | 0.17 | (0.38 | ) | (0.21 | ) | – | – | – | 10.43 | ||||||||||||||||||||||
Year Ended October 31, 2012 | 10.52 | 0.17 | 0.23 | 0.40 | (0.28 | ) | (0.28 | ) | – | 10.64 | ||||||||||||||||||||||
Year Ended October 31, 2011 | 10.91 | 0.25 | (0.10 | ) | 0.15 | (0.54 | ) | (0.54 | ) | – | 10.52 | |||||||||||||||||||||
Year Ended October 31, 2010 | 10.45 | 0.24 | 0.53 | 0.77 | (0.31 | ) | (0.31 | ) | – | 10.91 | ||||||||||||||||||||||
| (a) | Net investment income (loss) is based on average shares outstanding during the period. |
| (b) | Excludes sales charge. |
Amounts listed as “–” are $0 or round to $0.
See accompanying Notes to Financial Statements.
Annual Report 2014
96
Table of Contents
Financial Highlights (continued)
Selected Data for Each Share of Capital Outstanding Throughout the Periods Indicated
Aberdeen Global Fixed Income Fund (concluded)
| Ratios/Supplemental Data | ||||||||||||||||||||||
| Total Return (b) | Net Assets at End of Period (000’s) | Ratio of Expenses to Average Net Assets | Ratio of Net Investment Income to Average Net Assets | Ratio of Expenses (Prior to Reimbursements) to Average Net Assets (c) | Portfolio Turnover (d) | |||||||||||||||||
| 0.05 | %(e) | $ | 1,183 | 1.10 | % | 2.27 | % | 1.71 | % | 183.14 | % | |||||||||||
| (2.26 | %) | 1,888 | 1.16 | % | 1.32 | % | 1.64 | % | 208.61 | % | ||||||||||||
| 3.56 | % | 2,781 | 1.21 | % | 1.61 | % | 1.51 | % | 135.98 | % | ||||||||||||
| 1.34 | % | 3,172 | 1.22 | % | 2.13 | % | 1.38 | % | 199.69 | % | ||||||||||||
| 7.53 | % | 4,053 | 1.20 | % | 2.22 | % | 1.69 | % | 256.30 | % | ||||||||||||
| (0.70 | %) | 378 | 1.85 | % | 1.54 | % | 2.46 | % | 183.14 | % | ||||||||||||
| (3.03 | %) | 518 | 1.89 | % | 0.59 | % | 2.37 | % | 208.61 | % | ||||||||||||
| 2.90 | % | 967 | 1.95 | % | 0.86 | % | 2.25 | % | 135.98 | % | ||||||||||||
| 0.51 | % | 1,060 | 1.95 | % | 1.38 | % | 2.11 | % | 199.69 | % | ||||||||||||
| 6.76 | % | 1,237 | 1.95 | % | 1.44 | % | 2.45 | % | 256.30 | % | ||||||||||||
| 0.07 | % | 16,724 | 1.01 | % | 2.39 | % | 1.62 | % | 183.14 | % | ||||||||||||
| (2.17 | %) | 19,547 | 1.05 | % | 1.44 | % | 1.53 | % | 208.61 | % | ||||||||||||
| 3.64 | % | 25,168 | 1.13 | % | 1.69 | % | 1.42 | % | 135.98 | % | ||||||||||||
| 1.58 | % | 31,156 | 0.99 | % | 2.33 | % | 1.31 | % | 199.69 | % | ||||||||||||
| 7.66 | % | 36,649 | 0.95 | % | 2.47 | % | 1.44 | % | 256.30 | % | ||||||||||||
| 0.25 | % | 2,717 | 0.85 | % | 2.63 | % | 1.46 | % | 183.14 | % | ||||||||||||
| (1.97 | %) | 1,556 | 0.87 | % | 1.65 | % | 1.37 | % | 208.61 | % | ||||||||||||
| 3.93 | % | 850 | 0.95 | % | 1.68 | % | 1.25 | % | 135.98 | % | ||||||||||||
| 1.60 | % | 38 | 0.95 | % | 2.35 | % | 1.11 | % | 199.69 | % | ||||||||||||
| 7.64 | % | 26 | 0.95 | % | 2.29 | % | 1.47 | % | 256.30 | % | ||||||||||||
| (c) | During the period, certain fees were waived and/or reimbursed. If such waivers/reimbursements had not occurred, the ratios would have been as indicated. |
| (d) | Portfolio turnover is calculated on the basis of the Fund as a whole without distinguishing among the classes of shares. |
| (e) | The total return shown above includes the impact of financial statement rounding of the NAV per share and/or financial statement adjustments. |
2014 Annual Report
97
Table of Contents
Financial Highlights (continued)
Selected Data for Each Share of Capital Outstanding Throughout the Periods Indicated
Aberdeen High Yield Fund
| Investment Activities | Distributions | |||||||||||||||||||||||||||||||
| Net Asset Value, Beginning of Period | Net Investment Income (a) | Net Realized and Unrealized Gains (Losses) on Invest- ments | Total from Invest- ment Activities | Net Invest- ment Income | Net Realized Gains | Total Distri- butions | Net Asset Value, End of Period | |||||||||||||||||||||||||
Class A Shares | ||||||||||||||||||||||||||||||||
Year Ended October 31, 2014 | $ | 10.38 | $ | 0.60 | $ | (0.44 | ) | $ | 0.16 | $ | (0.61 | ) | $ | (0.73 | ) | $ | (1.34 | ) | $ | 9.20 | ||||||||||||
Year Ended October 31, 2013 | 10.16 | 0.66 | 0.33 | 0.99 | (0.66 | ) | (0.11 | ) | (0.77 | ) | 10.38 | |||||||||||||||||||||
Period Ended October 31, 2012(g) | 10.00 | 0.49 | 0.12 | 0.61 | (0.45 | ) | – | (0.45 | ) | 10.16 | ||||||||||||||||||||||
Class C Shares | ||||||||||||||||||||||||||||||||
Year Ended October 31, 2014 | 10.38 | 0.53 | (0.44 | ) | 0.09 | (0.55 | ) | (0.73 | ) | (1.28 | ) | 9.19 | ||||||||||||||||||||
Year Ended October 31, 2013 | 10.15 | 0.57 | 0.36 | 0.93 | (0.59 | ) | (0.11 | ) | (0.70 | ) | 10.38 | |||||||||||||||||||||
Period Ended October 31, 2012(g) | 10.00 | 0.43 | 0.13 | 0.56 | (0.41 | ) | – | (0.41 | ) | 10.15 | ||||||||||||||||||||||
Class R Shares |
| |||||||||||||||||||||||||||||||
Year Ended October 31, 2014 | 10.39 | 0.58 | (0.45 | ) | 0.13 | (0.59 | ) | (0.73 | ) | (1.32 | ) | 9.20 | ||||||||||||||||||||
Year Ended October 31, 2013 | 10.17 | 0.63 | 0.34 | 0.97 | (0.64 | ) | (0.11 | ) | (0.75 | ) | 10.39 | |||||||||||||||||||||
Period Ended October 31, 2012(g) | 10.00 | 0.46 | 0.14 | 0.60 | (0.43 | ) | – | (0.43 | ) | 10.17 | ||||||||||||||||||||||
Institutional Service Class Shares |
| |||||||||||||||||||||||||||||||
Year Ended October 31, 2014 | 10.39 | 0.63 | (0.44 | ) | 0.19 | (0.64 | ) | (0.73 | ) | (1.37 | ) | 9.21 | ||||||||||||||||||||
Year Ended October 31, 2013 | 10.16 | 0.68 | 0.36 | 1.04 | (0.70 | ) | (0.11 | ) | (0.81 | ) | 10.39 | |||||||||||||||||||||
Period Ended October 31, 2012(g) | 10.00 | 0.49 | 0.14 | 0.63 | (0.47 | ) | – | (0.47 | ) | 10.16 | ||||||||||||||||||||||
Institutional Class Shares | ||||||||||||||||||||||||||||||||
Year Ended October 31, 2014 | 10.39 | 0.62 | (0.43 | ) | 0.19 | (0.64 | ) | (0.73 | ) | (1.37 | ) | 9.21 | ||||||||||||||||||||
Year Ended October 31, 2013 | 10.16 | 0.68 | 0.36 | 1.04 | (0.70 | ) | (0.11 | ) | (0.81 | ) | 10.39 | |||||||||||||||||||||
Period Ended October 31, 2012(g) | 10.00 | 0.50 | 0.13 | 0.63 | (0.47 | ) | – | (0.47 | ) | 10.16 | ||||||||||||||||||||||
| (a) | Net investment income (loss) is based on average shares outstanding during the period. |
| (b) | Excludes sales charge. |
| (c) | Not annualized for periods less than one year. |
| (d) | Annualized for periods less than one year. |
Amounts listed as “–” are $0 or round to $0.
See accompanying Notes to Financial Statements.
Annual Report 2014
98
Table of Contents
Financial Highlights (continued)
Selected Data for Each Share of Capital Outstanding Throughout the Periods Indicated
Aberdeen High Yield Fund (concluded)
| Ratios/Supplemental Data | ||||||||||||||||||||||
| Total Return (b)(c) | Net Assets at End of Period (000’s) | Ratio of Expenses to Average Net Assets (d) | Ratio of Net Investment Income to Average Net Assets (d) | Ratio of Expenses (Prior to Reimbursements) to Average Net Assets (d)(e) | Portfolio Turnover (f) | |||||||||||||||||
| 1.65 | % | $ | 389 | 1.09 | % | 6.15 | % | 2.16 | % | 74.39 | % | |||||||||||
| 10.01 | % | 170 | 1.15 | % | 6.37 | % | 1.97 | % | 130.94 | % | ||||||||||||
| 6.28 | % | 71 | 1.05 | % | 7.30 | % | 2.09 | % | 80.40 | % | ||||||||||||
| 0.83 | % | 123 | 1.80 | % | 5.45 | % | 2.87 | % | 74.39 | % | ||||||||||||
| 9.44 | % | 144 | 1.80 | % | 5.58 | % | 2.62 | % | 130.94 | % | ||||||||||||
| 5.71 | % | 57 | 1.80 | % | 6.35 | % | 2.84 | % | 80.40 | % | ||||||||||||
| 1.33 | % | 18 | 1.30 | % | 5.92 | % | 2.38 | % | 74.39 | % | ||||||||||||
| 9.86 | % | 12 | 1.30 | % | 6.06 | % | 2.12 | % | 130.94 | % | ||||||||||||
| 6.20 | % | 11 | 1.30 | % | 6.83 | % | 2.34 | % | 80.40 | % | ||||||||||||
| 1.92 | % | 12 | 0.80 | % | 6.44 | % | 1.87 | % | 74.39 | % | ||||||||||||
| 10.54 | % | 12 | 0.80 | % | 6.57 | % | 1.62 | % | 130.94 | % | ||||||||||||
| 6.45 | % | 11 | 0.80 | % | 7.33 | % | 1.84 | % | 80.40 | % | ||||||||||||
| 1.92 | % | 9,243 | 0.80 | % | 6.39 | % | 1.88 | % | 74.39 | % | ||||||||||||
| 10.54 | % | 12,127 | 0.80 | % | 6.57 | % | 1.62 | % | 130.94 | % | ||||||||||||
| 6.45 | % | 16,907 | 0.80 | % | 7.40 | % | 1.84 | % | 80.40 | % | ||||||||||||
| (e) | During the period, certain fees were waived and/or reimbursed. If such waivers/reimbursements had not occurred, the ratios would have been as indicated. |
| (f) | Portfolio turnover is calculated on the basis of the Fund as a whole without distinguishing among the classes of shares. |
| (g) | For the period from February 27, 2012 (commencement of operations) through October 31, 2012. |
2014 Annual Report
99
Table of Contents
Financial Highlights (continued)
Selected Data for Each Share of Capital Outstanding Throughout the Periods Indicated
Aberdeen Tax-Free Income Fund
| Investment Activities | Distributions | |||||||||||||||||||||||||||||||
| Net Asset Value, Beginning of Period | Net Investment Income (a) | Net Realized and Unrealized Gains (Losses) on Invest- ments | Total from Invest- ment Activities | Net Invest- ment Income | Net Realized Gains | Total Distri- butions | Net Asset Value, End of Period | |||||||||||||||||||||||||
Class A Shares | ||||||||||||||||||||||||||||||||
Year Ended October 31, 2014 | $ | 10.24 | $ | 0.32 | $ | 0.29 | $ | 0.61 | $ | (0.32 | ) | $ | (0.15 | ) | $ | (0.47 | ) | $ | 10.38 | |||||||||||||
Year Ended October 31, 2013 | 10.86 | 0.32 | (0.53 | ) | (0.21 | ) | (0.32 | ) | (0.09 | ) | (0.41 | ) | 10.24 | |||||||||||||||||||
Year Ended October 31, 2012 | 10.32 | 0.34 | 0.55 | 0.89 | (0.34 | ) | (0.01 | ) | (0.35 | ) | 10.86 | |||||||||||||||||||||
Year Ended October 31, 2011 | 10.37 | 0.35 | (0.03 | ) | 0.32 | (0.35 | ) | (0.02 | ) | (0.37 | ) | 10.32 | ||||||||||||||||||||
Year Ended October 31, 2010 | 10.06 | 0.39 | 0.27 | 0.66 | (0.35 | ) | – | (0.35 | ) | 10.37 | ||||||||||||||||||||||
Class C Shares | ||||||||||||||||||||||||||||||||
Year Ended October 31, 2014 | 10.23 | 0.24 | 0.29 | 0.53 | (0.24 | ) | (0.15 | ) | (0.39 | ) | 10.37 | |||||||||||||||||||||
Year Ended October 31, 2013 | 10.85 | 0.25 | (0.54 | ) | (0.29 | ) | (0.24 | ) | (0.09 | ) | (0.33 | ) | 10.23 | |||||||||||||||||||
Year Ended October 31, 2012 | 10.31 | 0.26 | 0.55 | 0.81 | (0.26 | ) | (0.01 | ) | (0.27 | ) | 10.85 | |||||||||||||||||||||
Year Ended October 31, 2011 | 10.34 | 0.27 | (0.01 | ) | 0.26 | (0.27 | ) | (0.02 | ) | (0.29 | ) | 10.31 | ||||||||||||||||||||
Year Ended October 31, 2010 | 10.04 | 0.30 | 0.27 | 0.57 | (0.27 | ) | – | (0.27 | ) | 10.34 | ||||||||||||||||||||||
Class R Shares |
| |||||||||||||||||||||||||||||||
Year Ended October 31, 2014 | 10.25 | 0.30 | 0.30 | 0.60 | (0.30 | ) | (0.15 | ) | (0.45 | ) | 10.40 | |||||||||||||||||||||
Period Ended October 31, 2013(g) | 10.72 | 0.20 | (0.47 | ) | (0.27 | ) | (0.20 | ) | – | (0.20 | ) | 10.25 | ||||||||||||||||||||
Institutional Service Class Shares |
| |||||||||||||||||||||||||||||||
Year Ended October 31, 2014 | 10.25 | 0.35 | 0.30 | 0.65 | (0.35 | ) | (0.15 | ) | (0.50 | ) | 10.40 | |||||||||||||||||||||
Period Ended October 31, 2013(g) | 10.72 | 0.23 | (0.47 | ) | (0.24 | ) | (0.23 | ) | – | (0.23 | ) | 10.25 | ||||||||||||||||||||
Institutional Class Shares(h) | ||||||||||||||||||||||||||||||||
Year Ended October 31, 2014 | 10.25 | 0.35 | 0.30 | 0.65 | (0.35 | ) | (0.15 | ) | (0.50 | ) | 10.40 | |||||||||||||||||||||
Year Ended October 31, 2013 | 10.87 | 0.35 | (0.53 | ) | (0.18 | ) | (0.35 | ) | (0.09 | ) | (0.44 | ) | 10.25 | |||||||||||||||||||
Year Ended October 31, 2012 | 10.33 | 0.37 | 0.55 | 0.92 | (0.37 | ) | (0.01 | ) | (0.38 | ) | 10.87 | |||||||||||||||||||||
Year Ended October 31, 2011 | 10.37 | 0.37 | (0.02 | ) | 0.35 | (0.37 | ) | (0.02 | ) | (0.39 | ) | 10.33 | ||||||||||||||||||||
Year Ended October 31, 2010 | 10.06 | 0.41 | 0.27 | 0.68 | (0.37 | ) | – | (0.37 | ) | 10.37 | ||||||||||||||||||||||
| (a) | Net investment income (loss) is based on average shares outstanding during the period. |
| (b) | Excludes sales charge. |
| (c) | Not annualized for periods less than one year. |
| (d) | Annualized for periods less than one year. |
Amounts listed as “–” are $0 or round to $0.
See accompanying Notes to Financial Statements.
Annual Report 2014
100
Table of Contents
Financial Highlights (continued)
Selected Data for Each Share of Capital Outstanding Throughout the Periods Indicated
Aberdeen Tax-Free Income Fund (concluded)
| Ratios/Supplemental Data | ||||||||||||||||||||||
| Total Return (b)(c) | Net Assets at End of Period (000’s) | Ratio of Expenses to Average Net Assets (d) | Ratio of Net Investment Income to Average Net Assets (d) | Ratio of Expenses (Prior to Reimbursements) to Average Net Assets (d)(e) | Portfolio Turnover (f) | |||||||||||||||||
| 6.12 | % | $ | 9,379 | 0.87 | % | 3.14 | % | 1.00 | % | 5.58 | % | |||||||||||
| (1.93 | %) | 9,477 | 0.88 | % | 3.07 | % | 0.98 | % | 6.11 | % | ||||||||||||
| 8.74 | % | 11,416 | 0.94 | % | 3.18 | % | 0.94 | % | 13.27 | % | ||||||||||||
| 3.20 | % | 10,200 | 0.94 | % | 3.44 | % | 0.94 | % | 11.48 | % | ||||||||||||
| 6.64 | % | 9,879 | 0.93 | % | 3.43 | % | 0.94 | % | 15.29 | % | ||||||||||||
| 5.34 | % | 643 | 1.62 | % | 2.39 | % | 1.75 | % | 5.58 | % | ||||||||||||
| (2.66 | %) | 788 | 1.62 | % | 2.31 | % | 1.73 | % | 6.11 | % | ||||||||||||
| 7.95 | % | 2,410 | 1.68 | % | 2.43 | % | 1.68 | % | 13.27 | % | ||||||||||||
| 2.64 | % | 2,069 | 1.68 | % | 2.69 | % | 1.68 | % | 11.48 | % | ||||||||||||
| 5.77 | % | 2,854 | 1.68 | % | 2.70 | % | 1.69 | % | 15.29 | % | ||||||||||||
| 5.96 | % | 10 | 1.12 | % | 2.89 | % | 1.25 | % | 5.58 | % | ||||||||||||
| (2.53 | %) | 10 | 1.12 | % | 2.82 | % | 1.27 | % | 6.11 | % | ||||||||||||
| 6.49 | % | 17 | 0.62 | % | 3.39 | % | 0.75 | % | 5.58 | % | ||||||||||||
| (2.19 | %) | 10 | 0.62 | % | 3.32 | % | 0.77 | % | 6.11 | % | ||||||||||||
| 6.49 | % | 89,924 | 0.62 | % | 3.38 | % | 0.75 | % | 5.58 | % | ||||||||||||
| (1.67 | %) | 93,692 | 0.62 | % | 3.32 | % | 0.72 | % | 6.11 | % | ||||||||||||
| 9.02 | % | 104,318 | 0.68 | % | 3.43 | % | 0.68 | % | 13.27 | % | ||||||||||||
| 3.57 | % | 102,304 | 0.68 | % | 3.69 | % | 0.68 | % | 11.48 | % | ||||||||||||
| 6.91 | % | 110,180 | 0.68 | % | 3.68 | % | 0.69 | % | 15.29 | % | ||||||||||||
| (e) | During the period, certain fees were waived and/or reimbursed. If such waivers/reimbursements had not occurred, the ratios would have been as indicated. |
| (f) | Portfolio turnover is calculated on the basis of the Fund as a whole without distinguishing among the classes of shares. |
| (g) | For the period from February 25, 2013 (commencement of operations) through October 31, 2013. |
| (h) | Formerly Class D shares. |
2014 Annual Report
101
Table of Contents
Financial Highlights (continued)
Selected Data for Each Share of Capital Outstanding Throughout the Periods Indicated
Aberdeen Ultra-Short Duration Bond Fund
| Investment Activities | Distributions | |||||||||||||||||||||||||||||||
| Net Asset Value, Beginning of Period | Net Investment Income (a) | Net Realized and Unrealized Gains (Losses) on Invest- ments | Total Invest- | Net Invest- ment Income | Net Realized Gains | Total Distri- butions | Net Asset Value, End of Period | |||||||||||||||||||||||||
Class A Shares | ||||||||||||||||||||||||||||||||
Year Ended October 31, 2014 | $ | 9.98 | $ | 0.03 | $ | (0.01 | ) | $ | 0.02 | $ | (0.03 | ) | $ | (0.02 | ) | $ | (0.05 | ) | $ | 9.95 | ||||||||||||
Year Ended October 31, 2013 | 10.09 | 0.04 | (0.03 | ) | 0.01 | (0.04 | ) | (0.08 | ) | (0.12 | ) | 9.98 | ||||||||||||||||||||
Period Ended October 31, 2012(g) | 10.00 | 0.05 | 0.09 | 0.14 | (0.04 | ) | (0.01 | ) | (0.05 | ) | 10.09 | |||||||||||||||||||||
Institutional Service Class Shares | ||||||||||||||||||||||||||||||||
Year Ended October 31, 2014 | 9.97 | 0.05 | (0.02 | ) | 0.03 | (0.06 | ) | (0.02 | ) | (0.08 | ) | 9.92 | ||||||||||||||||||||
Year Ended October 31, 2013 | 10.07 | 0.07 | (0.02 | ) | 0.05 | (0.07 | ) | (0.08 | ) | (0.15 | ) | 9.97 | ||||||||||||||||||||
Period Ended October 31, 2012(h) | 10.00 | 0.06 | 0.07 | 0.13 | (0.06 | ) | – | (0.06 | ) | 10.07 | ||||||||||||||||||||||
Institutional Class Shares | ||||||||||||||||||||||||||||||||
Year Ended October 31, 2014 | 9.97 | 0.05 | (0.02 | ) | 0.03 | (0.06 | ) | (0.02 | ) | (0.08 | ) | 9.92 | ||||||||||||||||||||
Year Ended October 31, 2013 | 10.08 | 0.07 | (0.03 | ) | 0.04 | (0.07 | ) | (0.08 | ) | (0.15 | ) | 9.97 | ||||||||||||||||||||
Year Ended October 31, 2012 | 10.00 | 0.07 | 0.09 | 0.16 | (0.07 | ) | (0.01 | ) | (0.08 | ) | 10.08 | |||||||||||||||||||||
Period Ended October 31, 2011(j) | 10.00 | 0.05 | (0.01 | ) | 0.04 | (0.04 | ) | – | (0.04 | ) | 10.00 | |||||||||||||||||||||
| (a) | Net investment income (loss) is based on average shares outstanding during the period. |
| (b) | Excludes sales charge. |
| (c) | Not annualized for periods less than one year. |
| (d) | Annualized for periods less than one year. |
Amounts listed as “–” are $0 or round to $0.
See accompanying Notes to Financial Statements.
Annual Report 2014
102
Table of Contents
Financial Highlights (concluded)
Selected Data for Each Share of Capital Outstanding Throughout the Periods Indicated
Aberdeen Ultra-Short Duration Bond Fund (concluded)
| Ratios/Supplemental Data | ||||||||||||||||||||||
| Total Return (b)(c) | Net Assets at End of Period (000’s) | Ratio of Expenses to Average Net Assets (d) | Ratio of Net Investment Income to Average Net Asset (d) | Ratio of Expenses (Prior to Reimbursements) to Average Net Assets (d)(e) | Portfolio Turnover (f) | |||||||||||||||||
| 0.22 | % | $ | 110 | 0.65 | % | 0.30 | % | 1.38 | % | 81.59 | % | |||||||||||
| 0.16 | % | 466 | 0.65 | % | 0.44 | % | 1.25 | % | 93.60 | % | ||||||||||||
| 1.40 | % | 374 | 0.65 | % | 0.51 | % | 1.05 | % | 166.04 | % | ||||||||||||
| 0.27 | % | 19 | 0.40 | % | 0.55 | % | 1.13 | % | 81.59 | % | ||||||||||||
| 0.51 | % | 26 | 0.40 | % | 0.71 | % | 1.00 | % | 93.60 | % | ||||||||||||
| 1.28 | %(i) | 26 | 0.40 | % | 0.75 | % | 0.80 | % | 166.04 | % | ||||||||||||
| 0.27 | % | 10,130 | 0.40 | % | 0.54 | % | 1.13 | % | 81.59 | % | ||||||||||||
| 0.41 | %(i) | 13,509 | 0.40 | % | 0.69 | % | 1.00 | % | 93.60 | % | ||||||||||||
| 1.60 | %(i) | 17,927 | 0.40 | % | 0.72 | % | 0.80 | % | 166.04 | % | ||||||||||||
| 0.54 | % | 35,173 | 0.40 | % | 0.52 | % | 0.74 | % | 166.41 | % | ||||||||||||
| (e) | During the period, certain fees were waived and/or reimbursed. If such waivers/reimbursements had not occurred, the ratios would have been as indicated. |
| (f) | Portfolio turnover is calculated on the basis of the Fund as a whole without distinguishing among the classes of shares. |
| (g) | For the period from November 22, 2011 (commencement of operations) through October 31, 2012. |
| (h) | For the period from January 20, 2012 (commencement of operations) through October 31, 2012. |
| (i) | The total return shown above includes the impact of financial statement rounding of the NAV per share and/or financial statement adjustments. |
| (j) | For the period from November 30, 2010 (commencement of operations) to October 31, 2011. |
2014 Annual Report
103
Table of Contents
October 31, 2014
1. Organization
Aberdeen Funds (the “Trust”) was organized as a statutory trust under the laws of the state of Delaware by a Certificate of Trust filed on September 27, 2007 and is registered under the Investment Company Act of 1940, as amended (the “1940 Act”), as an open-end management investment company. As of October 31, 2014, the Trust had authorized an unlimited number of shares of beneficial interest (“shares”) without par value. As of October 31, 2014, the Trust operated twenty-four (24) separate series, or mutual funds, each with its own investment objective(s) and strategies. This report contains the financial statements and financial highlights of the eight (8) funds listed below (each a “Fund”; collectively, the “Funds”):
| – | Aberdeen Asia Bond Fund (“Asia Bond Fund”) |
| – | Aberdeen Core Fixed Income Fund (“Core Fixed Income Fund”) |
| – | Aberdeen Emerging Markets Debt Fund (“Emerging Markets Debt Fund”) |
| – | Aberdeen Emerging Markets Debt Local Currency Fund (“Emerging Markets Debt Local Currency Fund”) |
| – | Aberdeen Global Fixed Income Fund (“Global Fixed Income Fund”) |
| – | Aberdeen High Yield Fund (“High Yield Fund”, formerly the “Aberdeen U.S. High Yield Bond Fund”) |
| – | Aberdeen Tax-Free Income Fund (“Tax-Free Income Fund”) |
| – | Aberdeen Ultra-Short Duration Bond Fund (“Ultra-Short Duration Bond Fund”) |
2. Summary of Significant Accounting Policies
The following is a summary of significant accounting policies followed by the Funds in the preparation of their financial statements. The policies conform to accounting principles generally accepted in the United States of America (“GAAP”). The preparation of financial statements requires management to make estimates and assumptions that affect the reported amounts of assets and liabilities, disclosure of contingent assets and liabilities at the date of the financial statements, and the reported amounts of income and expenses for the period. Actual results could differ from those estimates. The accounting records of the Funds are maintained in U.S. Dollars.
| a. | Security Valuation |
The Funds value their securities at current market value or fair value, consistent with regulatory requirements. “Fair value” is defined in the Trust’s Valuation and Liquidity Procedures as the price that could be received to sell an asset or paid to transfer a liability in an orderly transaction between willing market participants without a compulsion to contract at the measurement date.
Long-term debt and other fixed-income securities are valued at the last quoted or evaluated bid price on the valuation date provided by an independent pricing service provider. If there are no current day bids, the security is valued at the previously applied bid. Short-term debt securities (such as commercial paper, and U.S. treasury bills) having a remaining maturity of 60 days or less are valued at the last quoted or evaluated bid price on the valuation date provided by an independent pricing service, or on the basis of amortized cost if it represents the best approximation for fair value. Debt and other fixed-income securities are generally determined to be Level 2 investments.
Exchange traded derivatives are generally Level 1 investments and over-the-counter derivatives are generally Level 2 investments.
In the event that a security’s market quotations are not readily available or are deemed unreliable (for reasons other than because the foreign exchange on which it trades closed before the close of regular trading on the New York Stock Exchange), the security is valued at fair value as determined by a pricing committee (“Pricing Committee”), taking into account the relevant factors and surrounding circumstances using valuation policies and procedures approved by the Trust’s Board of Trustees. A security that has been fair valued by the Pricing Committee may be classified as Level 2 or 3 depending on the nature of the inputs.
In accordance with the authoritative guidance on fair value measurements and disclosures under GAAP, the Funds disclose the fair value of their investments using a three-level hierarchy that classifies the inputs to valuation techniques used to measure the fair value. The hierarchy assigns Level 1 measurements to valuations based upon unadjusted quoted prices in active markets for identical assets, Level 2 measurements to valuations based upon other significant observable inputs, including adjusted quoted prices in active markets for identical assets, and Level 3 measurements to valuations based upon unobservable inputs that are significant to the valuation. Observable inputs are inputs that reflect the assumptions market participants would use in pricing the asset or liability, which are based on market data obtained from sources independent of the reporting entity. Unobservable inputs are inputs that reflect the reporting entity’s own assumptions about the assumptions market participants would use in pricing the asset or liability developed based on the best information available in the circumstances. A financial instrument’s level within the fair value hierarchy is based upon the lowest level of any input that is significant to the fair value measurement. The three-level hierarchy of inputs is summarized below:
| • | Level 1- quoted prices in active markets for identical investments; |
| • | Level 2- other significant observable inputs (including quoted prices for similar securities, interest rates, prepayment speeds, and credit risk); or |
| • | Level 3- significant unobservable inputs (including a Fund’s own assumptions in determining the fair value of investments). |
Annual Report 2014
104
Table of Contents
Notes to Financial Statements (continued)
October 31, 2014
A summary of standard inputs is listed below:
| Security Type | Standard Inputs | |
Debt and other fixed-income securities | Reported trade data, broker-dealer price quotations, benchmark yields, issuer spreads on comparable securities, credit quality, yield, and maturity. | |
Forward foreign currency contracts | Forward exchange rate quotations. | |
Swap agreements | Market information pertaining to the underlying reference assets, i.e., credit spreads, credit event probabilities, fair values, forward rates, and volatility measures. |
The following is a summary of the inputs used as of October 31, 2014 in valuing the Funds’ investments at fair value. The inputs or methodology used for valuing securities are not necessarily an indication of the risk associated with investing in those securities.
Please refer to the Statements of Investments for a detailed breakout of the security types:
| Investments, at Value | LEVEL 1–Quoted Prices ($) | LEVEL 2–Other Significant Observable Inputs ($) | LEVEL 3–Significant Unobservable Inputs ($) | Total ($) | ||||||||||||
| Aberdeen Asia Bond Fund | ||||||||||||||||
| Investments in Securities | ||||||||||||||||
Corporate Bonds | – | 67,402,460 | – | 67,402,460 | ||||||||||||
Government Bonds | – | 98,100,439 | – | 98,100,439 | ||||||||||||
Government Agencies | – | 31,464,820 | – | 31,464,820 | ||||||||||||
Sovereign Agency | – | 5,320,775 | – | 5,320,775 | ||||||||||||
Repurchase Agreement | – | 26,031,771 | – | 26,031,771 | ||||||||||||
| Assets | ||||||||||||||||
Futures Contracts | 1,234 | – | – | 1,234 | ||||||||||||
Forward Foreign Currency Exchange Contracts | – | 1,797,110 | – | 1,797,110 | ||||||||||||
| Other Financial Instruments | ||||||||||||||||
| Liabilities | ||||||||||||||||
Futures Contracts | (87,295 | ) | – | – | (87,295 | ) | ||||||||||
Forward Foreign Currency Exchange Contracts | – | (1,523,448 | ) | – | (1,523,448 | ) | ||||||||||
|
|
|
|
|
|
|
| |||||||||
| (86,061 | ) | 228,593,927 | – | 228,507,866 | ||||||||||||
|
|
|
|
|
|
|
| |||||||||
| Investments, at Value | LEVEL 1–Quoted Prices ($) | LEVEL 2–Other Significant Observable Inputs ($) | LEVEL 3–Significant Unobservable Inputs ($) | Total ($) | ||||||||||||
| Aberdeen Core Fixed Income Fund | ||||||||||||||||
| Investments in Securities | ||||||||||||||||
Asset-Backed Securities | – | 679,336 | – | 679,336 | ||||||||||||
Commercial Mortgage-Backed Securities | – | 1,610,669 | – | 1,610,669 | ||||||||||||
Residential Mortgage-Backed Securities | – | 2,632,875 | – | 2,632,875 | ||||||||||||
Corporate Bonds | – | 2,917,962 | – | 2,917,962 | ||||||||||||
Municipal Bonds | – | 230,322 | – | 230,322 | ||||||||||||
U.S. Treasuries | – | 3,826,795 | – | 3,826,795 | ||||||||||||
Repurchase Agreement | – | 200,000 | – | 200,000 | ||||||||||||
2014 Annual Report
105
Table of Contents
Notes to Financial Statements (continued)
October 31, 2014
| Investments, at Value | LEVEL 1–Quoted Prices ($) | LEVEL 2–Other Significant Observable Inputs ($) | LEVEL 3–Significant Unobservable Inputs ($) | Total ($) | ||||||||||||
| Aberdeen Core Fixed Income Fund (continued) | ||||||||||||||||
| Other Financial Instruments | ||||||||||||||||
| Liabilities | ||||||||||||||||
Futures Contracts | (3,527 | ) | – | – | (3,527 | ) | ||||||||||
|
|
|
|
|
|
|
| |||||||||
| (3,527 | ) | 12,097,959 | – | 12,094,432 | ||||||||||||
|
|
|
|
|
|
|
| |||||||||
| Investments, at Value | LEVEL 1–Quoted Prices ($) | LEVEL 2–Other Significant Observable Inputs ($) | LEVEL 3–Significant Unobservable Inputs ($) | Total ($) | ||||||||||||
| Aberdeen Emerging Markets Debt Fund | ||||||||||||||||
| Investments in Securities | ||||||||||||||||
Corporate Bonds | – | 5,537,180 | – | 5,537,180 | ||||||||||||
Government Bonds | – | 22,248,148 | – | 22,248,148 | ||||||||||||
Government Agencies | – | 2,385,897 | – | 2,385,897 | ||||||||||||
Repurchase Agreement | – | 519,000 | – | 519,000 | ||||||||||||
| Assets | ||||||||||||||||
Forward Foreign Currency Exchange Contracts | – | 125,334 | – | 125,334 | ||||||||||||
Other Financial Instruments | ||||||||||||||||
| Liabilities | ||||||||||||||||
Forward Foreign Currency Exchange Contracts | – | (38,969 | ) | – | (38,969 | ) | ||||||||||
|
|
|
|
|
|
|
| |||||||||
| – | 30,776,590 | – | 30,776,590 | |||||||||||||
|
|
|
|
|
|
|
| |||||||||
| Investments, at Value | LEVEL 1–Quoted Prices ($) | LEVEL 2–Other Significant Observable Inputs ($) | LEVEL 3–Significant Unobservable Inputs ($) | Total ($) | ||||||||||||
| Aberdeen Emerging Markets Debt Local Currency Fund | ||||||||||||||||
| Investments in Securities | ||||||||||||||||
Corporate Bonds | – | 3,119,781 | – | 3,119,781 | ||||||||||||
Government Bonds | – | 23,238,917 | – | 23,238,917 | ||||||||||||
Government Agencies | – | 3,218,134 | – | 3,218,134 | ||||||||||||
Repurchase Agreement | – | 366,408 | – | 366,408 | ||||||||||||
| Assets | ||||||||||||||||
Forward Foreign Currency Exchange Contracts | – | 149,224 | – | 149,224 | ||||||||||||
| Other Financial Instruments | ||||||||||||||||
| Liabilities | ||||||||||||||||
Forward Foreign Currency Exchange Contracts | – | (191,707 | ) | – | (191,707 | ) | ||||||||||
|
|
|
|
|
|
|
| |||||||||
| – | 29,900,757 | – | 29,900,757 | |||||||||||||
|
|
|
|
|
|
|
| |||||||||
Annual Report 2014
106
Table of Contents
Notes to Financial Statements (continued)
October 31, 2014
| Investments, at Value | LEVEL 1–Quoted Prices ($) | LEVEL 2–Other Significant Observable Inputs ($) | LEVEL 3–Significant Unobservable Inputs ($) | Total ($) | ||||||||||||
| Aberdeen Global Fixed Income Fund | ||||||||||||||||
| Investments in Securities | ||||||||||||||||
Asset-Backed Securities | – | 101,990 | – | 101,990 | ||||||||||||
Commercial Mortgage-Backed Securities | – | 543,044 | – | 543,044 | ||||||||||||
Residential Mortgage-Backed Securities | – | 1,801,832 | – | 1,801,832 | ||||||||||||
Corporate Bonds | – | 9,799,826 | – | 9,799,826 | ||||||||||||
Municipal Bonds | – | 134,199 | – | 134,199 | ||||||||||||
Government Bonds | – | 7,329,389 | – | 7,329,389 | ||||||||||||
U.S. Treasuries | – | 241,365 | – | 241,365 | ||||||||||||
Repurchase Agreement | – | 520,000 | – | 520,000 | ||||||||||||
| Assets | ||||||||||||||||
Futures Contracts | 16,899 | – | – | 16,899 | ||||||||||||
Forward Foreign Currency Exchange Contracts | – | 26,370 | – | 26,370 | ||||||||||||
| Other Financial Instruments | ||||||||||||||||
| Liabilities | ||||||||||||||||
Futures Contracts | (40,131 | ) | – | – | (40,131 | ) | ||||||||||
Forward Foreign Currency Exchange Contracts | – | (70,251 | ) | – | (70,251 | ) | ||||||||||
|
|
|
|
|
|
|
| |||||||||
| (23,232 | ) | 20,427,764 | – | 20,404,532 | ||||||||||||
|
|
|
|
|
|
|
| |||||||||
| Investments, at Value | LEVEL 1–Quoted Prices ($) | LEVEL 2–Other Significant Observable Inputs ($) | LEVEL 3–Significant Unobservable Inputs ($) | Total ($) | ||||||||||||
| Aberdeen High Yield Fund | ||||||||||||||||
| Investments in Securities | ||||||||||||||||
Corporate Bonds | – | 8,745,678 | – | 8,745,678 | ||||||||||||
Repurchase Agreement | – | 2,049,000 | – | 2,049,000 | ||||||||||||
| Assets | ||||||||||||||||
Forward Foreign Currency Exchange Contracts | – | 620 | – | 620 | ||||||||||||
| Other Financial Instruments | ||||||||||||||||
| Liabilities | ||||||||||||||||
Credit Default Swaps | – | (5,279 | ) | – | (5,279 | ) | ||||||||||
|
|
|
|
|
|
|
| |||||||||
| – | 10,790,019 | – | 10,790,019 | |||||||||||||
|
|
|
|
|
|
|
| |||||||||
2014 Annual Report
107
Table of Contents
Notes to Financial Statements (continued)
October 31, 2014
| Investments, at Value | LEVEL 1–Quoted Prices ($) | LEVEL 2–Other Significant Observable Inputs ($) | LEVEL 3–Significant Unobservable Inputs ($) | Total ($) | ||||||||||||
| Aberdeen Tax-Free Income Fund | ||||||||||||||||
| Investments in Securities | ||||||||||||||||
Municipal Bonds | – | 98,444,638 | – | 98,444,638 | ||||||||||||
Repurchase Agreement | – | 390,000 | – | 390,000 | ||||||||||||
|
|
|
|
|
|
|
| |||||||||
| – | 98,834,638 | – | 98,834,638 | |||||||||||||
|
|
|
|
|
|
|
| |||||||||
| Investments, at Value | LEVEL 1–Quoted Prices ($) | LEVEL 2–Other Significant Observable Inputs ($) | LEVEL 3–Significant Unobservable Inputs ($) | Total ($) | ||||||||||||
| Aberdeen Ultra-Short Duration Bond Fund | ||||||||||||||||
| Investments in Securities | ||||||||||||||||
Asset-Backed Securities | – | 630,515 | – | 630,515 | ||||||||||||
Corporate Bonds | – | 8,248,360 | – | 8,248,360 | ||||||||||||
U.S. Agencies | – | 959,971 | – | 959,971 | ||||||||||||
U.S. Treasuries | – | 307,469 | – | 307,469 | ||||||||||||
Other Financial Instruments | ||||||||||||||||
| Liabilities | ||||||||||||||||
Futures Contracts | (2,074 | ) | – | – | (2,074 | ) | ||||||||||
|
|
|
|
|
|
|
| |||||||||
| (2,074 | ) | 10,146,315 | – | 10,144,241 | ||||||||||||
|
|
|
|
|
|
|
| |||||||||
For movements between the Levels within the fair value hierarchy, the Funds have adopted a policy of recognizing transfers at the end of each period. During the year ended October 31, 2014, there were no transfers between Levels.
For the year ended October 31, 2014, there have been no significant changes to the fair valuation methodologies.
| b. | Repurchase Agreements |
The Funds may enter into repurchase agreements under the terms of a Master Repurchase Agreement. It is each Fund’s policy that its custodian/counterparty segregate the underlying collateral securities, the value of which exceeds the principal amount of the repurchase transaction, including accrued interest. The repurchase price generally equals the price paid by a Fund plus interest negotiated on the basis of current short-term rates. To the extent that any repurchase transaction exceeds one business day, the collateral is valued on a daily basis to determine its adequacy. Under the Master Repurchase Agreement, if the counterparty defaults and the value of the collateral declines, or if bankruptcy proceedings are commenced with respect to the counterparty of the security, realization of the collateral by the Funds may be delayed or limited. Repurchase agreements are subject to contractual netting arrangements with the counterparty, Fixed Income Clearing Corp. For additional information on individual repurchase agreements, see the Statements of Investments.
| c. | Restricted Securities |
Restricted securities are privately-placed securities whose resale is restricted under U.S. securities laws. The Funds may invest in restricted securities, including unregistered securities eligible for resale without registration pursuant to Rule 144A and privately-placed securities of U.S. and non-U.S. issuers offered outside the U.S. without registration pursuant to Regulation S under the Securities Act of 1933. Rule 144A securities may be freely traded among certain qualified institutional investors, such as the Funds, but resale of such securities in the U.S. is permitted only in limited circumstances.
| d. | Foreign Currency Translation |
Foreign currency amounts are translated into U.S. Dollars at the current rate of exchange as of the Valuation Time to determine the value of investments, assets and liabilities. Purchases and sales of securities, and income and expenses are translated at the prevailing rate of exchange on the respective date of these transactions. The Funds do not isolate that portion of the results of operations resulting from changes in foreign exchange rates on investments from fluctuations arising from changes in market prices of securities held. These fluctuations are included with the net realized and unrealized gain or loss from investments and foreign currencies within the Statements of Operations.
Annual Report 2014
108
Table of Contents
Notes to Financial Statements (continued)
October 31, 2014
Foreign securities, currencies, and other assets and liabilities denominated in foreign currencies are translated into U.S. Dollars at the exchange rate of said currencies against the U.S. Dollar, as of the Valuation Time, as provided by an independent pricing service.
| e. | Derivative Financial Instruments |
The Funds are authorized to use derivatives to manage currency risk, credit risk, and interest rate risk and to replicate, or use as a substitute for, physical securities. Losses may arise due to changes in the value of the contract or if the counterparty does not perform under the contract. The use of derivative instruments involves, to varying degrees, elements of market risk in excess of the amount recognized in the Statements of Assets and Liabilities.
Forward Foreign Currency Exchange Contracts
A forward foreign currency exchange contract (“forward contract”) involves an obligation to purchase and sell a specific currency at a future date, which may be any fixed number of days from the date of the contract agreed upon by the parties, at a price set at the time of the contract. Forward contracts are used to manage a Fund’s currency exposure in an efficient manner. They are used to sell unwanted currency exposure that comes with holding securities in a market, or to buy currency exposure where the exposure from holding securities is insufficient to give the desired currency exposure either in absolute terms or relative to the benchmark. The use of forward contracts allows the separation of decision-making between markets and their currencies. The forward contract is marked-to-market daily and the change in market value is recorded by a Fund as unrealized appreciation or depreciation. Forward contracts’ prices are received daily from an independent pricing provider. When the forward contract is closed, a Fund records a realized gain or loss equal to the difference between the value at the time it was opened and the value at the time it was closed. These realized and unrealized gains and losses are reported on the Statements of Operations. During the year, the Funds used forward contracts for the purposes of efficient portfolio management and managing active currency risk relative to the benchmark, the latter of which involves both hedging currency risk and adding currency risk in excess of underlying bond positions.
While a Fund may enter into forward contracts to seek to reduce currency exchange rate risks, transactions in such contracts involve certain risks. A Fund could be exposed to risks if the counterparties to the contracts are unable to meet the terms of their contracts and from unanticipated movements in exchange rates. Thus, while a Fund may benefit from such transactions, unanticipated changes in currency prices may result in a poorer overall performance for a Fund than if it had not engaged in any such transactions. Moreover, there may be imperfect correlation between a Fund’s portfolio holdings or securities quoted or denominated in a particular currency and forward contracts entered into by the Fund. Such imperfect correlation may prevent a Fund from achieving a complete hedge, which will expose the Fund to the risk of foreign exchange loss.
Forward contracts are subject to the risk that the counterparties to such contracts may default on their obligations. Since a forward foreign currency exchange contract is not guaranteed by an exchange or clearing house, a default on the contract would deprive a Fund of unrealized profits, transaction costs or the benefits of a currency hedge or force a Fund to cover its purchase or sale commitments, if any, at the market price at the time of the default.
Futures Contracts
Certain Funds may invest in financial futures contracts (“futures contracts”) for the purpose of hedging their existing portfolio securities, or securities that a Fund intends to purchase, against fluctuations in value caused by changes in prevailing market interest rates or prices. Futures contracts may also be entered into for non-hedging purposes; however, in those instances, the aggregate initial margin and premiums required to establish a Fund’s positions may not exceed 5% of a Fund’s net asset value after taking into account unrealized profits and unrealized losses on any such contract into which it has entered.
Upon entering into a futures contract, a Fund is required to pledge to the broker an amount of cash and/or other assets equal to a certain percentage of the contract amount. This payment is known as “initial margin”. Subsequent payments, known as “variation margin,” are calculated each day, depending on the daily fluctuations in the fair value/market value of the underlying assets. An unrealized gain/(loss) equal to the variation margin is recognized on a daily basis. When the contract expires or is closed, the gain/(loss) is realized and is presented in the Statements of Operations as a net realized gain/(loss) on futures contracts. Futures contracts are valued daily at their last quoted sale price on the exchange on which they are traded.
A “sale” of a futures contract means a contractual obligation to deliver the securities or foreign currency called for by the contract at a fixed price at a specified time in the future. A “purchase” of a futures contract means a contractual obligation to acquire the securities or foreign currency at a fixed price at a specified time in the future.
During the year, futures contracts were used to manage interest rate risk and raise the efficiency of one or more Funds. The Asia Bond Fund used futures contracts specifically to manage interest rate risk in Korea as well as to hedge duration risk with respect to the U.S. Dollar credit portfolio.
2014 Annual Report
109
Table of Contents
Notes to Financial Statements (continued)
October 31, 2014
There are significant risks associated with a Fund’s use of futures contracts, including the following: (1) the success of a hedging strategy may depend on the ability of a Fund’s investment adviser and/or sub-adviser to predict movements in the prices of individual securities, fluctuations in markets and movements in interest rates; (2) there may be an imperfect or no correlation between the movement in the price of futures contracts, interest rates and the value/market value of the securities held by a Fund; (3) there may not be a liquid secondary market for a futures contract; (4) trading restrictions or limitations may be imposed by an exchange; and (5) government regulations may restrict trading in futures contracts. In addition, should market conditions change unexpectedly, a Fund may not achieve the anticipated benefits of the futures contracts and may realize a loss.
Swaps
Certain Funds enter into swaps to efficiently gain or hedge interest rate or currency risk. A swap is an agreement that obligates two parties to exchange a series of cash flows at specified intervals based upon or calculated by reference to changes in specified prices or rates for a specified amount of an underlying asset or notional principal amount. A Fund will enter into swaps only on a net basis, which means that the two payment streams are netted out, with a Fund receiving or paying, as the case may be, only the net amount of the difference between the two payments. Risks may arise as a result of the failure of the counterparty to the swap contract to comply with the terms of the swap contract. The loss incurred by the failure of a counterparty is generally limited to the net interest payment to be received by a Fund, and/or the termination value at the end of the contract. Therefore, a Fund considers the creditworthiness of each counterparty to a swap contract in evaluating potential credit risk. Additionally, risks may arise from unanticipated movements in interest rates or in the value of the underlying reference asset or index. A Fund records unrealized gains/(losses) on a daily basis representing the value and the current net receivable or payable relating to open swap contracts. Net amounts received or paid on the swap contract are recorded as realized gains/(losses). Fluctuations in the value of swap contracts are recorded for financial statement purposes as unrealized appreciation or depreciation of swap contracts. Realized gains/(losses) from terminated swaps are included in net realized gains/(losses) on swap contracts transactions.
Certain Funds are a party to International Swap and Derivatives Association, Inc. Master Agreements (“ISDA Master Agreements”). These agreements are with select counterparties and they govern transactions, including certain over-the-counter derivative and foreign exchange contracts, entered into by certain Funds and the counterparty. The ISDA Master Agreements maintain provisions for general obligations, representations, agreements, collateral, and events of default or termination. The occurrence of a specified event of termination may give a counterparty the right to terminate all of its contracts and affect settlement of all outstanding transactions under the applicable ISDA Master Agreement. To the extent a Fund engages in transactions under these agreements, it is subject to counterparty risk, which is described with respect to swaps both above and below.
Effective June 10, 2013, certain swaps, including interest rate swaps, must be cleared pursuant to U.S. Commodity Futures Trading Commission (“CFTC”) regulations. As a result, interest rate swaps entered into by a Fund after June 10, 2013 can no longer be traded over-the-counter and became subject to various regulations and rules of the CFTC. Entering into swap agreements involves, to varying degrees, elements of credit, market and interest risk in excess of the amounts reported on the Statement of Assets and Liabilities. Such risks involve the possibility that there will be no liquid market for these agreements, that the counterparty to the agreements may default on its obligation to perform and that there may be unfavorable changes in the value of the index or securities underlying the agreement. The Funds’ maximum risk of loss from counterparty risk related to swaps is the fair value of the contract. This risk is mitigated by having a master netting agreement between the Funds and the counterparties and by the posting of collateral by the counterparties to the Funds to cover the Funds’ exposure to the counterparty. A Fund must also segregate liquid assets to “cover” its obligations under the swap.
Credit Default Swaps
A credit default swap is a credit derivative contract between two counterparties. The buyer makes periodic payments to the seller, and in return receives protection if an underlying financial instrument defaults. A Fund might use credit default swap contracts to limit or to reduce risk exposure of the Fund to defaults of corporate and sovereign issues (i.e., to reduce risk when the Fund owns or has exposure to such issuers). A Fund also might use credit default swap contracts to create direct or synthetic short or long exposure to domestic or foreign corporate debt securities or certain sovereign debt securities to which the Fund is not otherwise exposed. As the seller in a credit default swap contract, a Fund would be required to pay the par (or other agreed-upon) value of a referenced debt obligation to the counterparty in the event of a default (or similar event) by a third party, such as a U.S. or foreign issuer, on the debt obligation. In return, a Fund would receive from the counterparty a periodic stream of payments over the term of the contract, provided that no event of default (or similar event) occurs. If no event of default (or similar event) occurs, a Fund would keep the stream of payments and would have no payment of obligations. As the seller in a credit default swap contract, a Fund effectively would add economic leverage to its portfolio because, in addition to its total net assets, a Fund would be subject to investment exposure on the notional amount of the swap. As the purchaser in a credit default swap contract, a Fund would function as the counterparty referenced in the preceding
Annual Report 2014
110
Table of Contents
Notes to Financial Statements (continued)
October 31, 2014
paragraph. This would involve the risk that the investment might expire worthless. It also would involve credit risk that the seller may fail to satisfy its payment obligations to a Fund in the event of a default (or similar event). As the purchaser in a credit default swap contract, a Fund’s investment would generate income only in the event of an actual default (or similar event) by the issuer of the underlying obligation. During the year, credit default swaps were used in the High Yield Fund to adjust its exposure to the high yield bond sector and/or sell/buy protection on the credit risk of individual issuers. Credit default swaps were also used as a substitute for purchasing or selling securities or for non-hedging purposes to seek to enhance potential gains.
Interest Rate Swaps
Certain Funds may invest in interest rate swap contracts. A Fund uses interest rate swap contracts to manage its exposure to interest rates. Interest rate swap contracts typically represent the exchange between a Fund and a counterparty of respective commitments to make variable rate and fixed rate payments with respect to a notional amount of principal. Swap contracts may have a term of one to ten years, but typically require periodic interim settlement in cash, at which time the specified value of the variable interest rate is reset for the next settlement period. During the period that the swap contract is open, the contract is marked-to-market as the net amount due to or from a Fund in accordance with the terms of the contract based on the closing level of the relevant index or security and interest accrual through the valuation date. Changes in the value of swap contracts are recorded as unrealized gains or losses. Periodic cash settlements on interest rate swaps are recorded as realized gains or losses.
During the year, there was no interest rate swap activity.
Summary of Derivative Instruments
Certain Funds may use derivatives for various purposes as noted above. The following is a summary of the location of fair value amounts of derivatives, not accounted for as hedging instruments, as of October 31, 2014:
| Location on the Statement of Assets and Liabilities | ||||
| Derivative Instrument Risk Type | Asset Derivatives | Liability Derivatives | ||
| Interest Rate Risk | Unrealized appreciation on futures contracts | Unrealized depreciation on futures contracts | ||
| Variation margin receivable for futures contracts | Variation margin payable for futures contracts | |||
| Foreign Exchange Risk | Unrealized appreciation on forward foreign currency exchange contracts | Unrealized depreciation on forward foreign currency exchange contracts | ||
| Credit Risk | Unrealized appreciation on swap contracts | Unrealized depreciation on swap contracts | ||
The following is a summary of the fair value of Derivative Instruments, not accounted for as hedging instruments, as of October 31, 2014:
| Asset Derivatives | ||||||||||||||||
| Funds | Total Value at 10/31/2014 | Credit Default Swaps (credit risk) | Forward Foreign Exchange Contracts (Foreign Exchange Risk) | Futures Contracts (interest rate risk)* | ||||||||||||
Asia Bond Fund | $ | 1,798,344 | $ | – | $ | 1,797,110 | $ | 1,234 | ||||||||
Core Fixed Income Fund | – | – | – | – | ||||||||||||
Emerging Markets Debt Fund | 125,334 | – | 125,334 | – | ||||||||||||
Emerging Markets Debt Local Currency Fund | 149,224 | – | 149,224 | – | ||||||||||||
Global Fixed Income Fund | 43,269 | – | 26,370 | 16,899 | ||||||||||||
High Yield Fund | 620 | – | 620 | – | ||||||||||||
Ultra-Short Duration Bond Fund | – | – | – | – | ||||||||||||
2014 Annual Report
111
Table of Contents
Notes to Financial Statements (continued)
October 31, 2014
| Liability Derivatives | ||||||||||||||||
| Funds | Total Value at 10/31/2014 | Credit Default Swaps (credit risk) | Forward Foreign Exchange Contracts (Foreign Exchange Risk) | Futures Contracts | ||||||||||||
Asia Bond Fund | $ | 1,610,743 | $ | – | $ | 1,523,448 | $ | 87,295 | ||||||||
Core Fixed Income Fund | 3,527 | – | – | 3,527 | ||||||||||||
Emerging Markets Debt Fund | 38,969 | – | 38,969 | – | ||||||||||||
Emerging Markets Debt Local Currency Fund | 191,707 | – | 191,707 | – | ||||||||||||
Global Fixed Income Fund | 110,382 | – | 70,251 | 40,131 | ||||||||||||
High Yield Fund | 5,279 | 5,279 | – | – | ||||||||||||
Ultra-Short Duration Bond Fund | 2,074 | – | – | 2,074 | ||||||||||||
| * | Includes cumulative appreciation/depreciation on futures contracts as reported in the Statement of Investments. Only current day’s variation margin is reported within the Statement of Assets and Liabilities. |
Certain funds have transactions that may be subject to enforceable master netting arrangements. A reconciliation of the gross amounts on the Statement of Assets and Liabilities to the net amounts by broker and derivative type, including any collateral received or pledged, is included in the following tables:
Gross Amounts Not Offset in Statement of Assets and Liabilities | Gross Amounts Not Offset in Statement of Assets and Liabilities | |||||||||||||||||||||||||||||||
| Description | Gross Amounts of Assets Presented in Statement of Financial Position | Financial Instruments | Collateral Received (1) | Net Amount | Gross Amounts of Liabilities Presented in Statement of Financial Position | Financial Instruments | Collateral Received (1) | Net Amount | ||||||||||||||||||||||||
| Assets | Liabilities | |||||||||||||||||||||||||||||||
Asia Bond Fund | ||||||||||||||||||||||||||||||||
Forward foreign currency (2) | ||||||||||||||||||||||||||||||||
Credit Suisse | 215,308 | (44,693 | ) | – | 170,615 | 44,693 | (44,693 | ) | – | – | ||||||||||||||||||||||
Deutsche Bank | 34,405 | (34,405 | ) | – | – | 99,928 | (34,405 | ) | – | 65,523 | ||||||||||||||||||||||
Goldman Sachs | 197,279 | (197,279 | ) | – | – | 718,177 | (197,279 | ) | – | 520,898 | ||||||||||||||||||||||
HSBC | – | – | – | – | 5,563 | – | – | 5,563 | ||||||||||||||||||||||||
Royal Bank of Canada | 259,945 | – | – | 259,945 | – | – | – | – | ||||||||||||||||||||||||
Standard Chartered Bank | – | – | – | – | 4,451 | – | – | 4,451 | ||||||||||||||||||||||||
State Street | 569,095 | (569,095 | ) | – | – | 640,534 | (569,095 | ) | – | 71,439 | ||||||||||||||||||||||
UBS | 521,078 | (10,102 | ) | – | 510,976 | 10,102 | (10,102 | ) | – | – | ||||||||||||||||||||||
Futures (2) | ||||||||||||||||||||||||||||||||
UBS | 1,234 | (1,234 | ) | – | – | 87,295 | (1,234 | ) | (86,061 | ) | – | |||||||||||||||||||||
Core Fixed Income | ||||||||||||||||||||||||||||||||
Futures (2) | ||||||||||||||||||||||||||||||||
UBS | – | – | – | – | 3,527 | – | (3,527 | ) | – | |||||||||||||||||||||||
Annual Report 2014
112
Table of Contents
Notes to Financial Statements (continued)
October 31, 2014
Gross Amounts Not Offset in Statement of Assets and Liabilities | Gross Amounts Not Offset in Statement of Assets and Liabilities | |||||||||||||||||||||||||||||||
| Description | Gross Amounts of Assets Presented in Statement of Financial Position | Financial Instruments | Collateral Received (1) | Net Amount | Gross Amounts of Liabilities Presented in Statement of Financial Position | Financial Instruments | Collateral Received (1) | Net Amount | ||||||||||||||||||||||||
| Assets | Liabilities | |||||||||||||||||||||||||||||||
Emerging Markets Debt Fund | ||||||||||||||||||||||||||||||||
Forward foreign currency (2) | ||||||||||||||||||||||||||||||||
Barclays Bank | 5,709 | – | – | 5,709 | – | – | – | – | ||||||||||||||||||||||||
Citibank | 15,493 | (2,129 | ) | – | 13,364 | 2,129 | (2,129 | ) | – | – | ||||||||||||||||||||||
Goldman Sachs | – | – | – | – | 16,762 | – | – | 16,762 | ||||||||||||||||||||||||
HSBC | – | – | – | – | 610 | – | – | 610 | ||||||||||||||||||||||||
JPMorgan Chase | 101,430 | (19,468 | ) | – | 81,962 | 19,468 | (19,468 | ) | – | – | ||||||||||||||||||||||
UBS | 2,702 | – | – | 2,702 | – | – | – | – | ||||||||||||||||||||||||
Emerging Markets Debt Local Currency Fund | ||||||||||||||||||||||||||||||||
Forward foreign currency (2) | ||||||||||||||||||||||||||||||||
Barclays Bank | 4,556 | (4,556 | ) | – | – | 43,569 | (4,556 | ) | – | 39,013 | ||||||||||||||||||||||
Citibank | 11,207 | (11,207 | ) | – | – | 52,035 | (11,207 | ) | – | 40,828 | ||||||||||||||||||||||
Goldman Sachs | 4,914 | (4,914 | ) | – | – | 31,351 | (4,914 | ) | – | 26,437 | ||||||||||||||||||||||
HSBC | 10,284 | (10,284 | ) | – | – | 34,146 | (10,284 | ) | – | 23,862 | ||||||||||||||||||||||
JPMorgan Chase | 96,983 | (8,343 | ) | – | 88,640 | 8,343 | (8,343 | ) | – | – | ||||||||||||||||||||||
UBS | 21,280 | (21,280 | ) | – | – | 22,263 | (21,280 | ) | – | 983 | ||||||||||||||||||||||
Global Fixed Income Fund | ||||||||||||||||||||||||||||||||
Forward foreign currency (2) | ||||||||||||||||||||||||||||||||
Barclays Bank | 594 | (594 | ) | – | – | 47,634 | (594 | ) | – | 47,040 | ||||||||||||||||||||||
Citibank | 7,222 | (706 | ) | – | 6,516 | 706 | (706 | ) | – | – | ||||||||||||||||||||||
Deutsche Bank | 13,776 | (1,309 | ) | – | 12,467 | 1,309 | (1,309 | ) | – | – | ||||||||||||||||||||||
Goldman Sachs | 2,536 | (2,536 | ) | – | – | 18,291 | (2,536 | ) | – | 15,755 | ||||||||||||||||||||||
JPMorgan Chase | – | – | – | – | 875 | – | – | 875 | ||||||||||||||||||||||||
Royal Bank of Canada | 1,919 | – | – | 1,919 | – | – | – | – | ||||||||||||||||||||||||
UBS | 323 | (323 | ) | – | – | 1,436 | (323 | ) | – | 1,113 | ||||||||||||||||||||||
Futures (2) | ||||||||||||||||||||||||||||||||
UBS | 16,899 | (16,899 | ) | – | – | 40,131 | (16,899 | ) | (23,232 | ) | – | |||||||||||||||||||||
High Yield Fund | ||||||||||||||||||||||||||||||||
Forward foreign currency (2) | ||||||||||||||||||||||||||||||||
UBS | 620 | – | – | 620 | – | – | – | – | ||||||||||||||||||||||||
Credit Default Swaps (2) | ||||||||||||||||||||||||||||||||
Deutsche Bank | – | – | – | – | 5,279 | – | – | 5,279 | ||||||||||||||||||||||||
Ultra-Short Duration Bond Fund | ||||||||||||||||||||||||||||||||
Futures (2) | ||||||||||||||||||||||||||||||||
UBS | – | – | – | – | 2,074 | – | (2,074 | ) | – | |||||||||||||||||||||||
| (1) | In some instances, the actual collateral received and/or pledged may be more than the amount shown here due to overcollateralization. |
| (2) | Includes financial instrument (forwards and futures) which are not subject to master netting arrangement, or other another similar arrangement. |
2014 Annual Report
113
Table of Contents
Notes to Financial Statements (continued)
October 31, 2014
The following is a summary of the location of realized gain/(loss) and net change in unrealized appreciation/depreciation on derivatives in the Statement of Operations for the year ended October 31, 2014:
Location on the Statement of Operations Derivative Instrument Risk Type | ||
Interest Rate Risk | Realized gain/(loss) on future contracts transactions Net change in unrealized appreciation/depreciation on futures contracts | |
Foreign Exchange Risk | Realized gain/(loss) on foreign currency transactions Net change in unrealized appreciation/depreciation on foreign currency transactions | |
Credit Risk | Realized gain/(loss) on swap contracts Net change in unrealized appreciation/depreciation on swap contracts | |
The following is a summary of the effect of derivative instruments on the Statement of Operations for the year ended October 31, 2014:
Realized Gain or (Loss) on Derivatives Recognized in the Statement of Operations | ||||||||||||||||
| Total | Credit Default Swaps (credit risk) | Forward Foreign Exchange Contracts (Foreign Exchange Risk) | Futures Contracts (interest rate risk)* | |||||||||||||
Asia Bond Fund | $ | (3,279,717 | ) | $ | – | $ | (1,291,940 | ) | $ | (1,987,777 | ) | |||||
Core Fixed Income Fund | 34,203 | – | – | 34,203 | ||||||||||||
Emerging Markets Debt Fund | 25,286 | – | 25,286 | – | ||||||||||||
Emerging Markets Debt Local Currency Fund | 259,106 | – | 259,106 | – | ||||||||||||
Global Fixed Income Fund | 13,010 | – | 44,562 | (31,552 | ) | |||||||||||
High Yield Fund | (37,290 | ) | (43,291 | ) | 6,001 | – | ||||||||||
Ultra-Short Duration Bond Fund | (9,488 | ) | – | – | (9,488 | ) | ||||||||||
| Change in Unrealized Appreciation (Depreciation) on Derivatives Recognized in the Statement of Operations | ||||||||||||||||
| Total | Credit Default Swaps (credit risk) | Forward Foreign Exchange Contracts (Foreign Exchange Risk) | Futures Contracts (interest rate risk)* | |||||||||||||
Asia Bond Fund | $ | 1,413,988 | $ | – | $ | 529,899 | $ | 884,089 | ||||||||
Core Fixed Income Fund | 9,277 | – | – | 9,277 | ||||||||||||
Emerging Markets Debt Fund | 99,007 | – | 99,007 | – | ||||||||||||
Emerging Markets Debt Local Currency Fund | (304,037 | ) | – | (304,037 | ) | – | ||||||||||
Global Fixed Income Fund | (64,018 | ) | – | (59,655 | ) | (4,363 | ) | |||||||||
High Yield Fund | 31,825 | 31,634 | 191 | – | ||||||||||||
Ultra-Short Duration Bond Fund | (2,074 | ) | – | – | (2,074 | ) | ||||||||||
Annual Report 2014
114
Table of Contents
Notes to Financial Statements (continued)
October 31, 2014
Information about derivatives reflected as of the date of this report is generally indicative of the type of activity for the year ended October 31, 2014. The table below summarizes the weighted average values of derivatives holdings by fund during the year ended October 31, 2014.
| Fund | Forward foreign exchange contracts (Average Notional Value) | Futures contracts (Average Notional Value) | Swap contracts (Average Notional Value) | |||||||||
Asia Bond Fund | $189,247,498 | $(35,708,333 | ) | $ – | ||||||||
Core Fixed Income Fund | – | (1,425,000 | ) | – | ||||||||
Emerging Markets Debt Fund | 4,270,516 | – | – | |||||||||
Emerging Markets Debt Local Currency Fund | 20,916,532 | – | – | |||||||||
Global Fixed Income Fund | 6,548,125 | (1,375,493 | ) | – | ||||||||
High Yield Fund | 320,212 | – | 433,333 | |||||||||
Ultra-Short Duration Bond Fund | – | (1,241,667 | ) | – | ||||||||
| f. | Credit-Linked Notes |
The Asia Bond Fund invests in credit-linked securities, which are unstructured, unleveraged pass-through vehicles to an underlying security denominated in a local currency, used for the purposes of efficiently managing access to the market and interest rate risk. For instance, the Fund may invest in credit-linked securities as a cash management tool in order to gain exposure to a certain market and/or to remain fully invested when more traditional income producing securities are not available. Like an investment in a bond, investments in credit-linked securities represent the right to receive periodic income payments (in the form of distributions) and payment of principal at the end of the term of the security. However, these payments are conditioned on the issuer’s receipt of payments from, and the issuer’s potential obligations to, the counterparties to the derivative instruments and other securities in which the issuer invests. For instance, the issuer may sell one or more credit default swaps, under which the issuer would receive a stream of payments over the term of the swap agreements provided that no event of default has occurred with respect to the referenced debt obligation upon which the swap is based. If a default occurs, the stream of payments may stop and the issuer would be obligated to pay the counterparty the par value (or other agreed upon value) of the referenced debt obligation. This, in turn, would reduce the amount of income and principal that the Fund would receive. A Fund’s investments in these instruments are indirectly subject to the risks associated with derivative instruments, including, among others, credit risk, default or similar event risk, counterparty risk, interest rate risk, leverage risk and management risk. It is also expected that the securities will be exempt from registration under the 1933 Act. Accordingly, there may be no established trading market for the securities and they may constitute illiquid investments.
| g. | Mortgage Dollar Rolls |
Certain Funds may invest in mortgage dollar rolls. Mortgage dollar rolls are arrangements in which a Fund would sell mortgage-backed securities for delivery in the current month and simultaneously contract to purchase substantially similar (same type, coupon, and maturity) securities on a specified future date. During the roll period, the Fund forgoes principal and interest paid on the mortgage-backed securities. The Fund could potentially receive gains on the difference between the current sales price and the lower price for the future purchase as well as any interest earned on the proceeds of the initial sale. At the time the Fund enters into a mortgage dollar roll, it would set aside permissible liquid assets in a segregated account to secure its obligation for the forward commitment to buy mortgage-backed securities.
Depending on whether the segregated assets are cash equivalent or some other type of security, entering into mortgage dollar rolls may subject the Fund to additional interest rate sensitivity. For accounting purposes, any gain or loss is considered unrealized until the roll reaches completion. Mortgage dollar roll investments entail risks related to the potential inability of counterparties to complete the transaction, which may be heightened because of the delayed payment date.
| h. | Security Transactions, Investment Income and Expenses |
Security transactions are recorded on the trade date. Realized and unrealized gains/(losses) from security and currency transactions are calculated on the identified cost basis. Dividend income is recorded on the ex-dividend date except for certain dividends on foreign securities, which are recorded as soon as a Fund is informed after the ex-dividend date.
Interest income and expenses are recorded on an accrual basis. Expenses directly attributable to a Fund are charged to that Fund. Expenses not directly attributable to a Fund are allocated proportionately among the relevant Funds based on net assets of each. For each of the Funds, the method for allocating income, fund level expenses, and realized and unrealized gains or losses to a class is based on the total net asset value of that class’s shares in proportion to the total net assets of the relevant Fund. Expenses specific to a class (such as Rule 12b-1 and administrative services fees) are charged to that class.
2014 Annual Report
115
Table of Contents
Notes to Financial Statements (continued)
October 31, 2014
| i. | Distributions |
Distributions from net investment income, if any, are declared and paid quarterly for the Asia Bond Fund, the Emerging Markets Debt Fund, the Emerging Markets Debt Local Currency Fund and the Global Fixed Income Fund. Distributions from net investment income are declared and paid monthly for the High Yield Fund. Distributions from net investment income are declared daily and paid monthly for the Core Fixed Income Fund, the Tax-Free Income Fund and the Ultra-Short Duration Bond Fund. The Funds will also declare and pay distributions at least annually from net realized gains on investment transactions and net realized foreign exchange gains, if any. Dividends and distributions to shareholders are recorded on the ex-dividend date.
Dividends and distributions to shareholders are determined in accordance with federal income tax regulations, which may differ from GAAP. These differences are primarily due to differing treatments for foreign currencies and loss deferrals.
| j. | Federal Income Taxes |
Each Fund intends to continue to qualify as a “regulated investment company” by complying with the provisions available to certain investment companies, as defined in Subchapter M of the Internal Revenue Code of 1986, as amended, and to make distributions of net investment income and net realized capital gains sufficient to relieve the Funds from all federal income taxes. Therefore, no federal income tax provision is required.
Management of the Funds has concluded that there are no significant uncertain tax positions that would require recognition in the financial statements. Since tax authorities can examine previously filed tax returns, the Funds’ U.S. federal and state tax returns for each of the four fiscal years up to the most recent fiscal year ended October 31 are subject to such review.
3. Agreements and Transactions with Affiliates
| a. | Investment Adviser |
Under the Investment Advisory Agreement with the Trust, Aberdeen Asset Management Inc. (“Aberdeen” or the “Adviser”) manages the Funds in accordance with the policies and procedures established by the Board.
For services provided under the terms of the current Investment Advisory Agreement, each Fund pays the Adviser an annual management fee paid monthly based on that Fund’s average daily net assets according to the following schedule:
| Fund | Fee Schedule | |||||||
Asia Bond Fund | On all assets | 0.500% | ||||||
Core Fixed Income Fund | Up to $2 billion | 0.300% | ||||||
| $2 billion up to $5 billion | 0.275% | |||||||
| On $5 billion and more | 0.250% | |||||||
Emerging Markets Debt Fund | Up to $500 million | 0.750% | ||||||
| On $500 million and more | 0.700% | |||||||
Emerging Markets Debt Local Currency Fund | Up to $500 million | 0.800% | ||||||
| On $500 million and more | 0.750% | |||||||
Global Fixed Income Fund | Up to $500 million | 0.600% | ||||||
| $500 million up to $1 billion | 0.550% | |||||||
| On $1 billion and more | 0.500% | |||||||
High Yield Fund | Up to $500 million | 0.600% | ||||||
| $500 million and more | 0.550% | |||||||
Tax-Free Income Fund | Up to $250 million | 0.425% | ||||||
| $250 million up to $1 billion | 0.375% | |||||||
| On $1 billion and more | 0.355% | |||||||
Ultra-Short Duration Bond Fund | On all assets | 0.200% | ||||||
The Adviser has engaged the services of affiliates Aberdeen Asset Management Asia Limited (“AAMAL”) and Aberdeen Asset Managers Limited (“AAML”) as subadvisers (the “Subadvisers”) pursuant to subadvisory agreements. Subadvisers manage a portion of certain Funds’ investments and have the responsibility for making all investment decisions for the portion of a Fund’s assets they manage. Pursuant to the
Annual Report 2014
116
Table of Contents
Notes to Financial Statements (continued)
October 31, 2014
subadvisory agreements, the Adviser pays fees to the Subadvisers, if any. For the year ended October 31, 2014, the Adviser paid the following amounts to the following Subadvisers:
| Fund | Subadviser | Amount | ||||||
Asia Bond Fund | AAMAL | $ | 699,870 | |||||
Emerging Markets Debt Fund | AAML | 98,139 | ||||||
Emerging Markets Debt Local Currency Fund | AAML | 219,209 | ||||||
Global Fixed Income Fund | AAML | 85,539 | ||||||
The Trust and Aberdeen have entered into a written contract (“Expense Limitation Agreement”) limiting operating expenses for all classes of the Funds from exceeding the amounts listed below. This limit excludes certain expenses, including any taxes, interest, brokerage fees, short sale dividend expenses, Acquired Fund Fees and Expenses, Rule 12b-1 fees, administrative services fees and extraordinary expenses. This contract is in effect at least through February 28, 2015 or the effective date of the 2015 annual update to the registration statement, whichever occurs first.
| Fund | Limit | |||
Asia Bond Fund | 0.70% | |||
Core Fixed Income Fund | 0.50% | |||
Emerging Markets Debt Fund | 0.90% | |||
Emerging Markets Debt Local Currency Fund | 0.90% | |||
Global Fixed Income Fund | 0.85% | |||
High Yield Fund | 0.80% | |||
Tax-Free Income Fund | 0.62% | |||
Ultra-Short Duration Bond Fund | 0.40% | |||
Aberdeen may request and receive reimbursement from a Fund of the advisory fees waived and other expenses reimbursed pursuant to the Expense Limitation Agreement at a later date not to exceed three years from the fiscal year in which the corresponding reimbursement to the Funds was made. However, no reimbursement will be made for fees waived prior to March 1, 2011 (July 20, 2011 for the Asia Bond Fund and December 1, 2011 for the Core Fixed Income Fund and Ultra-Short Duration Bond Fund) unless:
(i) the Fund’s assets exceed $100 million;
(ii) the total annual expense ratio of the class making such reimbursement is less than the limit set forth above; and
(iii) the payment of such reimbursement is approved by the Board on a quarterly basis (the “Reimbursement Requirements”).
For fees waived after March 1, 2011, no reimbursement will be made for fees waived prior to March 1, 2011 (July 20, 2011 for the Asia Bond Fund and December 1, 2011 for the Core Fixed Income Fund and Ultra-Short Duration Bond Fund) unless:
(i) the total annual expense ratio of the class making such reimbursement is less than the limit set forth above; and
(ii) the payment of such reimbursement is approved by the Board on a quarterly basis (the “Reimbursement Requirements”).
If the Board approves any changes in the waiver terms or limitations, reimbursements are only permitted to the extent that the terms of the Expense Limitation Agreement in effect at the time of the waiver are met at the time that reimbursement is approved. Except as provided for in the Expense Limitation Agreement, reimbursement of amounts previously waived or assumed by Aberdeen is not permitted.
2014 Annual Report
117
Table of Contents
Notes to Financial Statements (continued)
October 31, 2014
As of October 31, 2014, to the extent the Reimbursement Requirements are met, the cumulative potential reimbursements for each Fund, based on expenses reimbursed by Aberdeen would be:
| Fund | Amount Fiscal Year 2012 (Expires 10/31/15) | Amount Fiscal Year 2013 (Expires 10/31/16) | Amount Fiscal Year 2014 (Expires 10/31/17) | Total* | ||||||||||||
Asia Bond Fund | $ | 202,438 | $ | 329,370 | $ | 205,651 | $ | 737,459 | ||||||||
Core Fixed Income Fund | 105,988 | 159,461 | 156,627 | 422,076 | ||||||||||||
Emerging Markets Debt Fund | – | 141,054 | 141,808 | 282,862 | ||||||||||||
Emerging Markets Debt Local Currency Fund | 269,869 | 188,513 | 196,473 | 654,855 | ||||||||||||
Global Fixed Income Fund | 96,679 | 128,477 | 133,386 | 358,542 | ||||||||||||
High Yield Fund | 101,197 | 140,020 | 118,215 | 359,432 | ||||||||||||
Tax-Free Income Fund | – | 111,413 | 134,346 | 245,759 | ||||||||||||
Ultra-Short Duration Bond Fund | 133,723 | 93,213 | 98,801 | 325,737 | ||||||||||||
| * | Amounts reported are due to expire throughout the respective 3-year expiration period presented above. |
Amounts listed as “–” are $0 or round to $0.
In accordance with the Funds’ Expense Limitation Agreement and criteria, as described above, the Adviser did not recapture any expenses for which it previously reimbursed the Funds. Accordingly, at October 31, 2014, the Funds did not have liabilities payable to the Adviser for recapture of previously reimbursed expenses.
| b. | Fund Administration |
Under the terms of the Fund Administration Agreement in effect during the period, Aberdeen provides various administrative and accounting services, including daily valuation of the Funds’ shares, preparation of financial statements, tax returns, regulatory reports, and presentation of quarterly reports to the Board. For services provided pursuant to the Fund Administration Agreement, the Funds pay Aberdeen a combined annual fee of 0.08% based on the Trust’s average daily net assets. The fee is then allocated proportionately among all funds within the Trust (including the Funds) in relation to the average daily net assets of each fund. This asset-based fee is subject to a per fund annual minimum fee.
| c. | Distributor |
The Trust and Aberdeen Fund Distributors, LLC (the “Distributor” or “AFD”) are parties to the current Underwriting Agreement (the “Underwriting Agreement”) whereby the Distributor acts as principal underwriter for the Trust’s shares.
The Trust has adopted a Distribution Plan (the “Plan”) pursuant to Rule 12b-1 under the 1940 Act with respect to certain classes of shares. The Plan permits the Funds to compensate AFD, as the Funds’ Distributor, for expenses associated with the distribution of certain classes of shares of the Funds of the Trust. Although actual distribution expenses may be more or less, under the Plan, the Funds of the Trust pay the Distributor an annual fee in an amount that will not exceed the following amounts:
| Fund | Class A Shares | Class C Shares (a) | Class R Shares (a) | |||||||||
Asia Bond Fund | 0.25% | 1.00% | 0.50% | |||||||||
Core Fixed Income Fund | 0.25% | 1.00% | 0.50% | |||||||||
Emerging Markets Debt Fund | 0.25% | 1.00% | 0.50% | |||||||||
Emerging Markets Debt Local Currency Fund | 0.25% | 1.00% | 0.50% | |||||||||
Global Fixed Income Fund | 0.25% | 1.00% | 0.50% | |||||||||
High Yield Fund | 0.25% | 1.00% | 0.50% | |||||||||
Tax-Free Income Fund | 0.25% | 1.00% | 0.50% | |||||||||
Ultra-Short Duration Bond Fund | 0.25% | 1.00% | 0.50% | |||||||||
| (a) | 0.25% of which is service fees. |
The Adviser or an affiliate of the Adviser may pay additional amounts from its own resources to dealers or other financial intermediaries, for aid in distribution or for aid in providing administrative services to shareholders.
Annual Report 2014
118
Table of Contents
Notes to Financial Statements (continued)
October 31, 2014
Pursuant to the current Underwriting Agreement, the Distributor will also receive the proceeds of contingent deferred sales charges (“CDSCs”) of 1% imposed on certain redemptions of Class C (and up to 1% for certain Class A) shares.
In addition, the Distributor will re-allow to dealers 3.75% of sales charges on Class A shares of the Funds, which have a maximum front-end sales charge of 4.25%, and the Distributor or Adviser may compensate broker dealers or financial intermediaries for sales of Class C shares from its own resources at the rate of 1.00% on sales of Class C shares, which have a maximum CDSC of 1.00%, (on the deferred sales charge assessed on sales within one year of purchase). For the year ended October 31, 2014, AFD retained commissions of $2,830 from front-end sales charges of Class A shares and $866 from CDSC fees from Class C (and certain Class A) shares of the Funds.
Under the terms of the current Administrative Services Plan, a series of the Trust is permitted to enter into Servicing Agreements with servicing organizations, such as broker-dealers, and financial institutions, which agree to provide certain administrative support services in connection with the Class A, Class R and Institutional Service Class shares of the series of the Trust (as applicable). These fees are based on an annual rate of up to 0.25% of the average daily net assets of Class A, Class R and Institutional Service Class shares of each of the Funds (as applicable). The amount of expenses incurred under the terms of the Administrative Services Plan during the year ended October 31, 2014 was as follows:
| Fund | Amount | |||
Asia Bond Fund | $ | 25,578 | ||
Core Fixed Income Fund | 696 | |||
Emerging Markets Debt Fund | – | |||
Emerging Markets Debt Local Currency Fund | 5,831 | |||
Global Fixed Income Fund | 29,532 | |||
High Yield Fund | 93 | |||
Tax-Free Income Fund | 59 | |||
Ultra-Short Duration Bond Fund | – | |||
Amounts listed as “–” are $0 or round to $0.
4. Short-Term Trading Fees
Prior to February 28, 2014, the Funds, except the Ultra-Short Duration Bond Fund, assessed a 2.00% redemption fee on all classes of shares that were sold or exchanged within a specified period following purchase (within 15 calendar days for the Core Fixed Income Fund, the Emerging Markets Debt Fund, the Emerging Markets Debt Local Currency Fund and the High Yield Fund, within 30 calendar days for the Asia Bond Fund and the Global Fixed Income Fund and within 7 calendar days for the Tax-Free Income Fund). The redemption fee, if any, was paid directly to the applicable Fund and was designed to offset brokerage commissions and other trading costs, market impact and other costs associated with short-term trading of Fund shares. For purposes of determining whether the redemption fee applied, the shares that were held the longest were redeemed first. This redemption fee was in addition to any CDSCs that were applicable at the time of sale. The redemption fee did not apply in certain circumstances, such as redemptions or exchanges of shares held in certain omnibus accounts or retirement plans that could not implement the redemption fee. The fee did not apply to shares purchased through reinvested dividends or capital gains.
For the year ended October 31, 2014, the Funds had the following contributions to capital due to collection of redemption fees:
| Fund | Class A Shares | Class C Shares | Class R Shares | Institutional Service Class Shares | Institutional Class Shares | |||||||||||||||
Asia Bond Fund | $ | 1 | $ | – | $ | – | $ | 3 | $ | 68 | ||||||||||
Core Fixed Income Fund | – | – | – | – | – | |||||||||||||||
Emerging Markets Debt Fund | – | – | – | – | – | |||||||||||||||
Emerging Markets Debt Local Currency Fund | – | – | – | – | – | |||||||||||||||
Global Fixed Income Fund | 1 | – | – | 10 | 1 | |||||||||||||||
High Yield Fund | – | – | – | – | – | |||||||||||||||
Tax-Free Income Fund | – | – | – | – | – | |||||||||||||||
Ultra-Short Duration Bond Fund | – | – | – | – | – | |||||||||||||||
Amounts listed as “–” are $0 or round to $0.
2014 Annual Report
119
Table of Contents
Notes to Financial Statements (continued)
October 31, 2014
For the year ended October 31, 2013, the Funds had the following contributions to capital due to collection of redemption fees:
| Fund | Class A Shares | Class C Shares | Class D Shares | Class R Shares | Institutional Service Class Shares | Institutional Class Shares | ||||||||||||||||||
Asia Bond Fund | $ | 178 | $ | 24 | $ | – | $ | – | $ | 519 | $ | 12,699 | ||||||||||||
Core Fixed Income Fund | 100 | 69 | – | – | 1 | 2,308 | ||||||||||||||||||
Emerging Markets Debt Fund | – | – | – | – | – | – | ||||||||||||||||||
Emerging Markets Debt Local Currency Fund | – | – | – | – | – | – | ||||||||||||||||||
Global Fixed Income Fund | – | – | – | – | 3 | – | ||||||||||||||||||
High Yield Fund | – | – | – | – | – | – | ||||||||||||||||||
Tax-Free Income Fund | – | – | – | – | – | – | ||||||||||||||||||
Ultra-Short Duration Bond Fund | – | – | – | – | – | – | ||||||||||||||||||
Amounts listed as “–” are $0 or round to $0.
5. Investment Transactions
Purchases and sales of securities (excluding short-term securities) for the year ended October 31, 2014, were as follows:
| Fund | Purchases | Sales | ||||||
Asia Bond Fund | $ | 116,802,266 | $ | 139,719,693 | ||||
Core Fixed Income Fund | 216,293,124 | 296,507,222 | ||||||
Emerging Markets Debt Fund | 34,182,177 | 12,088,729 | ||||||
Emerging Markets Debt Local Currency Fund | 17,791,612 | 30,751,010 | ||||||
Global Fixed Income Fund | 39,037,136 | 40,809,508 | ||||||
High Yield Fund | 7,961,984 | 10,736,451 | ||||||
Tax-Free Income Fund | 5,755,982 | 5,530,525 | ||||||
Ultra-Short Duration Bond Fund | 9,698,071 | 11,288,262 | ||||||
6. Portfolio Investment Risks
| a. | Active Trading Risk |
Certain Funds may engage in active and frequent trading of portfolio securities to achieve its investment objective. If a Fund does trade this way, it may incur increased costs, which can lower the actual return of the Fund.
| b. | Asset-Backed Securities |
Like traditional fixed income securities, the value of asset-backed securities typically increases when interest rates fall and decreases when interest rates rise. Certain asset-backed securities may also be subject to the risk of prepayment.
| c. | Call and Redemption Risk |
Some bonds allow the issuer to call a bond for redemption before it matures. If this happens, a Fund may be required to invest the proceeds in securities with lower yields.
| d. | Credit Risk |
A debt instrument’s price depends, in part, on the credit quality of the issuer, borrower, counterparty, or underlying collateral and can decline in response to changes in the financial condition of the issuer, borrower, counterparty, or underlying collateral, or changes in specific or general market, economic, industry, political, regulatory, geopolitical, or other conditions.
| e. | Corporate Bonds |
Corporate bonds are debt instruments issued by domestic or foreign corporations or similar entities.
| f. | Country/Regional Focus Risk |
Focusing on a single country or geographical region involves increased currency, political, regulatory and other risks. Market swings in the targeted country or geographical region likely will have a greater effect on portfolio performance than they would in a more geographically diversified fund.
Annual Report 2014
120
Table of Contents
Notes to Financial Statements (continued)
October 31, 2014
| g. | Derivatives Risk (including Options, Futures and Swaps) |
Derivatives are speculative and may hurt a Fund’s performance. Derivatives present the risk of disproportionately increased losses and/or reduced opportunities for gains when the financial asset or measure to which the derivative is linked changes in unexpected ways. The potential benefits to be derived from a Fund’s options, futures and derivatives strategy are dependent upon the portfolio managers’ ability to discern pricing inefficiencies and predict trends in these markets, which decisions could prove to be inaccurate. This requires different skills and techniques than predicting changes in the price of individual debt securities, and there can be no assurance that the use of this strategy will be successful.
Speculative Exposure Risk – To the extent that a derivative or practice is not used as a hedge, the Fund is directly exposed to its risks. Gains or losses from speculative positions in a derivative may be much greater than the derivative’s original cost. For example, potential losses from writing uncovered call options and from speculative short sales are unlimited.
Hedged Exposure Risk – Losses generated by a derivative or practice used by the Fund for hedging purposes should be substantially offset by gains on the hedged investment. However, while hedging can reduce or eliminate losses, it can also reduce or eliminate gains.
Correlation Risk – The Fund is exposed to the risk that changes in the value of a hedging instrument will not match those of the investment being hedged.
Counterparty Risk – Derivative transactions depend on the creditworthiness of the counterparty and the counterparty’s ability to fulfill its contractual obligations.
| h. | Emerging Markets Risk |
A magnification of the risks that apply to foreign investments. These risks are greater for securities of companies in emerging market countries because the countries may have less stable governments, more volatile currencies and less established markets (see “Foreign Securities Risk” below).
| i. | Foreign Securities Risk |
Foreign securities may be more volatile, harder to price and less liquid than U.S. securities. Foreign investments also may involve risks relating to the impact of currency exchange rate fluctuations.
Asian Risk. Parts of the Asian region may be subject to a greater degree of economic, political and social instability than is the case in the United States and Europe. Some Asian countries can be characterized as emerging markets or newly industrialized and may experience more volatile economic cycles than developed countries. The developing nature of securities markets in many countries in the Asian region may lead to a lack of liquidity while some countries have restricted the flow of money in and out of the country. Some countries in Asia have historically experienced political uncertainty, corruption, military intervention and social unrest. A Fund may be more volatile than a fund which is broadly diversified geographically.
China Risk. Concentrating investments in China and Hong Kong subjects a Fund to additional risks, and may make it significantly more volatile than geographically diverse mutual funds. Additional risks associated with investments in China and Hong Kong include exposure to currency fluctuations, less liquidity, expropriation, confiscatory taxation, nationalization, exchange control regulations (including currency blockage) and differing legal standards.
| j. | Foreign Government Securities Risk |
Debt securities issued by foreign governments are often supported by the full faith and credit of the foreign governments. These foreign governments may permit their subdivisions, agencies or instrumentalities to have the full faith and credit of the foreign governments. The issuer of foreign government securities may be unwilling or unable to pay interest or repay principal when due. A government entity’s willingness or ability to repay principal and interest due in a timely manner may be affected by a number of political, economic, financial and other factors. A Fund may have limited recourse to compel payment in the event of a default. Periods of economic uncertainty may result in the illiquidity and increased price volatility of a foreign government’s debt securities. A foreign government’s default on its debt securities may cause the value of securities held by a Fund to decline significantly.
| k. | High-Yield Bonds and Other Lower-Rated Securities |
A Fund’s investments in high-yield bonds (commonly referred to as “junk bonds”) and other lower-rated securities will subject the Fund to substantial risk of loss. Investments in high-yield bonds are speculative and issuers of these securities are generally considered to be less financially secure and less able to repay interest and principal than issuers of investment-grade securities. Prices of high-yield bonds tend to be very volatile. These securities are less liquid than investment-grade debt securities and may be difficult to price or sell, particularly in times of negative sentiment toward high-yield securities.
2014 Annual Report
121
Table of Contents
Notes to Financial Statements (continued)
October 31, 2014
| l. | Illiquid Securities |
Illiquid securities are assets which may not be sold or disposed of in the ordinary course of business within seven days at approximately the price at which a Fund has valued the investment on its books and may include such securities as those not registered under U.S. securities laws or securities that cannot be sold in public transactions. An inability to sell a portfolio position can adversely affect a Fund’s value or prevent the Fund from being able to take advantage of other investment opportunities.
| m. | Impact of Large Redemptions and Purchases of Fund Shares |
Occasionally, shareholders may make large redemptions or purchases of Fund shares, which may cause the Fund to have to sell securities or invest additional cash. These transactions may adversely affect the Fund’s performance and increase transaction costs. In addition, large redemption requests may exceed the cash balance of the Fund and result in credit line borrowing fees and/or overdraft charges to the Fund until the sale of portfolio securities to cover the redemption request settle.
On September 20, 2014, 3,873,690 shares were redeemed from the Core Fixed Income Fund, representing 75% of the total net assets of the Fund.
| n. | Interest Rate Risk |
A Fund’s fixed income investments are subject to interest rate risk, which generally causes the value of a fixed income portfolio to decrease when interest rates rise resulting in a decrease in the Fund’s net assets. A Fund may be subject to a greater risk of rising interest rates due to the current period of historically low rates and the effect of potential government fiscal policy initiatives and resulting market reaction to those initiatives. Interest rate fluctuations tend to have a greater impact on fixed income-securities with a greater time to maturity and/or lower coupon. In periods of market volatility, the market values of fixed income securities may be more sensitive to changes in interest rates.
| o. | Market Risk |
Deteriorating market conditions might cause a general weakness in the market that reduces the prices of securities in that market in which a Fund invests.
| p. | Mortgage-Related Securities Risk |
Certain Funds may invest in mortgage-related securities. Rising interest rates may cause an issuer to exercise its right to pay principal later than expected which tends to extend the duration of mortgage-related securities, making them more sensitive to changes in interest rates. As a result, in a period of rising interest rates, a fund that holds mortgage-related securities may exhibit additional volatility. This is known as extension risk. In addition, mortgage-related securities are subject to prepayment risk. When interest rates decline, borrowers may pay off their mortgages sooner than expected. This can reduce the returns of a Fund because the Fund will have to reinvest that money at the lower prevailing interest rates.
| q. | Non-Diversified Fund Risk |
Because Aberdeen Asia Bond Fund, Aberdeen Emerging Markets Debt Fund and Aberdeen Emerging Markets Debt Local Currency Fund are non-diversified, the Funds may hold larger positions in fewer securities than other funds. As a result, a single security’s increase or decrease in value may have a greater impact on each Fund’s value and total return.
| r. | Non-Hedging Foreign Currency Trading Risk |
Foreign exchange rates can be extremely volatile and a variance in the degree of volatility of the market or in the direction of the market from the Adviser’s expectations may produce significant losses to a Fund.
| s. | Private Placements and Other Restricted Securities Risk |
Investments in private placements and other restricted securities, including Regulation S Securities and Rule 144A Securities, could have the effect of increasing a Fund’s level of illiquidity. Private placements and restricted securities may be less liquid than other investments because such securities may not always be readily sold in broad public markets and the Fund might be unable to dispose of such securities promptly or at prices reflecting their true value.
| t. | Securities Selection Risk |
The investment team may select securities that underperform the market or other funds with similar investment objectives and strategies.
| u. | Valuation Risk |
The lack of active trading markets may make it difficult to obtain an accurate price for a security held by a Fund.
Please read the prospectus for more detailed information regarding these and other risks.
Annual Report 2014
122
Table of Contents
Notes to Financial Statements (continued)
October 31, 2014
7. Contingencies
In the normal course of business, the Funds may provide general indemnifications pursuant to certain contracts and organizational documents. The Funds’ maximum exposure under these arrangements is dependent on future claims that may be made against the Funds, and therefore, cannot be estimated; however, based on experience, the risk of loss from such claims is considered remote.
8. Tax Information
As of October 31, 2014, the tax cost of securities and the breakdown of unrealized appreciation/(depreciation) for each Fund were as follows:
| Tax Cost of Securities | Unrealized Appreciation | Unrealized Depreciation | Net Unrealized Appreciation (Depreciation) | |||||||||||||
Asia Bond Fund | $ | 233,428,367 | $ | 3,913,690 | $ | (9,021,792 | ) | $ | (5,108,102 | ) | ||||||
Core Fixed Income Fund | 11,997,263 | 149,435 | (48,739 | ) | 100,696 | |||||||||||
Emerging Markets Debt Fund | 31,052,806 | 553,435 | (916,016 | ) | (362,581 | ) | ||||||||||
Emerging Markets Debt Local Currency Fund | 33,899,963 | 146,105 | (4,102,828 | ) | (3,956,723 | ) | ||||||||||
Global Fixed Income Fund | 21,082,176 | 397,360 | (1,007,891 | ) | (610,531 | ) | ||||||||||
High Yield Fund | 11,252,084 | 170,397 | (627,803 | ) | (457,406 | ) | ||||||||||
Tax-Free Income Fund | 90,164,780 | 8,874,238 | (204,380 | ) | 8,669,858 | |||||||||||
Ultra-Short Duration Bond Fund | 10,122,328 | 27,979 | (3,992 | ) | 23,987 | |||||||||||
The tax character of distributions paid during the fiscal year ended October 31, 2014 was as follows (total distributions paid differ from the Statements of Changes in Net Assets because for tax purposes dividends are recognized when actually paid):
| Distributions paid from | ||||||||||||||||||||||||
| Fund | Ordinary Income | Net Long Term Capital Gains | Total Taxable Distributions | Tax Exempt Distributions | Return of Capital | Total Distributions Paid | ||||||||||||||||||
Asia Bond Fund | $ | 3,629,669 | $ | 7,276,146 | $ | 10,905,815 | $ | – | $ | – | $ | 10,905,815 | ||||||||||||
Core Fixed Income Fund | 2,150,532 | – | 2,150,532 | – | – | 2,150,532 | ||||||||||||||||||
Emerging Markets Debt Fund | 719,763 | – | 719,763 | – | – | 719,763 | ||||||||||||||||||
Emerging Markets Debt Local Currency Fund | 622,559 | – | 622,559 | – | – | 622,559 | ||||||||||||||||||
Global Fixed Income Fund | 581,242 | – | 581,242 | – | – | 581,242 | ||||||||||||||||||
High Yield Fund | 1,303,213 | 194,979 | 1,498,192 | – | – | 1,498,192 | ||||||||||||||||||
Tax-Free Income Fund | 48,781 | 1,477,743 | 1,526,524 | 3,346,952 | – | 4,873,476 | ||||||||||||||||||
Ultra-Short Duration Bond Fund | 85,235 | 21,532 | 106,767 | – | – | 106,767 | ||||||||||||||||||
2014 Annual Report
123
Table of Contents
Notes to Financial Statements (continued)
October 31, 2014
The tax character of distributions paid during the fiscal year ended October 31, 2013 was as follows (total distributions paid differ from the Statements of Changes in Net Assets because for tax purposes dividends are recognized when actually paid):
| Distributions paid from | ||||||||||||||||||||||||
| Fund | Ordinary Income | Net Long Term Capital Gain | Total Taxable Distributions | Tax Exempt Distributions | Return of Capital | Total Distributions Paid | ||||||||||||||||||
Asia Bond Fund | $ | 11,345,609 | $ | 2,964,437 | $ | 14,310,046 | $ | – | $ | – | $ | 14,310,046 | ||||||||||||
Core Fixed Income Fund | 4,041,980 | 1,031,019 | 5,072,999 | – | – | 5,072,999 | ||||||||||||||||||
Emerging Markets Debt Fund | 245,635 | – | 245,635 | – | – | 245,635 | ||||||||||||||||||
Emerging Markets Debt Local Currency Fund | 687,206 | – | 687,206 | – | – | 687,206 | ||||||||||||||||||
Global Fixed Income Fund | – | – | – | – | – | – | ||||||||||||||||||
High Yield Fund | 1,299,350 | – | 1,299,350 | – | – | 1,299,350 | ||||||||||||||||||
Tax-Free Income Fund | 14,114 | 1,019,964 | 1,034,078 | 3,633,580 | – | 4,667,658 | ||||||||||||||||||
Ultra-Short Duration Bond Fund | 205,163 | 31,120 | 236,283 | – | – | 236,283 | ||||||||||||||||||
As of October 31, 2014, the components of accumulated earnings (deficit) on a tax basis were as follows:
| Fund | Undistributed Tax Exempt Income | Undistributed Ordinary Income | Undistributed Long-Term Capital Gains | Accumulated Earnings | Distributions Payable | Late Year Ordinary and Post-October Capital Loss Deferrals | Other Temporary Differences | Accumulated Capital and Other Losses** | Unrealized Appreciation/ Depreciation* | Total Accumulated Earnings (Deficit) | ||||||||||||||||||||||||||||||
Asia Bond Fund | $ | – | $ | 2,305,516 | $ | – | $ | 2,305,516 | $ | – | $ | – | $ | (1,411,053 | ) | $ | (2,395,856 | ) | $ | (5,639,910 | ) | $ | (7,141,303 | ) | ||||||||||||||||
Core Fixed Income Fund | – | 212,358 | 206,674 | 419,032 | – | – | – | – | 100,695 | 519,727 | ||||||||||||||||||||||||||||||
Emerging Markets Debt Fund | – | 338,817 | – | 338,817 | – | – | (3,507 | ) | (156,680 | ) | (368,552 | ) | (189,922 | ) | ||||||||||||||||||||||||||
Emerging Markets Debt Local Currency Fund | – | – | – | – | – | – | (492,454 | ) | (1,494,503 | ) | (4,080,380 | ) | (6,067,337 | ) | ||||||||||||||||||||||||||
Global Fixed Income Fund | – | 199,462 | – | 199,462 | – | – | (84,785 | ) | (193,901 | ) | (620,168 | ) | (699,392 | ) | ||||||||||||||||||||||||||
High Yield Fund | – | 17,017 | – | 17,017 | – | – | – | (105,408 | ) | (457,475 | ) | (545,866 | ) | |||||||||||||||||||||||||||
Tax-Free Income Fund | – | 91,541 | 231,719 | 323,260 | – | – | (45,944 | ) | – | 8,669,858 | 8,947,174 | |||||||||||||||||||||||||||||
Ultra-Short Duration Bond Fund | – | 1,556 | – | 1,556 | – | – | (906 | ) | (3,462 | ) | 23,844 | 21,032 | ||||||||||||||||||||||||||||
| * | The difference between the book-basis and tax-basis unrealized appreciation/(depreciation) is attributable primarily to tax deferral of losses on wash sales. |
| ** | As of October 31, 2014, for Federal income tax purposes, the following Funds have capital loss carryforwards available to offset capital gains, if any, to the extent provided by the Treasury regulations, which expire in the years set forth below: |
Annual Report 2014
124
Table of Contents
Notes to Financial Statements (continued)
October 31, 2014
| Fund | Amount | Expires | ||||||
Asia Bond Fund | $ | 1,091,715 | Unlimited (Short-Term) | |||||
Asia Bond Fund | $ | 1,304,141 | Unlimited (Long-Term) | |||||
Emerging Markets Debt Fund | 33,477 | Unlimited (Short-Term) | ||||||
Emerging Markets Debt Fund | 123,203 | Unlimited (Long-Term) | ||||||
Emerging Markets Debt Local Currency Fund | 830,187 | Unlimited (Short-Term) | ||||||
Emerging Markets Debt Local Currency Fund . | 664,316 | Unlimited (Long-Term) | ||||||
Global Fixed Income Fund | 193,901 | 2015 (Short-Term) | ||||||
High Yield Bond Fund | 94,223 | Unlimited (Short-Term) | ||||||
High Yield Bond Fund | 11,185 | Unlimited (Long-Term) | ||||||
Ultra-Short Duration Bond Fund | 100 | Unlimited (Short-Term) | ||||||
Ultra-Short Duration Bond Fund | 3,362 | Unlimited (Long-Term) | ||||||
Amounts listed as “–” are $0 or round to $0.
Under the Regulated Investment Company Modernization Act of 2010, the Funds are permitted to carry forward capital losses incurred in taxable years beginning after December 22, 2010 for an unlimited period. However, any losses incurred during those taxable years will be required to be utilized prior to the losses incurred in pre-enactment taxable years. As a result of this ordering rule, pre-enactment capital loss carryforwards may be more likely to expire unused. Additionally, post-enactment capital losses that are carried forward will retain their character as either short-term or long-term capital losses rather than being considered all short-term as under previous law.
GAAP requires that certain components of net assets be adjusted to reflect permanent differences between financial and tax reporting. Accordingly, the table below details the necessary reclassifications, which are a result of permanent differences primarily attributable to foreign currency transactions, foreign capital gains taxes, paydown gain/(loss), and redesignation of distributions. These reclassifications have no effect on net assets or net asset values per share.
| Fund | Paid-in Capital | Accumulated Net Investment Income/(Loss) | Accumulated Net Realized Gain/(Loss) | |||||||||
Asia Bond Fund | $ | – | $ | (5,134,023 | ) | $ | 5,134,023 | |||||
Core Fixed Income Fund | – | 141,952 | (141,952 | ) | ||||||||
Emerging Markets Debt Fund | – | (96,968 | ) | 96,968 | ||||||||
Emerging Markets Debt Local Currency Fund | (83,388 | ) | (2,110,480 | ) | 2,193,868 | |||||||
Global Fixed Income Fund | – | 80,543 | (80,543 | ) | ||||||||
High Yield Fund | – | 3,345 | (3,345 | ) | ||||||||
Tax-Free Income Fund | – | 19,937 | (19,937 | ) | ||||||||
Ultra-Short Duration Bond Fund | – | 775 | (775 | ) | ||||||||
9. Significant Shareholders
As of October 31, 2014, the following Funds had shareholders with the percentage ownership indicated, which are considered significant shareholders (holdings greater than 5.0%) for financial reporting purposes:
| Fund | Record Ownership % | Number of Account Owners | ||
Asia Bond Fund | 76.7% | 3 | ||
Core Fixed Income Fund | 56.7 | 4 | ||
Emerging Markets Debt Fund | 99.8 | 3 | ||
Emerging Markets Debt Local Currency Fund | 91.8 | 4 | ||
Global Fixed Income Fund | 55.0 | 3 | ||
High Yield Fund | 89.2 | 3 | ||
Tax-Free Income Fund | – | – | ||
Ultra-Short Duration Bond Fund | 95.8 | 1 |
Amounts listed as “–” are $0 or round to $0.
2014 Annual Report
125
Table of Contents
Notes to Financial Statements (concluded)
October 31, 2014
10. Line of Credit
Effective August 15, 2014, the Trust, on behalf of each of the funds of the Trust (the “Borrowers”), entered into a credit agreement (the “Agreement”) with State Street Bank and Trust Company (the “Bank”). The Agreement provides for a revolving credit facility (the “Credit Facility”) to be utilized for temporary or emergency purposes to fund shareholder redemptions or other short-term liquidity purposes. The amount of the Credit Facility was $400,000,000 for the period ended October 31, 2014.
Principal on each outstanding loan made under the Agreement bears interest at a variable rate per annum equal to the higher of (a) the Federal Funds Rate as in effect of that day plus 1.25% or (b) the Overnight London Interbank Offered Rate (“LIBOR”) as in effect on that day plus 1.25%. In addition, the Borrowers shall pay to the Bank a commitment fee at the rate of 0.10% per annum on the daily unused portion of the Credit Facility, as applicable, which is allocated among the Borrowers in such manner as is determined by the Board to be reasonable. As of October 31, 2014, the Funds had no borrowings outstanding under the Credit Facility.
11. Recent Accounting Pronouncements
In June 2014, the Financial Accounting Standards Board issued guidance to improve the financial reporting of repurchase agreements and other similar transactions. The guidance includes expanded disclosure requirements for entities that enter into repurchase agreements and similar transactions accounted for as secured borrowings. The guidance is effective for financial statements with fiscal years beginning on or after December 15, 2014 and interim periods within those fiscal years. Management is evaluating the impact, if any, of this guidance on the Funds’ financial statement disclosures.
12. Subsequent Events
On December 10, 2014, considering the small size of the fund and other relevant considerations, the Board of Trustees of Aberdeen Funds (the “Trust”) approved a Plan of Liquidation for the Aberdeen Core Fixed Income Fund (the “Fund”) pursuant to which the Fund will be liquidated (the “Liquidation”) on or about February 12, 2015 (the “Liquidation Date”). Shareholder approval of the Liquidation is not required. Please refer to the supplement to the Fund’s prospectus and statement of additional information dated December 12, 2014 for more detail.
Accounting rules require that financial statements for entities in liquidation, or for which liquidation appears imminent, be prepared on a liquidation basis of accounting. Liquidation basis of accounting requires the Fund to record assets and liabilities at values expected to be achieved in liquidation. A change to the liquidation basis of accounting would not have a material effect on the Fund’s carrying value of assets and liabilities nor its operations. There were no adjustments necessary to the financial statements, which are prepared on a going-concern basis, to conform to a liquidation basis of accounting.
As disclosed in Note 3, the Trust and Aberdeen have entered into an Expense Limitation Agreement limiting operating expenses for all classes of the Funds. On December 10, 2014, the Board approved lowering the expense limitation for the Ultra-Short Duration Bond Fund from 0.40% to 0.30%. This limit excludes certain expenses, including any taxes, interest, brokerage fees, short sale dividend expenses, Acquired Fund Fees and Expenses, Rule 12b-1 fees, administrative services fees and extraordinary expenses. The lower expense cap will go into effect on February 28, 2015 and will remain in effect at least through the end of February 2016 or the effective date of the 2016 annual update to the registration statement, whichever occurs first.
Management has evaluated the need for disclosures and/or adjustments resulting from subsequent events through the date the Financial Statements were issued. Based on this evaluation, no disclosures and/or adjustments other than those described above were required to the Financial Statements as of October 31, 2014.
Annual Report 2014
126
Table of Contents
Shareholder Expense Examples (Unaudited)
As a shareholder of the Aberdeen Funds, you incur two types of costs: (1) transaction costs, including sales charges (loads) paid on purchase payments and (2) ongoing costs, including investment advisory fees, administration fees, transfer agent out-of-pocket expenses, distribution fees and other Fund expenses. The examples below are intended to help you understand your ongoing costs (in dollars) of investing in the Aberdeen Funds and to compare these costs with the ongoing costs of investing in other mutual funds.
The examples assume that you had a $1,000 investment in the Class at the beginning of the reporting period, May 1, 2014 and continued to hold your shares at the end of the reporting period, October 31, 2014.
Actual Expenses
The table below provides information about actual account values and actual expenses. You may use the information together with the amount you invested, to estimate the expenses that you paid over the period. Simply divide your account value by $1,000 (for example, an $8,600 account value divided by $1,000 = 8.6), then multiply the result by the number under the heading entitled “Actual Expenses Paid During Period” for the class of a Fund that you own to estimate the expenses you paid on your account during the period.
Hypothetical Example for Comparison Purposes
The table below provides information about hypothetical account values and hypothetical expenses based on the Class’ actual expense ratio and an assumed rate of return of 5% per year before expenses, which is not the Class’ actual return. The hypothetical account values and expenses may not be used to estimate the actual ending account balance or expenses you paid for the period. You may use this information to compare the ongoing costs of investing in the Class of a Fund and other funds. To do so, compare the 5% hypothetical example with the 5% hypothetical examples that appear in the shareholder reports of the other funds.
Please note that the expenses shown in the table are meant to highlight your ongoing costs only and do not reflect any transaction costs, such as sales charges (loads). Therefore, the information for each Class in the table is useful in comparing ongoing costs only, and will not help you determine the relative total costs of owning different funds. In addition, if these transaction costs were included, your costs would have been higher. The examples also assume all dividends and distributions have been reinvested.
| Beginning Account Value, May 1, 2014 | Actual Ending Account Value, October 31, 2014 | Hypothetical Ending Account Value | Actual Expenses Paid During Period* | Hypothetical Expenses Paid During Period*1 | Annualized Expense Ratio** | |||||||||||||||||||||
Aberdeen Asia Bond Fund | Class A | $ | 1,000.00 | $ | 1,019.00 | $ | 1,020.47 | $ | 4.78 | $ | 4.79 | 0.94% | ||||||||||||||
Class C | 1,000.00 | 1,016.10 | 1,016.64 | 8.64 | 8.64 | 1.70% | ||||||||||||||||||||
Class R | 1,000.00 | 1,018.00 | 1,019.21 | 6.05 | 6.06 | 1.19% | ||||||||||||||||||||
Institutional Service Class | 1,000.00 | 1,019.00 | 1,020.52 | 4.73 | 4.74 | 0.93% | ||||||||||||||||||||
Institutional Class | 1,000.00 | 1,021.00 | 1,021.68 | 3.57 | 3.57 | 0.70% | ||||||||||||||||||||
Aberdeen Core Fixed Income Fund | Class A | 1,000.00 | 1,020.50 | 1,021.32 | 3.92 | 3.92 | 0.77% | |||||||||||||||||||
Class C | 1,000.00 | 1,016.80 | 1,017.64 | 7.63 | 7.63 | 1.50% | ||||||||||||||||||||
Institutional Service Class | 1,000.00 | 1,022.60 | 1,022.69 | 2.55 | 2.55 | 0.50% | ||||||||||||||||||||
Institutional Class | 1,000.00 | 1,020.80 | 1,022.69 | 2.55 | 2.55 | 0.50% | ||||||||||||||||||||
Aberdeen Emerging Markets Debt Fund | Class A | 1,000.00 | 1,029.60 | 1,019.46 | 5.83 | 5.80 | 1.14% | |||||||||||||||||||
Class C | 1,000.00 | 1,025.30 | 1,015.68 | 9.65 | 9.60 | 1.89% | ||||||||||||||||||||
Class R | 1,000.00 | 1,029.10 | 1,018.20 | 7.11 | 7.07 | 1.39% | ||||||||||||||||||||
Institutional Service Class | 1,000.00 | 1,030.80 | 1,020.72 | 4.56 | 4.53 | 0.89% | ||||||||||||||||||||
Institutional Class | 1,000.00 | 1,031.90 | 1,020.67 | 4.61 | 4.58 | 0.90% | ||||||||||||||||||||
Aberdeen Emerging Markets Debt Local Currency Fund | Class A | 1,000.00 | 984.20 | 1,019.21 | 5.95 | 6.06 | 1.19% | |||||||||||||||||||
Class C | 1,000.00 | 979.60 | 1,015.63 | 9.48 | 9.65 | 1.90% | ||||||||||||||||||||
Class R | 1,000.00 | 981.90 | 1,016.89 | 8.24 | 8.39 | 1.65% | ||||||||||||||||||||
Institutional Service Class | 1,000.00 | 984.30 | 1,020.67 | 4.50 | 4.58 | 0.90% | ||||||||||||||||||||
Institutional Class | 1,000.00 | 984.30 | 1,020.67 | 4.50 | 4.58 | 0.90% | ||||||||||||||||||||
Aberdeen Global Fixed Income Fund | Class A | 1,000.00 | 971.90 | 1,019.71 | 5.42 | 5.55 | 1.09% | |||||||||||||||||||
Class C | 1,000.00 | 969.00 | 1,015.88 | 9.18 | 9.40 | 1.85% | ||||||||||||||||||||
Institutional Service Class | 1,000.00 | 972.50 | 1,020.16 | 4.97 | 5.09 | 1.00% | ||||||||||||||||||||
Institutional Class | 1,000.00 | 973.30 | 1,020.87 | 4.28 | 4.38 | 0.86% | ||||||||||||||||||||
2014 Annual Report
127
Table of Contents
Shareholder Expense Examples (Unaudited) (concluded)
| Beginning Account Value, May 1, 2014 | Actual Ending Account Value, October 31, 2014 | Hypothetical Ending Account Value | Actual Expenses Paid During Period* | Hypothetical Expenses Paid During Period*1 | Annualized Expense Ratio** | |||||||||||||||||||||
Aberdeen High Yield Fund | Class A | $ | 1,000.00 | $ | 974.70 | $ | 1,019.96 | $ | 5.18 | $ | 5.30 | 1.04% | ||||||||||||||
Class C | 1,000.00 | 970.70 | 1,016.13 | 8.94 | 9.15 | 1.80% | ||||||||||||||||||||
Class R | 1,000.00 | 972.30 | 1,018.65 | 6.46 | 6.61 | 1.30% | ||||||||||||||||||||
Institutional Service Class | 1,000.00 | 975.70 | 1,021.17 | 3.98 | 4.08 | 0.80% | ||||||||||||||||||||
Institutional Class | 1,000.00 | 975.70 | 1,021.17 | 3.98 | 4.08 | 0.80% | ||||||||||||||||||||
Aberdeen Tax-Free Income Fund | Class A | 1,000.00 | 1,026.50 | 1,020.82 | 4.44 | 4.43 | 0.87% | |||||||||||||||||||
Class C | 1,000.00 | 1,022.60 | 1,017.04 | 8.26 | 8.24 | 1.62% | ||||||||||||||||||||
Class R | 1,000.00 | 1,026.20 | 1,019.61 | 5.67 | 5.65 | 1.11% | ||||||||||||||||||||
Institutional Service Class | 1,000.00 | 1,028.80 | 1,022.08 | 3.17 | 3.16 | 0.62% | ||||||||||||||||||||
Institutional Class | 1,000.00 | 1,028.70 | 1,022.08 | 3.17 | 3.16 | 0.62% | ||||||||||||||||||||
Aberdeen Ultra-Short Duration Bond Fund | Class A | 1,000.00 | 999.40 | 1,021.93 | 3.28 | 3.31 | 0.65% | |||||||||||||||||||
Institutional Service Class | 1,000.00 | 1,000.70 | 1,023.09 | 2.12 | 2.14 | 0.42% | ||||||||||||||||||||
Institutional Class | 1,000.00 | 1,000.70 | 1,023.19 | 2.02 | 2.04 | 0.40% | ||||||||||||||||||||
| * | Expenses are equal to the Fund’s annualized expense ratio multiplied by the average account value over the period multiplied by 184/365 (to reflect the one-half year period). |
| ** | The expense ratio presented represents a six-month, annualized ratio. |
| 1 | Represents the hypothetical 5% return before expenses. |
Annual Report 2014
128
Table of Contents
Report of Independent Registered Public Accounting Firm
The Board of Trustees and Shareholders of Aberdeen Funds:
We have audited the accompanying statements of assets and liabilities, including the statements of investments, of the Aberdeen Asia Bond Fund, Aberdeen Core Fixed Income Fund, Aberdeen Emerging Markets Debt Fund, Aberdeen Emerging Markets Debt Local Currency Fund, Aberdeen Global Fixed Income Fund, Aberdeen High Yield Fund, Aberdeen Tax-Free Income Fund, and Aberdeen Ultra-Short Duration Bond Fund, eight of the funds comprising the Aberdeen Funds (the “Funds”), as of October 31, 2014, and the related statements of operations for the year then ended, the statements of changes in net assets for each of the years in the two-year period then ended, and the financial highlights for each of the years and periods presented. These financial statements and financial highlights are the responsibility of the Funds’ management. Our responsibility is to express an opinion on these financial statements and financial highlights based on our audits.
We conducted our audits in accordance with the standards of the Public Company Accounting Oversight Board (United States). Those standards require that we plan and perform the audit to obtain reasonable assurance about whether the financial statements and financial highlights are free of material misstatement. An audit includes examining, on a test basis, evidence supporting the amounts and disclosures in the financial statements. Our procedures included confirmation of securities owned as of October 31, 2014, by correspondence with custodians and brokers, or by other appropriate auditing procedures. An audit also includes assessing the accounting principles used and significant estimates made by management, as well as evaluating the overall financial statement presentation. We believe that our audits provide a reasonable basis for our opinion.
In our opinion, the financial statements and financial highlights referred to above present fairly, in all material respects, the financial position of the Funds as of October 31, 2014, the results of their operations, changes in their net assets and the financial highlights for the periods or years referred to in the first paragraph above, in conformity with U.S. generally accepted accounting principles.

Philadelphia, Pennsylvania
December 26, 2014
2014 Annual Report
129
Table of Contents
Other Tax Information (Unaudited)
For the period ended October 31, 2014, certain dividends paid by the Funds may be subject to a maximum tax rate of 15% as provided for by the Jobs and Growth Tax Relief Reconciliation Act of 2003. The Funds intend to designate the maximum amount allowable as taxed as a maximum rate of 15%. Complete information will be reported in conjunction with your 2013 Form 1099-DIV.
During the year ended October 31, 2014, the following Funds designated dividends as long-term capital gains:
| Fund | Amount | |||
Asia Bond Fund | $ | 7,276,146 | ||
High Yield Fund | 194,979 | |||
Tax-Free Income Fund | $ | 1,477,743 | ||
Ultra-Short Duration Bond Fund | 21,532 | |||
During the year ended October 31, 2014, the following Fund designated income dividends as tax-exempt dividends:
| Fund | Amount | |||
Tax-Free Income Fund | 99.15 | % | ||
The Funds intend to elect to pass through to their shareholders the credit for taxes paid in foreign countries during its fiscal year ended October 31, 2014. In accordance with the current tax laws, the foreign income and foreign tax per share (for a share outstanding as of October 31, 2014) was as follows:
| Fund | Foreign Tax | |||
Asia Bond Fund | $ | 0.02014 | ||
Emerging Markets Debt Local Currency Fund | $ | 0.00838 | ||
Annual Report 2014
130
Table of Contents
Supplemental Information (Unaudited)
Board of Trustees’ Consideration of Advisory and Sub-advisory Agreements
At an in-person meeting of the Board of Trustees (the “Board” or the “Trustees”) of the Aberdeen Funds (the “Trust”) held on June 11, 2014, the Board, including a majority of the Trustees who are not considered to be “interested persons” of the Trust (the “Independent Trustees”) under the Investment Company Act of 1940, as amended (the “1940 Act”), approved for an annual period the continuation of the Trust’s advisory agreement (the “Advisory Agreement”) with Aberdeen Asset Management Inc. (“AAMI”) and the applicable sub-advisory agreements (each a “Sub-Advisory Agreement,” and collectively with the Advisory Agreement, the “Agreements”) between: (i) AAMI and Aberdeen Asset Management Asia Limited (“AAMAL”) and (ii) AAMI and Aberdeen Asset Managers Limited (“AAML”) (each a “Sub-Adviser,” and collectively, the “Sub-Advisers”) for each series of the Trust identified below (each a “Fund,” and collectively the “Funds”). AAMAL and AAML are affiliates of AAMI. AAMI and the Sub-Advisers are sometimes referred to collectively as the “Advisers.”
In connection with contract review meetings, the Board reviews a variety of information provided by the Advisers relating to the Funds, the Agreements and the Advisers, including comparative performance, fee and expense information and other information regarding the nature, extent and quality of services provided by the Advisers under their respective Agreements. The materials provided to the Board generally include, among other items: (i) information on the investment performance of the Funds and the performance of peer groups of funds and the Funds’ performance benchmarks; (ii) information on the Funds’ advisory fees and other expenses, including information comparing each Fund’s expenses to those of a peer group of funds and information about any applicable expense limitations and fee “breakpoints”; (iii) sales and redemption data with respect to each Fund; (iv) information about the profitability of the Agreements to the Advisers; (v) a report prepared by the Advisers in response to a request submitted by the Independent Trustees’ independent legal counsel on behalf of such Trustees; and (vi) a memorandum from the Independent Trustees’ independent legal counsel on the responsibilities of the Board of Trustees in considering for approval the investment advisory and investment sub-advisory arrangements under the 1940 Act and Delaware law. The Board of Trustees, including the Independent Trustees, also considers other matters such as: (i) the Advisers’ financial results and financial condition; (ii) each Fund’s investment objective and strategies; (iii) the Advisers’ investment personnel and operations; (iv) arrangements relating to the distribution of the Funds’ shares and the related costs; (v) the procedures employed to determine the value of the Funds’ assets; (vi) the allocation of the Funds’ brokerage, if any, including, if applicable, allocations to brokers affiliated with the Advisers and the use, if any, of “soft” commission dollars to pay Fund expenses and to pay for research and other similar services; (vii) the resources devoted to, and the record of compliance with, the Funds’ investment policies and restrictions, policies on personal securities transactions and other compliance policies; and (viii) possible conflicts of interest. The Board also considers the nature, extent and quality of the services provided to the Funds by AAMI’s affiliates. Throughout the process, the Trustees are afforded the opportunity to ask questions of and request additional materials from AAMI and the Sub-Advisers.
In addition to the materials requested by the Trustees in connection with their annual consideration of the continuation of the Agreements, the Trustees receive materials in advance of each regular quarterly meeting of the Board that provide information relating to the services provided by the Advisers, including detailed information about the Funds’ investment performance. This information generally includes, among other things, third-party performance rankings for various periods (including prior to the Advisers’ management of the Funds) comparing each Fund against its peer group, total return information for various periods, and details of sales and redemptions of Fund shares for the period. The Board also receives periodic presentations from the portfolio management teams in connection with the performance of the Funds.
The Independent Trustees were advised by separate independent legal counsel throughout the process. The Independent Trustees also consulted in executive sessions with counsel to the Independent Trustees regarding consideration of the renewal of the Agreements. In considering whether to approve the continuation of the Agreements, the Board of Trustees, including the Independent Trustees, did not identify any single factor as determinative. Individual Trustees may have evaluated the information presented differently from one another, giving different weights to various factors. Matters considered by the Trustees, including the Independent Trustees, in connection with their approval of the continuation of the Agreements included the factors listed below.
The nature, extent and quality of the services provided to the Funds under the Agreements. The Trustees considered the nature, extent and quality of the services provided by AAMI and the Sub-Advisers, as applicable, to the Funds and the resources dedicated to the Funds by AAMI and its affiliates. The Board considered, among other things, the Advisers’ investment experience. The Board also considered the background and experience of the Advisers’ senior management personnel and the qualifications, background and responsibilities of the portfolio managers that are primarily responsible for the day-to-day portfolio management services for the Funds. The Board also considered the allocation of responsibilities among the Advisers. The Trustees considered not only the advisory services provided by AAMI to the Funds, but also the administrative services provided by AAMI to the Funds under a separate administration agreement. AAMI’s role in coordinating the activities of the Trust’s other service providers was also considered. The Board also considered that it receives information on a regular basis from the Trust’s Chief Compliance Officer regarding the Advisers’ compliance policies and procedures. The Board also considered the Advisers’ risk management processes. The Board was also mindful of the Advisers’ focus on the monitoring of the performance of the Funds and in addressing performance matters. The Trustees also considered the benefits to shareholders of investing in a mutual fund that is part of a family of funds that offers shareholders the right to exchange shares of one type of fund for shares of another type of fund, and provides a variety of fund and shareholder
2014 Annual Report
131
Table of Contents
Supplemental Information (Unaudited) (continued)
services. The Board also took into account its knowledge of management and the quality of the performance of management’s duties through Board meetings, discussion and reports during the preceding year.
After reviewing these and related factors, the Board concluded that the nature, extent and quality of the services provided were extensive in nature and of high quality and supported the renewal of the Agreements.
Investment performance of the Funds and the Advisers. The Trustees received information about the performance of the Funds over various time periods, including information which compared the performance of the Funds to the performance of peer groups of funds and each Fund’s performance benchmark. The Trustees also considered the performance of the Funds compared to the performance of comparable funds or accounts managed by AAMI and its affiliates to the extent available. In addition, the Trustees also reviewed data prepared by an independent third party which analyzed the performance of the Funds using a variety of performance metrics.
The Trustees considered that AAMI and its affiliates commenced management of a number of the Funds only upon those Funds’ reorganization into the Trust. The Trustees also considered AAMI’s and the Sub-Advisers’ performance and reputation generally, the performance of the fund family generally, and the historical responsiveness of AAMI to Trustee concerns about performance and the willingness of AAMI and the Sub-Advisers to take steps intended to improve performance. The Trustees also considered the performance of the Advisers since they commenced management of the Funds.
In addition to the foregoing, the Trustees considered the specific factors set forth below with respect to the performance of each Fund for the periods ended March 31, 2014:
Aberdeen Global Fixed Income Fund. The Board noted that the Fund outperformed its peer group average for the 1-year period and underperformed its peer group average for the 3-, 5- and 10-year periods. The Board also noted that the Fund outperformed its benchmark for the 5- year period and underperformed its benchmark for the 1-, 3- and 10-year periods. The Board noted that AAMI and its affiliates commenced managing the Fund on July 20, 2009, and that performance prior to that date represents the performance of the Fund’s previous investment adviser.
Aberdeen Tax-Free Income Fund. The Board noted that the Fund outperformed its peer group average for the 1-, 3-, 5- and 10-year periods and underperformed its benchmark for the 1-, 3-, 5- and 10-year periods. The Board also noted that AAMI took over direct portfolio management responsibilities for the Fund effective February 28, 2011.
Aberdeen Asia Bond Fund. The Board noted that the Fund underperformed its peer group average and benchmark for the 1- and 3- year periods and outperformed its peer group average and benchmark for the 5-year period.
Aberdeen Core Fixed Income Fund. The Board noted that the Fund underperformed its peer group average for the 1-, 3- , 5- and 10-year periods. The Board also noted that the Fund outperformed its benchmark for the 1-, 3- and 5-year periods and underperformed its benchmark for the 10-year period. The Board noted that AAMI commenced managing the Fund on July 12, 2010, and that performance prior to that date represents the performance of the Fund’s previous investment adviser. The Board also took into account a change implemented to the Fund’s investment strategy during the 5-year period.
Aberdeen Ultra-Short Duration Bond Fund. The Board noted that the Fund underperformed its peer group average and outperformed its benchmark for the 1- and 3-year periods.
Aberdeen Emerging Markets Debt Local Currency Fund. The Board noted that the Fund underperformed its peer group average and benchmark for the 1-year period.
Aberdeen High Yield Bond Fund (formerly, Aberdeen U.S. High Yield Bond Fund). The Board noted that the Fund outperformed its peer group average and underperformed its benchmark for the 1- year period.
Aberdeen Emerging Markets Debt Fund. The Board noted that the Fund outperformed its peer group average and underperformed its benchmark for the 1- year period.
After discussion, the Board concluded that it will continue to monitor the Funds’ performance and any actions taken by AAMI and its affiliates relating to performance.
The costs of the services provided and profits realized by the Advisers and their affiliates from their relationships with the Funds. The Trustees considered the fees charged to the Funds for advisory services as well as the total expense levels of the Funds. This information included comparisons (provided both by management and also by an independent third party) of each Fund’s net management fee and total expense level to those of its peer group (the “Expense Group”) and information about the advisory fees charged by AAMI to any separately managed accounts
Annual Report 2014
132
Table of Contents
Supplemental Information (Unaudited) (continued)
with a similar strategy. In comparing each Fund’s net management fee to that of comparable funds, the Board noted that such fee includes both advisory and administrative fees. In considering the fees charged to any comparable accounts, the Trustees considered, among other things, management’s discussion of the differences required to manage the different types of accounts. In evaluating the Funds’ advisory fees, the Trustees also took into account the demands, complexity and quality of the investment management of the Funds.
The Trustees also noted that the sub-advisory fees, as applicable, for the Funds would be paid by AAMI, not the Funds, out of its advisory fee. The Board also considered that AAMI had entered into expense limitation agreements with the Funds, pursuant to which AAMI agreed to waive a portion of its advisory fee and/or reimburse certain expenses as a means of limiting each Fund’s total annual operating expenses for a period of time.
The Trustees also considered the compensation directly or indirectly received by AAMI and its affiliates from their relationships with the Funds. The Trustees reviewed information provided by management as to the profitability of AAMI and its affiliates’ relationships with the Funds, such as the engagement of affiliates of AAMI to provide distribution and administrative services to the Funds. The Trustees also examined the profitability of AAMI and its affiliates on a Fund-by-Fund basis. The Trustees also considered information about the allocation of expenses used to calculate profitability. When reviewing profitability, the Trustees also considered information about court cases regarding adviser profitability, the performance of the Funds, the expense levels of the Funds, and whether AAMI had implemented breakpoints and expense limitations with respect to the Funds.
In addition to the foregoing, the Trustees considered the specific factors set forth below with respect to each Fund’s fees and expenses:
Aberdeen Global Fixed Income Fund. The Board considered that the Fund’s net management fee and net total expenses after waivers were each above the median of the Expense Group. The Trustees also noted that management had implemented breakpoints in the Fund’s advisory and sub-advisory fee schedules in 2010.
Aberdeen Tax-Free Income Fund. The Board considered that the Fund’s net management fee was below the median of the Expense Group and net total expenses after waivers were above the median of the Expense Group.
Aberdeen Asia Bond Fund. The Board considered that the Fund’s net management fee and net total expenses after waivers were each below the median of the Expense Group.
Aberdeen Core Fixed Income Fund. The Board considered that the Fund’s net management fee and net total expenses after waivers were each below the median of the Expense Group.
Aberdeen Ultra-Short Duration Bond Fund. The Board considered that the Fund’s net management fee and net total expenses after waivers were each below the median of the Expense Group.
Aberdeen Emerging Markets Debt Local Currency Fund. The Board considered that the Fund’s net management fee and net total expenses after waivers were each below the median of the Expense Group.
Aberdeen High Yield Bond Fund (formerly, Aberdeen U.S. High Yield Bond Fund). The Board considered that the Fund’s net management fee was below the median of the Expense Group and net total expenses after waivers were equal to the median of the Expense Group.
Aberdeen Emerging Markets Debt Fund. The Board considered that the Fund’s net management fee and net total expenses after waivers were each below the median of the Expense Group.
After reviewing these and related factors, including taking into account management’s discussion regarding Fund expenses, the Board concluded that the advisory fee, and as applicable, the sub-advisory fees, were fair and reasonable, and that the costs of these services generally and the related profitability of AAMI and its affiliates from their relationships with the Funds were reasonable and supported the renewal of the Agreements.
Economies of Scale. The Trustees considered the existence of any economies of scale in the provision of services by AAMI and the Sub-Advisers and whether those economies would be shared with the Funds through breakpoints in the investment advisory fees or other means, such as expense waivers or limitations. The Trustees noted that each of the Funds was subject to an expense limitation and that certain Funds were subject to breakpoints. The Board noted management’s discussion of the Funds’ advisory fee structure. The Trustees also took note of the costs of the services provided and the profitability to AAMI and its affiliates from their relationships with the Funds, as discussed above. The Board also considered the potential effect of each Fund’s growth and size on fees, noting that if a Fund’s assets increase over time, the Fund may realize other economies of scale if assets increase proportionally more than some expenses.
2014 Annual Report
133
Table of Contents
Supplemental Information (Unaudited) (concluded)
After reviewing these and related factors, the Board concluded that the advisory fee, and as applicable, sub-advisory fee structures were reasonable and reflect economies of scale being shared between the Funds and the Advisers, and supported the renewal of the Agreements.
The Trustees also considered other factors, which included but were not limited to the following:
| • | the effect of any market and economic volatility on the performance, asset levels and expense ratios of the Funds. |
| • | whether the Funds have operated in accordance with their investment objectives and the Funds’ record of compliance with their investment restrictions, and the compliance programs of the Trust and AAMI. The Trustees also considered the compliance-related resources AAMI and its affiliates were providing to the Funds. |
| • | the nature, quality, cost and extent of administrative services performed by AAMI under the Advisory Agreement and under a separate agreement covering administrative services. |
| • | so-called “fallout benefits” to AAMI, such as the benefits of research made available to AAMI by reason of brokerage commissions generated by the Funds’ securities transactions or reputational and other indirect benefits. The Trustees considered any possible conflicts of interest associated with these fallout and other benefits, and the reporting, disclosure and other processes in place to disclose and monitor such possible conflicts of interest. |
* * *
Based on their evaluation of all factors that they deemed to be material, including those factors described above, and assisted by the advice of independent counsel, the Trustees, including the Independent Trustees, concluded that renewal of the Agreements would be in the best interest of each of the Funds and its shareholders. Accordingly, the Board, and the Independent Trustees voting separately, approved the Agreements for an additional one-year period.
Annual Report 2014
134
Table of Contents
Management of the Funds (Unaudited)
As of October 31, 2014
The names of the Trustees and officers of the Funds, their addresses, years of birth, and principal occupations during the past five years are provided in the tables below. Trustees that are deemed “interested persons” (as that term is defined in Section 2(a)(19) of the 1940 Act) of the Funds and the investment adviser are included in the table below under the heading “Interested Trustees.” Trustees who are not interested persons as described above are referred to in the table below under the heading “Independent Trustees.”
The Statement of Additional Information includes additional information about the Trustees of the Funds and is available, without charge, on the Funds’ website at www.aberdeen-asset.com/us, or upon request at 1-866-667-9231.
Trustees and Officers of the Trust
| Name, Address, and Year of Birth | Position(s) Held, Length of Time Served and Term of Office* | Principal Occupation During Past 5 Years | Number of Portfolios in Fund Complex Overseen by Trustee** | Other Directorships Held by Trustee During Past 5 Years*** | ||||
Independent Trustees | ||||||||
P. Gerald Malone**** Year of Birth: 1950 | Trustee since December 2007 Chairman of the Board | Mr. Malone is, by profession, a solicitor of some 38 years standing. He has served as a Minister of State in the United Kingdom Government. Mr. Malone currently serves as Independent Chairman of a London AIM-listed company (healthcare software) and a UK based privately-owned pharmaceutical company. He is Chairman of the Board of Trustees of Aberdeen Funds, Chairman of the Board of Directors of Aberdeen Global Income Fund, Inc. and Aberdeen Asia-Pacific Income Fund, Inc. and serves on the boards of Aberdeen Australia Equity Fund, Inc. and Aberdeen Asia-Pacific Income Investment Company Limited. | 27 | None. | ||||
Richard H. McCoy**** Year of Birth: 1942 | Trustee since December 2007 | Prior to retiring in 2003, Mr. McCoy was Vice-Chairman, Investment Banking, at TD Securities Inc. He is currently a Director of Uranium Participation Corp. and Pizza Pizza Royalty Income Fund, Chair of Chorus Aviation Inc. and an Independent Review Committee member of Uranium Participation Corp. Mr. McCoy has also been Chairman of Aberdeen Asia-Pacific Income Investment Company Limited since 2010. | 24 | None. | ||||
Neville J. Miles Year of Birth: 1946 | Trustee since December 2011 | Mr. Miles is, and has been for over ten years, Chairman of Ballyshaw Pty. Ltd. (share trading, real estate development and investment). He is Chairman of the Board of Directors of Aberdeen Australia Equity Fund, Inc. He also is a non-executive director of a number of Australian and overseas companies. | 27 | None. | ||||
2014 Annual Report
135
Table of Contents
Management of the Funds (Unaudited) (continued)
As of October 31, 2014
| Name, Address, and Year of Birth | Position(s) Held, Length of Time Served and Term of Office* | Principal Occupation During Past 5 Years | Number of Portfolios in Fund Complex Overseen by Trustee** | Other Directorships Held by Trustee During Past 5 Years*** | ||||
Peter D. Sacks**** Year of Birth: 1945 | Trustee since December 2007 | Mr. Sacks has been a Director and Founding Partner of Toron AMI International Asset Management (formerly, Toron Investment Management) (investment management) since 1988. He is also a Director and Investment Advisory Committee member of several private and public sector funds in Canada. | 27 | None. | ||||
John T. Sheehy**** Year of Birth: 1942 | Trustee since December 2007 | Mr. Sheehy has been a Senior Managing Director of B.V. Murray and Company (investment banking) since 2001 and Director of Macquarie AIR-serv Holding, Inc. (automotive services) from 2006 to 2013. He was a Managing Member of Pristina Capital Partners, LLC (water purification technology development) from 2007 to 2011, a Director of Smarte Carte, Inc. (airport services) from 2007 to 2010, and Managing Member of The Value Group LLC (venture capital) from 1997 to 2009. | 27 | None. | ||||
Warren C. Smith**** Year of Birth: 1955 | Trustee since December 2007 | Mr. Smith has been a founding partner of MRB Partners Inc. (independent investment research and consultancy firm) since 2010. Mr. Smith was a Managing Editor with The Bank Credit Analyst Research Group (independent publishers of financial market research and publications, including The Bank Credit Analyst) from 1982 to 2009. | 24 | None. | ||||
John F. Solan, Jr.**** Year of Birth: 1939 | Trustee since December 2007 | Prior to retiring, Mr. Solan was Senior Vice President of Strategic Development at The Phoenix Companies, Inc. and Chairman of Phoenix Charter Oak Trust Company from 1998 until 2004. Mr. Solan served in several different positions with Ernst & Young from 1964 to 1998. | 24 | None. |
Annual Report 2014
136
Table of Contents
Management of the Funds (Unaudited) (continued)
As of October 31, 2014
| Name, Address, and Year of Birth | Position(s) Held, Length of Time Served and Term of Office* | Principal Occupation During Past 5 Years | Number of Portfolios in Fund Complex Overseen by Trustee** | Other Directorships Held by Trustee During Past 5 Years*** | ||||
Interested Trustee | ||||||||
Martin Gilbert****† Year of Birth: 1955 | Trustee since December 2007 | Mr. Gilbert is a founding director and shareholder, and Chief Executive of Aberdeen Asset Management PLC, the holding company of the fund management group that was established in 1983 (“Aberdeen Group”). He was a Director (1991–2014) of Aberdeen Asset Management Asia Limited and a Director (2000–2014) of Aberdeen Asset Management Limited. He was a Director (1995–2014) and was President (September 2006–2014) of Aberdeen Asset Management Inc. Mr. Gilbert also serves as officer and/or director of various Aberdeen Group subsidiary companies, Aberdeen-managed investment trusts and funds’ boards. | 28 | None. | ||||
| * | Each Trustee holds office for an indefinite term until his successor is elected and qualified. |
| ** | The Aberdeen Fund Complex consists of the Trust which currently consists of 24 portfolios, Aberdeen Asia-Pacific Income Fund, Inc., Aberdeen Global Income Fund, Inc., Aberdeen Australia Equity Fund, Inc., Aberdeen Chile Fund, Inc., Aberdeen Israel Fund, Inc., Aberdeen Indonesia Fund, Inc., Aberdeen Latin America Equity Fund, Inc., Aberdeen Emerging Markets Smaller Company Opportunities Fund, Inc., Aberdeen Singapore Fund, Inc., The Asia Tigers Fund, Inc., The India Fund, Inc., Aberdeen Greater China Fund, Inc., Aberdeen Japan Equity Fund, Inc., Aberdeen Investment Funds and Aberdeen Global Select Opportunities Fund Inc. |
| *** | Directorships held in (1) any other investment companies registered under the 1940 Act, (2) any company with a class of securities registered pursuant to Section 12 of the Securities Exchange Act of 1934, as amended (the “Exchange Act”) or (3) any company subject to the requirements of Section 15(d) of the Exchange Act. |
| **** | Each Trustee may be contacted by writing to the Trustee c/o Aberdeen Asset Management Inc., 1735 Market Street, 32nd Floor, Philadelphia, Pennsylvania 19103, Attn: Alan Goodson. |
| † | Mr. Gilbert is considered to be an “interested person” of the Trust as defined in the 1940 Act because of his affiliation with the Adviser. |
2014 Annual Report
137
Table of Contents
Management of the Funds (Unaudited) (continued)
As of October 31, 2014
Officers of the Trust
| Name, Address, and Year of Birth | Position(s) Held, Length of Time Served and Term of Office* | Principal Occupation During Past 5 Years | ||
Bev Hendry** Aberdeen Asset Management Inc. 1735 Market Street 32nd Floor Philadelphia, PA 19103 Year of Birth: 1953 | President, Chief Executive Officer and Principal Executive Officer (Since September 2014) | Currently, Co-Head of Americas and Chief Financial Officer for Aberdeen Asset Management Inc. since June 2014. He first joined Aberdeen in 1987 and helped establish Aberdeen’s business in the Americas in Fort Lauderdale. Mr. Hendry left Aberdeen in 2008 when the company moved to consolidate its headquarters in Philadelphia. Mr. Hendry re-joined Aberdeen from Hansberger Global Investors in Fort Lauderdale, Florida, where he worked for six years as Chief Operating Officer. | ||
Jeffrey Cotton** Aberdeen Asset Management Inc. 1735 Market Street 32nd Floor Philadelphia, PA 19103 Year of Birth: 1977 | Vice President and Chief Compliance Officer (Since March 2011) | Currently, Vice President and Head of Compliance– Americas for Aberdeen Asset Management Inc. Mr. Cotton joined Aberdeen in 2010. Prior to joining Aberdeen, Mr. Cotton was a Senior Compliance Officer at Old Mutual Asset Management (2009-2010) supporting its affiliated investment advisers and mutual fund platform. Mr. Cotton was also a Vice President and Senior Compliance Manager at Bank of America/Columbia Management (2006-2009). | ||
Sofia Rosala** Aberdeen Asset Management Inc. 1735 Market Street 32nd Floor Philadelphia, PA 19103 Year of Birth: 1974 | Vice President (since March 2014) and Deputy Chief Compliance Officer (Since December 2013) | Currently, Deputy Fund Chief Compliance Officer and U.S. Counsel for Aberdeen Asset Management Inc. (since July, 2012). Prior to joining Aberdeen, Ms. Rosala was Counsel for Vertex, Inc. from April 2011 to June 2012. She was also an Associate Attorney with Morgan, Lewis and Bockius from May 2008–April 2011. | ||
Andrea Melia** Aberdeen Asset Management Inc. 1735 Market Street 32nd Floor Philadelphia, PA 19103 Year of Birth: 1969 | Treasurer, Chief Financial Officer, and Principal Accounting Officer (Since September 2009) | Currently, Vice President and Head of Fund Administration for Aberdeen Asset Management Inc. (since 2009). Prior to joining Aberdeen, Ms. Melia was Director of Fund Administration and accounting oversight for Princeton Administrators LLC, a division of BlackRock Inc. and had worked with Princeton Administrators since 1992. | ||
Megan Kennedy** Aberdeen Asset Management Inc. 1735 Market Street 32nd Floor Philadelphia, PA 19103 Year of Birth: 1974 | Secretary and Vice President (Since September 2009) | Currently, Head of Product Management for Aberdeen Asset Management Inc. Ms. Kennedy joined Aberdeen Asset Management Inc. in 2005 as a Senior Fund Administrator. Ms. Kennedy was promoted to Assistant Treasurer Collective Funds/North American Mutual Funds in February 2008 and promoted to Treasurer Collective Funds/North American Mutual Funds in July 2008. | ||
Lucia Sitar** Aberdeen Asset Management Inc. 1735 Market Street 32nd Floor Philadelphia, PA 19103 Year of Birth: 1971 | Vice President (Since December 2008) | Currently, Managing U.S. Counsel for Aberdeen Asset Management Inc. Ms. Sitar joined Aberdeen Asset Management Inc. in July 2007. |
Annual Report 2014
138
Table of Contents
Management of the Funds (Unaudited) (continued)
As of October 31, 2014
| Name, Address, and Year of Birth | Position(s) Held, Length of Time Served and Term of Office* | Principal Occupation During Past 5 Years | ||
Brad Crombie Aberdeen Asset Management Bow Bells House 1 Bread Street London EC4M 9HH Year of Birth: 1970 | Vice President (Since June 2013) | Currently, Global Head of Fixed Income for Aberdeen Asset Management PLC. Mr. Crombie re-joined Aberdeen in 2012. Prior to re-joining Aberdeen, Mr. Crombie was a Managing Director at Bank of America Merrill Lynch for the bank’s non-financial corporate and high yield credit research team for the Europe, Middle East and Africa region from 2003 to 2012. | ||
Alan Goodson** Aberdeen Asset Management Inc. 1735 Market Street 32nd Floor Philadelphia, PA 19103 Year of Birth: 1974 | Vice President (Since March 2009) | Currently, Head of Product–US, overseeing Product Management, Product Development and Investor Services for Aberdeen’s registered and unregistered investment companies in the US and Canada. Mr. Goodson is Vice President of Aberdeen Asset Management Inc. and joined Aberdeen in 2000. | ||
Adam McCabe** Aberdeen Asset Management Asia Limited 21 Church Street #01-01 Capital Square Two Singapore 049480 Year of Birth: 1979 | Vice President (Since March 2010) | Currently, Head of Asian Fixed Income on the Fixed Income–Asia Pacific desk, responsible for currency and interest rate strategies in Aberdeen’s Asian fixed income portfolios. Mr. McCabe joined Aberdeen in 2009 following the acquisition of certain asset management businesses from Credit Suisse. Adam worked for Credit Suisse since 2001, where he was an investment manager responsible for the development and implementation of its Asian currency and interest rate strategies. | ||
Jennifer Nichols** Aberdeen Asset Management Inc. 1735 Market Street 32nd Floor Philadelphia, PA 19103 Year of Birth: 1978 | Vice President (Since December 2007) | Currently, Global Head of Legal for Aberdeen Asset Management PLC. Director and Vice President for Aberdeen Asset Management Inc. (since October 2006). | ||
Hugh Young** Aberdeen Asset Management Asia Limited 21 Church Street #01-01 Capital Square Two Singapore 049480 Year of Birth: 1958 | Vice President (Since June 2011) | Currently, Managing Director of Aberdeen Asset Management Asia Limited (since 1991) and member of the Executive Management Committee and Director of Aberdeen Asset Management PLC (since 1991 and 2011, respectively). Mr. Young joined Aberdeen in 1991. | ||
Brian O’Neill** Aberdeen Asset Management Inc. 1735 Market Street 32nd Floor Philadelphia, PA 19103 Year of Birth: 1968 | Assistant Treasurer (Since September 2008) | Currently, Senior Fund Administration Manager–US for Aberdeen Asset Management Inc. Mr. O’Neill joined Aberdeen Asset Management Inc. in 2008. Prior to joining Aberdeen Asset Management Inc., Mr. O’Neill was a Director of Fund Accounting with Nationwide Funds Group (2002-2008). | ||
Eric Olsen Aberdeen Asset Management Inc. 1735 Market Street 32nd Floor Philadelphia, PA 19103 Year of Birth: 1970 | Assistant Treasurer (Since December 2013) | Currently, Deputy Head of Fund Administration–US for Aberdeen Asset Management Inc. Mr. Olsen joined Aberdeen Asset Management Inc. in August 2013. Prior to joining Aberdeen Asset Management Inc., Mr. Olsen was a Director of Financial Reporting for BNY Mellon Asset Servicing and had worked with BNY Mellon since 1998. |
2014 Annual Report
139
Table of Contents
Management of the Funds (Unaudited) (concluded)
As of October 31, 2014
| Name, Address, and Year of Birth | Position(s) Held, Length of Time Served and Term of Office* | Principal Occupation During Past 5 Years | ||
Pamela Wade** Aberdeen Asset Management Inc. 1735 Market Street 32nd Floor Philadelphia, PA 19103 Year of Birth: 1971 | Assistant Secretary (Since March 2013) | Currently, Senior Product Manager for Aberdeen Asset Management Inc. Ms. Wade joined Aberdeen Asset Management Inc. in 2012 as Senior Product Manager. Prior to joining Aberdeen Asset Management Inc., Ms. Wade was a Vice President and Assistant Counsel with BNY Mellon Asset Servicing (2007-2012). |
| * | Each officer holds office for an indefinite term at the pleasure of the Board of Trustees and until his or her successor is elected and qualified. |
| ** | Mr. Hendry, Ms. Melia, Ms. Kennedy, Mr. Goodson, Ms. Nichols, Mr. Cotton, Mr. McCabe, Mr. Young, Ms. Sitar, Mr. O’Neill, Ms. Wade and Ms. Rosala hold officer position(s) in one or more of the following: Aberdeen Asia-Pacific Income Fund, Inc., Aberdeen Australia Equity Fund, Inc., Aberdeen Global Income Fund, Inc., Aberdeen Chile Fund, Inc., Aberdeen Israel Fund, Inc., Aberdeen Indonesia Fund, Inc., Aberdeen Latin America Equity Fund, Inc., Aberdeen Emerging Markets Smaller Company Opportunities Fund, Inc., Aberdeen Singapore Fund, Inc., The Asia Tigers Fund, Inc., The India Fund, Inc., Aberdeen Greater China Fund, Inc., Aberdeen Japan Equity Fund, Inc., Aberdeen Investment Funds and Aberdeen Global Select Opportunities Fund Inc., each of which may also be deemed to be a part of the same “Fund Complex” as the Trust. |
Annual Report 2014
140
Table of Contents
Management Information
Trustees
P. Gerald Malone, Chairman
Martin J. Gilbert
Richard H. McCoy
Neville J. Miles
Peter D. Sacks
John T. Sheehy
Warren C. Smith
John F. Solan, Jr.
Officers
Bev Hendry, President and Chief Executive Officer
Jeffrey Cotton, Chief Compliance Officer and Vice President
Sofia Rosala, Deputy Chief Compliance Officer and Vice President
Andrea Melia, Treasurer and Chief Financial Officer
Megan Kennedy, Secretary and Vice President
Brad Crombie, Vice President
Lucia Sitar, Vice President
Alan Goodson, Vice President
Adam McCabe, Vice President
Jennifer Nichols, Vice President
Hugh Young, Vice President
Eric Olsen, Assistant Treasurer
Brian O’Neill, Assistant Treasurer
Pamela Wade, Assistant Secretary
Investment Manager
Aberdeen Asset Management Inc.
1735 Market Street, 32nd Floor
Philadelphia, PA 19103
Fund Administrator
Aberdeen Asset Management Inc.
1735 Market Street, 32nd Floor
Philadelphia, PA 19103
Transfer Agent
Boston Financial Data Services, Inc.
30 Dan Road
Canton, MA 02021
Distributor
Aberdeen Fund Distributors LLC
1735 Market Street, 32nd Floor
Philadelphia, PA 19103
Sub-Administrator, Custodian & Fund Accountant
State Street Bank and Trust Company
1 Iron Street 5th Floor
Boston, MA 02110
Independent Registered Public Accounting Firm
KPMG LLP
1601 Market Street
Philadelphia, PA 19103
Fund Counsel
Willkie Farr & Gallagher LLP
787 Seventh Avenue
New York, NY 10019
Table of Contents
Aberdeen Asset Management Inc. 1735 Market Street, 32nd Floor Philadelphia, PA 19103 aberdeen-asset.us | |
AOE-0143-AR
Table of Contents
Item 2. Code of Ethics.
(a) As of October 31, 2014, the Registrant had adopted a code of ethics that applies to the Registrant’s principal executive officer, principal financial officer, principal accounting officer or controller, or persons performing similar functions (the “Code of Ethics”). The Code of Ethics is included with this Form N-CSR as Exhibit 12(a)(1). During the period covered by the report, no material changes were made to the provisions of the Code of Ethics and the Registrant did not grant any waivers to the provisions of the Code of Ethics.
Item 3. Audit Committee Financial Expert.
The Registrant’s Board of Trustees has determined that there is at least one member who qualifies as an “Audit Committee Financial Expert” serving on its Audit Committee. Mr. John F. Solan is the “Audit Committee Financial Expert” and is considered to be an “Independent Trustee” as each term is defined in Item 3 of Form N-CSR.
Item 4. Principal Accountant Fees and Services.
Fiscal Year Ended | (a) Audit Fees | (b) Audit-Related Fees | (c)1 Tax Fees | (d) All Other Fees | ||||||||||||
October 31, 2014 | $ | 553,345 | $ | — | $ | 172,320 | $ | — | ||||||||
October 31, 2013 | $ | 557,345 | $ | 13,000 | $ | 174,650 | $ | — | ||||||||
| 1 | The Tax Fees are for the completion of the Registrant’s federal and state tax returns. |
(e)(1) Pre-Approval Policies and Procedures. Except as permitted by Rule 2-01(c)(7)(i)(C) of Regulation S-X, the Registrant’s (hereinafter, the “Trust”) Audit Committee Charter authorizes the Audit Committee (“Committee”) to annually select, retain or terminate the Trust’s independent auditor and, in connection therewith, to evaluate the terms of the engagement and the qualifications and independence of the independent auditor, including whether the independent auditor provides any consulting, auditing or tax services to the investment adviser (hereinafter, the “Adviser”), and to receive the independent auditor’s specific representations as to their independence, delineating all relationships between the independent auditor and the Trust, consistent with Independence Standards Board (“ISB”) Standard No. 1. ISB No. 1 generally requires the auditor to annually: (1) disclose to the Committee all relationships between the auditor and its related entities and the Trust and its related entities that in the auditor’s professional judgment may reasonably be thought to bear on independence; (2) confirm that, in its professional judgment, it is independent of the Trust within SEC regulations; and (3) discuss the auditor’s independence with the Committee. The Committee is also authorized to review in advance, and consider approval of, any and all proposals by management or the Adviser that the Trust, Adviser or their affiliated persons, employ the independent auditor to render permissible non-audit services to the Trust and to consider whether such services are consistent with the independent auditor’s independence. The Committee may delegate to one or more of its members (“Delegates”) authority to pre-approve permissible non-audit services to be provided to the Trust. Any pre-approval determination of a Delegate shall be presented to the full Committee at its next meeting. The Committee shall communicate any pre-approval made by it or a Delegate to the Adviser, who will ensure that the appropriate disclosure is made in the Trust’s periodic reports required by Section 30 of the Investment Company Act of 1940, as amended, and other documents as required under the federal securities laws.
Table of Contents
(e)(2) None of the services described in each of paragraphs (b) through (d) of this Item involved a waiver of the pre-approval requirement by the Audit Committee pursuant to Rule 2-01 (c)(7)(i)(C) of Regulation S-X.
(f) Not applicable.
(g) The aggregate non-audit fees billed by the Registrant’s accountant for services to the Registrant and to the Registrant’s investment adviser and Service Affiliates for the Registrant’s fiscal years ended October 31, 2014 and October 31, 2013 were $621,410 and $877,862, respectively.
(h) The Registrant’s Audit Committee of the Board of Trustees has considered whether the provision of non-audit services that were rendered to the Registrant’s investment adviser (not including any sub-adviser whose role is primarily portfolio management and is subcontracted with or overseen by another investment adviser), and any entity controlling, controlled by, or under common control with the investment adviser that provides ongoing services to the Registrant that were not pre-approved pursuant to paragraph (c)(7)(ii) or Rule 2-01 of Regulation S-X is compatible with maintaining the principal accountant’s independence and has concluded that it is.
Item 5. Audit Committee of Listed Registrants.
Not applicable.
Item 6. Investments.
(a) Included as part of the Reports to Shareholders under Item 1 of this Form N-CSR.
(b) Not applicable.
Item 7. Disclosure of Proxy Voting Policies and Procedures for Closed-End Management Investment Companies.
Not applicable.
Item 8. Portfolio Managers of Closed-End Management Investment Companies.
Not applicable.
Item 9. Purchases of Equity Securities by Closed-End Management Investment Company and Affiliated Purchasers.
Not applicable.
Item 10. Submission of Matters to a Vote of Security Holders.
During the period ended October 31, 2014, there were no material changes to the procedures by which shareholders may recommend nominees to the Registrant’s Board of Trustees.
Table of Contents
Item 11. Controls and Procedures.
(a) The Registrant’s principal executive and principal financial officers, or persons performing similar functions, have concluded that the Registrant’s disclosure controls and procedures (as defined in Rule 30a-3(c) under the Investment Company Act of 1940 (the “Act”) (17 CFR 270.30a-3(c))) are effective, as of a date within 90 days of the filing date of the report that includes the disclosure required by this paragraph, based on the evaluation of these controls and procedures required by Rule 30a-3(b) under the Act (17 CFR 270.30a3(b)) and Rule 13a-15(b) or 15d-15(b) under the Securities Exchange Act of 1934 (17 CFR 240.13a-15(b) or 240.15d15(b)).
(b) There were no changes in the Registrant’s internal control over financial reporting (as defined in Rule 30a-3(d) under the Act (17 CFR 270.30a-3(d)) that occurred during the second fiscal quarter of the period covered by this report that have materially affected, or is reasonably likely to materially affect, the Registrant’s internal control over financial reporting.
Item 12. Exhibits.
(a)(1) The Code of Ethics of the Registrant for the period covered by this report as required pursuant to Item 2 of this Form N-CSR.
(a)(2) Certifications of the Registrant pursuant to Rule 30a-2(a) under the Act are exhibits to this report.
(a)(3) Not applicable.
| (b) | Certifications of the Registrant pursuant to Rule 30a-2(b) under the Act are exhibits to this report. |
Table of Contents
SIGNATURES
Pursuant to the requirements of the Securities Exchange Act of 1934 and the Investment Company Act of 1940, the registrant has duly caused this report to be signed on its behalf by the undersigned, thereunto duly authorized.
Aberdeen Funds
| By: | /s/ Bev Hendry | |
| Bev Hendry | ||
| Principal Executive Officer of | ||
| Aberdeen Funds | ||
Date: January 7, 2015
Pursuant to the requirements of the Securities Exchange Act of 1934 and the Investment Company Act of 1940, this report has been signed below by the following persons on behalf of the registrant and in the capacities and on the dates indicated.
| By: | /s/ Bev Hendry | |
| Bev Hendry | ||
| Principal Executive Officer of | ||
| Aberdeen Funds | ||
Date: January 7, 2015
| By: | /s/ Andrea Melia | |
| Andrea Melia | ||
| Principal Financial Officer of | ||
| Aberdeen Funds | ||
Date: January 7, 2015