UNITED STATES
SECURITIES AND EXCHANGE COMMISSION
Washington, D.C. 20549
FORM N-CSR
CERTIFIED SHAREHOLDER REPORT OF
REGISTERED MANAGEMENT INVESTMENT COMPANIES
Investment Company Act file number: 811-22132
Exact name of registrant as specified in charter:
Aberdeen Funds
Address of principal executive offices:
1735 Market Street, 32nd Floor
Philadelphia, PA 19103
Name and address of agent for service:
Ms. Andrea Melia
Aberdeen Asset Management Inc.
1735 Market Street, 32nd Floor
Philadelphia, PA 19103
Registrant’s telephone number, including area code: 866-667-9231
Date of fiscal year end: October 31
Date of reporting period: October 31, 2017
Item 1. Reports to Shareholders.

Aberdeen Funds
Equity Series
Annual Report
October 31, 2017
Aberdeen Asia-Pacific (ex-Japan) Equity Fund
Aberdeen China Opportunities Fund
Aberdeen Emerging Markets Fund
Aberdeen Focused U.S. Equity Fund (formerly, Aberdeen Equity Long-Short Fund)
Aberdeen Global Equity Fund
Aberdeen International Equity Fund
Aberdeen International Small Cap Fund
Aberdeen Japanese Equities Fund
Aberdeen U.S. Mid Cap Equity Fund
Aberdeen U.S. Multi-Cap Equity Fund
Aberdeen U.S. Small Cap Equity Fund

| Page 2 | ||||
| Page 4 | ||||
| Page 10 | ||||
| Page 16 | ||||
| Page 24 | ||||
| Page 31 | ||||
| Page 37 | ||||
| Page 43 | ||||
| Page 49 | ||||
| Page 54 | ||||
| Page 60 | ||||
| Page 66 | ||||
| Page 72 | ||||
| Page 116 | ||||
| Page 134 | ||||
| Page 135 | ||||
| Page 137 | ||||
| Page 139 | ||||
| Page 142 | ||||
Investors should carefully consider a fund’s investment objectives, risks, fees, charges and expenses before investing any money. To obtain this and other fund information, please call 866-667-9231 to request a prospectus, or download a prospectus at www.aberdeen-asset.us. Please read it carefully before investing any money.
Investing in mutual funds involves risk, including possible loss of principal.
Aberdeen Funds is distributed by Aberdeen Fund Distributors LLC, Member FINRA, 1735 Market Street, 32nd Floor, Philadelphia, PA 19103.
Aberdeen Asset Management Inc. (“AAMI”) has been registered as an investment adviser under the Investment Advisers Act of 1940 since August 23, 1995.
Statement Regarding Availability of Quarterly Portfolio Schedule.
The complete schedule of portfolio holdings for each fund of Aberdeen Funds (each a “Fund” and collectively, the “Funds”) is included in the Funds’ semi-annual and annual reports to shareholders. Aberdeen Funds also files complete schedules of portfolio holdings for each Fund with the Securities and Exchange Commission (the “Commission”) for the first and third quarters of each fiscal year on Form N-Q. The Funds’ Form N-Q filings are available on the Commission’s website at http://www.sec.gov. The Funds’ Form N-Q filings may be reviewed and copied at the Commission’s Public Reference Room in Washington, DC, and information on the operation of the Public Reference Room may be obtained by calling 800-SEC-0330; and the Funds make the information on Form N-Q available to shareholders on www.aberdeen-asset.us or upon request without charge.
Statement Regarding Availability of Proxy Voting Record.
Information regarding the policies and procedures that the Funds use to determine how to vote proxies relating to portfolio securities is available without charge, upon request, by calling 1-866-667-9231. The information is also included in the Funds’ Statement of Additional Information, which is available on the Funds’ website at www.aberdeen-asset.us and on the Commission’s website at www.sec.gov.
Information relating to how each Fund voted proxies relating to portfolio securities held during the most recent twelve months ended June 30 is available by August 30 of the relevant year: (i) upon request and without charge by calling 1-866-667-9231; and (ii) on the Commission’s website at www.sec.gov.
It appeared that the 12-month period ended October 31, 2017 saw the waning of the populist movement and a move towards the center in the global political arena. Early in the period in November 2016, Republican Donald Trump unexpectedly won the U.S. presidential election, defeating his Democratic party opponent, former U.S. Senator and Secretary of State Hillary Clinton. Trump’s victory seemed to be a continuation of the populist political movement that led to the UK’s vote to leave the European Union (known as Brexit) in June 2016. However, there appeared to be a change in voters’ sentiment in the spring of 2017, as candidates campaigning on a populist platform in the Netherlands and France lost national elections to more politically moderate opponents. Incumbent Prime Minister Mark Rutte’s People’s Party for Freedom and Democracy (VVD) won significantly more seats in the Dutch Parliament than Geert Wilders’ far-right Party for Freedom (PPV) in the Netherlands’ election in March 2017. Independent centrist candidate Emmanuel Macron subsequently claimed victory in the final round of the French presidential election in early May 2017, by a nearly two-to-one margin over far-right candidate Marine Le Pen. In the U.S., President Trump encountered numerous political challenges and obstacles to the fulfillment of his campaign promises – most notably the ongoing investigation of several members of his administration into possible collusion with the Russian government during the presidential election of 2016.
On the geopolitical front, in September 2017, North Korean leader Kim Jong Un claimed that the nation conducted a successful underground detonation of a hydrogen bomb, which reached a magnitude of 6.3 on the Richter scale, according to the U.S. Geological Survey. The following week, North Korea fired another intermediate-range ballistic missile which passed over the island of Hokkaido in Japan and subsequently landed in the Pacific Ocean. The launch from Pyongyang, North Korea’s capital, occurred after the United Nations Security Council unanimously adopted new sanctions against the nation.
The Morgan Stanley Capital International (MSCI) World Index,1 a global equity market benchmark, rose 23.4% for the 12-month period ended October 31, 2017. European large-cap stocks were the strongest performers among global developed markets, with the MSCI Europe Index up 27.0%. Shares of Asian and U.S. large-cap companies, as represented by the MSCI All Country (AC) Asia Pacific Index and the U.S. broader-market Standard & Poor’s (S&P) 500 Index, recorded corresponding gains of 23.7% and 23.6% over the period. Global emerging equity markets, as measured by the MSCI Emerging Markets Index, outperformed their developed-market counterparts, advancing 26.9% for the reporting period
Major U.S. equity indices moved sharply higher over the reporting period despite several periods of uncertainty surrounding the policies of the Trump administration. Most U.S. companies reported strong results and generally upbeat outlooks during the period. Corporate earnings generally were strong enough to support stocks across the market-capitalization ranges. U.S. small-cap stocks, as measured by the Russell 2000 Index, advanced 27.9% for the reporting period, outperforming the 23.6% and 21.1% returns of their large- and mid-cap counterparts, as measured by the S&P 500 Index and the Russell Midcap Index, respectively. Roughly 75% of S&P 500 Index companies posted better-than-expected earnings per share (EPS) for the third-quarter 2017 reporting season, while two-thirds exceeded consensus revenue estimates.2
Both European and UK stocks3 posted double-digit gains over the reporting period. In the Eurozone, the economic recovery, as well as investors’ positive views on the outcomes from elections in France and the Netherlands, strengthened the equity market. However, the rally was tempered by investors’ worries over rising secessionist fervor in the Catalonia region of Spain and its potential disruption to business operations. The UK market was hampered somewhat by Prime Minister Theresa May’s failed bid to secure a larger mandate from a snap election that resulted in a hung Parliament in June 2017.
The Asia-Pacific market also saw strong performance over the reporting period despite geopolitical tensions on the Korean peninsula and uncertainty regarding the prospect of major global central banks withdrawing monetary stimulus. China led the upturn in the region, buttressed by upbeat economic growth data, along with benchmark index provider MSCI’s decision to include A-shares4 in its influential indices and a sustained rise in Chinese internet stocks. Late in the reporting period, investors appeared to shrug off S&P’s downgrade of the country’s sovereign debt rating.5 Conversely, while Japanese equities rose sharply over the reporting period, they underperformed the overall Asia-Pacific region and their global developed-market counterparts due to investors’ concerns regarding external factors such as the volatile political environment in the U.S. and UK.
Emerging stock markets generally posted healthy gains for the reporting period. Within Latin America, Brazilian equities performed well despite a notable decline in May 2017, after President Michel Temer became implicated in a corruption scandal. Mexican stocks and the peso initially recovered from a post-U.S. election sell-off, but uncertainty over the fate of the North American Free Trade Agreement (NAFTA) and natural disasters capped gains towards the end of the reporting period. Economic growth in India slowed over the reporting period due to the lingering effects of the government’s demonetization,6 which it initiated in November 2016, while the Goods and Services Tax was implemented in July 2017.
Despite political risks in the U.S., Europe and the UK, global fixed-income markets garnered modestly positive returns over the reporting period amid an improving global economic backdrop. Investment-grade securities, as measured by the Bloomberg Barclays Global Aggregate Bond Index, returned 1.2% for the period. Global high-yield bonds outperformed their investment-grade counterparts by a wide margin, with the ICE Bank of America Merrill Lynch Global High Yield Constrained Index gaining 9.4% for the period. Global government bond yields moved higher after the U.S. presidential
| 2 | Annual Report 2017 |
Market Review (concluded)
election in November 2016, but slowly reversed direction throughout most of 2017; the 10-year U.S. Treasury yield rose 54 basis points to 2.38% over the reporting period. Donald Trump’s win in the November 2016 U.S. presidential election fueled expectations of increased fiscal spending and rising inflation, which halted the global bond market rally at that time. Towards the end of the reporting period, bond yields rose again as major global central banks edged closer towards ending the era of accommodative monetary policy. Both the U.S. Federal Reserve (Fed) and European Central Bank decided to start tapering their quantitative-easing programs. G107 currencies were mostly stronger against the U.S. dollar, while those in emerging markets ended with mixed performance.
Outlook
We believe that generally good economic conditions should support global equity prices. Business sentiment in the U.S. is likely to be buoyed by prospects of lower corporate taxes, in our view. Banks in the Eurozone anticipate healthier demand for loans from both businesses and households. Supporting this environment are still-low interest rates, increased capital expenditures, a favorable housing market, relatively low unemployment and rising consumer confidence. In Japan, investor sentiment improved following Prime Minister Shinzo Abe’s election victory in October 2017, which strengthened his mandate to implement reforms. However, we think that economic growth may moderate in China, as the Chinese Communist Party appears to be prioritizing stability over aggressive growth targets. For emerging markets, we think that future growth may be helped by structural reforms and a rebound in commodity prices. Crude oil prices are recovering, bolstered by growing demand, supply cuts, and stabilizing shale oil production. In addition to these developments, stock-market volatility, as measured by the CBOE Volatility Index,8 is at historical lows. In our view, equities now appear expensive in the U.S. While we do not think that valuations leave much room for upside, we also see little reason for a significant correction outside some external shock – which obviously is not out of the question given political instability both domestically and abroad. We believe that there is scope for improved earnings in Europe, while operational performance in Asia has been improving. We are cognizant that the move by major global central banks to exit quantitative easing, the unresolved Brexit issue in the UK, rising trade protectionism and geopolitical risks could dent corporate earnings growth. However, we believe that our bottom-up investment approach positions our equity portfolios well in the current global market environment. We will remain diligent in monitoring company valuations, financial performance and governance against their growth prospects in an effort to hold investments that we believe can withstand future challenges.
In early November 2017, the Bank of England raised its benchmark interest rate for the first time in a decade and indicated the beginning of a gradual increase in borrowing costs, as monetary policymakers seek to prevent a sustained rise in inflation without choking economic recovery. Meanwhile, the Fed grew more vocal about reducing its balance sheet. While we feel that global bond markets have taken this news in stride, we will not be surprised if the sell-off gathers pace. We do not think that such moves to drain liquidity from the global financial system will go unnoticed as risks to the nascent global economic recovery persist. In credit markets, valuations look expensive, so we will narrow our search to investment-grade companies that we believe have strong balance sheets, healthy cash flows and good management.
Aberdeen Standard Investments
| 1 | Indexes are unmanaged and have been provided for comparison purposes only. No fees or expenses are reflected. You cannot invest directly in an index. |
| 2 | Source: FactSet, “Earnings Insight,” November 2017. |
| 3 | The performance of UK stocks is measured by the MSCI United Kingdom Index. |
| 4 | A-shares are purchased and traded on the Shanghai and Shenzhen stock exchanges. |
| 5 | Standard & Poor’s credit ratings express the agency’s opinion about the ability and willingness of an issuer, such as a corporation or state or city government, to meet its financial obligations in full and on time. Typically, ratings are expressed as letter grades that range, for example, from “AAA” to “D” to communicate the agency’s opinion of relative level of credit risk. Ratings from “AA” to “CCC” may be modified by the addition of a plus (+) or minus (-) sign to show relative standing within the major rating categories. |
| 6 | Demonetization comprises the act of stripping specific denominations of a currency unit of their status as legal tender. The currency denominations are pulled from circulation and are replaced with new currency units. |
| 7 | The G10 nations, which consult and cooperate on economic, monetary and financial matters, include Belgium, Canada, France, Germany, Italy, Japan, the Netherlands, Sweden, Switzerland, the UK and the U.S. |
| 8 | The CBOE Volatility Index is a measure of market expectations of near-term volatility conveyed by S&P 500 stock index option prices. |
| 2017 Annual Report | 3 |
Aberdeen Asia-Pacific (ex-Japan) Equity Fund (Unaudited)
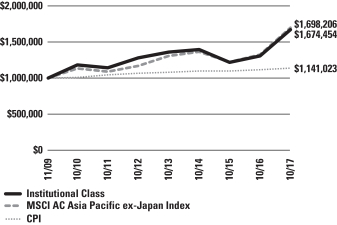
The Aberdeen Asia-Pacific (ex-Japan) Equity Fund (Institutional Class shares net of fees) returned 28.21% for the 12-month period ended October 31, 2017, versus the 28.03% return of its benchmark, the Morgan Stanley Capital International (MSCI) All Country (AC) Asia Pacific ex Japan Index, during the same period. For broader comparison, the average return of the Fund’s category of Pacific ex-Japan Funds (comprising 40 funds), as measured by Lipper, Inc., was 26.51% for the period.
Asian equities posted solid gains over the 12-month reporting period, driven by improving corporate fundamentals across the region and a recovery in global trade. However, the upturn was capped by investors’ doubts over U.S. President Donald Trump’s ability to deliver on his economic agenda, geopolitical tensions on the Korean peninsula, and the prospect of major central banks withdrawing monetary stimulus.
China’s equity market outpaced the overall Asia-Pacific region. Upbeat economic growth data, along with benchmark index provider MSCI’s decision to include China A-shares1 in its influential indices and a sustained rise in Chinese internet stocks, drove the mainland market, despite Beijing’s increased regulatory scrutiny and efforts to tighten leverage. Meanwhile, a rally in the technology sector underpinned equity markets in Korea and Taiwan, with companies in the Apple supply chain among the beneficiaries. The Korean market also gained ground on investors’ hopes that tensions with China over the Terminal High Altitude Area Defense (THAAD) missile system would thaw after South Korean President Moon Jae-in took office in May 2017.
Conversely, the performance of equities in the Philippines, Malaysia and Indonesia trailed the overall Asia-Pacific region for the reporting period. Philippine stocks lagged after an extended run-up, hampered by President Rodrigo Duterte’s unpredictability and domestic political events. Both consumer spending and consumer confidence remained sluggish in Indonesia despite favorable economic conditions. The Malaysian economy continued to feel the impact of the Goods and Services tax enacted in April 2015, with inflation rising, while a weaker ringgit, the nation’s currency unit, increased the costs of imports.
The Fund’s modest outperformance versus its benchmark, the MSCI AC Asia Pacific ex Japan Index, over the reporting period was attributable mainly to positive stock selection in Australia, Singapore and India.
In Australia, shares of miners Rio Tinto and BHP Billiton rallied over the period as iron ore prices rebounded on the back of China’s improving macroeconomic outlook. The Fund’s other Australian holding, blood plasma manufacturer CSL, was also a strong contributor to the relative performance. We trimmed the Fund’s position in CSL after its stock price rose sharply in 2017, as the company reported strong earnings from its immunoglobulin and specialty products. We like CSL’s business, as we feel that the company has a decent growth pipeline and a wide moat2 in a sector that has consolidated.
The Fund’s holdings in Singapore-based banks Oversea-Chinese Banking Corp. (OCBC), DBS Group Holdings and United Overseas Bank (UOB) also performed well, as investors’ concerns regarding their asset quality eased and fee income improved. The companies’ third-quarter 2017 results demonstrated steady loan growth, backed by healthy levels of capital. The rally in the banks’ shares provided us with the opportunity to take some profits.
In India, shares of Grasim Industries outperformed after the conglomerate restructured its business and realized substantial hidden value in spinning off its financial holding company, Aditya Birla Capital. HDFC Bank benefited from the Indian government’s demonetization,3 posting solid income growth over the reporting period that was driven largely by an increase in net interest income.
In contrast, the Fund’s positioning in China weighed on the relative performance for the reporting period. The underweight exposure to the market relative to the benchmark MSCI AC Asia Pacific ex Japan Index detracted from performance as the MSCI China Index led the Asia-Pacific region’s gains. As we noted previously, China’s market rally was underpinned by the strong performance of internet stocks. Tencent Holdings and Alibaba stood out, buoyed by momentum trading4 and solid results. Therefore, the Fund’s underweight exposure to Tencent relative to the benchmark and the absence of a position in MSCI AC Asia Pacific ex Japan Index constituent Alibaba detracted from the Fund’s relative performance. We initiated a relatively small position in Tencent towards the end of the reporting period in September 2017. This reflects our growing conviction in, and comfort with, its business, corporate structure and governance. We think that the valuation reflects its high-quality growth potential. Tencent has succeeded in diversifying its presence in the Chinese internet space, creating a powerful ecosystem that leverages on the network effects of its various offerings, while at the same time navigating the migration of gaming from PC to mobile. We believe that this combination of an expanding ecosystem and a growing monetization5 of the user base will drive earnings growth. We are more circumspect regarding Alibaba. While the company has a strong competitive moat and impressive business model, we see potential downside risks from poor corporate governance.
The Fund’s holding in Indonesian conglomerate Astra International hampered the Fund’s relative performance for the reporting period. A more competitive environment had weighed on the company’s auto
| 4 | Annual Report 2017 |
| 1 | China A-shares are purchased and traded on the Shanghai and Shenzhen stock exchanges. |
| 2 | A business moat refers to the ability of a company to maintain competitive advantages over its competitors in an effort to protect its long-term profits and market share from competing firms. |
| 3 | Demonetization comprises the act of stripping specific denominations of a currency unit of their status as legal tender. The currency denominations are pulled from circulation and are replaced with new currency units. |
| 4 | Momentum trading seeks to capitalize on market volatility by focusing on stocks that are moving significantly in one direction on high volume. |
| 5 | Monetization comprises the conversion of an asset into money or legal tender. |
Aberdeen Asia-Pacific (ex-Japan) Equity Fund (Unaudited) (concluded)
business, although that proved to be temporary. Astra International reported improvement from all of its business segments in the third quarter of its 2017 fiscal year, led by earnings from heavy equipment distributor United Tractor. The conglomerate’s performance was also enhanced by its subsidiary, Permata Bank, which turned profitable in the third quarter due to lower credit costs.
Apart from the portfolio activity that we noted previously, we initiated a position in Yum China Holdings following the parent company’s (Yum! Brands) restructuring. We also established new positions in Hangzhou Hikvision Digital Technology Co., a large global video surveillance vendor; appliance manufacturer Midea Group Co., alcoholic beverage producer Kweichow Moutai Co.; Shanghai International Airport, a leading airport operator in China; consumer products maker Hindustan Unilever; and Indian private-sector lender Kotak Mahindra Bank. Conversely, we exited the Fund’s position in India-based ICICI Bank.
In the latter half of the reporting period, we initiated positions in China International Travel Services (CITS) and China Resources Land (CR Land). CITS is the mainland’s largest duty-free operator, which we believe is poised to benefit from rising consumer spending and growing demand for domestic travel. CR Land is a Hong Kong exchange-listed Chinese real estate developer that in our view has strong profitability, a substantial land bank, as well as a good business mix of property development and investment.
Elsewhere, we also introduced Bangkok Dusit Medical Services (BDMS), the largest private hospital group in Thailand with well-recognized brands and good management. It stands to benefit from the rising demand for healthcare domestically and medical tourism6 across the region, given its reputation in high-quality complex treatments.
In India, we exited the Fund’s position in software services company Infosys. While the dust appears to have settled somewhat, with one of its founders Nandan Nilekani returning as non-executive chairman following Vishal Sikka’s resignation as chief executive, we think that the company could continue to face uncertainty on strategy, board and management leadership. From a regional perspective, we feel that the company is now less attractive quality-wise when compared to other Asian holdings.
Asian markets continue to enjoy a “sweet spot” of improving economic growth prospects and favorable external conditions: corporate earnings have been improving amid growing evidence of a synchronized worldwide economic recovery. Global financial conditions remain relatively easy because of accommodative monetary policies, with the U.S. Federal Reserve raising rates gradually and continued quantitative easing in Japan. Consequently, global markets have recorded strong performance thus far in 2017. Many countries are expected to enjoy sustained economic growth into 2018, which we believe should benefit the Fund’s holdings.
Portfolio Management:
Aberdeen Asia-Pacific Equity Team
PAST PERFORMANCE DOES NOT GUARANTEE FUTURE RESULTS.
The performance data quoted represents past performance and current returns may be lower or higher. Class A Shares have up to a 5.75% front-end sales charge and a 0.25% 12b-1 fee. The investment return and principal value will fluctuate so that an investor’s shares, when redeemed, may be worth more or less than the original cost. To obtain performance information current to the most recent month-end, which may be higher or lower than the performance shown above, please call 866-667-9231 or go to www.aberdeen-asset.us.
Investing in mutual funds involves risk, including the possible loss of principal.
Indexes are unmanaged and have been provided for comparison purposes only. No fees or expenses are reflected. You cannot invest directly in an index.
Lipper is a leading global provider of mutual fund information and analysis to fund companies, financial intermediaries and media organizations.
Risk Considerations
Concentrating investments in the Asia-Pacific region subjects the Fund to more volatility and greater risk of loss than geographically diverse mutual funds.
Parts of the Asia-Pacific region may be subject to a greater degree of economic, political and social instability than is the case in the United States and Europe. Some Asian countries can be characterized as emerging markets or newly industrialized and may experience more volatile economic cycles than developed countries.
Foreign securities may be more volatile, harder to price and less liquid than U.S. securities. They are subject to different accounting and regulatory standards, currency exchange rates, political and economic risks. Fluctuation in currency exchange rates may impact the Fund’s returns more greatly to the extent the Fund does not hedge currency exposure or hedging techniques are unsuccessful. The foregoing risks are enhanced in emerging market countries.
Equity stocks of small- and mid-cap companies carry greater risk and more volatility than equity stocks of larger, more established companies.
Investing a significant portion of the Fund’s assets in securities of companies conducting business in a broadly related group of industries within an economic sector may make the Fund more vulnerable to unfavorable developments in that sector.
Please read the prospectus for more detailed information regarding these and other risks.
| 6 | Medical tourism is the process of traveling outside an individual’s country of residence for the purpose of receiving medical care. |
| 2017 Annual Report | 5 |
Aberdeen Asia-Pacific (ex-Japan) Equity Fund (Unaudited)
| Average Annual Total Return (For periods ended October 31, 2017) | 1 Yr. | 5 Yr. | Inception1 | |||||||||||
Class A2 | w/o SC | 27.84% | 5.27% | 5.55% | ||||||||||
| w/SC3 | 20.49% | 4.02% | 4.45% | |||||||||||
Class C2 | w/o SC | 27.07% | 4.55% | 4.81% | ||||||||||
| w/SC4 | 26.07% | 4.55% | 4.81% | |||||||||||
Class R2,5 | w/o SC | 27.56% | 5.02% | 5.28% | ||||||||||
Institutional Service Class5 | w/o SC | 28.02% | 5.49% | 6.66% | ||||||||||
Institutional Class5 | w/o SC | 28.21% | 5.53% | 6.69% | ||||||||||
All figures showing the effect of a sales charge (SC) reflect the maximum charge possible because it has the most significant effect on performance data. The total returns shown above do not include the impact of financial statement rounding of the net asset value (NAV) per share and/or financial statement adjustments.
| 1 | Fund commenced operations on November 16, 2009. |
| 2 | Returns before the first offering of Class A, Class C and Class R (February 28, 2012) are based on the previous performance of the Institutional Class. Returns of each class have not been adjusted to reflect the expenses applicable to the respective classes. Excluding the effect of any fee waivers or reimbursements, this performance is substantially similar to what Class A, Class C and Class R would have produced because all classes invest in the same portfolio of securities. Returns for Class A, Class C and Class R shares would only differ to the extent of the difference in expenses of the classes. |
| 3 | A 5.75% front-end sales charge was deducted. |
| 4 | A 1.00% contingent deferred sales charge (CDSC) was deducted from the one year return because it is charged when Class C shares are sold within the first year after purchase. |
| 5 | Not subject to any sales charges. |
Performance of a $1,000,000 Investment* (as of October 31, 2017)
| * | Minimum Initial Investment |
Comparative performance of $1,000,000 invested in Institutional Class shares of the Aberdeen Asia-Pacific (ex-Japan) Equity Fund, the Morgan Stanley Capital International All Country (MSCI AC) Asia Pacific ex-Japan Index and the Consumer Price Index (CPI) since inception. Unlike the Fund, the returns for these unmanaged indexes do not reflect any fees, expenses, or sales charges. Investors cannot invest directly in market indexes.
The MSCI AC Asia Pacific ex Japan Index captures large and mid cap representation across 4 of 5 Developed Markets countries (excluding Japan) and 9 Emerging Markets countries in the Asia Pacific region. With 710 constituents, the index covers approximately 85% of the free float-adjusted market capitalization in each country. Developed Markets countries in the index are: Australia, Hong Kong, New Zealand and Singapore. Emerging Markets countries in the Index are: China, India, Indonesia, Korea, Malaysia, Pakistan, the Philippines, Taiwan and Thailand.
The CPI is a measure of the average change over time in the prices paid by urban consumers for a market basket of consumer goods and services.
Investment return and principal value will fluctuate, and when redeemed, shares may be worth more or less than original cost. Past performance is no guarantee of future results. The Average Annual Total Return table and Performance graph do not reflect the deduction of taxes that a shareholder would pay on fund distributions or the redemption of fund shares. Investing in mutual funds involves market risk, including loss of principal. Performance returns assume the reinvestment of all distributions. Total returns reflect waivers and reimbursements in effect, without which returns would have been lower.
| 6 | Annual Report 2017 |
Aberdeen Asia-Pacific (ex-Japan) Equity Fund (Unaudited) (concluded)
Portfolio Summary (as a percentage of net assets)
October 31, 2017 (Unaudited)
| Asset Allocation | ||||
Common Stocks | 92.7% | |||
Preferred Stocks | 5.8% | |||
Short-Term Investment | 0.5% | |||
Other Assets in Excess of Liabilities | 1.0% | |||
| 100.0% | ||||
The following table summarizes the composition of the Fund’s portfolio, in Standard & Poor’s Global Industry Classification Standard (GICS) sectors, expressed as a percentage of net assets. The GICS structure consists of 11 sectors, 24 industry groups, 68 industries and 157 sub-industries. As of October 31, 2017, the Fund did not have more than 25% of its assets invested in any industry group.
| Top Sectors | ||||
Financials | 29.2% | |||
Information Technology | 15.6% | |||
Materials | 10.3% | |||
Industrials | 9.0% | |||
Real Estate | 8.2% | |||
Consumer Discretionary | 8.1% | |||
Consumer Staples | 7.6% | |||
Telecommunication Services | 7.4% | |||
Health Care | 2.4% | |||
Energy | 0.7% | |||
Other | 1.5% | |||
| 100.0% | ||||
| Top Holdings* | ||||
Samsung Electronics Co. Ltd., Preferred Shares | 5.0% | |||
Taiwan Semiconductor Manufacturing Co. Ltd. | 4.0% | |||
Oversea-Chinese Banking Corp. Ltd. | 3.6% | |||
AIA Group Ltd. | 3.1% | |||
City Developments Ltd. | 3.1% | |||
Singapore Telecommunications Ltd. | 3.0% | |||
Jardine Strategic Holdings Ltd. | 3.0% | |||
Housing Development Finance Corp. Ltd. | 2.9% | |||
China Mobile Ltd. | 2.9% | |||
Ayala Corp. | 2.7% | |||
Other | 66.7% | |||
| 100.0% | ||||
| * | For the purpose of listing top holdings, Short-Term Investments are included as part of Other. |
| Top Countries | ||||
Singapore | 16.5% | |||
China | 15.8% | |||
Hong Kong | 15.5% | |||
India | 12.7% | |||
Republic of South Korea | 9.4% | |||
United Kingdom | 6.3% | |||
Indonesia | 6.1% | |||
Taiwan | 5.5% | |||
Philippines | 4.1% | |||
Thailand | 2.8% | |||
Other | 5.3% | |||
| 100.0% | ||||
| 2017 Annual Report | 7 |
Statement of Investments
October 31, 2017
Aberdeen Asia-Pacific (ex-Japan) Equity Fund
| Shares or Principal Amount | Value | |||||||
COMMON STOCKS (92.7%) | ||||||||
AUSTRALIA (1.9%) | ||||||||
Health Care (1.9%) | ||||||||
CSL Ltd. (a) | 2,050 | $ | 218,245 | |||||
CHINA (15.8%) | ||||||||
Consumer Discretionary (4.3%) | ||||||||
China International Travel Service Corp. Ltd., A Shares (Stock Connect) (a)(b) | 25,399 | 158,697 | ||||||
Midea Group Co. Ltd., A Shares (Stock Connect) (a)(b) | 21,999 | 169,326 | ||||||
Yum China Holdings, Inc. (c) | 4,009 | 161,763 | ||||||
| 489,786 | ||||||||
Consumer Staples (1.8%) | ||||||||
Kweichow Moutai Co. Ltd., A Shares (Stock Connect) (a)(b) | 2,200 | 205,702 | ||||||
Energy (0.7%) | ||||||||
PetroChina Co. Ltd., H Shares (a) | 126,000 | 82,366 | ||||||
Industrials (1.2%) | ||||||||
Shanghai International Airport Co. Ltd., A Shares (Stock Connect) (a)(b) | 20,198 | 133,497 | ||||||
Information Technology (2.7%) | ||||||||
Hangzhou Hikvision Digital Technology Co. Ltd., A Shares (Stock Connect) (a)(b) | 31,900 | 189,214 | ||||||
Tencent Holdings Ltd. (a) | 2,500 | 112,363 | ||||||
| 301,577 | ||||||||
Materials (1.4%) | ||||||||
Anhui Conch Cement Co. Ltd., H Shares (a) | 36,500 | 156,355 | ||||||
Real Estate (0.8%) | ||||||||
China Resources Land Ltd. (a) | 32,000 | 95,503 | ||||||
Telecommunication Services (2.9%) | ||||||||
China Mobile Ltd. (a) | 32,000 | 321,868 | ||||||
| 1,786,654 | ||||||||
HONG KONG (15.5%) | ||||||||
Financials (7.2%) | ||||||||
AIA Group Ltd. (a) | 46,200 | 348,139 | ||||||
Hong Kong Exchanges & Clearing Ltd. (a) | 7,981 | 222,384 | ||||||
HSBC Holdings PLC (a) | 25,344 | 247,595 | ||||||
| 818,118 | ||||||||
Industrials (4.0%) | ||||||||
Jardine Strategic Holdings Ltd. (a) | 8,100 | 339,755 | ||||||
MTR Corp. Ltd. (a) | 18,459 | 107,016 | ||||||
| 446,771 | ||||||||
Real Estate (4.3%) | ||||||||
Hang Lung Group Ltd. (a) | 44,000 | 154,602 | ||||||
Swire Pacific Ltd., Class B (a) | 52,500 | 90,749 | ||||||
Swire Properties Ltd. (a) | 71,700 | 242,290 | ||||||
| 487,641 | ||||||||
| 1,752,530 | ||||||||
INDIA (12.7%) | ||||||||
Consumer Discretionary (1.2%) | ||||||||
Hero MotoCorp Ltd. (a) | 2,325 | 138,508 | ||||||
Consumer Staples (2.9%) | ||||||||
Hindustan Unilever Ltd. (a) | 3,000 | 57,405 | ||||||
ITC Ltd. (a) | 64,400 | 264,562 | ||||||
| 321,967 | ||||||||
Financials (4.9%) | ||||||||
Aditya Birla Capital Ltd. (c)(d) | 4,263 | 11,706 | ||||||
HDFC Bank Ltd. (a) | 3,830 | 107,106 | ||||||
Housing Development Finance Corp. Ltd. (a) | 12,508 | 328,625 | ||||||
Kotak Mahindra Bank Ltd. (a) | 6,900 | 109,436 | ||||||
| 556,873 | ||||||||
Information Technology (1.5%) | ||||||||
Tata Consultancy Services Ltd. (a) | 4,158 | 168,207 | ||||||
Materials (2.2%) | ||||||||
Grasim Industries Ltd. (a) | 12,870 | 244,522 | ||||||
| 1,430,077 | ||||||||
INDONESIA (6.1%) | ||||||||
Consumer Discretionary (2.6%) | ||||||||
Astra International Tbk PT (a) | 501,900 | 296,054 | ||||||
Consumer Staples (0.9%) | ||||||||
Unilever Indonesia Tbk PT | 28,600 | 104,594 | ||||||
Financials (2.6%) | ||||||||
Bank Central Asia Tbk PT (a) | 190,600 | 293,608 | ||||||
| 694,256 | ||||||||
MALAYSIA (1.9%) | ||||||||
Financials (1.9%) | ||||||||
CIMB Group Holdings Bhd (a) | 70,148 | 101,738 | ||||||
Public Bank Bhd (a) | 23,200 | 112,115 | ||||||
| 213,853 | ||||||||
PHILIPPINES (4.1%) | ||||||||
Financials (4.1%) | ||||||||
Ayala Corp. (a) | 15,360 | 306,511 | ||||||
Bank of the Philippine Islands | 80,515 | 152,842 | ||||||
| 459,353 | ||||||||
REPUBLIC OF SOUTH KOREA (3.6%) | ||||||||
Consumer Staples (1.2%) | ||||||||
Amorepacific Group (a) | 126 | 16,158 | ||||||
E-MART, Inc. (a) | 588 | 117,705 | ||||||
| 133,863 | ||||||||
Information Technology (2.4%) | ||||||||
NAVER Corp. (a) | 341 | 272,552 | ||||||
| 406,415 | ||||||||
See accompanying Notes to Financial Statements.
| 8 | Annual Report 2017 |
Statement of Investments (concluded)
October 31, 2017
Aberdeen Asia-Pacific (ex-Japan) Equity Fund
| Shares or Principal Amount | Value | |||||||
SINGAPORE (16.5%) | ||||||||
Financials (6.6%) | ||||||||
DBS Group Holdings Ltd. (a) | 13,715 | $ | 229,021 | |||||
Oversea-Chinese Banking Corp. Ltd. (a) | 46,693 | 407,799 | ||||||
United Overseas Bank Ltd. (a) | 6,174 | 111,537 | ||||||
| 748,357 | ||||||||
Industrials (3.8%) | ||||||||
Keppel Corp. Ltd. (a) | 48,100 | 264,756 | ||||||
Singapore Technologies Engineering Ltd. (a) | 63,800 | 162,879 | ||||||
| 427,635 | ||||||||
Real Estate (3.1%) | ||||||||
City Developments Ltd. (a) | 36,200 | 343,787 | ||||||
Telecommunication Services (3.0%) | ||||||||
Singapore Telecommunications Ltd. (a) | 124,900 | 343,720 | ||||||
| 1,863,499 | ||||||||
TAIWAN (5.5%) | ||||||||
Information Technology (4.0%) | ||||||||
Taiwan Semiconductor Manufacturing Co. Ltd. | 56,000 | 451,201 | ||||||
Telecommunication Services (1.5%) | ||||||||
Taiwan Mobile Co. Ltd. | 48,100 | 171,447 | ||||||
| 622,648 | ||||||||
THAILAND (2.8%) | ||||||||
Health Care (0.5%) | ||||||||
Bangkok Dusit Medical Services PCL, Foreign Shares (a) | 90,000 | 57,450 | ||||||
Materials (2.3%) | ||||||||
Siam Cement PCL (The), Foreign Shares (a) | 17,600 | 258,490 | ||||||
| 315,940 | ||||||||
UNITED KINGDOM (6.3%) | ||||||||
Financials (1.9%) | ||||||||
Standard Chartered PLC (a)(c) | 21,986 | 218,978 | ||||||
Materials (4.4%) | ||||||||
BHP Billiton PLC — London Listing (a) | 12,634 | 228,746 | ||||||
Rio Tinto PLC — London Listing (a) | 5,601 | 264,707 | ||||||
| 493,453 | ||||||||
| 712,431 | ||||||||
Total Common Stocks | 10,475,901 | |||||||
PREFERRED STOCKS (5.8%) | ||||||||
REPUBLIC OF SOUTH KOREA (5.8%) | ||||||||
Consumer Staples (0.8%) | ||||||||
Amorepacific Corp., Preferred Shares, 0.89% | 539 | 85,876 | ||||||
Information Technology (5.0%) | ||||||||
Samsung Electronics Co. Ltd., Preferred Shares, 1.20% (a) | 283 | 566,805 | ||||||
| 652,681 | ||||||||
Total Preferred Stocks | 652,681 | |||||||
SHORT-TERM INVESTMENT (0.5%) | ||||||||
UNITED STATES (0.5%) | ||||||||
State Street Institutional U.S. Government Money Market Fund, Institutional Class, 0.96% (e) | 57,879 | 57,879 | ||||||
Total Short-Term Investment | 57,879 | |||||||
Total Investments | 11,186,461 | |||||||
Other Assets in Excess of Liabilities—1.0% | 109,630 | |||||||
Net Assets—100.0% | $ | 11,296,091 | ||||||
| (a) | Fair Values are determined pursuant to procedures approved by the Fund’s Board of Trustees. Unless otherwise noted, securities are valued by applying valuation factors to the exchange traded price. See Note 2(a) of the accompanying Notes to Financial Statements. |
| (b) | China A Shares. These shares are issued in local currency, traded in the local stock markets and are held through either a Qualified Foreign Institutional Investor (QFII) license or the Shanghai or Shenzhen Hong-Kong Stock Connect program. |
| (c) | Non-income producing security. |
| (d) | Shares received from spin off of Grasim Industries Ltd. and commenced trading on September 1, 2017. |
| (e) | Registered investment company advised by State Street Global Advisors. The rate shown is the current yield as of October 31, 2017. |
| (f) | See accompanying Notes to Financial Statements for tax unrealized appreciation/(depreciation) of securities. |
| PLC | Public Limited Company |
See accompanying Notes to Financial Statements.
| 2017 Annual Report | 9 |
Aberdeen China Opportunities Fund (Unaudited)
The Aberdeen China Opportunities Fund (Institutional Class shares net of fees) returned 23.62% for the 12-month period ended October 31, 2017, versus the 34.80% return of its benchmark, the Morgan Stanley Capital International (MSCI) Zhong Hua Index, during the same period. For broader comparison, the average return of the Fund’s peer category of China Region Funds (comprising 44 funds), as measured by Lipper, Inc., was 30.39% for the period.
The performance of equities in China and Hong Kong was buoyant over the reporting period. Despite early investor concerns over capital outflows, increased regulatory scrutiny and government curbs on leverage, Chinese equities recovered quickly amid upbeat corporate earnings and economic growth data, while worries over capital flight receded. Benchmark index provider MSCI’s decision to include China A-shares1 in its influential indices and a continued rise in Chinese internet stocks further propelled the mainland China market. In Hong Kong, sustained inflows from China and encouraging domestic economic data also bolstered investor sentiment.
The Fund recorded a positive return over the reporting period, but underperformed its benchmark, the MSCI Zhong Hua Index. Broadly, our buy-and-hold investment approach style was hampered by sector rotation and momentum trading,2 both of which were evident in the Chinese equity markets over the period.
The Fund’s positioning in the information technology (IT) sector was a key detractor from the relative performance for the reporting period. The IT sector rallied, driven by the sustained rise in domestic internet companies, notably Alibaba and Tencent Holdings, as momentum trading and solid corporate results boosted their share prices. Therefore, the Fund’s lack of exposure to Alibaba and the underweight allocation to Tencent relative to the benchmark weighed on performance. We initiated a relatively small position in Tencent Holdings in May 2017. This reflects our growing conviction in, and comfort with, its business, corporate structure and governance. We think that its valuation reflects its high-quality growth potential. Tencent has succeeded in diversifying its presence in the Chinese internet space, creating a powerful ecosystem that leverages on the network effects of its various offerings, while concurrently navigating the migration of gaming from PC to mobile. This combination of an expanding ecosystem and a growing monetization3 of the user base will drive earnings growth. We are more circumspect regarding Alibaba. While we think that the company has a strong competitive moat4 and impressive business model, we see potential downside risks from poor corporate governance.
However, within other technology subsectors, the Fund’s holdings in video-surveillance equipment manufacturer Hangzhou Hikvision Digital Technology Co. and semiconductor equipment supplier ASM Pacific Technology performed well over the reporting period. Shares of Hangzhou Hikvision rose on solid growth in both its domestic and overseas operations; the company is also branching out from its traditional video surveillance business. ASM Pacific Technology posted solid corporate results over the period that were driven by several factors, including increased output, ongoing cost reduction efforts, and a favorable product mix.
Shares of the Fund’s holdings in China Merchants Bank (CMB) and China Construction Bank (CCB) also rose on the back of positive results during the reporting period. The Chinese lenders generally saw declines in loan-loss provisions while asset quality and net interest margins stabilized. Global lender HSBC Holdings was another key contributor to Fund performance, aided by steady corporate results. Notably, the bank’s focus on Asia was successful, with the region generating over 70% of the company’s profits for the third quarter of its 2017 fiscal year.
Elsewhere, downbeat corporate results hurt the performance of the Fund’s holding in healthcare company Tong Ren Tang Technologies Co. (TRT) as a couple of its blockbuster products faced competition from cheaper alternatives. Nonetheless, TRT is a well-known traditional Chinese medicine maker in the mainland. We believe that its established brand is still able to differentiate it from other less trusted competitors in China.
Regarding portfolio activity over the reporting period, we initiated positions in Dah Sing Financial Holdings, as well as Chinese fast-food restaurant operator Yum China Holdings following the parent company’s (Yum! Brands) restructuring. We exited positions in Chinese industrial gas company Yingde Gases, Huaxin Cement Co. and Hung Hing Printing Group.
In addition to Tencent Holdings as previously noted, we established new positions in blood plasma products company China Biologic Products; China Construction Bank (CCB); automotive parts supplier Nexteer Automotive Group; and Chinese travel information provider Travelsky Technology. We think that China Biologic Products stands to benefit from structural growth in domestic demand for blood plasma products. We like the company’s direct sales model and initiated the holding at what we viewed as a reasonable valuation. We introduced CCB to the Fund after holding it in another Aberdeen China equity fund for some time, as we believe that it is one of the better managed state-owned lenders and is well positioned amid the government’s deleveraging campaign. Nexteer Automotive Group has benefited from the automotive industry’s move from hydraulic to electrical power steering, and has a growing business in Asia. Its financials are robust, while management is sensible and has a good track record, in our opinion. Travelsky Technology has a monopoly in China in airline-ticket distribution and is a proxy to the mainland’s growing tourism market fueled by rising affluence.
| 1 | China A-shares are purchased and traded on the Shanghai and Shenzhen stock exchanges. |
| 2 | Momentum trading seeks to capitalize on market volatility by focusing on stocks that are moving significantly in one direction on high volume. |
| 3 | Monetization comprises the conversion of an asset into money or legal tender. |
| 4 | A business moat refers to the ability of a company to maintain competitive advantages over its competitors in an effort to protect its long-term profits and market share from competing firms. |
| 10 | Annual Report 2017 |
Aberdeen China Opportunities Fund (Unaudited) (concluded)
Conversely, we exited the Fund’s relatively small positions in Hong Kong Aircraft Engineering Co., luxury hotel chain operator Hongkong & Shanghai Hotels, and knitted fabric and apparel maker Texwinca as we believe that the companies have deteriorating business prospects. Healthy global demand for its exports has led to generally better-than-expected economic growth in China. The slight moderation in growth in the third quarter of 2017 was attributable mainly to policy efforts to rein in leverage, reduce overcapacity5 and curb pollution. In a much-anticipated speech at the Communist Party’s 19th National Congress6 in October 2017, President Xi Jinping avoided specifying an economic growth target for 2020, instead espousing a near-term aim of a “moderately prosperous society,” while pushing for higher-quality growth. This was widely interpreted as a sign that the government will tolerate some deceleration in the economy in its pursuit of supply-side structural reforms, more equitable wealth distribution and financial stability.
At the corporate level, earnings growth for Chinese companies has recovered. Companies overall appear healthier, as do valuations, while the Chinese government continued to tweak supply-side policy. Many of the Fund’s holdings posted year-on-year earnings increases in the September quarter, which reflected fundamental growth rather than simply resulting from one-off gains or government subsidies. In our view, this suggested that the economy is bottoming out, with investors becoming optimistic and more willing to pay for future growth. Consequently, we have upgraded our forecasts across our Chinese holdings.7 Such supportive corporate fundamentals give us cause for optimism and confidence in our stock picks.
Portfolio Management:
Aberdeen Asia-Pacific Equity Team
PAST PERFORMANCE DOES NOT GUARANTEE FUTURE RESULTS.
The performance data quoted represents past performance and current returns may be lower or higher. Class A Shares have up to a 5.75% front-end sales charge and a 0.25% 12b-1 fee. The investment return and principal value will fluctuate so that an investor’s shares, when redeemed, may be worth more or less than the original cost. To obtain performance information current to the most recent month-end, which may be higher or lower than the performance shown above, please call 866-667-9231 or go to www.aberdeen-asset.us.
Investing in mutual funds involves risk, including the possible loss of principal.
Indexes are unmanaged and have been provided for comparison purposes only. No fees or expenses are reflected. You cannot invest directly in an index.
Lipper is a leading global provider of mutual fund information and analysis to fund companies, financial intermediaries and media organizations.
Risk Considerations
Concentrating investments in China and Hong Kong subjects the Fund to more volatility and greater risk of loss than geographically diverse mutual funds.
Additional risks associated with investments in China and Hong Kong include exposure to currency fluctuations, less liquidity, expropriation, confiscatory taxation, nationalization, exchange control regulations (including currency blockage) and differing legal standards.
Foreign securities may be more volatile, harder to price and less liquid than U.S. securities. They are subject to different accounting and regulatory standards, currency exchange rates, political and economic risks. Fluctuation in currency exchange rates may impact the Fund’s returns more greatly to the extent the Fund does not hedge currency exposure or hedging techniques are unsuccessful. The foregoing risks are enhanced in emerging market countries.
Equity stocks of small- and mid-cap companies carry greater risk, and more volatility than equity stocks of larger, more established companies.
Investing a significant portion of the Fund’s assets in securities of companies conducting business in a broadly related group of industries within an economic sector may make the Fund more vulnerable to unfavorable developments in that sector.
Please read the prospectus for more detailed information regarding these and other risks.
| 5 | Overcapacity occurs when the capacity to produce exceeds the demand. |
| 6 | The Chinese Communist Party sets its national policy goals and elects its leadership positions at the National Party Congress, which is held every five years. |
| 7 | Forecasts and estimates are offered as opinion and are not reflective of potential performance, are not guaranteed and actual events or results may differ materially. |
| 2017 Annual Report | 11 |
Aberdeen China Opportunities Fund (Unaudited)
| Average Annual Total Return1 (For periods ended October 31, 2017) | 1 Yr. | 5 Yr. | 10 Yr. | |||||||||||||
Class A | w/o SC | 23.15% | 3.61% | (1.39% | ) | |||||||||||
| w/SC2 | 16.04% | 2.39% | (1.97% | ) | ||||||||||||
Class C | w/o SC | 22.39% | 2.87% | (2.09% | ) | |||||||||||
| w/SC3 | 21.39% | 2.87% | (2.09% | ) | ||||||||||||
Class R4 | w/o SC | 22.77% | 3.24% | (1.69% | ) | |||||||||||
Institutional Service Class4 | w/o SC | 23.54% | 3.86% | (1.13% | ) | |||||||||||
Institutional Class4 | w/o SC | 23.62% | 3.89% | (1.14% | ) | |||||||||||
All figures showing the effect of a sales charge (SC) reflect the maximum charge possible because it has the most significant effect on performance data. The total returns shown above do not include the impact of financial statement rounding of the net asset value (NAV) per share and/or financial statement adjustments.
| 1 | Returns prior to June 23, 2008 reflect the performance of a predecessor fund (the “Predecessor Fund”). Returns of the Predecessor Fund have not been adjusted to reflect the expenses applicable to the respective classes. Aberdeen Asset Management Asia Limited began sub-advising the fund on January 1, 2009. Performance prior to this date reflects the performance of an unaffiliated sub-adviser. The Fund and the Predecessor Fund have substantially similar investment objectives and strategies. Please consult the Fund’s prospectus for more detail. |
| 2 | A 5.75% front-end sales charge was deducted. |
| 3 | A 1.00% contingent deferred sales charge (CDSC) was deducted from the one year return because it is charged when Class C shares are sold within the first year after purchase. |
| 4 | Not subject to any sales charges. |
Performance of a $10,000 Investment (as of October 31, 2017)
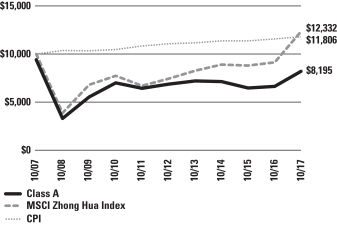
Comparative performance of $10,000 invested in Class A shares of the Aberdeen China Opportunities Fund, Morgan Stanley Capital International (MSCI) Zhong Hua Index and the Consumer Price Index (CPI) over a 10-year period ended October 31, 2017. Unlike the Fund, the returns for these unmanaged indexes do not reflect any fees, expenses, or sales charges. Investors cannot invest directly in market indexes.
The MSCI Zhong Hua Index is a composite index that comprises the MSCI China and MSCI Hong Kong Index. The index captures large and mid cap representation across all China securities (B shares, H shares, Red Chips, P Chips and foreign listed shares) as well as Hong Kong securities.
The CPI is a measure of the average change over time in the prices paid by urban consumers for a market basket of consumer goods and services.
Investment returns and principal value will fluctuate, and when redeemed, shares may be worth more or less than original cost. Past performance is no guarantee of future results. The Average Annual Total Return table and Performance graph do not reflect the deduction of taxes that a shareholder would pay on fund distributions or the redemption of fund shares. Investing in mutual funds involves market risk, including loss of principal. Performance returns assume the reinvestment of all distributions. Total returns reflect waivers and reimbursements in effect, without which returns would have been lower.
| 12 | Annual Report 2017 |
Aberdeen China Opportunities Fund (Unaudited) (concluded)
Portfolio Summary (as a percentage of net assets)
October 31, 2017 (Unaudited)
| Asset Allocation | ||||
Common Stocks | 98.7% | |||
Short-Term Investment | 0.2% | |||
Liabilities in Excess of Other Assets | 1.1% | |||
| 100.0% | ||||
The following table summarizes the composition of the Fund’s portfolio, in Standard & Poor’s Global Industry Classification Standard (GICS) sectors, expressed as a percentage of net assets. The GICS structure consists of 11 sectors, 24 industry groups, 68 industries and 157 sub-industries. As of October 31, 2017, the Fund did not have more than 25% of its assets invested in any industry group.
| Top Sectors | ||||
Financials | 19.3% | |||
Industrials | 18.1% | |||
Consumer Discretionary | 16.6% | |||
Information Technology | 11.3% | |||
Real Estate | 10.9% | |||
Telecommunication Services | 6.3% | |||
Health Care | 5.6% | |||
Consumer Staples | 5.0% | |||
Energy | 3.6% | |||
Utilities | 2.0% | |||
Other | 1.3% | |||
| 100.0% | ||||
| Top Holdings* | ||||
AIA Group Ltd. | 5.3% | |||
MTR Corp. Ltd. | 4.5% | |||
Tencent Holdings Ltd. | 4.3% | |||
China Mobile Ltd. | 3.9% | |||
Hangzhou Hikvision Digital Technology Co. Ltd., A Shares | 3.9% | |||
Jardine Strategic Holdings Ltd. | 3.9% | |||
HSBC Holdings PLC | 3.6% | |||
China International Travel Service Corp. Ltd., A Shares | 3.5% | |||
Shanghai International Airport Co. Ltd., A Shares | 3.3% | |||
China Merchants Bank Co. Ltd., H Shares | 2.9% | |||
Other | 60.9% | |||
| 100.0% | ||||
| * | For the purpose of listing top holdings, Short-Term Investments are included as part of Other. |
| Top Countries | ||||
Hong Kong | 48.7% | |||
China | 47.8% | |||
United States | 2.4% | |||
Other | 1.1% | |||
| 100.0% | ||||
| 2017 Annual Report | 13 |
Statement of Investments
October 31, 2017
Aberdeen China Opportunities Fund
| Shares or Principal Amount | Value | |||||||
COMMON STOCKS (98.7%) | ||||||||
CHINA (47.8%) | ||||||||
Consumer Discretionary (8.7%) | ||||||||
China International Travel Service Corp. Ltd., A Shares (a) | 74,000 | $ | 462,362 | |||||
China International Travel Service Corp. Ltd., A Shares (Stock Connect) (a)(b) | 200 | 1,250 | ||||||
Fuyao Glass Industry Group Co. Ltd., H Shares (a)(c) | 90,400 | 344,726 | ||||||
Nexteer Automotive Group Ltd. (a)(d) | 80,000 | 156,674 | ||||||
Yum China Holdings, Inc. (d) | 4,874 | 196,666 | ||||||
| 1,161,678 | ||||||||
Consumer Staples (3.0%) | ||||||||
Kweichow Moutai Co. Ltd., A Shares (a) | 2,400 | 93,501 | ||||||
Kweichow Moutai Co. Ltd., A Shares (Stock Connect) (a)(b) | 1,900 | 308,554 | ||||||
| 402,055 | ||||||||
Energy (3.6%) | ||||||||
CNOOC Ltd. (a) | 198,000 | 270,348 | ||||||
Green Dragon Gas Ltd. (d) | 53,000 | 42,587 | ||||||
PetroChina Co. Ltd., H Shares (a) | 254,000 | 166,039 | ||||||
| 478,974 | ||||||||
Financials (4.7%) | ||||||||
China Construction Bank Corp., Class H (a) | 260,000 | 232,366 | ||||||
China Merchants Bank Co. Ltd., H Shares (a) | 102,500 | 391,412 | ||||||
| 623,778 | ||||||||
Health Care (5.6%) | ||||||||
China Biologic Products Holdings, Inc. (d) | 600 | 46,626 | ||||||
CSPC Pharmaceutical Group Ltd. (a) | 196,000 | 340,988 | ||||||
Tong Ren Tang Technologies Co. Ltd., H Shares (a) | 251,000 | 352,768 | ||||||
| 740,382 | ||||||||
Industrials (5.5%) | ||||||||
China Conch Venture Holdings Ltd. (a) | 143,000 | 291,565 | ||||||
Shanghai International Airport Co. Ltd., A Shares (a)(b) | 66,500 | 439,526 | ||||||
| 731,091 | ||||||||
Information Technology (9.3%) | ||||||||
Hangzhou Hikvision Digital Technology Co. Ltd., A Shares (a)(b) | 87,375 | 518,234 | ||||||
Hangzhou Hikvision Digital Technology Co. Ltd., A Shares (Stock Connect) (a)(b) | 150 | 890 | ||||||
Tencent Holdings Ltd. (a) | 12,900 | 579,792 | ||||||
TravelSky Technology Ltd., H Shares (a) | 56,000 | 145,146 | ||||||
| 1,244,062 | ||||||||
Real Estate (3.5%) | ||||||||
China Resources Land Ltd. (a) | 90,000 | 268,604 | ||||||
Yanlord Land Group Ltd. (a)(e) | 149,600 | 196,582 | ||||||
| 465,186 | ||||||||
Telecommunication Services (3.9%) | ||||||||
China Mobile Ltd. (a) | 52,000 | 523,035 | ||||||
| 6,370,241 | ||||||||
HONG KONG (48.7%) | ||||||||
Consumer Discretionary (5.7%) | ||||||||
Aeon Stores (Hong Kong) Co. Ltd. (a) | 286,500 | 207,236 | ||||||
Giordano International Ltd. (a) | 224,000 | 126,642 | ||||||
Global Brands Group Holding Ltd. (a)(d) | 396,380 | 46,250 | ||||||
Shangri-La Asia Ltd. (a) | 188,000 | 374,317 | ||||||
| 754,445 | ||||||||
Consumer Staples (2.0%) | ||||||||
Convenience Retail Asia Ltd. (a) | 388,000 | 178,999 | ||||||
Dairy Farm International Holdings Ltd. (a) | 10,700 | 87,512 | ||||||
| 266,511 | ||||||||
Financials (14.6%) | ||||||||
AIA Group Ltd. (a) | 93,600 | 705,321 | ||||||
Dah Sing Banking Group Ltd. (a) | 59,840 | 132,432 | ||||||
Dah Sing Financial Holdings Ltd. (a) | 17,200 | 115,585 | ||||||
Hong Kong Exchanges & Clearing Ltd. (a) | 9,118 | 254,066 | ||||||
HSBC Holdings PLC (a) | 48,498 | 473,794 | ||||||
Standard Chartered PLC (HK Listing) (a)(d) | 27,348 | 271,471 | ||||||
| 1,952,669 | ||||||||
Industrials (12.6%) | ||||||||
Jardine Strategic Holdings Ltd. (a) | 12,300 | 515,925 | ||||||
Kerry Logistics Network Ltd. (a) | 225,000 | 310,229 | ||||||
MTR Corp. Ltd. (a) | 102,838 | 596,201 | ||||||
Pacific Basin Shipping Ltd. (a)(d) | 1,112,000 | 253,924 | ||||||
| 1,676,279 | ||||||||
Information Technology (2.0%) | ||||||||
ASM Pacific Technology Ltd. (a) | 17,900 | 261,169 | ||||||
Real Estate (7.4%) | ||||||||
Hang Lung Group Ltd. (a) | 70,000 | 245,957 | ||||||
Hang Lung Properties Ltd. (a) | 34,000 | 78,074 | ||||||
Swire Pacific Ltd., Class B (a) | 200,000 | 345,711 | ||||||
Swire Properties Ltd. (a) | 94,600 | 319,674 | ||||||
| 989,416 | ||||||||
Telecommunication Services (2.4%) | ||||||||
Asia Satellite Telecommunications Holdings Ltd. | 127,500 | 117,671 | ||||||
HKBN Ltd. (a) | 198,500 | 201,551 | ||||||
| 319,222 | ||||||||
Utilities (2.0%) | ||||||||
Hong Kong & China Gas Co. Ltd. (a) | 140,016 | 265,417 | ||||||
| 6,485,128 | ||||||||
UNITED STATES (2.2%) | ||||||||
Consumer Discretionary (2.2%) | ||||||||
Samsonite International SA (a) | 71,900 | 300,646 | ||||||
Total Common Stocks | 13,156,015 | |||||||
See accompanying Notes to Financial Statements.
| 14 | Annual Report 2017 |
Statement of Investments (concluded)
October 31, 2017
Aberdeen China Opportunities Fund
| Shares or Principal Amount | Value | |||||||
SHORT-TERM INVESTMENT (0.2%) | ||||||||
UNITED STATES (0.2%) | ||||||||
State Street Institutional U.S. Government Money Market Fund, Institutional Class, 0.96% (f) | 17,322 | $ | 17,322 | |||||
| 17,322 | ||||||||
Total Short-Term Investment | 17,322 | |||||||
Total Investments | 13,173,337 | |||||||
Liabilities in Excess of Other Assets—1.1% | 153,091 | |||||||
Net Assets—100.0% | $ | 13,326,428 | ||||||
| (a) | Fair Values are determined pursuant to procedures approved by the Fund’s Board of Trustees. Unless otherwise noted, securities are valued by applying valuation factors to the exchange traded price. See Note 2(a) of the accompanying Notes to Financial Statements. |
| (b) | China A Shares. These shares are issued in local currency, traded in the local stock markets and are held through either a Qualified Foreign Institutional Investor (QFII) license or the Shanghai or Shenzhen Hong-Kong Stock Connect program. |
| (c) | Denotes a security issued under Regulation S or Rule 144A. |
| (d) | Non-income producing security. |
| (e) | All or a portion of the securities are on loan. The total value of all securities on loan is $187,328. The amount of securities on loan indicated may not correspond with the securities on loan identified because securities with pending sales are in the process of recall from the brokers. See Note 2(k) for additional information. |
| (f) | Registered investment company advised by State Street Global Advisors. The rate shown is the current yield as of October 31, 2017. |
| (g) | See accompanying Notes to Financial Statements for tax unrealized appreciation/(depreciation) of securities. |
| PLC | Public Limited Company |
See accompanying Notes to Financial Statements.
| 2017 Annual Report | 15 |
Aberdeen Emerging Markets Fund (Unaudited)
The Aberdeen Emerging Markets Fund (Institutional Class shares net of fees) returned 17.89% for the 12-month period ended October 31, 2017, versus the 26.91% return of its benchmark, the Morgan Stanley Capital International (MSCI) Emerging Markets Index, during the same period. For broader comparison, the average return of the Fund’s peer category of Emerging Markets Funds (comprising 355 funds), as measured by Lipper, Inc., was 22.71% for the period.
Emerging-market equities posted substantial gains over the reporting period. Stocks initially sold-off in a knee-jerk reaction to Donald Trump’s victory in the U.S. presidential election in November 2016. However, in the first 10 months of 2017, an improving global economy lifted corporate earnings, which resulted in continued inflows into the asset class. Upbeat investor sentiment helped emerging markets maintain their positive momentum despite three U.S. Federal Reserve rate hikes and rising geopolitical uncertainty in North Korea and the Middle East. Oil prices were volatile at the beginning of the reporting period, but firmed on higher demand and tighter inventories following an Organization of Petroleum Exporting Countries (OPEC)-led agreement to extend output cuts. Currencies broadly strengthened against the U.S. dollar over the period amid growing worries about the policies of the Trump administration, though gains were capped towards the end of the period on renewed hopes for U.S. tax reform.
Across geographic regions, China led the advance in the emerging Asian markets, attributable to better-than-expected economic growth and a sharp rise in shares of Chinese internet companies despite the government’s increased tightening of financial regulations. At the 19th Communist Party Congress1 in October 2017, President Xi Jinping consolidated his position, while also emphasizing more equitable economic growth outcomes. In India, economic growth slowed over the reporting period due to the lingering effects of the government’s demonetization2 in November 2016, while the Goods and Services Tax was implemented in July 2017. The Latin American equity market posted a healthy gain for the reporting period. Brazilian equities performed well despite a notable decline in May 2017, after President Michel Temer became implicated in a corruption scandal. Mexican stocks and the peso initially recovered from a post-U.S. election sell-off, but uncertainty over the fate of the North American Free Trade Agreement (NAFTA) and natural disasters capped gains towards the end of the reporting period. In the Europe, Middle East and Africa (EMEA) region, the Russian market’s performance was volatile, tracking oil prices, while South African stocks were hampered by domestic political turmoil.
The Fund’s underperformance relative to its benchmark, the MSCI Emerging Markets Index, was attributable largely to the underweight allocations to both China and the information technology sector. Notably, information technology is the benchmark’s largest-weighted sector, partly driven by benchmark provider MSCI’s inclusion of Chinese internet companies in the MSCI China Index in 2015. Major internet companies such as Tencent Holdings (which the Fund holds) and Alibaba (which the Fund does not own) have thrived in a closed market where U.S. companies such as Google, Facebook and Amazon have limited access. The share prices of both Tencent and Alibaba have increased significantly, driving the Chinese equity market higher. This factor weighed on the Fund’s relative performance over the reporting period despite the solid performance from other Fund holdings in mainland China, including alcoholic beverage producer Kweichow Moutai Co. and Hangzhou Hikvision Digital Technology Co., a large global video surveillance vendor, which were among the top individual stock contributors to Fund performance over the reporting period.
While we recognize the opportunities that Chinese internet businesses enjoy, we remain concerned over their corporate structures, known as variable interest entities (VIE),3 designed to circumvent domestic laws restricting direct foreign control. The Chinese government remains ambiguous about the structures’ legality, and investors appear to believe that, as an increasingly important part of stock markets and economic activity, the risk that the Chinese government may rule that VIE structures are illegal is becoming negligible. While we remain skeptical, we are more sympathetic to the notion that the risk today is lower than it was in the past.
Nonetheless, we are optimistic about the prospects for Tencent Holdings. Since the stock initially was listed on the Hong Kong Stock Exchange in 2004, we have conducted extensive due diligence regarding its corporate structure and founder, and have engaged management on these issues. We take greater comfort from its track record of treating minority shareholders fairly, and we like the company’s business moat4 and robust financials. Over time, we have come to appreciate Tencent’s disciplined capital allocation and ability to expand and monetize5 its social media-based ecosystem. Therefore, following further analysis and a meeting with senior management, we initiated a position in Tencent in September 2017. While we acknowledge that the stock is not cheap, we believe that its valuation reflects its high-quality growth potential.
Elsewhere in Asia, the Fund’s exposure to Hong Kong, which is not represented in the benchmark MSCI Emerging Markets Index, hampered the relative performance for the reporting period. The Fund’s holding in Hang Lung Group was among the key detractors from the relative performance due to investors’ concerns over the recovery of its property subsidiary. Shares of Indonesian conglomerate Astra International, a long-term Fund holding that has performed well, also fell as the company saw lower profit margins in the second quarter of its 2017 fiscal year, though we believe that the weakness should be temporary. Conversely, stock selection in India contributed to the Fund’s relative performance. Conglomerate Grasim Industries’ stock price rose on investors’ positive expectations about its restructuring into a broader conglomerate, while shares of consumer goods company Hindustan Unilever were buoyed by the market’s post-demonetization recovery.
| 1 | The Chinese Communist Party sets its national policy goals and elects its leadership positions at the National Party Congress, which is held every five years. |
| 2 | Demonetization comprises the act of stripping specific denominations of a currency of their status as legal tender. The currency denominations are pulled from circulation and are replaced with new currency units. |
| 3 | A variable interest entity is an entity in which an investor has a controlling interest that is not based on a majority of voting rights. |
| 4 | A business moat refers to the ability of a company to maintain competitive advantages over its competitors in an effort to protect its long-term profits and market share from competing firms. |
| 5 | Monetization comprises the conversion of an asset into money or legal tender. |
| 16 | Annual Report 2017 |
Aberdeen Emerging Markets Fund (Unaudited) (continued)
In Latin America, positive stock selection was outweighed by the negative impact of asset allocation. Mexican markets were roiled by Trump’s U.S. presidential election win, uncertainty over NAFTA negotiations and concerns over the impact of earthquakes on the economy. However, stock selection in Brazil bolstered Fund performance for the reporting period. The primary contributor was the absence of a position in state-owned oil company Petroleo Brasileiro (Petrobras), as its shares came under significant pressure during a sell-off in May 2017, when President Temer became implicated in a corruption scandal.
In the EMEA region, the Fund’s overweight to Turkey relative to the benchmark weighed on performance as the market underperformed its emerging-market peers in 2016, due to political uncertainty and a credit-rating6 downgrade. Stock selection in Russia also detracted from the Fund’s relative performance, with retailer Magnit a key laggard amid investors’ concerns over falling returns. Conversely, the underweight position in South Africa enhanced the Fund’s relative performance, given the ongoing political turmoil in the country and deteriorating domestic economy. The Fund’s lack of exposure to benchmark constituent Qatar also had a positive impact on performance due to heightened geopolitical tensions in the Middle East.
Regarding significant portfolio activity over the reporting period, apart from Tencent, as we previously noted, we also initiated holdings in five other mainland China-based companies: Yum China Holdings, a fast-food restaurant operator with a net cash balance sheet; Shanghai International Airport Co., a leading airport operator in China which we believe has attractive growth prospects; Hangzhou Hikvision Digital Technology Co.; which is expanding its global footprint amid increasing automation in surveillance; Midea Group Co., an appliance manufacturer, given our higher conviction about its quality; and China Resources Land, a property developer backed by a healthy balance sheet, in our view.
We also initiated positions in AMOREPACIFIC Corp., a fast-growing Korean cosmetics business with well-established brands and a growing presence overseas; Falabella, a Chile-based diversified retailer with a broad regional footprint in Latin America; and Kotak Mahindra Bank, which we believe is a well-managed Indian private-sector lender.
Conversely, we exited the Fund’s positions in Yum! Brands and reinvested the proceeds into its spun-off business, Yum China Holdings; Indian software company Infosys given our decreased confidence in the company’s prospects following the resignation of Vishal Sikka as chief executive officer (CEO) and our growing corporate governance concerns; and Argentinian steel-pipe maker Tenaris due to our lower conviction in the outlook for its business. We also sold the Fund’s holdings in mall operator Multiplan’s rights offering7 ahead of its upcoming capital-raising due to the stock’s relative price strength, as well as Malaysian financial services company CIMB, India’s ICICI Bank and Korean hypermarket operator E-Mart in view of what we believed were better opportunities elsewhere.
In our opinion, the synchronized global economic recovery should continue to underpin further gains in the global emerging markets, which outperformed their developed-market counterparts for the first 10 months of 2017. We think that Chinese economic growth may moderate, given the government’s focus on regulatory tightening and supply-side reform, but a sharp downturn seems unlikely as economic drivers appear resilient, and both fiscal and monetary policy remain accommodative. However, political risks remain, including Kurdish separatism exacerbating tensions in the Middle East, as well as unresolved domestic political crises in South Africa and Brazil. Elections in various developing countries over 2018 could add further uncertainty, in our view. Nevertheless, most emerging-market economies are benefiting from an improved global macroeconomic environment, with recovering growth supported by moderate inflation and healthy trade flows. While we feel that major global central banks’ monetary policy normalization and tighter liquidity could cause some concerns, their well-telegraphed changes should ensure stability. Emerging-market companies also have sustained earnings improvement attributable to stronger corporate fundamentals and consumers’ rising spending capacity. We think that the expansion of long-term trends such as the semiconductor super-cycle and rise of e-commerce provides an additional boost for several Fund holdings. We are cautiously optimistic and will remain disciplined in our investment approach and diligent in engaging the management teams of the Fund’s holdings in an effort to maintain the quality of the Fund’s portfolio.
Portfolio Management:
Aberdeen Global Emerging Markets Equity Team
PAST PERFORMANCE DOES NOT GUARANTEE FUTURE RESULTS.
The performance data quoted represents past performance and current returns may be lower or higher. Class A Shares have up to a 5.75% front-end sales charge and a 0.25% 12b-1 fee. The investment return and principal value will fluctuate so that an investor’s shares, when redeemed, may be worth more or less than the original cost. To obtain performance information current to the most recent month-end, which may be higher or lower than the performance shown above, please call 866-667-9231 or go to www.aberdeen-asset.us.
Investing in mutual funds involves risk, including the possible loss of principal.
Indexes are unmanaged and have been provided for comparison purposes only. No fees or expenses are reflected. You cannot invest directly in an index.
Lipper is a leading global provider of mutual fund information and analysis to fund companies, financial intermediaries and media organizations.
| 6 | Standard & Poor’s credit ratings express the agency’s opinion about the ability and willingness of an issuer, such as a corporation or state or city government, to meet its financial obligations in full and on time. Typically, ratings are expressed as letter grades that range, for example, from “AAA” to “D” to communicate the agency’s opinion of relative level of credit risk. Ratings from “AA” to “CCC” may be modified by the addition of a plus (+) or minus (-) sign to show relative standing within the major rating categories. |
| 7 | A rights offering entitles a company’s existing shareholders to buy additional shares directly from the company in proportion to their existing holdings, within a fixed time period. |
| 2017 Annual Report | 17 |
Aberdeen Emerging Markets Fund (Unaudited) (concluded)
Risk Considerations
Foreign securities may be more volatile, harder to price and less liquid than U.S. securities. They are subject to different accounting and regulatory standards, currency exchange rates, political and economic risks. Fluctuation in currency exchange rates may impact the Fund’s returns more greatly to the extent the Fund does not hedge currency exposure or hedging techniques are unsuccessful. The foregoing risks are enhanced in emerging market countries.
Equity stocks of small- and mid-cap companies carry greater risk, and more volatility than equity stocks of larger, more established companies.
Investing a significant portion of the Fund’s assets in securities of companies conducting business in a broadly related group of industries within an economic sector may make the Fund more vulnerable to unfavorable developments in that sector.
Please read the prospectus for more detailed information regarding these and other risks.
| 18 | Annual Report 2017 |
Aberdeen Emerging Markets Fund (Unaudited)
| Average Annual Total Return1 (For periods ended October 31, 2017) | 1 Yr. | 5 Yr. | 10 Yr. | |||||||||||
Class A2 | w/o SC | 17.39% | 2.85% | 4.29% | ||||||||||
| w/SC3 | 10.60% | 1.63% | 3.67% | |||||||||||
Class C2 | w/o SC | 16.75% | 2.20% | 3.92% | ||||||||||
| w/SC4 | 15.75% | 2.20% | 3.92% | |||||||||||
Class R2,5 | w/o SC | 17.13% | 2.53% | 4.11% | ||||||||||
Institutional Service Class5,6 | w/o SC | 17.75% | 3.01% | 4.34% | ||||||||||
Institutional Class5 | w/o SC | 17.89% | 3.22% | 4.49% | ||||||||||
All figures showing the effect of a sales charge (SC) reflect the maximum charge possible because it has the most significant effect on performance data. The total returns shown above do not include the impact of financial statement rounding of the net asset value (NAV) per share and/or financial statement adjustments.
| 1 | Returns prior to November 23, 2009 reflect the performance of a predecessor fund (the “Predecessor Fund”). Returns of the Predecessor Fund have not been adjusted to reflect the expenses applicable to the respective classes. The Fund and the Predecessor Fund have substantially similar investment objectives and strategies. Please consult the Fund’s prospectus for more detail. |
| 2 | Returns before the first offering of Class A, Class C and Class R (May 21, 2012) are based on the previous performance of the Institutional Class. Excluding the effect of any fee waivers or reimbursements, this performance is substantially similar to what Class A, Class C and Class R would have produced because all classes invest in the same portfolio of securities. Returns would only differ to the extent of the differences in expenses of the classes. |
| 3 | A 5.75% front-end sales charge was deducted. |
| 4 | A 1.00% contingent deferred sales charge (CDSC) was deducted from the one year return because it is charged when Class C shares are sold within the first year after purchase. |
| 5 | Not subject to any sales charges. |
| 6 | Returns before the first offering of the Institutional Service Class (November 23, 2009) are based on the previous performance of the Institutional Class. Excluding the effect of any fee waivers or reimbursements, this performance is substantially similar to what Institutional Service Class would have produced because both classes invest in the same portfolio of securities. Returns would only differ to the extent of the differences in expenses of the two classes. |
Performance of a $1,000,000* Investment (as of October 31, 2017)
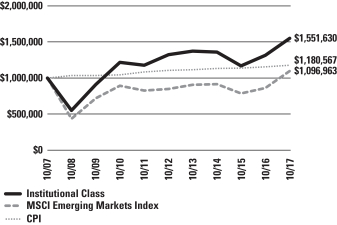
| * | Minimum Initial Investment |
Comparative performance of $1,000,000 invested in Institutional Class shares of the Aberdeen Emerging Markets Fund, Morgan Stanley Capital International (MSCI) Emerging Markets Index and the Consumer Price Index (CPI) over a 10-year period ended October 31, 2017. Unlike the Fund, the returns for these unmanaged indexes do not reflect any fees, expenses, or sales charges. Investors cannot invest directly in market indexes.
The MSCI Emerging Markets Index captures large and mid cap representation across 24 Emerging Markets (EM) countries. With 838 constituents, the index covers approximately 85% of the free float-adjusted market capitalization in each country. EM countries in the Index are: Brazil, Chile, China, Colombia, Czech Republic, Egypt, Greece, Hungary, India, Indonesia, Korea, Malaysia, Mexico, Pakistan, Peru, Philippines, Poland, Russia, Qatar, South Africa, Taiwan, Thailand, Turkey and United Arab Emirates.
The CPI is a measure of the average change over time in the prices paid by urban consumers for a market basket of consumer goods and services.
Investment return and principal value will fluctuate, and when redeemed, shares may be worth more or less than original cost. Past performance is no guarantee of future results. The Average Annual Total Return table and Performance graph do not reflect the deduction of taxes that a shareholder would pay on fund distributions or the redemption of fund shares. Investing in mutual funds involves market risk, including loss of principal. Performance returns assume the reinvestment of all distributions. Total returns reflect waivers and reimbursements in effect, without which returns would have been lower.
| 2017 Annual Report | 19 |
Aberdeen Emerging Markets Fund (Unaudited) (concluded)
Portfolio Summary (as a percentage of net assets)
October 31, 2017 (Unaudited)
| Asset Allocation | ||||
Common Stocks | 90.0% | |||
Preferred Stocks | 8.6% | |||
Short-Term Investment | 1.5% | |||
Liabilities in Excess of Other Assets | (0.1% | ) | ||
| 100.0% | ||||
The following table summarizes the composition of the Fund’s portfolio, in Standard & Poor’s Global Industry Classification Standard (GICS) sectors, expressed as a percentage of net assets. The GICS structure consists of 11 sectors, 24 industry groups, 68 industries and 157 sub-industries. As of October 31, 2017, the Fund did not have more than 25% of its assets invested in any industry group.
| Top Sectors | ||||
Financials | 26.6% | |||
Consumer Staples | 17.8% | |||
Information Technology | 16.5% | |||
Consumer Discretionary | 11.8% | |||
Materials | 8.4% | |||
Real Estate | 5.9% | |||
Telecommunication Services | 4.4% | |||
Energy | 3.2% | |||
Industrials | 2.9% | |||
Health Care | 1.1% | |||
Other | 1.4% | |||
| 100.0% | ||||
| Top Holdings* | ||||
Samsung Electronics Co. Ltd., Preferred Shares | 5.4% | |||
Taiwan Semiconductor Manufacturing Co. Ltd. | 4.6% | |||
Housing Development Finance Corp. Ltd. | 3.8% | |||
AIA Group Ltd. | 3.3% | |||
Banco Bradesco SA, ADR, Preferred Shares | 2.8% | |||
Kweichow Moutai Co. Ltd., A Shares (Stock Connect) | 2.6% | |||
Astra International Tbk PT | 2.6% | |||
ITC Ltd. | 2.4% | |||
Fomento Economico Mexicano SAB de CV, ADR | 2.4% | |||
China Mobile Ltd. | 2.4% | |||
Other | 67.7% | |||
| 100.0% | ||||
| * | For the purpose of listing top holdings, Short-Term Investments are included as part of Other. |
| Top Countries | ||||
India | 15.0% | |||
China | 14.4% | |||
Brazil | 12.4% | |||
Republic of South Korea | 8.4% | |||
Hong Kong | 7.1% | |||
Mexico | 5.8% | |||
Taiwan | 5.5% | |||
Indonesia | 5.3% | |||
Thailand | 4.0% | |||
Turkey | 3.8% | |||
Other | 18.3% | |||
| 100.0% | ||||
| 20 | Annual Report 2017 |
Statement of Investments
October 31, 2017
Aberdeen Emerging Markets Fund
| Shares or Principal Amount | Value | |||||||
COMMON STOCKS (90.0%) | ||||||||
BRAZIL (9.6%) | ||||||||
Consumer Discretionary (1.9%) | ||||||||
Lojas Renner SA | 15,678,000 | $ | 165,248,507 | |||||
Consumer Staples (2.5%) | ||||||||
Ambev SA | 19,354,600 | 123,654,553 | ||||||
BRF SA (a) | 7,100,969 | 96,052,908 | ||||||
| 219,707,461 | ||||||||
Energy (2.2%) | ||||||||
Ultrapar Participacoes SA | 7,943,000 | 189,633,571 | ||||||
Materials (1.8%) | ||||||||
Vale SA, ADR | 15,844,000 | 155,112,760 | ||||||
Real Estate (1.2%) | ||||||||
Multiplan Empreendimentos Imobiliarios SA | 5,048,000 | 110,332,895 | ||||||
| 840,035,194 | ||||||||
CHILE (2.5%) | ||||||||
Consumer Discretionary (1.2%) | ||||||||
S.A.C.I. Falabella | 10,630,299 | 101,885,182 | ||||||
Financials (1.3%) | ||||||||
Banco Santander Chile, ADR | 3,589,846 | 112,290,383 | ||||||
| 214,175,565 | ||||||||
CHINA (14.4%) | ||||||||
Consumer Discretionary (3.5%) | ||||||||
China International Travel Service Corp. Ltd., A Shares (Stock Connect) (b)(c) | 4,717,655 | 29,476,553 | ||||||
Midea Group Co. Ltd., A Shares (Stock Connect) (b)(c) | 14,966,092 | 115,193,941 | ||||||
Yum China Holdings, Inc. (a) | 3,930,900 | 158,611,815 | ||||||
| 303,282,309 | ||||||||
Consumer Staples (2.6%) | ||||||||
Kweichow Moutai Co. Ltd., A Shares (Stock Connect) (b)(c) | 2,405,318 | 224,899,831 | ||||||
Industrials (1.6%) | ||||||||
Shanghai International Airport Co. Ltd., A Shares (Stock Connect) (b)(c) | 20,972,992 | 138,619,240 | ||||||
Information Technology (3.4%) | ||||||||
Hangzhou Hikvision Digital Technology Co. Ltd., A Shares (Stock Connect) (b)(c) | 27,620,147 | 163,828,160 | ||||||
Tencent Holdings Ltd. (b) | 2,947,200 | 132,462,168 | ||||||
| 296,290,328 | ||||||||
Real Estate (0.9%) | ||||||||
China Resources Land Ltd. (b) | 26,084,000 | 77,847,359 | ||||||
Telecommunication Services (2.4%) | ||||||||
China Mobile Ltd. (b) | 20,872,600 | 209,944,225 | ||||||
| 1,250,883,292 | ||||||||
HONG KONG (7.1%) | ||||||||
Financials (4.6%) | ||||||||
AIA Group Ltd. (b) | 37,700,000 | $ | 284,087,559 | |||||
Hong Kong Exchanges & Clearing Ltd. (b) | 4,166,628 | 116,099,910 | ||||||
| 400,187,469 | ||||||||
Real Estate (2.5%) | ||||||||
Hang Lung Group Ltd. (b) | 25,049,000 | 88,014,064 | ||||||
Hang Lung Properties Ltd. (b) | 31,456,000 | 72,231,619 | ||||||
Swire Pacific Ltd., Class A (b)(d) | 3,617,000 | 35,743,454 | ||||||
Swire Properties Ltd. (b) | 6,157,100 | 20,806,196 | ||||||
| 216,795,333 | ||||||||
| 616,982,802 | ||||||||
HUNGARY (1.1%) | ||||||||
Health Care (1.1%) | ||||||||
Richter Gedeon Nyrt (b) | 3,850,840 | 95,787,938 | ||||||
INDIA (15.0%) | ||||||||
Consumer Discretionary (1.5%) | ||||||||
Hero MotoCorp Ltd. (b) | 2,165,335 | 128,996,391 | ||||||
Consumer Staples (4.0%) | ||||||||
Hindustan Unilever Ltd. (b) | 7,095,443 | 135,771,150 | ||||||
ITC Ltd. (b) | 51,467,500 | 211,434,349 | ||||||
| 347,205,499 | ||||||||
Financials (5.2%) | ||||||||
Aditya Birla Capital Ltd. (a) | 10,955,084 | 30,080,656 | ||||||
Housing Development Finance Corp. Ltd. (b) | 12,462,591 | 327,431,768 | ||||||
Kotak Mahindra Bank Ltd. (b) | 5,817,300 | 92,264,368 | ||||||
| 449,776,792 | ||||||||
Information Technology (1.1%) | ||||||||
Tata Consultancy Services Ltd. (b) | 2,411,893 | 97,570,315 | ||||||
Materials (3.2%) | ||||||||
Grasim Industries Ltd. (b) | 7,199,117 | 136,778,797 | ||||||
UltraTech Cement Ltd. (b) | 2,103,250 | 143,024,825 | ||||||
| 279,803,622 | ||||||||
| 1,303,352,619 | ||||||||
INDONESIA (5.3%) | ||||||||
Consumer Discretionary (2.6%) | ||||||||
Astra International Tbk PT (b) | 380,293,000 | 224,322,090 | ||||||
Financials (1.4%) | ||||||||
Bank Central Asia Tbk PT (b) | 83,125,500 | 128,049,892 | ||||||
Materials (1.3%) | ||||||||
Indocement Tunggal Prakarsa Tbk PT | 67,234,300 | 111,292,906 | ||||||
| 463,664,888 | ||||||||
MALAYSIA (1.1%) | ||||||||
Financials (1.1%) | ||||||||
Public Bank Bhd (b) | 19,459,200 | 94,037,215 | ||||||
See accompanying Notes to Financial Statements.
| 2017 Annual Report | 21 |
Statement of Investments (continued)
October 31, 2017
Aberdeen Emerging Markets Fund
| Shares or Principal Amount | Value | |||||||
MEXICO (5.8%) | ||||||||
Consumer Staples (2.6%) | ||||||||
Fomento Economico Mexicano SAB de CV, ADR | 2,402,101 | $ | 210,784,363 | |||||
Organizacion Soriana SAB de CV, Class B (a) | 6,026,034 | 12,635,600 | ||||||
| 223,419,963 | ||||||||
Financials (1.9%) | ||||||||
Grupo Financiero Banorte SAB de CV, Class O | 28,559,966 | 169,228,794 | ||||||
Industrials (1.3%) | ||||||||
Grupo Aeroportuario del Sureste SAB de CV, B Shares, ADR | 616,415 | 110,208,838 | ||||||
| 502,857,595 | ||||||||
PHILIPPINES (3.7%) | ||||||||
Financials (2.4%) | ||||||||
Ayala Corp. (b) | 4,698,000 | 93,749,094 | ||||||
Bank of the Philippine Islands | 60,725,894 | 115,276,274 | ||||||
| 209,025,368 | ||||||||
Real Estate (1.3%) | ||||||||
Ayala Land, Inc. (b) | 132,814,400 | 111,240,072 | ||||||
| 320,265,440 | ||||||||
POLAND (0.9%) | ||||||||
Financials (0.9%) | ||||||||
Bank Pekao SA (b) | 2,452,341 | 80,132,449 | ||||||
PORTUGAL (1.0%) | ||||||||
Consumer Staples (1.0%) | ||||||||
Jeronimo Martins SGPS SA (b) | 4,812,556 | 87,440,024 | ||||||
REPUBLIC OF SOUTH KOREA (2.6%) | ||||||||
Consumer Staples (0.6%) | ||||||||
Amorepacific Group (b) | 390,805 | 50,115,515 | ||||||
Information Technology (2.0%) | ||||||||
NAVER Corp. (b) | 219,635 | 175,548,103 | ||||||
| 225,663,618 | ||||||||
RUSSIA (2.6%) | ||||||||
Consumer Staples (1.6%) | ||||||||
Magnit PJSC (b) | 1,064,168 | 139,639,384 | ||||||
Energy (1.0%) | ||||||||
LUKOIL PJSC, ADR | 1,682,300 | 89,212,369 | ||||||
| 228,851,753 | ||||||||
SOUTH AFRICA (3.1%) | ||||||||
Consumer Discretionary (1.1%) | ||||||||
Truworths International Ltd. | 17,948,863 | 95,668,027 | ||||||
Consumer Staples (0.9%) | ||||||||
Massmart Holdings Ltd. | 9,743,893 | 73,774,821 | ||||||
Materials (0.0%) | ||||||||
BHP Billiton PLC (b) | 111,613 | 2,013,592 | ||||||
Telecommunication Services (1.1%) | ||||||||
MTN Group Ltd. (b) | 10,925,178 | 94,864,491 | ||||||
| 266,320,931 | ||||||||
TAIWAN (5.5%) | ||||||||
Information Technology (4.6%) | ||||||||
Taiwan Semiconductor Manufacturing Co. Ltd. | 50,024,117 | 403,052,452 | ||||||
Telecommunication Services (0.9%) | ||||||||
Taiwan Mobile Co. Ltd. | 21,089,255 | 75,170,176 | ||||||
| 478,222,628 | ||||||||
THAILAND (4.0%) | ||||||||
Financials (1.9%) | ||||||||
Siam Commercial Bank PCL (The), Foreign Shares (b) | 37,806,100 | 166,763,587 | ||||||
Materials (2.1%) | ||||||||
Siam Cement PCL (The), Foreign Shares (b) | 11,821,000 | 173,614,425 | ||||||
Siam Cement PCL (The), NVDR (b) | 793,300 | 11,701,083 | ||||||
| 185,315,508 | ||||||||
| 352,079,095 | ||||||||
TURKEY (3.8%) | ||||||||
Consumer Staples (1.6%) | ||||||||
BIM Birlesik Magazalar A.S. (b) | 6,830,673 | 139,398,276 | ||||||
Financials (2.2%) | ||||||||
Akbank Turk A.S. (b) | 39,344,408 | 104,080,845 | ||||||
Turkiye Garanti Bankasi A.S. (b) | 32,958,337 | 90,803,518 | ||||||
| 194,884,363 | ||||||||
| 334,282,639 | ||||||||
UNITED KINGDOM (0.9%) | ||||||||
Financials (0.9%) | ||||||||
Standard Chartered PLC (a)(b) | 7,985,932 | 79,538,833 | ||||||
Total Common Stocks | 7,834,574,518 | |||||||
PREFERRED STOCKS (8.6%) | ||||||||
BRAZIL (2.8%) | ||||||||
Financials (2.8%) | ||||||||
Banco Bradesco SA, ADR, Preferred Shares, 1.94% | 22,598,057 | 238,861,463 | ||||||
REPUBLIC OF SOUTH KOREA (5.8%) | ||||||||
Consumer Staples (0.4%) | ||||||||
Amorepacific Corp., Preferred Shares, 0.89% | 202,647 | 32,286,776 | ||||||
Information Technology (5.4%) | ||||||||
Samsung Electronics Co. Ltd., Preferred Shares, 1.20% (b) | 237,419 | 475,513,246 | ||||||
| 507,800,022 | ||||||||
Total Preferred Stocks | 746,661,485 | |||||||
See accompanying Notes to Financial Statements.
| 22 | Annual Report 2017 |
Statement of Investments (concluded)
October 31, 2017
Aberdeen Emerging Markets Fund
| Shares or Principal Amount | Value | |||||||
SHORT-TERM INVESTMENT (1.5%) | ||||||||
UNITED STATES (1.5%) | ||||||||
State Street Institutional U.S. Government Money Market Fund, Institutional Class, 0.96% (e) | 126,818,025 | $ | 126,818,025 | |||||
Total Short-Term Investment | 126,818,025 | |||||||
Total Investments |
| 8,708,054,028 | ||||||
Liabilities in Excess of Other Assets—(0.1)% |
| (5,834,600 | ) | |||||
Net Assets—100.0% | $ | 8,702,219,428 | ||||||
| (a) | Non-income producing security. |
| (b) | Fair Values are determined pursuant to procedures approved by the Fund’s Board of Trustees. Unless otherwise noted, securities are valued by applying valuation factors to the exchange traded price. See Note 2(a) of the accompanying Notes to Financial Statements. |
| (c) | China A Shares. These shares are issued in local currency, traded in the local stock markets and are held through either a Qualified Foreign Institutional Investor (QFII) license or the Shanghai or Shenzhen Hong-Kong Stock Connect program. |
| (d) | All or a portion of the securities are on loan. The total value of all securities on loan is $8,170,982. The amount of securities on loan indicated may not correspond with the securities on loan identified because securities with pending sales are in the process of recall from the brokers. See Note 2(k) for additional information. |
| (e) | Registered investment company advised by State Street Global Advisors. The rate shown is the current yield as of October 31, 2017. |
| (f) | See accompanying Notes to Financial Statements for tax unrealized appreciation/(depreciation) of securities. |
| ADR | American Depositary Receipt |
| NVDR | Non-Voting Depositary Receipt |
| PLC | Public Limited Company |
See accompanying Notes to Financial Statements.
| 2017 Annual Report | 23 |
Aberdeen Focused U.S. Equity Fund (Unaudited)
Effective November 15, 2017, there was a change in Aberdeen Equity Long-Short Fund’s investment strategy and it was renamed Aberdeen U.S. Focused Equity Fund. This commentary covers the 2017 fiscal year for Aberdeen Equity Long-Short Fund. The Fund will be managed pursuant to a “focused” strategy whereby the Fund’s investment adviser will typically invest the Fund’s assets in a small number of issuers. The Fund generally expects to hold approximately 20 to 30 issuers. The Fund may invest in securities of any market capitalization and the amount of small-, mid- and large-capitalization companies will vary based on market conditions. The Fund may also invest in securities of any market sector and may hold a significant amount of securities of companies, from time to time, within a single sector.
The Aberdeen Equity Long-Short Fund (Institutional Class shares net of fees) returned 10.12% for the 12-month period ended October 31, 2017, versus 0.71% for its benchmark, the Citigroup 3-Month Treasury Bill Index, and 23.63% for the U.S. broader-market Standard & Poor’s (S&P) 500 Index, for the same period. For broader comparison, the average return of the Fund’s peer category of Alternative Long/Short Equity Funds (comprising 135 funds), as measured by Lipper, Inc., was 11.73% for the period.
Major U.S. equity indices moved sharply higher over the 12-month period ended October 31, 2017, despite numerous periods of uncertainty surrounding the policies of the new administration of U.S. President Donald Trump. Most U.S. companies reported strong results and generally upbeat outlooks during the reporting period. Earnings largely have been strong enough to support stocks across the market-capitalization ranges. U.S. small-cap stocks, as measured by the Russell 2000 Index, gained 27.85% for the reporting period, outperforming the 23.63% return of their large-cap counterparts, as measured by the S&P 500 Index. Ten of the eleven sectors within S&P 500 Index garnered positive returns for the reporting period, led by information technology, financials and materials. Conversely, telecommunication services was the lone sector to record a negative return for the period, while shares of energy and consumer staples companies posted more modest gains and substantially lagged the overall market.
At the beginning of the reporting period in November 2016, the unexpected U.S. presidential election results led to a sharp rise in stock market valuations. President Trump had campaigned on a populist, laissez-faire and protectionist platform and had promised to undo the policies of the administration of former President Barack Obama if elected. However, despite a slew of executive orders and a threat to withdraw from existing trade agreements, the administration encountered obstacles to the fulfillment of its campaign promises. Other mounting challenges facing the new administration included the ongoing investigation into alleged ties between the Trump campaign’s staff and the Russian government.
Elsewhere in the U.S. political arena, the Republican-controlled Senate could not reach an agreement on healthcare reform despite crafting two separate proposals to “repeal and replace” the Affordable Care Act (dubbed “Obamacare”), which would have eliminated some key provisions of the current healthcare law. Separately, towards the end of the reporting period, the Republican-controlled House of Representatives approved a budget proposal for the government’s 2018 fiscal year, which began on October 1, 2017, by a margin of four votes; no Democrats supported the bill. The budget plan seeks to cut corporate and individual tax rates while concurrently eliminating or reducing other tax deductions in an effort to limit the projected increase in the federal deficit to $1.5 trillion over the next 10 years.
Several sectors within the U.S. equity market recently have seen notable developments. Growth in corporate technology spending accelerated toward the end of the reporting period as companies continue to reallocate their data needs toward cloud services and have been upgrading their installed PCs. Healthcare companies performed very well early in the 2017 calendar year, bolstered by strong returns from biotechnology stocks. Construction of new homes remains on the upswing, but still favors multi-family residences (i.e., apartment buildings). Automobile sales remain at a strong clip, but appear to have peaked, at least temporarily. However, the average age of the U.S. private-passenger automobile fleet remains quite old compared to its historical levels over the past few decades. Finally, the retail sector remains tumultuous; several “brick-and-mortar” retailers filed bankruptcy in 2017, but online shopping continues to accelerate, growing more than 15% year over year in the third quarter of 2017.1
There was generally positive U.S. economic news over the reporting period:
| • | The Federal Reserve (Fed) increased the federal funds rate to a range of 1.00% to 1.25% over the review period in three increments of 25 basis points in December 2016, and March and June 2017. The minutes of the Fed’s meeting of September 19-20, 2017 indicated that the central bank intends to continue to make “gradual adjustments in the stance of monetary policy.” |
| • | Gross domestic product (GDP) grew between 1.8% and 3.3% on an annualized basis over the four quarters comprising the reporting period, bolstered mainly by increases in consumer spending and nonresidential fixed investment. |
| • | The U.S. economy added an average of 167,000 jobs per month over the 12-month reporting period, down from the 203,000 average monthly increase for the same time frame a year earlier. |
| • | The unemployment rate fell 0.7 percentage point over the reporting period to 4.1% – its lowest level since September 2000 – and average hourly earnings were up 2.4% year over year as of the end of October 2017. |
| 1 | Source: U.S. Department of Commerce, November 2017. |
| 24 | Annual Report 2017 |
Aberdeen Focused U.S. Equity Fund (Unaudited) (continued)
As expected amid a market environment of generally rising stock prices, the Fund’s long holdings significantly enhanced performance over the reporting period, while the short exposures had an adverse impact. However, the short positions significantly underperformed the S&P 500 Index over the period. The Fund’s net exposure2 increased over the reporting period, ending in the high-40% range after remaining in the low-40% area for much of the first half of the period.
Fund performance for the period was bolstered mainly by long holdings in the information technology, financials and industrials sectors. The most notable contributors among individual holdings were industrial machinery manufacturer Deere & Co., payment-processing services provider Visa, and IT services provider Cognizant Technology Solutions.
Deere & Co. posted healthy year-over-year revenue and earnings per share (EPS) growth for the second quarter of its 2017 fiscal year. The company benefited mainly from strength in its Construction & Forestry and Agriculture & Turf segments and in markets outside the U.S. and Canada. Furthermore, management raised its earnings guidance for the full 2017 fiscal year, anticipating a notable increase in machinery sales. Visa’s results over the reporting period benefited largely from continued growth in payments volume, cross-border volume3 and processed transactions. Cognizant Technology Solutions posted healthy revenue growth over the review period, attributable mainly to an increase in demand for digital solutions in the consulting and technology services business.
Conversely, short exposures to the financials, industrials and information technology sectors weighed on Fund performance for the reporting period. The primary individual stock detractors included short positions in Agilent Technologies, a provider of instruments, software and services for laboratories, and truck manufacturer PACCAR.
Shares of the Fund’s holding in Agilent Technologies performed well over the reporting period as the company posted generally positive results, bolstered by healthy year-over-year revenue growth in both its Life Sciences and Applied Markets Group and Agilent CrossLab Group. The company also saw a sharp rebound in energy-related revenues in the second quarter of its 2017 fiscal year, following seven consecutive quarters of decline in that segment. PACCAR benefited over the reporting period from increases in revenue and gross profit margin. There was particular strength in truck sales in Europe, which offset relative weakness in North America.
During the reporting period, we established new long holdings in Beacon Roofing Supply brewer Molson Coors Brewing Co.; real estate management and development company Jones Lang LaSalle; commercial bank Regions Financial Corp.; Alphabet, the parent company of Google; oil and gas company ConocoPhillips; and tool-maker Snap-on. Conversely, we exited the Fund’s long positions in defense contractor Lockheed Martin; medical technology products manufacturer Teleflex; Bank of the Ozarks; industrial machinery manufacturer Deere & Co.; energy services provider Core Laboratories; and industrial and roller bearings manufacturer RBC Bearings.
Regarding portfolio activity during the reporting period, we initiated long positions in healthcare services provider Aetna and IT services provider CDW Corp. We exited the long holding in contract research organization PAREXEL International Corp. following the announcement of its acquisition by a private equity firm. We also sold the Fund’s long positions in marketing and loyalty solutions services provider Alliance Data Systems and credit rating agency Moody’s Corp.
We initiated new short exposures to SPDR S&P 500 ETF Trust, an exchange-traded fund, and The Toro Company, a provider of professional turf maintenance equipment and services and landscaping products. We closed the Fund’s short positons in casual restaurant operator Chipotle Mexican Grill and specialty retailer Tractor Supply Co.
The 3.3% increase in U.S. GDP in the third quarter of 2017 exceeded expectations and was a strong reading in light of the negative impact from the recent hurricanes. Overall growth was supported by both consumer spending and business investment. This is the first time that the GDP has grown at least 3% for two consecutive quarters since 2014, which we feel is a good sign that the economy is gaining steam. The impact on U.S. companies has been noticeable as the third-quarter earnings season is off to a strong start for small caps, with both sales and earnings growth accelerating from their second-quarter levels, and tracking ahead of sales and earnings growth for large caps. This is a reversal of the recent trend and is probably needed in order for small caps to maintain a valuation premium relative to larger companies. As it stands, small caps currently trade at 18.2 times forward earnings, a 4% premium to large caps – slightly below the longer-term average.
Within the large-cap universe, nearly three-quarters of S&P 500 Index companies posted better-than-expected EPS for the third quarter of 2017, while two-thirds exceeded consensus revenue estimates.4 Furthermore, the blended year-over-year earnings growth rate for S&P 500 constituents was 6.2%. Seven of the eleven sectors within the index saw increases in EPS over the quarter, with energy companies leading the way.
We believe that the market generally reflects the positive results from companies and improvement in the economy. Consequently, we think that valuations are largely fair, not cheap. We continue to seek specific companies for our portfolios that we feel have opportunities to increase their earnings and/or expand valuations.
| 2 | The net exposure is the difference between the percentage of assets invested in long positions and the percentage of assets invested in short positions. |
| 3 | Cross-border volume refers to payments and cash volume where the issuing country is different from the merchant country. |
| 4 | Source: Earnings Insight, FactSet, November 17, 2017. |
| 2017 Annual Report | 25 |
Aberdeen Focused U.S. Equity Fund (Unaudited) (concluded)
Portfolio Management:
Aberdeen North American Equity Team
PAST PERFORMANCE DOES NOT GUARANTEE FUTURE RESULTS.
The performance data quoted represents past performance and current returns may be lower or higher. Class A Shares have up to a 5.75% front-end sales charge and a 0.25% 12b-1 fee. The investment return and principal value will fluctuate so that an investor’s shares, when redeemed, may be worth more or less than the original cost. To obtain performance information current to the most recent month-end, which may be higher or lower than the performance shown above, please call 866-667-9231 or go to www.aberdeen-asset.us.
Investing in mutual funds involves risk, including possible loss of principal.
Indexes are unmanaged and have been provided for comparison purposes only. No fees or expenses are reflected. You cannot invest directly in an index.
Lipper is a leading global provider of mutual fund information and analysis to fund companies, financial intermediaries and media organizations.
Risk Considerations
There are special risks associated with selling securities short. A short position will lose value as the security’s price increases. Theoretically, the loss on a short sale can be unlimited. The use of leverage will also increase market exposure and magnify risk.*
Equity stocks of small- and mid-cap companies carry greater risk and more volatility than equity stocks of larger, more established companies.
Focus Risk – A fund that invests a greater proportion of its assets in securities of a smaller number of issuers will be subject to greater volatility with respect to its investments than a fund that invests in a larger number of securities.
Investing a significant portion of the Fund’s assets in securities of companies conducting business in a broadly related group of industries within an economic sector may make the Fund more vulnerable to unfavorable developments in that sector.
Please read the prospectus for more detailed information regarding these and other risks.
| * | Prior to November 15, 2017, as described above, the Fund sold securities short. |
| 26 | Annual Report 2017 |
Aberdeen Focused U.S. Equity Fund (Unaudited)
| Average Annual Total Return1 (For periods ended October 31, 2017) | 1 Yr. | 5 Yr. | 10 Yr. | |||||||||||
Class A | w/o SC | 9.69% | 4.04% | 1.60% | ||||||||||
| w/SC2 | 3.36% | 2.81% | 0.99% | |||||||||||
Class C | w/o SC | 8.89% | 3.34% | 0.89% | ||||||||||
| w/SC3 | 8.03% | 3.34% | 0.89% | |||||||||||
Class R4 | w/o SC | 9.35% | 3.64% | 1.24% | ||||||||||
Institutional Service Class4,5 | w/o SC | 9.96% | 4.15% | 1.54% | ||||||||||
Institutional Class4 | w/o SC | 10.12% | 4.39% | 1.90% | ||||||||||
All figures showing the effect of a sales charge (SC) reflect the maximum charge possible because it has the most significant effect on performance data. The total returns shown above do not include the impact of financial statement rounding of the net asset value (NAV) per share and/or financial statement adjustments.
| 1 | The Fund changed its investment strategies effective November 15, 2017. Performance information for periods prior to November 15, 2017 does not reflect the current investment strategies. In connection with the change in investment strategies, the Fund changed its name from Aberdeen Equity Long-Short Fund to Aberdeen Focused U.S. Equity Fund. Returns prior to June 23, 2008 reflect the performance of a predecessor fund (the “Predecessor Fund”). Returns of the Predecessor Fund have not been adjusted to reflect the expenses applicable to the respective classes. The Fund and the Predecessor Fund had substantially similar investment objectives and strategies prior to the Fund’s adoption of its current investment strategies on November 15, 2017. Please consult the Fund’s prospectus for more detail. |
| 2 | A 5.75% front-end sales charge was deducted. |
| 3 | A 1.00% contingent deferred sales charge (CDSC) was deducted from the one year return because it is charged when Class C shares are sold within the first year after purchase. |
| 4 | Not subject to any sales charges. |
| 5 | Returns before the first offering of the Institutional Service Class (November 1, 2009) are based on the previous performance of the Class C. Excluding the effect of any fee waivers or reimbursements, this performance is substantially similar to what the Institutional Service Class would have produced because both classes invest in the same portfolio of securities. Returns would only differ to the extent of differences in expenses of the two classes. |
Performance of a $10,000 Investment (as of October 31, 2017)
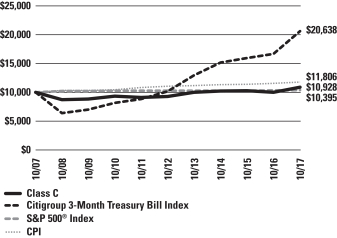
Comparative performance of $10,000 invested in Class C shares of the Aberdeen Focused U.S. Equity Fund, the S&P 500® Index, the Citigroup 3-Month Treasury Bill Index and the Consumer Price Index (CPI) over a 10-year period ended October 31, 2017. Unlike the Fund, the returns for these unmanaged indexes do not reflect any fees, expenses, or sales charges. Investors cannot invest directly in market indexes.
The Citigroup 3-Month Treasury Bill Index consists of the last three-month Treasury bill month-end rates. The index is not marked to market.
The S&P 500® Index represents large-cap U.S. equities. The index includes 500 leading companies and captures approximately 80% coverage of available U.S. market capitalization.
The CPI is a measure of the average change over time in the prices paid by urban consumers for a market basket of consumer goods and services.
| 2017 Annual Report | 27 |
Investment return and principal value will fluctuate, and when redeemed, shares may be worth more or less than original cost. Past performance is no guarantee of future results. The Average Annual Total Return table and Performance graph do not reflect the deduction of taxes that a shareholder would pay on fund distributions or the redemption of fund shares. Investing in mutual funds involves market risk, including loss of principal. Performance returns assume the reinvestment of all distributions. Total returns reflect waivers and reimbursements in effect, without which returns would have been lower.
Aberdeen Focused U.S. Equity Fund (Unaudited) (concluded)
Portfolio Summary (as a percentage of net assets)
October 31, 2017 (Unaudited)
| Long Positions | ||||
| Asset Allocation | ||||
Common Stocks | 92.4% | |||
Short-Term Investment | 3.6% | |||
Other Assets in Excess of Liabilities | 4.0% | |||
| 100.0% | ||||
The following table summarizes the composition of the Fund’s portfolio, in Standard & Poor’s Global Industry Classification Standard (GICS) sectors, expressed as a percentage of net assets. The GICS structure consists of 11 sectors, 24 industry groups, 68 industries and 157 sub-industries. As of October 31, 2017, the Fund did not have more than 25% of its assets invested in any industry group.
| Top Sectors of Long Positions | ||||
Information Technology | 20.2% | |||
Industrials | 15.4% | |||
Financials | 12.3% | |||
Consumer Staples | 12.0% | |||
Consumer Discretionary | 9.8% | |||
Health Care | 8.5% | |||
Materials | 6.5% | |||
Energy | 5.6% | |||
Real Estate | 2.1% | |||
Other | 7.6% | |||
| 100.0% | ||||
| Top Holdings of Long Positions* | ||||
Oracle Corp. | 3.6% | |||
Visa, Inc., Class A | 3.5% | |||
Alphabet, Inc., Class A | 3.3% | |||
Praxair, Inc. | 3.1% | |||
Intercontinental Exchange, Inc. | 2.8% | |||
Philip Morris International, Inc. | 2.8% | |||
Molson Coors Brewing Co., Class B | 2.7% | |||
Aetna, Inc. | 2.7% | |||
Estee Lauder Cos., Inc. (The), Class A | 2.6% | |||
Snap-on, Inc. | 2.6% | |||
Other | 70.3% | |||
| 100.0% | ||||
| * | For the purpose of listing top holdings, Short-Term Investments are included as part of Other. |
| Short Positions | ||||
| Asset Allocation | ||||
Common Stocks | 36.2% | |||
Exchange Traded Funds | 7.3% | |||
Other Assets in Excess of Liabilities | 56.5% | |||
| 100.0% | ||||
| Top Sectors of Short Positions | ||||
Industrials | 10.9% | |||
Consumer Discretionary | 7.8% | |||
Consumer Staples | 7.2% | |||
Information Technology | 5.8% | |||
Financials | 4.5% | |||
Other | 63.8% | |||
| 100.0% | ||||
| Top Holdings of Short Positions | ||||
SPDR S&P 500 ETF Trust | 4.0% | |||
Clorox Co. (The) | 3.4% | |||
Deluxe Corp. | 3.4% | |||
International Business Machines Corp. | 3.3% | |||
Utilities Select Sector SPDR Fund | 3.3% | |||
Dr Pepper Snapple Group, Inc. | 3.0% | |||
PACCAR, Inc. | 2.6% | |||
Priceline Group, Inc. (The) | 2.6% | |||
CA, Inc. | 2.5% | |||
FactSet Research Systems, Inc. | 2.4% | |||
Other | 69.5% | |||
| 100.0% | ||||
| 28 | Annual Report 2017 |
Statement of Investments
October 31, 2017
Aberdeen Focused U.S. Equity Fund
| Shares or Principal Amount | Value | |||||||
COMMON STOCKS — LONG POSITIONS (92.4%) |
| |||||||
Consumer Discretionary (9.8%) |
| |||||||
BorgWarner, Inc. | 13,125 | $ | 691,950 | |||||
Comcast Corp., Class A | 17,533 | 631,714 | ||||||
PVH Corp. | 5,258 | 666,767 | ||||||
TJX Cos., Inc. (The) | 8,956 | 625,129 | ||||||
| 2,615,560 | ||||||||
Consumer Staples (12.0%) | ||||||||
Casey’s General Stores, Inc. | 3,546 | 406,265 | ||||||
Costco Wholesale Corp. | 2,061 | 331,986 | ||||||
CVS Health Corp. | 4,645 | 318,322 | ||||||
Estee Lauder Cos., Inc. (The), Class A | 6,376 | 712,901 | ||||||
Molson Coors Brewing Co., Class B | 8,828 | 713,920 | ||||||
Philip Morris International, Inc. | 7,160 | 749,222 | ||||||
| 3,232,616 | ||||||||
Energy (5.6%) | ||||||||
ConocoPhillips | 10,561 | 540,195 | ||||||
EOG Resources, Inc. | 6,817 | 680,814 | ||||||
Schlumberger Ltd. | 4,450 | 284,800 | ||||||
| 1,505,809 | ||||||||
Financials (12.3%) | ||||||||
American International Group, Inc. | 10,714 | 692,232 | ||||||
Charles Schwab Corp. (The) | 15,503 | 695,154 | ||||||
Intercontinental Exchange, Inc. | 11,556 | 763,852 | ||||||
M&T Bank Corp. | 3,429 | 571,854 | ||||||
Regions Financial Corp. | 37,493 | 580,392 | ||||||
| 3,303,484 | ||||||||
Health Care (8.5%) | ||||||||
Aetna, Inc. | 4,195 | 713,276 | ||||||
Baxter International, Inc. | 8,694 | 560,502 | ||||||
Gilead Sciences, Inc. | 6,452 | 483,642 | ||||||
Globus Medical, Inc., Class A (a) | 16,067 | 512,055 | ||||||
| 2,269,475 | ||||||||
Industrials (15.4%) | ||||||||
Beacon Roofing Supply, Inc. (a) | 12,052 | 667,801 | ||||||
Canadian National Railway Co. | 6,616 | 532,522 | ||||||
Equifax, Inc. | 4,130 | 448,229 | ||||||
Ritchie Bros Auctioneers, Inc. | 21,938 | 614,922 | ||||||
Rockwell Automation, Inc. | 2,978 | 598,042 | ||||||
Snap-on, Inc. | 4,446 | 701,490 | ||||||
Verisk Analytics, Inc., Class A (a) | 6,826 | 580,551 | ||||||
| 4,143,557 | ||||||||
Information Technology (20.2%) |
| |||||||
Alphabet, Inc., Class A (a) | 853 | 881,183 | ||||||
CDW Corp. | 8,680 | 607,600 | ||||||
Cognizant Technology Solutions Corp., Class A | 9,149 | 692,305 | ||||||
Manhattan Associates, Inc. (a) | 15,282 | 639,704 | ||||||
Oracle Corp. | 18,829 | 958,396 | ||||||
Texas Instruments, Inc. | 7,226 | 698,682 | ||||||
Visa, Inc., Class A | 8,664 | 952,867 | ||||||
| 5,430,737 | ||||||||
Materials (6.5%) | ||||||||
Ecolab, Inc. | 3,017 | 394,201 | ||||||
Praxair, Inc. | 5,618 | 820,902 | ||||||
Sensient Technologies Corp. | 6,892 | 524,137 | ||||||
| 1,739,240 | ||||||||
Real Estate (2.1%) | ||||||||
Jones Lang LaSalle, Inc. | 4,248 | 550,074 | ||||||
Total Common Stocks — Long Positions | 24,790,552 | |||||||
SHORT-TERM INVESTMENT (3.6%) |
| |||||||
State Street Institutional U.S. Government Money Market Fund, Institutional Class, 0.96% (b) | 971,612 | 971,612 | ||||||
Total Short-Term Investment — Long Positions |
| 971,612 | ||||||
Total Investments — Long Positions | 25,762,164 | |||||||
Other Assets in Excess of Liabilities—4.0% | 1,076,231 | |||||||
Net Assets—100.0% | $ | 26,838,395 | ||||||
COMMON STOCKS — SHORT POSITIONS (36.2%) |
| |||||||
Consumer Discretionary (7.8%) |
| |||||||
Gap, Inc. (The) | 13,170 | 342,288 | ||||||
Garmin Ltd. | 9,530 | 539,493 | ||||||
Priceline Group, Inc. (The) (a) | 357 | 682,570 | ||||||
Wendy’s Co. (The) | 34,757 | 528,654 | ||||||
| 2,093,005 | ||||||||
Consumer Staples (7.2%) |
| |||||||
B&G Foods, Inc. | 6,396 | 203,393 | ||||||
Clorox Co. (The) | 7,300 | 923,669 | ||||||
Dr Pepper Snapple Group, Inc. | 9,360 | 801,777 | ||||||
| 1,928,839 | ||||||||
Financials (4.5%) | ||||||||
Allstate Corp. (The) | 6,083 | 570,951 | ||||||
FactSet Research Systems, Inc. | 3,405 | 646,507 | ||||||
| 1,217,458 | ||||||||
Industrials (10.9%) | ||||||||
Deluxe Corp. | 13,220 | 920,773 | ||||||
Fastenal Co. | 13,678 | 642,456 | ||||||
PACCAR, Inc. | 9,790 | 702,237 | ||||||
Toro Co. (The) | 10,244 | 643,835 | ||||||
| 2,909,301 | ||||||||
Information Technology (5.8%) |
| |||||||
CA, Inc. | 20,553 | 665,506 | ||||||
International Business Machines Corp. | 5,768 | 888,618 | ||||||
| 1,554,124 | ||||||||
Total Common Stocks — Short Positions | 9,702,727 | |||||||
See accompanying Notes to Financial Statements.
| 2017 Annual Report | 29 |
Statement of Investments (concluded)
October 31, 2017
Aberdeen Focused U.S. Equity Fund
| Shares or Principal Amount | Value | |||||||
EXCHANGE TRADED FUNDS — SHORT POSITIONS (7.3%) |
| |||||||
Equity Funds (7.3%) | ||||||||
SPDR S&P 500 ETF Trust | 4,194 | $ | 1,078,487 | |||||
Utilities Select Sector SPDR Fund | 16,036 | 883,905 | ||||||
| 1,962,392 | ||||||||
Total Exchange Traded Funds — Short Positions |
| 1,962,392 | ||||||
Total Securities Sold Short | $ | 11,665,119 | ||||||
| (a) | Non-income producing security. |
| (b) | Registered investment company advised by State Street Global Advisors. The rate shown is the current yield as of October 31, 2017. |
| (c) | See accompanying Notes to Financial Statements for tax unrealized appreciation/(depreciation) of securities. |
| ETF | Exchange-Traded Fund |
See accompanying Notes to Financial Statements.
| 30 | Annual Report 2017 |
Aberdeen Global Equity Fund (Unaudited)
The Aberdeen Global Equity Fund (Institutional Class shares net of fees) returned 19.75% for the 12-month period ended October 31, 2017, versus the 23.46% return of its benchmark, the MSCI World Index, and the 23.86% return of its secondary benchmark, the MSCI All Country (AC) World Index, during the same period. For broader comparison, the average return of the Fund’s peer category of Global Large-Cap Core Funds (comprising 32 funds), as measured by Lipper, Inc., was 22.43% for the period.
Global equities posted gains for the 12-month period ended October 31, 2017, underpinned by upbeat economic data reports. Improving economic activity in the U.S. prompted the Federal Reserve to tighten monetary policy. Expectations of rising interest rates bolstered the performance of the U.S. banking sector, while reflationary trades triggered by President Donald Trump’s election waned amid increasing political turmoil within the White House. The economic recovery in the Eurozone, as well as positive outcomes from elections in France and the Netherlands, also strengthened the global equity markets, although they were roiled by rising secessionist fervor in the Catalonia region of Spain and its potential disruption to business operations. Equities in the U.K. weakened amid Prime Minister Theresa May’s failed bid to secure a larger mandate from a snap election that resulted in a hung Parliament. Following China’s widely watched 19th National Party Congress1 in October 2017, the nation’s economy showed signs of softening with manufacturing activity falling, although it remained on track to reach its full-year growth target, which buoyed investor sentiment. Japanese businesses were bolstered by incumbent Prime Minister Shinzo Abe’s snap election victory in October 2017, and continued monetary stimulus. Elsewhere, Brent crude oil prices rose over the reporting period on the back of supply cuts by the Organization of the Petroleum Exporting Countries (OPEC), easing shale oil production in the U.S., and a bid to consolidate power by the crown prince in Saudi Arabia.
Among the Fund’s individual holdings, CVS Health Corp. weighed on performance after its management modestly lowered its earnings forecast for its full 2017 fiscal year. While the company saw an increase in revenue for the second quarter of its 2017 fiscal year, profitability was flat in its pharmacy benefit manager (PBM) segment, and retail sales declined. Given our concerns over increased competition and questions surrounding the position of PBM in the U.S. healthcare sector, we reduced our position in CVS Health during the reporting period. The Fund’s holding in Japan Tobacco (JT) detracted from performance because investors were concerned that potentially higher excise taxes and regulations aimed at curbing tobacco consumption, along with novel nicotine products sold by competitors, could weigh on JT’s profits and market share. Nonetheless, the company remains the world’s third-largest cigarette company, with a track record of what we believe are sensible acquisitions and returning excess capital to shareholders. Shares of Mexican retailer and Coke bottler FEMSA declined during the period amid increased anxiety about the North American Free Trade Agreement (NAFTA), the impending elections and a string of natural disasters disrupting operations. However, FEMSA’s fuel division posted improved profitability, and its balance sheet strengthened following the monetization2 of a portion of its stake in brewer Heineken (which the Fund does not hold).
On the positive side, two of the Fund’s holdings in the technology sector, Samsung Electronics (SEC) and Taiwan Semiconductor Manufacturing Co. (TSMC), performed well during the reporting period. Both companies generated sector-leading profit margins that were supported by growing demand for their semiconductors, given the rapid rise of automation, digitization and digitalization across industries. Investors appear to be taking a favorable view of their growth prospects and earnings potential. Additionally, we feel that the companies’ balance sheets are robust and their valuations remain attractive. With their solid cash generation, both companies continue to invest in their businesses and improve shareholder returns through share buybacks and dividends. Shares of the Fund’s holding in luxury auto-maker Rolls Royce rose over the reporting period due to the company’s solid financial performance. Revenues were boosted by increases in engine sales and maintenance work, and profit growth in the company’s civil and defense aerospace and power systems divisions.
During the reporting period, we initiated a holding in Diageo, a global alcoholic beverages producer that we believe has scope for operational efficiencies and is generating healthy cash flows. We also established a new position in Sysmex Corp., a market-leading Japanese diagnostic supplier, following a pullback in its share price. In our opinion, the business has attractive long-term opportunities for growth. In contrast, we exited the Fund’s position in City Developments as we believe that it was trading at full valuation following a robust recovery in its share price, which reflects a positive outlook for the Singaporean property market.
We believe that generally good economic conditions should support equity prices. Business sentiment in the U.S. is likely to be buoyed by prospects of lower corporate taxes, in our view. Banks in the Eurozone anticipate healthier demand for loans from both businesses and households. Underpinning this trend are persistent low interest rates, increased capital expenditures, a favorable housing market, low unemployment and rising consumer confidence. However, in China, economic growth may moderate, as we feel that the Chinese Communist Party appears to be prioritizing stability over aggressive growth targets. Elsewhere, crude oil prices are recovering, supported by growing demand, supply cuts and stabilizing shale oil production. Nonetheless, we are cognizant that much uncertainty remains due to the move by major global central banks to exit quantitative easing, the unresolved Brexit issue in the U.K., rising trade protectionism and persistent geopolitical risks – all of which could still dent earnings growth. However, we believe that our bottom-up approach to investing positions the Fund well, and we will remain diligent in monitoring valuations, financial performance and the governance of companies in relation to their growth prospects, aiming to hold investments that we feel can withstand future challenges.
| 1 | The Chinese Communist Party sets its national policy goals and elects its leadership positions at the National Party Congress, which is held every five years. |
| 2 | Monetization comprises the conversion of an asset into money or legal tender. |
| 2017 Annual Report | 31 |
Aberdeen Global Equity Fund (Unaudited) (concluded)
Portfolio Management:
Aberdeen Global Equity Team
PAST PERFORMANCE DOES NOT GUARANTEE FUTURE RESULTS.
The performance data quoted represents past performance and current returns may be lower or higher. Class A Shares have up to a 5.75% front-end sales charge and a 0.25% 12b-1 fee. The investment return and principal value will fluctuate so that an investor’s shares, when redeemed, may be worth more or less than the original cost. To obtain performance information current to the most recent month-end, which may be higher or lower than the performance shown above, please call 866-667-9231 or go to www.aberdeen-asset.us.
Investing in mutual funds involves risk, including the possible loss of principal.
Indexes are unmanaged and have been provided for comparison purposes only. No fees or expenses are reflected. You cannot invest directly in an index.
Lipper is a leading global provider of mutual fund information and analysis to fund companies, financial intermediaries and media organizations.
Risk Considerations
Foreign securities may be more volatile, harder to price and less liquid than U.S. securities. They are subject to different accounting and regulatory standards, currency exchange rates, political and economic risks. Fluctuation in currency exchange rates may impact the Fund’s returns more greatly to the extent the Fund does not hedge currency exposure or hedging techniques are unsuccessful. The foregoing risks are enhanced in emerging market countries.
Equity stocks of small- and mid-cap companies carry greater risk and more volatility than equity stocks of larger, more established companies.
Investing a significant portion of the Fund’s assets in securities of companies conducting business in a broadly related group of industries within an economic sector may make the Fund more vulnerable to unfavorable developments in that sector.
Please read the prospectus for more detailed information regarding these and other risks.
| 32 | Annual Report 2017 |
Aberdeen Global Equity Fund (Unaudited)
| Average Annual Total Return1 (For periods ended October 31, 2017) | 1 Yr. | 5 Yr. | 10 Yr. | |||||||||||
Class A | w/o SC | 19.58% | 5.54% | 0.99% | ||||||||||
| w/SC2 | 12.74% | 4.30% | 0.39% | |||||||||||
Class C | w/o SC | 18.85% | 4.87% | 0.31% | ||||||||||
| w/SC3 | 17.85% | 4.87% | 0.31% | |||||||||||
Class R4 | w/o SC | 19.15% | 5.23% | 0.73% | ||||||||||
Institutional Service Class4,5 | w/o SC | 19.97% | 5.92% | 1.20% | ||||||||||
Institutional Class4 | w/o SC | 19.75% | 5.89% | 1.26% | ||||||||||
All figures showing the effect of a sales charge (SC) reflect the maximum charge possible because it has the most significant effect on performance data. The total returns shown above do not include the impact of financial statement rounding of the net asset value (NAV) per share and/or financial statement adjustments.
| 1 | Returns prior to June 23, 2008 reflect the performance of a predecessor fund (the “Predecessor Fund”). Returns of the Predecessor Fund have not been adjusted to reflect the expenses applicable to the respective classes. Aberdeen Asset Management Asia Limited began sub-advising the fund on January 1, 2009. Performance prior to this date reflects the performance of an unaffiliated sub-adviser. The Fund and the Predecessor Fund have substantially similar investment objectives and strategies. Please see footnotes for the relevant classes and consult the Fund’s prospectus for more detail. |
| 2 | A 5.75% front-end sales charge was deducted. |
| 3 | A 1.00% contingent deferred sales charge (CDSC) was deducted from the one year return because it is charged when Class C shares are sold within the first year after purchase. |
| 4 | Not subject to any sales charges. |
| 5 | Returns before the first offering of the Institutional Service Class (December 19, 2011) are based on the previous performance of the Fund’s Class A shares. Excluding the effect of any fee waivers or reimbursements, this performance is substantially similar to what the Institutional Service Class would have produced because both classes invest in the same portfolio of securities. Returns would only differ to the extent of the differences in expenses of the classes. |
Performance of a $10,000 Investment (as of October 31, 2017)
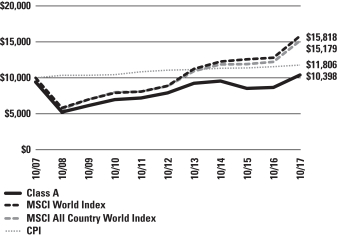
Comparative performance of $10,000 invested in Class A shares of the Aberdeen Global Equity Fund, Morgan Stanley Capital International (MSCI) World Index, MSCI All Country World Index (ACWI) and the Consumer Price Index (CPI) over a 10-year period ended October 31, 2017. Unlike the Fund, the returns for these unmanaged indexes do not reflect any fees, expenses or sales charges. Investors cannot invest directly in market indexes.
The MSCI World Index captures large and mid cap representation across 23 Developed Markets (DM) countries. With 1,652 constituents, the index covers approximately 85% of the free float-adjusted market capitalization in each country. DM countries in the Index are: Australia, Austria, Belgium, Canada, Denmark, Finland, France, Germany, Hong Kong, Ireland, Israel, Italy, Japan, Netherlands, New Zealand, Norway, Portugal, Singapore, Spain, Sweden, Switzerland, the UK and the US.
MSCI ACWI captures large and mid cap representation across 23 Developed Markets (DM) and 24 Emerging Markets (EM) countries. With 2,490 constituents, the index covers approximately 85% of the global investable equity opportunity set. DM countries in the Index are Australia, Austria, Belgium, Canada, Denmark, Finland, France, Germany, Hong Kong, Ireland, Israel, Italy, Japan, Netherlands, New Zealand, Norway, Portugal, Singapore, Spain, Sweden, Switzerland, the UK and the US. EM countries in the Index are: Brazil, Chile, China, Colombia, Czech Republic, Egypt, Greece, Hungary, India, Indonesia, Korea, Malaysia, Mexico, Pakistan, Peru, Philippines, Poland, Russia, Qatar, South Africa, Taiwan, Thailand, Turkey and United Arab Emirates.
The CPI is a measure of the average change over time in the prices paid by urban consumers for a market basket of consumer goods and services.
Investment return and principal value will fluctuate, and when redeemed, shares may be worth more or less than original cost. Past performance is no guarantee of future results. The Average Annual Total Return table and Performance graph do not reflect the deduction of taxes that a shareholder would pay on fund distributions or the redemption of fund shares. Investing in mutual funds involves market risk, including loss of principal. Performance returns assume the reinvestment of all distributions. Total returns reflect waivers and reimbursements in effect, without which returns would have been lower.
| 2017 Annual Report | 33 |
Aberdeen Global Equity Fund (Unaudited) (concluded)
Portfolio Summary (as a percentage of net assets)
October 31, 2017 (Unaudited)
| Asset Allocation | ||||
Common Stocks | 92.4% | |||
Preferred Stocks | 6.7% | |||
Short-Term Investment | 0.7% | |||
Other Assets in Excess of Liabilities | 0.2% | |||
| 100.0% | ||||
The following table summarizes the composition of the Fund’s portfolio, in Standard & Poor’s Global Industry Classification Standard (GICS) sectors, expressed as a percentage of net assets. The GICS structure consists of 11 sectors, 24 industry groups, 68 industries and 157 sub-industries. As of October 31, 2017, the Fund did not have more than 25% of its assets invested in any industry group.
| Top Sectors | ||||
Information Technology | 19.2% | |||
Consumer Staples | 16.4% | |||
Financials | 13.8% | |||
Health Care | 11.8% | |||
Industrials | 9.2% | |||
Energy | 7.9% | |||
Materials | 7.7% | |||
Consumer Discretionary | 5.3% | |||
Telecommunication Services | 3.4% | |||
Real Estate | 2.6% | |||
Other | 2.7% | |||
| 100.0% | ||||
| Top Holdings* | ||||
Taiwan Semiconductor Manufacturing Co. Ltd., ADR | 3.5% | |||
EOG Resources, Inc. | 3.4% | |||
M&T Bank Corp. | 3.3% | |||
Visa, Inc., Class A | 3.3% | |||
Roche Holding AG | 3.2% | |||
Oracle Corp. | 3.0% | |||
Shin-Etsu Chemical Co. Ltd. | 2.9% | |||
Novartis AG | 2.9% | |||
Vodafone Group PLC | 2.5% | |||
Samsung Electronics Co. Ltd., GDR, Preferred Shares | 2.4% | |||
Other | 69.6% | |||
| 100.0% | ||||
| * | For the purpose of listing top holdings, Short-Term Investments are included as part of Other. |
| Top Countries | ||||
United States | 33.6% | |||
United Kingdom | 14.6% | |||
Japan | 11.7% | |||
Switzerland | 8.1% | |||
Hong Kong | 5.5% | |||
Germany | 4.0% | |||
Taiwan | 3.5% | |||
India | 2.9% | |||
Republic of South Korea | 2.4% | |||
Brazil | 2.3% | |||
Other | 11.4% | |||
| 100.0% | ||||
| 34 | Annual Report 2017 |
Statement of Investments
October 31, 2017
Aberdeen Global Equity Fund
| Shares or Principal Amount | Value | |||||||
COMMON STOCKS (92.4%) | ||||||||
CANADA (1.6%) | ||||||||
Materials (1.6%) | ||||||||
Potash Corp. of Saskatchewan, Inc. | 36,600 | $ | 712,368 | |||||
GERMANY (2.0%) | ||||||||
Health Care (2.0%) | ||||||||
Fresenius Medical Care AG & Co. KGaA (a) | 9,000 | 871,398 | ||||||
HONG KONG (5.5%) | ||||||||
Financials (2.0%) | ||||||||
AIA Group Ltd. (a) | 112,100 | 844,727 | ||||||
Industrials (2.5%) | ||||||||
Jardine Matheson Holdings Ltd. (a) | 10,100 | 647,021 | ||||||
MTR Corp. Ltd. (a) | 75,000 | 434,811 | ||||||
| 1,081,832 | ||||||||
Real Estate (1.0%) | ||||||||
Swire Pacific Ltd., Class A (a) | 42,800 | 422,953 | ||||||
| 2,349,512 | ||||||||
INDIA (2.9%) | ||||||||
Consumer Staples (1.3%) | ||||||||
ITC Ltd. (a) | 140,650 | 577,806 | ||||||
Financials (1.6%) | ||||||||
Housing Development Finance Corp. Ltd. (a) | 25,300 | 664,711 | ||||||
| 1,242,517 | ||||||||
ISRAEL (2.2%) | ||||||||
Information Technology (2.2%) | ||||||||
Check Point Software Technologies Ltd. (b) | 8,000 | 941,680 | ||||||
ITALY (1.3%) | ||||||||
Energy (1.3%) | ||||||||
Tenaris SA, ADR | 20,200 | 550,450 | ||||||
JAPAN (11.7%) | ||||||||
Consumer Staples (1.9%) | ||||||||
Japan Tobacco, Inc. (a) | 24,300 | 804,334 | ||||||
Health Care Equipment & Supplies (1.8%) |
| |||||||
Sysmex Corp. (a) | 11,200 | 766,525 | ||||||
Industrials (1.7%) | ||||||||
FANUC Corp. (a) | 3,110 | 727,192 | ||||||
Information Technology (1.8%) | ||||||||
Keyence Corp. (a) | 1,400 | 777,315 | ||||||
Materials (2.9%) | ||||||||
Shin-Etsu Chemical Co. Ltd. (a) | 12,000 | 1,265,534 | ||||||
Real Estate (1.6%) | ||||||||
Daito Trust Construction Co. Ltd. (a) | 3,900 | 681,854 | ||||||
| 5,022,754 | ||||||||
MEXICO (1.7%) | ||||||||
Consumer Staples (1.7%) | ||||||||
Fomento Economico Mexicano SAB de CV, ADR | 8,500 | 745,875 | ||||||
SOUTH AFRICA (0.9%) | ||||||||
Telecommunication Services (0.9%) | ||||||||
MTN Group Ltd. (a) | 43,800 | 380,320 | ||||||
SWEDEN (1.8%) | ||||||||
Industrials (1.8%) | ||||||||
Atlas Copco AB, A Shares (a) | 17,300 | 758,630 | ||||||
SWITZERLAND (8.1%) | ||||||||
Consumer Staples (2.0%) | ||||||||
Nestle SA (a) | 10,000 | 841,385 | ||||||
Health Care (6.1%) | ||||||||
Novartis AG (a) | 15,200 | 1,253,684 | ||||||
Roche Holding AG (a) | 5,900 | 1,363,673 | ||||||
| 2,617,357 | ||||||||
| 3,458,742 | ||||||||
TAIWAN (3.5%) | ||||||||
Information Technology (3.5%) | ||||||||
Taiwan Semiconductor Manufacturing Co. Ltd., ADR | 35,400 | 1,498,482 | ||||||
THAILAND (1.7%) | ||||||||
Financials (1.7%) | ||||||||
Kasikornbank PCL (a) | 105,400 | 723,464 | ||||||
UNITED KINGDOM (14.6%) | ||||||||
Consumer Discretionary (1.9%) | ||||||||
Whitbread PLC (a) | 16,751 | 821,578 | ||||||
Consumer Staples (2.9%) | ||||||||
British American Tobacco PLC (a) | 12,300 | 794,701 | ||||||
Diageo PLC (a) | 12,800 | 437,105 | ||||||
| 1,231,806 | ||||||||
Energy (1.7%) | ||||||||
Royal Dutch Shell PLC, B Shares (a) | 23,400 | 753,416 | ||||||
Financials (1.4%) | ||||||||
Standard Chartered PLC (a)(b) | 58,930 | 586,935 | ||||||
Industrials (3.2%) | ||||||||
Experian PLC (a) | 32,400 | 682,613 | ||||||
Rolls-Royce Holdings PLC (b)(c) | 2,457,642 | 3,264 | ||||||
Rolls-Royce Holdings PLC (a)(b) | 53,427 | 690,436 | ||||||
| 1,376,313 | ||||||||
Materials (1.0%) | ||||||||
BHP Billiton PLC (a) | 24,200 | 438,156 | ||||||
Telecommunication Services (2.5%) | ||||||||
Vodafone Group PLC (a) | 373,600 | 1,068,622 | ||||||
| 6,276,826 | ||||||||
UNITED STATES (32.9%) | ||||||||
Consumer Discretionary (3.4%) |
| |||||||
Comcast Corp., Class A | 21,700 | 781,851 | ||||||
TJX Cos., Inc. (The) | 9,400 | 656,120 | ||||||
| 1,437,971 | ||||||||
See accompanying Notes to Financial Statements.
| 2017 Annual Report | 35 |
Statement of Investments (concluded)
October 31, 2017
Aberdeen Global Equity Fund
| Shares or Principal Amount | Value | |||||||
Consumer Staples (4.6%) |
| |||||||
CVS Health Corp. | 10,950 | $ | 750,404 | |||||
PepsiCo, Inc. | 7,350 | 810,190 | ||||||
Philip Morris International, Inc. | 3,700 | 387,168 | ||||||
| 1,947,762 | ||||||||
Energy (4.9%) | ||||||||
EOG Resources, Inc. | 14,800 | 1,478,076 | ||||||
Schlumberger Ltd. | 10,000 | 640,000 | ||||||
| 2,118,076 | ||||||||
Financials (4.8%) | ||||||||
Intercontinental Exchange, Inc. | 9,700 | 641,170 | ||||||
M&T Bank Corp. | 8,600 | 1,434,222 | ||||||
| 2,075,392 | ||||||||
Health Care (3.7%) | ||||||||
Johnson & Johnson | 4,900 | 683,109 | ||||||
Perrigo Co. PLC | 11,250 | 911,137 | ||||||
| 1,594,246 | ||||||||
Information Technology (9.3%) |
| |||||||
Amdocs Ltd. | 9,500 | 618,450 | ||||||
Cognizant Technology Solutions Corp., Class A | 9,200 | 696,164 | ||||||
Oracle Corp. | 25,100 | 1,277,590 | ||||||
Visa, Inc., Class A | 12,700 | 1,396,746 | ||||||
| 3,988,950 | ||||||||
Materials (2.2%) | ||||||||
Praxair, Inc. | 6,300 | 920,556 | ||||||
| 14,082,953 | ||||||||
Total Common Stocks | 39,615,971 | |||||||
PREFERRED STOCKS (6.7%) | ||||||||
BRAZIL (2.3%) | ||||||||
Financials (2.3%) | ||||||||
Banco Bradesco SA, ADR, Preferred Shares, 1.94% | 94,691 | 1,000,884 | ||||||
GERMANY (2.0%) | ||||||||
Consumer Staples (2.0%) | ||||||||
Henkel AG & Co. KGaA, Preferred Shares, 1.33% (a) | 6,100 | 856,539 | ||||||
REPUBLIC OF SOUTH KOREA (2.4%) | ||||||||
Information Technology (2.4%) | ||||||||
Samsung Electronics Co. Ltd., GDR, Preferred Shares, 1.20% | 1,000 | 1,010,000 | ||||||
Total Preferred Stocks | 2,867,423 | |||||||
SHORT-TERM INVESTMENT (0.7%) | ||||||||
UNITED STATES (0.7%) | ||||||||
State Street Institutional U.S. Government Money Market Fund, Institutional Class, 0.96% (d) | 294,372 | 294,372 | ||||||
Total Short-Term Investment | 294,372 | |||||||
Total Investments | 42,777,766 | |||||||
Other Assets in Excess of Liabilities—0.2% | 76,022 | |||||||
Net Assets—100.0% | $ | 42,853,788 | ||||||
| (a) | Fair Values are determined pursuant to procedures approved by the Fund’s Board of Trustees. Unless otherwise noted, securities are valued by applying valuation factors to the exchange traded price. See Note 2(a) of the accompanying Notes to Financial Statements. |
| (b) | Non-income producing security. |
| (c) | Illiquid security. |
| (d) | Registered investment company advised by State Street Global Advisors. The rate shown is the current yield as of October 31, 2017. |
| (e) | See accompanying Notes to Financial Statements for tax unrealized appreciation/(depreciation) of securities. |
| ADR | American Depositary Receipt |
| GDR | Global Depositary Receipt |
| PLC | Public Limited Company |
See accompanying Notes to Financial Statements.
| 36 | Annual Report 2017 |
Aberdeen International Equity Fund (Unaudited)
The Aberdeen International Equity Fund (Institutional Class shares net of fees) returned 20.48% for the 12-month period ended October 31, 2017, versus the 24.20% return of its benchmark, the Morgan Stanley Capital International (MSCI) All Country (AC) World ex USA Index, during the same period. For broader comparison, the average return of the Fund’s peer category of International Large-Cap Growth Funds (comprising 64 funds), as measured by Lipper, Inc., was 22.37% for the period.
International equities posted gains for the 12-month period ended October 31, 2017, underpinned by upbeat economic data reports. Improving economic activity in the U.S. prompted the Federal Reserve to tighten monetary policy. Expectations of rising interest rates bolstered the performance of the U.S. banking sector, while reflationary trades triggered by President Donald Trump’s election waned amid increasing political turmoil within the White House. The economic recovery in the Eurozone, as well as positive outcomes from elections in France and the Netherlands, also strengthened the international equity markets, although they were roiled by rising secessionist fervor in the Catalonia region of Spain and its potential disruption to business operations. Equities in the U.K. weakened amid Prime Minister Theresa May’s failed bid to secure a larger mandate from a snap election that resulted in a hung Parliament. Following China’s widely watched 19th National Party Congress1 in October 2017, the nation’s economy showed signs of softening with manufacturing activity falling, although it remained on track to reach its full-year growth target, which buoyed investor sentiment. Japanese businesses were bolstered by incumbent Prime Minister Shinzo Abe’s snap election victory in October 2017, and continued monetary stimulus. Elsewhere, Brent crude oil prices rose over the reporting period on the back of supply cuts by the Organization of the Petroleum Exporting Countries, easing shale oil production in the U.S., and a bid to consolidate power by the crown prince in Saudi Arabia.
Among the Fund’s individual holdings, Japan Tobacco (JT) detracted from performance because investors were concerned that potentially higher excise taxes and regulations aimed at curbing tobacco consumption, along with novel nicotine products sold by competitors, could weigh on JT’s profits and market share. Nonetheless, the company remains the world’s third-largest cigarette company, with a track record of what we believe are sensible acquisitions and returning excess capital to shareholders. Shares of Mexican retailer and Coke bottler FEMSA declined during the period amid increased anxiety about the North American Free Trade Agreement (NAFTA), the impending elections, and a string of natural disasters disrupting operations. However, FEMSA’s fuel division posted improved profitability, and its balance sheet strengthened following the monetization2 of a portion of its stake in brewer Heineken (which the Fund does not hold). The Fund’s position in Japanese bicycle component maker Shimano weighed on performance after the company lowered its earnings forecast for the full 2017 fiscal year given rising raw material prices. Nevertheless, Shimano retains an established market share and, in our view, is the de facto industry standard for bicycle gears.
On the positive side, the Fund’s position in Samsung Electronics (SEC) performed well over the reporting period. The company generated sector-leading profit margins, supported by growing demand for its semiconductors, and investors appeared to take a favorable view of its growth prospects and earnings potential. In addition, we feel that its balance sheet and cash flow are solid, and its valuation remains attractive. SEC continues to invest in its business and improve shareholder returns through share buybacks and dividends. The stock price of Fund holding Atlas Copco rose during the period as the manufacturer of compressors, vacuum solutions and air treatment systems delivered robust quarterly results that were driven by improved demand across its business, with order intake growing by a double-digit percentage. The Fund’s position in Prudential also contributed to performance as the U.K.-based diversified financial services company saw healthy growth in its Asian business and has benefited from rising global interest rates.
During the reporting period, we established a new position in Brazilian chemicals and fuel distribution company Ultrapar, as we believe that it is well managed and attractively valued. We also initiated holdings in AMOREPACIFIC Corp., a fast-growing Korean skincare and cosmetics business with increasing exposure to China; Diageo, a global alcoholic beverage producer that we feel has scope for operational efficiencies and is generating healthy cash flows; securities and derivatives exchange operator Japan Exchange Group, as we believe that it has a good business model and conservative management, and delivers strong returns and solid cash flow; Ritchie Bros. Auctioneers, a U.S.-focused auction business with large market share and good cash-generation; and Sysmex, a market-leading Japanese diagnostic supplier, which, in our opinion, has attractive long-term opportunities for growth.
In contrast, we exited the Fund’s positions in City Developments as it had been trading at what we viewed as full valuation following a robust recovery in its share price, which reflects a positive outlook for the Singaporean property market; engineering firm Weir Group, given its high valuation; and energy services company John Wood Group in view of its increased leverage following an acquisition.
We believe that generally good economic conditions should support equity prices. Business sentiment in the U.S. is likely to be buoyed by prospects of lower corporate taxes, in our view. Banks in the Eurozone anticipate healthier demand for loans from both businesses and households. Underpinning this are still-low interest rates, increased capital expenditures, a favorable housing market, low unemployment and rising consumer confidence. However, in China, economic growth may moderate, as we feel that the Chinese Communist Party appears to be prioritizing stability over aggressive growth targets. Elsewhere, crude oil prices are recovering, underpinned by growing demand, supply cuts and stabilizing shale oil
| 1 | The Chinese Communist Party sets its national policy goals and elects its leadership positions at the National Party Congress, which is held every five years. |
| 2 | Monetization comprises the conversion of an asset into money or legal tender. |
| 2017 Annual Report | 37 |
Aberdeen International Equity Fund (Unaudited) (concluded)
production. Nonetheless, we are cognizant that much uncertainty remains due to the move by major global central banks to exit quantitative easing, the unresolved Brexit issue in the U.K., rising trade protectionism and persistent geopolitical risks – all of which could still dent earnings growth. However, we believe that our bottom-up approach to investing positions the Fund well, and we will remain diligent in monitoring valuations, financial performance and the governance of companies in relation to their growth prospects, aiming to hold investments that we feel can withstand future challenges.
Portfolio Management:
Aberdeen Global Equity Team
PAST PERFORMANCE DOES NOT GUARANTEE FUTURE RESULTS.
The performance data quoted represents past performance and current returns may be lower or higher. Class A Shares have up to a 5.75% front-end sales charge and a 0.25% 12b-1 fee. The investment return and principal value will fluctuate so that an investor’s shares, when redeemed, may be worth more or less than the original cost. To obtain performance information current to the most recent month-end, which may be higher or lower than the performance shown above, please call 866-667-9231 or go to www.aberdeen-asset.us.
Investing in mutual funds involves risk, including the possible loss of principal.
Indexes are unmanaged and have been provided for comparison purposes only. No fees or expenses are reflected. You cannot invest directly in an index.
Lipper is a leading global provider of mutual fund information and analysis to fund companies, financial intermediaries and media organizations.
Risk Considerations
Foreign securities may be more volatile, harder to price and less liquid than U.S. securities. They are subject to different accounting and regulatory standards, currency exchange rates, political and economic risks. Fluctuation in currency exchange rates may impact the Fund’s returns more greatly to the extent the Fund does not hedge currency exposure or hedging techniques are unsuccessful. The foregoing risks are enhanced in emerging market countries.
Equity stocks of small- and mid-cap companies carry greater risk and more volatility than equity stocks of larger, more established companies.
Investing a significant portion of the Fund’s assets in securities of companies conducting business in a broadly related group of industries within an economic sector may make the Fund more vulnerable to unfavorable developments in that sector.
Please read the prospectus for more detailed information regarding these and other risks.
| 38 | Annual Report 2017 |
Aberdeen International Equity Fund (Unaudited)
| Average Annual Total Return1 (For periods ended October 31, 2017) | 1 Yr. | 5 Yr. | 10 Yr. | |||||||||||
Class A | w/o SC | 20.05% | 3.91% | (0.23% | ) | |||||||||
| w/SC2 | 13.19% | 2.68% | (0.82% | ) | ||||||||||
Class C | w/o SC | 19.27% | 3.19% | (0.92% | ) | |||||||||
| w/SC3 | 18.27% | 3.19% | (0.92% | ) | ||||||||||
Class R4 | w/o SC | 19.70% | 3.60% | (0.47% | ) | |||||||||
Institutional Service Class4 | w/o SC | 20.46% | 4.12% | (0.01% | ) | |||||||||
Institutional Class4 | w/o SC | 20.47% | 4.25% | 0.09% | ||||||||||
All figures showing the effect of a sales charge (SC) reflect the maximum charge possible because it has the most significant effect on performance data. The total returns shown above do not include the impact of financial statement rounding of the net asset value (NAV) per share and/or financial statement adjustments.
| 1 | Returns prior to June 23, 2008 reflect the performance of a predecessor fund (the “Predecessor Fund”). Returns of the Predecessor Fund have not been adjusted to reflect the expenses applicable to the respective classes. Aberdeen Asset Management Asia Limited began sub-advising the fund on January 1, 2009. Performance prior to this date reflects the performance of an unaffiliated sub-adviser. The Fund and the Predecessor Fund have substantially similar investment objectives and strategies. Please consult the Fund’s prospectus for more detail. |
| 2 | A 5.75% front-end sales charge was deducted. |
| 3 | A 1.00% contingent deferred sales charge (CDSC) was deducted from the one year return because it is charged when Class C shares are sold within the first year after purchase. |
| 4 | Not subject to any sales charges. |
Performance of a $10,000 Investment (as of October 31, 2017)
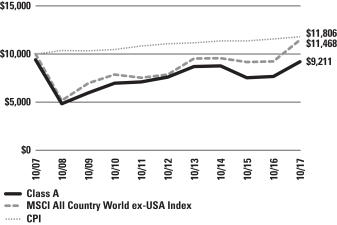
Comparative performance of $10,000 invested in Class A shares of the Aberdeen International Equity Fund, the Morgan Stanley Capital International All Country World (MSCI ACWI) ex-USA Index and the Consumer Price Index (CPI) over a 10-year period ending October 31, 2017. Unlike the Fund, the returns for these unmanaged indexes do not reflect any fees, expenses, or sales charges. Investors cannot invest directly in market indexes.
The MSCI ACWI ex USA Index captures large and mid cap representation across 22 of 23 Developed Markets (DM) countries (excluding the US) and 24 Emerging Markets (EM) countries. With 1,858 constituents, the index covers approximately 85% of the global equity opportunity set outside the US. DM countries in the Index are: Australia, Austria, Belgium, Canada, Denmark, Finland, France, Germany, Hong Kong, Ireland, Israel, Italy, Japan, Netherlands, New Zealand, Norway, Portugal, Singapore, Spain, Sweden, Switzerland and the UK. EM countries in the Index are: Brazil, Chile, China, Colombia, Czech Republic, Egypt, Greece, Hungary, India, Indonesia, Korea, Malaysia, Mexico, Pakistan, Peru, Philippines, Poland, Russia, Qatar, South Africa, Taiwan, Thailand, Turkey and United Arab Emirates.
The CPI is a measure of the average change over time in the prices paid by urban consumers for a market basket of consumer goods and services.
Investment return and principal value will fluctuate, and when redeemed, shares may be worth more or less than original cost. Past performance is no guarantee of future results. The Average Annual Total Return table and Performance graph do not reflect the deduction of taxes that a shareholder would pay on fund distributions or the redemption of fund shares. Investing in mutual funds involves market risk, including loss of principal. Performance returns assume the reinvestment of all distributions. Total returns reflect waivers and reimbursements in effect, without which returns would have been lower.
| 2017 Annual Report | 39 |
Aberdeen International Equity Fund (Unaudited) (concluded)
Portfolio Summary (as a percentage of net assets)
October 31, 2017 (Unaudited)
| Asset Allocation | ||||
Common Stocks | 88.0% | |||
Preferred Stocks | 7.6% | |||
Short-Term Investment | 4.3% | |||
Liabilities in Excess of Other Assets | 0.1% | |||
| 100.0% | ||||
The following table summarizes the composition of the Fund’s portfolio, in Standard & Poor’s Global Industry Classification Standard (GICS) sectors, expressed as a percentage of net assets. The GICS structure consists of 11 sectors, 24 industry groups, 68 industries and 157 sub-industries. As of October 31, 2017, the Fund did not have more than 25% of its assets invested in any industry group.
| Top Sectors | ||||
Consumer Staples | 16.2% | |||
Financials | 14.7% | |||
Health Care | 11.5% | |||
Industrials | 11.3% | |||
Information Technology | 11.2% | |||
Telecommunication Services | 8.0% | |||
Materials | 6.9% | |||
Consumer Discretionary | 5.8% | |||
Energy | 4.5% | |||
Real Estate | 3.8% | |||
Other | 6.1% | |||
| 100.0% | ||||
| Top Holdings* | ||||
Taiwan Semiconductor Manufacturing Co. Ltd. | 3.9% | |||
Roche Holding AG | 3.4% | |||
Samsung Electronics Co. Ltd., GDR, Preferred Shares | 3.0% | |||
AIA Group Ltd. | 2.9% | |||
Novartis AG | 2.9% | |||
Shin-Etsu Chemical Co. Ltd. | 2.7% | |||
Check Point Software Technologies Ltd. | 2.5% | |||
Royal Dutch Shell PLC, B Shares | 2.5% | |||
Nestle SA | 2.4% | |||
Vodafone Group PLC | 2.4% | |||
Other | 71.4% | |||
| 100.0% | ||||
| * | For the purpose of listing top holdings, Short-Term Investments are included as part of Other. |
| Top Countries | ||||
United Kingdom | 19.1% | |||
Japan | 15.0% | |||
Switzerland | 8.7% | |||
Germany | 8.1% | |||
United States | 6.6% | |||
Hong Kong | 6.5% | |||
Republic of South Korea | 4.6% | |||
Canada | 4.1% | |||
Taiwan | 3.9% | |||
Brazil | 3.3% | |||
Other | 20.1% | |||
| 100.0% | ||||
| 40 | Annual Report 2017 |
Statement of Investments
October 31, 2017
Aberdeen International Equity Fund
| Shares or Principal Amount | Value | |||||||
COMMON STOCKS (88.0%) | ||||||||
AUSTRALIA (1.0%) | ||||||||
Health Care (1.0%) | ||||||||
CSL Ltd. (a) | 49,800 | $ | 5,301,761 | |||||
BRAZIL (1.0%) | ||||||||
Energy (1.0%) | ||||||||
Ultrapar Participacoes SA, ADR | 217,000 | 5,184,130 | ||||||
CANADA (4.1%) | ||||||||
Industrials (1.0%) | ||||||||
Ritchie Bros Auctioneers, Inc. (b) | 185,400 | 5,199,420 | ||||||
Materials (1.6%) | ||||||||
Potash Corp. of Saskatchewan, Inc. | 453,400 | 8,824,800 | ||||||
Telecommunication Services (1.5%) | ||||||||
TELUS Corp. | 214,400 | 7,764,334 | ||||||
| 21,788,554 | ||||||||
FRANCE (1.5%) | ||||||||
Consumer Staples (1.5%) | ||||||||
L’Oreal SA (a) | 36,200 | 8,056,796 | ||||||
GERMANY (5.8%) | ||||||||
Health Care (4.2%) | ||||||||
Bayer AG (a) | 76,500 | 9,951,029 | ||||||
Fresenius Medical Care AG & Co. KGaA (a) | 130,700 | 12,654,629 | ||||||
| 22,605,658 | ||||||||
Materials (1.6%) | ||||||||
Linde AG (c) | 38,200 | 8,229,767 | ||||||
| 30,835,425 | ||||||||
HONG KONG (6.5%) | ||||||||
Financials (2.9%) | ||||||||
AIA Group Ltd. (a) | 2,057,900 | 15,507,262 | ||||||
Industrials (2.8%) | ||||||||
Jardine Matheson Holdings Ltd. (a) | 151,500 | 9,705,323 | ||||||
MTR Corp. Ltd. (a) | 852,000 | 4,939,455 | ||||||
| 14,644,778 | ||||||||
Real Estate (0.8%) | ||||||||
Swire Pacific Ltd., Class A (a) | 431,500 | 4,264,114 | ||||||
| 34,416,154 | ||||||||
INDIA (2.7%) | ||||||||
Consumer Staples (1.2%) | ||||||||
ITC Ltd. (a) | 1,611,100 | 6,618,582 | ||||||
Financials (1.5%) | ||||||||
Housing Development Finance Corp. Ltd. (a) | 297,700 | 7,821,523 | ||||||
| 14,440,105 | ||||||||
ISRAEL (2.5%) | ||||||||
Information Technology (2.5%) |
| |||||||
Check Point Software Technologies Ltd. (c) | 115,400 | 13,583,734 | ||||||
ITALY (1.0%) | ||||||||
Energy (1.0%) | ||||||||
Tenaris SA, ADR | 186,900 | 5,093,025 | ||||||
JAPAN (15.0%) | ||||||||
Consumer Discretionary (1.2%) |
| |||||||
Shimano, Inc. (a) | 45,700 | 6,253,647 | ||||||
Consumer Staples (2.2%) |
| |||||||
Japan Tobacco, Inc. (a) | 365,600 | 12,101,424 | ||||||
Financials (1.6%) | ||||||||
Japan Exchange Group, Inc. (a) | 465,700 | 8,395,849 | ||||||
Health Care Equipment & Supplies (1.7%) |
| |||||||
Sysmex Corp. (a) | 130,400 | 8,924,539 | ||||||
Industrials (1.7%) | ||||||||
FANUC Corp. (a) | 38,700 | 9,048,985 | ||||||
Information Technology (1.8%) |
| |||||||
Keyence Corp. (a) | 17,000 | 9,438,821 | ||||||
Materials (2.7%) | ||||||||
Shin-Etsu Chemical Co. Ltd. (a) | 139,500 | 14,711,836 | ||||||
Real Estate (2.1%) | ||||||||
Daito Trust Construction Co. Ltd. (a)(b) | 64,000 | 11,189,393 | ||||||
| 80,064,494 | ||||||||
MEXICO (2.2%) | ||||||||
Consumer Staples (2.2%) | ||||||||
Fomento Economico Mexicano SAB de CV, ADR | 134,000 | 11,758,500 | ||||||
PHILIPPINES (0.9%) | ||||||||
Real Estate (0.9%) | ||||||||
Ayala Land, Inc. (a) | 5,597,300 | 4,688,077 | ||||||
REPUBLIC OF SOUTH KOREA (1.6%) |
| |||||||
Consumer Staples (1.6%) | ||||||||
Amorepacific Group (a) | 68,100 | 8,732,914 | ||||||
SINGAPORE (2.9%) | ||||||||
Financials (1.1%) | ||||||||
Oversea-Chinese Banking Corp. Ltd. (a) | 657,600 | 5,743,227 | ||||||
Telecommunication Services (1.8%) |
| |||||||
Singapore Telecommunications Ltd. (a) | 3,608,700 | 9,931,015 | ||||||
| 15,674,242 | ||||||||
SOUTH AFRICA (1.2%) | ||||||||
Telecommunication Services (1.2%) |
| |||||||
MTN Group Ltd. (a) | 752,800 | 6,536,643 | ||||||
SWEDEN (2.3%) | ||||||||
Industrials (2.3%) | ||||||||
Atlas Copco AB, A Shares (a) | 275,100 | 12,063,532 | ||||||
SWITZERLAND (8.7%) | ||||||||
Consumer Staples (2.4%) |
| |||||||
Nestle SA (a) | 152,600 | 12,839,535 | ||||||
See accompanying Notes to Financial Statements.
| 2017 Annual Report | 41 |
Statement of Investments (concluded)
October 31, 2017
Aberdeen International Equity Fund
| Shares or Principal Amount | Value | |||||||
Health Care (6.3%) | ||||||||
Novartis AG (a) | 187,600 | $ | 15,473,104 | |||||
Roche Holding AG (a) | 78,800 | 18,213,121 | ||||||
| 33,686,225 | ||||||||
| 46,525,760 | ||||||||
TAIWAN (3.9%) | ||||||||
Information Technology (3.9%) |
| |||||||
Taiwan Semiconductor Manufacturing Co. Ltd. | 2,580,000 | 20,787,480 | ||||||
THAILAND (1.8%) | ||||||||
Financials (1.8%) | ||||||||
Kasikornbank PCL (a) | 1,364,700 | 9,367,274 | ||||||
UNITED KINGDOM (19.1%) |
| |||||||
Consumer Discretionary (2.3%) |
| |||||||
Whitbread PLC (a) | 247,142 | 12,121,443 | ||||||
Consumer Staples (2.8%) |
| |||||||
British American Tobacco PLC (a) | 146,600 | 9,471,800 | ||||||
Diageo PLC (a) | 154,300 | 5,269,162 | ||||||
| 14,740,962 | ||||||||
Energy (2.5%) | ||||||||
Royal Dutch Shell PLC, B Shares (a) | 408,200 | 13,142,925 | ||||||
Financials (3.5%) | ||||||||
Prudential PLC (a) | 450,100 | 11,047,868 | ||||||
Standard Chartered PLC (a)(c) | 770,157 | 7,670,663 | ||||||
| 18,718,531 | ||||||||
Industrials (3.5%) | ||||||||
Experian PLC (a) | 471,000 | 9,923,166 | ||||||
Rolls-Royce Holdings PLC (c)(d) | 30,962,600 | 41,123 | ||||||
Rolls-Royce Holdings PLC (a)(c) | 673,100 | 8,698,455 | ||||||
| 18,662,744 | ||||||||
Materials (1.0%) | ||||||||
BHP Billiton PLC (a) | 307,500 | 5,567,482 | ||||||
Telecommunication Services (3.5%) |
| |||||||
Inmarsat PLC (a)(b) | 735,800 | 6,069,255 | ||||||
Vodafone Group PLC (a) | 4,462,400 | 12,763,974 | ||||||
| 18,833,229 | ||||||||
| 101,787,316 | ||||||||
UNITED STATES (2.3%) | ||||||||
Consumer Discretionary (2.3%) |
| |||||||
Samsonite International SA (a) | 2,934,000 | 12,268,347 | ||||||
Total Common Stocks | 468,954,263 | |||||||
PREFERRED STOCKS (7.6%) |
| |||||||
BRAZIL (2.3%) | ||||||||
Financials (2.3%) | ||||||||
Banco Bradesco SA, ADR, Preferred Shares | 1,146,894 | 12,122,670 | ||||||
GERMANY (2.3%) | ||||||||
Consumer Staples (2.3%) | ||||||||
Henkel AG & Co. KGaA, Preferred Shares (a) | 87,800 | 12,328,551 | ||||||
REPUBLIC OF SOUTH KOREA (3.0%) |
| |||||||
Information Technology (3.0%) | ||||||||
Samsung Electronics Co. Ltd., GDR, Preferred Shares (e) | 15,800 | 15,958,000 | ||||||
Total Preferred Stocks | 40,409,221 | |||||||
SHORT-TERM INVESTMENT (4.3%) |
| |||||||
UNITED STATES (4.3%) | ||||||||
State Street Institutional U.S. Government Money Market Fund, Institutional Class, 0.96% (f) | 22,849,285 | 22,849,285 | ||||||
Total Short-Term Investment | 22,849,285 | |||||||
Total Investments | 532,212,769 | |||||||
Liabilities in Excess of Other Assets—0.1% | 880,982 | |||||||
Net Assets—100.0% | $ | 533,093,751 | ||||||
| (a) | Fair Values are determined pursuant to procedures approved by the Fund’s Board of Trustees. Unless otherwise noted, securities are valued by applying valuation factors to the exchange traded price. See Note 2(a) of the accompanying Notes to Financial Statements. |
| (b) | All or a portion of the securities are on loan. The total value of all securities on loan is $5,231,959. The amount of securities on loan indicated may not correspond with the securities on loan identified because securities with pending sales are in the process of recall from the brokers. See Note 2(k) for additional information. |
| (c) | Non-income producing security. |
| (d) | Illiquid security. |
| (e) | Denotes a security issued under Regulation S or Rule 144A. |
| (f) | Registered investment company advised by State Street Global Advisors. The rate shown is the current yield as of October 31, 2017. |
| (g) | See accompanying Notes to Financial Statements for tax unrealized appreciation/(depreciation) of securities. |
| ADR | American Depositary Receipt |
| GDR | Global Depositary Receipt |
| PLC | Public Limited Company |
See accompanying Notes to Financial Statements.
| 42 | Annual Report 2017 |
Aberdeen International Small Cap Fund (Unaudited)
The Aberdeen International Small Cap Fund (Institutional Class shares net of fees) returned 22.14% for the 12-month period ended October 31, 2017, versus the 25.16% return of its benchmark, the Morgan Stanley Capital International (MSCI) All Country (AC) World ex USA Small Cap Index, during the same period. For broader comparison, the average return of the Fund’s peer category of International Small/Mid-Cap Growth Funds (comprising 79 funds), as measured by Lipper, Inc., was 26.34% for the period.
International small-cap equities posted gains for the 12-month period ended October 31, 2017, underpinned by upbeat economic data reports. Improving economic activity in the U.S. prompted the Federal Reserve to tighten monetary policy. Expectations of rising interest rates bolstered the performance of the U.S. banking sector, while reflationary trades triggered by President Donald Trump’s election waned amid increasing political turmoil within the White House. The economic recovery in the Eurozone, as well as positive outcomes from elections in France and the Netherlands, also strengthened the international equity markets, although they were roiled by rising secessionist fervor in the Catalonia region of Spain and its potential disruption to business operations. Equities in the U.K. weakened amid Prime Minister Theresa May’s failed bid to secure a larger mandate from a snap election that resulted in a hung Parliament. Following China’s widely watched 19th National Party Congress1 in October 2017, the nation’s economy showed signs of softening with manufacturing activity falling, although it remained on track to reach its full-year growth target, which buoyed investor sentiment. Japanese businesses were bolstered by incumbent Prime Minister Shinzo Abe’s snap election victory in October 2017, and continued monetary stimulus. Elsewhere, Brent crude oil prices rose over the reporting period on the back of supply cuts by the Organization of the Petroleum Exporting Countries (OPEC), easing shale oil production in the U.S., and a bid to consolidate power by the crown prince in Saudi Arabia.
Among the Fund’s individual holdings, Singapore’s Raffles Medical Group was a key detractor from Fund performance for the reporting period due to slower foreign patient traffic and higher staff costs as the healthcare facilities operator prepared for the opening of Raffles Hospital Extension. While short-term pressures weighed on investor sentiment, we believe that the longer-term growth trajectory remains positive. Shares of Castrol India, India’s leading lubricants manufacturer and distributor, declined over the period on relatively weak quarterly results against a challenging operating environment caused by demonetization.2 However, diligent management of costs enabled the company to maintain healthy profit margins. Separately, Japan-based packaged foods maker Calbee posted weaker-than-expected overseas profitability over the reporting period, as a decline in orders from key customers in the U.S. continued to hamper its results. Nonetheless, we feel that the company may benefit from an economic recovery in Japan given its established market share in that country.
On the positive side, shares of the Fund’s holding in specialty footwear retailer Arezzo Industria e Comercio performed well as the company benefited from an improved economic backdrop in Brazil. Dechra Pharmaceuticals bolstered Fund performance as the veterinary drug-maker reported healthy revenue growth for its 2017 fiscal year attributable to strong market penetration from recent product launches and contributions from acquisitions made in 2016. Specialty flavors and fragrances company Frutarom Industries posted strong results over the reporting period, while its new acquisitions were generally expected to be accretive to earnings,3 bolstering investor sentiment.
During the reporting period, we initiated a position in BIM Birlesik Magazalar, a market-leading Turkish discount retailer. We also established new positions in Brunello Cucinelli, an Italian luxury retailer that we believe has good branding and scope for further international expansion; Indonesian cement-maker Indocement Tunggal Prakarsa, as we feel that it is a solid franchise with an attractive valuation; U.K.-based animal genetics company Genus, which in our view has a distinctive business model in animal breeding and significant capabilities in research and development, providing it with a competitive edge in a fragmented industry; Nice Systems, an Israel-based provider of software solutions with a solid market position, high free cash-flow yield and recurring revenue; and Ritchie Bros. Auctioneers, a U.S.-focused auction business with large market share and strong cash-generation.
In contrast, we exited the Fund’s positions in Hong Kong Exchange-listed Asia Satellite Telecommunications Holdings and Thailand-based Electricity Generating (EGCO) to fund what we believed were better opportunities elsewhere. We also sold the Fund’s shares in U.K.-based energy services company John Wood Group in view of its increased leverage following an acquisition.
We believe that generally good economic conditions should support equity prices. Business sentiment in the U.S. is likely to be buoyed by prospects of lower corporate taxes, in our view. Banks in the Eurozone anticipate healthier demand for loans from both businesses and households. Underpinning this trend are persistent low interest rates, increased capital expenditures, a favorable housing market, low unemployment and rising consumer confidence. However, in China, economic growth may moderate, as we feel that the Chinese Communist Party appears to be prioritizing stability over aggressive growth targets. Elsewhere, crude oil prices are recovering, underpinned by growing demand, supply cuts and stabilizing shale oil production. Nonetheless, we are cognizant that much uncertainty remains due to the move by major global central banks to exit quantitative easing, the unresolved Brexit issue in the U.K., rising trade protectionism and persistent geopolitical risks – all of which could still dent earnings growth. However, we believe that our bottom-up approach to investing positions the Fund well, and we will remain diligent in monitoring valuations, financial performance and the governance of companies in relation to their growth prospects, aiming to hold investments that we feel can withstand future challenges.
| 1 | The Chinese Communist Party sets its national policy goals and elects its leadership positions at the National Party Congress, which is held every five years. |
| 2 | Demonetization comprises the act of stripping specific denominations of a currency unit of their status as legal tender. The currency denominations are pulled from circulation and are replaced with new currency units. |
| 3 | An accretive acquisition increases the acquiring company’s earnings per share. |
| 2017 Annual Report | 43 |
Aberdeen International Small Cap Fund (Unaudited) (concluded)
Portfolio Management:
Aberdeen Global Equity Team
PAST PERFORMANCE DOES NOT GUARANTEE FUTURE RESULTS.
The performance data quoted represents past performance and current returns may be lower or higher. Class A Shares have up to a 5.75% front-end sales charge and a 0.25% 12b-1 fee. The investment return and principal value will fluctuate so that an investor’s shares, when redeemed, may be worth more or less than the original cost. To obtain performance information current to the most recent month-end, which may be higher or lower than the performance shown above, please call 866-667-9231 or go to www.aberdeen-asset.us.
Investing in mutual funds involves risk, including the possible loss of principal.
Indexes are unmanaged and have been provided for comparison purposes only. No fees or expenses are reflected. You cannot invest directly in an index.
Lipper is a leading global provider of mutual fund information and analysis to fund companies, financial intermediaries and media organizations.
Risk Considerations
Smaller company stocks are usually less stable in price and less liquid than those of larger, more established companies, and therefore carry greater risk to investors.
Foreign securities may be more volatile, harder to price and less liquid than U.S. securities. They are subject to different accounting and regulatory standards, currency exchange rates, political and economic risks. Fluctuation in currency exchange rates may impact the Fund’s returns more greatly to the extent the Fund does not hedge currency exposure or hedging techniques are unsuccessful. The foregoing risks are enhanced in emerging market countries.
Investing a significant portion of the Fund’s assets in securities of companies conducting business in a broadly related group of industries within an economic sector may make the Fund more vulnerable to unfavorable developments in that sector.
Please read the prospectus for more detailed information regarding these and other risks.
| 44 | Annual Report 2017 |
Aberdeen International Small Cap Fund (Unaudited)
| Average Annual Total Return1 (For periods ended October 31, 2017) | 1 Yr. | 5 Yr. | 10 Yr. | |||||||||||
Class A2 | w/o SC | 21.79% | 8.35% | 4.51% | ||||||||||
| w/SC3 | 14.80% | 7.07% | 3.89% | |||||||||||
Class C | w/o SC | 20.94% | 7.61% | 3.78% | ||||||||||
| w/SC4 | 19.94% | 7.61% | 3.78% | |||||||||||
Class R5,6 | w/o SC | 21.34% | 8.03% | 4.22% | ||||||||||
Institutional Service Class5,7 | w/o SC | 21.93% | 8.46% | 4.62% | ||||||||||
Institutional Class5,8 | w/o SC | 22.14% | 8.69% | 4.75% | ||||||||||
All figures showing the effect of a sales charge (SC) reflect the maximum charge possible because it has the most significant effect on performance data. The total returns shown above do not include the impact of financial statement rounding of the net asset value (NAV) per share and/or financial statement adjustments.
| 1 | The Fund changed its investment strategy effective February 29, 2016. Performance information for periods prior to February 29, 2016 does not reflect the current investment strategy. Returns prior to July 20, 2009 reflect the performance of a predecessor fund (the “Predecessor Fund”). Returns of the Predecessor Fund have not been adjusted to reflect the expenses applicable to the respective classes. Prior to the change of investment strategy of the Fund effective February 29, 2016, the Fund and the Predecessor Fund had substantially similar investment objectives and strategies. Please consult the Fund’s prospectus for more detail. |
| 2 | Class A returns prior to July 20, 2009, are based on the previous performance of Common Class shares of the Predecessor Fund. Excluding the effect of any fee waivers or reimbursements, this performance is substantially similar to what Class A shares would have produced because both classes invest in the same portfolio of securities. Returns of the Predecessor Fund have not been adjusted to reflect the expenses applicable to the respective classes. |
| 3 | A 5.75% front-end sales charge was deducted. |
| 4 | A 1.00% contingent deferred sales charge (CDSC) was deducted from the one year return because it is charged when Class C shares are sold within the first year after purchase. |
| 5 | Not subject to any sales charges. |
| 6 | Returns for Class R shares prior to July 20, 2009 are based on the previous performance of Adviser Class shares of the Predecessor Fund. Excluding the effect of any fee waivers or reimbursements, this performance is substantially similar to what Class R shares would have produced because both classes invest in the same portfolio of securities. Returns of the Predecessor Fund have not been adjusted to reflect the expenses applicable to the respective classes. |
| 7 | Returns before the first offering of Institutional Service Class shares (September 16, 2009) are based on the previous performance of the Fund’s Class A shares. This performance is substantially similar to what Institutional Service Class shares would have produced because both classes invest in the same portfolio of securities. Returns would only differ to the extent of the differences in expenses between the two classes. |
| 8 | Returns before the first offering of Institutional Class shares (July 20, 2009) are based on the previous performance of Common Class shares of the Predecessor Fund. Excluding the effect of any fee waivers or reimbursements, this performance is substantially similar to what Institutional Class shares would have produced because both classes invest in the same portfolio of securities. Returns have been adjusted to eliminate sales charges that do not apply to Institutional Class shares, but have not been adjusted to reflect its lower expenses. |
Performance of a $10,000 Investment (as of October 31, 2017)
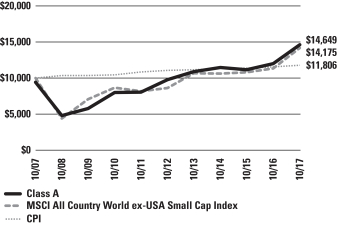
Comparative performance of $10,000 invested in Class A shares of the Aberdeen International Small Cap Fund, Morgan Stanley Capital Index (MSCI) All Country World (ACWI) ex-USA Small Cap Index and the Consumer Price Index (CPI) over a 10-year period ended October 31, 2017. Unlike the Fund, the returns for these unmanaged indexes do not reflect any fees, expenses, or sales charges. Investors cannot invest directly in market indexes.
The MSCI ACWI ex-USA Small Cap Index captures small cap representation across 22 of 23 Developed Markets (DM) countries (excluding the US) and 24 Emerging Markets (EM) countries. With 4,291 constituents, the index covers approximately 14% of the global equity opportunity set outside the US. DM countries in the Index are: Australia, Austria, Belgium, Canada, Denmark, Finland, France, Germany, Hong Kong, Ireland, Israel, Italy, Japan, Netherlands, New Zealand, Norway, Portugal, Singapore, Spain, Sweden, Switzerland and the UK. EM countries in the Index are: Brazil, Chile, China, Colombia, Czech Republic, Egypt, Greece, Hungary, India, Indonesia, Korea, Malaysia, Mexico, Pakistan, Peru, Philippines, Poland, Russia, Qatar, South Africa, Taiwan, Thailand, Turkey and United Arab Emirates.
The CPI is a measure of the average change over time in the prices paid by urban consumers for a market basket of consumer goods and services.
Investment return and principal value will fluctuate, and when redeemed, shares may be worth more or less than original cost. Past performance is no guarantee of future results. The Average Annual Total Return table and Performance graph do not reflect the deduction of taxes that a shareholder would pay on fund distributions or the redemption of fund shares. Investing in mutual funds involves market risk, including loss of principal. Performance returns assume the reinvestment of all distributions. Total returns reflect waivers and reimbursements in effect, without which returns would have been lower.
| 2017 Annual Report | 45 |
Aberdeen International Small Cap Fund (Unaudited) (concluded)
Portfolio Summary (as a percentage of net assets)
October 31, 2017 (Unaudited)
| Asset Allocation | ||||
Common Stocks | 99.5% | |||
Short-Term Investment | 0.5% | |||
Liabilities in Excess of Other Assets | –% | |||
| 100.0% | ||||
Amounts listed as “–” are 0% or round to 0%
The following table summarizes the composition of the Fund’s portfolio, in Standard & Poor’s Global Industry Classification Standard (GICS) sectors, expressed as a percentage of net assets. The GICS structure consists of 11 sectors, 24 industry groups, 68 industries and 157 sub-industries. As of October 31, 2017, the Fund did not have more than 25% of its assets invested in any industry group.
| Top Sectors | ||||
Consumer Staples | 19.9% | |||
Industrials | 19.4% | |||
Consumer Discretionary | 18.9% | |||
Health Care | 12.8% | |||
Materials | 12.7% | |||
Real Estate | 6.7% | |||
Information Technology | 4.8% | |||
Financials | 2.7% | |||
Other | 2.1% | |||
| 100.0% | ||||
| Top Holdings* | ||||
Ultra Electronics Holdings PLC | 3.0% | |||
Embotelladora Andina SA | 3.0% | |||
Dechra Pharmaceuticals PLC | 2.7% | |||
ARB Corp. Ltd. | 2.7% | |||
FUCHS PETROLUB SE | 2.7% | |||
Barry Callebaut AG | 2.6% | |||
Samsonite International SA | 2.5% | |||
AVEVA Group PLC | 2.5% | |||
dormakaba Holding AG, Class B | 2.5% | |||
Raffles Medical Group Ltd. | 2.4% | |||
Other | 73.4% | |||
| 100.0% | ||||
| * | For the purpose of listing top holdings, Short-Term Investments are included as part of Other. |
| Top Countries | ||||
United Kingdom | 22.3% | |||
Japan | 9.2% | |||
Brazil | 8.6% | |||
Chile | 7.3% | |||
Germany | 6.8% | |||
Switzerland | 6.3% | |||
India | 6.0% | |||
Indonesia | 3.7% | |||
Israel | 3.2% | |||
Other | 26.6% | |||
| 100.0% | ||||
| 46 | Annual Report 2017 |
Statement of Investments
October 31, 2017
Aberdeen International Small Cap Fund
| Shares or Principal Amount | Value | |||||||
COMMON STOCKS (99.5%) | ||||||||
AUSTRALIA (2.7%) | ||||||||
Consumer Discretionary (2.7%) | ||||||||
ARB Corp. Ltd. (a) | 153,200 | $ | 2,138,013 | |||||
BRAZIL (8.6%) | ||||||||
Consumer Discretionary (1.9%) | ||||||||
Arezzo Industria e Comercio SA | 95,800 | 1,480,356 | ||||||
Health Care (2.4%) | ||||||||
Odontoprev SA | 401,700 | 1,932,797 | ||||||
Industrials (2.1%) | ||||||||
Wilson Sons Ltd., BDR | 131,386 | 1,686,856 | ||||||
Real Estate (2.2%) | ||||||||
Iguatemi Empresa de Shopping Centers SA | 151,300 | 1,779,728 | ||||||
| 6,879,737 | ||||||||
CANADA (2.7%) | ||||||||
Financials (1.7%) | ||||||||
Canadian Western Bank | 47,600 | 1,340,814 | ||||||
Industrials (1.0%) | ||||||||
Ritchie Bros Auctioneers, Inc. | 28,900 | 810,481 | ||||||
| 2,151,295 | ||||||||
CHILE (7.3%) | ||||||||
Consumer Staples (5.1%) | ||||||||
Embotelladora Andina SA | 550,200 | 2,420,551 | ||||||
Vina Concha y Toro SA (a) | 959,300 | 1,692,400 | ||||||
| 4,112,951 | ||||||||
Real Estate (2.2%) | ||||||||
Parque Arauco SA | 599,300 | 1,731,657 | ||||||
| 5,844,608 | ||||||||
GERMANY (6.8%) | ||||||||
Consumer Discretionary (1.5%) | ||||||||
Fielmann AG (a) | 13,700 | 1,203,792 | ||||||
Consumer Staples (1.6%) | ||||||||
KWS Saat SE (a) | 3,000 | 1,263,945 | ||||||
Materials (3.7%) | ||||||||
FUCHS PETROLUB SE (a) | 42,800 | 2,131,404 | ||||||
Symrise AG (a) | 11,200 | 872,777 | ||||||
| 3,004,181 | ||||||||
| 5,471,918 | ||||||||
HONG KONG (2.3%) | ||||||||
Industrials (2.3%) | ||||||||
Kerry Logistics Network Ltd. (a) | 1,356,500 | 1,870,334 | ||||||
INDIA (6.0%) | ||||||||
Consumer Staples (2.1%) | ||||||||
Jyothy Laboratories Ltd. (a) | 266,400 | 1,635,937 | ||||||
Health Care (1.9%) | ||||||||
Sanofi India Ltd. | 23,800 | 1,530,784 | ||||||
Materials (2.0%) | ||||||||
Castrol (India) Ltd. (a) | 260,800 | 1,611,356 | ||||||
| 4,778,077 | ||||||||
INDONESIA (3.7%) | ||||||||
Consumer Discretionary (2.4%) | ||||||||
Ace Hardware Indonesia Tbk PT | 20,467,600 | 1,893,961 | ||||||
Materials (1.3%) | ||||||||
Indocement Tunggal Prakarsa Tbk PT | 620,300 | 1,026,782 | ||||||
| 2,920,743 | ||||||||
ISRAEL (3.2%) | ||||||||
Information Technology (1.1%) | ||||||||
NICE Ltd. (a) | 10,200 | 848,927 | ||||||
Materials (2.1%) | ||||||||
Frutarom Industries Ltd. (a) | 20,300 | 1,671,773 | ||||||
| 2,520,700 | ||||||||
ITALY (1.2%) | ||||||||
Consumer Discretionary (1.2%) | ||||||||
Brunello Cucinelli SpA (b) | 27,500 | 923,201 | ||||||
JAPAN (9.2%) | ||||||||
Consumer Discretionary (1.9%) | ||||||||
Resorttrust, Inc. (a) | 79,000 | 1,555,475 | ||||||
Consumer Staples (1.9%) | ||||||||
Calbee, Inc. (a) | 43,900 | 1,481,570 | ||||||
Health Care (2.1%) | ||||||||
Asahi Intecc Co. Ltd. (b) | 29,400 | 1,696,179 | ||||||
Health Care Equipment & Services (1.6%) |
| |||||||
Sysmex Corp. (a) | 18,400 | 1,259,291 | ||||||
Industrials (1.7%) | ||||||||
Nabtesco Corp. (a) | 33,500 | 1,330,844 | ||||||
| 7,323,359 | ||||||||
MALAYSIA (1.6%) | ||||||||
Consumer Staples (1.6%) | ||||||||
Carlsberg Brewery Malaysia Bhd | 345,100 | 1,299,373 | ||||||
MEXICO (2.1%) | ||||||||
Industrials (2.1%) | ||||||||
Grupo Aeroportuario del Sureste SAB de CV, Class B | 94,900 | 1,696,857 | ||||||
NEW ZEALAND (1.3%) | ||||||||
Industrials (1.3%) | ||||||||
Auckland International Airport Ltd. (a) | 245,300 | 1,045,508 | ||||||
SINGAPORE (2.4%) | ||||||||
Health Care (2.4%) | ||||||||
Raffles Medical Group Ltd. | 2,343,944 | 1,943,113 | ||||||
See accompanying Notes to Financial Statements.
| 2017 Annual Report | 47 |
Statement of Investments (concluded)
October 31, 2017
Aberdeen International Small Cap Fund
| Shares or Principal Amount | Value | |||||||
SOUTH AFRICA (1.9%) | ||||||||
Consumer Staples (1.9%) | ||||||||
Clicks Group Ltd. (a) | 139,100 | $ | 1,557,988 | |||||
SPAIN (2.0%) | ||||||||
Consumer Staples (2.0%) | ||||||||
Viscofan SA (a) | 26,000 | 1,573,836 | ||||||
SWITZERLAND (6.3%) | ||||||||
Consumer Staples (2.6%) | ||||||||
Barry Callebaut AG (a)(c) | 1,340 | 2,093,771 | ||||||
Industrials (2.5%) | ||||||||
dormakaba Holding AG, Class B (a)(c) | 2,000 | 1,979,544 | ||||||
Information Technology (1.2%) | ||||||||
Temenos Group AG (a)(b)(c) | 8,300 | 958,413 | ||||||
| 5,031,728 | ||||||||
THAILAND (2.3%) | ||||||||
Real Estate (2.3%) | ||||||||
Tesco Lotus Retail Growth Freehold & Leasehold Property Fund (a)(d) | 3,605,400 | 1,877,586 | ||||||
TURKEY (1.1%) | ||||||||
Consumer Staples (1.1%) | ||||||||
BIM Birlesik Magazalar A.S. (a) | 43,900 | 895,898 | ||||||
UNITED KINGDOM (22.3%) | ||||||||
Consumer Discretionary (4.8%) | ||||||||
Dignity PLC | 35,500 | 1,142,428 | ||||||
Fuller Smith & Turner PLC, Class A | 86,800 | 1,107,874 | ||||||
Millennium & Copthorne Hotels PLC | 196,600 | 1,579,741 | ||||||
| 3,830,043 | ||||||||
Financials (1.0%) | ||||||||
Rathbone Brothers PLC | 23,600 | 802,729 | ||||||
Health Care (4.0%) | ||||||||
Dechra Pharmaceuticals PLC (a) | 80,000 | 2,184,648 | ||||||
Genus PLC | 31,900 | 996,071 | ||||||
| 3,180,719 | ||||||||
Industrials (6.4%) | ||||||||
Rotork PLC (a) | 458,400 | 1,599,614 | ||||||
Ultra Electronics Holdings PLC (a) | 100,000 | 2,421,472 | ||||||
Weir Group PLC (The) (a) | 42,900 | 1,112,168 | ||||||
| 5,133,254 | ||||||||
Information Technology (2.5%) | ||||||||
AVEVA Group PLC (a) | 59,200 | 1,983,351 | ||||||
Materials (3.6%) | ||||||||
Croda International PLC (a) | 30,900 | 1,717,258 | ||||||
Victrex PLC (a) | 37,400 | 1,190,849 | ||||||
| 2,908,107 | ||||||||
| 17,838,203 | ||||||||
UNITED STATES (2.5%) | ||||||||
Consumer Discretionary (2.5%) | ||||||||
Samsonite International SA (a) | 482,100 | 2,015,873 | ||||||
Total Common Stocks | 79,597,948 | |||||||
SHORT-TERM INVESTMENT (0.5%) | ||||||||
UNITED STATES (0.5%) | ||||||||
State Street Institutional U.S. Government Money Market Fund, Institutional Class, 0.96% (e) | 379,046 | 379,046 | ||||||
Total Short-Term Investment | 379,046 | |||||||
Total Investments | 79,976,994 | |||||||
Liabilities in Excess of Other Assets—0.0% |
| (9,262 | ) | |||||
Net Assets—100.0% | $ | 79,967,732 | ||||||
| (a) | Fair Values are determined pursuant to procedures approved by the Fund’s Board of Trustees. Unless otherwise noted, securities are valued by applying valuation factors to the exchange traded price. See Note 2(a) of the accompanying Notes to Financial Statements. |
| (b) | All or a portion of the securities are on loan. The total value of all securities on loan is $3,001,054. The amount of securities on loan indicated may not correspond with the securities on loan identified because securities with pending sales are in the process of recall from the brokers. See Note 2(k) for additional information. |
| (c) | Non-income producing security. |
| (d) | As of October 31, 2017, security is a closed-end fund incorporated in Thailand. |
| (e) | Registered investment company advised by State Street Global Advisors. The rate shown is the current yield as of October 31, 2017. |
| (f) | See accompanying Notes to Financial Statements for tax unrealized appreciation/(depreciation) of securities. |
| BDR | Brazilian Depositary Receipt |
| PLC | Public Limited Company |
See accompanying Notes to Financial Statements.
| 48 | Annual Report 2017 |
Aberdeen Japanese Equities Fund (Unaudited)
The Aberdeen Japanese Equities Fund (Institutional Class shares net of fees) returned 11.88% for the 12-month period ended October 31, 2017, versus the 19.70% return of its benchmark, the Tokyo Stock Price Index (TOPIX), during the same period. For broader comparison, the average return of the Fund’s peer category of Japanese Funds (comprising 29 funds), as measured by Lipper, Inc., was 21.86% for the period.
Japanese equities rose sharply over the 12-month reporting period. Investor sentiment was underpinned by an improved outlook for corporate earnings, which in turn was supported by weakness in the Japanese yen. As generally expected, the Bank of Japan held its monetary-policy course steady amid still subdued inflation. A slew of external events also had an impact on the Japanese stock market. These included the UK Prime Minister Theresa May’s snap-election gamble that left her weakened ahead of Brexit negotiations, and Donald Trump’s unexpected election as U.S. president in November 2016, which had initially whet risk appetite on hopes that he would usher in a raft of pro-business reforms. However, these did not materialize after repeated failure to “repeal and replace” the Affordable Care Act (dubbed “Obamacare”), on which major fiscal reforms were predicated.
In the most recent corporate earnings news, company results in the Japanese equity market generally continued to exceed investors’ expectations, extending the trend from the second half of the reporting period. This was attributable largely to a healthier global macroeconomy and a weaker yen. The results of the Fund’s company holdings over the reporting period were broadly positive. Notably, specialty chemicals company Shin-Etsu Chemical Co. and robotics manufacturer Fanuc Corp. posted strong results and issued favorable business outlooks over the period. Convenience-store and supermarket chain operator Seven & i Holdings Co.’s results were largely better than expected, although its acquisition of U.S.-based integrated oil and gas company Sunoco’s convenience-store operations appears to have run into some regulatory delays; the company expects this to be resolved by the end of 2017. In contrast, internet search services provider Yahoo Japan Corp. posted relatively weaker results over the reporting period as the company continued to invest heavily in its business, while packaged foods maker Calbee’s weaker-than-expected profitability outside of Japan continued to drag on its results.
The Fund garnered a positive return but underperformed its benchmark, the TOPIX, for the reporting period. However, we believe that the Fund’s performance is consistent with its high-quality portfolio that has remained defensively positioned. The underlying holdings, comprising what we view as well-run companies, tend to perform more strongly amid tougher market conditions, and their businesses tend to be relatively unaffected when the yen appreciates. In contrast, investors favored lower-quality companies that have benefited more proportionately from yen weakness during the period, particularly those that have exhibited more aggressive growth.
One of the primary detractors from the Fund’s relative performance during the reporting period was Japan Tobacco. The company’s shares declined as competing novel nicotine products continued to take market share from its domestic cigarette sales. The company launched a competing product in the key Tokyo market in June 2017, and management expects to expand sales nationwide by the end of 2017. The Fund’s position in telecommunications company KDDI Corp. weighed on relative performance, as defensive stocks lagged the overall Japanese stock market during the reporting period. We see no fundamental change for KDDI’s business, including its competitiveness among domestic mobile telecommunications operators. Finally, Seven & i reported results over the period that were generally in line with the market’s expectations. However, its shares fell due to weaker-than-anticipated food sales at its subsidiary, Ito-Yokado, an area that was expected to drive the supermarket unit’s growth.
On the positive side, the Fund’s position in Keyence Corp. benefited the relative performance for the reporting period, as the sensor manufacturing company posted strong results driven by rising demand for automation. Similarly, Shin-Etsu Chemical Co. posted healthy earnings over the period that were buoyed by rising global demand for silicon wafers, as well as firm prices for polyvinyl chloride (PVC) amid stricter environmental regulations. Furthermore, the Fund’s holding in Chugai Pharmaceutical also contributed to relative performance as investors took a largely favorable view on the company’s product pipeline.
Regarding portfolio activity during the reporting period, we exited the Fund’s positions in both office devices manufacturer Canon and personal products maker Unicharm Corp. due to our concerns over their deteriorating business prospects. We also sold the Fund’s shares in auto-components supplier Aisin Seiki Co. after a period of strong stock price performance. We exited the positions in pharmaceutical firm Astellas Pharma and real estate developer Mitsubishi Estate Co. in favor of what we believed were better opportunities elsewhere. We initiated a holding in Shionogi & Co., a drug-maker specializing in treatments for infectious diseases such as HIV. We believe that its management team is well focused, and the company is positioned with diversified pipelines for both existing and new drugs, with no expiring patents in the near term. Additionally, we established new positions in cosmetics company Shiseido Co., which we believe has made good progress on restructuring the business under its new president, Masahiko Uotani, who has addressed underperforming brands, executed on cost structure reforms, and aligned executives behind an incentive-based pay structure. We also initiated a holding in Stanley Electric Co., one of the world’s largest automotive-lighting manufacturers that we feel is well positioned to benefit from an industry-wide structural shift from halogen to LED headlamps as demand for energy efficiency increases. Furthermore, we think that the company’s distinctive in-house LED manufacturing capabilities may improve cost efficiencies that will lead to improved profitability. Another new addition to the Fund was leading local furniture and home-furnishings retailer Nitori Holdings, which has recorded 30 consecutive years of sales and profit growth and is looking to accelerate earnings momentum by expanding into urban city centers with its interior decorating stores. The company’s vertically integrated* operation allows it to achieve healthy margins, in our view, and management of this largely domestic business is now seeking to replicate its success in key overseas markets such as China.
| * | Vertical integration comprises a merger of companies in the same industry at different stages of production and/or distribution. |
| 2017 Annual Report | 49 |
Aberdeen Japanese Equities Fund (Unaudited) (concluded)
We also initiated a position in leading automotive chip-maker Renesas Electronics Corp., which we believe is well positioned to benefit from a growing focus on vehicle electrification, autonomous driving and the increasing connectivity between industrial applications. This is underpinned by its cutting-edge technology in miniaturized microcontrollers, which improve energy consumption and enhance memory size, while its analog semiconductor technology is used in a broad range of applications. Another position we initiated was pharmacy and drugstore operator Ain Holdings. The company plans to open a chain of in-hospital pharmacies, which became possible only after a recent change in regulations. Finally, we established a new position in Komatsu, the world’s second-largest construction and mining equipment maker next to Caterpillar. We think that Komatsu’s operations are impressive: the company’s global reach allows it to build close client relationships with a loyal client base; an after-sales service uses remote monitoring systems to prevent any erosion of its market share; and its products are able to meet stricter emissions standards. We believe that Komatsu has a progressive management team, setting clear targets for financial and shareholder returns. In our view, the company made an effective acquisition to expand its mining equipment business at a time when the industry was still undergoing consolidation, although activity has since started to accelerate. We believe that the heavy-equipment replacement cycle is still in its early stages following a protracted four-year decline.
We believe that Japanese equities seem well placed to maintain their upward trajectory, bolstered by the benign global macroeconomic backdrop. Sustained demand for Japanese exports from abroad and the nascent improvement in domestic consumption should remain supportive of share prices, in our judgment. At the same time, it appears that Prime Minister Shinzo Abe is armed with a stronger mandate following his snap-election win in October 2017, and we feel that this should enable him to push through his expansionary policies and economic reforms. However, valuations are beginning to look stretched following the stock market’s recent rally. Therefore, we prefer to remain circumspect, given the raft of worries that investors have chosen to ignore. Nevertheless, we have constructed the Fund’s portfolio with a degree of defensiveness, which we think should help it weather whatever short-term challenges that may lie ahead.
Portfolio Management:
Aberdeen Asia-Pacific Equity Team
PAST PERFORMANCE DOES NOT GUARANTEE FUTURE RESULTS.
The performance data quoted represents past performance and current returns may be lower or higher. Class A Shares have up to a 5.75% front-end sales charge and a 0.25% 12b-1 fee. The investment return and principal value will fluctuate so that an investor’s shares, when redeemed, may be worth more or less than the original cost. To obtain performance information current to the most recent month-end, which may be higher or lower than the performance shown above, please call 866-667-9231 or go to www.aberdeen-asset.us.
Investing in mutual funds involves risk, including the possible loss of principal.
Indexes are unmanaged and have been provided for comparison purposes only. No fees or expenses are reflected. You cannot invest directly in an index.
Lipper is a leading global provider of mutual fund information and analysis to fund companies, financial intermediaries and media organizations.
Risk Considerations
Concentrating investments in the Japan region subjects the Fund to more volatility and greater risk of loss than geographically diverse mutual funds.
Foreign securities may be more volatile, harder to price and less liquid than U.S. securities. They are subject to different accounting and regulatory standards, currency exchange rates, political and economic risks. Fluctuation in currency exchange rates may impact the Fund’s returns more greatly to the extent the Fund does not hedge currency exposure or hedging techniques are unsuccessful. The foregoing risks are enhanced in emerging market countries.
Equity stocks of small- and mid-cap companies carry greater risk, and more volatility than equity stocks of larger, more established companies.
Investing a significant portion of the Fund’s assets in securities of companies conducting business in a broadly related group of industries within an economic sector may make the Fund more vulnerable to unfavorable developments in that sector.
Please read the prospectus for more detailed information regarding these and other risks.
| 50 | Annual Report 2017 |
Aberdeen Japanese Equities Fund (Unaudited)
| Average Annual Total Return (For periods ended October 31, 2017) | 1 Yr. | Inception1 | ||||||||
Class A | w/o SC | 11.58% | 11.39% | |||||||
| w/SC2 | 5.19% | 8.01% | ||||||||
Class C | w/o SC | 10.81% | 10.58% | |||||||
| w/SC3 | 9.81% | 10.58% | ||||||||
Class R4 | w/o SC | 11.31% | 11.13% | |||||||
Institutional Service Class4 | w/o SC | 11.89% | 11.66% | |||||||
Institutional Class4 | w/o SC | 11.88% | 11.68% | |||||||
All figures showing the effect of a sales charge (SC) reflect the maximum charge possible because it has the most significant effect on performance data. The total returns shown above do not include the impact of financial statement rounding of the net asset value (NAV) per share and/or financial statement adjustments.
| 1 | Fund commenced operations on November 30, 2015. |
| 2 | A 5.75% front-end sales charge was deducted. |
| 3 | A 1.00% contingent deferred sales charge (CDSC) was deducted because it is charged when Class C shares are sold within the first year after purchase. |
| 4 | Not subject to any sales charges. |
Performance of a $1,000,000 Investment* (as of October 31, 2017)
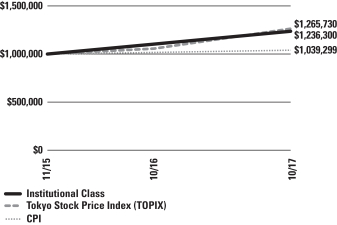
| * | Minimum Initial Investment |
Comparative performance of $1,000,000 invested in Institutional Class shares of the Aberdeen Japanese Equities Fund, the Tokyo Stock Price Index (TOPIX) and the Consumer Price Index (CPI) from inception to October 31, 2017. Unlike the Fund, the returns for these unmanaged indexes do not reflect any fees, expenses, or sales charges. Investors cannot invest directly in market indexes.
TOPIX is a free-float adjusted market capitalization-weighted index that is calculated based on all the domestic common stocks listed on the Tokyo Stock Exchange First Section. TOPIX shows the measure of current market capitalization assuming that market capitalization as of the base date (January 4, 1968) is 100 points. Indexes are unmanaged and have been provided for comparison purposes only.
The CPI is a measure of the average change over time in the prices paid by urban consumers for a market basket of consumer goods and services.
Investment returns and principal value will fluctuate, and when redeemed, shares may be worth more or less than original cost. Past performance is no guarantee of future results. The Average Annual Total Return table and Performance graph do not reflect the deduction of taxes that a shareholder would pay on fund distributions or the redemption of fund shares. Investing in mutual funds involves market risk, including loss of principal. Performance returns assume the reinvestment of all distributions. Total returns reflect waivers and reimbursements in effect, without which returns would have been lower.
| 2017 Annual Report | 51 |
Aberdeen Japanese Equities Fund (Unaudited) (concluded)
Portfolio Summary (as a percentage of net assets)
October 31, 2017 (Unaudited)
| Asset Allocation | ||||
Common Stocks | 96.2% | |||
Short-Term Investment | 0.3% | |||
Other Assets in Excess of Liabilities | 3.5% | |||
| 100.0% | ||||
The following table summarizes the composition of the Fund’s portfolio, in Standard & Poor’s Global Industry Classification Standard (GICS) sectors, expressed as a percentage of net assets. The GICS structure consists of 11 sectors, 24 industry groups, 68 industries and 157 sub-industries. As of October 31, 2017, the Fund did not have more than 25% of its assets invested in any industry group.
| Top Sectors | ||||
Industrials | 22.0% | |||
Consumer Discretionary | 14.0% | |||
Consumer Staples | 13.8% | |||
Information Technology | 12.6% | |||
Materials | 9.0% | |||
Financials | 7.6% | |||
Health Care | 6.2% | |||
Real Estate | 3.8% | |||
Health Care Equipment & Services | 3.6% | |||
Telecommunication Services | 3.6% | |||
Other | 3.8% | |||
| 100.0% | ||||
| Top Holdings* | ||||
Shin-Etsu Chemical Co. Ltd. | 6.3% | |||
Keyence Corp. | 5.6% | |||
FANUC Corp. | 4.7% | |||
Amada Holdings Co. Ltd. | 4.2% | |||
Japan Tobacco, Inc. | 4.2% | |||
Seven & i Holdings Co. Ltd. | 4.0% | |||
Sysmex Corp. | 3.6% | |||
KDDI Corp. | 3.6% | |||
Nabtesco Corp. | 3.4% | |||
Yahoo Japan Corp. | 3.3% | |||
Other | 57.1% | |||
| 100.0% | ||||
| * | For the purpose of listing top holdings, Short-Term Investments are included as part of Other. |
| Top Countries | ||||
Japan | 96.2% | |||
United States | 0.3% | |||
Other | 3.5% | |||
| 100.0% | ||||
| 52 | Annual Report 2017 |
Statement of Investments
October 31, 2017
Aberdeen Japanese Equities Fund
| Shares or Principal Amount | Value | |||||||
COMMON STOCKS (96.2%) (a) | ||||||||
JAPAN (96.2%) | ||||||||
Consumer Discretionary (14.0%) | ||||||||
Asics Corp. | 1,100 | $ | 16,816 | |||||
Denso Corp. | 600 | 33,044 | ||||||
Honda Motor Co. Ltd. | 800 | 25,070 | ||||||
Nitori Holdings Co. Ltd. | 200 | 29,066 | ||||||
Sekisui House Ltd. | 800 | 14,959 | ||||||
Shimano, Inc. | 160 | 21,895 | ||||||
Stanley Electric Co. Ltd. | 900 | 33,223 | ||||||
Toyota Motor Corp. | 300 | 18,608 | ||||||
USS Co. Ltd. | 900 | 18,193 | ||||||
| 210,874 | ||||||||
Consumer Staples (13.8%) | ||||||||
Calbee, Inc. | 700 | 23,624 | ||||||
Japan Tobacco, Inc. | 1,900 | 62,890 | ||||||
Pigeon Corp. | 1,100 | 39,037 | ||||||
Seven & i Holdings Co. Ltd. | 1,500 | 60,457 | ||||||
Shiseido Co. Ltd. | 500 | 20,624 | ||||||
| 206,632 | ||||||||
Financials (7.6%) | ||||||||
AEON Financial Service Co. Ltd. | 1,100 | 23,624 | ||||||
Concordia Financial Group Ltd. | 3,100 | 16,418 | ||||||
Japan Exchange Group, Inc. | 2,000 | 36,057 | ||||||
Suruga Bank Ltd. | 1,700 | 38,707 | ||||||
| 114,806 | ||||||||
Health Care (6.2%) | ||||||||
Astellas Pharma, Inc. | 1,700 | 22,625 | ||||||
Chugai Pharmaceutical Co. Ltd. | 900 | 42,909 | ||||||
Shionogi & Co. Ltd. | 500 | 26,918 | ||||||
| 92,452 | ||||||||
Health Care Equipment & Services (3.6%) |
| |||||||
Sysmex Corp. | 800 | 54,752 | ||||||
Industrials (22.0%) | ||||||||
Amada Holdings Co. Ltd. | 5,100 | 63,373 | ||||||
Daikin Industries Ltd. | 400 | 44,204 | ||||||
East Japan Railway Co. | 400 | 38,792 | ||||||
FANUC Corp. | 300 | 70,147 | ||||||
Komatsu Ltd. | 500 | 16,338 | ||||||
Makita Corp. | 1,100 | 46,099 | ||||||
Nabtesco Corp. | 1,300 | 51,645 | ||||||
| 330,598 | ||||||||
Information Technology (12.6%) | ||||||||
Keyence Corp. | 150 | 83,284 | ||||||
Renesas Electronics Corp. (b) | 2,000 | 25,858 | ||||||
SCSK Corp. | 700 | 30,187 | ||||||
Yahoo Japan Corp. (c) | 11,000 | 49,179 | ||||||
| 188,508 | ||||||||
Materials (9.0%) | ||||||||
Kansai Paint Co. Ltd. | 900 | 23,133 | ||||||
Nippon Paint Holdings Co. Ltd. | 500 | 17,639 | ||||||
Shin-Etsu Chemical Co. Ltd. | 900 | 94,915 | ||||||
| 135,687 | ||||||||
Real Estate (3.8%) | ||||||||
Daito Trust Construction Co. Ltd. | 200 | 34,967 | ||||||
Mitsubishi Estate Co. Ltd. | 1,200 | 21,761 | ||||||
| 56,728 | ||||||||
Telecommunication Services (3.6%) | ||||||||
KDDI Corp. | 2,000 | 53,285 | ||||||
| 1,444,322 | ||||||||
Total Common Stocks | 1,444,322 | |||||||
SHORT-TERM INVESTMENT (0.3%) | ||||||||
UNITED STATES (0.3%) | ||||||||
State Street Institutional U.S. Government Money Market Fund, Institutional Class, 0.96% (d) | 4,900 | 4,900 | ||||||
Total Short-Term Investment | 4,900 | |||||||
Total Investments | 1,449,222 | |||||||
Other Assets in Excess of Liabilities—3.5% | 52,395 | |||||||
Net Assets—100.0% | $ | 1,501,617 | ||||||
| (a) | All securities are fair valued. Fair Values are determined pursuant to procedures approved by the Fund’s Board of Trustees. Unless otherwise noted, securities are valued by applying valuation factors to the exchange traded price. See Note 2(a) of the accompanying Notes to Financial Statements. |
| (b) | Non-income producing security. |
| (c) | All or a portion of the securities are on loan. The total value of all securities on loan is $46,522. The amount of securities on loan indicated may not correspond with the securities on loan identified because securities with pending sales are in the process of recall from the brokers. See Note 2(k) for additional information. |
| (d) | Registered investment company advised by State Street Global Advisors. The rate shown is the current yield as of October 31, 2017. |
| (e) | See accompanying Notes to Financial Statements for tax unrealized appreciation/(depreciation) of securities. |
See accompanying Notes to Financial Statements.
| 2017 Annual Report | 53 |
Aberdeen U.S. Mid Cap Equity Fund (Unaudited)
The Aberdeen U.S. Mid Cap Equity Fund (Institutional Class shares net of fees) returned 24.70% for the 12-month period ended October 31, 2017, versus 21.09% for its benchmark, the Russell Midcap Index, for the same period. For broader comparison, the average return of the Fund’s peer category of Mid-Cap Core Funds (consisting of 193 funds), as measured by Lipper, Inc., was 21.31% for the period.
Major U.S. equity indices moved sharply higher over the 12-month period ended October 31, 2017, despite numerous periods of uncertainty surrounding the policies of the new administration of U.S. President Donald Trump. Most U.S. companies reported strong results and generally upbeat outlooks during the reporting period. Earnings largely have been strong enough to support stocks across the market-capitalization ranges. U.S. mid-cap stocks, as measured by the Russell Midcap Index, gained 21.09% for the period, underperforming the 23.63% return of their large-cap counterparts, as represented by the U.S. broader-market S&P 500 Index. The information technology, financials and materials sectors were the strongest performers within the Russell Midcap Index for the reporting period. Conversely, the telecommunication services, energy and consumer staples sectors posted negative returns and substantially lagged the overall market.
At the beginning of the reporting period in November 2016, the unexpected U.S. presidential election results led to a sharp rise in stock market valuations. President Trump had campaigned on a populist, laissez-faire and protectionist platform. However, despite a slew of executive orders and a threat to withdraw from existing trade agreements, the administration encountered obstacles to the fulfillment of its campaign promises, which led to a more tempered stock market after the initial rise. Other mounting challenges facing the new administration included the ongoing investigation into alleged ties between the Trump campaign’s staff and the Russian government.
Elsewhere in the U.S. political arena, the Republican-controlled Senate could not reach an agreement on healthcare reform despite crafting two separate proposals to “repeal and replace” the Affordable Care Act (dubbed “Obamacare”), which would have eliminated some key provisions of the current healthcare law. Separately, towards the end of the reporting period, the Republican-controlled House of Representatives approved a budget proposal for the government’s 2018 fiscal year, which began on October 1, 2017, by a margin of four votes; no Democrats supported the bill. The budget plan seeks to cut corporate and individual tax rates while concurrently eliminating or reducing other tax deductions in an effort to limit the projected increase in the federal deficit to $1.5 trillion over the next 10 years.
Several sectors within the U.S. equity market recently have seen some notable developments. Growth in corporate technology spending accelerated toward the end of the reporting period as companies continued to reallocate their data needs toward cloud services and have been refreshing PC businesses. Healthcare companies performed very well early in the 2017 calendar year, bolstered by strong returns from biotechnology stocks. Construction of new homes remains on the upswing, but still favors multi-family residences (i.e., apartment buildings). Automobile sales remain at a strong clip, but appear to have peaked, at least temporarily. The average age of the U.S. private-passenger automobile fleet remains old compared to its historical levels over the past few decades. Finally, the retail sector remains tumultuous; several “brick-and-mortar” retailers filed bankruptcy in 2017, but online shopping continues to accelerate, growing more than 15% year-over-year in the third quarter of 2017.1
There was generally positive U.S. economic news over the reporting period:
| • | The Federal Reserve (Fed) increased the federal funds rate to a range of 1.00% to 1.25% over the review period in three increments of 25 basis points in December 2016, and March and June 2017. The minutes of the Fed’s meeting of September 19-20, 2017 indicated that the central bank intends to continue to make “gradual adjustments in the stance of monetary policy.” |
| • | Gross domestic product (GDP) grew between 1.8% and 3.3% on an annualized basis over the four quarters comprising the reporting period, bolstered mainly by increases in consumer spending and nonresidential fixed investment. |
| • | The U.S. economy added an average of 167,000 jobs per month over the 12-month reporting period, down from the 203,000 average monthly increase for the same time frame a year earlier. |
| • | The unemployment rate fell 0.7 percentage points over the reporting period to 4.1% – its lowest level since September 2000 – and average hourly earnings were up 2.4% year-over-year as of the end of October 2017. |
The Fund’s performance relative to its benchmark, the Russell Midcap Index, for the 12-month reporting period was bolstered by both stock selection and an underweight position in the financials sector, along with strong stock selection in the consumer discretionary and consumer staples sectors. The largest individual stock contributors were derivatives exchange operator CBOE Global Markets (formerly CBOE Holdings), Alberta-based Canadian Western Bank, and industrial automation company Rockwell Automation.
CBOE Global Markets’ quarterly results over the period were enhanced by higher trading volumes and revenue from CBOE Volatility Index (VIX)2 futures and proprietary index options. In the second half of the reporting period, the company benefited from the positive contribution to results from its acquisition of Bats Global Markets for approximately $3.4 billion in February 2017. Canadian Western Bank, a position that we initiated in May 2017, saw healthy year-over-year organic3 loan growth and effective credit-cost controls over the reporting period. Sentiment around the Canadian
| 1 | Source: U.S. Department of Commerce, November 2017 |
| 2 | The CBOE Volatility Index (VIX) is an indicator of the market’s expectation of 30-day volatility, as implied by the U.S. broader-market S&P 500 Index. |
| 3 | Organic growth comprises increases in output and internal sales. This excludes profits or growth achieved through takeovers, acquisitions or mergers. |
| 54 | Annual Report 2017 |
Aberdeen U.S. Mid Cap Equity Fund (Unaudited) (continued)
economy was also much improved as the central bank, the Bank of Canada, raised its benchmark interest rate following a strong second-quarter 2017 GDP report for that country. Rockwell Automation’s results for the first three quarters of its 2017 fiscal year were bolstered by strong organic growth in both its Architecture & Software and Control Products & Solutions segments. Consequently, management upgraded its earnings outlook for the full 2017 fiscal year. Emerson Electric Co., a large industrial conglomerate company, made a bid to acquire Rockwell in October 2017.
In contrast, overall positioning in the information technology sector and stock selection in the industrials sector weighed on the Fund’s performance versus the benchmark for the reporting period. The primary detractors among individual holdings included brewer Molson Coors Brewing Co., Manhattan Associates, a provider of logistics software for omni-channel retailing,4 and Ritchie Brothers Auctioneers, an industrial equipment auctioneer.
Molson Coors posted relatively mixed quarterly results over the reporting period. While the company was able to get positive pricing, light beer volumes continued to be weak throughout the year. Additionally, management announced that improvement in profit margins following the company’s acquisition of Miller-Coors in October 2016 will be slower than initially anticipated. Shares of Manhattan Associates declined as its first-quarter 2017 results did not meet the market’s expectations. Management noted that while it is seeing some delays in implementation, it expects service revenue growth to return modestly in the second half of 2017. The company attributed the improvement in operating margins to strong license revenue performance, workforce productivity, and expense discipline. Overall, we believe that the management team is operating the business appropriately through a difficult demand environment. Ritchie Brothers Auctioneers experienced relatively lower business volumes for much of the reporting period as used industrial equipment supply has tightened while the business integrated its large acquisition of Iron Planet. This has tempered investors’ growth expectations for the company and has driven valuation multiple compression.5 We believe that further growth in new equipment sales will result in an improvement in Ritchie Brothers’ end markets.
It was a busy reporting period in terms of portfolio activity. In addition to Canadian Western Bank as previously noted, we initiated positions in Henry Schein Corp, a distributor of healthcare products and services to dental, animal health and medical practitioners; global home appliance manufacturer Whirlpool Corp.; Beacon Roofing Supply; commercial bank Regions Financial Corp.; industrial fuse-maker Littelfuse; Avery Dennison Corp., a manufacturer of pressure-sensitive and functional materials and labeling solutions for the retail apparel market; funeral services provider and cemetery operator Service Corporation International; software services provider Ellie Mae; branded apparel retailer Burlington Stores; and Axalta Coating Systems, a manufacturer and distributor of coatings systems primarily serving the transportation industry.
Conversely, we exited the Fund’s holdings in technology equipment manufacturer Analog Devices as its market capitalization reached a level that exceeded the Fund’s mid-cap parameters. Analog Devices’ market cap rose after the company issued stock to purchase Linear Technologies. We also sold the Fund’s shares in pool supplies distributor Pool Corp due to our valuation concerns. Additionally, we exited the Fund’s position in pediatric nutrition company Mead Johnson Nutrition Co. due to U.K.-based health products maker Reckitt Benckiser Group’s pending offer to purchase the company. Other exited positions for the period included diversified healthcare company Baxter International; Arkansas-based Bank of the Ozarks; discount apparel retailer Ross Stores; payroll services provider Paychex; and waste management services company Republic Services; marketing and loyalty solutions services provider Alliance Data Systems; credit rating agency Moody’s Corp.; and Mettler-Toledo International, a supplier of precision instruments and services.
The 3.3% increase in U.S. GDP in the third quarter of 2017 exceeded expectations and was a strong reading in light of the negative impact from the recent hurricanes. Overall growth was supported by both consumer spending and business investment. This is the first time that the GDP has grown at least 3% for two consecutive quarters since 2014, which we feel is a good sign that the economy is gaining steam. The impact on U.S. companies has been noticeable as the third-quarter earnings season is off to a strong start.
We believe that the market generally reflects the positive results from companies and improvement in the economy. Consequently, we think that valuations are largely fair, not cheap. We continue to seek specific companies for our portfolios that we feel have opportunities to increase their earnings and/or expand valuations.
Portfolio Management:
Aberdeen North American Equity Team
PAST PERFORMANCE DOES NOT GUARANTEE FUTURE RESULTS.
The performance data quoted represents past performance and current returns may be lower or higher. Class A Shares have up to a 5.75% front-end sales charge and a 0.25% 12b-1 fee. The investment return and principal value will fluctuate so that an investor’s shares, when redeemed, may be worth more or less than the original cost. To obtain performance information current to the most recent month-end, which may be higher or lower than the performance shown above, please call 866-667-9231 or go to www.aberdeen-asset.us.
Investing in mutual funds involves risk, including the possible loss of principal.
| 4 | Omni-channel retailing seeks to provide customers with a seamless shopping experience online from a desktop or mobile device, by telephone, or in “brick-and-mortar” stores. |
| 5 | Valuation multiple compression occurs when a company’s share price either declines or does not rise, even following strong earnings reports. The price/earnings multiple comprises the current market price of a company share divided by the earnings per share of the company. |
| 2017 Annual Report | 55 |
Aberdeen U.S. Mid Cap Equity Fund (Unaudited) (concluded)
Indexes are unmanaged and have been provided for comparison purposes only. No fees or expenses are reflected. You cannot invest directly in an index.
Lipper is a leading global provider of mutual fund information and analysis to fund companies, financial intermediaries and media organizations.
Risk Considerations
Equity stocks of mid-cap companies carry greater risk and more volatility than equity stocks of larger, more established companies.
Investing a significant portion of the Fund’s assets in securities of companies conducting business in a broadly related group of industries within an economic sector may make the Fund more vulnerable to unfavorable developments in that sector.
Please read the prospectus for more detailed information regarding these and other risks.
| 56 | Annual Report 2017 |
Aberdeen U.S. Mid Cap Equity Fund (Unaudited)
| Average Annual Total Return (For periods ended October 31, 2017) | 1 Yr. | Inception1 | ||||||||
Class A | w/o SC | 24.41% | 20.29% | |||||||
| w/SC2 | 17.24% | 16.11% | ||||||||
Class C | w/o SC | 23.57% | 19.41% | |||||||
| w/SC3 | 22.57% | 19.41% | ||||||||
Class R4 | w/o SC | 24.14% | 20.00% | |||||||
Institutional Service Class4 | w/o SC | 24.70% | 20.58% | |||||||
Institutional Class4 | w/o SC | 24.70% | 20.62% | |||||||
All figures showing the effect of a sales charge (SC) reflect the maximum charge possible because it has the most significant effect on performance data. The total returns shown above do not include the impact of financial statement rounding of the net asset value (NAV) per share and/or financial statement adjustments.
| 1 | Fund commenced operations on February 29, 2016. |
| 2 | A 5.75% front-end sales charge was deducted. |
| 3 | A 1.00% contingent deferred sales charge (CDSC) was deducted because it is charged when Class C shares are sold within the first year after purchase. |
| 4 | Not subject to any sales charges. |
Performance of a $1,000,000 Investment* (as of October 31, 2017)
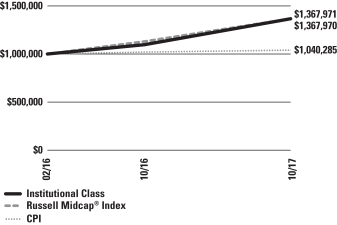
| * | Minimum Initial Investment |
Comparative performance of $1,000,000 invested in Institutional Class shares of the Aberdeen U.S. Mid Cap Equity Fund, Russell Midcap® Index and the Consumer Price Index (CPI) from inception to October 31, 2017. Unlike the Fund, the returns for these unmanaged indexes do not reflect any fees, expenses, or sales charges. Investors cannot invest directly in market indexes.
The Russell Midcap® Index measures the performance of the mid-cap segment of the U.S. equity universe. The Russell Midcap® Index is a subset of the Russell 1000® Index. It includes approximately 800 of the smallest securities based on a combination of their market cap and current index membership. The Russell Midcap® Index represents approximately 31% of the total market capitalization of the Russell 1000 companies. The Russell 1000® Index is constructed to provide a comprehensive and unbiased barometer for the mid-cap segment. The index is completely reconstituted annually to ensure larger stocks do not distort the performance and characteristics of the true mid-cap opportunity set.
The CPI is a measure of the average change over time in the prices paid by urban consumers for a market basket of consumer goods and services.
Investment return and principal value will fluctuate, and when redeemed, shares may be worth more or less than original cost. Past performance is no guarantee of future results. The Average Annual Total Return table and Performance graph do not reflect the deduction of taxes that a shareholder would pay on fund distributions or the redemption of fund shares. Investing in mutual funds involves market risk, including loss of principal. Performance returns assume the reinvestment of all distributions. Total returns reflect waivers and reimbursements in effect, without which returns would have been lower.
| 2017 Annual Report | 57 |
Aberdeen U.S. Mid Cap Equity Fund (Unaudited) (concluded)
Portfolio Summary (as a percentage of net assets)
October 31, 2017 (Unaudited)
| Asset Allocation | ||||
Common Stocks | 94.1% | |||
Short-Term Investment | 4.0% | |||
Other Assets in Excess of Liabilities | 1.9% | |||
| 100.0% | ||||
The following table summarizes the composition of the Fund’s portfolio, in Standard & Poor’s Global Industry Classification Standard (GICS) sectors, expressed as a percentage of net assets. The GICS structure consists of 11 sectors, 24 industry groups, 68 industries and 157 sub-industries. As of October 31, 2017, the Fund did not have more than 25% of its assets invested in any industry group.
| Top Sectors | ||||
Industrials | 19.6% | |||
Information Technology | 14.3% | |||
Consumer Discretionary | 12.8% | |||
Financials | 10.8% | |||
Health Care | 9.3% | |||
Materials | 8.1% | |||
Consumer Staples | 7.6% | |||
Real Estate | 6.0% | |||
Utilities | 3.8% | |||
Energy | 1.8% | |||
Other | 5.9% | |||
| 100.0% | ||||
| Top Holdings* | ||||
Cboe Global Markets, Inc. | 3.7% | |||
Snap-on, Inc. | 3.0% | |||
Molson Coors Brewing Co., Class B | 3.0% | |||
Beacon Roofing Supply, Inc. | 2.9% | |||
Littelfuse, Inc. | 2.9% | |||
Verisk Analytics, Inc., Class A | 2.8% | |||
Cerner Corp. | 2.7% | |||
Canadian Western Bank | 2.7% | |||
Avery Dennison Corp. | 2.6% | |||
Genpact Ltd. | 2.6% | |||
Other | 71.1% | |||
| 100.0% | ||||
| * | For the purpose of listing top holdings, Short-Term Investments are included as part of Other. |
| Top Countries | ||||
United States | 90.7% | |||
Canada | 4.9% | |||
Israel | 2.5% | |||
Other | 1.9% | |||
| 100.0% | ||||
| 58 | Annual Report 2017 |
Statement of Investments
October 31, 2017
Aberdeen U.S. Mid Cap Equity Fund
| Shares or Principal Amount | Value | |||||||
COMMON STOCKS (94.1%) | ||||||||
CANADA (4.9%) | ||||||||
Financials (2.7%) | ||||||||
Canadian Western Bank | 1,352 | $ | 38,084 | |||||
Industrials (2.2%) | ||||||||
Ritchie Bros Auctioneers, Inc. | 1,120 | 31,393 | ||||||
| 69,477 | ||||||||
ISRAEL (2.5%) | ||||||||
Information Technology (2.5%) | ||||||||
Check Point Software Technologies Ltd. (a) | 296 | 34,842 | ||||||
UNITED STATES (86.7%) | ||||||||
Consumer Discretionary (12.8%) | ||||||||
BorgWarner, Inc. | 660 | 34,795 | ||||||
Burlington Stores, Inc. (a) | 216 | 20,280 | ||||||
PVH Corp. | 274 | 34,746 | ||||||
Service Corp. International | 976 | 34,609 | ||||||
Tiffany & Co. | 274 | 25,652 | ||||||
Whirlpool Corp. | 194 | 31,803 | ||||||
| 181,885 | ||||||||
Consumer Staples (7.6%) | ||||||||
Cal-Maine Foods, Inc. (a) | 691 | 31,095 | ||||||
Casey’s General Stores, Inc. | 307 | 35,173 | ||||||
Molson Coors Brewing Co., Class B | 522 | 42,214 | ||||||
| 108,482 | ||||||||
Energy (1.8%) | ||||||||
Core Laboratories NV | 251 | 25,075 | ||||||
Financials (8.1%) | ||||||||
Cboe Global Markets, Inc. | 463 | 52,347 | ||||||
M&T Bank Corp. | 167 | 27,850 | ||||||
Regions Financial Corp. | 2,277 | 35,248 | ||||||
| 115,445 | ||||||||
Health Care (9.3%) | ||||||||
Cerner Corp. (a) | 575 | 38,824 | ||||||
Globus Medical, Inc., Class A (a) | 906 | 28,874 | ||||||
Henry Schein, Inc. (a) | 412 | 32,383 | ||||||
Teleflex, Inc. | 139 | 32,941 | ||||||
| 133,022 | ||||||||
Industrials (17.4%) | ||||||||
Beacon Roofing Supply, Inc. (a) | 754 | 41,779 | ||||||
CH Robinson Worldwide, Inc. | 457 | 35,888 | ||||||
Equifax, Inc. | 221 | 23,985 | ||||||
Kansas City Southern | 301 | 31,370 | ||||||
Rockwell Automation, Inc. | 162 | 32,533 | ||||||
Snap-on, Inc. | 272 | 42,916 | ||||||
Verisk Analytics, Inc., Class A (a) | 473 | 40,229 | ||||||
| 248,700 | ||||||||
Information Technology (11.8%) | ||||||||
CDW Corp. | 496 | 34,720 | ||||||
Ellie Mae, Inc. (a) | 244 | 21,948 | ||||||
Genpact Ltd. | 1,219 | 37,119 | ||||||
Littelfuse, Inc. | 197 | 41,173 | ||||||
Manhattan Associates, Inc. (a) | 790 | 33,069 | ||||||
| 168,029 | ||||||||
Materials (8.1%) | ||||||||
Avery Dennison Corp. | 351 | 37,265 | ||||||
Axalta Coating Systems Ltd. (a) | 959 | 31,887 | ||||||
International Flavors & Fragrances, Inc. | 221 | 32,580 | ||||||
Sonoco Products Co. | 266 | 13,776 | ||||||
| 115,508 | ||||||||
Real Estate (6.0%) | ||||||||
Digital Realty Trust, Inc., REIT | 218 | 25,820 | ||||||
Healthcare Realty Trust, Inc., REIT | 736 | 23,729 | ||||||
Jones Lang LaSalle, Inc. | 282 | 36,516 | ||||||
| 86,065 | ||||||||
Utilities (3.8%) | ||||||||
American Water Works Co., Inc. | 325 | 28,522 | ||||||
CMS Energy Corp. | 518 | 25,055 | ||||||
| 53,577 | ||||||||
| 1,235,788 | ||||||||
Total Common Stocks | 1,340,107 | |||||||
SHORT-TERM INVESTMENT (4.0%) | ||||||||
UNITED STATES (4.0%) | ||||||||
State Street Institutional U.S. Government Money Market Fund, Institutional Class, 0.96% (b) | 57,602 | 57,602 | ||||||
Total Short-Term Investment | 57,602 | |||||||
Total Investments | 1,397,709 | |||||||
Other Assets in Excess of Liabilities—1.9% | 27,203 | |||||||
Net Assets—100.0% | $ | 1,424,912 | ||||||
| (a) | Non-income producing security. |
| (b) | Registered investment company advised by State Street Global Advisors. The rate shown is the current yield as of October 31, 2017. |
| (c) | See accompanying Notes to Financial Statements for tax unrealized appreciation/(depreciation) of securities. |
| REIT | Real Estate Investment Trust |
See accompanying Notes to Financial Statements.
| 2017 Annual Report | 59 |
Aberdeen U.S. Multi-Cap Equity Fund (Unaudited)
The Aberdeen U.S. Multi-Cap Equity Fund (Institutional Class shares net of fees) returned 21.45% for the 12-month period ended October 31, 2017, versus the 23.98% return of its benchmark, the Russell 3000 Index, and 23.63% for the broader-market Standard and Poor’s (S&P) 500 Index, for the same period. For broader comparison, the average return of the Fund’s peer category of Multi-Cap Core Funds (consisting of 351 funds), as measured by Lipper, Inc., was 21.83% for the period.
Major U.S. equity indices moved sharply higher over the 12-month period ended October 31, 2017, despite numerous periods of uncertainty surrounding the policies of the new administration of U.S. President Donald Trump. Most U.S. companies reported strong results and generally upbeat outlooks during the reporting period. Earnings largely have been strong enough to support stocks across the market-capitalization ranges. U.S. small-cap stocks, as measured by the Russell 2000 Index, gained 27.85% for the reporting period, outperforming the 23.63% and 21.09% returns of their large- and mid-cap counterparts, as measured by the S&P 500 Index and the Russell Midcap Index, respectively. Ten of the eleven sectors within the U.S. extended-market Russell 3000 Index garnered positive returns for the reporting period, led by information technology, financials and materials. Conversely, telecommunication services was the lone sector to record a negative return for the period, while shares of energy and consumer staples companies posted more modest gains and substantially lagged the overall market.
At the beginning of the reporting period in November 2016, the unexpected U.S. presidential election results led to a sharp rise in stock market valuations. President Trump had campaigned on a populist, laissez-faire and protectionist platform and had promised to undo the policies of the administration of former President Barack Obama if elected. However, despite a slew of executive orders and a threat to withdraw from existing trade agreements, the administration encountered obstacles to the fulfillment of its campaign promises. Other mounting challenges facing the new administration included the ongoing investigation into alleged ties between the Trump campaign’s staff and the Russian government.
Elsewhere in the U.S. political arena, the Republican-controlled Senate could not reach an agreement on healthcare reform despite crafting two separate proposals to “repeal and replace” the Affordable Care Act (dubbed “Obamacare”), which would have eliminated some key provisions of the current healthcare law. Separately, towards the end of the reporting period, the Republican-controlled House of Representatives approved a budget proposal for the government’s 2018 fiscal year, which began on October 1, 2017, by a margin of four votes; no Democrats supported the bill. The budget plan seeks to cut corporate and individual tax rates while concurrently eliminating or reducing other tax deductions in an effort to limit the projected increase in the federal deficit to $1.5 trillion over the next 10 years.
Several sectors within the U.S. equity market recently have seen notable developments. Growth in corporate technology spending accelerated toward the end of the reporting period as companies continued to reallocate their data needs toward cloud services and have been upgrading their installed PCs. Healthcare companies performed very well early in the 2017 calendar year, bolstered by strong returns from biotechnology stocks. Construction of new homes remains on the upswing, but still favors multi-family residences (i.e., apartment buildings). Automobile sales remain at a strong clip, but appear to have peaked, at least temporarily. However, the average age of the U.S. private-passenger automobile fleet remains quite old compared to its historical levels over the past few decades. Finally, the retail sector remains tumultuous; several “brick-and-mortar” retailers filed bankruptcy in 2017, but online shopping continues to accelerate, growing more than 15% year over year in the third quarter of 2017.1
There was generally positive U.S. economic news over the reporting period:
| • | The Federal Reserve (Fed) increased the federal funds rate to a range of 1.00% to 1.25% over the review period in three increments of 25 basis points in December 2016, and March and June 2017. The minutes of the Fed’s meeting of September 19-20, 2017 indicated that the central bank intends to continue to make “gradual adjustments in the stance of monetary policy.” |
| • | Gross domestic product (GDP) grew between 1.8% and 3.3% on an annualized basis over the four quarters comprising the reporting period, bolstered mainly by increases in consumer spending and nonresidential fixed investment. |
| • | The U.S. economy added an average of 167,000 jobs per month over the 12-month reporting period, down from the 203,000 average monthly increase for the same timeframe a year earlier. |
| • | The unemployment rate fell 0.7 percentage points over the reporting period to 4.1%–its lowest level since September 2000–and average hourly earnings were up 2.4% year over year as of the end of October 2017. |
The Fund’s performance versus its benchmark, the Russell 3000 Index, for the reporting period was hampered by stock selection in the information technology and industrials sectors, as well as an overweight allocation to consumer staples. The most notable individual stock detractors from performance included brewer Molson Coors Brewing Co., Manhattan Associates, a provider of logistics software for omni-channel retailing,2 and Ritchie Brothers Auctioneers, an industrial equipment auctioneer.
Molson Coors posted relatively mixed quarterly results over the reporting period. Sales of the company’s Coors Light beer increased and both this product and its Miller Lite beer brand gained market share in the premium light beer market segment – albeit at lower
| 1 | Source: U.S. Department of Commerce, November 2017. |
| 2 | Omni-channel retailing seeks to provide customers with a seamless shopping experience online from a desktop or mobile device, by telephone, or in “brick-and-mortar” stores. |
| 60 | Annual Report 2017 |
Aberdeen U.S. Multi-Cap Equity Fund (Unaudited) (continued)
profit margins. Additionally, the company saw a decline in sales of its U.S. craft beer brands to retailers and wholesalers, as well as weakness in its Canadian and European business. Shares of Manhattan Associates declined as its first-quarter 2017 results did not meet the market’s expectations. Management noted that while it is seeing some delays in implementation, it expects service revenue growth to return modestly in the second half of 2017. The company attributed the improvement in operating margins to strong license revenue performance, workforce productivity and expense discipline. Overall, we believe that the management team is operating the business appropriately through a difficult demand environment. Ritchie Brothers Auctioneers experienced relatively lower business volumes for much of the reporting period as equipment supply has tightened. This has tempered investors’ growth expectations for the company and valuation multiple compression.3 We believe that further growth in new equipment sales will result in an improvement in Ritchie Brothers’ end markets.
The Fund’s relative performance benefited from stock selection in the healthcare and energy sectors, along with both stock selection and an underweight position in the real estate sector. The largest contributors to performance among individual holdings were industrial automation company Rockwell Automation, Arkansas-based Bank of the Ozarks, and contract research organization PAREXEL International Corp.
Rockwell Automation’s results for the first three quarters of its 2017 fiscal year were bolstered by strong organic growth in both its Architecture & Software and Control Products & Solutions segments. Consequently, management upgraded its earnings outlook for the full 2017 fiscal year. Bank of the Ozarks saw strong loan growth and higher net interest margins for the first two months of the reporting period. Shares of PAREXEL International Corp. rose sharply following its announced acquisition by a private equity firm. We subsequently exited the Fund’s position in the company in July 2017.
Market volatility provided us with several investment opportunities during the quarter. We initiated holdings in Beacon Roofing Supply; brewer Molson Coors Brewing Co.; real estate management and development company Jones Lang LaSalle; commercial bank Regions Financial Corp.; Alphabet, the parent company of Google; oil and gas company ConocoPhillips; tool-maker Snap-on; healthcare services provider Aetna; and IT services provider CDW Corp.
In addition to PAREXEL International Corp., we exited the Fund’s positions in Bank of the Ozarks; defense contractor Lockheed Martin; medical technology products manufacturer Teleflex; industrial machinery manufacturer Deere & Co.; energy services provider Core Laboratories; marketing and loyalty solutions services provider Alliance Data Systems; and credit-rating agency Moody’s Corp.
While each of the transactions stands on its own as a company-specific decision, we believe that the Fund has a balance that is slightly less dependent on overall macroeconomic performance than it was prior to the election in November 2016.
The 3.3% increase in U.S. GDP in the third quarter of 2017 exceeded expectations and was a strong reading in light of the negative impact from the recent hurricanes. Overall growth was supported by both consumer spending and business investment. This is the first time that the GDP has grown at least 3% for two consecutive quarters since 2014, which we feel is a good sign that the economy is gaining steam. The impact on U.S. companies has been noticeable as the third-quarter earnings season is off to a strong start for small caps, with both sales and earnings growth accelerating from their second-quarter levels, and tracking ahead of sales and earnings growth for large caps. This is a reversal of the recent trend, and is probably needed in order for small caps to maintain a valuation premium relative to larger companies. As it stands, small caps currently trade at 18.2 times forward earnings, a 4% premium to large caps – slightly below the longer-term average.
Within the large-cap universe, nearly three-quarters of S&P 500 Index companies posted better-than-expected earnings per share (EPS) for the third quarter of 2017, while two-thirds exceeded consensus revenue estimates.4 Furthermore, the blended year-over-year earnings growth rate for S&P 500 constituents was 6.2%. Seven of the eleven sectors within the index saw increases in EPS over the quarter, with energy companies leading the way.
We believe that the market generally reflects the positive results from companies and improvement in the economy. Consequently, we think that valuations are largely fair, not cheap. We continue to seek specific companies for our portfolios that we feel have opportunities to increase their earnings and/or expand valuations.
Portfolio Management:
Aberdeen North American Equity Team
PAST PERFORMANCE DOES NOT GUARANTEE FUTURE RESULTS.
The performance data quoted represents past performance and current returns may be lower or higher. Class A Shares have up to a 5.75% front-end sales charge and a 0.25% 12b-1 fee. The investment return and principal value will fluctuate so that an investor’s shares, when redeemed, may be worth more or less than the original cost. To obtain performance information current to the most recent month-end, which may be higher or lower than the performance shown above, please call 866-667-9231 or go to www.aberdeen-asset.us.
Investing in mutual funds involves risk, including the possible loss of principal.
Indexes are unmanaged and have been provided for comparison purposes only. No fees or expenses are reflected. You cannot invest directly in an index.
Lipper is a leading global provider of mutual fund information and analysis to fund companies, financial intermediaries and media organizations.
| 3 | Valuation multiple compression occurs when a company’s share price either declines or does not rise, even following strong earnings reports. The price/earnings multiple comprises the current market price of a company share divided by the earnings per share of the company. |
| 4 | Source: Earnings Insight, FactSet, November 17, 2017. |
| 2017 Annual Report | 61 |
Aberdeen U.S. Multi-Cap Equity Fund (Unaudited) (concluded)
Risk Considerations
Investing a significant portion of the Fund’s assets in securities of companies conducting business in a broadly related group of industries within an economic sector may make the Fund more vulnerable to unfavorable developments in that sector.
Equity stocks of small- and mid-cap companies carry greater risk and more volatility than equity stocks of larger, more established companies.
Please read the prospectus for more detailed information regarding these and other risks.
| 62 | Annual Report 2017 |
Aberdeen U.S. Multi-Cap Equity Fund (Unaudited)
| Average Annual Total Return1 (For periods ended October 31, 2017) | 1 Yr. | 5 Yr. | 10 Yr. | |||||||||||
Class A | w/o SC | 21.13% | 11.42% | 5.00% | ||||||||||
| w/SC2 | 14.16% | 10.10% | 4.39% | |||||||||||
Class C | w/o SC | 20.26% | 10.61% | 4.27% | ||||||||||
| w/SC3 | 19.26% | 10.61% | 4.27% | |||||||||||
Class R4 | w/o SC | 20.64% | 11.08% | 4.79% | ||||||||||
Institutional Service Class4,5 | w/o SC | 21.33% | 11.64% | 5.28% | ||||||||||
Institutional Class4 | w/o SC | 21.45% | 11.75% | 5.33% | ||||||||||
All figures showing the effect of a sales charge (SC) reflect the maximum charge possible because it has the most significant effect on performance data. The total returns shown above do not include the impact of financial statement rounding of the net asset value (NAV) per share and/or financial statement adjustments.
| 1 | Returns from June 23, 2008 to October 9, 2011 reflect the performance of a predecessor fund (the “Predecessor Fund”). In addition, after February 28, 2009, the Predecessor Fund changed its investment style and became diversified. The returns prior to June 23, 2008 reflect the performance of another predecessor fund (the “Second Predecessor Fund”), which was acquired by the Predecessor Fund. Returns of the Predecessor Fund have not been adjusted to reflect the expenses applicable to the respective classes. Please consult the Fund’s prospectus for more detail. |
| 2 | A 5.75% front-end sales charge was deducted. |
| 3 | A 1.00% contingent deferred sales charge (CDSC) was deducted from the one year return because it is charged when Class C shares are sold within the first year after purchase. |
| 4 | Not subject to any sales charges. |
| 5 | Returns before the first offering of the Institutional Service Class (October 10, 2011) are based on the previous performance of the Institutional Class of the Predecessor Fund and Second Predecessor Fund. Excluding the effect of any fee waivers or reimbursements, this performance is substantially similar to what the Institutional Service Class would have produced because both classes invest in the same portfolio of securities. Returns would only differ to the extent of the differences in expenses of the two classes. |
Performance of a $10,000 Investment (as of October 31, 2017)
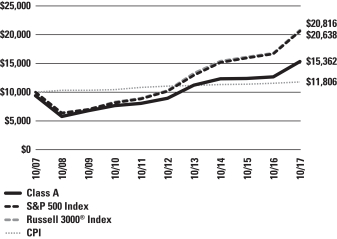
Comparative performance of $10,000 invested in Class A shares of the Aberdeen U.S. Multi-Cap Equity Fund, Russell 3000® Index and the Consumer Price Index (CPI) over a 10-year period ended October 31, 2017. Unlike the Fund, the returns for these unmanaged indexes do not reflect any fees, expenses, or sales charges. Investors cannot invest directly in market indexes.
The Russell 3000® Index measures the performance of the largest 3,000 U.S. companies representing approximately 98% of the investable U.S. equity market. The Russell 3000® Index is constructed to provide a comprehensive, unbiased, and stable barometer of the broad market and is completely reconstituted annually to ensure new and growing equities are reflected.
The CPI is a measure of the average change over time in the prices paid by urban consumers for a market basket of consumer goods and services.
Investment return and principal value will fluctuate, and when redeemed, shares may be worth more or less than original cost. Past performance is no guarantee of future results. The Average Annual Total Return table and Performance graph do not reflect the deduction of taxes that a shareholder would pay on fund distributions or the redemption of fund shares. Investing in mutual funds involves market risk, including loss of principal. Performance returns assume the reinvestment of all distributions. Total returns reflect waivers and reimbursements in effect, without which returns would have been lower.
| 2017 Annual Report | 63 |
Aberdeen U.S. Multi-Cap Equity Fund (Unaudited) (concluded)
Portfolio Summary (as a percentage of net assets)
October 31, 2017 (Unaudited)
| Asset Allocation | ||||
Common Stocks | 97.3% | |||
Short-Term Investment | 3.0% | |||
Liabilities in Excess of Other Assets | (0.3% | ) | ||
| 100.0% | ||||
The following table summarizes the composition of the Fund’s portfolio, in Standard & Poor’s Global Industry Classification Standard (GICS) sectors, expressed as a percentage of net assets. The GICS structure consists of 11 sectors, 24 industry groups, 68 industries and 157 sub-industries. As of October 31, 2017, the Fund did not have more than 25% of its assets invested in any industry group.
| Top Sectors | ||||
Information Technology | 20.1% | |||
Industrials | 15.8% | |||
Consumer Staples | 14.1% | |||
Financials | 12.4% | |||
Consumer Discretionary | 9.7% | |||
Health Care | 8.7% | |||
Materials | 7.3% | |||
Energy | 7.0% | |||
Real Estate | 2.2% | |||
Other | 2.7% | |||
| 100.0% | ||||
| Top Holdings* | ||||
Visa, Inc., Class A | 3.6% | |||
Oracle Corp. | 3.5% | |||
Praxair, Inc. | 3.3% | |||
Alphabet, Inc., Class A | 3.2% | |||
Intercontinental Exchange, Inc. | 3.0% | |||
Philip Morris International, Inc. | 2.8% | |||
EOG Resources, Inc. | 2.8% | |||
Charles Schwab Corp. (The) | 2.8% | |||
Aetna, Inc. | 2.7% | |||
Snap-on, Inc. | 2.6% | |||
Other | 69.7% | |||
| 100.0% | ||||
| * | For the purpose of listing top holdings, Short-Term Investments are included as part of Other. |
| Top Countries | ||||
United States | 95.9% | |||
Canada | 4.4% | |||
Other | (0.3% | ) | ||
| 100.0% | ||||
| 64 | Annual Report 2017 |
Statement of Investments
October 31, 2017
Aberdeen U.S. Multi-Cap Equity Fund
| Shares or Principal Amount | Value | |||||||
COMMON STOCKS (97.3%) | ||||||||
CANADA (4.4%) | ||||||||
Industrials (4.4%) | ||||||||
Canadian National Railway Co. | 90,390 | $ | 7,275,491 | |||||
Ritchie Bros Auctioneers, Inc. | 310,489 | 8,703,007 | ||||||
| 15,978,498 | ||||||||
UNITED STATES (92.9%) | ||||||||
Consumer Discretionary (9.7%) | ||||||||
BorgWarner, Inc. | 178,537 | 9,412,471 | ||||||
Comcast Corp., Class A | 225,833 | 8,136,763 | ||||||
PVH Corp. | 71,514 | 9,068,690 | ||||||
TJX Cos., Inc. (The) | 123,598 | 8,627,140 | ||||||
| 35,245,064 | ||||||||
Consumer Staples (14.1%) | ||||||||
Casey’s General Stores, Inc. | 67,480 | 7,731,184 | ||||||
Costco Wholesale Corp. | 53,122 | 8,556,892 | ||||||
CVS Health Corp. | 89,473 | 6,131,585 | ||||||
Estee Lauder Cos., Inc. (The), Class A | 84,210 | 9,415,520 | ||||||
Molson Coors Brewing Co., Class B | 110,093 | 8,903,221 | ||||||
Philip Morris International, Inc. | 98,040 | 10,258,905 | ||||||
| 50,997,307 | ||||||||
Energy (7.0%) | ||||||||
ConocoPhillips | 165,948 | 8,488,240 | ||||||
EOG Resources, Inc. | 102,506 | 10,237,275 | ||||||
Schlumberger Ltd. | 105,267 | 6,737,088 | ||||||
| 25,462,603 | ||||||||
Financials (12.4%) | ||||||||
American International Group, Inc. | 129,845 | 8,389,286 | ||||||
Charles Schwab Corp. (The) | 221,975 | 9,953,359 | ||||||
Intercontinental Exchange, Inc. | 165,393 | 10,932,477 | ||||||
M&T Bank Corp. | 45,988 | 7,669,419 | ||||||
Regions Financial Corp. | 502,786 | 7,783,127 | ||||||
| 44,727,668 | ||||||||
Health Care (8.7%) | ||||||||
Aetna, Inc. | 57,080 | 9,705,312 | ||||||
Baxter International, Inc. | 119,429 | 7,699,587 | ||||||
Gilead Sciences, Inc. | 85,383 | 6,400,310 | ||||||
Globus Medical, Inc., Class A (a) | 243,087 | 7,747,183 | ||||||
| 31,552,392 | ||||||||
Industrials (11.4%) | ||||||||
Beacon Roofing Supply, Inc. (a) | 163,781 | 9,075,105 | ||||||
Equifax, Inc. | 65,773 | 7,138,344 | ||||||
Rockwell Automation, Inc. | 39,388 | 7,909,898 | ||||||
Snap-on, Inc. | 59,937 | 9,456,860 | ||||||
Verisk Analytics, Inc., Class A (a) | 87,758 | 7,463,818 | ||||||
| 41,044,025 | ||||||||
Information Technology (20.1%) | ||||||||
Alphabet, Inc., Class A (a) | 11,344 | 11,718,806 | ||||||
CDW Corp. | 115,423 | 8,079,610 | ||||||
Cognizant Technology Solutions Corp., Class A | 122,919 | 9,301,281 | ||||||
Manhattan Associates, Inc. (a) | 206,981 | 8,664,225 | ||||||
Oracle Corp. | 250,087 | 12,729,428 | ||||||
Texas Instruments, Inc. | 97,414 | 9,418,959 | ||||||
Visa, Inc., Class A | 116,798 | 12,845,444 | ||||||
| 72,757,753 | ||||||||
Materials (7.3%) | ||||||||
Ecolab, Inc. | 55,693 | 7,276,847 | ||||||
Praxair, Inc. | 81,478 | 11,905,565 | ||||||
Sensient Technologies Corp. | 92,672 | 7,047,706 | ||||||
| 26,230,118 | ||||||||
Real Estate (2.2%) | ||||||||
Jones Lang LaSalle, Inc. | 60,296 | 7,807,729 | ||||||
| 335,824,659 | ||||||||
Total Common Stocks | 351,803,157 | |||||||
SHORT-TERM INVESTMENT (3.0%) | ||||||||
UNITED STATES (3.0%) | ||||||||
State Street Institutional U.S. Government Money Market Fund, Institutional Class, 0.96% (b) | 10,824,334 | 10,824,334 | ||||||
Total Short-Term Investment | 10,824,334 | |||||||
Total Investments | 362,627,491 | |||||||
Liabilities in Excess of Other Assets—(0.3)% |
| (915,105 | ) | |||||
Net Assets—100.0% | $ | 361,712,386 | ||||||
| (a) | Non-income producing security. |
| (b) | Registered investment company advised by State Street Global Advisors. The rate shown is the current yield as of October 31, 2017. |
| (c) | See accompanying Notes to Financial Statements for tax unrealized appreciation/(depreciation) of securities. |
See accompanying Notes to Financial Statements.
| 2017 Annual Report | 65 |
Aberdeen U.S. Small Cap Equity Fund (Unaudited)
The Aberdeen U.S. Small Cap Equity Fund (Institutional Class shares net of fees) returned 24.34% for the 12-month period ended October 31, 2017, versus 27.85% for its benchmark, the Russell 2000 Index, for the same period. For broader comparison, the average return of the Fund’s peer category of Small-Cap Core Funds (comprising 419 funds), as measured by Lipper, Inc., was 24.96% for the period.
Major U.S. equity indices moved sharply higher over the 12-month period ended October 31, 2017, despite numerous periods of uncertainty surrounding the policies of the new administration of U.S. President Donald Trump. Most U.S. companies reported strong results and generally upbeat outlooks during the reporting period. Earnings largely have been strong enough to support stocks across the market-capitalization ranges. U.S. small-cap stocks, as measured by the Russell 2000 Index, climbed 27.85% for the period, outperforming the 23.63% return of their large-cap counterparts, as represented by the U.S. broader-market S&P 500 Index. Ten of the eleven sectors within the Russell 2000 Index garnered positive returns for the reporting period, led by healthcare, industrials and materials. Conversely, energy was the lone sector to post a negative return for the period, while shares of consumer staples and real estate companies recorded more modest gains and significantly lagged the overall market.
At the beginning of the reporting period in November 2016, the unexpected U.S. presidential election results led to a sharp rise in stock market valuations. President Trump had campaigned on a populist, laissez-faire and protectionist platform and had promised to undo the policies of the administration of former President Barack Obama if elected. However, despite a slew of executive orders and a threat to withdraw from existing trade agreements, the administration encountered obstacles to fulfillment of its campaign promises. Other mounting challenges facing the new administration included the ongoing investigation into alleged ties between the Trump campaign’s staff and the Russian government.
Elsewhere in the U.S. political arena, the Republican-controlled Senate could not reach an agreement on healthcare reform despite crafting two separate proposals to “repeal and replace” the Affordable Care Act (dubbed “Obamacare”), which would have eliminated some key provisions of the current healthcare law. Separately, towards the end of the reporting period, the Republican-controlled House of Representatives approved a budget proposal for the government’s 2018 fiscal year, which began on October 1, 2017, by a margin of four votes; no Democrats supported the bill. The budget plan seeks to cut corporate and individual tax rates while concurrently eliminating or reducing other tax deductions in an effort to limit the projected increase in the federal deficit to $1.5 trillion over the next 10 years.
Several sectors within the U.S. equity market recently have seen notable developments. Growth in corporate technology spending accelerated toward the end of the reporting period as companies continued to reallocate their data needs toward cloud services and have been upgrading their installed PCs. Healthcare companies performed very well early in the 2017 calendar year, bolstered by strong returns from biotechnology stocks. Construction of new homes remains on the upswing, but still favors multi-family residences (i.e., apartment buildings). Automobile sales remain at a strong clip, but appear to have peaked, at least temporarily. However, the average age of the U.S. private-passenger automobile fleet remains quite old compared to its historical levels over the past few decades. Finally, the retail sector remains tumultuous; several “brick-and-mortar” retailers filed bankruptcy in 2017, but online shopping continues to accelerate, growing more than 15% year over year in the third quarter of 2017.1
There was generally positive U.S. economic news over the reporting period:
| • | The Federal Reserve (Fed) increased the federal funds rate to a range of 1.00% to 1.25% over the review period in three increments of 25 basis points in December 2016, as well as March and June 2017. The minutes of the Fed’s meeting of September 19-20, 2017 indicated that the central bank intends to continue to make “gradual adjustments in the stance of monetary policy.” |
| • | Gross domestic product (GDP) grew between 1.8% and 3.3% on an annualized basis over the four quarters comprising the reporting period, bolstered mainly by increases in consumer spending and nonresidential fixed investment. |
| • | The U.S. economy added an average of 167,000 jobs per month over the 12-month reporting period, down from the 203,000 average monthly increase for the same timeframe a year earlier. |
| • | The unemployment rate fell 0.7 percentage points over the reporting period to 4.1% – its lowest level since September 2000 – and average hourly earnings were up 2.4% year over year as of the end of October 2017. |
Stock selection in the industrials and materials sectors weighed on the Fund’s performance versus its benchmark, the Russell 2000 Index, for the reporting period. The largest detractors from performance among individual holdings included industrial equipment auctioneer Ritchie Brothers Auctioneers, oilfield services company Forum Energy Technologies, and building products manufacturer Gibraltar Industries.
Ritchie Brothers Auctioneers has seen an organic2 decline in volumes as well as salesforce integration issues which have hampered its profitability. This has tempered investors’ growth expectations for the company and has driven valuation multiple compression.3 The Fund’s position in Forum Energy Technologies had a negative impact on the relative performance as the company continues to be hampered by the downturn in oil prices. Gibraltar Industries downgraded its earnings guidance for its 2017 fiscal year due to weaker performance in its solar business.
| 1 | Source: U.S. Department of Commerce, November 2017. |
| 2 | A company’s organic volumes exclude those achieved through takeovers, acquisitions or mergers. |
| 3 | Valuation multiple compression occurs when a company’s share price either declines or does not rise, even following strong earnings reports. The price/earnings multiple comprises the current market price of a company share divided by the earnings per share of the company. |
| 66 | Annual Report 2017 |
Aberdeen U.S. Small Cap Equity Fund (Unaudited) (continued)
In contrast, Fund performance was bolstered primarily by strong stock selection in the financials, consumer discretionary and information technology sectors. The most notable individual stock contributors to performance were Fox Factory Holdings, a manufacturer of shock absorbers and suspension systems for bikes and powered vehicles; Pegasystems, a developer of customer relationship and business process management software; and Alberta-based Canadian Western Bank.
Fox Factory Holdings benefited over the reporting period from a significant increase in powered vehicle sales amid increased demand for on- and off-road suspension products. Pegasystems’ corporate results over the period were bolstered by healthy growth in maintenance and service revenues. Finally, Canadian Western Bank saw healthy year-over-year organic4 loan growth and effective credit-cost controls over the reporting period. Sentiment around the Canadian economy was also much improved as the central bank, the Bank of Canada, raised its benchmark interest rate following a strong second-quarter 2017 GDP report for that country.
It was a busy reporting period in terms of portfolio activity. We initiated positions in several companies following extended periods of due diligence. Market volatility provided us with the opportunity to initiate relatively small positions in several new companies, including software services provider Ellie Mae and commercial real estate brokerage firm Marcus & Millichap. We established a new position in Iowa-based diversified media company Meredith Corp., as we like the company’s ability to shift away from potentially more secularly challenged areas such as print media and toward higher-growth digital and mobile platforms, while continuing to generate dependable revenue growth and strong cash-flow generation, in our view. Furthermore, we initiated a holding in logistics software provider Manhattan Associates. We think that the company is positioned for strong product and revenue growth and has benefited from the increasing importance that customers are placing on developing omni-channel marketing5 capabilities. Additionally, we established a new position in Casella Waste Systems, a Vermont-based integrated waste management company. We first met with its management team in June 2016, and believe that, despite a history of mismanagement, Casella Waste Systems has a significant opportunity for improvement. In our opinion, companies in similar situations have been some of the Fund’s strongest-performing investments over time.
Other new Fund positions over the reporting period included Neenah Paper, a company that manufactures a variety of paper, packaging, and materials for filtration products, Physicians Realty Trust, a real estate investment trust (REIT) that invests primarily in medical office buildings, AMN Healthcare Services, a California-based healthcare staffing firm, and Lithia Motors, an Oregon-based auto dealer with a store footprint that touches the northwest, southwest and northeast regions of the U.S.
Conversely, we exited several positions in companies for which market capitalizations expanded to the extent that they no longer met the Fund’s small-cap investment parameters: Arkansas-based Bank of the Ozarks, automatic test systems manufacturer Teradyne Corp., pool and landscape supplies distributor Pool Corp., and diversified industrial manufacturer Curtiss-Wright Corp. We sold the Fund’s shares in contract research organization PAREXEL International Corp. following its announced acquisition by a private equity firm, and exited the position in hotel chain operator La Quinta Holdings as we believed that it had deteriorating fundamentals and had reached its full valuation. Other sales of existing positions during the reporting period included specialty minerals producer Compass Minerals and retail sporting goods store operator Hibbett Sports, both of which have experienced fundamental issues that led to a decrease in our conviction in the company’s prospects.
We do not actively seek to underweight or overweight sectors, as sector allocation is the result of our bottom-up stock selection. At the end of the reporting period on October 31, 2017, the Fund was most overweight to the materials and industrials sectors relative to the benchmark Russell 2000 Index. The Fund had no exposure to the utilities sector, and the largest underweight positions were in the healthcare, financials and real estate sectors.
The 3.3% increase in U.S. GDP in the third quarter of 2017 exceeded expectations and was a strong reading in light of the negative impact from the recent hurricanes. Overall growth was supported by both consumer spending and business investment. This is the first time that the GDP has grown at least 3% for two consecutive quarters since 2014, which we feel is a good sign that the economy is gaining steam. The impact on U.S. companies has been noticeable as the third-quarter earnings season is off to a strong start for small caps, with both sales and earnings growth accelerating from their second-quarter levels, and tracking ahead of sales and earnings growth for large caps. This is a reversal of the recent trend and is probably needed in order for small caps to maintain a valuation premium relative to larger companies. As it stands, small caps currently trade at 18.2 times forward earnings, a 4% premium to large caps – slightly below the longer-term average.
We believe that the market generally reflects the positive results from companies and improvement in the economy. Consequently, we think that valuations are largely fair, not cheap. We continue to seek specific companies for our portfolios that we feel have opportunities to increase their earnings and/or expand valuations.
Portfolio Management:
Aberdeen North American Equity Team
PAST PERFORMANCE DOES NOT GUARANTEE FUTURE RESULTS.
The performance data quoted represents past performance and current returns may be lower or higher. Class A Shares have up to a 5.75% front-end
| 4 | Organic growth comprises increases in output and internal sales. This excludes profits or growth achieved through takeovers, acquisitions or mergers. |
| 5 | Omni-channel marketing seeks to provide customers with a seamless shopping experience online from a desktop or mobile device, by telephone, or in “brick-and-mortar” stores. |
| 2017 Annual Report | 67 |
Aberdeen U.S. Small Cap Equity Fund (Unaudited) (concluded)
sales charge and a 0.25% 12b-1 fee. The investment return and principal value will fluctuate so that an investor’s shares, when redeemed, may be worth more or less than the original cost. To obtain performance information current to the most recent month-end, which may be higher or lower than the performance shown above, please call 866-667-9231 or go to www.aberdeen-asset.us.
Investing in mutual funds involves risk, including the possible loss of principal.
Indexes are unmanaged and have been provided for comparison purposes only. No fees or expenses are reflected. You cannot invest directly in an index.
Lipper is a leading global provider of mutual fund information and analysis to fund companies, financial intermediaries and media organizations.
Risk Considerations
Equity stocks of small-cap companies carry greater risk and more volatility than equity stocks of larger, more established companies.
Foreign securities may be more volatile, harder to price and less liquid than U.S. securities. They are subject to different accounting and regulatory standards, currency exchange rates, political and economic risks. Fluctuation in currency exchange rates may impact the Fund’s returns more greatly to the extent the Fund does not hedge currency exposure or hedging techniques are unsuccessful. The foregoing risks are enhanced in emerging market countries.
Investing a significant portion of the Fund’s assets in securities of companies conducting business in a broadly related group of industries within an economic sector may make the Fund more vulnerable to unfavorable developments in that sector.
Please read the prospectus for more detailed information regarding these and other risks.
| 68 | Annual Report 2017 |
Aberdeen U.S. Small Cap Equity Fund (Unaudited)
| Average Annual Total Return1 (For periods ended October 31, 2017) | 1 Yr. | 5 Yr. | 10 Yr. | |||||||||||
Class A | w/o SC | 24.03% | 17.57% | 7.33% | ||||||||||
| w/SC2 | 16.91% | 16.18% | 6.70% | |||||||||||
Class C | w/o SC | 23.17% | 16.76% | 6.60% | ||||||||||
| w/SC3 | 22.17% | 16.76% | 6.60% | |||||||||||
Class R4 | w/o SC | 23.62% | 17.29% | 7.10% | ||||||||||
Institutional Service Class4 | w/o SC | 24.33% | 17.89% | 7.67% | ||||||||||
Institutional Class4 | w/o SC | 24.39% | 17.94% | 7.66% | ||||||||||
All figures showing the effect of a sales charge (SC) reflect the maximum charge possible because it has the most significant effect on performance data. The total returns shown above do not include the impact of financial statement rounding of the net asset value (NAV) per share and/or financial statement adjustments.
| 1 | Returns prior to June 23, 2008 reflect the performance of a predecessor fund (the “Predecessor Fund”). Returns of the Predecessor Fund have not been adjusted to reflect the expenses applicable to the respective classes. The Fund and the Predecessor Fund have substantially similar investment objectives and strategies. Please consult the Fund’s prospectus for more detail. |
| 2 | A 5.75% front-end sales charge was deducted. |
| 3 | A 1.00% contingent deferred sales charge (CDSC) was deducted from the one year return because it is charged when Class C shares are sold within the first year after purchase. |
| 4 | Not subject to any sales charges. |
Performance of a $10,000 Investment (as of October 31, 2017)
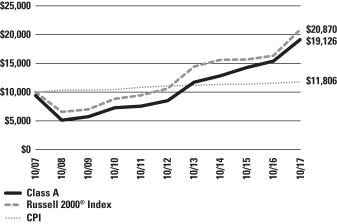
Comparative performance of $10,000 invested in Class A shares of the Aberdeen U.S. Small Cap Equity Fund, the Russell 2000® Index and the Consumer Price Index (CPI) over a 10-year period ended October 31, 2017. Unlike the Fund, the returns for these unmanaged indexes do not reflect any fees, expenses, or sales charges. Investors cannot invest directly in market indexes.
The Russell 2000® Index measures performance of the small-cap segment of the U.S. equity universe. It is a subset of the Russell 3000® Index and it represents approximately 8% of the U.S. market. It includes approximately 2000 of the smallest securities based on a combination of their market cap and current index membership. The Russell 2000® Index is constructed to provide a comprehensive and unbiased barometer for the small-cap segment and is completely reconstituted annually to ensure larger stocks do not distort the performance and characteristics of the true small-cap opportunity set.
The CPI is a measure of the average change over time in the prices paid by urban consumers for a market basket of consumer goods and services.
Investment return and principal value will fluctuate, and when redeemed, shares may be worth more or less than original cost. Past performance is no guarantee of future results. The Average Annual Total Return table and Performance graph do not reflect the deduction of taxes that a shareholder would pay on fund distributions or the redemption of fund shares. Investing in mutual funds involves market risk, including loss of principal. Performance returns assume the reinvestment of all distributions. Total returns reflect waivers and reimbursements in effect, without which returns would have been lower.
| 2017 Annual Report | 69 |
Aberdeen U.S. Small Cap Equity Fund (Unaudited) (concluded)
Portfolio Summary (as a percentage of net assets)
October 31, 2017 (Unaudited)
| Asset Allocation | ||||
Common Stocks | 96.4% | |||
Short-Term Investment | 4.6% | |||
Liabilities in Excess of Other Assets | (1.0% | ) | ||
| 100.0% | ||||
The following table summarizes the composition of the Fund’s portfolio, in Standard & Poor’s Global Industry Classification Standard (GICS) sectors, expressed as a percentage of net assets. The GICS structure consists of 11 sectors, 24 industry groups, 68 industries and 157 sub-industries. As of October 31, 2017, the Fund did not have more than 25% of its assets invested in any industry group.
| Top Sectors | ||||
Industrials | 19.4% | |||
Information Technology | 17.1% | |||
Financials | 15.5% | |||
Consumer Discretionary | 11.9% | |||
Health Care | 10.3% | |||
Materials | 8.8% | |||
Consumer Staples | 5.2% | |||
Real Estate | 4.5% | |||
Telecommunication Services | 1.9% | |||
Other | 5.4% | |||
| 100.0% | ||||
| Top Holdings* | ||||
Beacon Roofing Supply, Inc. | 3.1% | |||
Canadian Western Bank | 3.0% | |||
Insight Enterprises, Inc. | 2.8% | |||
Gibraltar Industries, Inc. | 2.8% | |||
Glacier Bancorp, Inc. | 2.7% | |||
WSFS Financial Corp. | 2.7% | |||
Emergent BioSolutions, Inc. | 2.6% | |||
ExlService Holdings, Inc. | 2.6% | |||
Core-Mark Holding Co., Inc. | 2.4% | |||
Kaiser Aluminum Corp. | 2.3% | |||
Other | 73.0% | |||
| 100.0% | ||||
| * | For the purpose of listing top holdings, Short-Term Investments are included as part of Other. |
| Top Countries | ||||
United States | 96.0% | |||
Canada | 5.0% | |||
Other | (1.0% | ) | ||
| 100.0% | ||||
| 70 | Annual Report 2017 |
Statement of Investments
October 31, 2017
Aberdeen U.S. Small Cap Equity Fund
| Shares or Principal Amount | Value | |||||||
COMMON STOCKS (96.4%) | ||||||||
CANADA (5.0%) | ||||||||
Financials (3.0%) | ||||||||
Canadian Western Bank | 2,116,130 | $ | 59,607,909 | |||||
Industrials (2.0%) | ||||||||
Richelieu Hardware Ltd. | 40,503 | 1,060,845 | ||||||
Ritchie Bros Auctioneers, Inc. | 1,383,593 | 38,782,112 | ||||||
| 39,842,957 | ||||||||
| 99,450,866 | ||||||||
UNITED STATES (91.4%) | ||||||||
Consumer Discretionary (11.9%) | ||||||||
Core-Mark Holding Co., Inc. | 1,381,423 | 47,051,267 | ||||||
Culp, Inc. | 1,095,663 | 34,732,517 | ||||||
Fox Factory Holding Corp. (a) | 782,481 | 33,294,567 | ||||||
G-III Apparel Group Ltd. (a) | 1,354,754 | 34,329,466 | ||||||
LCI Industries | 239,672 | 29,671,394 | ||||||
Lithia Motors, Inc., Class A | 263,635 | 29,838,209 | ||||||
Meredith Corp. (b) | 457,707 | 24,258,471 | ||||||
| 233,175,891 | ||||||||
Consumer Staples (5.2%) | ||||||||
Cal-Maine Foods, Inc. (a)(b) | 978,316 | 44,024,220 | ||||||
J&J Snack Foods Corp. | 225,384 | 30,014,387 | ||||||
WD-40 Co. | 256,482 | 28,431,030 | ||||||
| 102,469,637 | ||||||||
Energy (1.8%) | ||||||||
Forum Energy Technologies, Inc. (a) | 2,450,837 | 35,292,053 | ||||||
Financials (12.5%) | ||||||||
AMERISAFE, Inc. | 435,279 | 28,162,551 | ||||||
Boston Private Financial Holdings, Inc. | 2,594,006 | 41,244,695 | ||||||
Glacier Bancorp, Inc. | 1,404,222 | 53,304,267 | ||||||
Univest Corp. of Pennsylvania | 1,534,156 | 44,950,771 | ||||||
WisdomTree Investments, Inc. (b) | 2,267,229 | 25,143,570 | ||||||
WSFS Financial Corp. | 1,060,458 | 52,704,763 | ||||||
| 245,510,617 | ||||||||
Health Care (10.3%) | ||||||||
AMN Healthcare Services, Inc. (a) | 794,877 | 34,895,100 | ||||||
Emergent BioSolutions, Inc. (a) | 1,265,668 | 51,879,731 | ||||||
Globus Medical, Inc., Class A (a) | 1,311,540 | 41,798,780 | ||||||
Prestige Brands Holdings, Inc. (a) | 802,015 | 37,614,504 | ||||||
US Physical Therapy, Inc. | 534,751 | 36,336,330 | ||||||
| 202,524,445 | ||||||||
Industrials (17.4%) | ||||||||
ABM Industries, Inc. | 850,354 | 35,689,357 | ||||||
Actuant Corp., Class A | 1,169,535 | 29,823,142 | ||||||
Beacon Roofing Supply, Inc. (a) | 1,091,425 | 60,475,859 | ||||||
Casella Waste Systems, Inc., Class A (a) | 1,569,897 | 28,980,299 | ||||||
Gibraltar Industries, Inc. (a) | 1,636,153 | 54,402,087 | ||||||
Heartland Express, Inc. | 1,490,084 | 31,783,492 | ||||||
Multi-Color Corp. | 525,177 | 43,432,138 | ||||||
RBC Bearings, Inc. (a) | 243,012 | 30,089,746 | ||||||
US Ecology, Inc. | 568,787 | 27,045,822 | ||||||
| 341,721,942 | ||||||||
Information Technology (17.1%) | ||||||||
Ellie Mae, Inc. (a) | 327,481 | 29,456,916 | ||||||
ExlService Holdings, Inc. (a) | 809,357 | 50,520,064 | ||||||
Fair Isaac Corp. | 303,209 | 44,013,819 | ||||||
Insight Enterprises, Inc. (a) | 1,220,979 | 55,005,104 | ||||||
Littelfuse, Inc. | 191,628 | 40,050,252 | ||||||
Manhattan Associates, Inc. (a) | 915,430 | 38,319,900 | ||||||
OSI Systems, Inc. (a) | 421,126 | 37,219,116 | ||||||
Pegasystems, Inc. | 549,621 | 32,042,904 | ||||||
Rogers Corp. (a) | 62,291 | 9,473,215 | ||||||
| 336,101,290 | ||||||||
Materials (8.8%) | ||||||||
Kaiser Aluminum Corp. | 455,756 | 45,201,880 | ||||||
Neenah Paper, Inc. | 350,162 | 30,394,062 | ||||||
Quaker Chemical Corp. | 268,056 | 41,634,458 | ||||||
Sensient Technologies Corp. | 505,669 | 38,456,127 | ||||||
Silgan Holdings, Inc. | 555,391 | 16,245,187 | ||||||
| 171,931,714 | ||||||||
Real Estate (4.5%) | ||||||||
Healthcare Realty Trust, Inc., REIT | 849,531 | 27,388,879 | ||||||
Marcus & Millichap, Inc. (a) | 1,326,178 | 37,689,978 | ||||||
Physicians Realty Trust, REIT | 1,307,571 | 22,725,584 | ||||||
| 87,804,441 | ||||||||
Telecommunication Services (1.9%) | ||||||||
Shenandoah Telecommunications Co. | 990,141 | 37,625,358 | ||||||
| 1,794,157,388 | ||||||||
Total Common Stocks | 1,893,608,254 | |||||||
SHORT-TERM INVESTMENT (4.6%) | ||||||||
UNITED STATES (4.6%) | ||||||||
State Street Institutional U.S. Government Money Market Fund, Institutional Class, 0.96% (c) | 89,819,216 | 89,819,216 | ||||||
Total Short-Term Investment | 89,819,216 | |||||||
Total Investments | 1,983,427,470 | |||||||
Liabilities in Excess of Other Assets—(1.0)% | (20,471,036 | ) | ||||||
Net Assets—100.0% | $ | 1,962,956,434 | ||||||
| (a) | Non-income producing security. |
| (b) | All or a portion of the securities are on loan. The total value of all securities on loan is $55,982,310. The amount of securities on loan indicated may not correspond with the securities on loan identified because securities with pending sales are in the process of recall from the brokers. See Note 2(k) for additional information. |
| (c) | Registered investment company advised by State Street Global Advisors. The rate shown is the current yield as of October 31, 2017. |
| (d) | See accompanying Notes to Financial Statements for tax unrealized appreciation/(depreciation) of securities. |
| REIT | Real Estate Investment Trust |
See accompanying Notes to Financial Statements.
| 2017 Annual Report | 71 |
Statements of Assets and Liabilities
October 31, 2017
Aberdeen Asia-Pacific (ex-Japan) Equity Fund | Aberdeen China Opportunities Fund | Aberdeen Emerging Markets Fund | Aberdeen Focused U.S. Equity Fund | Aberdeen Global Equity Fund | ||||||||||||||||
Assets: | ||||||||||||||||||||
Investments, at value | $ | 11,128,582 | $ | 13,156,015 | $ | 8,581,236,003 | $ | 24,790,552 | $ | 42,483,394 | ||||||||||
Short-term investments, at value | 57,879 | 17,322 | 126,818,025 | 971,612 | 294,372 | |||||||||||||||
Cash | – | – | – | 13,577,473 | * | – | ||||||||||||||
Foreign currency, at value | 24,123 | 99,009 | 5,421,061 | – | – | |||||||||||||||
Cash at broker for China A shares | – | 1,278 | – | – | – | |||||||||||||||
Receivable for investments sold | 6,991 | 33,103 | 33,805,991 | 2,604,503 | – | |||||||||||||||
Receivable for capital shares issued | 100,100 | 550 | 7,462,004 | 9,373 | 3,174 | |||||||||||||||
Interest and dividends receivable | 9,113 | 7,799 | 4,439,273 | 11,953 | 45,384 | |||||||||||||||
Receivable from Adviser | 11,019 | 12,491 | 326,644 | 7,389 | 25,500 | |||||||||||||||
Tax reclaim receivable | – | – | 985,045 | – | 147,555 | |||||||||||||||
Other receivables | – | – | – | 5,893 | – | |||||||||||||||
Securities lending income receivable | – | 34 | 184 | – | 14 | |||||||||||||||
Prepaid expenses | 29,184 | 36,072 | 225,246 | 27,052 | 32,601 | |||||||||||||||
|
|
|
|
|
|
|
|
|
| |||||||||||
Total assets | 11,366,991 | 13,363,673 | 8,760,719,476 | 42,005,800 | 43,031,994 | |||||||||||||||
|
|
|
|
|
|
|
|
|
| |||||||||||
Liabilities: | ||||||||||||||||||||
Payable for investments purchased | 6,033 | – | 6,749,646 | 3,384,466 | 3,264 | |||||||||||||||
Payable for capital shares redeemed | 7,465 | 10 | 37,003,041 | 48,030 | 54,277 | |||||||||||||||
Payable for dividends on securities sold short | – | – | – | 10,509 | – | |||||||||||||||
Accrued foreign capital gains tax | 7,382 | – | 5,474,285 | – | 31,589 | |||||||||||||||
Securities sold short, at value | – | – | – | 11,665,119 | – | |||||||||||||||
Accrued expenses and other payables: | ||||||||||||||||||||
Investment advisory fees | 9,370 | 14,057 | 6,733,625 | 26,346 | 32,743 | |||||||||||||||
Custodian fees | 4,807 | 296 | 783,584 | 3,637 | 2,850 | |||||||||||||||
Administration fees | 750 | 900 | 598,544 | 1,833 | 2,910 | |||||||||||||||
Sub-transfer agent and administrative services fees | 1,023 | 1,639 | 538,741 | 4,857 | 4,055 | |||||||||||||||
Fund accounting fees | 1,190 | 1,213 | 146,615 | 519 | 3,328 | |||||||||||||||
Transfer agent fees | 10,436 | 6,425 | 115,428 | 6,936 | 12,801 | |||||||||||||||
Legal fees | 157 | 193 | 130,460 | 394 | 582 | |||||||||||||||
Distribution fees | 361 | 4,404 | 101,876 | 4,569 | 10,465 | |||||||||||||||
Printing fees | 1,007 | 310 | 83,030 | 2,100 | 4,086 | |||||||||||||||
Audit fees | 7,750 | 7,750 | 7,750 | 7,750 | 7,750 | |||||||||||||||
Other | 13,169 | 48 | 33,423 | 340 | 7,506 | |||||||||||||||
|
|
|
|
|
|
|
|
|
| |||||||||||
Total liabilities | 70,900 | 37,245 | 58,500,048 | 15,167,405 | 178,206 | |||||||||||||||
|
|
|
|
|
|
|
|
|
| |||||||||||
Net Assets | $ | 11,296,091 | $ | 13,326,428 | $ | 8,702,219,428 | $ | 26,838,395 | $ | 42,853,788 | ||||||||||
|
|
|
|
|
|
|
|
|
| |||||||||||
Cost: | ||||||||||||||||||||
Investments | $ | 9,229,863 | $ | 12,352,617 | $ | 7,304,876,328 | $ | 19,775,862 | $ | 34,932,720 | ||||||||||
Short-term investments | 57,879 | 17,322 | 126,818,025 | 971,612 | 294,372 | |||||||||||||||
Foreign currency | 24,181 | 98,894 | 5,420,839 | – | – | |||||||||||||||
Proceeds: | ||||||||||||||||||||
Securities sold short | $ | – | $ | – | $ | – | $ | 10,314,403 | $ | – | ||||||||||
Represented by: | ||||||||||||||||||||
Capital | $ | 211,835,379 | $ | 13,979,448 | $ | 7,499,882,612 | $ | 18,416,408 | $ | 37,482,496 | ||||||||||
Accumulated net investment income/(loss) | 96,883 | 113,578 | 89,501,434 | (384,866 | ) | 242,353 | ||||||||||||||
Accumulated net realized gain/(loss) from investments and foreign currency transactions | (202,528,405 | ) | (1,570,100 | ) | (157,992,827 | ) | 5,142,879 | (2,389,287 | ) | |||||||||||
Net unrealized appreciation on investments and translation of assets and liabilities denominated in foreign currencies (net of accrued foreign capital gains tax) | 1,892,234 | 803,502 | 1,270,828,209 | 3,663,974 | 7,518,226 | |||||||||||||||
|
|
|
|
|
|
|
|
|
| |||||||||||
Net Assets | $ | 11,296,091 | $ | 13,326,428 | $ | 8,702,219,428 | $ | 26,838,395 | $ | 42,853,788 | ||||||||||
|
|
|
|
|
|
|
|
|
| |||||||||||
Net Assets: | ||||||||||||||||||||
Class A Shares | $ | 1,040,525 | $ | 7,492,193 | $ | 208,083,735 | $ | 9,478,547 | $ | 34,296,066 | ||||||||||
Class C Shares | 266,803 | 2,436,505 | 28,617,936 | 1,836,907 | 2,181,359 | |||||||||||||||
Class R Shares | 13,388 | 1,850,671 | 79,767,493 | 2,269,452 | 3,107,469 | |||||||||||||||
Institutional Service Class Shares | 2,036,068 | 620,217 | 205,880,101 | 840,032 | 570,329 | |||||||||||||||
Institutional Class Shares | 7,939,307 | 926,842 | 8,179,870,163 | 12,413,457 | 2,698,565 | |||||||||||||||
|
|
|
|
|
|
|
|
|
| |||||||||||
Total | $ | 11,296,091 | $ | 13,326,428 | $ | 8,702,219,428 | $ | 26,838,395 | $ | 42,853,788 | ||||||||||
|
|
|
|
|
|
|
|
|
| |||||||||||
| * | The cash amount reported for the Aberdeen Focused U.S. Equity Fund is restricted from investing as it represents the amount due to the prime broker relating to the open short positions at October 31, 2017. |
Amounts listed as “–” are $0 or round to $0.
See accompanying Notes to Financial Statements.
| 72 | Annual Report 2017 |
Statements of Assets and Liabilities (continued)
October 31, 2017
Aberdeen Asia-Pacific (ex-Japan) Equity Fund | Aberdeen China Opportunities Fund | Aberdeen Emerging Markets Fund | Aberdeen Focused U.S. Equity Fund | Aberdeen Global Equity Fund | ||||||||||||||||
Shares Outstanding (unlimited number of shares authorized): | ||||||||||||||||||||
Class A Shares | 77,611 | 333,258 | 13,219,043 | 1,112,637 | 2,339,813 | |||||||||||||||
Class C Shares | 20,232 | 112,838 | 1,840,081 | 435,370 | 158,300 | |||||||||||||||
Class R Shares | 1,004 | 83,869 | 5,109,565 | 288,045 | 221,309 | |||||||||||||||
Institutional Service Class Shares | 151,085 | 27,424 | 13,049,285 | 96,032 | 38,351 | |||||||||||||||
Institutional Class Shares | 588,110 | 40,920 | 517,336,476 | 1,387,596 | 183,690 | |||||||||||||||
|
|
|
|
|
|
|
|
|
| |||||||||||
Total | 838,042 | 598,309 | 550,554,450 | 3,319,680 | 2,941,463 | |||||||||||||||
|
|
|
|
|
|
|
|
|
| |||||||||||
Net asset value and redemption price per share (Net assets by class divided by shares outstanding by class, respectively): | ||||||||||||||||||||
Class A Shares | $ | 13.41 | $ | 22.48 | $ | 15.74 | $ | 8.52 | $ | 14.66 | ||||||||||
Class C Shares (a) | $ | 13.19 | $ | 21.59 | $ | 15.55 | $ | 4.22 | $ | 13.78 | ||||||||||
Class R Shares | $ | 13.33 | $ | 22.07 | $ | 15.61 | $ | 7.88 | $ | 14.04 | ||||||||||
Institutional Service Class Shares | $ | 13.48 | $ | 22.62 | $ | 15.78 | $ | 8.75 | $ | 14.87 | ||||||||||
Institutional Class Shares | $ | 13.50 | $ | 22.65 | $ | 15.81 | $ | 8.95 | $ | 14.69 | ||||||||||
Maximum offering price per share (100%/(100%-maximum sales charge) of net asset value adjusted to the nearest cent): | ||||||||||||||||||||
Class A Shares | $ | 14.23 | $ | 23.85 | $ | 16.70 | $ | 9.04 | $ | 15.55 | ||||||||||
Maximum Sales Charge: | ||||||||||||||||||||
Class A Shares | 5.75 | % | 5.75 | % | 5.75 | % | 5.75 | % | 5.75 | % | ||||||||||
| (a) | For Class C Shares, the redemption price per share is reduced by 1.00% for shares held less than one year. |
See accompanying Notes to Financial Statements.
| 2017 Annual Report | 73 |
Statements of Assets and Liabilities (continued)
October 31, 2017
| Aberdeen International Equity Fund | Aberdeen International Small Cap Fund | Aberdeen Japanese Equities Fund | Aberdeen U.S. Mid Cap Equity Fund | Aberdeen U.S. Multi-Cap Equity Fund | ||||||||||||||||
Assets: | ||||||||||||||||||||
Investments, at value | $ | 509,363,484 | $ | 79,597,948 | $ | 1,444,322 | $ | 1,340,107 | $ | 351,803,157 | ||||||||||
Short-term investments, at value | 22,849,285 | 379,046 | 4,900 | 57,602 | 10,824,334 | |||||||||||||||
Foreign currency, at value | 16,578 | 14,516 | 67 | – | – | |||||||||||||||
Interest and dividends receivable | 626,035 | 61,748 | 6,797 | 235 | 172,399 | |||||||||||||||
Receivable for capital shares issued | 97,722 | 1,608 | – | – | 694 | |||||||||||||||
Receivable from Adviser | 107 | 20,572 | 13,631 | 16,968 | – | |||||||||||||||
Receivable for investments sold | – | – | 8,541 | – | – | |||||||||||||||
Tax reclaim receivable | 872,839 | 17,816 | 215 | – | – | |||||||||||||||
Securities lending income receivable | 498 | 859 | 10 | – | 2 | |||||||||||||||
Prepaid expenses | 38,857 | 37,288 | 37,163 | 23,517 | 49,345 | |||||||||||||||
|
|
|
|
|
|
|
|
|
| |||||||||||
Total assets | 533,865,405 | 80,131,401 | 1,515,646 | 1,438,429 | 362,849,931 | |||||||||||||||
|
|
|
|
|
|
|
|
|
| |||||||||||
Liabilities: | ||||||||||||||||||||
Payable for investments purchased | 41,123 | – | – | – | – | |||||||||||||||
Payable for capital shares redeemed | 197,777 | 2,515 | – | – | 730,692 | |||||||||||||||
Accrued expenses and other payables: | ||||||||||||||||||||
Investment advisory fees | 354,436 | 84,878 | 806 | 896 | 237,330 | |||||||||||||||
Distribution fees | 22,248 | 14,760 | 73 | 27 | 54,621 | |||||||||||||||
Transfer agent fees | 29,783 | 15,074 | 3,579 | 3,861 | 38,784 | |||||||||||||||
Administration fees | 35,444 | 5,432 | 99 | 96 | 24,651 | |||||||||||||||
Sub-transfer agent and administrative services fees | 32,216 | 6,328 | – | 17 | 18,845 | |||||||||||||||
Audit fees | 7,750 | 7,750 | 7,750 | 7,750 | 7,750 | |||||||||||||||
Custodian fees | 17,738 | 10,738 | 216 | 355 | 1,752 | |||||||||||||||
Printing fees | 8,963 | 4,678 | 473 | 475 | 11,630 | |||||||||||||||
Fund accounting fees | 9,464 | 2,246 | 1,012 | 21 | 6,117 | |||||||||||||||
Legal fees | 7,464 | 1,162 | 21 | 19 | 5,102 | |||||||||||||||
Other | 7,248 | 8,108 | – | – | 271 | |||||||||||||||
|
|
|
|
|
|
|
|
|
| |||||||||||
Total liabilities | 771,654 | 163,669 | 14,029 | 13,517 | 1,137,545 | |||||||||||||||
|
|
|
|
|
|
|
|
|
| |||||||||||
Net Assets | $ | 533,093,751 | $ | 79,967,732 | $ | 1,501,617 | $ | 1,424,912 | $ | 361,712,386 | ||||||||||
|
|
|
|
|
|
|
|
|
| |||||||||||
Cost: | ||||||||||||||||||||
Investments | $ | 438,992,812 | $ | 61,604,233 | $ | 1,223,354 | $ | 1,122,964 | $ | 284,376,468 | ||||||||||
Short-term investments | 22,849,285 | 379,046 | 4,900 | 57,602 | 10,824,334 | |||||||||||||||
Foreign currency | 16,439 | 14,473 | 67 | – | – | |||||||||||||||
Represented by: | ||||||||||||||||||||
Capital | $ | 497,104,007 | $ | 60,400,692 | $ | 1,260,131 | $ | 1,079,160 | $ | 257,382,644 | ||||||||||
Accumulated net investment income/(loss) | 5,567,337 | (79,627 | ) | 4,925 | 1,151 | 1,239,601 | ||||||||||||||
Accumulated net realized gain/(loss) from investments and foreign currency transactions | (39,940,796 | ) | 1,653,510 | 15,662 | 127,458 | 35,663,452 | ||||||||||||||
Net unrealized appreciation on investments and translation of assets and liabilities denominated in foreign currencies (net of accrued foreign capital gains tax) | 70,363,203 | 17,993,157 | 220,899 | 217,143 | 67,426,689 | |||||||||||||||
|
|
|
|
|
|
|
|
|
| |||||||||||
Net Assets | $ | 533,093,751 | $ | 79,967,732 | $ | 1,501,617 | $ | 1,424,912 | $ | 361,712,386 | ||||||||||
|
|
|
|
|
|
|
|
|
| |||||||||||
Net Assets: | ||||||||||||||||||||
Class A Shares | $ | 39,618,752 | $ | 59,477,042 | $ | 277,934 | $ | 46,149 | $ | 242,084,816 | ||||||||||
Class C Shares | 12,375,202 | 1,591,308 | 12,129 | 13,457 | 3,543,627 | |||||||||||||||
Class R Shares | 7,334,941 | 1,707,291 | 12,247 | 13,564 | 158,707 | |||||||||||||||
Institutional Service Class Shares | 106,424,289 | 51,339 | 12,364 | 13,678 | 109,418,451 | |||||||||||||||
Institutional Class Shares | 367,340,567 | 17,140,752 | 1,186,943 | 1,338,064 | 6,506,785 | |||||||||||||||
|
|
|
|
|
|
|
|
|
| |||||||||||
Total | $ | 533,093,751 | $ | 79,967,732 | $ | 1,501,617 | $ | 1,424,912 | $ | 361,712,386 | ||||||||||
|
|
|
|
|
|
|
|
|
| |||||||||||
| Amounts | listed as “–” are $0 or round to $0. |
See accompanying Notes to Financial Statements.
| 74 | Annual Report 2017 |
Statements of Assets and Liabilities (continued)
October 31, 2017
| Aberdeen International Equity Fund | Aberdeen International Small Cap Fund | Aberdeen Japanese Equities Fund | Aberdeen U.S. Mid Cap Equity Fund | Aberdeen U.S. Multi-Cap Equity Fund | ||||||||||||||||
Shares Outstanding (unlimited number of shares authorized): | ||||||||||||||||||||
Class A Shares | 2,634,176 | 1,897,405 | 22,869 | 3,457 | 18,548,527 | |||||||||||||||
Class C Shares | 878,241 | 55,292 | 1,009 | 1,019 | 307,286 | |||||||||||||||
Class R Shares | 511,785 | 57,253 | 1,010 | 1,019 | 12,913 | |||||||||||||||
Institutional Service Class Shares | 6,922,536 | 1,628 | 1,014 | 1,022 | 7,933,152 | |||||||||||||||
Institutional Class Shares | 23,804,257 | 545,320 | 97,362 | 100,016 | 470,670 | |||||||||||||||
|
|
|
|
|
|
|
|
|
| |||||||||||
Total | 34,750,995 | 2,556,898 | 123,264 | 106,533 | 27,272,548 | |||||||||||||||
|
|
|
|
|
|
|
|
|
| |||||||||||
Net asset value and redemption price per share (Net assets by class divided by shares outstanding by class, respectively): | ||||||||||||||||||||
Class A Shares | $ | 15.04 | $ | 31.35 | $ | 12.15 | $ | 13.35 | $ | 13.05 | ||||||||||
Class C Shares (a) | $ | 14.09 | $ | 28.78 | $ | 12.02 | $ | 13.21 | $ | 11.53 | ||||||||||
Class R Shares | $ | 14.33 | $ | 29.82 | $ | 12.13 | $ | 13.31 | $ | 12.29 | ||||||||||
Institutional Service Class Shares | $ | 15.37 | $ | 31.54 | $ | 12.19 | $ | 13.38 | $ | 13.79 | ||||||||||
Institutional Class Shares | $ | 15.43 | $ | 31.43 | $ | 12.19 | $ | 13.38 | $ | 13.82 | ||||||||||
Maximum offering price per share (100%/(100%-maximum sales charge) of net asset value adjusted to the nearest cent): | ||||||||||||||||||||
Class A Shares | $ | 15.96 | $ | 33.26 | $ | 12.89 | $ | 14.16 | $ | 13.85 | ||||||||||
Maximum Sales Charge: | ||||||||||||||||||||
Class A Shares | 5.75 | % | 5.75 | % | 5.75 | % | 5.75 | % | 5.75 | % | ||||||||||
| (a) | For Class C Shares, the redemption price per share is reduced by 1.00% for shares held less than one year. |
See accompanying Notes to Financial Statements.
| 2017 Annual Report | 75 |
Statements of Assets and Liabilities (continued)
October 31, 2017
| Aberdeen U.S. Small Cap Equity Fund | ||||
Assets: | ||||
Investments, at value | $ | 1,893,608,254 | ||
Short-term investments, at value | 89,819,216 | |||
Receivable for investments sold | 24,974,883 | |||
Receivable for capital shares issued | 3,311,402 | |||
Interest and dividends receivable | 412,113 | |||
Securities lending income receivable | 62,614 | |||
Prepaid expenses | 89,024 | |||
|
| |||
Total assets | 2,012,277,506 | |||
|
| |||
Liabilities: | ||||
Payable for investments purchased | 42,372,315 | |||
Payable for capital shares redeemed | 4,586,758 | |||
Accrued expenses and other payables: | ||||
Investment advisory fees | 1,503,857 | |||
Sub-transfer agent and administrative services fees | 300,803 | |||
Distribution fees | 157,953 | |||
Administration fees | 133,388 | |||
Printing fees | 113,271 | |||
Transfer agent fees | 75,670 | |||
Fund accounting fees | 29,890 | |||
Legal fees | 26,637 | |||
Custodian fees | 10,203 | |||
Audit fees | 7,750 | |||
Other | 2,577 | |||
|
| |||
Total liabilities | 49,321,072 | |||
|
| |||
Net Assets | $ | 1,962,956,434 | ||
|
| |||
Cost: | ||||
Investments | $ | 1,652,881,527 | ||
Short-term investments | 89,819,216 | |||
Represented by: | ||||
Capital | $ | 1,729,758,383 | ||
Accumulated net investment loss | (4,406,386 | ) | ||
Accumulated net realized loss from investments and foreign currency transactions | (3,122,590 | ) | ||
Net unrealized appreciation on investments and translation of assets and liabilities denominated in foreign currencies (net of accrued foreign capital gains tax) | 240,727,027 | |||
|
| |||
Net Assets | $ | 1,962,956,434 | ||
|
| |||
Net Assets: | ||||
Class A Shares | $ | 316,765,575 | ||
Class C Shares | 95,912,513 | |||
Class R Shares | 20,594,555 | |||
Institutional Service Class Shares | 61,897,148 | |||
Institutional Class Shares | 1,467,786,643 | |||
|
| |||
Total | $ | 1,962,956,434 | ||
|
| |||
See accompanying Notes to Financial Statements.
| 76 | Annual Report 2017 |
Statements of Assets and Liabilities (concluded)
October 31, 2017
| Aberdeen U.S. Small Cap Equity Fund | ||||
Shares Outstanding (unlimited number of shares authorized): | ||||
Class A Shares | 8,895,754 | |||
Class C Shares | 3,100,305 | |||
Class R Shares | 624,726 | |||
Institutional Service Class Shares | 1,649,986 | |||
Institutional Class Shares | 39,146,231 | |||
|
| |||
Total | 53,417,002 | |||
|
| |||
Net asset value and redemption price per share (Net assets by class divided by shares outstanding by class, respectively): | ||||
Class A Shares | $ | 35.61 | ||
Class C Shares (a) | $ | 30.94 | ||
Class R Shares | $ | 32.97 | ||
Institutional Service Class Shares | $ | 37.51 | ||
Institutional Class Shares | $ | 37.49 | ||
Maximum offering price per share (100%/(100%-maximum sales charge) of net asset value adjusted to the nearest cent): | ||||
Class A Shares | $ | 37.78 | ||
Maximum Sales Charge: | ||||
Class A Shares | 5.75 | % | ||
| (a) | For Class C Shares, the redemption price per share is reduced by 1.00% for shares held less than one year. |
Amounts listed as “–” are $0 or round to $0.
See accompanying Notes to Financial Statements.
| 2017 Annual Report | 77 |
Statements of Operations
For the Year Ended October 31, 2017
| Aberdeen Asia-Pacific (ex-Japan) Equity Fund | Aberdeen China Opportunities Fund | Aberdeen Emerging Markets Fund | Aberdeen Focused U.S. Equity Fund | Aberdeen Global Equity Fund | ||||||||||||||||
INVESTMENT INCOME: | ||||||||||||||||||||
Dividend income | $ | 290,775 | $ | 385,942 | $ | 210,837,550 | $ | 599,957 | $ | 2,090,258 | ||||||||||
Interest income | 973 | 1,958 | 907,342 | 5,946 | 9,432 | |||||||||||||||
Securities lending income, net | – | 34 | 184 | – | 14 | |||||||||||||||
Foreign tax withholding | (16,331 | ) | (10,941 | ) | (22,333,359 | ) | (5,556 | ) | (134,134 | ) | ||||||||||
Other income | – | – | 4,261 | 131 | 16,886 | |||||||||||||||
|
|
|
|
|
|
|
|
|
| |||||||||||
| 275,417 | 376,993 | 189,415,978 | 600,478 | 1,982,456 | ||||||||||||||||
|
|
|
|
|
|
|
|
|
| |||||||||||
EXPENSES: | ||||||||||||||||||||
Investment advisory fees | 117,792 | 163,030 | 75,066,418 | 486,377 | 771,657 | |||||||||||||||
Administration fees | 9,423 | 10,434 | 6,672,570 | 33,835 | 68,592 | |||||||||||||||
Distribution fees Class A | 2,118 | 18,155 | 475,171 | 25,370 | 127,186 | |||||||||||||||
Distribution fees Class C | 903 | 26,417 | 256,817 | 25,522 | 24,837 | |||||||||||||||
Distribution fees Class R | 59 | 7,878 | 309,738 | 12,321 | 15,544 | |||||||||||||||
Sub-transfer agent fees Institutional Class | 5,540 | 720 | 3,818,625 | 24,584 | 3,691 | |||||||||||||||
Sub-transfer agent and administrative service fees Class A | 337 | 7,224 | 418,469 | 11,231 | 58,637 | |||||||||||||||
Sub-transfer agent fees Class C | 39 | 3,689 | 50,623 | 4,945 | 5,076 | |||||||||||||||
Sub-transfer agent and administrative service fees Class R | – | 2,997 | 118,219 | 4,873 | 6,517 | |||||||||||||||
Sub-transfer agent and administrative service fees Institutional Service Class | 1,715 | 546 | 554,153 | 1,549 | 554 | |||||||||||||||
Fund accounting fees | 7,329 | 7,464 | 841,593 | 3,880 | 16,352 | |||||||||||||||
Transfer agent fees | 64,113 | 27,444 | 676,199 | 27,837 | 64,550 | |||||||||||||||
Trustee fees | 1,945 | 2,018 | 533,333 | 3,946 | 6,826 | |||||||||||||||
Legal fees | 752 | 830 | 531,271 | 2,865 | 5,466 | |||||||||||||||
Printing fees | 7,390 | 8,133 | 231,690 | 5,140 | 15,402 | |||||||||||||||
Custodian fees | 30,062 | 15,546 | 4,812,387 | 23,034 | 20,353 | |||||||||||||||
Registration and filing fees | 67,436 | 72,664 | 170,894 | 71,250 | 69,613 | |||||||||||||||
Audit fees | 36,150 | 35,150 | 37,150 | 38,150 | 35,150 | |||||||||||||||
Dividend expense for securities sold short | – | – | – | 494,172 | – | |||||||||||||||
Broker related expenses for securities sold short | – | – | – | 37,408 | – | |||||||||||||||
Other | 30,110 | 8,376 | 917,846 | 10,503 | 47,750 | |||||||||||||||
|
|
|
|
|
|
|
|
|
| |||||||||||
Total expenses before reimbursed/waived expenses | 383,213 | 418,715 | 96,493,166 | 1,348,792 | 1,363,753 | |||||||||||||||
Interest expense (Note 9) | 1,240 | 345 | – | 3,795 | 1,120 | |||||||||||||||
|
|
|
|
|
|
|
|
|
| |||||||||||
Total operating expenses before reimbursed/waived expenses | 384,453 | 419,060 | 96,493,166 | 1,352,587 | 1,364,873 | |||||||||||||||
Expenses reimbursed | (230,842 | ) | (144,211 | ) | (2,698,121 | ) | (170,267 | ) | (110,176 | ) | ||||||||||
Broker related expenses for securities sold short reduced by Adviser | – | – | – | (37,408 | ) | – | ||||||||||||||
|
|
|
|
|
|
|
|
|
| |||||||||||
Net expenses | 153,611 | 274,849 | 93,795,045 | 1,144,912 | 1,254,697 | |||||||||||||||
|
|
|
|
|
|
|
|
|
| |||||||||||
Net Investment Income/(Loss) | 121,806 | 102,144 | 95,620,933 | (544,434 | ) | 727,759 | ||||||||||||||
|
|
|
|
|
|
|
|
|
| |||||||||||
REALIZED/UNREALIZED GAIN/(LOSS) FROM INVESTMENTS: | ||||||||||||||||||||
Realized gain/(loss) on investment transactions and securities sold short (including $2,900, $0, $72,218, $0 and $17,039 capital gains tax, respectively) | 107,160 | (871,142 | ) | 9,139,732 | 7,961,954 | 9,116,568 | ||||||||||||||
Realized gain/(loss) on foreign currency transactions | (6,643 | ) | 11,439 | (2,486,532 | ) | (22 | ) | (13,546 | ) | |||||||||||
|
|
|
|
|
|
|
|
|
| |||||||||||
Net realized gain/(loss) from investments and foreign currency transactions | 100,517 | (859,703 | ) | 6,653,200 | 7,961,932 | 9,103,022 | ||||||||||||||
|
|
|
|
|
|
|
|
|
| |||||||||||
Net change in unrealized appreciation/(depreciation) on investment transactions (including $3,787, $0, $5,140,320, $0 and $57,767 change in deferred capital gains tax, respectively) | 2,553,051 | 3,399,241 | 1,304,868,210 | (3,138,765 | ) | 7,238,777 | ||||||||||||||
Net change in unrealized appreciation/(depreciation) on securities sold short | – | – | – | (239,043 | ) | – | ||||||||||||||
Net change in unrealized appreciation/(depreciation) on translation of assets and liabilities denominated in foreign currencies | 112 | (345 | ) | (116,556 | ) | – | 18,070 | |||||||||||||
|
|
|
|
|
|
|
|
|
| |||||||||||
Net change in unrealized appreciation/(depreciation) from investments and translation of assets and liabilities denominated in foreign currencies | 2,553,163 | 3,398,896 | 1,304,751,654 | (3,377,808 | ) | 7,256,847 | ||||||||||||||
|
|
|
|
|
|
|
|
|
| |||||||||||
Net realized/unrealized gain from investments and foreign currency transactions | 2,653,680 | 2,539,193 | 1,311,404,854 | 4,584,124 | 16,359,869 | |||||||||||||||
|
|
|
|
|
|
|
|
|
| |||||||||||
CHANGE IN NET ASSETS RESULTING FROM OPERATIONS | $ | 2,775,486 | $ | 2,641,337 | $ | 1,407,025,787 | $ | 4,039,690 | $ | 17,087,628 | ||||||||||
|
|
|
|
|
|
|
|
|
| |||||||||||
Amounts listed as “–” are $0 or round to $0.
See accompanying Notes to Financial Statements.
| 78 | Annual Report 2017 |
Statements of Operations (continued)
For the Year Ended October 31, 2017
| Aberdeen International Equity Fund | Aberdeen International Small Cap Fund | Aberdeen Japanese Equities Fund | Aberdeen U.S. Mid Cap Equity Fund | Aberdeen U.S. Multi-Cap Equity Fund | ||||||||||||||||
INVESTMENT INCOME: | ||||||||||||||||||||
Dividend income | $ | 12,937,330 | $ | 1,588,625 | $ | 21,457 | $ | 15,821 | $ | 5,281,441 | ||||||||||
Interest income | 66,078 | 10,271 | 166 | 172 | 48,486 | |||||||||||||||
Securities lending income, net | 498 | 859 | 10 | – | 817 | |||||||||||||||
Foreign tax withholding | (984,288 | ) | (89,093 | ) | (3,200 | ) | (240 | ) | (46,902 | ) | ||||||||||
Other income | 2,893 | 249 | – | – | 233 | |||||||||||||||
|
|
|
|
|
|
|
|
|
| |||||||||||
| 12,022,511 | 1,510,911 | 18,433 | 15,753 | 5,284,075 | ||||||||||||||||
|
|
|
|
|
|
|
|
|
| |||||||||||
EXPENSES: | ||||||||||||||||||||
Investment advisory fees | 3,920,621 | 933,092 | 7,828 | 9,489 | 2,680,764 | |||||||||||||||
Administration fees | 392,062 | 59,718 | 963 | 1,012 | 285,948 | |||||||||||||||
Distribution fees Class A | 109,369 | 133,315 | 254 | 73 | 592,592 | |||||||||||||||
Distribution fees Class C | 134,483 | 17,900 | 110 | 123 | 49,169 | |||||||||||||||
Distribution fees Class R | 37,499 | 6,717 | 56 | 62 | 1,241 | |||||||||||||||
Sub-transfer agent and administrative service fees Class A | 58,657 | 41,491 | 53 | – | 92,826 | |||||||||||||||
Sub-transfer agent fees Institutional Class | 73,335 | 10,009 | 1 | – | 2,743 | |||||||||||||||
Sub-transfer agent fees Class C | 24,588 | 1,831 | – | – | 6,067 | |||||||||||||||
Sub-transfer agent and administrative service fees Class R | 14,615 | 2,579 | – | – | 447 | |||||||||||||||
Sub-transfer agent and administrative service fees Institutional Service Class | 80,427 | 98 | – | – | 90,532 | |||||||||||||||
Fund accounting fees | 54,650 | 13,570 | 6,275 | 124 | 35,674 | |||||||||||||||
Transfer agent fees | 163,180 | 77,611 | 11,453 | 13,176 | 212,152 | |||||||||||||||
Trustee fees | 32,487 | 5,928 | 1,284 | 1,290 | 24,061 | |||||||||||||||
Legal fees | 31,043 | 5,015 | – | 172 | 22,789 | |||||||||||||||
Printing fees | 25,680 | 18,107 | 3,163 | 3,040 | 34,314 | |||||||||||||||
Custodian fees | 104,214 | 46,551 | 4,044 | 2,787 | 14,367 | |||||||||||||||
Registration and filing fees | 76,037 | 76,332 | 65,423 | 80,159 | 71,485 | |||||||||||||||
Audit fees | 35,150 | 37,150 | 38,150 | 35,150 | 34,150 | |||||||||||||||
Other | 73,254 | 24,173 | 1,889 | 3,813 | 42,750 | |||||||||||||||
|
|
|
|
|
|
|
|
|
| |||||||||||
Total expenses before reimbursed/waived expenses | 5,441,351 | 1,511,187 | 140,946 | 150,470 | 4,294,071 | |||||||||||||||
Interest expense (Note 9) | – | 614 | – | – | 427 | |||||||||||||||
|
|
|
|
|
|
|
|
|
| |||||||||||
Total operating expenses before reimbursed/waived expenses | 5,441,351 | 1,511,801 | 140,946 | 150,470 | 4,294,498 | |||||||||||||||
Expenses reimbursed | (11,298 | ) | (338,671 | ) | (128,431 | ) | (137,558 | ) | (250,349 | ) | ||||||||||
|
|
|
|
|
|
|
|
|
| |||||||||||
Net expenses | 5,430,053 | 1,173,130 | 12,515 | 12,912 | 4,044,149 | |||||||||||||||
|
|
|
|
|
|
|
|
|
| |||||||||||
Net Investment Income | 6,592,458 | 337,781 | 5,918 | 2,841 | 1,239,926 | |||||||||||||||
|
|
|
|
|
|
|
|
|
| |||||||||||
REALIZED/UNREALIZED GAIN/(LOSS) FROM INVESTMENTS: | ||||||||||||||||||||
Realized gain on investment transactions and securities sold short (including $0, $0, $2,210, $0 and $0 capital gains tax, respectively) | 3,434,796 | 2,713,512 | 15,662 | 127,459 | 38,843,808 | |||||||||||||||
Realized gain/(loss) on foreign currency transactions | (125,923 | ) | (39,764 | ) | (992 | ) | (122 | ) | 53 | |||||||||||
|
|
|
|
|
|
|
|
|
| |||||||||||
Net realized gain from investments and foreign currency transactions | 3,308,873 | 2,673,748 | 14,670 | 127,337 | 38,843,861 | |||||||||||||||
|
|
|
|
|
|
|
|
|
| |||||||||||
Net change in unrealized appreciation on investment transactions (including $392,845, $35,883, $0, $0 and $0 change in deferred capital gains tax, respectively) | 81,567,398 | 11,809,415 | 129,900 | 144,525 | 28,261,064 | |||||||||||||||
Net change in unrealized appreciation on translation of assets and liabilities denominated in foreign currencies | 91,208 | 8,597 | 178 | – | – | |||||||||||||||
|
|
|
|
|
|
|
|
|
| |||||||||||
Net change in unrealized appreciation from investments and translation of assets and liabilities denominated in foreign currencies | 81,658,606 | 11,818,012 | 130,078 | 144,525 | 28,261,064 | |||||||||||||||
|
|
|
|
|
|
|
|
|
| |||||||||||
Net realized/unrealized gain from investments and foreign currency transactions | 84,967,479 | 14,491,760 | 144,748 | 271,862 | 67,104,925 | |||||||||||||||
|
|
|
|
|
|
|
|
|
| |||||||||||
CHANGE IN NET ASSETS RESULTING FROM OPERATIONS | $ | 91,559,937 | $ | 14,829,541 | $ | 150,666 | $ | 274,703 | $ | 68,344,851 | ||||||||||
|
|
|
|
|
|
|
|
|
| |||||||||||
Amounts listed as “–” are $0 or round to $0.
See accompanying Notes to Financial Statements.
| 2017 Annual Report | 79 |
Statements of Operations (concluded)
For the Year Ended October 31, 2017
| Aberdeen U.S. Small Cap Equity Fund | ||||
INVESTMENT INCOME: | ||||
Dividend income | $ | 18,417,612 | ||
Interest income | 277,047 | |||
Securities lending income, net | 175,025 | |||
Foreign tax withholding | (353,375 | ) | ||
Other income | 21,871 | |||
|
| |||
| 18,538,180 | ||||
|
| |||
EXPENSES: | ||||
Investment advisory fees | 14,401,746 | |||
Administration fees | 1,425,175 | |||
Distribution fees Class A | 822,370 | |||
Distribution fees Class C | 966,859 | |||
Distribution fees Class R | 95,528 | |||
Sub-transfer agent fees Institutional Class | 1,305,946 | |||
Sub-transfer agent and administrative service fees Class A | 461,897 | |||
Sub-transfer agent fees Class C | 104,243 | |||
Sub-transfer agent and administrative service fees Class R | 42,324 | |||
Sub-transfer agent and administrative service fees Institutional Service Class | 84,207 | |||
Fund accounting fees | 179,220 | |||
Transfer agent fees | 469,375 | |||
Trustee fees | 118,969 | |||
Legal fees | 112,929 | |||
Printing fees | 356,323 | |||
Custodian fees | 66,389 | |||
Registration and filing fees | 189,845 | |||
Audit fees | 35,150 | |||
Other | 182,228 | |||
|
| |||
Total expenses before reimbursed/waived expenses | 21,420,723 | |||
Interest expense (Note 9) | – | |||
|
| |||
Total operating expenses before reimbursed/waived expenses | 21,420,723 | |||
Expenses reimbursed | – | |||
Recoupment of expenses previously reimbursed | 157,239 | |||
|
| |||
Net expenses | 21,577,962 | |||
|
| |||
Net Investment Loss | (3,039,782 | ) | ||
|
| |||
REALIZED/UNREALIZED GAIN/(LOSS) FROM INVESTMENTS: | ||||
Realized gain on investment transactions and securities sold short (including $0 capital gains tax) | 115,705,263 | |||
Realized gain/(loss) on foreign currency transactions | 17,894 | |||
|
| |||
Net realized gain from investments and foreign currency transactions | 115,723,157 | |||
|
| |||
Net change in unrealized appreciation on investment transactions (including $0 change in deferred capital gains tax) | 224,842,096 | |||
Net change in unrealized appreciation on translation of assets and liabilities denominated in foreign currencies | 300 | |||
|
| |||
Net change in unrealized appreciation from investments and translation of assets and liabilities denominated in foreign currencies | 224,842,396 | |||
|
| |||
Net realized/unrealized gain from investments and foreign currency transactions | 340,565,553 | |||
|
| |||
CHANGE IN NET ASSETS RESULTING FROM OPERATIONS | $ | 337,525,771 | ||
|
| |||
Amounts listed as “–” are $0 or round to $0.
See accompanying Notes to Financial Statements.
| 80 | Annual Report 2017 |
Statements of Changes in Net Assets
| Aberdeen Asia-Pacific (ex-Japan) Equity Fund | Aberdeen China Opportunities Fund | Aberdeen Emerging Markets Fund | ||||||||||||||||||||||
| Year Ended October 31, 2017 | Year Ended October 31, 2016 | Year Ended October 31, 2017 | Year Ended October 31, 2016 | Year Ended October 31, 2017 | Year Ended October 31, 2016 | |||||||||||||||||||
FROM INVESTMENT ACTIVITIES: | ||||||||||||||||||||||||
Operations: | ||||||||||||||||||||||||
Net investment income | $ | 121,806 | $ | 377,438 | $ | 102,144 | $ | 141,612 | $ | 95,620,933 | $ | 93,655,335 | ||||||||||||
Net realized gain/(loss) from investments and foreign currency transactions | 100,517 | (57,079,476 | ) | (859,703 | ) | (529,031 | ) | 6,653,200 | (151,861,104 | ) | ||||||||||||||
Net change in unrealized appreciation on investments and translation of assets and liabilities denominated in foreign currencies | 2,553,163 | 38,818,643 | 3,398,896 | 636,697 | 1,304,751,654 | 918,290,882 | ||||||||||||||||||
|
|
|
|
|
|
|
|
|
|
|
| |||||||||||||
Changes in net assets resulting from operations | 2,775,486 | (17,883,395 | ) | 2,641,337 | 249,278 | 1,407,025,787 | 860,085,113 | |||||||||||||||||
|
|
|
|
|
|
|
|
|
|
|
| |||||||||||||
Distributions to Shareholders From: | ||||||||||||||||||||||||
Net investment income: | ||||||||||||||||||||||||
Class A | – | (16,922 | ) | (72,703 | ) | – | (1,481,671 | ) | (41,210 | ) | ||||||||||||||
Class C | – | (3,733 | ) | – | – | (51,789 | ) | – | ||||||||||||||||
Class R | – | (202 | ) | (10,909 | ) | – | (348,298 | ) | – | |||||||||||||||
Institutional Service Class | – | (85,963 | ) | (8,632 | ) | – | (3,210,803 | ) | (223,421 | ) | ||||||||||||||
Institutional Class | – | (1,884,305 | ) | (10,628 | ) | – | (84,335,789 | ) | (9,182,602 | ) | ||||||||||||||
Net realized gains: | ||||||||||||||||||||||||
Class A | – | – | – | – | – | (1,899,998 | ) | |||||||||||||||||
Class C | – | – | – | – | – | (291,887 | ) | |||||||||||||||||
Class R | – | – | – | – | – | (376,083 | ) | |||||||||||||||||
Institutional Service Class | – | – | – | – | – | (4,386,207 | ) | |||||||||||||||||
Institutional Class | – | – | – | – | – | (72,844,239 | ) | |||||||||||||||||
|
|
|
|
|
|
|
|
|
|
|
| |||||||||||||
Change in net assets from shareholder distributions | – | (1,991,125 | ) | (102,872 | ) | – | (89,428,350 | ) | (89,245,647 | ) | ||||||||||||||
|
|
|
|
|
|
|
|
|
|
|
| |||||||||||||
Common Stock Transactions: | ||||||||||||||||||||||||
Change in net assets from capital transactions | (6,143,973 | ) | (233,758,952 | ) | (3,809,988 | ) | (2,505,324 | ) | (575,877,933 | ) | (439,710,802 | ) | ||||||||||||
|
|
|
|
|
|
|
|
|
|
|
| |||||||||||||
Change in net assets | (3,368,487 | ) | (253,633,472 | ) | (1,271,523 | ) | (2,256,046 | ) | 741,719,504 | 331,128,664 | ||||||||||||||
|
|
|
|
|
|
|
|
|
|
|
| |||||||||||||
Net Assets: | ||||||||||||||||||||||||
Beginning of year | 14,664,578 | 268,298,050 | 14,597,951 | 16,853,997 | 7,960,499,924 | 7,629,371,260 | ||||||||||||||||||
|
|
|
|
|
|
|
|
|
|
|
| |||||||||||||
End of year | $ | 11,296,091 | $ | 14,664,578 | $ | 13,326,428 | $ | 14,597,951 | $ | 8,702,219,428 | $ | 7,960,499,924 | ||||||||||||
|
|
|
|
|
|
|
|
|
|
|
| |||||||||||||
Accumulated net investment income/(loss) at end of year | $ | 96,883 | $ | (40,623 | ) | $ | 113,578 | $ | 102,867 | $ | 89,501,434 | $ | 75,601,133 | |||||||||||
|
|
|
|
|
|
|
|
|
|
|
| |||||||||||||
Amounts listed as “–” are $0 or round to $0.
See accompanying Notes to Financial Statements.
| 2017 Annual Report | 81 |
Statements of Changes in Net Assets (continued)
| Aberdeen Asia-Pacific (ex-Japan) Equity Fund | Aberdeen China Opportunities Fund | Aberdeen Emerging Markets Fund | ||||||||||||||||||||||
| Year Ended October 31, 2017 | Year Ended October 31, 2016 | Year Ended October 31, 2017 | Year Ended October 31, 2016 | Year Ended October 31, 2017 | Year Ended October 31, 2016 | |||||||||||||||||||
CAPITAL TRANSACTIONS: | ||||||||||||||||||||||||
Class A Shares | ||||||||||||||||||||||||
Proceeds from shares issued | $ | 189,725 | $ | 38,861 | $ | 1,152,279 | $ | 636,823 | $ | 52,739,091 | $ | 58,965,715 | ||||||||||||
Dividends reinvested | – | 16,568 | 52,296 | – | 1,185,696 | 1,571,397 | ||||||||||||||||||
Cost of shares redeemed | (108,493 | ) | (154,383 | ) | (2,440,453 | ) | (1,687,795 | ) | (62,742,101 | ) | (81,048,004 | ) | ||||||||||||
|
|
|
|
|
|
|
|
|
|
|
| |||||||||||||
Total Class A | 81,232 | (98,954 | ) | (1,235,878 | ) | (1,050,972 | ) | (8,817,314 | ) | (20,510,892 | ) | |||||||||||||
|
|
|
|
|
|
|
|
|
|
|
| |||||||||||||
Class C Shares | ||||||||||||||||||||||||
Proceeds from shares issued | 215,826 | – | 228,665 | 15,290 | 6,990,946 | 4,616,819 | ||||||||||||||||||
Dividends reinvested | – | 3,733 | – | – | 35,609 | 187,431 | ||||||||||||||||||
Cost of shares redeemed | (29,512 | ) | (236,746 | ) | (1,908,843 | ) | (1,120,967 | ) | (7,356,666 | ) | (12,524,842 | ) | ||||||||||||
|
|
|
|
|
|
|
|
|
|
|
| |||||||||||||
Total Class C | 186,314 | (233,013 | ) | (1,680,178 | ) | (1,105,677 | ) | (330,111 | ) | (7,720,592 | ) | |||||||||||||
|
|
|
|
|
|
|
|
|
|
|
| |||||||||||||
Class R Shares | ||||||||||||||||||||||||
Proceeds from shares issued | – | – | 602,537 | 677,628 | 26,866,922 | 14,700,499 | ||||||||||||||||||
Dividends reinvested | – | 202 | 8,749 | – | 314,211 | 332,795 | ||||||||||||||||||
Cost of shares redeemed | – | – | (454,181 | ) | (642,740 | ) | (5,003,437 | ) | (5,898,234 | ) | ||||||||||||||
|
|
|
|
|
|
|
|
|
|
|
| |||||||||||||
Total Class R | – | 202 | 157,105 | 34,888 | 22,177,696 | 9,135,060 | ||||||||||||||||||
|
|
|
|
|
|
|
|
|
|
|
| |||||||||||||
Institutional Service Class Shares | ||||||||||||||||||||||||
Proceeds from shares issued | 84,651 | 244,495 | 41,047 | 1,480 | 28,706,149 | 31,912,767 | ||||||||||||||||||
Dividends reinvested | – | 39,664 | 8,463 | – | 3,210,247 | 4,609,403 | ||||||||||||||||||
Cost of shares redeemed | (2,785,936 | ) | (193,769 | ) | (286,571 | ) | (108,203 | ) | (203,993,186 | ) | (151,486,664 | ) | ||||||||||||
|
|
|
|
|
|
|
|
|
|
|
| |||||||||||||
Total Institutional Service Class | (2,701,285 | ) | 90,390 | (237,061 | ) | (106,723 | ) | (172,076,790 | ) | (114,964,494 | ) | |||||||||||||
|
|
|
|
|
|
|
|
|
|
|
| |||||||||||||
Institutional Class Shares | ||||||||||||||||||||||||
Proceeds from shares issued | 834,777 | 4,160,163 | 1,399,308 | 200,063 | 1,713,068,009 | 2,143,126,393 | ||||||||||||||||||
Dividends reinvested | – | 1,258,158 | 6,680 | – | 64,624,339 | 64,842,955 | ||||||||||||||||||
Cost of shares redeemed | (4,545,011 | ) | (238,935,898 | ) | (2,219,964 | ) | (476,903 | ) | (2,194,523,762 | ) | (2,513,619,232 | ) | ||||||||||||
|
|
|
|
|
|
|
|
|
|
|
| |||||||||||||
Total Institutional Class | (3,710,234 | ) | (233,517,577 | ) | (813,976 | ) | (276,840 | ) | (416,831,414 | ) | (305,649,884 | ) | ||||||||||||
|
|
|
|
|
|
|
|
|
|
|
| |||||||||||||
Change in net assets from capital transactions: | $ | (6,143,973 | ) | $ | (233,758,952 | ) | $ | (3,809,988 | ) | $ | (2,505,324 | ) | $ | (575,877,933 | ) | $ | (439,710,802 | ) | ||||||
|
|
|
|
|
|
|
|
|
|
|
| |||||||||||||
Amounts listed as “–” are $0 or round to $0.
See accompanying Notes to Financial Statements.
| 82 | Annual Report 2017 |
Statements of Changes in Net Assets (continued)
| Aberdeen Asia-Pacific (ex-Japan) Equity Fund | Aberdeen China Opportunities Fund | Aberdeen Emerging Markets Fund | ||||||||||||||||||||||
| Year Ended October 31, 2017 | Year Ended October 31, 2016 | Year Ended October 31, 2017 | Year Ended October 31, 2016 | Year Ended October 31, 2017 | Year Ended October 31, 2016 | |||||||||||||||||||
SHARE TRANSACTIONS: | ||||||||||||||||||||||||
Class A Shares | ||||||||||||||||||||||||
Issued | 15,917 | 4,064 | 55,342 | 36,700 | 3,732,112 | 4,810,446 | ||||||||||||||||||
Reinvested | – | 1,805 | 3,012 | – | 96,713 | 138,817 | ||||||||||||||||||
Redeemed | (9,623 | ) | (15,712 | ) | (120,690 | ) | (99,417 | ) | (4,529,942 | ) | (6,738,498 | ) | ||||||||||||
|
|
|
|
|
|
|
|
|
|
|
| |||||||||||||
Total Class A Shares | 6,294 | (9,843 | ) | (62,336 | ) | (62,717 | ) | (701,117 | ) | (1,789,235 | ) | |||||||||||||
|
|
|
|
|
|
|
|
|
|
|
| |||||||||||||
Class C Shares | ||||||||||||||||||||||||
Issued | 17,639 | – | 11,471 | 932 | 489,143 | 378,269 | ||||||||||||||||||
Reinvested | – | 407 | – | – | 2,926 | 16,690 | ||||||||||||||||||
Redeemed | (2,980 | ) | (22,815 | ) | (103,192 | ) | (69,270 | ) | (528,671 | ) | (1,060,045 | ) | ||||||||||||
|
|
|
|
|
|
|
|
|
|
|
| |||||||||||||
Total Class C Shares | 14,659 | (22,408 | ) | (91,721 | ) | (68,338 | ) | (36,602 | ) | (665,086 | ) | |||||||||||||
|
|
|
|
|
|
|
|
|
|
|
| |||||||||||||
Class R Shares | ||||||||||||||||||||||||
Issued | – | – | 30,329 | 40,319 | 1,913,112 | 1,203,088 | ||||||||||||||||||
Reinvested | – | 22 | 512 | – | 25,797 | 29,556 | ||||||||||||||||||
Redeemed | – | – | (22,985 | ) | (37,453 | ) | (360,090 | ) | (486,611 | ) | ||||||||||||||
|
|
|
|
|
|
|
|
|
|
|
| |||||||||||||
Total Class R Shares | – | 22 | 7,856 | 2,866 | 1,578,819 | 746,033 | ||||||||||||||||||
|
|
|
|
|
|
|
|
|
|
|
| |||||||||||||
Institutional Service Class Shares | ||||||||||||||||||||||||
Issued | 7,176 | 23,765 | 2,039 | 86 | 1,952,623 | 2,921,150 | ||||||||||||||||||
Reinvested | – | 4,311 | 485 | – | 261,847 | 407,191 | ||||||||||||||||||
Redeemed | (263,641 | ) | (19,800 | ) | (14,724 | ) | (6,284 | ) | (13,812,530 | ) | (12,173,715 | ) | ||||||||||||
|
|
|
|
|
|
|
|
|
|
|
| |||||||||||||
Total Institutional Service Class Shares | (256,465 | ) | 8,276 | (12,200 | ) | (6,198 | ) | (11,598,060 | ) | (8,845,374 | ) | |||||||||||||
|
|
|
|
|
|
|
|
|
|
|
| |||||||||||||
Institutional Class Shares | ||||||||||||||||||||||||
Issued | 67,265 | 443,254 | 73,512 | 11,939 | 122,237,902 | 179,357,250 | ||||||||||||||||||
Reinvested | – | 136,608 | 383 | – | 5,266,857 | 5,728,176 | ||||||||||||||||||
Redeemed | (386,939 | ) | (25,805,089 | ) | (117,761 | ) | (27,406 | ) | (152,745,541 | ) | (211,608,136 | ) | ||||||||||||
|
|
|
|
|
|
|
|
|
|
|
| |||||||||||||
Total Institutional Class Shares | (319,674 | ) | (25,225,227 | ) | (43,866 | ) | (15,467 | ) | (25,240,782 | ) | (26,522,710 | ) | ||||||||||||
|
|
|
|
|
|
|
|
|
|
|
| |||||||||||||
Total change in shares: | (555,186 | ) | (25,249,180 | ) | (202,267 | ) | (149,854 | ) | (35,997,742 | ) | (37,076,372 | ) | ||||||||||||
|
|
|
|
|
|
|
|
|
|
|
| |||||||||||||
Amounts listed as “–” are $0 or round to $0.
See accompanying Notes to Financial Statements.
| 2017 Annual Report | 83 |
Statements of Changes in Net Assets (continued)
| Aberdeen Focused U.S. Equity Fund | Aberdeen Global Equity Fund | Aberdeen International Equity Fund | ||||||||||||||||||||||
| Year Ended October 31, 2017 | Year Ended October 31, 2016 | Year Ended October 31, 2017 | Year Ended October 31, 2016 | Year Ended October 31, 2017 | Year Ended October 31, 2016 | |||||||||||||||||||
FROM INVESTMENT ACTIVITIES: | ||||||||||||||||||||||||
Operations: | ||||||||||||||||||||||||
Net investment income/(loss) | $ | (544,434 | ) | $ | (1,386,505 | ) | $ | 727,759 | $ | 854,636 | $ | 6,592,458 | $ | 8,043,904 | ||||||||||
Net realized gain/(loss) from investments and foreign currency transactions | 7,961,932 | 8,305,077 | 9,103,022 | (1,042,768 | ) | 3,308,873 | (38,630,494 | ) | ||||||||||||||||
Net change in unrealized appreciation/(depreciation) on investments and translation of assets and liabilities denominated in foreign currencies | (3,377,808 | ) | (8,792,526 | ) | 7,256,847 | 2,181,772 | 81,658,606 | 30,908,013 | ||||||||||||||||
|
|
|
|
|
|
|
|
|
|
|
| |||||||||||||
Changes in net assets resulting from operations | 4,039,690 | (1,873,954 | ) | 17,087,628 | 1,993,640 | 91,559,937 | 321,423 | |||||||||||||||||
|
|
|
|
|
|
|
|
|
|
|
| |||||||||||||
Distributions to Shareholders From: | ||||||||||||||||||||||||
Net investment income: | ||||||||||||||||||||||||
Class A | – | – | (409,109 | ) | (148,771 | ) | (594,323 | ) | (256,405 | ) | ||||||||||||||
Class C | – | – | (13,245 | ) | (1,764 | ) | (85,811 | ) | (23,654 | ) | ||||||||||||||
Class R | – | – | (27,516 | ) | (2,908 | ) | (81,487 | ) | (31,721 | ) | ||||||||||||||
Institutional Service Class | – | – | (6,791 | ) | (4 | ) | (1,623,239 | ) | (508,720 | ) | ||||||||||||||
Institutional Class | – | – | (364,408 | ) | (112,925 | ) | (5,095,583 | ) | (1,114,495 | ) | ||||||||||||||
Net realized gains: | ||||||||||||||||||||||||
Class A | (1,313,126 | ) | (2,108,773 | ) | – | – | – | – | ||||||||||||||||
Class C | (710,750 | ) | (1,068,641 | ) | – | – | – | – | ||||||||||||||||
Class R | (329,447 | ) | (422,735 | ) | – | – | – | – | ||||||||||||||||
Institutional Service Class | (80,401 | ) | (78,807 | ) | – | – | – | – | ||||||||||||||||
Institutional Class | (5,697,016 | ) | (11,086,196 | ) | – | – | – | – | ||||||||||||||||
|
|
|
|
|
|
|
|
|
|
|
| |||||||||||||
Change in net assets from shareholder distributions | (8,130,740 | ) | (14,765,152 | ) | (821,069 | ) | (266,372 | ) | (7,480,443 | ) | (1,934,995 | ) | ||||||||||||
|
|
|
|
|
|
|
|
|
|
|
| |||||||||||||
Common Stock Transactions: | ||||||||||||||||||||||||
Change in net assets from capital transactions | (39,750,103 | ) | (33,908,882 | ) | (60,773,721 | ) | (6,961,159 | ) | (9,083,114 | ) | (158,316,614 | ) | ||||||||||||
|
|
|
|
|
|
|
|
|
|
|
| |||||||||||||
Change in net assets | (43,841,153 | ) | (50,547,988 | ) | (44,507,162 | ) | (5,233,891 | ) | 74,996,380 | (159,930,186 | ) | |||||||||||||
|
|
|
|
|
|
|
|
|
|
|
| |||||||||||||
Net Assets: | ||||||||||||||||||||||||
Beginning of year | 70,679,548 | 121,227,536 | 87,360,950 | 92,594,841 | 458,097,371 | 618,027,557 | ||||||||||||||||||
|
|
|
|
|
|
|
|
|
|
|
| |||||||||||||
End of year | $ | 26,838,395 | $ | 70,679,548 | $ | 42,853,788 | $ | 87,360,950 | $ | 533,093,751 | $ | 458,097,371 | ||||||||||||
|
|
|
|
|
|
|
|
|
|
|
| |||||||||||||
Accumulated net investment income/(loss) at end of year | $ | (384,866 | ) | $ | (1,081,442 | ) | $ | 242,353 | $ | 641,885 | $ | 5,567,337 | $ | 6,581,245 | ||||||||||
|
|
|
|
|
|
|
|
|
|
|
| |||||||||||||
Amounts listed as “–” are $0 or round to $0.
See accompanying Notes to Financial Statements.
| 84 | Annual Report 2017 |
Statements of Changes in Net Assets (continued)
| Aberdeen Focused U.S. Equity Fund | Aberdeen Global Equity Fund | Aberdeen International Equity Fund | ||||||||||||||||||||||
| Year Ended October 31, 2017 | Year Ended October 31, 2016 | Year Ended October 31, 2017 | Year Ended October 31, 2016 | Year Ended October 31, 2017 | Year Ended October 31, 2016 | |||||||||||||||||||
CAPITAL TRANSACTIONS: | ||||||||||||||||||||||||
Class A Shares | ||||||||||||||||||||||||
Proceeds from shares issued | $ | 1,638,105 | $ | 2,759,203 | $ | 2,972,034 | $ | 4,537,758 | $ | 9,090,986 | $ | 25,523,814 | ||||||||||||
Proceeds of shares issued in connection with fund merger | – | – | 8,732,862 | – | – | – | ||||||||||||||||||
Dividends reinvested | 1,085,391 | 1,729,534 | 376,258 | 142,616 | 514,894 | 197,190 | ||||||||||||||||||
Cost of shares redeemed | (4,269,568 | ) | (7,567,474 | ) | (35,583,933 | ) | (15,955,649 | ) | (24,986,938 | ) | (67,763,373 | ) | ||||||||||||
|
|
|
|
|
|
|
|
|
|
|
| |||||||||||||
Total Class A | (1,546,072 | ) | (3,078,737 | ) | (23,502,779 | ) | (11,275,275 | ) | (15,381,058 | ) | (42,042,369 | ) | ||||||||||||
|
|
|
|
|
|
|
|
|
|
|
| |||||||||||||
Class C Shares | ||||||||||||||||||||||||
Proceeds from shares issued | 323,903 | 554,407 | 77,042 | 215,386 | 621,287 | 768,809 | ||||||||||||||||||
Proceeds of shares issued in connection with fund merger | – | – | 1,432,891 | – | – | – | ||||||||||||||||||
Dividends reinvested | 400,441 | 555,252 | 7,308 | 903 | 63,239 | 15,675 | ||||||||||||||||||
Cost of shares redeemed | (1,833,234 | ) | (3,921,692 | ) | (1,312,269 | ) | (470,429 | ) | (4,988,505 | ) | (9,210,419 | ) | ||||||||||||
|
|
|
|
|
|
|
|
|
|
|
| |||||||||||||
Total Class C | (1,108,890 | ) | (2,812,033 | ) | 204,972 | (254,140 | ) | (4,303,979 | ) | (8,425,935 | ) | |||||||||||||
|
|
|
|
|
|
|
|
|
|
|
| |||||||||||||
Class R Shares | ||||||||||||||||||||||||
Proceeds from shares issued | 370,353 | 524,352 | 593,383 | 847,398 | 1,557,602 | 3,815,917 | ||||||||||||||||||
Proceeds of shares issued in connection with fund merger | – | – | 2,166,589 | – | – | – | ||||||||||||||||||
Dividends reinvested | 329,447 | 422,735 | 13,090 | 1,954 | 63,546 | 25,349 | ||||||||||||||||||
Cost of shares redeemed | (952,724 | ) | (1,028,877 | ) | (1,621,041 | ) | (990,969 | ) | (3,191,931 | ) | (9,972,641 | ) | ||||||||||||
|
|
|
|
|
|
|
|
|
|
|
| |||||||||||||
Total Class R | (252,924 | ) | (81,790 | ) | 1,152,021 | (141,617 | ) | (1,570,783 | ) | (6,131,375 | ) | |||||||||||||
|
|
|
|
|
|
|
|
|
|
|
| |||||||||||||
Institutional Service Class Shares | ||||||||||||||||||||||||
Proceeds from shares issued | 281,733 | 641,210 | – | – | 5,183,873 | 8,867,501 | ||||||||||||||||||
Proceeds of shares issued in connection with fund merger | – | – | 624,420 | – | – | – | ||||||||||||||||||
Dividends reinvested | 80,401 | 78,807 | 6,781 | – | 1,555,578 | 494,160 | ||||||||||||||||||
Cost of shares redeemed | (209,619 | ) | (721,684 | ) | (180,620 | ) | – | (19,212,691 | ) | (62,712,882 | ) | |||||||||||||
|
|
|
|
|
|
|
|
|
|
|
| |||||||||||||
Total Institutional Service Class | 152,515 | (1,667 | ) | 450,581 | – | (12,473,240 | ) | (53,351,221 | ) | |||||||||||||||
|
|
|
|
|
|
|
|
|
|
|
| |||||||||||||
Institutional Class Shares | ||||||||||||||||||||||||
Proceeds from shares issued | 8,412,055 | 34,050,649 | 7,518,659 | 10,245,231 | 65,995,458 | 54,535,342 | ||||||||||||||||||
Proceeds of shares issued in connection with fund merger | – | – | 582,702 | – | – | – | ||||||||||||||||||
Dividends reinvested | 5,503,242 | 10,198,090 | 359,934 | 110,584 | 5,052,139 | 1,096,585 | ||||||||||||||||||
Cost of shares redeemed | (50,910,029 | ) | (72,183,394 | ) | (47,539,811 | ) | (5,645,942 | ) | (46,401,651 | ) | (103,997,641 | ) | ||||||||||||
|
|
|
|
|
|
|
|
|
|
|
| |||||||||||||
Total Institutional Class | (36,994,732 | ) | (27,934,655 | ) | (39,078,516 | ) | 4,709,873 | 24,645,946 | (48,365,714 | ) | ||||||||||||||
|
|
|
|
|
|
|
|
|
|
|
| |||||||||||||
Change in net assets from capital transactions: | $ | (39,750,103 | ) | $ | (33,908,882 | ) | $ | (60,773,721 | ) | $ | (6,961,159 | ) | $ | (9,083,114 | ) | $ | (158,316,614 | ) | ||||||
|
|
|
|
|
|
|
|
|
|
|
| |||||||||||||
Amounts listed as “–” are $0 or round to $0.
See accompanying Notes to Financial Statements.
| 2017 Annual Report | 85 |
Statements of Changes in Net Assets (continued)
| Aberdeen Focused U.S. Equity Fund | Aberdeen Global Equity Fund | Aberdeen International Equity Fund | ||||||||||||||||||||||
| Year Ended October 31, 2017 | Year Ended October 31, 2016 | Year Ended October 31, 2017 | Year Ended October 31, 2016 | Year Ended October 31, 2017 | Year Ended October 31, 2016 | |||||||||||||||||||
SHARE TRANSACTIONS: | ||||||||||||||||||||||||
Class A Shares | ||||||||||||||||||||||||
Issued | 200,699 | 312,183 | 223,492 | 393,651 | 685,812 | 2,075,542 | ||||||||||||||||||
Issued in connection with fund merger | – | – | 728,321 | – | – | – | ||||||||||||||||||
Reinvested | 136,527 | 198,569 | 30,917 | 12,599 | 42,308 | 17,014 | ||||||||||||||||||
Redeemed | (518,277 | ) | (854,794 | ) | (2,559,089 | ) | (1,324,550 | ) | (1,853,771 | ) | (5,674,695 | ) | ||||||||||||
|
|
|
|
|
|
|
|
|
|
|
| |||||||||||||
Total Class A Shares | (181,051 | ) | (344,042 | ) | (1,576,359 | ) | (918,300 | ) | (1,125,651 | ) | (3,582,139 | ) | ||||||||||||
|
|
|
|
|
|
|
|
|
|
|
| |||||||||||||
Class C Shares | ||||||||||||||||||||||||
Issued | 78,073 | 110,555 | 6,167 | 19,784 | 47,715 | 67,584 | ||||||||||||||||||
Issued in connection with fund merger | – | – | 126,679 | – | – | – | ||||||||||||||||||
Reinvested | 101,121 | 113,548 | 636 | 84 | 5,514 | 1,435 | ||||||||||||||||||
Redeemed | (441,456 | ) | (699,556 | ) | (103,517 | ) | (41,616 | ) | (385,680 | ) | (809,232 | ) | ||||||||||||
|
|
|
|
|
|
|
|
|
|
|
| |||||||||||||
Total Class C Shares | (262,262 | ) | (475,453 | ) | 29,965 | (21,748 | ) | (332,451 | ) | (740,213 | ) | |||||||||||||
|
|
|
|
|
|
|
|
|
|
|
| |||||||||||||
Class R Shares | ||||||||||||||||||||||||
Issued | 48,890 | 62,746 | 46,518 | 75,422 | 117,324 | 349,780 | ||||||||||||||||||
Issued in connection with fund merger | – | – | 187,862 | – | – | – | ||||||||||||||||||
Reinvested | 44,701 | 51,679 | 1,120 | 179 | 5,464 | 2,288 | ||||||||||||||||||
Redeemed | (124,605 | ) | (123,427 | ) | (127,659 | ) | (86,515 | ) | (242,496 | ) | (898,467 | ) | ||||||||||||
|
|
|
|
|
|
|
|
|
|
|
| |||||||||||||
Total Class R Shares | (31,014 | ) | (9,002 | ) | 107,841 | (10,914 | ) | (119,708 | ) | (546,399 | ) | |||||||||||||
|
|
|
|
|
|
|
|
|
|
|
| |||||||||||||
Institutional Service Class Shares | ||||||||||||||||||||||||
Issued | 34,118 | 70,476 | – | – | 372,391 | 733,622 | ||||||||||||||||||
Issued in connection with fund merger | – | – | 51,283 | – | – | – | ||||||||||||||||||
Reinvested | 9,865 | 8,864 | 551 | – | 125,348 | 41,807 | ||||||||||||||||||
Redeemed | (24,918 | ) | (77,601 | ) | (13,571 | ) | – | (1,404,687 | ) | (5,196,160 | ) | |||||||||||||
|
|
|
|
|
|
|
|
|
|
|
| |||||||||||||
Total Institutional Service Class Shares | 19,065 | 1,739 | 38,263 | – | (906,948 | ) | (4,420,731 | ) | ||||||||||||||||
|
|
|
|
|
|
|
|
|
|
|
| |||||||||||||
Institutional Class Shares | ||||||||||||||||||||||||
Issued | 976,594 | 3,666,069 | 569,806 | 858,209 | 4,740,246 | 4,432,097 | ||||||||||||||||||
Issued in connection with fund merger | – | – | 48,395 | – | – | – | ||||||||||||||||||
Reinvested | 661,447 | 1,128,107 | 29,551 | 9,760 | 405,794 | 92,461 | ||||||||||||||||||
Redeemed | (5,977,260 | ) | (7,799,527 | ) | (3,381,873 | ) | (472,110 | ) | (3,332,221 | ) | (8,471,661 | ) | ||||||||||||
|
|
|
|
|
|
|
|
|
|
|
| |||||||||||||
Total Institutional Class Shares | (4,339,219 | ) | (3,005,351 | ) | (2,734,121 | ) | 395,859 | 1,813,819 | (3,947,103 | ) | ||||||||||||||
|
|
|
|
|
|
|
|
|
|
|
| |||||||||||||
Total change in shares: | (4,794,481 | ) | (3,832,109 | ) | (4,134,411 | ) | (555,103 | ) | (670,939 | ) | (13,236,585 | ) | ||||||||||||
|
|
|
|
|
|
|
|
|
|
|
| |||||||||||||
| Amounts | listed as “–” are $0 or round to $0. |
See accompanying Notes to Financial Statements.
| 86 | Annual Report 2017 |
Statements of Changes in Net Assets (continued)
| Aberdeen International Small Cap Fund | Aberdeen Japanese Equities Fund | Aberdeen U.S. Mid Cap Equity Fund | ||||||||||||||||||||||
| Year Ended October 31, 2017 | Year Ended October 31, 2016 | Year Ended October 31, 2017 | Year Ended October 31, 2016(a) | Year Ended October 31, 2017 | Year Ended October 31, 2016(b) | |||||||||||||||||||
FROM INVESTMENT ACTIVITIES: | ||||||||||||||||||||||||
Operations: | ||||||||||||||||||||||||
Net investment income | $ | 337,781 | $ | 448,764 | $ | 5,918 | $ | 7,191 | $ | 2,841 | $ | 2,335 | ||||||||||||
Net realized gain from investments and foreign currency transactions | 2,673,748 | 144,209 | 14,670 | 7,139 | 127,337 | 21,483 | ||||||||||||||||||
Net change in unrealized appreciation/(depreciation) on investments and translation of assets and liabilities denominated in foreign currencies | 11,818,012 | 4,409,248 | 130,078 | 90,821 | 144,525 | 72,618 | ||||||||||||||||||
|
|
|
|
|
|
|
|
|
|
|
| |||||||||||||
Changes in net assets resulting from operations | 14,829,541 | 5,002,221 | 150,666 | 105,151 | 274,703 | 96,436 | ||||||||||||||||||
|
|
|
|
|
|
|
|
|
|
|
| |||||||||||||
Distributions to Shareholders From: | ||||||||||||||||||||||||
Net investment income: | ||||||||||||||||||||||||
Class A | (266,730 | ) | (228,225 | ) | (55 | ) | (6 | ) | (20 | ) | – | |||||||||||||
Class C | – | (4,732 | ) | – | – | – | – | |||||||||||||||||
Class R | (4,254 | ) | (2,339 | ) | – | (5 | ) | (6 | ) | – | ||||||||||||||
Institutional Service Class | (94 | ) | (3,609 | ) | (40 | ) | (9 | ) | (40 | ) | – | |||||||||||||
Institutional Class | (152,102 | ) | (172,512 | ) | (3,825 | ) | (827 | ) | (3,884 | ) | – | |||||||||||||
Net realized gains: | ||||||||||||||||||||||||
Class A | (149,508 | ) | (4,916,418 | ) | (192 | ) | – | (234 | ) | – | ||||||||||||||
Class C | (3,656 | ) | (133,270 | ) | (95 | ) | – | (212 | ) | – | ||||||||||||||
Class R | (3,129 | ) | (57,580 | ) | (95 | ) | – | (215 | ) | – | ||||||||||||||
Institutional Service Class | (151 | ) | (76,860 | ) | (95 | ) | – | (215 | ) | – | ||||||||||||||
Institutional Class | (55,347 | ) | (3,082,076 | ) | (9,141 | ) | – | (20,608 | ) | – | ||||||||||||||
|
|
|
|
|
|
|
|
|
|
|
| |||||||||||||
Change in net assets from shareholder distributions | (634,971 | ) | (8,677,621 | ) | (13,538 | ) | (847 | ) | (25,434 | ) | – | |||||||||||||
|
|
|
|
|
|
|
|
|
|
|
| |||||||||||||
Common Stock Transactions: | ||||||||||||||||||||||||
Change in net assets from capital transactions | (7,781,845 | ) | (28,808,504 | ) | 248,338 | 1,011,847 | 78,207 | 1,001,000 | ||||||||||||||||
|
|
|
|
|
|
|
|
|
|
|
| |||||||||||||
Change in net assets | 6,412,725 | (32,483,904 | ) | 385,466 | 1,116,151 | 327,476 | 1,097,436 | |||||||||||||||||
|
|
|
|
|
|
|
|
|
|
|
| |||||||||||||
Net Assets: | ||||||||||||||||||||||||
Beginning of year | 73,555,007 | 106,038,911 | 1,116,151 | – | 1,097,436 | – | ||||||||||||||||||
|
|
|
|
|
|
|
|
|
|
|
| |||||||||||||
End of year | $ | 79,967,732 | $ | 73,555,007 | $ | 1,501,617 | $ | 1,116,151 | $ | 1,424,912 | $ | 1,097,436 | ||||||||||||
|
|
|
|
|
|
|
|
|
|
|
| |||||||||||||
Accumulated net investment income/(loss) at end of year | $ | (79,627 | ) | $ | (29,281 | ) | $ | 4,925 | $ | 3,919 | $ | 1,151 | $ | 2,382 | ||||||||||
|
|
|
|
|
|
|
|
|
|
|
| |||||||||||||
| (a) | For the period from November 30, 2015 (commencement of operations) through October 31, 2016. |
| (b) | For the period from February 29, 2016 (commencement of operations) through October 31, 2016. |
Amounts listed as “–” are $0 or round to $0.
See accompanying Notes to Financial Statements.
| 2017 Annual Report | 87 |
Statements of Changes in Net Assets (continued)
| Aberdeen International Small Cap Fund | Aberdeen Japanese Equities Fund | Aberdeen U.S. Mid Cap Equity Fund | ||||||||||||||||||||||
| Year Ended October 31, 2017 | Year Ended October 31, 2016 | Year Ended October 31, 2017 | Year Ended October 31, 2016(a) | Year Ended October 31, 2017 | Year Ended October 31, 2016(b) | |||||||||||||||||||
CAPITAL TRANSACTIONS: | ||||||||||||||||||||||||
Class A Shares | ||||||||||||||||||||||||
Proceeds from shares issued | $ | 8,666,909 | $ | 2,572,432 | $ | 239,852 | $ | 21,000 | $ | 28,765 | $ | 11,000 | ||||||||||||
Dividends reinvested | 399,285 | 4,951,615 | 247 | 6 | 254 | – | ||||||||||||||||||
Cost of shares redeemed | (11,268,150 | ) | (8,114,176 | ) | (5,052 | ) | – | – | – | |||||||||||||||
|
|
|
|
|
|
|
|
|
|
|
| |||||||||||||
Total Class A | (2,201,956 | ) | (590,129 | ) | 235,047 | 21,006 | 29,019 | 11,000 | ||||||||||||||||
|
|
|
|
|
|
|
|
|
|
|
| |||||||||||||
Class C Shares | ||||||||||||||||||||||||
Proceeds from shares issued | 1,792,572 | 243,990 | – | 10,000 | – | 10,000 | ||||||||||||||||||
Dividends reinvested | 3,468 | 130,352 | 95 | – | 212 | – | ||||||||||||||||||
Cost of shares redeemed | (1,741,386 | ) | (517,245 | ) | – | – | – | – | ||||||||||||||||
|
|
|
|
|
|
|
|
|
|
|
| |||||||||||||
Total Class C | 54,654 | (142,903 | ) | 95 | 10,000 | 212 | 10,000 | |||||||||||||||||
|
|
|
|
|
|
|
|
|
|
|
| |||||||||||||
Class R Shares | ||||||||||||||||||||||||
Proceeds from shares issued | 811,598 | 537,271 | – | 10,000 | – | 10,000 | ||||||||||||||||||
Dividends reinvested | 5,036 | 51,645 | 95 | 5 | 221 | – | ||||||||||||||||||
Cost of shares redeemed | (339,379 | ) | (248,342 | ) | – | – | – | – | ||||||||||||||||
|
|
|
|
|
|
|
|
|
|
|
| |||||||||||||
Total Class R | 477,255 | 340,574 | 95 | 10,005 | 221 | 10,000 | ||||||||||||||||||
|
|
|
|
|
|
|
|
|
|
|
| |||||||||||||
Institutional Service Class Shares | ||||||||||||||||||||||||
Proceeds from shares issued | 9,530 | 7,085 | – | 10,000 | – | 10,000 | ||||||||||||||||||
Dividends reinvested | 245 | 80,469 | 135 | 9 | 255 | – | ||||||||||||||||||
Cost of shares redeemed | (30,673 | ) | (1,287,799 | ) | – | – | – | – | ||||||||||||||||
|
|
|
|
|
|
|
|
|
|
|
| |||||||||||||
Total Institutional Service Class | (20,898 | ) | (1,200,245 | ) | 135 | 10,009 | 255 | 10,000 | ||||||||||||||||
|
|
|
|
|
|
|
|
|
|
|
| |||||||||||||
Institutional Class Shares | ||||||||||||||||||||||||
Proceeds from shares issued | 3,086,912 | 2,252,064 | – | 960,000 | 24,031 | 960,000 | ||||||||||||||||||
Dividends reinvested | 186,470 | 3,107,449 | 12,966 | 827 | 24,492 | – | ||||||||||||||||||
Cost of shares redeemed | (9,364,282 | ) | (32,575,314 | ) | – | – | (23 | ) | – | |||||||||||||||
|
|
|
|
|
|
|
|
|
|
|
| |||||||||||||
Total Institutional Class | (6,090,900 | ) | (27,215,801 | ) | 12,966 | 960,827 | 48,500 | 960,000 | ||||||||||||||||
|
|
|
|
|
|
|
|
|
|
|
| |||||||||||||
Change in net assets from capital transactions: | $ | (7,781,845 | ) | $ | (28,808,504 | ) | $ | 248,338 | $ | 1,011,847 | $ | 78,207 | $ | 1,001,000 | ||||||||||
|
|
|
|
|
|
|
|
|
|
|
| |||||||||||||
| (a) | For the period from November 30, 2015 (commencement of operations) through October 31, 2016. |
| (b) | For the period from February 29, 2016 (commencement of operations) through October 31, 2016. |
Amounts listed as “–” are $0 or round to $0.
See accompanying Notes to Financial Statements.
| 88 | Annual Report 2017 |
Statements of Changes in Net Assets (continued)
| Aberdeen International Small Cap Fund | Aberdeen Japanese Equities Fund | Aberdeen U.S. Mid Cap Equity Fund | ||||||||||||||||||||||
| Year Ended October 31, 2017 | Year Ended October 31, 2016 | Year Ended October 31, 2017 | Year Ended October 31, 2016(a) | Year Ended October 31, 2017 | Year Ended October 31, 2016(b) | |||||||||||||||||||
SHARE TRANSACTIONS: | ||||||||||||||||||||||||
Class A Shares | ||||||||||||||||||||||||
Issued | 320,012 | 99,041 | 21,263 | 2,013 | 2,348 | 1,087 | ||||||||||||||||||
Reinvested | 16,398 | 211,336 | 23 | 1 | 22 | – | ||||||||||||||||||
Redeemed | (423,079 | ) | (326,163 | ) | (431 | ) | – | – | – | |||||||||||||||
|
|
|
|
|
|
|
|
|
|
|
| |||||||||||||
Total Class A Shares | (86,669 | ) | (15,786 | ) | 20,855 | 2,014 | 2,370 | 1,087 | ||||||||||||||||
|
|
|
|
|
|
|
|
|
|
|
| |||||||||||||
Class C Shares | ||||||||||||||||||||||||
Issued | 69,769 | 10,073 | – | 1,000 | – | 1,000 | ||||||||||||||||||
Reinvested | 154 | 6,015 | 9 | – | 19 | – | ||||||||||||||||||
Redeemed | (63,826 | ) | (22,955 | ) | – | – | – | – | ||||||||||||||||
|
|
|
|
|
|
|
|
|
|
|
| |||||||||||||
Total Class C Shares | 6,097 | (6,867 | ) | 9 | 1,000 | 19 | 1,000 | |||||||||||||||||
|
|
|
|
|
|
|
|
|
|
|
| |||||||||||||
Class R Shares | ||||||||||||||||||||||||
Issued | 31,315 | 22,015 | – | 1,000 | – | 1,000 | ||||||||||||||||||
Reinvested | 217 | 2,305 | 10 | – | 19 | – | ||||||||||||||||||
Redeemed | (12,508 | ) | (10,229 | ) | – | – | – | – | ||||||||||||||||
|
|
|
|
|
|
|
|
|
|
|
| |||||||||||||
Total Class R Shares | 19,024 | 14,091 | 10 | 1,000 | 19 | 1,000 | ||||||||||||||||||
|
|
|
|
|
|
|
|
|
|
|
| |||||||||||||
Institutional Service Class Shares | ||||||||||||||||||||||||
Issued | 308 | 267 | – | 1,000 | – | 1,000 | ||||||||||||||||||
Reinvested | 10 | 3,433 | 13 | 1 | 22 | – | ||||||||||||||||||
Redeemed | (1,155 | ) | (51,801 | ) | – | – | – | – | ||||||||||||||||
|
|
|
|
|
|
|
|
|
|
|
| |||||||||||||
Total Institutional Service Class Shares | (837 | ) | (48,101 | ) | 13 | 1,001 | 22 | 1,000 | ||||||||||||||||
|
|
|
|
|
|
|
|
|
|
|
| |||||||||||||
Institutional Class Shares | ||||||||||||||||||||||||
Issued | 112,417 | 92,718 | – | 96,000 | 1,867 | 96,000 | ||||||||||||||||||
Reinvested | 7,658 | 132,684 | 1,277 | 85 | 2,151 | – | ||||||||||||||||||
Redeemed | (336,755 | ) | (1,284,223 | ) | – | – | (2 | ) | – | |||||||||||||||
|
|
|
|
|
|
|
|
|
|
|
| |||||||||||||
Total Institutional Class Shares | (216,680 | ) | (1,058,821 | ) | 1,277 | 96,085 | 4,016 | 96,000 | ||||||||||||||||
|
|
|
|
|
|
|
|
|
|
|
| |||||||||||||
Total change in shares: | (279,065 | ) | (1,115,484 | ) | 22,164 | 101,100 | 6,446 | 100,087 | ||||||||||||||||
|
|
|
|
|
|
|
|
|
|
|
| |||||||||||||
| (a) | For the period from November 30, 2015 (commencement of operations) through October 31, 2016. |
| (b) | For the period from February 29, 2016 (commencement of operations) through October 31, 2016. |
Amounts listed as “–” are $0 or round to $0.
See accompanying Notes to Financial Statements.
| 2017 Annual Report | 89 |
Statements of Changes in Net Assets (continued)
| Aberdeen U.S. Multi-Cap Equity Fund | Aberdeen U.S. Small Cap Equity Fund | |||||||||||||||
| Year Ended October 31, 2017 | Year Ended October 31, 2016 | Year Ended October 31, 2017 | Year Ended October 31, 2016 | |||||||||||||
FROM INVESTMENT ACTIVITIES: | ||||||||||||||||
Operations: | ||||||||||||||||
Net investment income/(loss) | $ | 1,239,926 | $ | 914,774 | $ | (3,039,782 | ) | $ | (1,031,157 | ) | ||||||
Net realized gain from investments and foreign currency transactions | 38,843,861 | 47,768,727 | 115,723,157 | 52,542,317 | ||||||||||||
Net change in unrealized appreciation/(depreciation) on investments and translation of assets and liabilities denominated in foreign currencies | 28,261,064 | (40,899,885 | ) | 224,842,396 | (18,311,897 | ) | ||||||||||
|
|
|
|
|
|
|
| |||||||||
Changes in net assets resulting from operations | 68,344,851 | 7,783,616 | 337,525,771 | 33,199,263 | ||||||||||||
|
|
|
|
|
|
|
| |||||||||
Distributions to Shareholders From: | ||||||||||||||||
Net investment income: | ||||||||||||||||
Class A | (287,332 | ) | (377,830 | ) | – | – | ||||||||||
Class R | – | (543 | ) | – | – | |||||||||||
Institutional Service Class | (272,427 | ) | (214,903 | ) | – | – | ||||||||||
Institutional Class | (22,533 | ) | (15,558 | ) | – | – | ||||||||||
Net realized gains: | ||||||||||||||||
Class A | (26,189,382 | ) | (11,902,823 | ) | – | – | ||||||||||
Class C | (739,985 | ) | (366,439 | ) | – | – | ||||||||||
Class R | (33,344 | ) | (24,769 | ) | – | – | ||||||||||
Institutional Service Class | (11,296,496 | ) | (5,033,508 | ) | – | – | ||||||||||
Institutional Class | (757,559 | ) | (325,415 | ) | – | – | ||||||||||
|
|
|
|
|
|
|
| |||||||||
Change in net assets from shareholder distributions | (39,599,058 | ) | (18,261,788 | ) | – | – | ||||||||||
|
|
|
|
|
|
|
| |||||||||
Common Stock Transactions: | ||||||||||||||||
Change in net assets from capital transactions | (7,197,173 | ) | (20,846,509 | ) | 480,510,982 | 751,947,122 | ||||||||||
|
|
|
|
|
|
|
| |||||||||
Change in net assets | 21,548,620 | (31,324,681 | ) | 818,036,753 | 785,146,385 | |||||||||||
|
|
|
|
|
|
|
| |||||||||
Net Assets: | ||||||||||||||||
Beginning of year | 340,163,766 | 371,488,447 | 1,144,919,681 | 359,773,296 | ||||||||||||
|
|
|
|
|
|
|
| |||||||||
End of year | $ | 361,712,386 | $ | 340,163,766 | $ | 1,962,956,434 | $ | 1,144,919,681 | ||||||||
|
|
|
|
|
|
|
| |||||||||
Accumulated net investment income/(loss) at end of year | $ | 1,239,601 | $ | 582,068 | $ | (4,406,386 | ) | $ | (1,581,355 | ) | ||||||
|
|
|
|
|
|
|
| |||||||||
Amounts listed as “–” are $0 or round to $0.
See accompanying Notes to Financial Statements.
| 90 | Annual Report 2017 |
Statements of Changes in Net Assets (continued)
| Aberdeen U.S. Multi-Cap Equity Fund | Aberdeen U.S. Small Cap Equity Fund | |||||||||||||||
| Year Ended October 31, 2017 | Year Ended October 31, 2016 | Year Ended October 31, 2017 | Year Ended October 31, 2016 | |||||||||||||
CAPITAL TRANSACTIONS: | ||||||||||||||||
Class A Shares | ||||||||||||||||
Proceeds from shares issued | $ | 3,928,729 | $ | 2,630,781 | $ | 191,289,180 | $ | 227,746,549 | ||||||||
Dividends reinvested | 24,007,105 | 11,221,671 | – | – | ||||||||||||
Cost of shares redeemed | (30,332,254 | ) | (28,392,609 | ) | (195,976,089 | ) | (47,729,228 | ) | ||||||||
|
|
|
|
|
|
|
| |||||||||
Total Class A | (2,396,420 | ) | (14,540,157 | ) | (4,686,909 | ) | 180,017,321 | |||||||||
|
|
|
|
|
|
|
| |||||||||
Class C Shares | ||||||||||||||||
Proceeds from shares issued | 430,378 | 227,349 | 35,506,760 | 47,256,350 | ||||||||||||
Dividends reinvested | 404,673 | 202,196 | – | – | ||||||||||||
Cost of shares redeemed | (3,413,355 | ) | (1,397,791 | ) | (35,730,729 | ) | (7,552,388 | ) | ||||||||
|
|
|
|
|
|
|
| |||||||||
Total Class C | (2,578,304 | ) | (968,246 | ) | (223,969 | ) | 39,703,962 | |||||||||
|
|
|
|
|
|
|
| |||||||||
Class R Shares | ||||||||||||||||
Proceeds from shares issued | 53,756 | 89,376 | 10,098,588 | 11,136,893 | ||||||||||||
Dividends reinvested | 28 | 11 | – | – | ||||||||||||
Cost of shares redeemed | (176,583 | ) | (250,111 | ) | (6,938,875 | ) | (2,788,520 | ) | ||||||||
|
|
|
|
|
|
|
| |||||||||
Total Class R | (122,799 | ) | (160,724 | ) | 3,159,713 | 8,348,373 | ||||||||||
|
|
|
|
|
|
|
| |||||||||
Institutional Service Class Shares | ||||||||||||||||
Proceeds from shares issued | 952,791 | 1,161,701 | 36,790,412 | 54,259,256 | ||||||||||||
Dividends reinvested | 11,275,476 | 5,105,142 | – | – | ||||||||||||
Cost of shares redeemed | (13,475,239 | ) | (11,290,046 | ) | (34,169,491 | ) | (17,874,597 | ) | ||||||||
|
|
|
|
|
|
|
| |||||||||
Total Institutional Service Class | (1,246,972 | ) | (5,023,203 | ) | 2,620,921 | 36,384,659 | ||||||||||
|
|
|
|
|
|
|
| |||||||||
Institutional Class Shares | ||||||||||||||||
Proceeds from shares issued | 2,681,977 | 1,534,156 | 889,508,996 | 593,765,521 | ||||||||||||
Dividends reinvested | 722,772 | 303,370 | – | – | ||||||||||||
Cost of shares redeemed | (4,257,427 | ) | (1,991,705 | ) | (409,867,770 | ) | (106,272,714 | ) | ||||||||
Total Institutional Class | (852,678 | ) | (154,179 | ) | 479,641,226 | 487,492,807 | ||||||||||
|
|
|
|
|
|
|
| |||||||||
Change in net assets from capital transactions: | $ | (7,197,173 | ) | $ | (20,846,509 | ) | $ | 480,510,982 | $ | 751,947,122 | ||||||
|
|
|
|
|
|
|
| |||||||||
Amounts listed as “–” are $0 or round to $0.
See accompanying Notes to Financial Statements.
| 2017 Annual Report | 91 |
Statements of Changes in Net Assets (concluded)
| Aberdeen U.S. Multi-Cap Equity Fund | Aberdeen U.S. Small Cap Equity Fund | |||||||||||||||
| Year Ended October 31, 2017 | Year Ended October 31, 2016 | Year Ended October 31, 2017 | Year Ended October 31, 2016 | |||||||||||||
SHARE TRANSACTIONS: | ||||||||||||||||
Class A Shares | ||||||||||||||||
Issued | 319,724 | 225,383 | 5,853,236 | 7,902,280 | ||||||||||||
Reinvested | 2,082,143 | 984,357 | – | – | ||||||||||||
Redeemed | (2,463,388 | ) | (2,379,388 | ) | (5,997,812 | ) | (1,679,187 | ) | ||||||||
|
|
|
|
|
|
|
| |||||||||
Total Class A Shares | (61,521 | ) | (1,169,648 | ) | (144,576 | ) | 6,223,093 | |||||||||
|
|
|
|
|
|
|
| |||||||||
Class C Shares | ||||||||||||||||
Issued | 41,110 | 21,448 | 1,243,834 | 1,896,422 | ||||||||||||
Reinvested | 39,480 | 19,574 | – | – | ||||||||||||
Redeemed | (311,583 | ) | (128,581 | ) | (1,252,586 | ) | (307,606 | ) | ||||||||
|
|
|
|
|
|
|
| |||||||||
Total Class C Shares | (230,993 | ) | (87,559 | ) | (8,752 | ) | 1,588,816 | |||||||||
|
|
|
|
|
|
|
| |||||||||
Class R Shares | ||||||||||||||||
Issued | 4,807 | 7,806 | 333,805 | 435,778 | ||||||||||||
Reinvested | 2 | 1 | – | – | ||||||||||||
Redeemed | (15,003 | ) | (23,035 | ) | (223,666 | ) | (106,850 | ) | ||||||||
|
|
|
|
|
|
|
| |||||||||
Total Class R Shares | (10,194 | ) | (15,228 | ) | 110,139 | 328,928 | ||||||||||
|
|
|
|
|
|
|
| |||||||||
Institutional Service Class Shares | ||||||||||||||||
Issued | 73,719 | 91,476 | 1,067,698 | 1,859,960 | ||||||||||||
Reinvested | 927,260 | 427,208 | – | – | ||||||||||||
Redeemed | (1,041,741 | ) | (892,439 | ) | (989,421 | ) | (614,501 | ) | ||||||||
|
|
|
|
|
|
|
| |||||||||
Total Institutional Service Class Shares | (40,762 | ) | (373,755 | ) | 78,277 | 1,245,459 | ||||||||||
|
|
|
|
|
|
|
| |||||||||
Institutional Class Shares | ||||||||||||||||
Issued | 206,077 | 124,587 | 26,250,509 | 19,876,666 | ||||||||||||
Reinvested | 59,341 | 25,366 | – | – | ||||||||||||
Redeemed | (323,215 | ) | (160,107 | ) | (11,856,653 | ) | (3,571,621 | ) | ||||||||
|
|
|
|
|
|
|
| |||||||||
Total Institutional Class Shares | (57,797 | ) | (10,154 | ) | 14,393,856 | 16,305,045 | ||||||||||
|
|
|
|
|
|
|
| |||||||||
Total change in shares: | (401,267 | ) | (1,656,344 | ) | 14,428,944 | 25,691,341 | ||||||||||
|
|
|
|
|
|
|
| |||||||||
Amounts listed as “–” are $0 or round to $0.
See accompanying Notes to Financial Statements.
| 92 | Annual Report 2017 |
This page intentionally left blank.
Financial Highlights
Selected Data for Each Share of Capital Outstanding Throughout the Periods Indicated
Aberdeen Asia-Pacific (ex-Japan) Equity Fund
| Investment Activities | Distributions | |||||||||||||||||||||||||||||||
| Net Asset Value, Beginning of Period | Net Investment Income (a) | Net Realized and Unrealized Gains (Losses) on Investments | Total from Investment Activities | Net Investment Income | Net Realized Gains | Total Distributions | Net Asset Value, End of Period | |||||||||||||||||||||||||
Class A Shares | ||||||||||||||||||||||||||||||||
Year Ended October 31, 2017 | $ | 10.49 | $ | 0.12 | $ | 2.80 | $ | 2.92 | $ | – | $ | – | $ | – | $ | 13.41 | ||||||||||||||||
Year Ended October 31, 2016 | 10.04 | 0.18 | (f) | 0.48 | 0.66 | (0.21 | ) | – | (0.21 | ) | 10.49 | |||||||||||||||||||||
Year Ended October 31, 2015 | 12.08 | 0.14 | (1.68 | ) | (1.54 | ) | (0.30 | ) | (0.20 | ) | (0.50 | ) | 10.04 | |||||||||||||||||||
Year Ended October 31, 2014 | 12.01 | 0.14 | 0.15 | 0.29 | (0.15 | ) | (0.07 | ) | (0.22 | ) | 12.08 | |||||||||||||||||||||
Year Ended October 31, 2013 | 11.73 | 0.17 | 0.54 | 0.71 | (0.27 | ) | (0.16 | ) | (0.43 | ) | 12.01 | |||||||||||||||||||||
Class C Shares | ||||||||||||||||||||||||||||||||
Year Ended October 31, 2017 | 10.38 | 0.03 | 2.78 | 2.81 | – | – | – | 13.19 | ||||||||||||||||||||||||
Year Ended October 31, 2016 | 10.01 | 0.12 | (f) | 0.44 | 0.56 | (0.19 | ) | – | (0.19 | ) | 10.38 | |||||||||||||||||||||
Year Ended October 31, 2015 | 12.05 | 0.07 | (1.67 | ) | (1.60 | ) | (0.24 | ) | (0.20 | ) | (0.44 | ) | 10.01 | |||||||||||||||||||
Year Ended October 31, 2014 | 12.00 | 0.05 | 0.15 | 0.20 | (0.08 | ) | (0.07 | ) | (0.15 | ) | 12.05 | |||||||||||||||||||||
Year Ended October 31, 2013 | 11.66 | 0.13 | 0.50 | 0.63 | (0.13 | ) | (0.16 | ) | (0.29 | ) | 12.00 | |||||||||||||||||||||
Class R Shares | ||||||||||||||||||||||||||||||||
Year Ended October 31, 2017 | 10.45 | 0.09 | 2.79 | 2.88 | – | – | – | 13.33 | ||||||||||||||||||||||||
Year Ended October 31, 2016 | 10.02 | 0.16 | (f) | 0.48 | 0.64 | (0.21 | ) | – | (0.21 | ) | 10.45 | |||||||||||||||||||||
Year Ended October 31, 2015 | 12.07 | 0.15 | (1.72 | ) | (1.57 | ) | (0.28 | ) | (0.20 | ) | (0.48 | ) | 10.02 | |||||||||||||||||||
Year Ended October 31, 2014 | 12.02 | 0.05 | 0.20 | 0.25 | (0.13 | ) | (0.07 | ) | (0.20 | ) | 12.07 | |||||||||||||||||||||
Year Ended October 31, 2013 | 11.70 | 0.18 | 0.51 | 0.69 | (0.21 | ) | (0.16 | ) | (0.37 | ) | 12.02 | |||||||||||||||||||||
Institutional Service Class Shares | ||||||||||||||||||||||||||||||||
Year Ended October 31, 2017 | 10.53 | 0.07 | 2.88 | 2.95 | – | – | – | 13.48 | ||||||||||||||||||||||||
Year Ended October 31, 2016 | 10.06 | 0.21 | (f) | 0.47 | 0.68 | (0.21 | ) | – | (0.21 | ) | 10.53 | |||||||||||||||||||||
Year Ended October 31, 2015 | 12.10 | 0.17 | (1.69 | ) | (1.52 | ) | (0.32 | ) | (0.20 | ) | (0.52 | ) | 10.06 | |||||||||||||||||||
Year Ended October 31, 2014 | 12.03 | 0.17 | 0.14 | 0.31 | (0.17 | ) | (0.07 | ) | (0.24 | ) | 12.10 | |||||||||||||||||||||
Year Ended October 31, 2013 | 11.73 | 0.16 | 0.58 | 0.74 | (0.28 | ) | (0.16 | ) | (0.44 | ) | 12.03 | |||||||||||||||||||||
Institutional Class Shares | ||||||||||||||||||||||||||||||||
Year Ended October 31, 2017 | 10.53 | 0.13 | 2.84 | 2.97 | – | – | – | 13.50 | ||||||||||||||||||||||||
Year Ended October 31, 2016 | 10.07 | 0.05 | (f) | 0.62 | 0.67 | (0.21 | ) | – | (0.21 | ) | 10.53 | |||||||||||||||||||||
Year Ended October 31, 2015 | 12.11 | 0.21 | (1.72 | ) | (1.51 | ) | (0.33 | ) | (0.20 | ) | (0.53 | ) | 10.07 | |||||||||||||||||||
Year Ended October 31, 2014 | 12.04 | 0.16 | 0.16 | 0.32 | (0.18 | ) | (0.07 | ) | (0.25 | ) | 12.11 | |||||||||||||||||||||
Year Ended October 31, 2013 | 11.74 | 0.19 | 0.56 | 0.75 | (0.29 | ) | (0.16 | ) | (0.45 | ) | 12.04 | |||||||||||||||||||||
| (a) | Net investment income/(loss) is based on average shares outstanding during the period. |
| (b) | Excludes sales charge. |
| (c) | During the period, certain fees were waived and/or reimbursed. If such waivers/reimbursements had not occurred, the ratios would have been as indicated. |
| (d) | Portfolio turnover is calculated on the basis of the Fund as a whole without distinguishing among the classes of shares. |
Amounts listed as “–” are $0 or round to $0.
See accompanying Notes to Financial Statements.
| 94 | Annual Report 2017 |
Financial Highlights (continued)
Selected Data for Each Share of Capital Outstanding Throughout the Periods Indicated
Aberdeen Asia-Pacific (ex-Japan) Equity Fund (concluded)
| Ratios/Supplemental Data | ||||||||||||||||||||||
| Total Return (b) | Net Assets at End of Period (000’s) | Ratio of Expenses (Net of Reimbursements/Waivers) to Average Net Assets | Ratio of Expenses (Prior to Reimbursements) to Average Net Assets (c) | Ratio of Net Investment Income to Average Net Assets | Portfolio Turnover (d) | |||||||||||||||||
| 27.84 | % | $ | 1,041 | 1.55 | %(e) | 3.46 | %(e) | 1.01 | % | 20.14 | % | |||||||||||
| 6.86 | %(f) | 748 | 1.54 | %(e) | 1.70 | %(e) | 1.88 | %(f) | 39.84 | % | ||||||||||||
| (12.94 | %) | 815 | 1.51 | %(e) | 1.52 | %(e) | 1.21 | % | 58.06 | % | ||||||||||||
| 2.43 | % | 1,173 | 1.50 | % | 1.52 | % | 1.21 | % | 36.48 | % | ||||||||||||
| 6.12 | % | 1,328 | 1.50 | % | 1.51 | % | 1.43 | % | 3.33 | % | ||||||||||||
| 27.07 | % | 267 | 2.26 | %(e) | 4.22 | %(e) | 0.28 | % | 20.14 | % | ||||||||||||
| 5.90 | %(f) | 58 | 2.26 | %(e) | 2.44 | %(e) | 1.24 | %(f) | 39.84 | % | ||||||||||||
| (13.42 | %) | 280 | 2.26 | %(e) | 2.27 | %(e) | 0.66 | % | 58.06 | % | ||||||||||||
| 1.67 | % | 288 | 2.25 | % | 2.27 | % | 0.46 | % | 36.48 | % | ||||||||||||
| 5.47 | % | 146 | 2.25 | % | 2.26 | % | 1.09 | % | 3.33 | % | ||||||||||||
| 27.56 | % | 13 | 1.76 | %(e) | 3.67 | %(e) | 0.81 | % | 20.14 | % | ||||||||||||
| 6.63 | %(f) | 10 | 1.76 | %(e) | 1.92 | %(e) | 1.68 | %(f) | 39.84 | % | ||||||||||||
| (13.17 | %) | 10 | 1.76 | %(e) | 1.77 | %(e) | 1.30 | % | 58.06 | % | ||||||||||||
| 2.06 | % | 11 | 1.76 | % | 1.78 | % | 0.40 | % | 36.48 | % | ||||||||||||
| 5.97 | % | 36 | 1.75 | % | 1.76 | % | 1.50 | % | 3.33 | % | ||||||||||||
| 28.02 | % | 2,036 | 1.33 | %(e) | 3.24 | %(e) | 0.65 | % | 20.14 | % | ||||||||||||
| 7.08 | %(f) | 4,291 | 1.28 | %(e) | 1.44 | %(e) | 2.14 | %(f) | 39.84 | % | ||||||||||||
| (12.73 | %) | 4,017 | 1.29 | %(e) | 1.30 | %(e) | 1.54 | % | 58.06 | % | ||||||||||||
| 2.59 | % | 3,950 | 1.30 | % | 1.32 | % | 1.45 | % | 36.48 | % | ||||||||||||
| 6.44 | % | 3,841 | 1.28 | % | 1.29 | % | 1.35 | % | 3.33 | % | ||||||||||||
| 28.21 | % | 7,939 | 1.26 | %(e) | 3.24 | %(e) | 1.15 | % | 20.14 | % | ||||||||||||
| 6.97 | %(f) | 9,558 | 1.26 | %(e) | 1.43 | %(e) | 0.57 | %(f) | 39.84 | % | ||||||||||||
| (12.68 | %) | 263,176 | 1.26 | %(e) | 1.27 | %(e) | 1.83 | % | 58.06 | % | ||||||||||||
| 2.64 | % | 1,069,989 | 1.25 | % | 1.27 | % | 1.32 | % | 36.48 | % | ||||||||||||
| 6.48 | % | 1,004,859 | 1.25 | % | 1.26 | % | 1.59 | % | 3.33 | % | ||||||||||||
| (e) | Includes interest expense that amounts to 0.01% for Class A, Class C, Class R, Institutional Service Class and Institutional Class for the year ended October 31, 2017. Includes interest expense that amounts to less than 0.01% for Class A, Class C, Class R, Institutional Service Class and Institutional Class for the years ended October 31, 2016 and October 31, 2015. |
| (f) | Included within Net Investment Income per share, Total Return and Ratio of Net Investment Income to Average Net Assets are the effects of a one-time reimbursement for overbilling of prior years’ custodian out-of-pocket fees. If such amounts were excluded, Net Investment Income per share would be reduced by $0.02, $0.01, $0.01, $0.02 and $0.02, Total Return would be reduced by 0.21%, 0.10%, 0.10%, 0.20% and 0.20% and Ratio of Net Investment Income to Average Net Assets would be reduced by 0.14%, 0.05%, 0.16%, 0.16% and 0.02% for Class A, Class C, Class R, Institutional Service Class and Institutional Class, respectively. |
| 2017 Annual Report | 95 |
Financial Highlights (continued)
Selected Data for Each Share of Capital Outstanding Throughout the Periods Indicated
Aberdeen China Opportunities Fund
| Investment Activities | Distributions | |||||||||||||||||||||||||||||||
| Net Asset Value, Beginning of Period | Net Investment Income (Loss) (a) | Net Realized and Unrealized Gains (Losses) on Investments | Total from Investment Activities | Net Investment Income | Total Distributions | Redemption Fees | Net Asset Value, End of Period | |||||||||||||||||||||||||
Class A Shares | ||||||||||||||||||||||||||||||||
Year Ended October 31, 2017 | $ | 18.46 | $ | 0.20 | $ | 4.02 | $ | 4.22 | $ | (0.20 | ) | $ | (0.20 | ) | $ | – | $ | 22.48 | ||||||||||||||
Year Ended October 31, 2016 | 17.94 | 0.19 | 0.33 | 0.52 | – | – | – | 18.46 | ||||||||||||||||||||||||
Year Ended October 31, 2015 | 20.19 | 0.22 | (2.14 | ) | (1.92 | ) | (0.33 | ) | (0.33 | ) | – | 17.94 | ||||||||||||||||||||
Year Ended October 31, 2014 | 20.54 | 0.16 | (0.33 | ) | (0.17 | ) | (0.18 | ) | (0.18 | ) | – | 20.19 | ||||||||||||||||||||
Year Ended October 31, 2013 | 19.64 | 0.15 | 0.82 | 0.97 | (0.08 | ) | (0.08 | ) | 0.01 | 20.54 | ||||||||||||||||||||||
Class C Shares | ||||||||||||||||||||||||||||||||
Year Ended October 31, 2017 | 17.64 | 0.03 | 3.92 | 3.95 | – | – | – | 21.59 | ||||||||||||||||||||||||
Year Ended October 31, 2016 | 17.26 | 0.06 | 0.32 | 0.38 | – | – | – | 17.64 | ||||||||||||||||||||||||
Year Ended October 31, 2015 | 19.50 | 0.18 | (2.17 | ) | (1.99 | ) | (0.25 | ) | (0.25 | ) | – | 17.26 | ||||||||||||||||||||
Year Ended October 31, 2014 | 19.87 | 0.01 | (0.32 | ) | (0.31 | ) | (0.06 | ) | (0.06 | ) | – | 19.50 | ||||||||||||||||||||
Year Ended October 31, 2013 | 19.09 | (0.01 | ) | 0.81 | 0.80 | (0.02 | ) | (0.02 | ) | – | 19.87 | |||||||||||||||||||||
Class R Shares | ||||||||||||||||||||||||||||||||
Year Ended October 31, 2017 | 18.13 | 0.15 | 3.94 | 4.09 | (0.15 | ) | (0.15 | ) | – | 22.07 | ||||||||||||||||||||||
Year Ended October 31, 2016 | 17.68 | 0.16 | 0.29 | 0.45 | – | – | – | 18.13 | ||||||||||||||||||||||||
Year Ended October 31, 2015 | 19.92 | 0.23 | (2.19 | ) | (1.96 | ) | (0.28 | ) | (0.28 | ) | – | 17.68 | ||||||||||||||||||||
Year Ended October 31, 2014 | 20.29 | 0.10 | (0.35 | ) | (0.25 | ) | (0.12 | ) | (0.12 | ) | – | 19.92 | ||||||||||||||||||||
Year Ended October 31, 2013 | 19.43 | 0.10 | 0.79 | 0.89 | (0.03 | ) | (0.03 | ) | – | 20.29 | ||||||||||||||||||||||
Institutional Service Class Shares | ||||||||||||||||||||||||||||||||
Year Ended October 31, 2017 | 18.55 | 0.22 | 4.08 | 4.30 | (0.23 | ) | (0.23 | ) | – | 22.62 | ||||||||||||||||||||||
Year Ended October 31, 2016 | 18.00 | 0.22 | 0.33 | 0.55 | – | – | – | 18.55 | ||||||||||||||||||||||||
Year Ended October 31, 2015 | 20.28 | 0.30 | (2.18 | ) | (1.88 | ) | (0.40 | ) | (0.40 | ) | – | 18.00 | ||||||||||||||||||||
Year Ended October 31, 2014 | 20.62 | 0.21 | (0.33 | ) | (0.12 | ) | (0.22 | ) | (0.22 | ) | – | 20.28 | ||||||||||||||||||||
Year Ended October 31, 2013 | 19.72 | 0.18 | 0.84 | 1.02 | (0.13 | ) | (0.13 | ) | 0.01 | 20.62 | ||||||||||||||||||||||
Institutional Class Shares | ||||||||||||||||||||||||||||||||
Year Ended October 31, 2017 | 18.58 | 0.19 | 4.13 | 4.32 | (0.25 | ) | (0.25 | ) | – | 22.65 | ||||||||||||||||||||||
Year Ended October 31, 2016 | 18.00 | 0.26 | 0.32 | 0.58 | – | – | – | 18.58 | ||||||||||||||||||||||||
Year Ended October 31, 2015 | 20.28 | 0.35 | (2.23 | ) | (1.88 | ) | (0.40 | ) | (0.40 | ) | – | 18.00 | ||||||||||||||||||||
Year Ended October 31, 2014 | 20.64 | 0.25 | (0.38 | ) | (0.13 | ) | (0.23 | ) | (0.23 | ) | – | 20.28 | ||||||||||||||||||||
Year Ended October 31, 2013 | 19.74 | 0.19 | 0.83 | 1.02 | (0.13 | ) | (0.13 | ) | 0.01 | 20.64 | ||||||||||||||||||||||
| (a) | Net investment income/(loss) is based on average shares outstanding during the period. |
| (b) | Excludes sales charge. |
Amounts listed as “–” are $0 or round to $0.
See accompanying Notes to Financial Statements.
| 96 | Annual Report 2017 |
Financial Highlights (continued)
Selected Data for Each Share of Capital Outstanding Throughout the Periods Indicated
Aberdeen China Opportunities Fund (concluded)
| Ratios/Supplemental Data | ||||||||||||||||||||||
| Total Return (b) | Net Assets at End of Period (000’s) | Ratio of Expenses (Net of Reimbursements/Waivers) to Average Net Assets | Ratio of Expenses (Prior to Reimbursements) to Average Net Assets (c) | Ratio of Net Investment Income (Loss) to Average Net Assets | Portfolio Turnover (d) | |||||||||||||||||
| 23.15 | % | $ | 7,492 | 1.97 | %(e) | 3.04 | %(e) | 0.98 | % | 23.58 | % | |||||||||||
| 2.90 | % | 7,301 | 1.95 | %(e) | 2.84 | %(e) | 1.10 | % | 15.75 | % | ||||||||||||
| (9.50 | %) | 8,221 | 1.89 | %(e) | 2.48 | %(e) | 1.12 | % | 10.48 | % | ||||||||||||
| (0.82 | %) | 19,425 | 1.89 | % | 2.30 | % | 0.79 | % | 30.61 | % | ||||||||||||
| 4.98 | % | 21,682 | 1.89 | % | 2.18 | % | 0.71 | % | 14.51 | % | ||||||||||||
| 22.39 | % | 2,437 | 2.62 | %(e) | 3.83 | %(e) | 0.14 | % | 23.58 | % | ||||||||||||
| 2.20 | % | 3,609 | 2.62 | %(e) | 3.60 | %(e) | 0.37 | % | 15.75 | % | ||||||||||||
| (10.18 | %) | 4,711 | 2.62 | %(e) | 3.21 | %(e) | 0.95 | % | 10.48 | % | ||||||||||||
| (1.57 | %) | 6,064 | 2.62 | % | 3.03 | % | 0.04 | % | 30.61 | % | ||||||||||||
| 4.18 | % | 7,704 | 2.62 | % | 2.91 | % | (0.06 | %) | 14.51 | % | ||||||||||||
| 22.77 | % | 1,851 | 2.31 | %(e) | 3.38 | %(e) | 0.74 | % | 23.58 | % | ||||||||||||
| 2.55 | % | 1,378 | 2.28 | %(e) | 3.17 | %(e) | 0.95 | % | 15.75 | % | ||||||||||||
| (9.83 | %) | 1,293 | 2.29 | %(e) | 2.88 | %(e) | 1.20 | % | 10.48 | % | ||||||||||||
| (1.25 | %) | 1,495 | 2.27 | % | 2.68 | % | 0.50 | % | 30.61 | % | ||||||||||||
| 4.61 | % | 1,599 | 2.25 | % | 2.54 | % | 0.47 | % | 14.51 | % | ||||||||||||
| 23.54 | % | 620 | 1.71 | %(e) | 2.78 | %(e) | 1.12 | % | 23.58 | % | ||||||||||||
| 3.06 | % | 735 | 1.79 | %(e) | 2.68 | %(e) | 1.29 | % | 15.75 | % | ||||||||||||
| (9.30 | %) | 825 | 1.63 | %(e) | 2.22 | %(e) | 1.53 | % | 10.48 | % | ||||||||||||
| (0.56 | %) | 1,778 | 1.64 | % | 2.05 | % | 1.05 | % | 30.61 | % | ||||||||||||
| 5.22 | % | 2,383 | 1.62 | % | 1.91 | % | 0.88 | % | 14.51 | % | ||||||||||||
| 23.62 | % | 927 | 1.62 | %(e) | 2.78 | %(e) | 0.94 | % | 23.58 | % | ||||||||||||
| 3.22 | % | 1,575 | 1.62 | %(e) | 2.56 | %(e) | 1.47 | % | 15.75 | % | ||||||||||||
| (9.27 | %) | 1,804 | 1.63 | %(e) | 2.22 | %(e) | 1.80 | % | 10.48 | % | ||||||||||||
| (0.65 | %) | 1,604 | 1.62 | % | 2.03 | % | 1.23 | % | 30.61 | % | ||||||||||||
| 5.22 | % | 1,250 | 1.62 | % | 1.91 | % | 0.90 | % | 14.51 | % | ||||||||||||
| (c) | During the period, certain fees were waived and/or reimbursed. If such waivers/reimbursements had not occurred, the ratios would have been as indicated. |
| (d) | Portfolio turnover is calculated on the basis of the Fund as a whole without distinguishing among the classes of shares. |
| (e) | Includes interest expense that amounts to less than 0.01% |
| 2017 Annual Report | 97 |
Financial Highlights (continued)
Selected Data for Each Share of Capital Outstanding Throughout the Periods Indicated
Aberdeen Emerging Markets Fund
| Investment Activities | Distributions | |||||||||||||||||||||||||||||||
| Net Asset Value, Beginning of Period | Net Investment Income (a) | Net Realized and Unrealized Gains (Losses) on Investments | Total from Investment Activities | Net Investment Income | Net Realized Gains | Total Distributions | Net Asset Value, End of Period | |||||||||||||||||||||||||
Class A Shares | ||||||||||||||||||||||||||||||||
Year Ended October 31, 2017 | $ | 13.53 | $ | 0.10 | $ | 2.22 | $ | 2.32 | $ | (0.11 | ) | $ | – | $ | (0.11 | ) | $ | 15.74 | ||||||||||||||
Year Ended October 31, 2016 | 12.22 | 0.11 | 1.33 | 1.44 | – | (e) | (0.13 | ) | (0.13 | ) | 13.53 | |||||||||||||||||||||
Year Ended October 31, 2015 | 14.88 | 0.11 | (2.20 | ) | (2.09 | ) | (0.13 | ) | (0.44 | ) | (0.57 | ) | 12.22 | |||||||||||||||||||
Year Ended October 31, 2014 | 15.30 | 0.16 | (0.37 | ) | (0.21 | ) | (0.21 | ) | – | (0.21 | ) | 14.88 | ||||||||||||||||||||
Year Ended October 31, 2013 | 15.00 | 0.17 | 0.36 | 0.53 | (0.23 | ) | – | (0.23 | ) | 15.30 | ||||||||||||||||||||||
Class C Shares | ||||||||||||||||||||||||||||||||
Year Ended October 31, 2017 | 13.35 | 0.02 | 2.21 | 2.23 | (0.03 | ) | – | (0.03 | ) | 15.55 | ||||||||||||||||||||||
Year Ended October 31, 2016 | 12.14 | 0.03 | 1.31 | 1.34 | – | (0.13 | ) | (0.13 | ) | 13.35 | ||||||||||||||||||||||
Year Ended October 31, 2015 | 14.79 | 0.02 | (2.17 | ) | (2.15 | ) | (0.06 | ) | (0.44 | ) | (0.50 | ) | 12.14 | |||||||||||||||||||
Year Ended October 31, 2014 | 15.23 | 0.05 | (0.36 | ) | (0.31 | ) | (0.13 | ) | – | (0.13 | ) | 14.79 | ||||||||||||||||||||
Year Ended October 31, 2013 | 14.95 | 0.09 | 0.34 | 0.43 | (0.15 | ) | – | (0.15 | ) | 15.23 | ||||||||||||||||||||||
Class R Shares | ||||||||||||||||||||||||||||||||
Year Ended October 31, 2017 | 13.43 | 0.08 | 2.19 | 2.27 | (0.09 | ) | – | (0.09 | ) | 15.61 | ||||||||||||||||||||||
Year Ended October 31, 2016 | 12.17 | 0.08 | 1.31 | 1.39 | – | (0.13 | ) | (0.13 | ) | 13.43 | ||||||||||||||||||||||
Year Ended October 31, 2015 | 14.83 | 0.06 | (2.19 | ) | (2.13 | ) | (0.09 | ) | (0.44 | ) | (0.53 | ) | 12.17 | |||||||||||||||||||
Year Ended October 31, 2014 | 15.27 | 0.11 | (0.38 | ) | (0.27 | ) | (0.17 | ) | – | (0.17 | ) | 14.83 | ||||||||||||||||||||
Year Ended October 31, 2013 | 14.98 | 0.14 | 0.35 | 0.49 | (0.20 | ) | – | (0.20 | ) | 15.27 | ||||||||||||||||||||||
Institutional Service Class Shares | ||||||||||||||||||||||||||||||||
Year Ended October 31, 2017 | 13.55 | 0.14 | 2.23 | 2.37 | (0.14 | ) | – | (0.14 | ) | 15.78 | ||||||||||||||||||||||
Year Ended October 31, 2016 | 12.22 | 0.14 | 1.33 | 1.47 | (0.01 | ) | (0.13 | ) | (0.14 | ) | 13.55 | |||||||||||||||||||||
Year Ended October 31, 2015 | 14.89 | 0.18 | (2.25 | ) | (2.07 | ) | (0.16 | ) | (0.44 | ) | (0.60 | ) | 12.22 | |||||||||||||||||||
Year Ended October 31, 2014 | 15.30 | 0.13 | (0.33 | ) | (0.20 | ) | (0.21 | ) | – | (0.21 | ) | 14.89 | ||||||||||||||||||||
Year Ended October 31, 2013 | 14.99 | 0.19 | 0.35 | 0.54 | (0.23 | ) | – | (0.23 | ) | 15.30 | ||||||||||||||||||||||
Institutional Class Shares | ||||||||||||||||||||||||||||||||
Year Ended October 31, 2017 | 13.58 | 0.17 | 2.22 | 2.39 | (0.16 | ) | – | (0.16 | ) | 15.81 | ||||||||||||||||||||||
Year Ended October 31, 2016 | 12.24 | 0.16 | 1.33 | 1.49 | (0.02 | ) | (0.13 | ) | (0.15 | ) | 13.58 | |||||||||||||||||||||
Year Ended October 31, 2015 | 14.90 | 0.16 | (2.20 | ) | (2.04 | ) | (0.18 | ) | (0.44 | ) | (0.62 | ) | 12.24 | |||||||||||||||||||
Year Ended October 31, 2014 | 15.31 | 0.20 | (0.35 | ) | (0.15 | ) | (0.26 | ) | – | (0.26 | ) | 14.90 | ||||||||||||||||||||
Year Ended October 31, 2013 | 15.02 | 0.22 | 0.36 | 0.58 | (0.29 | ) | – | (0.29 | ) | 15.31 | ||||||||||||||||||||||
| (a) | Net investment income/(loss) is based on average shares outstanding during the period. |
| (b) | Excludes sales charge. |
| (c) | During the period, certain fees were waived and/or reimbursed. If such waivers/reimbursements had not occurred, the ratios would have been as indicated. |
Amounts listed as “–” are $0 or round to $0.
See accompanying Notes to Financial Statements.
| 98 | Annual Report 2017 |
Financial Highlights (continued)
Selected Data for Each Share of Capital Outstanding Throughout the Periods Indicated
Aberdeen Emerging Markets Fund (concluded)
| Ratios/Supplemental Data | ||||||||||||||||||||||
| Total Return (b) | Net Assets at End of Period (000’s) | Ratio of Expenses (Net of Reimbursements/Waivers) to Average Net Assets | Ratio of Expenses (Prior to Reimbursements) to Average Net Assets (c) | Ratio of Net Investment Income to Average Net Assets | Portfolio Turnover (d) | |||||||||||||||||
| 17.39 | % | $ | 208,084 | 1.56 | % | 1.56 | % | 0.70 | % | 16.55 | % | |||||||||||
| 12.04 | % | 188,315 | 1.48 | %(f) | 1.49 | %(f) | 0.91 | % | 9.19 | % | ||||||||||||
| (14.28 | %) | 192,039 | 1.44 | %(f) | 1.47 | %(f) | 0.81 | % | 11.58 | % | ||||||||||||
| (1.37 | %) | 341,483 | 1.41 | % | 1.43 | % | 1.05 | % | 5.00 | % | ||||||||||||
| 3.50 | % | 417,896 | 1.43 | % | 1.43 | % | 1.13 | % | 2.79 | % | ||||||||||||
| 16.75 | % | 28,618 | 2.10 | % | 2.28 | % | 0.16 | % | 16.55 | % | ||||||||||||
| 11.26 | % | 25,054 | 2.10 | %(f) | 2.20 | %(f) | 0.28 | % | 9.19 | % | ||||||||||||
| (14.80 | %) | 30,850 | 2.10 | %(f) | 2.13 | %(f) | 0.17 | % | 11.58 | % | ||||||||||||
| (2.04 | %) | 45,077 | 2.10 | % | 2.12 | % | 0.36 | % | 5.00 | % | ||||||||||||
| 2.85 | % | 49,826 | 2.10 | % | 2.10 | % | 0.60 | % | 2.79 | % | ||||||||||||
| 17.13 | % | 79,767 | 1.78 | % | 1.78 | % | 0.55 | % | 16.55 | % | ||||||||||||
| 11.65 | % | 47,410 | 1.77 | %(f) | 1.78 | %(f) | 0.69 | % | 9.19 | % | ||||||||||||
| (14.59 | %) | 33,881 | 1.83 | %(f) | 1.86 | %(f) | 0.46 | % | 11.58 | % | ||||||||||||
| (1.76 | %) | 31,720 | 1.79 | % | 1.81 | % | 0.76 | % | 5.00 | % | ||||||||||||
| 3.26 | % | 22,968 | 1.74 | % | 1.74 | % | 0.90 | % | 2.79 | % | ||||||||||||
| 17.75 | % | 205,880 | 1.28 | % | 1.28 | % | 0.96 | % | 16.55 | % | ||||||||||||
| 12.25 | % | 333,964 | 1.28 | %(f) | 1.29 | %(f) | 1.13 | % | 9.19 | % | ||||||||||||
| (14.20 | %) | 409,406 | 1.32 | %(f) | 1.35 | %(f) | 1.35 | % | 11.58 | % | ||||||||||||
| (1.29 | %) | 234,846 | 1.34 | % | 1.36 | % | 0.90 | % | 5.00 | % | ||||||||||||
| 3.61 | % | 443,469 | 1.35 | % | 1.35 | % | 1.22 | % | 2.79 | % | ||||||||||||
| 17.89 | % | 8,179,870 | 1.10 | % | 1.13 | % | 1.17 | % | 16.55 | % | ||||||||||||
| 12.41 | %(g) | 7,365,757 | 1.10 | %(f) | 1.14 | %(f) | 1.32 | % | 9.19 | % | ||||||||||||
| (13.98 | %)(g) | 6,963,195 | 1.10 | %(f) | 1.13 | %(f) | 1.15 | % | 11.58 | % | ||||||||||||
| (1.01 | %) | 9,389,216 | 1.10 | % | 1.12 | % | 1.35 | % | 5.00 | % | ||||||||||||
| 3.86 | % | 11,114,896 | 1.10 | % | 1.10 | % | 1.43 | % | 2.79 | % | ||||||||||||
| (d) | Portfolio turnover is calculated on the basis of the Fund as a whole without distinguishing among the classes of shares. |
| (e) | Less than $0.005 per share. |
| (f) | Includes interest expense that amounts to less than 0.01%. |
| (g) | The total return shown above includes the impact of financial statement rounding of the NAV per share and/or financial statement adjustments. |
| 2017 Annual Report | 99 |
Financial Highlights (continued)
Selected Data for Each Share of Capital Outstanding Throughout the Periods Indicated
Aberdeen Focused U.S. Equity Fund
| Investment Activities | Distributions | |||||||||||||||||||||||||||
| Net Asset Value, Beginning of Period | Net Investment Income (Loss) (a) | Net Realized and Unrealized Gains (Losses) on Investments | Total from Investment Activities | Net Realized Gains | Total Distributions | Net Asset Value, End of Period | ||||||||||||||||||||||
Class A Shares | ||||||||||||||||||||||||||||
Year Ended October 31, 2017 | $ | 8.81 | $ | (0.12 | ) | $ | 0.90 | $ | 0.78 | $ | (1.07 | ) | $ | (1.07 | ) | $ | 8.52 | |||||||||||
Year Ended October 31, 2016 | 10.30 | (0.15 | ) | (0.04 | ) | (0.19 | ) | (1.30 | ) | (1.30 | ) | 8.81 | ||||||||||||||||
Year Ended October 31, 2015 | 12.26 | (0.13 | ) | 0.26 | 0.13 | (2.09 | ) | (2.09 | ) | 10.30 | ||||||||||||||||||
Year Ended October 31, 2014 | 12.12 | (0.13 | ) | 0.48 | 0.35 | (0.21 | ) | (0.21 | ) | 12.26 | ||||||||||||||||||
Year Ended October 31, 2013 | 11.29 | (0.14 | ) | 1.10 | 0.96 | (0.13 | ) | (0.13 | ) | 12.12 | ||||||||||||||||||
Class C Shares | ||||||||||||||||||||||||||||
Year Ended October 31, 2017 | 4.92 | (0.09 | ) | 0.46 | 0.37 | (1.07 | ) | (1.07 | ) | 4.22 | ||||||||||||||||||
Year Ended October 31, 2016 | 6.38 | (0.12 | ) | (0.04 | ) | (0.16 | ) | (1.30 | ) | (1.30 | ) | 4.92 | ||||||||||||||||
Year Ended October 31, 2015 | 8.43 | (0.13 | ) | 0.17 | 0.04 | (2.09 | ) | (2.09 | ) | 6.38 | ||||||||||||||||||
Year Ended October 31, 2014 | 8.45 | (0.15 | ) | 0.34 | 0.19 | (0.21 | ) | (0.21 | ) | 8.43 | ||||||||||||||||||
Year Ended October 31, 2013 | 7.96 | (0.15 | ) | 0.77 | 0.62 | (0.13 | ) | (0.13 | ) | 8.45 | ||||||||||||||||||
Class R Shares | ||||||||||||||||||||||||||||
Year Ended October 31, 2017 | 8.25 | (0.13 | ) | 0.83 | 0.70 | (1.07 | ) | (1.07 | ) | 7.88 | ||||||||||||||||||
Year Ended October 31, 2016 | 9.76 | (0.17 | ) | (0.04 | ) | (0.21 | ) | (1.30 | ) | (1.30 | ) | 8.25 | ||||||||||||||||
Year Ended October 31, 2015 | 11.77 | (0.16 | ) | 0.24 | 0.08 | (2.09 | ) | (2.09 | ) | 9.76 | ||||||||||||||||||
Year Ended October 31, 2014 | 11.69 | (0.18 | ) | 0.47 | 0.29 | (0.21 | ) | (0.21 | ) | 11.77 | ||||||||||||||||||
Year Ended October 31, 2013 | 10.94 | (0.18 | ) | 1.06 | 0.88 | (0.13 | ) | (0.13 | ) | 11.69 | ||||||||||||||||||
Institutional Service Class Shares | ||||||||||||||||||||||||||||
Year Ended October 31, 2017 | 9.00 | (0.10 | ) | 0.92 | 0.82 | (1.07 | ) | (1.07 | ) | 8.75 | ||||||||||||||||||
Year Ended October 31, 2016 | 10.48 | (0.14 | ) | (0.04 | ) | (0.18 | ) | (1.30 | ) | (1.30 | ) | 9.00 | ||||||||||||||||
Year Ended October 31, 2015 | 12.44 | (0.12 | ) | 0.25 | 0.13 | (2.09 | ) | (2.09 | ) | 10.48 | ||||||||||||||||||
Year Ended October 31, 2014 | 12.28 | (0.12 | ) | 0.49 | 0.37 | (0.21 | ) | (0.21 | ) | 12.44 | ||||||||||||||||||
Year Ended October 31, 2013 | 11.43 | (0.12 | ) | 1.10 | 0.98 | (0.13 | ) | (0.13 | ) | 12.28 | ||||||||||||||||||
Institutional Class Shares | ||||||||||||||||||||||||||||
Year Ended October 31, 2017 | 9.17 | (0.10 | ) | 0.95 | 0.85 | (1.07 | ) | (1.07 | ) | 8.95 | ||||||||||||||||||
Year Ended October 31, 2016 | 10.64 | (0.13 | ) | (0.04 | ) | (0.17 | ) | (1.30 | ) | (1.30 | ) | 9.17 | ||||||||||||||||
Year Ended October 31, 2015 | 12.56 | (0.10 | ) | 0.27 | 0.17 | (2.09 | ) | (2.09 | ) | 10.64 | ||||||||||||||||||
Year Ended October 31, 2014 | 12.37 | (0.10 | ) | 0.50 | 0.40 | (0.21 | ) | (0.21 | ) | 12.56 | ||||||||||||||||||
Year Ended October 31, 2013 | 11.48 | (0.10 | ) | 1.12 | 1.02 | (0.13 | ) | (0.13 | ) | 12.37 | ||||||||||||||||||
| (a) | Net investment income/(loss) is based on average shares outstanding during the period. |
| (b) | Excludes sales charge. |
| (c) | During the period, certain fees were waived and/or reimbursed. If such waivers/reimbursements had not occurred, the ratios would have been as indicated. |
| (d) | Indicates the dividend expense charged for the period to average net assets. |
Amounts listed as “–” are $0 or round to $0.
See accompanying Notes to Financial Statements.
| 100 | Annual Report 2017 |
Financial Highlights (continued)
Selected Data for Each Share of Capital Outstanding Throughout the Periods Indicated
Aberdeen Focused U.S. Equity Fund (concluded)
| Ratios/Supplemental Data | ||||||||||||||||||||||||||
| Total Return (b) | Net Assets at End of Period (000’s) | Ratio of Expenses (Net of Reimbursements/Waivers) to Average Net Assets | Ratio of Expenses (Prior to Reimbursements) to Average Net Assets (c) | Ratio of Net Investment Income (Loss) to Average Net Assets | Dividend Expense (d)(e) | Portfolio Turnover (f) | ||||||||||||||||||||
| 9.69 | % | $ | 9,479 | 2.80 | %(g) | 3.22 | %(g) | (1.39 | %) | 1.18 | % | 35.38 | % | |||||||||||||
| (1.68 | %) | 11,397 | 3.04 | % | 3.28 | % | (1.70 | %) | 1.45 | % | 36.34 | % | ||||||||||||||
| 1.18 | % | 16,869 | 2.93 | %(g) | 3.12 | %(g) | (1.21 | %) | 1.36 | % | 14.04 | % | ||||||||||||||
| 2.90 | % | 30,368 | 2.64 | % | 2.79 | % | (1.09 | %) | 1.08 | % | 31.13 | % | ||||||||||||||
| 8.54 | % | 62,819 | 2.62 | % | 2.72 | % | (1.15 | %) | 1.04 | % | 41.95 | % | ||||||||||||||
| 8.89 | % | 1,837 | 3.47 | %(g) | 4.09 | %(g) | (2.05 | %) | 1.21 | % | 35.38 | % | ||||||||||||||
| (2.35 | %) | 3,430 | 3.69 | % | 4.02 | % | (2.33 | %) | 1.44 | % | 36.34 | % | ||||||||||||||
| 0.51 | % | 7,480 | 3.61 | %(g) | 3.80 | %(g) | (1.90 | %) | 1.35 | % | 14.04 | % | ||||||||||||||
| 2.26 | % | 10,162 | 3.36 | % | 3.51 | % | (1.81 | %) | 1.11 | % | 31.13 | % | ||||||||||||||
| 7.83 | % | 12,104 | 3.32 | % | 3.42 | % | (1.85 | %) | 1.05 | % | 41.95 | % | ||||||||||||||
| 9.35 | % | 2,269 | 3.14 | %(g) | 3.56 | %(g) | (1.72 | %) | 1.18 | % | 35.38 | % | ||||||||||||||
| (2.01 | %) | 2,633 | 3.34 | % | 3.58 | % | (2.01 | %) | 1.44 | % | 36.34 | % | ||||||||||||||
| 0.74 | % | 3,202 | 3.35 | %(g) | 3.54 | %(g) | (1.65 | %) | 1.34 | % | 14.04 | % | ||||||||||||||
| 2.49 | % | 3,437 | 3.12 | % | 3.27 | % | (1.56 | %) | 1.12 | % | 31.13 | % | ||||||||||||||
| 8.07 | % | 2,759 | 3.01 | % | 3.12 | % | (1.55 | %) | 1.01 | % | 41.95 | % | ||||||||||||||
| 9.96 | % | 840 | 2.62 | %(g) | 3.04 | %(g) | (1.21 | %) | 1.17 | % | 35.38 | % | ||||||||||||||
| (1.54 | %) | 693 | 2.85 | % | 3.10 | % | (1.54 | %) | 1.43 | % | 36.34 | % | ||||||||||||||
| 1.16 | % | 789 | 2.86 | %(g) | 3.05 | %(g) | (1.13 | %) | 1.35 | % | 14.04 | % | ||||||||||||||
| 3.03 | % | 1,871 | 2.59 | % | 2.75 | % | (1.02 | %) | 1.09 | % | 31.13 | % | ||||||||||||||
| 8.61 | % | 3,551 | 2.47 | % | 2.59 | % | (1.00 | %) | 0.99 | % | 41.95 | % | ||||||||||||||
| 10.12 | % | 12,413 | 2.56 | %(g) | 3.07 | %(g) | (1.13 | %) | 1.30 | % | 35.38 | % | ||||||||||||||
| (1.40 | %) | 52,527 | 2.71 | % | 3.01 | % | (1.36 | %) | 1.46 | % | 36.34 | % | ||||||||||||||
| 1.52 | % | 92,887 | 2.61 | %(g) | 2.80 | %(g) | (0.89 | %) | 1.36 | % | 14.04 | % | ||||||||||||||
| 3.26 | % | 303,638 | 2.33 | % | 2.49 | % | (0.78 | %) | 1.08 | % | 31.13 | % | ||||||||||||||
| 8.92 | % | 581,327 | 2.29 | % | 2.40 | % | (0.82 | %) | 1.03 | % | 41.95 | % | ||||||||||||||
| (e) | Dividend expense ratio includes broker related expenses for securities sold short. |
| (f) | Portfolio turnover is calculated on the basis of the Fund as a whole without distinguishing among the classes of shares. |
| (g) | Includes interest expense that amounts to 0.01% for Class A, Class C, Class R, Institutional Service Class and Institutional Class for the year ended October 31, 2017. Includes interest expense that amounts to less than 0.01% for Class A, Class C, Class R, Institutional Service Class and Institutional Class for the year ended October 31, 2015. |
| 2017 Annual Report | 101 |
Financial Highlights (continued)
Selected Data for Each Share of Capital Outstanding Throughout the Periods Indicated
Aberdeen Global Equity Fund
| Investment Activities | Distributions | |||||||||||||||||||||||||||
| Net Asset Value, Beginning of Period | Net Investment Income (a) | Net Realized and Unrealized Gains (Losses) on Investments | Total from Investment Activities | Net Investment Income | Total Distributions | Net Asset Value, End of Period | ||||||||||||||||||||||
Class A Shares | ||||||||||||||||||||||||||||
Year Ended October 31, 2017 | $ | 12.35 | $ | 0.10 | $ | 2.30 | $ | 2.40 | $ | (0.09 | ) | $ | (0.09 | ) | $ | 14.66 | ||||||||||||
Year Ended October 31, 2016 | 12.15 | 0.10 | 0.13 | 0.23 | (0.03 | ) | (0.03 | ) | 12.35 | |||||||||||||||||||
Year Ended October 31, 2015 | 13.83 | 0.17 | (1.66 | ) | (1.49 | ) | (0.19 | ) | (0.19 | ) | 12.15 | |||||||||||||||||
Year Ended October 31, 2014 | 13.83 | 0.45 | 0.01 | 0.46 | (0.46 | ) | (0.46 | ) | 13.83 | |||||||||||||||||||
Year Ended October 31, 2013 | 12.01 | 0.18 | 1.80 | 1.98 | (0.16 | ) | (0.16 | ) | 13.83 | |||||||||||||||||||
Class C Shares | ||||||||||||||||||||||||||||
Year Ended October 31, 2017 | 11.65 | 0.01 | 2.18 | 2.19 | (0.06 | ) | (0.06 | ) | 13.78 | |||||||||||||||||||
Year Ended October 31, 2016 | 11.52 | 0.02 | 0.12 | 0.14 | (0.01 | ) | (0.01 | ) | 11.65 | |||||||||||||||||||
Year Ended October 31, 2015 | 13.13 | 0.06 | (1.55 | ) | (1.49 | ) | (0.12 | ) | (0.12 | ) | 11.52 | |||||||||||||||||
Year Ended October 31, 2014 | 13.15 | 0.33 | 0.03 | 0.36 | (0.38 | ) | (0.38 | ) | 13.13 | |||||||||||||||||||
Year Ended October 31, 2013 | 11.44 | 0.12 | 1.68 | 1.80 | (0.09 | ) | (0.09 | ) | 13.15 | |||||||||||||||||||
Class R Shares | ||||||||||||||||||||||||||||
Year Ended October 31, 2017 | 11.88 | 0.04 | 2.22 | 2.26 | (0.10 | ) | (0.10 | ) | 14.04 | |||||||||||||||||||
Year Ended October 31, 2016 | 11.71 | 0.08 | 0.11 | 0.19 | (0.02 | ) | (0.02 | ) | 11.88 | |||||||||||||||||||
Year Ended October 31, 2015 | 13.34 | 0.12 | (1.59 | ) | (1.47 | ) | (0.16 | ) | (0.16 | ) | 11.71 | |||||||||||||||||
Year Ended October 31, 2014 | 13.36 | 0.40 | – | (f) | 0.40 | (0.42 | ) | (0.42 | ) | 13.34 | ||||||||||||||||||
Year Ended October 31, 2013 | 11.61 | 0.16 | 1.73 | 1.89 | (0.14 | ) | (0.14 | ) | 13.36 | |||||||||||||||||||
Institutional Service Class Shares | ||||||||||||||||||||||||||||
Year Ended October 31, 2017 | 12.53 | 0.13 | 2.34 | 2.47 | (0.13 | ) | (0.13 | ) | 14.87 | |||||||||||||||||||
Year Ended October 31, 2016 | 12.30 | 0.14 | 0.13 | 0.27 | (0.04 | ) | (0.04 | ) | 12.53 | |||||||||||||||||||
Year Ended October 31, 2015 | 13.86 | 0.31 | (1.78 | ) | (1.47 | ) | (0.09 | ) | (0.09 | ) | 12.30 | |||||||||||||||||
Year Ended October 31, 2014 | 13.88 | 0.44 | 0.05 | 0.49 | (0.51 | ) | (0.51 | ) | 13.86 | |||||||||||||||||||
Year Ended October 31, 2013 | 12.01 | 0.23 | 1.85 | 2.08 | (0.21 | ) | (0.21 | ) | 13.88 | |||||||||||||||||||
Institutional Class Shares | ||||||||||||||||||||||||||||
Year Ended October 31, 2017 | 12.40 | 0.16 | 2.26 | 2.42 | (0.13 | ) | (0.13 | ) | 14.69 | |||||||||||||||||||
Year Ended October 31, 2016 | 12.16 | 0.14 | 0.14 | 0.28 | (0.04 | ) | (0.04 | ) | 12.40 | |||||||||||||||||||
Year Ended October 31, 2015 | 13.84 | 0.14 | (1.59 | ) | (1.45 | ) | (0.23 | ) | (0.23 | ) | 12.16 | |||||||||||||||||
Year Ended October 31, 2014 | 13.84 | 0.47 | 0.04 | 0.51 | (0.51 | ) | (0.51 | ) | 13.84 | |||||||||||||||||||
Year Ended October 31, 2013 | 12.02 | 0.25 | 1.78 | 2.03 | (0.21 | ) | (0.21 | ) | 13.84 | |||||||||||||||||||
| (a) | Net investment income/(loss) is based on average shares outstanding during the period. |
| (b) | Excludes sales charge. |
| (c) | During the period, certain fees were waived and/or reimbursed. If such waivers/reimbursements had not occurred, the ratios would have been as indicated. |
| (d) | Portfolio turnover is calculated on the basis of the Fund as a whole without distinguishing among the classes of shares. |
Amounts listed as “–” are $0 or round to $0.
See accompanying Notes to Financial Statements.
| 102 | Annual Report 2017 |
Financial Highlights (continued)
Selected Data for Each Share of Capital Outstanding Throughout the Periods Indicated
Aberdeen Global Equity Fund (concluded)
| Ratios/Supplemental Data | ||||||||||||||||||||||
| Total Return (b) | Net Assets at End of Period (000’s) | Ratio of Expenses (Net of Reimbursements/Waivers) to Average Net Assets | Ratio of Expenses (Prior to Reimbursements) to Average Net Assets (c) | Ratio of Net Investment Income to Average Net Assets | Portfolio Turnover (d) | |||||||||||||||||
| 19.58 | % | $ | 34,296 | 1.56 | %(e) | 1.68 | %(e) | 0.71 | % | 24.98 | % | |||||||||||
| 1.93 | % | 48,350 | 1.56 | %(e) | 1.63 | %(e) | 0.82 | % | 21.59 | % | ||||||||||||
| (10.85 | %) | 58,730 | 1.55 | %(e) | 1.61 | %(e) | 1.33 | % | 31.45 | % | ||||||||||||
| 3.37 | % | 73,230 | 1.56 | % | 1.56 | % | 3.22 | % | 24.09 | % | ||||||||||||
| 16.59 | % | 83,800 | 1.57 | % | 1.57 | % | 1.42 | % | 12.87 | % | ||||||||||||
| 18.85 | % | 2,181 | 2.19 | %(e) | 2.51 | %(e) | 0.06 | % | 24.98 | % | ||||||||||||
| 1.24 | % | 1,495 | 2.19 | %(e) | 2.36 | %(e) | 0.20 | % | 21.59 | % | ||||||||||||
| (11.43 | %) | 1,729 | 2.20 | %(e) | 2.26 | %(e) | 0.45 | % | 31.45 | % | ||||||||||||
| 2.78 | % | 4,165 | 2.19 | % | 2.19 | % | 2.50 | % | 24.09 | % | ||||||||||||
| 15.83 | % | 5,278 | 2.19 | % | 2.19 | % | 0.96 | % | 12.87 | % | ||||||||||||
| 19.15 | % | 3,107 | 1.90 | %(e) | 2.02 | %(e) | 0.31 | % | 24.98 | % | ||||||||||||
| 1.64 | % | 1,348 | 1.84 | %(e) | 1.91 | %(e) | 0.66 | % | 21.59 | % | ||||||||||||
| (11.13 | %) | 1,457 | 1.88 | %(e) | 1.94 | %(e) | 0.96 | % | 31.45 | % | ||||||||||||
| 3.06 | % | 1,986 | 1.85 | % | 1.85 | % | 2.96 | % | 24.09 | % | ||||||||||||
| 16.35 | % | 2,312 | 1.76 | % | 1.76 | % | 1.26 | % | 12.87 | % | ||||||||||||
| 19.97 | % | 570 | 1.29 | %(e) | 1.41 | %(e) | 0.94 | % | 24.98 | % | ||||||||||||
| 2.26 | % | 1 | 1.19 | %(e) | 1.26 | %(e) | 1.17 | % | 21.59 | % | ||||||||||||
| (10.60 | %) | 1 | 1.26 | %(e) | 1.33 | %(e) | 2.29 | % | 31.45 | % | ||||||||||||
| 3.62 | %(g) | 2 | 1.19 | % | 1.19 | % | 3.12 | % | 24.09 | % | ||||||||||||
| 17.44 | %(g) | 1 | 1.19 | % | 1.20 | % | 1.80 | % | 12.87 | % | ||||||||||||
| 19.75 | % | 2,699 | 1.19 | %(e) | 1.32 | %(e) | 1.21 | % | 24.98 | % | ||||||||||||
| 2.36 | % | 36,167 | 1.19 | %(e) | 1.27 | %(e) | 1.19 | % | 21.59 | % | ||||||||||||
| (10.55 | %) | 30,678 | 1.19 | %(e) | 1.25 | %(e) | 1.08 | % | 31.45 | % | ||||||||||||
| 3.77 | %(g) | 78,381 | 1.19 | % | 1.19 | % | 3.36 | % | 24.09 | % | ||||||||||||
| 17.01 | %(g) | 67,843 | 1.19 | % | 1.19 | % | 1.89 | % | 12.87 | % | ||||||||||||
| (e) | Includes interest expense that amounts to less than 0.01%. |
| (f) | Less than $0.005 per share. |
| (g) | The total return shown above includes the impact of financial statement rounding of the NAV per share and/or financial statement adjustments. |
| 2017 Annual Report | 103 |
Financial Highlights (continued)
Selected Data for Each Share of Capital Outstanding Throughout the Periods Indicated
Aberdeen International Equity Fund
| Investment Activities | Distributions | |||||||||||||||||||||||||||
| Net Asset Value, Beginning of Period | Net Investment Income (a) | Net Realized and Unrealized Gains (Losses) on Investments | Total from Investment Activities | Net Investment Income | Total Distributions | Net Asset Value, End of Period | ||||||||||||||||||||||
Class A Shares | ||||||||||||||||||||||||||||
Year Ended October 31, 2017 | $ | 12.70 | $ | 0.15 | $ | 2.36 | $ | 2.51 | $ | (0.17 | ) | $ | (0.17 | ) | $ | 15.04 | ||||||||||||
Year Ended October 31, 2016 | 12.52 | 0.18 | 0.04 | 0.22 | (0.04 | ) | (0.04 | ) | 12.70 | |||||||||||||||||||
Year Ended October 31, 2015 | 14.85 | 0.23 | (2.29 | ) | (2.06 | ) | (0.27 | ) | (0.27 | ) | 12.52 | |||||||||||||||||
Year Ended October 31, 2014 | 15.34 | 0.50 | (0.42 | ) | 0.08 | (0.57 | ) | (0.57 | ) | 14.85 | ||||||||||||||||||
Year Ended October 31, 2013 | 13.57 | 0.26 | 1.73 | 1.99 | (0.22 | ) | (0.22 | ) | 15.34 | |||||||||||||||||||
Class C Shares | ||||||||||||||||||||||||||||
Year Ended October 31, 2017 | 11.89 | 0.04 | 2.23 | 2.27 | (0.07 | ) | (0.07 | ) | 14.09 | |||||||||||||||||||
Year Ended October 31, 2016 | 11.79 | 0.08 | 0.03 | 0.11 | (0.01 | ) | (0.01 | ) | 11.89 | |||||||||||||||||||
Year Ended October 31, 2015 | 14.01 | 0.13 | (2.16 | ) | (2.03 | ) | (0.19 | ) | (0.19 | ) | 11.79 | |||||||||||||||||
Year Ended October 31, 2014 | 14.51 | 0.39 | (0.42 | ) | (0.03 | ) | (0.47 | ) | (0.47 | ) | 14.01 | |||||||||||||||||
Year Ended October 31, 2013 | 12.86 | 0.15 | 1.64 | 1.79 | (0.14 | ) | (0.14 | ) | 14.51 | |||||||||||||||||||
Class R Shares | ||||||||||||||||||||||||||||
Year Ended October 31, 2017 | 12.11 | 0.10 | 2.25 | 2.35 | (0.13 | ) | (0.13 | ) | 14.33 | |||||||||||||||||||
Year Ended October 31, 2016 | 11.97 | 0.12 | 0.05 | 0.17 | (0.03 | ) | (0.03 | ) | 12.11 | |||||||||||||||||||
Year Ended October 31, 2015 | 14.22 | 0.18 | (2.20 | ) | (2.02 | ) | (0.23 | ) | (0.23 | ) | 11.97 | |||||||||||||||||
Year Ended October 31, 2014 | 14.71 | 0.46 | (0.42 | ) | 0.04 | (0.53 | ) | (0.53 | ) | 14.22 | ||||||||||||||||||
Year Ended October 31, 2013 | 13.03 | 0.21 | 1.65 | 1.86 | (0.18 | ) | (0.18 | ) | 14.71 | |||||||||||||||||||
Institutional Service Class Shares | ||||||||||||||||||||||||||||
Year Ended October 31, 2017 | 12.98 | 0.19 | 2.41 | 2.60 | (0.21 | ) | (0.21 | ) | 15.37 | |||||||||||||||||||
Year Ended October 31, 2016 | 12.77 | 0.20 | 0.05 | 0.25 | (0.04 | ) | (0.04 | ) | 12.98 | |||||||||||||||||||
Year Ended October 31, 2015 | 15.16 | 0.27 | (2.36 | ) | (2.09 | ) | (0.30 | ) | (0.30 | ) | 12.77 | |||||||||||||||||
Year Ended October 31, 2014 | 15.64 | 0.56 | (0.44 | ) | 0.12 | (0.60 | ) | (0.60 | ) | 15.16 | ||||||||||||||||||
Year Ended October 31, 2013 | 13.84 | 0.28 | 1.77 | 2.05 | (0.25 | ) | (0.25 | ) | 15.64 | |||||||||||||||||||
Institutional Class Shares | ||||||||||||||||||||||||||||
Year Ended October 31, 2017 | 13.04 | 0.20 | 2.42 | 2.62 | (0.23 | ) | (0.23 | ) | 15.43 | |||||||||||||||||||
Year Ended October 31, 2016 | 12.82 | 0.22 | 0.05 | 0.27 | (0.05 | ) | (0.05 | ) | 13.04 | |||||||||||||||||||
Year Ended October 31, 2015 | 15.21 | 0.29 | (2.36 | ) | (2.07 | ) | (0.32 | ) | (0.32 | ) | 12.82 | |||||||||||||||||
Year Ended October 31, 2014 | 15.70 | 0.58 | (0.45 | ) | 0.13 | (0.62 | ) | (0.62 | ) | 15.21 | ||||||||||||||||||
Year Ended October 31, 2013 | 13.88 | 0.32 | 1.76 | 2.08 | (0.26 | ) | (0.26 | ) | 15.70 | |||||||||||||||||||
| (a) | Net investment income/(loss) is based on average shares outstanding during the period. |
| (b) | Excludes sales charge. |
| (c) | During the period, certain fees were waived and/or reimbursed. If such waivers/reimbursements had not occurred, the ratios would have been as indicated. |
Amounts listed as “–” are $0 or round to $0.
See accompanying Notes to Financial Statements.
| 104 | Annual Report 2017 |
Financial Highlights (continued)
Selected Data for Each Share of Capital Outstanding Throughout the Periods Indicated
Aberdeen International Equity Fund (concluded)
| Ratios/Supplemental Data | ||||||||||||||||||||||
| Total Return (b) | Net Assets at End of Period (000’s) | Ratio of Expenses (Net of Reimbursements/Waivers) to Average Net Assets | Ratio of Expenses (Prior to Reimbursements) to Average Net Assets (c) | Ratio of Net Investment Income to Average Net Assets | Portfolio Turnover (d) | |||||||||||||||||
| 20.05 | % | $ | 39,619 | 1.39 | % | 1.39 | % | 1.09 | % | 13.11 | % | |||||||||||
| 1.76 | % | 47,736 | 1.39 | %(e) | 1.39 | %(e) | 1.49 | % | 27.99 | % | ||||||||||||
| (14.02 | %) | 91,902 | 1.32 | %(e)(f) | 1.35 | %(e) | 1.65 | %(f) | 14.52 | % | ||||||||||||
| 0.49 | % | 148,018 | 1.33 | % | 1.33 | % | 3.30 | % | 10.08 | % | ||||||||||||
| 14.75 | % | 222,275 | 1.33 | % | 1.33 | % | 1.77 | % | 23.35 | % | ||||||||||||
| 19.27 | % | 12,375 | 2.10 | % | 2.18 | % | 0.35 | % | 13.11 | % | ||||||||||||
| 0.97 | % | 14,400 | 2.10 | %(e) | 2.12 | %(e) | 0.70 | % | 27.99 | % | ||||||||||||
| (14.61 | %) | 22,999 | 2.01 | %(e)(f) | 2.04 | %(e) | 0.97 | %(f) | 14.52 | % | ||||||||||||
| (0.24 | %) | 35,696 | 2.03 | % | 2.03 | % | 2.68 | % | 10.08 | % | ||||||||||||
| 14.02 | % | 42,861 | 2.01 | % | 2.01 | % | 1.08 | % | 23.35 | % | ||||||||||||
| 19.70 | % | 7,335 | 1.70 | % | 1.70 | % | 0.75 | % | 13.11 | % | ||||||||||||
| 1.42 | % | 7,647 | 1.67 | %(e) | 1.67 | %(e) | 1.08 | % | 27.99 | % | ||||||||||||
| (14.32 | %) | 14,095 | 1.62 | %(e)(f) | 1.65 | %(e) | 1.34 | %(f) | 14.52 | % | ||||||||||||
| 0.26 | % | 16,938 | 1.62 | % | 1.62 | % | 3.13 | % | 10.08 | % | ||||||||||||
| 14.42 | % | 17,303 | 1.59 | % | 1.59 | % | 1.51 | % | 23.35 | % | ||||||||||||
| 20.46 | % | 106,424 | 1.08 | % | 1.08 | % | 1.35 | % | 13.11 | % | ||||||||||||
| 2.01 | % | 101,655 | 1.14 | %(e) | 1.14 | %(e) | 1.62 | % | 27.99 | % | ||||||||||||
| (13.97 | %) | 156,489 | 1.15 | %(e)(f) | 1.18 | %(e) | 1.89 | %(f) | 14.52 | % | ||||||||||||
| 0.75 | % | 185,166 | 1.16 | % | 1.16 | % | 3.57 | % | 10.08 | % | ||||||||||||
| 14.91 | % | 206,212 | 1.13 | % | 1.13 | % | 1.92 | % | 23.35 | % | ||||||||||||
| 20.47 | % | 367,341 | 1.02 | % | 1.02 | % | 1.43 | % | 13.11 | % | ||||||||||||
| 2.14 | % | 286,659 | 1.04 | %(e) | 1.04 | %(e) | 1.75 | % | 27.99 | % | ||||||||||||
| (13.80 | %) | 332,542 | 1.01 | %(e)(f) | 1.04 | %(e) | 2.04 | %(f) | 14.52 | % | ||||||||||||
| 0.81 | % | 496,344 | 1.03 | % | 1.03 | % | 3.73 | % | 10.08 | % | ||||||||||||
| 15.14 | % | 558,986 | 1.01 | % | 1.01 | % | 2.13 | % | 23.35 | % | ||||||||||||
| (d) | Portfolio turnover is calculated on the basis of the Fund as a whole without distinguishing among the classes of shares. |
| (e) | Includes interest expense that amounts to less than 0.01%. |
| (f) | Includes 0.03% reimbursement from Aberdeen relating to certain Transfer Agent expenses paid by the Fund that are not attributable to the Fund. |
| 2017 Annual Report | 105 |
Financial Highlights (continued)
Selected Data for Each Share of Capital Outstanding Throughout the Periods Indicated
Aberdeen International Small Cap Fund
| Investment Activities | Distributions | |||||||||||||||||||||||||||||||||||
| Net Asset Value, Beginning of Period | Net Investment Income (Loss) (a) | Net Realized and Unrealized Gains (Losses) on Investments | Total from Investment Activities | Net Investment Income | Net Realized Gains | Total Distributions | Redemption Fees | Net Asset Value, End of Period | ||||||||||||||||||||||||||||
Class A Shares | ||||||||||||||||||||||||||||||||||||
Year Ended October 31, 2017 | $ | 25.97 | $ | 0.11 | $ | 5.49 | $ | 5.60 | $ | (0.14 | ) | $ | (0.08 | ) | $ | (0.22 | ) | $ | – | $ | 31.35 | |||||||||||||||
Year Ended October 31, 2016 | 26.87 | 0.13 | 1.61 | 1.74 | (0.12 | ) | (2.52 | ) | (2.64 | ) | – | 25.97 | ||||||||||||||||||||||||
Year Ended October 31, 2015 | 29.64 | 0.48 | (1.17 | ) | (0.69 | ) | (0.52 | ) | (1.56 | ) | (2.08 | ) | – | 26.87 | ||||||||||||||||||||||
Year Ended October 31, 2014 | 28.71 | 0.19 | 1.32 | 1.51 | (0.27 | ) | (0.31 | ) | (0.58 | ) | – | 29.64 | ||||||||||||||||||||||||
Year Ended October 31, 2013 | 25.95 | 0.17 | 2.65 | 2.82 | (0.07 | ) | – | (0.07 | ) | 0.01 | 28.71 | |||||||||||||||||||||||||
Class C Shares | ||||||||||||||||||||||||||||||||||||
Year Ended October 31, 2017 | 23.88 | (0.04 | ) | 5.02 | 4.98 | – | (0.08 | ) | (0.08 | ) | – | 28.78 | ||||||||||||||||||||||||
Year Ended October 31, 2016 | 25.04 | (0.05 | ) | 1.50 | 1.45 | (0.09 | ) | (2.52 | ) | (2.61 | ) | – | 23.88 | |||||||||||||||||||||||
Year Ended October 31, 2015 | 27.81 | 0.27 | (1.11 | ) | (0.84 | ) | (0.37 | ) | (1.56 | ) | (1.93 | ) | – | 25.04 | ||||||||||||||||||||||
Year Ended October 31, 2014 | 26.97 | (0.01 | ) | 1.24 | 1.23 | (0.08 | ) | (0.31 | ) | (0.39 | ) | – | 27.81 | |||||||||||||||||||||||
Year Ended October 31, 2013 | 24.50 | 0.02 | 2.46 | 2.48 | (0.02 | ) | – | (0.02 | ) | 0.01 | 26.97 | |||||||||||||||||||||||||
Class R Shares | ||||||||||||||||||||||||||||||||||||
Year Ended October 31, 2017 | 24.77 | 0.04 | 5.20 | 5.24 | (0.11 | ) | (0.08 | ) | (0.19 | ) | – | 29.82 | ||||||||||||||||||||||||
Year Ended October 31, 2016 | 25.81 | 0.05 | 1.53 | 1.58 | (0.10 | ) | (2.52 | ) | (2.62 | ) | – | 24.77 | ||||||||||||||||||||||||
Year Ended October 31, 2015 | 28.57 | 0.37 | (1.13 | ) | (0.76 | ) | (0.44 | ) | (1.56 | ) | (2.00 | ) | – | 25.81 | ||||||||||||||||||||||
Year Ended October 31, 2014 | 27.68 | 0.09 | 1.30 | 1.39 | (0.19 | ) | (0.31 | ) | (0.50 | ) | – | 28.57 | ||||||||||||||||||||||||
Year Ended October 31, 2013 | 25.06 | 0.15 | 2.51 | 2.66 | (0.05 | ) | – | (0.05 | ) | 0.01 | 27.68 | |||||||||||||||||||||||||
Institutional Service Class Shares |
| |||||||||||||||||||||||||||||||||||
Year Ended October 31, 2017 | 26.00 | 0.14 | 5.53 | 5.67 | (0.05 | ) | (0.08 | ) | (0.13 | ) | – | 31.54 | ||||||||||||||||||||||||
Year Ended October 31, 2016 | 26.87 | 0.06 | 1.71 | 1.77 | (0.12 | ) | (2.52 | ) | (2.64 | ) | – | 26.00 | ||||||||||||||||||||||||
Year Ended October 31, 2015 | 29.64 | 0.48 | (1.17 | ) | (0.69 | ) | (0.52 | ) | (1.56 | ) | (2.08 | ) | – | 26.87 | ||||||||||||||||||||||
Year Ended October 31, 2014 | 28.72 | 0.23 | 1.31 | 1.54 | (0.31 | ) | (0.31 | ) | (0.62 | ) | – | 29.64 | ||||||||||||||||||||||||
Year Ended October 31, 2013 | 25.95 | 0.31 | 2.56 | 2.87 | (0.11 | ) | – | (0.11 | ) | 0.01 | 28.72 | |||||||||||||||||||||||||
Institutional Class Shares | ||||||||||||||||||||||||||||||||||||
Year Ended October 31, 2017 | 26.04 | 0.19 | 5.49 | 5.68 | (0.21 | ) | (0.08 | ) | (0.29 | ) | – | 31.43 | ||||||||||||||||||||||||
Year Ended October 31, 2016 | 26.87 | 0.18 | 1.65 | 1.83 | (0.14 | ) | (2.52 | ) | (2.66 | ) | – | 26.04 | ||||||||||||||||||||||||
Year Ended October 31, 2015 | 29.66 | 0.36 | (0.99 | ) | (0.63 | ) | (0.60 | ) | (1.56 | ) | (2.16 | ) | – | 26.87 | ||||||||||||||||||||||
Year Ended October 31, 2014 | 28.74 | 0.29 | 1.32 | 1.61 | (0.38 | ) | (0.31 | ) | (0.69 | ) | – | 29.66 | ||||||||||||||||||||||||
Year Ended October 31, 2013 | 25.98 | 0.25 | 2.66 | 2.91 | (0.16 | ) | – | (0.16 | ) | 0.01 | 28.74 | |||||||||||||||||||||||||
| (a) | Net investment income/(loss) is based on average shares outstanding during the period. |
| (b) | Excludes sales charge. |
| (c) | During the period, certain fees were waived and/or reimbursed. If such waivers/reimbursements had not occurred, the ratios would have been as indicated. |
Amounts listed as “–” are $0 or round to $0.
See accompanying Notes to Financial Statements.
| 106 | Annual Report 2017 |
Financial Highlights (continued)
Selected Data for Each Share of Capital Outstanding Throughout the Periods Indicated
Aberdeen International Small Cap Fund (concluded)
| Ratios/Supplemental Data | ||||||||||||||||||||||
| Total Return (b) | Net Assets at End of Period (000’s) | Ratio of Expenses (Net of Reimbursements/Waivers) to Average Net Assets | Ratio of Expenses (Prior to Reimbursements) to Average Net Assets (c) | Ratio of Net Investment Income (Loss) to Average Net Assets | Portfolio Turnover (d) | |||||||||||||||||
| 21.79 | % | $ | 59,477 | 1.63 | %(e) | 2.07 | %(e) | 0.40 | % | 20.60 | % | |||||||||||
| 7.53 | %(f) | 51,530 | 1.63 | %(e) | 2.09 | %(e) | 0.53 | % | 36.40 | % | ||||||||||||
| (2.39 | %)(f) | 53,726 | 1.61 | %(e) | 1.84 | %(e) | 1.70 | % | 12.11 | % | ||||||||||||
| 5.32 | % | 64,189 | 1.60 | % | 1.73 | % | 0.65 | % | 12.93 | % | ||||||||||||
| 10.91 | % | 80,191 | 1.61 | % | 1.76 | % | 0.63 | % | 34.85 | % | ||||||||||||
| 20.94 | % | 1,591 | 2.30 | %(e) | 2.84 | %(e) | (0.17 | %) | 20.60 | % | ||||||||||||
| 6.85 | % | 1,175 | 2.30 | %(e) | 2.86 | %(e) | (0.20 | %) | 36.40 | % | ||||||||||||
| (3.10 | %) | 1,404 | 2.30 | %(e) | 2.53 | %(e) | 1.03 | % | 12.11 | % | ||||||||||||
| 4.60 | % | 1,646 | 2.30 | % | 2.43 | % | (0.03 | %) | 12.93 | % | ||||||||||||
| 10.17 | % | 2,208 | 2.30 | % | 2.45 | % | 0.08 | % | 34.85 | % | ||||||||||||
| 21.34 | % | 1,707 | 1.99 | %(e) | 2.43 | %(e) | 0.14 | % | 20.60 | % | ||||||||||||
| 7.20 | %(f) | 947 | 1.95 | %(e) | 2.41 | %(e) | 0.20 | % | 36.40 | % | ||||||||||||
| (2.74 | %)(f) | 623 | 1.91 | %(e) | 2.14 | %(e) | 1.38 | % | 12.11 | % | ||||||||||||
| 5.07 | % | 866 | 1.86 | % | 1.99 | % | 0.32 | % | 12.93 | % | ||||||||||||
| 10.67 | % | 1,749 | 1.82 | % | 1.97 | % | 0.55 | % | 34.85 | % | ||||||||||||
| 21.93 | % | 51 | 1.52 | %(e) | 1.96 | %(e) | 0.52 | % | 20.60 | % | ||||||||||||
| 7.65 | % | 64 | 1.52 | %(e) | 1.98 | %(e) | 0.24 | % | 36.40 | % | ||||||||||||
| (2.38 | %) | 1,359 | 1.55 | %(e) | 1.78 | %(e) | 1.71 | % | 12.11 | % | ||||||||||||
| 5.41 | % | 2,201 | 1.54 | % | 1.67 | % | 0.78 | % | 12.93 | % | ||||||||||||
| 11.11 | % | 1,803 | 1.47 | % | 1.62 | % | 1.10 | % | 34.85 | % | ||||||||||||
| 22.14 | % | 17,141 | 1.30 | %(e) | 1.79 | %(e) | 0.69 | % | 20.60 | % | ||||||||||||
| 7.92 | % | 19,840 | 1.30 | %(e) | 1.79 | %(e) | 0.71 | % | 36.40 | % | ||||||||||||
| (2.16 | %) | 48,927 | 1.30 | %(e) | 1.53 | %(e) | 1.27 | % | 12.11 | % | ||||||||||||
| 5.67 | % | 189,864 | 1.30 | % | 1.43 | % | 0.99 | % | 12.93 | % | ||||||||||||
| 11.29 | % | 212,642 | 1.30 | % | 1.45 | % | 0.91 | % | 34.85 | % | ||||||||||||
| (d) | Portfolio turnover is calculated on the basis of the Fund as a whole without distinguishing among the classes of shares. |
| (e) | Includes interest expense that amounts to less than 0.01%. |
| (f) | The total return shown above includes the impact of financial statement rounding of the NAV per share and/or financial statement adjustments. |
| 2017 Annual Report | 107 |
Financial Highlights (continued)
Selected Data for Each Share of Capital Outstanding Throughout the Periods Indicated
Aberdeen Japanese Equities Fund
| Investment Activities | Distributions | |||||||||||||||||||||||||||||||
| Net Asset Value, Beginning of Period | Net (a) | Net Realized and Unrealized Gains on Investments | Total from Investment Activities | Net Investment Income | Net Realized Gains | Total Distributions | Net Asset Value, End of Period | |||||||||||||||||||||||||
Class A Shares | ||||||||||||||||||||||||||||||||
Year Ended October 31, 2017 | $ | 11.02 | $ | 0.03 | $ | 1.23 | $ | 1.26 | $ | (0.03 | ) | $ | (0.10 | ) | $ | (0.13 | ) | $ | 12.15 | |||||||||||||
Period Ended October 31, 2016(g) | 10.00 | 0.06 | 0.97 | 1.03 | (0.01 | ) | – | (0.01 | ) | 11.02 | ||||||||||||||||||||||
Class C Shares | ||||||||||||||||||||||||||||||||
Year Ended October 31, 2017 | 10.95 | (0.05 | ) | 1.22 | 1.17 | – | (0.10 | ) | (0.10 | ) | 12.02 | |||||||||||||||||||||
Period Ended October 31, 2016(g) | 10.00 | (0.02 | ) | 0.97 | 0.95 | – | (h) | – | – | (h) | 10.95 | |||||||||||||||||||||
Class R Shares | ||||||||||||||||||||||||||||||||
Year Ended October 31, 2017 | 11.00 | – | (h) | 1.23 | 1.23 | – | (0.10 | ) | (0.10 | ) | 12.13 | |||||||||||||||||||||
Period Ended October 31, 2016(g) | 10.00 | 0.03 | 0.97 | 1.00 | – | (h) | – | – | (h) | 11.00 | ||||||||||||||||||||||
Institutional Service Class Shares | ||||||||||||||||||||||||||||||||
Year Ended October 31, 2017 | 11.04 | 0.06 | 1.23 | 1.29 | (0.04 | ) | (0.10 | ) | (0.14 | ) | 12.19 | |||||||||||||||||||||
Period Ended October 31, 2016(g) | 10.00 | 0.07 | 0.98 | 1.05 | (0.01 | ) | – | (0.01 | ) | 11.04 | ||||||||||||||||||||||
Institutional Class Shares | ||||||||||||||||||||||||||||||||
Year Ended October 31, 2017 | 11.04 | 0.06 | 1.23 | 1.29 | (0.04 | ) | (0.10 | ) | (0.14 | ) | 12.19 | |||||||||||||||||||||
Period Ended October 31, 2016(g) | 10.00 | 0.07 | 0.98 | 1.05 | (0.01 | ) | – | (0.01 | ) | 11.04 | ||||||||||||||||||||||
| (a) | Net investment income/(loss) is based on average shares outstanding during the period. |
| (b) | Excludes sales charge. |
| (c) | Not annualized for periods less than one year. |
| (d) | Annualized for periods less than one year. |
Amounts listed as “–” are $0 or round to $0.
See accompanying Notes to Financial Statements.
| 108 | Annual Report 2017 |
Financial Highlights (continued)
Selected Data for Each Share of Capital Outstanding Throughout the Periods Indicated
Aberdeen Japanese Equities Fund (concluded)
| Ratios/Supplemental Data | ||||||||||||||||||||||
Total Return (b)(c) | Net Assets at End of Period (000’s) | Ratio of Expenses (d) | Ratio of Expenses (d)(e) | Ratio of Net (d) | Portfolio Turnover (c)(f) | |||||||||||||||||
| 11.58 | % | $ | 278 | 1.30 | % | 11.96 | % | 0.31 | % | 19.81 | % | |||||||||||
| 10.27 | % | 22 | 1.25 | % | 19.03 | % | 0.67 | % | 8.21 | % | ||||||||||||
| 10.81 | % | 12 | 2.00 | % | 12.66 | % | (0.48 | %) | 19.81 | % | ||||||||||||
| 9.50 | % | 11 | 2.00 | % | 19.78 | % | (0.22 | %) | 8.21 | % | ||||||||||||
| 11.31 | % | 12 | 1.50 | % | 12.16 | % | 0.02 | % | 19.81 | % | ||||||||||||
| 10.05 | % | 11 | 1.50 | % | 19.28 | % | 0.28 | % | 8.21 | % | ||||||||||||
| 11.89 | % | 12 | 1.00 | % | 11.66 | % | 0.52 | % | 19.81 | % | ||||||||||||
| 10.50 | % | 11 | 1.00 | % | 18.78 | % | 0.78 | % | 8.21 | % | ||||||||||||
| 11.88 | % | 1,187 | 1.00 | % | 11.66 | % | 0.52 | % | 19.81 | % | ||||||||||||
| 10.50 | % | 1,061 | 1.00 | % | 18.78 | % | 0.79 | % | 8.21 | % | ||||||||||||
| (e) | During the period, certain fees were waived and/or reimbursed. If such waivers/reimbursements had not occurred, the ratios would have been as indicated. |
| (f) | Portfolio turnover is calculated on the basis of the Fund as a whole without distinguishing among the classes of shares. |
| (g) | For the period from November 30, 2015 (commencement of operations) through October 31, 2016. |
| (h) | Less than $0.005 per share. |
| 2017 Annual Report | 109 |
Financial Highlights (continued)
Selected Data for Each Share of Capital Outstanding Throughout the Periods Indicated
Aberdeen U.S. Mid Cap Equity Fund
| Investment Activities | Distributions | |||||||||||||||||||||||||||||||
| Net Asset Value, Beginning of Period | Net (a) | Net Realized and Unrealized Gains on Investments | Total from Investment Activities | Net Investment Income | Net Realized Gains | Total Distributions | Net Asset Value, End of Period | |||||||||||||||||||||||||
Class A Shares | ||||||||||||||||||||||||||||||||
Year Ended October 31, 2017 | $ | 10.95 | $ | – | (g) | $ | 2.63 | $ | 2.63 | $ | (0.02 | ) | $ | (0.21 | ) | $ | (0.23 | ) | $ | 13.35 | ||||||||||||
Period Ended October 31, 2016(h) | 10.00 | 0.01 | 0.94 | 0.95 | – | – | – | 10.95 | ||||||||||||||||||||||||
Class C Shares | ||||||||||||||||||||||||||||||||
Year Ended October 31, 2017 | 10.89 | (0.09 | ) | 2.62 | 2.53 | – | (0.21 | ) | (0.21 | ) | 13.21 | |||||||||||||||||||||
Period Ended October 31, 2016(h) | 10.00 | (0.05 | ) | 0.94 | 0.89 | – | – | – | 10.89 | |||||||||||||||||||||||
Class R Shares | ||||||||||||||||||||||||||||||||
Year Ended October 31, 2017 | 10.93 | (0.03 | ) | 2.63 | 2.60 | (0.01 | ) | (0.21 | ) | (0.22 | ) | 13.31 | ||||||||||||||||||||
Period Ended October 31, 2016(h) | 10.00 | (0.01 | ) | 0.94 | 0.93 | – | – | – | 10.93 | |||||||||||||||||||||||
Institutional Service Class Shares | ||||||||||||||||||||||||||||||||
Year Ended October 31, 2017 | 10.97 | 0.03 | 2.63 | 2.66 | (0.04 | ) | (0.21 | ) | (0.25 | ) | 13.38 | |||||||||||||||||||||
Period Ended October 31, 2016(h) | 10.00 | 0.02 | 0.95 | 0.97 | – | – | – | 10.97 | ||||||||||||||||||||||||
Institutional Class Shares | ||||||||||||||||||||||||||||||||
Year Ended October 31, 2017 | 10.97 | 0.03 | 2.63 | 2.66 | (0.04 | ) | (0.21 | ) | (0.25 | ) | 13.38 | |||||||||||||||||||||
Period Ended October 31, 2016(h) | 10.00 | 0.02 | 0.95 | 0.97 | – | – | – | 10.97 | ||||||||||||||||||||||||
| (a) | Net investment income/(loss) is based on average shares outstanding during the period. |
| (b) | Excludes sales charge. |
| (c) | Not annualized for periods less than one year. |
| (d) | Annualized for periods less than one year. |
Amounts listed as “–” are $0 or round to $0.
See accompanying Notes to Financial Statements.
| 110 | Annual Report 2017 |
Financial Highlights (continued)
Selected Data for Each Share of Capital Outstanding Throughout the Periods Indicated
Aberdeen U.S. Mid Cap Equity Fund (concluded)
| Ratios/Supplemental Data | ||||||||||||||||||||||
Total Return (b)(c) | Net Assets at End of Period (000’s) | Ratio of Expenses (d) | Ratio of Expenses (d)(e) | Ratio of Net (d) | Portfolio Turnover (c)(f) | |||||||||||||||||
| 24.41 | % | $ | 46 | 1.25 | % | 12.12 | % | (0.01 | %) | 42.92 | % | |||||||||||
| 9.50 | % | 12 | 1.25 | % | 15.77 | % | 0.09 | % | 18.10 | % | ||||||||||||
| 23.57 | % | 13 | 2.00 | % | 12.87 | % | (0.75 | %) | 42.92 | % | ||||||||||||
| 8.90 | % | 11 | 2.00 | % | 16.52 | % | (0.67 | %) | 18.10 | % | ||||||||||||
| 24.14 | % | 14 | 1.50 | % | 12.37 | % | (0.25 | %) | 42.92 | % | ||||||||||||
| 9.30 | % | 11 | 1.50 | % | 16.02 | % | (0.17 | %) | 18.10 | % | ||||||||||||
| 24.70 | % | 14 | 1.00 | % | 11.87 | % | 0.25 | % | 42.92 | % | ||||||||||||
| 9.70 | % | 11 | 1.00 | % | 15.52 | % | 0.33 | % | 18.10 | % | ||||||||||||
| 24.70 | % | 1,338 | 1.00 | % | 11.87 | % | 0.25 | % | 42.92 | % | ||||||||||||
| 9.70 | % | 1,053 | 1.00 | % | 15.52 | % | 0.33 | % | 18.10 | % | ||||||||||||
| (e) | During the period, certain fees were waived and/or reimbursed. If such waivers/reimbursements had not occurred, the ratios would have been as indicated. |
| (f) | Portfolio turnover is calculated on the basis of the Fund as a whole without distinguishing among the classes of shares. |
| (g) | Less than $0.005 per share. |
| (h) | For the period from February 29, 2016 (commencement of operations) through October 31, 2016. |
| 2017 Annual Report | 111 |
Financial Highlights (continued)
Selected Data for Each Share of Capital Outstanding Throughout the Periods Indicated
Aberdeen U.S. Multi-Cap Equity Fund
| Investment Activities | Distributions | |||||||||||||||||||||||||||||||
| Net Asset Value, Beginning of Period | Net Investment Income (Loss) (a) | Net Realized and Unrealized Gains (Losses) on Investments | Total from Investment Activities | Net Investment Income | Net Realized Gains | Total Distributions | Net Asset Value, End of Period | |||||||||||||||||||||||||
Class A Shares | ||||||||||||||||||||||||||||||||
Year Ended October 31, 2017 | $ | 12.13 | $ | 0.04 | $ | 2.34 | $ | 2.38 | $ | (0.02 | ) | $ | (1.44 | ) | $ | (1.46 | ) | $ | 13.05 | |||||||||||||
Year Ended October 31, 2016 | 12.52 | 0.03 | 0.21 | 0.24 | (0.02 | ) | (0.61 | ) | (0.63 | ) | 12.13 | |||||||||||||||||||||
Year Ended October 31, 2015 | 13.40 | 0.11 | (0.02 | ) | 0.09 | (0.12 | ) | (0.85 | ) | (0.97 | ) | 12.52 | ||||||||||||||||||||
Year Ended October 31, 2014 | 12.41 | 0.12 | 1.09 | 1.21 | (0.13 | ) | (0.09 | ) | (0.22 | ) | 13.40 | |||||||||||||||||||||
Year Ended October 31, 2013 | 9.97 | 0.11 | 2.43 | 2.54 | (0.10 | ) | – | (0.10 | ) | 12.41 | ||||||||||||||||||||||
Class C Shares | ||||||||||||||||||||||||||||||||
Year Ended October 31, 2017 | 10.93 | (0.04 | ) | 2.08 | 2.04 | – | (1.44 | ) | (1.44 | ) | 11.53 | |||||||||||||||||||||
Year Ended October 31, 2016 | 11.40 | (0.05 | ) | 0.19 | 0.14 | – | (0.61 | ) | (0.61 | ) | 10.93 | |||||||||||||||||||||
Year Ended October 31, 2015 | 12.29 | 0.02 | (0.02 | ) | – | (f) | (0.04 | ) | (0.85 | ) | (0.89 | ) | 11.40 | |||||||||||||||||||
Year Ended October 31, 2014 | 11.40 | 0.02 | 1.00 | 1.02 | (0.04 | ) | (0.09 | ) | (0.13 | ) | 12.29 | |||||||||||||||||||||
Year Ended October 31, 2013 | 9.18 | 0.02 | 2.23 | 2.25 | (0.03 | ) | – | (0.03 | ) | 11.40 | ||||||||||||||||||||||
Class R Shares | ||||||||||||||||||||||||||||||||
Year Ended October 31, 2017 | 11.53 | (0.01 | ) | 2.21 | 2.20 | – | (1.44 | ) | (1.44 | ) | 12.29 | |||||||||||||||||||||
Year Ended October 31, 2016 | 11.96 | (0.01 | ) | 0.20 | 0.19 | (0.01 | ) | (0.61 | ) | (0.62 | ) | 11.53 | ||||||||||||||||||||
Year Ended October 31, 2015 | 12.85 | 0.08 | (0.02 | ) | 0.06 | (0.10 | ) | (0.85 | ) | (0.95 | ) | 11.96 | ||||||||||||||||||||
Year Ended October 31, 2014 | 11.91 | 0.09 | 1.04 | 1.13 | (0.10 | ) | (0.09 | ) | (0.19 | ) | 12.85 | |||||||||||||||||||||
Year Ended October 31, 2013 | 9.58 | 0.08 | 2.32 | 2.40 | (0.07 | ) | – | (0.07 | ) | 11.91 | ||||||||||||||||||||||
Institutional Service Class Shares | ||||||||||||||||||||||||||||||||
Year Ended October 31, 2017 | 12.74 | 0.06 | 2.46 | 2.52 | (0.03 | ) | (1.44 | ) | (1.47 | ) | 13.79 | |||||||||||||||||||||
Year Ended October 31, 2016 | 13.09 | 0.05 | 0.24 | 0.29 | (0.03 | ) | (0.61 | ) | (0.64 | ) | 12.74 | |||||||||||||||||||||
Year Ended October 31, 2015 | 13.98 | 0.14 | (0.03 | ) | 0.11 | (0.15 | ) | (0.85 | ) | (1.00 | ) | 13.09 | ||||||||||||||||||||
Year Ended October 31, 2014 | 12.93 | 0.15 | 1.14 | 1.29 | (0.15 | ) | (0.09 | ) | (0.24 | ) | 13.98 | |||||||||||||||||||||
Year Ended October 31, 2013 | 10.38 | 0.14 | 2.53 | 2.67 | (0.12 | ) | – | (0.12 | ) | 12.93 | ||||||||||||||||||||||
Institutional Class Shares | ||||||||||||||||||||||||||||||||
Year Ended October 31, 2017 | 12.76 | 0.08 | 2.46 | 2.54 | (0.04 | ) | (1.44 | ) | (1.48 | ) | 13.82 | |||||||||||||||||||||
Year Ended October 31, 2016 | 13.10 | 0.06 | 0.24 | 0.30 | (0.03 | ) | (0.61 | ) | (0.64 | ) | 12.76 | |||||||||||||||||||||
Year Ended October 31, 2015 | 13.99 | 0.15 | (0.03 | ) | 0.12 | (0.16 | ) | (0.85 | ) | (1.01 | ) | 13.10 | ||||||||||||||||||||
Year Ended October 31, 2014 | 12.94 | 0.16 | 1.15 | 1.31 | (0.17 | ) | (0.09 | ) | (0.26 | ) | 13.99 | |||||||||||||||||||||
Year Ended October 31, 2013 | 10.38 | 0.14 | 2.54 | 2.68 | (0.12 | ) | – | (0.12 | ) | 12.94 | ||||||||||||||||||||||
| (a) | Net investment income/(loss) is based on average shares outstanding during the period. |
| (b) | Excludes sales charge. |
| (c) | During the period, certain fees were waived and/or reimbursed. If such waivers/reimbursements had not occurred, the ratios would have been as indicated. |
Amounts listed as “–” are $0 or round to $0.
See accompanying Notes to Financial Statements.
| 112 | Annual Report 2017 |
Financial Highlights (continued)
Selected Data for Each Share of Capital Outstanding Throughout the Periods Indicated
Aberdeen U.S. Multi-Cap Equity Fund (concluded)
| Ratios/Supplemental Data | ||||||||||||||||||||||
| Total Return (b) | Net Assets at End of Period (000’s) | Ratio of Expenses (Net of Reimbursements/Waivers) to Average Net Assets | Ratio of Expenses (Prior to Reimbursements) to Average Net Assets (c) | Ratio of Net Investment Income (Loss) to Average Net Assets | Portfolio Turnover (d) | |||||||||||||||||
| 21.13 | % | $ | 242,085 | 1.19 | %(e) | 1.26 | %(e) | 0.29 | % | 33.79 | % | |||||||||||
| 2.25 | % | $ | 225,723 | 1.19 | %(e) | 1.28 | %(e) | 0.21 | % | 63.11 | % | |||||||||||
| 0.50 | % | $ | 247,549 | 1.17 | %(e) | 1.25 | %(e) | 0.87 | % | 16.92 | % | |||||||||||
| 9.87 | % | $ | 276,861 | 1.17 | % | 1.25 | % | 0.92 | % | 20.60 | % | |||||||||||
| 25.54 | % | $ | 282,602 | 1.15 | % | 1.23 | % | 0.94 | % | 19.53 | % | |||||||||||
| 20.26 | % | 3,544 | 1.90 | %(e) | 2.09 | %(e) | (0.40 | %) | 33.79 | % | ||||||||||||
| 1.56 | % | 5,883 | 1.90 | %(e) | 2.08 | %(e) | (0.50 | %) | 63.11 | % | ||||||||||||
| (0.27 | %) | 7,134 | 1.90 | %(e) | 1.98 | %(e) | 0.15 | % | 16.92 | % | ||||||||||||
| 9.07 | % | 8,469 | 1.90 | % | 1.98 | % | 0.19 | % | 20.60 | % | ||||||||||||
| 24.60 | % | 9,637 | 1.90 | % | 1.95 | % | 0.20 | % | 19.53 | % | ||||||||||||
| 20.64 | % | 159 | 1.58 | %(e) | 1.65 | %(e) | (0.05 | %) | 33.79 | % | ||||||||||||
| 1.95 | % | 266 | 1.51 | %(e) | 1.60 | %(e) | (0.12 | %) | 63.11 | % | ||||||||||||
| 0.23 | % | 458 | 1.40 | %(e) | 1.48 | %(e) | 0.62 | % | 16.92 | % | ||||||||||||
| 9.62 | % | 351 | 1.40 | % | 1.48 | % | 0.69 | % | 20.60 | % | ||||||||||||
| 25.16 | % | 405 | 1.40 | % | 1.45 | % | 0.73 | % | 19.53 | % | ||||||||||||
| 21.33 | % | 109,418 | 0.98 | %(e) | 1.05 | %(e) | 0.49 | % | 33.79 | % | ||||||||||||
| 2.52 | % | 101,549 | 1.00 | %(e) | 1.09 | %(e) | 0.40 | % | 63.11 | % | ||||||||||||
| 0.59 | % | 109,288 | 0.99 | %(e) | 1.07 | %(e) | 1.06 | % | 16.92 | % | ||||||||||||
| 10.13 | % | 128,283 | 0.96 | % | 1.07 | % | 1.12 | % | 20.60 | % | ||||||||||||
| 25.84 | % | 128,368 | 0.90 | % | 1.05 | % | 1.21 | % | 19.53 | % | ||||||||||||
| 21.45 | % | 6,507 | 0.90 | %(e) | 1.01 | %(e) | 0.59 | % | 33.79 | % | ||||||||||||
| 2.63 | % | 6,742 | 0.90 | %(e) | 1.02 | %(e) | 0.50 | % | 63.11 | % | ||||||||||||
| 0.68 | % | 7,059 | 0.90 | %(e) | 0.98 | %(e) | 1.13 | % | 16.92 | % | ||||||||||||
| 10.23 | % | 3,437 | 0.90 | % | 0.98 | % | 1.18 | % | 20.60 | % | ||||||||||||
| 26.00 | % | 3,867 | 0.90 | % | 0.95 | % | 1.21 | % | 19.53 | % | ||||||||||||
| (d) | Portfolio turnover is calculated on the basis of the Fund as a whole without distinguishing among the classes of shares. |
| (e) | Includes interest expense that amounts to less than 0.01%. |
| (f) | Less than $0.005 per share. |
| 2017 Annual Report | 113 |
Financial Highlights (continued)
Selected Data for Each Share of Capital Outstanding Throughout the Periods Indicated
Aberdeen U.S. Small Cap Equity Fund
| Investment Activities | ||||||||||||||||||||
| Net Asset Value, Beginning of Period | Net (a) | Net Realized and Unrealized Gains on Investments | Total from Investment Activities | Net Asset Value, End of Period | ||||||||||||||||
Class A Shares | ||||||||||||||||||||
Year Ended October 31, 2017 | $ | 28.71 | $ | (0.11 | ) | $ | 7.01 | $ | 6.90 | $ | 35.61 | |||||||||
Year Ended October 31, 2016 | 26.62 | (0.09 | ) | 2.18 | 2.09 | 28.71 | ||||||||||||||
Year Ended October 31, 2015 | 23.90 | (0.08 | ) | 2.80 | 2.72 | 26.62 | ||||||||||||||
Year Ended October 31, 2014 | 21.86 | 0.01 | 2.03 | 2.04 | 23.90 | |||||||||||||||
Year Ended October 31, 2013 | 15.85 | 0.05 | 5.96 | 6.01 | 21.86 | |||||||||||||||
Class C Shares | ||||||||||||||||||||
Year Ended October 31, 2017 | 25.12 | (0.30 | ) | 6.12 | 5.82 | 30.94 | ||||||||||||||
Year Ended October 31, 2016 | 23.46 | (0.24 | ) | 1.90 | 1.66 | 25.12 | ||||||||||||||
Year Ended October 31, 2015 | 21.20 | (0.23 | ) | 2.49 | 2.26 | 23.46 | ||||||||||||||
Year Ended October 31, 2014 | 19.53 | (0.14 | ) | 1.81 | 1.67 | 21.20 | ||||||||||||||
Year Ended October 31, 2013 | 14.26 | (0.07 | ) | 5.34 | 5.27 | 19.53 | ||||||||||||||
Class R Shares | ||||||||||||||||||||
Year Ended October 31, 2017 | 26.67 | (0.21 | ) | 6.51 | 6.30 | 32.97 | ||||||||||||||
Year Ended October 31, 2016 | 24.78 | (0.13 | ) | 2.02 | 1.89 | 26.67 | ||||||||||||||
Year Ended October 31, 2015 | 22.30 | (0.14 | ) | 2.62 | 2.48 | 24.78 | ||||||||||||||
Year Ended October 31, 2014 | 20.44 | (0.04 | ) | 1.90 | 1.86 | 22.30 | ||||||||||||||
Year Ended October 31, 2013 | 14.85 | 0.01 | 5.58 | 5.59 | 20.44 | |||||||||||||||
Institutional Service Class Shares | ||||||||||||||||||||
Year Ended October 31, 2017 | 30.17 | (0.03 | ) | 7.37 | 7.34 | 37.51 | ||||||||||||||
Year Ended October 31, 2016 | 27.90 | (0.02 | ) | 2.29 | 2.27 | 30.17 | ||||||||||||||
Year Ended October 31, 2015 | 24.96 | (1.71 | ) | 4.65 | 2.94 | 27.90 | ||||||||||||||
Year Ended October 31, 2014 | 22.76 | 0.08 | 2.12 | 2.20 | 24.96 | |||||||||||||||
Year Ended October 31, 2013 | 16.47 | 0.09 | 6.20 | 6.29 | 22.76 | |||||||||||||||
Institutional Class Shares | ||||||||||||||||||||
Year Ended October 31, 2017 | 30.14 | (0.02 | ) | 7.37 | 7.35 | 37.49 | ||||||||||||||
Year Ended October 31, 2016 | 27.87 | – | (f) | 2.27 | 2.27 | 30.14 | ||||||||||||||
Year Ended October 31, 2015 | 24.93 | – | (f) | 2.94 | 2.94 | 27.87 | ||||||||||||||
Year Ended October 31, 2014 | 22.73 | 0.07 | 2.13 | 2.20 | 24.93 | |||||||||||||||
Year Ended October 31, 2013 | 16.43 | 0.12 | 6.18 | 6.30 | 22.73 | |||||||||||||||
| (a) | Net investment income/(loss) is based on average shares outstanding during the period. |
| (b) | Excludes sales charge. |
| (c) | During the period, certain fees were waived and/or reimbursed. If such waivers/reimbursements had not occurred, the ratios would have been as indicated. |
Amounts listed as “–” are $0 or round to $0.
See accompanying Notes to Financial Statements.
| 114 | Annual Report 2017 |
Financial Highlights (concluded)
Selected Data for Each Share of Capital Outstanding Throughout the Periods Indicated
Aberdeen U.S. Small Cap Equity Fund (concluded)
| Ratios/Supplemental Data | ||||||||||||||||||||||
Total Return (b) | Net Assets at End of Period (000’s) | Ratio of Expenses (Net of Reimbursements/Waivers) to Average Net Assets | Ratio of Expenses (c) | Ratio of Net Investment Income (Loss) to Average Net Assets | Portfolio Turnover (d) | |||||||||||||||||
| 24.03 | % | $ | 316,766 | 1.38 | % | 1.38 | % | (0.33 | %) | 42.71 | % | |||||||||||
| 7.85 | % | 259,556 | 1.46 | % | 1.39 | % | (0.33 | %) | 32.20 | % | ||||||||||||
| 11.38 | % | 75,005 | 1.46 | % | 1.53 | % | (0.33 | %) | 29.43 | % | ||||||||||||
| 9.33 | % | 72,790 | 1.47 | % | 1.59 | % | 0.03 | % | 29.32 | % | ||||||||||||
| 37.92 | % | 81,916 | 1.47 | % | 1.58 | % | 0.25 | % | 39.71 | % | ||||||||||||
| 23.17 | % | 95,913 | 2.10 | % | 2.10 | % | (1.05 | %) | 42.71 | % | ||||||||||||
| 7.08 | % | 78,109 | 2.15 | % | 2.12 | % | (0.96 | %) | 32.20 | % | ||||||||||||
| 10.66 | % | 35,665 | 2.15 | % | 2.22 | % | (1.02 | %) | 29.43 | % | ||||||||||||
| 8.55 | % | 31,346 | 2.15 | % | 2.27 | % | (0.66 | %) | 29.32 | % | ||||||||||||
| 36.96 | % | 32,664 | 2.15 | % | 2.26 | % | (0.42 | %) | 39.71 | % | ||||||||||||
| 23.62 | %(e) | 20,595 | 1.72 | % | 1.72 | % | (0.67 | %) | 42.71 | % | ||||||||||||
| 7.63 | %(e) | 13,722 | 1.68 | % | 1.65 | % | (0.49 | %) | 32.20 | % | ||||||||||||
| 11.12 | % | 4,601 | 1.71 | % | 1.78 | % | (0.59 | %) | 29.43 | % | ||||||||||||
| 9.10 | % | 1,152 | 1.70 | % | 1.82 | % | (0.19 | %) | 29.32 | % | ||||||||||||
| 37.64 | % | 1,507 | 1.67 | % | 1.78 | % | 0.08 | % | 39.71 | % | ||||||||||||
| 24.33 | %(e) | 61,897 | 1.13 | % | 1.13 | % | (0.08 | %) | 42.71 | % | ||||||||||||
| 8.14 | % | 47,421 | 1.14 | % | 1.13 | % | (0.06 | %) | 32.20 | % | ||||||||||||
| 11.78 | % | 9,101 | 1.18 | % | 1.25 | % | (6.38 | %) | 29.43 | % | ||||||||||||
| 9.67 | % | 1,626 | 1.15 | % | 1.27 | % | 0.33 | % | 29.32 | % | ||||||||||||
| 38.19 | % | 1,694 | 1.15 | % | 1.26 | % | 0.48 | % | 39.71 | % | ||||||||||||
| 24.39 | % | 1,467,787 | 1.10 | % | 1.10 | % | (0.06 | %) | 42.71 | % | ||||||||||||
| 8.15 | %(e) | 746,112 | 1.14 | % | 1.12 | % | 0.01 | % | 32.20 | % | ||||||||||||
| 11.79 | % | 235,400 | 1.15 | % | 1.22 | % | 0.02 | % | 29.43 | % | ||||||||||||
| 9.68 | % | 27,404 | 1.15 | % | 1.27 | % | 0.30 | % | 29.32 | % | ||||||||||||
| 38.34 | % | 19,619 | 1.15 | % | 1.26 | % | 0.61 | % | 39.71 | % | ||||||||||||
| (d) | Portfolio turnover is calculated on the basis of the Fund as a whole without distinguishing among the classes of shares. |
| (e) | The total return shown above includes the impact of financial statement rounding of the NAV per share and/or financial statement adjustments. |
| (f) | Less than $0.005 per share. |
| 2017 Annual Report | 115 |
October 31, 2017
1. Organization
Aberdeen Funds (the “Trust”) was organized as a statutory trust under the laws of the state of Delaware by a Certificate of Trust filed on September 27, 2007 and is registered under the Investment Company Act of 1940, as amended (the “1940 Act”), as an open-end management investment company. As of October 31, 2017, the Trust had authorized an unlimited number of shares of beneficial interest (“shares”) without par value. As of October 31, 2017, the Trust operated eighteen (18) separate series, or mutual funds, each with its own investment objective(s) and strategies. This report contains the financial statements and financial highlights of the eleven (11) funds listed below (each a “Fund”; collectively, the “Funds”):
| – | Aberdeen Asia-Pacific (ex-Japan) Equity Fund (“Asia-Pacific (ex-Japan) Equity Fund”) |
| – | Aberdeen China Opportunities Fund (“China Opportunities Fund”) |
| – | Aberdeen Emerging Markets Fund (“Emerging Markets Fund”) |
| – | Aberdeen Focused U.S. Equity Fund (“Focused U.S. Equity Fund,” formerly, the “Aberdeen Equity Long-Short Fund”) |
| – | Aberdeen Global Equity Fund (“Global Equity Fund”)* |
| – | Aberdeen International Equity Fund (“International Equity Fund”) |
| – | Aberdeen International Small Cap Fund (“International Small Cap Fund”) |
| – | Aberdeen Japanese Equities Fund (“Japanese Equities Fund”) |
| – | Aberdeen U.S. Mid Cap Equity Fund (“U.S. Mid Cap Equity Fund”) |
| – | Aberdeen U.S. Multi-Cap Equity Fund (“U.S. Multi-Cap Equity Fund”) |
| – | Aberdeen U.S. Small Cap Equity Fund (“U.S. Small Cap Equity Fund”) |
| * | On November 21, 2016, the Global Equity Fund acquired the assets and assumed the liabilities of the Aberdeen Global Natural Resources Fund (the “Global Natural Resources Fund”). The Global Equity Fund is considered the accounting survivor of the reorganization. |
| In connection with the reorganization, the Global Natural Resources Fund’s Class A, Class C, Class R, Institutional Service Class and Institutional Class shares were exchanged for Class A, Class C, Class R, Institutional Service Class and Institutional Class shares of the Global Equity Fund, respectively. |
| The following is a summary of the net assets reorganized and net asset value (“NAV”) per share issued as of November 21, 2016. |
| Shares Issued of the Global Equity Fund | Fund Net Assets Reorganized from the Global Natural Resources Fund | Net Asset Value Per Shares Issued of the Global Equity Fund | ||||||||||
Class A | 728,321 | $8,732,862 | $11.99 | |||||||||
Class C | 126,679 | 1,432,891 | 11.31 | |||||||||
Class R | 187,862 | 2,166,589 | 11.53 | |||||||||
Institutional Service Class | 51,283 | 624,420 | 12.18 | |||||||||
Institutional Class | 48,395 | 582,702 | 12.04 | |||||||||
2. Summary of Significant Accounting Policies
The Trust is an investment company and accordingly follows the investment company accounting and reporting guidance of the Financial Accounting Standards Board (“FASB”) Accounting Standard Codification Topic 946 Financial Services-Investment Companies. The following is a summary of significant accounting policies followed by the Funds in the preparation of their financial statements. The policies conform to generally accepted accounting principles in the United States of America (“GAAP”). The preparation of financial statements requires management to make estimates and assumptions that affect the reported amounts of assets and liabilities, disclosure of contingent assets and liabilities at the date of the financial statements, and the reported amounts of income and expenses for the period. Actual results could differ from those estimates. The accounting records of the Funds are maintained in U.S. Dollars.
| a. | Security Valuation |
The Funds value their securities at current market value or fair value, consistent with regulatory requirements. “Fair value” is defined in the Funds’ Valuation and Liquidity Procedures as the price that could be received to sell an asset or paid to transfer a liability in an orderly transaction between willing market participants without a compulsion to transact at the measurement date.
Equity securities that are traded on an exchange are valued at the last quoted sale price on the principal exchange on which the security is traded at the “Valuation Time” subject to application, when appropriate, of the valuation factors described in the paragraph below. Under
| 116 | Annual Report 2017 |
Notes to Financial Statements (continued)
October 31, 2017
normal circumstances, the Valuation Time is as of the close of regular trading on the New York Stock Exchange (usually 4:00 p.m. Eastern Time). In the absence of a sale price, the security is valued at the mean of the bid/ask price quoted at the close on the principal exchange on which the security is traded. Securities traded on NASDAQ are valued at the NASDAQ official closing price.
In accordance with the authoritative guidance on fair value measurements and disclosures under GAAP, the Funds disclose the fair value of their investments using a three-level hierarchy that classifies the inputs to valuation techniques used to measure the fair value. The hierarchy assigns Level 1, the highest level, measurements to valuations based upon unadjusted quoted prices in active markets for identical assets, Level 2 measurements to valuations based upon other significant observable inputs, including adjusted quoted prices in active markets for similar assets, and Level 3, the lowest level, measurements to valuations based upon unobservable inputs that are significant to the valuation. Observable inputs are inputs that reflect the assumptions market participants would use in pricing the asset or liability, which are based on market data obtained from sources independent of the reporting entity. Unobservable inputs are inputs that reflect the reporting entity’s own assumptions about the assumptions market participants would use in pricing the asset or liability developed based on the best information available in the circumstances. A financial instrument’s level within the fair value hierarchy is based upon the lowest level of any input that is significant to the fair value measurement. Open-end mutual funds are valued at the respective NAV as reported by such company. The prospectuses for the registered open-end management investment companies in which a Fund invests explain the circumstances under which those companies will use fair value pricing and the effects of using fair value pricing. Closed-end funds and exchange-traded funds (“ETFs”) are valued at the market price of the security at the Valuation Time. A security using any of these pricing methodologies is determined to be a Level 1 investment.
Foreign equity securities that are traded on foreign exchanges that close prior to Valuation Time are valued by applying valuation factors to the last sale price or the mean price as noted above. Valuation factors are provided by an independent pricing service provider approved by the Board. These valuation factors are used when pricing a Fund’s portfolio holdings to estimate market movements between the time foreign markets close and the time a Fund values such foreign securities. These valuation factors are based on inputs such as depositary receipts, indices, futures, sector indices/ETFs, exchange rates, and local exchange opening and closing prices of each security. When prices with the application of valuation factors are utilized, the value assigned to the foreign securities may not be the same as quoted or published prices of the securities on their primary markets. A security that applies a valuation factor is determined to be a Level 2 investment because the exchange-traded price has been adjusted. Valuation factors are not utilized if the independent pricing service provider is unable to provide a valuation factor or if the valuation factor falls below a predetermined threshold; in such case, the security is determined to be a Level 1 investment.
Short-term investments are comprised of cash and cash equivalents invested in short-term investment funds which are redeemable daily. The Funds sweep available cash into the State Street Institutional U.S. Government Money Market Fund, which has elected to qualify as a “government money market fund” pursuant to Rule 2a-7 under the 1940 Act, and has an objective, which is not guaranteed, to maintain a $1.00 NAV. Generally, these investment types are categorized as Level 1 investments.
Forward foreign currency contracts are generally valued based on the bid price of the forward rates and the current spot rate. Forward exchange rate quotations are available for scheduled settlement dates, such as 1-, 3-, 6-, 9- and 12-month periods. An interpolated valuation is derived based on the actual settlement dates of the forward contracts held. Futures contracts are valued at the settlement price or at the last bid price if no settlement price is available. Interest rate swaps agreements are generally valued by an approved pricing agent based on the terms of the swap agreement (including future cash flows).
In the event that a security’s market quotations are not readily available or are deemed unreliable (for reasons other than because the foreign exchange on which it trades closed before the Valuation Time), the security is valued at fair value as determined by the Funds’ pricing committee (the “Pricing Committee”), taking into account the relevant factors and surrounding circumstances using Valuation and Liquidity Procedures approved by the Board. A security that has been fair valued by the Pricing Committee may be classified as Level 2 or Level 3 depending on the nature of the inputs.
The three-level hierarchy of inputs is summarized below:
| • | Level 1- quoted prices in active markets for identical investments; |
| • | Level 2- other significant observable inputs (including quoted prices for similar securities, interest rates, prepayment speeds, and credit risk); or |
| • | Level 3- significant unobservable inputs (including a Fund’s own assumptions in determining the fair value of investments). |
| 2017 Annual Report | 117 |
Notes to Financial Statements (continued)
October 31, 2017
A summary of standard inputs is listed below:
| Security Type | Standard Inputs | |
Foreign equities utilizing a fair value factor | Depositary receipts, indices, futures, sector indices/ETFs, exchange rates, and local exchange opening and closing prices of each security. |
The following is a summary of the inputs used as of October 31, 2017 in valuing the Funds’ investments at fair value. The inputs or methodologies used for valuing securities are not necessarily an indication of the risk associated with investing in those securities.
Please refer to the Statements of Investments for a detailed breakout of the security types:
| Investments, at Value | LEVEL 1–Quoted Prices ($) | LEVEL 2–Other Significant Observable Inputs ($) | LEVEL 3–Significant Unobservable Inputs ($) | Total ($) | ||||||||||||
| Asia-Pacific (ex-Japan) Equity Fund | ||||||||||||||||
| Investments in Securities | ||||||||||||||||
Common Stocks | 1,053,553 | 9,422,348 | – | 10,475,901 | ||||||||||||
Preferred Stocks | 85,876 | 566,805 | – | 652,681 | ||||||||||||
Short-Term Investment | 57,879 | – | – | 57,879 | ||||||||||||
|
|
|
|
|
|
|
| |||||||||
| 1,197,308 | 9,989,153 | – | 11,186,461 | |||||||||||||
|
|
|
|
|
|
|
| |||||||||
| China Opportunities Fund | ||||||||||||||||
| Investments in Securities | ||||||||||||||||
Common Stocks | 403,550 | 12,752,465 | – | 13,156,015 | ||||||||||||
Short-Term Investment | 17,322 | – | – | 17,322 | ||||||||||||
|
|
|
|
|
|
|
| |||||||||
| 420,872 | 12,752,465 | – | 13,173,337 | |||||||||||||
|
|
|
|
|
|
|
| |||||||||
| Emerging Markets Fund | ||||||||||||||||
| Investments in Securities | ||||||||||||||||
Common Stocks | 2,709,207,850 | 5,125,366,668 | – | 7,834,574,518 | ||||||||||||
Preferred Stocks | 271,148,239 | 475,513,246 | – | 746,661,485 | ||||||||||||
Short-Term Investment | 126,818,025 | – | – | 126,818,025 | ||||||||||||
|
|
|
|
|
|
|
| |||||||||
| 3,107,174,114 | 5,600,879,914 | – | 8,708,054,028 | |||||||||||||
|
|
|
|
|
|
|
| |||||||||
| Focused U.S. Equity Fund | ||||||||||||||||
| Investments in Securities | ||||||||||||||||
Common Stocks–Long Positions | 24,790,552 | – | – | 24,790,552 | ||||||||||||
Short-Term Investment | 971,612 | – | – | 971,612 | ||||||||||||
Common Stocks–Short Positions | (9,702,727 | ) | – | – | (9,702,727 | ) | ||||||||||
Exchange Traded Funds–Short Positions | (1,962,392 | ) | – | – | (1,962,392 | ) | ||||||||||
|
|
|
|
|
|
|
| |||||||||
| 14,097,045 | – | – | 14,097,045 | |||||||||||||
|
|
|
|
|
|
|
| |||||||||
| 118 | Annual Report 2017 |
Notes to Financial Statements (continued)
October 31, 2017
| Investments, at Value | LEVEL 1–Quoted Prices ($) | LEVEL 2–Other Significant Observable Inputs ($) | LEVEL 3–Significant Unobservable Inputs ($) | Total ($) | ||||||||||||
| Global Equity Fund | ||||||||||||||||
| Investments in Securities | ||||||||||||||||
Common Stocks | 18,535,072 | 21,080,899 | – | 39,615,971 | ||||||||||||
Preferred Stocks | 2,010,884 | 856,539 | – | 2,867,423 | ||||||||||||
Short-Term Investment | 294,372 | – | – | 294,372 | ||||||||||||
|
|
|
|
|
|
|
| |||||||||
| 20,840,328 | 21,937,438 | – | 42,777,766 | |||||||||||||
|
|
|
|
|
|
|
| |||||||||
| International Equity Fund | ||||||||||||||||
| Investments in Securities | ||||||||||||||||
Common Stocks | 86,466,313 | 382,487,950 | – | 468,954,263 | ||||||||||||
Preferred Stocks | 28,080,670 | 12,328,551 | – | 40,409,221 | ||||||||||||
Short-Term Investment | 22,849,285 | – | – | 22,849,285 | ||||||||||||
|
|
|
|
|
|
|
| |||||||||
| 137,396,268 | 394,816,501 | – | 532,212,769 | |||||||||||||
|
|
|
|
|
|
|
| |||||||||
| International Small Cap Fund | ||||||||||||||||
| Investments in Securities | ||||||||||||||||
Common Stocks | 32,699,919 | 46,898,029 | – | 79,597,948 | ||||||||||||
Short-Term Investment | 379,046 | – | – | 379,046 | ||||||||||||
|
|
|
|
|
|
|
| |||||||||
| 33,078,965 | 46,898,029 | – | 79,976,994 | |||||||||||||
|
|
|
|
|
|
|
| |||||||||
| Japanese Equities Fund | ||||||||||||||||
| Investments in Securities | ||||||||||||||||
Common Stocks | – | 1,444,322 | – | 1,444,322 | ||||||||||||
Short-Term Investment | 4,900 | – | – | 4,900 | ||||||||||||
|
|
|
|
|
|
|
| |||||||||
| 4,900 | 1,444,322 | – | 1,449,222 | |||||||||||||
|
|
|
|
|
|
|
| |||||||||
| U.S. Mid Cap Equity Fund | ||||||||||||||||
| Investments in Securities | ||||||||||||||||
Common Stocks | 1,340,107 | – | – | 1,340,107 | ||||||||||||
Short-Term Investment | 57,602 | – | – | 57,602 | ||||||||||||
|
|
|
|
|
|
|
| |||||||||
| 1,397,709 | – | – | 1,397,709 | |||||||||||||
|
|
|
|
|
|
|
| |||||||||
| U.S. Multi-Cap Equity Fund | ||||||||||||||||
| Investments in Securities | ||||||||||||||||
Common Stocks | 351,803,157 | – | – | 351,803,157 | ||||||||||||
Short-Term Investment | 10,824,334 | – | – | 10,824,334 | ||||||||||||
|
|
|
|
|
|
|
| |||||||||
| 362,627,491 | – | – | 362,627,491 | |||||||||||||
|
|
|
|
|
|
|
| |||||||||
| U.S. Small Cap Equity Fund | ||||||||||||||||
| Investments in Securities | ||||||||||||||||
Common Stocks | 1,893,608,254 | – | – | 1,893,608,254 | ||||||||||||
Short-Term Investment | 89,819,216 | – | – | 89,819,216 | ||||||||||||
|
|
|
|
|
|
|
| |||||||||
| 1,983,427,470 | – | – | 1,983,427,470 | |||||||||||||
|
|
|
|
|
|
|
| |||||||||
| 2017 Annual Report | 119 |
Notes to Financial Statements (continued)
October 31, 2017
For movements between the levels within the fair value hierarchy, the Funds have adopted a policy of recognizing transfers at the end of each fiscal period. As described above, certain foreign securities are valued utilizing valuation factors provided by an independent pricing service to reflect any significant market movements between the time foreign markets close and the time the Fund values such foreign securities. The utilization of valuation factors may result in transfers between Level 1 and Level 2. The following is a summary of transfers from Level 1 and Level 2 as of October 31, 2017:
| Fund | Transfer from Level 1 | Transfer from Level 2 | ||||||
Asia-Pacific (ex-Japan) Equity Fund | $ | 112,115 | $ | 813,119 | ||||
China Opportunities Fund | $ | 207,236 | $ | – | ||||
Emerging Markets Fund | $ | 94,037,215 | $ | 717,470,337 | ||||
Global Equity Fund | $ | 647,022 | $ | – | ||||
International Equity Fund | $ | 9,705,323 | $ | 20,787,480 | ||||
International Small Cap Fund | $ | 6,698,981 | $ | 9,363,295 | ||||
| b. | Restricted Securities |
Restricted securities are privately-placed securities whose resale is restricted under U.S. securities laws. The Funds may invest in restricted securities, including unregistered securities eligible for resale without registration pursuant to Rule 144A and privately-placed securities of U.S. and non-U.S. issuers offered outside the U.S. without registration pursuant to Regulation S under the Securities Act of 1933, as amended (the “1933 Act”). Rule 144A securities may be freely traded among certain qualified institutional investors, such as the Funds, but resale of such securities in the U.S. is permitted only in limited circumstances.
| c. | Foreign Currency Translation |
Foreign securities, currency and other assets and liabilities denominated in foreign currencies are translated into U.S. dollars at the exchange rate of said currencies against the U.S. dollar, at Valuation Time, as provided by an independent pricing service. Purchases and sales of securities, and income and expenses are translated at the prevailing rate of exchange on the respective date of these transactions. The Funds do not isolate that portion of the results of operations resulting from changes in foreign exchange rates on investments from fluctuations arising from changes in market prices of securities held. These fluctuations are included with the net realized and unrealized gain or loss from investments and foreign currencies within the Statements of Operations.
| d. | Rights Issues and Warrants |
Rights issues give the right, normally to existing shareholders, to buy a proportional number of additional securities at a given price (generally at a discount) within a fixed period (generally a short-term period) and are offered at the company’s discretion. Warrants are securities that give the holder the right to buy common stock at a specified price for a specified period of time. Rights issues and warrants are speculative and have no value if they are not exercised before the expiration date. Rights issues and warrants are valued at the last sale price on the exchange on which they are traded.
| e. | Short Sales |
During the period, and prior to changing its principal investment strategies and name from Aberdeen Equity Long-Short Fund to Aberdeen Focused U.S. Equity Fund (which occurred on November 15, 2017), the Fund engaged in short-selling of portfolio securities, which obligates the Fund to replace any security that it has borrowed by purchasing the security at current market value sometime in the future. The Fund incurs a loss if the price of the security increases between the date of the short sale and the date on which the Fund replaces the borrowed security. The Fund generally will realize a gain if the price of the security declines between these dates. Until the Fund replaces the borrowed security, the Fund will segregate or earmarks cash, other liquid assets and/or securities held long to sufficiently cover the Fund’s short position on a daily basis. Dividends declared on securities sold short are recorded as an expense on the ex-dividend date and paid to the counterparty on the dividend pay date. The collateral for securities sold short includes the deposits with brokers and securities held long as shown in the Statement of Investments for the Fund.
| f. | Security Transactions, Investment Income and Expenses |
Security transactions are recorded on the trade date. Realized and unrealized gains/(losses) from security and currency transactions are calculated on the identified cost basis. Dividend income and corporate actions are recorded generally on the ex-date, except for certain dividends and corporate actions which may be recorded after the ex-date, as soon as a Fund acquires information regarding such dividends or corporate actions.
Interest income and expenses are recorded on an accrual basis. Expenses directly attributable to a Fund are charged to that Fund. Expenses not directly attributable to a Fund are allocated proportionately among the relevant Funds based on net assets of each. For each of the
| 120 | Annual Report 2017 |
Notes to Financial Statements (continued)
October 31, 2017
Funds, the method for allocating income, fund level expenses, and realized and unrealized gains or losses to a class is based on the average net asset value of that class’ shares in proportion to the average net assets of the relevant Fund when incurred. Expenses specific to a class (such as Rule 12b-1 and administrative services fees) are charged to that class.
| g. | Distributions |
Distributions from net investment income, if any, are declared and paid quarterly for all Funds. The Funds will also declare and pay distributions at least annually from net realized gains on investment transactions and net realized foreign exchange gains, if any. Dividends and distributions to shareholders are recorded on the ex-dividend date.
Dividends and distributions to shareholders are determined in accordance with federal income tax regulations, which may differ from GAAP. These differences are primarily due to differing treatments for foreign currencies and loss deferrals.
| h. | Federal Income Taxes |
Each Fund intends to continue to qualify as a “regulated investment company” by complying with the provisions available to certain investment companies, as defined in Subchapter M of the Internal Revenue Code of 1986, as amended, and to make distributions of net investment income and net realized capital gains sufficient to relieve the Funds from all federal income taxes. Therefore, no federal income tax provision is required. Management of the Funds has concluded that there are no significant uncertain tax positions that would require recognition in the financial statements. Since tax authorities can examine previously filed tax returns, the Funds’ U.S. federal and state tax returns for each of the four fiscal years up to the most recent fiscal year ended October 31 are subject to such review.
| i. | Foreign Withholding Tax |
Dividend and interest income from non-U.S. sources received by the Funds are generally subject to non-U.S. withholding taxes. In addition, the Funds may be subject to capital gains tax in certain countries in which they invest. The above taxes may be reduced or eliminated under the terms of applicable U.S. income tax treaties with some of these countries. The Funds accrue such taxes when the related income is earned.
In addition, when the Fund sells securities within certain countries in which it invests, the capital gains realized may be subject to tax. Based on these market requirements and as required under GAAP, the Fund accrues deferred capital gains tax on securities currently held that have unrealized appreciation within these countries. The amount of deferred capital gains tax accrued is reported on the Statement of Operations as part of the Net Change in Unrealized Appreciation/Depreciation on Investments.
| j. | Repurchase Agreements |
The Funds may enter into a repurchase agreement under the terms of a Master Repurchase Agreement. It is each Fund’s policy that its custodian/counterparty segregate the underlying collateral securities, the value of which exceeds the principal amount of the repurchase transaction, including accrued interest. The repurchase price generally equals the price paid by a Fund plus interest negotiated on the basis of current short-term rates. To the extent that any repurchase transaction exceeds one business day, the collateral is valued on a daily basis to determine its adequacy. If the counterparty to a repurchase agreement defaults and the value of the collateral declines, or if bankruptcy proceedings are commenced with respect to the counterparty of the security, realization of the collateral by the Funds may be delayed or limited. Repurchase agreements are subject to contractual netting arrangements with the Fund’s repurchase agreement counterparty, Fixed Income Clearing Corp. To the extent the Funds enter into repurchase agreements, additional information on individual repurchase agreements is included in the Statements of Investments. As of and during the fiscal year ended, October 31, 2017, the Funds did not hold any repurchase agreements.
| k. | Securities Lending |
Through an agreement with BNP Paribas as the Lending Agent and State Street Bank and Trust Company (the Funds’ custodian), the Funds may lend its portfolio securities to brokers, dealers and other financial institutions that pay a negotiated fee in order to generate additional income. The Funds receive non-cash collateral in the form of U.S. Government Securities, with respect to each loan of U.S. securities, equal to at least 102% of the value of the portfolio securities loaned, and, with respect to each loan of non-U.S. securities, collateral of at least 105% of the value of the portfolio securities loaned, and at all times thereafter shall require the borrower to mark to market such collateral on a daily basis so that the market value of such collateral does not fall below 100% of the market value of the portfolio securities so loaned.
The Funds continue to own the loaned securities. However, securities lending involves certain risks including the event of default or insolvency of the borrower including possible delays or restrictions upon a Fund’s ability to recover the loaned securities or dispose of the collateral for the loan. Securities on loan are noted within the Statement of Investments. Non-cash securities lending collateral held by the Lending Agent on behalf of the Funds cannot be sold or repledged by the Fund and, therefore, this amount is not presented on the Funds’ Statements of Investments.
| 2017 Annual Report | 121 |
Notes to Financial Statements (continued)
October 31, 2017
At October 31, 2017, the market value of loaned securities and collateral received were as follows:
| Fund | Value of Securities Loaned | Value of Cash Collateral | Value of Non-cash Collateral | |||||||||
China Opportunities Fund | $ | 187,328 | $ | 200,384 | $ | – | ||||||
Emerging Markets Fund | 8,170,982 | 8,819,231 | – | |||||||||
International Equity Fund | 5,231,959 | 5,614,261 | – | |||||||||
International Small Cap Fund | 3,001,054 | 3,241,223 | – | |||||||||
Japanese Equities Fund | 46,522 | 50,117 | – | |||||||||
U.S. Small Cap Equity Fund | 55,982,310 | 59,008,297 | – | |||||||||
3. Agreements and Transactions with Affiliates
| Merger | of Aberdeen Asset Management PLC with Standard Life plc |
The Funds’ investment adviser, sub-advisers, distributor and administrator are each a subsidiary of Aberdeen Asset Management PLC (“Aberdeen PLC”). The merger of Standard Life plc and Aberdeen PLC was announced on March 6, 2017 and closed on August 14, 2017 (“Merger”). Aberdeen PLC became a direct subsidiary of Standard Life plc as a result of the Merger and the combined company changed its name to Standard Life Aberdeen plc. Shareholders of the Funds are not required to take any action as a result of the Merger. Following the Merger, the Funds’ investment adviser, sub-advisers, distributor and administrator each became an indirect subsidiary of Standard Life Aberdeen plc, but otherwise did not change. The investment advisory, investment sub-advisory, distribution and administration agreements that the Trust, on behalf of the Funds, has with Aberdeen PLC’s subsidiary companies, the services provided under the agreements, and the fees charged for those services did not change as a result of the Merger. The portfolio management team for each Fund has remained the same following of the Merger.
| a. | Investment Adviser |
Under the Investment Advisory Agreement with the Trust, Aberdeen Asset Management Inc. (“Aberdeen” or the “Adviser”) manages the Funds in accordance with the policies and procedures established by the Board.
For services provided under the terms of the current Investment Advisory Agreement, each Fund pays the Adviser an annual management fee (as a percentage of its average daily net assets) paid monthly according to the following schedule:
| Fund | Fee Schedule | |||||||
Asia-Pacific (ex-Japan) Equity Fund | On all assets | 1.00% | ||||||
China Opportunities Fund | Up to $500 million | 1.25% | ||||||
| $500 million up to $2 billion | 1.20% | |||||||
| On $2 billion and more | 1.15% | |||||||
Emerging Markets Fund | On all assets | 0.90% | ||||||
Focused U.S. Equity Fund (effective 11/15/17)* | Up to $500 million | 0.75% | ||||||
| $500 million up to $2 billion | 0.70% | |||||||
| On $2 billion and more | 0.65% | |||||||
Global Equity Fund | Up to $500 million | 0.90% | ||||||
| $500 million up to $2 billion | 0.85% | |||||||
| On $2 billion and more | 0.80% | |||||||
International Equity Fund | On all assets | 0.80% | ||||||
International Small Cap Fund | Up to $100 million | 1.25% | ||||||
| On $100 million and more | 1.00% | |||||||
Japanese Equities Fund | On all assets | 0.65% | ||||||
U.S. Mid Cap Equity Fund | Up to $500 million | 0.75% | ||||||
| $500 million up to $2 billion | 0.70% | |||||||
| On $2 billion and more | 0.65% | |||||||
U.S. Multi-Cap Equity Fund | Up to $500 million | 0.75% | ||||||
| $500 million up to $2 billion | 0.70% | |||||||
| On $2 billion and more | 0.65% | |||||||
U.S. Small Cap Equity Fund | Up to $100 million | 0.95% | ||||||
| On $100 million and more | 0.80% | |||||||
| * | Prior to the change in the Fund’s name, strategy and fee structure on November 15, 2017, the management fee rate for the Fund was 1.15% on assets up to $1 billion and 1.00% on assets in excess of $1 billion. |
| 122 | Annual Report 2017 |
Notes to Financial Statements (continued)
October 31, 2017
The Adviser has engaged the services of affiliates Aberdeen Asset Management Asia Limited (“AAMAL”) and Aberdeen Asset Managers Limited (“AAML”) as subadvisers (the “Subadvisers”) pursuant to subadvisory agreements. The Subadvisers manage a portion of certain Funds’ investments and have the responsibility for making all investment decisions for the portion of a Fund’s assets they manage. Pursuant to the subadvisory agreements, the Adviser pays fees to the Subadvisers, if any.
The Trust and Aberdeen have entered into a written contract (“Expense Limitation Agreement”) limiting operating expenses for all classes of the Funds from exceeding the amounts listed below. This contractual limitation may not be terminated before February 28, 2018 (or February 28, 2019 with respect to the International Equity Fund and Focused U.S. Equity Fund) without the approval of the Independent Trustees of the Board. This limit excludes certain expenses, including any taxes, interest, brokerage fees, short-sale dividend expenses, acquired fund fees and expenses, Rule 12b-1 fees, administrative services fees, transfer agent out-of-pocket expenses for Class A shares, Class R shares, and Institutional Service Class shares and extraordinary expenses.
| Fund | Limit | |||
Asia-Pacific (ex-Japan) Equity Fund | 1.25% | |||
China Opportunities Fund | 1.62% | |||
Emerging Markets Fund | 1.10% | |||
Focused U.S. Equity Fund (effective 11/15/17)* | 0.90% | |||
Global Equity Fund | 1.19% | |||
International Equity Fund | 1.10% | |||
International Small Cap Fund | 1.30% | |||
Japanese Equities Fund | 1.00% | |||
U.S. Mid Cap Equity Fund | 1.00% | |||
U.S. Multi-Cap Equity Fund | 0.90% | |||
U.S. Small Cap Equity Fund | 1.15% | |||
| * | Prior to the change in the Fund’s name, strategy and fee structure on November 15, 2017, this limit was 1.40%. |
Effective as of November 15, 2017, in connection with the change in the Focused U.S. Equity Fund’s name, strategy and fee structure, the Adviser terminated, with the approval of the Independent Trustees of the Board, the written contract to reimburse the Fund for short-sale brokerage expenses at an annual rate of up to 0.15% of the Fund’s average daily net assets. Amounts reimbursed by the Adviser for short sale brokerage expenses are not subject to recoupment at a later date.
Aberdeen may request and receive reimbursement from a Fund of the advisory fees waived and other expenses reimbursed pursuant to the Expense Limitation Agreement as of a date not more than three years after the date when the Adviser limited the fees or reimbursed the expenses; provided that the following requirements are met: the reimbursements do not cause a class to exceed the lesser of the applicable expense limitation in the contract at the time the fees were limited or expenses are paid or the applicable expense limitation in effect at the time the expenses are being recouped by the Adviser, and the payment of such reimbursement is approved by the Board on a quarterly basis (the “Reimbursement Requirements”). Except as provided for in the Expense Limitation Agreement, reimbursement of amounts previously waived or assumed by Aberdeen is not permitted.
During the year ended October 31, 2016, the following Funds received reimbursement from Aberdeen for certain previously paid Transfer Agent expenses not attributable to the Funds as follows:
Focused U.S. Equity Fund | $ | 19,386 | ||
Global Equity Fund | $ | 17,201 | ||
International Equity Fund | $ | 264,886 |
In addition and related to the Transfer Agent expenses not attributable to the Funds, Aberdeen has reduced the amounts of prior advisory fees waived and other expenses reimbursed that are eligible for reimbursement in future periods by the following amounts for the following Funds:
China Opportunities Fund | $ | 11,010 | ||
Emerging Markets Fund | $ | 36,985 | ||
International Small Cap Fund | $ | 1,423 | ||
U.S. Multi-Cap Equity Fund | $ | 14,357 | ||
U.S. Small Cap Equity Fund | $ | 75,732 |
| 2017 Annual Report | 123 |
Notes to Financial Statements (continued)
October 31, 2017
As of October 31, 2017, to the extent the Reimbursement Requirements are met, the cumulative potential reimbursements to Aberdeen for each Fund, based on expenses reimbursed by Aberdeen, including adjustments described above, would be:
| Fund | Amount Fiscal Year 2015 (Expires 10/31/18) | Amount Fiscal Year 2016 (Expires 10/31/19) | Amount Fiscal Year 2017 (Expires 10/31/20) | Total* | ||||||||||||
Asia-Pacific (ex-Japan) Equity Fund | $ | 136,242 | $ | 89,826 | $ | 230,842 | $ | 456,910 | ||||||||
China Opportunities Fund | 137,165 | 136,771 | 144,211 | 418,147 | ||||||||||||
Emerging Markets Fund | 3,028,391 | 2,402,413 | 2,698,121 | 8,128,925 | ||||||||||||
Focused U.S. Equity Fund** | 98,729 | 132,760 | 144,234 | 375,723 | ||||||||||||
Global Equity Fund | 70,298 | 67,616 | 110,176 | 248,090 | ||||||||||||
International Equity Fund | – | 4,248 | 11,298 | 15,546 | ||||||||||||
International Small Cap Fund | 369,096 | 366,445 | 338,671 | 1,074,212 | ||||||||||||
Japanese Equities Fund | – | 165,646 | 128,431 | 294,077 | ||||||||||||
U.S. Mid Cap Equity Fund | – | 103,780 | 137,558 | 241,338 | ||||||||||||
U.S. Multi-Cap Equity Fund | 330,663 | 329,278 | 250,349 | 910,290 | ||||||||||||
U.S. Small Cap Equity Fund | – | – | – | – | ||||||||||||
| * | Amounts reported are due to expire throughout the respective 3-year expiration period presented above. |
| ** | Amount that expires 10/31/20 does not include $26,033 that has been reimbursed by Aberdeen that is not eligible to be recaptured by Aberdeen. |
| Amounts | listed as “–” are $0 or round to $0. |
| b. | Fund Administration |
Under the terms of the Fund Administration Agreement, Aberdeen provides various administrative and accounting services, including daily valuation of the Funds’ shares, preparation of financial statements, tax returns, regulatory reports, and presentation of quarterly reports to the Board. For services provided pursuant to the Fund Administration Agreement, the Trust pays Aberdeen an annual fee of 0.08% based on the Trust’s average daily net assets. The fee is then allocated proportionately among all funds within the Trust (including the Funds) in relation to the average daily net assets of each fund. This asset-based fee is subject to an annual minimum fee based on the number of funds served. Pursuant to a sub-administration agreement with Aberdeen, State Street Bank and Trust Company provides sub-administration services with respect to the Funds.
| c. | Distributor and Shareholder Servicing |
The Trust and Aberdeen Fund Distributors, LLC (the “Distributor”) are parties to the current Underwriting Agreement (the “Underwriting Agreement”) whereby the Distributor acts as principal underwriter for the Trust’s shares.
The Trust has adopted a Distribution Plan (the “Plan”) pursuant to Rule 12b-1 under the 1940 Act with respect to certain classes of shares. The Plan permits the Funds to compensate the Distributor, for expenses associated with the distribution-related and/or shareholder services provided by such entities. These fees are paid to the Distributor and are either kept or paid to shareholders’ financial advisors or other intermediaries for distribution and shareholder services. Although actual distribution expenses may be more or less, under the Plan, the Funds of the Trust pay the Distributor an annual fee of the following amounts:
| Fund | Class A Shares | Class C Shares (a) | Class R Shares (a) | |||||||||
Asia-Pacific (ex-Japan) Equity Fund | 0.25% | 1.00% | 0.50% | |||||||||
China Opportunities Fund | 0.25% | 1.00% | 0.50% | |||||||||
Emerging Markets Fund | 0.25% | 1.00% | 0.50% | |||||||||
Focused U.S. Equity Fund | 0.25% | 1.00% | 0.50% | |||||||||
Global Equity Fund | 0.25% | 1.00% | 0.50% | |||||||||
International Equity Fund | 0.25% | 1.00% | 0.50% | |||||||||
International Small Cap Fund | 0.25% | 1.00% | 0.50% | |||||||||
Japanese Equities Fund | 0.25% | 1.00% | 0.50% | |||||||||
U.S. Mid Cap Equity Fund | 0.25% | 1.00% | 0.50% | |||||||||
U.S. Multi-Cap Equity Fund | 0.25% | 1.00% | 0.50% | |||||||||
U.S. Small Cap Equity Fund | 0.25% | 1.00% | 0.50% | |||||||||
| (a) | 0.25% of which is service fees. |
| 124 | Annual Report 2017 |
Notes to Financial Statements (continued)
October 31, 2017
The Adviser or an affiliate of the Adviser may pay additional amounts from its own resources to dealers or other financial intermediaries, for aid in distribution or for aid in providing administrative services to shareholders.
Pursuant to the current Underwriting Agreement, the Distributor will also receive the proceeds of contingent deferred sales charges (“CDSCs”) of 1% imposed on certain redemptions of Class C (and up to 1% for certain Class A) shares.
In addition, the Distributor will re-allow to dealers 5.00% of sales charges on Class A shares of the Funds, which have a maximum front-end sales charge of 5.75% and the Distributor or the Adviser may compensate broker dealers or financial intermediaries from its own resources at the rate of 1.00% on sales of Class C shares of the Funds, which have a maximum CDSC of 1.00% (the CDSC assessed on sales within one year of purchase). For the fiscal year ended October 31, 2017, AFD retained commissions of $825,883 from front-end sales charges of Class A shares and $61,652 from CDSC fees from Class C (and certain Class A) shares of the Funds.
| d. | Administrative Services Fees/Transfer Agent Out-of-Pocket Expenses |
The Funds may pay and/or reimburse administrative services fees/transfer agent out-of-pocket expenses to certain broker-dealers and financial intermediaries who provide administrative support services to beneficial shareholders on behalf of the Funds (sometimes referred to as “sub-transfer agency fees”), subject to certain limitations approved by the Board. These fees may be in addition to Rule 12b-1 fees. Sub-transfer agency fees generally include, but are not limited to, costs associated with omnibus accounting, recordkeeping, networking, sub-transfer agency or other administrative or shareholder services.
Class A, Class R and Institutional Services Class shares of the Funds pay for such services pursuant to an Administrative Services Plan adopted by the Board. Under the Administrative Services Plan, a Fund may pay a broker-dealer or other intermediary a maximum annual administrative services fee of 0.25% for Class A, Class R and Institutional Services Class shares. Under an amendment to the Administrative Services Plan, that is in effect until at least February 28, 2018, a Fund may pay a maximum of 0.15% for contracts with fees that are calculated as percentage of Fund assets and a maximum of $16 per account for contracts with fees that are calculated on a dollar per account basis. Class C and Institutional Class shares may also pay for the services described above directly, as these classes are not subject to an Administrative Services Plan.
The amount of sub-transfer agent and administrative service fees paid during the fiscal year ended October 31, 2017 was as follows:
| Fund | Class A | Class C | Class R | Institutional Service | Institutional | |||||||||||||||
Asia-Pacific (ex-Japan) Equity Fund | $ | 337 | $ | 39 | $ | – | $ | 1,715 | $ | 5,540 | ||||||||||
China Opportunities Fund | 7,224 | 3,689 | 2,997 | 546 | 720 | |||||||||||||||
Emerging Markets Fund | 418,469 | 50,623 | 118,219 | 554,153 | 3,818,625 | |||||||||||||||
Focused U.S. Equity Fund | 11,231 | 4,945 | 4,873 | 1,549 | 24,584 | |||||||||||||||
Global Equity Fund | 58,637 | 5,076 | 6,517 | 554 | 3,691 | |||||||||||||||
International Equity Fund | 58,657 | 24,588 | 14,615 | 80,427 | 73,335 | |||||||||||||||
International Small Cap Fund | 41,491 | 1,831 | 2,579 | 98 | 10,009 | |||||||||||||||
Japanese Equities Fund | 53 | – | – | – | 1 | |||||||||||||||
U.S. Mid Cap Equity Fund | – | – | – | – | – | |||||||||||||||
U.S. Multi-Cap Equity Fund | 92,826 | 6,067 | 447 | 90,532 | 2,743 | |||||||||||||||
U.S. Small Cap Equity Fund | 491,019 | 112,799 | 44,010 | 89,470 | 1,418,558 | |||||||||||||||
| e. | Purchase/Sale Transactions Between Affiliates |
The Funds are permitted to buy or sell securities with funds that have a common investment adviser (or investment advisers which are affiliates) under specific procedures which have been approved by the Board of Trustees of the Trust. The procedures are designed to satisfy the requirements of Rule 17a-7 of the Investment Company Act of 1940 (“Rule 17a-7”). During the fiscal year ended October 31, 2017, the Funds engaged in purchases and sales of securities pursuant to Rule 17a-7 as follows:
| Fund | Purchases | Sales | ||||||
Focused U.S. Equity Fund | $ | 131,738 | $ | – | ||||
U.S. Multi-Cap Equity Fund | 1,151,744 | – | ||||||
U.S. Small Cap Equity Fund | – | 995,977 | ||||||
| 2017 Annual Report | 125 |
Notes to Financial Statements (continued)
October 31, 2017
4. Investment Transactions
Purchases and sales of securities (excluding short-term securities) for the fiscal year ended October 31, 2017, were as follows:
| Fund | Purchases | Sales | ||||||
Asia-Pacific (ex-Japan) Equity Fund | $ | 2,342,260 | $ | 8,423,285 | ||||
China Opportunities Fund | 3,006,037 | 6,590,766 | ||||||
Emerging Markets Fund | 1,352,864,057 | 1,846,569,518 | ||||||
Focused U.S. Equity Fund | 14,470,119 | 57,818,373 | ||||||
Global Equity Fund | 20,043,104 | 92,406,524 | ||||||
International Equity Fund | 62,616,097 | 83,609,574 | ||||||
International Small Cap Fund | 15,141,713 | 22,906,474 | ||||||
Japanese Equities Fund | 448,108 | 228,952 | ||||||
U.S. Mid Cap Equity Fund | 526,405 | 576,061 | ||||||
U.S. Multi-Cap Equity Fund | 118,129,162 | 166,943,719 | ||||||
U.S. Small Cap Equity Fund | 1,157,525,149 | 737,971,720 | ||||||
5. Portfolio Investment Risks
| a. | Active Trading Risk |
The Focused U.S. Equity Fund may engage in active and frequent trading of portfolio securities to achieve its investment objective. If the Fund does trade this way, it may incur increased costs, which can lower the actual return of the Fund.
| b. | Country/Regional Focus Risk |
Certain Funds may have significant exposure to a single country or geographical region, which involves increased currency, political, regulatory and other risks. Market swings in the targeted country or geographical region likely will have a greater effect on portfolio performance than they would in a more geographically diversified fund.
| c. | Emerging Markets Risk |
Certain Funds are subject to Emerging Markets Risk. This is a magnification of the risks that apply to foreign investments. These risks are greater for securities of companies in emerging markets countries because the countries may have less stable governments, more volatile currencies and less established markets (see “Foreign Securities Risk” below).
| d. | Equity-Linked Notes |
Certain Funds may invest in equity-linked notes, which are generally subject to the same risks as the foreign equity securities or the basket of foreign securities they are linked to. If the linked security(ies) declines in value, the note may return a lower amount at maturity. The trading price of an equity-linked note also depends on the value of the linked security(ies).
| e. | Focus Risk |
Because the Focused U.S. Equity Fund invests a greater proportion of its assets in the securities of a smaller number of issuers, the Fund will be subject to greater volatility with respect to its investments than a fund that invests in a larger number of securities.
| f. | Foreign Currency Exposure Risk |
The value of foreign currencies relative to the U.S. Dollar fluctuates in response to market, economic, political, regulatory, geopolitical or other conditions. A decline in the value of a foreign currency versus the U.S. Dollar reduces the value in U.S. Dollars of investments denominated in that foreign currency. This risk may impact a Fund more greatly to the extent the Fund does not hedge its currency risk, or hedging techniques used by the Adviser are unsuccessful.
| g. | Foreign Securities Risk |
Certain Funds are subject to Foreign Securities Risk. Foreign securities may be more volatile, harder to price and less liquid than U.S. securities. They are subject to different accounting and regulatory standards and political and economical risks.
Asia-Pacific (ex-Japan) Region. The Asia-Pacific (ex-Japan) region generally refers to the part of the world in or near the Western Pacific Ocean. The area includes much of East Asia, South Asia, Australasia and Oceania, but excludes Japan. Parts of the Asian-Pacific region may be subject to a greater degree of economic, political and social instability, as described below under “— Asian Risk.”
| 126 | Annual Report 2017 |
Notes to Financial Statements (continued)
October 31, 2017
Asian Risk. Parts of the Asian region may be subject to a greater degree of economic, political and social instability than is the case in the United States and Europe. Some Asian countries can be characterized as emerging markets or newly industrialized and may experience more volatile economic cycles than developed countries. The developing nature of securities markets in many countries in the Asian region may lead to a lack of liquidity while some countries have restricted the flow of money in and out of the country. Some countries in Asia have historically experienced political uncertainty, corruption, military intervention and social unrest. A fund investing heavily in Asia may be more volatile than a fund which is broadly diversified geographically.
China Risk. The economy of China differs from the U.S. and other more established economies in such respects as structure, general development, government involvement, wealth distribution, rate of inflation, growth rate, allocation of resources and capital reinvestment, and some of these differences are unfavorable to investors. Therefore, investing in China involves a high degree of risk and special considerations not typically associated with investing in other more established economies or securities markets. The Funds invest in China A shares. China A shares are shares in mainland China-based companies that trade on Chinese stock exchanges and are usually only available to foreign investors through a quota license or by purchasing Shanghai and Shenzhen Stock Exchange listed securities via brokers in Hong Kong through the Shanghai-Hong Kong Stock Connect and Shenzhen-Hong Kong Stock Connect programs (collectively, “Stock Connect”). Investing in China A shares may involve special risk considerations such as volatility in the China A share market and uncertainty regarding taxation.
A Funds’ ability to freely trade in China A Shares as a foreign investor through the quota license or Stock Connect may be limited by quota and repatriation restrictions, and utilizing Stock Connect is subject to trading, clearance and settlement procedures in China that are relatively new and untested.
Japan Risk. The Japanese economy has only recently emerged from a prolonged economic downturn. Since the year 2000, Japan’s economic growth has remained relatively low. The economy is characterized by an aging demographic, declining population, large government debt and highly regulated labor market. Economic growth is dependent on domestic consumption, deregulation and consistent government policy. International trade, particularly with the U.S., also impacts growth and adverse economic conditions in the U.S. or other such trade partners may affect Japan. Japan also has a growing economic relationship with China and other Southeast Asian countries, and thus Japan’s economy may also be affected by economic, political or social instability in those countries (whether resulting from local or global events).
| h. | Illiquid Securities Risk |
Illiquid securities are assets which may not be sold or disposed of in the ordinary course of business within seven days at approximately the price at which a Fund has valued the investment on its books and may include such securities as those not registered under U.S. securities laws or securities that cannot be sold in public transactions. An inability to sell a portfolio position can adversely affect a Fund’s value or prevent the Fund from being able to take advantage of other investment opportunities. Illiquid securities and relatively less liquid securities may also be difficult to value.
Each Fund employs proprietary procedures and tests using third-party and internal data inputs that seek to assess and manage the liquidity of its portfolio holdings. A Fund’s procedures and tests take into account relevant market, trading and other factors, and monitor whether liquidity assessments should be adjusted based on changed market conditions. These procedures and tests are designed to assist a Fund in determining its ability to meet redemption requests in various market conditions. In light of the dynamic nature of markets, there can be no assurance that these procedures and tests will enable a Fund to ensure that it has sufficient liquidity to meet redemption requests.
| i. | Impact of Large Redemptions and Purchases of Fund Shares |
Occasionally, shareholders may make large redemptions or purchases of Fund shares, which may cause the Fund to have to sell securities or invest additional cash. These transactions may adversely affect a Fund’s performance and increase transaction costs. In addition, large redemption requests may exceed the cash balance of a Fund and result in credit line borrowing fees and/or overdraft charges to the Fund until the sale of portfolio securities to cover the redemption request settle. For additional information on redemptions, please see the Statement of Changes in Net Assets.
| j. | Issuer Risk |
The value of a security may decline for reasons directly related to the issuer, such as management performance, financial leverage and reduced demand for the issuer’s goods or service.
| k. | Management Risk |
The Fund is subject to the risk that the Adviser may make poor security selections. The Adviser and its portfolio managers apply their own investment techniques and risk analyses in making investment decisions for the Fund and there can be no guarantee that these decisions will achieve the desired results for the Fund. In addition, the Adviser may select securities that underperform the relevant market of other funds with similar investment objectives and strategies.
| 2017 Annual Report | 127 |
Notes to Financial Statements (continued)
October 31, 2017
| l. | Market Risk |
Deteriorating market conditions might cause a general weakness in the market that reduces the prices of securities in that market in which a Fund invests.
| m. | Mid-Cap Securities Risk |
Certain Funds are subject to Mid-Cap Securities Risk. Stocks of medium-sized companies tend to be more volatile and less liquid than stocks of larger companies.
| n. | Sector Risk: |
To the extent that a Fund has a significant portion of its assets invested in securities of companies conducting business in a broadly related group of industries within an economic sector, the Fund may be more vulnerable to unfavorable developments in that economic sector than a fund that invest more broadly.
Consumer Staples Sector Risk. To the extent the consumer staples sector represents a significant portion of a Fund, the Fund will be sensitive to changes in, and its performance may depend to a greater extent on, factors impacting this sector. The consumer staples sector may be affected by the regulation of various product components and production methods, marketing campaigns and other factors affecting consumer demand. Tobacco companies, in particular, may be adversely affected by new laws, regulations and litigation. The consumer staples sector may also be adversely affected by changes or trends in commodity prices, which may be influenced by unpredictable factors.
Financial Sector Risk. To the extent that the financial sector represents a significant portion of a Fund, the Fund will be sensitive to changes in, and its performance may depend to a greater extent on, factors impacting this sector. Performance of companies in the financials sector may be adversely impacted by many factors, including, among others, government regulations, economic conditions, credit rating downgrades, changes in interest rates, and decreased liquidity in credit markets. The impact of more stringent capital requirements, recent or future regulation of any individual financial company, or recent or future regulation of the financials sector as a whole cannot be predicted. In recent years, cyber attacks and technology malfunctions and failures have become increasingly frequent in this sector and have caused significant losses.
Industrials Sector Risk. To the extent that the industrials sector represents a significant portion of a Fund, the Fund will be sensitive to changes in, and its performance may depend to a greater extent on, factors impacting this sector. The value of securities issued by companies in the industrials sector may be adversely affected by supply and demand related to their products and services, product obsolescence, claims for environmental damage or product liability and general economic conditions, among other factors.
Information Technology Risk. To the extent that the information technology sector represents a significant portion of a fund, the Fund will be sensitive to changes in, and its performance may depend to a greater extent on, factors impacting this sector. Performance of companies in the information technology sector may be adversely impacted by many factors, including, among others, overall economic conditions, short product cycles, rapid obsolescence of products, competition and government regulation.
| o. | Small-Cap Securities Risk |
Certain Funds are subject to Small-Cap Securities Risk. Stocks of smaller companies are usually less stable in price and less liquid than those of larger, more established companies. Therefore, they generally involve greater risk.
| p. | Valuation Risk |
The price that a Fund could receive upon the sale of any particular portfolio investment may differ from the Fund’s valuation of the investment, particularly for securities that trade in thin or volatile markets or that are valued using a fair valuation methodology or a price provided by an independent pricing service. As a result, the price received upon the sale of an investment may be less than the value ascribed by a Fund, and the Fund could realize a greater than expected loss or lower than expected gain upon the sale of the investment. A Fund’s ability to value its investments may also be impacted by technological issues and/or errors by pricing services or other third-party service providers.
Please read the prospectus for more detailed information regarding these and other risks.
6. Contingencies
In the normal course of business, the Funds may provide general indemnifications pursuant to certain contracts and organizational documents. The Funds’ maximum exposure under these arrangements is dependent on future claims that may be made against the Funds, and therefore, cannot be estimated; however, based on experience, the risk of loss from such claims is considered remote.
| 128 | Annual Report 2017 |
Notes to Financial Statements (continued)
October 31, 2017
7. Tax Information
As of October 31, 2017, the tax cost of securities and the breakdown of unrealized appreciation/(depreciation) for each Fund were as follows:
| Tax Cost of Securities | Unrealized Appreciation | Unrealized Depreciation | Net Unrealized Appreciation/ (Depreciation) | |||||||||||||
Asia-Pacific (ex-Japan) Equity Fund | $ | 9,912,852 | $ | 1,592,597 | $ | (318,988 | ) | $ | 1,273,609 | |||||||
China Opportunities Fund | 12,630,504 | 2,338,854 | (1,595,637 | ) | 743,217 | |||||||||||
Emerging Markets Fund | 7,535,694,487 | 1,953,641,462 | (772,462,690 | ) | 1,181,178,772 | |||||||||||
Focused U.S. Equity | 20,924,010 | 5,311,865 | (473,711 | ) | 4,838,154 | |||||||||||
Global Equity Fund | 36,203,440 | 7,028,472 | (454,146 | ) | 6,574,326 | |||||||||||
International Equity Fund | 470,964,138 | 99,429,111 | (32,566,219 | ) | 66,862,892 | |||||||||||
International Small Cap Fund | 66,259,515 | 17,959,986 | (1,001,284 | ) | 16,958,702 | |||||||||||
Japanese Equities Fund | 1,280,331 | 248,750 | (29,742 | ) | 219,008 | |||||||||||
U.S. Mid Cap Equity Fund | 1,180,663 | 237,087 | (20,041 | ) | 217,046 | |||||||||||
U.S. Multi-Cap Equity Fund | 295,378,502 | 73,788,418 | (6,539,429 | ) | 67,248,989 | |||||||||||
U.S. Small Cap Equity Fund | 1,804,831,629 | 276,924,007 | (39,319,869 | ) | 237,604,138 | |||||||||||
The tax character of distributions paid during the fiscal year ended October 31, 2017 was as follows (total distributions paid may differ from the Statements of Changes in Net Assets because for tax purposes dividends are recognized when actually paid):
| Distributions paid from | ||||||||||||||||||||||||
| Fund | Ordinary Income | Net Long Term Capital Gains | Total Taxable Distributions | Tax Exempt Distributions | Return of Capital | Total Distributions Paid | ||||||||||||||||||
Asia-Pacific (ex-Japan) Equity Fund | $ | – | $ | – | $ | – | $ | – | $ | – | $ | – | ||||||||||||
China Opportunities Fund | 102,872 | – | 102,872 | – | – | 102,872 | ||||||||||||||||||
Emerging Markets Fund | 89,428,350 | – | 89,428,350 | – | – | 89,428,350 | ||||||||||||||||||
Focused U.S. Equity Fund | – | 8,130,740 | 8,130,740 | – | – | 8,130,740 | ||||||||||||||||||
Global Equity Fund | 821,069 | – | 821,069 | – | – | 821,069 | ||||||||||||||||||
International Equity Fund | 7,480,443 | – | 7,480,443 | – | – | 7,480,443 | ||||||||||||||||||
International Small Cap Fund | 423,180 | 211,791 | 634,971 | – | – | 634,971 | ||||||||||||||||||
Japanese Equities Fund | 13,538 | – | 13,538 | – | – | 13,538 | ||||||||||||||||||
U.S. Mid Cap Equity Fund | 25,434 | – | 25,434 | – | – | 25,434 | ||||||||||||||||||
U.S. Multi-Cap Equity Fund | 582,292 | 39,016,766 | 39,599,058 | – | – | 39,599,058 | ||||||||||||||||||
U.S. Small Cap Equity Fund | – | – | – | – | – | – | ||||||||||||||||||
Amounts listed as “–” are $0 or round to $0.
The tax character of distributions paid during the fiscal year ended October 31, 2016 was as follows (total distributions paid may differ from the Statements of Changes in Net Assets because for tax purposes dividends are recognized when actually paid):
| Distributions paid from | ||||||||||||||||||||||||
| Fund | Ordinary Income | Net Long Term Capital Gains | Total Taxable Distributions | Tax Exempt Distributions | Return of Capital | Total Distributions Paid | ||||||||||||||||||
Asia-Pacific (ex-Japan) Equity Fund | $ | 1,991,125 | $ | – | $ | 1,991,125 | $ | – | $ | – | $ | 1,991,125 | ||||||||||||
China Opportunities Fund | – | – | – | – | – | – | ||||||||||||||||||
| 2017 Annual Report | 129 |
Notes to Financial Statements (continued)
October 31, 2017
| Distributions paid from | ||||||||||||||||||||||||
| Fund | Ordinary Income | Net Long Term Capital Gains | Total Taxable Distributions | Tax Exempt Distributions | Return of Capital | Total Distributions Paid | ||||||||||||||||||
Emerging Markets Fund | $ | 9,497,669 | $ | 79,747,978 | $ | 89,245,647 | $ | – | $ | – | $ | 89,245,647 | ||||||||||||
Focused U.S. Equity Fund | – | 14,765,152 | 14,765,152 | – | – | 14,765,152 | ||||||||||||||||||
Global Equity Fund | 266,372 | – | 266,372 | – | – | 266,372 | ||||||||||||||||||
International Equity Fund | 1,934,995 | – | 1,934,995 | – | – | 1,934,995 | ||||||||||||||||||
International Small Cap Fund | 467,389 | 8,210,232 | 8,677,621 | – | – | 8,677,621 | ||||||||||||||||||
Japanese Equities Fund | 847 | – | 847 | – | – | 847 | ||||||||||||||||||
U.S. Mid Cap Equity Fund | – | – | – | – | – | – | ||||||||||||||||||
U.S. Multi-Cap Equity Fund | 608,834 | 17,652,954 | 18,261,788 | – | – | 18,261,788 | ||||||||||||||||||
U.S. Small Cap Equity Fund | – | – | – | – | – | – | ||||||||||||||||||
Amounts listed as “–” are $0 or round to $0.
As of October 31, 2017, the components of accumulated earnings/(deficit) on a tax basis were as follows:
| Fund | Undistributed Tax Exempt Income | Undistributed Ordinary Income | Undistributed Long-Term Capital Gains | Accumulated Earnings | Distributions Payable | Late Year Ordinary and Post-October Capital Loss Deferrals | Other Temporary Differences | Unrealized Appreciation/ (Depreciation)* | Accumulated Capital and Other Losses** | Total Accumulated Earnings/ (Deficit) | ||||||||||||||||||||||||||||||
Asia-Pacific (ex-Japan) Equity Fund | $ | – | $ | 158,674 | $ | – | $ | – | $ | – | $ | – | $ | – | $ | 1,267,122 | $ | (201,965,084 | ) | $ | (200,539,288 | ) | ||||||||||||||||||
China Opportunities Fund | – | 113,578 | – | – | – | – | – | 743,324 | (1,509,922 | ) | (653,020 | ) | ||||||||||||||||||||||||||||
Emerging Markets Fund | – | 115,182,556 | – | – | – | – | – | 1,175,647,306 | (88,493,046 | ) | 1,202,336,816 | |||||||||||||||||||||||||||||
Focused U.S. Equity Fund | – | – | 6,555,886 | – | – | (384,866 | ) | – | 2,250,967 | – | 8,421,987 | |||||||||||||||||||||||||||||
Global Equity Fund | – | 245,638 | 3,376,934 | – | – | – | – | 6,541,875 | (4,793,155 | ) | 5,371,292 | |||||||||||||||||||||||||||||
International Equity Fund | – | 5,871,014 | – | – | – | – | – | 66,855,426 | (36,736,696 | ) | 35,989,744 | |||||||||||||||||||||||||||||
International Small Cap Fund | – | 491,325 | 2,117,573 | – | – | – | – | 16,958,142 | – | 19,567,040 | ||||||||||||||||||||||||||||||
Japanese Equities Fund | – | 7,371 | 15,176 | – | – | – | – | 218,939 | – | 241,486 | ||||||||||||||||||||||||||||||
U.S. Mid Cap Equity Fund | – | 52,373 | 76,333 | – | – | – | – | 217,046 | �� | 345,752 | ||||||||||||||||||||||||||||||
U.S. Multi-Cap Equity Fund | – | 1,239,601 | 35,841,152 | – | – | – | – | 67,248,989 | – | 104,329,742 | ||||||||||||||||||||||||||||||
U.S. Small Cap Equity Fund | – | – | – | – | – | (4,406,386 | ) | – | 237,604,437 | – | 233,198,051 | |||||||||||||||||||||||||||||
| * | The difference between the book-basis and tax-basis unrealized appreciation/(depreciation) is attributable primarily to passive foreign investment companies and tax deferral of losses on wash sales. |
| ** | As of October 31, 2017, for Federal income tax purposes, the following Funds have capital loss carryforwards available to offset capital gains, if any, to the extent provided by the Treasury regulations, with no expiration. |
As of October 31, 2017, for federal income tax purposes, capital loss carryforwards, as shown in the table below, were available to the extent provided by the regulations to offset future realized gains of each respective Fund with no expiration.
| Fund | Amount | Expires | ||||
Asia-Pacific (ex-Japan) Equity Fund | $ | 122,980,163 | Unlimited (Short-Term) | |||
Asia-Pacific (ex-Japan) Equity Fund | 78,984,921 | Unlimited (Long-Term) | ||||
China Opportunities Fund | 1,509,922 | Unlimited (Long-Term) | ||||
| 130 | Annual Report 2017 |
Notes to Financial Statements (continued)
October 31, 2017
| Fund | Amount | Expires | ||||
Emerging Markets Fund | $ | 88,493,046 | Unlimited (Long-Term) | |||
Global Equity Fund | 4,793,155 | Unlimited (Long-Term) | ||||
International Equity Fund | 1,215,870 | Unlimited (Short-Term) | ||||
International Equity Fund | 35,520,825 | Unlimited (Long-Term) | ||||
Under the Regulated Investment Company Modernization Act of 2010, the Funds are permitted to carry forward capital losses incurred in taxable years beginning after December 22, 2010 for an unlimited period. However, any losses incurred during those taxable years will be required to be utilized prior to the losses incurred in pre-enactment taxable years. As a result of this ordering rule, pre-enactment capital loss carryforwards may be more likely to expire unused. Additionally, post-enactment capital losses that are carried forward will retain their character as either short-term or long-term capital losses rather than being considered all short-term as under previous law.
GAAP requires that certain components of net assets be adjusted to reflect permanent differences between financial and tax reporting. Accordingly, the table below details the necessary reclassifications, which are a result of permanent differences primarily attributable to net operating losses, expired capital loss carryforwards, litigation reclass, spinoff adjustment, Indian capital gains tax, foreign currency gain/(loss), passive foreign investment company gain/(loss), equalization and merger tax attributes. These reclassifications have no effect on net assets or NAVs per share.
| Fund | Paid-in Capital | Accumulated Net Investment Income/(Loss) | Accumulated Net Realized Gain/(Loss) | |||||||||
Asia-Pacific (ex-Japan) Equity Fund | $ | – | $ | 15,700 | $ | (15,700 | ) | |||||
China Opportunities Fund | (10,001,079 | ) | 11,439 | 9,989,640 | ||||||||
Emerging Markets Fund | – | 7,707,718 | (7,707,718 | ) | ||||||||
Focused U.S. Equity Fund | 1,441,361 | 1,241,010 | (2,682,371 | ) | ||||||||
Global Equity Fund | (841,193 | ) | (306,222 | ) | 1,147,415 | |||||||
International Equity Fund | (84,636,377 | ) | (125,923 | ) | 84,762,300 | |||||||
International Small Cap Fund | – | 35,053 | (35,053 | ) | ||||||||
Japanese Equities Fund | – | (992 | ) | 992 | ||||||||
U.S. Mid Cap Equity Fund | – | (122 | ) | 122 | ||||||||
U.S. Multi-Cap Equity Fund | (11,304,060 | ) | (101 | ) | 11,304,161 | |||||||
U.S. Small Cap Equity Fund | (189,678,891 | ) | 214,751 | 189,464,140 | ||||||||
8. Significant Shareholders
As of October 31, 2017, the following Funds had shareholders with the percentage ownership indicated, which are considered significant shareholders (holdings greater than 5.0%) for financial reporting purposes:
| Fund | Record Ownership % | Number of Account Owners | ||||
Asia-Pacific (ex-Japan) Equity Fund | 71.8 | 6 | ||||
China Opportunities Fund | 23.2 | 2 | ||||
Emerging Markets Fund | 59.4 | 3 | ||||
Focused U.S. Equity Fund | 29.9 | 3 | ||||
Global Equity Fund | 25.1 | 2 | ||||
International Equity Fund | 54.5 | 3 | ||||
International Small Cap Fund | 32.0 | 2 | ||||
Japanese Equities Fund | 95.6 | 2 | ||||
U.S. Mid Cap Equity Fund | 92.2 | 1 | ||||
U.S. Multi-Cap Equity Fund | 13.2 | 1 | ||||
U.S. Small Cap Equity Fund | 56.9 | 4 | ||||
| 2017 Annual Report | 131 |
Notes to Financial Statements (continued)
October 31, 2017
9. Line of Credit
The Trust, on behalf of each of the Funds of the Trust (the “Borrowers”), has entered into an agreement (the “Agreement”) with State Street Bank and Trust Company (the “Bank”), subject to annual renewal. The Agreement provides for a revolving credit facility (the “Credit Facility”) for the amount of $250,000,000 to be utilized for temporary or emergency purposes to fund shareholder redemptions or other short-term liquidity purposes.
Principal on each outstanding loan made under the Agreement bears interest at a variable rate per annum equal to the higher of (a) the Federal Funds Rate as in effect on that day (not less than zero) plus 1.25% or (b) the One-Month London Interbank Offered Rate as in effect on that day (not less than zero) plus 1.25%. In addition, effective August 11, 2017, the Borrowers shall pay to the Bank a commitment fee at the rate of 0.25% per annum on the daily unused portion of the Credit Facility, as applicable, which is allocated among the Borrowers in such manner as is determined by the Board to be reasonable. During the period November 1, 2016 to August 10, 2017, the commitment fee rate was 0.22% per annum. For each Fund that borrowed under the Credit Facility during the fiscal year, the following table shows the average outstanding daily balance of the days the Fund utilized the Credit Facility and the average weighted interest rate paid by the Fund during the fiscal year ended October 31, 2017.
| Average Outstanding Daily Balance | Average Weighted Interest Rate | Days Utilized | ||||||||||
Asia-Pacific (ex-Japan) Equity Fund | $ | 504,657 | 2.14 | % | 26 | |||||||
China Opportunities Fund | 448,390 | 2.04 | % | 14 | ||||||||
Focused U.S. Equity Fund | 1,093,429 | 2.05 | % | 61 | ||||||||
Global Equity Fund | 1,991,270 | 2.25 | % | 9 | ||||||||
International Small Cap Fund | 992,376 | 2.17 | % | 13 | ||||||||
U.S. Multi-Cap Equity Fund | 950,000 | 2.02 | % | 8 | ||||||||
10. Fund Reorganization
Effective November 21, 2016, the Global Equity Fund acquired all of the assets and assumed all of the liabilities of the Global Natural Resources Fund. The acquisition was accomplished by a tax-free exchange as follows:
1,128,647 shares of the Global Natural Resources Fund, fair valued at $13,539,464 for 1,142,540 shares of the Global Equity Fund.
The investment portfolio and cash of the Global Natural Resources Fund with a fair value of $13,539,464 were the principal assets acquired by the Global Equity Fund. For financial reporting purposes, assets received and shares issued by the Global Equity Fund were recorded at value; however, the cost basis of the investments received from the Global Natural Resources Fund was carried forward to align ongoing reporting of the Global Equity Fund’s realized and unrealized gains and losses with amounts distributable to shareholders for tax purposes. The Global Equity Fund acquired capital loss carryovers of $33,599,102 (subject to future annual limitations). Immediately prior to the reorganization, the net assets of the Global Natural Resources Fund were $13,539,464.
Assuming that the Global Equity Fund reorganization had been completed on November 1, 2016, the pro forma results of operations for the fiscal year ended October 31, 2017 are as follows:
Net investment income | $ | 734,544 | ||
Net realized and unrealized gain from investments | 16,189,207 | |||
Net increase in net assets resulting from operations | 16,923,751 |
Because the combined investment portfolios have been managed as a single integrated portfolio since the reorganization was completed, it is not practical to separate the amounts of revenue and earnings of the Global Natural Resources Fund that have been reflected in the Statements of Operations since November 21, 2016 for the Global Equity Fund.
| 132 | Annual Report 2017 |
Notes to Financial Statements (concluded)
October 31, 2017
The chart below shows a summary of net assets, shares outstanding, NAV per share, net unrealized appreciation/(depreciation), and accumulated net realized gains/(losses), before and after the reorganization.
| Before Reorganization | After Reorganization | |||||||||||
| Global Natural Resources Fund | Global Equity Fund | Global Equity Fund | ||||||||||
| Net Assets: | ||||||||||||
Class A/Class A | $ | 8,732,862 | $ | 46,748,477 | $ | 55,481,339 | ||||||
Class C/Class C | 1,432,891 | 1,403,669 | 2,836,560 | |||||||||
Class R/Class R | 2,166,589 | 1,207,119 | 3,373,708 | |||||||||
Institutional Service Class/ Institutional Service Class | 624,420 | 1,072 | 625,492 | |||||||||
Institutional Class/ Institutional Class | 582,702 | 34,989,408 | 35,572,110 | |||||||||
| Shares Outstanding: | ||||||||||||
Class A/Class A | 723,033 | 3,898,835 | 4,627,156 | |||||||||
Class C/Class C | 124,828 | 124,095 | 250,774 | |||||||||
Class R/Class R | 182,410 | 104,667 | 292,529 | |||||||||
Institutional Service Class/ Institutional Service Class | 51,044 | 88 | 51,371 | |||||||||
Institutional Class/ Institutional Class | 47,332 | 2,906,011 | 2,954,406 | |||||||||
| Net Asset Value per Share: | ||||||||||||
Class A/Class A | $ | 12.08 | $ | 11.99 | $ | 11.99 | ||||||
Class C/Class C | 11.48 | 11.31 | 11.31 | |||||||||
Class R/Class R | 11.88 | 11.53 | 11.53 | |||||||||
Institutional Service Class/ Institutional Service Class | 12.23 | 12.18 | 12.18 | |||||||||
Institutional Class/ Institutional Class | 12.31 | 12.04 | 12.04 | |||||||||
Net unrealized appreciation/(depreciation) | 300,710 | (3,024,250 | ) | (2,723,540 | ) | |||||||
Accumulated net realized gain/(loss) | (232,050 | ) | 391,054 | 159,004 | ||||||||
11. Subsequent Events
Management has evaluated the need for disclosures and/or adjustments resulting from subsequent events through the date the financial statements were issued. Based on this evaluation, no disclosures and/or adjustments were required to the financial statements as of October 31, 2017, except as disclosed below.
Effective November 15, 2017, the Aberdeen Equity Long-Short Fund changed its name to the Aberdeen Focused U.S. Equity Fund in connection with changes to the Fund’s principal investment strategies. The contractual advisory fee schedule and expense limitation arrangements for the Fund also changed effective November 15, 2017 in connection with the strategy changes. The Fund’s revised strategies and fee schedule is described in the prospectus for the Fund dated November 15, 2017.
At the December 13, 2017 Board meeting, in regards to the International Small Cap Fund, the Board approved (1) a change of the management fee from 1.25% on the first $100 million and 1.00% on assets of $100 million or more to 1.00% on the first $100 million of assets and 0.90% of assets of $100 million and more; and (2) a change of the expense limitation from 1.30% to 1.15%, which will all be effective February 28, 2018.
| 2017 Annual Report | 133 |
Report of Independent Registered Public Accounting Firm
The Board of Trustees and Shareholders of Aberdeen Funds:
We have audited the accompanying statements of assets and liabilities, including the statements of investments, of the Aberdeen Asia Pacific (ex-Japan) Equity Fund, Aberdeen China Opportunities Fund, Aberdeen Emerging Markets Fund, Aberdeen Focused U.S. Equity Fund (formerly, Aberdeen Equity Long-Short Fund), Aberdeen Global Equity Fund, Aberdeen International Equity Fund, Aberdeen International Small Cap Fund, Aberdeen Japanese Equities Fund, Aberdeen U.S. Mid Cap Equity Fund, Aberdeen U.S. Multi Cap Equity Fund, and Aberdeen U.S. Small Cap Equity Fund, eleven of the funds comprising Aberdeen Funds (the “Funds”), as of October 31, 2017, and the related statements of operations for the year then ended, the statements of changes in net assets for each of the years, or periods, in the two-year period then ended and the financial highlights for each of the years in the five-year period then ended. These financial statements and financial highlights are the responsibility of the Funds’ management. Our responsibility is to express an opinion on these financial statements and financial highlights based on our audits.
We conducted our audits in accordance with the standards of the Public Company Accounting Oversight Board (United States). Those standards require that we plan and perform the audit to obtain reasonable assurance about whether the financial statements and financial highlights are free of material misstatement. An audit includes examining, on a test basis, evidence supporting the amounts and disclosures in the financial statements. Our procedures included confirmation of securities owned as of October 31, 2017, by correspondence with the custodian and brokers or by other appropriate auditing procedures. An audit also includes assessing the accounting principles used and significant estimates made by management, as well as evaluating the overall financial statement presentation. We believe that our audits provide a reasonable basis for our opinion.
In our opinion, the financial statements and financial highlights referred to above present fairly, in all material respects, the financial position of the Funds as of October 31, 2017, the results of their operations for the year then ended, the changes in their net assets for each of the years in the two-year period then ended and the financial highlights for each of the years, or periods, in the five-year period then ended, in conformity with U.S. generally accepted accounting principles.

Philadelphia, Pennsylvania
December 28, 2017
| 134 | Annual Report 2017 |
Other Tax Information (Unaudited)
For the period ended October 31, 2017, certain dividends paid by the Funds may be subject to a maximum tax rate of 15% as provided for by the Jobs and Growth Tax Relief Reconciliation Act of 2003. The Funds intend to designate the maximum amount allowable as taxed at a maximum rate of 15%. Complete information will be reported in conjunction with your 2017 Form 1099-DIV.
For the year ended October 31, 2017, the following Funds paid qualified dividend income:
| Fund | Qualified Dividend Income | |||
Asia-Pacific (ex-Japan) Equity Fund | 99.00 | % | ||
China Opportunities Fund | 97.73 | % | ||
Emerging Markets Fund | 100.00 | % | ||
Global Equity Fund | 100.00 | % | ||
International Equity Fund | 100.00 | % | ||
International Small Cap Fund | 100.00 | % | ||
Japanese Equities Fund | 100.00 | % | ||
U.S. Mid Cap Equity Fund | 36.31 | % | ||
U.S. Multi-Cap Equity Fund | 100.00 | % | ||
For the taxable year ended October 31, 2017, the following percentage of income dividends paid by the Funds qualify for the dividends received deduction available to corporate shareholders:
| Fund | Dividends Deduction | |||
Emerging Markets Fund | 1.96 | % | ||
Global Equity Fund | 48.81 | % | ||
International Small Cap Fund | 6.25 | % | ||
U.S. Mid Cap Equity Fund | 33.99 | % | ||
U.S. Multi-Cap Equity Fund | 100.00 | % | ||
The Funds intend to elect to pass through to their shareholders the credit for taxes paid in foreign countries during its fiscal year ended October 31, 2017. In accordance with the current tax laws, the foreign income and foreign tax per share (for a share outstanding as of October 31, 2017) was as follows:
| Fund | Foreign Tax | |||
Asia-Pacific (ex-Japan) Equity Fund | $ | 0.0229 | ||
China Opportunities Fund | $ | 0.0183 | ||
Emerging Markets Fund | $ | 0.0407 | ||
Global Equity Fund | $ | 0.0519 | ||
International Equity Fund | $ | 0.0286 | ||
International Small Cap Fund | $ | 0.0357 | ||
Japanese Equities Fund | $ | 0.0260 | ||
| 2017 Annual Report | 135 |
Other Tax Information (Unaudited) (concluded)
During the year ended October 31, 2017, the following Funds designated dividends as long-term capital gains:
| Fund | Amount | |||
Focused U.S. Equity Fund | $ | 10,813,133 | ||
Global Equity Fund | $ | 2,839,908 | ||
International Small Cap Fund | $ | 211,791 | ||
U.S. Multi-Cap Equity Fund | $ | 39,016,766 | ||
| 136 | Annual Report 2017 |
Shareholder Expense Examples (Unaudited)
As a shareholder of the Aberdeen Funds, you incur two types of costs: (1) transaction costs, including sales charges (loads) paid on purchase payments and (2) ongoing costs, including investment advisory fees, administration fees, transfer agent out-of-pocket expenses, distribution fees and other Fund expenses. The examples below are intended to help you understand your ongoing costs (in dollars) of investing in the Aberdeen Funds and to compare these costs with the ongoing costs of investing in other mutual funds.
The examples assume that you had a $1,000 investment in the Class at the beginning of the reporting period, May 1, 2017 and continued to hold your shares at the end of the reporting period, October 31, 2017.
Actual Expenses
The table below provides information about actual account values and actual expenses. You may use the information together with the amount you invested, to estimate the expenses that you paid over the period. Simply divide your account value by $1,000 (for example, an $8,600 account value divided by $1,000 = 8.6), then multiply the result by the number under the heading entitled “Actual Expenses Paid During Period” for the class of a Fund that you own to estimate the expenses you paid on your account during the period.
Hypothetical Example for Comparison Purposes
The table below provides information about hypothetical account values and hypothetical expenses based on the Class’ actual expense ratio and an assumed rate of return of 5% per year before expenses, which is not the Class’ actual return. The hypothetical account values and expenses may not be used to estimate the actual ending account balance or expenses you paid for the period. You may use this information to compare the ongoing costs of investing in the Class of a Fund and other funds. To do so, compare the 5% hypothetical example with the 5% hypothetical examples that appear in the shareholder reports of the other funds.
Please note that the expenses shown in the table are meant to highlight your ongoing costs only and do not reflect any transaction costs, such as sales charges (loads). Therefore, the information for each Class in the table is useful in comparing ongoing costs only, and will not help you determine the relative total costs of owning different funds. In addition, if these transaction costs were included, your costs would have been higher. The examples also assume all dividends and distributions have been reinvested.
| Beginning Account Value, May 1, 2017 | Actual Ending Account Value, October 31, 2017 | Hypothetical Ending Account Value | Actual Expenses Paid During Period* | Hypothetical Expenses Paid During Period*1 | Annualized Expense Ratio** | |||||||||||||||||||||
Asia-Pacific (ex-Japan) Equity Fund | Class A | $ | 1,000.00 | $ | 1,134.50 | $ | 1,017.39 | $ | 8.34 | $ | 7.88 | 1.55% | ||||||||||||||
Class C | 1,000.00 | 1,131.20 | 1,013.91 | 12.03 | 11.37 | 2.24% | ||||||||||||||||||||
Class R | 1,000.00 | 1,133.50 | 1,016.33 | 9.46 | 8.94 | 1.76% | ||||||||||||||||||||
Institutional Service Class | 1,000.00 | 1,135.60 | 1,018.25 | 7.43 | 7.02 | 1.38% | ||||||||||||||||||||
Institutional Class | 1,000.00 | 1,136.40 | 1,018.85 | 6.78 | 6.41 | 1.26% | ||||||||||||||||||||
China Opportunities Fund | Class A | 1,000.00 | 1,113.40 | 1,015.33 | 10.44 | 9.96 | 1.96% | |||||||||||||||||||
Class C | 1,000.00 | 1,109.50 | 1,012.00 | 13.93 | 13.29 | 2.62% | ||||||||||||||||||||
Class R | 1,000.00 | 1,111.80 | 1,013.46 | 12.40 | 11.82 | 2.33% | ||||||||||||||||||||
Institutional Service Class | 1,000.00 | 1,115.40 | 1,016.69 | 9.01 | 8.59 | 1.69% | ||||||||||||||||||||
Institutional Class | 1,000.00 | 1,115.80 | 1,017.04 | 8.64 | 8.24 | 1.62% | ||||||||||||||||||||
Emerging Markets Fund | Class A | 1,000.00 | 1,096.90 | 1,017.24 | 8.35 | 8.03 | 1.58% | |||||||||||||||||||
Class C | 1,000.00 | 1,094.30 | 1,014.62 | 11.09 | 10.66 | 2.10% | ||||||||||||||||||||
Class R | 1,000.00 | 1,095.40 | 1,016.13 | 9.51 | 9.15 | 1.80% | ||||||||||||||||||||
Institutional Service Class | 1,000.00 | 1,098.90 | 1,018.55 | 6.98 | 6.72 | 1.32% | ||||||||||||||||||||
Institutional Class | 1,000.00 | 1,099.40 | 1,019.66 | 5.82 | 5.60 | 1.10% | ||||||||||||||||||||
Focused U.S. Equity Fund | Class A | 1,000.00 | 1,051.90 | 1,012.05 | 13.50 | 13.24 | 2.61% | |||||||||||||||||||
Class C | 1,000.00 | 1,047.10 | 1,008.67 | 16.92 | 16.61 | 3.28% | ||||||||||||||||||||
Class R | 1,000.00 | 1,049.30 | 1,010.03 | 15.55 | 15.25 | 3.01% | ||||||||||||||||||||
Institutional Service Class | 1,000.00 | 1,052.90 | 1,012.75 | 12.78 | 12.53 | 2.47% | ||||||||||||||||||||
Institutional Class | 1,000.00 | 1,054.20 | 1,013.76 | 11.75 | 11.52 | 2.27% | ||||||||||||||||||||
| 2017 Annual Report | 137 |
Shareholder Expense Examples (Unaudited) (concluded)
| Beginning Account Value, May 1, 2017 | Actual Ending Account Value, October 31, 2017 | Hypothetical Ending Account Value | Actual Expenses Paid During Period* | Hypothetical Expenses Paid During Period*1 | Annualized Expense Ratio** | |||||||||||||||||||||
Global Equity Fund | Class A | $ | 1,000.00 | $ | 1,086.70 | $ | 1,017.39 | $ | 8.15 | $ | 7.88 | 1.55% | ||||||||||||||
Class C | 1,000.00 | 1,083.30 | 1,014.12 | 11.55 | 11.17 | 2.20% | ||||||||||||||||||||
Class R | 1,000.00 | 1,084.20 | 1,015.43 | 10.19 | 9.86 | 1.94% | ||||||||||||||||||||
Institutional Service Class | 1,000.00 | 1,087.80 | 1,018.30 | 7.21 | 6.97 | 1.37% | ||||||||||||||||||||
Institutional Class | 1,000.00 | 1,086.50 | 1,019.11 | 6.36 | 6.16 | 1.21% | ||||||||||||||||||||
International Equity Fund | Class A | 1,000.00 | 1,088.30 | 1,018.35 | 7.16 | 6.92 | 1.36% | |||||||||||||||||||
Class C | 1,000.00 | 1,083.80 | 1,014.62 | 11.03 | 10.66 | 2.10% | ||||||||||||||||||||
Class R | 1,000.00 | 1,086.40 | 1,016.59 | 8.99 | 8.69 | 1.71% | ||||||||||||||||||||
Institutional Service Class | 1,000.00 | 1,089.30 | 1,019.86 | 5.58 | 5.40 | 1.06% | ||||||||||||||||||||
Institutional Class | 1,000.00 | 1,090.50 | 1,020.11 | 5.32 | 5.14 | 1.01% | ||||||||||||||||||||
International Small Cap Fund | Class A | 1,000.00 | 1,124.50 | 1,017.09 | 8.62 | 8.19 | 1.61% | |||||||||||||||||||
Class C | 1,000.00 | 1,120.70 | 1,013.61 | 12.29 | 11.67 | 2.30% | ||||||||||||||||||||
Class R | 1,000.00 | 1,122.30 | 1,015.12 | 10.70 | 10.16 | 2.00% | ||||||||||||||||||||
Institutional Service Class | 1,000.00 | 1,125.20 | 1,017.39 | 8.30 | 7.88 | 1.55% | ||||||||||||||||||||
Institutional Class | 1,000.00 | 1,126.10 | 1,018.65 | 6.97 | 6.61 | 1.30% | ||||||||||||||||||||
Japanese Equities Fund | Class A | 1,000.00 | 1,122.90 | 1,018.65 | 6.96 | 6.61 | 1.30% | |||||||||||||||||||
Class C | 1,000.00 | 1,120.20 | 1,015.12 | 10.69 | 10.16 | 2.00% | ||||||||||||||||||||
Class R | 1,000.00 | 1,122.10 | 1,017.64 | 8.02 | 7.63 | 1.50% | ||||||||||||||||||||
Institutional Service Class | 1,000.00 | 1,124.50 | 1,020.16 | 5.35 | 5.09 | 1.00% | ||||||||||||||||||||
Institutional Class | 1,000.00 | 1,124.50 | 1,020.16 | 5.35 | 5.09 | 1.00% | ||||||||||||||||||||
U.S. Mid Cap Equity Fund | Class A | 1,000.00 | 1,088.90 | 1,018.90 | 6.58 | 6.36 | 1.25% | |||||||||||||||||||
Class C | 1,000.00 | 1,084.60 | 1,015.12 | 10.51 | 10.16 | 2.00% | ||||||||||||||||||||
Class R | 1,000.00 | 1,087.40 | 1,017.64 | 7.89 | 7.63 | 1.50% | ||||||||||||||||||||
Institutional Service Class | 1,000.00 | 1,090.50 | 1,020.16 | 5.27 | 5.09 | 1.00% | ||||||||||||||||||||
Institutional Class | 1,000.00 | 1,090.50 | 1,020.16 | 5.27 | 5.09 | 1.00% | ||||||||||||||||||||
U.S. Multi-Cap Equity Fund | Class A | 1,000.00 | 1,073.20 | 1,019.21 | 6.22 | 6.06 | 1.19% | |||||||||||||||||||
Class C | 1,000.00 | 1,068.60 | 1,015.58 | 9.96 | 9.70 | 1.91% | ||||||||||||||||||||
Class R | 1,000.00 | 1,070.60 | 1,017.04 | 8.45 | 8.24 | 1.62% | ||||||||||||||||||||
Institutional Service Class | 1,000.00 | 1,074.00 | 1,020.32 | 5.07 | 4.94 | 0.97% | ||||||||||||||||||||
Institutional Class | 1,000.00 | 1,073.80 | 1,020.67 | 4.70 | 4.58 | 0.90% | ||||||||||||||||||||
U.S. Small Cap Equity Fund | Class A | 1,000.00 | 1,089.30 | 1,017.90 | 7.64 | 7.38 | 1.45% | |||||||||||||||||||
Class C | 1,000.00 | 1,085.60 | 1,014.47 | 11.20 | 10.82 | 2.13% | ||||||||||||||||||||
Class R | 1,000.00 | 1,087.80 | 1,016.33 | 9.26 | 8.94 | 1.76% | ||||||||||||||||||||
Institutional Service Class | 1,000.00 | 1,090.70 | 1,019.26 | 6.22 | 6.01 | 1.18% | ||||||||||||||||||||
Institutional Class | 1,000.00 | 1,091.10 | 1,019.51 | 5.96 | 5.75 | 1.13% | ||||||||||||||||||||
| * | Expenses are equal to the Fund’s annualized expense ratio multiplied by the average account value over the period multiplied by 184/365 (to reflect the one-half year period). |
| ** | The expense ratio presented represents a six-month, annualized ratio. |
| 1 | Represents the hypothetical 5% return before expenses. |
| 138 | Annual Report 2017 |
Supplemental Information (Unaudited)
Board of Trustees’ Consideration of Advisory and Sub-Advisory Agreements
At an in-person meeting of the Board of Trustees (the “Board” or the “Trustees”) of the Aberdeen Funds (the “Trust”) held on June 14, 2017, the Board, including a majority of the Trustees who are not considered to be “interested persons” of the Trust (the “Independent Trustees”) under the Investment Company Act of 1940, as amended (the “1940 Act”), approved for an annual period the continuation of the Trust’s advisory agreement (the “Advisory Agreement”) with Aberdeen Asset Management Inc. (“AAMI”) and the applicable sub-advisory agreements (each a “Sub-Advisory Agreement,” and collectively with the Advisory Agreement, the “Agreements”) between: (i) AAMI and Aberdeen Asset Management Asia Limited (“AAMAL”) and (ii) AAMI and Aberdeen Asset Managers Limited (“AAML”) (each a “Sub-Adviser,” and collectively, the “Sub-Advisers”) for each of the following series of the Trust: Aberdeen Asia-Pacific (ex-Japan) Equity Fund, Aberdeen China Opportunities Fund, Aberdeen Emerging Markets Fund, Aberdeen Equity Long-Short Fund, Aberdeen Global Equity Fund, Aberdeen International Equity Fund, Aberdeen International Small Cap Fund, Aberdeen Japanese Equities Fund, Aberdeen Tax-Free Income Fund, Aberdeen U.S. Mid Cap Equity Fund, Aberdeen U.S. Multi-Cap Equity Fund, and Aberdeen U.S. Small Cap Equity Fund (each a “Fund,” and collectively the “Funds”). AAMAL and AAML are affiliates of AAMI. AAMI and the Sub-Advisers are sometimes referred to collectively as the “Advisers.”
In connection with contract review meetings, the Board reviews a variety of information provided by the Advisers relating to the Funds, the Agreements and the Advisers, including comparative performance, fee and expense information and other information regarding the nature, extent and quality of services provided by the Advisers under their respective Agreements. The materials provided to the Board generally included, among other items: (i) information on the investment performance of the Funds and the performance of peer groups of funds and the Funds’ performance benchmarks; (ii) information on the Funds’ advisory fees and other expenses, including information comparing each Fund’s expenses to those of a peer group of funds and information about any applicable expense limitations and fee “breakpoints”; (iii) sales and redemption data with respect to each Fund; (iv) information about the profitability of the Agreements to the Advisers; (v) a report prepared by the Advisers in response to a request submitted by the Independent Trustees’ independent legal counsel on behalf of such Trustees; and (vi) a memorandum from the Independent Trustees’ independent legal counsel on the responsibilities of the Board in considering for approval the investment advisory and investment sub-advisory arrangements under the 1940 Act and Delaware law. The Board, including the Independent Trustees, also considers other matters such as: (i) the Advisers’ financial results and financial condition; (ii) each Fund’s investment objective and strategies; (iii) the Advisers’ investment personnel and operations; (iv) arrangements relating to the distribution of the Funds’ shares and the related costs; (v) the procedures employed to determine the value of the Funds’ assets; (vi) the allocation of the Funds’ brokerage, if any, including, if applicable, allocations to brokers affiliated with the Advisers and the use, if any, of “soft” commission dollars to pay Fund expenses and to pay for research and other similar services; (vii) the resources devoted to, and the record of compliance with, the Funds’ investment policies and restrictions, policies on personal securities transactions and other compliance policies; and (viii) possible conflicts of interest. The Board also considered the nature, extent and quality of the services provided to the Funds by AAMI’s affiliates. Throughout the process, the Trustees are afforded the opportunity to ask questions of and request additional materials from AAMI and the Sub-Advisers.
In addition to the materials requested by the Trustees in connection with their annual consideration of the continuation of the Agreements, the Trustees receive materials in advance of each regular quarterly meeting of the Board that provide information relating to the services provided by the Advisers, including detailed information about the Funds’ investment performance. This information generally includes, among other things, third-party performance rankings for various periods (including prior to the Advisers’ management of the Funds, to the extent applicable) comparing each Fund against its peer group, total return information for various periods, and details of sales and redemptions of Fund shares for the period. The Board also receives periodic presentations from the portfolio management teams in connection with the performance of the Funds.
The Independent Trustees were advised by separate independent legal counsel throughout the process. The Independent Trustees also consulted in executive sessions with counsel to the Independent Trustees regarding consideration of the renewal of the Agreements. In considering whether to approve the continuation of the Agreements, the Board of Trustees, including the Independent Trustees, did not identify any single factor as determinative. Individual Trustees may have evaluated the information presented differently from one another, giving different weights to various factors. Matters considered by the Trustees, including the Independent Trustees, in connection with their approval of the continuation of the Agreements included the factors listed below.
The nature, extent and quality of the services provided to the Funds under the Agreements. The Trustees considered the nature, extent and quality of the services provided by AAMI and the Sub-Advisers, as applicable, to the Funds and the resources dedicated to the Funds by AAMI and its affiliates. The Board considered, among other things, the Advisers’ investment experience. The Board also considered the background and experience of the Advisers’ senior management personnel and the qualifications, background and responsibilities of the portfolio managers that are primarily responsible for the day-to-day portfolio management services for the Funds. The Board also considered the allocation of responsibilities among the Advisers. The Trustees considered not only the advisory services provided by AAMI to the Funds, but also the administrative services provided by AAMI to the Funds under a separate administration agreement. AAMI’s role in coordinating the activities of the Trust’s other service providers was also considered. The Board also considered that it receives information on a regular basis from the Trust’s
| 2017 Annual Report | 139 |
Supplemental Information (Unaudited) (continued)
Chief Compliance Officer regarding the Advisers’ compliance policies and procedures. The Board also considered the Advisers’ risk management processes. The Board was also mindful of the Advisers’ focus on the monitoring of the performance of the Funds and in addressing performance matters. The Trustees also considered the benefits to shareholders of investing in a mutual fund that is part of a family of funds that offers shareholders the right to exchange shares of one type of fund for shares of another type of fund, and provides a variety of fund and shareholder services. The Board also took into account its knowledge of management and the quality of the performance of management’s duties through Board meetings, discussion and reports during the preceding year.
After reviewing these and related factors, the Board concluded that they were satisfied with the nature, extent and quality of the services provided and supported the renewal of the Agreements.
Investment performance of the Funds and the Advisers. The Trustees received information about the performance of the Funds over various time periods, including information which compared the performance of the Funds to the performance of peer groups of funds and each Fund’s performance benchmark. The Trustees also considered that certain of the Funds had changed their respective performance benchmarks to better reflect the respective Fund’s investment strategy. The Trustees also considered the performance of the Funds compared to the performance of comparable funds or accounts managed by AAMI and its affiliates to the extent available. In addition, the Trustees also reviewed data prepared by an independent third party which analyzed the performance of the Funds using a variety of performance metrics.
The Trustees also considered AAMI’s and the Sub-Advisers’ performance and reputation generally, the performance of the fund family generally, the historical responsiveness of AAMI to Trustee concerns about performance and the willingness of AAMI and the Sub-Advisers to take steps intended to improve performance. The Trustees also considered the performance of the Advisers since they commenced management of the Funds.
Based on these factors, the Board determined that the Advisers are appropriate investment advisers for the Funds.
The Board further noted that it will continue to monitor the Funds’ performance and any actions taken by AAMI and its affiliates relating to performance.
The costs of the services provided and profits realized by the Advisers and their affiliates from their relationships with the Funds. The Trustees considered the fees charged to the Funds for advisory services as well as the total expense levels of the Funds. This information included comparisons (provided both by management and also by an independent third party) of each Fund’s net management fee and total expense level to those of its expense peer group and information about the advisory fees charged by AAMI to any separately managed accounts with a similar strategy. In comparing each Fund’s net management fee to that of comparable funds, the Board noted that such fee includes both advisory and administrative fees. In considering the fees charged to any comparable accounts, the Trustees considered, among other things, management’s discussion of the different objectives, policies or restrictions that may be involved in managing the different types of accounts. In evaluating the Funds’ advisory fees, the Trustees also took into account the demands, complexity and quality of the investment management of the Funds.
The Trustees also noted that the sub-advisory fees, as applicable, for the Funds would be paid by AAMI out of its advisory fee, not by the Funds. The Board also considered that AAMI had entered into expense limitation agreements with the Funds, pursuant to which AAMI agreed to waive a portion of its advisory fee and/or reimburse certain expenses as a means of limiting each Fund’s total annual operating expenses for a period of time.
The Trustees also considered the compensation directly or indirectly received by AAMI and its affiliates from their relationships with the Funds. The Trustees reviewed information provided by management as to the profitability of AAMI and its affiliates’ relationships with the Funds, such as the engagement of affiliates of AAMI to provide distribution and administrative services to the Funds. The Trustees also examined the profitability of AAMI and its affiliates on a Fund-by-Fund basis. The Trustees also considered information about the allocation of expenses used to calculate profitability. When reviewing profitability, the Trustees also considered information about court cases regarding adviser profitability, the performance of the Funds, the expense levels of the Funds, and whether AAMI had implemented breakpoints and expense limitations with respect to the Funds.
After reviewing these and related factors, including taking into account management’s discussion regarding Fund expenses, the Board concluded that the advisory fee, and as applicable, the sub-advisory fees, were fair and reasonable, and that the costs of these services generally and the related profitability of AAMI and its affiliates from their relationships with the Funds were reasonable and supported the renewal of the Agreements.
Economies of Scale. The Trustees considered the existence of any economies of scale in the provision of services by AAMI and the Sub-Advisers and whether those economies would be shared with the Funds through breakpoints in the investment advisory fees or other means, such as expense waivers or limitations. The Trustees noted that each of the Funds was subject to an expense limitation and considered that certain Funds
| 140 | Annual Report 2017 |
Supplemental Information (Unaudited) (concluded)
were subject to breakpoints. The Board noted management’s discussion of the Funds’ advisory fee structure. The Trustees also took note of the costs of the services provided and the profitability to AAMI and its affiliates from their relationships with the Funds, as discussed above. The Board also considered the potential effect of each Fund’s growth and size on fees, noting that if a Fund’s assets increase over time, the Fund may realize other economies of scale if assets increase proportionally more than certain expenses.
After reviewing these and related factors, the Board concluded that the advisory fee, and as applicable, sub-advisory fees were reasonable and supported the renewal of the Agreements.
The Trustees also considered other factors, which included but were not limited to the following:
| • | the effect of any market and economic volatility on the performance, asset levels and expense ratios of the Funds. |
| • | whether the Funds have operated in accordance with their investment objectives and the Funds’ record of compliance with their investment restrictions, and the compliance programs of the Trust and AAMI. The Trustees also considered the compliance-related resources AAMI and its affiliates were providing to the Funds. |
| • | the nature, quality, cost and extent of administrative services performed by AAMI under the Advisory Agreement and under a separate agreement covering administrative services. |
| • | so-called “fallout benefits” to AAMI, such as the benefits of research made available to AAMI by reason of brokerage commissions generated by the Funds’ securities transactions or reputational and other indirect benefits. The Trustees considered any possible conflicts of interest associated with these fallout and other benefits, and the reporting, disclosure and other processes in place to disclose and monitor such possible conflicts of interest. |
* * *
Based on their evaluation of all factors that they deemed to be material, including those factors described above, and assisted by the advice of independent counsel, the Trustees, including the Independent Trustees, concluded that renewal of the Agreements would be in the best interest of each of the Funds and its shareholders. Accordingly, the Board, and the Independent Trustees voting separately, approved the Agreements for an additional one-year period.
| 2017 Annual Report | 141 |
Management of the Funds (Unaudited)
As of October 31, 2017
Board of Trustees and Officers of the Trust
Name, Address, and Year of Birth | Position(s) Held, Length of Time Served and Term of Office* | Principal Occupation During Past 5 Years | Number of Portfolios in Fund Complex Overseen by Trustee** | Other 5 Years*** | ||||
Trustees who are not Interested Persons (as defined in the 1940 Act) of the Trust (“Independent Trustees”) | ||||||||
P. Gerald Malone**** Year of Birth: 1950 | Trustee since December 2007 Chairman of the Board | Mr. Malone is, by profession, a solicitor of some 40 years standing. He has served as a Minister of State in the United Kingdom Government. Mr. Malone currently serves as Independent Chairman of two UK companies, Crescent OTC Ltd (pharmaceutical services) and fluidOil Ltd. (oil services). He also serves as a director of Aberdeen Asia-Pacific Income Investment Company Limited (Canadian investment fund) since 2001. He is Chairman of the Board of Trustees of Aberdeen Funds and Chairman of the Board of Directors of Aberdeen Global Income Fund, Inc. and Aberdeen Asia-Pacific Income Fund, Inc. He previously served as chairman of Ultrasis plc (healthcare software services company) until October 2014 and director of US company Rejuvenan llc (wellbeing services) until September 2017. | 22 | None. | ||||
Richard H. McCoy**** Year of Birth: 1942 | Trustee since December 2007 | Prior to retiring in 2003, Mr. McCoy was Vice-Chairman, Investment Banking, at TD Securities Inc. He is currently a Director of Uranium Participation Corp. and Pizza Pizza Royalty Corp. and Chair of Chorus Aviation Inc. Mr. McCoy has also been Chairman of Aberdeen Asia-Pacific Income Investment Company Limited since 2010. | 18 | None. | ||||
Neville J. Miles**** Year of Birth: 1946 | Trustee since December 2011 | Mr. Miles is, and has been for over ten years, Chairman of Ballyshaw Pty. Ltd. (share trading, real estate development and investment). He is Chairman of the Board of Directors of Aberdeen Australia Equity Fund, Inc. He also is a non-executive director of a number of Australian and overseas companies. | 21 | None. | ||||
Rahn K. Porter**** Year of Birth: 1954 | Trustee since September 2016 | Mr. Porter has been the Chief Financial Officer of The Colorado Health Foundation since 2013. Previously, he was the Interim Chief Executive Officer of the Colorado Health Foundation from 2014 to 2015 and was Senior Vice President and Treasurer, Qwest Communications International Inc. (telecommunications) from 2008 to 2011. | 20 | Director, CenturyLink Investment Management Company, since 2006; Director, BlackRidge Financial Inc., since March, 2005. | ||||
| 142 | Annual Report 2017 |
Management of the Funds (Unaudited) (continued)
As of October 31, 2017
Name, Address, and Year of Birth | Position(s) Held, Length of Time Served and Term of Office* | Principal Occupation During Past 5 Years | Number of Portfolios in Fund Complex Overseen by Trustee** | Other 5 Years*** | ||||
Steven N. Rappaport**** Year of Birth: 1948 | Trustee since September 2016 | Mr. Rappaport has been a Partner of Lehigh Court, LLC (private investment firm) and RZ Capital LLC (private investment firm) since 2004. | 23 | Director of iCAD, Inc., since 2006; Director of Credit Suisse Funds (9) since 1999; Director of Credit Suisse Asset Management Income Fund, Inc. since 2005 and Director of Credit Suisse High Yield Bond Fund, Inc. since 2005. | ||||
Peter D. Sacks**** Year of Birth: 1945 | Trustee since December 2007 | Mr. Sacks was a Director and Founding Partner of Toron AMI International Asset Management (investment management) from 1988 to 2015. He is currently a Director of Aberdeen Asia-Pacific Income Fund Inc., Aberdeen Global Income Fund Inc., Aberdeen Australia Equity Fund Inc. and Tricon Capital Group Inc. | 21 | None. | ||||
John T. Sheehy**** Year of Birth: 1942 | Trustee since December 2007 | Mr. Sheehy has been a Senior Managing Director of B.V. Murray and Company (investment banking) since 2001 and Director of Macquarie AIR-serv Holding, Inc. (automotive services) from 2006 to 2013. He was a Managing Member of Pristina Capital Partners, LLC (water purification technology development) from 2007 to 2011 and a Director of Smarte Carte, Inc. (airport services) from 2007 to 2010. He has been a Director of Aberdeen Asia-Pacific Income Investment Company Limited (Canadian investment fund) since 1986. | 21 | None. | ||||
Warren C. Smith**** Year of Birth: 1955 | Trustee since December 2007 | Mr. Smith has been a founding partner of MRB Partners Inc. (independent investment research and consultancy firm) since 2010. He has been a Director of Aberdeen Asia-Pacific Income Investment Company Limited (Canadian investment fund) since 1993. Mr. Smith was a Managing Editor with The Bank Credit Analyst Research Group (independent publishers of financial market research and publications, including The Bank Credit Analyst) from 1982 to 2009. | 18 | None. |
| 2017 Annual Report | 143 |
Management of the Funds (Unaudited) (continued)
As of October 31, 2017
Name, Address, and Year of Birth | Position(s) Held, Length of Time Served and Term of Office* | Principal Occupation During Past 5 Years | Number of Portfolios in Fund Complex Overseen by Trustee** | Other 5 Years*** | ||||
Trustees who are Interested Persons (as defined in the 1940 Act) of the Trust (“Interested Trustees”) | ||||||||
Martin Gilbert****† Year of Birth: 1955 | Trustee since December 2007 | Mr. Gilbert is a founding director and shareholder, and Chief Executive of Aberdeen Asset Management PLC, the holding company of the fund management group that was established in 1983 (“Aberdeen Group”). He was a Director (1991–2014) of Aberdeen Asset Management Asia Limited and a Director (2000–2014) of Aberdeen Asset Management Limited. He was a Director (1995–2014) and was President (September 2006–2014) of Aberdeen Asset Management Inc. Mr. Gilbert also serves as officer and/or director of various Aberdeen Group subsidiary companies, Aberdeen-managed investment trusts and funds’ boards. | 22 | None. | ||||
| * | Each Trustee holds office for an indefinite term until his successor is elected and qualified. |
| ** | The Aberdeen Fund Complex consists of the Trust which currently consists of 18 portfolios, Aberdeen Asia-Pacific Income Fund, Inc., Aberdeen Global Income Fund, Inc., Aberdeen Australia Equity Fund, Inc., Aberdeen Chile Fund, Inc., Aberdeen Israel Fund, Inc., Aberdeen Indonesia Fund, Inc., Aberdeen Latin America Equity Fund, Inc., Aberdeen Emerging Markets Smaller Company Opportunities Fund, Inc., Aberdeen Singapore Fund, Inc., The Asia Tigers Fund, Inc., The India Fund, Inc., Aberdeen Greater China Fund, Inc., Aberdeen Japan Equity Fund, Inc., Aberdeen Income Credit Strategies Fund and Aberdeen Investment Funds, which currently consists of 4 portfolios. |
| *** | Directorships held in (1) any other investment companies registered under the 1940 Act, (2) any company with a class of securities registered pursuant to Section 12 of the Securities Exchange Act of 1934, as amended (the “Exchange Act”) or (3) any company subject to the requirements of Section 15(d) of the Exchange Act. |
| **** | Each Trustee may be contacted by writing to the Trustee c/o Aberdeen Asset Management Inc., 1735 Market Street, 32nd Floor, Philadelphia, Pennsylvania 19103, Attn: Alan Goodson. |
| † | Mr. Gilbert is considered to be an “interested person” of the Trust as defined in the 1940 Act because of his affiliation with the Adviser. |
| 144 | Annual Report 2017 |
Management of the Funds (Unaudited) (continued)
As of October 31, 2017
Officers of the Trust
| Name, Address, and Year of Birth | Position(s) Held, Length of Time Served and Term of Office* | Principal Occupation During Past 5 Years | ||
Bev Hendry** Aberdeen Asset Management Inc. 1735 Market Street 32nd Floor Philadelphia, PA 19103 Year of Birth: 1953 | President, Chief Executive Officer and Principal Executive Officer (Since September 2014) | Currently, CEO–Americas and Director at Aberdeen Asset Management Inc. He previously held the position of Co-Head of Americas. Mr. Hendry is also Vice President of Aberdeen Fund Distributors LLC. Mr. Hendry first joined Aberdeen at its headquarters in Scotland in 1987 where he set up Aberdeen’s mutual fund business. He moved to the United States in 1995 to establish Aberdeen’s business in the Americas based out of Fort Lauderdale. Mr. Hendry left Aberdeen in 2008 when the company moved to consolidate its headquarters in Philadelphia. Mr. Hendry re-joined Aberdeen in 2014 from Hansberger Global Investors in Fort Lauderdale, Florida, where he worked for six years as Chief Operating Officer. Bev is a Chartered Accountant and graduated with an MA in Economics from the University of Aberdeen. | ||
Jeffrey Cotton** Aberdeen Asset Management Inc. 1735 Market Street 32nd Floor Philadelphia, PA 19103 Year of Birth: 1977 | Vice President and Chief Compliance Officer (Since March 2011) | Currently, Director, Vice President, Head of International Compliance and Head of Compliance–Americas for Aberdeen Asset Management Inc. Mr. Cotton is also Vice President of Aberdeen Fund Distributors LLC. Mr. Cotton joined Aberdeen in 2010. Prior to joining Aberdeen, Mr. Cotton was a Senior Compliance Officer at Old Mutual Asset Management (2009–2010) supporting its affiliated investment advisers and mutual fund platform. Mr. Cotton was also a Vice President and Senior Compliance Manager at Bank of America/Columbia Management (2006–2009). | ||
Joseph Andolina** Aberdeen Asset Management Inc. 1735 Market Street 32nd Floor Philadelphia, PA 19103 Year of Birth: 1978 | Vice President–Compliance (Since March 2017) | Currently, Vice President, Deputy Head of Compliance–Americas & U.S. Counsel for Aberdeen Asset Management Inc. In this capacity, Mr. Andolina takes a lead role in the management and implementation of the U.S. Compliance Program and supports the group globally on SEC-related matters. Prior to joining the Compliance Department, he was a member of Aberdeen’s Legal Department, where he served as U.S. Counsel and worked primarily on matters relating to Aberdeen’s registered funds. Before joining Aberdeen in 2012, Mr. Andolina was an associate at Drinker Biddle & Reath LLP in Philadelphia where he worked in the firm’s Investment Management Group. | ||
Andrea Melia** Aberdeen Asset Management Inc. 1735 Market Street 32nd Floor Philadelphia, PA 19103 Year of Birth: 1969 | Treasurer, Chief Financial Officer, and Principal Accounting Officer (Since September 2009) | Currently, Vice President and Head of Fund Operations, Traditional Assets–Americas for Aberdeen Asset Management Inc. (since 2009). Prior to joining Aberdeen, Ms. Melia was Director of Fund Administration and accounting oversight for Princeton Administrators LLC, a division of BlackRock Inc. and had worked with Princeton Administrators since 1992. |
| 2017 Annual Report | 145 |
Management of the Funds (Unaudited) (continued)
As of October 31, 2017
| Name, Address, and Year of Birth | Position(s) Held, Length of Time Served and Term of Office* | Principal Occupation During Past 5 Years | ||
Megan Kennedy** Aberdeen Asset Management Inc. 1735 Market Street 32nd Floor Philadelphia, PA 19103 Year of Birth: 1974 | Secretary and Vice President (Since September 2009) | Currently, Head of Product Management for Aberdeen Asset Management Inc. Ms. Kennedy joined Aberdeen Asset Management Inc. in 2005 as a Senior Fund Administrator. Ms. Kennedy was promoted to Assistant Treasurer Collective Funds/North American Mutual Funds in February 2008 and promoted to Treasurer Collective Funds/North American Mutual Funds in July 2008. | ||
Lucia Sitar** Aberdeen Asset Management Inc. 1735 Market Street 32nd Floor Philadelphia, PA 19103 Year of Birth: 1971 | Vice President (Since December 2008) | Currently, Vice President and Managing U.S. Counsel for Aberdeen Asset Management Inc. Ms. Sitar joined Aberdeen Asset Management Inc. in July 2007. | ||
Brad Crombie Aberdeen Asset Management Bow Bells House 1 Bread Street London EC4M 9HH Year of Birth: 1970 | Vice President (Since June 2013) | Currently, Global Head of Fixed Income for Aberdeen Asset Management PLC. Mr. Crombie re-joined Aberdeen in 2012. Prior to re-joining Aberdeen, Mr. Crombie was a Managing Director at Bank of America Merrill Lynch for the bank’s non-financial corporate and high yield credit research team for the Europe, Middle East and Africa region from 2003 to 2012. | ||
Alan Goodson** Aberdeen Asset Management Inc. 1735 Market Street 32nd Floor Philadelphia, PA 19103 Year of Birth: 1974 | Vice President (Since March 2009) | Currently, Director, Vice President and Head of Product–U.S. for Aberdeen Asset Management Inc., overseeing Product Management and Product Development for Aberdeen’s registered and unregistered investment companies in the U.S. and Canada. Mr. Goodson is Director and Vice President of Aberdeen Asset Management Inc. and joined Aberdeen in 2000. | ||
Adam McCabe** Aberdeen Asset Management Asia Limited 21 Church Street #01-01 Capital Square Two Singapore 049480 Year of Birth: 1979 | Vice President (Since March 2010) | Currently, Head of Asian Fixed Income on the Fixed Income–Asia Pacific desk, responsible for currency and interest rate strategies in Aberdeen’s Asian fixed income portfolios. Mr. McCabe joined Aberdeen in 2009 following the acquisition of certain asset management businesses from Credit Suisse. Mr. McCabe worked for Credit Suisse since 2001, where he was an investment manager responsible for the development and implementation of its Asian currency and interest rate strategies. | ||
Jennifer Nichols** Aberdeen Asset Management Inc. 1735 Market Street 32nd Floor Philadelphia, PA 19103 Year of Birth: 1978 | Vice President (Since December 2007) | Currently, Global Head of Legal for Aberdeen Asset Management PLC. Director and Vice President for Aberdeen Asset Management Inc. (since October 2006). | ||
Hugh Young** Aberdeen Asset Management Asia Limited 21 Church Street #01-01 Capital Square Two Singapore 049480 Year of Birth: 1958 | Vice President (Since June 2011) | Currently, Managing Director of Aberdeen Asset Management Asia Limited (since 1991) and member of the Executive Management Committee and Director of Aberdeen Asset Management PLC (since 1991 and 2011, respectively). Mr. Young joined Aberdeen in 1991. |
| 146 | Annual Report 2017 |
Management of the Funds (Unaudited) (concluded)
As of October 31, 2017
| Name, Address, and Year of Birth | Position(s) Held, Length of Time Served and Term of Office* | Principal Occupation During Past 5 Years | ||
Brian O’Neill** Aberdeen Asset Management Inc. 1735 Market Street 32nd Floor Philadelphia, PA 19103 Year of Birth: 1968 | Assistant Treasurer (Since September 2008) | Currently, Senior Fund Administration Manager–U.S. for Aberdeen Asset Management Inc. Mr. O’Neill joined Aberdeen Asset Management Inc. in 2008. Prior to joining Aberdeen Asset Management Inc., Mr. O’Neill was a Director of Fund Accounting with Nationwide Funds Group (2002–2008). | ||
Eric Olsen** Aberdeen Asset Management Inc. 1735 Market Street 32nd Floor Philadelphia, PA 19103 Year of Birth: 1970 | Assistant Treasurer (Since December 2013) | Currently, Deputy Head of Fund Administration–U.S. for Aberdeen Asset Management Inc. Mr. Olsen joined Aberdeen Asset Management Inc. in August 2013. Prior to joining Aberdeen Asset Management Inc., Mr. Olsen was a Director of Financial Reporting for BNY Mellon Asset Servicing and had worked with BNY Mellon since 1998. | ||
Andrew Kim** Aberdeen Asset Management Inc. 1735 Market Street 32nd Floor Philadelphia, PA 19103 Year of Birth: 1983 | Assistant Secretary (Since March 2017) | Currently, Product Manager for Aberdeen Asset Management Inc. He joined Aberdeen in August 2013. Prior to Aberdeen, he worked at Weil, Gotshal & Manges LLP as a litigation paralegal. | ||
Stephen Varga** Aberdeen Asset Management Inc. 1735 Market Street 32nd Floor Philadelphia, PA 19103 Year of Birth: 1985 | Assistant Secretary (Since March 2017) | Currently, Product Manager for Aberdeen Asset Management Inc. Mr. Varga joined Aberdeen in 2011, where he worked for the U.S. Operations Team. He joined the Product Management team in June of 2013. Previously, he worked at SEI Investments as a Senior Fund Accountant. |
| * | Each officer holds office for an indefinite term at the pleasure of the Board of Trustees and until his or her successor is elected and qualified. |
| ** | Mr. Hendry, Ms. Melia, Ms. Kennedy, Mr. Goodson, Ms. Nichols, Mr. Cotton, Mr. McCabe, Mr. Young, Ms. Sitar, Mr. Andolina, Mr. Olsen, Mr. O’Neill, Mr. Kim and Mr. Varga hold officer position(s) in one or more of the following: Aberdeen Asia-Pacific Income Fund, Inc., Aberdeen Australia Equity Fund, Inc., Aberdeen Global Income Fund, Inc., Aberdeen Chile Fund, Inc., Aberdeen Israel Fund, Inc., Aberdeen Indonesia Fund, Inc., Aberdeen Latin America Equity Fund, Inc., Aberdeen Emerging Markets Smaller Company Opportunities Fund, Inc., Aberdeen Singapore Fund, Inc., The Asia Tigers Fund, Inc., The India Fund, Inc., Aberdeen Greater China Fund, Inc., Aberdeen Japan Equity Fund, Inc. and Aberdeen Investment Funds (consisting of 4 portfolios), each of which may also be deemed to be a part of the same “Fund Complex” as the Trust. |
| 2017 Annual Report | 147 |
Management Information
Trustees
P. Gerald Malone, Chairman
Martin J. Gilbert
Richard H. McCoy
Neville J. Miles
Rahn K. Porter
Steven N. Rappaport
Peter D. Sacks
John T. Sheehy
Warren C. Smith
Officers
Bev Hendry, President and Chief Executive Officer
Jeffrey Cotton, Chief Compliance Officer and Vice President
Joseph Andolina, Vice President - Compliance
Andrea Melia, Treasurer and Chief Financial Officer
Megan Kennedy, Secretary and Vice President
Brad Crombie, Vice President
Lucia Sitar, Vice President
Alan Goodson, Vice President
Adam McCabe, Vice President
Jennifer Nichols, Vice President
Hugh Young, Vice President
Eric Olsen, Assistant Treasurer
Brian O’Neill, Assistant Treasurer
Andrew Kim, Assistant Secretary
Stephen Varga, Assistant Secretary
Investment Manager
Aberdeen Asset Management Inc.
1735 Market Street, 32nd Floor
Philadelphia, PA 19103
Fund Administrator
Aberdeen Asset Management Inc.
1735 Market Street, 32nd Floor
Philadelphia, PA 19103
Transfer Agent
Boston Financial Data Services, Inc.
30 Dan Road
Canton, MA 02021
Distributor
Aberdeen Fund Distributors LLC
1735 Market Street, 32nd Floor
Philadelphia, PA 19103
Sub-Administrator, Custodian & Fund Accountant
State Street Bank and Trust Company
1 Heritage Drive, 3rd Floor
North Quincy, MA 02171
Independent Registered Public Accounting Firm
KPMG LLP
1601 Market Street
Philadelphia, PA 19103
Fund Counsel
Willkie Farr & Gallagher LLP
787 Seventh Avenue
New York, NY 10019
Aberdeen Asset Management Inc. 1735 Market Street, 32nd Floor Philadelphia, PA 19103 aberdeen-asset.us | |
AOE-0140-AR

Aberdeen Funds
Fixed Income Series
Annual Report
October 31, 2017
Aberdeen Asia Bond Fund
Aberdeen Emerging Markets Debt Fund
Aberdeen Global Unconstrained Fixed Income Fund
Aberdeen Tax-Free Income Fund

| Page 1 | ||||
| Page 3 | ||||
| Page 10 | ||||
| Page 18 | ||||
| Page 31 | ||||
| Page 38 | ||||
| Page 56 | ||||
| Page 75 | ||||
| Page 76 | ||||
| Page 77 | ||||
| Page 78 | ||||
| Page 81 | ||||
Investors should carefully consider a fund’s investment objectives, risks, fees, charges and expenses before investing any money. To obtain this and other fund information, please call 866-667-9231 to request a prospectus, or download a prospectus at www.aberdeen-asset.us. Please read it carefully before investing any money.
Investing in mutual funds involves risk, including possible loss of principal.
Aberdeen Funds is distributed by Aberdeen Fund Distributors, LLC, Member FINRA, 1735 Market Street, 32nd Floor, Philadelphia, PA 19103.
Aberdeen Asset Management Inc. (“AAMI”) has been registered as an investment adviser under the Investment Advisers Act of 1940 since August 23,1995.
Statement Regarding Availability of Quarterly Portfolio Schedule.
The complete schedule of portfolio holdings for each fund of Aberdeen Funds (each a “Fund” and collectively, the “Funds”) is included in the Funds’ semi-annual and annual reports to shareholders. Aberdeen Funds also files complete schedules of portfolio holdings for each Fund with the Securities and Exchange Commission (the “Commission”) for the first and third quarters of each fiscal year on Form N-Q. The Funds’ Form N-Q filings are available on the Commission’s website at http://www.sec.gov. The Funds’ Form N-Q filings may be reviewed and copied at the Commission’s Public Reference Room in Washington, DC, and information on the operation of the Public Reference Room may be obtained by calling 800-SEC-0330; and the Funds make the information on Form N-Q available to shareholders on www.aberdeen-asset.us or upon request without charge.
Statement Regarding Availability of Proxy Voting Record.
Information regarding the policies and procedures that the Funds use to determine how to vote proxies relating to portfolio securities is available without charge, upon request, by calling 1-866-667-9231. The information is also included in the Funds’ Statement of Additional Information, which is available on the Funds’ website at www.aberdeen-asset.us and on the Commission’s website at www.sec.gov.
Information relating to how each Fund voted proxies relating to portfolio securities held during the most recent twelve months ended June 30 is available by August 30 of the relevant year: (i) upon request and without charge by calling 1-866-667-9231; and (ii) on the Commission’s website at www.sec.gov.
It appeared that the 12-month period ended October 31, 2017 saw the waning of the populist movement and a move towards the center in the global political arena. Early in the period in November 2016, Republican Donald Trump unexpectedly won the U.S. presidential election, defeating his Democratic party opponent, former U.S. Senator and Secretary of State Hillary Clinton. Trump’s victory seemed to be a continuation of the populist political movement that led to the UK’s vote to leave the European Union (known as Brexit) in June 2016. However, there appeared to be a change in voters’ sentiment in the spring of 2017, as candidates campaigning on a populist platform in the Netherlands and France lost national elections to more politically moderate opponents. Incumbent Prime Minister Mark Rutte’s People’s Party for Freedom and Democracy (VVD) won significantly more seats in the Dutch Parliament than Geert Wilders’ far-right Party for Freedom (PPV) in the Netherlands’ election in March 2017. Independent centrist candidate Emmanuel Macron subsequently claimed victory in the final round of the French presidential election in early May 2017, by a nearly two-to-one margin over far-right candidate Marine Le Pen. In the U.S., President Trump encountered numerous political challenges and obstacles to the fulfillment of his campaign promises – most notably the ongoing investigation of several members of his administration into possible collusion with the Russian government during the presidential election of 2016.
On the geopolitical front, in September 2017, North Korean leader Kim Jong Un claimed that the nation conducted a successful underground detonation of a hydrogen bomb, which reached a magnitude of 6.3 on the Richter scale, according to the U.S. Geological Survey. The following week, North Korea fired another intermediate-range ballistic missile which passed over the island of Hokkaido in Japan and subsequently landed in the Pacific Ocean. The launch from Pyongyang, North Korea’s capital, occurred after the United Nations Security Council unanimously adopted new sanctions against the nation.
The Morgan Stanley Capital International (MSCI) World Index,1 a global equity market benchmark, rose 23.4% for the 12-month period ended October 31, 2017. European large-cap stocks were the strongest performers among global developed markets, with the MSCI Europe Index up 27.0%. Shares of Asian and U.S. large-cap companies, as represented by the MSCI All Country (AC) Asia Pacific Index and the U.S. broader-market Standard & Poor’s (S&P) 500 Index, recorded corresponding gains of 23.7% and 23.6% over the period. Global emerging equity markets, as measured by the MSCI Emerging Markets Index, outperformed their developed-market counterparts, advancing 26.9% for the reporting period
Major U.S. equity indices moved sharply higher over the reporting period despite several periods of uncertainty surrounding the policies of the Trump administration. Most U.S. companies reported strong results and generally upbeat outlooks during the period. Corporate earnings generally were strong enough to support stocks across the market-capitalization ranges. U.S. small-cap stocks, as measured by the Russell 2000 Index, advanced 27.9% for the reporting period, outperforming the 23.6% and 21.1% returns of their large- and mid-cap counterparts, as measured by the S&P 500 Index and the Russell Midcap Index, respectively. Roughly 75% of S&P 500 Index companies posted better-than-expected earnings per share (EPS) for the third-quarter 2017 reporting season, while two-thirds exceeded consensus revenue estimates.2
Both European and UK stocks3 posted double-digit gains over the reporting period. In the Eurozone, the economic recovery, as well as investors’ positive views on the outcomes from elections in France and the Netherlands, strengthened the equity market. However, the rally was tempered by investors’ worries over rising secessionist fervor in the Catalonia region of Spain and its potential disruption to business operations. The UK market was hampered somewhat by Prime Minister Theresa May’s failed bid to secure a larger mandate from a snap election that resulted in a hung Parliament in June 2017.
The Asia-Pacific market also saw strong performance over the reporting period despite geopolitical tensions on the Korean peninsula and uncertainty regarding the prospect of major global central banks withdrawing monetary stimulus. China led the upturn in the region, buttressed by upbeat economic growth data, along with benchmark index provider MSCI’s decision to include A-shares4 in its influential indices and a sustained rise in Chinese internet stocks. Late in the reporting period, investors appeared to shrug off S&P’s downgrade of the country’s sovereign debt rating.5 Conversely, while Japanese equities rose sharply over the reporting period, they underperformed the overall Asia-Pacific region and their global developed-market counterparts due to investors’ concerns regarding external factors such as the volatile political environment in the U.S. and U.K.
Emerging stock markets generally posted healthy gains for the reporting period. Within Latin America, Brazilian equities performed well despite a notable decline in May 2017, after President Michel Temer became implicated in a corruption scandal. Mexican stocks and the peso initially recovered from a post-U.S. election sell-off, but uncertainty over the fate of the North American Free Trade Agreement (NAFTA) and natural disasters capped gains towards the end of the reporting period. Economic growth in India slowed over the reporting period due to the lingering effects of the government’s demonetization,6 which it initiated in November 2016, while the Goods and Services Tax was implemented in July 2017.
Despite political risks in the U.S., Europe and the UK, global fixed-income markets garnered modestly positive returns over the reporting period amid an improving global economic backdrop. Investment-grade securities, as measured by the Bloomberg Barclays Global Aggregate Bond Index, returned 1.2% for the period. Global high-yield bonds outperformed their investment-grade counterparts by a wide margin, with the ICE Bank of America Merrill Lynch Global High Yield Constrained Index gaining 9.4% for the period. Global government bond yields moved higher after the U.S. presidential election in November 2016, but slowly reversed direction throughout most of 2017; the 10-year U.S. Treasury yield rose 54 basis points to 2.38% over the reporting period. Donald Trump’s win in the November 2016 U.S. presidential election fueled expectations of increased fiscal spending and rising inflation, which halted the global
| 2017 Annual Report | 1 |
Market Review (concluded)
bond market rally at that time. Towards the end of the reporting period, bond yields rose again as major global central banks edged closer towards ending the era of accommodative monetary policy. Both the U.S. Federal Reserve (Fed) and European Central Bank decided to start tapering their quantitative-easing programs. G107 currencies were mostly stronger against the U.S. dollar, while those in emerging markets ended with mixed performance.
Outlook
We believe that generally good economic conditions should support global equity prices. Business sentiment in the U.S. is likely to be buoyed by prospects of lower corporate taxes, in our view. Banks in the Eurozone anticipate healthier demand for loans from both businesses and households. Supporting this environment are still-low interest rates, increased capital expenditures, a favorable housing market, relatively low unemployment and rising consumer confidence. In Japan, investor sentiment improved following Prime Minister Shinzo Abe’s election victory in October 2017, which strengthened his mandate to implement reforms. However, we think that economic growth may moderate in China, as the Chinese Communist Party appears to be prioritizing stability over aggressive growth targets. For emerging markets, we think that future growth may be helped by structural reforms and a rebound in commodity prices. Crude oil prices are recovering, bolstered by growing demand, supply cuts, and stabilizing shale oil production. In addition to these developments, stock-market volatility, as measured by the CBOE Volatility Index,8 is at historical lows. In our view, equities now appear expensive in the U.S. While we do not think that valuations leave much room for upside, we also see little reason for a significant correction outside some external shock – which obviously is not out of the question given political instability both domestically and abroad. We believe that there is scope for improved earnings in Europe, while operational performance in Asia has been improving. We are cognizant that the move by major global central banks to exit quantitative easing, the unresolved Brexit issue in the UK, rising trade protectionism and geopolitical risks could dent corporate earnings growth. However, we believe that our bottom-up investment approach positions our equity portfolios well in the current global market environment. We will remain diligent in monitoring company valuations, financial performance and governance against their growth prospects in an effort to hold investments that we believe can withstand future challenges.
In early November 2017, the Bank of England raised its benchmark interest rate for the first time in a decade and indicated the beginning of a gradual increase in borrowing costs, as monetary policymakers seek to prevent a sustained rise in inflation without choking economic recovery. Meanwhile, the Fed grew more vocal about reducing its balance sheet. While we feel that global bond markets have taken this news in stride, we will not be surprised if the sell-off gathers pace. We do not think that such moves to drain liquidity from the global financial system will go unnoticed as risks to the nascent global economic recovery persist. In credit markets, valuations look expensive, so we will narrow our search to investment-grade companies that we believe have strong balance sheets, healthy cash flows and good management.
Aberdeen Standard Investments
| 1 | Indexes are unmanaged and have been provided for comparison purposes only. No fees or expenses are reflected. You cannot invest directly in an index. |
| 2 | Source: FactSet, “Earnings Insight,” November 2017. |
| 3 | The performance of UK stocks is measured by the MSCI United Kingdom Index. |
| 4 | A-shares are purchased and traded on the Shanghai and Shenzhen stock exchanges. |
| 5 | Standard & Poor’s credit ratings express the agency’s opinion about the ability and willingness of an issuer, such as a corporation or state or city government, to meet its financial obligations in full and on time. Typically, ratings are expressed as letter grades that range, for example, from “AAA” to “D” to communicate the agency’s opinion of relative level of credit risk. Ratings from “AA” to “CCC” may be modified by the addition of a plus (+) or minus (-) sign to show relative standing within the major rating categories. |
| 6 | Demonetization comprises the act of stripping specific denominations of a currency unit of their status as legal tender. The currency denominations are pulled from circulation and are replaced with new currency units. |
| 7 | The G10 nations, which consult and cooperate on economic, monetary and financial matters, include Belgium, Canada, France, Germany, Italy, Japan, the Netherlands, Sweden, Switzerland, the UK and the U.S. |
| 8 | The CBOE Volatility Index is a measure of market expectations of near-term volatility conveyed by S&P 500 stock index option prices. |
| 2 | Annual Report 2017 |
Aberdeen Asia Bond Fund (Unaudited)
The Aberdeen Asia Bond Fund (Institutional Class shares net of fees) returned 4.88% for the 12-month period ended October 31, 2017, versus the 1.45% return of its benchmark, the Markit iBoxxR Asia Government Index, during the same period. For broader comparison, the average return of the Fund’s peer category of International Income Funds (comprising 38 funds), as measured by Lipper, Inc., was 3.30% for the period.
Asia-Pacific government bonds ended with mixed performance over the 12-month period ended October 31, 2017. Global investors remained drawn towards the more attractive yields in the region compared to the low-rate environment in most developed markets. However, external events weighed on the markets. Donald Trump’s win in the November 2016 U.S. presidential election fueled expectations of increased fiscal spending and rising inflation, which halted the global bond market rally. Towards the end of the reporting period, bond yields rose again as major global central banks edged closer towards ending the era of accommodative monetary policy. Notably, both the U.S. Federal Reserve (Fed) and European Central Bank decided to start unwinding their quantitative-easing programs. Meanwhile, North Korea enflamed geopolitical tensions and market anxiety with its missile tests. Regional currencies ended with mixed performance against the U.S. dollar.
Indonesian local-currency government bonds were among the strongest regional performers over the reporting period, buoyed by monetary policy rate cuts and ongoing reforms that prompted Standard & Poor’s to restore the country’s investment-grade rating.1 Government reform momentum also lifted Sri Lankan bonds. In India, the government’s demonetization2 led to vast amounts of bank deposits being channeled into domestic bonds, while the nationwide Goods and Services Tax was finally implemented in July 2017. However, market gains were later pared by investors’ concerns that the government’s bank rescue plan could increase the fiscal deficit. Malaysian bonds were boosted by easier trading rules for government securities, although rising inflationary pressures capped total returns.
Conversely, bonds in Hong Kong and Singapore tracked U.S. Treasury yields higher. Philippine bonds weakened as expectations of an interest-rate hike persisted amid rising inflation. Korean bonds were also pressured by the hawkish central bank, coupled with domestic and external political pressures. In China, short-duration3 bonds declined as money-market rates moved sharply higher after monetary authorities tightened liquidity.
Asia-Pacific region credit markets recorded positive total returns over the reporting period mainly because of tighter spreads against relatively weaker-performing U.S. Treasuries. High-yield credits outperformed their investment-grade counterparts. Commodity-related issues outperformed the overall market on the back of a price recovery. Consumer-related credit spreads tightened as data indicated better-than-expected economic growth in China. Financial-sector credits were buoyed by hopes that profit margins would improve with rising rates, but non-performing loans remained a concern in some markets. Additionally, this segment was hurt by heavy bond supply in China. Industrial-sector credits also underperformed due mainly to Noble Group, a trading company that is suffering from potential default and debt restructuring. The Fund does not have a position in Noble Group.
The Fund’s outperformance relative to its benchmark, the Markit iBoxxR Asia Government Index, for the reporting period was attributable mainly to the strategy in Asian local-currency bonds. The key contributors were the overweight positions in Indian, Indonesian and Sri Lankan bonds. Fund performance also benefited from the overweight allocation to the Indian rupee, which strengthened against the U.S. dollar over the reporting period, as well as the underweight to the Philippine peso, which weakened. However, gains were pared by the Fund’s exposure to Malaysian bonds and the weakness of the Malaysian ringgit against the U.S. dollar.
The overall impact on performance from the Fund’s use of derivatives was generally positive, driven by the currency overlay4 into Asian currencies and the hedging of U.S. Treasury risk.
In early November 2017, the Bank of England raised interest rates for the first time in a decade and indicated the start of a gradual increase in borrowing costs, as monetary policymakers seek to prevent a sustained rise in inflation without choking economic recovery. Meanwhile, the Fed grew more vocal about unwinding its balance sheet. Bond markets currently appear to be taking the news in stride, but we will not be surprised if the sell-off gathers pace. We do not think that such moves to drain liquidity from the global financial system will go unnoticed as risks to the nascent global economic recovery persist. Specifically, global financial markets remain vulnerable to precarious political developments in the Korean Peninsula and the Middle East, the possibility of renewed volatility in commodity prices and potentially protectionist trade policies from the Trump administration in the U.S. While higher oil prices are generally positive for emerging markets, a continued rise could exert inflationary and balance-of-payments pressure for parts of Asia, in our view.
| 1 | Standard & Poor’s credit ratings express the agency’s opinion about the ability and willingness of an issuer, such as a corporation or state or city government, to meet its financial obligations in full and on time. Typically, ratings are expressed as letter grades that range, for example, from “AAA” to “D” to communicate the agency’s opinion of relative level of credit risk. Ratings from “AA” to “CCC” may be modified by the addition of a plus (+) or minus (-) sign to show relative standing within the major rating categories. |
| 2 | Demonetization comprises the act of stripping specific denominations of a currency unit of their status as legal tender. The currency denominations are pulled from circulation and are replaced with new currency units. |
| 3 | Duration is an estimate of bond price sensitivity to changes in interest rates. The higher the duration, the greater the change (i.e., higher risk) in relation to interest-rate movements. |
| 4 | A currency overlay seeks to separate the management of currency risk from the asset allocation and security selection decisions of the investor’s money managers. |
| 2017 Annual Report | 3 |
Aberdeen Asia Bond Fund (Unaudited) (concluded)
Against this backdrop, we will maintain the Fund’s overweight to high-yielding government bond markets that are relatively insulated from external risks, including India and Sri Lanka. We also retain our preference for countries with more robust balance of payments over their structurally weaker counterparts. In credit markets, valuations look expensive, so we will narrow our search to investment-grade companies that we believe have strong balance sheets, healthy cash flows and good management.
Portfolio Management:
Aberdeen Asian Fixed Income Team
PAST PERFORMANCE DOES NOT GUARANTEE FUTURE RESULTS.
The performance data quoted represents past performance and current returns may be lower or higher. Class A shares have up to a 4.25% front-end sales charge and a 0.25% 12b-1 fee. The investment return and principal value will fluctuate so that an investor’s shares, when redeemed, may be worth more or less than the original cost. To obtain performance information current to the most recent month-end, which may be higher or lower than the performance shown above, please call 866-667-9231 or go to www.aberdeen-asset.us.
Investing in mutual funds involves risk, including the possible loss of principal.
Indexes are unmanaged and have been provided for comparison purposes only. No fees or expenses are reflected. You cannot invest directly in an index.
Lipper is a leading global provider of mutual fund information and analysis to fund companies, financial intermediaries and media organizations.
Risk Considerations
Concentrating investments in the Asian region subjects the Fund to more volatility and greater risk of loss than geographically diverse mutual funds.
Fixed income securities are subject to certain risks including, but not limited to: interest rate (changes in interest rates may cause a decline in the market value of an investment), credit (changes in the financial condition of the issuer, borrower, counterparty, or underlying collateral), prepayment (debt issuers may repay or refinance their loans or obligations earlier than anticipated), and extension (principal repayments may not occur as quickly as anticipated, causing the expected maturity of a security to increase).
Foreign securities may be more volatile, harder to price and less liquid than U.S. securities. They are subject to different accounting and regulatory standards, currency exchange rates, and political and economic risks. Fluctuation in currency exchange rates may impact the Fund’s returns more greatly to the extent the Fund does not hedge currency exposure or hedging techniques are unsuccessful. The foregoing risks are enhanced in emerging market countries.
Derivatives are speculative and may hurt the Fund’s performance. They present the risk of disproportionately increased losses and/or reduced gains when the financial asset or measure to which the derivative is linked changes in unexpected ways.
Investing a significant portion of the Fund’s assets in securities of companies conducting business in a broadly related group of industries within an economic sector may make the Fund more vulnerable to unfavorable developments in that sector.
Please read the prospectus for more detailed information regarding these and other risks.
| 4 | Annual Report 2017 |
Aberdeen Asia Bond Fund (Unaudited)
| Average Annual Total Return1 (For periods ended October 31, 2017) | 1 Yr. | 5 Yr. | 10 Yr. | |||||||||||
Class A2 | w/o SC | 4.71% | 0.91% | 3.50% | ||||||||||
| w/SC3 | 0.28% | 0.04% | 3.05% | |||||||||||
Class C2 | w/o SC | 3.90% | 0.13% | 3.05% | ||||||||||
| w/SC4 | 2.90% | 0.13% | 3.05% | |||||||||||
Class R2,6 | w/o SC | 4.44% | 0.63% | 3.34% | ||||||||||
Institutional Service Class5,6 | w/o SC | 5.39% | 1.06% | 3.55% | ||||||||||
Institutional Class6 | w/o SC | 4.88% | 1.14% | 3.64% | ||||||||||
All figures showing the effect of a sales charge (SC) reflect the maximum charge possible because it has the most significant effect on performance data. The total returns shown above do not include the impact of financial statement rounding of the net asset value (NAV) per share and/or financial statement adjustments.
| 1 | Returns presented for the Fund for periods prior to July 20, 2009 reflect the performance of the predecessor fund (the “Predecessor Fund”). Returns of the Predecessor Fund have not been adjusted to reflect the expenses applicable to the respective classes. The Fund and the Predecessor Fund have substantially similar investment objectives and strategies. Please consult the Fund’s prospectus for more detail. |
| 2 | Returns before the first offering of Class A, Class C and Class R (February 27, 2012) are based on the previous performance of the Institutional Class shares. Returns of each class have not been adjusted to reflect the expenses applicable to the respective classes. Excluding the effect of any fee waivers or reimbursements, this performance of Class A, Class C and Class R is substantially similar to what the Institutional Class would have produced because all classes invest in the same portfolio of securities. Returns would only differ to the extent of the differences in expenses of the classes. |
| 3 | A 4.25% front-end sales charge was deducted. |
| 4 | A 1.00% contingent deferred sales charge (CDSC) was deducted from the one year return because it is charged when Class C shares are sold within the first year after purchase. |
| 5 | Returns before the first offering of the Institutional Service Class (January 4, 2010) are based on the previous performance of the Institutional Class shares. These returns have not been adjusted to reflect the expenses applicable to the Institutional Service Class. Excluding the effect of any fee waivers or reimbursements, this performance is substantially similar to what the Institutional Service Class would have produced because both classes invest in the same portfolio of securities. Returns would only differ to the extent of the differences in expenses of the two classes. |
| 6 | Not subject to any sales charges. |
Performance of a $1,000,000* Investment (as of October 31, 2017)
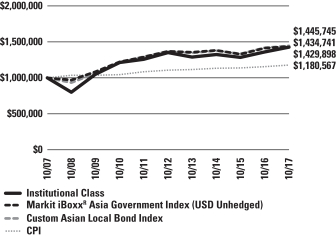
| * | Minimum Initial Investment |
Comparative performance of $1,000,000 invested in Institutional Class shares of the Aberdeen Asia Bond Fund, the Markit iBoxxR Asia Government Index, a broad-based securities Index, the Custom Asian Local Bond Index and the Consumer Price Index (CPI) since inception. Unlike the Fund, the returns for these unmanaged indexes do not reflect any fees, expenses, or sales charges. Investors cannot invest directly in market indexes.
The Markit iBoxxR Asia Government Index (USD Unhedged) is part of the Markit iBoxxR ex-Japan Index family. The Markit iBoxxR Asia ex-Japan Index family covers local currency sovereign and quasi-sovereign debt from 10 Asian markets. The 10 Asian markets are China, Hong Kong, India, Indonesia, Korea, Malaysia, Philippines, Singapore, Taiwan and Thailand. The indices serve as benchmarks for asset managers and investors and may form the basis for traded products, such as ETFs. Multiple-source pricing ensures that they are an accurate reflection of the underlying markets.
The Custom Asian Local Bond Index reflects the returns of the HSBC Asian Bond IndexTM for periods prior to April 1, 2016 and the returns of the Markit iBoxxR Asian Local Bond Index for periods subsequent to March 31, 2016.
The CPI is a measure of the average change over time in the prices paid by urban consumers for a market basket of consumer goods and services.
Investment return and principal value will fluctuate, and when redeemed, shares may be worth more or less than original cost. Past performance is no guarantee of future results. The Average Annual Total Return table and Performance graph do not reflect the deduction of taxes that a shareholder would pay on fund distributions or the redemption of fund shares. Investing in mutual funds involves market risk, including loss of principal. Performance returns assume the reinvestment of all distributions. Total returns reflect waivers and reimbursements in effect, without which returns would have been lower.
| 2017 Annual Report | 5 |
Aberdeen Asia Bond Fund (Unaudited) (concluded)
Portfolio Summary (as a percentage of net assets)
October 31, 2017 (Unaudited)
| Asset Allocation | ||||
Corporate Bonds | 60.3% | |||
Government Bonds | 24.9% | |||
Short-Term Investment | 10.5% | |||
Other Assets in Excess of Liabilities | 4.3% | |||
| 100.0% | ||||
The following chart summarizes the composition of the Fund’s portfolio, expressed as a percentage of net assets. The industries listed below may include more than one industry group. As of October 31, 2017, the Fund did not have more than 25% of its assets invested in any industry group.
| Top Industries | ||||
Commercial Banks | 23.5% | |||
Oil, Gas & Consumable Fuels | 7.6% | |||
Diversified Telecommunication Services | 6.6% | |||
Electric Utilities | 6.5% | |||
Real Estate Investment Trust (REIT) Funds | 4.4% | |||
Real Estate | 3.5% | |||
Holding Companies-Diversified Operations | 3.3% | |||
Commercial Services & Supplies | 1.9% | |||
Auto Manufacturers | 1.6% | |||
Chemicals | 1.4% | |||
Other | 39.7% | |||
| 100.0% | ||||
| Top Holdings* | ||||
ICICI Bank Ltd. 08/06/2024 | 13.1% | |||
Indonesia Treasury Bond, Series FR74 08/15/2032 | 7.9% | |||
Malaysia Government Bond, Series 0217 09/30/2024 | 5.9% | |||
Champion MTN Ltd. 01/17/2023 | 4.4% | |||
Reliance Industries Ltd. 01/28/2025 | 4.2% | |||
Indonesia Government International Bond 01/08/2047 | 3.5% | |||
State Grid Overseas Investment 2016 Ltd. 05/04/2027 | 3.5% | |||
China Overseas Finance Cayman III Ltd. 10/29/2023 | 3.5% | |||
Indonesia Treasury Bill, Series 153 11/09/2017 | 3.5% | |||
Sinopec Group Overseas Development 2013 Ltd. 10/17/2023 | 3.4% | |||
Other | 47.1% | |||
| 100.0% | ||||
| * | For the purpose of listing top holdings, Short-Term Investments are included as part of Other. |
| Top Countries | ||||
India | 20.7% | |||
Indonesia | 14.9% | |||
China | 13.6% | |||
Hong Kong | 12.6% | |||
United States | 10.5% | |||
Malaysia | 9.1% | |||
Thailand | 5.4% | |||
Sri Lanka | 4.1% | |||
Singapore | 3.2% | |||
Other | 5.9% | |||
| 100.0% | ||||
| 6 | Annual Report 2017 |
Statement of Investments
October 31, 2017
Aberdeen Asia Bond Fund
| Shares or Principal Amount | Value (US$) | |||||||
CORPORATE BONDS (60.3%) |
| |||||||
CHINA (13.6%) | ||||||||
Diversified Telecommunication Services (3.2%) |
| |||||||
Proven Honour Capital Ltd. (USD), 4.13%, 05/19/2025 (a) | $ | 200,000 | $ | 208,185 | ||||
Electric Utilities (3.5%) |
| |||||||
State Grid Overseas Investment 2016 Ltd. (USD), 3.50%, 05/04/2027 (a) | 219,000 | 223,523 | ||||||
Oil, Gas & Consumable Fuels (3.4%) |
| |||||||
Sinopec Group Overseas Development 2013 Ltd. (USD), 4.38%, 10/17/2023 (a) | 200,000 | 215,971 | ||||||
Real Estate (3.5%) |
| |||||||
China Overseas Finance Cayman III Ltd. (USD), 5.38%, 10/29/2023 (a) | 200,000 | 222,850 | ||||||
| 870,529 | ||||||||
HONG KONG (12.6%) | ||||||||
Commercial Services & Supplies (1.9%) | ||||||||
HPHT Finance 15 Ltd. (USD), 2.88%, 03/17/2020 (a) | 118,000 | 118,809 | ||||||
Electric Utilities (3.0%) | ||||||||
Hongkong Electric Finance Ltd. (USD), 2.88%, 05/03/2026 (a) | 200,000 | 194,176 | ||||||
Holding Companies-Diversified Operations (3.3%) |
| |||||||
Hutchison Whampoa International 11 Ltd. (USD), 4.63%, 01/13/2022 (a) | 200,000 | 212,716 | ||||||
Real Estate Investment Trust (REIT) Funds (4.4%) |
| |||||||
Champion MTN Ltd. (USD), | 278,000 | 281,387 | ||||||
| 807,088 | ||||||||
INDIA (20.7%) | ||||||||
Commercial Banks (13.1%) | ||||||||
ICICI Bank Ltd. (INR), 9.15%, 08/06/2024 | 50,000,000 | 838,190 | ||||||
Diversified Telecommunication Services (3.4%) |
| |||||||
Bharti Airtel International Netherlands BV (USD), 5.13%, 03/11/2023 (a) | 200,000 | 214,216 | ||||||
Oil, Gas & Consumable Fuels (4.2%) |
| |||||||
Reliance Industries Ltd. (USD), 4.13%, 01/28/2025 (a) | 260,000 | 270,741 | ||||||
| 1,323,147 | ||||||||
MALAYSIA (3.2%) | ||||||||
Commercial Banks (3.2%) | ||||||||
Malayan Banking Bhd (USD), 3.91%, 10/29/2026 (a) | 200,000 | 206,326 | ||||||
REPUBLIC OF SOUTH KOREA (1.6%) | ||||||||
Auto Manufacturers (1.6%) | ||||||||
Hyundai Capital Services, Inc. (USD), 2.63%, 09/29/2020 (a) | 100,000 | 99,528 | ||||||
SINGAPORE (3.2%) |
| |||||||
Commercial Banks (3.2%) | ||||||||
United Overseas Bank Ltd. (USD), 3.50%, 09/16/2026 (a) | 200,000 | 203,589 | ||||||
THAILAND (5.4%) |
| |||||||
Chemicals (1.4%) | ||||||||
PTT Global Chemical PCL (USD), 4.25%, 09/19/2022 (a) | 80,000 | 84,532 | ||||||
Commercial Banks (4.0%) | ||||||||
Bangkok Bank PCL (USD), | 50,000 | 70,584 | ||||||
Krung Thai Bank PCL (USD), 5.20%, 12/26/2024 (a) | 179,000 | 185,753 | ||||||
| 256,337 | ||||||||
| 340,869 | ||||||||
Total Corporate Bonds | 3,851,076 | |||||||
GOVERNMENT BONDS (24.9%) | ||||||||
INDONESIA (14.9%) | ||||||||
Indonesia Government International Bond (USD), 5.25%, 01/08/2047 (a) | 200,000 | 225,796 | ||||||
Indonesia Treasury Bill, Series 153 (IDR), Zero Coupon, 11/09/2017 | 3,000,000,000 | 220,999 | ||||||
Indonesia Treasury Bond, Series FR74 (IDR), 7.50%, 08/15/2032 | 6,700,000,000 | 503,148 | ||||||
| 949,943 | ||||||||
MALAYSIA (5.9%) | ||||||||
Malaysia Government Bond, Series 0217 (MYR), 4.06%, 09/30/2024 | 1,600,000 | 380,285 | ||||||
SRI LANKA (4.1%) | ||||||||
Sri Lanka Government Bond | ||||||||
Series A (LKR), 10.75%, 01/15/2019 | 15,000,000 | 98,961 | ||||||
(LKR), 10.60%, 09/15/2019 | 25,000,000 | 164,933 | ||||||
| 263,894 | ||||||||
Total Government Bonds | 1,594,122 | |||||||
SHORT-TERM INVESTMENT (10.5%) | ||||||||
UNITED STATES (10.5%) | ||||||||
State Street Institutional U.S. Government Money Market Fund, Institutional Class, 0.96% (b) | 671,389 | 671,389 | ||||||
Total Short-Term Investment | 671,389 | |||||||
Total Investments | 6,116,587 | |||||||
Other Assets in Excess of Liabilities—4.3% | 271,494 | |||||||
Net Assets—100.0% | $ | 6,388,081 | ||||||
| (a) | Denotes a security issued under Regulation S or Rule 144A. |
| (b) | Registered investment company advised by State Street Global Advisors. The rate shown is the current yield as of October 31, 2017. |
| (c) | See accompanying Notes to Financial Statements for tax unrealized appreciation/(depreciation) of securities. |
See accompanying Notes to Financial Statements.
| 2017 Annual Report | 7 |
Statement of Investments (continued)
October 31, 2017
Aberdeen Asia Bond Fund
| AUD | Australian Dollar |
| CNH | Chinese Yuan Renminbi Offshore |
| CNY | Chinese Yuan Renminbi |
| HKD | Hong Kong Dollar |
| IDR | Indonesian Rupiah |
| INR | Indian Rupee |
| JPY | Japanese Yen |
| KRW | South Korean Won |
| LKR | Sri Lanka Rupee |
| MYR | Malaysian Ringgit |
| PHP | Philippine Peso |
| SGD | Singapore Dollar |
| THB | Thai Baht |
| USD | U.S. Dollar |
At October 31, 2017, the Fund held the following futures contracts:
| Futures Contracts | Number of Contracts Long/(Short) | Expiration Date | Notional Amount | Market Value | Unrealized Appreciation/ (Depreciation) | |||||||||||||||
| LONG CONTRACT POSITIONS | ||||||||||||||||||||
United States Treasury Note 6%-2 year | 4 | 12/29/2017 | $ | 865,134 | $ | 861,437 | $ | (3,697 | ) | |||||||||||
United States Treasury Note 6%-5 year | 5 | 12/29/2017 | 592,512 | 585,938 | (6,574 | ) | ||||||||||||||
United States Treasury Note 6%-Ultra Long | 1 | 12/19/2017 | 167,979 | 164,781 | (3,198 | ) | ||||||||||||||
| $ | (13,469 | ) | ||||||||||||||||||
| SHORT CONTRACT POSITIONS | ||||||||||||||||||||
United States Treasury Note 6%-10 year | (20 | ) | 12/19/2017 | $ | (2,532,032 | ) | $ | (2,498,750 | ) | $ | 33,282 | |||||||||
United States Treasury Note 6%-5 year | (3 | ) | 12/29/2017 | (355,102 | ) | (351,562 | ) | 3,540 | ||||||||||||
| $ | 36,822 | |||||||||||||||||||
| $ | 23,353 | |||||||||||||||||||
At October 31, 2017, the Fund’s open forward foreign currency exchange contracts were as follows:
| Purchase Contracts Settlement Date* | Counterparty | Amount Purchased | Amount Sold | Fair Value | Unrealized Appreciation/ (Depreciation) | |||||||||||||||||||||||
| Australian Dollar/United States Dollar 12/12/2017 | Standard Chartered Bank | AUD | 800,000 | USD | 629,964 | $ | 612,030 | $ | (17,934 | ) | ||||||||||||||||||
| Chinese Yuan Renminbi/United States Dollar 12/12/2017 | Standard Chartered Bank | CNY | 3,280,152 | USD | 500,001 | 493,898 | (6,103 | ) | ||||||||||||||||||||
| Chinese Yuan Renminbi Offshore/United States Dollar 11/03/2017 | Goldman Sachs | CNH | 1,321,202 | USD | 200,000 | 199,181 | (819 | ) | ||||||||||||||||||||
| 11/03/2017 | UBS | CNH | 6,763,100 | USD | 1,000,000 | 1,019,588 | 19,588 | |||||||||||||||||||||
| 12/12/2017 | Goldman Sachs | CNH | 2,359,070 | USD | 354,049 | 354,812 | 763 | |||||||||||||||||||||
| Indian Rupee/United States Dollar 11/03/2017 | BNP Paribas | INR | 186,971,700 | USD | 2,900,000 | 2,886,328 | (13,672 | ) | ||||||||||||||||||||
| Indonesian Rupiah/United States Dollar 12/12/2017 | Goldman Sachs | IDR | 38,705,850,000 | USD | 2,850,000 | 2,844,673 | (5,327 | ) | ||||||||||||||||||||
| Japanese Yen/United States Dollar 12/12/2017 | Goldman Sachs | JPY | 14,700,000 | USD | 131,291 | 129,518 | (1,773 | ) | ||||||||||||||||||||
| Philippine Peso/United States Dollar 12/12/2017 | Goldman Sachs | PHP | 2,564,300 | USD | 50,000 | 49,552 | (448 | ) | ||||||||||||||||||||
| 12/12/2017 | HSBC Bank | PHP | 67,735,200 | USD | 1,300,001 | 1,308,893 | 8,892 | |||||||||||||||||||||
| Singapore Dollar/United States Dollar 12/12/2017 | Standard Chartered Bank | SGD | 1,060,000 | USD | 782,618 | 778,038 | (4,580 | ) | ||||||||||||||||||||
| South Korean Won/United States Dollar 12/12/2017 | Goldman Sachs | KRW | 227,236,559 | USD | 200,000 | 202,935 | 2,935 | |||||||||||||||||||||
| 12/12/2017 | UBS | KRW | 796,915,000 | USD | 699,999 | 711,691 | 11,692 | |||||||||||||||||||||
| Thai Baht/United States Dollar 11/10/2017 | UBS | THB | 55,522,500 | USD | 1,650,000 | 1,671,584 | 21,584 | |||||||||||||||||||||
| $ | 13,262,721 | $ | 14,798 | |||||||||||||||||||||||||
See accompanying Notes to Financial Statements.
| 8 | Annual Report 2017 |
Statement of Investments (concluded)
October 31, 2017
Aberdeen Asia Bond Fund
| Sale Contracts Settlement Date* | Counterparty | Amount Purchased | Amount Sold | Fair Value | Unrealized Appreciation/ (Depreciation) | |||||||||||||||||||||||
| United States Dollar/Australian Dollar 11/03/2017 | Standard Chartered Bank | USD | 964,000 | AUD | 1,216,744 | $ | 931,226 | $ | 32,774 | |||||||||||||||||||
| United States Dollar/Chinese Yuan Renminbi Offshore 11/03/2017 | UBS | USD | 1,400,000 | CNH | 9,441,280 | 1,423,343 | (23,343 | ) | ||||||||||||||||||||
| United States Dollar/Hong Kong Dollar 12/08/2017 | HSBC Bank | USD | 1,300,000 | HKD | 10,142,535 | 1,300,780 | (780 | ) | ||||||||||||||||||||
| United States Dollar/Indian Rupee 12/12/2017 | HSBC Bank | USD | 2,500,000 | INR | 165,774,250 | 2,546,859 | (46,859 | ) | ||||||||||||||||||||
| United States Dollar/Indonesian Rupiah 12/12/2017 | UBS | USD | 2,700,000 | IDR | 36,374,400,000 | 2,673,324 | 26,676 | |||||||||||||||||||||
| United States Dollar/Philippine Peso 12/12/2017 | Credit Suisse | USD | 900,000 | PHP | 46,251,000 | 893,739 | 6,261 | |||||||||||||||||||||
| United States Dollar/Thai Baht 12/12/2017 | Standard Chartered Bank | USD | 1,096,887 | THB | 36,500,000 | 1,098,993 | (2,106 | ) | ||||||||||||||||||||
| $ | 10,868,264 | $ | (7,377 | ) | ||||||||||||||||||||||||
| * | Certain contracts with different trade dates and like characteristics have been shown net. |
See accompanying Notes to Financial Statements.
| 2017 Annual Report | 9 |
Aberdeen Emerging Markets Debt Fund (Unaudited)
The Aberdeen Emerging Markets Debt Fund (Institutional Class shares net of fees) returned 8.62% for the 12-month period ended October 31, 2017, versus the 6.32% return of its benchmark, the J.P. Morgan Emerging Markets Bond (EMBI) Global Diversified Index, for the same period. For broader comparison, the average return of the Fund’s peer category of Emerging Markets Hard Currency Debt Funds (comprising 88 funds), as measured by Lipper, Inc., was 7.42% for the period.
The run-up to the U.S. presidential election in November 2016 dominated market news early in the reporting period. Donald Trump’s surprise victory sparked some volatility in emerging-market risk assets, with most market participants expecting former U.S. Secretary of State Hillary Clinton to replace President Barack Obama in the White House. Despite a sharp sell-off on the back of initial fears around what a Trump presidency would mean for emerging-market debt, it was a very positive period overall for both hard and local currency bonds. The asset class shrugged off prospects of a “hard” Trump – despite the president withdrawing the U.S. from the Trans-Pacific Partnership in January 2017 – while the U.S. Federal Reserve’s (Fed) decision to raise its benchmark interest rate in three 25-basis point increments over the reporting period did little to offset the 2017 rally. As of the end of the reporting period, the market appeared to be pricing in another rate hike in December 2017.
Oil prices were volatile at the start of the reporting period amid concerns that members of the Organization of the Petroleum Exporting Countries (OPEC) would fail to come to an agreement on production quotas. However, despite a dip in prices over the second quarter of 2017, the Brent crude oil price subsequently rallied, rising 9.1% in September alone as it reached a peak of $59 per barrel – its highest level since mid-2015. There recently have been some signs of a drawdown in the massive glut in global oil inventories, as well as rising expectations that the OPEC supply deal will be extended beyond March 2018. The prices of other commodities were relatively subdued for much of the reporting period before an increase over the third quarter of 2017 helped boost the asset class. Demand for both hard currency and local currency remained robust, while emerging-market currencies saw strong performance against a weakening U.S. dollar.
The Eurozone successfully skirted around various political hurdles over the reporting period, including potential French and Dutch general election surprises and a possible Greek debt default. The German election in September 2017 did not play out in the same vein, however. While Angela Merkel will continue as German chancellor after winning the national election, her Christian Democrat alliance recorded its worst election result since 1949, amid a larger-than-expected surge in support for her nationalist opponents, the anti-immigration Alternative for Germany party.
It appears that many emerging-market countries now find themselves in something of a ”sweet spot,” though the picture is a little more mixed for some. A weaker U.S. dollar is boosting global cross-border liquidity and helping several emerging-market currencies, while China’s economy continues to perform well despite weakening marginally over the third quarter of 2017 and lingering fears around debt levels. India recently has been heralded as one of the emerging markets’ strongest-performing economies but data has become somewhat mixed. Economic activity slowed notably over the second and third quarters of 2017, with the external sector1 deteriorating alongside weak domestic demand playing a role. A strong rupee and initial difficulties surrounding the implementation of the Goods and Services Tax in July 2017, also hindered progress.
The Fund outperformed its benchmark, the J.P. Morgan EMBI Global Diversified Index, over the reporting period. Fund performance was bolstered by an overweight allocation to Brazilian local currency bonds, both country allocation and security selection in Ukraine, as well as overweight positions in Argentina, Russia, Mexico and El Salvador. Security selection in Venezuela was the largest detractor from performance over the period, while underweight positions in Panama and Sri Lanka also had a negative impact.
At the start of the reporting period, we reduced the Fund’s exposure to Ecuador and Kenya in the run-up to the U.S. presidential election. We added to positions in Iraq and Bahrain, where we participated in new issues in the third quarter of 2017. For much of the period, we added to the Fund’s exposure to Argentina, favoring local currency bonds, as we have been encouraged by its improving macroeconomic fundamentals. In frontier markets, we reduced the exposure to several countries at the beginning of 2017, including Suriname, Angola, Ethiopia and Ghana, while concurrently reducing the Fund’s duration2 in Pemex, the Mexican state-owned oil company. Within the corporate sector, we carried out various switches between holdings and also purchased a new issue from Vimpelcom, a Russian telecommunications company.
Later in the reporting period, we increased the Fund’s allocation to El Salvador and initiated a position in Lebanon, while reducing positions in Ethiopia, Dubai and Tunisia. Finally, in local markets, we reduced the positions in Malaysia and Uruguay, while increasing the exposure to Russia. In the currency space, we trimmed the Fund’s exposure to the Mexican peso and increased the position in the Turkish lira, from which we subsequently took profits in September 2017.
The Fund may invest in derivatives for hedging purposes and to gain risk exposure to countries, currencies and securities in which the Fund is permitted to invest. The overall currency exposure subtracted 0.45% from the Fund’s absolute return during the reporting period.
| 1 | The external sector is the portion of a country’s economy that interacts with the economies of other countries. |
| 2 | Duration is an estimate of bond price sensitivity to changes in interest rates. The higher the duration, the greater the change (i.e., higher risk) in relation to interest-rate movements. |
| 10 | Annual Report 2017 |
Aberdeen Emerging Markets Debt Fund (Unaudited) (concluded)
Fund flows into the emerging-market debt asset class remain strong, although we feel that this could be tested amid potential changes in news flow in the U.S. and Eurozone. In early November 2017, President Trump announced the nomination of Jerome Powell as Fed chairman to succeed Janet Yellen, whose four-year term expires in February 2018. Powell, who currently serves as a Fed governor, has supported the central bank’s program of gradual monetary policy tightening as the economy continues to improve. Therefore, it is generally believed that he will “stay the course” as Fed chairman. In Europe, while Brexit negotiations continue, we wait to ascertain whether Merkel’s administration has been weakened as a result of Germany’s election result and what this could mean for the Eurozone project.3
Overall, we anticipate that monetary policy should remain divergent between developed and emerging economies throughout the remainder of 2017. Robust economic growth in developed economies is giving central banks some room to breathe and reload their monetary policy arsenals ahead of the next slowdown. Uneven recoveries in emerging-market economies have set several central banks on a monetary policy easing cycle, including Brazil, Colombia, Russia, Ukraine and South Africa.
Portfolio Management:
Aberdeen Emerging Markets Debt Team
PAST PERFORMANCE DOES NOT GUARANTEE FUTURE RESULTS.
The performance data quoted represents past performance and current returns may be lower or higher. Class A Shares have up to a 4.25% front-end sales charge and a 0.25% 12b-1 fee. The investment return and principal value will fluctuate so that an investor’s shares, when redeemed, may be worth more or less than the original cost. To obtain performance information current to the most recent month-end, which may be higher or lower than the performance shown above, please call 866-667-9231 or go to www.aberdeen-asset.us.
Investing in mutual funds involves risk, including the possible loss of principal.
Indexes are unmanaged and have been provided for comparison purposes only. No fees or expenses are reflected. You cannot invest directly in an index.
Lipper is a leading global provider of mutual fund information and analysis to fund companies, financial intermediaries and media organizations.
Risk Considerations
Fixed income securities are subject to certain risks including, but not limited to: interest rate (changes in interest rates may cause a decline in the market value of an investment), credit (changes in the financial condition of the issuer, borrower, counterparty, or underlying collateral), prepayment (debt issuers may repay or refinance their loans or obligations earlier than anticipated), and extension (principal repayments may not occur as quickly as anticipated, causing the expected maturity of a security to increase). The Fund’s investments in high yield bonds and other lower-rated securities will subject the Fund to substantial risk of loss.
Foreign securities may be more volatile, harder to price and less liquid than U.S. securities. They are subject to different accounting and regulatory standards, currency exchange rates, and political and economic risks. Fluctuation in currency exchange rates may impact the Fund’s returns more greatly to the extent the Fund does not hedge currency exposure or hedging techniques are unsuccessful. The foregoing risks are enhanced in emerging market countries.
The Fund is non-diversified and may hold larger positions in fewer securities than other funds and have greater risk than more diversified funds.
Derivatives are speculative and may hurt the Fund’s performance. They present the risk of disproportionately increased losses and/or reduced gains when the financial asset or measure to which the derivative is linked changes in unexpected ways.
Investing a significant portion of the Fund’s assets in securities of companies conducting business in a broadly related group of industries within an economic sector may make the Fund more vulnerable to unfavorable developments in that sector.
Please read the prospectus for more detailed information regarding these and other risks.
| 3 | The Eurozone project refers to the establishment of a geographic and economic region that consists of all the European Union countries that have fully incorporated the euro as their national currency. |
| 2017 Annual Report | 11 |
Aberdeen Emerging Markets Debt Fund (Unaudited)
| Average Annual Total Return (For periods ended October 31, 2017) | 1 Yr. | 5 Yr. | Inception1 | |||||||||||
Class A | w/o SC | 8.21% | 3.62% | 3.62% | ||||||||||
| w/SC2 | 3.63% | 2.73% | 2.73% | |||||||||||
Class C | w/o SC | 7.57% | 2.90% | 2.90% | ||||||||||
| w/SC3 | 6.57% | 2.90% | 2.90% | |||||||||||
Class R4 | w/o SC | 7.96% | 3.39% | 3.39% | ||||||||||
Institutional Service Class4 | w/o SC | 8.67% | 3.93% | 3.93% | ||||||||||
Institutional Class4 | w/o SC | 8.62% | 3.90% | 3.90% | ||||||||||
All figures showing the effect of a sales charge (SC) reflect the maximum charge possible because it has the most significant effect on performance data. The total returns shown above do not include the impact of financial statement rounding of the net asset value (NAV) per share and/or financial statement adjustments.
| 1 | The Fund commenced operations on November 1, 2012. |
| 2 | A 4.25% front-end sales charge was deducted. |
| 3 | A 1.00% contingent deferred sales charge (CDSC) was deducted from the one year return because it is charged when Class C shares are sold within the first year after purchase. |
| 4 | Not subject to any sales charges. |
Performance of a $1,000,000* Investment (as of October 31, 2017)
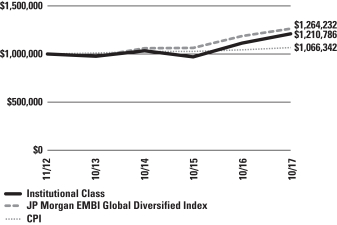
| * | Minimum Initial Investment |
Comparative performance of $1,000,000 invested in Institutional Class shares of the Aberdeen Emerging Markets Debt Fund, the J.P. Morgan Emerging Markets Bond Index (EMBI) Global Diversified Index, a broad-based securities Index and the Consumer Price Index (CPI) since inception. Unlike the Fund, the returns for these unmanaged indexes do not reflect any fees, expenses, or sales charges. Investors cannot invest directly in market indexes.
The J.P. Morgan EMBI Global Diversified Index is an alternatively weighted index that assigns a larger weight to less liquid issues from countries with smaller debt stocks and limits the weights of those index countries with larger debt stocks by only including a specified portion of these countries’ eligible current face amounts of debt outstanding. The index consists of U.S. dollar-denominated Brady bonds, Eurobonds, and traded loans issued by sovereign and quasi-sovereign entities issued in emerging markets countries.
The CPI is a measure of the average change over time in the prices paid by urban consumers for a market basket of consumer goods and services.
Investment return and principal value will fluctuate, and when redeemed, shares may be worth more or less than original cost. Past performance is no guarantee of future results. The Average Annual Total Return table and Performance graph do not reflect the deduction of taxes that a shareholder would pay on fund distributions or the redemption of fund shares. Investing in mutual funds involves market risk, including loss of principal. Performance returns assume the reinvestment of all distributions. Total returns reflect waivers and reimbursements in effect, without which returns would have been lower.
| 12 | Annual Report 2017 |
Aberdeen Emerging Markets Debt Fund (Unaudited) (concluded)
Portfolio Summary (as a percentage of net assets)
October 31, 2017 (Unaudited)
| Asset Allocation | ||||
Government Bonds | 70.7% | |||
Corporate Bonds | 21.6% | |||
Short-Term Investment | 6.0% | |||
Other Assets in Excess of Liabilities | 1.7% | |||
| 100.0% | ||||
The following chart summarizes the composition of the Fund’s portfolio, expressed as a percentage of net assets. The industries listed below may include more than one industry group. As of October 31, 2017, the Fund did not have more than 25% of its assets invested in any industry group.
| Top Industries | ||||
Oil, Gas & Consumable Fuels | 6.6% | |||
Chemicals | 2.3% | |||
Energy Equipment & Services | 2.0% | |||
Transportation | 1.9% | |||
Commercial Banks | 1.5% | |||
Metals & Mining | 1.4% | |||
Holding Companies-Diversified Operations | 0.9% | |||
Diversified Financial Services | 0.9% | |||
Investment Companies | 0.9% | |||
Real Estate | 0.9% | |||
Other | 80.7% | |||
| 100.0% | ||||
| Top Holdings* | ||||
Argentine Republic Government International Bond 04/22/2026 | 3.8% | |||
Serbia International Bond 09/28/2021 | 2.7% | |||
Turkey Government International Bond 10/09/2026 | 2.3% | |||
Ukraine Government International Bond 09/01/2024 | 2.2% | |||
Indonesia Government International Bond 01/15/2024 | 2.0% | |||
Turkey Government International Bond 03/25/2027 | 2.0% | |||
Brazil Notas do Tesouro Nacional, Series F 01/01/2027 | 1.9% | |||
Georgian Railway JSC 07/11/2022 | 1.9% | |||
Republic of South Africa Government International Bond 05/30/2022 | 1.8% | |||
Bahrain Government International Bond 10/12/2028 | 1.8% | |||
Other | 77.6% | |||
| 100.0% | ||||
| * | For the purpose of listing top holdings, Short-Term Investments are included as part of Other. |
| Top Countries | ||||
Argentina | 6.9% | |||
United States | 6.0% | |||
Turkey | 5.7% | |||
Russia | 5.5% | |||
Indonesia | 5.2% | |||
Mexico | 5.1% | |||
Brazil | 4.9% | |||
Ukraine | 4.5% | |||
Ecuador | 3.9% | |||
Dominican Republic | 3.4% | |||
Other | 48.9% | |||
| 100.0% | ||||
| 2017 Annual Report | 13 |
Statement of Investments
October 31, 2017
Aberdeen Emerging Markets Debt Fund
| Shares or Principal Amount | Value (US$) | |||||||
CORPORATE BONDS (21.6%) | ||||||||
AZERBAIJAN (1.2%) | ||||||||
Energy Equipment & Services (1.2%) | ||||||||
Southern Gas Corridor CJSC (USD), 6.88%, 03/24/2026 (a)(b) | $ | 250,000 | $ | 282,510 | ||||
BRAZIL (1.6%) | ||||||||
Commercial Banks (0.6%) | ||||||||
Caixa Economica Federal (USD), 4.25%, 05/13/2019 (a) | 150,000 | 152,400 | ||||||
Engineering & Construction (0.1%) | ||||||||
OAS Investments GmbH (USD), 8.25%, 10/19/2019 (a)(c) | 200,000 | 15,000 | ||||||
Oil, Gas & Consumable Fuels (0.9%) | ||||||||
Petrobras Global Finance BV (USD), 6.25%, 03/17/2024 | 190,000 | 203,746 | ||||||
| 371,146 | ||||||||
CHILE (1.3%) | ||||||||
Airlines (0.5%) | ||||||||
Latam Airlines 2015-1 Pass Through Trust A (USD), 4.20%, 11/15/2027 (d) | 109,482 | 110,987 | ||||||
Electric Utilities (0.8%) | ||||||||
Empresa Electrica Angamos SA (USD), 4.88%, 05/25/2029 (a)(d) | 200,000 | 202,589 | ||||||
| 313,576 | ||||||||
GEORGIA (1.9%) | ||||||||
Transportation (1.9%) | ||||||||
Georgian Railway JSC (USD), 7.75%, 07/11/2022 (a) | 400,000 | 446,508 | ||||||
INDONESIA (1.4%) | ||||||||
Oil, Gas & Consumable Fuels (1.4%) | ||||||||
Pertamina Persero PT (USD), 6.00%, 05/03/2042 (a) | 290,000 | 331,888 | ||||||
KAZAKHSTAN (0.8%) | ||||||||
Oil, Gas & Consumable Fuels (0.8%) | ||||||||
Tengizchevroil Finance Co. International Ltd. (USD), 4.00%, 08/15/2026 (a)(d) | 200,000 | 196,662 | ||||||
KUWAIT (0.9%) | ||||||||
Chemicals (0.9%) | ||||||||
Equate Petrochemical BV (USD), 4.25%, 11/03/2026 (a) | 200,000 | 205,500 | ||||||
MEXICO (3.4%) | ||||||||
Holding Companies-Diversified Operations (0.9%) |
| |||||||
Alfa SAB de CV (USD), 6.88%, 03/25/2044 (a) | 200,000 | 218,750 | ||||||
Oil, Gas & Consumable Fuels (2.5%) |
| |||||||
Petroleos Mexicanos | ||||||||
(USD), 6.38%, 01/23/2045 | 70,000 | 69,632 | ||||||
(USD), 5.63%, 01/23/2046 | 240,000 | 217,596 | ||||||
(USD), 6.75%, 09/21/2047 | 80,000 | 82,456 | ||||||
(USD), 3-month LIBOR + 3.650%, 4.97%, 03/11/2022 (a)(e) | 190,000 | 207,100 | ||||||
| 576,784 | ||||||||
| 795,534 | ||||||||
MOROCCO (1.4%) | ||||||||
Chemicals (1.4%) | ||||||||
OCP SA (USD), 6.88%, 04/25/2044 (a) | 300,000 | 338,220 | ||||||
PANAMA (0.9%) | ||||||||
Commercial Banks (0.9%) | ||||||||
Global Bank Corp. (USD), 4.50%, 10/20/2021 (a) | 200,000 | 204,750 | ||||||
PERU (1.4%) | ||||||||
Metals & Mining (1.4%) | ||||||||
Nexa Resources SA (USD), 5.38%, 05/04/2027 (a) | 200,000 | 211,240 | ||||||
Southern Copper Corp. (USD), 5.88%, 04/23/2045 | 98,000 | 114,559 | ||||||
| 325,799 | ||||||||
RUSSIA (1.8%) | ||||||||
Diversified Financial Services (0.9%) | ||||||||
GTLK Europe DAC (USD), 5.95%, 07/19/2021 (a) | 200,000 | 212,248 | ||||||
Diversified Telecommunication Services (0.9%) |
| |||||||
VEON Holdings BV (USD), 4.95%, 06/16/2024 (a) | 200,000 | 204,652 | ||||||
| 416,900 | ||||||||
UNITED ARAB EMIRATES (2.6%) | ||||||||
Energy Equipment & Services (0.8%) | ||||||||
Abu Dhabi Crude Oil Pipeline LLC (USD), 4.60%, 11/02/2047 (a)(d) | 200,000 | 204,363 | ||||||
Investment Companies (0.9%) | ||||||||
ICD Sukuk Co. Ltd. (USD), 5.00%, 02/01/2027 (a) | 200,000 | 209,421 | ||||||
Real Estate (0.9%) | ||||||||
MAF Global Securities Ltd. (USD), 5.50%, 09/07/2022 (a)(f) | 200,000 | 206,364 | ||||||
| 620,148 | ||||||||
VENEZUELA (1.0%) | ||||||||
Oil, Gas & Consumable Fuels (1.0%) | ||||||||
Petroleos de Venezuela SA (USD), 6.00%, 05/16/2024 (a)(d) | 890,000 | 251,425 | ||||||
Total Corporate Bonds |
| 5,100,566 | ||||||
GOVERNMENT BONDS (70.7%) | ||||||||
ARGENTINA (6.9%) | ||||||||
Argentina POM Politica Monetaria (ARS), Argentina Central Bank 7-day Repo Reference Rate, 27.14%, 06/21/2020 (e) | 2,680,200 | 165,342 | ||||||
Argentine Bonos del Tesoro | ||||||||
(ARS), 18.20%, 10/03/2021 | 1,050,000 | 60,704 | ||||||
(ARS), 16.00%, 10/17/2023 | 1,393,942 | 79,400 | ||||||
See accompanying Notes to Financial Statements.
| 14 | Annual Report 2017 |
Statement of Investments (continued)
October 31, 2017
Aberdeen Emerging Markets Debt Fund
| Shares or Principal Amount | Value (US$) | |||||||
Argentine Republic Government International Bond | ||||||||
(USD), 5.63%, 01/26/2022 | $ | 237,000 | $ | 248,850 | ||||
(USD), 7.50%, 04/22/2026 | 790,000 | 892,700 | ||||||
(EUR), 7.82%, 12/31/2033 (d) | 86,695 | 116,018 | ||||||
(USD), 0.00%, 12/15/2035 (e) | 600,000 | 67,800 | ||||||
| 1,630,814 | ||||||||
ARMENIA (0.9%) | ||||||||
Republic of Armenia International Bond (USD), 7.15%, 03/26/2025 (a) | 200,000 | 223,350 | ||||||
BAHRAIN (1.8%) | ||||||||
Bahrain Government International Bond (USD), 7.00%, 10/12/2028 (a) | 410,000 | 421,299 | ||||||
BRAZIL (3.3%) | ||||||||
Brazil Notas do Tesouro Nacional, Series F (BRL), 10.00%, 01/01/2025 | 1,010,000 | 312,028 | ||||||
Brazil Notas do Tesouro Nacional, Series F (BRL), 10.00%, 01/01/2027 | 1,480,000 | 456,157 | ||||||
| 768,185 | ||||||||
CROATIA (0.5%) | ||||||||
Croatia Government International Bond (USD), 6.63%, 07/14/2020 (a) | 100,000 | 109,477 | ||||||
DOMINICAN REPUBLIC (3.4%) | ||||||||
Dominican Republic International Bond | ||||||||
(USD), 5.88%, 04/18/2024 (a)(d) | 200,000 | 217,750 | ||||||
(USD), 6.88%, 01/29/2026 (a) | 290,000 | 331,421 | ||||||
(USD), 7.45%, 04/30/2044 (a) | 100,000 | 118,750 | ||||||
(USD), 6.85%, 01/27/2045 (a) | 120,000 | 133,800 | ||||||
| 801,721 | ||||||||
ECUADOR (3.9%) | ||||||||
Ecuador Government International Bond | ||||||||
(USD), 10.75%, 03/28/2022 (a) | 420,000 | 474,600 | ||||||
(USD), 8.75%, 06/02/2023 (a) | 200,000 | 209,800 | ||||||
(USD), 8.88%, 10/23/2027 (a) | 220,000 | 225,084 | ||||||
| 909,484 | ||||||||
EGYPT (0.9%) | ||||||||
Egypt Government International Bond (USD), 6.13%, 01/31/2022 (a) | 200,000 | 208,545 | ||||||
EL SALVADOR (2.2%) | ||||||||
El Salvador Government International Bond | ||||||||
(USD), 5.88%, 01/30/2025 (a) | 472,000 | 466,100 | ||||||
(USD), 7.65%, 06/15/2035 (a) | 40,000 | 41,700 | ||||||
| 507,800 | ||||||||
GHANA (1.7%) | ||||||||
Ghana Government International Bond (USD), 10.75%, 10/14/2030 (a)(d) | 300,000 | 399,720 | ||||||
HONDURAS (1.4%) | ||||||||
Honduras Government International Bond (USD), 7.50%, 03/15/2024 (a)(d) | 290,000 | 329,150 | ||||||
HUNGARY (0.5%) | ||||||||
Hungary Government International Bond (USD), 6.38%, 03/29/2021 | 100,000 | 111,875 | ||||||
INDONESIA (3.8%) | ||||||||
Indonesia Government International Bond (USD), 5.88%, 01/15/2024 (a) | 410,000 | 470,733 | ||||||
Indonesia Treasury Bond | ||||||||
Series FR68 (IDR), 8.38%, 03/15/2034 | 2,600,000,000 | 207,713 | ||||||
Series FR72 (IDR), 8.25%, 05/15/2036 | 249,000,000 | 19,828 | ||||||
Perusahaan Penerbit SBSN Indonesia III (USD), 3.40%, 03/29/2022 (a) | 200,000 | 203,900 | ||||||
| 902,174 | ||||||||
IVORY COAST (0.7%) | ||||||||
Ivory Coast Government International Bond (USD), 5.75%, 12/31/2032 (a)(d)(g) | 176,730 | 174,242 | ||||||
JORDAN (0.9%) | ||||||||
Jordan Government International Bond (USD), 6.13%, 01/29/2026 (a) | 200,000 | 207,000 | ||||||
LEBANON (3.0%) | ||||||||
Lebanon Government International Bond | ||||||||
(USD), 6.10%, 10/04/2022 (a) | 150,000 | 148,217 | ||||||
(USD), 6.85%, 03/23/2027 (a) | 250,000 | 243,428 | ||||||
(USD), 6.75%, 11/29/2027 (a) | 330,000 | 317,926 | ||||||
| 709,571 | ||||||||
MEXICO (1.7%) | ||||||||
Mexico Government International Bond (USD), 6.05%, 01/11/2040 | 340,000 | 398,140 | ||||||
MONGOLIA (1.0%) | ||||||||
Mongolia Government International Bond (USD), 10.88%, 04/06/2021 (a) | 200,000 | 234,846 | ||||||
NAMIBIA (0.9%) | ||||||||
Namibia International Bonds (USD), 5.25%, 10/29/2025 (a) | 220,000 | 223,476 | ||||||
NIGERIA (0.9%) | ||||||||
Nigeria Government International Bond (USD), 7.88%, 02/16/2032 (a) | 200,000 | 219,696 | ||||||
PARAGUAY (2.3%) | ||||||||
Paraguay Government International Bond | ||||||||
(USD), 4.70%, 03/27/2027 (a) | 200,000 | 210,000 | ||||||
(USD), 6.10%, 08/11/2044 (a) | 300,000 | 342,750 | ||||||
| 552,750 | ||||||||
PERU (1.5%) | ||||||||
Peru Government Bond (PEN), 6.15%, 08/12/2032 (a) | 180,000 | 57,893 | ||||||
Peruvian Government International Bond | ||||||||
(USD), 7.13%, 03/30/2019 | 80,000 | 86,440 | ||||||
(PEN), 6.95%, 08/12/2031 (a) | 630,000 | 217,416 | ||||||
| 361,749 | ||||||||
See accompanying Notes to Financial Statements.
| 2017 Annual Report | 15 |
Statement of Investments (continued)
October 31, 2017
Aberdeen Emerging Markets Debt Fund
| Shares or Principal Amount | Value (US$) | |||||||
RUSSIA (3.7%) | ||||||||
Russian Federal Bond — OFZ | ||||||||
Series 6204 (RUB), 7.50%, 03/15/2018 | $ | 14,000,000 | $ | 239,422 | ||||
Series 6218 (RUB), 8.50%, 09/17/2031 | 11,600,000 | 214,723 | ||||||
Russian Foreign Bond — Eurobond (USD), 5.25%, 06/23/2047 (a) | 400,000 | 409,500 | ||||||
| 863,645 | ||||||||
RWANDA (1.1%) | ||||||||
Rwanda International Government Bond (USD), 6.63%, 05/02/2023 (a) | 250,000 | 259,393 | ||||||
SENEGAL (0.9%) | ||||||||
Senegal Government International Bond (USD), 6.25%, 07/30/2024 (a) | 200,000 | 214,860 | ||||||
SERBIA (2.7%) | ||||||||
Serbia International Bond (USD), 7.25%, 09/28/2021 (a) | 560,000 | 644,013 | ||||||
SOUTH AFRICA (1.8%) | ||||||||
Republic of South Africa Government International Bond (USD), 5.88%, 05/30/2022 | 390,000 | 425,507 | ||||||
SRI LANKA (0.5%) | ||||||||
Sri Lanka Government International Bond (USD), 6.25%, 10/04/2020 (a) | 100,000 | 106,765 | ||||||
TANZANIA (0.5%) | ||||||||
Tanzania Government International Bond (USD), 7.45%, 03/09/2020 (a)(d)(e) | 111,111 | 116,387 | ||||||
TURKEY (5.7%) | ||||||||
Turkey Government International Bond | ||||||||
(USD), 7.38%, 02/05/2025 | 290,000 | 332,449 | ||||||
(USD), 4.88%, 10/09/2026 | 550,000 | 537,093 | ||||||
(USD), 6.00%, 03/25/2027 | 440,000 | 463,408 | ||||||
| 1,332,950 | ||||||||
UKRAINE (4.5%) | ||||||||
Ukraine Government International Bond | ||||||||
(USD), 7.75%, 09/01/2020 (a) | 100,000 | 106,605 | ||||||
(USD), 7.75%, 09/01/2021 (a) | 200,000 | 213,508 | ||||||
(USD), 7.75%, 09/01/2024 (a) | 500,000 | 524,098 | ||||||
(USD), 7.75%, 09/01/2026 (a) | 120,000 | 123,727 | ||||||
(USD), 0.00%, 05/31/2040 (a)(e) | 165,000 | 94,087 | ||||||
| 1,062,025 | ||||||||
URUGUAY (2.2%) | ||||||||
Uruguay Government International Bond | ||||||||
(UYU), 9.88%, 06/20/2022 (a) | 5,870,000 | 214,174 | ||||||
(USD), 4.38%, 10/27/2027 (d) | 80,000 | 86,480 | ||||||
(USD), 5.10%, 06/18/2050 (d) | 200,000 | 214,500 | ||||||
| 515,154 | ||||||||
VENEZUELA (0.7%) | ||||||||
Venezuela Government International Bond (USD), 9.25%, 05/07/2028 (a) | 490,000 | 161,700 | ||||||
VIETNAM (0.5%) | ||||||||
Vietnam Government International Bond (USD), 6.75%, 01/29/2020 (a) | 110,000 | 119,832 | ||||||
ZAMBIA (1.8%) | ||||||||
Zambia Government International Bond | ||||||||
(USD), 8.50%, 04/14/2024 (a) | 200,000 | 214,040 | ||||||
(USD), 8.97%, 07/30/2027 (a)(d) | 200,000 | 218,040 | ||||||
| 432,080 | ||||||||
Total Government Bonds |
| 16,659,375 | ||||||
SHORT-TERM INVESTMENT (6.0%) | ||||||||
UNITED STATES (6.0%) | ||||||||
State Street Institutional U.S. Government Money Market Fund, Institutional Class, 0.96% (h) | 1,396,810 | 1,396,810 | ||||||
Total Short-Term Investment |
| 1,396,810 | ||||||
Total Investments |
| 23,156,751 | ||||||
Other Assets in Excess of Liabilities—1.7% |
| 412,193 | ||||||
Net Assets—100.0% |
| $ | 23,568,944 | |||||
| (a) | Denotes a security issued under Regulation S or Rule 144A. |
| (b) | This security is government guaranteed. |
| (c) | Security is in default. |
| (d) | Sinkable security. |
| (e) | Variable or Floating Rate Security. Rate disclosed is as of October 31, 2017. |
| (f) | Perpetual bond. This is a bond that has no maturity date, is redeemable and pays a steady stream of interest indefinitely. The maturity date presented for these instruments represents the next call/put date. |
| (g) | Indicates a stepped coupon bond. This bond was issued with a low coupon that gradually increases over the life of the bond. |
| (h) | Registered investment company advised by State Street Global Advisors. The rate shown is the current yield as of October 31, 2017. |
| (i) | See accompanying Notes to Statements of Investments for tax unrealized appreciation/(depreciation) of securities. |
| ARS | Argentine Peso |
| BRL | Brazilian Real |
| CNY | Chinese Yuan Renminbi |
| COP | Colombian Peso |
| EUR | Euro Currency |
| HUF | Hungarian Forint |
| IDR | Indonesian Rupiah |
| KRW | South Korean Won |
| PEN | Peruvian Sol |
| RUB | New Russian Ruble |
| USD | U.S. Dollar |
| UYU | Uruguayan Peso |
See accompanying Notes to Financial Statements.
| 16 | Annual Report 2017 |
Statement of Investments (concluded)
October 31, 2017
Aberdeen Emerging Markets Debt Fund
At October 31, 2017, the Fund’s open forward foreign currency exchange contracts were as follows:
| Purchase Contracts Settlement Date* | Counterparty | Amount | Amount Sold | Fair Value | Unrealized Appreciation | |||||||||||||||||||||
| South Korean Won/United States Dollar 11/22/2017 | Goldman Sachs | KRW | 239,599,000 | USD | 212,749 | $ | 213,916 | $ | 1,167 | |||||||||||||||||
| Sale Contracts Settlement Date* | Counterparty | Amount | Amount Sold | Fair Value | Unrealized Appreciation/ (Depreciation) | |||||||||||||||||||||
| United States Dollar/Brazilian Real 11/22/2017 | UBS | USD | 149,412 | BRL | 485,000 | $ | 147,888 | $ | 1,524 | |||||||||||||||||
| United States Dollar/Chinese Yuan Renminbi 11/22/2017 | Goldman Sachs | USD | 219,242 | CNY | 1,473,000 | 222,019 | (2,777 | ) | ||||||||||||||||||
| United States Dollar/Colombian Peso 11/22/2017 | Barclays Bank | USD | 226,585 | COP | 684,569,000 | 224,639 | 1,946 | |||||||||||||||||||
| United States Dollar/Euro 01/10/2018 | Royal Bank of Canada | USD | 159,383 | EUR | 135,000 | 157,897 | 1,486 | |||||||||||||||||||
| United States Dollar/Hungarian Forint 01/10/2018 | Citibank | USD | 231,015 | HUF | 61,142,000 | 229,561 | 1,454 | |||||||||||||||||||
| United States Dollar/South Korean Won 11/22/2017 | Goldman Sachs |
| USD |
| 211,277 | KRW | 239,599,000 | 213,916 | (2,639 | ) | ||||||||||||||||
| $ | 1,195,920 | $ | 994 | |||||||||||||||||||||||
| * | Certain contracts with different trade dates and like characteristics have been shown net. |
See accompanying Notes to Financial Statements.
| 2017 Annual Report | 17 |
Aberdeen Global Unconstrained Fixed Income Fund (Unaudited)
The Aberdeen Global Unconstrained Fixed Income Fund (Institutional Class shares net of fees) returned 2.21% for the 12-month period ended October 31, 2017, versus the 0.66% return for its benchmark, the ICE Bank of America Merrill Lynch (BofA ML) 3-Month U.S. Treasury Note Index, and the 1.18% return of the broader-market Bloomberg Barclays Global Aggregate Bond Index, for the same period. For broader comparison, the average return of the Fund’s peer category of Alternative Credit Focus Funds (comprising 69 funds), as measured by Lipper, Inc., was 4.79% for the period.
Global fixed-income markets experienced pockets of volatility during the reporting period as an improving global economic backdrop was clouded by political risks in the U.S., Europe and the U.K. Global government bond yields spiked higher after the U.S. presidential election in November 2016, but slowly reversed throughout most of 2017, with the 10-year U.S. Treasury yield closing the period at 2.38%. The U.S. Dollar Index (DXY)1 appreciated sharply at the beginning of the reporting period following the election of U.S. President Donald Trump, driven by his pro-growth campaign promises. However, these moves unwound by the end of the period as the U.S. Congress failed to implement healthcare reform, leading investors to question Trump’s ability to implement the promised fiscal easing upon which he had been elected. The U.S. dollar staged some measure of recovery from the first week of September 2017 onward, fueled by hawkish rhetoric from the U.S. Federal Reserve (Fed) and increasing expectations of fiscal stimulus.
U.S. economic data continued to improve over the reporting period, with the labor market tightening further. Unemployment fell to a cyclical low of 4.1% in October 2017, although the pass-through to wage inflation remained lackluster. The Fed hiked its benchmark interest rate in three 25-basis point increments in December 2016, and March and June 2017, and began its program to phase out the reinvestment of maturing bonds purchased under prior quantitative easing (QE) programs.
European politics was a focus for markets during the reporting period as investors’ fears of rising populism and skepticism regarding the European market came to the forefront. Concern that Marine Le Pen could be elected as the French president pushed credit spreads in France and peripheral Europe2 to their widest levels since 2012. These moves sharply reversed direction following the election of pro-European Union (EU) candidate Emmanuel Macron. However, uncertainties remain in the region over the upcoming election in Italy in May 2018, as well as Macron’s ability to implement structural reforms in France. The European Central Bank (ECB) announced that it would reduce its monthly asset purchases from €80 billion to €60 billion (roughly US$95 billion to US$71 billion) in March 2017, but would extend the program to December 2017. European economic data improved substantially over the reporting period, with Purchasing Managers’ indices of manufacturing activity hitting historical highs, prompting speculation the ECB would withdraw monetary stimulus. Speaking at an ECB conference in June 2017, central bank President Mario Draghi noted that as the economy continues to recover, the parameters of policy will need to be adjusted in an effort to maintain a consistent stance. Markets interpreted the message as hawkish, with government bonds selling off (and yields concurrently rising) and the euro strengthening sharply against most major global currencies.
In the UK, the government triggered Article 50,3 the formal process for the UK to leave the EU. Prime Minister Theresa May called a snap general election in June 2017, in a bid to capitalize on her lead in the opinion polls and win a larger majority to improve her ability to get Brexit-related policies approved. However, the election resulted in a hung Parliament, requiring assistance from Northern Ireland’s Democratic Unionist Party to form a government. The ensuing uncertainty surrounding Brexit caused the pound sterling to weaken further. The sterling subsequently benefited from a newly hawkish tone from the Bank of England, as the monetary policymaker’s indications that interest rates were likely to rise soon helped the pound to emerge from a prolonged spell of weakness to outperform other G104 currencies in September 2017.
The Bank of Japan (BoJ) announced its new monetary policy package, dubbed “qualitative quantitative easing,” with yield-curve control. That is, the BoJ essentially targets purchases at varying maturities in an effort to maintain the 10-year Japanese government bond yield close to 0% and will directly intervene if the yield exceeds 0.1%.
Geopolitics was a focus for markets in the second half of the reporting period as tensions escalated on the Korean peninsula; severe weather also took its toll in the Caribbean and southern U.S., prompting a risk-off rally in U.S. Treasuries and pushing yield on the 10-year note to a 2017 year-to-date low of 2.04% in the first week of September. The risk-off rally waned over the remainder of September as weather-related risks dissipated and following the Fed’s decision to unwind its balance sheet. Global government bond yields moved higher and yield curves steepened. Towards the end of the period in October 2017, global government bond markets diverged as the sell-off in U.S. Treasuries continued. In Europe, the ECB’s dovish
taper of monetary easing sent European yields lower and peripheral Europe spreads tighter despite geopolitical tensions in the Catalonia region of Spain.
Interest-rate strategies contributed positively to Fund performance for the reporting period, most notably through yield-curve positioning. Yield-curve steepener5 trades in the short end of the U.S.
| 1 | The U.S. Dollar index measures the value of the U.S. dollar relative to a basket of foreign currencies. |
| 2 | Peripheral Europe comprises Greece, Spain, Italy, Ireland, Portugal, Poland, Hungary, Romania, Bulgaria, Turkey, Slovenia, Croatia, Estonia, Latvia, Lithuania and Albania. |
| 3 | Article 50 contains the procedures to be followed by a country seeking to leave the European Union voluntarily. |
| 4 | The G10 nations, which consult and cooperate on economic, monetary and financial matters, consists of Belgium, Canada, France, Germany, Italy, Japan, the Netherlands, Sweden, Switzerland, the UK and the U.S. |
| 5 | A yield-curve steepener trade is a strategy that seeks to benefit from increasing yield differences that occur as a result of the widening of the yield curve between two U.S. Treasury securities of different maturities. |
| 18 | Annual Report 2017 |
Aberdeen Global Unconstrained Fixed Income Fund (Unaudited) (continued)
Treasury curve were strong contributors to Fund performance following the election of Donald Trump in November 2016, as markets expected higher U.S. gross domestic product (GDP) growth and inflation, upon which the Fed would lean through interest-rate hikes. Later in the period, yield curve-flattening6 positions in both the U.S. and Europe added to Fund performance for the period. Duration7 positioning detracted slightly from performance, with the bulk of the negative performance following the U.S. presidential election, while selective long holdings in Australia and a short position in France helped recoup earlier losses. The latter position benefited from investors’ concerns that Marine Le Pen could be elected as the president of France.
Currency strategies had a negative impact on Fund performance over the reporting period, attributable primarily to the Fund’s overweight U.S. dollar position as the currency weakened despite the Fed hiking its benchmark interest rate three times over the period. The Fund’s long position in the Czech Koruna performed well as the Czech National Bank removed the currency peg8 with the euro; a long Israeli shekel position also bolstered Fund performance for the period.
Regarding the use of derivatives in the Fund over the reporting period, we employed bond futures in a bid to achieve efficient portfolio management purposes and to hedge interest-rate risk. We employed interest-rate swaps in an effort to efficiently gain or hedge interest-rate risk. We also used credit default swaps9 as part of the Fund’s hedging strategy to reduce the Fund’s exposure to the performance of the credit market. Finally, we employed foreign exchange forwards10 as a hedging strategy to manage currency exposure. The derivatives positions subtracted 2.70% from the Fund’s absolute return for the reporting period.
The Fund’s credit position benefited from the rally in corporate bonds over the reporting period. Financials in particular generated strong returns, driven predominantly by issuers down the capital structure,11 with the subordinated bonds12 of HSBC and J.P. Morgan some of the strongest performers over the 12-month period. The Fund’s largest sector allocation is in financials despite our recent reduction of the exposure. This reflects our view that there remains a favorable backdrop for the sector (low volatility, improving asset quality, low regulation in the U.S.), which we believe should support profitability and fundamental credit quality.
The Fund’s exposure to the industrial and consumer-related sectors enhanced performance for the reporting period. Specifically, higher-beta,13 emerging-market and high-yield issuers benefited with significant spread-tightening. For example, the Fund’s holding in Tesco for example was a strong performer as improved sales and profits provided further evidence that the UK-based retailer’s turnaround strategy was on track for a return to investment grade.14 The performance of the Fund’s holdings in higher-beta credits in the energy sector also was strong, driven by a recovery in commodity prices, including Brent crude oil, which was up 27.0% over the 12-month period. This was helped by the Organization of the Petroleum Exporting Countries’ (OPEC) November 2016 meeting, which resulted in production cuts and, more recently, with inventory drawdowns and further OPEC compliance discussions supporting prices and supporting energy sector bond valuations.
At the end of the reporting period on October 31, 2017, short-dated issues (those with less than three years to maturity) represented about 60% of the Fund’s assets. These bonds helped to provide relative stability to Fund performance. Within the Fund’s credit alpha15 allocation, the beta hedge comprised approximately 60% of the Fund’s credit risk, reflecting our desire to lock in recent market outperformance and isolate the alpha within these positions.
We maintain a modestly bearish global outlook on interest-rate risk, a positive view on the U.S. dollar and a neutral position on credit. We still think that there will be an ongoing late-cycle hawkish shift in global central banks’ monetary policy, though we see this as remaining tentative and idiosyncratic16 across different regions. We believe that this will be challenging for risk assets with valuations that have been supported by low interest rates and growing or stable central bank balance sheets. However, we also think the market will focus increasingly on the possibility that stretched valuations collapse or are dislodged by an external shock other than central bank policy tightening, and this adds to our caution in taking directional risk.
We anticipate that a focus on current low inflation levels will continue to have some impact on policy in the short term, but we do not feel that unexpectedly low inflation will continue for long. We believe that global central banks will increasingly focus on the longer-term impact of their policies on economic strength (and therefore,
| 6 | A yield-curve flattening trade comprises a strategy that seeks to benefit from decreasing yield differences that occur as a result of the narrowing of the yield curve between two U.S. Treasury securities of different maturities. |
| 7 | Duration is an estimate of bond price sensitivity to changes in interest rates. The higher the duration, the greater the change (i.e., higher risk) in relation to interest-rate movements. |
| 8 | In a currency peg, a currency’s value is fixed against either the value of another single currency or to a basket of other currencies. |
| 9 | A credit default swap is a contract that transfers the credit exposure of fixed-income products between two or more parties. |
| 10 | A foreign exchange forward is a binding contract in the foreign exchange market that locks in the exchange rate for the purchase or sale of a currency on a future date. |
| 11 | The capital structure is the composition of a company’s capital in terms of equity (common and preferred stock), debt (including bonds and loans) and hybrid securities (i.e., convertible debt and preferred shares). |
| 12 | Subordinated debt comprises loans or securities that rank below other loans and securities with regard to claims on a company’s assets or earnings. |
| 13 | Beta is a measure of the volatility of a security in comparison to a benchmark index. |
| 14 | Standard & Poor’s credit ratings express the agency’s opinion about the ability and willingness of an issuer, such as a corporation or state or city government, to meet its financial obligations in full and on time. Typically, ratings are expressed as letter grades that range, for example, from “AAA” to “D” to communicate the agency’s opinion of relative level of credit risk. Ratings from “AA” to “CCC” may be modified by the addition of a plus (+) or minus (-) sign to show relative standing within the major rating categories. |
| 15 | Alpha is a measure of performance that takes the volatility of a mutual fund and compares its risk-adjusted performance to a benchmark index. |
| 16 | Idiosyncratic risk reflects the possibility that the price of an asset may decline due to an event that could specifically affect that asset but not the overall market. |
| 2017 Annual Report | 19 |
Aberdeen Global Unconstrained Fixed Income Fund (Unaudited) (concluded)
price stability) now that unemployment rates are falling to pre-global financial crisis levels.
While we recognize that risks in Europe have diminished marginally with the election of Emmanuel Macron as French president, we think the structural flaws and internal divergence remain threats in the medium term, and that the current “Europhoria” is overdone. We anticipate further periods of political turbulence, with a focus on Italy and its 2018 election. Disappointments stemming from Macron’s program amid a collapse in his popularity ratings also may lead to repricing in peripheral Europe credit spreads. Investors remain focused on China and its attempts to reduce credit growth while maintaining financial stability.
We have maintained the Fund’s positioning in an effort to benefit from corporate spread carry17 and what we view as the attractive roll18 of shorter-dated bonds. Although investment-grade credit markets rallied significantly for the first 10 months of 2017, we feel that there appears to be good reason to retain the Fund’s modestly risk-on positioning for the short term. Tighter valuations mean that it is prudent to reduce risk despite the improving fundamental backdrop. Corporate leverage is not excessive and, combined with an improving global economic outlook, suggests that defaults should remain low. We believe that the greatest risk to credit markets presently appears to be from the major central banks and their management of monetary policy.
Portfolio Management:
Aberdeen Global Fixed Income Team
PAST PERFORMANCE DOES NOT GUARANTEE FUTURE RESULTS.
The performance data quoted represents past performance and current returns may be lower or higher. Class A Shares have up to a 4.25% front-end sales charge and a 0.25% 12b-1 fee. The investment return and principal value will fluctuate so that an investor’s shares, when redeemed, may be worth more or less than the original cost. To obtain performance information current to the most recent month-end, which may be higher or lower than the performance shown above, please call 866-667-9231 or go to www.aberdeen-asset.us.
Investing in mutual funds involves risk, including the possible loss of principal.
Indexes are unmanaged and have been provided for comparison purposes only. No fees or expenses are reflected. You cannot invest directly in an index.
Lipper is a leading global provider of mutual fund information and analysis to fund companies, financial intermediaries and media organizations.
Risk Considerations
Fixed income securities are subject to certain risks including, but not limited to: interest rate (changes in interest rates may cause a decline in the market value of an investment), credit (changes in the financial condition of the issuer, borrower, counterparty, or underlying collateral), prepayment (debt issuers may repay or refinance their loans or obligations earlier than anticipated), and extension (principal repayments may not occur as quickly as anticipated, causing the expected maturity of a security to increase).
Foreign securities may be more volatile, harder to price and less liquid than U.S. securities. They are subject to different accounting and regulatory standards, currency exchange rates, and political and economic risks. Fluctuation in currency exchange rates may impact the Fund’s returns more greatly to the extent the Fund does not hedge currency exposure or hedging techniques are unsuccessful. The foregoing risks are enhanced in emerging market countries.
Derivatives are speculative and may hurt the Fund’s performance. They present the risk of disproportionately increased losses and/or reduced gains when the financial asset or measure to which the derivative is linked changes in unexpected ways.
Investing a significant portion of the Fund’s assets in securities of companies conducting business in a broadly related group of industries within an economic sector may make the Fund more vulnerable to unfavorable developments in that sector.
Please read the prospectus for more detailed information regarding these and other risks.
| 17 | Spread carry is a strategy in which traders borrow a currency that has a low interest rate and use the funds to buy a different currency that is paying a higher interest rate. |
| 18 | A roll is the return that a bond provides when its value converges to par as it approaches its maturity date. |
| 20 | Annual Report 2017 |
Aberdeen Global Unconstrained Fixed Income Fund (Unaudited)
| Average Annual Total Return1 (For periods ended October 31, 2017) | 1 Yr. | 5 Yr. | 10 Yr. | |||||||||||
Class A | w/o SC | 1.53% | 0.23% | 2.76% | ||||||||||
| w/SC2 | -2.77% | -0.63% | 2.31% | |||||||||||
Class C | w/o SC | 0.75% | -0.51% | 2.00% | ||||||||||
| w/SC3 | -0.25% | -0.51% | 2.00% | |||||||||||
Institutional Service Class4,5 | w/o SC | 1.62% | 0.34% | 2.92% | ||||||||||
Institutional Class4,6 | w/o SC | 1.81% | 0.50% | 3.04% | ||||||||||
All figures showing the effect of a sales charge (SC) reflect the maximum charge possible because it has the most significant effect on performance data. The total returns shown above do not include the impact of financial statement rounding of the net asset value (NAV) per share and/or financial statement adjustments.
| 1 | The Fund changed its investment objective and strategies effective August 15, 2016. Performance information for periods prior to August 15, 2016 does not reflect the current investment strategy. Returns presented for the Fund prior to July 20, 2009 reflect the performance of the predecessor fund (the “Predecessor Fund”). Returns of the Predecessor Fund have not been adjusted to reflect the expenses applicable to the respective classes. The investment objective and strategies of the Fund, prior to the changes noted above, and those of the Predecessor Fund were substantially similar. Please consult the Fund’s prospectus for more detail. |
| 2 | A 4.25% front-end sales charge was deducted. |
| 3 | A 1.00% contingent deferred sales charge (CDSC) was deducted from the one year return because it is charged when Class C shares are sold within the first year after purchase. |
| 4 | Not subject to any sales charges. |
| 5 | Returns before the first offering of the Institutional Service Class shares (July 20, 2009) are based on the previous performance of Common Class shares of the Predecessor Fund. Excluding the effect of any fee waivers or reimbursements, this performance is substantially similar to what Institutional Service Class shares would have produced because both classes invest in the same portfolio of securities. Returns would only differ to the extent of the differences in expenses between the two classes. |
| 6 | Returns before the first offering of the Institutional Class shares (July 20, 2009) are based on the previous performance of the Common Class shares of the Predecessor Fund. Excluding the effect of any fee waivers or reimbursements, this performance is substantially similar to what Institutional Class shares would have produced because both classes invest in the same portfolio of securities. Returns would only differ to the extent of the differences in expenses between the two classes. |
Performance of a $1,000,000 Investment* (as of October 31, 2017)
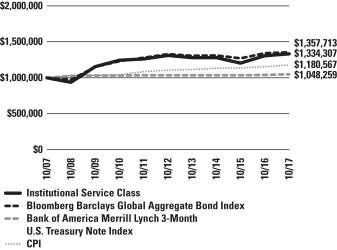
| * | Minimum Initial Investment |
Comparative performance of $1,000,000 invested in Institutional Service Class shares of the Aberdeen Global Unconstrained Fixed Income Fund, the Bank of America Merrill Lynch 3-Month U.S. Treasury Note Index and the Consumer Price Index (CPI) over a 10-year period ended October 31, 2017. Unlike the Fund, the returns for these unmanaged indexes do not reflect any fees, expenses, or sales charges. Investors cannot invest directly in market indexes.
Effective August 15, 2016, the Bank of America Merill Lynch 3-Month U.S. Treasury Note Index replaced the Bloomberg Barclays Global Aggregate Bond Index as the Fund’s benchmark index in connection with the change to the Fund’s investment objective and strategy. The Bloomberg Barclays Global Aggregate Bond Index is a broad-based index that measures the global investment grade fixed-rate debt markets inclusive of three major components: U.S. Aggregate Bond Index, the Pan-European Aggregate Index, and the Asian-Pacific Aggregate Index.
The CPI is a measure of the average change over time in the prices paid by urban consumers for a market basket of consumer goods and services.
Investment return and principal value will fluctuate, and when redeemed, shares may be worth more or less than original cost. Past performance is no guarantee of future results. The Average Annual Total Return table and Performance graph do not reflect the deduction of taxes that a shareholder would pay on fund distributions or the redemption of fund shares. Investing in mutual funds involves market risk, including loss of principal. Performance returns assume the reinvestment of all distributions. Total returns reflect waivers and reimbursements in effect, without which returns would have been lower.
| 2017 Annual Report | 21 |
Aberdeen Global Unconstrained Fixed Income Fund (Unaudited) (concluded)
Portfolio Summary (as a percentage of net assets)
October 31, 2017 (Unaudited)
| Asset Allocation | ||||
Corporate Bonds | 86.4% | |||
Short-Term Investment | 4.8% | |||
Government Bonds | 4.5% | |||
Commercial Mortgage-Backed Securities | 0.9% | |||
Residential Mortgage-Backed Securities | 0.2% | |||
Other Assets in Excess of Liabilities | 3.2% | |||
| 100.0% | ||||
The following chart summarizes the composition of the Fund’s portfolio, expressed as a percentage of net assets. The industries listed below may include more than one industry group. As of October 31, 2017, the Fund did not have more than 25% of its assets invested in any industry group.
| Top Industries | ||||
Commercial Banks | 21.8% | |||
Diversified Telecommunication Services | 8.5% | |||
Oil, Gas & Consumable Fuels | 6.6% | |||
Auto Manufacturers | 5.9% | |||
Food Products | 4.7% | |||
Insurance | 4.4% | |||
Media | 4.2% | |||
Metals & Mining | 3.2% | |||
Computers & Peripherals | 2.9% | |||
Electric Utilities | 2.7% | |||
Other | 35.1% | |||
| 100.0% | ||||
| Top Holdings* | ||||
National Australia Bank Ltd. 03/16/2021 | 1.9% | |||
Industrial & Commercial Bank of China Ltd. 10/20/2021 | 1.9% | |||
Ford Motor Credit Co. LLC 02/01/2021 | 1.7% | |||
Altice Luxembourg SA 05/15/2022 | 1.6% | |||
Marfrig Holdings Europe BV 06/24/2019 | 1.6% | |||
HSBC Holdings PLC 03/13/2023 | 1.5% | |||
ING Groep NV, 3-month LIBOR + 1.150% 03/29/2022 | 1.5% | |||
Turkey Government International Bond 04/03/2018 | 1.5% | |||
Wind Acquisition Finance SA 07/15/2020 | 1.5% | |||
Societe Generale SA 09/04/2019 | 1.5% | |||
Other | 83.8% | |||
| 100.0% | ||||
| * | For the purpose of listing top holdings, Short-Term Investments are included as part of Other. |
| Top Countries | ||||
United States | 41.6% | |||
United Kingdom | 12.3% | |||
Netherlands | 8.3% | |||
Germany | 3.5% | |||
Australia | 2.9% | |||
France | 2.7% | |||
Italy | 2.5% | |||
India | 2.5% | |||
Sweden | 2.4% | |||
Other | 21.3% | |||
| 100.0% | ||||
| 22 | Annual Report 2017 |
Statement of Investments
October 31, 2017
Aberdeen Global Unconstrained Fixed Income Fund
| Shares or Principal Amount | Value (US$) | |||||||
COMMERCIAL MORTGAGE-BACKED SECURITIES (0.9%) |
| |||||||
UNITED STATES (0.9%) | ||||||||
SFAVE Commercial Mortgage Securities Trust, Series 2015-5AVE, Class D (USD), 4.39%, 01/05/2043 (a)(b) | $ | 138,000 | $ | 113,852 | ||||
Total Commercial Mortgage-Backed Securities | 113,852 | |||||||
RESIDENTIAL MORTGAGE-BACKED SECURITIES (0.2%) |
| |||||||
UNITED STATES (0.2%) | ||||||||
BCAP LLC Trust, Series 2009-RR6, Class 3A1 (USD), 3.52%, 12/26/2037 (a)(b) | 14,299 | 14,282 | ||||||
JP Morgan Resecuritization Trust, Series 2009-7, Class 2A1 (USD), 6.00%, 02/27/2037 (a)(b) | 5,199 | 5,226 | ||||||
| 19,508 | ||||||||
Total Residential Mortgage-Backed Securities | 19,508 | |||||||
CORPORATE BONDS (86.4%) | ||||||||
AUSTRALIA (2.9%) | ||||||||
Commercial Banks (1.9%) | ||||||||
National Australia Bank Ltd. (USD), 2.25%, 03/16/2021 (a) | 250,000 | 249,502 | ||||||
Metals & Mining (1.0%) | ||||||||
BHP Billiton Finance Ltd. (EUR), 4.75%, 04/22/2076 (a) | 100,000 | 131,554 | ||||||
| 381,056 | ||||||||
BRAZIL (2.1%) | ||||||||
Food Products (1.6%) | ||||||||
Marfrig Holdings Europe BV (USD), 6.88%, 06/24/2019 (a) | 200,000 | 206,750 | ||||||
Oil, Gas & Consumable Fuels (0.5%) | ||||||||
Petrobras Global Finance BV (USD), 5.30%, 01/27/2025 (a) | 68,000 | 68,221 | ||||||
| 274,971 | ||||||||
CANADA (2.2%) | ||||||||
Metals & Mining (1.2%) | ||||||||
Glencore Canada Financial Corp. (GBP), 7.38%, 05/27/2020 (a) | 100,000 | 152,239 | ||||||
Oil, Gas & Consumable Fuels (1.0%) | ||||||||
Cenovus Energy, Inc. | ||||||||
(USD), 3.00%, 08/15/2022 | 80,000 | 79,178 | ||||||
(USD), 4.25%, 04/15/2027 (a) | 57,000 | 57,194 | ||||||
| 136,372 | ||||||||
| 288,611 | ||||||||
CHINA (1.8%) | ||||||||
Commercial Banks (1.8%) | ||||||||
Industrial & Commercial Bank of China Ltd. (USD), 2.45%, 10/20/2021 | 250,000 | 246,928 | ||||||
FRANCE (2.7%) | ||||||||
Commercial Banks (1.5%) | ||||||||
Societe Generale SA (EUR), 9.38%, 09/04/2019 (a)(c) | 150,000 | 202,355 | ||||||
Insurance (1.2%) | ||||||||
CNP Assurances (GBP), 7.38%, 09/30/2041 (a) | 100,000 | 157,482 | ||||||
| 359,837 | ||||||||
GERMANY (3.5%) | ||||||||
Auto Manufacturers (1.2%) | ||||||||
Daimler Finance North America LLC (USD), 3-month LIBOR + 0.620%, | 160,000 | 160,966 | ||||||
Diversified Telecommunication Services (1.3%) | ||||||||
Deutsche Telekom International Finance BV (USD), 2.82%, 01/19/2022 (a) | 170,000 | 171,085 | ||||||
Insurance (1.0%) | ||||||||
Muenchener Rueckversicherungs-Gesellschaft AG in Muenchen (GBP), 7.63%, 06/21/2028 | 100,000 | 138,027 | ||||||
| 470,078 | ||||||||
HONG KONG (0.9%) | ||||||||
Holding Companies-Diversified Operations (0.9%) |
| |||||||
Hutchison Whampoa Europe Finance 13 Ltd. (EUR), 3.75%, 05/10/2018 (a)(c) | 100,000 | 118,393 | ||||||
INDIA (2.5%) | ||||||||
Commercial Banks (1.5%) | ||||||||
Export-Import Bank of India (USD), 2.75%, 04/01/2020 (a) | 200,000 | 201,026 | ||||||
Diversified Telecommunication Services (1.0%) | ||||||||
Bharti Airtel International Netherlands BV (EUR), 3.38%, 05/20/2021 (a) | 100,000 | 126,209 | ||||||
| 327,235 | ||||||||
ITALY (2.5%) | ||||||||
Commercial Banks (1.0%) | ||||||||
Intesa Sanpaolo SpA (USD), 6.50%, 02/24/2021 (a) | 120,000 | 133,629 | ||||||
Diversified Telecommunication Services (1.5%) | ||||||||
Wind Acquisition Finance SA (USD), 4.75%, 07/15/2020 (a) | 200,000 | 202,380 | ||||||
| 336,009 | ||||||||
KUWAIT (1.5%) | ||||||||
Chemicals (1.5%) | ||||||||
Equate Petrochemical BV (USD), 3.00%, 03/03/2022 (a) | 200,000 | 197,800 | ||||||
LUXEMBOURG (1.6%) | ||||||||
Media (1.6%) | ||||||||
Altice Luxembourg SA (USD), 7.75%, 05/15/2022 (a) | 200,000 | 211,750 | ||||||
MEXICO (1.5%) | ||||||||
Diversified Telecommunication Services (0.9%) | ||||||||
America Movil SAB de CV, Series A (EUR), 5.13%, 09/06/2073 (a) | 100,000 | 121,107 | ||||||
See accompanying Notes to Financial Statements.
| 2017 Annual Report | 23 |
Statement of Investments (continued)
October 31, 2017
Aberdeen Global Unconstrained Fixed Income Fund
| Shares or Principal Amount | Value (US$) | |||||||
Oil, Gas & Consumable Fuels (0.6%) | ||||||||
Petroleos Mexicanos (USD), 3-month LIBOR + 3.650%, 4.97%, 03/11/2022 (a)(b) | $ | 78,000 | $ | 85,020 | ||||
| 206,127 | ||||||||
NETHERLANDS (8.3%) | ||||||||
Auto Manufacturers (1.0%) | ||||||||
Volkswagen International Finance NV (EUR), 3.88%, 09/04/2018 (a)(c) | 110,000 | 131,839 | ||||||
Commercial Banks (4.5%) | ||||||||
Cooperatieve Rabobank UA | ||||||||
(USD), 11.00%, 06/30/2019 (a)(c) | 140,000 | 158,900 | ||||||
(AUD), 4.25%, 10/13/2021 (a) | 100,000 | 80,384 | ||||||
ING Bank NV (GBP), 6.88%, 05/29/2023 (a) | 115,000 | 157,585 | ||||||
ING Groep NV (USD), 3-month LIBOR + 1.150%, 2.48%, 03/29/2022 (b) | 200,000 | 204,183 | ||||||
| 601,052 | ||||||||
Diversified Telecommunication Services (0.9%) | ||||||||
Koninklijke KPN NV (EUR), 6.13%, 09/14/2018 (a)(c) | 100,000 | 122,018 | ||||||
Real Estate (1.9%) | ||||||||
ATF Netherlands BV (EUR), 1.50%, 05/03/2022 (a) | 100,000 | 121,280 | ||||||
Vonovia Finance BV (EUR), 4.00%, 12/17/2021 (a)(c) | 100,000 | 128,526 | ||||||
| 249,806 | ||||||||
| 1,104,715 | ||||||||
REPUBLIC OF SOUTH KOREA (0.5%) | ||||||||
Commercial Banks (0.5%) | ||||||||
Export-Import Bank of Korea (AUD), 4.25%, 05/21/2020 (a) | 80,000 | 62,888 | ||||||
RUSSIA (2.3%) | ||||||||
Oil, Gas & Consumable Fuels (2.3%) | ||||||||
Gazprom OAO Via Gaz Capital SA (USD), 8.15%, 04/11/2018 (a) | 100,000 | 102,537 | ||||||
Lukoil International Finance BV (USD), 3.42%, 04/24/2018 (a) | 200,000 | 200,806 | ||||||
| 303,343 | ||||||||
SWEDEN (0.9%) | ||||||||
Auto Manufacturers (0.9%) | ||||||||
Volvo Treasury AB (EUR), 4.20%, 06/10/2075 (a) | 100,000 | 125,804 | ||||||
SWITZERLAND (0.7%) | ||||||||
Insurance (0.7%) | ||||||||
Zurich Finance UK PLC (GBP), 6.63%, 10/02/2022 (c) | 57,000 | 89,809 | ||||||
UNITED KINGDOM (12.3%) | ||||||||
Auto Manufacturers (1.1%) | ||||||||
Jaguar Land Rover Automotive PLC (USD), 5.63%, 02/01/2023 (a) | 150,000 | 154,500 | ||||||
Commercial Banks (4.5%) | ||||||||
Barclays PLC (EUR), 2.63%, 11/11/2025 (a) | 100,000 | 121,298 | ||||||
HBOS Capital Funding LP (GBP), 6.46%, 11/30/2018 (a)(c) | 50,000 | 69,553 | ||||||
HSBC Holdings PLC (USD), 3.26%, 03/13/2023 | 200,000 | 204,401 | ||||||
Standard Chartered PLC (USD), 2.10%, 08/19/2019 (a) | 200,000 | 199,447 | ||||||
| 594,699 | ||||||||
Electric Utilities (1.0%) | ||||||||
SSE PLC (GBP), 3.88%, 09/10/2020 (a)(c) | 100,000 | 137,601 | ||||||
Food Products (1.1%) | ||||||||
Tesco PLC (GBP), 5.50%, 12/13/2019 | 100,000 | 144,660 | ||||||
Household Products/Wares (1.5%) | ||||||||
Reckitt Benckiser Treasury Services PLC (USD), 3-month LIBOR + 0.560%, 1.89%, 06/24/2022 (a)(b) | 200,000 | 200,636 | ||||||
Insurance (1.1%) | ||||||||
Aviva PLC (GBP), 6.88%, 11/21/2019 (c) | 40,000 | 58,173 | ||||||
Legal & General Group PLC (GBP), 10.00%, 07/23/2041 (a) | 50,000 | 84,755 | ||||||
| 142,928 | ||||||||
Metals & Mining (1.0%) | ||||||||
Anglo American Capital PLC (EUR), 3.50%, 03/28/2022 (a) | 100,000 | 130,457 | ||||||
Oil, Gas & Consumable Fuels (1.0%) | ||||||||
BG Energy Capital PLC (GBP), 6.50%, 11/30/2072 (a) | 100,000 | 133,309 | ||||||
| 1,638,790 | ||||||||
UNITED STATES (35.7%) | ||||||||
Auto Manufacturers (1.7%) | ||||||||
Ford Motor Credit Co. LLC (USD), 5.75%, 02/01/2021 | 200,000 | 220,128 | ||||||
Chemicals (1.2%) | ||||||||
Sherwin-Williams Co. (The) (USD), 2.25%, 05/15/2020 | 160,000 | 160,379 | ||||||
Commercial Banks (6.1%) | ||||||||
Bank of America Corp., 3-month LIBOR + 1.180% (USD), 2.54%, 10/21/2022 (b) | 140,000 | 142,784 | ||||||
Capital One Financial Corp. (USD), 2.50%, 05/12/2020 | 70,000 | 70,254 | ||||||
Citigroup, Inc., Series MPLE (CAD), 3.39%, 11/18/2021 | 100,000 | 80,154 | ||||||
Goldman Sachs Group, Inc. (The) (USD), 3-month LIBOR + 1.170%, 2.49%, 11/15/2021 (b) | 140,000 | 142,051 | ||||||
JPMorgan Chase & Co. Series V (USD), 5.00%, 07/01/2019 (c) | 60,000 | 61,858 | ||||||
(USD), 2.78%, 04/25/2023 | 160,000 | 160,567 | ||||||
Morgan Stanley (USD), 3-month LIBOR + 1.400%, 2.76%, 10/24/2023 (b) | 150,000 | 154,215 | ||||||
| 811,883 | ||||||||
See accompanying Notes to Financial Statements.
| 24 | Annual Report 2017 |
Statement of Investments (continued)
October 31, 2017
Aberdeen Global Unconstrained Fixed Income Fund
| Shares or Principal Amount | Value (US$) | |||||||
Computers & Peripherals (2.9%) | ||||||||
Apple, Inc., 3-month LIBOR + 0.500% (USD), 1.81%, 02/09/2022 (b) | $ | 170,000 | $ | 172,138 | ||||
Dell International LLC / EMC Corp. (USD), 3.48%, 06/01/2019 (a) | 130,000 | 132,332 | ||||||
EMC Corp. (USD), 1.88%, 06/01/2018 | 80,000 | 79,798 | ||||||
| 384,268 | ||||||||
Diversified Financial Services (1.6%) | ||||||||
AIG Global Funding (USD), 2.15%, 07/02/2020 (a) | 31,000 | 30,983 | ||||||
American Express Credit Corp. (USD), 3-month LIBOR + 0.570%, 1.95%, 10/30/2019 (b) | 150,000 | 150,968 | ||||||
HSBC Finance Corp. (USD), 6.68%, 01/15/2021 | 29,000 | 32,615 | ||||||
| 214,566 | ||||||||
Diversified Telecommunication Services (2.9%) |
| |||||||
AT&T, Inc. | ||||||||
(USD), 3.20%, 03/01/2022 | 100,000 | 101,742 | ||||||
(EUR), 0.52%, 09/04/2023(b) | 100,000 | 119,784 | ||||||
Verizon Communications, Inc. (USD), 3-month LIBOR + 1.000%, 2.32%, 03/16/2022 (b) | 159,000 | 162,314 | ||||||
| 383,840 | ||||||||
Electric Utilities (1.7%) | ||||||||
Dominion Energy, Inc. (USD), 2.96%, 07/01/2019 (d) | 155,000 | 157,077 | ||||||
Exelon Corp. (USD), 3.50%, 06/01/2022 | 69,000 | 71,014 | ||||||
| 228,091 | ||||||||
Energy Equipment & Services (1.5%) | ||||||||
Energy Transfer LP (USD), 5.20%, 02/01/2022 | 50,000 | 54,300 | ||||||
Kinder Morgan Energy Partners LP (USD), 3.50%, 03/01/2021 | 22,000 | 22,632 | ||||||
MPLX LP (USD), 4.50%, 07/15/2023 | 55,000 | 58,800 | ||||||
Sabine Pass Liquefaction LLC | ||||||||
(USD), 5.63%, 03/01/2025 | 25,000 | 27,779 | ||||||
(USD), 4.20%, 03/15/2028 | 37,000 | 37,742 | ||||||
| 201,253 | ||||||||
Food Products (2.0%) | ||||||||
General Mills, Inc. (USD), 2.60%, 10/12/2022 | 58,000 | 57,908 | ||||||
Kraft Heinz Foods Co., FRN (USD), 3-month LIBOR + 0.570%, 1.88%, 02/10/2021 (b) | 140,000 | 140,221 | ||||||
Kroger Co. (The) (USD), 1.50%, 09/30/2019 | 75,000 | 74,198 | ||||||
| 272,327 | ||||||||
Insurance (0.4%) | ||||||||
American International Group, Inc. (USD), 4.13%, 02/15/2024 | 50,000 | 53,182 | ||||||
Internet (1.4%) | ||||||||
eBay, Inc. (USD), 3-month LIBOR + 0.870%, 2.25%, 01/30/2023 (b) | 180,000 | 181,176 | ||||||
Machinery-Construction & Mining (1.1%) | ||||||||
Caterpillar Financial Services Corp. (USD), 3-month LIBOR + 0.180%, 1.50%, 12/06/2018 (b) | 140,000 | 140,084 | ||||||
Media (2.6%) | ||||||||
CBS Corp. (USD), 2.30%, 08/15/2019 | 80,000 | 80,501 | ||||||
Time Warner, Inc. (USD), 4.75%, 03/29/2021 | 100,000 | 107,196 | ||||||
Walt Disney Co. (The) | ||||||||
Series MPLE (CAD), 2.76%, 10/07/2024 | 170,000 | 133,420 | ||||||
(USD), 7.55%, 07/15/2093 | 25,000 | 30,425 | ||||||
| 351,542 | ||||||||
Oil & Gas Services (0.8%) | ||||||||
Halliburton Co. (USD), 3.50%, 08/01/2023 | 98,000 | 101,795 | ||||||
Oil, Gas & Consumable Fuels (1.2%) | ||||||||
Marathon Oil Corp. (USD), 2.80%, 11/01/2022 | 110,000 | 108,194 | ||||||
Phillips 66 (USD), 3-month LIBOR + 0.750%, 2.11%, 04/15/2020 (a)(b) | 49,000 | 49,095 | ||||||
| 157,289 | ||||||||
Pharmaceutical (2.1%) | ||||||||
Actavis, Inc. (USD), 3.25%, 10/01/2022 | 65,000 | 66,060 | ||||||
Express Scripts Holding Co. (USD), 2.25%, 06/15/2019 | 70,000 | 70,212 | ||||||
Shire Acquisitions Investments Ireland DAC (USD), 1.90%, 09/23/2019 | 140,000 | 139,441 | ||||||
| 275,713 | ||||||||
Real Estate Investment Trust (REIT) Funds (0.3%) |
| |||||||
Crown Castle International Corp. (USD), 2.25%, 09/01/2021 | 47,000 | 46,563 | ||||||
Retail (0.3%) | ||||||||
CVS Health Corp. (USD), 3.50%, 07/20/2022 | 43,000 | 44,324 | ||||||
Semiconductors (2.1%) | ||||||||
Broadcom Corp. / Broadcom Cayman Finance Ltd. (USD), 2.38%, 01/15/2020 (a) | 170,000 | 170,949 | ||||||
Intel Corp. (USD), 2.88%, 05/11/2024 | 70,000 | 70,755 | ||||||
Texas Instruments, Inc. (USD), 2.63%, 05/15/2024 | 36,000 | 36,079 | ||||||
| 277,783 | ||||||||
Transportation (1.8%) | ||||||||
Penske Truck Leasing Co. LP / PTL Finance Corp. | ||||||||
(USD), 3.38%, 02/01/2022 (a) | 150,000 | 153,804 | ||||||
(USD), 2.70%, 03/14/2023 (a) | 85,000 | 84,013 | ||||||
| 237,817 | ||||||||
| 4,744,003 | ||||||||
Total Corporate Bonds | 11,488,147 | |||||||
GOVERNMENT BONDS (4.5%) | ||||||||
SERBIA (1.5%) | ||||||||
Serbia International Bond (USD), 5.25%, 11/21/2017 (a) | 200,000 | 200,250 | ||||||
SWEDEN (1.5%) | ||||||||
Svensk Exportkredit AB (USD), 2.88%, 11/14/2023 (a) | 200,000 | 199,360 | ||||||
See accompanying Notes to Financial Statements.
| 2017 Annual Report | 25 |
Statement of Investments (continued)
October 31, 2017
Aberdeen Global Unconstrained Fixed Income Fund
| Shares or Principal Amount | Value (US$) | |||||||
TURKEY (1.5%) | ||||||||
Turkey Government International Bond (USD), 6.75%, 04/03/2018 | $ | 200,000 | $ | 203,365 | ||||
Total Government Bonds | 602,975 | |||||||
SHORT-TERM INVESTMENT (4.8%) | ||||||||
UNITED STATES (4.8%) | ||||||||
State Street Institutional U.S. Government Money Market Fund, Institutional Class, 0.96% (e) | 647,387 | 647,387 | ||||||
Total Short-Term Investment | 647,387 | |||||||
Total Investments | 12,871,869 | |||||||
Other Assets in Excess of Liabilities—3.2% | 418,695 | |||||||
Net Assets—100.0% | $ | 13,290,564 | ||||||
| (a) | Denotes a security issued under Regulation S or Rule 144A. |
| (b) | Variable or Floating Rate Security. Rate disclosed is as of October 31, 2017. |
| (c) | Perpetual bond. This is a bond that has no maturity date, is redeemable and pays a steady stream of interest indefinitely. The maturity date presented for these instruments represents the next call/put date. |
| (d) | Indicates a stepped coupon bond. This bond was issued with a low coupon that gradually increases over the life of the bond. |
| (e) | Registered investment company advised by State Street Global Advisors. The rate shown is the current yield as of October 31, 2017. |
| (f) | See accompanying Notes to Financial Statements for tax unrealized appreciation/(depreciation) of securities. |
| AUD | Australian Dollar |
| BRL | Brazilian Real |
| CAD | Canadian Dollar |
| CHF | Swiss Franc |
| CNY | Chinese Yuan Renminbi |
| CZK | Czech Koruna |
| EUR | Euro Currency |
| GBP | British Pound Sterling |
| HUF | Hungarian Forint |
| JPY | Japanese Yen |
| MXN | Mexican Peso |
| NZD | New Zealand Dollar |
| PLC | Public Limited Company |
| PLN | Polish Zloty |
| RUB | New Russian Ruble |
| SEK | Swedish Krona |
| USD | U.S. Dollar |
At October 31, 2017, the Fund held the following futures contracts:
| Futures Contracts | Number of Contracts Long/(Short) | Expiration Date | Notional Amount | Market Value | Unrealized Appreciation/ (Depreciation) | |||||||||||||||
| LONG CONTRACT POSITIONS | ||||||||||||||||||||
Australian Treasury Bond 6%-10 year | 3 | 12/15/2017 | $ | 292,046 | $ | 295,853 | $ | 3,807 | ||||||||||||
Euro Bund Futures | 4 | 12/07/2017 | 751,262 | 758,317 | 7,055 | |||||||||||||||
Euro BUXL Futures-30 year | 3 | 12/07/2017 | 573,246 | 580,515 | 7,269 | |||||||||||||||
United States Treasury Note 6%-2 year | 1 | 12/29/2017 | 216,283 | 215,359 | (924 | ) | ||||||||||||||
| $ | 17,207 | |||||||||||||||||||
| SHORT CONTRACT POSITIONS | ||||||||||||||||||||
Canadian Government Bond-10 year | (1 | ) | 12/18/2017 | $ | (105,199 | ) | $ | (106,527 | ) | $ | (1,328 | ) | ||||||||
Euro Bobl Futures | (2 | ) | 12/07/2017 | (306,446 | ) | (307,008 | ) | (562 | ) | |||||||||||
Euro BTP Futures | (4 | ) | 12/07/2017 | (632,040 | ) | (650,405 | ) | (18,365 | ) | |||||||||||
Euro OAT Futures | (7 | ) | 12/07/2017 | (1,271,677 | ) | (1,283,920 | ) | (12,243 | ) | |||||||||||
Euro Schatz Futures | (9 | ) | 12/07/2017 | (1,175,958 | ) | (1,176,946 | ) | (988 | ) | |||||||||||
Japan Government 10 Year Bond Mini Futures | (4 | ) | 12/12/2017 | (531,572 | ) | (529,405 | ) | 2,167 | ||||||||||||
Long Gilt Futures | (2 | ) | 12/27/2017 | (337,134 | ) | (330,258 | ) | 6,876 | ||||||||||||
United States Treasury Note 6%-10 year | (4 | ) | 12/19/2017 | (504,296 | ) | (499,750 | ) | 4,546 | ||||||||||||
United States Treasury Note 6%-2 year | (4 | ) | 12/29/2017 | (864,930 | ) | (861,437 | ) | 3,492 | ||||||||||||
United States Treasury Note 6%-5 year | (30 | ) | 12/29/2017 | (3,548,203 | ) | (3,515,625 | ) | 32,578 | ||||||||||||
United States Treasury Note 6%-Ultra Long | (4 | ) | 12/19/2017 | (540,241 | ) | (535,688 | ) | 4,553 | ||||||||||||
| $ | 20,726 | |||||||||||||||||||
| $ | 37,933 | |||||||||||||||||||
See accompanying Notes to Financial Statements.
| 26 | Annual Report 2017 |
Statement of Investments (continued)
October 31, 2017
Aberdeen Global Unconstrained Fixed Income Fund
At October 31, 2017, the Fund’s open forward foreign currency exchange contracts were as follows:
| Purchase Contracts Settlement Date* | Counterparty | Amount | Amount | Fair Value | Unrealized Appreciation/ (Depreciation) | |||||||||||||||||||||||
| Australian Dollar/United States Dollar 11/22/2017 | Morgan Stanley | AUD | 12,000 | USD | 9,352 | $ | 9,182 | $ | (170 | ) | ||||||||||||||||||
| 11/22/2017 | UBS | AUD | 322,000 | USD | 254,996 | 246,391 | (8,605 | ) | ||||||||||||||||||||
| British Pound/United States Dollar 11/16/2017 | Royal Bank of Canada | GBP | 161,000 | USD | 208,274 | 213,914 | 5,640 | |||||||||||||||||||||
| 11/22/2017 | Citibank | GBP | 426,000 | USD | 564,105 | 566,100 | 1,995 | |||||||||||||||||||||
| 11/22/2017 | Morgan Stanley | GBP | 7,000 | USD | 9,135 | 9,302 | 167 | |||||||||||||||||||||
| 11/22/2017 | UBS | GBP | 18,000 | USD | 24,365 | 23,920 | (445 | ) | ||||||||||||||||||||
| 01/10/2018 | UBS | GBP | 219,000 | USD | 289,390 | 291,509 | 2,119 | |||||||||||||||||||||
| Canadian Dollar/United States Dollar 11/22/2017 | JPMorgan Chase | CAD | 45,000 | USD | 36,908 | 34,888 | (2,020 | ) | ||||||||||||||||||||
| 11/22/2017 | Morgan Stanley | CAD | 111,000 | USD | 90,417 | 86,056 | (4,361 | ) | ||||||||||||||||||||
| 11/22/2017 | UBS | CAD | 11,000 | USD | 8,675 | 8,528 | (147 | ) | ||||||||||||||||||||
| Chinese Yuan Renminbi/United States Dollar 11/22/2017 | UBS | CNY | 178,000 | USD | 27,138 | 26,829 | (309 | ) | ||||||||||||||||||||
| Czech Koruna/United States Dollar 11/22/2017 | Citibank | CZK | 6,734,000 | USD | 304,572 | 305,988 | 1,416 | |||||||||||||||||||||
| Euro/United States Dollar 11/22/2017 | Barclays Bank | EUR | 229,000 | USD | 269,641 | 267,024 | (2,617 | ) | ||||||||||||||||||||
| 11/22/2017 | Citibank | EUR | 114,000 | USD | 134,066 | 132,929 | (1,137 | ) | ||||||||||||||||||||
| Hungarian Forint/United States Dollar 11/22/2017 | JPMorgan Chase | HUF | 10,631,000 | USD | 41,342 | 39,803 | (1,539 | ) | ||||||||||||||||||||
| Japanese Yen/United States Dollar 11/22/2017 | Citibank | JPY | 29,370,000 | USD | 274,395 | 258,515 | (15,880 | ) | ||||||||||||||||||||
| Mexican Peso/United States Dollar 11/22/2017 | Royal Bank of Canada | MXN | 1,300,000 | USD | 68,790 | 67,582 | (1,208 | ) | ||||||||||||||||||||
| New Russian Ruble/United States Dollar 11/22/2017 | Barclays Bank | RUB | 12,806,000 | USD | 209,780 | 218,288 | 8,508 | |||||||||||||||||||||
| New Zealand Dollar/United States Dollar 11/22/2017 | UBS | NZD | 24,663 | USD | 17,776 | 16,870 | (906 | ) | ||||||||||||||||||||
| Polish Zloty/United States Dollar 11/22/2017 | Citibank | PLN | 532,000 | USD | 146,075 | 146,156 | 81 | |||||||||||||||||||||
| Swedish Krona/United States Dollar 11/22/2017 | Royal Bank of Canada | SEK | 3,045,000 | USD | 379,028 | 364,121 | (14,907 | ) | ||||||||||||||||||||
| 01/10/2018 | UBS | SEK | 146,000 | USD | 18,030 | 17,519 | (511 | ) | ||||||||||||||||||||
| Swiss Franc/United States Dollar 11/22/2017 | UBS | CHF | 210,000 | USD | 216,985 | 210,762 | (6,223 | ) | ||||||||||||||||||||
| $ | 3,562,176 | $ | (41,059 | ) | ||||||||||||||||||||||||
See accompanying Notes to Financial Statements.
| 2017 Annual Report | 27 |
Statement of Investments (continued)
October 31, 2017
Aberdeen Global Unconstrained Fixed Income Fund
| Sale Contracts Settlement Date* | Counterparty | Amount | Amount Sold | Fair Value | Unrealized Appreciation/ (Depreciation) | |||||||||||||||||||||||
| United States Dollar/Australian Dollar 11/16/2017 | UBS | USD | 209,348 | AUD | 263,809 | $ | 201,877 | $ | 7,471 | |||||||||||||||||||
| 11/22/2017 | Royal Bank of Canada | USD | 8,605 | AUD | 11,000 | 8,417 | 188 | |||||||||||||||||||||
| 11/22/2017 | UBS | USD | 704,950 | AUD | 901,000 | 689,437 | 15,513 | |||||||||||||||||||||
| 01/08/2018 | JPMorgan Chase | USD | 13,203 | AUD | 17,000 | 13,003 | 200 | |||||||||||||||||||||
| 01/10/2018 | Barclays Bank | USD | 137,175 | AUD | 176,000 | 134,614 | 2,561 | |||||||||||||||||||||
| United States Dollar/Brazilian Real 11/22/2017 | UBS | USD | 146,332 | BRL | 475,000 | 144,839 | 1,493 | |||||||||||||||||||||
| United States Dollar/British Pound 11/22/2017 | Royal Bank of Canada | USD | 448,520 | GBP | 346,000 | 459,790 | (11,270 | ) | ||||||||||||||||||||
| 11/22/2017 | UBS | USD | 7,757 | GBP | 6,000 | 7,973 | (216 | ) | ||||||||||||||||||||
| 01/10/2018 | UBS | USD | 1,631,261 | GBP | 1,246,000 | 1,658,541 | (27,280 | ) | ||||||||||||||||||||
| United States Dollar/Canadian Dollar 11/22/2017 | Citibank | USD | 365,444 | CAD | 465,000 | 360,505 | 4,939 | |||||||||||||||||||||
| 11/22/2017 | Royal Bank of Canada | USD | 47,049 | CAD | 57,000 | 44,191 | 2,858 | |||||||||||||||||||||
| 11/22/2017 | UBS | USD | 7,400 | CAD | 9,000 | 6,978 | 422 | |||||||||||||||||||||
| 01/10/2018 | Barclays Bank | USD | 137,998 | CAD | 173,000 | 134,199 | 3,799 | |||||||||||||||||||||
| 01/10/2018 | UBS | USD | 83,474 | CAD | 105,000 | 81,450 | 2,024 | |||||||||||||||||||||
| United States Dollar/Chinese Yuan Renminbi 11/22/2017 | JPMorgan Chase | USD | 226,610 | CNY | 1,524,000 | 229,706 | (3,096 | ) | ||||||||||||||||||||
| United States Dollar/Czech Koruna 11/22/2017 | UBS | USD | 27,616 | CZK | 610,000 | 27,718 | (102 | ) | ||||||||||||||||||||
| United States Dollar/Euro 11/22/2017 | Citibank | USD | 118,459 | EUR | 100,000 | 116,604 | 1,855 | |||||||||||||||||||||
| 11/22/2017 | JPMorgan Chase | USD | �� | 274,229 | EUR | 228,000 | 265,858 | 8,371 | ||||||||||||||||||||
| 11/22/2017 | Morgan Stanley | USD | 171,060 | EUR | 145,000 | 169,076 | 1,984 | |||||||||||||||||||||
| 11/22/2017 | Royal Bank of Canada | USD | 27,113 | EUR | 23,000 | 26,819 | 294 | |||||||||||||||||||||
| 01/10/2018 | Royal Bank of Canada | USD | 1,765,060 | EUR | 1,500,000 | 1,754,409 | 10,651 | |||||||||||||||||||||
| 01/10/2018 | UBS | USD | 17,511 | EUR | 15,000 | 17,544 | (33 | ) | ||||||||||||||||||||
| United States Dollar/Hungarian Forint 11/22/2017 | Morgan Stanley | USD | 452,261 | HUF | 116,785,000 | 437,244 | 15,017 | |||||||||||||||||||||
| United States Dollar/Japanese Yen 11/22/2017 | UBS | USD | 716,963 | JPY | 78,819,000 | 693,766 | 23,197 | |||||||||||||||||||||
| United States Dollar/Mexican Peso 11/22/2017 | Royal Bank of Canada | USD | 71,952 | MXN | 1,300,000 | 67,582 | 4,370 | |||||||||||||||||||||
| United States Dollar/New Russian Ruble 11/22/2017 | Citibank | USD | 152,899 | RUB | 8,914,000 | 151,946 | 953 | |||||||||||||||||||||
| 11/22/2017 | Morgan Stanley | USD | 67,452 | RUB | 3,892,000 | 66,342 | 1,110 | |||||||||||||||||||||
| United States Dollar/New Zealand Dollar 11/22/2017 | JPMorgan Chase | USD | 14,533 | NZD | 20,000 | 13,681 | 852 | |||||||||||||||||||||
| United States Dollar/Swedish Krona 01/10/2018 | UBS | USD | 13,511 | SEK | 109,000 | 13,079 | 432 | |||||||||||||||||||||
| $ | 7,997,188 | $ | 68,557 | |||||||||||||||||||||||||
See accompanying Notes to Financial Statements.
| 28 | Annual Report 2017 |
Statement of Investments (continued)
October 31, 2017
Aberdeen Global Unconstrained Fixed Income Fund
At October 31, 2017, the Fund’s open forward foreign cross currency contracts were as follows:
| Purchase/Sale Settlement Date | Counterparty | Amount | Amount | Contract Value | Fair Value | Unrealized Appreciation/ (Depreciation) | ||||||||||||||||||||||||
| Australian Dollar/British Pound 11/16/2017 | Royal Bank of Canada | AUD | 263,809 | GBP | 161,000 | $ | 207,974 | $ | 195,937 | $ | (12,037 | ) | ||||||||||||||||||
| Australian Dollar/Euro 11/22/2017 | JPMorgan Chase | AUD | 344,621 | EUR | 228,000 | 272,372 | 270,214 | (2,158 | ) | |||||||||||||||||||||
| Australian Dollar/New Zealand Dollar 11/22/2017 | JPMorgan Chase | AUD | 520,000 | NZD | 574,222 | 412,438 | 417,547 | 5,109 | ||||||||||||||||||||||
| British Pound/Japanese Yen 11/22/2017 | JPMorgan Chase | GBP | 153,000 | JPY | 22,918,589 | 207,996 | 209,584 | 1,588 | ||||||||||||||||||||||
| Canadian Dollar/Japanese Yen 11/22/2017 | Citibank | CAD | 168,000 | JPY | 15,131,088 | 134,669 | 131,732 | (2,937 | ) | |||||||||||||||||||||
| Czech Koruna/Euro 03/27/2018 | Royal Bank of Canada | CZK | 12,297,054 | EUR | 462,000 | 489,216 | 509,385 | 20,169 | ||||||||||||||||||||||
| Euro/British Pound 11/22/2017 | Citibank | EUR | 170,000 | GBP | 151,684 | 199,656 | 196,315 | (3,341 | ) | |||||||||||||||||||||
| Euro/Czech Koruna 11/22/2017 | Royal Bank of Canada | EUR | 113,454 | CZK | 2,959,000 | 134,698 | 132,536 | (2,162 | ) | |||||||||||||||||||||
| 03/27/2018 | Citibank | EUR | 457,230 | CZK | 12,297,054 | 497,901 | 472,128 | (25,773 | ) | |||||||||||||||||||||
| Hungarian Forint/Euro 11/22/2017 | Morgan Stanley | HUF | 105,557,000 | EUR | 340,328 | 405,406 | 403,775 | (1,631 | ) | |||||||||||||||||||||
| Japanese Yen/Euro 11/22/2017 | Citibank | JPY | 29,960,070 | EUR | 229,000 | 275,495 | 272,180 | (3,315 | ) | |||||||||||||||||||||
| Japanese Yen/Polish Zloty 11/22/2017 | JPMorgan Chase | JPY | 16,214,881 | PLN | 532,000 | 149,102 | 145,670 | (3,432 | ) | |||||||||||||||||||||
| Japanese Yen/Swedish Krona 11/22/2017 | UBS | JPY | 4,503,991 | SEK | 334,000 | 41,415 | 41,119 | (296 | ) | |||||||||||||||||||||
| New Zealand Dollar/Australian Dollar 11/22/2017 | JPMorgan Chase | NZD | 569,559 | AUD | 520,000 | 412,703 | 404,404 | (8,299 | ) | |||||||||||||||||||||
| Swedish Krona/Euro 11/22/2017 | JPMorgan Chase | SEK | 2,735,646 | EUR | 283,000 | 330,938 | 328,076 | (2,862 | ) | |||||||||||||||||||||
| $ | 4,130,602 | $ | (41,377 | ) | ||||||||||||||||||||||||||
| * | Certain contracts with different trade dates and like characteristics have been shown net. |
At October 31, 2017, the Fund held the following over-the-counter credit default swaps:
| Expiration Date | Notional Amount | Counterparty/Reference Entity | Fixed Rate | Premiums Paid (Received) | Unrealized | Value | ||||||||||||||||
| Buy Protection: | ||||||||||||||||||||||
| 06/20/2022 | $ | 400,000 | Barclays Bank/Vodafone Group PLC, 5%, 6/4/18 | Equal to 1.00% | $ | (2,345 | ) | $ | (9,181 | ) | $ | (11,526 | ) | |||||||||
| Sell Protection: | ||||||||||||||||||||||
| 06/20/2022 | $ | 200,000 | Barclays Bank/Virgin Media Finance PLC, 7%, 4/15/23 | Equal to 5.00% | $ | 26,998 | $ | 9,565 | $ | 36,563 | ||||||||||||
See accompanying Notes to Financial Statements.
| 2017 Annual Report | 29 |
Statement of Investments (concluded)
October 31, 2017
Aberdeen Global Unconstrained Fixed Income Fund
At October 31, 2017, the Fund held the following centrally cleared credit default swaps:
| Expiration Date | Notional Amount | Credit Index | Fixed Rate | Implied Credit Spread* | Premiums Paid (Received) | Unrealized Appreciation/ (Depreciation) | Value | |||||||||||||||||||
| Buy Protection: | ||||||||||||||||||||||||||
| 12/20/2021 | $ | 180,000 | iTRAXX-Crossover 5-year | Equal to 5.00% | 1.66% | $ | (12,638 | ) | $ | (16,605 | ) | $ | (29,243 | ) | ||||||||||||
| 12/20/2021 | 600,000 | iTRAXX-FinSen 5-year | Equal to 1.00% | 0.35% | (1,266 | ) | (18,765 | ) | (20,031 | ) | ||||||||||||||||
| 12/20/2021 | 780,000 | iTRAXX-Europe 5-year | Equal to 1.00% | 0.37% | (9,623 | ) | (15,581 | ) | (25,204 | ) | ||||||||||||||||
| 12/20/2021 | 400,000 | iTRAXX-Europe 5-year | Equal to 1.00% | 0.37% | (4,527 | ) | (8,398 | ) | (12,925 | ) | ||||||||||||||||
| 12/20/2021 | 210,000 | Markit CDX 5-year | Equal to 5.00% | 2.57% | (5,123 | ) | (14,771 | ) | (19,894 | ) | ||||||||||||||||
| 12/20/2021 | 2,420,000 | Markit CDX 5-year | Equal to 1.00% | 0.24% | (19,775 | ) | (38,155 | ) | (57,930 | ) | ||||||||||||||||
| 12/20/2021 | 900,000 | iTRAXX-Crossover 5-year | Equal to 5.00% | 1.66% | (75,165 | ) | (71,049 | ) | (146,214 | ) | ||||||||||||||||
| $ | (128,117 | ) | $ | (183,324 | ) | $ | (311,441 | ) | ||||||||||||||||||
| Sell Protection: | ||||||||||||||||||||||||||
| 12/20/2021 | $ | 400,000 | Markit CDX 5-year | Equal to 1.00% | 0.24% | $ | 5,911 | $ | 3,664 | $ | 9,575 | |||||||||||||||
| * | Implied credit spreads, represented in absolute terms, are utilized in determining the market value of credit default swaps agreements on corporate issues or sovereign issues and serve as an indicator of the current status of the payment/performance risk and represent the likelihood or risk of default for the credit derivative. The implied credit spread of particular referenced entity reflects the cost of buying/selling protection and may include upfront payments required to be made prior to entering into the agreement. For credit default swap with asset-backed securities or credit indices as the underlying assets, the quoted market prices and resulting market values serve as an indicator of the current status of the payment/performance risk. Wider credit spreads and increasing market values, in absolute terms when compared to the notional amount of the swap, represent a deterioration of the reference entity’s credit soundness and a greater likelihood or risk of default or other credit event occurring as defined under the terms of the agreement. |
At October 31, 2017, the Fund held the following centrally cleared interest rate swaps:
| Currency | Notional Amount | Expiration Date | Receive (Pay) Floating Rate | Floating Rate Index | Fixed Rate | Premiums Paid (Received) | Unrealized Appreciation/ (Depreciation) | Value | ||||||||||||||||||||||
USD | $ | 1,810,000 | 06/26/2019 | Receive | 12-month CPI | 1.68% | $ | – | $ | 11,745 | $ | 11,745 | ||||||||||||||||||
USD | 4,000,000 | 04/24/2019 | Receive | 1-month LIBOR | 1.87% | – | (4,848 | ) | (4,848 | ) | ||||||||||||||||||||
EUR | 1,350,000 | 04/15/2022 | Receive | 12-month CPI | 1.11% | – | 9,597 | 9,597 | ||||||||||||||||||||||
| EUR | 1,200,000 | 04/15/2022 | Receive | 12-month CPI | 1.11% | – | (10,074 | ) | (10,074 | ) | ||||||||||||||||||||
| – | 6,420 | 6,420 | ||||||||||||||||||||||||||||
SEK | $ | 31,560,000 | 01/02/2020 | Pay | 3-month STIBOR | 0.06% | $ | – | $ | (9,618 | ) | $ | (9,618 | ) | ||||||||||||||||
SEK | 11,740,000 | 01/02/2023 | Pay | 3-month STIBOR | 0.59% | – | 11,630 | 11,630 | ||||||||||||||||||||||
GBP | 1,180,000 | 10/15/2021 | Pay | 12-month UK RPI | 3.48% | – | 1,411 | 1,411 | ||||||||||||||||||||||
GBP | 250,000 | 10/15/2021 | Pay | 12-month UK RPI | 3.48% | 850 | (1,325 | ) | (475 | ) | ||||||||||||||||||||
EUR | 1,340,000 | 04/15/2027 | Pay | 1-month CPI | 1.35% | – | (12,831 | ) | (12,831 | ) | ||||||||||||||||||||
AUD | 7,040,000 | 09/20/2019 | Pay | 3-month LIBOR | 2.26% | – | 12,921 | 12,921 | ||||||||||||||||||||||
GBP | 5,070,000 | 09/24/2019 | Pay | 6-month BBR BBSW | 0.99% | – | 471 | 471 | ||||||||||||||||||||||
USD | 1,150,000 | 08/10/2022 | Pay | 3-month LIBOR BBA | 1.90% | – | (7,160 | ) | (7,160 | ) | ||||||||||||||||||||
GBP | 1,020,000 | 12/22/2022 | Pay | 6-month BBR BBSW | 1.16% | – | (1,947 | ) | (1,947 | ) | ||||||||||||||||||||
USD | 1,190,000 | 08/10/2027 | Pay | 3-month LIBOR BBA | 2.24% | – | 8,063 | 8,063 | ||||||||||||||||||||||
USD | 250,000 | 08/10/2047 | Pay | 3-month LIBOR BBA | 2.53% | – | (2,482 | ) | (2,482 | ) | ||||||||||||||||||||
NZD | 7,740,000 | 09/21/2019 | Pay | 3-month BA CDOR | 2.46% | – | (10,532 | ) | (10,532 | ) | ||||||||||||||||||||
| EUR | 1,200,000 | 04/15/2027 | Pay | 12-month CPI | 1.35% | 2,491 | 4,122 | 6,613 | ||||||||||||||||||||||
| 3,341 | (7,277 | ) | (3,936 | ) | ||||||||||||||||||||||||||
| 3,341 | (857 | ) | 2,484 | |||||||||||||||||||||||||||
See accompanying Notes to Financial Statements.
| 30 | Annual Report 2017 |
Aberdeen Tax-Free Income Fund (Unaudited)
The Aberdeen Tax-Free Income Fund (Institutional Class shares net of fees) returned 0.98% for the 12-month period ended October 31, 2017, versus the 1.96% return of its benchmark, the ICE Bank of America Merrill Lynch (BofA ML) 1-22 Year Municipal Securities Index, and the 2.19% return of broader-market Bloomberg Barclays Municipal Bond Index. For broader comparison, the average return of the Fund’s peer category of Intermediate Municipal Debt Funds (comprising 84 funds), as measured by Lipper, Inc., was 1.49% for the period.
The U.S. municipal market experienced considerable volatility over the 12-month period ended October 31, 2017. In November 2016, following the election of Donald Trump as the 45th president of the U.S., the tax-exempt market experienced a dramatic sell-off, with the benchmark ICE BofA ML 1-22 Year Municipal Securities Index falling 3.22% – its worst monthly total return since the global financial crisis of the late 2000s. The sell-off was driven by speculation that the Trump administration’s tax-reform, if enacted, could potentially eliminate the preferential tax treatment of interest on municipal bonds. Consequently, tax-exempt municipal rates cheapened dramatically relative to comparable-duration1 U.S. Treasuries. Additionally, concerns around Trump’s inflationary policies drove significant Treasury yield curve steepening,2 further contributing to negative returns in November. Given its conservative positioning, the Fund strongly outperformed the ICE BofA Merrill Lynch 1-22 Year Municipal Securities Index in November 2016, highlighting our focus on credit quality. However, the municipal market sell-off was short-lived and was followed by a strong rally that started in December 2016, and lasted through the end of October 2017, with only brief pauses in June and September.
The U.S. economy performed well over the reporting period, with gross domestic product (GDP) growth gradually accelerating throughout 2017, increasing 3.3% in the third quarter–the highest real GDP growth rate since 2014 – despite the severe hurricane season in the summer and fall. The U.S. unemployment rate also remained healthy, falling to 4.1% in October 2017, while a modest rise in personal income further supported consumer spending. The U.S. Federal Reserve (Fed) increased the federal funds rate in three increments of 25 basis points over then 12-month reporting period to a range of 1.00%-1.25%. Improving U.S. macroeconomic conditions have translated into a strong overall market environment. Most notably, yields on tax-exempt municipal bonds moved lower in 2017, as uncertainty surrounding the preferential treatment of municipal bond interest payments abated gradually throughout the year. The most recent versions of House and Senate tax reform proposals leave tax-exempt status on municipal bond interest unchanged. However, the House has passed a bill that removes preferential tax treatment on Private Activity Partnership (PAP) bonds3 issued after November 2, 2017. The change in the tax-exempt status of PAP bonds, if the provision ultimately becomes part of the law, would likely result in reduced municipal bond issuance in 2018 and beyond, which could tighten tax-exempt municipal spreads.
The Fund’s shorter duration and up-in-quality credit positioning were detractors from performance over the reporting period as the municipal market rallied in 2017, and higher-beta,4 lower-rated5 securities generally were the strongest performers. However, the Fund generated excess monthly returns relative to its benchmark during periods of market weakness such as those experienced in November 2016, as well as June and September 2017. Among the Fund’s top-performing holdings during the period were New Hampshire Business Finance Authority adjustable-rate bonds. The Fund’s New Hampshire Business Finance Authority Pollution Control Revenue Auction Rate bonds were called6 at par value in December 2016, at approximately seven points above the then-current market price, generating a substantial gain for the Fund. Among the Fund’s weakest-performing holdings were Beaver County Industrial Development Revenue senior unsecured bonds 3.5%, due in 2035. We exited the position in December 2016, based on our view that the underlying credit profile of the issuer had significantly changed, and on a risk-adjusted basis, the security was no longer offering a compelling relative value.
Looking forward to the next 12 months, we believe that the municipal market will exhibit lower volatility compared to the past year, especially after the tax reform bill is enacted. However, we think that there could be temporary spikes in market volatility as we head into the final stages of the tax reform deliberations, and as the U.S. Congress deals with the looming federal government shutdown issue at the end of 2017. We continue to anticipate that the U.S. economy will remain strong over the next 12 months, and we see few catalysts that could derail current domestic macroeconomic trends. Global geopolitical risks could surface in 2018, including those related to North Korea and Italian elections scheduled for May of next year. We believe that the Fed will maintain its disciplined and measured approach to interest-rate increases and assign a high probability to an interest-rate hike in December 2017. Given the Fund’s overall conservative positioning, we intend to look to gradually increase its
| 1 | Duration is an estimate of bond price sensitivity to changes in interest rates. The higher the duration, the greater the change (i.e., higher risk) in relation to interest-rate movements. |
| 2 | Yield curve steepening occurs when the spread between long- and short-term interest rates increases. Consequently, long-term bond prices will decrease relative to short-term bonds. |
| 3 | Private Activity Partnership bonds are tax-exempt bonds issued by or on behalf of a local or state government for the purpose of providing special financing benefits for qualified projects. |
| 4 | Beta is a measure of the volatility of a portfolio in comparison to a benchmark index. |
| 5 | Standard & Poor’s credit ratings express the agency’s opinion about the ability and willingness of an issuer, such as a corporation or state or city government, to meet its financial obligations in full and on time. Typically, ratings are expressed as letter grades that range, for example, from “AAA” to “D” to communicate the agency’s opinion of relative level of credit risk. Ratings from “AA” to “CCC” may be modified by the addition of a plus (+) or minus (-) sign to show relative standing within the major rating categories. |
| 6 | A callable bond can be redeemed by the issuer prior to its maturity. If interest rates have declined since the bond was issued, the company may want to refinance the debt at a lower interest rate. |
| 2017 Annual Report | 31 |
Aberdeen Tax-Free Income Fund (Unaudited) (concluded)
duration as rates rise. The Fund also holds substantial exposure to pre-refunded securities7 which carry little or no credit risk. As these securities are called or mature, we will seek to reinvest the proceeds into higher-yielding municipal bonds, thus avoiding taxable gains for the Fund’s investors while increasing the overall yield. We are focused on adding the highest level of prudent yield without taking significant duration risk, while simultaneously minimizing capital gains for the Fund’s shareholders.
Portfolio Management:
Aberdeen North American Fixed Income Team
PAST PERFORMANCE DOES NOT GUARANTEE FUTURE RESULTS.
The performance data quoted represents past performance and current returns may be lower or higher. Class A Shares have up to a 4.25% front-end sales charge and a 0.25% 12b-1 fee. The investment return and principal value will fluctuate so that an investor’s shares, when redeemed, may be worth more or less than the original cost. To obtain performance information current to the most recent month-end, which may be higher or lower than the performance shown above, please call 866-667-9231 or go to www.aberdeen-asset.us.
Investing in mutual funds involves risk, including the possible loss of principal.
Indexes are unmanaged and have been provided for comparison purposes only. No fees or expenses are reflected. You cannot invest directly in an index.
Lipper is a leading global provider of mutual fund information and analysis to fund companies, financial intermediaries and media organizations.
Risk Considerations
Fixed income securities are subject to certain risks including, but not limited to: interest rate (changes in interest rates may cause a decline in the market value of an investment), credit (changes in the financial condition of the issuer, borrower, counterparty, or underlying collateral), prepayment (debt issuers may repay or refinance their loans or obligations earlier than anticipated), and extension (principal repayments may not occur as quickly as anticipated, causing the expected maturity of a security to increase).
Municipal securities can be affected by adverse tax, legislative or political changes and the financial condition of the issuers of municipal securities.
Derivatives are speculative and may hurt the Fund’s performance. They present the risk of disproportionately increased losses and/or reduced gains when the financial asset or measure to which the derivative is linked changes in unexpected ways.
Investing a significant portion of the Fund’s assets in securities of companies conducting business in a broadly related group of industries within an economic sector may make the Fund more vulnerable to unfavorable developments in that sector.
Please read the prospectus for more detailed information regarding these and other risks.
| 7 | Pre-refunded bonds are issued to fund another callable bond, which provides the issuer with the right to redeem the bond before the scheduled maturity date. The proceeds from the issue of the lower-yielding and/or longer-maturing pre-refunded bond are typically invested in Treasury securities until the scheduled call date of the original bond issue occurs. |
| 32 | Annual Report 2017 |
Aberdeen Tax-Free Income Fund (Unaudited)
Average Annual Total Return1 (For periods ended October 31, 2017) | 1 Yr. | 5 Yr. | 10 Yr. | |||||||||||
Class A | w/o SC | 0.72% | 1.70% | 3.46% | ||||||||||
| w/SC2 | -3.57% | 0.82% | 3.02% | |||||||||||
Class C | w/o SC | -0.02% | 0.93% | 2.71% | ||||||||||
| w/SC3 | -1.00% | 0.93% | 2.71% | |||||||||||
Class R4 | w/o SC | 0.47% | 1.49% | 3.50% | ||||||||||
Institutional Service Class4 | w/o SC | 0.79% | 1.93% | 3.72% | ||||||||||
Institutional Class4,5 | w/o SC | 0.98% | 1.96% | 3.74% | ||||||||||
All figures showing the effect of a sales charge (SC) reflect the maximum charge possible because it has the most significant effect on performance data. The total returns shown above do not include the impact of financial statement rounding of the net asset value (NAV) per share and/or financial statement adjustments.
| 1 | Returns prior to June 23, 2008 reflect the performance of a predecessor fund (the “Predecessor Fund”). Since June 23, 2008, Aberdeen Asset Management Inc. has served as the Fund’s investment adviser. Credit Suisse Asset Management, LLC served as the subadviser for the Tax-Free Income Fund from June 23, 2008 to February 27, 2011. Returns of the Predecessor Fund have not been adjusted to reflect the expenses applicable to the respective classes. The Fund and the Predecessor Fund have substantially similar investment objectives and strategies. Please consult the Fund’s prospectus for more detail. |
| 2 | A 4.25% front-end sales charge was deducted. |
| 3 | A 1.00% contingent deferred sales charge (CDSC) was deducted from the one year return because it is charged when Class C shares are sold within the first year after purchase. |
| 4 | Not subject to any sales charge. Returns before the first offering of the Class R, Institutional Class and Institutional Service Class shares (February 25, 2013) are based on the previous performance of Class D shares. Returns of each class have not been adjusted to reflect the expenses applicable to the respective classes. Excluding the effect of any fee waivers or reimbursements, this performance is substantially similar to what the Class R, Institutional Service Class, and Institutional Class shares would have produced because all classes invest in the same portfolio of securities. Returns for the Class R, Institutional Service Class, and Institutional Class shares would only differ to the extent of the differences in expenses of the classes. |
| 5 | Effective February 25, 2013, all Class D shares of the Fund were converted into Institutional Class shares of the Fund. |
Performance of a $10,000 Investment (as of October 31, 2017)
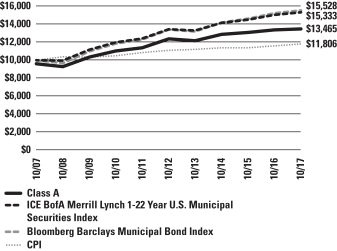
Comparative performance of $10,000 invested in Class A shares of the Aberdeen Tax-Free Income Fund, the ICE BofA Merrill Lynch 1-22 Year U.S. Municipal Securities Index, the Bloomberg Barclays Municipal Bond Index and the Consumer Price Index (CPI) over a 10-year period ended October 31, 2017. Unlike the Fund, the returns for these unmanaged indexes do not reflect any fees, expenses, or sales charges. Investors cannot invest directly in market indexes.
The ICE BofA Merrill Lynch 1-22 Year U.S. Municipal Securities Index is a subset of the ICE BofA Merrill Lynch U.S. Municipal Securities Index including all securities with a remaining term to final maturity less than 22 years, calculated on a total return basis. The ICE BofA Merrill Lynch U.S. Municipal Securities Index tracks the performance of U.S. dollar-denominated investment grade tax-exempt debt publicly issued by U.S. states and territories, and their political subdivisions, in the U.S. domestic market.
Effective September 14, 2017, the ICE BofA Merrill Lynch 1-22 Year U.S. Municipal Securities Index replaced the Bloomberg Barclays Municipal Bond Index as the Fund’s primary benchmark. The Fund’s investment adviser believes that the ICE BofA Merrill Lynch 1-22 Year U.S. Municipal Securities Index is a more meaningful comparison index given the duration of the Fund’s holdings.
The Bloomberg Barclays Municipal Bond Index is a broad market performance benchmark for the tax exempt bond market, the bonds included in this index must have a minimum credit rating of at least Baa. They must have an outstanding par value of at least $3 million and be issued as part of a transaction of at least $50 million. The index includes both zero coupon bonds and bonds subject to the Alternative Minimum Tax.
The CPI is a measure of the average change over time in the prices paid by urban consumers for a market basket of consumer goods and services.
Investment return and principal value will fluctuate, and when redeemed, shares may be worth more or less than original cost. Past performance is no guarantee of future results. The Average Annual Total Return table and Performance graph do not reflect the deduction of taxes that a shareholder would pay on fund distributions or the redemption of fund shares. Investing in mutual funds involves market risk, including loss of principal. Performance returns assume the reinvestment of all distributions. Total returns reflect waivers and reimbursements in effect, without which returns would have been lower.
| 2017 Annual Report | 33 |
Aberdeen Tax-Free Income Fund (Unaudited) (concluded)
Portfolio Summary (as a percentage of net assets)
October 31, 2017 (Unaudited)
| Asset Allocation | ||||
Municipal Bonds | 99.0% | |||
Short-Term Investment | 0.9% | |||
Other Assets in Excess of Liabilities | 0.1% | |||
| 100.0% | ||||
| Top Holdings* | ||||
Harris County Health Facilities Development Corp. Revenue Bonds (SCH Health Care System), Prerefunded/Escrowed to Maturity, Series B 07/01/2027 | 8.1% | |||
Pennsylvania Turnpike Commission Revenue Bonds, Series A 07/15/2029 | 6.2% | |||
New York State Dormitory Authority Revenue Bonds (State University Dormitory Facilities), Series A 07/01/2039 | 3.3% | |||
Fort Bend Independent School District General Obligation Unlimited Bonds, Prerefunded/Escrowed to Maturity 02/15/2018 | 2.9% | |||
New Jersey Economic Development Authority Revenue Bonds (School Facilities Conservation), Series BB 09/01/2024 | 2.6% | |||
State of Washington General Obligation Unlimited Bonds, Series R-2010A 01/01/2022 | 2.6% | |||
Commonwealth of Massachusetts General Obligation Limited Bonds, Series D 10/01/2018 | 2.6% | |||
County of King General Obligation Limited Bonds 01/01/2025 | 2.5% | |||
Texas Municipal Gas Acquisition & Supply Corp. I Revenue Bonds, Series D 12/15/2026 | 2.2% | |||
City of Houston General Obligation Limited Bonds (Public Improvement), Series A 03/01/2030 | 2.0% | |||
Other | 65.0% | |||
| 100.0% | ||||
| * | For the purpose of listing top holdings, Short-Term Investments are included as part of Other. |
| Top States | ||||
Texas | 24.4% | |||
New York | 13.0% | |||
Pennsylvania | 9.2% | |||
California | 7.3% | |||
Washington | 6.3% | |||
Louisiana | 4.8% | |||
New Jersey | 4.7% | |||
Florida | 4.5% | |||
Massachusetts | 3.9% | |||
Georgia | 3.6% | |||
Other | 18.3% | |||
| 100.0% | ||||
| 34 | Annual Report 2017 |
Statement of Investments
October 31, 2017
Aberdeen Tax-Free Income Fund
| Shares or Principal Amount | Value (US$) | |||||||
MUNICIPAL BONDS (99.0%) | ||||||||
Alabama (1.8%) | ||||||||
Black Belt Energy Gas District Revenue Bonds, Series A, 4.00%, 08/01/2047 (a) | $ | 1,000,000 | $ | 1,091,880 | ||||
Industrial Development Board of the City of Mobile Alabama Revenue Bonds (Alabama Power Co.), 1.63%, 07/15/2034 (a) | 400,000 | 400,380 | ||||||
| 1,492,260 | ||||||||
Alaska (1.4%) | ||||||||
City of Valdez Revenue Bonds Pipelines Project, Series B, 5.00%, 01/01/2021 | 1,000,000 | 1,105,450 | ||||||
California (7.3%) | ||||||||
Bay Area Toll Authority Revenue Bonds, Series A, 2.95%, 04/01/2047 (a) | 350,000 | 367,405 | ||||||
Brea Redevelopment Agency Tax Allocation Refunding Bonds, Series A, 0.00%, 08/01/2025 (b) | 1,000,000 | 721,860 | ||||||
Los Angeles Community College District General Obligation Unlimited Bonds | ||||||||
Series A, 5.50%, 08/01/2025 | 1,000,000 | 1,077,370 | ||||||
Series I, 4.00%, 08/01/2029 | 400,000 | 451,900 | ||||||
M-S-R Energy Authority Gas Revenue Bonds | ||||||||
Series B, 6.13%, 11/01/2029 | 500,000 | 633,880 | ||||||
Series A, 6.50%, 11/01/2039 | 500,000 | 707,560 | ||||||
San Francisco City & County Public Utilities Commission Revenue Bonds, Series F, 5.00%, 11/01/2024 | 300,000 | 334,215 | ||||||
Santa Clara Unified School District General Obligation Unlimited Bonds, 5.00%, 07/01/2026 | 465,000 | 493,458 | ||||||
Turlock Irrigation District Revenue Bonds, 5.00%, 01/01/2029 | 1,000,000 | 1,112,330 | ||||||
| 5,899,978 | ||||||||
Florida (4.5%) | ||||||||
City of Tampa Revenue Bonds (Baycare Health Care System), Series A, 4.00%, 11/15/2033 | 1,000,000 | 1,029,770 | ||||||
CityPlace Community Development District, Special Assessment & Revenue Refunding Bonds, 5.00%, 05/01/2019 | 1,000,000 | 1,048,280 | ||||||
County of Escambia Revenue Bonds , 5.00%, 10/01/2046 | 1,000,000 | 1,142,720 | ||||||
Volusia County Educational Facility Authority Revenue Bonds, Series B, 5.00%, 10/15/2023 | 250,000 | 293,118 | ||||||
Volusia County Educational Facility Authority Revenue Bonds (EMBRY- Riddle Aeronautical University, Inc.), 5.00%, 10/15/2047 | 100,000 | 114,686 | ||||||
| 3,628,574 | ||||||||
Georgia (3.6%) | ||||||||
Burke County Development Authority Pollution Control Revenue Bonds (Transmission Corp. Vogtle Project), 1.30%, 01/01/2052 (a) | 1,000,000 | 998,550 | ||||||
Cherokee County General Obligation Unlimited Bonds, 5.00%, 04/01/2021 | 500,000 | 527,060 | ||||||
Forsyth County General Obligation Unlimited Bonds, Series A, 5.00%, 03/01/2028 | 100,000 | 105,177 | ||||||
Monroe Country Development Authority Revenue Bonds, 2.35%, 10/01/2048 (a) | 1,000,000 | 1,008,980 | ||||||
Municipal Electric Authority of Georgia Revenue Bonds | ||||||||
Prerefunded/Escrowed to Maturity, Series V, 6.60%, 01/01/2018 (c) | 125,000 | 126,141 | ||||||
Unrefunded, Series V, 6.60%, 01/01/2018 (c) | 140,000 | 141,249 | ||||||
| 2,907,157 | ||||||||
Illinois (1.7%) | ||||||||
Illinois Finance Authority Revenue Bonds (Carle Foundation), Series A, 6.00%, 08/15/2041 | 500,000 | 565,570 | ||||||
State of Illinois General Obligation Unlimited Bonds, Series D, 5.00%, 11/01/2021 | 750,000 | 804,720 | ||||||
| 1,370,290 | ||||||||
Louisiana (4.8%) | ||||||||
East Baton Rouge Parish Sales Tax Revenue Bonds (Road & Street Improvement), 5.00%, 08/01/2024 | 540,000 | 575,850 | ||||||
Louisiana Public Facilities Authority Revenue Bonds | ||||||||
(Pre-refunded @ $100.000000, 05/15/2026), 3.00%, 05/15/2031 | 10,000 | 10,773 | ||||||
3.00%, 05/15/2031 | 990,000 | 970,517 | ||||||
Louisiana Public Facilities Authority Revenue Bonds (Entergy Louisiana LLC), Series B, 3.50%, 06/01/2030 | 1,000,000 | 1,016,800 | ||||||
Saint Charles Parish Revenue Bonds (Valero Energy Corp.), 4.00%, 12/01/2040 (a) | 1,250,000 | 1,325,975 | ||||||
| 3,899,915 | ||||||||
Massachusetts (3.9%) | ||||||||
Commonwealth of Massachusetts General Obligation Limited Bonds, Series D | ||||||||
5.50%, 10/01/2018 | 2,000,000 | 2,081,100 | ||||||
5.50%, 08/01/2019 | 1,000,000 | 1,075,560 | ||||||
| 3,156,660 | ||||||||
Michigan (1.2%) | ||||||||
Grand Rapids Building Authority Revenue Bonds, 5.00%, 08/01/2020 | 900,000 | 954,585 | ||||||
Minnesota (0.7%) | ||||||||
University of Minnesota Revenue Bonds, Series A, 5.25%, 04/01/2029 | 500,000 | 528,810 | ||||||
Nebraska (1.0%) | ||||||||
Central Plains Energy Project, Gas Project Revenue Bonds (Project No.3), 5.00%, 09/01/2021 | 750,000 | 848,243 | ||||||
New Hampshire (2.6%) | ||||||||
New Hampshire Health & Education Facilities Authority Revenue Bonds (Dartmouth College), 5.25%, 06/01/2039 | 1,000,000 | 1,064,190 | ||||||
See accompanying Notes to Financial Statements.
| 2017 Annual Report | 35 |
Statement of Investments (continued)
October 31, 2017
Aberdeen Tax-Free Income Fund
| Shares or Principal Amount | Value (US$) | |||||||
New Hampshire Health & Education Facilities Authority Revenue Bonds (University Systems), Series A, 5.00%, 07/01/2023 | $ | 1,000,000 | $ | 1,058,470 | ||||
| 2,122,660 | ||||||||
New Jersey (4.7%) | ||||||||
New Jersey Economic Development Authority Revenue Bonds (School Facilities Conservation), Series BB, 5.25%, 09/01/2024 | 2,000,000 | 2,145,820 | ||||||
New Jersey Educational Facilities Authority Revenue Bonds (The College of New Jersey), Series F, 4.00%, 07/01/2033 | 100,000 | 105,003 | ||||||
New Jersey Turnpike Authority Revenue Bonds, Series A, 5.00%, 01/01/2031 | 850,000 | 995,749 | ||||||
Newark Housing Authority Revenue Bonds (Newark Redevelopment Project), 4.00%, 01/01/2037 | 500,000 | 536,880 | ||||||
| 3,783,452 | ||||||||
New York (13.0%) | ||||||||
Hudson Yards Infrastructure Corp. Revenue Bonds, Series A, 5.00%, 02/15/2042 | 1,000,000 | 1,167,180 | ||||||
Nassau County Local Economic Assistance Corp. Revenue Bonds (Catholic Health Services), 5.00%, 07/01/2030 | 1,000,000 | 1,125,740 | ||||||
New York City Water & Sewer System Revenue Bonds, Series EE, 5.00%, 06/15/2037 | 295,000 | 350,484 | ||||||
New York State Dormitory Authority Revenue Bonds, Series A, 5.00%, 03/15/2033 | 850,000 | 1,004,734 | ||||||
New York State Dormitory Authority Revenue Bonds (State University Dormitory Facilities), Series A, 5.00%, 07/01/2039 | 2,500,000 | 2,659,425 | ||||||
New York State Dormitory Authority Revenue Bonds (State University Educational Facilities 3rd Generation), Series A, 5.50%, 05/15/2023 | 1,160,000 | 1,400,131 | ||||||
Oneida County Industrial Development Agency Revenue Bonds (Hamilton College Civic Facilities), 5.00%, 09/15/2027 | 1,000,000 | 1,032,310 | ||||||
Port Authority of New York & New Jersey Revenue Bonds, 5.00%, 10/15/2042 | 560,000 | 654,595 | ||||||
Tompkins County Industrial Development Agency Revenue Bonds (Cornell University Civic Facilities), Series A, 5.25%, 07/01/2030 | 1,000,000 | 1,104,460 | ||||||
| 10,499,059 | ||||||||
North Dakota (1.3%) | ||||||||
City of Grand Forks, Health Care System Revenue Bonds (Altru Health System Obligated Group), 4.50%, 12/01/2032 | 1,000,000 | 1,035,000 | ||||||
Pennsylvania (9.2%) | ||||||||
Beaver County Industrial Development Authority Revenue Bonds (FirstEnergy Nuclear Generation LLC), Series A, 4.38%, 01/01/2035 (a) | 500,000 | 494,185 | ||||||
Lehigh County Industrial Development Authority Revenue Bonds (PPL Electric Utilities Corp.), 1.80%, 02/15/2027 (a) | 800,000 | 795,984 | ||||||
Montgomery County Industrial Development Authority Health System Revenue Bonds, Series A, 5.00%, 01/15/2022 | 250,000 | 274,672 | ||||||
Pennsylvania Higher Educational Facilities Authority Revenue Bonds (University of Pennsylvania), Series A, 5.00%, 09/01/2019 | 800,000 | 855,472 | ||||||
Pennsylvania Turnpike Commission Revenue Bonds, Series A, 5.25%, 07/15/2029 | 4,100,000 | 5,031,889 | ||||||
| 7,452,202 | ||||||||
Rhode Island (0.9%) | ||||||||
Tobacco Settlement Financing Corp. Revenue Bonds, Series B, 4.50%, 06/01/2045 | 750,000 | 751,410 | ||||||
South Carolina (1.5%) | ||||||||
Rock Hill South Carolina Combined Utility System Revenue Bonds (City of Rock Hill South Carolina Combined Utility System Revenue) | ||||||||
5.00%, 01/01/2025 | 500,000 | 600,010 | ||||||
5.00%, 01/01/2026 | 500,000 | 605,330 | ||||||
| 1,205,340 | ||||||||
Tennessee (1.4%) | ||||||||
Knox County Health Educational & Housing Facilities Board Revenue Bonds (University Health System, Inc.), 5.00%, 09/01/2036 | 500,000 | 559,350 | ||||||
Tennessee Energy Acquisition Corp. Revenue Bonds, Series A, 5.25%, 09/01/2023 | 500,000 | 584,795 | ||||||
| 1,144,145 | ||||||||
Texas (24.4%) | ||||||||
City of Houston General Obligation Limited Bonds (Public Improvement), Series A, 5.00%, 03/01/2030 | 1,575,000 | 1,650,317 | ||||||
Dallas/Fort Worth International Airport Revenue Bonds, Joint Revenue Refunding Bonds, Series B, 5.00%, 11/01/2020 | 1,000,000 | 1,107,170 | ||||||
Fort Bend Independent School District General Obligation Unlimited Bonds, Prerefunded/Escrowed to Maturity, 5.00%, 02/15/2018 | 2,300,000 | 2,326,450 | ||||||
Harris County Health Facilities Development Corp. Revenue Bonds (SCH Health Care System), Prerefunded/Escrowed to Maturity, Series B, 5.75%, 07/01/2027 | 5,325,000 | 6,541,443 | ||||||
Matagorda County Navigation District No. 1 Revenue Bonds, Series B-1, 4.00%, 06/01/2030 | 1,000,000 | 1,051,580 | ||||||
State of Texas General Obligation Unlimited Bonds (Water Financial Assistance), Series C, 5.25%, 08/01/2018 | 1,050,000 | 1,082,718 | ||||||
Tarrant County Cultural Education Facilities Finance Corp. Revenue Bonds (Baylor Scott & White Obligated Group), 5.00%, 11/15/2029 | 800,000 | 948,936 | ||||||
See accompanying Notes to Financial Statements.
| 36 | Annual Report 2017 |
Statement of Investments (concluded)
October 31, 2017
Aberdeen Tax-Free Income Fund
| Shares or Principal Amount | Value (US$) | |||||||
Tarrant County Cultural Education Facilities Finance Corp. Revenue Bonds (Texas Health Resources Obligated Group), Series A, 4.00%, 02/15/2036 | $ | 1,000,000 | $ | 1,051,480 | ||||
Texas A&M University Revenue Bonds (Financing System), Series A, 5.00%, 05/15/2025 | 1,065,000 | 1,127,590 | ||||||
Texas Municipal Gas Acquisition & Supply Corp. I Revenue Bonds, Series D, 6.25%, 12/15/2026 | 1,500,000 | 1,835,370 | ||||||
University of North Texas Revenue Bonds (Financing System), Series A, 5.00%, 04/15/2028 | 1,000,000 | 1,055,600 | ||||||
| 19,778,654 | ||||||||
Utah (0.1%) | ||||||||
Salt Lake City Corp. Airport Revenue Bonds, Series B, 5.00%, 07/01/2042 | 100,000 | 116,484 | ||||||
Washington (6.3%) | ||||||||
City of Seattle Water System Revenue Bonds, 5.00%, 02/01/2026 | 1,000,000 | 1,009,930 | ||||||
County of King General Obligation Limited Bonds, 5.00%, 01/01/2025 | 2,000,000 | 2,013,200 | ||||||
State of Washington General Obligation Unlimited Bonds, Series R-2010A, 5.00%, 01/01/2022 | 2,000,000 | 2,089,700 | ||||||
| 5,112,830 | ||||||||
West Virginia (0.7%) | ||||||||
West Virginia Economic Development Authority Revenue Bonds, Unrefunded, Series A, 1.90%, 03/01/2040 (a) | 550,000 | 552,679 | ||||||
Wisconsin (1.0%) | ||||||||
Wisconsin Health & Educational Facilities Authority Revenue Bonds (Aurora Health Care), Series A, 5.00%, 07/15/2028 | 500,000 | 547,860 | ||||||
Wisconsin Health & Educational Facilities Authority Revenue Bonds (Froedtert Health, Inc. Obligated Group), Series 2017 A, 5.00%, 04/01/2035 | 250,000 | 290,568 | ||||||
| 838,428 | ||||||||
Total Municipal Bonds | 80,184,265 | |||||||
SHORT-TERM INVESTMENT (0.9%) | ||||||||
UNITED STATES (0.9%) | ||||||||
State Street Institutional U.S. Government Money Market Fund, Institutional Class, 0.96% (d) | 781,021 | 781,021 | ||||||
Total Short-Term Investment | 781,021 | |||||||
Total Investments | 80,965,286 | |||||||
Other Assets in Excess of Liabilities—0.1% | 52,334 | |||||||
Net Assets—100.0% | $ | 81,017,620 | ||||||
| (a) | Variable or Floating Rate Security. Rate disclosed is as of October 31, 2017. |
| (b) | Issued with a zero coupon. |
| (c) | Sinkable security. |
| (d) | Registered investment company advised by State Street Global Advisors. The rate shown is the current yield as of October 31, 2017. |
| (e) | See accompanying Notes to Financial Statements for tax unrealized appreciation/(depreciation) of securities. |
See accompanying Notes to Financial Statements.
| 2017 Annual Report | 37 |
Statements of Assets and Liabilities
October 31, 2017
| Aberdeen Asia Bond Fund | Aberdeen Emerging Markets Debt Fund | Aberdeen Global Unconstrained Fixed Income Fund | Aberdeen Tax-Free Income Fund | |||||||||||||
Assets: | ||||||||||||||||
Investments, at value | $ | 5,445,198 | $ | 21,759,941 | $ | 12,224,482 | $ | 80,184,265 | ||||||||
Short-term investments, at value | 671,389 | 1,396,810 | 647,387 | 781,021 | ||||||||||||
Cash collateral pledged for swaps contracts | – | – | 245,845 | – | ||||||||||||
Foreign currency, at value | 181,261 | 26,052 | 17,104 | – | ||||||||||||
Cash collateral pledged for futures | 18,262 | – | 81,045 | – | ||||||||||||
Cash | – | – | – | 70 | ||||||||||||
Cash at broker for China A shares | 7 | – | – | – | ||||||||||||
Due from broker | – | – | 10,821 | – | ||||||||||||
Interest and dividends receivable | 77,125 | 314,347 | 127,192 | 1,020,425 | ||||||||||||
Unrealized appreciation on forward foreign currency exchange contracts | 131,165 | 7,577 | 157,346 | – | ||||||||||||
Receivable for investments sold | – | 203,076 | – | – | ||||||||||||
Receivable for capital shares issued | – | 74,647 | 1,465 | – | ||||||||||||
Receivable from Adviser | 12,062 | 18,147 | 17,556 | 8,047 | ||||||||||||
Over-the-counter credit default swaps, at value (net upfront payments of $0, $0, $26,998 and $0, respectively) | – | – | 36,563 | – | ||||||||||||
Variation margin receivable for futures contracts | 2,694 | – | 48,657 | – | ||||||||||||
Prepaid expenses | 19,113 | 40,764 | 40,829 | 32,852 | ||||||||||||
|
|
|
|
|
|
|
| |||||||||
Total assets | 6,558,276 | 23,841,361 | 13,656,292 | 82,026,680 | ||||||||||||
|
|
|
|
|
|
|
| |||||||||
Liabilities: | ||||||||||||||||
Due to custodian | – | – | 61,271 | – | ||||||||||||
Due to broker | – | – | 29,908 | – | ||||||||||||
Payable for investments purchased | – | 200,000 | – | 810,263 | ||||||||||||
Unrealized depreciation on forward foreign currency exchange contracts | 123,744 | 5,416 | 171,225 | – | ||||||||||||
Over-the-counter credit default swaps, at value (net upfront receipts of $0, $0, $2,345 and $0, respectively) | – | – | 11,526 | – | ||||||||||||
Distributions payable | – | – | – | 8,852 | ||||||||||||
Payable for capital shares redeemed | – | 10,702 | 19,660 | 120,444 | ||||||||||||
Accrued foreign capital gains tax | 6,243 | 12,328 | – | – | ||||||||||||
Payable for interest rate swaps closed | – | – | 4,412 | – | ||||||||||||
Variation margin payable for futures contracts | – | – | 18,591 | – | ||||||||||||
Variation margin payable for centrally cleared swap contracts | – | – | 1,733 | – | ||||||||||||
Accrued expenses and other payables: | ||||||||||||||||
Investment advisory fees | 2,719 | 14,815 | 6,838 | 29,440 | ||||||||||||
Audit fees | 7,750 | 7,750 | 7,750 | 7,750 | ||||||||||||
Custodian fees | 8,186 | 1,593 | 15,979 | 750 | ||||||||||||
Transfer agent fees | 4,095 | 3,783 | 4,258 | 13,227 | ||||||||||||
Printing fees | 3,732 | 1,205 | 4,763 | 5,916 | ||||||||||||
Sub-transfer agent and administrative services fees | 3,507 | 3,086 | 4,792 | 672 | ||||||||||||
Administration fees | 435 | 1,580 | 912 | 5,542 | ||||||||||||
Distribution fees | 386 | 1,806 | 394 | 2,435 | ||||||||||||
Fund accounting fees | 337 | 339 | 266 | 1,543 | ||||||||||||
Legal fees | 72 | 331 | 196 | 1,176 | ||||||||||||
Other accrued expenses | 8,989 | 7,683 | 1,254 | 1,050 | ||||||||||||
|
|
|
|
|
|
|
| |||||||||
Total liabilities | 170,195 | 272,417 | 365,728 | 1,009,060 | ||||||||||||
|
|
|
|
|
|
|
| |||||||||
Net Assets | $ | 6,388,081 | $ | 23,568,944 | $ | 13,290,564 | $ | 81,017,620 | ||||||||
|
|
|
|
|
|
|
| |||||||||
Cost: | ||||||||||||||||
Investments | $ | 5,362,801 | $ | 21,240,039 | $ | 12,041,646 | $ | 75,531,380 | ||||||||
Short-term investments | 671,389 | 1,396,810 | 647,387 | 781,021 | ||||||||||||
Foreign currency | 181,145 | 27,886 | 13,385 | – | ||||||||||||
Represented by: | ||||||||||||||||
Capital | $ | 11,104,966 | $ | 26,227,176 | $ | 13,125,602 | $ | 76,582,582 | ||||||||
Accumulated net investment income/(loss) | 377,043 | 272,098 | 152,207 | (8,851 | ) | |||||||||||
Accumulated net realized loss from investments, futures contracts, swaps and foreign currency transactions | (5,204,638 | ) | (3,448,464 | ) | (10,230 | ) | (208,996 | ) | ||||||||
Net unrealized appreciation on investments, futures contracts, forwards and translation of assets and liabilities denominated in foreign currencies | 110,710 | 518,134 | 22,985 | 4,652,885 | ||||||||||||
|
|
|
|
|
|
|
| |||||||||
Net Assets | $ | 6,388,081 | $ | 23,568,944 | $ | 13,290,564 | $ | 81,017,620 | ||||||||
|
|
|
|
|
|
|
| |||||||||
Net Assets: | ||||||||||||||||
Class A Shares | $ | 1,091,082 | $ | 1,987,458 | $ | 805,571 | $ | 9,084,216 | ||||||||
Class C Shares | 175,057 | 260,639 | 246,627 | 542,244 | ||||||||||||
Class R Shares | 10,844 | 2,934,062 | – | 10,709 | ||||||||||||
Institutional Service Class Shares | 184,119 | 21,521 | 10,553,484 | 18,105 | ||||||||||||
Institutional Class Shares | 4,926,979 | 18,365,264 | 1,684,882 | 71,362,346 | ||||||||||||
|
|
|
|
|
|
|
| |||||||||
Total | $ | 6,388,081 | $ | 23,568,944 | $ | 13,290,564 | $ | 81,017,620 | ||||||||
|
|
|
|
|
|
|
| |||||||||
Amounts listed as “–” are $0 or round to $0.
See accompanying Notes to Financial Statements.
| 38 | Annual Report 2017 |
Statements of Assets and Liabilities (concluded)
October 31, 2017
| Aberdeen Asia Bond Fund | Aberdeen Emerging Markets Debt Fund | Aberdeen Global Unconstrained Fixed Income Fund | Aberdeen Tax-Free Income Fund | |||||||||||||
Shares Outstanding (unlimited number of shares authorized): | ||||||||||||||||
Class A Shares | 102,205 | 193,427 | 78,833 | 918,477 | ||||||||||||
Class C Shares | 16,849 | 25,501 | 24,725 | 54,934 | ||||||||||||
Class R Shares | 1,024 | 286,302 | – | 1,082 | ||||||||||||
Institutional Service Class Shares | 17,134 | 2,089 | 1,028,113 | 1,830 | ||||||||||||
Institutional Class Shares | 458,761 | 1,783,962 | 163,069 | 7,209,440 | ||||||||||||
|
|
|
|
|
|
|
| |||||||||
Total | 595,973 | 2,291,281 | 1,294,740 | 8,185,763 | ||||||||||||
|
|
|
|
|
|
|
| |||||||||
Net asset value and redemption price per share (Net assets by class divided by shares outstanding by class, respectively): | ||||||||||||||||
Class A Shares | $ | 10.68 | $ | 10.27 | $ | 10.22 | $ | 9.89 | ||||||||
Class C Shares (a) | $ | 10.39 | $ | 10.22 | $ | 9.97 | (b) | $ | 9.87 | |||||||
Class R Shares | $ | 10.59 | $ | 10.25 | $ | – | $ | 9.90 | ||||||||
Institutional Service Class Shares | $ | 10.75 | $ | 10.30 | $ | 10.26 | $ | 9.89 | ||||||||
Institutional Class Shares | $ | 10.74 | $ | 10.29 | $ | 10.33 | $ | 9.90 | ||||||||
Maximum offering price per share (100%/(100%-maximum sales charge) of net asset value adjusted to the nearest cent): | ||||||||||||||||
Class A Shares | $ | 11.15 | $ | 10.73 | $ | 10.67 | $ | 10.33 | ||||||||
Maximum Sales Charge: | ||||||||||||||||
Class A Shares | 4.25 | % | 4.25 | % | 4.25 | % | 4.25 | % | ||||||||
| (a) | For Class C Shares, the redemption price per share is reduced by 1.00% for shares held less than one year due to contingent deferred sales charge. |
| (b) | The NAV shown above differs from the traded NAV on October 31, 2017 due to financial statement rounding and/or financial statement adjustments. |
Amounts listed as “–” are $0 or round to $0.
See accompanying Notes to Financial Statements.
| 2017 Annual Report | 39 |
Statements of Operations
For the Year Ended October 31, 2017
| Aberdeen Asia Bond Fund | Aberdeen Emerging Markets Debt Fund | Aberdeen Global Unconstrained Fixed Income Fund | Aberdeen Tax-Free Income Fund | |||||||||||||
INVESTMENT INCOME: | ||||||||||||||||
Dividend income | $ | 1,149 | $ | – | $ | – | $ | 19,325 | ||||||||
Interest income | 957,772 | 1,316,790 | 368,722 | 3,241,994 | ||||||||||||
Foreign tax withholding | (19,201 | ) | (2,561 | ) | – | – | ||||||||||
Other income | – | 6,000 | 11,738 | – | ||||||||||||
|
|
|
|
|
|
|
| |||||||||
Total Income | 939,720 | 1,320,229 | 380,460 | 3,261,319 | ||||||||||||
|
|
|
|
|
|
|
| |||||||||
EXPENSES: | ||||||||||||||||
Investment advisory fees | 95,659 | 156,639 | 92,029 | 364,404 | ||||||||||||
Administration fees | 15,305 | 16,708 | 12,271 | 68,594 | ||||||||||||
Distribution fees Class A | 2,616 | 1,724 | 2,425 | 23,808 | ||||||||||||
Distribution fees Class C | 2,321 | 2,967 | 3,719 | 10,116 | ||||||||||||
Distribution fees Class R | 52 | 9,399 | – | 53 | ||||||||||||
Sub-transfer agent fees Institutional Class | 9,406 | 13,564 | 4,183 | 1,253 | ||||||||||||
Sub-transfer agent and administrative service fees Class A | 238 | 1,527 | 696 | 1,403 | ||||||||||||
Sub-transfer agent fees Class C | 118 | 190 | 387 | 461 | ||||||||||||
Sub-transfer agent and administrative service fees Class R | – | 3,046 | – | – | ||||||||||||
Sub-transfer agent and administrative service fees Institutional Service Class | 12,502 | – | 18,616 | 17 | ||||||||||||
Fund accounting fees | 2,070 | 2,158 | 1,581 | 8,692 | ||||||||||||
Transfer agent fees | 15,112 | 11,909 | 15,735 | 63,056 | ||||||||||||
Trustee fees | 2,325 | 2,555 | 2,204 | 6,670 | ||||||||||||
Legal fees | 1,945 | 2,506 | 999 | 5,495 | ||||||||||||
Printing fees | 15,497 | 8,762 | 18,365 | 21,476 | ||||||||||||
Custodian fees | 34,859 | 8,994 | 86,472 | 5,019 | ||||||||||||
Registration and filing fees | 72,329 | 73,919 | 75,863 | 72,346 | ||||||||||||
Audit fees | 42,150 | 42,150 | 53,150 | 39,850 | ||||||||||||
Other | 23,554 | 24,843 | 13,180 | 17,935 | ||||||||||||
|
|
|
|
|
|
|
| |||||||||
Total expenses before reimbursed/waived expenses | 348,058 | 383,560 | 401,875 | 710,648 | ||||||||||||
Interest expense (Note 9) | 571 | – | 62 | 600 | ||||||||||||
|
|
|
|
|
|
|
| |||||||||
Total operating expenses before reimbursed/waived expenses | 348,629 | 383,560 | 401,937 | 711,248 | ||||||||||||
Expenses reimbursed | (196,408 | ) | (176,930 | ) | (246,045 | ) | (143,650 | ) | ||||||||
|
|
|
|
|
|
|
| |||||||||
Net expenses | 152,221 | 206,630 | 155,892 | 567,598 | ||||||||||||
|
|
|
|
|
|
|
| |||||||||
Net Investment Income | 787,499 | 1,113,599 | 224,568 | 2,693,721 | ||||||||||||
|
|
|
|
|
|
|
| |||||||||
REALIZED/UNREALIZED GAIN/(LOSS) FROM INVESTMENTS: | ||||||||||||||||
Realized gain/(loss) on investment transactions | (435,582 | ) | 176,007 | 56,994 | (39,259 | ) | ||||||||||
Realized gain/(loss) on futures contracts | 25,311 | – | 59,085 | – | ||||||||||||
Realized gain/(loss) on swap contracts | – | – | (83,177 | ) | – | |||||||||||
Realized gain/(loss) on forward foreign currency exchange contracts | 4,595 | (89,723 | ) | (124,193 | ) | – | ||||||||||
Realized gain/(loss) on foreign currency transactions | (27,348 | ) | 2,875 | 33,322 | – | |||||||||||
|
|
|
|
|
|
|
| |||||||||
Net realized gain/(loss) from investments, futures contracts, swaps and foreign currency transactions | (433,024 | ) | 89,159 | (57,969 | ) | (39,259 | ) | |||||||||
|
|
|
|
|
|
|
| |||||||||
Net change in unrealized appreciation/(depreciation) on investment transactions | (44,306 | ) | 1,382,495 | 381,134 | (1,933,759 | ) | ||||||||||
Net change in unrealized appreciation/depreciation on futures contracts | 66,598 | – | (17,020 | ) | – | |||||||||||
Net change in unrealized appreciation/depreciation on swap contracts | – | – | (180,203 | ) | – | |||||||||||
Net change in unrealized appreciation/(depreciation) on forward foreign currency exchange contracts | 158,928 | (2,813 | ) | (68,880 | ) | – | ||||||||||
Net change in unrealized appreciation/(depreciation) on foreign currency translation | 2,289 | (50,913 | ) | (3,935 | ) | – | ||||||||||
|
|
|
|
|
|
|
| |||||||||
Net change in unrealized appreciation/(depreciation) from investments, futures contracts, swaps and translation of assets and liabilities denominated in foreign currencies | 183,509 | 1,328,769 | 111,096 | (1,933,759 | ) | |||||||||||
|
|
|
|
|
|
|
| |||||||||
Net realized/unrealized gain/(loss) from investments, futures contracts, swaps and foreign currency transactions | (249,515 | ) | 1,417,928 | 53,127 | (1,973,018 | ) | ||||||||||
|
|
|
|
|
|
|
| |||||||||
CHANGE IN NET ASSETS RESULTING FROM OPERATIONS | $ | 537,984 | $ | 2,531,527 | $ | 277,695 | $ | 720,703 | ||||||||
|
|
|
|
|
|
|
| |||||||||
| Amounts | listed as “–” are $0 or round to $0. |
See accompanying Notes to Financial Statements.
| 40 | Annual Report 2017 |
Statements of Changes in Net Assets
Aberdeen Asia Bond Fund | Aberdeen Emerging Markets Debt Fund | |||||||||||||||
| Year Ended October 31, 2017 | Year Ended October 31, 2016 | Year Ended October 31, 2017 | Year Ended October 31, 2016 | |||||||||||||
FROM INVESTMENT ACTIVITIES: | ||||||||||||||||
Operations: | ||||||||||||||||
Net investment income | $ | 787,499 | $ | 1,605,965 | $ | 1,113,599 | $ | 1,651,246 | ||||||||
Net realized gain/(loss) from investments, futures contracts, swaps and foreign currency transactions | (433,024 | ) | (2,256,303 | ) | 89,159 | (2,354,314 | ) | |||||||||
Net change in unrealized appreciation/(depreciation) on investments, futures contracts, swaps and translation of assets and liabilities denominated in foreign currencies | 183,509 | 2,127,618 | 1,328,769 | 2,539,728 | ||||||||||||
|
|
|
|
|
|
|
| |||||||||
Changes in net assets resulting from operations | 537,984 | 1,477,280 | 2,531,527 | 1,836,660 | ||||||||||||
|
|
|
|
|
|
|
| |||||||||
Distributions to Shareholders From: | ||||||||||||||||
Net investment income: | ||||||||||||||||
Class A | – | – | (21,569 | ) | (257 | ) | ||||||||||
Class C | – | – | (4,951 | ) | (17,166 | ) | ||||||||||
Class R | – | – | (51,220 | ) | (236 | ) | ||||||||||
Institutional Service Class | – | – | (590 | ) | (266 | ) | ||||||||||
Institutional Class | – | – | (512,681 | ) | (752,149 | ) | ||||||||||
Tax return of capital: | ||||||||||||||||
Class A | – | (7,596 | ) | – | (43 | ) | ||||||||||
Class C | – | (5,446 | ) | – | (283 | ) | ||||||||||
Class R | – | (93 | ) | – | (42 | ) | ||||||||||
Institutional Service Class | – | (107,254 | ) | – | (42 | ) | ||||||||||
Institutional Class | – | (331,890 | ) | – | (119,327 | ) | ||||||||||
|
|
|
|
|
|
|
| |||||||||
Change in net assets from shareholder distributions | – | (452,279 | ) | (591,011 | ) | (889,811 | ) | |||||||||
|
|
|
|
|
|
|
| |||||||||
Common Stock Transactions: | ||||||||||||||||
Change in net assets from capital transactions | (23,701,899 | ) | (57,849,596 | ) | 2,653,709 | (10,121,916 | ) | |||||||||
|
|
|
|
|
|
|
| |||||||||
Change in net assets | (23,163,915 | ) | (56,824,595 | ) | 4,594,225 | (9,175,067 | ) | |||||||||
|
|
|
|
|
|
|
| |||||||||
Net Assets: | ||||||||||||||||
Beginning of year | 29,551,996 | 86,376,591 | 18,974,719 | 28,149,786 | ||||||||||||
|
|
|
|
|
|
|
| |||||||||
End of year | $ | 6,388,081 | $ | 29,551,996 | $ | 23,568,944 | $ | 18,974,719 | ||||||||
|
|
|
|
|
|
|
| |||||||||
Accumulated net investment income/(loss) at end of year | $ | 377,043 | $ | 22,146 | $ | 272,098 | $ | (142,399 | ) | |||||||
|
|
|
|
|
|
|
| |||||||||
| Amounts | listed as “–” are $0 or round to $0. |
See accompanying Notes to Financial Statements.
| 2017 Annual Report | 41 |
Statements of Changes in Net Assets (continued)
Aberdeen Asia Bond Fund | Aberdeen Emerging Markets Debt Fund | |||||||||||||||
| Year Ended October 31, 2017 | Year Ended October 31, 2016 | Year Ended October 31, 2017 | Year Ended October 31, 2016 | |||||||||||||
CAPITAL TRANSACTIONS: | ||||||||||||||||
Class A Shares | ||||||||||||||||
Proceeds from shares issued | $ | 197,708 | $ | 406,446 | $ | 2,044,646 | $ | 202,894 | ||||||||
Proceeds of shares issued in connection with fund merger(b) | – | – | – | 40,646 | ||||||||||||
Dividends reinvested | – | 7,596 | 21,569 | 300 | ||||||||||||
Cost of shares redeemed(a) | (183,758 | ) | (182,171 | ) | (363,120 | ) | (11,029 | ) | ||||||||
|
|
|
|
|
|
|
| |||||||||
Total Class A | 13,950 | 231,871 | 1,703,095 | 232,811 | ||||||||||||
|
|
|
|
|
|
|
| |||||||||
Class C Shares | ||||||||||||||||
Proceeds from shares issued | 7,370 | 56,014 | – | – | ||||||||||||
Proceeds of shares issued in connection with fund merger(b) | – | – | – | 114,371 | ||||||||||||
Dividends reinvested | – | 3,688 | 4,032 | 17,449 | ||||||||||||
Cost of shares redeemed(a) | (158,699 | ) | (355,875 | ) | (143,474 | ) | (449,962 | ) | ||||||||
|
|
|
|
|
|
|
| |||||||||
Total Class C | (151,329 | ) | (296,173 | ) | (139,442 | ) | (318,142 | ) | ||||||||
|
|
|
|
|
|
|
| |||||||||
Class R Shares | ||||||||||||||||
Proceeds from shares issued | – | – | 2,017,827 | 215,021 | ||||||||||||
Proceeds of shares issued in connection with fund merger(b) | – | – | – | 1,098,312 | ||||||||||||
Dividends reinvested | – | 93 | 51,220 | 278 | ||||||||||||
Cost of shares redeemed(a) | – | – | (484,492 | ) | (57,592 | ) | ||||||||||
| �� |
|
|
|
|
|
|
|
| ||||||||
Total Class R | – | 93 | 1,584,555 | 1,256,019 | ||||||||||||
|
|
|
|
|
|
|
| |||||||||
Institutional Service Class Shares | ||||||||||||||||
Proceeds from shares issued | 22,152 | 381,000 | – | – | ||||||||||||
Proceeds of shares issued in connection with fund merger(b) | – | – | – | 6,938 | ||||||||||||
Dividends reinvested | – | 106,653 | 590 | 308 | ||||||||||||
Cost of shares redeemed(a) | (9,835,665 | ) | (2,316,823 | ) | – | – | ||||||||||
|
|
|
|
|
|
|
| |||||||||
Total Institutional Service Class | (9,813,513 | ) | (1,829,170 | ) | 590 | 7,246 | ||||||||||
|
|
|
|
|
|
|
| |||||||||
Institutional Class Shares | ||||||||||||||||
Proceeds from shares issued | 1,911,340 | 2,415,016 | 6,136,523 | 239,361 | ||||||||||||
Proceeds of shares issued in connection with fund merger(b) | – | – | – | 10,985,000 | ||||||||||||
Dividends reinvested | – | 326,914 | 507,047 | 858,055 | ||||||||||||
Cost of shares redeemed(a) | (15,662,348 | ) | (58,698,147 | ) | (7,138,659 | ) | (23,382,266 | ) | ||||||||
|
|
|
|
|
|
|
| |||||||||
Total Institutional Class | (13,751,008 | ) | (55,956,217 | ) | (495,089 | ) | (11,299,850 | ) | ||||||||
|
|
|
|
|
|
|
| |||||||||
Change in net assets from capital transactions: | $ | (23,701,900 | ) | $ | (57,849,596 | ) | $ | 2,653,709 | $ | (10,121,916 | ) | |||||
|
|
|
|
|
|
|
| |||||||||
| (a) | Includes redemption fees, if any. |
| (b) | Proceeds of shares issued in connection with the merger of the Aberdeen Emerging Markets Debt Local Currency Fund into the Aberdeen Emerging Markets Debt Fund on August 15, 2016. |
| Amounts | listed as “–” are $0 or round to $0. |
See accompanying Notes to Financial Statements.
| 42 | Annual Report 2017 |
Statements of Changes in Net Assets (continued)
Aberdeen Asia Bond Fund | Aberdeen Emerging Markets Debt Fund | |||||||||||||||
| Year Ended October 31, 2017 | Year Ended October 31, 2016 | Year Ended October 31, 2017 | Year Ended October 31, 2016 | |||||||||||||
SHARE TRANSACTIONS: | ||||||||||||||||
Class A Shares | ||||||||||||||||
Issued | 19,571 | 39,806 | 202,334 | 20,968 | ||||||||||||
Issued in connection with fund merger(a) | – | – | – | 4,393 | ||||||||||||
Reinvested | – | 798 | 2,102 | 36 | ||||||||||||
Redeemed | (18,154 | ) | (19,199 | ) | (36,382 | ) | (1,157 | ) | ||||||||
|
|
|
|
|
|
|
| |||||||||
Total Class A Shares | 1,417 | 21,405 | 168,054 | 24,240 | ||||||||||||
|
|
|
|
|
|
|
| |||||||||
Class C Shares | ||||||||||||||||
Issued | 735 | 5,903 | – | – | ||||||||||||
Issued in connection with fund merger(a) | – | – | – | 12,044 | ||||||||||||
Reinvested | – | 393 | 398 | 2,095 | ||||||||||||
Redeemed | (16,043 | ) | (37,085 | ) | (15,172 | ) | (48,062 | ) | ||||||||
|
|
|
|
|
|
|
| |||||||||
Total Class C Shares | (15,308 | ) | (30,789 | ) | (14,774 | ) | (33,923 | ) | ||||||||
|
|
|
|
|
|
|
| |||||||||
Class R Shares | ||||||||||||||||
Issued | – | – | 176,546 | 22,022 | ||||||||||||
Issued in connection with fund merger(a) | – | – | – | 136,435 | ||||||||||||
Reinvested | – | 10 | 5,049 | 34 | ||||||||||||
Redeemed | – | – | (48,964 | ) | (5,912 | ) | ||||||||||
|
|
|
|
|
|
|
| |||||||||
Total Class R Shares | – | 10 | 132,631 | 152,579 | ||||||||||||
|
|
|
|
|
|
|
| |||||||||
Institutional Service Class Shares | ||||||||||||||||
Issued | 2,174 | 38,233 | – | – | ||||||||||||
Issued in connection with fund merger(a) | – | – | – | 886 | ||||||||||||
Reinvested | – | 11,227 | 58 | 38 | ||||||||||||
Redeemed | (937,006 | ) | (236,302 | ) | – | – | ||||||||||
|
|
|
|
|
|
|
| |||||||||
Total Institutional Service Class Shares | (934,832 | ) | (186,842 | ) | 58 | 924 | ||||||||||
|
|
|
|
|
|
|
| |||||||||
Institutional Class Shares | ||||||||||||||||
Issued | 189,534 | 247,614 | 734,421 | 25,251 | ||||||||||||
Issued in connection with fund merger(a) | – | – | – | 1,023,421 | ||||||||||||
Reinvested | – | 34,340 | 50,032 | 103,255 | ||||||||||||
Redeemed | (1,536,320 | ) | (6,049,506 | ) | (728,374 | ) | (2,555,245 | ) | ||||||||
|
|
|
|
|
|
|
| |||||||||
Total Institutional Class Shares | (1,346,786 | ) | (5,767,552 | ) | 56,079 | (1,403,318 | ) | |||||||||
|
|
|
|
|
|
|
| |||||||||
Total change in shares: | (2,295,509 | ) | (5,963,768 | ) | 342,048 | (1,259,498 | ) | |||||||||
|
|
|
|
|
|
|
| |||||||||
| (a) | Issued in connection with the merger of the Aberdeen Emerging Markets Debt Local Currency Fund into the Aberdeen Emerging Markets Debt Fund on August 15, 2016. |
Amounts listed as “–” are $0 or round to $0.
See accompanying Notes to Financial Statements.
| 2017 Annual Report | 43 |
Statements of Changes in Net Assets (continued)
Aberdeen Global Unconstrained Fixed Income Fund | Aberdeen Tax-Free Income Fund | |||||||||||||||
| Year Ended October 31, 2017 | Year Ended October 31, 2016 | Year Ended October 31, 2017 | Year Ended October 31, 2016 | |||||||||||||
FROM INVESTMENT ACTIVITIES: | ||||||||||||||||
Operations: | ||||||||||||||||
Net investment income | $ | 224,568 | $ | 196,737 | $ | 2,693,721 | $ | 2,974,918 | ||||||||
Net realized gain/(loss) from investments, futures contracts, swaps and foreign currency transactions | (57,969 | ) | 344,446 | (39,259 | ) | 38,085 | ||||||||||
Net change in unrealized appreciation/(depreciation) on investments, futures contracts, swaps and translation of assets and liabilities denominated in foreign currencies | 111,096 | 578,921 | (1,933,759 | ) | (748,133 | ) | ||||||||||
|
|
|
|
|
|
|
| |||||||||
Changes in net assets resulting from operations | 277,695 | 1,120,104 | 720,703 | 2,264,870 | ||||||||||||
|
|
|
|
|
|
|
| |||||||||
Distributions to Shareholders From: | ||||||||||||||||
Net investment income: | ||||||||||||||||
Class A | – | (2,781 | ) | (277,956 | ) | (305,772 | ) | |||||||||
Class C | – | (551 | ) | (22,335 | ) | (15,726 | ) | |||||||||
Class R | – | – | (283 | ) | (289 | ) | ||||||||||
Institutional Service Class | – | (40,809 | ) | (704 | ) | (736 | ) | |||||||||
Institutional Class | – | (5,182 | ) | (2,392,443 | ) | (2,643,402 | ) | |||||||||
Net realized gains: | ||||||||||||||||
Class A | (10,566 | ) | – | – | – | |||||||||||
Class C | (4,764 | ) | – | – | – | |||||||||||
Institutional Service Class | (123,195 | ) | – | – | – | |||||||||||
Institutional Class | (51,496 | ) | – | – | – | |||||||||||
Tax return of capital: | ||||||||||||||||
Class A | – | – | – | (1,002 | ) | |||||||||||
Class C | – | – | – | (68 | ) | |||||||||||
Class R | – | – | – | (1 | ) | |||||||||||
Institutional Service Class | – | – | – | (2 | ) | |||||||||||
Institutional Class | – | – | – | (7,922 | ) | |||||||||||
|
|
|
|
|
|
|
| |||||||||
Change in net assets from shareholder distributions | (190,021 | ) | (49,323 | ) | (2,693,721 | ) | (2,974,920 | ) | ||||||||
|
|
|
|
|
|
|
| |||||||||
Common Stock Transactions: | ||||||||||||||||
Change in net assets from capital transactions | (2,545,971 | ) | (579,023 | ) | (7,976,144 | ) | (1,442,082 | ) | ||||||||
|
|
|
|
|
|
|
| |||||||||
Change in net assets | (2,458,297 | ) | 491,758 | (9,949,162 | ) | (2,152,132 | ) | |||||||||
|
|
|
|
|
|
|
| |||||||||
Net Assets: | ||||||||||||||||
Beginning of year | 15,748,861 | 15,257,103 | 90,966,782 | 93,118,914 | ||||||||||||
|
|
|
|
|
|
|
| |||||||||
End of year | $ | 13,290,564 | $ | 15,748,861 | $ | 81,017,620 | $ | 90,966,782 | ||||||||
|
|
|
|
|
|
|
| |||||||||
Accumulated net investment income/(loss) at end of year | $ | 152,207 | $ | (58,636 | ) | $ | (8,851 | ) | $ | (9,349 | ) | |||||
|
|
|
|
|
|
|
| |||||||||
Amounts listed as “–” are $0 or round to $0.
See accompanying Notes to Financial Statements.
| 44 | Annual Report 2017 |
Statements of Changes in Net Assets (continued)
Aberdeen Global Unconstrained Fixed Income Fund | Aberdeen Tax-Free Income Fund | |||||||||||||||
| Year Ended October 31, 2017 | Year Ended October 31, 2016 | Year Ended October 31, 2017 | Year Ended October 31, 2016 | |||||||||||||
CAPITAL TRANSACTIONS: | ||||||||||||||||
Class A Shares | ||||||||||||||||
Proceeds from shares issued | $ | 217,180 | $ | 1,153,055 | $ | 428,418 | $ | 4,280,512 | ||||||||
Dividends reinvested | 10,302 | 2,151 | 211,612 | 228,631 | ||||||||||||
Cost of shares redeemed(a) | (1,246,071 | ) | (221,735 | ) | (2,116,919 | ) | (2,703,863 | ) | ||||||||
|
|
|
|
|
|
|
| |||||||||
Total Class A | (1,018,589 | ) | 933,471 | (1,476,889 | ) | 1,805,280 | ||||||||||
|
|
|
|
|
|
|
| |||||||||
Class C Shares | ||||||||||||||||
Proceeds from shares issued | 28,226 | 321,590 | 754,262 | 484,388 | ||||||||||||
Dividends reinvested | 4,399 | 518 | 19,798 | 12,550 | ||||||||||||
Cost of shares redeemed(a) | (187,729 | ) | (190,410 | ) | (1,062,506 | ) | (515,847 | ) | ||||||||
|
|
|
|
|
|
|
| |||||||||
Total Class C | (155,104 | ) | 131,698 | (288,446 | ) | (18,909 | ) | |||||||||
|
|
|
|
|
|
|
| |||||||||
Class R Shares | ||||||||||||||||
Dividends reinvested | – | – | 283 | 291 | ||||||||||||
|
|
|
|
|
|
|
| |||||||||
Total Class R | – | – | 283 | 291 | ||||||||||||
|
|
|
|
|
|
|
| |||||||||
Institutional Service Class Shares | ||||||||||||||||
Proceeds from shares issued | 1,308,965 | 649,399 | 2,472 | 10,061 | ||||||||||||
Dividends reinvested | 121,013 | 39,375 | 672 | 738 | ||||||||||||
Cost of shares redeemed(a) | (1,876,638 | ) | (3,372,599 | ) | (12,458 | ) | (15 | ) | ||||||||
|
|
|
|
|
|
|
| |||||||||
Total Institutional Service Class | (446,660 | ) | (2,683,825 | ) | (9,314 | ) | 10,784 | |||||||||
|
|
|
|
|
|
|
| |||||||||
Institutional Class Shares | ||||||||||||||||
Proceeds from shares issued | 3,069,715 | 1,639,260 | 2,940,975 | 1,472,091 | ||||||||||||
Dividends reinvested | 51,431 | 5,179 | 1,863,928 | 1,973,683 | ||||||||||||
Cost of shares redeemed(a) | (4,046,764 | ) | (604,806 | ) | (11,006,681 | ) | (6,685,302 | ) | ||||||||
|
|
|
|
|
|
|
| |||||||||
Total Institutional Class | (925,618 | ) | 1,039,633 | (6,201,778 | ) | (3,239,528 | ) | |||||||||
|
|
|
|
|
|
|
| |||||||||
Change in net assets from capital transactions: | $ | (2,545,971 | ) | $ | (579,023 | ) | $ | (7,976,144 | ) | $ | (1,442,082 | ) | ||||
|
|
|
|
|
|
|
| |||||||||
| (a) | Includes redemption fees, if any. |
Amounts listed as “–” are $0 or round to $0.
See accompanying Notes to Financial Statements.
| 2017 Annual Report | 45 |
Statements of Changes in Net Assets (concluded)
Aberdeen Global Unconstrained Fixed Income Fund | Aberdeen Tax-Free Income Fund | |||||||||||||||
| Year Ended October 31, 2017 | Year Ended October 31, 2016 | Year Ended October 31, 2017 | Year Ended October 31, 2016 | |||||||||||||
SHARE TRANSACTIONS: | ||||||||||||||||
Class A Shares | ||||||||||||||||
Issued | 21,477 | 114,100 | 43,119 | 419,435 | ||||||||||||
Reinvested | 1,021 | 233 | 21,368 | 22,384 | ||||||||||||
Redeemed | (122,740 | ) | (23,113 | ) | (213,951 | ) | (264,292 | ) | ||||||||
|
|
|
|
|
|
|
| |||||||||
Total Class A Shares | (100,242 | ) | 91,220 | (149,464 | ) | 177,527 | ||||||||||
|
|
|
|
|
|
|
| |||||||||
Class C Shares | ||||||||||||||||
Issued | 2,854 | 32,470 | 76,091 | 47,491 | ||||||||||||
Reinvested | 444 | 57 | 2,004 | 1,231 | ||||||||||||
Redeemed | (18,815 | ) | (19,242 | ) | (107,426 | ) | (50,729 | ) | ||||||||
|
|
|
|
|
|
|
| |||||||||
Total Class C Shares | (15,517 | ) | 13,285 | (29,331 | ) | (2,007 | ) | |||||||||
|
|
|
|
|
|
|
| |||||||||
Class R Shares | ||||||||||||||||
Reinvested | – | – | 29 | 29 | ||||||||||||
|
|
|
|
|
|
|
| |||||||||
Total Class R Shares | – | – | 29 | 29 | ||||||||||||
|
|
|
|
|
|
|
| |||||||||
Institutional Service Class Shares | ||||||||||||||||
Issued | 128,798 | 65,888 | 250 | 982 | ||||||||||||
Reinvested | 11,958 | 4,252 | 68 | 72 | ||||||||||||
Redeemed | (183,897 | ) | (353,276 | ) | (1,261 | ) | (1 | ) | ||||||||
|
|
|
|
|
|
|
| |||||||||
Total Institutional Service Class Shares | (43,141 | ) | (283,136 | ) | (943 | ) | 1,053 | |||||||||
|
|
|
|
|
|
|
| |||||||||
Institutional Class Shares | ||||||||||||||||
Issued | 300,303 | 162,450 | 296,521 | 143,745 | ||||||||||||
Reinvested | 5,057 | 557 | 188,015 | 193,056 | ||||||||||||
Redeemed | (393,893 | ) | (61,379 | ) | (1,109,828 | ) | (653,558 | ) | ||||||||
|
|
|
|
|
|
|
| |||||||||
Total Institutional Class Shares | (88,533 | ) | 101,628 | (625,292 | ) | (316,757 | ) | |||||||||
|
|
|
|
|
|
|
| |||||||||
Total change in shares: | (247,433 | ) | (77,003 | ) | (805,001 | ) | (140,155 | ) | ||||||||
|
|
|
|
|
|
|
| |||||||||
Amounts listed as “–” are $0 or round to $0.
See accompanying Notes to Financial Statements.
| 46 | Annual Report 2017 |
This page intentionally left blank.
Financial Highlights
Selected Data for Each Share of Capital Outstanding Throughout the Periods Indicated
Aberdeen Asia Bond Fund
| Investment Activities | Distributions | |||||||||||||||||||||||||||||||||||
| Net Asset Value, Beginning of Period | Net (a) | Net Realized and Unrealized Gains (Losses) on Invest- ments | Total from Invest- ment Activities | Net Invest- | Net Realized Gains | Tax Return of Capital | Total Distri- | Net Asset Value, End of Period | ||||||||||||||||||||||||||||
Class A Shares | ||||||||||||||||||||||||||||||||||||
Year Ended October 31, 2017 | $ | 10.20 | $ | 0.41 | $ | 0.07 | $ | 0.48 | $ | – | $ | – | $ | – | $ | – | $ | 10.68 | ||||||||||||||||||
Year Ended October 31, 2016 | 9.75 | 0.41 | 0.14 | 0.55 | – | – | (0.10 | ) | (0.10 | ) | 10.20 | |||||||||||||||||||||||||
Year Ended October 31, 2015 | 10.19 | 0.39 | (0.71 | ) | (0.32 | ) | (0.04 | ) | – | (0.08 | ) | (0.12 | ) | 9.75 | ||||||||||||||||||||||
Year Ended October 31, 2014 | 10.43 | 0.35 | (0.12 | ) | 0.23 | (0.14 | ) | (0.33 | ) | – | (0.47 | ) | 10.19 | |||||||||||||||||||||||
Year Ended October 31, 2013 | 11.26 | 0.34 | (0.85 | ) | (0.51 | ) | (0.25 | ) | (0.07 | ) | – | (0.32 | ) | 10.43 | ||||||||||||||||||||||
Class C Shares | ||||||||||||||||||||||||||||||||||||
Year Ended October 31, 2017 | 10.00 | 0.32 | 0.07 | 0.39 | – | – | – | – | 10.39 | |||||||||||||||||||||||||||
Year Ended October 31, 2016 | 9.62 | 0.32 | 0.14 | 0.46 | – | – | (0.08 | ) | (0.08 | ) | 10.00 | |||||||||||||||||||||||||
Year Ended October 31, 2015 | 10.10 | 0.31 | (0.71 | ) | (0.40 | ) | – | – | (0.08 | ) | (0.08 | ) | 9.62 | |||||||||||||||||||||||
Year Ended October 31, 2014 | 10.37 | 0.28 | (0.11 | ) | 0.17 | (0.11 | ) | (0.33 | ) | – | (0.44 | ) | 10.10 | |||||||||||||||||||||||
Year Ended October 31, 2013 | 11.24 | 0.26 | (0.86 | ) | (0.60 | ) | (0.20 | ) | (0.07 | ) | – | (0.27 | ) | 10.37 | ||||||||||||||||||||||
Class R Shares | ||||||||||||||||||||||||||||||||||||
Year Ended October 31, 2017 | 10.14 | 0.38 | 0.07 | 0.45 | – | – | – | – | 10.59 | |||||||||||||||||||||||||||
Year Ended October 31, 2016 | 9.71 | 0.38 | 0.14 | 0.52 | – | – | (0.09 | ) | (0.09 | ) | 10.14 | |||||||||||||||||||||||||
Year Ended October 31, 2015 | 10.16 | 0.36 | (0.70 | ) | (0.34 | ) | (0.03 | ) | – | (0.08 | ) | (0.11 | ) | 9.71 | ||||||||||||||||||||||
Year Ended October 31, 2014 | 10.42 | 0.33 | (0.12 | ) | 0.21 | (0.14 | ) | (0.33 | ) | – | (0.47 | ) | 10.16 | |||||||||||||||||||||||
Year Ended October 31, 2013 | 11.27 | 0.31 | (0.86 | ) | (0.55 | ) | (0.23 | ) | (0.07 | ) | – | (0.30 | ) | 10.42 | ||||||||||||||||||||||
Institutional Service Class Shares | ||||||||||||||||||||||||||||||||||||
Year Ended October 31, 2017 | 10.20 | 0.41 | 0.14 | 0.55 | – | – | – | – | 10.75 | |||||||||||||||||||||||||||
Year Ended October 31, 2016 | 9.74 | 0.41 | 0.15 | 0.56 | – | – | (0.10 | ) | (0.10 | ) | 10.20 | |||||||||||||||||||||||||
Year Ended October 31, 2015 | 10.20 | 0.39 | (0.72 | ) | (0.33 | ) | (0.05 | ) | – | (0.08 | ) | (0.13 | ) | 9.74 | ||||||||||||||||||||||
Year Ended October 31, 2014 | 10.43 | 0.35 | (0.10 | ) | 0.25 | (0.15 | ) | (0.33 | ) | – | (0.48 | ) | 10.20 | |||||||||||||||||||||||
Year Ended October 31, 2013 | 11.27 | 0.34 | (0.86 | ) | (0.52 | ) | (0.25 | ) | (0.07 | ) | – | (0.32 | ) | 10.43 | ||||||||||||||||||||||
Institutional Class Shares | ||||||||||||||||||||||||||||||||||||
Year Ended October 31, 2017 | 10.24 | 0.43 | 0.07 | 0.50 | – | – | – | – | 10.74 | |||||||||||||||||||||||||||
Year Ended October 31, 2016 | 9.76 | 0.42 | 0.16 | 0.58 | – | – | (0.10 | ) | (0.10 | ) | 10.24 | |||||||||||||||||||||||||
Year Ended October 31, 2015 | 10.22 | 0.40 | (0.70 | ) | (0.30 | ) | (0.08 | ) | – | (0.08 | ) | (0.16 | ) | 9.76 | ||||||||||||||||||||||
Year Ended October 31, 2014 | 10.45 | 0.38 | (0.12 | ) | 0.26 | (0.16 | ) | (0.33 | ) | – | (0.49 | ) | 10.22 | |||||||||||||||||||||||
Year Ended October 31, 2013 | 11.27 | 0.36 | (0.84 | ) | (0.48 | ) | (0.27 | ) | (0.07 | ) | – | (0.34 | ) | 10.45 | ||||||||||||||||||||||
| (a) | Net investment income/(loss) is based on average shares outstanding during the period. |
| (b) | Excludes sales charge. |
| (c) | During the period, certain fees were waived and/or reimbursed. If such waivers/reimbursements had not occurred, the ratios would have been as indicated. |
| (d) | Portfolio turnover is calculated on the basis of the Fund as a whole without distinguishing among the classes of shares. |
Amounts listed as “–” are $0 or round to $0.
See accompanying Notes to Financial Statements.
| 48 | Annual Report 2017 |
Financial Highlights (continued)
Selected Data for Each Share of Capital Outstanding Throughout the Periods Indicated
Aberdeen Asia Bond Fund (concluded)
| Ratios/Supplemental Data | ||||||||||||||||||||||
| Total Return (b) | Net Assets at End of Period (000’s) | Ratio of Expenses (Net of Reimbursements/Waivers) to Average Net Assets | Ratio of Expenses (c) | Ratio of Net Investment Income to Average Net Assets | Portfolio Turnover (d) | |||||||||||||||||
| 4.71 | %(e) | $ | 1,091 | 0.97 | %(f) | 1.95 | %(f) | 3.98 | % | 106.31 | % | |||||||||||
| 5.67 | % | 1,029 | 0.97 | %(g) | 1.40 | %(g) | 4.12 | % | 96.06 | % | ||||||||||||
| (3.16 | %) | 774 | 0.96 | %(f) | 1.09 | %(f) | 3.91 | % | 93.16 | % | ||||||||||||
| 2.41 | % | 824 | 0.95 | % | 1.05 | % | 3.52 | % | 57.03 | % | ||||||||||||
| (4.64 | %) | 1,807 | 0.95 | % | 1.03 | % | 3.18 | % | 77.93 | % | ||||||||||||
| 3.90 | %(e) | 175 | 1.70 | %(f) | 2.73 | %(f) | 3.21 | % | 106.31 | % | ||||||||||||
| 4.88 | % | 322 | 1.71 | %(g) | 2.17 | %(g) | 3.34 | % | 96.06 | % | ||||||||||||
| (3.97 | %)(e) | 606 | 1.71 | %(f) | 1.84 | %(f) | 3.19 | % | 93.16 | % | ||||||||||||
| 1.76 | %(e) | 598 | 1.70 | % | 1.80 | % | 2.77 | % | 57.03 | % | ||||||||||||
| (5.46 | %)(e) | 637 | 1.70 | % | 1.78 | % | 2.39 | % | 77.93 | % | ||||||||||||
| 4.44 | % | 11 | 1.20 | %(f) | 2.18 | %(f) | 3.76 | % | 106.31 | % | ||||||||||||
| 5.44 | % | 10 | 1.20 | %(g) | 1.63 | %(g) | 3.85 | % | 96.06 | % | ||||||||||||
| (3.40 | %) | 10 | 1.20 | %(f) | 1.33 | %(f) | 3.69 | % | 93.16 | % | ||||||||||||
| 2.14 | % | 10 | 1.20 | % | 1.31 | % | 3.25 | % | 57.03 | % | ||||||||||||
| (5.04 | %) | 10 | 1.20 | % | 1.28 | % | 2.84 | % | 77.93 | % | ||||||||||||
| 5.39 | %(e) | 184 | 0.88 | %(f) | 1.86 | %(f) | 4.01 | % | 106.31 | % | ||||||||||||
| 5.78 | % | 9,709 | 0.88 | %(g) | 1.31 | %(g) | 4.17 | % | 96.06 | % | ||||||||||||
| (3.21 | %) | 11,087 | 0.96 | %(f) | 1.09 | %(f) | 3.92 | % | 93.16 | % | ||||||||||||
| 2.54 | %(e) | 11,377 | 0.94 | % | 1.04 | % | 3.52 | % | 57.03 | % | ||||||||||||
| (4.74 | %) | 11,083 | 0.95 | % | 1.03 | % | 3.09 | % | 77.93 | % | ||||||||||||
| 4.88 | % | 4,927 | 0.70 | %(f) | 1.76 | %(f) | 4.22 | % | 106.31 | % | ||||||||||||
| 6.02 | % | 18,483 | 0.71 | %(g) | 1.18 | %(g) | 4.29 | % | 96.06 | % | ||||||||||||
| (2.99 | %) | 73,900 | 0.70 | %(f) | 0.83 | %(f) | 3.99 | % | 93.16 | % | ||||||||||||
| 2.72 | % | 224,989 | 0.70 | % | 0.80 | % | 3.77 | % | 57.03 | % | ||||||||||||
| (4.40 | %)(e) | 232,639 | 0.70 | % | 0.78 | % | 3.27 | % | 77.93 | % | ||||||||||||
| (e) | The total return shown above includes the impact of financial statement rounding of the NAV per share and/or financial statement adjustments. |
| (f) | Includes interest expense that amounts to less than 0.01%. |
| (g) | Includes interest expense that amounts to 0.01% |
| 2017 Annual Report | 49 |
Financial Highlights (continued)
Selected Data for Each Share of Capital Outstanding Throughout the Periods Indicated
Aberdeen Emerging Markets Debt Fund
| Investment Activities | Distributions | |||||||||||||||||||||||||||||||
| Net Asset Value, Beginning of Period | Net Investment Income (a) | Net Realized and Unrealized (Losses) | Total from Invest- ment Activities | Net Invest- | Tax Return of Capital | Total Distri- | Net Asset Value, End of Period | |||||||||||||||||||||||||
Class A Shares | ||||||||||||||||||||||||||||||||
Year Ended October 31, 2017 | $ | 9.73 | $ | 0.49 | $ | 0.30 | $ | 0.79 | $ | (0.25 | ) | $ | – | $ | (0.25 | ) | $ | 10.27 | ||||||||||||||
Year Ended October 31, 2016 | 8.77 | 0.57 | 0.65 | 1.22 | (0.22 | ) | (0.04 | ) | (0.26 | ) | 9.73 | |||||||||||||||||||||
Year Ended October 31, 2015 | 9.73 | 0.49 | (1.11 | ) | (0.62 | ) | (0.34 | ) | – | (0.34 | ) | 8.77 | ||||||||||||||||||||
Year Ended October 31, 2014 | 9.54 | 0.42 | 0.11 | 0.53 | (0.34 | ) | – | (0.34 | ) | 9.73 | ||||||||||||||||||||||
Year Ended October 31, 2013 | 10.00 | 0.35 | (0.59 | ) | (0.24 | ) | (0.22 | ) | – | (0.22 | ) | 9.54 | ||||||||||||||||||||
Class C Shares | ||||||||||||||||||||||||||||||||
Year Ended October 31, 2017 | 9.68 | 0.44 | 0.29 | 0.73 | (0.19 | ) | – | (0.19 | ) | 10.22 | ||||||||||||||||||||||
Year Ended October 31, 2016 | 8.76 | 0.57 | 0.59 | 1.16 | (0.21 | ) | (0.03 | ) | (0.24 | ) | 9.68 | |||||||||||||||||||||
Year Ended October 31, 2015 | 9.72 | 0.38 | (1.05 | ) | (0.67 | ) | (0.29 | ) | – | (0.29 | ) | 8.76 | ||||||||||||||||||||
Year Ended October 31, 2014 | 9.53 | 0.34 | 0.11 | 0.45 | (0.26 | ) | – | (0.26 | ) | 9.72 | ||||||||||||||||||||||
Year Ended October 31, 2013 | 10.00 | 0.27 | (0.59 | ) | (0.32 | ) | (0.15 | ) | – | (0.15 | ) | 9.53 | ||||||||||||||||||||
Class R Shares | ||||||||||||||||||||||||||||||||
Year Ended October 31, 2017 | 9.72 | 0.47 | 0.30 | 0.77 | (0.24 | ) | – | (0.24 | ) | 10.25 | ||||||||||||||||||||||
Year Ended October 31, 2016 | 8.77 | 0.51 | 0.69 | 1.20 | (0.22 | ) | (0.03 | ) | (0.25 | ) | 9.72 | |||||||||||||||||||||
Year Ended October 31, 2015 | 9.73 | 0.46 | (1.10 | ) | (0.64 | ) | (0.32 | ) | – | (0.32 | ) | 8.77 | ||||||||||||||||||||
Year Ended October 31, 2014 | 9.54 | 0.39 | 0.11 | 0.50 | (0.31 | ) | – | (0.31 | ) | 9.73 | ||||||||||||||||||||||
Year Ended October 31, 2013 | 10.00 | 0.32 | (0.58 | ) | (0.26 | ) | (0.20 | ) | – | (0.20 | ) | 9.54 | ||||||||||||||||||||
Institutional Service Class Shares | ||||||||||||||||||||||||||||||||
Year Ended October 31, 2017 | 9.75 | 0.54 | 0.30 | 0.84 | (0.29 | ) | – | (0.29 | ) | 10.30 | ||||||||||||||||||||||
Year Ended October 31, 2016 | 8.78 | 0.64 | 0.61 | 1.25 | (0.24 | ) | (0.04 | ) | (0.28 | ) | 9.75 | |||||||||||||||||||||
Year Ended October 31, 2015 | 9.74 | 0.51 | (1.11 | ) | (0.60 | ) | (0.36 | ) | – | (0.36 | ) | 8.78 | ||||||||||||||||||||
Year Ended October 31, 2014 | 9.55 | 0.44 | 0.11 | 0.55 | (0.36 | ) | – | (0.36 | ) | 9.74 | ||||||||||||||||||||||
Year Ended October 31, 2013 | 10.00 | 0.37 | (0.58 | ) | (0.21 | ) | (0.24 | ) | – | (0.24 | ) | 9.55 | ||||||||||||||||||||
Institutional Class Shares | ||||||||||||||||||||||||||||||||
Year Ended October 31, 2017 | 9.74 | 0.54 | 0.29 | 0.83 | (0.28 | ) | – | (0.28 | ) | 10.29 | ||||||||||||||||||||||
Year Ended October 31, 2016 | 8.77 | 0.65 | 0.60 | 1.25 | (0.24 | ) | (0.04 | ) | (0.28 | ) | 9.74 | |||||||||||||||||||||
Year Ended October 31, 2015 | 9.73 | 0.52 | (1.12 | ) | (0.60 | ) | (0.36 | ) | – | (0.36 | ) | 8.77 | ||||||||||||||||||||
Year Ended October 31, 2014 | 9.54 | 0.47 | 0.08 | 0.55 | (0.36 | ) | – | (0.36 | ) | 9.73 | ||||||||||||||||||||||
Year Ended October 31, 2013 | 10.00 | 0.37 | (0.59 | ) | (0.22 | ) | (0.24 | ) | – | (0.24 | ) | 9.54 | ||||||||||||||||||||
| (a) | Net investment income/(loss) is based on average shares outstanding during the period. |
| (b) | Excludes sales charge. |
| (c) | During the period, certain fees were waived and/or reimbursed. If such waivers/reimbursements had not occurred, the ratios would have been as indicated. |
| (d) | Portfolio turnover is calculated on the basis of the Fund as a whole without distinguishing among the classes of shares. |
Amounts listed as “–” are $0 or round to $0.
See accompanying Notes to Financial Statements.
| 50 | Annual Report 2017 |
Financial Highlights (continued)
Selected Data for Each Share of Capital Outstanding Throughout the Periods Indicated
Aberdeen Emerging Markets Debt Fund (concluded)
| Ratios/Supplemental Data | ||||||||||||||||||||||
Total Return (b) | Net Assets at End of Period (000’s) | Ratio of Expenses (Net of Reimbursements/Waivers) to Average Net Assets | Ratio of Expenses (Prior to Reimbursements) to Average Net Assets (c) | Ratio of Net Investment Income to Average Net Assets | Portfolio Turnover (d) | |||||||||||||||||
| 8.21 | % | $ | 1,987 | 1.37 | % | 2.15 | % | 4.85 | % | 64.37 | % | |||||||||||
| 14.45 | %(f) | 247 | 1.20 | %(e) | 1.79 | %(e) | 5.88 | % | 103.26 | % | ||||||||||||
| (6.41 | %) | 10 | 1.17 | %(e) | 1.65 | %(e) | 5.39 | % | 64.60 | % | ||||||||||||
| 5.64 | % | 10 | 1.15 | % | 1.85 | % | 4.35 | % | 60.31 | % | ||||||||||||
| (2.43 | %) | 10 | 1.15 | % | 2.57 | % | 3.58 | % | 55.26 | % | ||||||||||||
| 7.57 | % | 261 | 1.90 | % | 2.75 | % | 4.46 | % | 64.37 | % | ||||||||||||
| 13.62 | %(f) | 390 | 1.90 | %(e) | 2.53 | %(e) | 6.39 | % | 103.26 | % | ||||||||||||
| (6.98 | %) | 650 | 1.90 | %(e) | 2.38 | %(e) | 4.29 | % | 64.60 | % | ||||||||||||
| 4.83 | %(g) | 10 | 1.89 | % | 2.60 | % | 3.60 | % | 60.31 | % | ||||||||||||
| (3.20 | %)(g) | 10 | 1.90 | % | 3.32 | % | 2.83 | % | 55.26 | % | ||||||||||||
| 7.96 | % | 2,934 | 1.56 | % | 2.34 | % | 4.72 | % | 64.37 | % | ||||||||||||
| 14.22 | %(f) | 1,493 | 1.40 | %(e) | 1.99 | %(e) | 5.04 | % | 103.26 | % | ||||||||||||
| (6.60 | %) | 10 | 1.40 | %(e) | 1.88 | %(e) | 5.09 | % | 64.60 | % | ||||||||||||
| 5.37 | % | 10 | 1.40 | % | 2.10 | % | 4.10 | % | 60.31 | % | ||||||||||||
| (2.66 | %) | 10 | 1.40 | % | 2.82 | % | 3.34 | % | 55.26 | % | ||||||||||||
| 8.67 | % | 22 | 0.90 | % | 1.68 | % | 5.43 | % | 64.37 | % | ||||||||||||
| 14.76 | %(f) | 20 | 0.90 | %(e) | 1.49 | %(e) | 7.01 | % | 103.26 | % | ||||||||||||
| (6.22 | %)(g) | 10 | 0.90 | %(e) | 1.38 | %(e) | 5.62 | % | 64.60 | % | ||||||||||||
| 5.80 | %(g) | 10 | 0.90 | % | 1.60 | % | 4.60 | % | 60.31 | % | ||||||||||||
| (2.11 | %)(g) | 10 | 0.90 | % | 2.32 | % | 3.83 | % | 55.26 | % | ||||||||||||
| 8.62 | % | 18,365 | 0.90 | % | 1.76 | % | 5.42 | % | 64.37 | % | ||||||||||||
| 14.78 | %(f) | 16,825 | 0.90 | %(e) | 1.49 | %(e) | 7.37 | % | 103.26 | % | ||||||||||||
| (6.23 | %) | 27,471 | 0.90 | %(e) | 1.38 | %(e) | 5.71 | % | 64.60 | % | ||||||||||||
| 5.91 | % | 31,173 | 0.90 | % | 1.60 | % | 4.79 | % | 60.31 | % | ||||||||||||
| (2.21 | %) | 9,742 | 0.90 | % | 2.32 | % | 3.81 | % | 55.26 | % | ||||||||||||
| (e) | Includes interest expense that amounts to less than 0.01%. |
| (f) | Included within Net Realized and Unrealized Gains (Losses) on Investments per share is a payment from affiliate (Note 10). If such payment was excluded, the total return would have been 14.33% for Class A Shares, 13.15% for Class C Shares, 13.87% for Class R Shares, 14.41% for Institutional Service Class Shares and 14.31% for Institutional Class Shares. |
| (g) | The total return shown above includes the impact of financial statement rounding of the NAV per share and/or financial statement adjustments. |
| 2017 Annual Report | 51 |
Financial Highlights (continued)
Selected Data for Each Share of Capital Outstanding Throughout the Periods Indicated
Aberdeen Global Unconstrained Fixed Income Fund
| Investment Activities | Distributions | |||||||||||||||||||||||||||||||
| Net Asset Value, Beginning of Period | Net (a) | Net Realized and Unrealized (Losses) | Total from | Net Invest- | Net Realized Gains | Total Distri- | Net Asset Value, End of Period | |||||||||||||||||||||||||
Class A Shares | ||||||||||||||||||||||||||||||||
Year Ended October 31, 2017 | $ | 10.18 | $ | 0.13 | $ | 0.02 | $ | 0.15 | $ | – | $ | (0.11 | ) | $ | (0.11 | ) | $ | 10.22 | ||||||||||||||
Year Ended October 31, 2016 | 9.41 | 0.13 | (f) | 0.67 | 0.80 | (0.03 | ) | – | (0.03 | ) | 10.18 | |||||||||||||||||||||
Year Ended October 31, 2015 | 10.12 | 0.22 | (0.84 | ) | (0.62 | ) | (0.09 | ) | – | (0.09 | ) | 9.41 | ||||||||||||||||||||
Year Ended October 31, 2014 | 10.37 | 0.24 | (0.23 | ) | 0.01 | (0.26 | ) | – | (0.26 | ) | 10.12 | |||||||||||||||||||||
Year Ended October 31, 2013 | 10.61 | 0.14 | (0.38 | ) | (0.24 | ) | – | – | – | 10.37 | ||||||||||||||||||||||
Class C Shares | ||||||||||||||||||||||||||||||||
Year Ended October 31, 2017 | 10.01 | 0.06 | 0.01 | 0.07 | – | (0.11 | ) | (0.11 | ) | 9.97 | ||||||||||||||||||||||
Year Ended October 31, 2016 | 9.30 | 0.05 | (f) | 0.68 | 0.73 | (0.02 | ) | – | (0.02 | ) | 10.01 | |||||||||||||||||||||
Year Ended October 31, 2015 | 10.07 | 0.14 | (0.83 | ) | (0.69 | ) | (0.08 | ) | – | (0.08 | ) | 9.30 | ||||||||||||||||||||
Year Ended October 31, 2014 | 10.23 | 0.16 | (0.23 | ) | (0.07 | ) | (0.09 | ) | – | (0.09 | ) | 10.07 | ||||||||||||||||||||
Year Ended October 31, 2013 | 10.55 | 0.06 | (0.38 | ) | (0.32 | ) | – | – | – | 10.23 | ||||||||||||||||||||||
Institutional Service Class Shares | ||||||||||||||||||||||||||||||||
Year Ended October 31, 2017 | 10.21 | 0.15 | 0.01 | 0.16 | – | (0.11 | ) | (0.11 | ) | 10.26 | ||||||||||||||||||||||
Year Ended October 31, 2016 | 9.42 | 0.14 | (f) | 0.68 | 0.82 | (0.03 | ) | – | (0.03 | ) | 10.21 | |||||||||||||||||||||
Year Ended October 31, 2015 | 10.12 | 0.22 | (0.83 | ) | (0.61 | ) | (0.09 | ) | – | (0.09 | ) | 9.42 | ||||||||||||||||||||
Year Ended October 31, 2014 | 10.39 | 0.25 | (0.24 | ) | 0.01 | (0.28 | ) | – | (0.28 | ) | 10.12 | |||||||||||||||||||||
Year Ended October 31, 2013 | 10.62 | 0.15 | (0.38 | ) | (0.23 | ) | – | – | – | 10.39 | ||||||||||||||||||||||
Institutional Class Shares | ||||||||||||||||||||||||||||||||
Year Ended October 31, 2017 | 10.26 | 0.16 | 0.02 | 0.18 | – | (0.11 | ) | (0.11 | ) | 10.33 | ||||||||||||||||||||||
Year Ended October 31, 2016 | 9.46 | 0.16 | (f) | 0.68 | 0.84 | (0.04 | ) | – | (0.04 | ) | 10.26 | |||||||||||||||||||||
Year Ended October 31, 2015 | 10.15 | 0.25 | (0.84 | ) | (0.59 | ) | (0.10 | ) | – | (0.10 | ) | 9.46 | ||||||||||||||||||||
Year Ended October 31, 2014 | 10.43 | 0.27 | (0.24 | ) | 0.03 | (0.31 | ) | – | (0.31 | ) | 10.15 | |||||||||||||||||||||
Year Ended October 31, 2013 | 10.64 | 0.17 | (0.38 | ) | (0.21 | ) | – | – | – | 10.43 | ||||||||||||||||||||||
| (a) | Net investment income/(loss) is based on average shares outstanding during the period. |
| (b) | Excludes sales charge. |
| (c) | During the period, certain fees were waived and/or reimbursed. If such waivers/reimbursements had not occurred, the ratios would have been as indicated. |
| (d) | Portfolio turnover is calculated on the basis of the Fund as a whole without distinguishing among the classes of shares. |
Amounts listed as “–” are $0 or round to $0.
See accompanying Notes to Financial Statements.
| 52 | Annual Report 2017 |
Financial Highlights (continued)
Selected Data for Each Share of Capital Outstanding Throughout the Periods Indicated
Aberdeen Global Unconstrained Fixed Income Fund (concluded)
| Ratios/Supplemental Data | ||||||||||||||||||||||
| Total Return (b) | Net Assets at End of Period (000’s) | Ratio of Expenses (Net of Reimbursements/Waivers) to Average Net Assets | Ratio of Expenses (Prior to Reimbursements) to Average Net Assets (c) | Ratio of Net Investment Income to Average Net Assets | Portfolio Turnover (d) | |||||||||||||||||
| 1.53 | % | $ | 806 | 1.17 | %(e) | 2.74 | %(e) | 1.29 | % | 91.26 | % | |||||||||||
| 8.55 | %(f) | 1,824 | 1.13 | %(e) | 2.34 | %(e) | 1.38 | %(f) | 219.22 | % | ||||||||||||
| (6.13 | %)(g) | 826 | 1.11 | % | 2.06 | % | 2.26 | % | 173.93 | % | ||||||||||||
| 0.05 | %(g) | 1,183 | 1.10 | % | 1.71 | % | 2.27 | % | 183.14 | % | ||||||||||||
| (2.26 | %) | 1,888 | 1.16 | % | 1.64 | % | 1.32 | % | 208.61 | % | ||||||||||||
| 0.75 | %(g) | 247 | 1.85 | %(e) | 3.53 | %(e) | 0.62 | % | 91.26 | % | ||||||||||||
| 7.87 | %(f) | 403 | 1.85 | %(e) | 3.15 | %(e) | 0.52 | %(f) | 219.22 | % | ||||||||||||
| (6.86 | %) | 251 | 1.85 | % | 2.80 | % | 1.51 | % | 173.93 | % | ||||||||||||
| (0.70 | %) | 378 | 1.85 | % | 2.46 | % | 1.54 | % | 183.14 | % | ||||||||||||
| (3.03 | %) | 518 | 1.89 | % | 2.37 | % | 0.59 | % | 208.61 | % | ||||||||||||
| 1.62 | % | 10,553 | 1.02 | %(e) | 2.59 | %(e) | 1.47 | % | 91.26 | % | ||||||||||||
| 8.76 | %(f) | 10,940 | 1.01 | %(e) | 2.22 | %(e) | 1.43 | %(f) | 219.22 | % | ||||||||||||
| (6.02 | %) | 12,761 | 1.03 | % | 1.98 | % | 2.33 | % | 173.93 | % | ||||||||||||
| 0.07 | % | 16,724 | 1.01 | % | 1.62 | % | 2.39 | % | 183.14 | % | ||||||||||||
| (2.17 | %) | 19,547 | 1.05 | % | 1.53 | % | 1.44 | % | 208.61 | % | ||||||||||||
| 1.81 | %(g) | 1,685 | 0.85 | %(e) | 2.56 | %(e) | 1.60 | % | 91.26 | % | ||||||||||||
| 8.87 | %(f) | 2,583 | 0.85 | %(e) | 2.12 | %(e) | 1.61 | %(f) | 219.22 | % | ||||||||||||
| (5.88 | %) | 1,419 | 0.85 | % | 1.80 | % | 2.56 | % | 173.93 | % | ||||||||||||
| 0.25 | % | 2,717 | 0.85 | % | 1.46 | % | 2.63 | % | 183.14 | % | ||||||||||||
| (1.97 | %) | 1,556 | 0.87 | % | 1.37 | % | 1.65 | % | 208.61 | % | ||||||||||||
| (e) | Interest expense is less than 0.001%. |
| (f) | Included within Net Investment Income per share, Total Return, and Ratio of Net Investment Income to Average Net Assets are the effects of a one-time reimbursement for overbilling of prior years’ custodian out-of-pocket fees. If such amounts were excluded, the Net Investment Income per share would be $0.01, $0.01, $0.01 and $0.01, Total Return would be 0.11%, 0.11%, 0.11% and 0.11%, and the impact to Ratio of Net Investment Income to Average Net Assets would be, 0.20%, 0.11%, 0.09% and 0.16% for Class A, Class C, Institutional Service Class and Institutional Class, respectively. |
| (g) | The total return shown above includes the impact of financial statement rounding of the NAV per share and/or financial statement adjustments. |
| 2017 Annual Report | 53 |
Financial Highlights (continued)
Selected Data for Each Share of Capital Outstanding Throughout the Periods Indicated
Aberdeen Tax-Free Income Fund
| Investment Activities | Distributions | |||||||||||||||||||||||||||||||
| Net Asset Value, Beginning of Period | Net Investment Income (a) | Net Realized and Unrealized (Losses) | Total from | Net Invest- | Net Realized Gains | Total Distri- | Net Asset Value, End of Period | |||||||||||||||||||||||||
Class A Shares | ||||||||||||||||||||||||||||||||
Year Ended October 31, 2017 | $ | 10.11 | $ | 0.29 | $ | (0.22 | ) | $ | 0.07 | $ | (0.29 | ) | $ | – | $ | (0.29 | ) | $ | 9.89 | |||||||||||||
Year Ended October 31, 2016 | 10.19 | 0.30 | (0.08 | ) | 0.22 | (0.30 | ) | – | (0.30 | ) | 10.11 | |||||||||||||||||||||
Year Ended October 31, 2015 | 10.38 | 0.32 | (0.16 | ) | 0.16 | (0.32 | ) | (0.03 | ) | (0.35 | ) | 10.19 | ||||||||||||||||||||
Year Ended October 31, 2014 | 10.24 | 0.32 | 0.29 | 0.61 | (0.32 | ) | (0.15 | ) | (0.47 | ) | 10.38 | |||||||||||||||||||||
Year Ended October 31, 2013 | 10.86 | 0.32 | (0.53 | ) | (0.21 | ) | (0.32 | ) | (0.09 | ) | (0.41 | ) | 10.24 | |||||||||||||||||||
Class C Shares | ||||||||||||||||||||||||||||||||
Year Ended October 31, 2017 | 10.09 | 0.22 | (0.22 | ) | – | (0.22 | ) | – | (0.22 | ) | 9.87 | |||||||||||||||||||||
Year Ended October 31, 2016 | 10.18 | 0.23 | (0.09 | ) | 0.14 | (0.23 | ) | – | (0.23 | ) | 10.09 | |||||||||||||||||||||
Year Ended October 31, 2015 | 10.37 | 0.24 | (0.16 | ) | 0.08 | (0.24 | ) | (0.03 | ) | (0.27 | ) | 10.18 | ||||||||||||||||||||
Year Ended October 31, 2014 | 10.23 | 0.24 | 0.29 | 0.53 | (0.24 | ) | (0.15 | ) | (0.39 | ) | 10.37 | |||||||||||||||||||||
Year Ended October 31, 2013 | 10.85 | 0.25 | (0.54 | ) | (0.29 | ) | (0.24 | ) | (0.09 | ) | (0.33 | ) | 10.23 | |||||||||||||||||||
Class R Shares | ||||||||||||||||||||||||||||||||
Year Ended October 31, 2017 | 10.12 | 0.27 | (0.23 | ) | 0.04 | (0.26 | ) | – | (0.26 | ) | 9.90 | |||||||||||||||||||||
Year Ended October 31, 2016 | 10.20 | 0.28 | (0.08 | ) | 0.20 | (0.28 | ) | – | (0.28 | ) | 10.12 | |||||||||||||||||||||
Year Ended October 31, 2015 | 10.40 | 0.29 | (0.17 | ) | 0.12 | (0.29 | ) | (0.03 | ) | (0.32 | ) | 10.20 | ||||||||||||||||||||
Year Ended October 31, 2014 | 10.25 | 0.30 | 0.30 | 0.60 | (0.30 | ) | (0.15 | ) | (0.45 | ) | 10.40 | |||||||||||||||||||||
Period Ended October 31, 2013(h) | 10.72 | 0.20 | (0.47 | ) | (0.27 | ) | (0.20 | ) | – | (0.20 | ) | 10.25 | ||||||||||||||||||||
Institutional Service Class Shares | ||||||||||||||||||||||||||||||||
Year Ended October 31, 2017 | 10.12 | 0.31 | (0.23 | ) | 0.08 | (0.31 | ) | – | (0.31 | ) | 9.89 | |||||||||||||||||||||
Year Ended October 31, 2016 | 10.20 | 0.33 | (0.08 | ) | 0.25 | (0.33 | ) | – | (0.33 | ) | 10.12 | |||||||||||||||||||||
Year Ended October 31, 2015 | 10.40 | 0.34 | (0.17 | ) | 0.17 | (0.34 | ) | (0.03 | ) | (0.37 | ) | 10.20 | ||||||||||||||||||||
Year Ended October 31, 2014 | 10.25 | 0.35 | 0.30 | 0.65 | (0.35 | ) | (0.15 | ) | (0.50 | ) | 10.40 | |||||||||||||||||||||
Period Ended October 31, 2013(h) | 10.72 | 0.23 | (0.47 | ) | (0.24 | ) | (0.23 | ) | – | (0.23 | ) | 10.25 | ||||||||||||||||||||
Institutional Class Shares(i) | ||||||||||||||||||||||||||||||||
Year Ended October 31, 2017 | 10.12 | 0.32 | (0.23 | ) | 0.09 | (0.31 | ) | – | (0.31 | ) | 9.90 | |||||||||||||||||||||
Year Ended October 31, 2016 | 10.20 | 0.33 | (0.08 | ) | 0.25 | (0.33 | ) | – | (0.33 | ) | 10.12 | |||||||||||||||||||||
Year Ended October 31, 2015 | 10.40 | 0.34 | (0.17 | ) | 0.17 | (0.34 | ) | (0.03 | ) | (0.37 | ) | 10.20 | ||||||||||||||||||||
Year Ended October 31, 2014 | 10.25 | 0.35 | 0.30 | 0.65 | (0.35 | ) | (0.15 | ) | (0.50 | ) | 10.40 | |||||||||||||||||||||
Year Ended October 31, 2013 | 10.87 | 0.35 | (0.53 | ) | (0.18 | ) | (0.35 | ) | (0.09 | ) | (0.44 | ) | 10.25 | |||||||||||||||||||
| (a) | Net investment income/(loss) is based on average shares outstanding during the period. |
| (b) | Excludes sales charge. |
| (c) | Annualized for periods less than one year. |
| (d) | During the period, certain fees were waived and/or reimbursed. If such waivers/reimbursements had not occurred, the ratios would have been as indicated. |
| (e) | Not annualized for periods less than one year. |
Amounts listed as “–” are $0 or round to $0.
See accompanying Notes to Financial Statements.
| 54 | Annual Report 2017 |
Financial Highlights (concluded)
Selected Data for Each Share of Capital Outstanding Throughout the Periods Indicated
Aberdeen Tax-Free Income Fund (concluded)
| Ratios/Supplemental Data | ||||||||||||||||||||||
| Total Return (b)(e) | Net Assets at End of Period (000’s) | Ratio of Expenses (Net of Reimbursements/Waivers) to Average Net Assets (c) | Ratio of Expenses (Prior to Reimbursements) to Average Net Assets (d)(c) | Ratio of Net Investment Income to Average Net Assets (c) | Portfolio Turnover (e)(f) | |||||||||||||||||
| 0.72 | % | $ | 9,084 | 0.88 | %(g) | 1.05 | %(g) | 2.92 | % | 16.25 | % | |||||||||||
| 2.19 | % | 10,798 | 0.88 | % | 1.03 | % | 2.96 | % | 10.71 | % | ||||||||||||
| 1.56 | % | 9,073 | 0.88 | % | 1.01 | % | 3.09 | % | 4.85 | % | ||||||||||||
| 6.12 | % | 9,379 | 0.87 | % | 1.00 | % | 3.14 | % | 5.58 | % | ||||||||||||
| (1.93 | %) | 9,477 | 0.88 | % | 0.98 | % | 3.07 | % | 6.11 | % | ||||||||||||
| (0.02 | %) | 542 | 1.62 | %(g) | 1.83 | %(g) | 2.21 | % | 16.25 | % | ||||||||||||
| 1.36 | % | 851 | 1.62 | % | 1.82 | % | 2.24 | % | 10.71 | % | ||||||||||||
| 0.82 | % | 878 | 1.62 | % | 1.75 | % | 2.37 | % | 4.85 | % | ||||||||||||
| 5.34 | % | 643 | 1.62 | % | 1.75 | % | 2.39 | % | 5.58 | % | ||||||||||||
| (2.66 | %) | 788 | 1.62 | % | 1.73 | % | 2.31 | % | 6.11 | % | ||||||||||||
| 0.47 | % | 11 | 1.12 | %(g) | 1.29 | %(g) | 2.67 | % | 16.25 | % | ||||||||||||
| 1.96 | % | 11 | 1.12 | % | 1.27 | % | 2.72 | % | 10.71 | % | ||||||||||||
| 1.24 | % | 10 | 1.12 | % | 1.25 | % | 2.85 | % | 4.85 | % | ||||||||||||
| 5.96 | % | 10 | 1.12 | % | 1.25 | % | 2.89 | % | 5.58 | % | ||||||||||||
| (2.53 | %) | 10 | 1.12 | % | 1.27 | % | 2.82 | % | 6.11 | % | ||||||||||||
| 0.79 | % | 18 | 0.69 | %(g) | 0.86 | %(g) | 3.10 | % | 16.25 | % | ||||||||||||
| 2.48 | % | 28 | 0.62 | % | 0.77 | % | 3.22 | % | 10.71 | % | ||||||||||||
| 1.74 | % | 18 | 0.62 | % | 0.75 | % | 3.35 | % | 4.85 | % | ||||||||||||
| 6.49 | % | 17 | 0.62 | % | 0.75 | % | 3.39 | % | 5.58 | % | ||||||||||||
| (2.19 | %) | 10 | 0.62 | % | 0.77 | % | 3.32 | % | 6.11 | % | ||||||||||||
| 0.98 | % | 71,362 | 0.62 | %(g) | 0.79 | %(g) | 3.18 | % | 16.25 | % | ||||||||||||
| 2.47 | % | 79,279 | 0.62 | % | 0.77 | % | 3.23 | % | 10.71 | % | ||||||||||||
| 1.72 | % | 83,140 | 0.62 | % | 0.75 | % | 3.35 | % | 4.85 | % | ||||||||||||
| 6.49 | % | 89,924 | 0.62 | % | 0.75 | % | 3.38 | % | 5.58 | % | ||||||||||||
| (1.67 | %) | 93,692 | 0.62 | % | 0.72 | % | 3.32 | % | 6.11 | % | ||||||||||||
| (f) | Portfolio turnover is calculated on the basis of the Fund as a whole without distinguishing among the classes of shares. |
| (g) | Interest expense is less than 0.001%. |
| (h) | For the period from February 25, 2013 (commencement of operations) through October 31, 2013. |
| (i) | Formerly Class D shares. |
| 2017 Annual Report | 55 |
October 31, 2017
1. Organization
Aberdeen Funds (the “Trust”) was organized as a statutory trust under the laws of the state of Delaware by a Certificate of Trust filed on September 27, 2007 and is registered under the Investment Company Act of 1940, as amended (the “1940 Act”), as an open-end management investment company. As of October 31, 2017, the Trust had authorized an unlimited number of shares of beneficial interest (“shares”) without par value. As of October 31, 2017, the Trust operated eighteen (18) separate series, or mutual funds, each with its own investment objective(s) and strategies. This report contains the financial statements and financial highlights of the four (4) funds listed below (each a “Fund”; collectively, the “Funds”):
| – | Aberdeen Asia Bond Fund (“Asia Bond Fund”) |
| – | Aberdeen Emerging Markets Debt Fund (“Emerging Markets Debt Fund”) |
| – | Aberdeen Global Unconstrained Fixed Income Fund (“Global Unconstrained Fixed Income Fund”) |
| – | Aberdeen Tax-Free Income Fund (“Tax-Free Income Fund”) |
2. Summary of Significant Accounting Policies
The Trust is an investment company and accordingly follows the investment company accounting and reporting guidance of the Financial Accounting Standards Board (“FASB”) Accounting Standard Codification Topic 946 Financial Services-Investment Companies. The following is a summary of significant accounting policies followed by the Funds in the preparation of their financial statements. The policies conform to generally accepted accounting principles in the United States of America (“GAAP”). The preparation of financial statements requires management to make estimates and assumptions that affect the reported amounts of assets and liabilities, disclosure of contingent assets and liabilities at the date of the financial statements, and the reported amounts of income and expenses for the period. Actual results could differ from those estimates. The accounting records of the Funds are maintained in U.S. Dollars.
| a. | Security Valuation |
The Funds value their securities at current market value or fair value, consistent with regulatory requirements. “Fair value” is defined in the Funds’ Valuation and Liquidity Procedures as the price that could be received to sell an asset or paid to transfer a liability in an orderly transaction between willing market participants without a compulsion to transact at the measurement date.
In accordance with the authoritative guidance on fair value measurements and disclosures under GAAP, the Funds disclose the fair value of their investments using a three-level hierarchy that classifies the inputs to valuation techniques used to measure the fair value. The hierarchy assigns Level 1, the highest level, measurements to valuations based upon unadjusted quoted prices in active markets for identical assets, Level 2 measurements to valuations based upon other significant observable inputs, including adjusted quoted prices in active markets for similar assets, and Level 3, the lowest level, measurements to valuations based upon unobservable inputs that are significant to the valuation. Observable inputs are inputs that reflect the assumptions market participants would use in pricing the asset or liability, which are based on market data obtained from sources independent of the reporting entity. Unobservable inputs are inputs that reflect the reporting entity’s own assumptions about the assumptions market participants would use in pricing the asset or liability developed based on the best information available in the circumstances. A financial instrument’s level within the fair value hierarchy is based upon the lowest level of any input that is significant to the fair value measurement.
Long-term debt and other fixed-income securities are valued at the last quoted or evaluated bid price on the valuation date provided by an independent pricing service provider approved by the Board of Trustees of the Trust (the “Board”). If there are no current day bids, the security is valued at the previously applied bid. Pricing services generally price debt securities assuming orderly transactions of an institutional “round lot” size, and the strategies employed by Aberdeen Asset Management, Inc. (the “Adviser”) generally trade in round lot sizes. In certain circumstances, fixed income securities may be held or transactions may be conducted in smaller, “odd lot” sizes. Odd lots may trade at lower or, occasionally, higher prices than institutional round lot trades. Short-term debt securities (such as commercial paper and U.S. treasury bills) having a remaining maturity of 60 days or less are valued at the last quoted or evaluated bid price on the valuation date provided by an independent pricing service, or on the basis of amortized cost if it represents the best approximation for fair value. Debt and other fixed-income securities are generally determined to be Level 2 investments.
Short-term investments are comprised of cash and cash equivalents invested in short-term investment funds which are redeemable daily. Each Fund sweeps available cash into the State Street Institutional U.S. Government Money Market Fund, which has elected to qualify as a “government money market fund” pursuant to Rule 2a-7 under the 1940 Act, and has an objective, which is not guaranteed, to maintain a $1.00 per share net asset value (“NAV”). Generally, these investment types are categorized as Level 1 investments.
Derivative instruments are generally valued according to the following procedures. Exchange traded derivatives are generally Level 1 investments and over-the-counter derivatives are generally Level 2 investments. Forward currency exchange contracts are generally valued
| 56 | Annual Report 2017 |
Notes to Financial Statements (continued)
October 31, 2017
based on the current spot exchange rates and the forward exchange rate points (ex. 1-month, 3-month) that are obtained from an approved pricing agent. Based on the actual settlement dates of the forward contracts held, an interpolated value of the forward points is combined with the spot exchange rate to derive the valuation. Futures contracts are generally valued at the most recent settlement price as of NAV determination. Swap agreements are generally valued by an approved pricing agent based on the terms of the swap agreement (including future cash flows). When market quotations or exchange rates are not readily available, or if the Adviser concludes that such market quotations do not accurately reflect fair value, the fair value of a Fund’s assets are determined in good faith in accordance with the Valuation Procedures.
In the event that a security’s market quotations are not readily available or are deemed unreliable (for reasons other than because the foreign exchange on which it trades closed before the Valuation Time (as defined below)), the security is valued at fair value as determined by the Funds’ Pricing Committee (the “Pricing Committee”), taking into account the relevant factors and surrounding circumstances using Valuation and Liquidity Procedures approved by the Board. Under normal circumstances, the Valuation Time is as of the close of regular trading on the New York Stock Exchange (usually 4:00 p.m. Eastern Time). A security that has been fair valued by the Pricing Committee may be classified as Level 2 or Level 3 depending on the nature of the inputs.
The three-level hierarchy of inputs is summarized below:
Level 1- quoted prices in active markets for identical investments;
Level 2- other significant observable inputs (including quoted prices for similar securities, interest rates, prepayment speeds, and credit risk); or
Level 3- significant unobservable inputs (including a Fund’s own assumptions in determining the fair value of investments).
A summary of standard inputs is listed below:
| Security Type | Standard Inputs | |
Debt and other fixed-income securities | Reported trade data, broker-dealer price quotations, benchmark yields, issuer spreads on comparable securities, credit quality, yield, and maturity. | |
Forward foreign currency contracts | Forward exchange rate quotations. | |
Swap agreements | Market information pertaining to the underlying reference assets, i.e., credit spreads, credit event probabilities, fair values, forward rates, and volatility measures. |
The following is a summary of the inputs used as of October 31, 2017 in valuing the Funds’ investments at fair value. The inputs or methodologies used for valuing securities are not necessarily an indication of the risk associated with investing in those securities.
Please refer to the Statements of Investments for a detailed breakout of the security types:
| Investments, at Value | LEVEL 1–Quoted Prices ($) | LEVEL 2–Other Significant Observable Inputs ($) | LEVEL 3–Significant Unobservable Inputs ($) | Total ($) | ||||||||||||
| Asia Bond Fund | ||||||||||||||||
| Investments in Securities | ||||||||||||||||
Corporate Bonds | – | 3,851,076 | – | 3,851,076 | ||||||||||||
Government Bonds | – | 1,594,122 | – | 1,594,122 | ||||||||||||
Short-Term Investment | 671,389 | – | – | 671,389 | ||||||||||||
| Other Financial Instruments | ||||||||||||||||
| Assets | ||||||||||||||||
Futures Contracts | 36,822 | – | – | 36,822 | ||||||||||||
Forward Foreign Currency Exchange Contracts | – | 131,165 | – | 131,165 | ||||||||||||
| Liabilities | ||||||||||||||||
Futures Contracts | (13,469 | ) | – | – | (13,469 | ) | ||||||||||
Forward Foreign Currency Exchange Contracts | – | (123,744 | ) | – | (123,744 | ) | ||||||||||
|
|
|
|
|
|
|
| |||||||||
| 694,742 | 5,452,619 | – | 6,147,361 | |||||||||||||
|
|
|
|
|
|
|
| |||||||||
| 2017 Annual Report | 57 |
Notes to Financial Statements (continued)
October 31, 2017
| Investments, at Value | LEVEL 1–Quoted Prices ($) | LEVEL 2–Other Significant Observable Inputs ($) | LEVEL 3–Significant Unobservable Inputs ($) | Total ($) | ||||||||||||
| Emerging Markets Debt Fund | ||||||||||||||||
| Investments in Securities | ||||||||||||||||
Corporate Bonds | – | 5,100,566 | – | 5,100,566 | ||||||||||||
Government Bonds | – | 16,659,375 | – | 16,659,375 | ||||||||||||
Short-Term Investment | 1,396,810 | – | – | 1,396,810 | ||||||||||||
| Other Financial Instruments | ||||||||||||||||
| Assets | ||||||||||||||||
Forward Foreign Currency Exchange Contracts | – | 7,577 | – | 7,577 | ||||||||||||
| Liabilities | ||||||||||||||||
Forward Foreign Currency Exchange Contracts | – | (5,416 | ) | – | (5,416 | ) | ||||||||||
|
|
|
|
|
|
|
| |||||||||
| 1,396,810 | 21,762,102 | – | 23,158,912 | |||||||||||||
|
|
|
|
|
|
|
| |||||||||
| Global Unconstrained Fixed Income Fund | ||||||||||||||||
| Investments in Securities | ||||||||||||||||
Commercial Mortgage-Backed Securities | – | 113,852 | – | 113,852 | ||||||||||||
Residential Mortgage-Backed Securities | – | 19,508 | – | 19,508 | ||||||||||||
Corporate Bonds | – | 11,488,147 | – | 11,488,147 | ||||||||||||
Government Bonds | – | 602,975 | – | 602,975 | ||||||||||||
Short-Term Investment | 647,387 | – | – | 647,387 | ||||||||||||
| Other Financial Instruments | ||||||||||||||||
| Assets | ||||||||||||||||
Futures Contracts | 72,343 | – | – | 72,343 | ||||||||||||
Forward Foreign Currency Exchange Contracts | – | 157,346 | – | 157,346 | ||||||||||||
Credit Default Swap Contracts | – | 13,229 | – | 13,229 | ||||||||||||
Interest Rate Swap Agreements | – | 59,960 | – | 59,960 | ||||||||||||
| Liabilities | ||||||||||||||||
Futures Contracts | (34,410 | ) | – | – | (34,410 | ) | ||||||||||
Forward Foreign Currency Exchange Contracts | – | (171,225 | ) | – | (171,225 | ) | ||||||||||
Credit Default Swap Contracts | – | (192,505 | ) | – | (192,505 | ) | ||||||||||
Interest Rate Swap Agreements | – | (60,817 | ) | – | (60,817 | ) | ||||||||||
|
|
|
|
|
|
|
| |||||||||
| 685,320 | 12,030,470 | – | 12,715,790 | |||||||||||||
|
|
|
|
|
|
|
| |||||||||
| Tax-Free Income Fund | ||||||||||||||||
| Investments in Securities | ||||||||||||||||
Municipal Bonds | – | 80,184,265 | – | 80,184,265 | ||||||||||||
Short-Term Investment | 781,021 | – | – | 781,021 | ||||||||||||
|
|
|
|
|
|
|
| |||||||||
| 781,021 | 80,184,265 | – | 80,965,286 | |||||||||||||
|
|
|
|
|
|
|
| |||||||||
For movements between the levels within the fair value hierarchy, the Funds have adopted a policy of recognizing transfers at the end of each period. During the fiscal year ended October 31, 2017, there were no transfers between Levels.
For the fiscal year ended October 31, 2017, there were no significant changes to the fair valuation methodologies.
| 58 | Annual Report 2017 |
Notes to Financial Statements (continued)
October 31, 2017
| b. | Restricted Securities |
Restricted securities are privately-placed securities whose resale is restricted under U.S. securities laws. The Funds may invest in restricted securities, including unregistered securities eligible for resale without registration pursuant to Rule 144A and privately-placed securities of U.S. and non-U.S. issuers offered outside the U.S. without registration pursuant to Regulation S under the Securities Act of 1933, as amended. Rule 144A securities may be freely traded among certain qualified institutional investors, such as the Funds, but resale of such securities in the U.S. is permitted only in limited circumstances.
| c. | Foreign Currency Translation |
Foreign securities, currencies, and other assets and liabilities denominated in foreign currencies are translated into U.S. Dollars at the exchange rate of said currencies against the U.S. Dollar, as of the Valuation Time, as provided by an independent pricing service. Purchases and sales of securities, and income and expenses are translated at the prevailing rate of exchange on the respective date of these transactions. The Funds do not isolate that portion of the results of operations resulting from changes in foreign exchange rates on investments from fluctuations arising from changes in market prices of securities held. These fluctuations are included with the net realized and unrealized gain or loss from investments and foreign currencies within the Statements of Operations.
| d. | Derivative Financial Instruments |
Certain Funds are authorized to use derivatives to manage currency risk, credit risk, and interest rate risk and to replicate, or use as a substitute for, physical securities. Losses may arise due to changes in the value of the contract or if the counterparty does not perform under the contract. The use of derivative instruments involves, to varying degrees, elements of market risk in excess of the amount recognized in the Statements of Assets and Liabilities.
Forward Foreign Currency Exchange Contracts
A forward foreign currency exchange contract (“forward contract”) involves an obligation to purchase and sell a specific currency at a future date, which may be any fixed number of days from the date of the contract agreed upon by the parties, at a price set at the time of the contract. Forward contracts are used to manage a Fund’s currency exposure in an efficient manner. They are used to sell unwanted currency exposure that comes with holding securities in a market, or to buy currency exposure where the exposure from holding securities is insufficient to give the desired currency exposure either in absolute terms or relative to the benchmark. The use of forward contracts allows the separation of decision-making between markets and their currencies. The forward contract is marked-to market daily and the change in market value is recorded by a Fund as unrealized appreciation/(depreciation). Forward contracts’ prices are received daily from an independent pricing provider. When the forward contract is closed, a Fund records a realized gain or loss equal to the difference between the value at the time it was opened and the value at the time it was closed. These realized and unrealized gains and losses are reported on the Statements of Operations. During the fiscal year, the Funds used forward contracts for the purposes of efficient portfolio management and managing active currency risk relative to the benchmark, the latter of which involves both hedging currency risk and adding currency risk in excess of underlying bond positions.
While a Fund may enter into forward contracts to seek to reduce currency exchange rate risks, transactions in such contracts involve certain risks. A Fund could be exposed to risks if the counterparties to the contracts are unable to meet the terms of their contracts and from unanticipated movements in exchange rates. Thus, while a Fund may benefit from such transactions, unanticipated changes in currency prices may result in a poorer overall performance for a Fund than if it had not engaged in any such transactions. Moreover, there may be imperfect correlation between a Fund’s portfolio holdings or securities quoted or denominated in a particular currency and forward contracts entered into by the Fund. Such imperfect correlation may prevent a Fund from achieving a complete hedge, which will expose the Fund to the risk of foreign exchange loss.
Forward contracts are subject to the risk that the counterparties to such contracts may default on their obligations. Since a forward foreign currency exchange contract is not guaranteed by an exchange or clearing house, a default on the contract would deprive a Fund of unrealized profits, transaction costs or the benefits of a currency hedge or force a Fund to cover its purchase or sale commitments, if any, at the market price at the time of the default.
Futures Contracts
Certain Funds may invest in financial futures contracts (“futures contracts”) for the purpose of hedging their existing portfolio securities, or securities that a Fund intends to purchase, against fluctuations in value caused by changes in prevailing market interest rates or prices. Futures contracts may also be entered into for non-hedging purposes; however, in those instances, the aggregate initial margin and premiums required to establish a Fund’s positions may not exceed 5% of a Fund’s NAV after taking into account unrealized profits and unrealized losses on any such contract into which it has entered.
| 2017 Annual Report | 59 |
Notes to Financial Statements (continued)
October 31, 2017
Upon entering into a futures contract, a Fund is required to pledge to the broker an amount of cash and/or other assets equal to a certain percentage of the contract amount. This payment is known as “initial margin”. Subsequent payments, known as “variation margin,” are calculated each day, depending on the daily fluctuations in the fair value/market value of the underlying assets. An unrealized gain/(loss) equal to the variation margin is recognized on a daily basis. When the contract expires or is closed, the gain/(loss) is realized and is presented in the Statements of Operations as a net realized gain/(loss) on futures contracts. Futures contracts are valued daily at their last quoted sale price on the exchange on which they are traded.
A “sale” of a futures contract means a contractual obligation to deliver the securities or foreign currency called for by the contract at a fixed price at a specified time in the future. A “purchase” of a futures contract means a contractual obligation to acquire the securities or foreign currency at a fixed price at a specified time in the future.
There are significant risks associated with a Fund’s use of futures contracts, including the following: (1) the success of a hedging strategy may depend on the ability of a Fund’s investment adviser and/or sub-adviser to predict movements in the prices of individual securities, fluctuations in markets and movements in interest rates; (2) there may be an imperfect or no correlation between the movement in the price of futures contracts, interest rates and the value/market value of the securities held by a Fund; (3) there may not be a liquid secondary market for a futures contract; (4) trading restrictions or limitations may be imposed by an exchange; and (5) government regulations may restrict trading in futures contracts. In addition, should market conditions change unexpectedly, a Fund may not achieve the anticipated benefits of the futures contracts and may realize a loss.
For the fiscal year ended October 31, 2017, the Asia Bond Fund invested in futures to hedge U.S. interest-rate risk and the Global Unconstrained Fixed Income Fund invested in futures to achieve more efficient portfolio management and to hedge interest-rate risk.
Swaps
A swap is an agreement that obligates two parties to exchange a series of cash flows and/or meet certain obligations at specified intervals based upon or calculated by reference to changes in specified prices or rates (interest rates in the case of interest rate swaps, currency exchange rates in the case of currency swaps) or the occurrence of a credit event with respect to an underlying reference obligation (in the case of a credit default swap) for a specified amount of an underlying asset or notional principal amount. A Fund will enter into swaps only on a net basis, which means that the two payment streams are netted out, with a Fund receiving or paying, as the case may be, only the amount of the difference between the two payments. Except for currency swaps and credit default swaps, the notional principal amount is used solely to calculate the payment streams but is not exchanged. With respect to currency swaps, actual principal amounts of currencies may be exchanged by the counterparties at the initiation, and again upon the termination of the transaction.
Traditionally, swaps were customized, privately negotiated agreements executed between two parties (“OTC Swaps”) but since 2013, certain swaps are required to be cleared pursuant to rules and regulations related to the Dodd–Frank Wall Street Reform and Consumer Protection Act (“Dodd Frank”) and/or Regulation (EU) No 648/2012 on OTC Derivatives, Central Counterparties and Trade Repositories (“EMIR”) (“Cleared Swaps”). Like OTC Swaps, Cleared Swaps are negotiated bilaterally. Unlike OTC Swaps, the act of clearing results in two swaps executed between each of the parties and a central counterparty (“CCP”), and thus the counterparty credit exposure of the parties is to the CCP rather than to one another. Upon entering into a Cleared Swap, a Fund is required to pledge an amount of cash and/or other assets equal to a certain percentage of the contract amount. This payment is known as “initial margin”. Subsequent payments, known as “variation margin,” are calculated each day, depending on the daily fluctuations in the fair value/market value of the underlying assets. An unrealized gain/(loss) equal to the variation margin is recognized on a daily basis. When the contract matures or is terminated, the gain or loss is realized and is presented in the Statements of Operations as a net realized gain or loss on swap contracts. As of March 2017, a Fund may be required to provide variation and/or initial margin for OTC Swaps pursuant to further rules and regulations related to Dodd Frank and EMIR. The margin requirements associated with OTC Swaps and Cleared Swaps may not be the same.
Entering into swap agreements involves, to varying degrees, elements of credit, market and interest risk in excess of the amounts reported on the Statement of Assets and Liabilities. Such risks involve the possibility that there will be no liquid market for these agreements, that the counterparty to the agreements may default on its obligation to perform and that there may be unfavorable changes in the value of the index or securities underlying the agreement. The Funds’ maximum risk of loss from counterparty risk related to swaps is the fair value of the contract. This risk is mitigated by the posting of collateral by the counterparties to the Funds to cover the Funds’ exposure to the counterparty.
Credit Default Swaps
A credit default swap is an agreement whereby one party, the buyer, is obligated to pay the other party, the seller, a periodic stream of payments over the term of the contract in return for a contingent payment upon the occurrence of a credit event with respect to an underlying reference obligation. A Fund might use credit default swap contracts to limit or to reduce risk exposure of the Fund to defaults of
| 60 | Annual Report 2017 |
Notes to Financial Statements (continued)
October 31, 2017
corporate and sovereign issues (i.e., to reduce risk when the Fund owns or has exposure to such issuers). A Fund also might use credit default swap contracts to create direct or synthetic short or long exposure to domestic or foreign corporate debt securities or certain sovereign debt securities to which the Fund is not otherwise exposed.
During the fiscal year ended October 31, 2017, Global Unconstrained Fixed Income Fund held credit default swaps to hedge the Fund’s exposure to the credit market.
Interest Rate Swaps
A Fund uses interest rate swap contracts to manage its exposure to interest rates. Interest rate swap contracts typically represent the exchange between a Fund and a counterparty of respective commitments to make variable rate and fixed rate payments with respect to a notional amount of principal. Interest rate swap contracts may have a term that is greater than one year, but typically require periodic interim settlement in cash, at which time the specified value of the variable interest rate is reset for the next settlement period. Net payments of interest are recorded as realized gains or losses. During the period that the swap contract is open, the contract is marked-to-market as the net amount due to or from a Fund and changes in the value of swap contracts are recorded as unrealized gains or losses.
During the fiscal year ended October 31, 2017, Global Unconstrained Fixed Income Fund held interest rate swaps to hedge interest rate risk.
Summary of Derivative Instruments
Certain Funds may use derivatives for various purposes as noted above. The following is a summary of the location of fair value amounts of derivatives, not accounted for as hedging instruments, as of October 31, 2017:
| Location on the Statement of Assets and Liabilities | ||||
| Derivative Instrument Risk Type | Asset Derivatives | Liability Derivatives | ||
Interest Rate Risk | Variation margin receivable for centrally cleared swap contracts Variation margin receivable for futures contracts | Variation margin payable for centrally cleared rate swap contracts Variation margin payable for futures contracts | ||
Credit Risk | Over-the-counter credit default swaps, at value | Over-the-counter credit default swaps, at value and variation margin payable for centrally cleared swap contracts | ||
Foreign Exchange Risk | Unrealized appreciation on forward foreign currency exchange contracts | Unrealized depreciation on forward foreign currency exchange contracts | ||
The following is a summary of the fair value of Derivative Instruments, not accounted for as hedging instruments, as of October 31, 2017:
| Asset Derivatives | ||||||||||||||||||||||||
| Funds | Total Value at October 31, 2017 | Over-the- Default (Credit risk) | Centrally Credit Swaps Risk)* | Centrally Swaps Risk)* | Forward Risk) | Futures Contracts (Interest Rate Risk)* | ||||||||||||||||||
Asia Bond Fund | $ | 167,987 | $ | – | $ | – | $ | – | $ | 131,165 | $ | 36,822 | ||||||||||||
Emerging Markets Debt Fund | 7,577 | – | – | – | 7,577 | – | ||||||||||||||||||
Global Unconstrained Fixed Income Fund | 302,878 | 9,565 | 3,664 | 59,960 | 157,346 | 72,343 | ||||||||||||||||||
| 2017 Annual Report | 61 |
Notes to Financial Statements (continued)
October 31, 2017
| Liabilities Derivatives | ||||||||||||||||||||||||
| Funds | Total Value at October 31, 2017 | Over- (Credit | Centrally | Centrally Risk)* | Forward Foreign Exchange Contracts (Foreign Exchange Risk) | Futures Contracts (Interest Rate Risk)* | ||||||||||||||||||
Asia Bond Fund | $ | 137,213 | $ | – | $ | – | $ | – | $ | 123,744 | $ | 13,469 | ||||||||||||
Emerging Markets Debt Fund | 5,416 | – | – | – | 5,416 | – | ||||||||||||||||||
Global Unconstrained Fixed Income Fund | 458,957 | 9,181 | 183,324 | 60,817 | 171,225 | 34,410 | ||||||||||||||||||
| * | The values shown reflect unrealized appreciation/(depreciation) and the values shown in the Statement of Assets and Liabilities reflects variation margin. |
Certain funds have transactions that may be subject to enforceable master netting arrangements. A reconciliation of the gross amounts on the Statements of Assets and Liabilities as of October 31, 2017 to the net amounts by broker and derivative type, including any collateral received or pledged, is included in the following tables:
| Gross Amounts Not Offset in Statement of Assets & Liabilities | Gross Amounts Not Offset in Statement of Assets and Liabilities | |||||||||||||||||||||||||||||||
| Description | Gross Amounts Position | Financial Instruments | Collateral Received (1) | Net Amount (3) | Gross Amounts Position | Financial Instruments | Collateral Pledged (1) | Net Amount (3) | ||||||||||||||||||||||||
| Assets | Liabilities | |||||||||||||||||||||||||||||||
| Asia Bond Fund | ||||||||||||||||||||||||||||||||
Forward foreign currency (2) | ||||||||||||||||||||||||||||||||
BNP Paribas | $ | — | $ | — | $ | — | $ | — | $ | 13,672 | $ | — | $ | — | $ | 13,672 | ||||||||||||||||
Credit Suisse | 6,261 | — | — | 6,261 | — | — | — | — | ||||||||||||||||||||||||
Goldman Sachs | 3,698 | (3,698 | ) | — | — | 8,367 | (3,698 | ) | — | 4,669 | ||||||||||||||||||||||
HSBC Bank | 8,892 | (8,892 | ) | — | — | 47,639 | (8,892 | ) | — | 38,747 | ||||||||||||||||||||||
Standard Chartered Bank | 32,774 | (30,723 | ) | — | 2,051 | 30,723 | (30,723 | ) | — | — | ||||||||||||||||||||||
UBS | 79,540 | (23,343 | ) | — | 56,197 | 23,343 | (23,343 | ) | — | — | ||||||||||||||||||||||
| 1. | In some instances, the actual collateral received and/or pledged may be more than the amount shown here due to overcollateralization. |
| 2. | Includes financial instrument which are not subject to a master netting arrangement across funds, or another similar arrangement. |
| 3. | Net amounts represent the net receivables/(payable) that would be due from/to the counterparty in the event of default. Exposure from financial derivative instruments can only be netted across transactions governed under the same master netting agreement with the same legal entity. |
| 62 | Annual Report 2017 |
Notes to Financial Statements (continued)
October 31, 2017
| Gross Amounts Not Offset in Statement of Assets & Liabilities | Gross Amounts Not Offset in Statement of Assets and Liabilities | |||||||||||||||||||||||||||||||
| Description | Gross Amounts Position | Financial Instruments | Collateral Received (1) | Net Amount (3) | Gross Amounts Position | Financial Instruments | Collateral Pledged (1) | Net Amount (3) | ||||||||||||||||||||||||
| Assets | Liabilities | |||||||||||||||||||||||||||||||
| Emerging Markets Debt Fund | ||||||||||||||||||||||||||||||||
Forward foreign currency (2) | ||||||||||||||||||||||||||||||||
Barclays Bank | $ | 1,946 | $ | — | $ | — | $ | 1,946 | $ | — | $ | — | $ | — | $ | — | ||||||||||||||||
Citibank | 1,454 | — | — | 1,454 | — | — | — | — | ||||||||||||||||||||||||
Goldman Sachs | 1,167 | (1,167 | ) | — | — | 5,416 | (1,167 | ) | — | 4,249 | ||||||||||||||||||||||
Royal Bank of Canada | 1,486 | — | — | 1,486 | — | — | — | — | ||||||||||||||||||||||||
UBS | 1,524 | — | — | 1,524 | — | — | — | — | ||||||||||||||||||||||||
| 1. | In some instances, the actual collateral received and/or pledged may be more than the amount shown here due to overcollateralization. |
| 2. | Includes financial instrument which are not subject to a master netting arrangement across funds, or another similar arrangement. |
| 3. | Net amounts represent the net receivables/(payable) that would be due from/to the counterparty in the event of default. Exposure from financial derivative instruments can only be netted across transactions governed under the same master netting agreement with the same legal entity. |
| Gross Amounts Not Offset in Statement of Assets & Liabilities | Gross Amounts Not Offset in Statement of Assets and Liabilities | |||||||||||||||||||||||||||||||
| Description | Gross Amounts Position | Financial Instruments | Collateral Received (1) | Net Amount (3) | Gross Amounts Position | Financial Instruments | Collateral Pledged (1) | Net Amount (3) | ||||||||||||||||||||||||
| Assets | Liabilities | |||||||||||||||||||||||||||||||
| Global Unconstrained Fixed Income Fund | ||||||||||||||||||||||||||||||||
Forward foreign currency (2) | ||||||||||||||||||||||||||||||||
Barclays Bank | $ | 14,868 | $ | (2,617 | ) | $ | — | $ | 12,251 | $ | 2,617 | $ | (2,617 | ) | $ | — | $ | — | ||||||||||||||
Citibank | 11,239 | (11,239 | ) | — | — | 52,383 | (11,239 | ) | — | 41,144 | ||||||||||||||||||||||
JPMorgan Chase | 16,120 | (16,120 | ) | — | — | 23,406 | (16,120 | ) | — | 7,286 | ||||||||||||||||||||||
Morgan Stanley | 18,278 | (6,162 | ) | — | 12,116 | 6,162 | (6,162 | ) | — | — | ||||||||||||||||||||||
Royal Bank of Canada | 44,170 | (41,584 | ) | — | 2,586 | 41,584 | (41,584 | ) | — | — | ||||||||||||||||||||||
UBS | 52,671 | (45,073 | ) | — | 7,598 | 45,073 | (45,073 | ) | — | — | ||||||||||||||||||||||
| Global Unconstrained Fixed Income Fund | ||||||||||||||||||||||||||||||||
Credit default swaps (2) | ||||||||||||||||||||||||||||||||
Barclays Bank | $ | 9,565 | $ | (9,181 | ) | $ | — | $ | 384 | $ | 9,181 | $ | (9,181 | ) | $ | — | $ | — | ||||||||||||||
| 1. | In some instances, the actual collateral received and/or pledged may be more than the amount shown here due to overcollateralization. |
| 2. | Includes financial instrument which are not subject to a master netting arrangement across funds, or another similar arrangement. |
| 3. | Net amounts represent the net receivables/(payable) that would be due from/to the counterparty in the event of default. Exposure from financial derivative instruments can only be netted across transactions governed under the same master netting agreement with the same legal entity. |
| 2017 Annual Report | 63 |
Notes to Financial Statements (continued)
October 31, 2017
The following is a summary of the location of realized gain/(loss) and net change in unrealized appreciation/(depreciation) on derivatives in the Statement of Operations for the fiscal year ended October 31, 2017:
| Derivative Instrument Risk Type | Location on the Statement of Operations | |
Credit Risk | Realized gain/(loss) on swap contracts Net change in unrealized appreciation/(depreciation) on swap contracts | |
Interest Rate Risk | Realized gain/(loss) on future contracts transactions Net change in unrealized appreciation/(depreciation) on futures contracts Realized gain/(loss) on swap contracts Net change in unrealized appreciation/(depreciation) on swap contracts | |
Foreign Exchange Risk | Realized gain/(loss) on foreign currency transactions Net change in unrealized appreciation/(depreciation) on foreign currency transactions |
The following is a summary of the effect of derivative instruments on the Statement of Operations for the fiscal year ended October 31, 2017:
| Realized Gain or (Loss) on Derivatives Recognized in the Statement of Operations | ||||||||||||||||||||
| Funds | Total | Credit Default Swaps | Interest Rate Swaps (Interest Rate Risk) | Forward Foreign Exchange Contracts (Foreign Exchange Risk) | Futures Contracts (Interest Rate Risk) | |||||||||||||||
Asia Bond Fund | $ | 29,906 | $ | – | $ | – | $ | 4,595 | $ | 25,311 | ||||||||||
Emerging Markets Debt Fund | (89,723 | ) | – | – | (89,723 | ) | – | |||||||||||||
Global Unconstrained Fixed Income Fund | (148,285 | ) | (67,368 | ) | (15,809 | ) | (124,193 | ) | 59,085 | |||||||||||
| Change in Unrealized Appreciation/ (Depreciation) on Derivatives Recognized in the Statement of Operations | ||||||||||||||||||||
| Funds | Total | Credit Default Swaps (Credit Risk) | Interest Rate (Interest | Forward Foreign Exchange Contracts (Foreign Exchange Risk) | Futures Contracts (Interest Rate Risk) | |||||||||||||||
Asia Bond Fund | $ | 225,526 | $ | – | $ | – | $ | 158,928 | $ | 66,598 | ||||||||||
Emerging Markets Debt Fund | (2,813 | ) | – | – | (2,813 | ) | – | |||||||||||||
Global Unconstrained Fixed Income Fund | (266,103 | ) | (179,346 | ) | (857 | ) | (68,880 | ) | (17,020 | ) | ||||||||||
Information about derivatives reflected as of the date of this report is generally indicative of the type of activity for the fiscal year ended October 31, 2017. The table below summarizes the weighted average values of derivatives holdings by the Funds during the fiscal year ended October 31, 2017.
| Fund | Purchase Forward Contracts (Average Notional Value) | Sale Forward Foreign Currency Contracts (Average Notional Value) | Long Futures Contracts (Average Notional Value) | Short Futures Contracts (Average Notional Value) | Buy Protection Credit Default Swaps (Average Notional Value) | Sell Protection Credit Default Swaps (Average Notional Value) | Interest Rate Swaps (Average Notional Value) | |||||||||||||||||||||
Asia Bond Fund | $ | 13,060,030 | $ | 5,694,594 | $ | 12,241,666 | $ | 6,175,000 | $ | – | $ | – | $ | – | ||||||||||||||
Emerging Markets Debt Fund | 255,642 | 1,384,040 | – | – | – | – | – | |||||||||||||||||||||
Global Unconstrained Fixed Income Fund | 2,518,766 | 7,409,958 | 9,110,098 | 23,284,855 | 5,713,425 | 577,778 | 136,531,667 | |||||||||||||||||||||
| 64 | Annual Report 2017 |
Notes to Financial Statements (continued)
October 31, 2017
| e. | Security Transactions, Investment Income and Expenses |
Security transactions are recorded on the trade date. Realized and unrealized gains/(losses) from security and currency transactions are calculated on the identified cost basis. Dividend income and corporate actions are recorded generally on the ex-date, except for certain dividends and corporate actions which may be recorded after the ex-date, as soon as the Fund acquires information regarding such dividends or corporate actions.
Interest income and expenses are recorded on an accrual basis. Expenses directly attributable to a Fund are charged to that Fund. Expenses not directly attributable to a Fund are allocated proportionately among the relevant Funds based on net assets of each Fund as of the month end. For each of the Funds, the method for allocating income, fund level expenses, and realized and unrealized gains or losses to a class is based on the total net asset value of that class’ shares in proportion to the total net assets of the relevant Fund. Expenses specific to a class (such as Rule 12b-1 and administrative services fees) are charged to that class.
| f. | Distributions |
Distributions from net investment income, if any, are declared and paid quarterly for the Asia Bond Fund, the Emerging Markets Debt Fund and the Global Unconstrained Fixed Income Fund. Distributions from net investment income are declared daily and paid monthly for the Tax-Free Income Fund. The Funds will also declare and pay distributions at least annually from net realized gains on investment transactions and net realized foreign exchange gains, if any. Dividends and distributions to shareholders are recorded on the ex-dividend date.
Dividends and distributions to shareholders are determined in accordance with federal income tax regulations, which may differ from GAAP. These differences are primarily due to differing treatments for foreign currencies and loss deferrals.
| g. | Federal Income Taxes |
Each Fund intends to continue to qualify as a “regulated investment company” by complying with the provisions available to certain investment companies, as defined in Subchapter M of the Internal Revenue Code of 1986, as amended, and to make distributions of net investment income and net realized capital gains sufficient to relieve the Funds from all federal income taxes. Therefore, no federal income tax provision is required.
Management of the Funds has concluded that there are no significant uncertain tax positions that would require recognition in the financial statements. Since tax authorities can examine previously filed tax returns, the Funds’ U.S. federal and state tax returns for each of the four fiscal years up to the most recent fiscal year ended October 31 are subject to such review.
| h. | Repurchase Agreements |
The Funds may enter into a repurchase agreement under the terms of a Master Repurchase Agreement. It is each Fund’s policy that its custodian/counterparty segregate the underlying collateral securities, the value of which exceeds the principal amount of the repurchase transaction, including accrued interest. The repurchase price generally equals the price paid by a Fund plus interest negotiated on the basis of current short-term rates. To the extent that any repurchase transaction exceeds one business day, the collateral is valued on a daily basis to determine its adequacy. If the counterparty to a repurchase agreement defaults and the value of the collateral declines, or if bankruptcy proceedings are commenced with respect to the counterparty of the security, realization of the collateral by the Funds may be delayed or limited. Repurchase agreements are subject to contractual netting arrangements with the Fund’s repurchase agreement counterparty, Fixed Income Clearing Corp. To the extent the Funds enter into repurchase agreements, additional information on individual repurchase agreements is included in the Statements of Investments. As of and during the fiscal year ended, October 31, 2017, the Funds did not hold any repurchase agreements.
| i. | Securities Lending |
Through an agreement with BNP Paribas as the Lending Agent and State Street Bank and Trust Company (the Funds’ custodian), the Funds may lend its portfolio securities to brokers, dealers and other financial institutions that pay a negotiated fee in order to generate income. The Funds receive non-cash collateral in the form of U.S. Government Securities, with respect to each loan of U.S. securities, equal to at least 102% of the value of the portfolio securities loaned, and, with respect to each loan of non-U.S. securities, collateral of at least 105% of the value of the portfolio securities loaned, and at all times thereafter shall require the borrower to mark to market such collateral on a daily basis so that the market value of such collateral does not fall below 100% of the market value of the portfolio securities loaned.
The Funds continue to own the loaned securities and continue to recognize unrealized gains and losses on the securities on loan. However, securities lending involves certain risks including the event of default or insolvency of the borrower including possible delays or restrictions upon a Fund’s ability to recover the loaned securities or dispose of the collateral for the loan. Securities on loan are noted within the Statement of Investments. Non-cash securities lending collateral held by the Lending Agent on behalf of the Funds cannot be sold or repledged by the Fund and therefore, this amount is not presented on the Funds’ Statements of Investments.
At October 31, 2017, the Funds did not have any securities on loan.
| 2017 Annual Report | 65 |
Notes to Financial Statements (continued)
October 31, 2017
3. Agreements and Transactions with Affiliates
Merger of Aberdeen Asset Management PLC with Standard Life plc
The Funds’ investment adviser, sub-advisers, distributor and administrator are each a subsidiary of Aberdeen Asset Management PLC (“Aberdeen PLC”). The merger of Standard Life plc and Aberdeen PLC was announced on March 6, 2017 and closed on August 14, 2017 (“Merger”). Aberdeen PLC became a direct subsidiary of Standard Life plc as a result of the Merger and the combined company changed its name to Standard Life Aberdeen plc. Shareholders of the Funds are not required to take any action as a result of the Merger. Following the Merger, the Funds’ investment adviser, sub-advisers, distributor and administrator each became an indirect subsidiary of Standard Life Aberdeen plc, but otherwise did not change. The investment advisory, investment sub-advisory, distribution and administration agreements that the Trust, on behalf of the Funds, has with Aberdeen PLC’s subsidiary companies, the services provided under the agreements, and the fees charged for those services did not change as a result of the Merger. The portfolio management team for each Fund has renamed the same following of the Merger.
| a. | Investment Adviser |
Under the Investment Advisory Agreement with the Trust, the Adviser manages the Funds in accordance with the policies and procedures established by the Board.
For services provided under the terms of the current Investment Advisory Agreement, each Fund pays the Adviser an annual management fee (as a percentage of its average daily net assets) paid monthly according to the following schedule:
| Fund | Fee Schedule | |||||||
Asia Bond Fund | On all assets | 0.500% | ||||||
Emerging Markets Debt Fund | Up to $500 million | 0.750% | ||||||
| On $500 million and more | 0.700% | |||||||
Global Unconstrained Fixed Income Fund | Up to $500 million | 0.600% | ||||||
| $500 million up to $1 billion | 0.550% | |||||||
| On $1 billion and more | 0.500% | |||||||
Tax-Free Income Fund | Up to $250 million | 0.425% | ||||||
| $250 million up to $1 billion | 0.375% | |||||||
| On $1 billion and more | 0.355% | |||||||
The Adviser has engaged the services of affiliates Aberdeen Asset Management Asia Limited and Aberdeen Asset Managers Limited as subadvisers (the “Subadvisers”) pursuant to subadvisory agreements. The Subadvisers manage a portion of certain Funds’ investments and have the responsibility for making all investment decisions for the portion of a Fund’s assets they manage. Pursuant to the subadvisory agreements, the Adviser pays fees to the Subadvisers, if any.
The Trust and Aberdeen have entered into a written contract (“Expense Limitation Agreement”) limiting operating expenses for all classes of the Funds from exceeding the amounts listed below. This contractual limitation may not be terminated before February 28, 2018 without the approval of the Independent Trustees of the Board. This limit excludes certain expenses, including any taxes, interest, brokerage fees, short-sale dividend expenses, acquired fund fees and expenses, Rule 12b-1 fees, administrative services fees, transfer agent out-of-pocket expenses for Class A shares, Class R shares and Institutional Service Class shares and extraordinary expenses.
| Fund | Limit | |||
Asia Bond Fund | 0.70 | % | ||
Emerging Markets Debt Fund | 0.90 | % | ||
Global Unconstrained Fixed Income Fund | 0.85 | % | ||
Tax-Free Income Fund | 0.62 | % | ||
Aberdeen may request and receive reimbursement from a Fund of the advisory fees waived and other expenses reimbursed pursuant to the Expense Limitation Agreement as of a date not more than three years after the date when the Adviser limited the fees or reimbursed the expenses; provided that the following requirements are met: the reimbursements do not cause a class to exceed the lesser of the applicable expense limitation in the contract at the time the fees were limited or expenses are paid or the applicable expense limitation in effect at the time the expenses are being recouped by the Adviser, and the payment of such reimbursement is approved by the Board on a quarterly basis (the “Reimbursement Requirements”). Except as provided for in the Expense Limitation Agreement, reimbursement of amounts previously waived or assumed by Aberdeen is not permitted.
| 66 | Annual Report 2017 |
Notes to Financial Statements (continued)
October 31, 2017
As of October 31, 2017, to the extent the Reimbursement Requirements are met, the cumulative potential reimbursements to Aberdeen for each Fund, based on expenses reimbursed by Aberdeen would be:
| Fund | Amount Fiscal Year 2015 (Expires 10/31/18) | Amount Fiscal Year (Expires 10/31/19) | Amount 2017 | Total* | ||||||||||||
Asia Bond Fund | $ | 290,081 | $ | 174,473 | $ | 196,408 | $ | 660,962 | ||||||||
Emerging Markets Debt Fund | 144,411 | 134,178 | 176,930 | 455,519 | ||||||||||||
Global Unconstrained Fixed Income Fund | 173,469 | 168,405 | 246,045 | 587,919 | ||||||||||||
Tax-Free Income Fund | 121,485 | 136,796 | 143,650 | 401,931 | ||||||||||||
| * | Amounts reported are due to expire throughout the respective 3-year expiration period presented above. |
In accordance with the Funds’ Expense Limitation Agreement and criteria, as described above, the Adviser did not recapture any expenses for which it previously reimbursed the Funds. Accordingly, at October 31, 2017, the Funds did not have liabilities payable to the Adviser for recapture of previously reimbursed expenses.
| b. | Fund Administration |
Under the terms of the Fund Administration Agreement, Aberdeen provides various administrative and accounting services, including daily valuation of the Funds’ shares, preparation of financial statements, tax returns, regulatory reports, and presentation of quarterly reports to the Board. For services provided pursuant to the Fund Administration Agreement, the Trust pays Aberdeen an annual fee of 0.08% based on the Trust’s average daily net assets. The fee is then allocated proportionately among all funds within the Trust (including the Funds) in relation to the average daily net assets of each fund. This asset-based fee is subject to an annual minimum fee based on the number of funds served. Pursuant to a sub-administration agreement with Aberdeen, State Street Bank and Trust Company provides sub-administration services with respect to the Funds.
| c. | Distributor and Shareholder Servicing |
The Trust and Aberdeen Fund Distributors, LLC (the “Distributor”) are parties to the current Underwriting Agreement (the “Underwriting Agreement”) whereby the Distributor acts as principal underwriter for the Trust’s shares.
The Trust has adopted a Distribution Plan (the “Plan”) pursuant to Rule 12b-1 under the 1940 Act with respect to certain classes of shares. The Plan permits the Funds to compensate the Distributor, for expenses associated with the distribution-related and/or shareholder services provided by such entities. These fees are paid to the Distributor and are either kept or paid to shareholders’ financial advisors or other intermediaries for distribution and shareholder services. Although actual distribution expenses may be more or less, under the Plan, the Funds pay the Distributor an annual fee of the following amounts:
| Fund | Class A Shares | Class C Shares (a) | Class R Shares (a) | |||||||||
Asia Bond Fund | 0.25% | 1.00% | 0.50% | |||||||||
Emerging Markets Debt Fund | 0.25% | 1.00% | 0.50% | |||||||||
Global Unconstrained Fixed Income Fund | 0.25% | 1.00% | 0.50% | |||||||||
Tax-Free Income Fund | 0.25% | 1.00% | 0.50% | |||||||||
| (a) | 0.25% of which is service fees. |
The Adviser or an affiliate of the Adviser may pay additional amounts from its own resources to dealers or other financial intermediaries, for aid in distribution or for aid in providing administrative services to shareholders.
Pursuant to the current Underwriting Agreement, the Distributor will also receive the proceeds of contingent deferred sales charges (“CDSCs”) of 1% imposed on certain redemptions of Class C shares (and up to 1% for certain Class A shares).
In addition, the Distributor will re-allow to dealers 3.75% of sales charges on Class A shares of the Funds, which have a maximum front-end sales charge of 4.25%, and the Distributor or Adviser may compensate broker dealers or financial intermediaries for sales of Class C shares from its own resources at the rate of 1.00% on sales of Class C shares, which have a maximum CDSC of 1.00% (on the deferred sales charge assessed on sales within one year of purchase). For the fiscal year ended October 31, 2017, AFD retained commissions of $6,165 from front-end sales charges of Class A shares and $191 from CDSC fees from Class C shares (and certain Class A shares) of the Funds.
| 2017 Annual Report | 67 |
Notes to Financial Statements (continued)
October 31, 2017
| d. | Administrative Services Fees/Transfer Agent Out-of-Pocket Expenses |
The Funds may pay and/or reimburse administrative services fees/transfer agent out-of-pocket expenses to certain broker-dealers and financial intermediaries who provide administrative support services to beneficial shareholders on behalf of the Funds (sometimes referred to as “sub-transfer agency fees”), subject to certain limitations approved by the Board. These fees may be in addition to Rule 12b-1 fees. Sub-transfer agency fees generally include, but are not limited to, costs associated with omnibus accounting, recordkeeping, networking, sub-transfer agency or other administrative or shareholder services.
Class A, Class R and Institutional Service Class shares of the Funds pay for such services pursuant to an Administrative Services Plan adopted by the Board. Under the Administrative Services Plan, a Fund may pay a broker-dealer or other intermediary a maximum annual administrative services fee of 0.25% for Class A, Class R and Institutional Service Class shares. (Under an amendment to the Administrative Services Plan that is in effect until at least February 28, 2018), the administrative service fee is limited to a maximum of 0.15% for contracts with fees that are calculated as a percentage of Fund assets and a maximum of $16 per account for contracts with fees that are calculated on a dollar per account basis). Class C and Institutional Class shares may also pay for the services described above directly, as these classes are not subject to an Administrative Services Plan.
The amount of sub-transfer agent and administrative service fees paid during the fiscal year ended October 31, 2017 was as follows:
| Fund | Class A | Class C | Class R | Institutional Service | Institutional | |||||||||||||||
Asia Bond Fund | $ | 238 | $ | 118 | $ | – | $ | 12,502 | $ | 9,406 | ||||||||||
Emerging Markets Debt Fund | 1,527 | 190 | 3,046 | – | 13,564 | |||||||||||||||
Global Unconstrained Fixed Income Fund | 696 | 387 | – | 18,616 | 4,183 | |||||||||||||||
Tax-Free Income Fund | 1,403 | 461 | – | 17 | 1,253 | |||||||||||||||
| Amounts | listed as “–” are $0 or round to $0. |
4. Investment Transactions
Purchases and sales of securities (excluding short-term securities) for the fiscal year ended October 31, 2017, were as follows:
| Fund | Purchases | Sales | ||||||
Asia Bond Fund | $ | 18,240,131 | $ | 40,550,823 | ||||
Emerging Markets Debt Fund | 15,035,860 | 12,660,611 | ||||||
Global Unconstrained Fixed Income Fund | 12,588,881 | 13,851,087 | ||||||
Tax-Free Income Fund | 13,658,230 | 19,906,245 | ||||||
5. Portfolio Investment Risks
| a. | Active Trading Risk |
Certain Funds may engage in active and frequent trading of portfolio securities to achieve its investment objective. If a Fund does trade this way, it may incur increased costs, which can lower the actual return of the Fund.
| b. | Asset-Backed Securities Risk |
Like traditional fixed income securities, the value of asset-backed securities typically increases when interest rates fall and decreases when interest rates rise. Certain asset-backed securities may also be subject to the risk of prepayment.
| c. | Call and Redemption Risk |
Some bonds allow the issuer to call a bond for redemption before it matures. If this happens, a Fund may be required to invest the proceeds in securities with lower yields.
| d. | Corporate Bonds Risk |
Corporate bonds are debt instruments issued by domestic or foreign corporations or similar entities. Corporate bonds can decline in value in response to changes in the financial condition of the issuer and involve a risk of loss in case of issuer default or insolvency.
| e. | Country/Regional Focus Risk |
Significant exposure to a single country or geographical region involves increased currency, political, regulatory and other risks. Market swings in the targeted country or geographical region likely will have a greater effect on portfolio performance than they would in a more geographically diversified fund.
| 68 | Annual Report 2017 |
Notes to Financial Statements (continued)
October 31, 2017
| f. | Credit Risk |
A debt instrument’s price depends, in part, on the credit quality of the issuer, borrower, counterparty, or underlying collateral and can decline in response to changes in the financial condition of the issuer, borrower, counterparty, or underlying collateral, or changes in specific or general market, economic, industry, political, regulatory, geopolitical, or other conditions.
| g. | Derivatives Risk (Including Options, Futures and Swaps) |
Derivatives are speculative and may hurt a Fund’s performance. Derivatives present the risk of disproportionately increased losses and/or reduced opportunities for gains when the financial asset or measure to which the derivative is linked changes in unexpected ways. The potential benefits to be derived from a Fund’s options, futures and derivatives strategy are dependent upon the portfolio managers’ ability to discern pricing inefficiencies and predict trends in these markets, which decisions could prove to be inaccurate. This requires different skills and techniques than predicting changes in the price of individual debt securities, and there can be no assurance that the use of this strategy will be successful.
Speculative Exposure Risk – To the extent that a derivative or practice is not used as a hedge, a Fund is directly exposed to its risks. Gains or losses from speculative positions in a derivative may be much greater than the derivative’s original cost. For example, potential losses from writing uncovered call options and from speculative short sales are unlimited.
Hedged Exposure Risk – Losses generated by a derivative or practice used by a Fund for hedging purposes should be substantially offset by gains on the hedged investment. However, while hedging can reduce or eliminate losses, it can also reduce or eliminate gains.
Correlation Risk – A Fund is exposed to the risk that changes in the value of a hedging instrument will not match those of the investment being hedged.
Counterparty Risk – Derivative transactions depend on the creditworthiness of the counterparty and the counterparty’s ability to fulfill its contractual obligations.
| h. | Emerging Markets Risk |
Certain Funds are subject to Emerging Markets Risk. This is a magnification of the risks that apply to foreign investments. These risks are greater for securities of companies in emerging market countries because the countries may have less stable governments, more volatile currencies and less established markets (see “Foreign Securities Risk” below).
| i. | Extension Risk |
Principal repayments may not occur as quickly as anticipated, causing the expected maturity of a security to increase. Rapidly rising interest rates may cause prepayments to occur more slowly than expected, thereby lengthening the maturity of the securities held by the Fund and making their prices more sensitive to rate changes and more volatile.
| j. | Foreign Currency Exposure Risk |
The value of foreign currencies relative to the U.S. Dollar fluctuates in response to market, economic, political, regulatory, geopolitical or other conditions. A decline in the value of a foreign currency versus the U.S. Dollar reduces the value in U.S. Dollars of investments denominated in that foreign currency. This risk may impact a Fund more greatly to the extent the Fund does not hedge its currency risk, or hedging techniques used by the Fund are unsuccessful.
| k. | Foreign Securities Risk |
Foreign securities may be more volatile, harder to price and less liquid than U.S. securities. They are subject to different accounting and regulatory standards, and political and economic risks.
Asian Risk. Parts of the Asian region may be subject to a greater degree of economic, political and social instability than is the case in the United States and Europe. Some Asian countries can be characterized as emerging markets or newly industrialized and may experience more volatile economic cycles than developed countries. The developing nature of securities markets in many countries in the Asian region may lead to a lack of liquidity while some countries have restricted the flow of money in and out of the country. Some countries in Asia have historically experienced political uncertainty, corruption, military intervention and social unrest. A Fund may be more volatile than a fund which is broadly diversified geographically.
China Risk. The economy of China differs from the U.S. and other more established economies in such respects as structure, general development, government involvement, wealth distribution, rate of inflation, growth rate, allocation of resources and capital reinvestment, and some of these differences are unfavorable to investors. Therefore, investing in China involves a high degree of risk and special considerations not typically associated with investing in other more established economies or securities markets. The Fund invests in China A shares. China A shares are shares in mainland China-based companies that trade on Chinese stock exchanges and are usually only available to foreign investors through a quota license or by purchasing Shanghai and Shenzhen Stock Exchange listed securities via brokers in Hong Kong through the
| 2017 Annual Report | 69 |
Notes to Financial Statements (continued)
October 31, 2017
Shanghai-Hong Kong Stock Connect and Shenzhen-Hong Kong Stock Connect programs (collectively, “Stock Connect”). Investing in China A shares may involve special risk considerations such as volatility in the China A share market and uncertainty regarding taxation.
A Fund’s ability to freely trade in China A Shares as a foreign investor through the quota license or Stock Connect may be limited by quota and repatriation restrictions, and utilizing Stock Connect is subject to trading, clearance and settlement procedures in China that are relatively new and untested.
| l. | High-Yield Bonds and Other Lower-Rated Securities Risk |
A Fund’s investments in high-yield bonds (commonly referred to as “junk bonds”) and other lower-rated securities will subject the Fund to substantial risk of loss. Investments in high-yield bonds are speculative and issuers of these securities are generally considered to be less financially secure and less able to repay interest and principal than issuers of investment-grade securities. Prices of high-yield bonds tend to be very volatile. These securities are less liquid than investment-grade debt securities and may be difficult to price or sell, particularly in times of negative sentiment toward high-yield securities.
| m. | Illiquid Securities Risk |
Illiquid securities are assets which may not be sold or disposed of in the ordinary course of business within seven days at approximately the price at which a Fund has valued the investment on its books and may include such securities as those not registered under U.S. securities laws or securities that cannot be sold in public transactions. An inability to sell a portfolio position can adversely affect a Fund’s value or prevent the Fund from being able to take advantage of other investment opportunities. Over recent years, the capacity of dealers to make markets in fixed income securities has been outpaced by the growth in the size of the fixed income markets. Liquidity risk may be magnified in a rising interest rate environment or when investor redemptions from fixed income funds may be higher than normal, due to the increased supply in the market that would result from selling activity.
Each Fund employs proprietary procedures and tests using third-party and internal data inputs that seek to assess and manage the liquidity of its portfolio holdings. A Fund’s procedures and tests take into account relevant market, trading and other factors, and monitor whether liquidity assessments should be adjusted based on changed market conditions. These procedures and tests are designed to assist a Fund in determining its ability to meet redemption requests in various market conditions. In light of the dynamic nature of markets, there can be no assurance that these procedures and tests will enable a fund to ensure that it has sufficient liquidity to meet redemption requests.
| n. | Impact of Large Redemptions and Purchases of Fund Shares Risk |
Occasionally, shareholders may make large redemptions or purchases of Fund shares, which may cause a Fund to have to sell securities or invest additional cash. These transactions may adversely affect a Fund’s performance and increase transaction costs. In addition, large redemption requests may exceed the cash balance of a Fund and result in credit line borrowing fees and/or overdraft charges to the Fund until the sale of portfolio securities to cover the redemption request settle. For additional information on redemptions, please see the Statement of Changes in Net Assets.
| o. | Interest Rate Risk |
A Fund’s fixed income investments are subject to interest rate risk, which generally causes the value of a fixed income portfolio to decrease when interest rates rise resulting in a decrease in the Fund’s net assets. A Fund may be subject to a greater risk of rising interest rates due to the current period of historically low rates and the effect of potential government fiscal policy initiatives and resulting market reaction to those initiatives. Interest rate fluctuations tend to have a greater impact on fixed income securities with a greater time to maturity and/or lower coupon. In periods of market volatility, the market values of fixed income securities may be more sensitive to changes in interest rates. A fund with a longer average portfolio duration will be more sensitive to changes in interest rates than a fund with a shorter average portfolio duration.
| p. | Issuer Risk |
The value of a security may decline for reasons directly related to the issuer, such as management performance, financial leverage and reduced demand for the issuer’s goods or service.
| q. | Management Risk |
The Fund is subject to the risk that the Adviser may make poor security selections. The Adviser and its portfolio managers apply their own investment techniques and risk analyses in making investment decisions for the Fund and there can be no guarantee that these decisions will achieve the desired results for the Fund. In addition, the Adviser may select securities that underperform the relevant market of other funds with similar investment objectives and strategies.
| r. | Market Risk |
Deteriorating market conditions might cause a general weakness in the market that reduces the prices of securities in that market in which a Fund invests.
| 70 | Annual Report 2017 |
Notes to Financial Statements (continued)
October 31, 2017
| s. | Mid-Cap Securities Risk |
Securities of medium-sized companies tend to be more volatile and less liquid than securities of larger companies.
| t. | Mortgage-Related Securities Risk |
Certain Funds may invest in mortgage-related securities. Rising interest rates may cause an issuer to exercise its right to pay principal later than expected which tends to extend the duration of mortgage-related securities, making them more sensitive to changes in interest rates. As a result, in a period of rising interest rates, a Fund that holds mortgage-related securities may exhibit additional volatility. This is known as extension risk. In addition, mortgage-related securities are subject to prepayment risk. When interest rates decline, borrowers may pay off their mortgages sooner than expected. This can reduce the returns of a Fund because the Fund will have to reinvest that money at the lower prevailing interest rates.
| u. | Municipal Bond Tax Risk |
The Tax-Free Income Fund may be subject to Municipal Bond Tax Risk. A municipal bond that is issued as tax-exempt may later be declared to be taxable. In addition, if the federal income tax rate is reduced, the value of the tax exemption may be less valuable causing the value of a municipal bond to decline.
| v. | Non-Diversified Fund Risk |
Because Asia Bond Fund and Emerging Markets Debt Fund are non-diversified, the Funds may hold larger positions in fewer securities than diversified funds. As a result, a single security’s increase or decrease in value may have a greater impact on each Fund’s value and total return.
| w. | Non-Hedging Foreign Currency Trading Risk |
Foreign exchange rates can be extremely volatile and a variance in the degree of volatility of the market or in the direction of the market from the Adviser’s expectations may produce significant losses to a Fund.
| x. | Prepayment Risk |
As interest rates decline, debt issuers may repay or refinance their loans or obligations earlier than anticipated. The issuers of fixed income securities may, therefore, repay principal in advance. This forces a Fund to reinvest the proceeds from the principal prepayments at lower rates, which reduces the Fund’s income.
| y. | Private Placements and Other Restricted Securities Risk |
Investments in private placements and other restricted securities, including Regulation S Securities and Rule 144A Securities, could have the effect of increasing a Fund’s level of illiquidity. Private placements and restricted securities may be less liquid than other investments because such securities may not always be readily sold in broad public markets and a Fund might be unable to dispose of such securities promptly or at prices reflecting their true value.
| z. | Sector Risk |
To the extent that a Fund has a significant portion of its assets invested in securities of companies conducting business in a broadly related group of industries within an economic sector, the Fund may be more vulnerable to unfavorable developments in that economic sector than funds that invest more broadly.
Consumer Staples Sector Risk. To the extent the consumer staples sector represents a significant portion of a Fund, the Fund will be sensitive to changes in, and its performance may depend to a greater extent on, factors impacting this sector. The consumer staples sector may be affected by the regulation of various product components and production methods, marketing campaigns and other factors affecting consumer demand. Tobacco companies, in particular, may be adversely affected by new laws, regulations and litigation. The consumer staples sector may also be adversely affected by changes or trends in commodity prices, which may be influenced by unpredictable factors.
Financials Sector Risk. To the extent that the financials sector represents a significant portion of a Fund, the Fund will be sensitive to changes in, and its performance may depend to a greater extent on, factors impacting this sector. Performance of companies in the financials sector may be adversely impacted by many factors, including, among others, government regulations, economic conditions, credit rating downgrades, changes in interest rates, and decreased liquidity in credit markets. The impact of more stringent capital requirements, recent or future regulation of any individual financial company, or recent or future regulation of the financials sector as a whole cannot be predicted. In recent years, cyber attacks and technology malfunctions and failures have become increasingly frequent in this sector and have caused significant losses.
Industrials Sector Risk. To the extent that the industrials sector represents a significant portion of a Fund, the Fund will be sensitive to changes in, and its performance may depend to a greater extent on, factors impacting this sector. The value of securities issued by companies in the industrials sector may be adversely affected by supply and demand related to their products and services, product obsolescence, claims for environmental damage or product liability and general economic conditions, among other factors.
| 2017 Annual Report | 71 |
Notes to Financial Statements (continued)
October 31, 2017
| aa. | Small-Cap Securities Risk |
Securities of smaller companies are usually less stable in price and less liquid than those of larger, more established companies. Therefore, they generally involve greater risk.
| bb. | Sovereign Debt Risk |
Periods of economic and political uncertainty may result in the illiquidity and increased price volatility of a foreign government’s debt securities held by a Fund and impact an issuer’s ability and willingness to pay interest or repay principal when due. A Fund may have limited resources to compel payment in the event of a default. A foreign government’s default on its debt securities may cause the value of securities held by a Fund to decline significantly.
| cc. | Valuation Risk |
The price that a Fund could receive upon the sale of any particular portfolio investment may differ from the Fund’s valuation of the investment, particularly for securities that trade in thin or volatile markets or that are valued using a fair valuation methodology or a price provided by an independent pricing service. As a result, the price received upon the sale of an investment may be less than the value ascribed by a Fund, and the Fund could realize a greater than expected loss or lesser than expected gain upon the sale of the investment. A Fund’s ability to value its investments may also be impacted by technological issues and/or errors by pricing services or other third-party service providers.
| dd. | Variable and Floating Rate Securities Risk |
For floating and variable rate obligations, there may be a lag between an actual change in the underlying interest rate benchmark and the reset time for an interest payment of such an obligation, which could harm or benefit a Fund, depending on the interest rate environment or other circumstances.
Please read the prospectus for more detailed information regarding these and other risks.
6. Contingencies
In the normal course of business, the Funds may provide general indemnifications pursuant to certain contracts and organizational documents. The Funds’ maximum exposure under these arrangements is dependent on future claims that may be made against the Funds, and therefore, cannot be estimated; however, based on experience, the risk of loss from such claims is considered remote.
7. Tax Information
As of October 31, 2017, the tax cost of securities and the breakdown of unrealized appreciation/(depreciation) for each Fund were as follows:
Tax Cost of | Unrealized Appreciation | Unrealized Depreciation | Net Unrealized Appreciation/ (Depreciation) | |||||||||||||
Asia Bond Fund | $ | 4,753,282 | $ | 167,171 | $ | (34,601 | ) | $ | 132,570 | |||||||
Emerging Markets Debt Fund | 22,686,872 | 984,467 | (512,427 | ) | 472,040 | |||||||||||
Global Unconstrained Fixed Income Fund | 4,508,623 | 624,527 | (470,631 | ) | 153,896 | |||||||||||
Tax-Free Income Fund | 76,312,401 | 4,745,796 | (92,911 | ) | 4,652,885 | |||||||||||
The tax character of distributions paid during the fiscal year ended October 31, 2017 was as follows (total distributions paid may differ from the Statements of Changes in Net Assets because for tax purposes dividends are recognized when actually paid):
| Distributions paid from | ||||||||||||||||||||||||
| Fund | Ordinary Income* | Net Long Term Capital Gains* | Total Taxable Distributions | Tax Exempt Distributions | Return of Capital | Total Distributions Paid | ||||||||||||||||||
Asia Bond Fund | $ | – | $ | – | $ | – | $ | – | $ | – | $ | – | ||||||||||||
Emerging Markets Debt Fund | 591,011 | – | 591,011 | – | – | 591,011 | ||||||||||||||||||
Global Unconstrained Fixed Income Fund | 190,016 | 5 | 190,021 | – | – | 190,021 | ||||||||||||||||||
Tax-Free Income Fund | 5,055 | – | 5,055 | 2,688,666 | – | 2,693,721 | ||||||||||||||||||
| * | The difference between the book-basis and tax-basis unrealized appreciation/(depreciation) is attributable primarily to the tax deferral of losses on wash sales. |
| 72 | Annual Report 2017 |
Notes to Financial Statements (continued)
October 31, 2017
The tax character of distributions paid during the fiscal year ended October 31, 2016 was as follows (total distributions paid may differ from the Statements of Changes in Net Assets because for tax purposes dividends are recognized when actually paid):
| Distributions paid from | ||||||||||||||||||||||||
| Fund | Ordinary Income | Net Long Term Capital Gains | Total Taxable Distributions | Tax Exempt Distributions | Return of Capital | Total Distributions Paid | ||||||||||||||||||
Asia Bond Fund | $ | – | $ | – | $ | – | $ | – | $ | 452,279 | $ | 452,279 | ||||||||||||
Emerging Markets Debt Fund | 770,074 | – | 770,074 | – | 119,737 | 889,811 | ||||||||||||||||||
Global Unconstrained Fixed Income Fund | 49,323 | – | 49,323 | – | – | 49,323 | ||||||||||||||||||
Tax-Free Income Fund | 20,914 | – | 20,914 | 2,945,011 | 8,995 | 2,974,920 | ||||||||||||||||||
As of October 31, 2017, the components of accumulated earnings/(deficit) on a tax basis were as follows:
| Fund | Undistributed Tax Exempt Income | Undistributed Ordinary Income | Undistributed Long-Term Capital Gains | Accumulated Earnings | Distributions Payable | Late Year Ordinary and Post-October Capital Loss Deferrals | Other Temporary Differences | Unrealized Appreciation/ (Depreciation)* | Accumulated Capital and Other Losses** | Total Accumulated Earnings/ (Deficit) | ||||||||||||||||||||||||||||||
Asia Bond Fund | $ | – | $ | 334,291 | $ | – | $ | – | $ | – | $ | – | $ | – | $ | 130,100 | $ | (5,181,276 | ) | $ | (4,716,885 | ) | ||||||||||||||||||
Emerging Markets Debt Fund | – | 497,774 | – | – | – | – | (131,740 | ) | 417,997 | (3,442,263 | ) | (2,658,232 | ) | |||||||||||||||||||||||||||
Global Unconstrained Fixed Income Fund | – | – | 41,898 | – | – | (27,062 | ) | – | 150,126 | – | 164,962 | |||||||||||||||||||||||||||||
Tax-Free Income Fund | – | – | – | – | – | – | (8,852 | ) | 4,652,886 | (208,996 | ) | 4,435,038 | ||||||||||||||||||||||||||||
| * | The difference between the book-basis and tax-basis unrealized appreciation/(depreciation) is attributable primarily to tax deferral of losses on wash sales. |
| ** | As of October 31, 2017, for Federal income tax purposes, the following Funds have capital loss carryforwards available to offset capital gains, if any, to the extent provided by the Treasury regulations, with no expiration. |
| Fund | Amount | Expires | ||||
Asia Bond Fund | $ | 3,881,440 | Unlimited (Short-Term) | |||
Asia Bond Fund | 1,299,836 | Unlimited (Long-Term) | ||||
Emerging Markets Debt Fund | 520,104 | Unlimited (Short-Term) | ||||
Emerging Markets Debt Fund | 2,922,159 | Unlimited (Long-Term) | ||||
Tax-Free Income Fund | 208,996 | Unlimited (Short-Term) | ||||
Amounts listed as “–” are $0 or round to $0.
Under the Regulated Investment Company Modernization Act of 2010, the Funds are permitted to carry forward capital losses incurred in taxable years beginning after December 22, 2010 for an unlimited period. However, any losses incurred during those taxable years will be required to be utilized prior to the losses incurred in pre-enactment taxable years. As a result of this ordering rule, pre-enactment capital loss carryforwards may be more likely to expire unused. Additionally, post-enactment capital losses that are carried forward will retain their character as either short-term or long-term capital losses rather than being considered all short-term as under previous law.
GAAP requires that certain components of net assets be adjusted to reflect permanent differences between financial and tax reporting. Accordingly, the table below details the necessary reclassifications, which are a result of permanent differences primarily attributable to foreign currency gain/(loss), capital Loss, ordinary losses, amortization of upfront payments-open swaps, distributions in excess of current earnings, capital gain tax, swap gain/(loss) and net operating losses. These reclassifications have no effect on net assets or NAVs per share.
| Fund | Paid-in Capital | Accumulated Net Investment Income/(Loss) | Accumulated Net Realized Gain/(Loss) | |||||||||
Asia Bond Fund | $ | – | $ | (432,602 | ) | $ | 432,602 | |||||
Emerging Markets Debt Fund | – | (108,091 | ) | 108,091 | ||||||||
Global Unconstrained Fixed Income Fund | (88,879 | ) | (13,725 | ) | 102,604 | |||||||
Tax-Free Income Fund | (498 | ) | 498 | – | ||||||||
| 2017 Annual Report | 73 |
Notes to Financial Statements (concluded)
October 31, 2017
8. Significant Shareholders
As of October 31, 2017, the following Funds had shareholders with the percentage ownership indicated, which are considered significant shareholders (holdings greater than 5.0%) for financial reporting purposes:
| Fund | Record Ownership % | Number of Account Owners | ||||
Asia Bond Fund | 82.2 | % | 5 | |||
Emerging Markets Debt Fund | 93.6 | 4 | ||||
Global Unconstrained Fixed Income Fund | 60.1 | 3 | ||||
Tax-Free Income Fund | – | – | ||||
Amounts listed as “–” are $0 or round to $0.
9. Line of Credit
The Trust, on behalf of each of the Funds of the Trust (the “Borrowers”), has entered into an agreement (the “Agreement”) with State Street Bank and Trust Company (the “Bank”), subject to annual renewal. The Agreement provides for a revolving credit facility (the “Credit Facility”) for the amount of $250,000,000 to be utilized for temporary or emergency purposes to fund shareholder redemptions or other short-term liquidity purposes.
Principal on each outstanding loan made under the Agreement bears interest at a variable rate per annum equal to the higher of (a) the Federal Funds Rate as in effect on that day (not less than zero) plus 1.25% or (b) the One-Month London Interbank Offered Rate as in effect on that day (not less than zero) plus 1.25%. In addition, effective August 11, 2017, the Borrowers shall pay to the Bank a commitment fee at the rate of 0.25% per annum on the daily unused portion of the Credit Facility, as applicable, which is allocated among the Borrowers in such manner as is determined by the Board to be reasonable. During the period November 1, 2016 to August 10, 2017, the commitment fee rate was 0.22%, per annum. For each Fund that borrowed under the Credit Facility during the fiscal year, the following table shows the average outstanding daily balance of the days the Fund utilized the Credit Facility and the average weighted interest rate paid by the Fund during the fiscal year ended October 31, 2017.
Average Balance | Average Weighted Interest Rate | Days Utilized | ||||||||||
Asia Bond Fund | $ | 426,850 | 2.07% | 21 | ||||||||
Global Unconstrained Fixed Income Fund | 500,000 | 2.24% | 2 | |||||||||
Tax-Free Income Fund | 1,209,630 | 2.48% | 10 | |||||||||
10. Subsequent Events
Management has evaluated the need for disclosures and/or adjustments resulting from subsequent events through the date the financial statements were issued. Based on this evaluation, no disclosures and/or adjustments were required to the financial statements as of October 31, 2017.
At the December 13, 2017 Board meeting, in regards to the Tax-Free Income Fund, the Board approved a change of the expense limitation from 0.62% to 0.50%, which will all be effective February 28, 2018.
| 74 | Annual Report 2017 |
Report of Independent Registered Public Accounting Firm
The Board of Trustees and Shareholders of
Aberdeen Funds:
We have audited the accompanying statements of assets and liabilities, including the statements of investments, of the Aberdeen Asia Bond Fund, Aberdeen Emerging Markets Debt Fund, Aberdeen Global Unconstrained Fixed Income Fund (formerly, Aberdeen Global Fixed Income Fund), and Aberdeen Tax-Free Income Fund, four of the funds comprising Aberdeen Funds (the “Funds”), as of October 31, 2017, and the related statements of operations for the year then ended, the statements of changes in net assets for each of the years in the two-year period then ended and the financial highlights for each of the years or periods in the five-year period then ended. These financial statements and financial highlights are the responsibility of the Funds’ management. Our responsibility is to express an opinion on these financial statements and financial highlights based on our audits.
We conducted our audits in accordance with the standards of the Public Company Accounting Oversight Board (United States). Those standards require that we plan and perform the audit to obtain reasonable assurance about whether the financial statements and financial highlights are free of material misstatement. An audit includes examining, on a test basis, evidence supporting the amounts and disclosures in the financial statements. Our procedures included confirmation of securities owned as of October 31, 2017, by correspondence with the custodian and brokers, or by other appropriate auditing procedures. An audit also includes assessing the accounting principles used and significant estimates made by management, as well as evaluating the overall financial statement presentation. We believe that our audits provide a reasonable basis for our opinion.
In our opinion, the financial statements and financial highlights referred to above present fairly, in all material respects, the financial position of the Funds as of October 31, 2017, the results of their operations for the year then ended, the changes in their net assets for each of the years in the two-year period then ended and the financial highlights for each of the years or periods in the five-year period then ended, in conformity with U.S. generally accepted accounting principles.

Philadelphia, Pennsylvania
December 28, 2017
| 2017 Annual Report | 75 |
Other Tax Information (Unaudited)
For the period ended October 31, 2017, certain dividends paid by the Funds may be subject to a maximum tax rate of 15% as provided for by the Jobs and Growth Tax Relief Reconciliation Act of 2003. The Funds intend to designate the maximum amount allowable as taxed at a maximum rate of 15%. Complete information will be reported in conjunction with your 2017 Form 1099-DIV.
The Funds intend to elect to pass through to their shareholders the credit for taxes paid in foreign countries during its fiscal year ended October 31, 2017. In accordance with the current tax laws, the foreign income and foreign tax per share (for a share outstanding as of October 31, 2017) was as follows:
| Fund | Foreign Tax | |||
Asia Bond Fund | $ | 0.0980 | ||
Emerging Markets Debt Fund | 0.0019 | |||
During the year ended October 31, 2017, the following fund designated dividends as long-term capital gains:
| Fund | Amount | |||
Global Unconstrained Fixed Income Fund | $ | 5 | ||
| 76 | Annual Report 2017 |
Shareholder Expense Examples (Unaudited)
As a shareholder of the Aberdeen Funds, you incur two types of costs: (1) transaction costs, including sales charges (loads) paid on purchase payments and (2) ongoing costs, including investment advisory fees, administration fees, transfer agent out-of-pocket expenses, distribution fees and other Fund expenses. The examples below are intended to help you understand your ongoing costs (in dollars) of investing in the Aberdeen Funds and to compare these costs with the ongoing costs of investing in other mutual funds.
The examples assume that you had a $1,000 investment in the Class at the beginning of the reporting period, May 1, 2017 and continued to hold your shares at the end of the reporting period, October 31, 2017.
Actual Expenses
The table below provides information about actual account values and actual expenses. You may use the information together with the amount you invested, to estimate the expenses that you paid over the period. Simply divide your account value by $1,000 (for example, an $8,600 account value divided by $1,000 = 8.6), then multiply the result by the number under the heading entitled “Actual Expenses Paid During Period” for the class of a Fund that you own to estimate the expenses you paid on your account during the period.
Hypothetical Example for Comparison Purposes
The table below provides information about hypothetical account values and hypothetical expenses based on the Class’ actual expense ratio and an assumed rate of return of 5% per year before expenses, which is not the Class’ actual return. The hypothetical account values and expenses may not be used to estimate the actual ending account balance or expenses you paid for the period. You may use this information to compare the ongoing costs of investing in the Class of a Fund and other funds. To do so, compare the 5% hypothetical example with the 5% hypothetical examples that appear in the shareholder reports of the other funds.
Please note that the expenses shown in the table are meant to highlight your ongoing costs only and do not reflect any transaction costs, such as sales charges (loads). Therefore, the information for each Class in the table is useful in comparing ongoing costs only, and will not help you determine the relative total costs of owning different funds. In addition, if these transaction costs were included, your costs would have been higher. The examples also assume all dividends and distributions have been reinvested.
| Beginning Account Value, May 1, 2017 | Actual Ending Account Value, October 31, 2017 | Hypothetical Ending Account Value | Actual Expenses Paid During Period* | Hypothetical Expenses Paid During Period*1 | Annualized Expense Ratio** | |||||||||||||||||||||
Asia Bond Fund | Class A | $ | 1,000.00 | $ | 1,045.10 | $ | 1,020.27 | $ | 5.05 | $ | 4.99 | 0.98% | ||||||||||||||
Class C | 1,000.00 | 1,042.10 | 1,016.64 | 8.75 | 8.64 | 1.70% | ||||||||||||||||||||
Class R | 1,000.00 | 1,044.40 | 1,018.75 | 6.60 | 6.51 | 1.28% | ||||||||||||||||||||
Institutional Service Class | 1,000.00 | 1,051.90 | 1,020.42 | 4.91 | 4.84 | 0.95% | ||||||||||||||||||||
Institutional Class | 1,000.00 | 1,046.80 | 1,021.68 | 3.61 | 3.57 | 0.70% | ||||||||||||||||||||
Emerging Markets | Class A | 1,000.00 | 1,042.80 | 1,018.25 | 7.11 | 7.02 | 1.38% | |||||||||||||||||||
Class C | 1,000.00 | 1,039.20 | 1,015.63 | 9.77 | 9.65 | 1.90% | ||||||||||||||||||||
Class R | 1,000.00 | 1,041.60 | 1,016.99 | 8.39 | 8.29 | 1.63% | ||||||||||||||||||||
Institutional Service Class | 1,000.00 | 1,044.50 | 1,020.67 | 4.64 | 4.58 | 0.90% | ||||||||||||||||||||
Institutional Class | 1,000.00 | 1,044.10 | 1,020.67 | 4.64 | 4.58 | 0.90% | ||||||||||||||||||||
Global Unconstrained Fixed Income Fund | Class A | 1,000.00 | 1,002.00 | 1,019.16 | 6.06 | 6.11 | 1.20% | |||||||||||||||||||
Class C | 1,000.00 | 999.00 | 1,015.83 | 9.37 | 9.45 | 1.86% | ||||||||||||||||||||
Institutional Service Class | 1,000.00 | 1,003.90 | 1,019.96 | 5.25 | 5.30 | 1.04% | ||||||||||||||||||||
Institutional Class | 1,000.00 | 1,003.90 | 1,020.87 | 4.34 | 4.38 | 0.86% | ||||||||||||||||||||
Tax-Free Income Fund | Class A | 1,000.00 | 1,012.50 | 1,020.72 | 4.51 | 4.53 | 0.89% | |||||||||||||||||||
Class C | 1,000.00 | 1,008.70 | 1,016.99 | 8.25 | 8.29 | 1.63% | ||||||||||||||||||||
Class R | 1,000.00 | 1,012.20 | 1,019.56 | 5.68 | 5.70 | 1.12% | ||||||||||||||||||||
Institutional Service Class | 1,000.00 | 1,013.00 | 1,021.37 | 3.86 | 3.87 | 0.76% | ||||||||||||||||||||
Institutional Class | 1,000.00 | 1,013.80 | 1,022.08 | 3.15 | 3.16 | 0.62% | ||||||||||||||||||||
| * | Expenses are equal to the Fund’s annualized expense ratio multiplied by the average account value over the period multiplied by 184/365 (to reflect the one-half year period). |
| ** | The expense ratio presented represents a six-month, annualized ratio. |
| 1 | Represents the hypothetical 5% return before expenses. |
| 2017 Annual Report | 77 |
Supplemental Information (Unaudited)
Board of Trustees’ Consideration of Advisory and Sub-Advisory Agreements
At an in-person meeting of the Board of Trustees (the “Board” or the “Trustees”) of the Aberdeen Funds (the “Trust”) held on June 14, 2017, the Board, including a majority of the Trustees who are not considered to be “interested persons” of the Trust (the “Independent Trustees”) under the Investment Company Act of 1940, as amended (the “1940 Act”), approved for an annual period the continuation of the Trust’s advisory agreement (the “Agreement”) with Aberdeen Asset Management Inc. (“AAMI” or the “Adviser”) and the applicable sub-advisory agreements (each a “Sub-Advisory Agreement,” and collectively with the Advisory Agreement, the “Agreements”) between: (i) AAMI and Aberdeen Asset Management Asia Limited (“AAMAL”) and (ii) AAMI and Aberdeen Asset Managers Limited (“AAML”) (each a “Sub-Adviser,” and collectively, the “Sub-Advisers”) for each of the following series of the Trust: Aberdeen Asia Bond Fund, Aberdeen Emerging Markets Debt Fund, Aberdeen Global Unconstrained Fixed Income Fund and Aberdeen Tax-Free Income Fund (each a “Fund,” and collectively the “Funds”). AAMAL and AAML are affiliates of AAMI. AAMI and the Sub-Advisers are sometimes referred to collectively as the “Advisers.”
In connection with contract review meetings, the Board reviews a variety of information provided by the Advisers relating to the Funds, the Agreements and the Advisers, including comparative performance, fee and expense information and other information regarding the nature, extent and quality of services provided by the Advisers under their respective Agreements. The materials provided to the Board generally included, among other items: (i) information on the investment performance of the Funds and the performance of peer groups of funds and the Funds’ performance benchmarks; (ii) information on the Funds’ advisory fees and other expenses, including information comparing each Fund’s expenses to those of a peer group of funds and information about any applicable expense limitations and fee “breakpoints”; (iii) sales and redemption data with respect to each Fund; (iv) information about the profitability of the Agreements to the Advisers; (v) a report prepared by the Advisers in response to a request submitted by the Independent Trustees’ independent legal counsel on behalf of such Trustees; and (vi) a memorandum from the Independent Trustees’ independent legal counsel on the responsibilities of the Board in considering for approval the investment advisory and investment sub-advisory arrangements under the 1940 Act and Delaware law. The Board, including the Independent Trustees, also considers other matters such as: (i) the Advisers’ financial results and financial condition; (ii) each Fund’s investment objective and strategies; (iii) the Advisers’ investment personnel and operations; (iv) arrangements relating to the distribution of the Funds’ shares and the related costs; (v) the procedures employed to determine the value of the Funds’ assets; (vi) the allocation of the Funds’ brokerage, if any, including, if applicable, allocations to brokers affiliated with the Advisers and the use, if any, of “soft” commission dollars to pay Fund expenses and to pay for research and other similar services; (vii) the resources devoted to, and the record of compliance with, the Funds’ investment policies and restrictions, policies on personal securities transactions and other compliance policies; and (viii) possible conflicts of interest. The Board also considered the nature, extent and quality of the services provided to the Funds by AAMI’s affiliates. Throughout the process, the Trustees are afforded the opportunity to ask questions of and request additional materials from AAMI and the Sub-Advisers.
In addition to the materials requested by the Trustees in connection with their annual consideration of the continuation of the Agreements, the Trustees receive materials in advance of each regular quarterly meeting of the Board that provide information relating to the services provided by the Advisers, including detailed information about the Funds’ investment performance. This information generally includes, among other things, third-party performance rankings for various periods (including prior to the Advisers’ management of the Funds, to the extent applicable) comparing each Fund against its peer group, total return information for various periods, and details of sales and redemptions of Fund shares for the period. The Board also receives periodic presentations from the portfolio management teams in connection with the performance of the Funds.
The Independent Trustees were advised by separate independent legal counsel throughout the process. The Independent Trustees also consulted in executive sessions with counsel to the Independent Trustees regarding consideration of the renewal of the Agreements. In considering whether to approve the continuation of the Agreements, the Board of Trustees, including the Independent Trustees, did not identify any single factor as determinative. Individual Trustees may have evaluated the information presented differently from one another, giving different weights to various factors. Matters considered by the Trustees, including the Independent Trustees, in connection with their approval of the continuation of the Agreements included the factors listed below.
The nature, extent and quality of the services provided to the Funds under the Agreements. The Trustees considered the nature, extent and quality of the services provided by AAMI and the Sub-Advisers, as applicable, to the Funds and the resources dedicated to the Funds by AAMI and its affiliates. The Board considered, among other things, the Advisers’ investment experience. The Board also considered the background and experience of the Advisers’ senior management personnel and the qualifications, background and responsibilities of the portfolio managers that are primarily responsible for the day-to-day portfolio management services for the Funds. The Board also considered the allocation of responsibilities among the Advisers. The Trustees considered not only the advisory services provided by AAMI to the Funds, but also the administrative services provided by AAMI to the Funds under a separate administration agreement. AAMI’s role in coordinating the activities of the Trust’s other service providers was also considered. The Board also considered that it receives information on a regular basis from the Trust’s Chief Compliance Officer regarding the Advisers’ compliance policies and procedures. The Board also considered the Advisers’ risk management processes. The Board was also mindful of the Advisers’ focus on the monitoring of the performance of the Funds and in addressing performance
| 78 | Annual Report 2017 |
Supplemental Information (Unaudited) (continued)
matters. The Trustees also considered the benefits to shareholders of investing in a mutual fund that is part of a family of funds that offers shareholders the right to exchange shares of one type of fund for shares of another type of fund, and provides a variety of fund and shareholder services. The Board also took into account its knowledge of management and the quality of the performance of management’s duties through Board meetings, discussion and reports during the preceding year.
After reviewing these and related factors, the Board concluded that they were satisfied with the nature, extent and quality of the services provided and supported the renewal of the Agreements.
Investment performance of the Funds and the Advisers. The Trustees received information about the performance of the Funds over various time periods, including information which compared the performance of the Funds to the performance of peer groups of funds and each Fund’s performance benchmark. The Trustees also considered that certain of the Funds had changed their respective performance benchmarks to better reflect the respective Fund’s investment strategy. The Trustees also considered the performance of the Funds compared to the performance of comparable funds or accounts managed by AAMI and its affiliates to the extent available. In addition, the Trustees also reviewed data prepared by an independent third party which analyzed the performance of the Funds using a variety of performance metrics.
The Trustees also considered AAMI’s and the Sub-Advisers’ performance and reputation generally, the performance of the fund family generally, the historical responsiveness of AAMI to Trustee concerns about performance and the willingness of AAMI and the Sub-Advisers to take steps intended to improve performance. The Trustees also considered the performance of the Advisers since they commenced management of the Funds.
Based on these factors, the Board determined that the Advisers are appropriate investment advisers for the Funds.
The Board further noted that it will continue to monitor the Funds’ performance and any actions taken by AAMI and its affiliates relating to performance.
The costs of the services provided and profits realized by the Advisers and their affiliates from their relationships with the Funds. The Trustees considered the fees charged to the Funds for advisory services as well as the total expense levels of the Funds. This information included comparisons (provided both by management and also by an independent third party) of each Fund’s net management fee and total expense level to those of its expense peer group and information about the advisory fees charged by AAMI to any separately managed accounts with a similar strategy. In comparing each Fund’s net management fee to that of comparable funds, the Board noted that such fee includes both advisory and administrative fees. In considering the fees charged to any comparable accounts, the Trustees considered, among other things, management’s discussion of the different objectives, policies or restrictions that may be involved in managing the different types of accounts. In evaluating the Funds’ advisory fees, the Trustees also took into account the demands, complexity and quality of the investment management of the Funds.
The Trustees also noted that the sub-advisory fees, as applicable, for the Funds would be paid by AAMI out of its advisory fee, not by the Funds. The Board also considered that AAMI had entered into expense limitation agreements with the Funds, pursuant to which AAMI agreed to waive a portion of its advisory fee and/or reimburse certain expenses as a means of limiting each Fund’s total annual operating expenses for a period of time.
The Trustees also considered the compensation directly or indirectly received by AAMI and its affiliates from their relationships with the Funds. The Trustees reviewed information provided by management as to the profitability of AAMI and its affiliates’ relationships with the Funds, such as the engagement of affiliates of AAMI to provide distribution and administrative services to the Funds. The Trustees also examined the profitability of AAMI and its affiliates on a Fund-by-Fund basis. The Trustees also considered information about the allocation of expenses used to calculate profitability. When reviewing profitability, the Trustees also considered information about court cases regarding adviser profitability, the performance of the Funds, the expense levels of the Funds, and whether AAMI had implemented breakpoints and expense limitations with respect to the Funds.
After reviewing these and related factors, including taking into account management’s discussion regarding Fund expenses, the Board concluded that the advisory fee, and as applicable, the sub-advisory fees, were fair and reasonable, and that the costs of these services generally and the related profitability of AAMI and its affiliates from their relationships with the Funds were reasonable and supported the renewal of the Agreements.
Economies of Scale. The Trustees considered the existence of any economies of scale in the provision of services by AAMI and the Sub-Advisers and whether those economies would be shared with the Funds through breakpoints in the investment advisory fees or other means, such as expense waivers or limitations. The Trustees noted that each of the Funds was subject to an expense limitation and considered that certain Funds were subject to breakpoints. The Board noted management’s discussion of the Funds’ advisory fee structure. The Trustees also took note of the costs of the services provided and the profitability to AAMI and its affiliates from their relationships with the Funds, as discussed above. The
| 2017 Annual Report | 79 |
Supplemental Information (Unaudited) (concluded)
Board also considered the potential effect of each Fund’s growth and size on fees, noting that if a Fund’s assets increase over time, the Fund may realize other economies of scale if assets increase proportionally more than certain expenses.
After reviewing these and related factors, the Board concluded that the advisory fee, and as applicable, sub-advisory fees were reasonable and supported the renewal of the Agreements.
The Trustees also considered other factors, which included but were not limited to the following:
| • | the effect of any market and economic volatility on the performance, asset levels and expense ratios of the Funds. |
| • | whether the Funds have operated in accordance with their investment objectives and the Funds’ record of compliance with their investment restrictions, and the compliance programs of the Trust and AAMI. The Trustees also considered the compliance-related resources AAMI and its affiliates were providing to the Funds. |
| • | the nature, quality, cost and extent of administrative services performed by AAMI under the Agreement and under a separate agreement covering administrative services. |
| • | so-called “fallout benefits” to AAMI, such as the benefits of research made available to AAMI by reason of brokerage commissions generated by the Funds’ securities transactions or reputational and other indirect benefits. The Trustees considered any possible conflicts of interest associated with these fallout and other benefits, and the reporting, disclosure and other processes in place to disclose and monitor such possible conflicts of interest. |
* * *
Based on their evaluation of all factors that they deemed to be material, including those factors described above, and assisted by the advice of independent counsel, the Trustees, including the Independent Trustees, concluded that renewal of the Agreements would be in the best interest of each of the Funds and its shareholders. Accordingly, the Board, and the Independent Trustees voting separately, approved the Agreements for an additional one-year period.
| 80 | Annual Report 2017 |
Management of the Funds (Unaudited)
As of October 31, 2017
Board of Trustees and Officers of the Trust
| Name, Address, and Year of Birth | Position(s) Held, Length of Time Served and Term of Office* | Principal Occupation During Past 5 Years | Number of Portfolios in Fund Complex Overseen by Trustee** | Other Directorships Held by Trustee During Past 5 Years*** | ||||
Trustees who are not interested persons (as defined in the 1940 Act) of the trust (“Independent Trustees”) | ||||||||
P. Gerald Malone**** Year of Birth: 1950 | Trustee since December 2007 Chairman of the Board | Mr. Malone is, by profession, a solicitor of some 40 years standing. He has served as a Minister of State in the United Kingdom Government. Mr. Malone currently serves as Independent Chairman of two UK companies, Crescent OTC Ltd (pharmaceutical services) and fluidOil Ltd. (oil services). He also serves as a director of Aberdeen Asia-Pacific Income Investment Company Limited (Canadian investment fund) since 2001. He is Chairman of the Board of Trustees of Aberdeen Funds and Chairman of the Board of Directors of Aberdeen Global Income Fund, Inc. and Aberdeen Asia-Pacific Income Fund, Inc. He previously served as chairman of Ultrasis plc (healthcare software services company) until October 2014 and director of US company Rejuvenan llc (wellbeing services) until September 2017. | 22 | None. | ||||
Richard H. McCoy**** Year of Birth: 1942 | Trustee since December 2007 | Prior to retiring in 2003, Mr. McCoy was Vice-Chairman, Investment Banking, at TD Securities Inc. He is currently a Director of Uranium Participation Corp. and Pizza Pizza Royalty Corp. and Chair of Chorus Aviation Inc. Mr. McCoy has also been Chairman of Aberdeen Asia-Pacific Income Investment Company Limited since 2010. | 18 | None. | ||||
Neville J. Miles**** Year of Birth: 1946 | Trustee since December 2011 | Mr. Miles is, and has been for over ten years, Chairman of Ballyshaw Pty. Ltd. (share trading, real estate development and investment). He is Chairman of the Board of Directors of Aberdeen Australia Equity Fund, Inc. He also is a non-executive director of a number of Australian and overseas companies. | 21 | None. | ||||
Rahn K. Porter**** Year of Birth: 1954 | Trustee since September 2016 | Mr. Porter has been the Chief Financial Officer of The Colorado Health Foundation since 2013. Previously, he was the Interim Chief Executive Officer of the Colorado Health Foundation from 2014 to 2015 and was Senior Vice President and Treasurer, Qwest Communications International Inc. (telecommunications) from 2008 to 2011. | 20 | Director, CenturyLink Investment Management Company, since 2006; Director, BlackRidge Financial Inc., since March, 2005. | ||||
| 2017 Annual Report | 81 |
Management of the Funds (Unaudited) (continued)
As of October 31, 2017
| Name, Address, and Year of Birth | Position(s) Held, Length of Time Served and Term of Office* | Principal Occupation During Past 5 Years | Number of Portfolios in Fund Complex Overseen by Trustee** | Other Directorships Held by Trustee During Past 5 Years*** | ||||
Steven N. Rappaport**** Year of Birth: 1948 | Trustee since September 2016 | Mr. Rappaport has been a Partner of Lehigh Court, LLC (private investment firm) and RZ Capital LLC (private investment firm) since 2004. | 23 | Director of iCAD, Inc., since 2006; Director of Credit Suisse Funds (9) since 1999; Director of Credit Suisse Asset Management Income Fund, Inc. since 2005 and Director of Credit Suisse High Yield Bond Fund, Inc. since 2005. | ||||
Peter D. Sacks**** Year of Birth: 1945 | Trustee since December 2007 | Mr. Sacks was a Director and Founding Partner of Toron AMI International Asset Management (investment management) from 1988 to 2015. He is currently a Director of Aberdeen Asia-Pacific Income Fund Inc., Aberdeen Global Income Fund Inc., Aberdeen Australia Equity Fund Inc. and Tricon Capital Group Inc. | 21 | None. | ||||
John T. Sheehy**** Year of Birth: 1942 | Trustee since December 2007 | Mr. Sheehy has been a Senior Managing Director of B.V. Murray and Company (investment banking) since 2001 and Director of Macquarie AIR-serv Holding, Inc. (automotive services) from 2006 to 2013. He was a Managing Member of Pristina Capital Partners, LLC (water purification technology development) from 2007 to 2011 and a Director of Smarte Carte, Inc. (airport services) from 2007 to 2010. He has been a Director of Aberdeen Asia-Pacific Income Investment Company Limited (Canadian investment fund) since 1986. | 21 | None. | ||||
Warren C. Smith**** Year of Birth: 1955 | Trustee since December 2007 | Mr. Smith has been a founding partner of MRB Partners Inc. (independent investment research and consultancy firm) since 2010. He has been a Director of Aberdeen Asia-Pacific Income Investment Company Limited (Canadian investment fund) since 1993. Mr. Smith was a Managing Editor with The Bank Credit Analyst Research Group (independent publishers of financial market research and publications, including The Bank Credit Analyst) from 1982 to 2009. | 18 | None. |
| 82 | Annual Report 2017 |
Management of the Funds (Unaudited) (continued)
As of October 31, 2017
| Name, Address, and Year of Birth | Position(s) Held, Length of Time Served and Term of Office* | Principal Occupation During Past 5 Years | Number of Portfolios in Fund Complex Overseen by Trustee** | Other Directorships Held by Trustee During Past 5 Years*** | ||||
Trustees who are interested persons (as defined in the 1940 Act) of the trust (“Interested Trustees”) | ||||||||
Martin Gilbert****† Year of Birth: 1955 | Trustee since December 2007 | Mr. Gilbert is a founding director and shareholder, and Chief Executive of Aberdeen Asset Management PLC, the holding company of the fund management group that was established in 1983 (“Aberdeen Group”). He was a Director (1991–2014) of Aberdeen Asset Management Asia Limited and a Director (2000–2014) of Aberdeen Asset Management Limited. He was a Director (1995–2014) and was President (September 2006–2014) of Aberdeen Asset Management Inc. Mr. Gilbert also serves as officer and/or director of various Aberdeen Group subsidiary companies, Aberdeen-managed investment trusts and funds’ boards. | 22 | None. | ||||
| * | Each Trustee holds office for an indefinite term until his successor is elected and qualified. |
| ** | The Aberdeen Fund Complex consists of the Trust which currently consists of 18 portfolios, Aberdeen Asia-Pacific Income Fund, Inc., Aberdeen Global Income Fund, Inc., Aberdeen Australia Equity Fund, Inc., Aberdeen Chile Fund, Inc., Aberdeen Israel Fund, Inc., Aberdeen Indonesia Fund, Inc., Aberdeen Latin America Equity Fund, Inc., Aberdeen Emerging Markets Smaller Company Opportunities Fund, Inc., Aberdeen Singapore Fund, Inc., The Asia Tigers Fund, Inc., The India Fund, Inc., Aberdeen Greater China Fund, Inc., Aberdeen Japan Equity Fund, Inc., Aberdeen Income Credit Strategies Fund and Aberdeen Investment Funds, which currently consists of 4 portfolios. |
| *** | Directorships held in (1) any other investment companies registered under the 1940 Act, (2) any company with a class of securities registered pursuant to Section 12 of the Securities Exchange Act of 1934, as amended (the “Exchange Act”) or (3) any company subject to the requirements of Section 15(d) of the Exchange Act. |
| **** | Each Trustee may be contacted by writing to the Trustee c/o Aberdeen Asset Management Inc., 1735 Market Street, 32nd Floor, Philadelphia, Pennsylvania 19103, Attn: Alan Goodson. |
| † | Mr. Gilbert is considered to be an “interested person” of the Trust as defined in the 1940 Act because of his affiliation with the Adviser. |
| 2017 Annual Report | 83 |
Management of the Funds (Unaudited) (continued)
As of October 31, 2017
Officers of the Trust
| Name, Address, and Year of Birth | Position(s) Held, Length of Time Served and Term of Office* | Principal Occupation During Past 5 Years | ||
Bev Hendry** Aberdeen Asset Management Inc. 1735 Market Street 32nd Floor Philadelphia, PA 19103 Year of Birth: 1953 | President, Chief Executive Officer and Principal Executive Officer (Since September 2014) | Currently, CEO – Americas and Director at Aberdeen Asset Management Inc. He previously held the position of Co-Head of Americas. Mr. Hendry is also Vice President of Aberdeen Fund Distributors LLC. Mr. Hendry first joined Aberdeen at its headquarters in Scotland in 1987 where he set up Aberdeen’s mutual fund business. He moved to the United States in 1995 to establish Aberdeen’s business in the Americas based out of Fort Lauderdale. Mr. Hendry left Aberdeen in 2008 when the company moved to consolidate its headquarters in Philadelphia. Mr. Hendry re-joined Aberdeen in 2014 from Hansberger Global Investors in Fort Lauderdale, Florida, where he worked for six years as Chief Operating Officer. Bev is a Chartered Accountant and graduated with an MA in Economics from the University of Aberdeen. | ||
Jeffrey Cotton** Aberdeen Asset Management Inc. 1735 Market Street 32nd Floor Philadelphia, PA 19103 Year of Birth: 1977 | Vice President and Chief Compliance Officer (Since March 2011) | Currently, Director, Vice President, Head of International Compliance and Head of Compliance – Americas for Aberdeen Asset Management Inc. Mr. Cotton is also Vice President of Aberdeen Fund Distributors LLC. Mr. Cotton joined Aberdeen in 2010. Prior to joining Aberdeen, Mr. Cotton was a Senior Compliance Officer at Old Mutual Asset Management (2009-2010) supporting its affiliated investment advisers and mutual fund platform. Mr. Cotton was also a Vice President and Senior Compliance Manager at Bank of America/Columbia Management (2006-2009). | ||
Joseph Andolina** Aberdeen Asset Management Inc. 1735 Market Street 32nd Floor Philadelphia, PA 19103 Year of Birth: 1978 | Vice President – Compliance (Since March 2017) | Currently, Vice President, Deputy Head of Compliance – Americas & U.S. Counsel for Aberdeen Asset Management Inc. In this capacity, Mr. Andolina takes a lead role in the management and implementation of the U.S. Compliance Program and supports the group globally on SEC-related matters. Prior to joining the Compliance Department, he was a member of Aberdeen’s Legal Department, where he served as U.S. Counsel and worked primarily on matters relating to Aberdeen’s registered funds. Before joining Aberdeen in 2012, Mr. Andolina was an associate at Drinker Biddle & Reath LLP in Philadelphia where he worked in the firm’s Investment Management Group. |
| 84 | Annual Report 2017 |
Management of the Funds (Unaudited) (continued)
As of October 31, 2017
| Name, Address, and Year of Birth | Position(s) Held, Length of Time Served and Term of Office* | Principal Occupation During Past 5 Years | ||
Andrea Melia** Aberdeen Asset Management Inc. 1735 Market Street 32nd Floor Philadelphia, PA 19103 Year of Birth: 1969 | Treasurer, Chief Financial Officer, and Principal Accounting Officer (Since September 2009) | Currently, Vice President and Head of Fund Operations, Traditional Assets – Americas for Aberdeen Asset Management Inc. (since 2009). Prior to joining Aberdeen, Ms. Melia was Director of Fund Administration and accounting oversight for Princeton Administrators LLC, a division of BlackRock Inc. and had worked with Princeton Administrators since 1992. | ||
Megan Kennedy** Aberdeen Asset Management Inc. 1735 Market Street 32nd Floor Philadelphia, PA 19103 Year of Birth: 1974 | Secretary and Vice President (Since September 2009) | Currently, Head of Product Management for Aberdeen Asset Management Inc. Ms. Kennedy joined Aberdeen Asset Management Inc. in 2005 as a Senior Fund Administrator. Ms. Kennedy was promoted to Assistant Treasurer Collective Funds/North American Mutual Funds in February 2008 and promoted to Treasurer Collective Funds/North American Mutual Funds in July 2008. | ||
Lucia Sitar** Aberdeen Asset Management Inc. 1735 Market Street 32nd Floor Philadelphia, PA 19103 Year of Birth: 1971 | Vice President (Since December 2008) | Currently, Vice President and Managing U.S. Counsel for Aberdeen Asset Management Inc. Ms. Sitar joined Aberdeen Asset Management Inc. in July 2007. | ||
Brad Crombie Aberdeen Asset Management Bow Bells House 1 Bread Street London EC4M 9HH Year of Birth: 1970 | Vice President (Since June 2013) | Currently, Global Head of Fixed Income for Aberdeen Asset Management PLC. Mr. Crombie re-joined Aberdeen in 2012. Prior to re-joining Aberdeen, Mr. Crombie was a Managing Director at Bank of America Merrill Lynch for the bank’s non-financial corporate and high yield credit research team for the Europe, Middle East and Africa region from 2003 to 2012. | ||
Alan Goodson** Aberdeen Asset Management Inc. 1735 Market Street 32nd Floor Philadelphia, PA 19103 Year of Birth: 1974 | Vice President (Since March 2009) | Currently, Director, Vice President and Head of Product – U.S. for Aberdeen Asset Management Inc., overseeing Product Management and Product Development for Aberdeen’s registered and unregistered investment companies in the U.S. and Canada. Mr. Goodson is Director and Vice President of Aberdeen Asset Management Inc. and joined Aberdeen in 2000. | ||
Adam McCabe** Aberdeen Asset Management Asia Limited 21 Church Street #01-01 Capital Square Two Singapore 049480 Year of Birth: 1979 | Vice President (Since March 2010) | Currently, Head of Asian Fixed Income on the Fixed Income – Asia Pacific desk, responsible for currency and interest rate strategies in Aberdeen’s Asian fixed income portfolios. Mr. McCabe joined Aberdeen in 2009 following the acquisition of certain asset management businesses from Credit Suisse. Mr. McCabe worked for Credit Suisse since 2001, where he was an investment manager responsible for the development and implementation of its Asian currency and interest rate strategies. |
| 2017 Annual Report | 85 |
Management of the Funds (Unaudited) (concluded)
As of October 31, 2017
| Name, Address, and Year of Birth | Position(s) Held, Length of Time Served and Term of Office* | Principal Occupation During Past 5 Years | ||
Jennifer Nichols** Aberdeen Asset Management Inc. 1735 Market Street 32nd Floor Philadelphia, PA 19103 Year of Birth: 1978 | Vice President (Since December 2007) | Currently, Global Head of Legal for Aberdeen Asset Management PLC. Director and Vice President for Aberdeen Asset Management Inc. (since October 2006). | ||
Hugh Young** Aberdeen Asset Management Asia Limited 21 Church Street #01-01 Capital Square Two Singapore 049480 Year of Birth: 1958 | Vice President (Since June 2011) | Currently, Managing Director of Aberdeen Asset Management Asia Limited (since 1991) and member of the Executive Management Committee and Director of Aberdeen Asset Management PLC (since 1991 and 2011, respectively). Mr. Young joined Aberdeen in 1991. | ||
Brian O’Neill** Aberdeen Asset Management Inc. 1735 Market Street 32nd Floor Philadelphia, PA 19103 Year of Birth: 1968 | Assistant Treasurer (Since September 2008) | Currently, Senior Fund Administration Manager – U.S. for Aberdeen Asset Management Inc. Mr. O’Neill joined Aberdeen Asset Management Inc. in 2008. Prior to joining Aberdeen Asset Management Inc., Mr. O’Neill was a Director of Fund Accounting with Nationwide Funds Group (2002-2008). | ||
Eric Olsen** Aberdeen Asset Management Inc. 1735 Market Street 32nd Floor Philadelphia, PA 19103 Year of Birth: 1970 | Assistant Treasurer (Since December 2013) | Currently, Deputy Head of Fund Administration – U.S. for Aberdeen Asset Management Inc. Mr. Olsen joined Aberdeen Asset Management Inc. in August 2013. Prior to joining Aberdeen Asset Management Inc., Mr. Olsen was a Director of Financial Reporting for BNY Mellon Asset Servicing and had worked with BNY Mellon since 1998. | ||
Andrew Kim** Aberdeen Asset Management Inc. 1735 Market Street 32nd Floor Philadelphia, PA 19103 Year of Birth: 1983 | Assistant Secretary (Since March 2017) | Currently, Product Manager for Aberdeen Asset Management Inc. He joined Aberdeen in August 2013. Prior to Aberdeen, he worked at Weil, Gotshal & Manges LLP as a litigation paralegal. | ||
Stephen Varga** Aberdeen Asset Management Inc. 1735 Market Street 32nd Floor Philadelphia, PA 19103 Year of Birth: 1985 | Assistant Secretary (Since March 2017) | Currently, Product Manager for Aberdeen Asset Management Inc. Mr. Varga joined Aberdeen in 2011, where he worked for the U.S. Operations Team. He joined the Product Management team in June of 2013. Previously, he worked at SEI Investments as a Senior Fund Accountant. |
| * | Each officer holds office for an indefinite term at the pleasure of the Board of Trustees and until his or her successor is elected and qualified. |
| ** | Mr. Hendry, Ms. Melia, Ms. Kennedy, Mr. Goodson, Ms. Nichols, Mr. Cotton, Mr. McCabe, Mr. Young, Ms. Sitar, Mr. Andolina, Mr. Olsen, Mr. O’Neill, Mr. Kim and Mr. Varga hold officer position(s) in one or more of the following: Aberdeen Asia-Pacific Income Fund, Inc., Aberdeen Australia Equity Fund, Inc., Aberdeen Global Income Fund, Inc., Aberdeen Chile Fund, Inc., Aberdeen Israel Fund, Inc., Aberdeen Indonesia Fund, Inc., Aberdeen Latin America Equity Fund, Inc., Aberdeen Emerging Markets Smaller Company Opportunities Fund, Inc., Aberdeen Singapore Fund, Inc., The Asia Tigers Fund, Inc., The India Fund, Inc., Aberdeen Greater China Fund, Inc., Aberdeen Japan Equity Fund, Inc. and Aberdeen Investment Funds (consisting of 4 portfolios), each of which may also be deemed to be a part of the same “Fund Complex” as the Trust. |
| 86 | Annual Report 2017 |
Management Information
Trustees
P. Gerald Malone, Chairman
Martin J. Gilbert
Richard H. McCoy
Neville J. Miles
Rahn K. Porter
Steven N. Rappaport
Peter D. Sacks
John T. Sheehy
Warren C. Smith
Officers
Bev Hendry, President and Chief Executive Officer
Jeffrey Cotton, Chief Compliance Officer and Vice President
Joseph Andolina, Vice President — Compliance
Andrea Melia, Treasurer and Chief Financial Officer
Megan Kennedy, Secretary and Vice President
Brad Crombie, Vice President
Lucia Sitar, Vice President
Alan Goodson, Vice President
Adam McCabe, Vice President
Jennifer Nichols, Vice President
Hugh Young, Vice President
Eric Olsen, Assistant Treasurer
Brian O’Neill, Assistant Treasurer
Andrew Kim, Assistant Secretary
Stephen Varga, Assistant Secretary
Investment Manager
Aberdeen Asset Management Inc.
1735 Market Street, 32nd Floor
Philadelphia, PA 19103
Fund Administrator
Aberdeen Asset Management Inc.
1735 Market Street, 32nd Floor
Philadelphia, PA 19103
Transfer Agent
Boston Financial Data Services, Inc.
30 Dan Road
Canton, MA 02021
Distributor
Aberdeen Fund Distributors LLC
1735 Market Street, 32nd Floor
Philadelphia, PA 19103
Sub-Administrator, Custodian & Fund Accountant
State Street Bank and Trust Company
1 Heritage Drive, 3rd Floor
North Quincy, MA 02171
Independent Registered Public Accounting Firm
KPMG LLP
1601 Market Street
Philadelphia, PA 19103
Fund Counsel
Willkie Farr & Gallagher LLP
787 Seventh Avenue
New York, NY 10019
Aberdeen Asset Management Inc. 1735 Market Street, 32nd Floor Philadelphia, PA 19103 aberdeen-asset.us | |
AOE-0143-AR

Aberdeen Funds
Asset Allocations Series
Annual Report
October 31, 2017
Aberdeen Diversified Alternatives Fund
Aberdeen Diversified Income Fund
Aberdeen Dynamic Allocation Fund

| Page 2 | ||||
| Page 4 | ||||
| Page 9 | ||||
| Page 14 | ||||
| Page 19 | ||||
| Page 32 | ||||
| Page 45 | ||||
| Page 46 | ||||
| Page 47 | ||||
| Page 48 | ||||
| Page 51 | ||||
Investors should carefully consider a fund’s investment objectives, risks, fees, charges and expenses before investing any money. To obtain this and other fund information, please call 866-667-9231 to request a prospectus, or download a prospectus at www.aberdeen-asset.us. Please read it carefully before investing any money.
Investing in mutual funds involves risk, including possible loss of principal.
Aberdeen Funds is distributed by Aberdeen Fund Distributors LLC, Member FINRA, 1735 Market Street, 32nd Floor, Philadelphia, PA 19103.
Aberdeen Asset Management Inc. (“AAMI”) has been registered as an investment adviser under the Investment Advisers Act of 1940 since August 23, 1995.
Statement Regarding Availability of Quarterly Portfolio Schedule.
The complete schedule of portfolio holdings for each fund of Aberdeen Funds (each, a “Fund” and collectively, the “Funds”) is included in the Funds’ semi-annual and annual reports to shareholders. Aberdeen Funds also files complete schedules of portfolio holdings for each Fund with the Securities and Exchange Commission (the “Commission”) for the first and third quarters of each fiscal year on Form N-Q. The Funds’ Form N-Q filings are available on the Commission’s website at http://www.sec.gov. The Funds’ Form N-Q filings may be reviewed and copied at the Commission’s Public Reference Room in Washington, DC, and information on the operation of the Public Reference Room may be obtained by calling 800-SEC-0330; and the Funds make the information on Form N-Q available to shareholders on www.aberdeen-asset.us or upon request without charge.
Statement Regarding Availability of Proxy Voting Record.
Information regarding the policies and procedures that the Funds use to determine how to vote proxies relating to portfolio securities is available without charge, upon request, by calling 1-866-667-9231. The information is also included in the Funds’ Statement of Additional Information, which is available on the Funds’ website at www.aberdeen-asset.us and on the Commission’s website at www.sec.gov.
Information relating to how each Fund voted proxies relating to portfolio securities held during the most recent twelve months ended June 30 is available by August 30 of the relevant year: (i) upon request and without charge by calling 1-866-667-9231; and (ii) on the Commission’s website at www.sec.gov.
It appeared that the 12-month period ended October 31, 2017 saw the waning of the populist movement and a move towards the center in the global political arena. Early in the period in November 2016, Republican Donald Trump unexpectedly won the U.S. presidential election, defeating his Democratic party opponent, former U.S. Senator and Secretary of State Hillary Clinton. Trump’s victory seemed to be a continuation of the populist political movement that led to the UK’s vote to leave the European Union (known as Brexit) in June 2016. However, there appeared to be a change in voters’ sentiment in the spring of 2017, as candidates campaigning on a populist platform in the Netherlands and France lost national elections to more politically moderate opponents. Incumbent Prime Minister Mark Rutte’s People’s Party for Freedom and Democracy (VVD) won significantly more seats in the Dutch Parliament than Geert Wilders’ far-right Party for Freedom (PPV) in the Netherlands’ election in March 2017. Independent centrist candidate Emmanuel Macron subsequently claimed victory in the final round of the French presidential election in early May 2017, by a nearly two-to-one margin over far-right candidate Marine Le Pen. In the U.S., President Trump encountered numerous political challenges and obstacles to the fulfillment of his campaign promises – most notably the ongoing investigation of several members of his administration into possible collusion with the Russian government during the presidential election of 2016.
On the geopolitical front, in September 2017, North Korean leader Kim Jong Un claimed that the nation conducted a successful underground detonation of a hydrogen bomb, which reached a magnitude of 6.3 on the Richter scale, according to the U.S. Geological Survey. The following week, North Korea fired another intermediate-range ballistic missile which passed over the island of Hokkaido in Japan and subsequently landed in the Pacific Ocean. The launch from Pyongyang, North Korea’s capital, occurred after the United Nations Security Council unanimously adopted new sanctions against the nation.
The Morgan Stanley Capital International (MSCI) World Index,1 a global equity market benchmark, rose 23.4% for the 12-month period ended October 31, 2017. European large-cap stocks were the strongest performers among global developed markets, with the MSCI Europe Index up 27.0%. Shares of Asian and U.S. large-cap companies, as represented by the MSCI All Country (AC) Asia Pacific Index and the U.S. broader-market Standard & Poor’s (S&P) 500 Index, recorded corresponding gains of 23.7% and 23.6% over the period. Global emerging equity markets, as measured by the MSCI Emerging Markets Index, outperformed their developed-market counterparts, advancing 26.9% for the reporting period
Major U.S. equity indices moved sharply higher over the reporting period despite several periods of uncertainty surrounding the policies of the Trump administration. Most U.S. companies reported strong results and generally upbeat outlooks during the period. Corporate earnings generally were strong enough to support stocks across the market-capitalization ranges. U.S. small-cap stocks, as measured by the Russell 2000 Index, advanced 27.9% for the reporting period, outperforming the 23.6% and 21.1% returns of their large- and mid-cap counterparts, as measured by the S&P 500 Index and the Russell Midcap Index, respectively. Roughly 75% of S&P 500 Index companies posted better-than-expected earnings per share (EPS) for the third-quarter 2017 reporting season, while two-thirds exceeded consensus revenue estimates.2
Both European and UK stocks3 posted double-digit gains over the reporting period. In the Eurozone, the economic recovery, as well as investors’ positive views on the outcomes from elections in France and the Netherlands, strengthened the equity market. However, the rally was tempered by investors’ worries over rising secessionist fervor in the Catalonia region of Spain and its potential disruption to business operations. The UK market was hampered somewhat by Prime Minister Theresa May’s failed bid to secure a larger mandate from a snap election that resulted in a hung Parliament in June 2017.
The Asia-Pacific market also saw strong performance over the reporting period despite geopolitical tensions on the Korean peninsula and uncertainty regarding the prospect of major global central banks withdrawing monetary stimulus. China led the upturn in the region, buttressed by upbeat economic growth data, along with benchmark index provider MSCI’s decision to include A-shares4 in its influential indices and a sustained rise in Chinese internet stocks. Late in the reporting period, investors appeared to shrug off S&P’s downgrade of the country’s sovereign debt rating.5 Conversely, while Japanese equities rose sharply over the reporting period, they underperformed the overall Asia-Pacific region and their global developed-market counterparts due to investors’ concerns regarding external factors such as the volatile political environment in the U.S. and UK.
Emerging stock markets generally posted healthy gains for the reporting period. Within Latin America, Brazilian equities performed well despite a notable decline in May 2017, after President Michel Temer became implicated in a corruption scandal. Mexican stocks and the peso initially recovered from a post-U.S. election sell-off, but uncertainty over the fate of the North American Free Trade Agreement (NAFTA) and natural disasters capped gains towards the end of the reporting period. Economic growth in India slowed over the reporting period due to the lingering effects of the government’s demonetization,6 which it initiated in November 2016, while the Goods and Services Tax was implemented in July 2017.
Despite political risks in the U.S., Europe and the UK, global fixed-income markets garnered modestly positive returns over the reporting period amid an improving global economic backdrop. Investment-grade securities, as measured by the Bloomberg Barclays Global Aggregate Bond Index, returned 1.2% for the period. Global high-yield bonds outperformed their investment-grade counterparts by a wide margin, with the ICE Bank of America Merrill Lynch Global High Yield Constrained Index gaining 9.4% for the period. Global government bond yields moved higher after the U.S. presidential election in November 2016, but slowly reversed direction throughout most of 2017; the 10-year U.S. Treasury yield rose 54 basis points to 2.38% over the reporting period. Donald Trump’s win in the November 2016 U.S. presidential election fueled expectations of
| 2 | Annual Report 2017 |
Market Review (concluded)
increased fiscal spending and rising inflation, which halted the global bond market rally at that time. Towards the end of the reporting period, bond yields rose again as major global central banks edged closer towards ending the era of accommodative monetary policy. Both the U.S. Federal Reserve (Fed) and European Central Bank decided to start tapering their quantitative-easing programs. G107 currencies were mostly stronger against the U.S. dollar, while those in emerging markets ended with mixed performance.
Outlook
We believe that generally good economic conditions should support global equity prices. Business sentiment in the U.S. is likely to be buoyed by prospects of lower corporate taxes, in our view. Banks in the Eurozone anticipate healthier demand for loans from both businesses and households. Supporting this environment are still-low interest rates, increased capital expenditures, a favorable housing market, relatively low unemployment and rising consumer confidence. In Japan, investor sentiment improved following Prime Minister Shinzo Abe’s election victory in October 2017, which strengthened his mandate to implement reforms. However, we think that economic growth may moderate in China, as the Chinese Communist Party appears to be prioritizing stability over aggressive growth targets. For emerging markets, we think that future growth may be helped by structural reforms and a rebound in commodity prices. Crude oil prices are recovering, bolstered by growing demand, supply cuts, and stabilizing shale oil production. In addition to these developments, stock-market volatility, as measured by the CBOE Volatility Index,8 is at historical lows. In our view, equities now appear expensive in the U.S. While we do not think that valuations leave much room for upside, we also see little reason for a significant correction outside some external shock – which obviously is not out of the question given political instability both domestically and abroad. We believe that there is scope for improved earnings in Europe, while operational performance in Asia has been improving. We are cognizant that the move by major global central banks to exit quantitative easing, the unresolved Brexit issue in the UK, rising trade protectionism and geopolitical risks could dent corporate earnings growth. However, we believe that our bottom-up investment approach positions our equity portfolios well in the current global market environment. We will remain diligent in monitoring company valuations, financial performance and governance against their growth prospects in an effort to hold investments that we believe can withstand future challenges.
In early November 2017, the Bank of England raised its benchmark interest rate for the first time in a decade and indicated the beginning of a gradual increase in borrowing costs, as monetary policymakers seek to prevent a sustained rise in inflation without choking economic recovery. Meanwhile, the Fed grew more vocal about reducing its balance sheet. While we feel that global bond markets have taken this news in stride, we will not be surprised if the sell-off gathers pace. We do not think that such moves to drain liquidity from the global financial system will go unnoticed as risks to the nascent global economic recovery persist. In credit markets, valuations look expensive, so we will narrow our search to investment-grade companies that we believe have strong balance sheets, healthy cash flows and good management.
Aberdeen Standard Investments
| 1 | Indexes are unmanaged and have been provided for comparison purposes only. No fees or expenses are reflected. You cannot invest directly in an index. |
| 2 | Source: FactSet, “Earnings Insight,” November 2017. |
| 3 | The performance of UK stocks is measured by the MSCI United Kingdom Index. |
| 4 | A-shares are purchased and traded on the Shanghai and Shenzhen stock exchanges. |
| 5 | Standard & Poor’s credit ratings express the agency’s opinion about the ability and willingness of an issuer, such as a corporation or state or city government, to meet its financial obligations in full and on time. Typically, ratings are expressed as letter grades that range, for example, from “AAA” to “D” to communicate the agency’s opinion of relative level of credit risk. Ratings from “AA” to “CCC” may be modified by the addition of a plus (+) or minus (-) sign to show relative standing within the major rating categories. |
| 6 | Demonetization comprises the act of stripping specific denominations of a currency unit of their status as legal tender. The currency denominations are pulled from circulation and are replaced with new currency units. |
| 7 | The G10 nations, which consult and cooperate on economic, monetary and financial matters, include Belgium, Canada, France, Germany, Italy, Japan, the Netherlands, Sweden, Switzerland, the UK and the U.S. |
| 8 | The CBOE Volatility Index is a measure of market expectations of near-term volatility conveyed by S&P 500 stock index option prices. |
| 2017 Annual Report | 3 |
Aberdeen Diversified Alternatives Fund (Unaudited)
The Aberdeen Diversified Alternatives Fund (Institutional Class shares net of fees) returned 4.26% for the 12-month period ended October 31, 2017, versus the 0.71% return of its benchmark, the Citigroup 3-Month Treasury Bill Index, for the same period. For broader comparison, the average return of the Fund’s peer category of Alternative Multi-Strategy Funds (comprising 69 funds), as measured by Lipper, Inc., was 5.14%.
Politics dominated the news over the reporting period, beginning with the surprise victory of Donald J. Trump in the U.S. presidential election in early November 2016. The Italian Constitutional referendum, as well as national elections in the Netherlands and France, also garnered the global markets’ attention during the period. However, unlike the U.S. election, the results of these three votes were in line with expectations, dampening market reactions following the results. Although the U.S. election grabbed most of the headlines and subsequent market reactions, global central banks remained active during the period, with the U.S. Federal Reserve (Fed) in particular continuing its monetary policy tightening cycle. Economic data from the U.S. and Europe indicated firming economic growth, while consumer metrics (confidence and spending) also trended higher. The European Central Bank (ECB) signaled a more hawkish monetary policy tone, but indicated that it would maintain the flow of “cheap money” given its fear of undermining the recovery. At the start of the reporting period, it appeared that investors were the most optimistic since prior to the global financial crisis nearly 10 years earlier. However, much of this optimism faded as President Trump was unable to immediately deliver upon his stated agenda.
However, aside from the political events witnessed during the reporting period, the backdrop for global markets remained one of robust global growth driving equities and cyclical commodities higher, while safe-haven assets such as global government bonds and precious metals were the primary market laggards. The MSCI World Index,1 the Bloomberg Industrial Metals Index2 and the Brent crude oil price gained 23%, 29% and 15%, respectively, during the reporting period. In contrast, the Bloomberg Barclays U.S. Aggregate Bond Index,3 a U.S. fixed-income market benchmark, returned just under 1%. In the developed world, the U.S. continued to lead the economic cycle, with data released during October 2017 showing consumer confidence, auto sales, services and manufacturing surveys all hitting the highest levels seen in over a decade. There was also increased optimism among investors that the U.S. Congress potentially would pass legislation to cut corporate and personal taxes before the end of 2017. Growth stocks outperformed relatively defensive sectors in the global markets for the reporting period and the U.S. dollar recently began to experience a broad-based rally versus both developed- and emerging-market currencies.
The ECB announced that it would begin the process of tapering asset purchases but combined the announcement with a dovish message on the likely future path of ECB interest-rate settings. In Japan, equity markets saw unusually strong returns (the Nikkei Index4 rose 18% in U.S. dollar terms) during the period as the government of Prime Minister Shinzo Abe continued its highly accommodative monetary and fiscal policy stances. Abe and the ruling coalition secured a landslide electoral victory in Japan’s national election in October 2017, promising an extension of accommodative policies in the country. Finally, in China, at the quinquennial Communist Party Congress5, President Xi Jinping consolidated his power at the top tier of the government. There were numerous changes in the membership of the Politburo Standing Committee6 and these were generally viewed as further strengthening Xi’s position within the party. These changes were widely anticipated ahead of the Congress, and Asian markets had a relatively muted reaction to the news.
The Fund’s performance for the 12-month reporting period lagged relative to the dramatic rally in global equity markets. However, the Fund significantly outperformed the broad U.S. fixed-income market, as represented by the Bloomberg Barclays U.S. Aggregate Bond Index. Two of the top three contributors to Fund performance for the period were alternative exposures, Boston Partners Long/Short Research Fund and BlackRock Global Long/Short Equity Fund. With its larger net long7 bias, Boston Partners Long/Short Research Fund’s strong performance was not surprising, as it logged gains across many sectors. Following a difficult year in 2016, BlackRock Global Long/Short Equity Fund derived solid gains from its well-balanced macroeconomic positioning and strong performance from market sentiment signals. The Eaton Vance Floating-Rate Fund was the top directional contributor to Fund performance as credit spreads continued to tighten over the reporting period. Conversely, the Fund’s positions in Otter Creek Long/Short Opportunity Fund and AQR Managed Futures Strategy were the largest detractors from performance. The lack of volatility in markets has hurt Otter Creek Long/Short Opportunity Fund due to its slight net short bias.8 The Fund’s holding in AQR Managed Futures Strategy was not positioned well to benefit from the reversals in different asset class performance over the period, mainly in commodities, fixed income and currencies.
At the end of the reporting period on October 31, 2017, the Fund was invested in line with its alternatives orientation and lower-volatility objective. We believe that global economic growth will be the driving force behind the performance of the financial markets. The global economy has enjoyed a sustained period of strength, attributable primarily to fiscal stimulus in China that was implemented in the summer of 2016, labor market strength in the U.S., and fading political headwinds in the Eurozone. While we think that economic growth in China and the Eurozone may have peaked, we are optimistic about growth prospects in the U.S. and emerging markets outside of China. We believe that the Fed will continue raising interest rates and shrinking its balance sheet; the ECB will taper asset purchases in 2018 and raise rates beginning in 2020; the People’s Bank of China will tweak various market rates to slowly rein in credit growth; and the Bank of Japan will remain accommodative. Nevertheless, we are focused on the possibility of monetary policy error if financial conditions should tighten too quickly, the U.S. Congress fails to enact tax cuts, and the Chinese rein in credit growth too much or stagnation returns. It appears to us that this expansion still has some “gas in the tank,” but we are cognizant of its long run and the possibility of execution risk9 by policymakers derailing it.
| 4 | Annual Report 2017 |
Aberdeen Diversified Alternatives Fund (Unaudited) (concluded)
Portfolio Management
Aberdeen Alternatives and Solutions Team
PAST PERFORMANCE DOES NOT GUARANTEE FUTURE RESULTS.
The performance data quoted represents past performance and current returns may be lower or higher. Class A shares have up to a 5.75% front-end sales charge and a 0.25% 12b-1 fee. The investment return and principal value will fluctuate so that an investor’s shares, when redeemed, may be worth more or less than the original cost. To obtain performance information current to the most recent month-end, which may be higher or lower than the performance shown above, please call 866-667-9231 or go to www.aberdeen-asset.us.
Investing in mutual funds involves risk, including the possible loss of principal.
Indexes are unmanaged and have been provided for comparison purposes only. No fees or expenses are reflected. You cannot invest directly in an index.
Lipper is a leading global provider of mutual fund information and analysis to fund companies, financial intermediaries and media organizations.
Risk Considerations
The Fund is subject to different levels and combinations of risk, based on its actual allocation among the various asset classes and underlying funds. The Fund will be affected by stock and bond market risks, among others.
Foreign securities may be more volatile, harder to price and less liquid than U.S. securities, and are subject to different accounting and regulatory standards, political and economic risks and, to the extent denominated in foreign currencies, currency exchange rate risk (unless otherwise hedged). These risks are enhanced in emerging market countries.
Fixed income securities are subject to certain risks including, but not limited to: interest rate (changes in interest rates may cause a decline in the market value of an investment), credit (changes in the financial condition of the issuer, borrower, counterparty, or underlying collateral), prepayment (debt issuers may repay or refinance their loans or obligations earlier than anticipated), call (some bonds allow the issuer to call a bond for redemption before it matures), and extension (principal repayments may not occur as quickly as anticipated, causing the expected maturity of a security to increase).
The Fund invests a significant proportion of its assets in non-traditional asset classes, which may involve riskier types of securities or investments than those offered by other asset classes.
Please read the prospectus for more detailed information regarding these and other risks.
| 1 | The MSCI World Index tracks the performance of large- and mid-cap equities across 23 developed-market countries. |
| 2 | The Bloomberg Industrial Metals Index tracks the performance of longer-dated futures contracts on aluminum, copper, nickel and zinc. |
| 3 | The Bloomberg Barclays U.S. Aggregate Bond Index is a broad-based benchmark that measures the investment-grade, U.S. dollar-denominated, fixed-rate taxable bond market. |
| 4 | The Nikkei Index tracks the performance of the Nikkei 225 Stock Average, which comprises Japan’s top 225 blue-chip companies traded on the Tokyo Stock Exchange. |
| 5 | The Chinese Communist Party sets its national policy goals and elects its leadership positions at the National Party Congress, which is held every five years. |
| 6 | The Politburo Standing Committee comprises the top leadership of the Communist Party of China. |
| 7 | A portfolio takes a net long position when the percentage of assets invested in long positions exceeds that of assets invested in short positions. |
| 8 | A portfolio takes a net short position when the percentage of assets invested in short positions exceeds that of assets invested in long positions. |
| 9 | Execution risk is the risk that a company’s business plans will not be successful when they are put into action. |
| 2017 Annual Report | 5 |
Aberdeen Diversified Alternatives Fund (Unaudited)
| Average Annual Total Return1 (For periods ended October 31, 2017) | 1 Yr. | 5 Yr. | 10 Yr. | |||||||||||
Class A | w/o SC | 3.82% | 3.45% | 0.73% | ||||||||||
| w/SC2 | (2.17% | ) | 2.24% | 0.13% | ||||||||||
Class C | w/o SC | 3.20% | 2.75% | 0.02% | ||||||||||
| w/SC3 | 2.20% | 2.75% | 0.02% | |||||||||||
Class R4 | w/o SC | 3.49% | 3.12% | 0.43% | ||||||||||
Institutional Service Class4,5 | w/o SC | 4.25% | 3.54% | 0.77% | ||||||||||
Institutional Class4 | w/o SC | 4.26% | 3.78% | 1.02% | ||||||||||
All figures showing the effect of a sales charge (SC) reflect the maximum charge possible because it has the most significant effect on performance data. The total returns shown above do not include the impact of financial statement rounding of the net asset value (NAV) per share and/or financial statement adjustments.
| 1 | The Fund changed its investment objective and strategy effective September 24, 2012. Performance information for periods prior to September 24, 2012 does not reflect the current investment strategy. Returns also incorporate the performance of a predecessor fund (the “Predecessor Fund”) from inception to June 23, 2008. Returns of the Predecessor Fund have not been adjusted to reflect the expenses applicable to the respective classes. Prior to the change of investment objective and strategy of the Fund effective September 24, 2012, the Fund and the Predecessor Fund had substantially similar investment objectives and strategies. Please consult the Fund’s prospectus for more detail. |
| 2 | A 5.75% front-end sales charge was deducted. |
| 3 | A 1.00% contingent deferred sales charge (CDSC) was deducted from the one year return because it is charged when Class C shares are sold within the first year after purchase. |
| 4 | Not subject to any sales charges. |
| 5 | Returns before the commencement of operations of the Institutional Service Class (December 29, 2016) are based on the performance of the Fund’s Class A shares. These returns have not been adjusted to reflect the expenses applicable to the Institutional Service Class. Excluding the effect of any fee waivers or reimbursements, this performance is substantially similar to what the Institutional Service Class shares would have produced because both classes invest in the same portfolio of securities. Returns for the Institutional Service Class shares would only differ to the extent of the differences in expenses of the two classes. |
Performance of a $10,000 Investment (as of October 31, 2017)
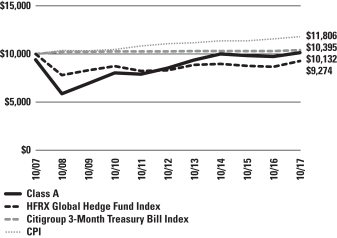
Comparative performance of $10,000 invested in Class A shares of the Aberdeen Diversified Alternatives Fund, the Citigroup 3-Month Treasury Bill Index, the HFRX Global Hedge Fund Index and the Consumer Price Index (CPI) over a 10-year period ended October 31, 2017. Unlike the Fund, the returns for these unmanaged indexes do not reflect any fees, expenses, or sales charges. Investors cannot invest directly in market indexes.
The Citigroup 3-Month Treasury Bill Index consists of the last three-month Treasury bill issues and measures monthly returns equivalents of yield averages that are not marked to market.
The HFRX Global Hedge Fund Index is designed to be representative of the overall composition of the hedge fund universe. It is comprised of all eligible hedge fund strategies; including but not limited to convertible arbitrage, distressed securities, equity hedge, equity market neutral, event driven, macro, merger arbitrage, and relative value arbitrage. The strategies are asset weighted based on the distribution of assets in the hedge fund industry.
The CPI is a measure of the average change over time in the prices paid by urban consumers for a market basket of consumer goods and services.
Investment return and principal value will fluctuate, and when redeemed, shares may be worth more or less than original cost. Past performance is no guarantee of future results. The Average Annual Total Return table and Performance graph do not reflect the deduction of taxes that a shareholder would pay on fund distributions or the redemption of fund shares. Investing in mutual funds involves market risk, including loss of principal. Performance returns assume the reinvestment of all distributions. Performance returns reflect fee waivers and reimbursements in effect, without which returns would have been lower.
| 6 | Annual Report 2017 |
Aberdeen Diversified Alternatives Fund (Unaudited) (concluded)
Portfolio Summary (as a percentage of net assets)
October 31, 2017 (Unaudited)
| Asset Allocation | ||||
Mutual Funds | 82.9% | |||
Exchange Traded Funds | 12.7% | |||
Short-Term Investment | 4.3% | |||
Other Assets in Excess of Liabilities | 0.1% | |||
| 100.0% | ||||
| Top Industries | ||||
Alternative Investment | 55.1% | |||
Fixed Income Funds | 31.8% | |||
Equity Funds | 8.7% | |||
Other | 4.4% | |||
| 100.0% | ||||
| Top Holdings* | ||||
Eaton Vance Floating-Rate Fund, Class I | 19.2% | |||
Boston Partners Long/Short Research Fund, Institutional Class | 11.1% | |||
Gotham Neutral Fund, Institutional Class | 11.0% | |||
BlackRock Global Long/Short Equity Fund, Institutional Class | 10.3% | |||
Arbitrage Event Driven Fund, Institutional Class | 9.7% | |||
Nuveen Preferred Securities Fund, Institutional Class | 8.6% | |||
Otter Creek Long/Short Opportunity Fund, Institutional Class | 7.9% | |||
AQR Managed Futures Strategy Fund, Class I | 5.1% | |||
iShares TIPS Bond ETF | 4.0% | |||
X-trackers MSCI Japan Hedged Equity ETF | 2.6% | |||
Other | 10.5% | |||
| 100.0% | ||||
| * | For the purpose of listing top holdings, Short-Term Investments are included as part of Other. |
| 2017 Annual Report | 7 |
Statement of Investments
October 31, 2017
Aberdeen Diversified Alternatives Fund
| Shares or Principal Amount | Value | |||||||
MUTUAL FUNDS (82.9%) | ||||||||
Alternative Investment (55.1%) | ||||||||
AQR Managed Futures Strategy Fund, Class I | 234,664 | $ | 2,128,400 | |||||
Arbitrage Event Driven Fund, Institutional Class (a) | 423,317 | 4,051,143 | ||||||
BlackRock Global Long/Short Equity Fund, Institutional Class (a) | 360,225 | 4,322,702 | ||||||
Boston Partners Long/Short Research Fund, Institutional Class (a) | 281,270 | 4,635,323 | ||||||
Gotham Neutral Fund, Institutional Class (a) | 445,090 | 4,611,128 | ||||||
Otter Creek Long/Short Opportunity Fund, Institutional Class (a) | 285,653 | 3,327,861 | ||||||
| 23,076,557 | ||||||||
Fixed Income Funds (27.8%) | ||||||||
Eaton Vance Floating-Rate Fund, Class I | 893,826 | 8,053,370 | ||||||
Nuveen Preferred Securities Fund, Institutional Class | 202,688 | 3,607,841 | ||||||
| 11,661,211 | ||||||||
Total Mutual Funds | 34,737,768 | |||||||
EXCHANGE TRADED FUNDS (12.7%) | ||||||||
Equity Funds (8.7%) | ||||||||
iShares Edge MSCI Min Vol USA ETF | 5,254 | 269,635 | ||||||
iShares Edge MSCI USA Momentum Factor ETF | 2,321 | 233,261 | ||||||
iShares Edge MSCI USA Quality Factor ETF | 2,884 | 228,961 | ||||||
iShares Edge MSCI USA Size Factor ETF | 2,122 | 171,182 | ||||||
iShares Edge MSCI USA Value Factor ETF | 4,013 | 318,391 | ||||||
iShares MSCI Eurozone ETF | 19,941 | 874,014 | ||||||
iShares Nasdaq Biotechnology ETF | 1,436 | 451,163 | ||||||
X-trackers MSCI Japan Hedged Equity ETF | 25,662 | 1,107,315 | ||||||
| 3,653,922 | ||||||||
Fixed Income Fund (4.0%) | ||||||||
iShares TIPS Bond ETF | 14,899 | 1,695,506 | ||||||
Total Exchange Traded Funds | 5,349,428 | |||||||
SHORT-TERM INVESTMENT (4.3%) | ||||||||
State Street Institutional U.S. Government Money Market Fund (b) | 1,781,618 | 1,781,618 | ||||||
Total Short-Term Investment | 1,781,618 | |||||||
Total Investments | 41,868,814 | |||||||
Other Assets in Excess of Liabilities—0.1% | 41,635 | |||||||
Net Assets—100.0% | $ | 41,910,449 | ||||||
| (a) | Non-income producing security. |
| (b) | Registered investment company advised by State Street Global Advisors. |
| (c) | See accompanying Notes to Financial Statements for tax unrealized appreciation/(depreciation) of securities. |
| ETF | Exchange-Traded Fund |
| TIPS | Treasury Inflation Protected Securities |
See accompanying Notes to Financial Statements.
| 8 | Annual Report 2017 |
Aberdeen Diversified Income Fund (Unaudited)
The Aberdeen Diversified Income Fund (Institutional Class shares net of fees) returned 10.66% for the 12-month period ended October 31, 2017, versus the 0.90% return of its benchmark, the Bloomberg Barclays U.S. Aggregate Bond Index, for the same period. For broader comparison, the average return of the Fund’s peer category of Flexible Portfolio Funds (comprising 261 funds), as measured by Lipper, Inc., was 12.89%.
The 12-month reporting period was dominated by political events, including the surprise victory of Donald J. Trump in the U.S. presidential election in early November 2016. Political events played a part in Europe as well. German Chancellor Angela Merkel was unable to form a coalition government, Brexit negotiations continued, and there was a Constitutional referendum in Italy, as well as national elections in the Netherlands and France. However, the political volatility in developed countries did not translate into market volatility due to the favorable economic background.
The global markets scrambled to interpret the surprise U.S. election result as early gains went to U.S. small-company stocks, which would benefit most from proposed tax reforms. The mere prospect of fiscal stimulus led to higher interest rates and a strengthening U.S. dollar over the period. The stronger dollar and the possibility of restrictive trade policies led to weakness in emerging-market equities in the immediate aftermath of the election.
European equity market performance caught up with the performance of U.S. small-cap company shares in May 2017, as Emmanuel Macron was elected president of France and European political fears proved to be overblown. U.S. small-cap stocks sold off in August after President Trump mishandled domestic political unrest. However, the efficacy of the Trump administration was questioned for much of the first 10 months of his term, but overcame pessimism around Republican tax reform efforts after the end of the reporting period in November and early December 2017.
U.S. small-cap stocks began to outperform the global equity markets again in September 2017, as tax reform returned to the front and the U.S. economy improved. European stocks also steadily strengthened as economic growth remained above its historical trend with accommodative monetary policy from the U.S. Federal Reserve.
The primary contributors to Fund performance over the reporting period were high-dividend-yielding equities, preferred securities and hedged European equities. The detractors from performance included positions in a global infrastructure fund and two fixed-income strategies which we exited in early 2017. We exited the Fund’s position in a 10-year U.S. Treasury note in November 2016 to reduce the Fund’s duration1 in anticipation of marginally higher U.S. interest rates.
As of the end of the reporting period, the Fund’s fixed-income allocations were positioned in anticipation of higher U.S. interest rates. The fixed-income exposure comprised an overweight allocation to a very short-duration1 floating-rate bank notes fund and an overweight to preferred securities, and relatively small allocations to the U.S. investment-grade and European fixed-income sectors, in which we did not feel compensated for risk.
We have positioned the Fund’s equity allocations in an effort to benefit from profit growth for Japanese and European companies, given accommodative monetary policies in Europe and Japan. The U.S. equity allocation is dominated by high-dividend-yielding stocks. Our positive view of this asset class is attributable to both their higher yields and lower valuations when compared to those of growth stocks.
We believe that the U.S. economy should continue to expand at an above-average pace with a further boost possible from the government’s fiscal easing. We feel that leading economic indicators point to considerable momentum in the Eurozone economy. In our opinion, Prime Minister Shinzo Abe’s victory in Japan’s national election in October 2017 means a continuation of Abenomics2 in Japan. Many emerging markets are benefiting from an external demand “sweet spot.” Central banks in the U.S. and U.K. are tightening monetary policies with caution, while the Eurozone and Japan maintain accommodative monetary policies with increasing balance sheets, albeit at a lower rate of expansion. We believe that the primary risks to the positive environment for equities emanate from a “hard landing” for the Chinese economy, geopolitical conflict and global central bank miscues. Upside risks include the overachievement of U.S. fiscal reform and central banks being behind the curve in the policy tightening cycle, in our view.
The Fund remains diversified,3 and we feel that it has the flexibility to tilt specific allocations based on changes in relative valuations or specific macroeconomic events. We believe that this allows us to respond effectively to changing market conditions and position the Fund’s asset class exposures accordingly.
Portfolio Management
Aberdeen Alternatives and Solutions Team
PAST PERFORMANCE DOES NOT GUARANTEE FUTURE RESULTS.
The performance data quoted represents past performance and current returns may be lower or higher. Class A shares have up to a 5.75% front-end sales charge and a 0.25% 12b-1 fee. The investment return and principal value will fluctuate so that an investor’s shares, when redeemed, may be worth more or less than the original cost. To obtain performance information current to the most recent month-end, which may be higher or lower than the performance shown above, please call 866-667-9231 or go to www.aberdeen-asset.us.
| 1 | Duration is an estimate of bond price sensitivity to changes in interest rates. The higher the duration, the greater the change (i.e., higher risk) in relation to interest-rate movements. |
| 2 | Abenomics comprises the economic policies advocated by Prime Minister Shinzō Abe of Japan. Abenomics is based upon “three arrows” of monetary easing, fiscal stimulus and structural reforms. |
| 3 | Diversification does not ensure a profit or protect against a loss in a declining market. |
| 2017 Annual Report | 9 |
Aberdeen Diversified Income Fund (Unaudited) (concluded)
Investing in mutual funds involves risk, including the possible loss of principal.
Indexes are unmanaged and have been provided for comparison purposes only. No fees or expenses are reflected. You cannot invest directly in an index.
Lipper is a leading global provider of mutual fund information and analysis to fund companies, financial intermediaries and media organizations.
Risk Considerations
The Fund is subject to different levels and combinations of risk, based on its actual allocation among the various asset classes and underlying funds. The Fund will be affected by stock and bond market risks, among others.
Foreign securities may be more volatile, harder to price and less liquid than U.S. securities, and are subject to different accounting and regulatory standards, political and economic risks and, to the extent denominated in foreign currencies, currency exchange rate risk (unless otherwise hedged). These risks are enhanced in emerging market countries.
Fixed income securities are subject to certain risks including, but not limited to: interest rate (changes in interest rates may cause a decline in the market value of an investment), credit (changes in the financial condition of the issuer, borrower, counterparty, or underlying collateral), prepayment (debt issuers may repay or refinance their loans or obligations earlier than anticipated), call (some bonds allow the issuer to call a bond for redemption before it matures), and extension (principal repayments may not occur as quickly as anticipated, causing the expected maturity of a security to increase). Additionally, non-investment grade debt securities (high yield/junk bonds) may be subject to greater market fluctuations, risk of default or loss of income and principal than higher rated securities.
The Fund may allocate its assets, to a limited extent, to alternative investment strategies, which may involve riskier types of securities or investments than those offered by investment in traditional asset classes.
Please read the prospectus for more detailed information regarding these and other risks.
| 10 | Annual Report 2017 |
Aberdeen Diversified Income Fund (Unaudited)
| Average Annual Total Return1 (For periods ended October 31, 2017) | 1 Yr. | 5 Yr. | 10 Yr. | |||||||||||
Class A | w/o SC | 10.27% | 5.30% | 3.75% | ||||||||||
| w/SC2 | 3.91% | 4.07% | 3.14% | |||||||||||
Class C | w/o SC | 9.55% | 4.55% | 2.99% | ||||||||||
| w/SC3 | 8.55% | 4.55% | 2.99% | |||||||||||
Class R4 | w/o SC | 10.00% | 4.88% | 3.38% | ||||||||||
Institutional Service Class4,5 | w/o SC | 10.64% | 5.61% | 3.90% | ||||||||||
Institutional Class4 | w/o SC | 10.66% | 5.60% | 4.03% | ||||||||||
All figures showing the effect of a sales charge (SC) reflect the maximum charge possible because it has the most significant effect on performance data. The total returns shown above do not include the impact of financial statement rounding of the net asset value (NAV) per share and/or financial statement adjustments.
| 1 | The Fund changed its investment objective and strategy effective September 24, 2012. Performance information for periods prior to September 24, 2012 does not reflect the current investment strategy. Returns also incorporate the performance of a predecessor fund (the “Predecessor Fund”) from inception to June 23, 2008. Returns of the Predecessor Fund have not been adjusted to reflect the expenses applicable to the respective classes. Prior to the change of investment objective and strategy of the Fund effective September 24, 2012, the Fund and the Predecessor Fund had substantially similar investment objectives and strategies. Please consult the Fund’s prospectus for more detail. |
| 2 | A 5.75% front-end sales charge was deducted. |
| 3 | A 1.00% contingent deferred sales charge (CDSC) was deducted from the one year return because it is charged when Class C shares are sold within the first year after purchase. |
| 4 | Not subject to any sales charges. |
| 5 | Returns before the first offering of the Institutional Service Class (September 24, 2012) are based on the performance of the Fund’s Class A shares. These returns have not been adjusted to reflect the expenses applicable to the Institutional Service Class. Excluding the effect of any fee waivers or reimbursements, this performance is substantially similar to what the Institutional Service Class shares would have produced because both classes invest in the same portfolio of securities. Returns for the Institutional Service Class shares would only differ to the extent of the differences in expenses of the two classes. |
Performance of a $10,000 Investment (as of October 31, 2017)
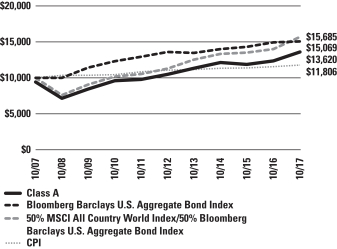
Comparative performance of $10,000 invested in Class A shares of the Aberdeen Diversified Income Fund, the Bloomberg Barclays U.S. Aggregate Bond Index, a blended benchmark of 50% Morgan Stanley Capital International All Country (MSCI AC) World Index/50% Bloomberg Barclays U.S. Aggregate Bond Index, and the Consumer Price Index (CPI) over a 10-year period ended October 31, 2017. Unlike the Fund, the returns for these unmanaged indexes do not reflect any fees, expenses, or sales charges. Investors cannot invest directly in market indexes.
The Bloomberg Barclays U.S. Aggregate Bond Index is a broad-based benchmark that measures the investment grade, U.S. dollar-denominated, fixed rate taxable bond market, including Treasuries, government-related and corporate securities, mortgage-backed securities (agency fixed-rate and hybrid adjustable-rate mortgage pass-throughs), asset-backed securities, and commercial mortgage-backed securities.
The MSCI AC World Index is a free float-adjusted market capitalization-weighted index that captures the large- and mid-cap representation across 23 developed markets and 24 emerging markets. The developed markets countries in the Index are: Australia, Austria, Belgium, Canada, Denmark, Finland, France, Germany, Hong Kong, Ireland, Israel, Italy, Japan, Netherlands, New Zealand, Norway, Portugal, Singapore, Spain, Sweden, Switzerland, the U.K. and the U.S. The emerging markets countries in the Index are: Brazil, Chile, China, Colombia, Czech Republic, Egypt, Greece, Hungary, India, Indonesia, South Korea, Malaysia, Mexico, Pakistan, Peru, Philippines, Poland, Qatar, Russia, South Africa, Taiwan, Thailand, Turkey and United Arab Emirates.
The CPI is a measure of the average change over time in the prices paid by urban consumers for a market basket of consumer goods and services.
Investment return and principal value will fluctuate, and when redeemed, shares may be worth more or less than original cost. Past performance is no guarantee of future results. The Average Annual Total Return table and Performance graph do not reflect the deduction of taxes that a shareholder would pay on fund distributions or the redemption of fund shares. Investing in mutual funds involves market risk, including loss of principal. Performance returns assume the reinvestment of all distributions. Performance returns reflect fee waivers and reimbursements in effect, without which returns would have been lower.
| 2017 Annual Report | 11 |
Aberdeen Diversified Income Fund (Unaudited) (concluded)
Portfolio Summary (as a percentage of net assets)
October 31, 2017 (Unaudited)
| Asset Allocation | ||||
Exchange Traded Funds | 57.9% | |||
Mutual Funds | 40.1% | |||
Short-Term Investment | 3.1% | |||
Liabilities in Excess of Other Assets | (1.1% | ) | ||
| 100.0% | ||||
| Top Industries | ||||
Fixed Income Funds | 60.4% | |||
Equity Funds | 32.8% | |||
Real Estate Investment Trust (REIT) Funds | 4.8% | |||
Other | 2.0% | |||
| 100.0% | ||||
| Top Holdings* | ||||
Vanguard High Dividend Yield ETF | 16.9% | |||
Nuveen Preferred Securities Fund, Institutional Class | 16.1% | |||
Eaton Vance Floating-Rate Fund, Class I | 15.0% | |||
Oppenheimer International Bond Fund, Class Y | 9.0% | |||
iShares U.S. & International High Yield Corp Bond ETF | 9.0% | |||
iShares Edge U.S. Fixed Income Balanced Risk ETF | 5.3% | |||
iShares Cohen & Steers REIT ETF | 4.8% | |||
WisdomTree Europe Hedged Equity Fund | 4.4% | |||
iShares Core S&P 500 ETF | 4.1% | |||
iShares JP Morgan EM Local Currency Bond ETF | 4.1% | |||
Other | 11.3% | |||
| 100.0% | ||||
| * | For the purpose of listing top holdings, Short-Term Investments are included as part of Other. |
| 12 | Annual Report 2017 |
Statement of Investments
October 31, 2017
Aberdeen Diversified Income Fund
| Shares or Principal Amount | Value | |||||||
MUTUAL FUNDS (40.1%) | ||||||||
Fixed Income Funds (40.1%) | ||||||||
Eaton Vance Floating-Rate Fund, Class I | 308,508 | $ | 2,779,653 | |||||
Nuveen Preferred Securities Fund, Institutional Class | 167,141 | 2,975,108 | ||||||
Oppenheimer International Bond Fund, Class Y | 282,821 | 1,668,646 | ||||||
| 7,423,407 | ||||||||
Total Mutual Funds | 7,423,407 | |||||||
EXCHANGE TRADED FUNDS (57.9%) | ||||||||
Equity Funds (32.8%) | ||||||||
iShares Core S&P 500 ETF | 2,927 | 757,537 | ||||||
iShares MSCI EAFE ETF | 10,645 | 741,211 | ||||||
Vanguard High Dividend Yield ETF | 38,078 | 3,140,674 | ||||||
WisdomTree Europe Hedged Equity Fund | 12,314 | 817,773 | ||||||
X-trackers MSCI Japan Hedged Equity ETF | 14,368 | 619,979 | ||||||
| 6,077,174 | ||||||||
Fixed Income Funds (20.3%) | ||||||||
iShares Edge U.S. Fixed Income Balanced Risk ETF | 9,788 | 986,728 | ||||||
iShares Emerging Markets High Yield Bond ETF | 7,213 | 366,493 | ||||||
iShares JP Morgan EM Local Currency Bond ETF (a) | 16,070 | 753,522 | ||||||
iShares U.S. & International High Yield Corp Bond ETF | 32,530 | 1,665,861 | ||||||
| 3,772,604 | ||||||||
Real Estate Investment Trust (REIT) Funds (4.8%) |
| |||||||
iShares Cohen & Steers REIT ETF | 8,837 | 880,961 | ||||||
Total Exchange Traded Funds | 10,730,739 | |||||||
SHORT-TERM INVESTMENT (3.1%) | ||||||||
State Street Institutional U.S. Government Money Market Fund (b) | 579,717 | 579,717 | ||||||
Total Short-Term Investment | 579,717 | |||||||
Total Investments | 18,733,863 | |||||||
Liabilities in Excess of Other Assets—(1.1)% | (195,884 | ) | ||||||
Net Assets—100.0% |
| $ | 18,537,979 | |||||
| (a) | Non-income producing security. |
| (b) | Registered investment company advised by State Street Global Advisors. |
| (c) | See accompanying Notes to Financial Statements for tax unrealized appreciation/(depreciation) of securities. |
| ETF | Exchange-Traded Fund |
| REIT | Real Estate Investment Trust |
See accompanying Notes to Financial Statements.
| 2017 Annual Report | 13 |
Aberdeen Dynamic Allocation Fund (Unaudited)
The Aberdeen Dynamic Allocation Fund (Institutional Class shares net of fees) returned 11.13% for the 12-month period ended October 31, 2017, versus the 23.86% return of its benchmark, the MSCI All Country (AC) World Index, for the same period. For broader comparison, the average return of the Fund’s peer category of Flexible Portfolio Funds (comprising 261 funds), as measured by Lipper, Inc., was 12.89%.
The 12-month reporting period was dominated by political events, including the surprise victory of Donald J. Trump in the U.S. presidential election in early November 2016. Political events played a part in Europe as well. German Chancellor Angela Merkel was unable to form a coalition government, Brexit negotiations continued, and there was a Constitutional referendum in Italy, as well as national elections in the Netherlands and France However, the political volatility in developed countries did not translate into market volatility due to the favorable economic background.
The global markets scrambled to interpret the surprise U.S. election result as early gains went to U.S. small-company stocks, which would benefit most from proposed tax reforms. The mere prospect of fiscal stimulus led to higher interest rates and a strengthening U.S. dollar over the period. The stronger dollar and the possibility of restrictive trade policies led to weakness in emerging-market equities in the immediate aftermath of the election.
European equity market performance caught up with the performance of U.S. small-cap company shares in May 2017, as Emmanuel Macron was elected president of France and European political fears proved to be overblown. U.S. small-cap stocks sold off in August after President Trump mishandled domestic political unrest. The efficacy of the Trump administration was questioned for much of the first 10 months of his term, but overcame pessimism around Republican tax reform efforts after the end of the reporting period in November and early December 2017.
U.S. small-cap stocks began to outperform the global equity markets again in September 2017, as tax reform returned to the fore front and the U.S. economy improved. European stocks also steadily strengthened as economic growth remained above its historical trend with accommodative monetary policy from the U.S. Federal Reserve.
The primary contributors to Fund performance over the reporting period were small-, mid- and large-cap U.S. equities. The Fund’s exposure to European equities hedged to the U.S. dollar also had a positive impact on performance. The detractors from Fund performance included a managed futures strategy and two fixed-income strategies which we exited in early 2017. We exited the Fund’s position in a 10-year U.S. Treasury note in November 2016 to reduce the Fund’s duration1 in anticipation of marginally higher U.S. interest rates.
As of the end of the reporting period, the Fund’s fixed-income allocations were positioned in anticipation of higher U.S. interest rates. The fixed-income exposure comprised a moderate allocation to a very short-duration floating-rate bank notes fund, some preferred securities, and relatively small allocations to the U.S. investment-grade and European fixed-income sectors where we did not feel compensated for risk. We have positioned the Fund’s equity allocations in an effort to benefit from profit growth for Japanese, European and U.S. companies given U.S. economic growth prospects with low wage inflation, and persistent accommodative monetary policies in Europe and Japan.
We believe that the U.S. economy should continue to expand at an above-average pace with a further boost possible from the government’s fiscal easing. We feel that leading economic indicators point to considerable momentum in the Eurozone economy. In our opinion, Prime Minister Shinzo Abe’s victory in Japan’s national election in October 2017 means a continuation of Abenomics2 in Japan. Many emerging markets are benefiting from an external demand “sweet spot.” Central banks in the U.S. and UK are tightening monetary policy with caution, while the Eurozone and Japan maintain accommodative monetary policies with increasing balance sheets, albeit at a lower rate of expansion. We believe that the primary risks to the positive environment for equities emanate from a “hard landing” for the Chinese economy, geopolitical conflict and global central bank miscues. Upside risks include the overachievement of U.S. fiscal reform and central banks being behind the curve in the policy tightening cycle, in our view.
The Fund remains diversified,3 and we feel that it has the flexibility to tilt specific allocations based on changes in relative valuations or specific macroeconomic events. We believe that this allows us to respond effectively to changing market conditions and position the Fund’s asset class exposures accordingly.
Portfolio Management
Aberdeen Alternatives and Solutions Team
PAST PERFORMANCE DOES NOT GUARANTEE FUTURE RESULTS.
The performance data quoted represents past performance and current returns may be lower or higher. Class A shares have up to a 5.75% front-end sales charge and a 0.25% 12b-1 fee. The investment return and principal value will fluctuate so that an investor’s shares, when redeemed, may be worth more or less than the original cost. To obtain performance information current to the most recent month-end, which may be higher or lower than the performance shown above, please call 866-667-9231 or go to www.aberdeen-asset.us.
Investing in mutual funds involves risk, including the possible loss of principal.
| 1 | Duration is an estimate of bond price sensitivity to changes in interest rates. The higher the duration, the greater the change (i.e., higher risk) in relation to interest-rate movements. |
| 2 | Abenomics comprises the economic policies advocated by Prime Minister Shinzō Abe of Japan. Abenomics is based upon “three arrows” of monetary easing, fiscal stimulus and structural reforms. |
| 3 | Diversification does not ensure a profit or protect against a loss in a declining market |
| 14 | Annual Report 2017 |
Aberdeen Dynamic Allocation Fund (Unaudited) (concluded)
Indexes are unmanaged and have been provided for comparison purposes only. No fees or expenses are reflected. You cannot invest directly in an index.
Lipper is a leading global provider of mutual fund information and analysis to fund companies, financial intermediaries and media organizations.
Risk Considerations
The Fund is subject to different levels and combinations of risk, based on its actual allocation among the various asset classes and underlying funds. The Fund will be affected by stock and bond market risks, among others.
Foreign securities may be more volatile, harder to price and less liquid than U.S. securities, and are subject to different accounting and regulatory standards, political and economic risks and, to the extent denominated in foreign currencies, currency exchange rate risk (unless otherwise hedged). These risks are enhanced in emerging market countries.
Fixed income securities are subject to certain risks including, but not limited to: interest rate (changes in interest rates may cause a decline in the market value of an investment), credit (changes in the financial condition of the issuer, borrower, counterparty, or underlying collateral), prepayment (debt issuers may repay or refinance their loans or obligations earlier than anticipated), call (some bonds allow the issuer to call a bond for redemption before it matures), and extension (principal repayments may not occur as quickly as anticipated, causing the expected maturity of a security to increase).
The Fund allocates its assets, to a limited extent, to alternative investment strategies, which may involve riskier types of securities or investments than those offered by investment in traditional asset classes.
Please read the prospectus for more detailed information regarding these and other risks.
| 2017 Annual Report | 15 |
Aberdeen Dynamic Allocation Fund (Unaudited)
| Average Annual Total Return1 (For periods ended October 31, 2017) | 1 Yr. | 5 Yr. | 10 Yr. | |||||||||||
Class A | w/o SC | 10.71% | 5.82% | 3.09% | ||||||||||
| w/SC2 | 4.33% | 4.58% | 2.48% | |||||||||||
Class C | w/o SC | 10.04% | 5.08% | 2.36% | ||||||||||
| w/SC3 | 9.04% | 5.08% | 2.36% | |||||||||||
Class R4 | w/o SC | 10.38% | 5.41% | 2.76% | ||||||||||
Institutional Service Class4,5 | w/o SC | 11.13% | 6.12% | 3.24% | ||||||||||
Institutional Class4, 5 | w/o SC | 11.13% | 6.12% | 3.28% | ||||||||||
All figures showing the effect of a sales charge (SC) reflect the maximum charge possible because it has the most significant effect on performance data. The total returns shown above do not include the impact of financial statement rounding of the net asset value (NAV) per share and/or financial statement adjustments.
| 1 | The Fund changed its investment objective and strategy effective September 24, 2012. Performance information for periods prior to September 24, 2012 does not reflect the current investment strategy. Returns also incorporate the performance of a predecessor fund (the “Predecessor Fund”) from inception to June 23, 2008. Returns of the Predecessor Fund have not been adjusted to reflect the expenses applicable to the respective classes. Prior to the change of investment objective and strategy of the Fund effective September 24, 2012, the Fund and the Predecessor Fund had substantially similar investment objectives and strategies. Please consult the Fund’s prospectus for more detail. |
| 2 | A 5.75% front-end sales charge was deducted. |
| 3 | A 1.00% contingent deferred sales charge (CDSC) was deducted from the one year return because it is charged when Class C shares are sold within the first year after purchase. |
| 4 | Not subject to any sales charges. |
| 5 | Returns before the first offering of the Institutional Service Class (September 24, 2012) and Institutional Class (July 29, 2009) are based on the previous performance of the Fund’s Class A shares. Returns of each class have not been adjusted to reflect the expenses applicable to the respective classes. Excluding the effect of any fee waivers or reimbursements, this performance is substantially similar to what the Institutional Service Class and Institutional Class shares would have produced because all classes invest in the same portfolio of securities. Returns for the Institutional Service Class and Institutional Class shares would only differ to the extent of the differences in expenses of the two classes. |
Performance of a $10,000 Investment (as of October 31, 2017)
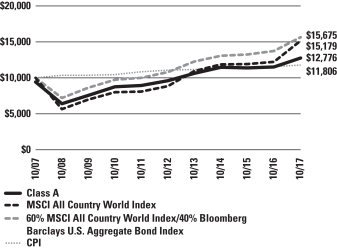
Comparative performance of $10,000 invested in Class A shares of the Aberdeen Dynamic Allocation Fund, the Morgan Stanley Capital International All Country (MSCI AC) World Index, a blended benchmark of 60% MSCI AC World Index/40% Bloomberg Barclays U.S. Aggregate Bond Index, and the Consumer Price Index (CPI) over a 10-year period ended October 31, 2017. Unlike the Fund, the returns for these unmanaged indexes do not reflect any fees, expenses, or sales charges. Investors cannot invest directly in market indexes.
The MSCI AC World Index is a free float-adjusted market capitalization-weighted index that captures the large- and mid-cap representation across 23 developed markets and 24 emerging markets. The developed markets countries in the Index are: Australia, Austria, Belgium, Canada, Denmark, Finland, France, Germany, Hong Kong, Ireland, Israel, Italy, Japan, Netherlands, New Zealand, Norway, Portugal, Singapore, Spain, Sweden, Switzerland, the U.K. and the U.S. The emerging markets countries in the Index are: Brazil, Chile, China, Colombia, Czech Republic, Egypt, Greece, Hungary, India, Indonesia, South Korea, Malaysia, Mexico, Pakistan, Peru, Philippines, Poland, Qatar, Russia, South Africa, Taiwan, Thailand, Turkey and United Arab Emirates.
The Bloomberg Barclays U.S. Aggregate Bond Index is a broad-based benchmark that measures the investment grade, U.S. dollar-denominated, fixed rate taxable bond market, including Treasuries, government-related and corporate securities, mortgage-backed securities (agency fixed-rate and hybrid adjustable-rate mortgage pass-throughs), asset-backed securities, and commercial mortgage-backed securities.
The CPI is a measure of the average change over time in the prices paid by urban consumers for a market basket of consumer goods and services.
Investment return and principal value will fluctuate, and when redeemed, shares may be worth more or less than original cost. Past performance is no guarantee of future results. The Average Annual Total Return table and Performance graph do not reflect the deduction of taxes that a shareholder would pay on fund distributions or the redemption of fund shares. Investing in mutual funds involves market risk, including loss of principal. Performance returns assume the reinvestment of all distributions. Performance returns reflect fee waivers and reimbursements in effect, without which returns would have been lower.
| 16 | Annual Report 2017 |
Aberdeen Dynamic Allocation Fund (Unaudited) (continued)
Portfolio Summary (as a percentage of net assets)
October 31, 2017 (Unaudited)
| Asset Allocation | ||||
Exchange Traded Funds | 80.1% | |||
Mutual Funds | 14.5% | |||
Short-Term Investment | 5.3% | |||
Other Assets in Excess of Liabilities | 0.1% | |||
| 100.0% | ||||
| Top Industries | ||||
Equity Funds | 56.4% | |||
Fixed Income Funds | 38.2% | |||
Other | 5.4% | |||
| 100.0% | ||||
| Top Holdings* | ||||
WisdomTree Europe Hedged Equity Fund | 8.3% | |||
iShares Edge U.S. Fixed Income Balanced Risk ETF | 8.0% | |||
Eaton Vance Floating-Rate Fund, Class I | 8.0% | |||
iShares Russell 2000 ETF | 7.9% | |||
iShares Russell Mid-Cap ETF | 7.8% | |||
iShares Core S&P 500 ETF | 7.0% | |||
X-trackers MSCI Japan Hedged Equity ETF | 6.4% | |||
iShares TIPS Bond ETF | 6.0% | |||
iShares MSCI EAFE ETF | 5.3% | |||
iShares U.S. & International High Yield Corp Bond ETF | 4.0% | |||
Other | 31.3% | |||
| 100.0% | ||||
| * | For the purpose of listing top holdings, Short-Term Investments are included as part of Other. |
| 2017 Annual Report | 17 |
Statement of Investments
October 31, 2017
Aberdeen Dynamic Allocation Fund
| Shares or Principal Amount | Value | |||||||
MUTUAL FUNDS (14.5%) | ||||||||
Fixed Income Funds (14.5%) | ||||||||
Eaton Vance Floating-Rate Fund, Class I | 138,202 | $ | 1,245,202 | |||||
Nuveen Preferred Securities Fund, Institutional Class | 31,204 | 555,438 | ||||||
Oppenheimer International Bond Fund, Class Y | 79,367 | 468,263 | ||||||
| 2,268,903 | ||||||||
Total Mutual Funds | 2,268,903 | |||||||
EXCHANGE TRADED FUNDS (80.1%) | ||||||||
Equity Funds (56.4%) | ||||||||
iShares Core S&P 500 ETF | 4,219 | 1,091,919 | ||||||
iShares MSCI EAFE ETF | 11,785 | 820,590 | ||||||
iShares MSCI Emerging Markets ETF | 10,282 | 475,851 | ||||||
iShares MSCI Eurozone ETF | 10,750 | 471,173 | ||||||
iShares MSCI Japan ETF | 8,273 | 485,211 | ||||||
iShares MSCI Pacific ex Japan ETF | 3,301 | 154,157 | ||||||
iShares Nasdaq Biotechnology ETF | 724 | 227,466 | ||||||
iShares Russell 2000 ETF | 8,217 | 1,226,469 | ||||||
iShares Russell Mid-Cap ETF | 6,115 | 1,224,957 | ||||||
Vanguard High Dividend Yield ETF | 3,903 | 321,919 | ||||||
WisdomTree Europe Hedged Equity Fund | 19,607 | 1,302,101 | ||||||
X-trackers MSCI Japan Hedged Equity ETF | 23,273 | 1,004,230 | ||||||
| 8,806,043 | ||||||||
Fixed Income Funds (23.7%) | ||||||||
iShares Edge U.S. Fixed Income Balanced Risk ETF | 12,394 | 1,249,439 | ||||||
iShares Emerging Markets High Yield Bond ETF | 5,328 | 270,716 | ||||||
iShares JP Morgan EM Local Currency Bond ETF (a) | 13,027 | 610,836 | ||||||
iShares TIPS Bond ETF | 8,212 | 934,526 | ||||||
iShares U.S. & International High Yield Corp Bond ETF | 12,234 | 626,503 | ||||||
| 3,692,020 | ||||||||
Total Exchange Traded Funds | 12,498,063 | |||||||
SHORT-TERM INVESTMENT (5.3%) | ||||||||
State Street Institutional U.S. Government Money Market Fund (b) | 827,533 | 827,533 | ||||||
Total Short-Term Investment | 827,533 | |||||||
Total Investments | 15,594,499 | |||||||
Other Assets in Excess of Liabilities—0.1% | 18,691 | |||||||
Net Assets—100.0% |
| $ | 15,613,190 | |||||
| (a) | Non-income producing security. |
| (b) | Registered investment company advised by State Street Global Advisors. |
| (c) | See accompanying Notes to Financial Statements for tax unrealized appreciation/(depreciation) of securities. |
| ETF | Exchange-Traded Fund |
| TIPS | Treasury Inflation Protected Securities |
See accompanying Notes to Financial Statements.
| 18 | Annual Report 2017 |
Statements of Assets and Liabilities
October 31, 2017
| Aberdeen Diversified Alternatives Fund | Aberdeen Diversified Income Fund | Aberdeen Dynamic Allocation Fund | ||||||||||
Assets: | ||||||||||||
Investments, at value | $ | 40,087,196 | $ | 18,154,146 | $ | 14,766,966 | ||||||
Short-term investment, at value | 1,781,618 | 579,717 | 827,533 | |||||||||
Cash | 49,008 | – | – | |||||||||
Interest and dividends receivable | 43,055 | 27,340 | 9,819 | |||||||||
Receivable for capital shares issued | 18,497 | 30,232 | 3,499 | |||||||||
Receivable from Adviser | 9,331 | 14,212 | 13,539 | |||||||||
Securities lending income receivable | – | – | 109 | |||||||||
Prepaid expenses | 37,528 | 36,272 | 35,932 | |||||||||
|
|
|
|
|
| |||||||
Total assets | 42,026,233 | 18,841,919 | 15,657,397 | |||||||||
|
|
|
|
|
| |||||||
Liabilities: | ||||||||||||
Payable for investments purchased | 44,350 | 236,742 | 10,276 | |||||||||
Payable for capital shares redeemed | 21,210 | 33,141 | 2,944 | |||||||||
Accrued expenses and other payables: | ||||||||||||
Distribution fees | 8,667 | 10,060 | 7,204 | |||||||||
Audit fees | 7,750 | 7,750 | 7,750 | |||||||||
Printing fees | 10,631 | 4,593 | 4,338 | |||||||||
Transfer agent fees | 6,435 | 5,338 | 5,685 | |||||||||
Investment advisory fees | 5,416 | 2,332 | 1,996 | |||||||||
Sub-transfer agent and administrative services fees | 6,029 | 1,518 | 1,909 | |||||||||
Administration fees | 2,888 | 1,244 | 1,064 | |||||||||
Custodian fees | 746 | 631 | 507 | |||||||||
Fund accounting fees | 768 | 315 | 308 | |||||||||
Legal fees | 615 | 264 | 226 | |||||||||
Other | 279 | 12 | – | |||||||||
|
|
|
|
|
| |||||||
Total liabilities | 115,784 | 303,940 | 44,207 | |||||||||
|
|
|
|
|
| |||||||
Net Assets | $ | 41,910,449 | $ | 18,537,979 | $ | 15,613,190 | ||||||
|
|
|
|
|
| |||||||
Cost: | ||||||||||||
Investments | $ | 39,125,258 | $ | 16,907,174 | $ | 13,644,373 | ||||||
Short-term investment | 1,781,618 | 579,717 | 827,533 | |||||||||
Represented by: | ||||||||||||
Capital | $ | 55,931,818 | $ | 17,820,305 | $ | 14,619,222 | ||||||
Accumulated net investment income | 46,804 | 53,302 | 25,311 | |||||||||
Accumulated net realized loss from investments | (15,030,111 | ) | (582,600 | ) | �� | (153,936 | ) | |||||
Net unrealized appreciation on investments | 961,938 | 1,246,972 | 1,122,593 | |||||||||
|
|
|
|
|
| |||||||
Net Assets | $ | 41,910,449 | $ | 18,537,979 | $ | 15,613,190 | ||||||
|
|
|
|
|
| |||||||
Net Assets: | ||||||||||||
Class A Shares | $ | 16,672,277 | $ | 6,811,192 | $ | 7,582,942 | ||||||
Class C Shares | 5,100,896 | 10,003,216 | 6,302,378 | |||||||||
Class R Shares | 1,444,451 | 363,972 | 475,336 | |||||||||
Institutional Service Class Shares | 1,647 | 38,047 | 11,361 | |||||||||
Institutional Class Shares | 18,691,178 | 1,321,552 | 1,241,173 | |||||||||
|
|
|
|
|
| |||||||
Total | $ | 41,910,449 | $ | 18,537,979 | $ | 15,613,190 | ||||||
|
|
|
|
|
| |||||||
Amounts listed as “–” are $0 or round to $0.
See accompanying Notes to Financial Statements.
| 2017 Annual Report | 19 |
Statements of Assets and Liabilities (concluded)
October 31, 2017
| Aberdeen Diversified Alternatives Fund | Aberdeen Diversified Income Fund | Aberdeen Dynamic Allocation Fund | ||||||||||
Shares Outstanding (unlimited number of shares authorized): | ||||||||||||
Class A Shares | 1,288,502 | 541,908 | 548,915 | |||||||||
Class C Shares | 410,762 | 813,949 | 465,898 | |||||||||
Class R Shares | 112,749 | 29,272 | 34,631 | |||||||||
Institutional Service Class Shares | 126 | 3,032 | 826 | |||||||||
Institutional Class Shares | 1,428,962 | 105,156 | 89,986 | |||||||||
|
|
|
|
|
| |||||||
Total | 3,241,101 | 1,493,317 | 1,140,256 | |||||||||
|
|
|
|
|
| |||||||
Net asset value and redemption price per share (Net assets by class divided by shares outstanding by class, respectively): | ||||||||||||
Class A Shares | $ | 12.94 | $ | 12.57 | $ | 13.81 | ||||||
Class C Shares (a) | $ | 12.42 | $ | 12.29 | $ | 13.53 | ||||||
Class R Shares | $ | 12.81 | $ | 12.43 | $ | 13.73 | ||||||
Institutional Service Class Shares | $ | 13.07 | $ | 12.55 | $ | 13.75 | ||||||
Institutional Class Shares | $ | 13.08 | $ | 12.57 | $ | 13.79 | ||||||
Maximum offering price per share (100%/(100%-maximum sales charge) of net asset value adjusted to the nearest cent): | ||||||||||||
Class A Shares | $ | 13.73 | $ | 13.34 | $ | 14.65 | ||||||
Maximum Sales Charge: | ||||||||||||
Class A Shares | 5.75 | % | 5.75 | % | 5.75 | % | ||||||
| (a) | For Class C Shares, the redemption price per share is reduced by 1.00% for shares held less than one year. |
See accompanying Notes to Financial Statements.
| 20 | Annual Report 2017 |
Statements of Operations
For the Year Ended October 31, 2017
| Aberdeen Diversified Alternatives Fund | Aberdeen Diversified Income Fund | Aberdeen Dynamic Allocation Fund | ||||||||||
INVESTMENT INCOME: | ||||||||||||
Dividend income | $ | 637,040 | $ | 636,201 | $ | 397,135 | ||||||
Dividend income from affiliates | – | 57,020 | 32,923 | |||||||||
Interest income | 13,662 | 1,531 | 4,836 | |||||||||
Securities lending income, net | – | – | 178 | |||||||||
Other income | – | 29 | 2 | |||||||||
|
|
|
|
|
| |||||||
| 650,702 | 694,781 | 435,074 | ||||||||||
|
|
|
|
|
| |||||||
EXPENSES: | ||||||||||||
Investment advisory fees | 71,016 | 28,028 | 25,522 | |||||||||
Administration fees | 37,875 | 14,948 | 13,612 | |||||||||
Distribution fees Class A | 39,460 | 14,588 | 18,347 | |||||||||
Distribution fees Class C | 76,138 | 112,303 | 80,120 | |||||||||
Distribution fees Class R | 8,160 | 1,707 | 2,535 | |||||||||
Sub-transfer agent and administrative service fees Class A | 23,194 | 4,621 | 6,078 | |||||||||
Sub-transfer agent fees Institutional Class | 18,204 | 642 | 1,110 | |||||||||
Sub-transfer agent fees Class C | 10,330 | 8,354 | 7,770 | |||||||||
Sub-transfer agent and administrative service fees Class R | 3,325 | 259 | 1,007 | |||||||||
Sub-transfer agent and administrative service fees Institutional Service Class | 2 | – | – | |||||||||
Fund accounting fees | 4,633 | 1,859 | 1,715 | |||||||||
Transfer agent fees | 30,904 | 20,728 | 23,800 | |||||||||
Trustee fees | 4,196 | 2,396 | 2,281 | |||||||||
Legal fees | 3,040 | 1,195 | 1,088 | |||||||||
Printing fees | 28,075 | 19,641 | 19,393 | |||||||||
Custodian fees | 4,287 | 3,146 | 3,293 | |||||||||
Registration and filing fees | 73,116 | 70,013 | 70,896 | |||||||||
Audit fees | 25,900 | 25,900 | 25,900 | |||||||||
Other | 9,040 | 5,613 | 5,483 | |||||||||
|
|
|
|
|
| |||||||
Total expenses before reimbursed/waived expenses | 470,895 | 335,941 | 309,950 | |||||||||
Interest expense (Note 9) | 79 | – | – | |||||||||
|
|
|
|
|
| |||||||
Total operating expenses before reimbursed/waived expenses | 470,974 | 335,941 | 309,950 | |||||||||
Expenses reimbursed/waived by investment advisor | (202,256 | ) | (155,750 | ) | (159,325 | ) | ||||||
|
|
|
|
|
| |||||||
Net expenses | 268,718 | 180,191 | 150,625 | |||||||||
|
|
|
|
|
| |||||||
Net Investment Income | 381,984 | 514,590 | 284,449 | |||||||||
|
|
|
|
|
| |||||||
REALIZED/UNREALIZED GAIN/(LOSS) FROM INVESTMENTS: | ||||||||||||
Realized gain distributions from underlying affiliated funds | 477,015 | 39,996 | 50,335 | |||||||||
Realized gain/(loss) from investment transactions from affiliated funds | (826,911 | ) | (230,778 | ) | 258,390 | |||||||
Realized gain from investment transactions from non-affiliated funds | 39,902 | 117,452 | 223,062 | |||||||||
|
|
|
|
|
| |||||||
Net realized gain/(loss) from investments | (309,994 | ) | (73,330 | ) | 531,787 | |||||||
|
|
|
|
|
| |||||||
Net change in unrealized appreciation/(depreciation) on affiliated funds | 373,362 | 172,401 | (135,429 | ) | ||||||||
Net change in unrealized appreciation/(depreciation) on non-affiliated funds | 1,289,321 | 1,148,789 | 991,563 | |||||||||
|
|
|
|
|
| |||||||
Net change in unrealized appreciation on investments | 1,662,683 | 1,321,190 | 856,134 | |||||||||
|
|
|
|
|
| |||||||
Net realized/unrealized gain from investments | 1,352,689 | 1,247,860 | 1,387,921 | |||||||||
|
|
|
|
|
| |||||||
CHANGE IN NET ASSETS RESULTING FROM OPERATIONS | $ | 1,734,673 | $ | 1,762,450 | $ | 1,672,370 | ||||||
|
|
|
|
|
| |||||||
Amounts listed as “–” are $0 or round to $0.
See accompanying Notes to Financial Statements.
| 2017 Annual Report | 21 |
Statements of Changes in Net Assets
| Aberdeen Diversified Alternatives Fund | Aberdeen Diversified Income Fund | Aberdeen Dynamic Allocation Fund | ||||||||||||||||||||||
| Year Ended October 31, 2017 | Year Ended October 31, 2016 | Year Ended October 31, 2017 | Year Ended October 31, 2016 | Year Ended October 31, 2017 | Year Ended October 31, 2016 | |||||||||||||||||||
FROM INVESTMENT ACTIVITIES: | ||||||||||||||||||||||||
Operations: | ||||||||||||||||||||||||
Net investment income | $ | 381,984 | $ | 1,142,349 | $ | 514,590 | $ | 528,628 | $ | 284,449 | $ | 335,020 | ||||||||||||
Net realized gain/(loss) from investments | (309,994 | ) | (4,721,220 | ) | (73,330 | ) | (540,343 | ) | 531,787 | (365,913 | ) | |||||||||||||
Net change in unrealized appreciation/(depreciation) on investments | 1,662,683 | 1,128,379 | 1,321,190 | 654,626 | 856,134 | 161,559 | ||||||||||||||||||
|
|
|
|
|
|
|
|
|
|
|
| |||||||||||||
Changes in net assets resulting from operations | 1,734,673 | (2,450,492 | ) | 1,762,450 | 642,911 | 1,672,370 | 130,666 | |||||||||||||||||
|
|
|
|
|
|
|
|
|
|
|
| |||||||||||||
Distributions to Shareholders From: | ||||||||||||||||||||||||
Net investment income: | ||||||||||||||||||||||||
Class A | (124,294 | ) | (287,575 | ) | (186,456 | ) | (164,376 | ) | (167,300 | ) | (166,526 | ) | ||||||||||||
Class C | (7,690 | ) | (114,337 | ) | (265,080 | ) | (288,554 | ) | (122,857 | ) | (151,820 | ) | ||||||||||||
Class R | (7,998 | ) | (17,432 | ) | (9,580 | ) | (10,003 | ) | (9,742 | ) | (7,968 | ) | ||||||||||||
Institutional Service Class | (13 | ) | (280 | ) | (1,217 | ) | (1,018 | ) | (279 | ) | (239 | ) | ||||||||||||
Institutional Class | (227,702 | ) | (1,037,869 | ) | (41,964 | ) | (35,748 | ) | (28,014 | ) | (42,445 | ) | ||||||||||||
Net realized gains: | ||||||||||||||||||||||||
Class A | – | – | – | (49,208 | ) | – | (4,466 | ) | ||||||||||||||||
Class C | – | – | – | (112,812 | ) | – | (6,061 | ) | ||||||||||||||||
Class R | – | – | – | (3,342 | ) | – | (247 | ) | ||||||||||||||||
Institutional Service Class | – | – | – | (249 | ) | – | (6 | ) | ||||||||||||||||
Institutional Class | – | – | – | (9,596 | ) | – | (1,217 | ) | ||||||||||||||||
|
|
|
|
|
|
|
|
|
|
|
| |||||||||||||
Change in net assets from shareholder distributions | (367,697 | ) | (1,457,493 | ) | (504,297 | ) | (674,906 | ) | (328,192 | ) | (380,995 | ) | ||||||||||||
|
|
|
|
|
|
|
|
|
|
|
| |||||||||||||
Common Stock Transactions: | ||||||||||||||||||||||||
Change in net assets from capital transactions | (18,534,078 | ) | (86,643,398 | ) | (1,878,444 | ) | (3,263,715 | ) | (4,635,153 | ) | (3,395,198 | ) | ||||||||||||
|
|
|
|
|
|
|
|
|
|
|
| |||||||||||||
Change in net assets | (17,167,102 | ) | (90,551,383 | ) | (620,291 | ) | (3,295,710 | ) | (3,290,975 | ) | (3,645,527 | ) | ||||||||||||
|
|
|
|
|
|
|
|
|
|
|
| |||||||||||||
Net Assets: | ||||||||||||||||||||||||
Beginning of year | 59,077,551 | 149,628,934 | 19,158,270 | 22,453,980 | 18,904,165 | 22,549,692 | ||||||||||||||||||
|
|
|
|
|
|
|
|
|
|
|
| |||||||||||||
End of year | $ | 41,910,449 | $ | 59,077,551 | $ | 18,537,979 | $ | 19,158,270 | $ | 15,613,190 | $ | 18,904,165 | ||||||||||||
|
|
|
|
|
|
|
|
|
|
|
| |||||||||||||
Accumulated net investment income at end of year | $ | 46,804 | $ | 40,312 | $ | 53,302 | $ | 64,673 | $ | 25,311 | $ | 47,602 | ||||||||||||
|
|
|
|
|
|
|
|
|
|
|
| |||||||||||||
Amounts listed as “–” are $0 or round to $0.
See accompanying Notes to Financial Statements.
| 22 | Annual Report 2017 |
Statements of Changes in Net Assets (continued)
| Aberdeen Diversified Alternatives Fund | Aberdeen Diversified Income Fund | Aberdeen Dynamic Allocation Fund | ||||||||||||||||||||||
| Year Ended October 31, 2017 | Year Ended October 31, 2016 | Year Ended October 31, 2017 | Year Ended October 31, 2016 | Year Ended October 31, 2017 | Year Ended October 31, 2016 | |||||||||||||||||||
CAPITAL TRANSACTIONS: | ||||||||||||||||||||||||
Class A Shares | ||||||||||||||||||||||||
Proceeds from shares issued | $ | 8,783,295 | $ | 10,166,808 | $ | 2,267,743 | $ | 669,224 | $ | 1,777,504 | $ | 532,382 | ||||||||||||
Dividends reinvested | 106,369 | 258,875 | 131,448 | 161,355 | 121,336 | 131,001 | ||||||||||||||||||
Cost of shares redeemed | (8,812,964 | ) | (20,964,553 | ) | (1,361,188 | ) | (1,717,964 | ) | (2,534,465 | ) | (1,605,693 | ) | ||||||||||||
|
|
|
|
|
|
|
|
|
|
|
| |||||||||||||
Total Class A | 76,700 | (10,538,870 | ) | 1,038,003 | (887,385 | ) | (635,625 | ) | (942,310 | ) | ||||||||||||||
|
|
|
|
|
|
|
|
|
|
|
| |||||||||||||
Class C Shares | ||||||||||||||||||||||||
Proceeds from shares issued | 130,238 | 625,277 | 693,097 | 538,381 | 222,715 | 298,508 | ||||||||||||||||||
Dividends reinvested | 5,606 | 67,563 | 196,083 | 270,661 | 84,926 | 97,862 | ||||||||||||||||||
Cost of shares redeemed | (5,899,565 | ) | (6,415,616 | ) | (3,945,707 | ) | (2,898,023 | ) | (4,105,136 | ) | (2,487,871 | ) | ||||||||||||
|
|
|
|
|
|
|
|
|
|
|
| |||||||||||||
Total Class C | (5,763,721 | ) | (5,722,776 | ) | (3,056,527 | ) | (2,088,981 | ) | (3,797,495 | ) | (2,091,501 | ) | ||||||||||||
|
|
|
|
|
|
|
|
|
|
|
| |||||||||||||
Class R Shares | ||||||||||||||||||||||||
Proceeds from shares issued | 489,108 | 1,062,944 | 54,133 | 47,890 | 55,732 | 102,113 | ||||||||||||||||||
Dividends reinvested | 6,141 | 12,891 | 31 | 34 | 7,703 | 6,602 | ||||||||||||||||||
Cost of shares redeemed | (954,002 | ) | (528,285 | ) | (26,083 | ) | (155,883 | ) | (136,640 | ) | (100,541 | ) | ||||||||||||
|
|
|
|
|
|
|
|
|
|
|
| |||||||||||||
Total Class R | (458,753 | ) | 547,550 | 28,081 | (107,959 | ) | (73,205 | ) | 8,174 | |||||||||||||||
|
|
|
|
|
|
|
|
|
|
|
| |||||||||||||
Institutional Service Class Shares | ||||||||||||||||||||||||
Proceeds from shares issued | 1,600 | – | 1,468 | – | – | – | ||||||||||||||||||
Dividends reinvested | 13 | 280 | 1,217 | 1,267 | 279 | 245 | ||||||||||||||||||
Cost of shares redeemed | (19,107 | ) | – | – | – | – | – | |||||||||||||||||
|
|
|
|
|
|
|
|
|
|
|
| |||||||||||||
Total Institutional Service Class | (17,494 | ) | 280 | 2,685 | 1,267 | 279 | 245 | |||||||||||||||||
|
|
|
|
|
|
|
|
|
|
|
| |||||||||||||
Institutional Class Shares | ||||||||||||||||||||||||
Proceeds from shares issued | 5,284,150 | 10,414,345 | 482,829 | 154,738 | 770,432 | 941,551 | ||||||||||||||||||
Dividends reinvested | 201,168 | 914,983 | 33,233 | 37,357 | 17,784 | 24,499 | ||||||||||||||||||
Cost of shares redeemed | (17,856,128 | ) | (82,258,910 | ) | (406,748 | ) | (372,752 | ) | (917,323 | ) | (1,335,856 | ) | ||||||||||||
|
|
|
|
|
|
|
|
|
|
|
| |||||||||||||
Total Institutional Class | (12,370,810 | ) | (70,929,582 | ) | 109,314 | (180,657 | ) | (129,107 | ) | (369,806 | ) | |||||||||||||
|
|
|
|
|
|
|
|
|
|
|
| |||||||||||||
Change in net assets from capital transactions: | $ | (18,534,078 | ) | $ | (86,643,398 | ) | $ | (1,878,444 | ) | $ | (3,263,715 | ) | $ | (4,635,153 | ) | $ | (3,395,198 | ) | ||||||
|
|
|
|
|
|
|
|
|
|
|
| |||||||||||||
Amounts listed as “–” are $0 or round to $0.
See accompanying Notes to Financial Statements.
| 2017 Annual Report | 23 |
Statements of Changes in Net Assets (concluded)
| Aberdeen Diversified Alternatives Fund | Aberdeen Diversified Income Fund | Aberdeen Dynamic Allocation Fund | ||||||||||||||||||||||
| Year Ended October 31, 2017 | Year Ended October 31, 2016 | Year Ended October 31, 2017 | Year Ended October 31, 2016 | Year Ended October 31, 2017 | Year Ended October 31, 2016 | |||||||||||||||||||
SHARE TRANSACTIONS: | ||||||||||||||||||||||||
Class A Shares | ||||||||||||||||||||||||
Issued | 691,898 | 811,324 | 184,501 | 57,547 | 133,205 | 42,528 | ||||||||||||||||||
Reinvested | 8,363 | 20,553 | 10,887 | 14,081 | 9,228 | 10,317 | ||||||||||||||||||
Redeemed | (694,182 | ) | (1,674,760 | ) | (111,986 | ) | (149,232 | ) | (192,494 | ) | (128,320 | ) | ||||||||||||
|
|
|
|
|
|
|
|
|
|
|
| |||||||||||||
Total Class A Shares | 6,079 | (842,883 | ) | 83,402 | (77,604 | ) | (50,061 | ) | (75,475 | ) | ||||||||||||||
|
|
|
|
|
|
|
|
|
|
|
| |||||||||||||
Class C Shares | ||||||||||||||||||||||||
Issued | 10,736 | 51,813 | 58,712 | 47,760 | 17,392 | 24,214 | ||||||||||||||||||
Reinvested | 458 | 5,572 | 16,611 | 24,183 | 6,609 | 7,858 | ||||||||||||||||||
Redeemed | (485,598 | ) | (529,963 | ) | (331,381 | ) | (256,867 | ) | (316,360 | ) | (201,023 | ) | ||||||||||||
|
|
|
|
|
|
|
|
|
|
|
| |||||||||||||
Total Class C Shares | (474,404 | ) | (472,578 | ) | (256,058 | ) | (184,924 | ) | (292,359 | ) | (168,951 | ) | ||||||||||||
|
|
|
|
|
|
|
|
|
|
|
| |||||||||||||
Class R Shares | ||||||||||||||||||||||||
Issued | 38,998 | 85,462 | 4,554 | 4,272 | 4,282 | 8,321 | ||||||||||||||||||
Reinvested | 487 | 1,032 | 3 | 2 | 589 | 523 | ||||||||||||||||||
Redeemed | (76,062 | ) | (42,629 | ) | (2,183 | ) | (13,623 | ) | (10,310 | ) | (7,983 | ) | ||||||||||||
|
|
|
|
|
|
|
|
|
|
|
| |||||||||||||
Total Class R Shares | (36,577 | ) | 43,865 | 2,374 | (9,349 | ) | (5,439 | ) | 861 | |||||||||||||||
|
|
|
|
|
|
|
|
|
|
|
| |||||||||||||
Institutional Service Class Shares | ||||||||||||||||||||||||
Issued | 126 | – | 124 | – | – | – | ||||||||||||||||||
Reinvested | 1 | 23 | 101 | 110 | 21 | 19 | ||||||||||||||||||
Redeemed | (1,500 | ) | – | – | – | – | – | |||||||||||||||||
|
|
|
|
|
|
|
|
|
|
|
| |||||||||||||
Total Institutional Service Class Shares | (1,373 | ) | 23 | 225 | 110 | 21 | 19 | |||||||||||||||||
|
|
|
|
|
|
|
|
|
|
|
| |||||||||||||
Institutional Class Shares | ||||||||||||||||||||||||
Issued | 412,914 | 824,872 | 39,967 | 13,360 | 58,883 | 74,306 | ||||||||||||||||||
Reinvested | 15,684 | 72,024 | 2,751 | 3,263 | 1,354 | 1,942 | ||||||||||||||||||
Redeemed | (1,399,037 | ) | (6,563,532 | ) | (33,671 | ) | (32,647 | ) | (70,504 | ) | (106,695 | ) | ||||||||||||
|
|
|
|
|
|
|
|
|
|
|
| |||||||||||||
Total Institutional Class Shares | (970,439 | ) | (5,666,636 | ) | 9,047 | (16,024 | ) | (10,267 | ) | (30,447 | ) | |||||||||||||
|
|
|
|
|
|
|
|
|
|
|
| |||||||||||||
Total change in shares: | (1,476,714 | ) | (6,938,209 | ) | (161,010 | ) | (287,791 | ) | (358,105 | ) | (273,993 | ) | ||||||||||||
|
|
|
|
|
|
|
|
|
|
|
| |||||||||||||
Amounts listed as “–” are $0 or round to $0.
See accompanying Notes to Financial Statements.
| 24 | Annual Report 2017 |
This page intentionally left blank.
Financial Highlights
Selected Data for Each Share of Capital Outstanding Throughout the Periods Indicated
Aberdeen Diversified Alternatives Fund
| Investment Activities | Distributions | |||||||||||||||||||||||||||
| Net Asset Value, Beginning of Period | Net Investment Income (Loss) (a) | Net Realized and Unrealized Gains (Losses) on Investments | Total from Investment Activities | Net Investment Income | Total Distributions | Net Asset Value, End of Period | ||||||||||||||||||||||
Class A Shares | ||||||||||||||||||||||||||||
Year Ended October 31, 2017 | $ | 12.56 | $ | 0.09 | $ | 0.39 | $ | 0.48 | $ | (0.10 | ) | $ | (0.10 | ) | $ | 12.94 | ||||||||||||
Year Ended October 31, 2016 | 12.82 | 0.13 | (0.24 | ) | (0.11 | ) | (0.15 | ) | (0.15 | ) | 12.56 | |||||||||||||||||
Year Ended October 31, 2015 | 13.32 | 0.17 | (0.39 | ) | (0.22 | ) | (0.28 | ) | (0.28 | ) | 12.82 | |||||||||||||||||
Year Ended October 31, 2014 | 12.63 | 0.05 | 0.79 | 0.84 | (0.15 | ) | (0.15 | ) | 13.32 | |||||||||||||||||||
Year Ended October 31, 2013 | 11.64 | 0.12 | 1.01 | 1.13 | (0.14 | ) | (0.14 | ) | 12.63 | |||||||||||||||||||
Class C Shares | ||||||||||||||||||||||||||||
Year Ended October 31, 2017 | 12.05 | 0.01 | 0.37 | 0.38 | (0.01 | ) | (0.01 | ) | 12.42 | |||||||||||||||||||
Year Ended October 31, 2016 | 12.33 | 0.04 | (0.22 | ) | (0.18 | ) | (0.10 | ) | (0.10 | ) | 12.05 | |||||||||||||||||
Year Ended October 31, 2015 | 12.89 | 0.10 | (0.39 | ) | (0.29 | ) | (0.27 | ) | (0.27 | ) | 12.33 | |||||||||||||||||
Year Ended October 31, 2014 | 12.22 | (0.05 | ) | 0.77 | 0.72 | (0.05 | ) | (0.05 | ) | 12.89 | ||||||||||||||||||
Year Ended October 31, 2013 | 11.33 | 0.03 | 0.97 | 1.00 | (0.11 | ) | (0.11 | ) | 12.22 | |||||||||||||||||||
Class R Shares | ||||||||||||||||||||||||||||
Year Ended October 31, 2017 | 12.44 | 0.05 | 0.38 | 0.43 | (0.06 | ) | (0.06 | ) | 12.81 | |||||||||||||||||||
Year Ended October 31, 2016 | 12.72 | 0.07 | (0.22 | ) | (0.15 | ) | (0.13 | ) | (0.13 | ) | 12.44 | |||||||||||||||||
Year Ended October 31, 2015 | 13.25 | 0.11 | (0.36 | ) | (0.25 | ) | (0.28 | ) | (0.28 | ) | 12.72 | |||||||||||||||||
Year Ended October 31, 2014 | 12.56 | 0.02 | 0.78 | 0.80 | (0.11 | ) | (0.11 | ) | 13.25 | |||||||||||||||||||
Year Ended October 31, 2013 | 11.61 | 0.06 | 1.01 | 1.07 | (0.12 | ) | (0.12 | ) | 12.56 | |||||||||||||||||||
Institutional Service Class Shares | ||||||||||||||||||||||||||||
Year Ended October 31, 2017 | 12.68 | 0.12 | 0.41 | 0.53 | (0.14 | ) | (0.14 | ) | 13.07 | |||||||||||||||||||
Year Ended October 31, 2016 | 12.94 | 0.15 | (0.22 | ) | (0.07 | ) | (0.19 | ) | (0.19 | ) | 12.68 | |||||||||||||||||
Year Ended October 31, 2015 | 13.44 | 0.20 | (0.38 | ) | (0.18 | ) | (0.32 | ) | (0.32 | ) | 12.94 | |||||||||||||||||
Year Ended October 31, 2014 | 12.75 | 0.09 | 0.80 | 0.89 | (0.20 | ) | (0.20 | ) | 13.44 | |||||||||||||||||||
Year Ended October 31, 2013 | 11.73 | 0.15 | 1.02 | 1.17 | (0.15 | ) | (0.15 | ) | 12.75 | |||||||||||||||||||
Institutional Class Shares | ||||||||||||||||||||||||||||
Year Ended October 31, 2017 | 12.68 | 0.14 | 0.40 | 0.54 | (0.14 | ) | (0.14 | ) | 13.08 | |||||||||||||||||||
Year Ended October 31, 2016 | 12.93 | 0.20 | (0.27 | ) | (0.07 | ) | (0.18 | ) | (0.18 | ) | 12.68 | |||||||||||||||||
Year Ended October 31, 2015 | 13.43 | 0.21 | (0.39 | ) | (0.18 | ) | (0.32 | ) | (0.32 | ) | 12.93 | |||||||||||||||||
Year Ended October 31, 2014 | 12.75 | 0.08 | 0.80 | 0.88 | (0.20 | ) | (0.20 | ) | 13.43 | |||||||||||||||||||
Year Ended October 31, 2013 | 11.73 | 0.15 | 1.02 | 1.17 | (0.15 | ) | (0.15 | ) | 12.75 | |||||||||||||||||||
| (a) | Net investment income/(loss) is based on average shares outstanding during the period. |
| (b) | Excludes sales charge. |
| (c) | During the period, certain fees were waived and/or reimbursed. If such waivers/reimbursements had not occurred, the ratios would have been as indicated. |
Amounts listed as “–” are $0 or round to $0.
See accompanying Notes to Financial Statements.
| 26 | Annual Report 2017 |
Financial Highlights (continued)
Selected Data for Each Share of Capital Outstanding Throughout the Periods Indicated
Aberdeen Diversified Alternatives Fund (concluded)
| Ratios/Supplemental Data | ||||||||||||||||||||||
| Total Return (b) | Net Assets at End of Period (000’s) | Ratio of Expenses (Net of Reimbursements/Waivers) to Average Net Assets | Ratio of Expenses (Prior to Reimbursements) to Average Net Assets (c) | Ratio of Net Investment Income (Loss) to Average Net Assets | Portfolio Turnover (d) | |||||||||||||||||
| 3.82 | % | $ | 16,672 | 0.65 | %(e) | 1.01 | %(e) | 0.75 | % | 26.64 | % | |||||||||||
| (0.87 | %) | 16,106 | 0.62 | %(e) | 0.88 | %(e) | 1.01 | % | 36.02 | % | ||||||||||||
| (1.68 | %) | 27,238 | 0.57 | % | 0.80 | % | 1.31 | % | 78.72 | % | ||||||||||||
| 6.70 | % | 21,608 | 0.52 | % | 0.88 | % | 0.36 | % | 54.26 | % | ||||||||||||
| 9.76 | % | 6,135 | 0.52 | % | 1.20 | % | 1.02 | % | 47.20 | % | ||||||||||||
| 3.20 | % | 5,101 | 1.25 | %(e) | 1.75 | %(e) | 0.10 | % | 26.64 | % | ||||||||||||
| (1.45 | %) | 10,664 | 1.25 | %(e) | 1.60 | %(e) | 0.34 | % | 36.02 | % | ||||||||||||
| (2.35 | %) | 16,740 | 1.25 | % | 1.48 | % | 0.79 | % | 78.72 | % | ||||||||||||
| 5.91 | % | 15,565 | 1.25 | % | 1.61 | % | (0.36 | %) | 54.26 | % | ||||||||||||
| 8.91 | % | 12,467 | 1.25 | % | 1.93 | % | 0.26 | % | 47.20 | % | ||||||||||||
| 3.49 | % | 1,444 | 0.95 | %(e) | 1.32 | %(e) | 0.42 | % | 26.64 | % | ||||||||||||
| (1.17 | %) | 1,858 | 0.92 | %(e) | 1.18 | %(e) | 0.58 | % | 36.02 | % | ||||||||||||
| (1.98 | %) | 1,341 | 0.87 | % | 1.10 | % | 0.81 | % | 78.72 | % | ||||||||||||
| 6.37 | %(f) | 348 | 0.83 | % | 1.19 | % | 0.14 | % | 54.26 | % | ||||||||||||
| 9.32 | %(f) | 371 | 0.88 | % | 1.56 | % | 0.51 | % | 47.20 | % | ||||||||||||
| 4.18 | % | 2 | 0.29 | %(e) | 0.66 | %(e) | 0.97 | % | 26.64 | % | ||||||||||||
| (0.55 | %) | 19 | 0.32 | %(e) | 0.58 | %(e) | 1.22 | % | 36.02 | % | ||||||||||||
| (1.38 | %) | 19 | 0.25 | % | 0.48 | % | 1.54 | % | 78.72 | % | ||||||||||||
| 7.02 | % | 12 | 0.25 | % | 0.61 | % | 0.65 | % | 54.26 | % | ||||||||||||
| 10.03 | % | 11 | 0.25 | % | 0.93 | % | 1.22 | % | 47.20 | % | ||||||||||||
| 4.26 | % | 18,691 | 0.25 | %(e) | 0.70 | %(e) | 1.12 | % | 26.64 | % | ||||||||||||
| (0.51 | %) | 30,431 | 0.25 | %(e) | 0.55 | %(e) | 1.58 | % | 36.02 | % | ||||||||||||
| (1.38 | %) | 104,291 | 0.25 | % | 0.48 | % | 1.59 | % | 78.72 | % | ||||||||||||
| 6.94 | % | 66,073 | 0.25 | % | 0.61 | % | 0.58 | % | 54.26 | % | ||||||||||||
| 10.03 | % | 3,261 | 0.25 | % | 0.93 | % | 1.19 | % | 47.20 | % | ||||||||||||
| (d) | Portfolio turnover is calculated on the basis of the Fund as a whole without distinguishing among the classes of shares. |
| (e) | Includes interest expense that amounts to less than 0.01%. |
| (f) | The total return shown above includes the impact of financial statement rounding of the NAV per share and/or financial statement adjustments. |
| 2017 Annual Report | 27 |
Financial Highlights (continued)
Selected Data for Each Share of Capital Outstanding Throughout the Periods Indicated
Aberdeen Diversified Income Fund
| Investment Activities | Distributions | |||||||||||||||||||||||||||||||
| Net Asset Value, Beginning of Period | Net Investment Income (a) | Net Realized and Unrealized Gains (Losses) on Investments | Total from Investment Activities | Net Investment Income | Net Realized Gains | Total Distributions | Net Asset Value, End of Period | |||||||||||||||||||||||||
Class A Shares | ||||||||||||||||||||||||||||||||
Year Ended October 31, 2017 | $ | 11.76 | $ | 0.38 | $ | 0.81 | $ | 1.19 | $ | (0.38 | ) | $ | – | $ | (0.38 | ) | $ | 12.57 | ||||||||||||||
Year Ended October 31, 2016 | 11.73 | 0.35 | 0.10 | 0.45 | (0.33 | ) | (0.09 | ) | (0.42 | ) | 11.76 | |||||||||||||||||||||
Year Ended October 31, 2015 | 12.99 | 0.38 | (0.65 | ) | (0.27 | ) | (0.37 | ) | (0.62 | ) | (0.99 | ) | 11.73 | |||||||||||||||||||
Year Ended October 31, 2014 | 12.58 | 0.39 | 0.48 | 0.87 | (0.46 | ) | – | (0.46 | ) | 12.99 | ||||||||||||||||||||||
Year Ended October 31, 2013 | 12.03 | 0.35 | 0.56 | 0.91 | (0.36 | ) | – | (0.36 | ) | 12.58 | ||||||||||||||||||||||
Class C Shares | ||||||||||||||||||||||||||||||||
Year Ended October 31, 2017 | 11.49 | 0.29 | 0.79 | 1.08 | (0.28 | ) | – | (0.28 | ) | 12.29 | ||||||||||||||||||||||
Year Ended October 31, 2016 | 11.47 | 0.26 | 0.10 | 0.36 | (0.25 | ) | (0.09 | ) | (0.34 | ) | 11.49 | |||||||||||||||||||||
Year Ended October 31, 2015 | 12.75 | 0.28 | (0.64 | ) | (0.36 | ) | (0.30 | ) | (0.62 | ) | (0.92 | ) | 11.47 | |||||||||||||||||||
Year Ended October 31, 2014 | 12.35 | 0.29 | 0.48 | 0.77 | (0.37 | ) | – | (0.37 | ) | 12.75 | ||||||||||||||||||||||
Year Ended October 31, 2013 | 11.81 | 0.25 | 0.56 | 0.81 | (0.27 | ) | – | (0.27 | ) | 12.35 | ||||||||||||||||||||||
Class R Shares | ||||||||||||||||||||||||||||||||
Year Ended October 31, 2017 | 11.63 | 0.34 | 0.81 | 1.15 | (0.35 | ) | – | (0.35 | ) | 12.43 | ||||||||||||||||||||||
Year Ended October 31, 2016 | 11.61 | 0.32 | 0.09 | 0.41 | (0.30 | ) | (0.09 | ) | (0.39 | ) | 11.63 | |||||||||||||||||||||
Year Ended October 31, 2015 | 12.90 | 0.32 | (0.66 | ) | (0.34 | ) | (0.33 | ) | (0.62 | ) | (0.95 | ) | 11.61 | |||||||||||||||||||
Year Ended October 31, 2014 | 12.49 | 0.33 | 0.49 | 0.82 | (0.41 | ) | – | (0.41 | ) | 12.90 | ||||||||||||||||||||||
Year Ended October 31, 2013 | 11.94 | 0.29 | 0.57 | 0.86 | (0.31 | ) | – | (0.31 | ) | 12.49 | ||||||||||||||||||||||
Institutional Service Class Shares | ||||||||||||||||||||||||||||||||
Year Ended October 31, 2017 | 11.74 | 0.42 | 0.81 | 1.23 | (0.42 | ) | – | (0.42 | ) | 12.55 | ||||||||||||||||||||||
Year Ended October 31, 2016 | 11.72 | 0.38 | 0.10 | 0.48 | (0.37 | ) | (0.09 | ) | (0.46 | ) | 11.74 | |||||||||||||||||||||
Year Ended October 31, 2015 | 12.97 | 0.38 | (0.61 | ) | (0.23 | ) | (0.40 | ) | (0.62 | ) | (1.02 | ) | 11.72 | |||||||||||||||||||
Year Ended October 31, 2014 | 12.57 | 0.42 | 0.48 | 0.90 | (0.50 | ) | – | (0.50 | ) | 12.97 | ||||||||||||||||||||||
Year Ended October 31, 2013 | 12.01 | 0.39 | 0.57 | 0.96 | (0.40 | ) | – | (0.40 | ) | 12.57 | ||||||||||||||||||||||
Institutional Class Shares | ||||||||||||||||||||||||||||||||
Year Ended October 31, 2017 | 11.75 | 0.42 | 0.81 | 1.23 | (0.41 | ) | – | (0.41 | ) | 12.57 | ||||||||||||||||||||||
Year Ended October 31, 2016 | 11.72 | 0.38 | 0.10 | 0.48 | (0.36 | ) | (0.09 | ) | (0.45 | ) | 11.75 | |||||||||||||||||||||
Year Ended October 31, 2015 | 12.97 | 0.40 | (0.63 | ) | (0.23 | ) | (0.40 | ) | (0.62 | ) | (1.02 | ) | 11.72 | |||||||||||||||||||
Year Ended October 31, 2014 | 12.56 | 0.42 | 0.49 | 0.91 | (0.50 | ) | – | (0.50 | ) | 12.97 | ||||||||||||||||||||||
Year Ended October 31, 2013 | 12.01 | 0.38 | 0.57 | 0.95 | (0.40 | ) | – | (0.40 | ) | 12.56 | ||||||||||||||||||||||
| (a) | Net investment income/(loss) is based on average shares outstanding during the period. |
| (b) | Excludes sales charge. |
| (c) | During the period, certain fees were waived and/or reimbursed. If such waivers/reimbursements had not occurred, the ratios would have been as indicated. |
Amounts listed as “–” are $0 or round to $0.
See accompanying Notes to Financial Statements.
| 28 | Annual Report 2017 |
Financial Highlights (continued)
Selected Data for Each Share of Capital Outstanding Throughout the Periods Indicated
Aberdeen Diversified Income Fund (concluded)
| Ratios/Supplemental Data | ||||||||||||||||||||||
| Total Return (b) | Net Assets at End of Period (000’s) | Ratio of Expenses (Net of Reimbursements/Waivers) to Average Net Assets | Ratio of Expenses (Prior to Reimbursements) to Average Net Assets (c) | Ratio of Net Investment Income to Average Net Assets | Portfolio Turnover (d) | |||||||||||||||||
| 10.27 | % | $ | 6,811 | 0.58 | % | 1.36 | % | 3.17 | % | 27.52 | % | |||||||||||
| 4.00 | % | 5,390 | 0.56 | % | 1.22 | % | 3.02 | % | 20.87 | % | ||||||||||||
| (2.21 | %) | 6,291 | 0.53 | %(e) | 1.16 | %(e) | 3.07 | % | 50.74 | % | ||||||||||||
| 7.10 | % | 7,542 | 0.51 | % | 1.08 | % | 3.06 | % | 29.19 | % | ||||||||||||
| 7.69 | % | 8,357 | 0.53 | % | 1.00 | % | 2.82 | % | 37.01 | % | ||||||||||||
| 9.55 | % | 10,003 | 1.25 | % | 2.11 | % | 2.46 | % | 27.52 | % | ||||||||||||
| 3.24 | % | 12,293 | 1.25 | % | 1.96 | % | 2.33 | % | 20.87 | % | ||||||||||||
| (2.96 | %) | 14,396 | 1.25 | %(e) | 1.88 | %(e) | 2.33 | % | 50.74 | % | ||||||||||||
| 6.34 | %(f) | 14,906 | 1.25 | % | 1.82 | % | 2.31 | % | 29.19 | % | ||||||||||||
| 6.96 | %(f) | 17,824 | 1.25 | % | 1.72 | % | 2.09 | % | 37.01 | % | ||||||||||||
| 10.00 | % | 364 | 0.83 | % | 1.61 | % | 2.86 | % | 27.52 | % | ||||||||||||
| 3.65 | % | 313 | 0.85 | % | 1.51 | % | 2.77 | % | 20.87 | % | ||||||||||||
| (2.75 | %) | 421 | 0.98 | %(e) | 1.61 | %(e) | 2.64 | % | 50.74 | % | ||||||||||||
| 6.66 | % | 408 | 0.97 | % | 1.54 | % | 2.58 | % | 29.19 | % | ||||||||||||
| 7.29 | % | 387 | 0.96 | % | 1.43 | % | 2.39 | % | 37.01 | % | ||||||||||||
| 10.64 | % | 38 | 0.25 | % | 1.04 | % | 3.45 | % | 27.52 | % | ||||||||||||
| 4.28 | % | 33 | 0.25 | % | 0.91 | % | 3.32 | % | 20.87 | % | ||||||||||||
| (1.91 | %) | 32 | 0.25 | %(e) | 0.88 | %(e) | 3.16 | % | 50.74 | % | ||||||||||||
| 7.32 | %(f) | 12 | 0.25 | % | 0.82 | % | 3.31 | % | 29.19 | % | ||||||||||||
| 8.10 | %(f) | 11 | 0.25 | % | 0.72 | % | 3.10 | % | 37.01 | % | ||||||||||||
| 10.66 | % | 1,322 | 0.25 | % | 1.09 | % | 3.47 | % | 27.52 | % | ||||||||||||
| 4.30 | % | 1,129 | 0.25 | % | 0.95 | % | 3.32 | % | 20.87 | % | ||||||||||||
| (1.91 | %) | 1,314 | 0.25 | %(e) | 0.88 | %(e) | 3.30 | % | 50.74 | % | ||||||||||||
| 7.40 | % | 2,339 | 0.25 | % | 0.82 | % | 3.32 | % | 29.19 | % | ||||||||||||
| 8.01 | % | 1,953 | 0.25 | % | 0.72 | % | 3.10 | % | 37.01 | % | ||||||||||||
| (d) | Portfolio turnover is calculated on the basis of the Fund as a whole without distinguishing among the classes of shares. |
| (e) | Includes interest expense that amounts to less than 0.01%. |
| (f) | The total return shown above includes the impact of financial statement rounding of the NAV per share and/or financial statement adjustments. |
| 2017 Annual Report | 29 |
Financial Highlights (continued)
Selected Data for Each Share of Capital Outstanding Throughout the Periods Indicated
Aberdeen Dynamic Allocation Fund
| Investment Activities | Distributions | |||||||||||||||||||||||||||||||
| Net Asset Value, Beginning of Period | Net Investment Income (a) | Net Realized and Unrealized Gains (Losses) on Investments | Total from Investment Activities | Net Investment Income | Net Realized Gains | Total Distributions | Net Asset Value, End of Period | |||||||||||||||||||||||||
Class A Shares | ||||||||||||||||||||||||||||||||
Year Ended October 31, 2017 | $ | 12.76 | $ | 0.26 | $ | 1.09 | $ | 1.35 | $ | (0.30 | ) | $ | – | $ | (0.30 | ) | $ | 13.81 | ||||||||||||||
Year Ended October 31, 2016 | 12.86 | 0.24 | (0.07 | ) | 0.17 | (0.26 | ) | (0.01 | ) | (0.27 | ) | 12.76 | ||||||||||||||||||||
Year Ended October 31, 2015 | 13.30 | 0.33 | (0.43 | ) | (0.10 | ) | (0.34 | ) | – | (0.34 | ) | 12.86 | ||||||||||||||||||||
Year Ended October 31, 2014 | 12.51 | 0.20 | 0.80 | 1.00 | (0.21 | ) | – | (0.21 | ) | 13.30 | ||||||||||||||||||||||
Year Ended October 31, 2013 | 11.52 | 0.17 | 1.01 | 1.18 | (0.19 | ) | – | (0.19 | ) | 12.51 | ||||||||||||||||||||||
Class C Shares | ||||||||||||||||||||||||||||||||
Year Ended October 31, 2017 | 12.49 | 0.17 | 1.07 | 1.24 | (0.20 | ) | – | (0.20 | ) | 13.53 | ||||||||||||||||||||||
Year Ended October 31, 2016 | 12.60 | 0.15 | (0.07 | ) | 0.08 | (0.18 | ) | (0.01 | ) | (0.19 | ) | 12.49 | ||||||||||||||||||||
Year Ended October 31, 2015 | 13.06 | 0.23 | (0.43 | ) | (0.20 | ) | (0.26 | ) | – | (0.26 | ) | 12.60 | ||||||||||||||||||||
Year Ended October 31, 2014 | 12.28 | 0.11 | 0.78 | 0.89 | (0.11 | ) | – | (0.11 | ) | 13.06 | ||||||||||||||||||||||
Year Ended October 31, 2013 | 11.32 | 0.08 | 1.00 | 1.08 | (0.12 | ) | – | (0.12 | ) | 12.28 | ||||||||||||||||||||||
Class R Shares | ||||||||||||||||||||||||||||||||
Year Ended October 31, 2017 | 12.68 | 0.22 | 1.08 | 1.30 | (0.25 | ) | – | (0.25 | ) | 13.73 | ||||||||||||||||||||||
Year Ended October 31, 2016 | 12.79 | 0.19 | (0.08 | ) | 0.11 | (0.21 | ) | (0.01 | ) | (0.22 | ) | 12.68 | ||||||||||||||||||||
Year Ended October 31, 2015 | 13.23 | 0.27 | (0.42 | ) | (0.15 | ) | (0.29 | ) | – | (0.29 | ) | 12.79 | ||||||||||||||||||||
Year Ended October 31, 2014 | 12.45 | 0.15 | 0.78 | 0.93 | (0.15 | ) | – | (0.15 | ) | 13.23 | ||||||||||||||||||||||
Year Ended October 31, 2013 | 11.47 | 0.12 | 1.02 | 1.14 | (0.16 | ) | – | (0.16 | ) | 12.45 | ||||||||||||||||||||||
Institutional Service Class Shares | ||||||||||||||||||||||||||||||||
Year Ended October 31, 2017 | 12.70 | 0.30 | 1.09 | 1.39 | (0.34 | ) | – | (0.34 | ) | 13.75 | ||||||||||||||||||||||
Year Ended October 31, 2016 | 12.81 | 0.28 | (0.08 | ) | 0.20 | (0.30 | ) | (0.01 | ) | (0.31 | ) | 12.70 | ||||||||||||||||||||
Year Ended October 31, 2015 | 13.24 | 0.34 | (0.40 | ) | (0.06 | ) | (0.37 | ) | – | (0.37 | ) | 12.81 | ||||||||||||||||||||
Year Ended October 31, 2014 | 12.46 | 0.24 | 0.78 | 1.02 | (0.24 | ) | – | (0.24 | ) | 13.24 | ||||||||||||||||||||||
Year Ended October 31, 2013 | 11.47 | 0.20 | 1.02 | 1.22 | (0.23 | ) | – | (0.23 | ) | 12.46 | ||||||||||||||||||||||
Institutional Class Shares | ||||||||||||||||||||||||||||||||
Year Ended October 31, 2017 | 12.72 | 0.30 | 1.10 | 1.40 | (0.33 | ) | – | (0.33 | ) | 13.79 | ||||||||||||||||||||||
Year Ended October 31, 2016 | 12.81 | 0.28 | (0.08 | ) | 0.20 | (0.28 | ) | (0.01 | ) | (0.29 | ) | 12.72 | ||||||||||||||||||||
Year Ended October 31, 2015 | 13.24 | 0.36 | (0.42 | ) | (0.06 | ) | (0.37 | ) | – | (0.37 | ) | 12.81 | ||||||||||||||||||||
Year Ended October 31, 2014 | 12.46 | 0.24 | 0.78 | 1.02 | (0.24 | ) | – | (0.24 | ) | 13.24 | ||||||||||||||||||||||
Year Ended October 31, 2013 | 11.47 | 0.19 | 1.03 | 1.22 | (0.23 | ) | – | (0.23 | ) | 12.46 | ||||||||||||||||||||||
| (a) | Net investment income/(loss) is based on average shares outstanding during the period. |
| (b) | Excludes sales charge. |
| (c) | During the period, certain fees were waived and/or reimbursed. If such waivers/reimbursements had not occurred, the ratios would have been as indicated. |
Amounts listed as “–” are $0 or round to $0.
See accompanying Notes to Financial Statements.
| 30 | Annual Report 2017 |
Financial Highlights (concluded)
Selected Data for Each Share of Capital Outstanding Throughout the Periods Indicated
Aberdeen Dynamic Allocation Fund (concluded)
| Ratios/Supplemental Data | ||||||||||||||||||||||
| Total Return (b) | Net Assets at End of Period (000’s) | Ratio of Expenses (Net of Reimbursements/Waivers) to Average Net Assets | Ratio of Expenses (Prior to Reimbursements) to Average Net Assets (c) | Ratio of Net Investment Income to Average Net Assets | Portfolio Turnover (d) | |||||||||||||||||
| 10.71 | % | $ | 7,583 | 0.58 | % | 1.47 | % | 2.00 | % | 56.19 | % | |||||||||||
| 1.30 | % | 7,641 | 0.56 | % | 1.24 | % | 1.92 | % | 40.08 | % | ||||||||||||
| (0.82 | %) | 8,677 | 0.53 | % | 1.19 | % | 2.50 | % | 40.49 | % | ||||||||||||
| 8.03 | % | 9,506 | 0.52 | % | 1.16 | % | 1.58 | % | 52.34 | % | ||||||||||||
| 10.35 | % | 9,937 | 0.52 | % | 1.07 | % | 1.44 | % | 67.49 | % | ||||||||||||
| 10.04 | % | 6,302 | 1.25 | % | 2.23 | % | 1.29 | % | 56.19 | % | ||||||||||||
| 0.58 | % | 9,470 | 1.25 | % | 2.00 | % | 1.24 | % | 40.08 | % | ||||||||||||
| (1.55 | %) | 11,687 | 1.25 | % | 1.91 | % | 1.78 | % | 40.49 | % | ||||||||||||
| 7.28 | % | 12,939 | 1.25 | % | 1.89 | % | 0.85 | % | 52.34 | % | ||||||||||||
| 9.58 | % | 15,123 | 1.25 | % | 1.80 | % | 0.71 | % | 67.49 | % | ||||||||||||
| 10.38 | % | 475 | 0.95 | % | 1.83 | % | 1.64 | % | 56.19 | % | ||||||||||||
| 0.84 | % | 508 | 0.93 | % | 1.61 | % | 1.52 | % | 40.08 | % | ||||||||||||
| (1.16 | %) | 501 | 0.96 | % | 1.62 | % | 2.04 | % | 40.49 | % | ||||||||||||
| 7.52 | % | 454 | 0.95 | % | 1.59 | % | 1.15 | % | 52.34 | % | ||||||||||||
| 9.99 | % | 406 | 0.92 | % | 1.47 | % | 1.02 | % | 67.49 | % | ||||||||||||
| 11.13 | % | 11 | 0.25 | % | 1.13 | % | 2.30 | % | 56.19 | % | ||||||||||||
| 1.58 | % | 10 | 0.25 | % | 0.93 | % | 2.22 | % | 40.08 | % | ||||||||||||
| (0.53 | %)(e) | 10 | 0.25 | % | 0.91 | % | 2.56 | % | 40.49 | % | ||||||||||||
| 8.36 | % | 12 | 0.25 | % | 0.89 | % | 1.85 | % | 52.34 | % | ||||||||||||
| 10.72 | % | 11 | 0.25 | % | 0.80 | % | 1.68 | % | 67.49 | % | ||||||||||||
| 11.13 | % | 1,241 | 0.25 | % | 1.23 | % | 2.30 | % | 56.19 | % | ||||||||||||
| 1.57 | % | 1,275 | 0.25 | % | 1.02 | % | 2.26 | % | 40.08 | % | ||||||||||||
| (0.53 | %) | 1,675 | 0.25 | % | 0.91 | % | 2.73 | % | 40.49 | % | ||||||||||||
| 8.28 | % | 1,506 | 0.25 | % | 0.89 | % | 1.86 | % | 52.34 | % | ||||||||||||
| 10.72 | % | 1,223 | 0.25 | % | 0.80 | % | 1.62 | % | 67.49 | % | ||||||||||||
| (d) | Portfolio turnover is calculated on the basis of the Fund as a whole without distinguishing among the classes of shares. |
| (e) | The total return shown above includes the impact of financial statement rounding of the NAV per share and/or financial statement adjustments. |
| 2017 Annual Report | 31 |
October 31, 2017
1. Organization
Aberdeen Funds (the “Trust”) was organized as a statutory trust under the laws of the state of Delaware by a Certificate of Trust filed on September 27, 2007 and is registered under the Investment Company Act of 1940, as amended (the “1940 Act”), as an open-end management investment company. As of October 31, 2017, the Trust had authorized an unlimited number of shares of beneficial interest (“shares”) without par value. As of October 31, 2017, the Trust operated eighteen (18) separate series, or mutual funds, each with its own investment objective(s) and strategies. This report contains the financial statements and financial highlights of the three (3) funds listed below (each a “Fund”; collectively, the “Funds”):
| – | Aberdeen Diversified Alternatives Fund (“Diversified Alternatives Fund”) |
| – | Aberdeen Diversified Income Fund (“Diversified Income Fund”) |
| – | Aberdeen Dynamic Allocation Fund (“Dynamic Allocation Fund”) |
Each of the Funds is operated as a “fund of funds,” which means that each of these Funds pursues its investment objective primarily by allocating its investments among other affiliated and unaffiliated mutual funds and exchange traded funds (“Underlying Funds”).
2. Summary of Significant Accounting Policies
The Trust is an investment company and accordingly follows the investment company accounting and reporting guidance of the Financial Accounting Standards Board (“FASB”) Accounting Standard Codification Topic 946 Financial Services-Invesment Companies. The following is a summary of significant accounting policies followed by the Funds in the preparation of their financial statements. The policies conform to generally accepted accounting principles in the United States of America (“GAAP”). The preparation of financial statements requires management to make estimates and assumptions that affect the reported amounts of assets and liabilities, disclosure of contingent assets and liabilities at the date of the financial statements, and the reported amounts of income and expenses for the period. Actual results could differ from those estimates. The accounting records of the Funds are maintained in U.S. Dollars.
| a. | Security Valuation |
The Funds value their securities at current market value or fair value, consistent with regulatory requirements. “Fair value” is defined in the Funds’ Valuation and Liquidity Procedures as the price that could be received to sell an asset or paid to transfer a liability in an orderly transaction between willing market participants without a compulsion to transact at the measurement date.
In accordance with the authoritative guidance on fair value measurements and disclosures under GAAP, the Funds disclose the fair value of their investments using a three-level hierarchy that classifies the inputs to valuation techniques used to measure the fair value. The hierarchy assigns Level 1, the highest level, measurements to valuations based upon unadjusted quoted prices in active markets for identical assets, Level 2 measurements to valuations based upon other significant observable inputs, including adjusted quoted prices in active markets for similar assets, and Level 3, the lowest level, measurements to valuations based upon unobservable inputs that are significant to the valuation. Observable inputs are inputs that reflect the assumptions market participants would use in pricing the asset or liability, which are based on market data obtained from sources independent of the reporting entity. Unobservable inputs are inputs that reflect the reporting entity’s own assumptions about the assumptions market participants would use in pricing the asset or liability developed based on the best information available in the circumstances. A financial instrument’s level within the fair value hierarchy is based upon the lowest level of any input that is significant to the fair value measurement.
Equity securities that are traded on an exchange are valued at the last quoted sale price on the principal exchange on which the security is traded at the “Valuation Time” subject to application, when appropriate, of the valuation factors described in the paragraph below. Under normal circumstances, the Valuation Time is as of the close of regular trading on the New York Stock Exchange (usually 4:00 p.m. Eastern Time). In the absence of a sale price, the security is valued at the mean of the bid/ask price quoted at the close on the principal exchange on which the security is traded. Securities traded on NASDAQ are valued at the NASDAQ official closing price. Open-end mutual funds are valued at the respective net asset value as reported by such company. The prospectuses for the registered open-end management investment companies in which a Fund invests explain the circumstances under which those companies will use fair value pricing and the effects of using fair value pricing. Closed-end funds and exchange-traded funds (“ETFs”) are valued at the market price of the security at the Valuation Time. A security using any of these pricing methodologies is determined to be a Level 1 investment.
Short-term investments are comprised of cash and cash equivalents invested in short-term investment funds which are redeemable daily. Each Fund sweeps available cash into the State Street Institutional U.S. Government Money Market Fund, which has elected to qualify as a “government money market fund” pursuant to Rule 2a-7 under the 1940 Act, and has an objective, which is not guaranteed, to maintain a $1.00 per share net asset value. Generally, these investment types are categorized as Level 1 investments.
| 32 | Annual Report 2017 |
Notes to Financial Statements (continued)
October 31, 2017
In the event that a security’s market quotations are not readily available or are deemed unreliable (for reasons other than because the foreign exchange on which it trades closed before the Valuation Time), the security is valued at fair value as determined by the Funds’ Pricing Committee (the “Pricing Committee”), taking into account the relevant factors and surrounding circumstances using Valuation and Liquidity Procedures approved by the Board of Trustees of the Trust (the “Board”). A security that has been fair valued by the Pricing Committee may be classified as Level 2 or Level 3 depending on the nature of the inputs.
The three-level hierarchy of inputs is summarized below:
| • | Level 1- quoted prices in active markets for identical investments; |
| • | Level 2- other significant observable inputs (including quoted prices for similar securities, interest rates, prepayment speeds, and credit risk); or |
| • | Level 3- significant unobservable inputs (including a Fund’s own assumptions in determining the fair value of investments). |
The following is a summary of the inputs used as of October 31, 2017 in valuing the Funds’ investments at fair value. The inputs or methodologies used for valuing securities are not necessarily an indication of the risk associated with investing in those securities.
Please refer to the Statements of Investments for a detailed breakout of the security types:
| LEVEL 1–Quoted Prices ($) | LEVEL 2–Other Significant Observable Inputs ($) | LEVEL 3–Significant Unobservable Inputs ($) | Total ($) | |||||||||||||
| Diversified Alternatives Fund | ||||||||||||||||
| Investments in Securities | ||||||||||||||||
Mutual Funds | 34,737,768 | – | – | 34,737,768 | ||||||||||||
Exchange Traded Funds | 5,349,428 | – | – | 5,349,428 | ||||||||||||
Short-Term Investment | 1,781,618 | – | – | 1,781,618 | ||||||||||||
|
|
|
|
|
|
|
| |||||||||
| 41,868,814 | – | – | 41,868,814 | |||||||||||||
|
|
|
|
|
|
|
| |||||||||
| Diversified Income Fund | ||||||||||||||||
| Investments in Securities | ||||||||||||||||
Mutual Funds | 7,423,407 | – | – | 7,423,407 | ||||||||||||
Exchange Traded Funds | 10,730,739 | – | – | 10,730,739 | ||||||||||||
Short-Term Investment | 579,717 | – | – | 579,717 | ||||||||||||
|
|
|
|
|
|
|
| |||||||||
| 18,733,863 | – | – | 18,733,863 | |||||||||||||
|
|
|
|
|
|
|
| |||||||||
| Dynamic Allocation Fund | ||||||||||||||||
| Investments in Securities | ||||||||||||||||
Mutual Funds | 2,268,903 | – | – | 2,268,903 | ||||||||||||
Exchange Traded Funds | 12,498,063 | – | – | 12,498,063 | ||||||||||||
Short-Term Investment | 827,533 | – | – | 827,533 | ||||||||||||
|
|
|
|
|
|
|
| |||||||||
| 15,594,499 | – | – | 15,594,499 | |||||||||||||
|
|
|
|
|
|
|
| |||||||||
Amounts listed as “–” are $0 or round to $0.
For movements between the levels within the fair value hierarchy, the Funds have adopted a policy of recognizing transfers at the end of each fiscal period. During the fiscal year ended October 31, 2017, there were no transfers between Levels. For the fiscal year ended October 31, 2017, there were no significant changes to the fair valuation methodologies.
| b. | Restricted Securities |
Restricted securities are privately-placed securities whose resale is restricted under U.S. securities laws. The Funds may invest in restricted
securities, including unregistered securities eligible for resale without registration pursuant to Rule 144A and privately-placed securities of U.S. and non-U.S. issuers offered outside the U.S. without registration pursuant to Regulation S under the Securities Act of 1933, as amended (the “1933 Act”). Rule 144A securities may be freely traded among certain qualified institutional investors, such as the Funds, but resale of such securities in the U.S. is permitted only in limited circumstances.
| 2017 Annual Report | 33 |
Notes to Financial Statements (continued)
October 31, 2017
| c. | Security Transactions, Investment Income and Expenses |
Security transactions are recorded on the trade date. Realized and unrealized gains/(losses) from security and currency transactions are calculated on the identified cost basis. Dividend income and corporate actions are recorded generally on the ex-date, except for certain dividends and corporate actions which may be recorded after the ex-date, as soon as a Fund acquires information regarding such dividends or corporate actions.
Interest income and expenses are recorded on an accrual basis. Expenses directly attributable to a Fund are charged to that Fund. Expenses not directly attributable to a Fund are allocated proportionately among the relevant Funds based on net assets of each. For each of the Funds, the method for allocating income, fund level expenses, and realized and unrealized gains or losses to a class is based on the total net asset value of that class’ shares in proportion to the total net assets of the relevant Fund. Expenses specific to a class (such as Rule 12b-1 and administrative services fees) are charged to that class.
| d. | Distributions |
Distributions from net investment income, if any, are declared and paid quarterly for all Funds. The Funds will also declare and pay distributions at least annually from net realized gains on investment transactions and net realized foreign exchange gains, if any. Dividends and distributions to shareholders are recorded on the ex-dividend date.
Dividends and distributions to shareholders are determined in accordance with federal income tax regulations, which may differ from GAAP. These differences are primarily due to differing treatments for foreign currencies and loss deferrals.
| e. | Federal Income Taxes |
Each Fund intends to continue to qualify as a “regulated investment company” by complying with the provisions available to certain investment companies, as defined in Subchapter M of the Internal Revenue Code of 1986, as amended, and to make distributions of net investment income and net realized capital gains sufficient to relieve the Funds from all federal income taxes. Therefore, no federal income tax provision is required.
Management of the Funds has concluded that there are no significant uncertain tax positions that would require recognition in the financial statements. Since tax authorities can examine previously filed tax returns, the Funds’ U.S. federal and state tax returns for each of the four fiscal years up to the most recent fiscal year ended October 31 are subject to such review.
| f. | Repurchase Agreements |
The Funds may enter into a repurchase agreement under the terms of a Master Repurchase Agreement. It is each Fund’s policy that its custodian/counterparty segregate the underlying collateral securities, the value of which exceeds the principal amount of the repurchase transaction, including accrued interest. The repurchase price generally equals the price paid by a Fund plus interest negotiated on the basis of current short-term rates. To the extent that any repurchase transaction exceeds one business day, the collateral is valued on a daily basis to determine its adequacy. If the counterparty to a repurchase agreement defaults and the value of the collateral declines, or if bankruptcy proceedings are commenced with respect to the counterparty of the security, realization of the collateral by the Funds may be delayed or limited. Repurchase agreements are subject to contractual netting arrangements with the Fund’s repurchase agreement counterparty, Fixed Income Clearing Corp. To the extent a Fund enters into repurchase agreements, additional information on individual repurchase agreements is included in the Statements of Investments. As of and during the fiscal year ended October 31, 2017, the Funds did not hold any repurchase agreements.
| g. | Securities Lending |
Through an agreement with BNP Paribas as the Lending Agent and State Street Bank and Trust Company (the Funds’ custodian), the Funds may lend its portfolio securities to brokers, dealers and other financial institutions that pay a negotiated fee in order to generate income. The Funds receive non-cash collateral in the form of U.S. Government Securities, with respect to each loan of U.S. securities, equal to at least 102% of the value of the portfolio securities loaned, and, with respect to each loan of non-U.S. securities, collateral of at least 105% of the value of the portfolio securities loaned, and at all times thereafter shall require the borrower to mark to market such collateral on a daily basis so that the market value of such collateral does not fall below 100% of the market value of the portfolio securities loaned.
The Funds continue to own the loaned securities and continue to recognize unrealized gains and losses on the securities on loan. However, securities lending involves certain risks including the event of default or insolvency of the borrower including possible delays or restrictions upon a Fund’s ability to recover the loaned securities or dispose of the collateral for the loan. Securities on loan are noted within the Statement of Investments. Non-cash securities lending collateral held by the Lending Agent on behalf of the Funds cannot be sold or repledged by the Fund and therefore, this amount is not presented on the Funds’ Statements of Investments.
At October 31, 2017, the Funds did not have any securities on loan.
| 34 | Annual Report 2017 |
Notes to Financial Statements (continued)
October 31, 2017
3. Agreements and Transactions with Affiliates
| Merger | of Aberdeen Asset Management PLC with Standard Life plc |
The Funds’ investment adviser, distributor and administrator are each a subsidiary of Aberdeen Asset Management PLC (“Aberdeen PLC”). The merger of Standard Life plc and Aberdeen PLC was announced on March 6, 2017 and closed on August 14, 2017 (“Merger”). Aberdeen PLC became a direct subsidiary of Standard Life plc as a result of the Merger and the combined company changed its name to Standard Life Aberdeen plc. Shareholders of the Funds are not required to take any action as a result of the Merger. Following the Merger, the Funds’ investment adviser, distributor and administrator each became an indirect subsidiary of Standard Life Aberdeen plc, but otherwise did not change. The agreements that the Trust, on behalf of the Funds, has with Aberdeen PLC’s subsidiary companies, the services provided under the agreements, and the fees charged for those services did not change as a result of the Merger. The portfolio management team for each Fund remained the same following the Merger.
| a. | Investment Adviser |
Under the Investment Advisory Agreement with the Trust, Aberdeen Asset Management Inc. (“Aberdeen” or the “Adviser”) manages the Funds in accordance with the policies and procedures established by the Board. Under the terms of the Investment Advisory Agreement, each Fund pays Aberdeen an annual management fee of 0.15% based on such Fund’s average daily net assets, paid monthly.
The Trust and Aberdeen have entered into a written contract (the “Expense Limitation Agreement”) limiting operating expenses to 0.25% for all classes of the Funds. This contractual limitation may not be terminated before February 28, 2018 without the approval of the Independent Trustees of the Board. This limit excludes certain expenses, including any taxes, interest, brokerage fees, short-sale dividend expenses, Acquired Fund Fees and Expenses, Rule 12b-1 fees, administrative services fees, transfer agent out-of-pocket expenses for Class A shares, Class R shares, and Institutional Service Class shares and extraordinary expenses.
Aberdeen may request and receive reimbursement from a Fund of the advisory fees waived and other expenses reimbursed pursuant to the Expense Limitation Agreement as of a date not more than three years after the date when the Adviser limited the fees or reimbursed the expenses; provided that the following requirements are met: the reimbursements do not cause a class to exceed the lesser of the applicable expense limitation in the contract at the time the fees were limited or expenses are paid or the applicable expense limitation in effect at the time the expenses are being recouped by the Adviser, and the payment of such reimbursement is approved by the Board on a quarterly basis (the “Reimbursement Requirements”). Except as provided for in the Expense Limitation Agreement, reimbursement of amounts previously waived or assumed by Aberdeen is not permitted.
As of October 31, 2017, to the extent the Reimbursement Requirements are met, the cumulative potential reimbursements to Aberdeen for each Fund, based on expenses reimbursed by Aberdeen would be:
| Fund | Amount Fiscal Year 2015 (Expires 10/31/18) | Amount Fiscal Year 2016 (Expires 10/31/19) | Amount Fiscal Year 2017 (Expires 10/31/20) | Total* | ||||||||||||
Diversified Alternatives Fund | $ | 341,817 | $ | 272,716 | $ | 202,256 | $ | 816,789 | ||||||||
Diversified Income Fund | 153,561 | 142,028 | 155,750 | 451,339 | ||||||||||||
Dynamic Allocation Fund | 160,791 | 151,253 | 159,325 | 471,369 | ||||||||||||
| * | Amounts reported are due to expire throughout the respective 3-year expiration period presented above. |
In accordance with the Funds’ Expense Limitation Agreement and criteria, as described above, the Adviser did not recapture any expenses for which it previously reimbursed the Funds. Accordingly, at October 31, 2017, the Funds did not have liabilities payable to the Adviser for recapture of previously reimbursed expenses.
| b. | Fund Administration |
Under the terms of the Fund Administration Agreement, Aberdeen provides various administrative and accounting services, including daily valuation of the Funds’ shares, preparation of financial statements, tax returns, regulatory reports, and presentation of quarterly reports to the Board. For services provided pursuant to the Fund Administration Agreement, the Trust pays Aberdeen an annual fee of 0.08% based on the Trust’s average daily net assets. The fee is then allocated proportionately among all funds within the Trust (including the Funds) in relation to the average daily net assets of each fund. This asset-based fee is subject to an annual minimum fee based on the number of funds served. Pursuant to a sub-administration agreement with Aberdeen, State Street Bank and Trust Company provides sub-administration services with respect to the Funds.
| 2017 Annual Report | 35 |
Notes to Financial Statements (continued)
October 31, 2017
| c. | Distributor and Shareholder Servicing |
The Trust and Aberdeen Fund Distributors, LLC (the “Distributor” or “AFD”) are parties to the current Underwriting Agreement (the “Underwriting Agreement”) whereby the Distributor acts as principal underwriter for the Trust’s shares.
The Trust has adopted a Distribution Plan (the “Plan”) pursuant to Rule 12b-1 under the 1940 Act with respect to certain classes of shares. The Plan permits the Funds to compensate AFD, as the Funds’ Distributor, for expenses associated with the distribution of certain classes of shares of the Funds of the Trust. Although actual distribution expenses may be more or less, under the Plan, the Funds of the Trust pay the Distributor an annual fee of the following amounts:
| Fund | Class A Shares | Class C Shares(a) | Class R Shares(a) | |||||||||
Diversified Alternatives Fund | 0.25% | 1.00% | 0.50% | |||||||||
Diversified Income Fund | 0.25% | 1.00% | 0.50% | |||||||||
Dynamic Allocation Fund | 0.25% | 1.00% | 0.50% | |||||||||
| (a) | 0.25% of which is service fees |
The Adviser or an affiliate of the Adviser may pay additional amounts from its own resources to dealers or other financial intermediaries, for aid in distribution or for aid in providing administrative services to shareholders.
Pursuant to the current Underwriting Agreement, the Distributor will also receive the proceeds of contingent deferred sales charges (“CDSCs”) of 1% imposed on certain redemptions of Class C shares (and up to 1% for certain Class A shares).
In addition, the Distributor will re-allow to dealers 5.00% of sales charges on Class A shares of the Funds, which have a maximum front-end sales charge of 5.75% and the Distributor or the Adviser may compensate broker dealers or financial intermediaries from its own resources at the rate of 1.00% on sales of Class C shares of the Funds, which have a maximum CDSC of 1.00%, (on the CDSC assessed on sales within one year of purchase). For the fiscal year ended October 31, 2017, AFD retained commissions of $20,581 from front-end sales charges of Class A shares and $1,308 from CDSC fees from Class C shares (and certain Class A shares) of the Funds.
| d. | Administrative Services Fees/Transfer Agent Out-of-Pocket Expenses |
The Funds may pay and/or reimburse administrative services fees/transfer agent out-of-pocket expenses to certain broker-dealers and financial intermediaries who provide administrative support services to beneficial shareholders on behalf of the Funds (sometimes referred to as “sub-transfer agency fees”), subject to certain limitations approved by the Board. These fees may be in addition to Rule 12b-1 fees. Sub-transfer agency fees generally include, but are not limited to, costs associated with omnibus accounting, recordkeeping, networking, sub-transfer agency or other administrative or shareholder services.
Class A, Class R and Institutional Service Class shares of the Funds pay for such services pursuant to an Administrative Services Plan adopted by the Board. Under the Administrative Services Plan, a Fund may pay a broker-dealer or other intermediary a maximum annual administrative services fee of 0.25% for Class A, Class R and Institutional Services Class shares. Under an amendment to the Administrative Services Plan that is in effect until at least February 28, 2019, the administrative services fee is limited to a maximum of 0.15% for contracts with fees that are calculated as a percentage of Fund assets and a maximum of $16 per account for contracts with fees that are calculated on a dollar per account basis. Class C and Institutional Class shares may also pay for the services described above directly, as these classes are not subject to an Administrative Services Plan.
The amount of sub-transfer agent and administrative service fees paid during the fiscal year ended October 31, 2017 was as follows:
| Fund | Class A | Class C | Class R | Institutional Service | Institutional | |||||||||||||||
Diversified Alternatives Fund | $ | 23,194 | $ | 10,330 | $ | 3,325 | $ | 2 | $ | 18,204 | ||||||||||
Diversified Income Fund | 4,621 | 8,354 | 259 | – | 642 | |||||||||||||||
Dynamic Allocation Fund | 6,078 | 7,770 | 1,007 | – | 1,110 | |||||||||||||||
The Funds may pay and/or reimburse transfer agent out-of-pocket expenses to certain broker-dealers and financial intermediaries who provide administrative support services to beneficial shareholders on behalf of the Funds, subject to certain limitations approved by the Board. These fees may be in addition to Rule 12b-1 fees. Transfer agent out-of-pocket expenses generally include, but are not limited to, costs associated with recordkeeping, networking, sub-transfer agency or other administrative or shareholder services.
| 36 | Annual Report 2017 |
Notes to Financial Statements (continued)
October 31, 2017
4. Investment Transactions
Purchases and sales of Underlying Funds for the fiscal year ended October 31, 2017, were as follows:
| Fund | Purchases | Sales | ||||||
Diversified Alternatives Fund | $ | 12,135,910 | $ | 30,471,317 | ||||
Diversified Income Fund | 5,070,869 | 7,499,145 | ||||||
Dynamic Allocation Fund | 9,122,109 | 14,140,912 | ||||||
A summary of the Funds’ investments in securities of affiliated issuers for the fiscal year ended October 31, 2017 is set forth below:
Diversified Alternatives Fund
| Fund | 10/31/2016 Share Balance | Purchase Cost | Sales Cost | Realized Gain (Loss) | Distributions Received(1) | Change in Unrealized Appreciation/ (Depreciation) | 10/31/2017 Share Balance | 10/31/2017 Market Value | ||||||||||||||||||||||||
Aberdeen Asia Bond Fund | 234,243 | $ | – | $ | 2,261,660 | $ | 41,764 | $ | – | $ | 510,350 | $ | – | $ | – | |||||||||||||||||
Aberdeen Focused U.S. Equity Fund (formerly, Aberdeen Equity Long-Short Fund) | 595,567 | 477,017 | 6,448,720 | (868,675 | ) | 477,017 | (136,988 | ) | – | – | ||||||||||||||||||||||
Total | $ | 477,017 | $ | 8,710,380 | $ | (826,911 | ) | $ | 477,017 | $ | 373,362 | $ | – | |||||||||||||||||||
| (1) | Distributions received includes both Income and Gains Distributions, if any. |
Diversified Income Fund
| Fund | 10/31/2016 Share Balance | Purchase Cost | Sales Cost | Realized Gain (Loss) | Distributions Received(1) | Change in Unrealized Appreciation/ (Depreciation) | 10/31/2017 Share Balance | 10/31/2017 Market Value | ||||||||||||||||||||||||
Aberdeen Asia Bond Fund | 112,241 | $ | – | $ | 1,148,338 | $ | (23,682 | ) | $ | – | $ | (1,010 | ) | $ | – | $ | – | |||||||||||||||
Aberdeen Global High Income Fund | 229,884 | 49,967 | 2,142,369 | (161,626 | ) | 52,133 | (15,553 | ) | – | – | ||||||||||||||||||||||
Aberdeen Total Return Bond Fund | 88,371 | 45,436 | 1,235,264 | (45,470 | ) | 44,882 | 188,964 | – | – | |||||||||||||||||||||||
Total | $ | 95,403 | $ | 4,525,971 | $ | (230,778 | ) | $ | 97,015 | $ | 172,401 | $ | – | |||||||||||||||||||
| (1) | Distributions received includes both Income and Gains Distributions, if any. |
Dynamic Allocation Fund
| Fund | 10/31/2016 Share Balance | Purchase Cost | Sales Cost | Realized Gain (Loss) | Distributions Received(1) | Change in Unrealized Appreciation/ (Depreciation) | 10/31/2017 Share Balance | 10/31/2017 Market Value | ||||||||||||||||||||||||
Aberdeen Asia Bond Fund | 93,070 | $ | – | $ | 945,258 | $ | (13,309 | ) | $ | – | $ | (7,778 | ) | $ | – | $ | – | |||||||||||||||
Aberdeen Emerging Markets Fund | 42,998 | 6,665 | 532,596 | 56,886 | 6,665 | (57,843 | ) | – | – | |||||||||||||||||||||||
Aberdeen Global High Income Fund | 90,778 | 18,604 | 904,137 | (122,636 | ) | 18,604 | 133,894 | – | – | |||||||||||||||||||||||
Aberdeen Total Return Bond Fund | 115,750 | 57,182 | 1,607,453 | (49,295 | ) | 57,989 | (28,565 | ) | – | – | ||||||||||||||||||||||
Aberdeen U.S. Small Cap Equity Fund | 44,288 | 206,831 | 1,366,986 | 386,744 | – | (175,137 | ) | – | – | |||||||||||||||||||||||
Total | $ | 289,282 | $ | 5,356,430 | $ | 258,390 | $ | 83,258 | $ | (135,429 | ) | $ | – | |||||||||||||||||||
| (1) | Distributions received includes both Income and Gains Distributions, if any. |
| 2017 Annual Report | 37 |
Notes to Financial Statements (continued)
October 31, 2017
5. Portfolio Investment Risks
| Principal | Risks of the Funds |
| a. | Affiliated Funds Risk |
The Funds’ Adviser serves as the adviser of certain Underlying Funds. It is possible that a conflict of interest among the Funds and the Underlying Funds could affect how the Funds’ Adviser fulfills its fiduciary duties to each Fund and the Underlying Funds.
| b. | Asset Allocation Risk |
Each Fund is subject to different levels and combinations of risk, based on its actual allocation among the various asset classes and Underlying Funds. Each Fund will be exposed to risks of the Underlying Funds in which it invests. The Funds will be affected by stock and bond market risks, among others. To the extent a Fund invests in Underlying Funds that expose it to non-traditional or alternative asset classes (which include investments that focus on a specialized asset class (e.g. long-short strategies), as well as specific market sectors within a broader asset class), the Fund will be exposed to the increased risk associated with those asset classes. The potential impact of the risks related to an asset class depends on the size of a Fund’s investment allocation to it.
| c. | Asset Class Variation Risk |
The Underlying Funds invest principally in the securities or investments constituting their asset class. However, under normal market conditions, an Underlying Fund may vary the percentage of its assets in these securities or investments (subject to any applicable regulatory requirements). Depending upon the percentage of securities or investments in a particular asset class held by the Underlying Funds at any given time and the percentage of the Fund’s assets invested in various Underlying Funds, the Fund’s actual exposure to the securities or investments in a particular asset class may vary substantially from its allocation model for that asset class.
| d. | Derivatives Risk |
Derivatives are speculative and may hurt a Fund’s performance. Derivatives present the risk of disproportionately increased losses and/or reduced opportunities for gains when the financial asset or measure to which the derivative is linked changes in unexpected ways. The potential benefits to be derived from a Fund’s derivatives strategy are dependent upon the portfolio managers’ ability to discern pricing inefficiencies and predict trends in markets, which decisions could prove to be inaccurate. This requires different skills and techniques than predicting changes in the price of individual securities, and there can be no assurance that the use of this strategy will be successful.
Hedged Exposure Risk – Losses generated by a derivative or practice used by a Fund for hedging purposes should be offset in part by gains on the hedged investment depending on the degree of correlation between the hedging instrument and the assets hedged. However, while hedging can reduce or eliminate losses, it can also reduce or eliminate gains.
Correlation Risk – The Funds are exposed to the risk that changes in the value of a hedging instrument will not match those of the investment being hedged.
Counterparty Risk – Derivative transactions depend on the creditworthiness of the counterparty and the counterparty’s ability to fulfill its contractual obligations.
| e. | Exchange-Traded Notes Risk |
Certain Funds may invest in exchange-traded notes (ETNs). ETNs are a type of unsecured, unsubordinated debt security that have characteristics and risks similar to those of fixed income securities and trade on a major exchange similar to shares of exchange-traded funds. However, this type of debt security differs from other types of bonds and notes because ETN returns are based upon the performance of a financial asset or market index minus applicable fees, no periodic coupon payments are distributed, and no principal protections exist. The purpose of ETNs is to create a type of security that combines the aspects of both bonds and exchange-traded funds. The value of an ETN may be influenced by time to maturity, level of supply and demand for the ETN, volatility and lack of liquidity in underlying commodities or securities markets, changes in the applicable interest rates, changes in the issuer’s credit rating and economic, legal, political or geographic events that affect the referenced asset or index.
| f. | Fund of Funds Risk |
Your cost of investing in one of the Funds, as a fund of funds, may be higher than the cost of investing in a mutual fund that only invests directly in individual securities. An Underlying Fund may change its investment objective or policies without a Fund’s approval, which could force the Fund to withdraw its investment from such Underlying Fund at a time that is unfavorable to the Fund. In addition, one Underlying Fund may buy the same securities that another Underlying Fund sells. Therefore, the Fund would indirectly bear the costs of these trades without accomplishing any investment purpose.
| 38 | Annual Report 2017 |
Notes to Financial Statements (continued)
October 31, 2017
| g. | Impact of Large Redemptions and Purchases of Fund Shares |
Occasionally, shareholders may make large redemptions or purchases of Fund shares, which may cause a Fund to have to sell securities or invest additional cash. These transactions may adversely affect a Fund’s performance and increase transaction costs. In addition, large redemption requests may exceed the cash balance of a Fund and result in credit line borrowing fees and/or overdraft charges to the Fund until the sale of portfolio securities to cover the redemption request settles. For additional information on redemptions, please see the Statement of Changes in Net Assets.
| h. | Performance Risk |
Each Fund’s investment performance is directly tied to the performance of the Underlying Funds and other investments in which the Fund invests. If one or more of the Underlying Funds fails to meet its investment objective, a Fund’s performance could be negatively affected. There can be no assurance that each Fund or any Underlying Fund will achieve its investment objective.
| Principal | Risks of Underlying Funds |
| a. | Alternative Strategies Risk |
Certain Funds invest in Underlying Funds that involve Alternative Strategies Risk. The performance of Underlying Funds that pursue alternative strategies is linked to the performance of highly volatile alternative asset classes (e.g., commodities and currencies) and alternative strategies (e.g., managed futures). To the extent a Fund invests in such Underlying Funds, the Fund’s share price will be exposed to potentially significant fluctuations in value. In addition, Underlying Funds that employ alternative strategies have the risk that anticipated opportunities do not play out as planned, resulting in potentially substantial losses to the Underlying Fund. Furthermore, alternative strategies may employ leverage, involve extensive short positions and/or focus on narrow segments of the market, which may magnify the overall risks and volatility associated with such Underlying Funds’ investments. Depending on the particular alternative strategies used by an Underlying Fund, it may be subject to risks not associated with more traditional investments. These risks may include, but are not limited to, derivatives risk, liquidity risk, credit risk, commodity risk and counterparty risk.
| b. | Commodity Risk |
The Funds may invest in Underlying Funds that involve Commodity Risk. The value of commodities may be more volatile than the value of equity securities or debt instruments and their value may be affected by changes in overall market movements, commodity index volatility, changes in interest rates, or factors affecting a particular industry or commodity. The price of a commodity may be affected by demand/supply imbalances in the market for the commodity.
| c. | Counterparty and Third Party Risk |
Transactions involving a counterparty or third party (other than the issuer of the instrument) are subject to the counterparty’s or third party’s credit risk and ability to perform in accordance with the terms of the transaction.
| d. | Credit Risk |
A debt instrument’s price depends, in part, on the credit quality of the issuer, borrower, counterparty, or underlying collateral and can decline in response to changes in the financial condition of the issuer, borrower, counterparty, or underlying collateral, or changes in specific or general market, economic, industry, political, regulatory, geopolitical, or other conditions. High yield bonds (“junk bonds”) may be subject to an increased risk of default, a more limited secondary market than investment grade bonds, and greater price volatility.
| e. | Derivatives Risk |
Derivatives can be highly volatile and involve risks in addition to the risks of the underlying security. Gains or losses from derivatives can be substantially greater than the derivatives’ original cost and can involve leverage.
| f. | Emerging Markets Risk |
Emerging market securities are subject to a magnification of the risks that apply to foreign investments; such risks are greater for securities of companies in emerging market countries because the countries may have less stable governments, more volatile currencies and less established markets (see “Foreign Securities Risk” below).
| g. | Floating Rate Loan Risk |
Floating rate loans generally are subject to restrictions on resale. Floating rate loans sometimes trade infrequently in the secondary market. As a result, valuing a floating rate loan can be more difficult and buying and selling a floating rate loan at an acceptable price can be more difficult or delayed. Difficulty in selling a floating rate loan can result in a loss. In addition, a floating rate loan may not be fully collateralized which may cause the floating rate loan to decline significantly in value.
| 2017 Annual Report | 39 |
Notes to Financial Statements (continued)
October 31, 2017
| h. | Foreign Currency Exposure Risk |
The value of foreign currencies relative to the U.S. Dollar fluctuates in response to market, economic, political, regulatory, geopolitical or other conditions. A decline in the value of a foreign currency versus the U.S. Dollar reduces the value in U.S. Dollars of investments denominated in that foreign currency. This risk may impact a Fund more greatly to the extent the Underlying Fund does not hedge its currency risk, or hedging techniques used by the Underlying Fund are unsuccessful.
| i. | Foreign Securities Risk |
Foreign securities may be more volatile, harder to price and less liquid than U.S. securities. They are subject to different accounting and regulatory standards, and political and economic risks.
| j. | High-Yield Bond and Other Lower-Rated Securities Risk |
An Underlying Fund’s investments in high-yield bonds (commonly referred to as “junk bonds”) and other lower-rated securities will subject the Underlying Fund to substantial risk of loss. Investments in high-yield bonds are speculative and issuers of these securities are generally considered to be less financially secure and less able to repay interest and principal than issuers of investment-grade securities. Prices of high-yield bonds tend to be very volatile. These securities are less liquid than investment-grade debt securities and may be difficult to price or sell, particularly in times of negative sentiment toward high-yield securities.
| k. | Illiquid Securities Risk |
The Funds may invest in Underlying Funds that hold illiquid securities. Illiquid securities are assets which may not be sold or disposed of in the ordinary course of business within seven days at approximately the price at which the Underlying Fund has valued the investment on its books and may include such securities as those not registered under U.S. securities laws or securities that cannot be sold in public transactions. An inability to sell a portfolio position can adversely affect the Underlying Fund’s value or prevent the Underlying Fund from being able to take advantage of other investment opportunities. Illiquid securities and relatively less liquid securities may also be difficult to value. Over recent years, the capacity of dealers to make markets in fixed income securities have been outpaced by the growth in the size of the fixed income markets. Liquidity risk may be magnified in a rising interest rate environment or when investor redemptions from fixed income funds may be higher than normal, due to the increased supply in the market that would result from selling activity.
| l. | Impact of Large Redemptions and Purchases of Underlying Fund Shares |
Occasionally, shareholders of an Underlying Fund may make large redemptions or purchases of the Underlying Fund’s shares, which may cause the Underlying Fund to have to sell securities or invest additional cash. These transactions may adversely affect the Underlying Fund’s performance and increase transaction costs to Underlying Fund shareholders, including the Fund. In addition, large redemption requests may exceed the cash balance of the Underlying Fund and result in credit line borrowing fees and/or overdraft charges to the Underlying Fund until the sale of portfolio securities to cover the redemption request settles. For additional information on redemptions, please see the Statement of Changes in Net Assets.
| m. | Interest Rate Risk |
Certain Funds invest in underlying Funds that involve interest rate risk. Fixed income investments are subject to interest rate risk, which generally causes the value of a fixed income portfolio to decrease when interest rates rise resulting in a decrease in the Underlying Fund’s, and possibly a Fund’s, net assets. An Underlying Fund may be subject to a greater risk of rising interest rates due to the current period of historically low rates and the effect of potential government fiscal policy initiatives and resulting market reaction to those initiatives. Interest rate fluctuations tend to have a greater impact on fixed income securities with a greater time to maturity and/or lower coupon. In periods of market volatility, the market values of fixed income securities may be more sensitive to changes in interest rates.
| n. | Issuer Risk |
The value of a security may decline for reasons directly related to the issuer, such as management performance, financial leverage and reduced demand for the issuer’s goods or service.
| o. | Market Risk |
Deteriorating market conditions might cause a general weakness in the market that reduces the prices of securities in that market in which an Underlying Fund invests.
| p. | Mid-Cap Securities Risk |
A Fund may invest in Underlying Funds that hold mid-cap securities. Securities of medium-sized companies tend to be more volatile and less liquid than securities of larger companies.
| q. | Real Estate Investment Trusts (“REIT”) and Real Estate Risk |
The Funds may invest in Underlying Funds that are subject to REIT and Real Estate Risk. Investment in REITs and real estate involves the risks that are associated with direct ownership of real estate and with the real estate industry in general. These risks include risks related to
| 40 | Annual Report 2017 |
Notes to Financial Statements (continued)
October 31, 2017
general, regional and local economic conditions; fluctuations in interest rates; property tax rates, zoning laws, environmental regulations and other governmental action; cash flow dependency; increased operating expenses; lack of availability of mortgage funds; losses due to natural disasters; changes in property values and rental rates; and other factors.
| r. | Sector Risk |
At times, a Fund may have a significant portion of its assets invested in Underlying Funds that invest primarily in securities of companies conducting business in a broadly related group of industries within an economic sector. Companies in the same economic sector may be similarly affected by economic or market events, making a Fund more vulnerable to unfavorable developments in that economic sector than funds that invest more broadly.
| s. | Short Sale Risk |
The Funds may invest in Underlying Funds that sell securities short. Short Sale risk is the risk that the price of a security sold short will increase in value between the time of the short sale and the time the Underlying Fund must purchase the security to return it to the lender. The Underlying Fund’s potential loss on a short sale could theoretically be unlimited in a case where the Underlying Fund is unable, for whatever reason, to close out its short position.
| t. | Small-Cap Securities Risk |
The Funds may invest in Underlying Funds that hold small-cap securities. Securities of smaller companies are usually less stable in price and less liquid than larger, more established companies. Therefore, they generally involve greater risk. If the value of a Fund’s investment decrease, you may lose money.
| u. | Valuation Risk |
The price that an Underlying Fund could receive upon the sale of any particular portfolio investment may differ from the Underlying Fund’s valuation of the investment, particularly for securities that trade in thin or volatile markets or that are valued using a fair valuation methodology or a price provided by an independent pricing service. As a result, the price received upon the sale of an investment may be less than the value ascribed by the Underlying Fund, and the Underlying Fund could realize a greater than expected loss or lesser than expected gain upon the sale of the investment. An Underlying Fund’s ability to value its investments may also be impacted by technological issues and/or errors by pricing services or other third-party service providers.
Please read the prospectus for more detailed information regarding these and other risks.
6. Contingencies
In the normal course of business, the Funds may provide general indemnifications pursuant to certain contracts and organizational documents. The Funds’ maximum exposure under these arrangements is dependent on future claims that may be made against the Funds, and therefore, cannot be estimated; however, based on experience, the risk of loss from such claims is considered remote.
7. Tax Information
As of October 31, 2017, the tax cost of securities and the breakdown of unrealized appreciation/(depreciation) for each Fund were as follows:
| Tax Cost of Securities | Unrealized Appreciation | Unrealized Depreciation | Net Unrealized Appreciation/ (Depreciation) | |||||||||||||
Diversified Alternatives Fund | $ | 41,480,780 | $ | 894,381 | $ | (506,347 | ) | $ | 388,034 | |||||||
Diversified Income Fund | 17,473,834 | 1,351,501 | (91,472 | ) | 1,260,029 | |||||||||||
Dynamic Allocation Fund | 14,481,734 | 1,126,553 | (13,788 | ) | 1,112,765 | |||||||||||
| 2017 Annual Report | 41 |
Notes to Financial Statements (continued)
October 31, 2017
The tax character of distributions paid during the fiscal year ended October 31, 2017 was as follows (total distributions paid may differ from the Statements of Changes in Net Assets because for tax purposes dividends are recognized when actually paid):
| Distributions paid from | ||||||||||||||||||||||||
| Fund | Ordinary Income | Net Long Term Capital Gains | Total Taxable Distributions | Tax Exempt Distributions | Return of Capital | Total Distributions Paid | ||||||||||||||||||
Diversified Alternatives Fund | $ | 367,697 | $ | – | $ | 367,697 | $ | – | $ | – | $ | 367,697 | ||||||||||||
Diversified Income Fund | 504,297 | – | 504,297 | – | – | 504,297 | ||||||||||||||||||
Dynamic Allocation Fund | 328,192 | – | 328,192 | – | – | 328,192 | ||||||||||||||||||
Amounts listed as “–” are $0 or round to $0.
The tax character of distributions paid during the fiscal year ended October 31, 2016 was as follows (total distributions paid may differ from the Statements of Changes in Net Assets because for tax purposes dividends are recognized when actually paid):
| Distributions paid from | ||||||||||||||||||||||||
| Fund | Ordinary Income | Net Long Term Capital Gains | Total Taxable Distributions | Tax Exempt Distributions | Return of Capital | Total Distributions Paid | ||||||||||||||||||
Diversified Alternatives Fund | $ | 1,457,493 | $ | – | $ | 1,457,493 | $ | – | $ | – | $ | 1,457,493 | ||||||||||||
Diversified Income Fund | 488,373 | 186,533 | 674,906 | – | – | 674,906 | ||||||||||||||||||
Dynamic Allocation Fund | 355,975 | 25,020 | 380,995 | – | – | 380,995 | ||||||||||||||||||
As of October 31, 2017, the components of accumulated earnings/(deficit) on a tax basis were as follows:
| Fund | Undistributed Tax Exempt Income | Undistributed Ordinary Income | Undistributed Long-Term Capital Gains | Accumulated Earnings | Distributions Payable | Late Year Ordinary and Post- October Capital Loss Deferrals | Other Temporary Differences | Unrealized Appreciation/ (Depreciation)* | Accumulated Capital and Other Losses** | Total Accumulated Earnings/ (Deficit) | ||||||||||||||||||||||||||||||
Diversified Alternatives Fund | $ | – | $ | 46,804 | $ | – | $ | – | $ | – | $ | – | $ | – | $ | 388,034 | $ | (14,456,207 | ) | $ | (14,021,369 | ) | ||||||||||||||||||
Diversified Income Fund | – | 53,300 | – | – | – | – | – | 1,260,033 | (595,659 | ) | 717,674 | |||||||||||||||||||||||||||||
Dynamic Allocation Fund | – | 25,311 | – | – | – | – | – | 1,112,765 | (144,109 | ) | 993,967 | |||||||||||||||||||||||||||||
| * | The difference between the book-basis and tax-basis unrealized appreciation/(depreciation) is attributable primarily to non-REITs dividend, ROC non-taxable dividend adjustment to income, spinoff adjustment and wash sales. |
| ** | As of October 31, 2017, for Federal income tax purposes, the following Funds have capital loss carryforwards available to offset capital gains, if any, to the extent provided by the Treasury regulations, which expire in the years set forth below. |
Amounts listed as “–” are $0 or round to $0.
| Fund | Amount | Expires | ||||
Diversified Alternatives Fund | $ | 6,953,184 | 2018 (Short-Term) | |||
Diversified Alternatives Fund | 1,084,237 | 2019 (Short-Term) | ||||
Diversified Alternatives Fund | 4,699,137 | Unlimited (Short-Term) | ||||
Diversified Alternatives Fund | 1,719,649 | Unlimited (Long-Term) | ||||
| 42 | Annual Report 2017 |
Notes to Financial Statements (continued)
October 31, 2017
| Fund | Amount | Expires | ||||
Diversified Income Fund | $ | 36,677 | Unlimited (Short-Term) | |||
Diversified Income Fund | 558,982 | Unlimited (Long-Term) | ||||
Dynamic Allocation Fund | 144,109 | 2018 (Short-Term) | ||||
Under the Regulated Investment Company Modernization Act of 2010, the Funds are permitted to carry forward capital losses incurred in taxable years beginning after December 22, 2010 for an unlimited period. However, any losses incurred during those taxable years will be required to be utilized prior to the losses incurred in pre-enactment taxable years. As a result of this ordering rule, pre-enactment capital loss carryforwards may be more likely to expire unused. Additionally, post-enactment capital losses that are carried forward will retain their character as either short-term or long-term capital losses rather than being considered all short-term as under previous law.
GAAP requires that certain components of net assets be adjusted to reflect permanent differences between financial and tax reporting. Accordingly, the table below details the necessary reclassifications, which are a result of permanent differences primarily attributable to expired capital loss carryovers, capital gains distribution reclassification and non-taxable dividend adjustment. These reclassifications have no effect on net assets or NAVs per share.
Fund | Capital | Accumulated | Accumulated | |||||||||
Diversified Alternatives Fund | $ | (10,674,825 | ) | $ | (7,795 | ) | $ | 10,682,620 | ||||
Diversified Income Fund | – | (21,664 | ) | 21,664 | ||||||||
Dynamic Allocation Fund | (448,083 | ) | 21,452 | 426,631 | ||||||||
8. Significant Shareholders
As of October 31, 2017, the following Funds had shareholders with the percentage ownership indicated, which are considered significant shareholders (holdings greater than 5.0%) for financial reporting purposes:
| Fund | Record Ownership % | Number of Account Owners | ||||
Diversified Alternatives Fund | 57.4 | 5 | ||||
Diversified Income Fund | 52.2 | 3 | ||||
Dynamic Allocation Fund | 32.9 | 2 | ||||
9. Line of Credit
The Trust, on behalf of each of the funds of the Trust (the “Borrowers”), has entered into an agreement (the “Agreement”) with State Street Bank and Trust Company (the “Bank”), subject to annual renewal. The Agreement provides for a revolving credit facility (the “Credit Facility”) for the amount of $250,000,000 to be utilized for temporary or emergency purposes to fund shareholder redemptions or other short-term liquidity purposes.
Principal on each outstanding loan made under the Agreement bears interest at a variable rate per annum equal to the higher of (a) the Federal Funds Rate as in effect on that day (not less than zero) plus 1.25% or (b) the One-Month London Interbank Offered Rate as in effect on that day (not less than zero) plus 1.25%. In addition, effective August 11, 2017, the Borrowers shall pay to the Bank a commitment fee at the rate of 0.25% per annum on the daily unused portion of the Credit Facility, as applicable, which is allocated among the Borrowers in such manner as is determined by the Board to be reasonable. During the period November 1, 2016 to August 10, 2017, the commitment fee rate was 0.22% per annum. For each Fund that borrowed under the Credit Facility during the fiscal year ended October 31, 2017, the following table shows the average outstanding daily balance of the days the Fund utilized the Credit Facility and the average weighted interest rate paid by the Fund during the fiscal year ended October 31, 2017.
| Average Outstanding Daily Balance | Average Weighted Interest Rate | Days Utilized | ||||||||||
Diversified Alternatives Fund | $ | 1,500,000 | 1.90 | % | 1 | |||||||
| 2017 Annual Report | 43 |
Notes to Financial Statements (concluded)
October 31, 2017
10. Subsequent Events
Management has evaluated the need for disclosures and/or adjustments resulting from subsequent events through the date the financial statements were issued. Based on this evaluation, no disclosures and/or adjustments were required to the financial statements as of October 31, 2017.
| 44 | Annual Report 2017 |
Report of Independent Registered Public Accounting Firm
The Board of Trustees and Shareholders of Aberdeen Funds:
We have audited the accompanying statements of assets and liabilities, including the statements of investments, of the Aberdeen Diversified Alternatives Fund, Aberdeen Diversified Income Fund, and Aberdeen Dynamic Allocation Fund, three of the funds comprising Aberdeen Funds (the “Funds”), as of October 31, 2017, and the related statements of operations for the year then ended, the statements of changes in net assets for each of the years in the two-year period then ended, and the financial highlights for each of the years in the five-year period then ended. These financial statements and financial highlights are the responsibility of the Funds’ management. Our responsibility is to express an opinion on these financial statements and financial highlights based on our audits.
We conducted our audits in accordance with the standards of the Public Company Accounting Oversight Board (United States). Those standards require that we plan and perform the audit to obtain reasonable assurance about whether the financial statements and financial highlights are free of material misstatement. An audit includes examining, on a test basis, evidence supporting the amounts and disclosures in the financial statements. Our procedures included confirmation of securities owned as of October 31, 2017, by correspondence with the custodian, transfer agent, and brokers or by other appropriate auditing procedures. An audit also includes assessing the accounting principles used and significant estimates made by management, as well as evaluating the overall financial statement presentation. We believe that our audits provide a reasonable basis for our opinion.
In our opinion, the financial statements and financial highlights referred to above present fairly, in all material respects, the financial position of the Funds as of October 31, 2017, the results of their operations for the year then ended, the changes in their net assets for each of the years in the two-year period then ended, and the financial highlights for each of the years in the five-year period then ended, in conformity with U.S. generally accepted accounting principles.

Philadelphia, Pennsylvania
December 28, 2017
| 2017 Annual Report | 45 |
Other Tax Information (Unaudited)
For the period ended October 31, 2017, certain dividends paid by the Funds may be subject to a maximum tax rate of 15% as provided for by the Jobs and Growth Tax Relief Reconciliation Act of 2003. The Funds intend to designate the maximum amount allowable as taxed at a maximum rate of 15%. Complete information will be reported in conjunction with your 2017 Form 1099-DIV.
For the year ended October 31, 2017, the following Funds paid qualified dividend income:
| Fund | Qualified Dividend Income | |||
Diversified Alternatives Fund | 53.99% | |||
Diversified Income Fund | 54.38% | |||
Dynamic Allocation Fund | 57.05% | |||
For the taxable year ended October 31, 2017, the following percentage of income dividends paid by the Funds qualify for the dividends received deduction available to corporate shareholders:
| Fund | Dividend Received Deduction | |||
Diversified Alternatives Fund | 31.49% | |||
Diversified Income Fund | 36.14% | |||
Dynamic Allocation Fund | 29.68% | |||
| 46 | Annual Report 2017 |
Shareholder Expense Examples (Unaudited)
As a shareholder of the Aberdeen Funds, you incur two types of costs: (1) transaction costs, including sales charges (loads) paid on purchase payments and (2) ongoing costs, including investment advisory fees, administration fees, transfer agent out-of-pocket expenses, distribution fees and other Fund expenses. The examples below are intended to help you understand your ongoing costs (in dollars) of investing in the Aberdeen Funds and to compare these costs with the ongoing costs of investing in other mutual funds.
The examples assume that you had a $1,000 investment in the Class at the beginning of the reporting period, May 1, 2017 and continued to hold your shares at the end of the reporting period, October 31, 2017.
Actual Expenses
The table below provides information about actual account values and actual expenses. You may use the information together with the amount you invested, to estimate the expenses that you paid over the period. Simply divide your account value by $1,000 (for example, an $8,600 account value divided by $1,000 = 8.6), then multiply the result by the number under the heading entitled “Actual Expenses Paid During Period” for the class of a Fund that you own to estimate the expenses you paid on your account during the period.
Hypothetical Example for Comparison Purposes
The table below provides information about hypothetical account values and hypothetical expenses based on the Class’ actual expense ratio and an assumed rate of return of 5% per year before expenses, which is not the Class’ actual return. The hypothetical account values and expenses may not be used to estimate the actual ending account balance or expenses you paid for the period. You may use this information to compare the ongoing costs of investing in the Class of a Fund and other funds. To do so, compare the 5% hypothetical example with the 5% hypothetical examples that appear in the shareholder reports of the other funds.
Please note that the expenses shown in the table are meant to highlight your ongoing costs only and do not reflect any transaction costs, such as sales charges (loads). Therefore, the information for each Class in the table is useful in comparing ongoing costs only, and will not help you determine the relative total costs of owning different funds. In addition, if these transaction costs were included, your costs would have been higher. The examples also assume all dividends and distributions have been reinvested.
| Beginning Account Value, May 1, 2017 | Actual Ending Account Value, October 31, 2017 | Hypothetical Ending Account Value | Actual Expenses Paid During Period*+ | Hypothetical Expenses Paid During Period*+1 | Annualized Expense Ratio** | |||||||||||||||||||||
Diversified Alternatives Fund | Class A | $ | 1,000.00 | $ | 1,024.80 | $ | 1,022.13 | $ | 3.11 | $ | 3.11 | 0.61% | ||||||||||||||
Class C | 1,000.00 | 1,021.40 | 1,018.90 | 6.37 | 6.36 | 1.25% | ||||||||||||||||||||
Class R | 1,000.00 | 1,023.00 | 1,020.16 | 5.10 | 5.09 | 1.00% | ||||||||||||||||||||
Institutional Service Class | 1,000.00 | 1,027.40 | 1,024.80 | 0.41 | 0.41 | 0.08% | ||||||||||||||||||||
Institutional Class | 1,000.00 | 1,026.80 | 1,023.95 | 1.28 | 1.28 | 0.25% | ||||||||||||||||||||
Diversified Income Fund | Class A | 1,000.00 | 1,048.50 | 1,022.28 | 2.99 | 2.96 | 0.58% | |||||||||||||||||||
Class C | 1,000.00 | 1,044.30 | 1,018.90 | 6.44 | 6.36 | 1.25% | ||||||||||||||||||||
Class R | 1,000.00 | 1,046.90 | 1,021.27 | 4.02 | 3.97 | 0.78% | ||||||||||||||||||||
Institutional Service Class | 1,000.00 | 1,050.20 | 1,023.95 | 1.29 | 1.28 | 0.25% | ||||||||||||||||||||
Institutional Class | 1,000.00 | 1,049.80 | 1,023.95 | 1.29 | 1.28 | 0.25% | ||||||||||||||||||||
Dynamic Allocation Fund | Class A | 1,000.00 | 1,053.20 | 1,022.28 | 3.00 | 2.96 | 0.58% | |||||||||||||||||||
Class C | 1,000.00 | 1,050.40 | 1,018.90 | 6.46 | 6.36 | 1.25% | ||||||||||||||||||||
Class R | 1,000.00 | 1,052.10 | 1,020.27 | 5.07 | 4.99 | 0.98% | ||||||||||||||||||||
Institutional Service Class | 1,000.00 | 1,055.10 | 1,023.95 | 1.29 | 1.28 | 0.25% | ||||||||||||||||||||
Institutional Class | 1,000.00 | 1,055.30 | 1,023.95 | 1.30 | 1.28 | 0.25% | ||||||||||||||||||||
| * | Expenses are equal to the Fund’s annualized expense ratio multiplied by the average account value over the period multiplied by 184/365 (to reflect the one-half year period). |
| ** | The expense ratio presented represents a six-month, annualized ratio. |
| + | Expenses are based on the direct expenses of the Fund and do not include the effect of the Underlying Funds’ expenses, which are disclosed in the Fee and expense table and described more fully in a footnote to that table in your Fund Prospectus. |
| 1 | Represents the hypothetical 5% return before expenses. |
| 2017 Annual Report | 47 |
Supplemental Information (Unaudited)
Board of Trustees’ Consideration of Advisory Agreements
At an in-person meeting of the Board of Trustees (the “Board” or the “Trustees”) of the Aberdeen Funds (the “Trust”) held on June 14, 2017, the Board, including a majority of the Trustees who are not considered to be “interested persons” of the Trust (the “Independent Trustees”) under the Investment Company Act of 1940, as amended (the “1940 Act”), approved for an annual period the continuation of the Trust’s advisory agreement (the “Agreement”) with Aberdeen Asset Management Inc. (“AAMI” or the “Advisor”) for each of the following series of the Trust: Aberdeen Diversified Alternatives Fund, Aberdeen Diversified Income Fund and Aberdeen Dynamic Allocation Fund (each a “Fund,” and collectively the “Funds”).
In connection with contract review meetings, the Board reviews a variety of information provided by the Adviser relating to the Funds, the Agreements and the Adviser, including comparative performance, fee and expense information and other information regarding the nature, extent and quality of services provided by the Adviser under their respective Agreements. The materials provided to the Board generally included, among other items: (i) information on the investment performance of the Funds and the performance of peer groups of funds and the Funds’ performance benchmarks; (ii) information on the Funds’ advisory fees and other expenses, including information comparing each Fund’s expenses to those of a peer group of funds and information about any applicable expense limitations and fee “breakpoints”; (iii) sales and redemption data with respect to each Fund; (iv) information about the profitability of the Agreement to the Adviser; (v) a report prepared by the Adviser in response to a request submitted by the Independent Trustees’ independent legal counsel on behalf of such Trustees; and (vi) a memorandum from the Independent Trustees’ independent legal counsel on the responsibilities of the Board of Trustees in considering for approval the investment advisory arrangements under the 1940 Act and Delaware law. The Board of Trustees, including the Independent Trustees, also considers other matters such as: (i) the Adviser’s financial results and financial condition; (ii) each Fund’s investment objective and strategies; (iii) the Adviser’s investment personnel and operations; (iv) arrangements relating to the distribution of the Funds’ shares and the related costs; (v) the procedures employed to determine the value of the Funds’ assets; (vi) the allocation of the Funds’ brokerage, if any, including, if applicable, allocations to brokers affiliated with the Adviser and the use, if any, of “soft” commission dollars to pay Fund expenses and to pay for research and other similar services; (vii) the resources devoted to, and the record of compliance with, the Funds’ investment policies and restrictions, policies on personal securities transactions and other compliance policies; and (viii) possible conflicts of interest. The Board also considers the nature, extent and quality of the services provided to the Funds by AAMI’s affiliates. Throughout the process, the Trustees are afforded the opportunity to ask questions of and request additional materials from AAMI.
In addition to the materials requested by the Trustees in connection with their annual consideration of the continuation of the Agreement, the Trustees receive materials in advance of each regular quarterly meeting of the Board that provide information relating to the services provided by the Adviser, including detailed information about the Funds’ investment performance. This information generally includes, among other things, third-party performance rankings for various periods (including prior to the Adviser’s management of the Funds) comparing each Fund against its peer group, total return information for various periods, and details of sales and redemptions of Fund shares for the period. The Board also receives periodic presentations from the portfolio management teams in connection with the performance of the Funds.
The Independent Trustees were advised by separate independent legal counsel throughout the process. The Independent Trustees also consulted in executive sessions with counsel to the Independent Trustees regarding consideration of the renewal of the Agreement. In considering whether to approve the continuation of the Agreement, the Board of Trustees, including the Independent Trustees, did not identify any single factor as determinative. Individual Trustees may have evaluated the information presented differently from one another, giving different weights to various factors. Matters considered by the Trustees, including the Independent Trustees, in connection with their approval of the continuation of the Agreement included the factors listed below.
The nature, extent and quality of the services provided to the Funds under the Agreement. The Trustees considered the nature, extent and quality of the services provided by AAMI to the Funds and the resources dedicated to the Funds by AAMI and its affiliates. The Board considered, among other things, the Adviser’s investment experience. The Board also considered the background and experience of the Adviser’s senior management personnel and the qualifications, background and responsibilities of the portfolio managers that are primarily responsible for the day-to-day portfolio management services for the Funds. The Trustees considered not only the advisory services provided by AAMI to the Funds, but also the administrative services provided by AAMI to the Funds under a separate administration agreement. AAMI’s role in coordinating the activities of the Trust’s other service providers was also considered. The Board also considered that it receives information on a regular basis from the Trust’s Chief Compliance Officer regarding the Adviser’s compliance policies and procedures. The Board also considered the Adviser’s risk management processes. The Board was also mindful of the Adviser’s focus on the monitoring of the performance of the Funds and in addressing performance matters. The Trustees also considered the benefits to shareholders of investing in a mutual fund that is part of a family of funds that offers shareholders the right to exchange shares of one type of fund for shares of another type of fund, and provides a variety of fund and shareholder services. The Board also took into account its knowledge of management and the quality of the performance of management’s duties through Board meetings, discussion and reports during the preceding year.
| 48 | Annual Report 2017 |
Supplemental Information (Unaudited) (continued)
After reviewing these and related factors, the Board concluded that they were satisfied with the nature, extent and quality of the services provided and supported the renewal of the Agreement.
Investment performance of the Funds and the Adviser. The Trustees received information about the performance of the Funds over various time periods, including information which compared the performance of the Funds to the performance of peer groups of funds and each Fund’s performance benchmark. The Trustees also considered the performance of the Funds compared to the performance of comparable funds or accounts managed by AAMI and its affiliates to the extent available. In addition, the Trustees also reviewed data prepared by an independent third party which analyzed the performance of the Funds using a variety of performance metrics.
The Trustees also considered AAMI’s performance and reputation generally, the performance of the fund family generally, the historical responsiveness of AAMI to Trustee concerns about performance and the willingness of AAMI to take steps intended to improve performance. The Trustees also considered the performance of the Adviser since it commenced management of the Funds.
Based on these factors, the Board determined that the Adviser is an appropriate investment adviser for the Funds.
The Board further noted that it will continue to monitor the Funds’ performance and any actions taken by AAMI and its affiliates relating to performance.
The costs of the services provided and profits realized by the Adviser and its affiliates from their relationships with the Funds. The Trustees considered the fees charged to the Funds for advisory services as well as the total expense levels of the Funds. This information included comparisons (provided both by management and also by an independent third party) of each Fund’s net management fee and total expense level to those of its expense peer group and information about the advisory fees charged by AAMI to any separately managed accounts with a similar strategy. In comparing each Fund’s net management fee to that of comparable funds, the Board noted that such fee includes both advisory and administrative fees. In considering the fees charged to any comparable accounts, the Trustees considered, among other things, management’s discussion of the different objectives, policies or restrictions that may be involved in managing the different types of accounts. In evaluating the Funds’ advisory fees, the Trustees also took into account the demands, complexity and quality of the investment management of the Funds.
The Board also considered that AAMI had entered into expense limitation agreements with the Funds, pursuant to which AAMI agreed to waive a portion of its advisory fee and/or reimburse certain expenses as a means of limiting each Fund’s total annual operating expenses for a period of time.
The Trustees also considered the compensation directly or indirectly received by AAMI and its affiliates from their relationships with the Funds. The Trustees reviewed information provided by management as to the profitability of AAMI and its affiliates’ relationships with the Funds, such as the engagement of affiliates of AAMI to provide distribution and administrative services to the Funds. The Trustees also examined the profitability of AAMI and its affiliates on a Fund-by-Fund basis. The Trustees also considered information about the allocation of expenses used to calculate profitability. When reviewing profitability, the Trustees also considered information about court cases regarding adviser profitability, the performance of the Funds, the expense levels of the Funds, and whether AAMI had implemented breakpoints and expense limitations with respect to the Funds.
After reviewing these and related factors, including taking into account management’s discussion regarding Fund expenses, the Board concluded that the advisory fee was fair and reasonable, and that the costs of these services generally and the related profitability of AAMI and its affiliates from their relationships with the Funds were reasonable and supported the renewal of the Agreement.
Economies of Scale. The Trustees considered the existence of any economies of scale in the provision of services by AAMI and whether those economies would be shared with the Funds through breakpoints in the investment advisory fees or other means, such as expense waivers or limitations. The Trustees noted that each of the Funds was subject to an expense limitation. The Board noted management’s discussion of the Funds’ advisory fee structure. The Trustees also took note of the costs of the services provided and the profitability to AAMI and its affiliates from their relationships with the Funds, as discussed above. The Board also considered the potential effect of each Fund’s growth and size on fees, noting that if a Fund’s assets increase over time, the Fund may realize other economies of scale if assets increase proportionally more than certain expenses.
After reviewing these and related factors, the Board concluded that the advisory fee was reasonable and supported the renewal of the Agreement.
The Trustees also considered other factors, which included but were not limited to the following:
| • | the effect of any market and economic volatility on the performance, asset levels and expense ratios of the Funds. |
| 2017 Annual Report | 49 |
Supplemental Information (Unaudited) (concluded)
| • | whether the Funds have operated in accordance with their investment objectives and the Funds’ record of compliance with their investment restrictions, and the compliance programs of the Trust and AAMI. The Trustees also considered the compliance-related resources AAMI and its affiliates were providing to the Funds. |
| • | the nature, quality, cost and extent of administrative services performed by AAMI under the Agreement and under a separate agreement covering administrative services. |
| • | so-called “fallout benefits” to AAMI, such as the benefits of research made available to AAMI by reason of brokerage commissions generated by the Funds’ securities transactions or reputational and other indirect benefits. The Trustees considered any possible conflicts of interest associated with these fallout and other benefits, and the reporting, disclosure and other processes in place to disclose and monitor such possible conflicts of interest. |
* * *
Based on their evaluation of all factors that they deemed to be material, including those factors described above, and assisted by the advice of independent counsel, the Trustees, including the Independent Trustees, concluded that renewal of the Agreement would be in the best interest of each of the Funds and its shareholders. Accordingly, the Board, and the Independent Trustees voting separately, approved the Agreement for an additional one-year period.
| 50 | Annual Report 2017 |
Management of the Funds (Unaudited)
As of October 31, 2017
Board of Trustees and Officers of the Trust
Trustees Who are Not Interested Persons (as Defined in the 1940 Act) of the Trust
| Name, Address, and Year of Birth | Position(s) Held, Length of Time Served and Term of Office* | Principal Occupation During Past 5 Years | Number of Portfolios in Fund Complex Overseen by Trustee** | Other Directorships Held by Trustee During Past 5 Years*** | ||||
(“Independent Trustees”) | ||||||||
P. Gerald Malone**** Year of Birth: 1950 | Trustee since December 2007 Chairman of the Board | Mr. Malone is, by profession, a solicitor of some 40 years standing. He has served as a Minister of State in the United Kingdom Government. Mr. Malone currently serves as Independent Chairman of two UK companies, Crescent OTC Ltd (pharmaceutical services) and fluidOil Ltd. (oil services). He also serves as a director of Aberdeen Asia-Pacific Income Investment Company Limited (Canadian investment fund) since 2001. He is Chairman of the Board of Trustees of Aberdeen Funds and Chairman of the Board of Directors of Aberdeen Global Income Fund, Inc. and Aberdeen Asia-Pacific Income Fund, Inc. He previously served as chairman of Ultrasis plc (healthcare software services company) until October 2014 and director of US company Rejuvenan llc (wellbeing services) until September 2017. | 22 | None. | ||||
Richard H. McCoy**** Year of Birth: 1942 | Trustee since December 2007 | Prior to retiring in 2003, Mr. McCoy was Vice-Chairman, Investment Banking, at TD Securities Inc. He is currently a Director of Uranium Participation Corp. and Pizza Pizza Royalty Corp. and Chair of Chorus Aviation Inc. Mr. McCoy has also been Chairman of Aberdeen Asia-Pacific Income Investment Company Limited since 2010. | 18 | None. | ||||
Neville J. Miles**** Year of Birth: 1946 | Trustee since December 2011 | Mr. Miles is, and has been for over ten years, Chairman of Ballyshaw Pty. Ltd. (share trading, real estate development and investment). He is Chairman of the Board of Directors of Aberdeen Australia Equity Fund, Inc. He also is a non-executive director of a number of Australian and overseas companies. | 21 | None. | ||||
Rahn K. Porter**** Year of Birth: 1954 | Trustee since September 2016 | Mr. Porter has been the Chief Financial Officer of The Colorado Health Foundation since 2013. Previously, he was the Interim Chief Executive Officer of the Colorado Health Foundation from 2014 to 2015 and was Senior Vice President and Treasurer, Qwest Communications International Inc. (telecommunications) from 2008 to 2011. | 20 | Director, CenturyLink Investment Management Company, since 2006; Director, BlackRidge Financial Inc., since March, 2005. | ||||
| 2017 Annual Report | 51 |
Management of the Funds (Unaudited) (continued)
As of October 31, 2017
| Name, Address, and Year of Birth | Position(s) Held, Length of Time Served and Term of Office* | Principal Occupation During Past 5 Years | Number of Portfolios in Fund Complex Overseen by Trustee** | Other Directorships Held by Trustee During Past 5 Years*** | ||||
Steven N. Rappaport**** Year of Birth: 1948 | Trustee since September 2016 | Mr. Rappaport has been a Partner of Lehigh Court, LLC (private investment firm) and RZ Capital LLC (private investment firm) since 2004. | 23 | Director of iCAD, Inc., since 2006; Director of Credit Suisse Funds (9) since 1999; Director of Credit Suisse Asset Management Income Fund, Inc. since 2005 and Director of Credit Suisse High Yield Bond Fund, Inc. since 2005. | ||||
Peter D. Sacks**** Year of Birth: 1945 | Trustee since December 2007 | Mr. Sacks was a Director and Founding Partner of Toron AMI International Asset Management (investment management) from 1988 to 2015. He is currently a Director of Aberdeen Asia-Pacific Income Fund Inc., Aberdeen Global Income Fund Inc., Aberdeen Australia Equity Fund Inc. and Tricon Capital Group Inc. | 21 | None. | ||||
John T. Sheehy**** Year of Birth: 1942 | Trustee since December 2007 | Mr. Sheehy has been a Senior Managing Director of B.V. Murray and Company (investment banking) since 2001 and Director of Macquarie AIR-serv Holding, Inc. (automotive services) from 2006 to 2013. He was a Managing Member of Pristina Capital Partners, LLC (water purification technology development) from 2007 to 2011 and a Director of Smarte Carte, Inc. (airport services) from 2007 to 2010. He has been a Director of Aberdeen Asia-Pacific Income Investment Company Limited (Canadian investment fund) since 1986. | 21 | None. | ||||
Warren C. Smith**** Year of Birth: 1955 | Trustee since December 2007 | Mr. Smith has been a founding partner of MRB Partners Inc. (independent investment research and consultancy firm) since 2010. He has been a Director of Aberdeen Asia-Pacific Income Investment Company Limited (Canadian investment fund) since 1993. Mr. Smith was a Managing Editor with The Bank Credit Analyst Research Group (independent publishers of financial market research and publications, including The Bank Credit Analyst) from 1982 to 2009. | 18 | None. |
| 52 | Annual Report 2017 |
Management of the Funds (Unaudited) (continued)
As of October 31, 2017
| Name, Address, and Year of Birth | Position(s) Held, Length of Time Served and Term of Office* | Principal Occupation During Past 5 Years | Number of Portfolios in Fund Complex Overseen by Trustee** | Other Directorships Held by Trustee During Past 5 Years*** | ||||
(“Interested Trustees”) | ||||||||
Martin Gilbert****† Year of Birth: 1955 | Trustee since December 2007 | Mr. Gilbert is a founding director and shareholder, and Chief Executive of Aberdeen Asset Management PLC, the holding company of the fund management group that was established in 1983 (“Aberdeen Group”). He was a Director (1991–2014) of Aberdeen Asset Management Asia Limited and a Director (2000–2014) of Aberdeen Asset Management Limited. He was a Director (1995–2014) and was President (September 2006–2014) of Aberdeen Asset Management Inc. Mr. Gilbert also serves as officer and/or director of various Aberdeen Group subsidiary companies, Aberdeen-managed investment trusts and funds’ boards. | 22 | None. | ||||
| * | Each Trustee holds office for an indefinite term until his successor is elected and qualified. |
| ** | The Aberdeen Fund Complex consists of the Trust which currently consists of 18 portfolios, Aberdeen Asia-Pacific Income Fund, Inc., Aberdeen Global Income Fund, Inc., Aberdeen Australia Equity Fund, Inc., Aberdeen Chile Fund, Inc., Aberdeen Israel Fund, Inc., Aberdeen Indonesia Fund, Inc., Aberdeen Latin America Equity Fund, Inc., Aberdeen Emerging Markets Smaller Company Opportunities Fund, Inc., Aberdeen Singapore Fund, Inc., The Asia Tigers Fund, Inc., The India Fund, Inc., Aberdeen Greater China Fund, Inc., Aberdeen Japan Equity Fund, Inc., Aberdeen Income Credit Strategies Fund and Aberdeen Investment Funds, which currently consists of 4 portfolios. |
| *** | Directorships held in (1) any other investment companies registered under the 1940 Act, (2) any company with a class of securities registered pursuant to Section 12 of the Securities Exchange Act of 1934, as amended (the “Exchange Act”) or (3) any company subject to the requirements of Section 15(d) of the Exchange Act. |
| **** | Each Trustee may be contacted by writing to the Trustee c/o Aberdeen Asset Management Inc., 1735 Market Street, 32nd Floor, Philadelphia, Pennsylvania 19103, Attn: Alan Goodson. |
| † | Mr. Gilbert is considered to be an “interested person” of the Trust as defined in the 1940 Act because of his affiliation with the Adviser. |
| 2017 Annual Report | 53 |
Management of the Funds (Unaudited) (continued)
As of October 31, 2017
Officers of the Trust
| Name, Address, and Year of Birth | Position(s) Held, Length of Time Served and Term of Office* | Principal Occupation During Past 5 Years | ||
Bev Hendry** Aberdeen Asset Management Inc. 1735 Market Street 32nd Floor Philadelphia, PA 19103 Year of Birth: 1953 | President, Chief Executive Officer and Principal Executive Officer (Since September 2014) | Currently, CEO–Americas and Director at Aberdeen Asset Management Inc. He previously held the position of Co-Head of Americas. Mr. Hendry is also Vice President of Aberdeen Fund Distributors LLC. Mr. Hendry first joined Aberdeen at its headquarters in Scotland in 1987 where he set up Aberdeen’s mutual fund business. He moved to the United States in 1995 to establish Aberdeen’s business in the Americas based out of Fort Lauderdale. Mr. Hendry left Aberdeen in 2008 when the company moved to consolidate its headquarters in Philadelphia. Mr. Hendry re-joined Aberdeen in 2014 from Hansberger Global Investors in Fort Lauderdale, Florida, where he worked for six years as Chief Operating Officer. Bev is a Chartered Accountant and graduated with an MA in Economics from the University of Aberdeen. | ||
Jeffrey Cotton** Aberdeen Asset Management Inc. 1735 Market Street 32nd Floor Philadelphia, PA 19103 Year of Birth: 1977 | Vice President and Chief Compliance Officer (Since March 2011) | Currently, Director, Vice President, Head of International Compliance and Head of Compliance–Americas for Aberdeen Asset Management Inc. Mr. Cotton is also Vice President of Aberdeen Fund Distributors LLC. Mr. Cotton joined Aberdeen in 2010. Prior to joining Aberdeen, Mr. Cotton was a Senior Compliance Officer at Old Mutual Asset Management (2009-2010) supporting its affiliated investment advisers and mutual fund platform. Mr. Cotton was also a Vice President and Senior Compliance Manager at Bank of America/Columbia Management (2006-2009). | ||
Joseph Andolina** Aberdeen Asset Management Inc. 1735 Market Street 32nd Floor Philadelphia, PA 19103 Year of Birth: 1978 | Vice President–Compliance (Since March 2017) | Currently, Vice President, Deputy Head of Compliance–Americas & U.S. Counsel for Aberdeen Asset Management Inc. In this capacity, Mr. Andolina takes a lead role in the management and implementation of the U.S. Compliance Program and supports the group globally on SEC-related matters. Prior to joining the Compliance Department, he was a member of Aberdeen’s Legal Department, where he served as U.S. Counsel and worked primarily on matters relating to Aberdeen’s registered funds. Before joining Aberdeen in 2012, Mr. Andolina was an associate at Drinker Biddle & Reath LLP in Philadelphia where he worked in the firm’s Investment Management Group. |
| 54 | Annual Report 2017 |
Management of the Funds (Unaudited) (continued)
As of October 31, 2017
| Name, Address, and Year of Birth | Position(s) Held, Length of Time Served and Term of Office* | Principal Occupation During Past 5 Years | ||
Andrea Melia** Aberdeen Asset Management Inc. 1735 Market Street 32nd Floor Philadelphia, PA 19103 Year of Birth: 1969 | Treasurer, Chief Financial Officer, and Principal Accounting Officer (Since September 2009) | Currently, Vice President and Head of Fund Operations, Traditional Assets–Americas for Aberdeen Asset Management Inc. (since 2009). Prior to joining Aberdeen, Ms. Melia was Director of Fund Administration and accounting oversight for Princeton Administrators LLC, a division of BlackRock Inc. and had worked with Princeton Administrators since 1992. | ||
Megan Kennedy** Aberdeen Asset Management Inc. 1735 Market Street 32nd Floor Philadelphia, PA 19103 Year of Birth: 1974 | Secretary and Vice President (Since September 2009) | Currently, Head of Product Management for Aberdeen Asset Management Inc. Ms. Kennedy joined Aberdeen Asset Management Inc. in 2005 as a Senior Fund Administrator. Ms. Kennedy was promoted to Assistant Treasurer Collective Funds/North American Mutual Funds in February 2008 and promoted to Treasurer Collective Funds/North American Mutual Funds in July 2008. | ||
Lucia Sitar** Aberdeen Asset Management Inc. 1735 Market Street 32nd Floor Philadelphia, PA 19103 Year of Birth: 1971 | Vice President (Since December 2008) | Currently, Vice President and Managing U.S. Counsel for Aberdeen Asset Management Inc. Ms. Sitar joined Aberdeen Asset Management Inc. in July 2007. | ||
Brad Crombie Aberdeen Asset Management Bow Bells House 1 Bread Street London EC4M 9HH Year of Birth: 1970 | Vice President (Since June 2013) | Currently, Global Head of Fixed Income for Aberdeen Asset Management PLC. Mr. Crombie re-joined Aberdeen in 2012. Prior to re-joining Aberdeen, Mr. Crombie was a Managing Director at Bank of America Merrill Lynch for the bank’s non-financial corporate and high yield credit research team for the Europe, Middle East and Africa region from 2003 to 2012. | ||
Alan Goodson** Aberdeen Asset Management Inc. 1735 Market Street 32nd Floor Philadelphia, PA 19103 Year of Birth: 1974 | Vice President (Since March 2009) | Currently, Director, Vice President and Head of Product–U.S. for Aberdeen Asset Management Inc., overseeing Product Management and Product Development for Aberdeen’s registered and unregistered investment companies in the U.S. and Canada. Mr. Goodson is Director and Vice President of Aberdeen Asset Management Inc. and joined Aberdeen in 2000. | ||
Adam McCabe** Aberdeen Asset Management Asia Limited 21 Church Street #01-01 Capital Square Two Singapore 049480 Year of Birth: 1979 | Vice President (Since March 2010) | Currently, Head of Asian Fixed Income on the Fixed Income–Asia Pacific desk, responsible for currency and interest rate strategies in Aberdeen’s Asian fixed income portfolios. Mr. McCabe joined Aberdeen in 2009 following the acquisition of certain asset management businesses from Credit Suisse. Mr. McCabe worked for Credit Suisse since 2001, where he was an investment manager responsible for the development and implementation of its Asian currency and interest rate strategies. |
| 2017 Annual Report | 55 |
Management of the Funds (Unaudited) (concluded)
As of October 31, 2017
| Name, Address, and Year of Birth | Position(s) Held, Length of Time Served and Term of Office* | Principal Occupation During Past 5 Years | ||
Jennifer Nichols** Aberdeen Asset Management Inc. 1735 Market Street 32nd Floor Philadelphia, PA 19103 Year of Birth: 1978 | Vice President (Since December 2007) | Currently, Global Head of Legal for Aberdeen Asset Management PLC. Director and Vice President for Aberdeen Asset Management Inc. (since October 2006). | ||
Hugh Young** Aberdeen Asset Management Asia Limited 21 Church Street #01-01 Capital Square Two Singapore 049480 Year of Birth: 1958 | Vice President (Since June 2011) | Currently, Managing Director of Aberdeen Asset Management Asia Limited (since 1991) and member of the Executive Management Committee and Director of Aberdeen Asset Management PLC (since 1991 and 2011, respectively). Mr. Young joined Aberdeen in 1991. | ||
Brian O’Neill** Aberdeen Asset Management Inc. 1735 Market Street 32nd Floor Philadelphia, PA 19103 Year of Birth: 1968 | Assistant Treasurer (Since September 2008) | Currently, Senior Fund Administration Manager–U.S. for Aberdeen Asset Management Inc. Mr. O’Neill joined Aberdeen Asset Management Inc. in 2008. Prior to joining Aberdeen Asset Management Inc., Mr. O’Neill was a Director of Fund Accounting with Nationwide Funds Group (2002-2008). | ||
Eric Olsen** Aberdeen Asset Management Inc. 1735 Market Street 32nd Floor Philadelphia, PA 19103 Year of Birth: 1970 | Assistant Treasurer (Since December 2013) | Currently, Deputy Head of Fund Administration–U.S. for Aberdeen Asset Management Inc. Mr. Olsen joined Aberdeen Asset Management Inc. in August 2013. Prior to joining Aberdeen Asset Management Inc., Mr. Olsen was a Director of Financial Reporting for BNY Mellon Asset Servicing and had worked with BNY Mellon since 1998. | ||
Andrew Kim** Aberdeen Asset Management Inc. 1735 Market Street 32nd Floor Philadelphia, PA 19103 Year of Birth: 1983 | Assistant Secretary (Since March 2017) | Currently, Product Manager for Aberdeen Asset Management Inc. He joined Aberdeen in August 2013. Prior to Aberdeen, he worked at Weil, Gotshal & Manges LLP as a litigation paralegal. | ||
Stephen Varga** Aberdeen Asset Management Inc. 1735 Market Street 32nd Floor Philadelphia, PA 19103 Year of Birth: 1985 | Assistant Secretary (Since March 2017) | Currently, Product Manager for Aberdeen Asset Management Inc. Mr. Varga joined Aberdeen in 2011, where he worked for the U.S. Operations Team. He joined the Product Management team in June of 2013. Previously, he worked at SEI Investments as a Senior Fund Accountant. |
| * | Each officer holds office for an indefinite term at the pleasure of the Board of Trustees and until his or her successor is elected and qualified. |
| ** | Mr. Hendry, Ms. Melia, Ms. Kennedy, Mr. Goodson, Ms. Nichols, Mr. Cotton, Mr. McCabe, Mr. Young, Ms. Sitar, Mr. Andolina, Mr. Olsen, Mr. O’Neill, Mr. Kim and Mr. Varga hold officer position(s) in one or more of the following: Aberdeen Asia-Pacific Income Fund, Inc., Aberdeen Australia Equity Fund, Inc., Aberdeen Global Income Fund, Inc., Aberdeen Chile Fund, Inc., Aberdeen Israel Fund, Inc., Aberdeen Indonesia Fund, Inc., Aberdeen Latin America Equity Fund, Inc., Aberdeen Emerging Markets Smaller Company Opportunities Fund, Inc., Aberdeen Singapore Fund, Inc., The Asia Tigers Fund, Inc., The India Fund, Inc., Aberdeen Greater China Fund, Inc., Aberdeen Japan Equity Fund, Inc. and Aberdeen Investment Funds (consisting of 4 portfolios), each of which may also be deemed to be a part of the same “Fund Complex” as the Trust. |
| 56 | Annual Report 2017 |
Management Information
Trustees
P. Gerald Malone, Chairman
Martin J. Gilbert
Richard H. McCoy
Neville J. Miles
Rahn K. Porter
Steven N. Rappaport
Peter D. Sacks
John T. Sheehy
Warren C. Smith
Officers
Bev Hendry, President and Chief Executive Officer
Jeffrey Cotton, Chief Compliance Officer and Vice President
Joseph Andolina, Vice President - Compliance
Andrea Melia, Treasurer and Chief Financial Officer
Megan Kennedy, Secretary and Vice President
Brad Crombie, Vice President
Lucia Sitar, Vice President
Alan Goodson, Vice President
Adam McCabe, Vice President
Jennifer Nichols, Vice President
Hugh Young, Vice President
Eric Olsen, Assistant Treasurer
Brian O’Neill, Assistant Treasurer
Andrew Kim, Assistant Secretary
Stephen Varga, Assistant Secretary
Investment Manager
Aberdeen Asset Management Inc.
1735 Market Street, 32nd Floor
Philadelphia, PA 19103
Fund Administrator
Aberdeen Asset Management Inc.
1735 Market Street, 32nd Floor
Philadelphia, PA 19103
Transfer Agent
Boston Financial Data Services, Inc.
30 Dan Road
Canton, MA 02021
Distributor
Aberdeen Fund Distributors LLC
1735 Market Street, 32nd Floor
Philadelphia, PA 19103
Sub-Administrator, Custodian & Fund Accountant
State Street Bank and Trust Company
1 Heritage Drive, 3rd Floor
North Quincy, MA 02171
Independent Registered Public Accounting Firm
KPMG LLP
1601 Market Street
Philadelphia, PA 19103
Fund Counsel
Willkie Farr & Gallagher LLP
787 Seventh Avenue
New York, NY 10019
Aberdeen Asset Management Inc. 1735 Market Street, 32nd Floor Philadelphia, PA 19103 aberdeen-asset.us | |
AOE-0142-AR
Item 2. Code of Ethics.
(a) As of October 31, 2017, the Registrant had adopted a code of ethics that applies to the Registrant’s principal executive officer, principal financial officer, principal accounting officer or controller, or persons performing similar functions, regardless of whether these individuals are employed by the Registrant or a third party (the “Code of Ethics”).
(c) There have been no amendments during the period covered by this report to a provision of the Code of Ethics.
(d) During the period covered by the report, the Registrant did not grant any waivers to the provisions of the Code of Ethics.
(f) The Code of Ethics is included with this Form N-CSR as Exhibit 12(a)(1).
Item 3. Audit Committee Financial Expert.
The Registrant’s Board of Trustees has determined that there is at least one member who qualifies as an “audit committee financial expert” serving on its Audit Committee. Mr. Rahn K. Porter is the “audit committee financial expert” and is considered to be an independent” Trustee as each term is defined in Item 3 of Form N-CSR.
Item 4. Principal Accountant Fees and Services.
Fiscal Year Ended | (a) Audit Fees | (b) Audit-Related Fees | (c)1 Tax Fees | (d) All Other Fees | ||||
| October 31, 2017 | $509,550 | $0 | $147,000 | $0 | ||||
| October 31, 2016 | $556,000 | $10,500 | $180,000 | $28,000 | ||||
| 1 | The Tax Fees are for the completion of the Registrant’s federal and state tax returns. |
(e)(1) Pre-Approval Policies and Procedures. Except as permitted by Rule 2-01(c)(7)(i)(C) of Regulation S-X, the Registrant’s (hereinafter, the “Trust”) Audit Committee Charter authorizes the Audit Committee (“Committee”) to annually select, retain or terminate the Trust’s independent auditor and, in connection therewith, to evaluate the terms of the engagement and the qualifications and independence of the independent auditor, including whether the independent auditor provides any consulting, auditing or tax services to the investment adviser (hereinafter, the “Adviser”) or a sub-adviser, and to receive the independent auditor’s specific representations as to their independence, delineating all relationships between the independent auditor and the Trust, consistent with PCAOB 3526 or any other applicable auditing standard. PCAOB Rule 3526 requires that, at least annually, the auditor: (1) disclose to the Committee in writing all relationships between the auditor and its related entities and the Trust and its related entities that in the auditor’s professional judgment may reasonably be thought to bear on independence; (2) confirm in its letter that, in its professional judgment, it is independent of the Trust within the meaning of the Securities Acts administered by the SEC; and (3) discuss the auditor’s independence with the Committee. The Committee is responsible for actively engaging in a dialogue with the independent auditor with respect to any disclosed relationships or services that may impact the objectivity and independence of the independent auditor and for taking, or recommending that the full Board take, appropriate action to oversee the independence of the independent auditor. The Committee is also authorized to review in advance, and consider approval of, any and all proposals by management or the Adviser that the Trust, Adviser or their affiliated persons, employ the independent auditor to render “permissible non-audit services” to the Trust and to consider whether such services are consistent with the
independent auditor’s independence. The Committee may delegate to one or more of its members (“Delegates”) authority to pre-approve permissible non-audit services to be provided to the Trust. Any pre-approval determination of a Delegate shall be presented to the full Committee at its next meeting. The Committee shall communicate any pre-approval made by it or a Delegate to the Adviser, who will ensure that the appropriate disclosure is made in the Trust’s periodic reports required by Section 30 of the Investment Company Act of 1940, as amended, and other documents as required under the federal securities laws.
(e)(2) None of the services described in each of paragraphs (b) through (d) of this Item involved a waiver of the pre-approval requirement by the Audit Committee pursuant to Rule 2-01 (c)(7)(i)(C) of Regulation S-X.
(f) Not applicable.
(g) The aggregate non-audit fees billed by the Registrant’s accountant for services to the Registrant and to the Registrant’s investment adviser and all entities controlling, controlled by, or under common control with the Adviser that provide services to the Registrant for the Registrant’s fiscal years ended October 31, 2017 and October 31, 2016 and were $803,351 and $1,049,768, respectively.
(h) The Registrant’s Audit Committee of the Board of Trustees has considered whether the provision of non-audit services that were rendered to the Registrant’s investment adviser (not including any sub-adviser whose role is primarily portfolio management and is subcontracted with or overseen by another investment adviser), and any entity controlling, controlled by, or under common control with the investment adviser that provides ongoing services to the Registrant that were not pre-approved pursuant to paragraph (c)(7)(ii) or Rule 2-01 of Regulation S-X is compatible with maintaining the principal accountant’s independence and has concluded that it is.
Item 5. Audit Committee of Listed Registrants.
Not applicable.
Item 6. Investments.
(a) Included as part of the Reports to Shareholders filed under Item 1 of this Form N-CSR.
(b) Not applicable.
Item 7. Disclosure of Proxy Voting Policies and Procedures for Closed-End Management Investment Companies.
Not applicable.
Item 8. Portfolio Managers of Closed-End Management Investment Companies.
Not applicable.
Item 9. Purchases of Equity Securities by Closed-End Management Investment Company and Affiliated Purchasers.
Not applicable.
Item 10. Submission of Matters to a Vote of Security Holders.
During the period ended October 31, 2017, there were no material changes to the procedures by which shareholders may recommend nominees to the Registrant’s Board of Trustees.
Item 11. Controls and Procedures.
(a) The Registrant’s principal executive and principal financial officers, or persons performing similar functions, have concluded that the Registrant’s disclosure controls and procedures (as defined in Rule 30a-3(c) under the Investment Company Act of 1940 (the “Act”) (17 CFR 270.30a-3(c))) are effective, as of a date within 90 days of the filing date of the report that includes the disclosure required by this paragraph, based on the evaluation of these controls and procedures required by Rule 30a-3(b) under the Act (17 CFR 270.30a3(b)) and Rule 13a-15(b) or 15d-15(b) under the Securities Exchange Act of 1934 (17 CFR 240.13a-15(b) or 240.15d15(b)).
(b) There were no changes in the Registrant’s internal control over financial reporting (as defined in Rule 30a-3(d) under the Act (17 CFR 270.30a-3(d))) that occurred during the second fiscal quarter of the period covered by this report that have materially affected, or are reasonably likely to materially affect, the Registrant’s internal control over financial reporting.
Item 12. Exhibits.
(a)(1) The Code of Ethics of the Registrant for the period covered by this report as required pursuant to Item 2 of this Form N-CSR.
(a)(2) Certifications of the Registrant pursuant to Rule 30a-2(a) under the Act are exhibits to this report.
(a)(3) Not applicable.
(b) Certifications of the Registrant pursuant to Rule 30a-2(b) under the Act are exhibits to this report.
SIGNATURES
Pursuant to the requirements of the Securities Exchange Act of 1934 and the Investment Company Act of 1940, the registrant has duly caused this report to be signed on its behalf by the undersigned, thereunto duly authorized.
| Aberdeen Funds | ||
| By: | /s/ Bev Hendry | |
| Bev Hendry | ||
| Principal Executive Officer | ||
| Aberdeen Funds | ||
Date: January 5, 2018
Pursuant to the requirements of the Securities Exchange Act of 1934 and the Investment Company Act of 1940, this report has been signed below by the following persons on behalf of the registrant and in the capacities and on the dates indicated.
| By: | /s/ Bev Hendry | |
| Bev Hendry | ||
| Principal Executive Officer | ||
| Aberdeen Funds | ||
Date: January 5, 2018
| By: | /s/ Andrea Melia | |
| Andrea Melia | ||
| Principal Financial Officer | ||
| Aberdeen Funds | ||
Date: January 5, 2018