UNITED STATES
SECURITIES AND EXCHANGE COMMISSION
Washington, D.C. 20549
FORM N-CSR
CERTIFIED SHAREHOLDER REPORT OF REGISTERED
MANAGEMENT INVESTMENT COMPANIES
| Investment Company Act file number: | 811-22132 | |
| Exact name of registrant as specified in charter: | Aberdeen Funds | |
| Address of principal executive offices: | 1735 Market Street, 32nd Floor | |
| Philadelphia, PA 19103 | ||
| Name and address of agent for service: | Ms. Andrea Melia | |
| Aberdeen Asset Management Inc. | ||
| 1735 Market Street, 32nd Floor | ||
| Philadelphia, PA 19103 | ||
| Registrant’s telephone number, including area code: | 866-667-9231 | |
| Date of fiscal year end: | October 31 | |
| Date of reporting period: | October 31, 2016 | |
Item 1. Reports to Shareholders.

Aberdeen Funds
Equity Series
Annual Report
October 31, 2016
Aberdeen Asia-Pacific (ex-Japan) Equity Fund
Aberdeen China Opportunities Fund
Aberdeen Emerging Markets Fund
Aberdeen Equity Long-Short Fund
Aberdeen Global Natural Resources Fund
Aberdeen International Equity Fund
Aberdeen International Small Cap Fund (formerly, Aberdeen Global Small Cap Fund)
Aberdeen Japanese Equities Fund
Aberdeen U.S. Mid Cap Equity Fund
Aberdeen U.S. Multi Cap Equity Fund (formerly, Aberdeen U.S. Equity Fund)
Aberdeen U.S. Small Cap Equity Fund (formerly, Aberdeen Small Cap Fund)

| Page 2 | ||||
| Page 4 | ||||
| Page 10 | ||||
| Page 16 | ||||
| Page 23 | ||||
| Page 31 | ||||
| Page 38 | ||||
| Page 44 | ||||
| Page 51 | ||||
Aberdeen Japanese Equities Fund | Page 58 | |||
Aberdeen U.S. Mid Cap Equity Fund | Page 63 | |||
| Page 69 | ||||
| Page 74 | ||||
| Page 80 | ||||
| Page 126 | ||||
| Page 147 | ||||
| Page 148 | ||||
| Page 150 | ||||
| Page 152 | ||||
| Page 155 | ||||
Investors should carefully consider a fund’s investment objectives, risks, fees, charges and expenses before investing any money. To obtain this and other fund information, please call 866-667-9231 to request a prospectus, or download a prospectus at www.aberdeen-asset.us. Please read it carefully before investing any money.
Investing in mutual funds involves risk, including possible loss of principal.
Aberdeen Funds is distributed by Aberdeen Fund Distributors LLC, Member FINRA, 1735 Market Street, 32nd Floor, Philadelphia, PA 19103.
Aberdeen Asset Management Inc. (“AAMI”) has been registered as an investment adviser under the Investment Advisers Act of 1940 since August 23, 1995.
Statement Regarding Availability of Quarterly Portfolio Schedule.
The complete schedule of portfolio holdings for each fund of Aberdeen Funds (each a “Fund” and collectively, the “Funds”) is included in the Funds’ semi-annual and annual reports to shareholders. Aberdeen Funds also files complete schedules of portfolio holdings for each Fund with the Securities and Exchange Commission (the “Commission”) for the first and third quarters of each fiscal year on Form N-Q. The Funds’ Form N-Q filings are available on the Commission’s website at http://www.sec.gov. The Funds’ Form N-Q filings may be reviewed and copied at the Commission’s Public Reference Room in Washington, DC, and information on the operation of the Public Reference Room may be obtained by calling 800-SEC-0330; and the Funds make the information on Form N-Q available to shareholders on www.aberdeen-asset.us or upon request without charge.
Statement Regarding Availability of Proxy Voting Record.
Information regarding the policies and procedures that the Funds use to determine how to vote proxies relating to portfolio securities is available without charge, upon request, by calling 1-866-667-9231. The information is also included in the Funds’ Statement of Additional Information, which is available on the Funds’ website at www.aberdeen-asset.us and on the Commission’s website at www.sec.gov.
Information relating to how each Fund voted proxies relating to portfolio securities held during the most recent twelve months ended June 30 is available by August 30 of the relevant year: (i) upon request and without charge by calling 1-866-667-9231; and (ii) on the Commission’s website at www.sec.gov.
The 12-month reporting period ended October 31, 2016 appeared to encapsulate the adage: “Expect the unexpected.” Myriad economic and geopolitical events prompted numerous bouts of volatility in the global financial markets over the period – and beyond. There was abundant speculation regarding U.S. Federal Reserve (Fed) monetary policy, with investor sentiment alternatively shifting towards and away from interest-rate hikes with each release of economic data. In early 2016, oil and commodity prices ended their prolonged slump and led to a rally in global equities. However, in June 2016, the UK’s surprising approval of a referendum to leave the European Union (EU) – commonly referred to as “Brexit” – sent tremors through the global markets. Stock prices fell sharply, oil prices slumped, and the British sterling plummeted to a 30-year low against the U.S. dollar. Investor sentiment recovered soon thereafter as central banks in Japan and parts of Europe unexpectedly imposed negative interest rates in a bid to combat low inflation and boost spending. In the U.S., Fed policy remained on hold for most of the reporting period after the central bank increased its benchmark interest rate for the first time in more than nine years in December 2015. Additionally, for much of the reporting period, investors focused on the pending U.S. presidential election and its possible impact on the global economy and financial markets. Shortly after the end of the reporting period in early November, real estate magnate Donald Trump, seemingly benefiting from a global surge in populism that had led to the successful campaign for Brexit, secured what generally had been deemed an improbable victory in the presidential election versus former U.S. Secretary of State Hillary Clinton.
The Morgan Stanley Capital International (MSCI) World Index, a global equity market benchmark, registered a modest gain of 1.8% for the reporting period. Shares of U.S. large-cap companies significantly outperformed their developed-market peers in Europe, but lagged large-cap Asian stocks. The U.S. broader-market S&P 500 Index was up 4.5% for the period, versus the corresponding -7.5% and 8.0% returns of the MSCI Europe and MSCI All-Country (AC) Asia Pacific indices. Emerging-markets and global natural resources stocks benefited from the sharp rebound in oil and commodity prices, with the MSCI Emerging Markets and the S&P Global Natural Resources indices climbing 9.7% and 13.6%, respectively, for the reporting period.1
U.S. equities saw modest gains over the reporting period, with large-cap stocks slightly outperforming small-cap company stocks. Economic growth was sluggish for most of the period before expanding sharply in the third quarter of 2016. The U.S. employment picture continued to improve, albeit at a somewhat slower rate in the second half of the reporting period. However, average hourly wages rose 2.8% over the 12-month reporting period – the largest year-over-year increase since June 2009. Corporate results were generally positive, with 72% of S&P 500 Index companies exceeding consensus earnings estimates and 54% posting better-than-expected revenue for the third-quarter 2016 earnings season.2
Given their significant exposure to the uncertainty generated by Brexit, UK and European stocks lost ground and were the weakest global equity market performers over the reporting period. The UK electorate’s surprising vote to leave the EU counterbalanced the upturn in the European markets for much of the first half of 2016, as the European Central Bank’s aggressive monetary easing had boosted investor sentiment. Earlier in the reporting period, stocks in the region fell amid concerns regarding the terror attacks in Paris and Brussels in November 2015 and March 2016, respectively.
The Asian stock markets performed well during the reporting period despite a slowdown in economic growth in China and the government’s devaluation of its currency, the renminbi, as well as the Brent crude oil price dropping to a multi-year low at the beginning of the 2016 calendar year. The strength in the second half of the period was attributable primarily to investors’ optimism regarding rising oil and commodity prices and global central bank monetary policy. Stock prices rose in response to the European Central Bank’s package of fresh monetary stimulus and the Bank of Japan’s (BoJ’s) move to impose negative interest rates. Additionally, the Japanese yen moved higher amid the flight to safety shortly after the Brexit vote and investors’ hopes that the BoJ would take further stimulus measures. China’s economy strengthened due to increased infrastructure spending and a robust real estate market.
The strong performance of emerging-market equities over the reporting period was attributable primarily to a significant upturn in the Latin America region – particularly Brazil. That market rallied sharply after former President Dilma Rousseff was impeached on charges of fiscal mismanagement and subsequently removed from office. Vice President Michel Temer succeeded her as president. Temer’s economic team, which includes former central bank president Henrique Meirelles serving as finance minister, unveiled an ambitious program of reforms in an effort to buttress the country’s public finances. In contrast, Mexican stocks declined over the reporting period, hampered by an economic slowdown and the global slump in oil prices. Additionally, the Mexican peso weakened against the U.S. dollar on concerns regarding the possible impact of trade restrictions and tariffs and tougher immigration laws under a Trump administration.
Global fixed-income securities saw positive returns over the reporting period as most central banks maintained accommodative monetary policy. Benchmark interest rates remained slightly above 0% in the U.S. and dipped into negative territory in Europe and Japan. Global investment-grade bonds, as measured by the Bloomberg Barclays Global Aggregate Bond Index, gained 5.6% during the reporting period. High-yield issues significantly outperformed their investment-grade counterparts for the period. The Bank of America Merrill Lynch Global High Yield Constrained Index climbed 10.6%, as the asset class was bolstered mainly by the upturn in global commodity prices for much of the reporting period.
Outlook
It seems that the global financial markets have been subjected to heavy doses of Trump- and Brexit-related news, in our view. Both trending topics caused upheaval in equity and bond prices and prompted furious but short-lived sell-offs in the markets. With the continued rise of insurgent populist movements elsewhere in the
Annual Report 2016
2
Market Review (concluded)
developed world, we think that we may be heading for an economic and political “crunch point.” The electoral tests thus far in 2016 have brought de-globalization and protectionist tendencies into the front line of government in both the U.S. and the UK. Other incumbent governments facing such challenges in the year ahead – most obviously in France and Germany – are taking notice and contemplating how to explain the benefits of globalization, while acknowledging they could and should be shared more widely.
We feel that it is worth bearing in mind that the story of populism and de-globalization is nuanced, with both negative and positive implications for champions of globalization. On the downside, this complexity may make it harder to successfully address the causes of discontent and reduce the risk of damaging de-globalization. Nonetheless, protectionism is not an inevitable, reflexive response to the challenges the world faces on the other side of the global financial crisis. Returning to the UK, and specifically the EU referendum result, young people voted “remain” overall, whereas older demographic groups favored “leave.” At least in this case, in our opinion, those who have spent all their lives in a globalized world appear most reluctant to give up on it just yet.
Hugh Young
Managing Director
Aberdeen Asset Management
| 1 | Indexes are unmanaged and have been provided for comparison purposes only. No fees or expenses are reflected. You cannot invest directly in an index. |
| 2 | Source: FactSet, “Earnings Insight,” November 2016 |
2016 Annual Report
3
Aberdeen Asia-Pacific (ex-Japan) Equity Fund (Unaudited)
The Aberdeen Asia-Pacific (ex-Japan) Equity Fund (Institutional Class shares net of fees) returned 6.97% for the 12-month period ended October 31, 2016, versus the 8.26% return of its benchmark, the MSCI All Country (AC) Asia Pacific ex Japan Index, during the same period. For broader comparison, the average return of the Fund’s category of Pacific ex-Japan Funds (comprising 46 funds), as measured by Lipper, Inc., was 6.56% for the period.
Asian equities overcame heightened volatility in the first half of the reporting period to end with solid gains. Markets initially fluctuated, with the benchmark MSCI AC Asia Pacific ex Japan Index hitting a trough in February 2016. This was partly because of headwinds from China, including a volatile renminbi (China’s currency), slowing economic growth and policy missteps. The slowing growth rate in the mainland economy also hurt commodity demand, with the Brent Crude oil price tumbling to below US$30 a barrel in January 2016. Investor sentiment was further hampered by concerns over divergent monetary policy among major developed economies; while the U.S. raised interest rates for the first time in almost a decade, rates fell below 0% in Europe and Japan. However, improving fundamentals in emerging economies, steadier commodity prices and reform momentum across Asia helped to improve market sentiment. Expectations of an extended period of low interest rates and liquidity from inflows post-Brexit1 also buoyed the markets. These positive catalysts offset a June sell-off, arising from the UK’s unexpected vote to leave the European Union, as well as another reactionary rout at the end of the reporting period, on uncertainties over global monetary policies and the outcome of the pending U.S. presidential election in early November. Republican Donald Trump subsequently won the election on November 8, garnering a majority of electoral votes in the race against his Democratic Party opponent, former U.S. Secretary of State Hillary Clinton.
The Fund underperformed the benchmark MSCI AC Asia Pacific ex Japan Index over the reporting period, hampered largely by the overweight exposure to Singapore and stock selection in Australia. At the stock level, Standard Chartered was the key detractor from Fund performance, as the share price decline in the first half of the reporting period overshadowed the rebound in the latter half. The emerging-markets lender returned to underlying profitability in the first half of its 2016 fiscal year, benefiting from reduced commodity exposure, improved cost controls and lower loan impairments. The position in Swire Pacific also hampered Fund performance, as the Hong Kong-based conglomerate’s stock price fell after it reported a set of generally lackluster results and cut its interim dividend payment. The company announced that the operating environment for its core aviation business, Cathay Pacific, is likely to remain challenging for the second half of 2016. Swire Pacific’s management team is conducting a critical review of the business in response to the deteriorating outlook; we will engage with management on this issue. The Fund’s lack of exposure to Tencent also had a negative impact on the relative performance, as the Chinese internet company’s profits exceeded expectations over the reporting period. While Tencent is a leader in China’s internet sector, we are not sufficiently comfortable with the opaque corporate structures that are characteristic of this sector. Nonetheless, we will continue to look for fair minority shareholder treatment that could potentially ease our concerns.
Conversely, the Fund’s performance for the reporting period was enhanced by holdings in three conglomerates: Indonesia-based Astra International, Grasim Industries in India, and Hong Kong-based Jardine Strategic. Astra International’s third-quarter 2016 results largely met the market’s expectations. The company’s automobile business improved markedly following new car launches, although losses in its subsidiary, Bank Permata, weighed on the company’s results. Separately, its commodities-related business may see higher earnings, in our opinion, given the recent rebound in commodity prices. In India, Grasim Industries’ share price was buoyed by robust profits, driven by both its cement and viscose staple fiber businesses. Finally, Jardine Strategic’s results over the reporting period benefited from the strength of its Indonesian subsidiary, Astra International, and the stability of Hong Kong Land, its property subsidiary.
Non-Chinese investors, including the Fund, recently were authorized to invest directly in the People’s Republic of China (PRC) by trading with specified brokers in Shanghai or Shenzhen through a “stock connect” program. Investments through stock connect programs provide additional access to direct PRC investments, but may subject the Fund to additional risks, including those relating to liquidity, currency, legal and regulatory uncertainty, trade execution, operations, tax, counterparties (legal entities which may be exposed to financial risk) and credit.
Regarding Fund activity over the reporting period, we took advantage of market swings to establish new positions at what we believed were reasonable valuations and exit positions for which we felt that our investment rationale has seen significant erosion. We initiated holdings in Indonesian private lender Bank Central Asia, Hong Kong Exchanges and Clearing, along with two Korean companies, cosmetics maker AmorePacific Corp and internet company Naver. Furthermore, we initiated a position in India’s HDFC Bank. The lender is an associate of HDFC, in which the Fund also has a position. The company is one of India’s leading private sector banks and, in our view, has a good track record of delivering above-industry average returns, strong management team and solid capital base. We believe that HDFC Bank is well-positioned to benefit from its expansion in the suburban and rural areas, as India’s banking penetration remains low. In contrast, we exited the Fund’s position in retailer Woolworths as we believed that it had reached its full valuation and faced rising uncertainty in an increasingly tough operating environment.
Global financial markets have rebounded as quickly as they tumbled in the wake of Donald Trump’s victory in the U.S. presidential election. However, until there is greater clarity on the president-elect’s policies, we feel that it is difficult to predict the impact on Asia in the months ahead. Our best guess is that his policies could increase the U.S. fiscal deficit, curb global trade and spark currency wars. We believe that none of this is good for Asian equity markets.
| 1 | Brexit is an abbreviation of “British exit,” which refers to the June 23, 2016 referendum by British voters to exit the European Union. |
4
Annual Report 2016
Aberdeen Asia-Pacific (ex-Japan) Equity Fund (Unaudited) (concluded)
However, government leaders have historically found that they could not deliver on all of their campaign pledges, and Trump is a political outsider. We think that his election success injects additional uncertainty in already uncertain times. Over the long run, however, we believe that Trump-inspired protectionism might force Asian countries to accelerate their efforts to shift from export-led growth models to more consumption-based economies. For example, we think that China could finally have the catalyst it needs to fully embrace the painful structural overhaul that its government has promised. If so, we feel that this may prove beneficial to the region.
Portfolio Management:
Aberdeen Asia-Pacific Equity Team
PAST PERFORMANCE DOES NOT GUARANTEE FUTURE RESULTS.
The performance data quoted represents past performance and current returns may be lower or higher. Class A Shares have up to a 5.75% front-end sales charge and a 0.25% 12b-1 fee. The investment return and principal value will fluctuate so that an investor’s shares, when redeemed, may be worth more or less than the original cost. To obtain performance information current to the most recent month-end, which may be higher or lower than the performance shown above, please call 866-667-9231 or go to www.aberdeen-asset.us.
Investing in mutual funds involves risk, including the possible loss of principal.
Indexes are unmanaged and have been provided for comparison purposes only. No fees or expenses are reflected. You cannot invest directly in an index.
Lipper is a leading global provider of mutual fund information and analysis to fund companies, financial intermediaries and media organizations.
Risk Considerations
Concentrating investments in the Asia-Pacific region subjects the Fund to more volatility and greater risk of loss than geographically diverse mutual funds.
Parts of the Asia-Pacific region may be subject to a greater degree of economic, political and social instability than is the case in the United States and Europe. Some Asian countries can be characterized as emerging markets or newly industrialized and may experience more volatile economic cycles than developed countries.
Foreign securities may be more volatile, harder to price and less liquid than U.S. securities. They are subject to different accounting and regulatory standards, currency exchange rates, political and economic risks. Fluctuation in currency exchange rates may impact the Fund’s returns more greatly to the extent the Fund does not hedge currency exposure or hedging techniques are unsuccessful. The foregoing risks are enhanced in emerging market countries.
Equity stocks of small- and mid-cap companies carry greater risk and more volatility than equity stocks of larger, more established companies.
Investing a significant portion of the Fund’s assets in securities of companies conducting business in a broadly related group of industries within an economic sector may make the Fund more vulnerable to unfavorable developments in that sector.
Please read the prospectus for more detailed information regarding these and other risks.
2016 Annual Report
5
Aberdeen Asia-Pacific (ex-Japan) Equity Fund (Unaudited)
| Average Annual Total Return (For periods ended October 31, 2016) | 1 Yr. | 5 Yr. | Inception1 | |||||||||||
Class A2 | w/o SC | 6.86% | 2.49% | 1.31% | ||||||||||
| w/SC3 | 0.74% | 1.28% | 0.04% | |||||||||||
Class C2 | w/o SC | 5.90% | 1.79% | 0.58% | ||||||||||
| w/SC4 | 4.90% | 1.79% | 0.58% | |||||||||||
Class R2,5 | w/o SC | 6.63% | 2.24% | 1.05% | ||||||||||
Institutional Service Class5 | w/o SC | 7.08% | 2.68% | 3.90% | ||||||||||
Institutional Class5 | w/o SC | 6.97% | 2.70% | 3.91% | ||||||||||
All figures showing the effect of a sales charge (SC) reflect the maximum charge possible because it has the most significant effect on performance data. The total returns shown above do not include the impact of financial statement rounding of the net asset value (NAV) per share and/or financial statement adjustments.
| 1 | Fund commenced operations on November 16, 2009. |
| 2 | Returns before the first offering of Class A, Class C and Class R (February 28, 2012) are based on the previous performance of the Institutional Class. Excluding the effect of any fee waivers or reimbursements, this performance is substantially similar to what Class A, Class C and Class R would have produced because all classes invest in the same portfolio of securities. Returns for Class A, Class C and Class R shares would only differ to the extent of the differences in expenses of the classes. |
| 3 | A 5.75% front-end sales charge was deducted. |
| 4 | A 1.00% contingent deferred sales charge (CDSC) was deducted from the one year return because it is charged when Class C shares are sold within the first year after purchase. |
| 5 | Not subject to any sales charges. |
Annual Report 2016
6
Aberdeen Asia-Pacific (ex-Japan) Equity Fund (Unaudited)
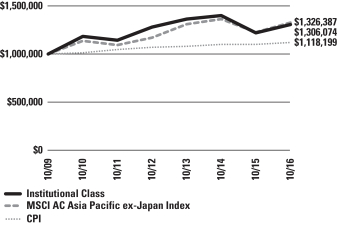
Performance of a $1,000,000 Investment* (as of October 31, 2016)
| * | Minimum Initial Investment |
Comparative performance of $1,000,000 invested in Institutional Class shares of the Aberdeen Asia-Pacific (ex-Japan) Equity Fund, the Morgan Stanley Capital International All Country (MSCI AC) Asia Pacific ex-Japan Index and the Consumer Price Index (CPI) since inception. Unlike the Fund, the returns for these unmanaged indexes do not reflect any fees, expenses, or sales charges. Investors cannot invest directly in market indexes.
The MSCI AC Asia Pacific ex-Japan Index captures large and mid cap representation across 4 of 5 Developed Markets countries (excluding Japan) and 8 Emerging Markets countries in the Asia Pacific region. With 701 constituents, the index covers approximately 85% of the free float-adjusted market capitalization in each country. Developed Markets countries in the index are: Australia, Hong Kong, New Zealand and Singapore. Emerging Markets countries are: China, India, Indonesia, Korea, Malaysia, the Philippines, Taiwan and Thailand.
The CPI is a measure of the average change over time in the prices paid by urban consumers for a market basket of consumer goods and services.
Investment return and principal value will fluctuate, and when redeemed, shares may be worth more or less than original cost. Past performance is no guarantee of future results. The Average Annual Total Return table and Performance graph do not reflect the deduction of taxes that a shareholder would pay on fund distributions or the redemption of fund shares. Investing in mutual funds involves market risk, including loss of principal. Performance returns assume the reinvestment of all distributions. Total returns reflect waivers and reimbursements in effect, without which returns would have been lower.
Portfolio Summary (as a percentage of net assets)
October 31, 2016 (Unaudited)
| Asset Allocation | ||||
Common Stocks | 93.4% | |||
Preferred Stocks | 6.0% | |||
Short-Term Investment | 1.0% | |||
Liabilities in excess of other assets | (0.4% | ) | ||
| 100.0% | ||||
The following table summarizes the composition of the Fund’s portfolio, in Standard & Poor’s Global Industry Classification Standard (GICS) sectors, expressed as a percentage of net assets. The GICS structure consists of 11 sectors, 24 industry groups, 68 industries and 157 sub-industries. As of October 31, 2016, the Fund did not have more than 25% of its assets invested in any industry group.
| Top Sectors | ||||
Financials | 32.5% | |||
Information Technology | 13.0% | |||
Materials | 11.5% | |||
Real Estate | 8.9% | |||
Industrials | 8.9% | |||
Telecommunication Services | 8.4% | |||
Consumer Staples | 6.2% | |||
Consumer Discretionary | 6.0% | |||
Health Care | 2.4% | |||
Energy | 1.6% | |||
Other | 0.6% | |||
| 100.0% | ||||
| Top Holdings* | ||||
Samsung Electronics Co. Ltd., Preferred Shares | 5.1% | |||
Jardine Strategic Holdings Ltd. | 4.2% | |||
Taiwan Semiconductor Manufacturing Co. Ltd. | 4.0% | |||
Oversea-Chinese Banking Corp. Ltd. | 3.9% | |||
Housing Development Finance Corp. Ltd. | 3.7% | |||
AIA Group Ltd. | 3.4% | |||
Astra International Tbk PT | 3.3% | |||
Singapore Telecommunications Ltd. | 3.3% | |||
China Mobile Ltd. | 3.2% | |||
Rio Tinto PLC – London Listing | 3.2% | |||
Other | 62.7% | |||
| 100.0% | ||||
| * | For the purpose of listing top holdings, Short-Term Investments are included as part of Other. |
| Top Countries | ||||
Singapore | 18.7% | |||
Hong Kong | 18.5% | |||
India | 14.6% | |||
Australia | 8.1% | |||
Republic of South Korea | 8.1% | |||
China | 6.6% | |||
Indonesia | 6.0% | |||
Taiwan | 5.9% | |||
Philippines | 4.0% | |||
Malaysia | 3.5% | |||
Other | 6.0% | |||
| 100.0% | ||||
2016 Annual Report
7
Statement of Investments
October 31, 2016
Aberdeen Asia-Pacific (ex-Japan) Equity Fund
| Shares or Principal Amount | Value | |||||||
COMMON STOCKS (93.4%) | ||||||||
AUSTRALIA (8.1%) | ||||||||
Health Care (2.4%) | ||||||||
CSL Ltd. (a) | 4,630 | $ | 353,295 | |||||
Materials (5.7%) | ||||||||
BHP Billiton PLC — London Listing (a) | 24,734 | 371,927 | ||||||
Rio Tinto PLC — London Listing (a) | 13,521 | 470,197 | ||||||
| 842,124 | ||||||||
| 1,195,419 | ||||||||
CHINA (6.6%) | ||||||||
Consumer Discretionary (1.1%) | ||||||||
Yum! Brands, Inc. | 1,859 | 160,395 | ||||||
Energy (1.6%) | ||||||||
PetroChina Co. Ltd., H Shares (a) | 348,000 | 238,114 | ||||||
Materials (0.7%) | ||||||||
Anhui Conch Cement Co. Ltd., H Shares (a) | 34,500 | 95,355 | ||||||
Telecommunication Services (3.2%) | ||||||||
China Mobile Ltd. (a) | 41,500 | 475,440 | ||||||
| 969,304 | ||||||||
HONG KONG (18.5%) | ||||||||
Financials (7.5%) | ||||||||
AIA Group Ltd. (a) | 78,400 | 493,214 | ||||||
Hong Kong Exchanges and Clearing Ltd. (a) | 8,417 | 222,516 | ||||||
HSBC Holdings PLC (a) | 51,869 | 390,306 | ||||||
| 1,106,036 | ||||||||
Industrials (5.1%) | ||||||||
Jardine Strategic Holdings Ltd. (a) | 17,500 | 614,029 | ||||||
MTR Corp. Ltd. (a) | 23,842 | 131,943 | ||||||
| 745,972 | ||||||||
Real Estate (5.9%) | ||||||||
Hang Lung Group Ltd. (a) | 84,000 | 321,321 | ||||||
Swire Pacific Ltd., Class B (a) | 172,500 | 322,581 | ||||||
Swire Properties Ltd. (a) | 76,900 | 220,832 | ||||||
| 864,734 | ||||||||
| 2,716,742 | ||||||||
INDIA (14.6%) | ||||||||
Consumer Discretionary (1.6%) | ||||||||
Hero MotoCorp Ltd. (a) | 4,560 | 228,885 | ||||||
Consumer Staples (2.2%) | ||||||||
ITC Ltd. (a) | 90,600 | 327,779 | ||||||
Financials (5.9%) | ||||||||
HDFC Bank Ltd. (a) | 7,200 | 134,936 | ||||||
Housing Development Finance Corp. Ltd. (a) | 26,458 | 546,210 | ||||||
ICICI Bank Ltd. (a) | 44,500 | 184,961 | ||||||
| 866,107 | ||||||||
Information Technology (2.6%) | ||||||||
Infosys Ltd. (a) | 9,504 | 142,532 | ||||||
Tata Consultancy Services Ltd. (a) | 6,483 | 232,060 | ||||||
| 374,592 | ||||||||
Materials (2.3%) | ||||||||
Grasim Industries Ltd. (a) | 23,470 | 340,146 | ||||||
| 2,137,509 | ||||||||
INDONESIA (6.0%) | ||||||||
Consumer Discretionary (3.3%) | ||||||||
Astra International Tbk PT (a) | 776,400 | 489,837 | ||||||
Consumer Staples (1.1%) | ||||||||
Unilever Indonesia Tbk PT (a) | 45,200 | 154,031 | ||||||
Financials (1.6%) | ||||||||
Bank Central Asia Tbk PT (a) | 195,300 | 232,201 | ||||||
| 876,069 | ||||||||
MALAYSIA (3.5%) | ||||||||
Consumer Staples (1.2%) | ||||||||
British American Tobacco Bhd | 15,100 | 178,248 | ||||||
Financials (2.3%) | ||||||||
CIMB Group Holdings Bhd (a) | 139,546 | 167,172 | ||||||
Public Bank Bhd | 35,100 | 166,171 | ||||||
| 333,343 | ||||||||
| 511,591 | ||||||||
PHILIPPINES (4.0%) | ||||||||
Financials (4.0%) | ||||||||
Ayala Corp. (a) | 20,110 | 346,700 | ||||||
Bank of the Philippine Islands | 114,515 | 239,093 | ||||||
| 585,793 | ||||||||
REPUBLIC OF SOUTH KOREA (2.1%) | ||||||||
Consumer Staples (0.8%) | ||||||||
Amorepacific Group (a) | 126 | 16,265 | ||||||
E-MART, Inc. (a) | 788 | 111,739 | ||||||
| 128,004 | ||||||||
Information Technology (1.3%) | ||||||||
NAVER Corp. (a) | 251 | 187,789 | ||||||
| 315,793 | ||||||||
SINGAPORE (18.7%) | ||||||||
Financials (8.6%) | ||||||||
DBS Group Holdings Ltd. (a) | 36,188 | 390,060 | ||||||
Oversea-Chinese Banking Corp. Ltd. (a) | 94,893 | 578,101 | ||||||
United Overseas Bank Ltd. (a) | 21,153 | 285,367 | ||||||
| 1,253,528 | ||||||||
Industrials (3.8%) | ||||||||
Keppel Corp. Ltd. (a) | 72,400 | 273,791 | ||||||
Singapore Technologies Engineering Ltd. (a) | 125,800 | 282,819 | ||||||
| 556,610 | ||||||||
See accompanying Notes to Financial Statements.
Annual Report 2016
8
Statement of Investments (concluded)
October 31, 2016
Aberdeen Asia-Pacific (ex-Japan) Equity Fund
| Shares or Principal Amount | Value | |||||||
Real Estate (3.0%) | ||||||||
City Developments Ltd. (a) | 72,600 | $ | 442,042 | |||||
Telecommunication Services (3.3%) | ||||||||
Singapore Telecommunications Ltd. (a) | 174,400 | 486,040 | ||||||
| 2,738,220 | ||||||||
TAIWAN (5.9%) | ||||||||
Information Technology (4.0%) | ||||||||
Taiwan Semiconductor Manufacturing Co. Ltd. (a) | 97,000 | 582,131 | ||||||
Telecommunication Services (1.9%) | ||||||||
Taiwan Mobile Co. Ltd. (a) | 82,100 | 287,255 | ||||||
| 869,386 | ||||||||
THAILAND (2.8%) | ||||||||
Materials (2.8%) | ||||||||
Siam Cement PCL, Foreign Shares (a) | 28,100 | 404,654 | ||||||
UNITED KINGDOM (2.6%) | ||||||||
Financials (2.6%) | ||||||||
Standard Chartered PLC (a)(b) | 43,986 | 382,498 | ||||||
Total Common Stocks | 13,702,978 | |||||||
PREFERRED STOCKS (6.0%) | ||||||||
REPUBLIC OF SOUTH KOREA (6.0%) | ||||||||
Consumer Staples (0.9%) | ||||||||
Amorepacific Corp., Preferred Shares (a) | 769 | 134,231 | ||||||
Information Technology (5.1%) |
| |||||||
Samsung Electronics Co. Ltd., Preferred Shares (a) | 645 | 741,601 | ||||||
| 875,832 | ||||||||
Total Preferred Stocks | 875,832 | |||||||
SHORT-TERM INVESTMENT (1.0%) | ||||||||
UNITED STATES (1.0%) | ||||||||
State Street Institutional U.S. Government Money Market Fund (c) | 150,052 | 150,052 | ||||||
Total Short-Term Investment | 150,052 | |||||||
Total Investments | 14,728,862 | |||||||
Liabilities in excess of other assets—(0.4)% | (64,284 | ) | ||||||
Net Assets—100.0% | $ | 14,664,578 | ||||||
| (a) | Fair Valued Security. Fair Values are determined pursuant to procedures approved by the Fund’s Board of Trustees. See Note 2(a) of the accompanying Notes to Financial Statements. |
| (b) | Non-income producing security. |
| (c) | Registered investment company advised by State Street Global Advisors. |
| (d) | See accompanying Notes to Financial Statements for tax unrealized appreciation/(depreciation) of securities. |
See accompanying Notes to Financial Statements.
2016 Annual Report
9
Aberdeen China Opportunities Fund (Unaudited)
The Aberdeen China Opportunities Fund (Institutional Class shares net of fees) returned 3.22% for the 12-month period ended October 31, 2016, versus the 3.71% return of its benchmark, the Morgan Stanley Capital International (MSCI) Zhong Hua Index, during the same period. For broader comparison, the average return of the Fund’s peer category of China Region Funds (comprising 48 funds), as measured by Lipper, Inc., was 1.72% for the period.
Equities in China and Hong Kong posted gains over the reporting period despite big market swings. The period started with fresh policies, positive growth data and interest rate cuts, alongside Beijing’s 13th Five-Year economic roadmap.1 The well-telegraphed interest-rate hike U.S. Federal Reserve (Fed) in December 2015 also removed some uncertainty. However, mainland markets suffered a downturn at the start to 2016, attributable to a volatile renminbi (China’s currency), weakening gross domestic product (GDP) growth, policy gaffes and a steep drop in oil prices. This spilled over to Hong Kong’s stocks and currency.
Investor sentiment subsequently improved a bit later in the reporting period due to a bounce in commodity prices and the Fed’s dovish monetary policy comments, weathering a “double whammy” of MSCI’s decision to delay A-share index inclusion and the UK’s unexpected vote to exit the European Union (EU). Beginning in June 2016, global equity markets climbed steadily, as investors’ risk appetite was whetted by expectations of lower interest rates for a longer period and a rebound in crude oil prices. The Chinese economy also stabilized on the back of infrastructure spending and a buoyant real estate market.
Towards the end of the reporting period, the global stock market rally took a breather, as China’s steady GDP growth failed to mollify concerns over Beijing’s renewed impetus in staving off asset bubbles. There were external worries, too. Oil prices remained volatile. Uncertainty also emanated from the looming U.S. presidential election scheduled for early November 2016 and the direction of the Fed’s monetary policy. Elsewhere, the UK set a firm deadline for an exit from the EU, causing a steep decline in the sterling and broader currency volatility.
The reform drive continued apace, with policymakers vigilant of the risks posed by excessive leverage and rising property prices. The Chinese government provided subsidies for companies in the iron, steel and coal industries that have reduced excess capacity; tightened rules for wealth management products that make up a large part of the shadow banking sector; and approved a long-awaited trading link between the Shenzhen and Hong Kong securities exchanges. Beijing also unveiled a contentious program that allowed companies to exchange equity stakes for banks to write off their debt, albeit with reassurances that such swaps would be market-oriented and exclude “zombie” companies.2 More than 24 cities imposed fresh curbs on residential home purchases.
After years of Chinese lobbying, the renminbi was accepted into the International Monetary Fund’s exclusive club of global reserve currencies. Although largely symbolic, we think that this milestone nonetheless reflects Beijing’s efforts towards liberalizing currency and financial markets.
At the stock level, the lack of exposure to both online retailer Alibaba and internet company Tencent detracted from Fund performance over the reporting period, as their share prices were buoyed by healthy profits over the reporting period. While Tencent is a clear leader in China’s internet sector, we are not sufficiently comfortable with the opaque corporate structures that are characteristic of this sector. We feel that valuations in the sector remain relatively expensive, while the operating environment is still evolving. Nonetheless, we continue to monitor Tencent’s improving track record of fair minority shareholder treatment that is beginning to ease our concerns.
The holding in Global Brands Group, an apparel and lifestyle products company, also underperformed versus its peers on worries about the U.S. retail recovery, although the company’s business is more defensive in nature because of its large exposure to the children’s apparel market segment. The Fund’s position in Swire Pacific also detracted from performance, as the conglomerate’s stock price declined after it reported a set of relatively lackluster results and cut its interim dividend payment. The company announced that the operating environment for its core aviation business, Cathay Pacific, is likely to remain challenging for the second half of 2016. Swire Pacific’s management is conducting a critical review of the business in response to the deteriorating outlook; we continue to engage with management. The company previously employed a fuel hedging program to keep fuel costs relatively stable. However, this move also led to the company benefiting to a lesser degree from the current low oil price environment compared to some of its peers.
Key contributors to Fund performance among individual holdings for the reporting period included China Vanke’s A shares,3 as the stock rallied amid speculation regarding a potential hostile takeover by unlisted Baoneng Group. The trading of the shares was suspended on December 18, 2015, but resumed trading in early July 2016. We exited the Fund’s position on valuation grounds in view of the sharp run-up in the stock price. Subway operator MTR Corp. benefited from investors’ demand for high-quality defensive stocks. The company also raised fares, which is expected to increase revenue by HK$400 million (about US$52 million). We consider MTR to be one of the best subway operators in Asia. The holding in automotive glass-maker Fuyao Glass Industry also contributed to Fund performance, as its earnings were bolstered by lower natural gas costs and higher selling prices.
Non-Chinese investors, including the Fund, recently were authorized to invest directly in the People’s Republic of China (PRC) by trading with specified brokers in Shanghai or Shenzhen through a “stock connect” program. Investments through stock connect programs provide additional access to direct PRC investments, but may subject
| 1 | The 13th Five-year Plan establishes the Chinese government’s goals and targets for China’s development for the years 2016 to 2020. |
| 2 | “Zombie” companies continue to operate despite being insolvent or near bankruptcy. |
| 3 | A shares are shares that are purchased and traded on the Shanghai and Shenzhen stock exchanges and are denominated in renminbi. |
Annual Report 2016
10
Aberdeen China Opportunities Fund (Unaudited) (concluded)
the Fund to additional risks, including those relating to liquidity, currency, legal and regulatory uncertainty, trade execution, operations, tax, counterparties (legal entities which may be exposed to financial risk) and credit.
During the reporting period, we initiated positions in CSPC Pharmaceutical Group and Shanghai International Airport, switched from China Merchants Bank’s A shares to its H shares,4 and subscribed to Standard Chartered’s rights issue.5 We subsequently sought to capitalize on market volatility to invest in new holdings that we believed had solid fundamentals as valuations turned more compelling. We initiated holdings in China International Travel Service, a leading domestic land tour company, and the mainland’s largest duty-free operator; China Resources Land, which is the flagship of China Resources Group and among the leading domestic property developers; Hong Kong Broadband Network, the second-largest broadband services provider in Hong Kong; and Kweichow Moutai, a Chinese liquor producer which, in our opinion, has a dominant brand and a cash-generative business.
Apart from the previously noted sale of China Vanke’s A shares, we also exited the Fund’s relatively small position in Hung Hing Printing, as we believed that the company had a muted growth outlook in an increasingly competitive and commoditized industry. Additionally, we sold the Fund’s shares in logistics services company Li & Fung in view of its structural weakness in the global retail supply chain and the weak economic environment in its core U.S. market. In our view, its recent valuation reflects the pressures on the company’s business model.
We anticipate that markets will remain volatile over the short term. A Donald Trump presidency in the U.S. has increased uncertainty over China’s economy and currency, with the renminbi falling to its lowest level against the U.S. dollar in almost eight years shortly after the U.S. election in early November. However, we think that Trump’s castigation of China during his campaign may be tempered by the reality of governing when he takes office in January 2017. In our opinion, a full-blown trade war with China and “tit-for-tat” sanctions would not only hurt global trade but also U.S. economic growth and jobs, which he has promised to deliver. Meanwhile, China’s economy is stabilizing, with positive trends in both manufacturing and services. We believe that Beijing still has various monetary policy options available should GDP growth falter. It appears that President Xi Jinping continues to tighten his grip on power, assuming the title of “core” leader of the ruling communist party and entrenching loyalists in senior posts. For investors, we believe that such moves are worrisome because much-needed structural reform may take a backseat, with Xi’s focus on consolidating power. Against such a backdrop, the Fund’s holdings generally are tightening cost controls in an effort to mitigate muted sales. We remain confident that they have what it takes to help them navigate the challenging times.
Portfolio Management:
Aberdeen Asia-Pacific Equity Team
PAST PERFORMANCE DOES NOT GUARANTEE FUTURE RESULTS.
The performance data quoted represents past performance and current returns may be lower or higher. Class A Shares have up to a 5.75% front-end sales charge and a 0.25% 12b-1 fee. The investment return and principal value will fluctuate so that an investor’s shares, when redeemed, may be worth more or less than the original cost. To obtain performance information current to the most recent month-end, which may be higher or lower than the performance shown above, please call 866-667-9231 or go to www.aberdeen-asset.us.
Investing in mutual funds involves risk, including the possible loss of principal.
Indexes are unmanaged and have been provided for comparison purposes only. No fees or expenses are reflected. You cannot invest directly in an index.
Lipper is a leading global provider of mutual fund information and analysis to fund companies, financial intermediaries and media organizations.
Risk Considerations
Concentrating investments in China and Hong Kong subjects the Fund to more volatility and greater risk of loss than geographically diverse mutual funds.
Additional risks associated with investments in China and Hong Kong include exposure to currency fluctuations, less liquidity, expropriation, confiscatory taxation, nationalization, exchange control regulations (including currency blockage) and differing legal standards.
Foreign securities may be more volatile, harder to price and less liquid than U.S. securities. They are subject to different accounting and regulatory standards, currency exchange rates, political and economic risks. Fluctuation in currency exchange rates may impact the Fund’s returns more greatly to the extent the Fund does not hedge currency exposure or hedging techniques are unsuccessful. The foregoing risks are enhanced in emerging market countries.
Equity stocks of small- and mid-cap companies carry greater risk, and more volatility than equity stocks of larger, more established companies.
Investing a significant portion of the Fund’s assets in securities of companies conducting business in a broadly related group of industries within an economic sector may make the Fund more vulnerable to unfavorable developments in that sector.
Please read the prospectus for more detailed information regarding these and other risks.
| 4 | H shares are shares of mainland Chinese companies traded on the Hong Kong stock exchange and denominated in Hong Kong dollars. |
| 5 | An issue of rights to a company’s existing shareholders entitling them to buy additional shares directly from the company in proportion to their existing holdings within a fixed time period. |
2016 Annual Report
11
Aberdeen China Opportunities Fund (Unaudited)
| Average Annual Total Return1 (For periods ended October 31, 2016) | 1 Yr. | 5 Yr. | 10 Yr. | |||||||||||
Class A | w/o SC | 2.90% | 0.68% | 5.68% | ||||||||||
| w/SC2 | (3.00% | ) | (0.51% | ) | 5.05% | |||||||||
Class C | w/o SC | 2.20% | (0.06% | ) | 4.91% | |||||||||
| w/SC3 | 1.20% | (0.06% | ) | 4.91% | ||||||||||
Class R4 | w/o SC | 2.55% | 0.31% | 5.35% | ||||||||||
Institutional Service Class4 | w/o SC | 3.06% | 0.91% | 5.94% | ||||||||||
Institutional Class4 | w/o SC | 3.22% | 0.93% | 5.93% | ||||||||||
All figures showing the effect of a sales charge (SC) reflect the maximum charge possible because it has the most significant effect on performance data. The total returns shown above do not include the impact of financial statement rounding of the net asset value (NAV) per share and/or financial statement adjustments.
| 1 | Returns prior to June 23, 2008 reflect the performance of a predecessor fund (the “Predecessor Fund”). Returns of the Predecessor Fund have not been adjusted to reflect the expenses applicable to the respective classes. Aberdeen Asset Management Asia Limited began sub-advising The Fund on January 1, 2009. Performance prior to this date reflects the performance of an unaffiliated sub-adviser. The Fund and the Predecessor Fund have substantially similar investment objectives and strategies. Please consult the Fund’s prospectus for more detail. |
| 2 | A 5.75% front-end sales charge was deducted. |
| 3 | A 1.00% contingent deferred sales charge (CDSC) was deducted from the one year return because it is charged when Class C shares are sold within the first year after purchase. |
| 4 | Not subject to any sales charges. |
Annual Report 2016
12
Aberdeen China Opportunities Fund (Unaudited)
Performance of a $10,000 Investment (as of October 31, 2016)
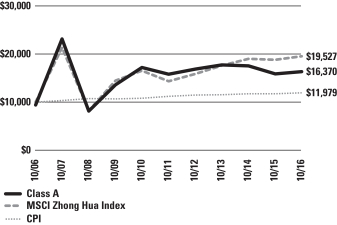
Comparative performance of $10,000 invested in Class A shares of the Aberdeen China Opportunities Fund, Morgan Stanley Capital International (MSCI) Zhong Hua Index and the Consumer Price Index (CPI) over a 10-year period ended October 31, 2016. Unlike the Fund, the returns for these unmanaged indexes do not reflect any fees, expenses, or sales charges. Investors cannot invest directly in market indexes.
The MSCI Zhong Hua Index is a composite index that comprises the MSCI China and MSCI Hong Kong Index. The index captures large and mid cap representation across all China securities (A shares, B shares, H shares, Red Chips, P Chips and foreign listed shares) as well as Hong Kong securities.
The CPI is a measure of the average change over time in the prices paid by urban consumers for a market basket of consumer goods and services.
Investment returns and principal value will fluctuate, and when redeemed, shares may be worth more or less than original cost. Past performance is no guarantee of future results. The Average Annual Total Return table and Performance graph do not reflect the deduction of taxes that a shareholder would pay on fund distributions or the redemption of fund shares. Investing in mutual funds involves market risk, including loss of principal. Performance returns assume the reinvestment of all distributions. Total returns reflect waivers and reimbursements in effect, without which returns would have been lower.
Portfolio Summary (as a percentage of net assets)
October 31, 2016 (Unaudited)
| Asset Allocation | ||||
Common Stocks | 97.3% | |||
Short-Term Investment | 1.5% | |||
Other assets in excess of liabilities | 1.2% | |||
| 100.0% | ||||
The following table summarizes the composition of the Fund’s portfolio, in Standard & Poor’s Global Industry Classification Standard (GICS) sectors, expressed as a percentage of net assets. The GICS structure consists of 11 sectors, 24 industry groups, 68 industries and 157 sub-industries. As of October 31, 2016, the Fund did not have more than 25% of its assets invested in any industry group.
| Top Sectors | ||||
Industrials | 21.8% | |||
Financials | 18.6% | |||
Consumer Discretionary | 17.9% | |||
Real Estate | 12.8% | |||
Telecommunication Services | 6.1% | |||
Energy | 5.3% | |||
Health Care | 4.2% | |||
Information Technology | 3.5% | |||
Consumer Staples | 3.2% | |||
Materials | 2.1% | |||
Other | 4.5% | |||
| 100.0% | ||||
| Top Holdings* | ||||
Jardine Strategic Holdings Ltd. | 6.0% | |||
AIA Group Ltd. | 5.7% | |||
MTR Corp. Ltd. | 5.4% | |||
Swire Pacific Ltd., Class B | 4.3% | |||
HSBC Holdings PLC | 4.3% | |||
China Mobile Ltd. | 4.1% | |||
Hang Lung Group Ltd. | 3.5% | |||
Shangri-La Asia Ltd. | 2.8% | |||
Swire Properties Ltd. | 2.7% | |||
Tong Ren Tang Technologies Co. Ltd., H Shares | 2.6% | |||
Other | 58.6% | |||
| 100.0% | ||||
| * | For the purpose of listing top holdings, Short-Term Investments are included as part of Other. |
| Top Countries | ||||
Hong Kong | 64.6% | |||
China | 32.7% | |||
United States | 1.5% | |||
Other | 1.2% | |||
| 100.0% | ||||
2016 Annual Report
13
Statement of Investments
October 31, 2016
Aberdeen China Opportunities Fund
| Shares or Principal Amount | Value | |||||||
COMMON STOCKS (97.3%) | ||||||||
CHINA (32.7%) | ||||||||
Consumer Discretionary (5.5%) | ||||||||
China International Travel Service Corp. Ltd., A Shares (a) | 42,000 | $ | 279,272 | |||||
Fuyao Glass Industry Group Co. Ltd., H Shares (a)(b) | 130,000 | 377,016 | ||||||
Yum! Brands, Inc. | 1,674 | 144,433 | ||||||
| 800,721 | ||||||||
Consumer Staples (0.3%) | ||||||||
Kweichow Moutai Co. Ltd. (a) | 1,000 | 46,898 | ||||||
Energy (4.4%) | ||||||||
CNOOC Ltd. (a) | 235,000 | 295,694 | ||||||
Greka Drilling Ltd. (c) | 225,000 | 7,023 | ||||||
PetroChina Co. Ltd., H Shares (a) | 506,000 | 346,223 | ||||||
| 648,940 | ||||||||
Financials (2.4%) | ||||||||
China Merchants Bank Co. Ltd., H Shares (a) | 145,000 | 352,603 | ||||||
Health Care (4.2%) | ||||||||
CSPC Pharmaceutical Group Ltd. (a) | 228,000 | 236,075 | ||||||
Tong Ren Tang Technologies Co. Ltd., H Shares (a) | 208,000 | 380,414 | ||||||
| 616,489 | ||||||||
Industrials (4.6%) | ||||||||
China Conch Venture Holdings Ltd. (a) | 182,000 | 339,758 | ||||||
Shanghai International Airport Co. Ltd., | 82,000 | 327,979 | ||||||
| 667,737 | ||||||||
Information Technology (2.1%) | ||||||||
Hangzhou Hikvision Digital Technology Co. Ltd., A Shares (a)(d) | 86,250 | 312,148 | ||||||
Materials (2.1%) | ||||||||
Huaxin Cement Co. Ltd., B Shares (a) | 107,240 | 76,601 | ||||||
Yingde Gases Group Co. Ltd. (a) | 573,000 | 231,027 | ||||||
| 307,628 | ||||||||
Real Estate (1.8%) | ||||||||
China Resources Land Ltd. (a) | 26,000 | 64,572 | ||||||
Yanlord Land Group Ltd. (a) | 195,600 | 194,646 | ||||||
| 259,218 | ||||||||
Telecommunication Services (5.3%) | ||||||||
Asia Satellite Telecommunications Holdings Ltd. (c) | 127,500 | 172,618 | ||||||
China Mobile Ltd. (a) | 52,000 | 595,733 | ||||||
| 768,351 | ||||||||
| 4,780,733 | ||||||||
HONG KONG (64.6%) | ||||||||
Consumer Discretionary (12.4%) | ||||||||
AEON Stores (Hong Kong) Co. Ltd. | 286,500 | 261,544 | ||||||
Giordano International Ltd. (a) | 562,000 | 297,742 | ||||||
Global Brands Group Holding Ltd. (a)(c) | 1,584,380 | 179,456 | ||||||
Hongkong & Shanghai Hotels Ltd. (The) (a) | 246,624 | 278,709 | ||||||
Samsonite International SA (a) | 86,900 | 272,659 | ||||||
Shangri-La Asia Ltd. (a) | 370,000 | 406,369 | ||||||
Texwinca Holdings Ltd. (a) | 160,000 | 111,935 | ||||||
| 1,808,414 | ||||||||
Consumer Staples (2.9%) | ||||||||
Convenience Retail Asia Ltd. (a) | 388,000 | 207,069 | ||||||
Dairy Farm International Holdings Ltd. (a) | 30,700 | 217,075 | ||||||
| 424,144 | ||||||||
Energy (0.9%) | ||||||||
Green Dragon Gas Ltd. (c) | 53,000 | 136,231 | ||||||
Financials (16.2%) | ||||||||
AIA Group Ltd. (a) | 132,800 | 835,445 | ||||||
Dah Sing Banking Group Ltd. (a) | 170,240 | 307,449 | ||||||
Hong Kong Exchanges and Clearing Ltd. (a) | 9,945 | 262,911 | ||||||
HSBC Holdings PLC (a) | 83,010 | 624,636 | ||||||
Standard Chartered PLC (HK Listing) (a)(c) | 39,548 | 335,546 | ||||||
| 2,365,987 | ||||||||
Industrials (17.2%) | ||||||||
Hong Kong Aircraft Engineering Co. Ltd. (a) | 20,400 | 145,333 | ||||||
Jardine Strategic Holdings Ltd. (a) | 25,000 | 877,184 | ||||||
Kerry Logistics Network Ltd. (a) | 283,000 | 375,662 | ||||||
MTR Corp. Ltd. (a) | 142,252 | 787,234 | ||||||
Pacific Basin Shipping Ltd. (a)(c) | 2,172,000 | 324,313 | ||||||
| 2,509,726 | ||||||||
Information Technology (1.4%) | ||||||||
ASM Pacific Technology Ltd. (a) | 21,600 | 208,107 | ||||||
Real Estate (11.0%) | ||||||||
Hang Lung Group Ltd. (a) | 135,000 | 516,408 | ||||||
Hang Lung Properties Ltd. (a) | 20,000 | 43,982 | ||||||
Swire Pacific Ltd., Class A (a) | 2,000 | 20,788 | ||||||
Swire Pacific Ltd., Class B (a) | 335,000 | 626,462 | ||||||
Swire Properties Ltd. (a) | 135,800 | 389,974 | ||||||
| 1,597,614 | ||||||||
Telecommunication Services (0.8%) | ||||||||
HKBN Ltd. (a) | 96,000 | 113,325 | ||||||
Utilities (1.8%) | ||||||||
Hong Kong & China Gas Co. Ltd. (a) | 137,379 | 268,364 | ||||||
| 9,431,912 | ||||||||
Total Common Stocks | 14,212,645 | |||||||
See accompanying Notes to Financial Statements.
Annual Report 2016
14
Statement of Investments (concluded)
October 31, 2016
Aberdeen China Opportunities Fund
| Shares or Principal Amount | Value | |||||||
SHORT-TERM INVESTMENT (1.5%) | ||||||||
UNITED STATES (1.5%) | ||||||||
State Street Institutional U.S. Government Money Market Fund (e) | $ | 214,463 | $ | 214,463 | ||||
| 214,463 | ||||||||
Total Short-Term Investment | 214,463 | |||||||
Total Investments | 14,427,108 | |||||||
Other assets in excess of liabilities—1.2% | 170,843 | |||||||
Net Assets—100.0% | $ | 14,597,951 | ||||||
| (a) | Fair Valued Security. Fair Values are determined pursuant to procedures approved by the Fund’s Board of Trustees. See Note 2(a) of the accompanying Notes to Financial Statements. |
| (b) | Denotes a security issued under Regulation S or Rule 144A. |
| (c) | Non-income producing security. |
| (d) | China A Shares. These shares are issued in local currency, traded in the local stock markets and are held through a qualified foreign institutional investor license. |
| (e) | Registered investment company advised by State Street Global Advisors. |
| (f) | See accompanying Notes to Financial Statements for tax unrealized appreciation/(depreciation) of securities. |
See accompanying Notes to Financial Statements.
2016 Annual Report
15
Aberdeen Emerging Markets Fund (Unaudited)
The Aberdeen Emerging Markets Fund (Institutional Class shares net of fees) returned 12.50% for the 12-month period ended October 31, 2016, versus the 9.67% return of its benchmark, the Morgan Stanley Capital International (MSCI) Emerging Markets (EM) Index, during the same period. For broader comparison, the average return of the Fund’s peer category of Emerging Markets Funds (comprising 350 funds), as measured by Lipper, Inc., was 7.88% for the period.
Emerging-market equities moved higher over the reporting period. Among the key events during the period was the well-telegraphed interest-rate hike by the U.S. Federal Reserve (Fed) in December 2015, although the move did not rattle the global financial markets. At the start of 2016, weak crude oil prices and a sell-off in Chinese shares heightened investors’ risk aversion. However, continued monetary stimulus from global central banks and a sharp rebound in commodity prices spurred a market rebound. In June 2016, the UK’s vote to leave the European Union sent shockwaves across global markets and the British sterling fell to a multi-year low. Meanwhile, the Fed’s delay of a second interest-rate hike and signs of stabilization in the Chinese economy supported investor sentiment. However, caution ahead of the pending U.S. presidential election in early November capped gains towards the end of the reporting period. Republican Donald Trump subsequently won the election on November 8, garnering a majority of electoral votes in the race against his Democratic Party opponent, former U.S. Secretary of State Hillary Clinton.
At the stock level, two of the Fund’s Brazilian holdings, Banco Bradesco and retailer Lojas Renner, were among the main contributors to the Fund’s relative performance for the reporting period, riding the rally in the Brazilian stock market following the end of a lengthy process to impeach President Dilma Rousseff. Encouraging fiscal reforms, in our view, and the start of a monetary easing cycle further supported investor sentiment. The Fund’s holding in Astra International was another strong performer, as the Indonesian conglomerate is well-placed to capitalize on a recovery and better outlook in the country, in our opinion.
Conversely, the lack of exposure to Tencent, which has a significant weight in the MSCI EM Index, hurt the Fund’s relative performance, as the company posted generally positive operating results over the reporting period. While Tencent is a leader in China’s internet sector, we are not sufficiently comfortable with the opaque corporate structures that are characteristic of this sector. Valuations remain relatively expensive in the sector, where the operating environment is still evolving. Nonetheless, we will continue to look for fair minority shareholder treatment that could ease our concerns. Additionally, the absence of positions in Brazilian state-owned oil company Petrobras and lender Itau Unibanco also detracted from the Fund’s relative performance, as the companies benefited from the improving investor sentiment towards Brazilian equities.
Non-Chinese investors, including the Fund, recently were authorized to invest directly in the People’s Republic of China (PRC) by trading with specified brokers in Shanghai or Shenzhen through a “stock connect” program. Investments through stock connect programs provide additional access to direct PRC investments, but may subject the Fund to additional risks, including those relating to liquidity, currency, legal and regulatory uncertainty, trade execution, operations, tax, counterparties (legal entities which may be exposed to financial risk) and credit.
Regarding portfolio activity, we initiated positions in four companies over the reporting period: Hong Kong Exchanges and Clearing, as we believe that the securities exchange operator has good growth prospects; Naver, a Korean internet company with a dominant market share in the domestic search portal business; Tata Consultancy Services, a leading Indian IT outsourcing and business-solutions provider; and Ambev, the largest brewer in Latin America with a leading market position in Brazil.
In contrast, we exited the Fund’s position in Australian metals and mining company South32, which was previously spun off from its parent company, BHP Billiton, in May 2015, as the stock rallied on better-than-expected quarterly results. We also exited the holding in brewer SABMiller by tendering the shares to AB InBev, which merged with SABMiller in October 2016.
A reactionary sell-off across the global financial markets immediately following Donald Trump’s victory in the U.S. presidential election seemed understandable, as investors had largely priced in a win for Hillary Clinton. However, until there is greater clarity on Trump’s policies, we feel that it is difficult to predict the impact on emerging markets over the medium term. One potential concern may be the possibility of increased trade barriers and U.S. withdrawal from, or modification of, trade agreements. We believe that the other pertinent factors will be the impact of a Trump presidency on the U.S. dollar and the Fed’s monetary policy. On a more positive note, however, we think that most emerging economies are in a better position to weather the uncertainty than they were during the “taper tantrum” in 2013. Additionally, many of these countries – such as Brazil, India, and Indonesia – still have room to ease rates to help spur economic activity, in our opinion. At the corporate level, quarterly earnings generally have been in line with, or slightly above, the markets’ expectations, supported by lower input costs and improved cost management. We remain confident in the quality of the Fund’s holdings, while we feel that valuations remain attractive despite emerging markets’ turnaround this year.
Portfolio Management:
Aberdeen Global Emerging Markets Equity Team
PAST PERFORMANCE DOES NOT GUARANTEE FUTURE RESULTS.
The performance data quoted represents past performance and current returns may be lower or higher. Class A Shares have up to a 5.75% front-end sales charge and a 0.25% 12b-1 fee. The investment return and principal value will fluctuate so that an investor’s shares, when redeemed, may be worth more or less than the original cost. To obtain performance information current to the most recent month-end, which may be higher or lower than the performance shown above, please call 866-667-9231 or go to www.aberdeen-asset.us.
Investing in mutual funds involves risk, including the possible loss of principal.
Annual Report 2016
16
Aberdeen Emerging Markets Fund (Unaudited) (concluded)
Indexes are unmanaged and have been provided for comparison purposes only. No fees or expenses are reflected. You cannot invest directly in an index.
Lipper is a leading global provider of mutual fund information and analysis to fund companies, financial intermediaries and media organizations.
Risk Considerations
Foreign securities may be more volatile, harder to price and less liquid than U.S. securities. They are subject to different accounting and regulatory standards, currency exchange rates, political and economic risks. Fluctuation in currency exchange rates may impact the Fund’s returns more greatly to the extent the Fund does not hedge currency exposure or hedging techniques are unsuccessful. The foregoing risks are enhanced in emerging market countries.
Equity stocks of small- and mid-cap companies carry greater risk, and more volatility than equity stocks of larger, more established companies.
Investing a significant portion of the Fund’s assets in securities of companies conducting business in a broadly related group of industries within an economic sector may make the Fund more vulnerable to unfavorable developments in that sector.
Please read the prospectus for more detailed information regarding these and other risks.
2016 Annual Report
17
Aberdeen Emerging Markets Fund (Unaudited)
| Average Annual Total Return1 (For periods ended October 31, 2016) | 1 Yr. | 5 Yr. | Inception2 | |||||||||||
Class A3 | w/o SC | 12.04% | 1.91% | 2.68% | ||||||||||
| w/SC4 | 5.56% | 0.70% | 1.32% | |||||||||||
Class C3 | w/o SC | 11.26% | 1.31% | 2.00% | ||||||||||
| w/SC5 | 10.26% | 1.31% | 2.00% | |||||||||||
Class R3,6 | w/o SC | 11.65% | 1.61% | 2.34% | ||||||||||
Institutional Service Class6,7 | w/o SC | 12.25% | 1.97% | 4.37% | ||||||||||
Institutional Class6 | w/o SC | 12.50% | 2.22% | 5.54% | ||||||||||
All figures showing the effect of a sales charge (SC) reflect the maximum charge possible because it has the most significant effect on performance data. The total returns shown above do not include the impact of financial statement rounding of the net asset value (NAV) per share and/or financial statement adjustments.
| 1 | Returns prior to November 23, 2009 reflect the performance of a predecessor fund (the “Predecessor Fund”). Returns of the Predecessor Fund have not been adjusted to reflect the expenses applicable to the respective classes. The Fund and the Predecessor Fund have substantially similar investment objectives and strategies. Please consult the Fund’s prospectus for more detail. |
| 2 | Fund commenced operations on May 11, 2007. |
| 3 | Returns before the first offering of Class A, Class C and Class R (May 21, 2012) are based on the previous performance of the Institutional Class. Excluding the effect of any fee waivers or reimbursements, this performance is substantially similar to what Class A, Class C and Class R would have produced because all classes invest in the same portfolio of securities. Returns would only differ to the extent of the differences in expenses of the classes. |
| 4 | A 5.75% front-end sales charge was deducted. |
| 5 | A 1.00% contingent deferred sales charge (CDSC) was deducted from the one year return because it is charged when Class C shares are sold within the first year after purchase. |
| 6 | Not subject to any sales charges. |
| 7 | Returns before the first offering of the Institutional Service Class (November 23, 2009) are based on the previous performance of the Institutional Class. Excluding the effect of any fee waivers or reimbursements, this performance is substantially similar to what Institutional Service Class would have produced because both classes invest in the same portfolio of securities. Returns would only differ to the extent of the differences in expenses of the two classes. |
Annual Report 2016
18
Aberdeen Emerging Markets Fund (Unaudited)
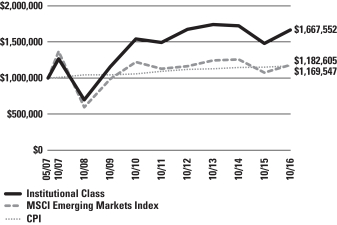
Performance of a $1,000,000* Investment (as of October 31, 2016)
| * | Minimum Initial Investment |
Comparative performance of $1,000,000 invested in Institutional Class shares of the Aberdeen Emerging Markets Fund, Morgan Stanley Capital International (MSCI) Emerging Markets Index and the Consumer Price Index (CPI) since inception. Unlike the Fund, the returns for these unmanaged indexes do not reflect any fees, expenses, or sales charges. Investors cannot invest directly in market indexes.
The MSCI Emerging Markets Index captures large and mid cap representation across 23 Emerging Markets (EM) countries. With 833 constituents, the index covers approximately 85% of the free float-adjusted market capitalization in each country. EM countries are: Brazil, Chile, China, Colombia, Czech Republic, Egypt, Greece, Hungary, India, Indonesia, Korea, Malaysia, Mexico, Peru, Philippines, Poland, Russia, Qatar, South Africa, Taiwan, Thailand, Turkey and United Arab Emirates.
The CPI is a measure of the average change over time in the prices paid by urban consumers for a market basket of consumer goods and services.
Investment return and principal value will fluctuate, and when redeemed, shares may be worth more or less than original cost. Past performance is no guarantee of future results. The Average Annual Total Return table and Performance graph do not reflect the deduction of taxes that a shareholder would pay on fund distributions or the redemption of fund shares. Investing in mutual funds involves market risk, including loss of principal. Performance returns assume the reinvestment of all distributions. Total returns reflect waivers and reimbursements in effect, without which returns would have been lower.
Portfolio Summary (as a percentage of net assets)
October 31, 2016 (Unaudited)
| Asset Allocation | ||||
Common Stocks | 89.3% | |||
Preferred Stocks | 8.3% | |||
Short-Term Investment | 2.5% | |||
Liabilities in excess of other assets | (0.1% | ) | ||
| 100.0% | ||||
The following table summarizes the composition of the Fund’s portfolio, in Standard & Poor’s Global Industry Classification Standard (GICS) sectors, expressed as a percentage of net assets. The GICS structure consists of 11 sectors, 24 industry groups, 68 industries and 157 sub-industries. As of October 31, 2016, the Fund did not have more than 25% of its assets invested in any industry group.
| Top Sectors | ||||
Financials | 28.5% | |||
Consumer Staples | 16.7% | |||
Information Technology | 12.3% | |||
Consumer Discretionary | 9.8% | |||
Materials | 9.2% | |||
Real Estate | 7.1% | |||
Energy | 7.0% | |||
Telecommunication Services | 4.5% | |||
Industrials | 1.4% | |||
Health Care | 1.1% | |||
Other | 2.4% | |||
| 100.0% | ||||
| Top Holdings* | ||||
Samsung Electronics Co. Ltd., Preferred Shares | 4.9% | |||
Taiwan Semiconductor Manufacturing Co. Ltd. | 3.9% | |||
Housing Development Finance Corp. Ltd. | 3.7% | |||
Astra International Tbk PT | 3.5% | |||
Grupo Financiero Banorte SAB de CV, Class O | 3.1% | |||
Fomento Economico Mexicano SAB de CV, ADR | 3.1% | |||
AIA Group Ltd. | 3.0% | |||
Banco Bradesco SA, ADR, Preferred Shares | 2.9% | |||
China Mobile Ltd. | 2.7% | |||
ITC Ltd. | 2.5% | |||
Other | 66.7% | |||
| 100.0% | ||||
| * | For the purpose of listing top holdings, Short-Term Investments are included as part of Other. |
| Top Countries | ||||
India | 16.1% | |||
Brazil | 12.2% | |||
Hong Kong | 8.1% | |||
Mexico | 8.1% | |||
Republic of South Korea | 6.8% | |||
China | 5.6% | |||
Taiwan | 4.8% | |||
Indonesia | 4.6% | |||
Turkey | 4.6% | |||
Thailand | 4.5% | |||
Other | 24.6% | |||
| 100.0% | ||||
2016 Annual Report
19
Statement of Investments
October 31, 2016
Aberdeen Emerging Markets Fund
| Shares or Principal Amount | Value | |||||||
COMMON STOCKS (89.3%) | ||||||||
BRAZIL (8.9%) | ||||||||
Consumer Discretionary (1.8%) | ||||||||
Lojas Renner SA | 16,744,550 | $ | 141,636,231 | |||||
Consumer Staples (2.3%) | ||||||||
Ambev SA | 13,483,000 | 79,537,873 | ||||||
BRF SA | 6,381,705 | 106,761,606 | ||||||
| 186,299,479 | ||||||||
Energy (2.3%) | ||||||||
Ultrapar Participacoes SA | 8,301,000 | 188,098,788 | ||||||
Materials (1.1%) | ||||||||
Vale SA, ADR (a) | 12,405,571 | 85,846,551 | ||||||
Real Estate (1.4%) | ||||||||
Multiplan Empreendimentos Imobiliarios SA | 5,435,025 | 109,228,338 | ||||||
| 711,109,387 | ||||||||
CHILE (1.5%) | ||||||||
Consumer Discretionary (0.1%) | ||||||||
SACI Falabella | 978,637 | 7,678,140 | ||||||
Financials (1.4%) | ||||||||
Banco Santander Chile, ADR | 4,758,846 | 108,739,631 | ||||||
| 116,417,771 | ||||||||
CHINA (5.6%) | ||||||||
Consumer Discretionary (1.6%) | ||||||||
Yum! Brands, Inc. | 1,441,000 | 124,329,480 | ||||||
Energy (1.3%) | ||||||||
PetroChina Co. Ltd., H Shares (b) | 149,132,200 | 102,041,476 | ||||||
Telecommunication Services (2.7%) | ||||||||
China Mobile Ltd. (b) | 18,998,600 | 217,655,409 | ||||||
| 444,026,365 | ||||||||
HONG KONG (8.1%) | ||||||||
Financials (3.9%) | ||||||||
AIA Group Ltd. (b) | 37,700,000 | 237,170,763 | ||||||
Hong Kong Exchanges and Clearing Ltd. (b) | 2,829,741 | 74,808,397 | ||||||
| 311,979,160 | ||||||||
Real Estate (4.2%) | ||||||||
Hang Lung Group Ltd. (b) | 25,049,000 | 95,818,462 | ||||||
Hang Lung Properties Ltd. (b) | 38,882,000 | 85,505,857 | ||||||
Swire Pacific Ltd., Class A (b) | 8,142,000 | 84,626,784 | ||||||
Swire Pacific Ltd., Class B (b) | 15,945,000 | 29,817,721 | ||||||
Swire Properties Ltd. (b) | 13,957,100 | 40,080,322 | ||||||
| 335,849,146 | ||||||||
| 647,828,306 | ||||||||
HUNGARY (1.1%) | ||||||||
Health Care (1.1%) | ||||||||
Richter Gedeon Nyrt (b) | 4,169,840 | 89,514,503 | ||||||
INDIA (16.1%) | ||||||||
Consumer Discretionary (1.4%) | ||||||||
Hero MotoCorp Ltd. (b) | 2,181,035 | 109,475,062 | ||||||
Consumer Staples (3.8%) | ||||||||
Hindustan Unilever Ltd. (b) | 8,215,443 | 103,301,421 | ||||||
ITC Ltd. (b) | 55,993,500 | 202,576,947 | ||||||
| 305,878,368 | ||||||||
Financials (5.1%) | ||||||||
Housing Development Finance Corp. Ltd. (b) | 14,350,533 | 296,258,621 | ||||||
ICICI Bank Ltd. (b) | 25,734,500 | 106,963,728 | ||||||
ICICI Bank Ltd., ADR | 160,500 | 1,330,545 | ||||||
| 404,552,894 | ||||||||
Information Technology (2.3%) | ||||||||
Infosys Ltd. (b) | 8,003,359 | 120,026,247 | ||||||
Tata Consultancy Services Ltd. (b) | 1,839,018 | 65,828,002 | ||||||
| 185,854,249 | ||||||||
Materials (3.5%) | ||||||||
Grasim Industries Ltd. (b) | 8,825,060 | 127,899,890 | ||||||
UltraTech Cement Ltd. (b) | 2,472,250 | 147,006,503 | ||||||
| 274,906,393 | ||||||||
| 1,280,666,966 | ||||||||
INDONESIA (4.6%) | ||||||||
Consumer Discretionary (3.5%) | ||||||||
Astra International Tbk PT (b) | 442,684,500 | 279,292,994 | ||||||
Materials (1.1%) | ||||||||
Indocement Tunggal Prakarsa Tbk PT (b) | 67,234,300 | 84,655,351 | ||||||
| 363,948,345 | ||||||||
ITALY (1.3%) | ||||||||
Energy (1.3%) | ||||||||
Tenaris SA, ADR | 3,829,000 | 107,977,800 | ||||||
MALAYSIA (1.9%) | ||||||||
Financials (1.9%) | ||||||||
CIMB Group Holdings Bhd (b) | 48,880,275 | 58,557,090 | ||||||
Public Bank Bhd | 19,459,200 | 92,123,888 | ||||||
| 150,680,978 | ||||||||
MEXICO (8.1%) | ||||||||
Consumer Staples (3.6%) | ||||||||
Fomento Economico Mexicano SAB de CV, ADR | 2,521,501 | 241,232,001 | ||||||
Organizacion Soriana SAB de CV, Class B (a) | 15,206,779 | 41,329,677 | ||||||
| 282,561,678 | ||||||||
Financials (3.1%) | ||||||||
Grupo Financiero Banorte SAB de CV, Class O | 41,576,148 | 245,264,298 | ||||||
See accompanying Notes to Financial Statements.
Annual Report 2016
20
Statement of Investments (continued)
October 31, 2016
Aberdeen Emerging Markets Fund
| Shares or Principal Amount | Value | |||||||
Industrials (1.4%) | ||||||||
Grupo Aeroportuario del Sureste SAB de CV, ADR | 722,315 | $ | 114,848,085 | |||||
| 642,674,061 | ||||||||
PHILIPPINES (3.9%) | ||||||||
Financials (2.4%) | ||||||||
Ayala Corp. (b) | 3,958,000 | 68,236,661 | ||||||
Bank of the Philippine Islands | 60,725,894 | 126,787,916 | ||||||
| 195,024,577 | ||||||||
Real Estate (1.5%) | ||||||||
Ayala Land, Inc. (b) | 156,930,400 | 117,382,733 | ||||||
| 312,407,310 | ||||||||
POLAND (1.3%) | ||||||||
Financials (1.3%) | ||||||||
Bank Pekao SA (b) | 3,257,741 | 100,547,198 | ||||||
PORTUGAL (1.4%) | ||||||||
Consumer Staples (1.4%) | ||||||||
Jeronimo Martins SGPS SA (b) | 6,446,556 | 110,771,925 | ||||||
REPUBLIC OF SOUTH KOREA (1.8%) | ||||||||
Consumer Staples (0.6%) | ||||||||
Amorepacific Group (b) | 204,893 | 26,449,455 | ||||||
E-MART, Inc. (b) | 114,584 | 16,248,025 | ||||||
| 42,697,480 | ||||||||
Information Technology (1.2%) | ||||||||
NAVER Corp. (b) | 130,796 | 97,857,030 | ||||||
| 140,554,510 | ||||||||
RUSSIA (4.4%) | ||||||||
Consumer Staples (2.3%) | ||||||||
Magnit PJSC (b) | 1,064,168 | 178,439,420 | ||||||
Energy (2.1%) | ||||||||
LUKOIL PJSC, ADR | 3,501,043 | 170,185,700 | ||||||
| 348,625,120 | ||||||||
SOUTH AFRICA (4.1%) | ||||||||
Consumer Discretionary (1.4%) | ||||||||
Truworths International Ltd. (b) | 20,677,863 | 109,708,688 | ||||||
Consumer Staples (1.1%) | ||||||||
Massmart Holdings Ltd. | 10,026,621 | 86,898,001 | ||||||
Materials (0.7%) | ||||||||
BHP Billiton PLC (b) | 3,894,549 | 58,739,474 | ||||||
Telecommunication Services (0.9%) | ||||||||
MTN Group Ltd. (b) | 8,578,000 | 74,091,067 | ||||||
| 329,437,230 | ||||||||
TAIWAN (4.8%) | ||||||||
Information Technology (3.9%) | ||||||||
Taiwan Semiconductor Manufacturing Co. Ltd. (b) | 51,969,117 | 311,884,931 | ||||||
Telecommunication Services (0.9%) | ||||||||
Taiwan Mobile Co. Ltd. (b) | 21,089,255 | 73,787,963 | ||||||
| 385,672,894 | ||||||||
THAILAND (4.5%) | ||||||||
Financials (2.1%) | ||||||||
Siam Commercial Bank PCL, Foreign | 41,390,100 | 169,465,485 | ||||||
Materials (2.4%) | ||||||||
Siam Cement PCL, Foreign Shares (b) | 11,821,000 | 170,228,482 | ||||||
Siam Cement PCL, NVDR (b) | 1,365,300 | 19,496,102 | ||||||
| 189,724,584 | ||||||||
| 359,190,069 | ||||||||
TURKEY (4.6%) | ||||||||
Consumer Staples (1.5%) | ||||||||
BIM Birlesik Magazalar A.S. (b) | 7,270,673 | 118,527,159 | ||||||
Financials (3.1%) | ||||||||
Akbank T.A.S. (b) | 48,783,608 | 130,552,629 | ||||||
Turkiye Garanti Bankasi A.S. (b) | 42,048,837 | 114,420,684 | ||||||
| 244,973,313 | ||||||||
| 363,500,472 | ||||||||
UNITED KINGDOM (1.3%) | ||||||||
Financials (1.3%) | ||||||||
Standard Chartered PLC (a)(b) | 11,610,632 | 100,965,017 | ||||||
Total Common Stocks | 7,106,516,227 | |||||||
PREFERRED STOCKS (8.3%) | ||||||||
BRAZIL (3.3%) | ||||||||
Financials (2.9%) | ||||||||
Banco Bradesco SA, ADR, Preferred Shares | 22,146,143 | 230,541,349 | ||||||
Materials (0.4%) | ||||||||
Vale SA, ADR, Preferred Shares | 5,729,416 | 36,897,439 | ||||||
| 267,438,788 | ||||||||
REPUBLIC OF SOUTH KOREA (5.0%) |
| |||||||
Consumer Staples (0.1%) | ||||||||
Amorepacific Corp., Preferred Shares (b) | 50,666 | 8,843,882 | ||||||
Information Technology (4.9%) |
| |||||||
Samsung Electronics Co. Ltd., Preferred Shares (b) | 336,959 | 387,425,176 | ||||||
| 396,269,058 | ||||||||
Total Preferred Stocks | 663,707,846 | |||||||
See accompanying Notes to Financial Statements.
2016 Annual Report
21
Statement of Investments (concluded)
October 31, 2016
Aberdeen Emerging Markets Fund
| Shares or Principal Amount | Value | |||||||
SHORT-TERM INVESTMENT (2.5%) | ||||||||
UNITED STATES (2.5%) | ||||||||
State Street Institutional U.S. Government Money Market Fund (c) | $ | 200,531,487 | $ | 200,531,487 | ||||
Total Short-Term Investment | 200,531,487 | |||||||
Total Investments | 7,970,755,560 | |||||||
Liabilities in excess of other assets—(0.1)% |
| (10,255,636 | ) | |||||
Net Assets—100.0% | $ | 7,960,499,924 | ||||||
| (a) | Non-income producing security. |
| (b) | Fair Valued Security. Fair Values are determined pursuant to procedures approved by the Fund’s Board of Trustees. See Note 2(a) of the accompanying Notes to Financial Statements. |
| (c) | Registered investment company advised by State Street Global Advisors. |
| (d) | See accompanying Notes to Financial Statements for tax unrealized appreciation/(depreciation) of securities. |
| ADR | American Depositary Receipt |
| NVDR | Non-Voting Depositary Receipt |
See accompanying Notes to Financial Statements.
Annual Report 2016
22
Aberdeen Equity Long-Short Fund (Unaudited)
The Aberdeen Equity Long-Short Fund (Institutional Class shares net of fees) returned -1.40% for the 12-month period ended October 31, 2016, versus 0.22% for its benchmark, the Citigroup 3-Month Treasury Bill Index, and 4.51% for the U.S. broader-market Standard & Poor’s (S&P) 500 Index, for the same period. For broader comparison, the average return of the Fund’s peer category of Alternative Long/Short Equity Funds (consisting of 157 funds), as measured by Lipper, Inc., was -1.30% for the period.
Major North American equity market indices posted modest gains despite numerous periods of volatility over the 12-month period ended October 31, 2016. The primary catalysts of the market’s performance were continued speculation regarding U.S. Federal Reserve (Fed) monetary policy, generally positive economic data reports and, particularly later in the period, uncertainty regarding the pending U.S. presidential election. Large-cap stocks, as measured by the S&P 500 Index, rose 4.51% for the reporting period, modestly outperforming the 4.11% return of the small-cap equity market benchmark, the Russell 2000 Index. The utilities, telecommunication services and information technology sectors captured double-digit returns and were the strongest performers within the S&P 500 Index over the reporting period, while the healthcare and consumer discretionary sectors lost ground and were the most notable market laggards. The materials and utilities sectors posted the highest returns within the Russell 2000 Index for the period. Conversely, energy and healthcare were the weakest-performing sectors.
Shortly after the end of the reporting period in early November, Republican Donald Trump won the U.S. presidential election, garnering a majority of electoral votes in the race against his Democratic Party opponent, former U.S. Secretary of State Hillary Clinton. The outcome of the election was widely unexpected, as Clinton led most major polls for much of the campaign. Regarding monetary policy, the Fed raised its benchmark interest rate by 25 basis points (bps) to a range of 0.25%-0.50% at its meeting in December 2015, and subsequently left the rate unchanged over the next ten months, noting the pick-up in economic activity and steady job gains. However, the decisions following the Fed’s meetings in July, September and November 2016 were not unanimous, as several Fed governors voted for an increase of 25 bps.
On the economic front, the U.S. Department of Commerce reported that gross domestic product (GDP) expanded by 0.9%, 0.8%, 1.4% and 2.9% for the fourth quarter of 2015 and the first three quarters of 2016, respectively. Upturns in consumer spending and exports offset the negative impact of a decline in residential fixed investment and an increase in imports (which are subtracted from GDP) over the period. According to the U.S. Department of Labor, the U.S. economy added an average of approximately 173,000 jobs per month over the 12-month reporting period, and the unemployment rate dipped 0.1% to 4.9%. Furthermore, while the labor force participation rate1 rose 0.3 percentage point over the reporting period, it has remained virtually flat over the past three years as more jobseekers have entered the market.
In an environment of rising stock prices over the reporting period, the Fund’s long positions enhanced performance and collectively outperformed both the S&P 500 and Russell 2000 indices. The aggregate return of the Fund’s short exposures slightly exceeded that of the S&P 500 Index, and had a negative impact on Fund performance during the period.
Fund performance benefited over the period mainly from long holdings in the industrials and materials sectors, as well as the short exposure to the consumer discretionary sector. The most notable contributors to performance among individual stocks were long holdings in specialty apparel retailer PVH Corp. and semiconductor manufacturer Texas Instruments, and a short position in casual restaurant chain operator Chipotle Mexican Grill.
PVH Corp. posted generally positive results during the reporting period. The company benefited mainly from strength in its Calvin Klein and Tommy Hilfiger brands and international business, which offset relative weakness in its Heritage brand. In our view, the company has been executing well fundamentally, despite encountering a stiff revenue headwind from the strong U.S. dollar over the latter half of the reporting period. Texas Instruments’ quarterly results over the period were bolstered by record-high margins attributable mainly to a reduction in manufacturing costs and a switch in production from 200- to 300-millimeter semiconductor wafers. There was particular strength in its embedded processing and automotive units over the period, as well as notable revenue growth in its industrial market segment for the third quarter of 2016 compared to the same periods a year earlier. The short position in Chipotle Mexican Grill benefited Fund performance as the company saw year-over-year decreases in revenue and earnings over the reporting period, and suffered its first quarterly loss in the first quarter of its 2016 fiscal year. Chipotle has been plagued by declining traffic in its stores following outbreaks of E. coli at its restaurants in several states in October and November 2015. The slowdown in business compressed the company’s valuation and lowered expectations for its earnings power.
Short positions in the information technology, industrials and energy sectors weighed on Fund performance for the reporting period. The primary individual stock detractors included a long holding in global real estate development and investment firm Jones Lang LaSalle, and short positions in packaged foods producer B&G Foods and technology company IBM Corp.
While Jones Lang LaSalle reported generally better-than-expected results during the reporting period, investors’ concerns about a slowdown in the global property leasing market weighed on the stock price. B&G Foods posted better-than-expected results for the first two quarters of its 2016 fiscal year, attributable largely to strength in its Green Giant brand, which the company acquired in November 2015. Nonetheless, there was relative weakness in the company’s core business, particularly in its TrueNorth-branded products. Finally, IBM’s results for the first and second quarters of its 2016 fiscal year generally exceeded the market’s expectations, bolstered largely by its
| 1 | The labor force participation rate is expressed as a percentage of the U.S. population aged 16 years and older working or actively seeking work. |
2016 Annual Report
23
Aberdeen Equity Long-Short Fund (Unaudited) (continued)
cloud computing segment. The size of the Fund’s short position in IBM is relatively large, which amplified the holding’s negative impact on performance for the period.
As the reporting period progressed, we found what we viewed as several good opportunities for new positions within the long segment of the Fund and exited several holdings where we were concerned about deteriorating fundamentals or high valuations. During the reporting period, we established new long holdings in credit-rating agency Moody’s Corp.; regional bank holding company M&T Bank Corp.; industrial automation power company Rockwell Automation; Verisk, a risk assessment and data analytics company; industrial bearings manufacturer RBC Bearings; medical device maker Globus Medical; energy services provider Core Laboratories; medical technology products maker Teleflex; flavors and fragrances maker Sensient Technologies; Arkansas-based Bank of the Ozarks; Richie Brothers Auctioneers, an auctioneer of industrial equipment; and cosmetics maker Estee Lauder. Conversely, among others, we exited several of the Fund’s long positions, including pharmaceutical firm Pfizer; IT services provider EMC Corp.; fertilizer maker Potash Corp. of Saskatchewan; discount retailer Target; energy pipeline company TransCanada; and diversified industrial company Emerson Electric. We also reduced our holdings in diversified financial services companies by exiting BlackRock, American Express, Wells Fargo & Co. and Jones Lang LaSalle. We exited microscope technology company FEI Company, which was acquired by Thermo Fisher Scientific, as well as our positions in Qualcomm and Verizon.
We also made numerous changes to the short segment of the Fund. We initiated short positions in specialty retailer Tractor Supply Co.; The Gap, a specialty apparel retailer; diversified financial services company State Street Corp.; Priceline Group, a provider of travel and restaurant reservations and related services; beverage-maker Dr Pepper Snapple Group; Deluxe Corp., a provider of payment solutions for businesses; Lululemon Athletica, a retailer and distributor of specialty athletic apparel; and fast-food restaurant chain operators McDonald’s Corp. and Wendy’s Co. We exited the Fund’s short exposures to United Natural Foods; department store operator Kohl’s Corp.; diversified financial services company Northern Trust; asset management firm Legg Mason; data storage services provider NetApp; oil and gas drilling services provider Patterson-UTI Energy; Leggett & Platt, a manufacturer of engineered components; and healthcare services provider Cardinal Health.
At the end of the reporting period on October 31, 2016, the Fund had a net long position2 of roughly 39% and gross exposure3 of 129%, versus the respective 44% and 124% positions at the beginning of the period on November 1, 2015. The lower net exposure reflects the increased volatility in both the market environment and individual stock price movements.
Following the end of the reporting period, Donald Trump was elected as the 45th president of the U.S. in early November in another example of a vote against the status quo, in our opinion. As with the UK Brexit4 referendum, it appeared that many people voted against the “establishment” as the Trump campaign promised meaningful changes to regulation, trade policy and an increase in infrastructure improvement funding within the U.S.
The markets swiftly priced in many of the possible changes that had been proposed, boosting the U.S. dollar and the stocks of companies that will benefit from government fiscal stimulus or looser regulation. Those companies which compete on a global basis have had more mixed results as the Trump campaign suggested tougher trade policies, which helped the stocks of companies with strong foreign competition within the U.S. and hindered those which rely more on global trade. The anticipated shifts in policy are expected to drive economic growth, while increasing the potential for rising national debt and eventually leading to higher inflation.
However, we feel that there are many unknowns that still need to be sorted out both prior to and following the presidential inauguration on January 20, 2017, which we feel leaves the risk of continued volatility in the markets. Our strategy is built with a balanced, bottom-up investment approach, which we think could provide opportunities to take advantage of the large swings in stock prices seen through mid-November. While we do not expect a verbatim enactment of the entire list of campaign promises, we still see a lot of opportunity resulting from the market swings.
Specifically, there have been extreme fluctuations in valuations between the companies that benefit from expected regulatory change and those which have been hampered by higher interest rates, a slowdown in trade, or inflation. This has unwound much of the overvaluation we previously saw in higher dividend-paying companies and those with generally stable business models. Consequently, we see the volatility as an opportunity in some cases to add to higher-quality holdings and, in others, to potentially reduce our portfolios’ exposure to shares of more volatile or recently overvalued companies.
Portfolio Management:
Aberdeen North American Equity Team
PAST PERFORMANCE DOES NOT GUARANTEE FUTURE RESULTS.
The performance data quoted represents past performance and current returns may be lower or higher. Class A Shares have up to a 5.75% front-end sales charge and a 0.25% 12b-1 fee. The investment return and principal value will fluctuate so that an investor’s shares, when redeemed, may be worth more or less than the original cost. To obtain performance information current to the most recent month-end, which may be higher or lower than the performance shown above, please call 866-667-9231 or go to www.aberdeen-asset.us.
Investing in mutual funds involves risk, including possible loss of principal.
Indexes are unmanaged and have been provided for comparison purposes only. No fees or expenses are reflected. You cannot invest directly in an index.
Lipper is a leading global provider of mutual fund information and analysis to fund companies, financial intermediaries and media organizations.
| 2 | The Fund’s net long position is the difference between the percentage of assets invested in long positions and the percentage of assets invested in short positions. |
| 3 | The Fund’s gross exposure is the sum of the percentage of assets invested in long positions plus the percentage of assets invested in short positions. |
| 4 | Brexit is an abbreviation of “British exit,” which refers to the June 23, 2016 referendum by British voters to exit the European Union. |
Annual Report 2016
24
Aberdeen Equity Long-Short Fund (Unaudited) (concluded)
Risk Considerations
There are special risks associated with selling securities short. A short position will lose value as the security’s price increases. Theoretically, the loss on a short sale can be unlimited. The use of leverage will also increase market exposure and magnify risk.
Equity stocks of small- and mid-cap companies carry greater risk and more volatility than equity stocks of larger, more established companies.
Investing a significant portion of the Fund’s assets in securities of companies conducting business in a broadly related group of industries within an economic sector may make the Fund more vulnerable to unfavorable developments in that sector.
Please read the prospectus for more detailed information regarding these and other risks.
2016 Annual Report
25
Aberdeen Equity Long-Short Fund (Unaudited)
| Average Annual Total Return1 (For periods ended October 31, 2016) | 1 Yr. | 5 Yr. | 10 Yr. | |||||||||||
Class A | w/o SC | (1.68% | ) | 2.54% | 2.28% | |||||||||
| w/SC2 | (7.34% | ) | 1.34% | 1.67% | ||||||||||
Class C | w/o SC | (2.35% | ) | 1.86% | 1.57% | |||||||||
| w/SC3 | (3.12% | ) | 1.86% | 1.57% | ||||||||||
Class R4 | w/o SC | (2.01% | ) | 2.13% | 1.91% | |||||||||
Institutional Service Class4,5 | w/o SC | (1.54% | ) | 2.63% | 2.43% | |||||||||
Institutional Class4 | w/o SC | (1.40% | ) | 2.87% | 2.58% | |||||||||
All figures showing the effect of a sales charge (SC) reflect the maximum charge possible because it has the most significant effect on performance data. The total returns shown above do not include the impact of financial statement rounding of the net asset value (NAV) per share and/or financial statement adjustments.
| 1 | Returns prior to June 23, 2008 reflect the performance of a predecessor fund (the “Predecessor Fund”). Returns of the Predecessor Fund have not been adjusted to reflect the expenses applicable to the respective classes. The Fund and the Predecessor Fund have substantially similar investment objectives and strategies. Please consult the Fund’s prospectus for more detail. |
| 2 | A 5.75% front-end sales charge was deducted. |
| 3 | A 1.00% contingent deferred sales charge (CDSC) was deducted from the one year return because it is charged when Class C shares are sold within the first year after purchase. |
| 4 | Not subject to any sales charges. |
| 5 | Returns before the first offering of the Institutional Service Class (November 1, 2009) are based on the previous performance of the Institutional Class. Excluding the effect of any fee waivers or reimbursements, this performance is substantially similar to what the Institutional Service Class would have produced because both classes invest in the same portfolio of securities. Returns would only differ to the extent of differences in expenses of the two classes. |
Annual Report 2016
26
Aberdeen Equity Long-Short Fund (Unaudited)
Performance of a $10,000 Investment (as of October 31, 2016)
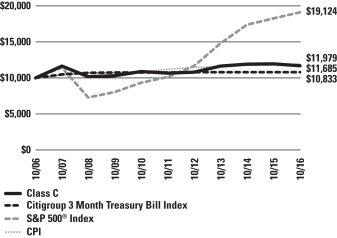
Comparative performance of $10,000 invested in Class C shares of the Aberdeen Equity Long-Short Fund, the S&P 500® Index, the Citigroup 3-Month Treasury Bill Index and the Consumer Price Index (CPI) over a 10-year period ended October 31, 2016. Unlike the Fund, the returns for these unmanaged indexes do not reflect any fees, expenses, or sales charges. Investors cannot invest directly in market indexes.
The S&P 500® Index represents large-cap U.S. equities. The index includes 500 leading companies and captures approximately 80% coverage of available U.S. market capitalization. The Citigroup 3-Month Treasury Bill Index measures return equivalents of yield averages. The Citigroup 3-Month Treasury Bill Index consists of the last three three-month Treasury bill month-end rates. The index is not marked to market.
The CPI is a measure of the average change over time in the prices paid by urban consumers for a market basket of consumer goods and services.
Investment return and principal value will fluctuate, and when redeemed, shares may be worth more or less than original cost. Past performance is no guarantee of future results. The Average Annual Total Return table and Performance graph do not reflect the deduction of taxes that a shareholder would pay on fund distributions or the redemption of fund shares. Investing in mutual funds involves market risk, including loss of principal. Performance returns assume the reinvestment of all distributions. Total returns reflect waivers and reimbursements in effect, without which returns would have been lower.
Portfolio Summary (as a percentage of net assets)
October 31, 2016 (Unaudited)
| Long Positions | ||||
| Asset Allocation | ||||
Common Stocks | 84.0% | |||
Short-Term Investment | 15.0% | |||
Other assets in excess of liabilities | 1.0% | |||
| 100.0% | ||||
The following table summarizes the composition of the Fund’s portfolio, in Standard & Poor’s Global Industry Classification Standard (GICS) sectors, expressed as a percentage of net assets. The GICS structure consists of 11 sectors, 24 industry groups, 68 industries and 157 sub-industries. As of October 31, 2016, the Fund did not have more than 25% of its assets invested in any industry group.
| Top Sectors of Long Positions | ||||
Financials | 14.9% | |||
Industrials | 14.6% | |||
Information Technology | 13.1% | |||
Consumer Staples | 11.3% | |||
Health Care | 9.5% | |||
Consumer Discretionary | 8.5% | |||
Materials | 6.2% | |||
Energy | 5.9% | |||
Other | 16.0% | |||
| 100.0% | ||||
| Top Holdings of Long Positions* | ||||
M&T Bank Corp. | 3.7% | |||
Visa, Inc., Class A | 3.6% | |||
Intercontinental Exchange, Inc. | 2.8% | |||
Casey’s General Stores, Inc. | 2.7% | |||
Texas Instruments, Inc. | 2.6% | |||
Charles Schwab Corp. (The) | 2.6% | |||
Oracle Corp. | 2.5% | |||
Deere & Co. | 2.5% | |||
PAREXEL International Corp. | 2.4% | |||
EOG Resources, Inc. | 2.4% | |||
Other | 72.2% | |||
| 100.0% | ||||
| * | For the purpose of listing top holdings, Short-Term Investments are included as part of Other. |
2016 Annual Report
27
Aberdeen Equity Long-Short Fund (Unaudited) (concluded)
| Short Positions | ||||
| Asset Allocation | ||||
Common Stocks | 43.0% | |||
Exchange Traded Funds | 2.0% | |||
Other assets in excess of liabilities | 55.0% | |||
| 100.0% | ||||
| Top Sectors of Short Positions | ||||
Consumer Discretionary | 14.0% | |||
Consumer Staples | 7.9% | |||
Financials | 7.1% | |||
Industrials | 6.2% | |||
Information Technology | 5.2% | |||
Health Care | 2.6% | |||
Other | 57.0% | |||
| 100.0% | ||||
| Top Holdings of Short Positions | ||||
Clorox Co. | 3.0% | |||
State Street Corp. | 2.8% | |||
Priceline Group, Inc. (The) | 2.7% | |||
CA, Inc. | 2.6% | |||
Agilent Technologies, Inc. | 2.6% | |||
International Business Machines Corp. | 2.5% | |||
Allstate Corp. (The) | 2.3% | |||
Fastenal Co. | 2.3% | |||
Chipotle Mexican Grill, Inc. | 2.3% | |||
PACCAR, Inc. | 2.3% | |||
Other | 74.6% | |||
| 100.0% | ||||
Annual Report 2016
28
Statement of Investments
October 31, 2016
Aberdeen Equity Long-Short Fund
| Shares or Principal Amount | Value | |||||||
COMMON STOCKS — LONG POSITIONS (84.0%) |
| |||||||
Consumer Discretionary (8.5%) | ||||||||
BorgWarner, Inc. | 41,441 | $ | 1,485,246 | |||||
Comcast Corp., Class A | 22,288 | 1,377,844 | ||||||
PVH Corp. | 14,884 | 1,592,290 | ||||||
TJX Cos., Inc. (The) | 21,388 | 1,577,365 | ||||||
| 6,032,745 | ||||||||
Consumer Staples (11.3%) | ||||||||
Casey’s General Stores, Inc. | 17,096 | 1,931,677 | ||||||
Costco Wholesale Corp. | 11,197 | 1,655,700 | ||||||
CVS Health Corp. | 19,366 | 1,628,681 | ||||||
Estee Lauder Cos., Inc. (The), Class A | 15,792 | 1,375,957 | ||||||
Philip Morris International, Inc. | 14,582 | 1,406,288 | ||||||
| 7,998,303 | ||||||||
Energy (5.9%) | ||||||||
Core Laboratories NV | 12,687 | 1,230,258 | ||||||
EOG Resources, Inc. | 18,364 | 1,660,473 | ||||||
Schlumberger Ltd. | 16,280 | 1,273,585 | ||||||
| 4,164,316 | ||||||||
Financials (14.9%) | ||||||||
American International Group, Inc. | 23,845 | 1,471,237 | ||||||
Bank of the Ozarks, Inc. | 28,297 | 1,045,857 | ||||||
Charles Schwab Corp. (The) | 57,997 | 1,838,505 | ||||||
Intercontinental Exchange, Inc. | 7,332 | 1,982,499 | ||||||
M&T Bank Corp. | 21,106 | 2,590,339 | ||||||
Moody’s Corp. | 15,801 | 1,588,317 | ||||||
| 10,516,754 | ||||||||
Health Care (9.5%) | ||||||||
Baxter International, Inc. | 27,122 | 1,290,736 | ||||||
Gilead Sciences, Inc. | 17,200 | 1,266,436 | ||||||
Globus Medical, Inc., Class A (a) | 64,988 | 1,438,185 | ||||||
PAREXEL International Corp. (a) | 28,827 | 1,679,461 | ||||||
Teleflex, Inc. | 7,063 | 1,010,927 | ||||||
| 6,685,745 | ||||||||
Industrials (14.6%) | ||||||||
Canadian National Railway Co. | 20,875 | 1,312,411 | ||||||
Deere & Co. | 19,880 | 1,755,404 | ||||||
Equifax, Inc. | 9,841 | 1,219,989 | ||||||
Lockheed Martin Corp. | 4,204 | 1,035,781 | ||||||
RBC Bearings, Inc. (a) | 19,356 | 1,381,051 | ||||||
Ritchie Bros Auctioneers, Inc. | 25,962 | 898,026 | ||||||
Rockwell Automation, Inc. | 10,900 | 1,304,948 | ||||||
Verisk Analytics, Inc. (a) | 17,488 | 1,426,146 | ||||||
| 10,333,756 | ||||||||
Information Technology (13.1%) | ||||||||
Alliance Data Systems Corp. (a) | 4,900 | 1,001,903 | ||||||
Cognizant Technology Solutions Corp., Class A (a) | 25,809 | 1,325,292 | ||||||
Manhattan Associates, Inc. (a) | 15,730 | 796,567 | ||||||
Oracle Corp. | 46,313 | 1,779,345 | ||||||
Texas Instruments, Inc. | 26,360 | 1,867,606 | ||||||
Visa, Inc., Class A | 30,429 | 2,510,697 | ||||||
| 9,281,410 | ||||||||
Materials (6.2%) | ||||||||
Ecolab, Inc. | 13,411 | 1,531,134 | ||||||
Praxair, Inc. | 12,014 | 1,406,359 | ||||||
Sensient Technologies Corp. | 18,910 | 1,408,984 | ||||||
| 4,346,477 | ||||||||
Total Common Stocks — Long Positions | 59,359,506 | |||||||
SHORT-TERM INVESTMENT (15.0%) | ||||||||
State Street Institutional U.S. Government Money Market Fund (b) | 10,646,044 | 10,646,044 | ||||||
Total Short-Term Investment | 10,646,044 | |||||||
Total Investments | 70,005,550 | |||||||
Other assets in excess of liabilities—1.0% | 673,998 | |||||||
Net Assets—100.0% | $ | 70,679,548 | ||||||
COMMON STOCKS — SHORT POSITIONS (43.0%) |
| |||||||
Consumer Discretionary (14.0%) | ||||||||
Chipotle Mexican Grill, Inc. (a) | 4,451 | 1,605,743 | ||||||
Gap, Inc. | 55,562 | 1,532,955 | ||||||
Garmin Ltd. | 32,453 | 1,569,427 | ||||||
McDonald’s Corp. | 9,403 | 1,058,496 | ||||||
Priceline Group, Inc. (The) (a) | 1,278 | 1,884,066 | ||||||
Tractor Supply Co. | 16,300 | 1,020,869 | ||||||
Wendy’s Co. | 113,599 | 1,231,413 | ||||||
| 9,902,969 | ||||||||
Consumer Staples (7.9%) | ||||||||
B&G Foods, Inc. | 28,000 | 1,187,200 | ||||||
Clorox Co. | 17,890 | 2,147,158 | ||||||
Dr Pepper Snapple Group, Inc. | 15,699 | 1,378,215 | ||||||
Whole Foods Market, Inc. | 31,100 | 879,819 | ||||||
| 5,592,392 | ||||||||
Financials (7.1%) | ||||||||
Allstate Corp. (The) | 23,938 | 1,625,390 | ||||||
FactSet Research Systems, Inc. | 9,375 | 1,450,500 | ||||||
State Street Corp. | 28,043 | 1,968,899 | ||||||
| 5,044,789 | ||||||||
Health Care (2.6%) | ||||||||
Agilent Technologies, Inc. | 41,400 | 1,803,798 | ||||||
Industrials (6.2%) | ||||||||
Deluxe Corp. | 19,090 | 1,168,308 | ||||||
Fastenal Co. | 41,580 | 1,620,789 | ||||||
PACCAR, Inc. | 29,000 | 1,592,680 | ||||||
| 4,381,777 | ||||||||
Information Technology (5.2%) | ||||||||
CA, Inc. | 60,400 | 1,856,696 | ||||||
International Business Machines Corp. | 11,729 | 1,802,630 | ||||||
| 3,659,326 | ||||||||
Total Common Stocks — Short Positions | 30,385,051 | |||||||
See accompanying Notes to Financial Statements.
2016 Annual Report
29
Statement of Investments (concluded)
October 31, 2016
Aberdeen Equity Long-Short Fund
| Shares or Principal Amount | Value | |||||||
EXCHANGE TRADED FUNDS — SHORT POSITIONS (2.0%) |
| |||||||
Equity Fund (2.0%) | ||||||||
Utilities Select Sector SPDR Fund | 28,380 | $ | 1,402,823 | |||||
Total Exchange Traded Funds — Short Positions |
| 1,402,823 | ||||||
Total Securities Sold Short | $ | 31,787,874 | ||||||
| (a) | Non-income producing security. |
| (b) | Registered investment company advised by State Street Global Advisors. |
| (c) | See accompanying Notes to Financial Statements for tax unrealized appreciation/(depreciation) of securities. |
See accompanying Notes to Financial Statements.
Annual Report 2016
30
Aberdeen Global Equity Fund (Unaudited)
The Aberdeen Global Equity Fund (Institutional Class shares net of fees) returned 2.36% for the 12-month period ended October, 2016, versus the 1.79% return of its benchmark, the Morgan Stanley Capital International (MSCI) World Index, and the 2.64% return of its secondary benchmark, the MSCI All Country World Index (ACWI), during the same period. For broader comparison, the average return of the Fund’s peer category of Global Large-Cap Core Funds (comprising 23 funds), as measured by Lipper, Inc., was -0.19% for the period.
Global equities rose during the reporting period despite numerous bouts of volatility. Stock markets tumbled early in the period when commodity prices plummeted and the U.S. Federal Reserve (Fed) raised interest rates for the first time in a decade, and again in June 2016, when the UK voted to leave the European Union. However, investor sentiment recovered quickly in both instances. Meanwhile, investors reacted positively as central banks in Japan and parts of Europe unexpectedly imposed negative interest rates to combat low inflation and boost spending, while persistent deflationary pressures forced the Fed to maintain an accommodative monetary policy stance. The end of the period saw anxiety rise again, ahead of a nail-biting finish to the U.S. presidential election in early November. Republican Donald Trump subsequently won the election on November 8, garnering a majority of electoral votes in the race against his Democratic Party opponent, former U.S. Secretary of State Hillary Clinton. Elsewhere, oil prices fluctuated throughout the reporting period, in tandem with ongoing speculation over a production cap by members of the Organization of the Petroleum Exporting Countries (OPEC).
At the stock level, the position in Banco Bradesco contributed positively to Fund performance for the reporting period, riding the rally in Brazilian stocks. The upturn was supported by rising investor confidence as Michel Temer took over as the country’s president and an ambitious program of reforms was unveiled in an effort to buttress the country’s public finances. The holding in Taiwan Semiconductor Manufacturing Co. also benefited Fund performance. The company’s shares rose in line with the wider semiconductor industry, as solid demand improved the company’s cash flows. Shin-Etsu Chemical Co.’s stock price rose as its core polyvinyl chloride (PVC) business posted healthy results over the reporting period. The company plans to build a new local silicone production plant in a bid to take advantage of the rapidly expanding market.
Conversely, the Fund’s position in IT services provider Cognizant Technology Solutions detracted from performance after the company disclosed that it was conducting an internal probe to determine whether certain payments the company made relating to facilities in India were in violation of the U.S. Foreign Corrupt Practices Act. This was followed quickly by the resignation of president, Gordon Coburn. Rajeev Mehta, a 20-year veteran with the company, was appointed as his replacement. Additionally, shares of Fund holdings Perrigo Co. and Novartis fell in line with the broader healthcare and pharmaceuticals sectors, which were weighed down by concerns about the impact of the outcome of the upcoming U.S. election on pharmaceutical prices.
During the reporting period, we initiated positions in Housing Development Finance Corp. (HDFC); subway operator MTR Corp.; IT software and services provider Amdocs; pharmaceutical firm Perrigo Co.; Thailand-based commercial bank Kasikornbank; and manufacturing company Keyence. We also established new positions in restaurant, coffee shop and budget hotel group Whitbread due to its competitiveness in the UK, as well as its ambitions to expand overseas; and U.S.-based software and services provider Amdocs, which benefits from increased outsourcing in its core segments and solid client retention, providing the company with a robust recurring revenue stream, in our view.
We exited positions over the reporting period in U.S. diversified healthcare company Baxter International; French electricity distributor Schneider Electric; Swiss multi-lines insurer Zurich Insurance; Sweden-based Nordea Bank; Brazilian miner Vale, and diversified financial services company HSBC Holdings. Furthermore, we exited the Fund’s position in freight railroad operator Canadian National Railway. While the stock performed well over the reporting period, we feel that the company faces an increasingly challenging operating environment.
We anticipate that global markets will remain cautious in light of the unexpected U.S. election result, which rattled financial markets in a reactionary sell-off. Until there is greater clarity on President-elect Trump’s policies, we think that it is difficult to predict the impact on the U.S. dollar and the Fed’s monetary policy, and more turmoil is expected in coming months. Meanwhile, we believe that there may be further uncertainty driven by the upcoming Brexit1 negotiations, mounting debt concerns in China, and uncertainty over central bank policy in Europe. We think that oil prices likely will remain in the doldrums, with OPEC members showing few signs of achieving consensus on reducing output. Despite the turbulent outlook, we maintain faith in our investment process, which seeks opportunities to add to what we believe are high-quality holdings at a good price, which we feel should benefit the Fund’s performance over the long term.
Portfolio Management:
Aberdeen Global Equity Team
PAST PERFORMANCE DOES NOT GUARANTEE FUTURE RESULTS.
The performance data quoted represents past performance and current returns may be lower or higher. Class A Shares have up to a 5.75% front-end sales charge and a 0.25% 12b-1 fee. The investment return and principal value will fluctuate so that an investor’s shares, when redeemed, may be worth more or less than the original cost. To obtain performance information current to the most recent month-end, which may be higher or lower than the performance shown above, please call 866-667-9231 or go to www.aberdeen-asset.us.
Investing in mutual funds involves risk, including the possible loss of principal.
Indexes are unmanaged and have been provided for comparison purposes only. No fees or expenses are reflected. You cannot invest directly in an index.
Lipper is a leading global provider of mutual fund information and analysis to fund companies, financial intermediaries and media organizations.
| 1 | Brexit is an abbreviation of “British exit,” which refers to the June 23, 2016 referendum by British voters to exit the European Union. |
2016 Annual Report
31
Aberdeen Global Equity Fund (Unaudited) (concluded)
Risk Considerations
Foreign securities may be more volatile, harder to price and less liquid than U.S. securities. They are subject to different accounting and regulatory standards, currency exchange rates, political and economic risks. Fluctuation in currency exchange rates may impact the Fund’s returns more greatly to the extent the Fund does not hedge currency exposure or hedging techniques are unsuccessful. The foregoing risks are enhanced in emerging market countries.
Equity stocks of small- and mid-cap companies carry greater risk and more volatility than equity stocks of larger, more established companies.
Investing a significant portion of the Fund’s assets in securities of companies conducting business in a broadly related group of industries within an economic sector may make the Fund more vulnerable to unfavorable developments in that sector.
Please read the prospectus for more detailed information regarding these and other risks.
Annual Report 2016
32
Aberdeen Global Equity Fund (Unaudited)
| Average Annual Total Return1 (For periods ended October 31, 2016) | 1 Yr. | 5 Yr. | 10 Yr. | |||||||||||
Class A | w/o SC | 1.93% | 3.77% | 2.04% | ||||||||||
| w/SC2 | (3.93% | ) | 2.54% | 1.44% | ||||||||||
Class C | w/o SC | 1.24% | 3.09% | 1.35% | ||||||||||
| w/SC3 | 0.24% | 3.09% | 1.35% | |||||||||||
Class R4 | w/o SC | 1.64% | 3.49% | 1.78% | ||||||||||
Institutional Service Class4,5 | w/o SC | 2.26% | 4.13% | 2.22% | ||||||||||
Institutional Class4 | w/o SC | 2.36% | 4.14% | 2.29% | ||||||||||
All figures showing the effect of a sales charge (SC) reflect the maximum charge possible because it has the most significant effect on performance data. The total returns shown above do not include the impact of financial statement rounding of the net asset value (NAV) per share and/or financial statement adjustments.
| 1 | Returns prior to June 23, 2008 reflect the performance of a predecessor fund (the “Predecessor Fund”). Returns of the Predecessor Fund have not been adjusted to reflect the expenses applicable to the respective classes. The Fund and the Predecessor Fund have substantially similar investment objectives and strategies. Please see footnotes for the relevant classes and consult the Fund’s prospectus for more detail. |
| 2 | A 5.75% front-end sales charge was deducted. |
| 3 | A 1.00% contingent deferred sales charge (CDSC) was deducted from the one year return because it is charged when Class C shares are sold within the first year after purchase. |
| 4 | Not subject to any sales charges. |
| 5 | Returns before the first offering of the Institutional Service Class (December 19, 2011) are based on the previous performance of the Fund’s Class A shares. Excluding the effect of any fee waivers or reimbursements, this performance is substantially similar to what the Institutional Service Class would have produced because both classes invest in the same portfolio of securities. Returns would only differ to the extent of the differences in expenses of the classes. |
2016 Annual Report
33
Aberdeen Global Equity Fund (Unaudited)
Performance of a $10,000 Investment (as of October 31, 2016)
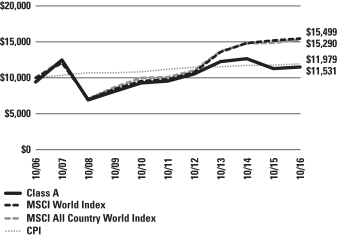
Comparative performance of $10,000 invested in Class A shares of the Aberdeen Global Equity Fund, Morgan Stanley Capital International (MSCI) World Index, MSCI All Country World Index (ACWI) and the Consumer Price Index (CPI) over a 10-year period ended October 31, 2016. Unlike the Fund, the returns for these unmanaged indexes do not reflect any fees, expenses or sales charges. Investors cannot invest directly in market indexes.
The MSCI World Index captures large and mid cap representation across 23 Developed Markets (DM) countries. With 1,647 constituents, the index covers approximately 85% of the free float-adjusted market capitalization in each country. DM countries are: Australia, Austria, Belgium, Canada, Denmark, Finland, France, Germany, Hong Kong, Ireland, Israel, Italy, Japan, Netherlands, New Zealand, Norway, Portugal, Singapore, Spain, Sweden, Switzerland, the UK and the US.
MSCI ACWI captures large and mid cap representation across 23 Developed Markets (DM) and 23 Emerging Markets (EM) countries. With 2,470 constituents, the index covers approximately 85% of the global investable equity opportunity set. EM countries are: Brazil, Chile, China, Colombia, Czech Republic, Egypt, Greece, Hungary, India, Indonesia, Korea, Malaysia, Mexico, Peru, Philippines, Poland, Russia, Qatar, South Africa, Taiwan, Thailand, Turkey and United Arab Emirates.
The CPI is a measure of the average change over time in the prices paid by urban consumers for a market basket of consumer goods and services.
Investment return and principal value will fluctuate, and when redeemed, shares may be worth more or less than original cost. Past performance is no guarantee of future results. The Average Annual Total Return table and Performance graph do not reflect the deduction of taxes that a shareholder would pay on fund distributions or the redemption of fund shares. Investing in mutual funds involves market risk, including loss of principal. Performance returns assume the reinvestment of all distributions. Total returns reflect waivers and reimbursements in effect, without which returns would have been lower.
Portfolio Summary
| Asset Allocation | ||||
Common Stocks | 91.4% | |||
Preferred Stocks | 6.5% | |||
Short-Term Investment | 3.9% | |||
Liabilities in excess of other assets | (1.8% | ) | ||
| 100.0% | ||||
The following table summarizes the composition of the Fund’s portfolio, in Standard & Poor’s Global Industry Classification Standard (GICS) sectors, expressed as a percentage of net assets. The GICS structure consists of 11 sectors, 24 industry groups, 68 industries and 157 sub-industries. As of October 31, 2016, the Fund did not have more than 25% of its assets invested in any industry group.
| Top Sectors | ||||
Consumer Staples | 20.0% | |||
Information Technology | 16.7% | |||
Financials | 11.8% | |||
Health Care | 11.6% | |||
Industrials | 9.1% | |||
Energy | 8.9% | |||
Materials | 7.7% | |||
Consumer Discretionary | 5.4% | |||
Real Estate | 3.4% | |||
Telecommunication Services | 3.3% | |||
Other | 2.1% | |||
| 100.0% | ||||
Annual Report 2016
34
Aberdeen Global Equity Fund (Unaudited) (concluded)
| Top Holdings* | ||||
EOG Resources, Inc. | 4.0% | |||
Shin-Etsu Chemical Co. Ltd. | 3.3% | |||
Roche Holding AG | 3.2% | |||
Novartis AG | 3.2% | |||
Taiwan Semiconductor Manufacturing Co. Ltd., ADR | 3.0% | |||
PepsiCo, Inc. | 3.0% | |||
Japan Tobacco, Inc. | 2.8% | |||
CVS Health Corp. | 2.8% | |||
Samsung Electronics Co. Ltd., GDR, Preferred Shares | 2.5% | |||
Oracle Corp. | 2.4% | |||
Other | 69.8% | |||
| 100.0% | ||||
| * | For the purpose of listing top holdings, Short-Term Investments are included as part of Other. |
| Top Countries | ||||
United States | 36.8% | |||
United Kingdom | 13.7% | |||
Japan | 11.2% | |||
Switzerland | 8.3% | |||
Hong Kong | 5.8% | |||
Germany | 3.9% | |||
India | 3.3% | |||
Taiwan | 3.0% | |||
Republic of South Korea | 2.5% | |||
Israel | 2.1% | |||
Other | 9.4% | |||
| 100.0% | ||||
2016 Annual Report
35
Statement of Investments
October 31, 2016
Aberdeen Global Equity Fund
| Shares or Principal Amount | Value | |||||||
COMMON STOCKS (91.4%) | ||||||||
CANADA (1.4%) | ||||||||
Materials (1.4%) | ||||||||
Potash Corp. of Saskatchewan, Inc. | 73,600 | $ | 1,196,761 | |||||
GERMANY (1.9%) | ||||||||
Health Care (1.9%) | ||||||||
Fresenius Medical Care AG & Co. KGaA (a) | 20,500 | 1,669,809 | ||||||
HONG KONG (5.8%) | ||||||||
Financials (2.1%) | ||||||||
AIA Group Ltd. (a) | 297,300 | 1,870,315 | ||||||
Industrials (2.8%) | ||||||||
Jardine Matheson Holdings Ltd. | 23,400 | 1,425,294 | ||||||
MTR Corp. Ltd. (a) | 177,000 | 979,532 | ||||||
| 2,404,826 | ||||||||
Real Estate (0.9%) | ||||||||
Swire Pacific Ltd., Class A (a) | 75,800 | 787,854 | ||||||
| 5,062,995 | ||||||||
INDIA (3.3%) | ||||||||
Consumer Staples (1.6%) | ||||||||
ITC Ltd. (a) | 387,550 | 1,402,104 | ||||||
Financials (1.7%) | ||||||||
Housing Development Finance Corp. Ltd. (a) | 72,300 | 1,492,592 | ||||||
| 2,894,696 | ||||||||
ISRAEL (2.1%) | ||||||||
Information Technology (2.1%) | ||||||||
Check Point Software Technologies Ltd. (b) | 21,500 | 1,818,040 | ||||||
ITALY (1.5%) | ||||||||
Energy (1.5%) | ||||||||
Tenaris SA, ADR | 45,900 | 1,294,380 | ||||||
JAPAN (11.2%) | ||||||||
Consumer Staples (2.8%) | ||||||||
Japan Tobacco, Inc. (a) | 63,500 | 2,414,278 | ||||||
Industrials (1.8%) | ||||||||
FANUC Corp. (a) | 8,710 | 1,594,692 | ||||||
Information Technology (1.7%) | ||||||||
Keyence Corp. (a) | 2,100 | 1,539,492 | ||||||
Materials (3.3%) | ||||||||
Shin-Etsu Chemical Co. Ltd. (a) | 37,700 | 2,858,464 | ||||||
Real Estate (1.6%) | ||||||||
Daito Trust Construction Co. Ltd. (a) | 8,300 | 1,390,903 | ||||||
| 9,797,829 | ||||||||
MEXICO (2.0%) | ||||||||
Consumer Staples (2.0%) | ||||||||
Fomento Economico Mexicano SAB de CV, ADR | 18,300 | 1,750,761 | ||||||
SINGAPORE (0.9%) | ||||||||
Real Estate (0.9%) | ||||||||
City Developments Ltd. (a) | 133,400 | 812,237 | ||||||
SOUTH AFRICA (0.9%) | ||||||||
Telecommunication Services (0.9%) | ||||||||
MTN Group Ltd. (a) | 92,300 | 797,226 | ||||||
SWEDEN (1.5%) | ||||||||
Industrials (1.5%) | ||||||||
Atlas Copco AB, A Shares (a) | 43,800 | 1,283,124 | ||||||
SWITZERLAND (8.3%) | ||||||||
Consumer Staples (1.9%) | ||||||||
Nestle SA (a) | 23,200 | 1,682,322 | ||||||
Health Care (6.4%) | ||||||||
Novartis AG (a) | 38,500 | 2,732,252 | ||||||
Roche Holding AG (a) | 12,200 | 2,802,115 | ||||||
| 5,534,367 | ||||||||
| 7,216,689 | ||||||||
TAIWAN (3.0%) | ||||||||
Information Technology (3.0%) | ||||||||
Taiwan Semiconductor Manufacturing Co. Ltd., ADR | 85,000 | 2,643,500 | ||||||
THAILAND (1.0%) | ||||||||
Financials (1.0%) | ||||||||
Kasikornbank PCL (a) | 179,000 | 878,864 | ||||||
UNITED KINGDOM (13.7%) | ||||||||
Consumer Discretionary (2.0%) | ||||||||
Whitbread PLC (a) | 39,451 | 1,742,757 | ||||||
Consumer Staples (1.9%) | ||||||||
British American Tobacco PLC (a) | 29,000 | 1,662,075 | ||||||
Energy (1.9%) | ||||||||
Royal Dutch Shell PLC, B Shares (a) | 64,900 | 1,673,933 | ||||||
Financials (1.5%) | ||||||||
Standard Chartered PLC (a)(b) | 153,130 | 1,331,605 | ||||||
Industrials (3.0%) | ||||||||
Experian PLC (a) | 68,900 | 1,324,570 | ||||||
Rolls-Royce Holdings PLC (a)(b) | 140,927 | 1,250,955 | ||||||
Rolls-Royce Holdings PLC, C Shares (b) | 6,482,642 | 7,935 | ||||||
| 2,583,460 | ||||||||
Materials (1.0%) | ||||||||
BHP Billiton PLC (a) | 55,600 | 836,061 | ||||||
Telecommunication Services (2.4%) | ||||||||
Vodafone Group PLC (a) | 765,700 | 2,102,861 | ||||||
| 11,932,752 | ||||||||
See accompanying Notes to Financial Statements.
Annual Report 2016
36
Statement of Investments (concluded)
October 31, 2016
Aberdeen Global Equity Fund
| Shares or Principal Amount | Value | |||||||
UNITED STATES (32.9%) | ||||||||
Consumer Discretionary (3.4%) | ||||||||
Comcast Corp., Class A | 27,700 | $ | 1,712,414 | |||||
TJX Cos., Inc. (The) | 17,600 | 1,298,000 | ||||||
| 3,010,414 | ||||||||
Consumer Staples (7.8%) | ||||||||
CVS Health Corp. | 28,700 | 2,413,670 | ||||||
PepsiCo, Inc. | 24,400 | 2,615,680 | ||||||
Philip Morris International, Inc. | 18,100 | 1,745,564 | ||||||
| 6,774,914 | ||||||||
Energy (5.5%) | ||||||||
EOG Resources, Inc. | 38,400 | 3,472,128 | ||||||
Schlumberger Ltd. | 16,500 | 1,290,795 | ||||||
| 4,762,923 | ||||||||
Financials (3.5%) | ||||||||
Intercontinental Exchange, Inc. | 4,900 | 1,324,911 | ||||||
M&T Bank Corp. | 14,300 | 1,755,039 | ||||||
| 3,079,950 | ||||||||
Health Care (3.3%) | ||||||||
Johnson & Johnson | 14,700 | 1,705,053 | ||||||
Perrigo Co. PLC | 14,700 | 1,222,893 | ||||||
| 2,927,946 | ||||||||
Information Technology (7.4%) | ||||||||
Amdocs Ltd. | 22,300 | 1,303,435 | ||||||
Cognizant Technology Solutions Corp., Class A (b) | 25,300 | 1,299,155 | ||||||
Oracle Corp. | 55,700 | 2,139,994 | ||||||
Visa, Inc., Class A | 21,200 | 1,749,212 | ||||||
| 6,491,796 | ||||||||
Materials (2.0%) | ||||||||
Praxair, Inc. | 14,800 | 1,732,488 | ||||||
| 28,780,431 | ||||||||
Total Common Stocks | 79,830,094 | |||||||
PREFERRED STOCKS (6.5%) | ||||||||
BRAZIL (2.0%) | ||||||||
Financials (2.0%) | ||||||||
Banco Bradesco SA, ADR, Preferred Shares | 172,410 | 1,794,788 | ||||||
GERMANY (2.0%) | ||||||||
Consumer Staples (2.0%) | ||||||||
Henkel AG & Co. KGaA, Preferred Shares (a) | 13,600 | 1,748,017 | ||||||
REPUBLIC OF SOUTH KOREA (2.5%) | ||||||||
Information Technology (2.5%) | ||||||||
Samsung Electronics Co. Ltd., GDR, Preferred Shares (c) | 3,800 | 2,162,200 | ||||||
Total Preferred Stocks | 5,705,005 | |||||||
SHORT-TERM INVESTMENT (3.9%) | ||||||||
UNITED STATES (3.9%) | ||||||||
State Street Institutional U.S. Government Money Market Fund (d) | 3,417,398 | 3,417,398 | ||||||
Total Short-Term Investment | 3,417,398 | |||||||
Total Investments | 88,952,497 | |||||||
Liabilities in excess of other assets—(1.8)% | (1,591,547 | ) | ||||||
Net Assets—100.0% | $ | 87,360,950 | ||||||
| (a) | Fair Valued Security. Fair Values are determined pursuant to procedures approved by the Fund’s Board of Trustees. See Note 2(a) of the accompanying Notes to Financial Statements. |
| (b) | Non-income producing security. |
| (c) | Denotes a security issued under Regulation S or Rule 144A. |
| (d) | Registered investment company advised by State Street Global Advisors. |
| (e) | See accompanying Notes to Financial Statements for tax unrealized appreciation/(depreciation) of securities. |
| ADR | American Depositary Receipt |
| GDR | Global Depositary Receipt |
See accompanying Notes to Financial Statements.
2016 Annual Report
37
Aberdeen Global Natural Resources Fund (Unaudited)
The Aberdeen Global Natural Resources Fund (Institutional Class shares net of fees) returned 8.49% for the 12-month period ended October 31, 2016, versus the 2.64% return of its benchmark, the Morgan Stanley Capital International (MSCI) All Country (AC) World Index, and the 13.62% return of its secondary benchmark, the S&P Global Natural Resources Index, for the same period. For broader comparison, the average return of the Fund’s peer category of Global Natural Resources Funds (comprising 54 funds), as measured by Lipper, Inc., was 3.24% for the period.
Global natural resources stocks, as represented by the S&P Global Natural Resources Index, rose during the reporting period, outperforming the broader global equities market, as measured by the MSCI AC World Index. Over a “rollercoaster” 12-month period, oil prices initially plummeted on oversupply concerns, with Brent crude sinking below US$30 a barrel in January 2016. However, prices then stabilized on the back of a weaker U.S. dollar and supply disruption fears, triggered by outbreaks of violence in Nigeria and wildfires in Canada. Cautious investor sentiment subsequently dominated the global financial markets following the UK’s vote to leave the European Union. Towards the end of the reporting period, oil prices enjoyed a brief rally after members of the Organization of the Petroleum Exporting Countries (OPEC) tentatively agreed to cut production for the first time in eight years. However, the gains were capped as doubts grew over the agreement. Meanwhile, gold prices moved higher over the period, buoyed by rising global uncertainty and the cautious monetary policy stance by the U.S. Federal Reserve.
Fund performance for the reporting period benefited from the holding in Chilean specialty fertilizer producer Sociedad Quimica y Minera de Chile (SQM), as its share price rose on speculation about Chinese investors’ interests in the business. Market sentiment also improved with regard to the dispute over its main concession in Chile. Positions in two Brazilian companies – port, maritime and logistics operator Wilson Sons and miner Vale – also contributed to Fund performance, as the stocks were buoyed by a rally in the Brazilian market on President Dilma Rousseff’s impeachment and increased hopes for economic reforms.
In contrast, the absence of a position in UK exchange-traded metals and mining company Glencore detracted from the Fund’s relative performance for the reporting period, as the company’s shares rebounded with the broader mining sector. The Fund does not hold the stock due to our concerns over the company’s financial and operational leverage. The lack of exposure to Barrick Gold and Newmont Mining also weighed on Fund performance, as the gold producers’ shares rose along with the gold price.
During the period, we used market volatility to initiate holdings in U.S.-based Deere & Co, which is dominant in the agriculture machinery space with a strong dealer network and a solid balance sheet, in our opinion; Givaudan, a Swiss company that has provided healthy stock price returns and cash-generation; Bayer, a German company with an attractive spread of businesses and chemical and agricultural exposures, in our view; Frutarom, which we believe is a well-managed flavor and fragrance company; Brenntag, a leading German chemical distributor; and Randgold Resources, a well-managed gold company with a robust balance sheet and good asset quality, in our opinion.
We exited the Fund’s positions in National Oilwell Varco, given the ongoing structural headwinds for the business; Compass Minerals International due to our concerns over weakness in its core market of salt and other plant nutrition products; and freight railroad operator Canadian National Railway, which has performed well but faces an increasingly challenging operating environment.
We anticipate that global financial markets will remain cautious in light of the unexpected U.S. election result, which rattled financial markets in a reactionary sell-off. Until there is greater clarity on President-elect Donald Trump’s policies, we feel that it is difficult to predict the impact on the U.S. dollar and the Fed’s monetary policy, and there may be more turmoil in coming months. Meanwhile, further uncertainty is expected to be driven by the upcoming Brexit1 negotiations, mounting debt concerns in China and uncertainty over central bank policy in Europe. We believe that this could further support the price of gold, which has posted solid gains over the past year. Additionally, we think that oil prices could fluctuate further, with investors focusing on a potential deal by OPEC members to reduce output.
Portfolio Management:
Aberdeen Global Equity Team
PAST PERFORMANCE DOES NOT GUARANTEE FUTURE RESULTS.
The performance data quoted represents past performance and current returns may be lower or higher. Class A Shares have up to a 5.75% front-end sales charge and a 0.25% 12b-1 fee. The investment return and principal value will fluctuate so that an investor’s shares, when redeemed, may be worth more or less than the original cost. To obtain performance information current to the most recent month-end, which may be higher or lower than the performance shown above, please call 866-667-9231 or go to www.aberdeen-asset.us.
Investing in mutual funds involves risk, including the possible loss of principal.
Indexes are unmanaged and have been provided for comparison purposes only. No fees or expenses are reflected. You cannot invest directly in an index.
Lipper is a leading global provider of mutual fund information and analysis to fund companies, financial intermediaries and media organizations.
Risk Considerations
Investing 25% or more of the Fund’s net assets in natural resources industries subjects the Fund to greater risk of loss and is considerably more volatile compared to investments that are diversified across a greater number of industries.
The natural resources industry can be significantly affected by events relating to international political and economic developments, energy
| 1 | Brexit is an abbreviation of “British exit,” which refers to the June 23, 2016 referendum by British voters to exit the European Union. |
38
Annual Report 2016
Aberdeen Global Natural Resources Fund (Unaudited) (concluded)
conservation, the success of exploration projects, commodity prices, and tax and other government regulations. The securities of companies in the natural resources sector may experience more price volatility than securities of companies in other industries.
Foreign securities may be more volatile, harder to price and less liquid than U.S. securities. They are subject to different accounting and regulatory standards, currency exchange rates, political and economic risks. Fluctuation in currency exchange rates may impact the Fund’s returns more greatly to the extent the Fund does not hedge currency exposure or hedging techniques are unsuccessful. The foregoing risks are enhanced in emerging market countries.
Equity stocks of small- and mid-cap companies carry greater risk and more volatility than equity stocks of larger, more established companies.
Please read the prospectus for more detailed information regarding these and other risks.
2016 Annual Report
39
Aberdeen Global Natural Resources Fund (Unaudited)
Average Annual Total Return1 (For periods ended October 31, 2016) | 1 Yr. | 5 Yr. | 10 Yr. | |||||||||||
Class A | w/o SC | 7.90% | (4.04% | ) | (0.90% | ) | ||||||||
| w/SC2 | 1.72% | (5.17% | ) | (1.49% | ) | |||||||||
Class C | w/o SC | 7.17% | (4.69% | ) | (1.57% | ) | ||||||||
| w/SC3 | 6.17% | (4.69% | ) | (1.57% | ) | |||||||||
Class R4 | w/o SC | 7.61% | (4.26% | ) | (1.12% | ) | ||||||||
Institutional Service Class4 | w/o SC | 8.16% | (3.72% | ) | (0.58% | ) | ||||||||
Institutional Class4 | w/o SC | 8.49% | (3.69% | ) | (0.56% | ) | ||||||||
All figures showing the effect of a sales charge (SC) reflect the maximum charge possible because it has the most significant effect on performance data. The total returns shown above do not include the impact of financial statement rounding of the net asset value (NAV) per share and/or financial statement adjustments.
| 1 | Returns prior to June 23, 2008 reflect the performance of a predecessor fund (the “Predecessor Fund”). Returns of the Predecessor Fund have not been adjusted to reflect the expenses applicable to the respective classes. The Fund and the Predecessor Fund have substantially similar investment objectives and strategies. Please consult the Fund’s prospectus for more detail. |
| 2 | A 5.75% front-end sales charge was deducted. |
| 3 | A 1.00% contingent deferred sales charge (CDSC) was deducted from the one year return because it is charged when Class C shares are sold within the first year after purchase. |
| 4 | Not subject to any sales charges. |
Annual Report 2016
40
Aberdeen Global Natural Resources Fund (Unaudited)
Performance of a $10,000 Investment (as of October 31, 2016)
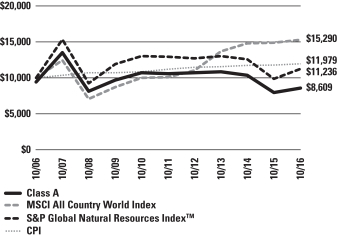
Comparative performance of $10,000 invested in Class A shares of the Aberdeen Global Natural Resources Fund, the Morgan Stanley Capital International (MSCI) All Country World Index (ACWI), the S&P Global Natural Resources Index™, and the Consumer Price Index (CPI) over a 10-year period ended October 31, 2016. Unlike the Fund, the returns for these unmanaged indexes do not reflect any fees, expenses, or sales charges. Investors cannot invest directly in market indexes.
MSCI ACWI captures large and mid cap representation across 23 Developed Markets (DM) and 23 Emerging Markets (EM) countries. With 2,470 constituents, the index covers approximately 85% of the global investable equity opportunity set. DM countries are: Australia, Austria, Belgium, Canada, Denmark, Finland, France, Germany, Hong Kong, Ireland, Israel, Italy, Japan, Netherlands, New Zealand, Norway, Portugal, Singapore, Spain, Sweden, Switzerland, the UK and the US. EM countries are: Brazil, Chile, China, Colombia, Czech Republic, Egypt, Greece, Hungary, India, Indonesia, Korea, Malaysia, Mexico, Peru, Philippines, Poland, Russia, Qatar, South Africa, Taiwan, Thailand, Turkey and United Arab Emirates.
The S&P Global Natural Resources Index™ includes 90 of the largest publicly-traded companies in natural resources and commodities businesses that meet specific investability requirements, with exposure across 3 primary commodity-related sectors: Agribusiness, Energy, and Metals & Mining.
The CPI is a measure of the average change over time in the prices paid by urban consumers for a market basket of consumer goods and services.
Investment return and principal value will fluctuate, and when redeemed, shares may be worth more or less than original cost. Past performance is no guarantee of future results. The Average Annual Total Return table and Performance graph do not reflect the deduction of taxes that a shareholder would pay on fund distributions or the redemption of fund shares. Investing in mutual funds involves market risk, including loss of principal. Performance returns assume the reinvestment of all distributions. Total returns reflect waivers and reimbursements in effect, without which returns would have been lower.
Portfolio Summary (as a percentage of net assets)
October 31, 2016 (Unaudited)
| Asset Allocation | ||||
Common Stocks | 96.0% | |||
Preferred Stocks | 3.3% | |||
Short-Term Investment | 0.7% | |||
Other assets in excess of liabilities | –% | |||
| 100.0% | ||||
Amounts listed as “–” are 0% or round to 0%
The following table summarizes the composition of the Fund’s portfolio, in Standard & Poor’s Global Industry Classification Standard (GICS) sectors, expressed as a percentage of net assets. The GICS structure consists of 11 sectors, 24 industry groups, 68 industries and 157 sub-industries.
| Top Sectors | ||||
Materials | 56.0% | |||
Energy | 31.8% | |||
Industrials | 7.2% | |||
Health Care | 2.6% | |||
Consumer Staples | 1.7% | |||
Other | 0.7% | |||
| 100.0% | ||||
2016 Annual Report
41
Aberdeen Global Natural Resources Fund (Unaudited) (concluded)
| Top Holdings* | ||||
EOG Resources, Inc. | 7.1% | |||
Goldcorp, Inc. | 5.7% | |||
Rio Tinto PLC | 5.7% | |||
BHP Billiton PLC | 5.6% | |||
Praxair, Inc. | 5.0% | |||
Shin-Etsu Chemical Co. Ltd. | 4.9% | |||
Royal Dutch Shell PLC, B Shares | 4.9% | |||
Potash Corp. of Saskatchewan, Inc. | 4.4% | |||
Schlumberger Ltd. | 4.2% | |||
Tenaris SA, ADR | 4.0% | |||
Other | 48.5% | |||
| 100.0% | ||||
| * | For the purpose of listing top holdings, Short-Term Investments are included as part of Other. |
| Top Countries | ||||
United States | 25.6% | |||
United Kingdom | 21.3% | |||
Germany | 12.8% | |||
Canada | 10.1% | |||
Brazil | 7.1% | |||
Italy | 6.0% | |||
Japan | 4.9% | |||
Chile | 3.3% | |||
France | 2.9% | |||
Israel | 2.2% | |||
Other | 3.8% | |||
| 100.0% | ||||
Annual Report 2016
42
Statement of Investments
October 31, 2016
Aberdeen Global Natural Resources Fund
| Shares or Principal Amount | Value | |||||||
COMMON STOCKS (96.0%) | ||||||||
BRAZIL (7.1%) | ||||||||
Industrials (3.9%) | ||||||||
Wilson Sons Ltd., BDR | 52,900 | $ | 571,757 | |||||
Materials (3.2%) | ||||||||
Vale SA, ADR (a) | 66,500 | 460,180 | ||||||
| 1,031,937 | ||||||||
CANADA (10.1%) | ||||||||
Materials (10.1%) | ||||||||
Goldcorp, Inc. | 54,600 | 829,197 | ||||||
Potash Corp. of Saskatchewan, Inc. | 39,500 | 643,060 | ||||||
| 1,472,257 | ||||||||
DENMARK (1.8%) | ||||||||
Materials (1.8%) | ||||||||
Novozymes AS, B Shares (b) | 7,200 | 267,097 | ||||||
FRANCE (2.9%) | ||||||||
Energy (2.9%) | ||||||||
TOTAL SA (b) | 8,900 | 426,354 | ||||||
GERMANY (12.8%) | ||||||||
Consumer Staples (1.7%) | ||||||||
KWS Saat SE (a) | 750 | 245,347 | ||||||
Health Care (2.6%) | ||||||||
Bayer AG (b) | 3,800 | 377,300 | ||||||
Industrials (1.1%) | ||||||||
Brenntag AG (b) | 3,100 | 165,727 | ||||||
Materials (7.4%) | ||||||||
BASF SE (b) | 2,900 | 256,006 | ||||||
FUCHS PETROLUB SE (b) | 6,100 | 241,371 | ||||||
Linde AG (b) | 3,500 | 578,083 | ||||||
| 1,075,460 | ||||||||
| 1,863,834 | ||||||||
ISRAEL (2.2%) | ||||||||
Materials (2.2%) | ||||||||
Frutarom Industries Ltd. (b) | 6,100 | 322,340 | ||||||
ITALY (6.0%) | ||||||||
Energy (6.0%) | ||||||||
Eni SpA (b) | 19,900 | 288,794 | ||||||
Tenaris SA, ADR | 20,500 | 578,100 | ||||||
| 866,894 | ||||||||
JAPAN (4.9%) | ||||||||
Materials (4.9%) | ||||||||
Shin-Etsu Chemical Co. Ltd. (b) | 9,300 | 705,138 | ||||||
NETHERLANDS (1.1%) | ||||||||
Energy (1.1%) | ||||||||
Koninklijke Vopak NV (b) | 3,100 | 156,465 | ||||||
SWITZERLAND (0.9%) | ||||||||
Materials (0.9%) | ||||||||
Givaudan SA (b) | 70 | 135,385 | ||||||
UNITED KINGDOM (21.3%) | ||||||||
Energy (6.8%) | ||||||||
John Wood Group PLC (b) | 29,300 | 275,396 | ||||||
Royal Dutch Shell PLC, B Shares (b) | 27,300 | 704,135 | ||||||
| 979,531 | ||||||||
Industrials (1.1%) | ||||||||
Weir Group PLC (The) (b) | 7,800 | 162,028 | ||||||
Materials (13.4%) | ||||||||
BHP Billiton PLC (b) | 54,400 | 818,016 | ||||||
Randgold Resources Ltd. (b) | 3,500 | 310,823 | ||||||
Rio Tinto PLC (b) | 23,700 | 824,175 | ||||||
| 1,953,014 | ||||||||
| 3,094,573 | ||||||||
UNITED STATES (24.9%) | ||||||||
Energy (15.0%) | ||||||||
Chevron Corp. | 5,100 | 534,225 | ||||||
EOG Resources, Inc. | 11,500 | 1,039,830 | ||||||
Schlumberger Ltd. | 7,900 | 618,017 | ||||||
| 2,192,072 | ||||||||
Industrials (1.1%) | ||||||||
Deere & Co. | 1,800 | 158,940 | ||||||
Materials (8.8%) | ||||||||
Monsanto Co. | 5,500 | 554,235 | ||||||
Praxair, Inc. | 6,200 | 725,772 | ||||||
| 1,280,007 | ||||||||
| 3,631,019 | ||||||||
Total Common Stocks | 13,973,293 | |||||||
PREFERRED STOCKS (3.3%) | ||||||||
CHILE (3.3%) | ||||||||
Materials (3.3%) | ||||||||
Sociedad Quimica y Minera de Chile SA, ADR, Preferred Shares | 16,700 | 488,642 | ||||||
Total Preferred Stocks | 488,642 | |||||||
SHORT-TERM INVESTMENT (0.7%) | ||||||||
UNITED STATES (0.7%) | ||||||||
State Street Institutional U.S. Government Money Market Fund (c) | 93,005 | 93,005 | ||||||
Total Short-Term Investment | 93,005 | |||||||
Total Investments | 14,554,940 | |||||||
Other assets in excess of liabilities—0.0% | 4,952 | |||||||
Net Assets—100.0% | $ | 14,559,892 | ||||||
| (a) | Non-income producing security. |
| (b) | Fair Valued Security. Fair Values are determined pursuant to procedures approved by the Fund’s Board of Trustees. See Note 2(a) of the accompanying Notes to Financial Statements. |
| (c) | Registered investment company advised by State Street Global Advisors. |
| (d) | See accompanying Notes to Financial Statements for tax unrealized appreciation/(depreciation) of securities. |
| ADR | American Depositary Receipt |
| BDR | Brazilian Depositary Receipt |
See accompanying Notes to Financial Statements.
2016 Annual Report
43
Aberdeen International Equity Fund (Unaudited)
The Aberdeen International Equity Fund (Institutional Class shares net of fees) returned 2.14% for the 12-month period ended October 31, 2016, versus the 0.72% return of its benchmark, the Morgan Stanley Capital International (MSCI) All Country (AC) World ex USA Index, during the same period. For broader comparison, the average return of the Fund’s peer category of International Large-Cap Core Funds (comprising 52 funds), as measured by Lipper, Inc., was -2.65% for the period.
Global equities rose amid numerous periods of volatility during the reporting period. Stock markets tumbled early in the period when commodity prices plummeted and the U.S. Federal Reserve (Fed) raised interest rates for the first time in a decade, and again in June 2016, when the UK voted to leave the European Union. However, investor sentiment recovered quickly in both instances. Meanwhile, investors reacted positively as central banks in Japan and parts of Europe unexpectedly imposed negative interest rates to combat low inflation and boost spending, while persistent deflationary pressures forced the Fed to maintain an accommodative monetary policy stance. The end of the period saw anxiety rise again, ahead of a nail-biting finish to the U.S. presidential election in early November. Republican Donald Trump subsequently won the election on November 8, garnering a majority of electoral votes in the race against his Democratic Party opponent, former U.S. Secretary of State Hillary Clinton. Elsewhere, oil prices fluctuated throughout the reporting period, in tandem with ongoing speculation over a production cap by members of the Organization of Petroleum Exporting Countries (OPEC).
At the stock level, the position in Banco Bradesco contributed positively to Fund performance for the reporting period, riding the rally in Brazilian stocks. The upturn was supported by rising investor confidence as Michel Temer took over as the country’s president and an ambitious program of reforms was unveiled in an effort to buttress the country’s public finances. The holding in Taiwan Semiconductor Manufacturing Co. also benefited Fund performance. The company’s shares rose in line with the wider semiconductor industry, as solid demand improved the company’s cash flows. Shin-Etsu Chemical Co.’s stock price rose as its core polyvinyl chloride (PVC) business posted healthy results over the reporting period. The company plans to build a new local silicone production plant in a bid to take advantage of the rapidly expanding market.
Conversely, the Fund’s position in IT services provider Cognizant Technology Solutions detracted from performance after the company disclosed that it was conducting an internal probe to determine whether certain payments the company made relating to facilities in India were in violation of the U.S. Foreign Corrupt Practices Act. This was followed quickly by the resignation of President Gordon Coburn. Rajeev Mehta, a 20-year veteran with the company, was appointed as his replacement. Additionally, shares of Fund holdings Perrigo Co. and Novartis fell in line with the broader healthcare and pharmaceuticals sectors, which were weighed down by concerns about the impact of the outcome of the upcoming U.S. election on pharmaceutical prices.
During the reporting period, we initiated positions in Australian biopharmaceutical company CSL; Housing Development Finance Corporation (HDFC); Inmarsat, a UK-based provider of global mobile satellite communications services; French cosmetics maker L’Oreal; restaurant, coffee shop and budget hotel group Whitbread; German pharmaceutical firm Bayer; Thailand-based commercial bank Kasikornbank; property developer Ayala Land; manufacturing company Keyence; and two Hong Kong exchange-listed companies – subway operator MTR Corp. and luggage-maker Samsonite International.
Conversely, we exited positions in three French companies: natural gas and electricity supplier Engie, electricity distributor Schneider Electric, and retailer Casino Guichard Perrachon. We also sold the Fund’s shares in Swedish telecommunications company Ericsson; Swiss multi-lines insurer Zurich Insurance; Sweden-based Nordea Bank; Brazilian miner Vale; and UK exchange-listed diversified financial services company HSBC Holdings. Furthermore, we exited the Fund’s position in Canadian National Railway. While the stock performed well over the reporting period, we feel that the company faces an increasingly challenging operating environment.
We anticipate that global markets will remain cautious in light of the unexpected U.S. election result, which rattled financial markets in a reactionary sell-off. Until there is greater clarity on President-elect Trump’s policies, we think that it is difficult to predict the impact on the U.S. dollar and the Fed’s monetary policy, and more turmoil is expected in coming months. Meanwhile, we believe that there may be further uncertainty driven by the upcoming Brexit1 negotiations, mounting debt concerns in China, and uncertainty over central bank policy in Europe. We think that oil prices likely will remain in the doldrums, with OPEC members showing few signs of achieving consensus on reducing output. Despite the turbulent outlook, we maintain faith in our investment process, which seeks opportunities to add to what we believe are high-quality holdings at a good price, which we feel should benefit the Fund’s performance over the long term.
Portfolio Management:
Aberdeen Global Equity Team
PAST PERFORMANCE DOES NOT GUARANTEE FUTURE RESULTS.
The performance data quoted represents past performance and current returns may be lower or higher. Class A Shares have up to a 5.75% front-end sales charge and a 0.25% 12b-1 fee. The investment return and principal value will fluctuate so that an investor’s shares, when redeemed, may be worth more or less than the original cost. To obtain performance information current to the most recent month-end, which may be higher or lower than the performance shown above, please call 866-667-9231 or go to www.aberdeen-asset.us.
Investing in mutual funds involves risk, including the possible loss of principal.
Indexes are unmanaged and have been provided for comparison purposes only. No fees or expenses are reflected. You cannot invest directly in an index.
Lipper is a leading global provider of mutual fund information and analysis to fund companies, financial intermediaries and media organizations.
| 1 | Brexit is an abbreviation of “British exit,” which refers to the June 23, 2016 referendum by British voters to exit the European Union. |
Annual Report 2016
44
Aberdeen International Equity Fund (Unaudited) (concluded)
Risk Considerations
Foreign securities may be more volatile, harder to price and less liquid than U.S. securities. They are subject to different accounting and regulatory standards and currency exchange rate, political and economic risks. Fluctuation in currency exchange rates may impact a Fund’s returns more greatly to the extent a Fund does not hedge currency exposure or hedging techniques are unsuccessful. The foregoing risks are enhanced in emerging market countries.
Equity stocks of small- and mid-cap companies carry greater risk and more volatility than equity stocks of larger, more established companies.
Investing a significant portion of the Fund’s assets in securities of companies conducting business in a broadly related group of industries within an economic sector may make the Fund more vulnerable to unfavorable developments in that sector.
Please read the prospectus for more detailed information regarding these and other risks.
2016 Annual Report
45
Aberdeen International Equity Fund (Unaudited)
| Average Annual Total Return1 (For periods ended October 31, 2016) | 1 Yr. | 5 Yr. | 10 Yr. | |||||||||||
Class A | w/o SC | 1.76% | 1.51% | 1.80% | ||||||||||
| w/SC2 | (4.06% | ) | 0.32% | 1.21% | ||||||||||
Class C | w/o SC | 0.97% | 0.80% | 1.09% | ||||||||||
| w/SC3 | (0.03% | ) | 0.80% | 1.09% | ||||||||||
Class R4 | w/o SC | 1.42% | 1.23% | 1.55% | ||||||||||
Institutional Service Class4 | w/o SC | 2.01% | 1.70% | 2.02% | ||||||||||
Institutional Class4 | w/o SC | 2.14% | 1.84% | 2.12% | ||||||||||
All figures showing the effect of a sales charge (SC) reflect the maximum charge possible because it has the most significant effect on performance data. The total returns shown above do not include the impact of financial statement rounding of the net asset value (NAV) per share and/or financial statement adjustments.
| 1 | Returns prior to June 23, 2008 reflect the performance of a predecessor fund (the “Predecessor Fund”). Returns of the Predecessor Fund have not been adjusted to reflect the expenses applicable to the respective classes. The Fund and the Predecessor Fund have substantially similar investment objectives and strategies. Please consult the Fund’s prospectus for more detail. |
| 2 | A 5.75% front-end sales charge was deducted. |
| 3 | A 1.00% contingent deferred sales charge (CDSC) was deducted from the one year return because it is charged when Class C shares are sold within the first year after purchase. |
| 4 | Not subject to any sales charges. |
Annual Report 2016
46
Aberdeen International Equity Fund (Unaudited)
Performance of a $10,000 Investment (as of October 31, 2016)
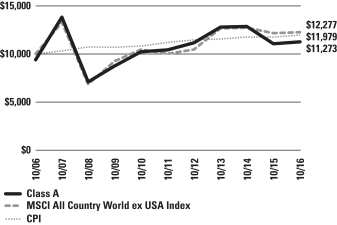
Comparative performance of $10,000 invested in Class A shares of the Aberdeen International Equity Fund, the Morgan Stanley Capital International All Country World (MSCI ACWI) ex USA Index and the Consumer Price Index (CPI) over a 10-year period ending October 31, 2016. Unlike the Fund, the returns for these unmanaged indexes do not reflect any fees, expenses, or sales charges. Investors cannot invest directly in market indexes.
The MSCI ACWI ex USA Index captures large and mid cap representation across 22 of 23 Developed Markets (DM) countries (excluding the US) and 23 Emerging Markets (EM) countries. With 1,853 constituents, the index covers approximately 85% of the global equity opportunity set outside the US. DM countries in the Index are: Australia, Austria, Belgium, Canada, Denmark, Finland, France, Germany, Hong Kong, Ireland, Israel, Italy, Japan, Netherlands, New Zealand, Norway, Portugal, Singapore, Spain, Sweden, Switzerland and the UK. EM countries in the Index are: Brazil, Chile, China, Colombia, Czech Republic, Egypt, Greece, Hungary, India, Indonesia, Korea, Malaysia, Mexico, Peru, Philippines, Poland, Russia, Qatar, South Africa, Taiwan, Thailand, Turkey and United Arab Emirates.
The CPI is a measure of the average change over time in the prices paid by urban consumers for a market basket of consumer goods and services.
Investment return and principal value will fluctuate, and when redeemed, shares may be worth more or less than original cost. Past performance is no guarantee of future results. The Average Annual Total Return table and Performance graph do not reflect the deduction of taxes that a shareholder would pay on fund distributions or the redemption of fund shares. Investing in mutual funds involves market risk, including loss of principal. Performance returns assume the reinvestment of all distributions. Total returns reflect waivers and reimbursements in effect, without which returns would have been lower.
Portfolio Summary (as a percentage of net assets)
October 31, 2016 (Unaudited)
| Asset Allocation | ||||
Common Stocks | 89.7% | |||
Preferred Stocks | 7.7% | |||
Short-Term Investment | 2.3% | |||
Other assets in excess of liabilities | 0.3% | |||
| 100.0% | ||||
The following table summarizes the composition of the Fund’s portfolio, in Standard & Poor’s Global Industry Classification Standard (GICS) sectors, expressed as a percentage of net assets. The GICS structure consists of 11 sectors, 24 industry groups, 68 industries and 157 sub-industries. As of October 31, 2016, the Fund did not have more than 25% of its assets invested in any industry group.
| Top Sectors | ||||
Consumer Staples | 17.0% | |||
Financials | 12.8% | |||
Health Care | 11.8% | |||
Industrials | 11.1% | |||
Information Technology | 10.8% | |||
Telecommunication Services | 9.8% | |||
Materials | 7.1% | |||
Energy | 5.9% | |||
Consumer Discretionary | 5.6% | |||
Real Estate | 5.5% | |||
Other | 2.6% | |||
| 100.0% | ||||
2016 Annual Report
47
Aberdeen International Equity Fund (Unaudited) (concluded)
| Top Holdings* | ||||
Novartis AG | 3.6% | |||
Roche Holding AG | 3.6% | |||
Taiwan Semiconductor Manufacturing Co. Ltd. | 3.5% | |||
Japan Tobacco, Inc. | 3.4% | |||
Nestle SA | 3.4% | |||
Shin-Etsu Chemical Co. Ltd. | 3.2% | |||
Singapore Telecommunications Ltd. | 3.0% | |||
Royal Dutch Shell PLC, B Shares | 2.9% | |||
Samsung Electronics Co. Ltd., GDR, Preferred Shares | 2.9% | |||
AIA Group Ltd. | 2.8% | |||
Other | 67.7% | |||
| 100.0% | ||||
| * | For the purpose of listing top holdings, Short-Term Investments are included as part of Other. |
| Top Countries | ||||
United Kingdom | 21.6% | |||
Japan | 13.8% | |||
Switzerland | 10.6% | |||
Hong Kong | 8.3% | |||
Germany | 7.7% | |||
Singapore | 6.3% | |||
Taiwan | 3.5% | |||
India | 3.0% | |||
Republic of South Korea | 2.9% | |||
Canada | 2.9% | |||
Other | 19.4% | |||
| 100.0% | ||||
Annual Report 2016
48
Statement of Investments
October 31, 2016
Aberdeen International Equity Fund
| Shares or Principal Amount | Value | |||||||
COMMON STOCKS (89.7%) | ||||||||
AUSTRALIA (0.9%) | ||||||||
Health Care (0.9%) | ||||||||
CSL Ltd. (a) | 54,700 | $ | 4,173,914 | |||||
CANADA (2.9%) | ||||||||
Materials (1.4%) | ||||||||
Potash Corp. of Saskatchewan, Inc. | 391,000 | 6,357,795 | ||||||
Telecommunication Services (1.5%) | ||||||||
TELUS Corp. | 214,400 | 6,942,065 | ||||||
| 13,299,860 | ||||||||
FRANCE (1.5%) | ||||||||
Consumer Staples (1.5%) | ||||||||
L’Oreal SA (a) | 37,800 | 6,772,215 | ||||||
GERMANY (5.2%) | ||||||||
Health Care (3.7%) | ||||||||
Bayer AG (a) | 59,800 | 5,937,519 | ||||||
Fresenius Medical Care AG & Co. KGaA (a) | 132,800 | 10,817,106 | ||||||
| 16,754,625 | ||||||||
Materials (1.5%) | ||||||||
Linde AG (a) | 41,400 | 6,837,897 | ||||||
| 23,592,522 | ||||||||
HONG KONG (8.3%) | ||||||||
Consumer Discretionary (1.5%) | ||||||||
Samsonite International SA (a) | 2,148,600 | 6,741,486 | ||||||
Financials (2.8%) | ||||||||
AIA Group Ltd. (a) | 2,057,900 | 12,946,253 | ||||||
Industrials (3.0%) | ||||||||
Jardine Matheson Holdings Ltd. | 153,400 | 9,343,594 | ||||||
MTR Corp. Ltd. (a) | 852,000 | 4,715,033 | ||||||
| 14,058,627 | ||||||||
Real Estate (1.0%) | ||||||||
Swire Pacific Ltd., Class A (a) | 431,500 | 4,484,949 | ||||||
| 38,231,315 | ||||||||
INDIA (3.0%) | ||||||||
Consumer Staples (1.5%) | ||||||||
ITC Ltd. (a) | 1,935,200 | 7,001,293 | ||||||
Financials (1.5%) | ||||||||
Housing Development Finance Corp. Ltd. (a) | 330,900 | 6,831,243 | ||||||
| 13,832,536 | ||||||||
ISRAEL (2.8%) | ||||||||
Information Technology (2.8%) | ||||||||
Check Point Software Technologies Ltd. (b) | 149,200 | 12,616,352 | ||||||
ITALY (1.5%) | ||||||||
Energy (1.5%) | ||||||||
Tenaris SA, ADR | 242,100 | 6,827,220 | ||||||
JAPAN (13.8%) | ||||||||
Consumer Discretionary (1.7%) | ||||||||
Shimano, Inc. (a) | 45,700 | 7,813,770 | ||||||
Consumer Staples (3.4%) | ||||||||
Japan Tobacco, Inc. (a) | 413,900 | 15,736,529 | ||||||
Industrials (1.7%) | ||||||||
FANUC Corp. (a) | 41,800 | 7,653,055 | ||||||
Information Technology (1.6%) | ||||||||
Keyence Corp. (a) | 9,700 | 7,110,986 | ||||||
Materials (3.2%) | ||||||||
Shin-Etsu Chemical Co. Ltd. (a) | 195,700 | 14,838,235 | ||||||
Real Estate (2.2%) | ||||||||
Daito Trust Construction Co. Ltd. (a) | 60,900 | 10,205,544 | ||||||
| 63,358,119 | ||||||||
MEXICO (2.6%) | ||||||||
Consumer Staples (2.6%) | ||||||||
Fomento Economico Mexicano SAB de CV, ADR | 124,700 | 11,930,049 | ||||||
PHILIPPINES (0.9%) | ||||||||
Real Estate (0.9%) | ||||||||
Ayala Land, Inc. (a) | 5,597,300 | 4,186,737 | ||||||
SINGAPORE (6.3%) | ||||||||
Financials (1.9%) | ||||||||
Oversea-Chinese Banking Corp. Ltd. (a) | 1,417,900 | 8,638,039 | ||||||
Real Estate (1.4%) | ||||||||
City Developments Ltd. (a) | 1,054,000 | 6,417,523 | ||||||
Telecommunication Services (3.0%) | ||||||||
Singapore Telecommunications Ltd. (a) | 4,930,900 | 13,742,054 | ||||||
| 28,797,616 | ||||||||
SOUTH AFRICA (1.4%) | ||||||||
Telecommunication Services (1.4%) | ||||||||
MTN Group Ltd. (a) | 752,800 | 6,502,186 | ||||||
SWEDEN (2.0%) | ||||||||
Industrials (2.0%) | ||||||||
Atlas Copco AB, A Shares (a) | 315,400 | 9,239,665 | ||||||
SWITZERLAND (10.6%) | ||||||||
Consumer Staples (3.4%) | ||||||||
Nestle SA (a) | 211,900 | 15,365,688 | ||||||
Health Care (7.2%) | ||||||||
Novartis AG (a) | 235,000 | 16,677,382 | ||||||
Roche Holding AG (a) | 71,800 | 16,491,135 | ||||||
| 33,168,517 | ||||||||
| 48,534,205 | ||||||||
See accompanying Notes to Financial Statements.
2016 Annual Report
49
Statement of Investments (concluded)
October 31, 2016
Aberdeen International Equity Fund
| Shares or Principal Amount | Value | |||||||
TAIWAN (3.5%) | ||||||||
Information Technology (3.5%) | ||||||||
Taiwan Semiconductor Manufacturing Co. Ltd. (a) | 2,695,000 | $ | 16,173,642 | |||||
THAILAND (0.9%) | ||||||||
Financials (0.9%) | ||||||||
Kasikornbank PCL (a) | 850,800 | 4,177,305 | ||||||
UNITED KINGDOM (21.6%) | ||||||||
Consumer Discretionary (2.4%) | ||||||||
Whitbread PLC (a) | 247,142 | 10,917,556 | ||||||
Consumer Staples (2.1%) | ||||||||
British American Tobacco PLC (a) | 163,200 | 9,353,471 | ||||||
Energy (4.4%) | ||||||||
John Wood Group PLC (a) | 717,500 | 6,743,905 | ||||||
Royal Dutch Shell PLC, B Shares (a) | 522,700 | 13,481,741 | ||||||
| 20,225,646 | ||||||||
Financials (3.4%) | ||||||||
Prudential PLC (a) | 518,500 | 8,461,334 | ||||||
Standard Chartered PLC (a)(b) | 839,657 | 7,301,582 | ||||||
| 15,762,916 | ||||||||
Industrials (4.4%) | ||||||||
Experian PLC (a) | 471,000 | 9,054,756 | ||||||
Rolls-Royce Holdings PLC (a)(b) | 736,000 | 6,533,189 | ||||||
Rolls-Royce Holdings PLC, C Shares (b) | 33,856,000 | 41,440 | ||||||
Weir Group PLC (The) (a) | 212,000 | 4,403,830 | ||||||
| 20,033,215 | ||||||||
Materials (1.0%) | ||||||||
BHP Billiton PLC (a) | 307,500 | 4,623,897 | ||||||
Telecommunication Services (3.9%) |
| |||||||
Inmarsat PLC (a) | 812,900 | 6,973,099 | ||||||
Vodafone Group PLC (a) | 3,959,300 | 10,873,523 | ||||||
| 17,846,622 | ||||||||
| 98,763,323 | ||||||||
Total Common Stocks | 411,008,781 | |||||||
PREFERRED STOCKS (7.7%) | ||||||||
BRAZIL (2.3%) | ||||||||
Financials (2.3%) | ||||||||
Banco Bradesco SA, ADR, Preferred Shares | 1,001,540 | 10,426,031 | ||||||
GERMANY (2.5%) | ||||||||
Consumer Staples (2.5%) | ||||||||
Henkel AG & Co. KGaA, Preferred Shares (a) | 87,800 | 11,284,992 | ||||||
REPUBLIC OF SOUTH KOREA (2.9%) |
| |||||||
Information Technology (2.9%) | ||||||||
Samsung Electronics Co. Ltd., GDR, Preferred Shares (c) | 23,500 | 13,371,500 | ||||||
Total Preferred Stocks | 35,082,523 | |||||||
SHORT-TERM INVESTMENT (2.3%) | ||||||||
UNITED STATES (2.3%) | ||||||||
State Street Institutional U.S. Government Money Market Fund (d) | 10,521,547 | 10,521,547 | ||||||
Total Short-Term Investment | 10,521,547 | |||||||
Total Investments | 456,612,851 | |||||||
Other assets in excess of liabilities—0.3% | 1,484,520 | |||||||
Net Assets—100.0% | $ | 458,097,371 | ||||||
| (a) | Fair Valued Security. Fair Values are determined pursuant to procedures approved by the Fund’s Board of Trustees. See Note 2(a) of the accompanying Notes to Financial Statements. |
| (b) | Non-income producing security. |
| (c) | Denotes a security issued under Regulation S or Rule 144A. |
| (d) | Registered investment company advised by State Street Global Advisors. |
| (e) | See accompanying Notes to Financial Statements for tax unrealized appreciation/(depreciation) of securities. |
| ADR | American Depositary Receipt |
| GDR | Global Depositary Receipt |
See accompanying Notes to Financial Statements.
Annual Report 2016
50
Aberdeen International Small Cap Fund (Unaudited)
The Aberdeen International Small Cap Fund (Institutional Class shares net of fees) returned 7.92% for the 12-month period ended October 31, 2016, versus the 4.60% return of its benchmark, the Morgan Stanley Capital International (MSCI) All Country (AC) World ex USA Small Cap Index, during the same period. For broader comparison, the average return of the Fund’s peer category of International Small/Mid-Cap Growth Funds (comprising 67 funds), as measured by Lipper, Inc., was 0.90% for the period.
International small-cap equities rose during the reporting period, outperforming their large-cap counterparts, as measured by the MSCI AC World ex USA Index. Stock markets tumbled early in the period when commodity prices plummeted and the U.S. Federal Reserve (Fed) raised interest rates for the first time in a decade, and again in June 2016, when the UK voted to leave the European Union. However, investor sentiment recovered quickly in both instances. Meanwhile, investors reacted positively as central banks in Japan and parts of Europe unexpectedly imposed negative interest rates to combat low inflation and boost spending, while persistent deflationary pressures forced the Fed to maintain an accommodative monetary policy stance. The end of the period saw anxiety rise again, ahead of a nail-biting finish to the U.S. presidential vote in November. Republican Donald Trump subsequently won the election on November 8, garnering a majority of electoral votes in the race against his Democratic Party opponent, former U.S. Secretary of State Hillary Clinton. Elsewhere, oil prices fluctuated throughout the year, in tandem with ongoing speculation over a production cap by members of the Organization of the Petroleum Exporting Countries (OPEC).
Fund performance for the reporting period was bolstered by the holding in Brazilian dental benefits provider OdontoPrev. The company reported healthy quarterly results over the period, driven by an increase in sales of individual plans. The position in Brazilian shopping-center developer Iguatemi Empresa also contributed to Fund performance, as the company posted healthy profits over the reporting period attributable to an increase in sales at its shopping malls and higher rental revenue. Additionally, shares of Brazilian footwear manufacturer Arezzo rose over the period as the company delivered strong earnings growth driven by accelerated domestic sales following the successful implementation of a new marketing program.
Conversely, the effects of the Brexit1 vote had a negative impact on UK-based investment management firm Rathbone Brothers, as well as global real estate groups Jones Lang LaSalle and Millennium & Copthorne Hotels, all of which saw their share prices decline over the period.
During the reporting period, we initiated positions in Auckland International Airport; Israel-based consumer products maker Frutarom; Hong Kong exchange-listed luggage-maker Samsonite International; UK-based software company Aveva Group; Temenos group, a Swiss developer of banking software systems; Jyothy Laboratories and Parque Arauco; and two UK-based companies – Dignity, a provider of funeral-related services, and brewer and pub operator Fuller Smith & Turner. In contrast, we exited the Fund’s positions in Oxford Instruments, a provider of technology tools and systems for industry and research; U.S.-based consumer goods packaging manufacturer Silgan Holdings; UK-based consumer products maker PZ Cussons; Israel-based retailer Rami Levi Chain Stores; and French animal health pharmaceutical firm Societe Virbac. We also sold the Fund’s shares in UK-based diversified financial services company Close Brothers Group, as we feel that the company faces increased competition within its high-margin specialist lending business.
We anticipate that global markets will remain cautious in light of the unexpected U.S. election result, which rattled financial markets in a reactionary sell-off. Until there is greater clarity on President-elect Trump’s policies, we think that it is difficult to predict the impact on the U.S. dollar and the Fed’s monetary policy, and more turmoil is expected in coming months. Meanwhile, we believe that there may be further uncertainty driven by the upcoming Brexit* negotiations, mounting debt concerns in China, and uncertainty over central bank policy in Europe. We think that oil prices likely will remain in the doldrums, with OPEC members showing few signs of achieving consensus on reducing output. Despite the turbulent outlook, we maintain faith in our investment process, which seeks opportunities to add to what we believe are high-quality holdings at a good price, which we feel should benefit the Fund’s performance over the long term.
Portfolio Management:
Aberdeen Global Equity Team
PAST PERFORMANCE DOES NOT GUARANTEE FUTURE RESULTS.
The performance data quoted represents past performance and current returns may be lower or higher. Class A Shares have up to a 5.75% front-end sales charge and a 0.25% 12b-1 fee. The investment return and principal value will fluctuate so that an investor’s shares, when redeemed, may be worth more or less than the original cost. To obtain performance information current to the most recent month-end, which may be higher or lower than the performance shown above, please call 866-667-9231 or go to www.aberdeen-asset.us.
Investing in mutual funds involves risk, including the possible loss of principal.
Indexes are unmanaged and have been provided for comparison purposes only. No fees or expenses are reflected. You cannot invest directly in an index.
Lipper is a leading global provider of mutual fund information and analysis to fund companies, financial intermediaries and media organizations.
Risk Considerations
Smaller company stocks are usually less stable in price and less liquid than those of larger, more established companies, and therefore carry greater risk to investors.
Foreign securities may be more volatile, harder to price and less liquid than U.S. securities. They are subject to different accounting and
| 1 | Brexit is an abbreviation of “British exit,” which refers to the June 23, 2016 referendum by British voters to exit the European Union. |
2016 Annual Report
51
Aberdeen International Small Cap Fund (Unaudited) (concluded)
regulatory standards, currency exchange rates, political and economic risks. Fluctuation in currency exchange rates may impact the Fund’s returns more greatly to the extent the Fund does not hedge currency
exposure or hedging techniques are unsuccessful. The foregoing risks are enhanced in emerging market countries.
Investing a significant portion of the Fund’s assets in securities of companies conducting business in a broadly related group of industries within an economic sector may make the Fund more vulnerable to unfavorable developments in that sector.
Please read the prospectus for more detailed information regarding these and other risks.
Annual Report 2016
52
Aberdeen International Small Cap Fund (Unaudited)
| Average Annual Total Return1 (For periods ended October 31, 2016) | 1 Yr. | 5 Yr. | 10 Yr. | |||||||||||
Class A2 | w/o SC | 7.57% | 8.34% | 3.67% | ||||||||||
| w/SC3 | 1.38% | 7.07% | 3.06% | |||||||||||
Class C | w/o SC | 6.85% | 7.61% | 2.94% | ||||||||||
| w/SC4 | 5.90% | 7.61% | 2.94% | |||||||||||
Class R5,6 | w/o SC | 7.24% | 8.05% | 3.40% | ||||||||||
Institutional Service Class5,7 | w/o SC | 7.65% | 8.45% | 3.77% | ||||||||||
Institutional Class5,8 | w/o SC | 7.92% | 8.69% | 3.88% | ||||||||||
All figures showing the effect of a sales charge (SC) reflect the maximum charge possible because it has the most significant effect on performance data. The total returns shown above do not include the impact of financial statement rounding of the net asset value (NAV) per share and/or financial statement adjustments.
| 1 | The Fund changed its investment strategy effective February 29, 2016. Performance information for periods prior to February 29, 2016 does not reflect the current investment strategy. Returns prior to July 20, 2009 reflect the performance of a predecessor fund (the “Predecessor Fund”). Returns of the Predecessor Fund have not been adjusted to reflect the expenses applicable to the respective classes. Prior to the change of investment strategy of the Fund effective February 29, 2016, the Fund and the Predecessor Fund had substantially similar investment objectives and strategies. Please consult the Fund’s prospectus for more detail. |
| 2 | Class A returns prior to July 20, 2009, are based on the previous performance of Common Class shares of the Predecessor Fund. Excluding the effect of any fee waivers or reimbursements, this performance is substantially similar to what Class A shares would have produced because both classes invest in the same portfolio of securities. Returns of the Predecessor Fund have not been adjusted to reflect the expenses applicable to the respective classes. |
| 3 | A 5.75% front-end sales charge was deducted. |
| 4 | A 1.00% contingent deferred sales charge (CDSC) was deducted from the one year return because it is charged when Class C shares are sold within the first year after purchase. |
| 5 | Not subject to any sales charges. |
| 6 | Returns for Class R shares prior to July 20, 2009 are based on the previous performance of Adviser Class shares of the Predecessor Fund. Excluding the effect of any fee waivers or reimbursements, this performance is substantially similar to what Class R shares would have produced because both classes invest in the same portfolio of securities. Returns of the Predecessor Fund have not been adjusted to reflect the expenses applicable to the respective classes. |
| 7 | Returns before the first offering of Institutional Service Class shares (September 16, 2009) are based on the previous performance of the Fund’s Class A shares. This performance is substantially similar to what Institutional Service Class shares would have produced because both classes invest in the same portfolio of securities. Returns would only differ to the extent of the differences in expenses between the two classes. |
| 8 | Returns before the first offering of Institutional Class shares (July 20, 2009) are based on the previous performance of Common Class shares of the Predecessor Fund. Excluding the effect of any fee waivers or reimbursements, this performance is substantially similar to what Institutional Class shares would have produced because both classes invest in the same portfolio of securities. Returns have been adjusted to eliminate sales charges that do not apply to Institutional Class shares, but have not been adjusted to reflect its lower expenses. |
2016 Annual Report
53
Aberdeen International Small Cap Fund (Unaudited)
Performance of a $10,000 Investment (as of October 31, 2016)
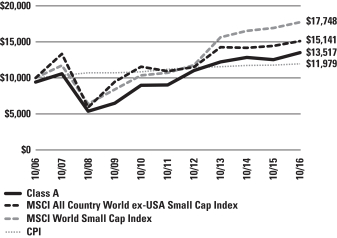
Comparative performance of $10,000 invested in Class A shares of the Aberdeen International Small Cap Fund, Morgan Stanley Capital Index (MSCI) All Country World (ACWI) ex-USA Small Cap Index, MSCI World Small Cap Index and the Consumer Price Index (CPI) over a 10-year period ended October 31, 2016. Effective February 29, 2016, the MSCI All Country World ex-USA Small Cap Index replaced the MSCI World Small Cap Index as the Fund’s benchmark index. The Adviser believes that the MSCI All Country World ex-USA Small Cap Index is a more meaningful comparison given the Fund’s investment strategy. Unlike the Fund, the returns for these unmanaged indexes do not reflect any fees, expenses, or sales charges. Investors cannot invest directly in market indexes.
The MSCI ACWI ex-USA Small Cap Index captures small cap representation across 22 of 23 Developed Markets (DM) countries (excluding the US) and 23 Emerging Markets (EM) countries. With 4,321 constituents, the index covers approximately 14% of the global equity opportunity set outside the US. DM countries in the Index are: Australia, Austria, Belgium, Canada, Denmark, Finland, France, Germany, Hong Kong, Ireland, Israel, Italy, Japan, Netherlands, New Zealand, Norway, Portugal, Singapore, Spain, Sweden, Switzerland and the UK. EM countries in the Index are: Brazil, Chile, China, Colombia, Czech Republic, Egypt, Greece, Hungary, India, Indonesia, Korea, Malaysia, Mexico, Peru, Philippines, Poland, Russia, Qatar, South Africa, Taiwan, Thailand, Turkey and United Arab Emirates.
The MSCI World Small Cap Index captures small cap representation across 23 Developed Markets (DM) countries. With 4,333 constituents, the index covers approximately 14% of the free float-adjusted market capitalization in each country.
The CPI is a measure of the average change over time in the prices paid by urban consumers for a market basket of consumer goods and services.
Investment return and principal value will fluctuate, and when redeemed, shares may be worth more or less than original cost. Past performance is no guarantee of future results. The Average Annual Total Return table and Performance graph do not reflect the deduction of taxes that a shareholder would pay on fund distributions or the redemption of fund shares. Investing in mutual funds involves market risk, including loss of principal. Performance returns assume the reinvestment of all distributions. Total returns reflect waivers and reimbursements in effect, without which returns would have been lower.
Portfolio Summary (as a percentage of net assets)
October 31, 2016 (Unaudited)
| Asset Allocation | ||||
Common Stocks | 99.1% | |||
Short-Term Investment | 0.8% | |||
Other assets in excess of liabilities | 0.1% | |||
| 100.0% | ||||
The following table summarizes the composition of the Fund’s portfolio, in Standard & Poor’s Global Industry Classification Standard (GICS) sectors, expressed as a percentage of net assets. The GICS structure consists of 11 sectors, 24 industry groups, 68 industries and 157 sub-industries. As of October 31, 2016, the Fund did not have more than 25% of its assets invested in any industry group.
| Top Sectors | ||||
Consumer Staples | 20.6% | |||
Industrials | 19.1% | |||
Consumer Discretionary | 16.3% | |||
Materials | 13.6% | |||
Health Care | 13.1% | |||
Real Estate | 6.7% | |||
Information Technology | 3.2% | |||
Financials | 2.5% | |||
Utilities | 1.5% | |||
Energy | 1.5% | |||
Other | 1.9% | |||
| 100.0% | ||||
Annual Report 2016
54
Aberdeen International Small Cap Fund (Unaudited) (concluded)
| Top Holdings* | ||||
Embotelladora Andina SA, Class A | 4.3% | |||
Kaba Holding AG, Class B | 3.2% | |||
Castrol (India) Ltd. | 3.0% | |||
Clicks Group Ltd. | 3.0% | |||
FUCHS PETROLUB SE | 2.6% | |||
Arezzo Industria e Comercio SA | 2.5% | |||
Dechra Pharmaceuticals PLC | 2.5% | |||
Iguatemi Empresa de Shopping Centers SA | 2.4% | |||
Barry Callebaut AG | 2.4% | |||
ARB Corp. Ltd. | 2.4% | |||
Other | 71.7% | |||
| 100.0% | ||||
| * | For the purpose of listing top holdings, Short-Term Investments are included as part of Other. |
| Top Countries | ||||
United Kingdom | 22.4% | |||
Japan | 9.6% | |||
Brazil | 8.7% | |||
Chile | 8.3% | |||
Germany | 7.7% | |||
Switzerland | 7.4% | |||
India | 6.9% | |||
Hong Kong | 4.1% | |||
Thailand | 3.8% | |||
South Africa | 3.0% | |||
Other | 18.1% | |||
| 100.0% | ||||
2016 Annual Report
55
Statement of Investments
October 31, 2016
Aberdeen International Small Cap Fund
| Shares or Principal Amount | Value | |||||||
COMMON STOCKS (99.1%) | ||||||||
AUSTRALIA (2.4%) | ||||||||
Consumer Discretionary (2.4%) | ||||||||
ARB Corp. Ltd. (a) | 135,700 | $ | 1,757,472 | |||||
BRAZIL (8.7%) | ||||||||
Consumer Discretionary (2.5%) | ||||||||
Arezzo Industria e Comercio SA | 199,000 | 1,843,493 | ||||||
Health Care (2.3%) | ||||||||
OdontoPrev SA | 441,600 | 1,660,151 | ||||||
Industrials (1.5%) | ||||||||
Wilson Sons Ltd., BDR | 102,669 | 1,109,674 | ||||||
Real Estate (2.4%) | ||||||||
Iguatemi Empresa de Shopping Centers SA | 190,400 | 1,798,421 | ||||||
| 6,411,739 | ||||||||
CANADA (1.4%) | ||||||||
Financials (1.4%) | ||||||||
Canadian Western Bank | 55,700 | 1,056,859 | ||||||
CHILE (8.3%) | ||||||||
Consumer Staples (6.3%) | ||||||||
Embotelladora Andina SA, Class A | 839,800 | 3,138,869 | ||||||
Vina Concha y Toro SA | 866,600 | 1,511,064 | ||||||
| 4,649,933 | ||||||||
Real Estate (2.0%) | ||||||||
Parque Arauco SA | 585,500 | 1,450,260 | ||||||
| 6,100,193 | ||||||||
CHINA (1.0%) | ||||||||
Telecommunication Services (1.0%) | ||||||||
Asia Satellite Telecommunications Holdings Ltd. (b) | 517,000 | 699,950 | ||||||
GERMANY (7.7%) | ||||||||
Consumer Discretionary (1.4%) | ||||||||
Fielmann AG (a) | 14,900 | 1,034,109 | ||||||
Consumer Staples (1.6%) | ||||||||
KWS Saat SE (b) | 3,600 | 1,177,666 | ||||||
Materials (4.7%) | ||||||||
FUCHS PETROLUB SE (a) | 48,300 | 1,911,183 | ||||||
Symrise AG (a) | 22,100 | 1,517,725 | ||||||
| 3,428,908 | ||||||||
| 5,640,683 | ||||||||
HONG KONG (4.1%) | ||||||||
Consumer Discretionary (2.1%) | ||||||||
Samsonite International SA (a) | 483,300 | 1,516,411 | ||||||
Industrials (2.0%) | ||||||||
Kerry Logistics Network Ltd. (a) | 1,138,500 | 1,511,276 | ||||||
| 3,027,687 | ||||||||
INDIA (6.9%) | ||||||||
Consumer Staples (1.9%) | ||||||||
Jyothy Laboratories Ltd. (a) | 266,400 | 1,429,184 | ||||||
Health Care (2.0%) | ||||||||
Sanofi India Ltd. | 22,200 | 1,441,297 | ||||||
Materials (3.0%) | ||||||||
Castrol (India) Ltd. (a) | 324,000 | 2,229,211 | ||||||
| 5,099,692 | ||||||||
INDONESIA (2.0%) | ||||||||
Consumer Discretionary (2.0%) | ||||||||
Ace Hardware Indonesia Tbk PT (a) | 21,987,800 | 1,439,425 | ||||||
ISRAEL (2.0%) | ||||||||
Materials (2.0%) | ||||||||
Frutarom Industries Ltd. (a) | 28,500 | 1,506,014 | ||||||
JAPAN (9.6%) | ||||||||
Consumer Discretionary (1.8%) | ||||||||
Resorttrust, Inc. (a) | 67,700 | 1,353,204 | ||||||
Consumer Staples (2.0%) | ||||||||
Calbee, Inc. (a) | 40,700 | 1,476,662 | ||||||
Health Care (4.0%) | ||||||||
Asahi Intecc Co. Ltd. (a) | 34,500 | 1,494,144 | ||||||
Sysmex Corp. (a) | 20,700 | 1,434,553 | ||||||
| 2,928,697 | ||||||||
Industrials (1.8%) | ||||||||
Nabtesco Corp. (a) | 44,200 | 1,320,103 | ||||||
| 7,078,666 | ||||||||
MALAYSIA (1.6%) | ||||||||
Consumer Staples (1.6%) | ||||||||
Carlsberg Brewery Malaysia Bhd | 333,400 | 1,158,754 | ||||||
MEXICO (1.5%) | ||||||||
Industrials (1.5%) | ||||||||
Grupo Aeroportuario del Sureste SAB de CV, Class B | 69,600 | 1,108,018 | ||||||
NEW ZEALAND (1.2%) | ||||||||
Industrials (1.2%) | ||||||||
Auckland International Airport Ltd. (a) | 187,000 | 880,688 | ||||||
SINGAPORE (2.3%) | ||||||||
Health Care (2.3%) | ||||||||
Raffles Medical Group Ltd. (a) | 1,595,451 | 1,724,944 | ||||||
SOUTH AFRICA (3.0%) | ||||||||
Consumer Staples (3.0%) | ||||||||
Clicks Group Ltd. | 238,800 | 2,222,631 | ||||||
SPAIN (1.8%) | ||||||||
Consumer Staples (1.8%) | ||||||||
Viscofan SA (a) | 27,700 | 1,304,159 | ||||||
See accompanying Notes to Financial Statements.
Annual Report 2016
56
Statement of Investments (concluded)
October 31, 2016
Aberdeen International Small Cap Fund
| Shares or Principal Amount | Value | |||||||
SWITZERLAND (7.4%) | ||||||||
Consumer Staples (2.4%) | ||||||||
Barry Callebaut AG (a)(b) | 1,440 | $ | 1,793,263 | |||||
Industrials (3.2%) | ||||||||
Kaba Holding AG, Class B (a)(b) | 3,400 | 2,362,603 | ||||||
Information Technology (1.8%) | ||||||||
Temenos Group AG (a)(b) | 20,000 | 1,291,630 | ||||||
| 5,447,496 | ||||||||
THAILAND (3.8%) | ||||||||
Real Estate (2.3%) | ||||||||
Tesco Lotus Retail Growth Freehold & Leasehold Property Fund (c) | 3,226,800 | 1,687,276 | ||||||
Utilities (1.5%) | ||||||||
Electricity Generating PCL, Foreign Shares (a) | 202,500 | 1,127,032 | ||||||
| 2,814,308 | ||||||||
UNITED KINGDOM (22.4%) | ||||||||
Consumer Discretionary (4.1%) | ||||||||
Dignity PLC (a) | 20,100 | 651,877 | ||||||
Fuller Smith & Turner PLC, Class A (a) | 86,600 | 1,103,808 | ||||||
Millennium & Copthorne Hotels PLC (a) | 223,000 | 1,222,813 | ||||||
| 2,978,498 | ||||||||
Energy (1.5%) | ||||||||
John Wood Group PLC (a) | 118,200 | 1,110,982 | ||||||
Financials (1.1%) | ||||||||
Rathbone Brothers PLC | 38,500 | 840,693 | ||||||
Health Care (2.5%) | ||||||||
Dechra Pharmaceuticals PLC | 110,000 | 1,810,909 | ||||||
Industrials (7.9%) | ||||||||
Rotork PLC (a) | 587,700 | 1,466,169 | ||||||
Spirax-Sarco Engineering PLC (a) | 20,100 | 1,083,694 | ||||||
Ultra Electronics Holdings PLC (a) | 68,800 | 1,563,254 | ||||||
Weir Group PLC (The) (a) | 80,600 | 1,674,286 | ||||||
| 5,787,403 | ||||||||
Information Technology (1.4%) | ||||||||
AVEVA Group PLC (a) | 46,600 | 1,049,230 | ||||||
Materials (3.9%) | ||||||||
Croda International PLC (a) | 33,400 | 1,428,345 | ||||||
Victrex PLC (a) | 67,200 | 1,439,023 | ||||||
| 2,867,368 | ||||||||
| 16,445,083 | ||||||||
Total Common Stocks | 72,924,461 | |||||||
SHORT-TERM INVESTMENT (0.8%) | ||||||||
UNITED STATES (0.8%) | ||||||||
State Street Institutional U.S. Government Money Market Fund (d) | 581,817 | 581,817 | ||||||
Total Short-Term Investment | 581,817 | |||||||
Total Investments | 73,506,278 | |||||||
Other assets in excess of liabilities—0.1% | 48,729 | |||||||
Net Assets—100.0% | $ | 73,555,007 | ||||||
| (a) | Fair Valued Security. Fair Values are determined pursuant to procedures approved by the Fund’s Board of Trustees. See Note 2(a) of the accompanying Notes to Financial Statements. |
| (b) | Non-income producing security. |
| (c) | As of October 31, 2016, security is a closed-end fund incorporated in Thailand. |
| (d) | Registered investment company advised by State Street Global Advisors. |
| (e) | See accompanying Notes to Financial Statements for tax unrealized appreciation/(depreciation) of securities. |
| BDR | Brazilian Depositary Receipt |
See accompanying Notes to Financial Statements.
2016 Annual Report
57
Aberdeen Japanese Equities Fund (Unaudited)
The Aberdeen Japanese Equities Fund (Institutional Class shares net of fees) returned 10.50% from the date of its inception on November 30, 2015, to the end of the reporting period on October 31, 2016, versus the 5.74% return of its benchmark, the Tokyo Stock Price Index (TOPIX), during the same period. For broader comparison, the average return of the Fund’s peer category of Japanese Funds (comprising 33 funds), as measured by Lipper, Inc., was 6.01% for the period.
Japanese equities rose during the reporting period, buoyed by a weaker yen, as well as upbeat economic data in both the U.S. and domestically. The market weathered apprehension ahead of the U.S. presidential election, a likely rate hike by the U.S. Federal Reserve (Fed) in December, and UK Prime Minister Theresa May’s resolve to start formal Brexit1 negotiations in March 2017, which had sent the sterling to a 31-year low against the U.S. dollar in October 2016. In economic news, leading indicators2 rose to their highest levels in nearly a year, led by the manufacturing sector. Bank lending rose in September 2016, while the jobless rate eased. Lower energy prices and the stronger yen accounted for not only a positive trade balance as the consequent slump in imports outweighed the decline in exports, they also compelled inflation to retreat. Meanwhile, household spending slid by more than the market had anticipated and economic sentiment slipped unexpectedly in September 2016, according to the Japanese government’s Economy Watchers’ Survey.
Earlier in the reporting period, investor sentiment had been dampened by the sell-off in Chinese equities, the continued decline in the oil price, and worries over the health of the global economy. Also weighing on share prices was the spike in the yen after the Fed switched gears and announced a more measured approach to interest-rate hikes. Mitigating these negative factors were the European Central Bank’s package of fresh monetary stimulus and the Bank of Japan’s (BoJ’s) move to impose negative interest rates. The UK’s unexpected vote to exit the European Union also reverberated across global financial markets. The yen strengthened subsequently in the ensuing flight to safety and on hopes that the BoJ would unleash substantial stimulus.
Fund performance for the reporting period benefited from the holding in Daito Trust Construction Co. The real estate company reported better-than-expected profits, bolstered by effective cost controls and increased demand to build rental houses on the back of a low interest rate environment, in addition to the need to reduce inheritance tax payments (which would provide prospective homebuyers with more funds for down payments). The Fund’s holding in Shin-Etsu Chemical Co. also contributed to performance. The company’s results benefited from its polyvinyl chloride (PVC) business, which saw significant profit growth attributable to lower costs, along with solid contributions from its specialty chemicals, electronics and functional materials businesses. Manufacturing company Keyence reported better-than-expected full-year 2016 results, with strong sales across all regions on the back of brisk demand for factory automation.
In contrast, the Fund’s position in Aeon Financial Services detracted from performance over the reporting period. In an effort to repay debt, the company will raise funds via a public offering, third-party allocation,3 and a convertible bond issue. We believe that this may potentially result in the significant dilution4 of existing stakeholdings of minority shareholders. We are disappointed by Aeon’s decision and have engaged with management in an effort to understand and discuss the move. The position in diversified financial services company Concordia Financial Group also weighed on Fund performance, as its shares declined following by the BoJ’s decision to maintain its negative interest-rate policy. We believe that this is likely to continue to hurt the banking sector via lower net-interest margins. Finally, retailer Seven & i Holdings lowered its full-year 2016 forecast for net profits, largely due to impairment5 losses from its struggling department store and general-merchandise store businesses. However, the company took further steps to restructure its businesses.
In portfolio activity over the reporting period, we initiated a holding in systems integrator SCSK Corp., which has a significant presence in the financials, manufacturing and distribution sectors. We believe that the company’s mid- to long-term growth potential appears promising, as it shifts towards a larger proportion of fee-generating projects, and given its vigilance in keeping its projects profitable. The business is also backed by a robust balance sheet and stable cash flow-generation, in our opinion. We also established a new position in snack-food maker Calbee, as we think that its experienced management has been gaining market share through product innovation, underpinning the solid domestic growth. The company is also expanding overseas, particularly to the U.S., UK and Asia through joint ventures. Backed by a sturdy balance sheet, clear operational targets and a good track record, we believe that the company should continue to perform well over the longer term. In contrast, we participated in Kansai Paint’s share repurchase, taking partial profits in the stock after a period of strong stock price performance.
Republican Donald Trump won the U.S. presidential election on November 8, garnering a majority of electoral votes in the race against his Democratic Party opponent, former U.S. Secretary of State Hillary Clinton. Looking ahead, we believe that Trump’s presidency may mean greater uncertainty for Japan. His campaign rhetoric against global trade, as well as his stance on the U.S.’s traditional security alliances across northeast Asia, rattled Japanese politicians and businesses. Nevertheless, the president-elect met with Japan’s Prime Minister Shinzo Abe shortly after the election, which we believe is an indication that Trump may opt for a pragmatic policy approach. We think that the medium-term outlook appears mixed, however. While the implications of a stronger U.S. dollar and
| 1 | Brexit is an abbreviation of “British exit,” which refers to the June 23, 2016 referendum by British voters to exit the European Union. |
| 2 | Leading economic indicators comprise measurable economic factors that change before the economy starts to follow a particular pattern or trend. |
| 3 | Under a third-party allocation, a company issues shares of stock directly to designated investors or shareholders. |
| 4 | Dilution is a reduction in the ownership percentage of a share of stock caused by the issuance of new shares. |
| 5 | Impairment is a permanent reduction in the value of a company’s asset. |
Annual Report 2016
58
Aberdeen Japanese Equities Fund (Unaudited) (concluded)
the consequently weaker yen may improve the competitiveness of Japanese exporters, rising trade barriers and withdrawals from or weakening of trade agreements may undo such potential benefits, in our view. In comparison, Japanese companies with existing operations in the U.S. may potentially benefit from Trump’s commitment to spend more on domestic infrastructure.
Within the Fund, there is a modest portion of holdings with segments of their operations based in the U.S.; these companies are likely to escape largely unscathed from the adverse trade policies of the Trump administration, in our opinion. We believe that the remainder of the Fund’s holdings are well-placed despite this uncertain backdrop, even with the companies’ geographic business exposure divided equally between Japan and the rest of the world. In our view, this is attributable to their global operations, solid balance sheets and agility in adapting to changing economic conditions that should help insulate them from the impact of these challenges.
Portfolio Management:
Aberdeen Asia-Pacific Equity Team
PAST PERFORMANCE DOES NOT GUARANTEE FUTURE RESULTS.
The performance data quoted represents past performance and current returns may be lower or higher. Class A Shares have up to a 5.75% front-end sales charge and a 0.25% 12b-1 fee. The investment return and principal value will fluctuate so that an investor’s shares, when redeemed, may be worth more or less than the original cost. To obtain performance information current to the most recent month-end, which may be higher or lower than the performance shown above, please call 866-667-9231 or go to www.aberdeen-asset.us.
Investing in mutual funds involves risk, including the possible loss of principal.
Indexes are unmanaged and have been provided for comparison purposes only. No fees or expenses are reflected. You cannot invest directly in an index.
Lipper is a leading global provider of mutual fund information and analysis to fund companies, financial intermediaries and media organizations.
Risk Considerations
Concentrating investments in the Japan region subjects the Fund to more volatility and greater risk of loss than geographically diverse mutual funds.
Foreign securities may be more volatile, harder to price and less liquid than U.S. securities. They are subject to different accounting and regulatory standards, currency exchange rates, political and economic risks. Fluctuation in currency exchange rates may impact the Fund’s returns more greatly to the extent the Fund does not hedge currency exposure or hedging techniques are unsuccessful. The foregoing risks are enhanced in emerging market countries.
Equity stocks of small- and mid-cap companies carry greater risk, and more volatility than equity stocks of larger, more established companies.
Investing a significant portion of the Fund’s assets in securities of companies conducting business in a broadly related group of industries within an economic sector may make the Fund more vulnerable to unfavorable developments in that sector.
Please read the prospectus for more detailed information regarding these and other risks.
2016 Annual Report
59
Aberdeen Japanese Equities Fund (Unaudited)
Average Annual Total Return (For periods ended October 31, 2016) | Inception†1 | |||||
Class A | w/o SC | 10.27% | ||||
| w/SC2 | 3.93% | |||||
Class C | w/o SC | 9.50% | ||||
| w/SC3 | 8.50% | |||||
Class R4 | w/o SC | 10.05% | ||||
Institutional Service Class4 | w/o SC | 10.50% | ||||
Institutional Class4 | w/o SC | 10.50% | ||||
All figures showing the effect of a sales charge (SC) reflect the maximum charge possible because it has the most significant effect on performance data. The total returns shown above do not include the impact of financial statement rounding of the net asset value (NAV) per share and/or financial statement adjustments.
| † | Not Annualized |
| 1 | Fund commenced operations on November 30, 2015. |
| 2 | A 5.75% front-end sales charge was deducted. |
| 3 | A 1.00% contingent deferred sales charge (CDSC) was deducted because it is charged when Class C shares are sold within the first year after purchase. |
| 4 | Not subject to any sales charges. |
Annual Report 2016
60
Aberdeen Japanese Equities Fund (Unaudited)
Performance of a $1,000,000 Investment* (as of October 31, 2016)
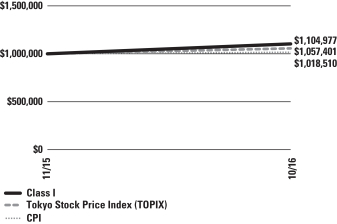
| * | Minimum Initial Investment |
Comparative performance of $1,000,000 invested in Institutional shares of the Aberdeen Japanese Equities Fund, the Tokyo Stock Price Index (TOPIX) and the Consumer Price Index (CPI) from inception to October 31, 2016. Unlike the Fund, the returns for these unmanaged indexes do not reflect any fees, expenses, or sales charges. Investors cannot invest directly in market indexes.
TOPIX is a free-float adjusted market capitalization-weighted index that is calculated based on all the domestic common stocks listed on the Tokyo Stock Exchange First Section. TOPIX shows the measure of current market capitalization assuming that market capitalization as of the base date (January 4, 1968) is 100 points. Indexes are unmanaged and have been provided for comparison purposes only.
The CPI is a measure of the average change over time in the prices paid by urban consumers for a market basket of consumer goods and services.
Investment returns and principal value will fluctuate, and when redeemed, shares may be worth more or less than original cost. Past performance is no guarantee of future results. The Average Annual Total Return table and Performance graph do not reflect the deduction of taxes that a shareholder would pay on fund distributions or the redemption of fund shares. Investing in mutual funds involves market risk, including loss of principal. Performance returns assume the reinvestment of all distributions. Total returns reflect waivers and reimbursements in effect, without which returns would have been lower.
Portfolio Summary (as a percentage of net assets)
October 31, 2016 (Unaudited)
| Asset Allocation | ||||
Common Stocks | 96.7% | |||
Short-Term Investment | 1.6% | |||
Other assets in excess of liabilities | 1.7% | |||
| 100.0% | ||||
The following table summarizes the composition of the Fund’s portfolio, in Standard & Poor’s Global Industry Classification Standard (GICS) sectors, expressed as a percentage of net assets. The GICS structure consists of 11 sectors, 24 industry groups, 68 industries and 157 sub-industries. As of October 31, 2016, the Fund did not have more than 25% of its assets invested in any industry group.
| Top Sectors | ||||
Industrials | 21.9% | |||
Consumer Staples | 14.4% | |||
Consumer Discretionary | 14.1% | |||
Information Technology | 11.4% | |||
Health Care | 9.2% | |||
Materials | 8.8% | |||
Financials | 7.5% | |||
Real Estate | 4.8% | |||
Telecommunication Services | 4.6% | |||
Other | 3.3% | |||
| 100.0% | ||||
| Top Holdings* | ||||
Keyence Corp. | 6.6% | |||
Shin-Etsu Chemical Co. Ltd. | 6.1% | |||
Japan Tobacco, Inc. | 4.8% | |||
KDDI Corp. | 4.6% | |||
Amada Holdings Co. Ltd. | 4.5% | |||
Seven & i Holdings Co. Ltd. | 4.5% | |||
Nabtesco Corp. | 4.3% | |||
East Japan Railway Co. | 3.9% | |||
Toyota Motor Corp. | 3.6% | |||
Daikin Industries Ltd. | 3.4% | |||
Other | 53.7% | |||
| 100.0% | ||||
| * | For the purpose of listing top holdings, Short-Term Investments are included as part of Other. |
| Top Countries | ||||
Japan | 96.7% | |||
United States | 1.6% | |||
Other | 1.7% | |||
| 100.0% | ||||
2016 Annual Report
61
Statement of Investments
October 31, 2016
Aberdeen Japanese Equities Fund
| Shares or Principal Amount | Value | |||||||
COMMON STOCKS (96.7%) (a) | ||||||||
JAPAN (96.7%) | ||||||||
Consumer Discretionary (14.1%) | ||||||||
Asics Corp. | 900 | $ | 19,205 | |||||
Denso Corp. | 400 | 17,406 | ||||||
Honda Motor Co. Ltd. | 800 | 23,937 | ||||||
Rinnai Corp. | 200 | 19,213 | ||||||
Sekisui House Ltd. | 600 | 9,914 | ||||||
Shimano, Inc. | 100 | 17,098 | ||||||
Toyota Motor Corp. | 700 | 40,605 | ||||||
USS Co. Ltd. | 600 | 10,148 | ||||||
| 157,526 | ||||||||
Consumer Staples (14.4%) | ||||||||
Calbee, Inc. | 300 | 10,885 | ||||||
Japan Tobacco, Inc. | 1,400 | 53,228 | ||||||
Pigeon Corp. | 900 | 25,320 | ||||||
Seven & i Holdings Co. Ltd. | 1,200 | 50,087 | ||||||
Unicharm Corp. | 900 | 21,401 | ||||||
| 160,921 | ||||||||
Financials (7.5%) | ||||||||
AEON Financial Service Co. Ltd. | 1,100 | 19,365 | ||||||
Concordia Financial Group Ltd. | 3,300 | 15,301 | ||||||
Japan Exchange Group, Inc. | 1,000 | 14,848 | ||||||
Suruga Bank Ltd. | 1,400 | 34,178 | ||||||
| 83,692 | ||||||||
Health Care (9.2%) | ||||||||
Astellas Pharma, Inc. | 2,500 | 37,104 | ||||||
Chugai Pharmaceutical Co. Ltd. | 1,100 | 37,486 | ||||||
Sysmex Corp. | 400 | 27,721 | ||||||
| 102,311 | ||||||||
Industrials (21.9%) | ||||||||
Amada Holdings Co. Ltd. | 4,400 | 50,121 | ||||||
Daikin Industries Ltd. | 400 | 38,332 | ||||||
East Japan Railway Co. | 500 | 44,014 | ||||||
FANUC Corp. | 200 | 36,617 | ||||||
Makita Corp. | 400 | 27,656 | ||||||
Nabtesco Corp. | 1,600 | 47,787 | ||||||
| 244,527 | ||||||||
Information Technology (11.4%) | ||||||||
Canon, Inc. | 700 | 20,110 | ||||||
Keyence Corp. | 100 | 73,309 | ||||||
SCSK Corp. | 300 | 11,191 | ||||||
Yahoo Japan Corp. | 5,900 | 22,632 | ||||||
| 127,242 | ||||||||
Materials (8.8%) | ||||||||
Kansai Paint Co. Ltd. | 1,400 | 30,086 | ||||||
Shin-Etsu Chemical Co. Ltd. | 900 | 68,239 | ||||||
| 98,325 | ||||||||
Real Estate (4.8%) | ||||||||
Daito Trust Construction Co. Ltd. | 200 | 33,516 | ||||||
Mitsubishi Estate Co. Ltd. | 1,000 | 19,875 | ||||||
| 53,391 | ||||||||
Telecommunication Services (4.6%) | ||||||||
KDDI Corp. | 1,700 | 51,669 | ||||||
| 1,079,604 | ||||||||
Total Common Stocks | 1,079,604 | |||||||
SHORT-TERM INVESTMENT (1.6%) | ||||||||
UNITED STATES (1.6%) | ||||||||
State Street Institutional U.S. Government Money Market Fund (b) | 17,194 | 17,194 | ||||||
Total Short-Term Investment | 17,194 | |||||||
Total Investments | 1,096,798 | |||||||
Other assets in excess of liabilities—1.7% | 19,353 | |||||||
Net Assets—100.0% | $ | 1,116,151 | ||||||
| (a) | All securities are fair valued. Fair Values are determined pursuant to procedures approved by the Fund’s Board of Trustees. See Note 2(a) of the accompanying Notes to Financial Statements. |
| (b) | Registered investment company advised by State Street Global Advisors. |
| (c) | See accompanying Notes to Financial Statements for tax unrealized appreciation/(depreciation) of securities. |
See accompanying Notes to Financial Statements.
Annual Report 2016
62
Aberdeen U.S. Mid Cap Equity Fund (Unaudited)
The Aberdeen U.S. Mid Cap Equity Fund (Institutional Class shares net of fees) returned 9.70% from the date of its inception on February 29, 2016, to the end of the reporting period on October 31, 2016, versus 12.97% for its benchmark, the Russell Midcap Index, for the same period. For broader comparison, the average return of the Fund’s peer category of Mid-Cap Core Funds (consisting of 159 funds), as measured by Lipper, Inc., was 9.71% for the period.
Major North American equity market indices posted strong gains despite numerous bouts of volatility during the period of February 29, 2016 to October 31, 2016. The primary drivers of the market’s performance were a sharp rebound following a strong sell-off that extended from 2015 into 2016, higher energy prices and the outlook for the sector, continued speculation regarding U.S. Federal Reserve (Fed) monetary policy, and generally positive economic data reports. There were also several spikes in volatility surrounding events such as uncertainty created by Brexit1 and, particularly later in the period, concerns regarding the pending U.S. presidential election in early November 2016. Mid-cap stocks, as measured by the Russell Midcap Index, rose 12.97% for the reporting period. All sectors ended the period in positive territory with particular strength in the energy, information technology and materials sectors.
On the economic front, the U.S. Department of Commerce reported that gross domestic product (GDP) expanded by an increasing amount in each of the quarters covered by the reporting period, rising. 0.8%, 1.4% and 2.9% for the first three quarters of 2016, respectively. Upturns in consumer spending and exports offset the negative impact of a decline in residential fixed investment and an increase in imports (which are subtracted from GDP) over the period. According to the U.S. Department of Labor, the U.S. economy added an average of approximately 173,000 jobs per month over the 12-month reporting period, and the unemployment rate dipped 0.1% to 4.9%. Furthermore, while the labor force participation rate2 rose 0.3 percentage point over the reporting period, it has remained virtually flat over the past three years as more jobseekers have entered the market. There was an abundance of market speculation that the data-dependent Fed, with such a strong set of economic indicators, would raise the federal funds rate at its meeting in December 2016.
The Fund underperformed relative to its benchmark, the Russell Midcap Index, for the reporting period. Fund performance was hindered largely by stock selection in the energy and financials sectors, as well as lack of exposure in the strong-performing energy sector. The most notable detractors from performance among individual holdings were Genpact, a provider of digitally powered business process management and services; medical device maker Globus Medical; and energy services company Core Laboratories.
Genpact’s results were hampered by a decline in its customers’ discretionary technology spending. Consequently, the company’s IT outsourcing business weakened and management lowered its earnings guidance for the full 2016 fiscal year. On the positive side, Genpact continued to grow its non-General Electric (GE) client business (Genpact was spun off of GE, which remains Genpact’s largest customer). Globus Medical’s quarterly results over the reporting period were hindered by poor salesforce productivity and hiring issues that caused management to reduce its growth outlook for the full 2016 fiscal year. Globus Medical continued to deliver new products and made a small acquisition during this period. The ongoing weakness in oil prices had a negative impact on the demand for Core Laboratories’ products and services over the reporting period. Similar to other service providers for the energy industry, Core Laboratories’ management has begun to see a recovery in the company’s end-market demand.
Overall positioning in the consumer discretionary sector and stock selection in the consumer staples sector enhanced Fund performance for the reporting period. The largest individual stock contributors included specialty apparel retailer PVH Corp., life sciences company FEI Company, and International Flavors & Fragrances.
PVH Corp. posted generally positive results over the reporting period. The company benefited mainly from strength in its Calvin Klein and Tommy Hilfiger brands and international business, as well as higher operating margins. In May 2016, Thermo Fisher Scientific (in which the Fund has no position) announced an agreement to acquire FEI Company for a 14% premium to FEI’s stock price at that time. We subsequently exited the position. During the reporting period, International Flavors & Fragrances (IFF) benefited from higher revenues in both its fine fragrances and consumer fragrances segments, continued margin improvement, as well as the positive contributions of acquisitions of Ottens Flavors and Lucas Meyer Cosmetics, which IFF acquired in May and July 2015, respectively. These positive factors offset relative weakness in the company’s flavors business and in the Europe, Middle East and Africa region.
Following the Fund’s launch, the Aberdeen North American Equity team initiated and exited a relatively small number of holdings, continuing our search for what we believe are solidly managed, high-quality companies. We established new holdings in CDW Corp., a provider of integrated technology solutions; Manhattan Associates, a developer and provider of supply chain commerce solutions; and egg producer Cal-Maine Foods. In addition to selling the Fund’s shares in FEI Company as previously noted, we exited the position in Sherwin-Williams Co., a retailer and distributor of paint, coatings and related products, due to our concerns about the impact of a pending acquisition of Valspar.
In our view, Donald Trump’s unexpected victory over Hillary Clinton in the U.S. presidential election in early November was another example of a spate of movements against the status quo, which we have seen play out globally in 2016. As with the UK Brexit1 referendum, it appeared that the electorate voted against the “establishment” as the Trump campaign promised meaningful changes to regulation, trade policy and an increase in infrastructure improvement funding within the U.S. The markets swiftly priced in
| 1 | Brexit is an abbreviation of “British exit,” which refers to the June 23, 2016 referendum by British voters to exit the European Union. |
| 2 | The labor force participation rate is expressed as a percentage of the U.S. population aged 16 years and older working or actively seeking work. |
2016 Annual Report
63
Aberdeen U.S. Mid Cap Equity Fund (Unaudited) (concluded)
many of the possible changes that had been proposed, boosting the U.S. dollar and companies that will likely benefit from government fiscal stimulus or looser regulation. Following the election, the 5-year, 5-year forward inflation expectation rate3 (a key Fed decision input data point) moved sharply higher and the U.S. Treasury yield curve steepened, indicating expectations of higher interest rates. This environment should benefit financial companies, particularly banks. Shares of global companies have had more mixed results given Trump’s tough stance on trade policies. Infrastructure and defense company stocks have performed well, reflecting Trump’s key spending initiatives. While we think that the political environment has the potential to prove beneficial for domestically oriented smaller U.S. companies, we continue to look for businesses that we believe create value without the need for help from fiscal stimulus. We believe that there is opportunity resulting from divergence in stock and sector returns that we witnessed in November and going forward. Our strategy is built with a balanced, bottom-up investment approach which we think could provide opportunities to take advantage of the large swings in stock prices.
Portfolio Management:
Aberdeen North American Equity Team
PAST PERFORMANCE DOES NOT GUARANTEE FUTURE RESULTS.
The performance data quoted represents past performance and current returns may be lower or higher. Class A Shares have up to a 5.75% front-end sales charge and a 0.25% 12b-1 fee. The investment return and principal value will fluctuate so that an investor’s shares, when redeemed, may be worth more or less than the original cost. To obtain performance information current to the most recent month-end, which may be higher or lower than the performance shown above, please call 866-667-9231 or go to www.aberdeen-asset.us.
Investing in mutual funds involves risk, including the possible loss of principal.
Indexes are unmanaged and have been provided for comparison purposes only. No fees or expenses are reflected. You cannot invest directly in an index.
Lipper is a leading global provider of mutual fund information and analysis to fund companies, financial intermediaries and media organizations.
Risk Considerations
The Fund could lose value if the individual stocks in which it invests or overall stock markets in which such stocks trade decrease in value.
The investment team may select securities that underperform the stock market or other funds with similar investment objectives and strategies.
Equity stocks of mid-cap companies carry greater risk and more volatility than equity stocks of larger, more established companies.
Investing a significant portion of the Fund’s assets in securities of companies conducting business in a broadly related group of industries within an economic sector may make the Fund more vulnerable to unfavorable developments in that sector.
Please read the prospectus for more detailed information regarding these and other risks.
| 3 | The Fed’s 5-year, 5-year forward inflation expectation rate is the measure of an average rate of expected inflation over the five-year period that begins five years from the current date. |
64
Annual Report 2016
Aberdeen U.S. Mid Cap Equity Fund (Unaudited)
Average Annual Total Return (For periods ended October 31, 2016) | Inception†,1 | |||||
Class A | w/o SC | 9.50% | ||||
| w/SC2 | 3.21% | |||||
Class C | w/o SC | 8.90% | ||||
| w/SC3 | 7.90% | |||||
Class R4 | w/o SC | 9.30% | ||||
Institutional Service Class4 | w/o SC | 9.70% | ||||
Institutional Class4 | w/o SC | 9.70% | ||||
All figures showing the effect of a sales charge (SC) reflect the maximum charge possible because it has the most significant effect on performance data. The total returns shown above do not include the impact of financial statement rounding of the net asset value (NAV) per share and/or financial statement adjustments.
| † | Not Annualized |
| 1 | Fund commenced operations on February 29, 2016. |
| 2 | A 5.75% front-end sales charge was deducted. |
| 3 | A 1.00% contingent deferred sales charge (CDSC) was deducted because it is charged when Class C shares are sold within the first year after purchase. |
| 4 | Not subject to any sales charges. |
2016 Annual Report
65
Aberdeen U.S. Mid Cap Equity Fund (Unaudited)
Performance of a $1,000,000 Investment* (as of October 31, 2016)
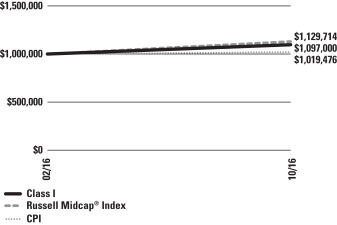
| * | Minimum Initial Investment |
Comparative performance of $1,000,000 invested in Institutional shares of the Aberdeen U.S. Mid Cap Equity Fund, Russell Midcap® Index and the Consumer Price Index (CPI) from inception to October 31, 2016. Unlike the Fund, the returns for these unmanaged indexes do not reflect any fees, expenses, or sales charges. Investors cannot invest directly in market indexes.
The Russell Midcap® Index measures the performance of the mid-cap segment of the U.S. equity universe. The Russell Midcap® Index is a subset of the Russell 1000® Index. It includes approximately 800 of the smallest securities based on a combination of their market cap and current index membership. The Russell Midcap® Index represents approximately 31% of the total market capitalization of the Russell 1000 companies. The Russell 1000® Index is constructed to provide a comprehensive and unbiased barometer for the mid-cap segment. The index is completely reconstituted annually to ensure larger stocks do not distort the performance and characteristics of the true mid-cap opportunity set.
The CPI is a measure of the average change over time in the prices paid by urban consumers for a market basket of consumer goods and services.
Investment return and principal value will fluctuate, and when redeemed, shares may be worth more or less than original cost. Past performance is no guarantee of future results. The Average Annual Total Return table and Performance graph do not reflect the deduction of taxes that a shareholder would pay on fund distributions or the redemption of fund shares. Investing in mutual funds involves market risk, including loss of principal. Performance returns assume the reinvestment of all distributions. Total returns reflect waivers and reimbursements in effect, without which returns would have been lower.
Portfolio Summary (as a percentage of net assets)
October 31, 2016 (Unaudited)
| Asset Allocation | ||||
Common Stocks | 101.9% | |||
Short-Term Investment | 1.6% | |||
Liabilities in excess of other assets | (3.5% | ) | ||
| 100.0% | ||||
The following table summarizes the composition of the Fund’s portfolio, in Standard & Poor’s Global Industry Classification Standard (GICS) sectors, expressed as a percentage of net assets. The GICS structure consists of 11 sectors, 24 industry groups, 68 industries and 157 sub-industries. As of October 31, 2016, the Fund did not have more than 25% of its assets invested in any industry group.
| Top Sectors | ||||
Industrials | 20.0% | |||
Information Technology | 16.6% | |||
Health Care | 15.0% | |||
Consumer Discretionary | 12.7% | |||
Financials | 10.8% | |||
Consumer Staples | 10.1% | |||
Real Estate | 6.1% | |||
Materials | 4.9% | |||
Utilities | 3.5% | |||
Energy | 2.2% | |||
Other | (1.9% | ) | ||
| 100.0% | ||||
Annual Report 2016
66
Aberdeen U.S. Mid Cap Equity Fund (Unaudited) (concluded)
| Top Holdings* | ||||
M&T Bank Corp. | 3.8% | |||
BorgWarner, Inc. | 3.3% | |||
Rockwell Automation, Inc. | 3.3% | |||
Casey’s General Stores, Inc. | 3.1% | |||
Alliance Data Systems Corp. | 3.0% | |||
Molson Coors Brewing Co. | 3.0% | |||
PVH Corp. | 3.0% | |||
Analog Devices, Inc. | 2.9% | |||
PAREXEL International Corp. | 2.8% | |||
Tiffany & Co. | 2.7% | |||
Other | 69.1% | |||
| 100.0% | ||||
| * | For the purpose of listing top holdings, Short-Term Investments are included as part of Other. |
| Top Countries | ||||
United States | 97.0% | |||
Israel | 2.3% | |||
Netherlands | 2.2% | |||
Canada | 2.0% | |||
Other | (3.5% | ) | ||
| 100.0% | ||||
2016 Annual Report
67
Statement of Investments
October 31, 2016
Aberdeen U.S. Mid Cap Equity Fund
| Shares or Principal Amount | Value | |||||||
COMMON STOCKS (101.9%) | ||||||||
CANADA (2.0%) | ||||||||
Industrials (2.0%) | ||||||||
Ritchie Bros Auctioneers, Inc. | 617 | $ | 21,342 | |||||
ISRAEL (2.3%) | ||||||||
Information Technology (2.3%) | ||||||||
Check Point Software Technologies Ltd. (a) | 296 | 25,030 | ||||||
NETHERLANDS (2.2%) | ||||||||
Energy (2.2%) | ||||||||
Core Laboratories NV | 251 | 24,339 | ||||||
UNITED STATES (95.4%) | ||||||||
Consumer Discretionary (12.7%) | ||||||||
BorgWarner, Inc. | 1,022 | 36,628 | ||||||
Pool Corp. | 179 | 16,572 | ||||||
PVH Corp. | 303 | 32,415 | ||||||
Ross Stores, Inc. | 377 | 23,578 | ||||||
Tiffany & Co. | 410 | 30,102 | ||||||
| 139,295 | ||||||||
Consumer Staples (10.1%) | ||||||||
Cal-Maine Foods, Inc. | 616 | 23,808 | ||||||
Casey’s General Stores, Inc. | 302 | 34,123 | ||||||
Mead Johnson Nutrition Co. | 267 | 19,964 | ||||||
Molson Coors Brewing Co. | 313 | 32,493 | ||||||
| 110,388 | ||||||||
Financials (10.8%) | ||||||||
Bank of the Ozarks, Inc. | 591 | 21,843 | ||||||
CBOE Holdings, Inc. | 454 | 28,697 | ||||||
M&T Bank Corp. | 338 | 41,483 | ||||||
Moody’s Corp. | 265 | 26,638 | ||||||
| 118,661 | ||||||||
Health Care (15.0%) | ||||||||
Baxter International, Inc. | 619 | 29,458 | ||||||
Cerner Corp. (a) | 499 | 29,232 | ||||||
Globus Medical, Inc., Class A (a) | 1,193 | 26,401 | ||||||
Mettler-Toledo International, Inc. (a) | 60 | 24,245 | ||||||
PAREXEL International Corp. (a) | 524 | 30,528 | ||||||
Teleflex, Inc. | 171 | 24,475 | ||||||
| 164,339 | ||||||||
Industrials (18.0%) | ||||||||
CH Robinson Worldwide, Inc. | 335 | 22,820 | ||||||
Equifax, Inc. | 220 | 27,273 | ||||||
Kansas City Southern | 319 | 27,995 | ||||||
Republic Services, Inc. | 458 | 24,105 | ||||||
Rockwell Automation, Inc. | 301 | 36,036 | ||||||
Snap-on, Inc. | 194 | 29,895 | ||||||
Verisk Analytics, Inc. (a) | 365 | 29,766 | ||||||
| 197,890 | ||||||||
Information Technology (14.3%) | ||||||||
Alliance Data Systems Corp. (a) | 160 | 32,715 | ||||||
Analog Devices, Inc. | 490 | 31,409 | ||||||
CDW Corp. | 510 | 22,904 | ||||||
Genpact Ltd. (a) | 1,219 | 28,025 | ||||||
Manhattan Associates, Inc. (a) | 400 | 20,256 | ||||||
Paychex, Inc. | 400 | 22,080 | ||||||
| 157,389 | ||||||||
Materials (4.9%) | ||||||||
International Flavors & Fragrances, Inc. | 219 | 28,641 | ||||||
Sonoco Products Co. | 500 | 25,145 | ||||||
| 53,786 | ||||||||
Real Estate (6.1%) | ||||||||
Digital Realty Trust, Inc., REIT | 249 | 23,264 | ||||||
Healthcare Realty Trust, Inc., REIT | 700 | 22,323 | ||||||
Jones Lang LaSalle, Inc. | 221 | 21,404 | ||||||
| 66,991 | ||||||||
Utilities (3.5%) | ||||||||
American Water Works Co., Inc. | 226 | 16,733 | ||||||
CMS Energy Corp. | 518 | 21,834 | ||||||
| 38,567 | ||||||||
| 1,047,306 | ||||||||
Total Common Stocks | 1,118,017 | |||||||
SHORT-TERM INVESTMENT (1.6%) | ||||||||
UNITED STATES (1.6%) | ||||||||
State Street Institutional U.S. Government Money Market Fund (b) | 17,982 | 17,982 | ||||||
Total Short-Term Investment | 17,982 | |||||||
Total Investments | 1,135,999 | |||||||
Liabilities in excess of other assets—(3.5)% | (38,563 | ) | ||||||
Net Assets—100.0% | $ | 1,097,436 | ||||||
| (a) | Non-income producing security. |
| (b) | Registered investment company advised by State Street Global Advisors. |
| (c) | See accompanying Notes to Financial Statements for tax unrealized appreciation/(depreciation) of securities. |
| REIT | Real Estate Investment Trust |
See accompanying Notes to Financial Statements.
Annual Report 2016
68
Aberdeen U.S. Multi-Cap Equity Fund (Unaudited)
The Aberdeen U.S. Multi-Cap Equity Fund (Institutional Class shares net of fees) returned 2.63% for the 12-month period ended October 31, 2016, versus the 4.24% return of its benchmark, the Russell 3000 Index, and 4.51% for the broader-market Standard and Poor’s (S&P) 500 Index, for the same period. For broader comparison, the average return of the Fund’s peer category of Multi-Cap Core Funds (consisting of 292 funds), as measured by Lipper, Inc., was 1.54% for the period.
Major North American equity market indices posted modest gains despite numerous periods of volatility over the 12-month period ended October 31, 2016. The primary catalysts of the market’s performance were continued speculation regarding U.S. Federal Reserve (Fed) monetary policy, generally positive economic data reports and, particularly later in the period, uncertainty regarding the pending U.S. presidential election. Shares of large-cap companies, as measured by the broader-market S&P 500 Index, returned 4.51%, modestly outperforming the 4.10% return of their small-cap counterparts, as represented by the Russell 2000 Index, as well as the 4.23% gain of the Russell Midcap Index, the mid-cap equity market benchmark. The utilities and telecommunication services sectors garnered double-digit returns and were the strongest performers within the Russell 3000 Index over the reporting period, while the healthcare and consumer discretionary sectors lost ground and were the most notable market laggards.
Shortly after the end of the reporting period in early November, Republican Donald Trump won the U.S. presidential election on November 8, garnering a majority of electoral votes in the race against his Democratic Party opponent, former U.S. Secretary of State Hillary Clinton. The outcome of the election was widely unexpected, as Clinton led most major polls for much of the campaign. Regarding monetary policy, the Fed raised its benchmark interest rate by 25 basis points (bps) to a range of 0.25-0.50% at its meeting in December 2015, and subsequently left the rate unchanged over the next ten months, noting the pick-up in economic activity and steady job gains. However, the decisions following the Fed’s meetings in July, September and November 2016, were not unanimous, as several Fed governors voted for an increase of 25 bps.
On the economic front, the U.S. Department of Commerce reported that gross domestic product (GDP) expanded by 0.9%, 0.8%, 1.4% and 2.9% for the fourth quarter of 2015 and the first three quarters of 2016, respectively. Upturns in consumer spending and exports offset the negative impact of a decline in residential fixed investment and an increase in imports (which are subtracted from GDP) over the period. According to the U.S. Department of Labor, the U.S. economy added an average of approximately 173,000 jobs per month over the 12-month reporting period, and the unemployment rate dipped 0.1% to 4.9%. Furthermore, while the labor participation rate1 rose 0.3% over the reporting period, it has remained virtually flat over the past three years as more jobseekers have entered the market.
Fund performance for the reporting period was hampered primarily by stock selection in the information technology sector and overall positioning in the consumer staples and financials sectors. The largest individual stock detractors from performance were IT services provider Cognizant Technology Solutions, Arkansas-based Bank of the Ozarks and biopharmaceutical firm Gilead Sciences.
Shares of Cognizant Technology underperformed relative to those of its peers as the company faced questions about the pace of revenue growth. Additionally, towards the end of the reporting period, Cognizant’s president, Gordon Coburn, resigned following an internal investigation into whether certain payments the company made relating to facilities in India were in violation of the U.S. Foreign Corrupt Practices Act. We retain the position with an understanding that the issues involved were narrowly focused and not indicative of larger problems at the firm. While Bank of the Ozarks benefited from generally higher interest margins over the period, its strong loan growth rate began to slow, modestly reducing its valuation. We still believe that Bank of the Ozarks is one of the better-run banks in the country and may potentially benefit from any improvement in lending growth or a higher interest-rate environment. Shares of Gilead Sciences moved lower during the reporting period, hampered mainly by declining sales of its Hepatitis C franchise, which has been partially offset by acceleration in its industry-leading HIV treatment franchise.
Conversely, stock selection in the industrials and consumer discretionary sectors bolstered Fund performance for the reporting period. The most notable contributors among individual holdings included semiconductor manufacturer Texas Instruments, specialty apparel retailer PVH Corp. and diversified healthcare company Baxter International. Texas Instruments’ quarterly results over the period were bolstered by record-high margins attributable mainly to a reduction in manufacturing costs and a switch in production from 200- to 300-millimeter semiconductor wafers. There was particular strength in its automotive and industrial market segments, which in our opinion highlights its well diversified end markets. PVH Corp. posted generally positive results during the reporting period. The company benefited mainly from strength in its Calvin Klein and Tommy Hilfiger brands and international business, which offset relative weakness in its Heritage brand. In our view, the company has been executing well fundamentally, despite encountering a stiff revenue headwind from the strong U.S. dollar over the latter half of the reporting period. Baxter International recorded healthy revenue growth in its hospital products segment and its U.S. business over the reporting period. The company also benefited from higher operating margins attributable to expense controls.
During the reporting period, we initiated positions in consumer credit reporting services provider Equifax; Richie Brothers Auctioneers, an auctioneer of industrial equipment; Alliance Data Systems, a provider of data-driven marketing and loyalty solutions; and Manhattan Associates, a developer and provider of supply chain commerce solutions. We exited the Fund’s positions in analytics software company Fair Isaac Corp. (FICO); Compass Minerals International, the largest rock-salt producer in North America and the UK; and swimming pool supplies distributor Pool Corp.
| 1 | The labor force participation rate is expressed as a percentage of the U.S. population aged 16 years and older working or actively seeking work. |
2016 Annual Report
69
Aberdeen U.S. Multi-Cap Equity Fund (Unaudited) (concluded)
In our view, Donald Trump’s unexpected upset of Hillary Clinton in early November was another example of a spate of protests against the status quo, which we have seen play out globally in 2016. As with the UK Brexit2 referendum, it appeared that many people voted against the “establishment” as the Trump campaign promised meaningful changes to regulation, trade policy and an increase in infrastructure improvement funding within the U.S. The markets swiftly priced in many of the possible changes that had been proposed, boosting the U.S. dollar and companies that will likely benefit from government fiscal stimulus or looser regulation. Shares of global companies have had more mixed results given Trump’s tough stance on trade policies, while infrastructure and defense company stocks have performed well, reflecting Trump’s key spending initiatives. Financial stocks also moved higher on conjecture of a possible rollback of regulations and the prospects for inflation and, consequently, higher interest rates. These factors have led to further expansion of the valuations of small-cap companies. While we think that the environment has the potential to prove beneficial for domestically oriented smaller companies, we do not expect a verbatim enactment of the entire list of campaign promises. Nonetheless, we believe that there are opportunities resulting from likely continued volatility and, in particular, divergence in stock and sector returns that we witnessed in November and going forward. Our strategy is built with a balanced, bottom-up investment approach which we think could provide opportunities to take advantage of the large swings in stock prices.
Portfolio Management:
Aberdeen North American Equity Team
PAST PERFORMANCE DOES NOT GUARANTEE FUTURE RESULTS.
The performance data quoted represents past performance and current returns may be lower or higher. Class A Shares have up to a 5.75% front-end sales charge and a 0.25% 12b-1 fee. The investment return and principal value will fluctuate so that an investor’s shares, when redeemed, may be worth more or less than the original cost. To obtain performance information current to the most recent month-end, which may be higher or lower than the performance shown above, please call 866-667-9231 or go to www.aberdeen-asset.us.
Investing in mutual funds involves risk, including the possible loss of principal.
Indexes are unmanaged and have been provided for comparison purposes only. No fees or expenses are reflected. You cannot invest directly in an index.
Lipper is a leading global provider of mutual fund information and analysis to fund companies, financial intermediaries and media organizations.
Risk Considerations
The Fund could lose value if the individual stocks in which it invests or overall stock markets in which such stocks trade decrease in value.
The investment team may select securities that underperform the stock market or other funds with similar investment objectives and strategies.
Investing a significant portion of the Fund’s assets in securities of companies conducting business in a broadly related group of industries within an economic sector may make the Fund more vulnerable to unfavorable developments in that sector.
Equity stocks of small- and mid-cap companies carry greater risk and more volatility than equity stocks of larger, more established companies.
Please read the prospectus for more detailed information regarding these and other risks.
| 2 | Brexit is an abbreviation of “British exit,” which refers to the June 23, 2016 referendum by British voters to exit the European Union. |
Annual Report 2016
70
Aberdeen U.S. Multi-Cap Equity Fund (Unaudited)
Average Annual Total Return1 (For periods ended October 31, 2016) | 1 Yr. | 5 Yr. | 10 Yr. | |||||||||||
Class A | w/o SC | 2.25% | 9.49% | 5.69% | ||||||||||
| w/SC2 | (3.60% | ) | 8.21% | 5.07% | ||||||||||
Class C | w/o SC | 1.56% | 8.70% | 4.96% | ||||||||||
| w/SC3 | 0.60% | 8.70% | 4.96% | |||||||||||
Class R4 | w/o SC | 1.95% | 9.23% | 5.48% | ||||||||||
Institutional Service Class4,5 | w/o SC | 2.52% | 9.74% | 5.98% | ||||||||||
Institutional Class4 | w/o SC | 2.63% | 9.83% | 6.02% | ||||||||||
All figures showing the effect of a sales charge (SC) reflect the maximum charge possible because it has the most significant effect on performance data. The total returns shown above do not include the impact of financial statement rounding of the net asset value (NAV) per share and/or financial statement adjustments.
| 1 | Returns from June 23, 2008 to October 9, 2011 reflect the performance of a predecessor fund (the “Predecessor Fund”). In addition, after February 28, 2009, the Predecessor Fund changed its investment style and became diversified. The returns prior to June 23, 2008 reflect the performance of another predecessor fund (the “Second Predecessor Fund”), which was acquired by the Predecessor Fund. Returns of the Predecessor Fund have not been adjusted to reflect the expenses applicable to the respective classes. Please consult the Fund’s prospectus for more detail. |
| 2 | A 5.75% front-end sales charge was deducted. |
| 3 | A 1.00% contingent deferred sales charge (CDSC) was deducted from the one year return because it is charged when Class C shares are sold within the first year after purchase. |
| 4 | Not subject to any sales charges. |
| 5 | Returns before the first offering of the Institutional Service Class (October 10, 2011) are based on the previous performance of the Institutional Class of the Predecessor Fund and Second Predecessor Fund. Excluding the effect of any fee waivers or reimbursements, this performance is substantially similar to what the Institutional Service Class would have produced because both classes invest in the same portfolio of securities. Returns would only differ to the extent of the differences in expenses of the two classes. |
2016 Annual Report
71
Aberdeen U.S. Multi-Cap Equity Fund (Unaudited)
Performance of a $10,000 Investment (as of October 31, 2016)
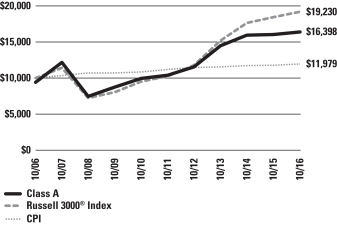
Comparative performance of $10,000 invested in Class A shares of the Aberdeen U.S. Multi-Cap Equity Fund, Russell 3000® Index and the Consumer Price Index (CPI) over a 10-year period ended October 31, 2016. Unlike the Fund, the returns for these unmanaged indexes do not reflect any fees, expenses, or sales charges. Investors cannot invest directly in market indexes.
The Russell 3000® Index measures the performance of the largest 3,000 U.S. companies representing approximately 98% of the investable U.S. equity market. The Russell 3000® Index is constructed to provide a comprehensive, unbiased, and stable barometer of the broad market and is completely reconstituted annually to ensure new and growing equities are reflected.
The CPI is a measure of the average change over time in the prices paid by urban consumers for a market basket of consumer goods and services.
Investment return and principal value will fluctuate, and when redeemed, shares may be worth more or less than original cost. Past performance is no guarantee of future results. The Average Annual Total Return table and Performance graph do not reflect the deduction of taxes that a shareholder would pay on fund distributions or the redemption of fund shares. Investing in mutual funds involves market risk, including loss of principal. Performance returns assume the reinvestment of all distributions. Total returns reflect waivers and reimbursements in effect, without which returns would have been lower.
Portfolio Summary (as a percentage of net assets)
October 31, 2016 (Unaudited)
| Asset Allocation | ||||
Common Stocks | 98.1% | |||
Short-Term Investment | 2.2% | |||
Liabilities in excess of other assets | (0.3% | ) | ||
| 100.0% | ||||
The following table summarizes the composition of the Fund’s portfolio, in Standard & Poor’s Global Industry Classification Standard (GICS) sectors, expressed as a percentage of net assets. The GICS structure consists of 11 sectors, 24 industry groups, 68 industries and 157 sub-industries. As of October 31, 2016, the Fund did not have more than 25% of its assets invested in any industry group.
| Top Sectors | ||||
Industrials | 17.8% | |||
Financials | 16.6% | |||
Information Technology | 14.8% | |||
Consumer Staples | 13.2% | |||
Health Care | 11.3% | |||
Consumer Discretionary | 10.6% | |||
Materials | 7.2% | |||
Energy | 6.6% | |||
Other | 1.9% | |||
| 100.0% | ||||
| Top Holdings* | ||||
M&T Bank Corp. | 3.9% | |||
Visa, Inc., Class A | 3.6% | |||
Intercontinental Exchange, Inc. | 3.2% | |||
Oracle Corp. | 3.1% | |||
Costco Wholesale Corp. | 3.1% | |||
Casey’s General Stores, Inc. | 3.0% | |||
PVH Corp. | 2.9% | |||
PAREXEL International Corp. | 2.8% | |||
BorgWarner, Inc. | 2.8% | |||
Verisk Analytics, Inc. | 2.7% | |||
Other | 68.9% | |||
| 100.0% | ||||
| * | For the purpose of listing top holdings, Short-Term Investments are included as part of Other. |
| Top Countries | ||||
United States | 94.5% | |||
Canada | 4.0% | |||
Netherlands | 1.8% | |||
Other | (0.3% | ) | ||
| 100.0% | ||||
Annual Report 2016
72
Statement of Investments
October 31, 2016
Aberdeen U.S. Multi-Cap Equity Fund
| Shares or Principal Amount | Value | |||||||
COMMON STOCKS (98.1%) | ||||||||
CANADA (4.0%) | ||||||||
Industrials (4.0%) | ||||||||
Canadian National Railway Co. | 131,642 | $ | 8,276,332 | |||||
Ritchie Bros Auctioneers, Inc. | 147,552 | 5,103,824 | ||||||
| 13,380,156 | ||||||||
NETHERLANDS (1.8%) | ||||||||
Energy (1.8%) | ||||||||
Core Laboratories NV | 62,715 | 6,081,473 | ||||||
UNITED STATES (92.3%) | ||||||||
Consumer Discretionary (10.6%) |
| |||||||
BorgWarner, Inc. | 259,690 | 9,307,289 | ||||||
Comcast Corp., Class A | 133,377 | 8,245,366 | ||||||
PVH Corp. | 93,017 | 9,950,959 | ||||||
TJX Cos., Inc. (The) | 114,985 | 8,480,144 | ||||||
| 35,983,758 | ||||||||
Consumer Staples (13.2%) | ||||||||
Casey’s General Stores, Inc. | 91,179 | 10,302,315 | ||||||
Costco Wholesale Corp. | 70,771 | 10,464,908 | ||||||
CVS Health Corp. | 100,150 | 8,422,615 | ||||||
Estee Lauder Cos., Inc. (The), Class A | 80,456 | 7,010,131 | ||||||
Philip Morris International, Inc. | 90,483 | 8,726,181 | ||||||
| 44,926,150 | ||||||||
Energy (4.8%) | ||||||||
EOG Resources, Inc. | 99,935 | 9,036,123 | ||||||
Schlumberger Ltd. | 94,466 | 7,390,075 | ||||||
| 16,426,198 | ||||||||
Financials (16.6%) | ||||||||
American International Group, Inc. | 132,325 | 8,164,453 | ||||||
Bank of the Ozarks, Inc. | 192,220 | 7,104,451 | ||||||
Charles Schwab Corp. (The) | 285,063 | 9,036,497 | ||||||
Intercontinental Exchange, Inc. | 39,844 | 10,773,419 | ||||||
M&T Bank Corp. | 107,800 | 13,230,294 | ||||||
Moody’s Corp. | 81,383 | 8,180,619 | ||||||
| 56,489,733 | ||||||||
Health Care (11.3%) | ||||||||
Baxter International, Inc. | 167,000 | 7,947,530 | ||||||
Gilead Sciences, Inc. | 85,399 | 6,287,928 | ||||||
Globus Medical, Inc., Class A (a) | 351,473 | 7,778,098 | ||||||
PAREXEL International Corp. (a) | 160,981 | 9,378,753 | ||||||
Teleflex, Inc. | 49,624 | 7,102,683 | ||||||
| 38,494,992 | ||||||||
Industrials (13.8%) | ||||||||
Deere & Co. | 103,261 | 9,117,946 | ||||||
Equifax, Inc. | 62,153 | 7,705,107 | ||||||
Lockheed Martin Corp. | 20,783 | 5,120,516 | ||||||
RBC Bearings, Inc. (a) | 97,701 | 6,970,966 | ||||||
Rockwell Automation, Inc. | 75,459 | 9,033,952 | ||||||
Verisk Analytics, Inc. (a) | 112,009 | 9,134,334 | ||||||
| 47,082,821 | ||||||||
Information Technology (14.8%) | ||||||||
Alliance Data Systems Corp. (a) | 26,453 | 5,408,845 | ||||||
Cognizant Technology Solutions Corp., Class A (a) | 153,099 | 7,861,634 | ||||||
Manhattan Associates, Inc. (a) | 101,194 | 5,124,464 | ||||||
Oracle Corp. | 272,788 | 10,480,515 | ||||||
Texas Instruments, Inc. | 127,991 | 9,068,162 | ||||||
Visa, Inc., Class A | 149,563 | 12,340,443 | ||||||
| 50,284,063 | ||||||||
Materials (7.2%) | ||||||||
Ecolab, Inc. | 77,200 | 8,813,924 | ||||||
Praxair, Inc. | 72,742 | 8,515,179 | ||||||
Sensient Technologies Corp. | 94,443 | 7,036,948 | ||||||
| 24,366,051 | ||||||||
| 314,053,766 | ||||||||
Total Common Stocks | 333,515,395 | |||||||
SHORT-TERM INVESTMENT (2.2%) | ||||||||
UNITED STATES (2.2%) | ||||||||
State Street Institutional U.S. Government Money Market Fund (b) | 7,522,891 | 7,522,891 | ||||||
Total Short-Term Investment | 7,522,891 | |||||||
Total Investments | 341,038,286 | |||||||
Liabilities in excess of other assets—(0.3)% | (874,520 | ) | ||||||
Net Assets—100.0% | $ | 340,163,766 | ||||||
| (a) | Non-income producing security. |
| (b) | Registered investment company advised by State Street Global Advisors. |
| (c) | See accompanying Notes to Financial Statements for tax unrealized appreciation/(depreciation) of securities. |
See accompanying Notes to Financial Statements.
2016 Annual Report
73
Aberdeen U.S. Small Cap Equity Fund (Unaudited)
As of February 29, 2016, the Fund’s investment strategy changed and its name changed from Aberdeen Small Cap Fund to Aberdeen U.S. Small Cap Equity Fund.
The Aberdeen U.S. Small Cap Equity Fund (Institutional Class shares net of fees) returned 8.18% for the 12-month period ended October 31, 2016, versus 4.11% for its benchmark, the Russell 2000 Index, for the same period. For broader comparison, the average return of the Fund’s peer category of Small-Cap Core Funds (consisting of 307 funds), as measured by Lipper, Inc., was 3.01% for the period.
Major North American equity market indices posted modest gains despite numerous periods of volatility over the 12-month period ended October 31, 2016. The primary catalysts of the market’s performance were continued speculation regarding U.S. Federal Reserve (Fed) monetary policy, generally positive economic data reports and, particularly later in the period, uncertainty regarding the pending U.S. presidential election. Shares of small-cap companies, as measured by the Russell 2000 Index, rose 4.11% for the reporting period, but modestly underperformed the 4.51% return of the broader-market Standard and Poor’s (S&P) 500 Index. The materials and utilities sectors posted the highest returns within the Russell 2000 Index for the period. Conversely, energy and healthcare were the weakest-performing sectors.
Shortly after the end of the reporting period in early November, Republican Donald Trump won the U.S. presidential election on November 8, garnering a majority of electoral votes in the race against his Democratic Party opponent, former U.S. Secretary of State Hillary Clinton. The outcome of the election was widely unexpected, as Clinton led most major polls for much of the campaign. Regarding monetary policy, the Fed raised its benchmark interest rate by 25 basis points (bps) to a range of 0.25-0.50% at its meeting in December 2015, and subsequently left the rate unchanged over the next ten months, noting the pick-up in economic activity and steady job gains. However, the decisions following the Fed’s meetings in July, September and November 2016 were not unanimous, as several Fed governors voted for an increase of 25 bps. Following the presidential election, the market began to anticipate that the Fed would raise the federal funds rate at its meeting in December 2016.
On the economic front, the U.S. Department of Commerce reported that gross domestic product (GDP) expanded by 0.9%, 0.8%, 1.4% and 2.9% for the fourth quarter of 2015 and the first three quarters of 2016, respectively. Upturns in consumer spending and exports offset the negative impact of a decline in residential fixed investment and an increase in imports (which are subtracted from GDP) over the period. According to the U.S. Department of Labor, the U.S. economy added an average of approximately 173,000 jobs per month over the 12-month reporting period, and the unemployment rate dipped 0.1% to 4.9%. Furthermore, while the labor participation rate1 rose 0.3% over the reporting period, it has remained virtually flat over the past three years as more jobseekers have entered the market.
Stock selection historically has been the primary driver of the Fund’s outperformance versus its benchmark, the Russell 2000 Index. The Fund’s relative performance for the reporting period benefited mainly from strong stock selection in the information technology and industrials sectors. The largest individual stock contributors included building products manufacturer Gibraltar Industries, life sciences company FEI Company and industrial fuse-maker Littelfuse. While revenue growth has been difficult to achieve, Gibraltar Industries reported positive results over the reporting period, as improved profitability was the result of management executing on its portfolio development as we have anticipated. Consequently, the company has upgraded its earnings guidance for the full 2016 fiscal year. In May 2016, Thermo Fisher Scientific (in which the Fund has no position) announced an agreement to acquire FEI Company for a 14% premium to FEI’s stock price at that time. We subsequently exited the position after discussing the proposed deal with company management. Littelfuse benefited from healthy year-over-year revenue growth during the reporting period, driven mainly by increased content in its automotive business as well as improvement in its electronics segment, driving strong profitability growth.
Conversely, stock selection in the materials and consumer staples sectors weighed on the Fund’s relative performance for the reporting period. The primary detractors among individual holdings were specialty apparel retailer G-III Apparel Group, egg producer Cal-Maine Foods, and hotel chain operator La Quinta Holdings. G-III Apparel Group’s quarterly results over the reporting period were hampered mainly by relative weakness in its Wilsons Leather stores and its G.H. Bass & Co. product line. Additionally, in late July 2016, the company announced the acquisition of Donna Karan from LVMH Moet Hennessy Louis Vuitton, which drove the stock price lower due to the dilutive2 impact of the deal on the company’s shares. Egg producer Cal-Maine Foods reported losses for the fourth quarter of its 2016 fiscal year and the first quarter of 2017 due to falling egg prices and lower business volumes. The company noted that egg inventory levels are an issue given lower wholesale demand and a decline in exports. The continued slowdown in La Quinta Holdings’ revenue growth over the reporting period was attributable to lower occupancy rates and enhanced competition.
During the reporting period, we initiated holdings in regional bank Glacier Bancorp; IT services provider ExlService Holdings; specialized electronic systems components manufacturer OSI Systems; integrated facility solutions provider ABM Industries; exchange-traded funds (ETF)-focused asset manager WisdomTree Investments; Ritchie Brothers Auctioneers, a Canadian company that is a global leader in industrial auctions; suspension manufacturer Fox Factory Holding, truck transportation company Heartland Express; IT services provider Insight Enterprises; and software developer Pegasystems. In addition to selling the Fund’s shares in FEI Company as noted previously, we
| 1 | The labor force participation rate is expressed as a percentage of the U.S. population aged 16 years and older working or actively seeking work. |
| 2 | Dilution is a reduction in the ownership percentage of a share of stock caused by the issuance of new shares. |
74
Annual Report 2016
Aberdeen U.S. Small Cap Equity Fund (Unaudited) (concluded)
exited the positions in convenience-store operator Casey’s General Stores and MarketAxess Holdings, a provider of investment trading platforms, as the companies’ market capitalizations exceeded the Fund’s $5 billion market-cap threshold. We sold the Fund’s shares in waste management services provider Progressive Waste Solutions and payment-processing services provider Heartland Payment Systems, as both companies were targets of acquisitions during the period. Finally, we also exited holdings in Sabra Healthcare REIT and IT services provider Syntel.
Following the end of the reporting period, Donald Trump was elected as the 45th president of the U.S. in early November in another example of a vote against the status quo, in our opinion. As with the UK Brexit3 referendum, it appeared that many people voted against the “establishment” as the Trump campaign promised meaningful changes to regulation, trade policy and an increase in infrastructure improvement funding within the U.S. The markets swiftly priced in many of the possible changes that had been proposed, boosting the U.S. dollar and the stocks of companies that may benefit from government fiscal stimulus and/or less regulation. Those companies which compete on a global basis have had more mixed results as the Trump campaign suggested tougher trade policies, which helped the stocks of companies with strong foreign competition within the U.S. and hindered those which rely more on global trade. The anticipated shifts in policy are expected to drive economic growth, while increasing the potential for raising the national debt and eventually leading to higher inflation.
However, we feel that there are many unknowns that still need to be sorted out prior to the presidential inauguration on January 20, 2017, which leaves the risk of continued volatility in the markets. Our investment strategy is built with a balanced, bottom-up investment approach which we think could provide opportunities to take advantage of the large swings in stock prices seen thus far in November. While we do not expect a verbatim enactment of the entire list of campaign promises, we still see a lot of opportunity resulting from the market swings.
U.S. small-cap company valuations continued to rise during the third quarter of 2016, and then retreated somewhat in October. The expanded valuations in the market contrasted with corporate fundamentals, which remained broadly stable but lackluster. Our companies’ operating margins have leveled off, as much of the “low-hanging fruit” in terms of operational improvements have already occurred. Companies are balancing margins against investing in the business as they seek revenue growth.
Portfolio Management:
Aberdeen North American Equity Team
PAST PERFORMANCE DOES NOT GUARANTEE FUTURE RESULTS.
The performance data quoted represents past performance and current returns may be lower or higher. Class A Shares have up to a 5.75% front-end sales charge and a 0.25% 12b-1 fee. The investment return and principal value will fluctuate so that an investor’s shares, when redeemed, may be worth more or less than the original cost. To obtain performance information current to the most recent month-end, which may be higher or lower than the performance shown above, please call 866-667-9231 or go to www.aberdeen-asset.us.
Investing in mutual funds involves risk, including the possible loss of principal.
Indexes are unmanaged and have been provided for comparison purposes only. No fees or expenses are reflected. You cannot invest directly in an index.
Lipper is a leading global provider of mutual fund information and analysis to fund companies, financial intermediaries and media organizations.
Risk Considerations
Equity stocks of small-cap companies carry greater risk and more volatility than equity stocks of larger, more established companies.
Foreign securities may be more volatile, harder to price and less liquid than U.S. securities. They are subject to different accounting and regulatory standards, currency exchange rates, political and economic risks. Fluctuation in currency exchange rates may impact the Fund’s returns more greatly to the extent the Fund does not hedge currency exposure or hedging techniques are unsuccessful. The foregoing risks are enhanced in emerging market countries.
Investing a significant portion of the Fund’s assets in securities of companies conducting business in a broadly related group of industries within an economic sector may make the Fund more vulnerable to unfavorable developments in that sector.
Please read the prospectus for more detailed information regarding these and other risks.
| 3 | Brexit is an abbreviation of “British exit,” which refers to the June 23, 2016 referendum by British voters to exit the European Union. |
2016 Annual Report
75
Aberdeen U.S. Small Cap Equity Fund (Unaudited)
| Average Annual Total Return1 (For periods ended October 31, 2016) | 1 Yr. | 5 Yr. | 10 Yr. | |||||||||||
Class A | w/o SC | 7.85% | 15.35% | 6.11% | ||||||||||
| w/SC2 | 1.66% | 13.99% | 5.48% | |||||||||||
Class C | w/o SC | 7.08% | 14.56% | 5.38% | ||||||||||
| w/SC3 | 6.08% | 14.56% | 5.38% | |||||||||||
Class R4 | w/o SC | 7.59% | 15.08% | 5.87% | ||||||||||
Institutional Service Class4 | w/o SC | 8.14% | 15.69% | 6.44% | ||||||||||
Institutional Class4 | w/o SC | 8.18% | 15.72% | 6.43% | ||||||||||
All figures showing the effect of a sales charge (SC) reflect the maximum charge possible because it has the most significant effect on performance data. The total returns shown above do not include the impact of financial statement rounding of the net asset value (NAV) per share and/or financial statement adjustments.
| 1 | Returns prior to June 23, 2008 reflect the performance of a predecessor fund (the “Predecessor Fund”). Returns of the Predecessor Fund have not been adjusted to reflect the expenses applicable to the respective classes. The Fund and the Predecessor Fund have substantially similar investment objectives and strategies. Please consult the Fund’s prospectus for more detail. |
| 2 | A 5.75% front-end sales charge was deducted. |
| 3 | A 1.00% contingent deferred sales charge (CDSC) was deducted from the one year return because it is charged when Class C shares are sold within the first year after purchase. |
| 4 | Not subject to any sales charges. |
Annual Report 2016
76
Aberdeen U.S. Small Cap Equity Fund (Unaudited)
Performance of a $10,000 Investment (as of October 31, 2016)
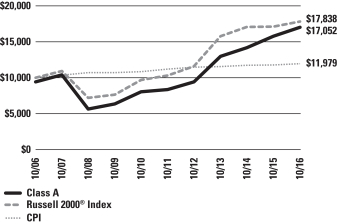
Comparative performance of $10,000 invested in Class A shares of the Aberdeen U.S. Small Cap Equity Fund, the Russell 2000® Index and the Consumer Price Index (CPI) over a 10-year period ended October 31, 2016. Unlike the Fund, the returns for these unmanaged indexes do not reflect any fees, expenses, or sales charges. Investors cannot invest directly in market indexes.
The Russell 2000® Index measures performance of the small-cap segment of the U.S. equity universe. It is a subset of the Russell 3000® Index and it represents approximately 8% of the U.S. market. It includes approximately 2000 of the smallest securities based on a combination of their market cap and current index membership. The Russell 2000® Index is constructed to provide a comprehensive and unbiased barometer for the small-cap segment and is completely reconstituted annually to ensure larger stocks do not distort the performance and characteristics of the true small-cap opportunity set.
The CPI is a measure of the average change over time in the prices paid by urban consumers for a market basket of consumer goods and services.
Investment return and principal value will fluctuate, and when redeemed, shares may be worth more or less than original cost. Past performance is no guarantee of future results. The Average Annual Total Return table and Performance graph do not reflect the deduction of taxes that a shareholder would pay on fund distributions or the redemption of fund shares. Investing in mutual funds involves market risk, including loss of principal. Performance returns assume the reinvestment of all distributions. Total returns reflect waivers and reimbursements in effect, without which returns would have been lower.
Portfolio Summary (as a percentage of net assets)
October 31, 2016 (Unaudited)
| Asset Allocation | ||||
Common Stocks | 99.0% | |||
Short-Term Investment | 1.3% | |||
Liabilities in excess of other assets | (0.3% | ) | ||
| 100.0% | ||||
The following table summarizes the composition of the Fund’s portfolio, in Standard & Poor’s Global Industry Classification Standard (GICS) sectors, expressed as a percentage of net assets. The GICS structure consists of 11 sectors, 24 industry groups, 68 industries and 157 sub-industries. As of October 31, 2016, the Fund did not have more than 25% of its assets invested in any industry group.
| Top Sectors | ||||
Industrials | 22.7% | |||
Financials | 16.3% | |||
Consumer Discretionary | 13.5% | |||
Information Technology | 13.2% | |||
Health Care | 10.7% | |||
Materials | 10.2% | |||
Consumer Staples | 6.1% | |||
Telecommunication Services | 2.8% | |||
Energy | 1.9% | |||
Real Estate | 1.6% | |||
Other | 1.0% | |||
| 100.0% | ||||
2016 Annual Report
77
Aberdeen U.S. Small Cap Equity Fund (Unaudited) (concluded)
| Top Holdings* | ||||
Beacon Roofing Supply, Inc. | 3.0% | |||
Littelfuse, Inc. | 3.0% | |||
Cal-Maine Foods, Inc. | 2.8% | |||
Shenandoah Telecommunications Co. | 2.8% | |||
Quaker Chemical Corp. | 2.8% | |||
Gibraltar Industries, Inc. | 2.7% | |||
PAREXEL International Corp. | 2.7% | |||
WSFS Financial Corp. | 2.6% | |||
US Ecology, Inc. | 2.6% | |||
Core-Mark Holding Co., Inc. | 2.5% | |||
Other | 72.5% | |||
| 100.0% | ||||
| * | For the purpose of listing top holdings, Short-Term Investments are included as part of Other. |
| Top Countries | ||||
United States | 95.5% | |||
Canada | 4.8% | |||
Other | (0.3% | ) | ||
| 100.0% | ||||
Annual Report 2016
78
Statement of Investments
October 31, 2016
Aberdeen U.S. Small Cap Equity Fund
| Shares or Principal Amount | Value | |||||||
COMMON STOCKS (99.0%) | ||||||||
CANADA (4.8%) | ||||||||
Financials (2.5%) | ||||||||
Canadian Western Bank | 1,491,620 | $ | 28,302,191 | |||||
Industrials (2.3%) | ||||||||
Ritchie Bros Auctioneers, Inc. | 773,887 | 26,768,752 | ||||||
| 55,070,943 | ||||||||
UNITED STATES (94.2%) | ||||||||
Consumer Discretionary (13.5%) | ||||||||
Core-Mark Holding Co., Inc. | 820,182 | 28,993,434 | ||||||
Culp, Inc. | 734,820 | 20,574,960 | ||||||
Drew Industries, Inc. | 193,593 | 17,336,253 | ||||||
Fox Factory Holding Corp. (a) | 730,553 | 15,853,000 | ||||||
G-III Apparel Group Ltd. (a) | 829,440 | 21,664,973 | ||||||
Hibbett Sports, Inc. (a) | 482,503 | 18,745,241 | ||||||
La Quinta Holdings, Inc. (a) | 1,532,269 | 15,338,013 | ||||||
Pool Corp. | 173,224 | 16,037,078 | ||||||
| 154,542,952 | ||||||||
Consumer Staples (6.1%) | ||||||||
Cal-Maine Foods, Inc. | 849,447 | 32,831,126 | ||||||
J&J Snack Foods Corp. | 175,577 | 21,446,731 | ||||||
WD-40 Co. | 150,762 | 16,074,998 | ||||||
| 70,352,855 | ||||||||
Energy (1.9%) | ||||||||
Forum Energy Technologies, Inc. (a) | 1,228,666 | 22,115,988 | ||||||
Financials (13.8%) | ||||||||
AMERISAFE, Inc. | 372,208 | 20,694,765 | ||||||
Bank of the Ozarks, Inc. | 643,131 | 23,770,122 | ||||||
Boston Private Financial Holdings, Inc. | 1,924,683 | 25,309,581 | ||||||
Glacier Bancorp, Inc. | 919,809 | 25,993,802 | ||||||
Univest Corp. of Pennsylvania | 843,901 | 20,042,649 | ||||||
WisdomTree Investments, Inc. | 1,437,347 | 12,332,437 | ||||||
WSFS Financial Corp. | 856,830 | 30,031,892 | ||||||
| 158,175,248 | ||||||||
Health Care (10.7%) | ||||||||
Emergent BioSolutions, Inc. (a) | 727,665 | 19,443,209 | ||||||
Globus Medical, Inc., Class A (a) | 1,288,390 | 28,512,071 | ||||||
PAREXEL International Corp. (a) | 516,618 | 30,098,164 | ||||||
Prestige Brands Holdings, Inc. (a) | 534,602 | 24,206,778 | ||||||
US Physical Therapy, Inc. | 346,192 | 19,698,325 | ||||||
| 121,958,547 | ||||||||
Industrials (20.4%) | ||||||||
ABM Industries, Inc. | 504,027 | 19,697,375 | ||||||
Actuant Corp., Class A | 1,006,034 | 22,434,558 | ||||||
Beacon Roofing Supply, Inc. (a) | 829,800 | 34,884,792 | ||||||
Curtiss-Wright Corp. | 273,119 | 24,476,925 | ||||||
Gibraltar Industries, Inc. (a) | 794,737 | 30,915,269 | ||||||
Heartland Express, Inc. | 779,920 | 14,350,528 | ||||||
Multi-Color Corp. | 440,886 | 28,624,524 | ||||||
RBC Bearings, Inc. (a) | 400,934 | 28,606,641 | ||||||
US Ecology, Inc. | 701,982 | 29,658,739 | ||||||
| 233,649,351 | ||||||||
Information Technology (13.2%) | ||||||||
ExlService Holdings, Inc. (a) | 534,321 | 23,526,154 | ||||||
Fair Isaac Corp. | 240,056 | 28,969,958 | ||||||
Insight Enterprises, Inc. (a) | 439,008 | 12,639,040 | ||||||
Littelfuse, Inc. | 248,375 | 34,648,313 | ||||||
OSI Systems, Inc. (a) | 332,572 | 23,323,274 | ||||||
Pegasystems, Inc. | 392,731 | 12,135,388 | ||||||
Teradyne, Inc. | 682,338 | 15,891,652 | ||||||
| 151,133,779 | ||||||||
Materials (10.2%) | ||||||||
Compass Minerals International, Inc. | 218,224 | 15,679,394 | ||||||
Kaiser Aluminum Corp. | 354,858 | 25,723,656 | ||||||
Quaker Chemical Corp. | 293,551 | 31,556,733 | ||||||
Sensient Technologies Corp. | 346,457 | 25,814,511 | ||||||
Silgan Holdings, Inc. | 359,689 | 18,326,155 | ||||||
| 117,100,449 | ||||||||
Real Estate (1.6%) | ||||||||
Healthcare Realty Trust, Inc., REIT | 562,164 | 17,927,410 | ||||||
Telecommunication Services (2.8%) | ||||||||
Shenandoah Telecommunications Co. | 1,207,474 | 31,877,314 | ||||||
| 1,078,833,893 | ||||||||
Total Common Stocks | 1,133,904,836 | |||||||
SHORT-TERM INVESTMENT (1.3%) | ||||||||
UNITED STATES (1.3%) | ||||||||
State Street Institutional U.S. Government Money Market Fund (b) | 14,764,752 | 14,764,752 | ||||||
Total Short-Term Investment | 14,764,752 | |||||||
Total Investments | 1,148,669,588 | |||||||
Liabilities in excess of other assets—(0.3)% | (3,749,907 | ) | ||||||
Net Assets—100.0% | $ | 1,144,919,681 | ||||||
| (a) | Non-income producing security. |
| (b) | Registered investment company advised by State Street Global Advisors. |
| (c) | See accompanying Notes to Financial Statements for tax unrealized appreciation/(depreciation) of securities. |
| REIT | Real Estate Investment Trust |
See accompanying Notes to Financial Statements.
2016 Annual Report
79
Statements of Assets and Liabilities
October 31, 2016
| Aberdeen Asia-Pacific (ex-Japan) Equity Fund | Aberdeen China Opportunities Fund | Aberdeen Emerging Markets Fund | Aberdeen Equity Long-Short Fund | Aberdeen Global Equity Fund | ||||||||||||||||
Assets: | ||||||||||||||||||||
Investments, at value | $ | 14,578,810 | $ | 14,212,645 | $ | 7,770,224,073 | $ | 59,359,506 | $ | 85,535,099 | ||||||||||
Short-term investments, at value | 150,052 | 214,463 | 200,531,487 | 10,646,044 | 3,417,398 | |||||||||||||||
|
|
|
|
|
|
|
|
|
| |||||||||||
Total investments | 14,728,862 | 14,427,108 | 7,970,755,560 | 70,005,550 | 88,952,497 | |||||||||||||||
|
|
|
|
|
|
|
|
|
| |||||||||||
Cash | – | – | – | 35,583,721 | * | – | ||||||||||||||
Foreign currency, at value | 30,168 | 171,837 | 1,765,303 | – | – | |||||||||||||||
Cash at broker for China A shares | – | 1,246 | – | – | – | |||||||||||||||
Interest and dividends receivable | 7,511 | 9,225 | 9,325,441 | 33,680 | 132,995 | |||||||||||||||
Receivable for investments sold | 31,099 | – | 3,586,484 | – | 2,756,363 | |||||||||||||||
Receivable for capital shares issued | 390 | 3,967 | 5,039,706 | 85,297 | 10,862 | |||||||||||||||
Receivable from Adviser | – | 12,632 | 236,983 | 3,412 | 7,503 | |||||||||||||||
Tax reclaim receivable | – | – | 742,240 | – | 280,226 | |||||||||||||||
Other receivables | 20,664 | 5,844 | 20,806 | 4,666 | 5,671 | |||||||||||||||
Prepaid expenses | 25,490 | 30,439 | 251,937 | 27,918 | 35,247 | |||||||||||||||
|
|
|
|
|
|
|
|
|
| |||||||||||
Total assets | 14,844,184 | 14,662,298 | 7,991,724,460 | 105,744,244 | 92,181,364 | |||||||||||||||
|
|
|
|
|
|
|
|
|
| |||||||||||
Liabilities: | ||||||||||||||||||||
Due to custodian | – | – | 818,371 | 21,192 | – | |||||||||||||||
Payable for investments purchased | 10,576 | – | 5,910,526 | 3,015,959 | – | |||||||||||||||
Payable for capital shares redeemed | 1,765 | 9,890 | 5,496,076 | 69,603 | 4,591,740 | |||||||||||||||
Payable for dividends on securities sold short | – | – | – | 26,786 | – | |||||||||||||||
Accrued foreign capital gains tax | 10,248 | – | 10,614,605 | – | 89,356 | |||||||||||||||
Securities sold short, at value | – | – | – | 31,787,874 | – | |||||||||||||||
Payable for brokers related expenses for securities sold short | – | – | – | 8,176 | – | |||||||||||||||
Accrued expenses and other payables: | ||||||||||||||||||||
Investment advisory fees | 44,970 | 15,706 | 6,056,164 | 69,576 | 70,808 | |||||||||||||||
Custodian fees | 5,743 | 2,121 | 697,741 | 2,444 | 3,520 | |||||||||||||||
Administration fees | 1,006 | 1,005 | 538,326 | 4,840 | 6,294 | |||||||||||||||
Sub-transfer agent and administrative services fees | 1,141 | 2,165 | 471,843 | 8,138 | 7,678 | |||||||||||||||
Transfer agent fees | 13,442 | 4,772 | 100,963 | 9,568 | 9,684 | |||||||||||||||
Fund accounting fees | 1,282 | 1,256 | 126,123 | 1,630 | 2,559 | |||||||||||||||
Printing fees | 46,527 | 2,802 | 100,490 | 9,904 | 4,481 | |||||||||||||||
Distribution fees | 214 | 5,275 | 81,261 | 6,710 | 13,245 | |||||||||||||||
Audit fees | 19,958 | 19,012 | 19,958 | 20,432 | 19,010 | |||||||||||||||
Legal fees | 40 | 40 | 21,468 | 192 | 250 | |||||||||||||||
Other | 22,694 | 303 | 170,621 | 1,672 | 1,789 | |||||||||||||||
|
|
|
|
|
|
|
|
|
| |||||||||||
Total liabilities | 179,606 | 64,347 | 31,224,536 | 35,064,696 | 4,820,414 | |||||||||||||||
|
|
|
|
|
|
|
|
|
| |||||||||||
Net Assets | $ | 14,664,578 | $ | 14,597,951 | $ | 7,960,499,924 | $ | 70,679,548 | $ | 87,360,950 | ||||||||||
|
|
|
|
|
|
|
|
|
| |||||||||||
Cost: | ||||||||||||||||||||
Investments | $ | 15,229,355 | $ | 16,808,488 | $ | 7,793,592,288 | $ | 51,206,051 | $ | 85,467,229 | ||||||||||
Short-term investments | 150,052 | 214,463 | 200,531,487 | 10,646,044 | 3,417,398 | |||||||||||||||
Foreign currency | 30,276 | 171,353 | 1,764,469 | – | – | |||||||||||||||
Proceeds: | ||||||||||||||||||||
Securities sold short | $ | – | $ | – | $ | – | $ | 30,676,201 | $ | – | ||||||||||
Represented by: | ||||||||||||||||||||
Capital | $ | 217,979,352 | $ | 27,790,515 | $ | 8,075,760,545 | $ | 56,725,150 | $ | 99,398,120 | ||||||||||
Accumulated net investment income/(loss) | (40,623 | ) | 102,867 | 75,601,133 | (1,081,442 | ) | 641,885 | |||||||||||||
Accumulated net realized gain/(loss) from investments and foreign currency transactions | (202,613,222 | ) | (10,700,037 | ) | (156,938,309 | ) | 7,994,058 | (12,639,724 | ) | |||||||||||
Net unrealized appreciation/(depreciation) on investments and translation of assets and liabilities denominated in foreign currencies | (660,929 | ) | (2,595,394 | ) | (33,923,445 | ) | 7,041,782 | (39,331 | ) | |||||||||||
|
|
|
|
|
|
|
|
|
| |||||||||||
Net Assets | $ | 14,664,578 | $ | 14,597,951 | $ | 7,960,499,924 | $ | 70,679,548 | $ | 87,360,950 | ||||||||||
|
|
|
|
|
|
|
|
|
| |||||||||||
Net Assets: | ||||||||||||||||||||
Class A Shares | $ | 747,878 | $ | 7,300,696 | $ | 188,314,818 | $ | 11,396,611 | $ | 48,349,663 | ||||||||||
Class C Shares | 57,868 | 3,609,236 | 25,054,090 | 3,429,901 | 1,495,176 | |||||||||||||||
Class R Shares | 10,495 | 1,377,848 | 47,409,833 | 2,632,738 | 1,347,645 | |||||||||||||||
Institutional Service Class Shares | 4,290,642 | 735,055 | 333,963,814 | 692,928 | 1,103 | |||||||||||||||
Institutional Class Shares | 9,557,695 | 1,575,116 | 7,365,757,369 | 52,527,370 | 36,167,363 | |||||||||||||||
|
|
|
|
|
|
|
|
|
| |||||||||||
Total | $ | 14,664,578 | $ | 14,597,951 | $ | 7,960,499,924 | $ | 70,679,548 | $ | 87,360,950 | ||||||||||
|
|
|
|
|
|
|
|
|
| |||||||||||
| * | The cash amount reported for the Aberdeen Equity Long-Short Fund is restricted from investing as it represents the amount due to the prime broker relating to the open short positions at October 31, 2016. |
Amounts listed as “–” are $0 or round to $0.
See accompanying Notes to Financial Statements.
Annual Report 2016
80
Statements of Assets and Liabilities (continued)
October 31, 2016
| Aberdeen Asia-Pacific (ex-Japan) Equity Fund | Aberdeen China Opportunities Fund | Aberdeen Emerging Markets Fund | Aberdeen Equity Long-Short Fund | Aberdeen Global Equity Fund | ||||||||||||||||
Shares Outstanding (unlimited number of shares authorized): | ||||||||||||||||||||
Class A Shares | 71,317 | 395,594 | 13,920,160 | 1,293,688 | 3,916,172 | |||||||||||||||
Class C Shares | 5,573 | 204,559 | 1,876,683 | 697,632 | 128,335 | |||||||||||||||
Class R Shares | 1,004 | 76,013 | 3,530,746 | 319,059 | 113,468 | |||||||||||||||
Institutional Service Class Shares | 407,550 | 39,624 | 24,647,345 | 76,967 | 88 | |||||||||||||||
Institutional Class Shares | 907,784 | 84,786 | 542,577,258 | 5,726,815 | 2,917,811 | |||||||||||||||
|
|
|
|
|
|
|
|
|
| |||||||||||
Total | 1,393,228 | 800,576 | 586,552,192 | 8,114,161 | 7,075,874 | |||||||||||||||
|
|
|
|
|
|
|
|
|
| |||||||||||
Net asset value and redemption price per share (Net assets by class divided by shares outstanding by class, respectively): | ||||||||||||||||||||
Class A Shares | $ | 10.49 | $ | 18.46 | $ | 13.53 | $ | 8.81 | $ | 12.35 | ||||||||||
Class C Shares (a) | $ | 10.38 | $ | 17.64 | $ | 13.35 | $ | 4.92 | $ | 11.65 | ||||||||||
Class R Shares | $ | 10.45 | $ | 18.13 | $ | 13.43 | $ | 8.25 | $ | 11.88 | ||||||||||
Institutional Service Class Shares | $ | 10.53 | $ | 18.55 | $ | 13.55 | $ | 9.00 | $ | 12.53 | ||||||||||
Institutional Class Shares | $ | 10.53 | $ | 18.58 | $ | 13.58 | $ | 9.17 | $ | 12.40 | ||||||||||
Maximum offering price per share (100%/(100%-maximum sales charge) of net asset value adjusted to the nearest cent): | ||||||||||||||||||||
Class A Shares | $ | 11.13 | $ | 19.59 | $ | 14.36 | $ | 9.35 | $ | 13.10 | ||||||||||
Maximum Sales Charge: | ||||||||||||||||||||
Class A Shares | 5.75 | % | 5.75 | % | 5.75 | % | 5.75 | % | 5.75 | % | ||||||||||
| (a) | For Class C Shares, the redemption price per share is reduced by 1.00% for shares held less than one year. |
See accompanying Notes to Financial Statements.
2016 Annual Report
81
Statements of Assets and Liabilities (continued)
October 31, 2016
| Aberdeen Global Natural Resources Fund | Aberdeen International Equity Fund | Aberdeen International Small Cap Fund | Aberdeen Japanese Equities Fund | Aberdeen U.S. Mid Cap Equity Fund | ||||||||||||||||
Assets: | ||||||||||||||||||||
Investments, at value | $ | 14,461,935 | $ | 446,091,304 | $ | 72,924,461 | $ | 1,079,604 | $ | 1,118,017 | ||||||||||
Short-term investments, at value | 93,005 | 10,521,547 | 581,817 | 17,194 | 17,982 | |||||||||||||||
|
|
|
|
|
|
|
|
|
| |||||||||||
Total investments | 14,554,940 | 456,612,851 | 73,506,278 | 1,096,798 | 1,135,999 | |||||||||||||||
|
|
|
|
|
|
|
|
|
| |||||||||||
Foreign currency, at value | – | 15,725 | 15,340 | 181 | – | |||||||||||||||
Interest and dividends receivable | 10,668 | 756,540 | 82,902 | 5,944 | 377 | |||||||||||||||
Receivable for capital shares issued | 7,239 | 26,190 | 71,970 | – | – | |||||||||||||||
Receivable from Adviser | 13,632 | 139 | 21,342 | 7,857 | 3,500 | |||||||||||||||
Tax reclaim receivable | 8,655 | 2,043,457 | 46,194 | 127 | – | |||||||||||||||
Other receivables | 3,555 | 4,912 | 6,898 | – | – | |||||||||||||||
Prepaid expenses | 29,523 | 41,529 | 37,540 | 32,028 | 25,908 | |||||||||||||||
|
|
|
|
|
|
|
|
|
| |||||||||||
Total assets | 14,628,212 | 459,501,343 | 73,788,464 | 1,142,935 | 1,165,784 | |||||||||||||||
|
|
|
|
|
|
|
|
|
| |||||||||||
Liabilities: | ||||||||||||||||||||
Payable for investments purchased | – | 248,178 | – | – | 12,963 | |||||||||||||||
Payable for capital shares redeemed | 8,207 | 245,249 | 30,934 | – | – | |||||||||||||||
Payable to Adviser | – | – | – | – | 17,568 | |||||||||||||||
Accrued foreign capital gains tax | – | 392,845 | 35,883 | – | – | |||||||||||||||
Accrued expenses and other payables: | ||||||||||||||||||||
Investment advisory fees | 8,702 | 315,790 | 80,983 | 610 | 712 | |||||||||||||||
Audit fees | 33,499 | 19,011 | 19,958 | 18,958 | 33,500 | |||||||||||||||
Transfer agent fees | 3,829 | 31,721 | 13,643 | 1,042 | 681 | |||||||||||||||
Distribution fees | 4,272 | 26,411 | 12,491 | 19 | 17 | |||||||||||||||
Sub-transfer agent and administrative services fees | 1,990 | 29,600 | 7,640 | – | 3 | |||||||||||||||
Administration fees | 995 | 31,579 | 5,183 | 74 | 76 | |||||||||||||||
Printing fees | 3,384 | 20,406 | 6,805 | 2,330 | 2,383 | |||||||||||||||
Custodian fees | 1,714 | 19,198 | 8,124 | 437 | 412 | |||||||||||||||
Fund accounting fees | 1,368 | 9,012 | 2,234 | 1,031 | 19 | |||||||||||||||
Legal fees | 39 | 1,248 | 207 | 2,264 | 3 | |||||||||||||||
Other | 321 | 13,724 | 9,372 | 19 | 11 | |||||||||||||||
|
|
|
|
|
|
|
|
|
| |||||||||||
Total liabilities | 68,320 | 1,403,972 | 233,457 | 26,784 | 68,348 | |||||||||||||||
|
|
|
|
|
|
|
|
|
| |||||||||||
Net Assets | $ | 14,559,892 | $ | 458,097,371 | $ | 73,555,007 | $ | 1,116,151 | $ | 1,097,436 | ||||||||||
|
|
|
|
|
|
|
|
|
| |||||||||||
Cost: | ||||||||||||||||||||
Investments | $ | 14,221,615 | $ | 456,895,185 | $ | 66,704,278 | $ | 988,536 | $ | 1,045,399 | ||||||||||
Short-term investments | 93,005 | 10,521,547 | 581,817 | 17,194 | 17,982 | |||||||||||||||
Foreign currency | – | 15,716 | 15,353 | 184 | – | |||||||||||||||
Represented by: | ||||||||||||||||||||
Capital | $ | 48,311,268 | $ | 590,823,498 | $ | 68,182,537 | $ | 1,011,793 | $ | 1,000,953 | ||||||||||
Accumulated net investment income/(loss) | 148,025 | 6,581,245 | (29,281 | ) | 3,919 | 2,382 | ||||||||||||||
Accumulated net realized gain/(loss) from investments and foreign currency transactions | (34,138,723 | ) | (128,011,969 | ) | (773,394 | ) | 9,618 | 21,483 | ||||||||||||
Net unrealized appreciation/(depreciation) on investments and translation of assets and liabilities denominated in foreign currencies | 239,322 | (11,295,403 | ) | 6,175,145 | 90,821 | 72,618 | ||||||||||||||
|
|
|
|
|
|
|
|
|
| |||||||||||
Net Assets | $ | 14,559,892 | $ | 458,097,371 | $ | 73,555,007 | $ | 1,116,151 | $ | 1,097,436 | ||||||||||
|
|
|
|
|
|
|
|
|
| |||||||||||
Net Assets: | ||||||||||||||||||||
Class A Shares | $ | 9,571,850 | $ | 47,735,712 | $ | 51,529,936 | $ | 22,190 | $ | 11,908 | ||||||||||
Class C Shares | 1,463,122 | 14,400,494 | 1,174,529 | 10,951 | 10,893 | |||||||||||||||
Class R Shares | 2,293,114 | 7,647,320 | 946,950 | 11,002 | 10,929 | |||||||||||||||
Institutional Service Class Shares | 637,536 | 101,654,768 | 64,086 | 11,052 | 10,966 | |||||||||||||||
Institutional Class Shares | 594,270 | 286,659,077 | 19,839,506 | 1,060,956 | 1,052,740 | |||||||||||||||
|
|
|
|
|
|
|
|
|
| |||||||||||
Total | $ | 14,559,892 | $ | 458,097,371 | $ | 73,555,007 | $ | 1,116,151 | $ | 1,097,436 | ||||||||||
|
|
|
|
|
|
|
|
|
| |||||||||||
Amounts listed as “–” are $0 or round to $0.
See accompanying Notes to Financial Statements.
Annual Report 2016
82
Statements of Assets and Liabilities (continued)
October 31, 2016
| Aberdeen Global Natural Resources Fund | Aberdeen International Equity Fund | Aberdeen International Small Cap Fund | Aberdeen Japanese Equities Fund | Aberdeen U.S. Mid Cap Equity Fund | ||||||||||||||||
Shares Outstanding (unlimited number of shares authorized): | ||||||||||||||||||||
Class A Shares | 773,250 | 3,759,827 | 1,984,074 | 2,014 | 1,087 | |||||||||||||||
Class C Shares | 125,012 | 1,210,692 | 49,194 | 1,000 | 1,000 | |||||||||||||||
Class R Shares | 188,661 | 631,493 | 38,229 | 1,000 | 1,000 | |||||||||||||||
Institutional Service Class Shares | 50,735 | 7,829,484 | 2,465 | 1,001 | 1,000 | |||||||||||||||
Institutional Class Shares | 47,098 | 21,990,438 | 762,000 | 96,085 | 96,000 | |||||||||||||||
|
|
|
|
|
|
|
|
|
| |||||||||||
Total | 1,184,756 | 35,421,934 | 2,835,962 | 101,100 | 100,087 | |||||||||||||||
|
|
|
|
|
|
|
|
|
| |||||||||||
Net asset value and redemption price per share (Net assets by class divided by shares outstanding by class, respectively): | ||||||||||||||||||||
Class A Shares | $ | 12.38 | $ | 12.70 | $ | 25.97 | $ | 11.02 | $ | 10.95 | ||||||||||
Class C Shares (a) | $ | 11.70 | $ | 11.89 | $ | 23.88 | $ | 10.95 | $ | 10.89 | ||||||||||
Class R Shares | $ | 12.15 | $ | 12.11 | $ | 24.77 | $ | 11.00 | $ | 10.93 | ||||||||||
Institutional Service Class Shares | $ | 12.57 | $ | 12.98 | $ | 26.00 | $ | 11.04 | $ | 10.97 | ||||||||||
Institutional Class Shares | $ | 12.62 | $ | 13.04 | $ | 26.04 | $ | 11.04 | $ | 10.97 | ||||||||||
Maximum offering price per share (100%/(100%-maximum sales charge) of net asset value adjusted to the nearest cent): | ||||||||||||||||||||
Class A Shares | $ | 13.14 | $ | 13.47 | $ | 27.55 | $ | 11.69 | $ | 11.62 | ||||||||||
Maximum Sales Charge: | ||||||||||||||||||||
Class A Shares | 5.75 | % | 5.75 | % | 5.75 | % | 5.75 | % | 5.75 | % | ||||||||||
| (a) | For Class C Shares, the redemption price per share is reduced by 1.00% for shares held less than one year. |
See accompanying Notes to Financial Statements.
2016 Annual Report
83
Statements of Assets and Liabilities (continued)
October 31, 2016
| Aberdeen U.S. Multi-Cap Equity Fund | Aberdeen U.S. Small Cap Equity Fund | |||||||
Assets: | ||||||||
Investments, at value | $ | 333,515,395 | $ | 1,133,904,836 | ||||
Short-term investments, at value | 7,522,891 | 14,764,752 | ||||||
|
|
|
| |||||
Total investments | 341,038,286 | 1,148,669,588 | ||||||
|
|
|
| |||||
Receivable for investments sold | – | 5,387,098 | ||||||
Receivable for capital shares issued | 7,052 | 2,519,432 | ||||||
Interest and dividends receivable | 157,936 | 222,897 | ||||||
Receivable from Adviser | 24,355 | – | ||||||
Other receivables | 3,453 | 2,700 | ||||||
Prepaid expenses | 50,344 | 80,245 | ||||||
|
|
|
| |||||
Total assets | 341,281,426 | 1,156,881,960 | ||||||
|
|
|
| |||||
Liabilities: | ||||||||
Payable for investments purchased | 397,646 | 9,740,411 | ||||||
Payable for capital shares redeemed | 307,684 | 912,450 | ||||||
Accrued expenses and other payables: | ||||||||
Investment advisory fees | 221,246 | 814,002 | ||||||
Distribution fees | 54,141 | 127,743 | ||||||
Sub-transfer agent and administrative services fees | 20,617 | 157,130 | ||||||
Administration fees | 23,600 | 77,201 | ||||||
Transfer agent fees | 42,390 | 25,797 | ||||||
Printing fees | 15,436 | 46,578 | ||||||
Audit fees | 18,537 | 18,537 | ||||||
Fund accounting fees | 5,956 | 14,961 | ||||||
Custodian fees | 2,296 | 8,939 | ||||||
Legal fees | 936 | 3,081 | ||||||
Other | 7,175 | 15,449 | ||||||
|
|
|
| |||||
Total liabilities | 1,117,660 | 11,962,279 | ||||||
|
|
|
| |||||
Net Assets | $ | 340,163,766 | $ | 1,144,919,681 | ||||
|
|
|
| |||||
Cost: | ||||||||
Investments | $ | 294,349,770 | $ | 1,118,020,205 | ||||
Short-term investments | 7,522,891 | 14,764,752 | ||||||
Represented by: | ||||||||
Capital | $ | 275,883,877 | $ | 1,438,926,292 | ||||
Accumulated net investment income/(loss) | 582,068 | (1,581,355 | ) | |||||
Accumulated net realized gain/(loss) from investments and foreign currency transactions | 24,532,196 | (308,309,887 | ) | |||||
Net unrealized appreciation on investments and translation of assets and liabilities denominated in foreign currencies | 39,165,625 | 15,884,631 | ||||||
|
|
|
| |||||
Net Assets | $ | 340,163,766 | $ | 1,144,919,681 | ||||
|
|
|
| |||||
Net Assets: | ||||||||
Class A Shares | $ | 225,723,030 | $ | 259,556,259 | ||||
Class C Shares | 5,882,896 | 78,108,669 | ||||||
Class R Shares | 266,324 | 13,721,717 | ||||||
Institutional Service Class Shares | 101,549,141 | 47,421,028 | ||||||
Institutional Class Shares | 6,742,375 | 746,112,008 | ||||||
|
|
|
| |||||
Total | $ | 340,163,766 | $ | 1,144,919,681 | ||||
|
|
|
| |||||
Amounts listed as “–” are $0 or round to $0.
See accompanying Notes to Financial Statements.
Annual Report 2016
84
Statements of Assets and Liabilities (concluded)
October 31, 2016
| Aberdeen U.S. Multi-Cap Equity Fund | Aberdeen U.S. Small Cap Equity Fund | |||||||
Shares Outstanding (unlimited number of shares authorized): | ||||||||
Class A Shares | 18,610,048 | 9,040,330 | ||||||
Class C Shares | 538,279 | 3,109,057 | ||||||
Class R Shares | 23,106 | 514,587 | ||||||
Institutional Service Class Shares | 7,973,914 | 1,571,709 | ||||||
Institutional Class Shares | 528,467 | 24,752,375 | ||||||
|
|
|
| |||||
Total | 27,673,814 | 38,988,058 | ||||||
|
|
|
| |||||
Net asset value and redemption price per share (Net assets by class divided by shares outstanding by class, respectively): | ||||||||
Class A Shares | $ | 12.13 | $ | 28.71 | ||||
Class C Shares (a) | $ | 10.93 | $ | 25.12 | ||||
Class R Shares | $ | 11.53 | $ | 26.67 | (b) | |||
Institutional Service Class Shares | $ | 12.74 | $ | 30.17 | ||||
Institutional Class Shares | $ | 12.76 | $ | 30.14 | (b) | |||
Maximum offering price per share (100%/(100%-maximum sales charge) of net asset value adjusted to the nearest cent): | ||||||||
Class A Shares | $ | 12.87 | $ | 30.46 | ||||
Maximum Sales Charge: | ||||||||
Class A Shares | 5.75 | % | 5.75 | % | ||||
| (a) | For Class C Shares, the redemption price per share is reduced by 1.00% for shares held less than one year. |
| (b) | The NAV shown above differs from the traded NAV on October 31, 2016 due to financial statement rounding and/or financial statement adjustments. |
See accompanying Notes to Financial Statements.
2016 Annual Report
85
Statements of Operations
For the Year Ended October 31, 2016
| Aberdeen Asia-Pacific (ex-Japan) Equity Fund | Aberdeen China Opportunities Fund | Aberdeen Emerging Markets Fund | Aberdeen Equity Long-Short Fund | Aberdeen Global Equity Fund | ||||||||||||||||
INVESTMENT INCOME: | ||||||||||||||||||||
Dividend income | $ | 1,065,401 | $ | 458,061 | $ | 192,169,373 | $ | 1,254,472 | $ | 2,302,411 | ||||||||||
Interest income | 243 | 1,535 | 137,759 | 7,261 | 2,807 | |||||||||||||||
Foreign tax withholding | (35,798 | ) | (10,277 | ) | (17,142,806 | ) | (10,023 | ) | (144,093 | ) | ||||||||||
Other income(a) | 20,664 | 5,811 | 41,605 | 7,708 | 5,671 | |||||||||||||||
|
|
|
|
|
|
|
|
|
| |||||||||||
| 1,050,510 | 455,130 | 175,205,931 | 1,259,418 | 2,166,796 | ||||||||||||||||
|
|
|
|
|
|
|
|
|
| |||||||||||
EXPENSES: | ||||||||||||||||||||
Investment advisory fees | 531,613 | 186,000 | 65,189,197 | 1,076,795 | 819,258 | |||||||||||||||
Administration fees | 42,529 | 11,904 | 5,794,595 | 74,908 | 72,823 | |||||||||||||||
Distribution fees Class A | 1,874 | 18,543 | 428,102 | 35,965 | 137,460 | |||||||||||||||
Distribution fees Class C | 1,706 | 37,926 | 246,395 | 45,246 | 16,271 | |||||||||||||||
Distribution fees Class R | 48 | 6,516 | 192,443 | 14,732 | 7,901 | |||||||||||||||
Sub-transfer agent and administrative service fees Institutional Class | 5,130 | 703 | 2,184,597 | 41,138 | 4,377 | |||||||||||||||
Sub-transfer agent and administrative service fees Class A | 204 | 6,116 | 226,273 | 12,811 | 64,795 | |||||||||||||||
Sub-transfer agent and administrative service fees Class C | 36 | 3,413 | 24,606 | 4,006 | 1,641 | |||||||||||||||
Sub-transfer agent and administrative service fees Class R | – | 2,113 | 63,631 | 4,402 | 2,310 | |||||||||||||||
Sub-transfer agent and administrative service fees Institutional Service Class | 1,032 | 1,245 | 678,736 | 1,454 | – | |||||||||||||||
Fund accounting fees | 886 | 7,683 | 731,444 | 9,162 | 15,479 | |||||||||||||||
Transfer agent fees | 856 | 36,705 | 1,797,637 | 67,353 | 65,766 | |||||||||||||||
Trustee fees | 2,569 | 1,004 | 489,120 | 6,126 | 6,249 | |||||||||||||||
Legal fees | 1,403 | 912 | 437,019 | 8,151 | 5,760 | |||||||||||||||
Printing fees | 4,794 | 11,827 | 287,458 | 16,470 | 19,224 | |||||||||||||||
Custodian fees | 11,462 | 13,273 | 3,972,004 | 12,388 | 26,746 | |||||||||||||||
Registration and filing fees | 65,303 | 62,928 | 230,687 | 72,339 | 62,211 | |||||||||||||||
Audit fees | 34,694 | 32,761 | 34,694 | 35,660 | 32,761 | |||||||||||||||
Dividend expense for securities sold short | – | – | – | 1,080,660 | – | |||||||||||||||
Broker related expenses for securities sold short | – | – | – | 280,223 | – | |||||||||||||||
Other | 53,006 | 8,712 | 905,040 | 19,146 | 18,561 | |||||||||||||||
|
|
|
|
|
|
|
|
|
| |||||||||||
Total expenses before reimbursed/waived expenses | 759,145 | 450,284 | 83,913,678 | 2,919,135 | 1,379,593 | |||||||||||||||
Interest expense (Note 10) | 3,753 | 5 | 39,331 | – | 183 | |||||||||||||||
|
|
|
|
|
|
|
|
|
| |||||||||||
Total operating expenses before reimbursed/waived expenses | 762,898 | 450,289 | 83,953,009 | 2,919,135 | 1,379,776 | |||||||||||||||
Expenses reimbursed | (89,826 | ) | (136,771 | ) | (2,402,413 | ) | (132,760 | ) | (67,616 | ) | ||||||||||
Broker related expenses for securities sold short reduced by Adviser | – | – | – | (140,452 | ) | – | ||||||||||||||
|
|
|
|
|
|
|
|
|
| |||||||||||
Net expenses | 673,072 | 313,518 | 81,550,596 | 2,645,923 | 1,312,160 | |||||||||||||||
|
|
|
|
|
|
|
|
|
| |||||||||||
Net Investment Income/(Loss) | 377,438 | 141,612 | 93,655,335 | (1,386,505 | ) | 854,636 | ||||||||||||||
|
|
|
|
|
|
|
|
|
| |||||||||||
REALIZED/UNREALIZED GAIN/(LOSS) FROM INVESTMENTS: | ||||||||||||||||||||
Realized gain/(loss) on investment transactions and securities sold short (including $816,957, $0, $0, $0 and $4,062 capital gains tax, respectively) | (56,974,668 | ) | (490,287 | ) | (148,270,563 | ) | 8,305,247 | (1,022,473 | ) | |||||||||||
Realized gain/(loss) on foreign currency transactions | (104,808 | ) | (38,744 | ) | (3,590,541 | ) | (170 | ) | (20,295 | ) | ||||||||||
|
|
|
|
|
|
|
|
|
| |||||||||||
Net realized gain/(loss) from investments and foreign currency transactions | (57,079,476 | ) | (529,031 | ) | (151,861,104 | ) | 8,305,077 | (1,042,768 | ) | |||||||||||
|
|
|
|
|
|
|
|
|
| |||||||||||
Net change in unrealized appreciation/(depreciation) on investment transactions (including $992,703, $0, $14,481,683, $0 and $89,356 change in deferred capital gains tax, respectively) | 38,818,539 | 622,232 | 917,981,700 | (9,896,368 | ) | 2,179,415 | ||||||||||||||
Net change in unrealized appreciation/depreciation on securities sold short | – | – | – | 1,103,842 | – | |||||||||||||||
Net change in unrealized appreciation/(depreciation) on translation of assets and liabilities denominated in foreign currencies | 104 | 14,465 | 309,182 | – | 2,357 | |||||||||||||||
|
|
|
|
|
|
|
|
|
| |||||||||||
Net change in unrealized appreciation/(depreciation) from investments and translation of assets and liabilities denominated in foreign currencies | 38,818,643 | 636,697 | 918,290,882 | (8,792,526 | ) | 2,181,772 | ||||||||||||||
|
|
|
|
|
|
|
|
|
| |||||||||||
Net realized/unrealized gain/(loss) from investments and foreign currency transactions | (18,260,833 | ) | 107,666 | 766,429,778 | (487,449 | ) | 1,139,004 | |||||||||||||
|
|
|
|
|
|
|
|
|
| |||||||||||
CHANGE IN NET ASSETS RESULTING FROM OPERATIONS | $ | (17,883,395 | ) | $ | 249,278 | $ | 860,085,113 | $ | (1,873,954 | ) | $ | 1,993,640 | ||||||||
|
|
|
|
|
|
|
|
|
| |||||||||||
(a) Other income includes a one-time reimbursement for overbilling of prior year custodian out-of-pocket fees.
Amounts listed as “–” are $0 or round to $0.
See accompanying Notes to Financial Statements.
Annual Report 2016
86
Statements of Operations (continued)
For the Year Ended October 31, 2016
| Aberdeen Global Natural Resources Fund | Aberdeen International Equity Fund | Aberdeen International Small Cap Fund | Aberdeen Japanese Equities Fund(b) | Aberdeen U.S. Mid Cap Equity Fund(c) | ||||||||||||||||
INVESTMENT INCOME: | ||||||||||||||||||||
Dividend income | $ | 574,848 | $ | 14,910,246 | $ | 1,739,397 | $ | 19,546 | $ | 9,924 | ||||||||||
Interest income | 275 | 6,017 | 1,287 | 19 | 11 | |||||||||||||||
Foreign tax withholding | (51,586 | ) | (1,162,240 | ) | (101,243 | ) | (2,862 | ) | (83 | ) | ||||||||||
Other income(a) | 3,555 | 4,912 | 13,018 | – | – | |||||||||||||||
|
|
|
|
|
|
|
|
|
| |||||||||||
| 527,092 | 13,758,935 | 1,652,459 | 16,703 | 9,852 | ||||||||||||||||
|
|
|
|
|
|
|
|
|
| |||||||||||
EXPENSES: | ||||||||||||||||||||
Investment advisory fees | 126,895 | 3,939,482 | 977,998 | 6,074 | 5,540 | |||||||||||||||
Administration fees | 14,502 | 393,949 | 62,637 | 748 | 591 | |||||||||||||||
Distribution fees Class A | 23,303 | 163,680 | 126,114 | 28 | 19 | |||||||||||||||
Distribution fees Class C | 14,664 | 174,533 | 11,032 | 93 | 73 | |||||||||||||||
Distribution fees Class R | 10,975 | 49,281 | 3,426 | 47 | 37 | |||||||||||||||
Sub-transfer agent and administrative service fees Class A | 10,959 | 71,611 | 41,084 | – | – | |||||||||||||||
Sub-transfer agent and administrative service fees Institutional Class | 1,675 | 47,384 | 7,597 | – | 3 | |||||||||||||||
Sub-transfer agent and administrative service fees Class C | 1,496 | 16,686 | 1,056 | – | – | |||||||||||||||
Sub-transfer agent and administrative service fees Class R | 2,521 | 13,626 | 1,031 | – | – | |||||||||||||||
Sub-transfer agent and administrative service fees Institutional Service Class | 486 | 134,099 | 899 | – | – | |||||||||||||||
Fund accounting fees | 8,185 | 55,738 | 14,065 | 5,743 | 75 | |||||||||||||||
Transfer agent fees | 35,578 | 241,284 | 92,421 | 18,169 | 11,287 | |||||||||||||||
Trustee fees | 1,224 | 32,788 | 4,962 | 81 | 64 | |||||||||||||||
Legal fees | 1,202 | 29,595 | 8,057 | 2,424 | 34 | |||||||||||||||
Printing fees | 14,999 | 56,582 | 28,784 | 18,157 | 8,376 | |||||||||||||||
Custodian fees | 10,717 | 117,871 | 53,852 | 2,837 | 1,796 | |||||||||||||||
Registration and filing fees | 70,064 | 65,475 | 66,340 | 81,791 | 50,594 | |||||||||||||||
Audit fees | 32,761 | 32,761 | 34,693 | 35,500 | 33,500 | |||||||||||||||
Other | 8,485 | 79,029 | 31,844 | 3,966 | 2,808 | |||||||||||||||
|
|
|
|
|
|
|
|
|
| |||||||||||
Total expenses before reimbursed/waived expenses | 390,691 | 5,715,454 | 1,567,892 | 175,658 | 114,797 | |||||||||||||||
Interest expense (Note 10) | 106 | 3,825 | 2,248 | – | – | |||||||||||||||
|
|
|
|
|
|
|
|
|
| |||||||||||
Total operating expenses before reimbursed/waived expenses | 390,797 | 5,719,279 | 1,570,140 | 175,658 | 114,797 | |||||||||||||||
Expenses reimbursed | (117,499 | ) | (4,248 | ) | (366,445 | ) | (166,146 | ) | (107,280 | ) | ||||||||||
|
|
|
|
|
|
|
|
|
| |||||||||||
Net expenses | 273,298 | 5,715,031 | 1,203,695 | 9,512 | 7,517 | |||||||||||||||
|
|
|
|
|
|
|
|
|
| |||||||||||
Net Investment Income | 253,794 | 8,043,904 | 448,764 | 7,191 | 2,335 | |||||||||||||||
|
|
|
|
|
|
|
|
|
| |||||||||||
REALIZED/UNREALIZED GAIN/(LOSS) FROM INVESTMENTS: | ||||||||||||||||||||
Realized gain/(loss) on investment transactions and securities sold short (including $0, $2,454, $0, $0 and $0 capital gains tax, respectively) | (3,793,811 | ) | (38,401,775 | ) | 192,510 | 9,618 | 21,483 | |||||||||||||
Realized gain/(loss) on foreign currency transactions | (23,646 | ) | (228,719 | ) | (48,301 | ) | (2,479 | ) | – | |||||||||||
|
|
|
|
|
|
|
|
|
| |||||||||||
Net realized gain/(loss) from investments and foreign currency transactions | (3,817,457 | ) | (38,630,494 | ) | 144,209 | 7,139 | 21,483 | |||||||||||||
|
|
|
|
|
|
|
|
|
| |||||||||||
Net change in unrealized appreciation/(depreciation) on investment transactions (including $0, $392,845, $0, $0 and $4,062 change in deferred capital gains tax, respectively) | 5,022,895 | 30,825,263 | 4,403,686 | 91,068 | 72,618 | |||||||||||||||
Net change in unrealized appreciation on translation of assets and liabilities denominated in foreign currencies | (407 | ) | 82,750 | 5,562 | (247 | ) | – | |||||||||||||
|
|
|
|
|
|
|
|
|
| |||||||||||
Net change in unrealized appreciation/(depreciation) from investments and translation of assets and liabilities denominated in foreign currencies | 5,022,488 | 30,908,013 | 4,409,248 | 90,821 | 72,618 | |||||||||||||||
|
|
|
|
|
|
|
|
|
| |||||||||||
Net realized/unrealized gain/(loss) from investments and foreign currency transactions | 1,205,031 | (7,722,481 | ) | 4,553,457 | 97,960 | 94,101 | ||||||||||||||
|
|
|
|
|
|
|
|
|
| |||||||||||
CHANGE IN NET ASSETS RESULTING FROM OPERATIONS | $ | 1,458,825 | $ | 321,423 | $ | 5,002,221 | $ | 105,151 | $ | 96,436 | ||||||||||
|
|
|
|
|
|
|
|
|
| |||||||||||
(a) Other income includes a one-time reimbursement for overbilling of prior year custodian out-of-pocket fees.
(b) For the period from November 30, 2015 (commencement of operations) through October 31, 2016.
(c) For the period from February 29, 2016 (commencement of operations) through October 31, 2016.
Amounts listed as “–” are $0 or round to $0.
See accompanying Notes to Financial Statements.
2016 Annual Report
87
Statements of Operations (concluded)
For the Year Ended October 31, 2016
| Aberdeen U.S. Multi-Cap Equity Fund | Aberdeen U.S. Small Cap Equity Fund | |||||||
INVESTMENT INCOME: | ||||||||
Dividend income | $ | 4,941,292 | $ | 8,017,557 | ||||
Interest income | 9,266 | 26,914 | ||||||
Foreign tax withholding | (44,171 | ) | (123,936 | ) | ||||
Other income(a) | 6,784 | 80,649 | ||||||
|
|
|
| |||||
| 4,913,171 | 8,001,184 | |||||||
|
|
|
| |||||
EXPENSES: | ||||||||
Investment advisory fees | 2,633,340 | 5,717,269 | ||||||
Administration fees | 280,890 | 556,727 | ||||||
Distribution fees Class A | 582,909 | 364,711 | ||||||
Distribution fees Class C | 63,194 | 551,751 | ||||||
Distribution fees Class R | 1,448 | 51,686 | ||||||
Sub-transfer agent and administrative service fees Institutional Class | 1,793 | 397,684 | ||||||
Sub-transfer agent and administrative service fees Class A | 82,920 | 155,575 | ||||||
Sub-transfer agent and administrative service fees Class C | 5,499 | 47,202 | ||||||
Sub-transfer agent and administrative service fees Class R | 325 | 11,979 | ||||||
Sub-transfer agent and administrative service fees Institutional Service Class | 107,392 | 30,222 | ||||||
Fund accounting fees | 35,913 | 67,432 | ||||||
Transfer agent fees | 270,042 | 358,251 | ||||||
Trustee fees | 23,983 | 54,309 | ||||||
Legal fees | 26,695 | 43,724 | ||||||
Printing fees | 49,814 | 132,384 | ||||||
Custodian fees | 14,831 | 40,724 | ||||||
Registration and filing fees | 71,036 | 106,277 | ||||||
Audit fees | 31,795 | 31,795 | ||||||
Other | 43,655 | 74,685 | ||||||
|
|
|
| |||||
Total expenses before reimbursed/waived expenses | 4,327,474 | 8,794,387 | ||||||
Interest expense (Note 10) | 201 | – | ||||||
|
|
|
| |||||
Total operating expenses before reimbursed/waived expenses | 4,327,675 | 8,794,387 | ||||||
Expenses reimbursed | (329,278 | ) | – | |||||
Recoupment of expenses previously reimbursed | – | 237,954 | ||||||
|
|
|
| |||||
Net expenses | 3,998,397 | 9,032,341 | ||||||
|
|
|
| |||||
Net Investment Income/(Loss) | 914,774 | (1,031,157 | ) | |||||
|
|
|
| |||||
REALIZED/UNREALIZED GAIN/(LOSS) FROM INVESTMENTS: | ||||||||
Realized gain on investment transactions and securities sold short (including $0 and $0 capital gains tax, respectively) | 47,756,225 | 52,564,264 | ||||||
Realized gain/(loss) on foreign currency transactions | 12,502 | (21,947 | ) | |||||
|
|
|
| |||||
Net realized gain from investments and foreign currency transactions | 47,768,727 | 52,542,317 | ||||||
|
|
|
| |||||
Net change in unrealized depreciation on investment transactions (including $0 and $0 change in deferred capital gains tax, respectively) | (40,899,763 | ) | (18,311,964 | ) | ||||
Net change in unrealized appreciation/(depreciation) on translation of assets and liabilities denominated in foreign currencies | (122 | ) | 67 | |||||
|
|
|
| |||||
Net change in unrealized depreciation from investments and translation of assets and liabilities denominated in foreign currencies | (40,899,885 | ) | (18,311,897 | ) | ||||
|
|
|
| |||||
Net realized/unrealized gain from investments and foreign currency transactions | 6,868,842 | 34,230,420 | ||||||
|
|
|
| |||||
CHANGE IN NET ASSETS RESULTING FROM OPERATIONS | $ | 7,783,616 | $ | 33,199,263 | ||||
|
|
|
| |||||
(a) Other income includes a one-time reimbursement for overbilling of prior year custodian out-of-pocket fees.
Amounts listed as “–” are $0 or round to $0.
See accompanying Notes to Financial Statements.
Annual Report 2016
88
Statements of Changes in Net Assets
| Aberdeen Asia-Pacific (ex-Japan) Equity Fund | Aberdeen China Opportunities Fund | Aberdeen Emerging Markets Fund | ||||||||||||||||||||||
| Year Ended October 31, 2016 | Year Ended October 31, 2015 | Year Ended October 31, 2016 | Year Ended October 31, 2015 | Year Ended October 31, 2016 | Year Ended October 31, 2015 | |||||||||||||||||||
FROM INVESTMENT ACTIVITIES: |
| |||||||||||||||||||||||
Operations: | ||||||||||||||||||||||||
Net investment income | $ | 377,438 | $ | 21,867,293 | $ | 141,612 | $ | 271,056 | $ | 93,655,335 | $ | 104,462,036 | ||||||||||||
Net realized gain/(loss) from investments and foreign currency transactions | (57,079,476 | ) | (144,368,434 | ) | (529,031 | ) | 1,180,078 | (151,861,104 | ) | 71,504,332 | ||||||||||||||
Net change in unrealized appreciation/(depreciation) on investments and translation of assets and liabilities denominated in foreign currencies | 38,818,643 | (80,508,238 | ) | 636,697 | (3,474,579 | ) | 918,290,882 | (1,618,944,253 | ) | |||||||||||||||
|
|
|
|
|
|
|
|
|
|
|
| |||||||||||||
Changes in net assets resulting from operations | (17,883,395 | ) | (203,009,379 | ) | 249,278 | (2,023,445 | ) | 860,085,113 | (1,442,977,885 | ) | ||||||||||||||
|
|
|
|
|
|
|
|
|
|
|
| |||||||||||||
Distributions to Shareholders From: |
| |||||||||||||||||||||||
Net investment income: | ||||||||||||||||||||||||
Class A | (16,922 | ) | (25,625 | ) | – | (172,726 | ) | (41,210 | ) | (2,645,889 | ) | |||||||||||||
Class C | (3,733 | ) | (7,296 | ) | – | (69,035 | ) | – | (163,090 | ) | ||||||||||||||
Class R | (202 | ) | (271 | ) | – | (19,117 | ) | – | (246,400 | ) | ||||||||||||||
Institutional Service Class | (85,963 | ) | (128,144 | ) | – | (20,749 | ) | (223,421 | ) | (5,932,794 | ) | |||||||||||||
Institutional Class | (1,884,305 | ) | (22,698,545 | ) | – | (42,982 | ) | (9,182,602 | ) | (107,175,841 | ) | |||||||||||||
Net realized gains: | ||||||||||||||||||||||||
Class A | – | (16,504 | ) | – | – | (1,899,998 | ) | (10,017,204 | ) | |||||||||||||||
Class C | – | (4,740 | ) | – | – | (291,887 | ) | (1,314,333 | ) | |||||||||||||||
Class R | – | (186 | ) | – | – | (376,083 | ) | (990,879 | ) | |||||||||||||||
Institutional Service Class | – | (66,146 | ) | – | – | (4,386,207 | ) | (6,924,119 | ) | |||||||||||||||
Institutional Class | – | (17,386,145 | ) | – | – | (72,844,239 | ) | (267,561,188 | ) | |||||||||||||||
|
|
|
|
|
|
|
|
|
|
|
| |||||||||||||
Change in net assets from shareholder distributions | (1,991,125 | ) | (40,333,602 | ) | – | (324,609 | ) | (89,245,647 | ) | (402,971,737 | ) | |||||||||||||
|
|
|
|
|
|
|
|
|
|
|
| |||||||||||||
Common Stock Transactions: | ||||||||||||||||||||||||
Change in net assets from capital transactions | (233,758,952 | ) | (563,771,354 | ) | (2,505,324 | ) | (11,163,177 | ) | (439,710,802 | ) | (567,021,908 | ) | ||||||||||||
|
|
|
|
|
|
|
|
|
|
|
| |||||||||||||
Change in net assets | (253,633,472 | ) | (807,114,335 | ) | (2,256,046 | ) | (13,511,231 | ) | 331,128,664 | (2,412,971,530 | ) | |||||||||||||
|
|
|
|
|
|
|
|
|
|
|
| |||||||||||||
Net Assets: | ||||||||||||||||||||||||
Beginning of year | 268,298,050 | 1,075,412,385 | 16,853,997 | 30,365,228 | 7,629,371,260 | 10,042,342,790 | ||||||||||||||||||
|
|
|
|
|
|
|
|
|
|
|
| |||||||||||||
End of year | $ | 14,664,578 | $ | 268,298,050 | $ | 14,597,951 | $ | 16,853,997 | $ | 7,960,499,924 | $ | 7,629,371,260 | ||||||||||||
|
|
|
|
|
|
|
|
|
|
|
| |||||||||||||
Accumulated net investment income/(loss) at end of year | $ | (40,623 | ) | $ | 1,348,658 | $ | 102,867 | $ | – | $ | 75,601,133 | $ | (5,957,577 | ) | ||||||||||
|
|
|
|
|
|
|
|
|
|
|
| |||||||||||||
Amounts listed as “–” are $0 or round to $0.
See accompanying Notes to Financial Statements.
2016 Annual Report
89
Statements of Changes in Net Assets (continued)
| Aberdeen Asia-Pacific (ex-Japan) Equity Fund | Aberdeen China Opportunities Fund | Aberdeen Emerging Markets Fund | ||||||||||||||||||||||
| Year Ended October 31, 2016 | Year Ended October 31, 2015 | Year Ended October 31, 2016 | Year Ended October 31, 2015 | Year Ended October 31, 2016 | Year Ended October 31, 2015 | |||||||||||||||||||
CAPITAL TRANSACTIONS: | ||||||||||||||||||||||||
Class A Shares | ||||||||||||||||||||||||
Proceeds from shares issued | $ | 38,861 | $ | 767,550 | $ | 636,823 | $ | 1,032,710 | $ | 58,965,715 | $ | 74,844,365 | ||||||||||||
Dividends reinvested | 16,568 | 40,887 | – | 127,067 | 1,571,397 | 10,269,358 | ||||||||||||||||||
Cost of shares redeemed | (154,383 | ) | (982,791 | ) | (1,687,795 | ) | (11,126,688 | ) | (81,048,004 | ) | (176,166,541 | ) | ||||||||||||
|
|
|
|
|
|
|
|
|
|
|
| |||||||||||||
Total Class A | (98,954 | ) | (174,354 | ) | (1,050,972 | ) | (9,966,911 | ) | (20,510,892 | ) | (91,052,818 | ) | ||||||||||||
|
|
|
|
|
|
|
|
|
|
|
| |||||||||||||
Class C Shares | ||||||||||||||||||||||||
Proceeds from shares issued | – | 229,595 | 15,290 | 275,384 | 4,616,819 | 9,165,355 | ||||||||||||||||||
Dividends reinvested | 3,733 | 10,842 | – | 36,469 | 187,431 | 979,311 | ||||||||||||||||||
Cost of shares redeemed | (236,746 | ) | (176,618 | ) | (1,120,967 | ) | (1,029,923 | ) | (12,524,842 | ) | (16,095,683 | ) | ||||||||||||
|
|
|
|
|
|
|
|
|
|
|
| |||||||||||||
Total Class C | (233,013 | ) | 63,819 | (1,105,677 | ) | (718,070 | ) | (7,720,592 | ) | (5,951,017 | ) | |||||||||||||
|
|
|
|
|
|
|
|
|
|
|
| |||||||||||||
Class R Shares | ||||||||||||||||||||||||
Proceeds from shares issued | – | – | 677,628 | 825,302 | 14,700,499 | 15,328,585 | ||||||||||||||||||
Dividends reinvested | 202 | 457 | – | 15,504 | 332,795 | 1,042,782 | ||||||||||||||||||
Cost of shares redeemed | – | – | (642,740 | ) | (889,705 | ) | (5,898,234 | ) | (7,757,428 | ) | ||||||||||||||
|
|
|
|
|
|
|
|
|
|
|
| |||||||||||||
Total Class R | 202 | 457 | 34,888 | (48,899 | ) | 9,135,060 | 8,613,939 | |||||||||||||||||
|
|
|
|
|
|
|
|
|
|
|
| |||||||||||||
Institutional Service Class Shares | ||||||||||||||||||||||||
Proceeds from shares issued | 244,495 | 2,103,196 | 1,480 | 22,518 | 31,912,767 | 406,467,287 | ||||||||||||||||||
Dividends reinvested | 39,664 | 121,039 | – | 20,390 | 4,609,403 | 12,851,158 | ||||||||||||||||||
Cost of shares redeemed | (193,769 | ) | (1,282,946 | ) | (108,203 | ) | (873,767 | ) | (151,486,664 | ) | (145,024,672 | ) | ||||||||||||
|
|
|
|
|
|
|
|
|
|
|
| |||||||||||||
Total Institutional Service Class | 90,390 | 941,289 | (106,723 | ) | (830,859 | ) | (114,964,494 | ) | 274,293,773 | |||||||||||||||
|
|
|
|
|
|
|
|
|
|
|
| |||||||||||||
Institutional Class Shares | ||||||||||||||||||||||||
Proceeds from shares issued | 4,160,163 | 845,931,013 | 200,063 | 1,750,645 | 2,143,126,393 | 2,387,051,334 | ||||||||||||||||||
Dividends reinvested | 1,258,158 | 13,214,750 | – | 41,438 | 64,842,955 | 286,469,136 | ||||||||||||||||||
Cost of shares redeemed | (238,935,898 | ) | (1,423,748,328 | ) | (476,903 | ) | (1,390,521 | ) | (2,513,619,232 | ) | (3,426,446,255 | ) | ||||||||||||
|
|
|
|
|
|
|
|
|
|
|
| |||||||||||||
Total Institutional Class | (233,517,577 | ) | (564,602,565 | ) | (276,840 | ) | 401,562 | (305,649,884 | ) | (752,925,785 | ) | |||||||||||||
|
|
|
|
|
|
|
|
|
|
|
| |||||||||||||
Change in net assets from capital transactions: | $ | (233,758,952 | ) | $ | (563,771,354 | ) | $ | (2,505,324 | ) | $ | (11,163,177 | ) | $ | (439,710,802 | ) | $ | (567,021,908 | ) | ||||||
|
|
|
|
|
|
|
|
|
|
|
| |||||||||||||
Amounts listed as “–” are $0 or round to $0.
See accompanying Notes to Financial Statements.
Annual Report 2016
90
Statements of Changes in Net Assets (continued)
| Aberdeen Asia-Pacific (ex-Japan) Equity Fund | Aberdeen China Opportunities Fund | Aberdeen Emerging Markets Fund | ||||||||||||||||||||||
| Year Ended October 31, 2016 | Year Ended October 31, 2015 | Year Ended October 31, 2016 | Year Ended October 31, 2015 | Year Ended October 31, 2016 | Year Ended October 31, 2015 | |||||||||||||||||||
SHARE TRANSACTIONS: | ||||||||||||||||||||||||
Class A Shares | ||||||||||||||||||||||||
Issued | 4,064 | 64,113 | 36,700 | 52,192 | 4,810,446 | 5,498,237 | ||||||||||||||||||
Reinvested | 1,805 | 3,838 | – | 7,040 | 138,817 | 773,178 | ||||||||||||||||||
Redeemed | (15,712 | ) | (83,911 | ) | (99,417 | ) | (563,244 | ) | (6,738,498 | ) | (13,504,085 | ) | ||||||||||||
|
|
|
|
|
|
|
|
|
|
|
| |||||||||||||
Total Class A Shares | (9,843 | ) | (15,960 | ) | (62,717 | ) | (504,012 | ) | (1,789,235 | ) | (7,232,670 | ) | ||||||||||||
|
|
|
|
|
|
|
|
|
|
|
| |||||||||||||
Class C Shares | ||||||||||||||||||||||||
Issued | – | 19,471 | 932 | 14,324 | 378,269 | 675,466 | ||||||||||||||||||
Reinvested | 407 | 1,030 | – | 2,149 | 16,690 | 74,134 | ||||||||||||||||||
Redeemed | (22,815 | ) | (16,462 | ) | (69,270 | ) | (54,485 | ) | (1,060,045 | ) | (1,254,631 | ) | ||||||||||||
|
|
|
|
|
|
|
|
|
|
|
| |||||||||||||
Total Class C Shares | (22,408 | ) | 4,039 | (68,338 | ) | (38,012 | ) | (665,086 | ) | (505,031 | ) | |||||||||||||
|
|
|
|
|
|
|
|
|
|
|
| |||||||||||||
Class R Shares | ||||||||||||||||||||||||
Issued | – | – | 40,319 | 42,152 | 1,203,088 | 1,147,004 | ||||||||||||||||||
Reinvested | 22 | 44 | – | 891 | 29,556 | 79,187 | ||||||||||||||||||
Redeemed | – | – | (37,453 | ) | (44,953 | ) | (486,611 | ) | (580,271 | ) | ||||||||||||||
|
|
|
|
|
|
|
|
|
|
|
| |||||||||||||
Total Class R Shares | 22 | 44 | 2,866 | (1,910 | ) | 746,033 | 645,920 | |||||||||||||||||
|
|
|
|
|
|
|
|
|
|
|
| |||||||||||||
Institutional Service Class Shares | ||||||||||||||||||||||||
Issued | 23,765 | 176,560 | 86 | 1,123 | 2,921,150 | 29,133,387 | ||||||||||||||||||
Reinvested | 4,311 | 11,299 | – | 1,111 | 407,191 | 979,266 | ||||||||||||||||||
Redeemed | (19,800 | ) | (115,076 | ) | (6,284 | ) | (44,092 | ) | (12,173,715 | ) | (12,389,902 | ) | ||||||||||||
|
|
|
|
|
|
|
|
|
|
|
| |||||||||||||
Total Institutional Service Class Shares | 8,276 | 72,783 | (6,198 | ) | (41,858 | ) | (8,845,374 | ) | 17,722,751 | |||||||||||||||
|
|
|
|
|
|
|
|
|
|
|
| |||||||||||||
Institutional Class Shares | ||||||||||||||||||||||||
Issued | 443,254 | 72,164,872 | 11,939 | 89,738 | 179,357,250 | 178,994,441 | ||||||||||||||||||
Reinvested | 136,608 | 1,205,448 | – | 2,264 | 5,728,176 | 21,631,046 | ||||||||||||||||||
Redeemed | (25,805,089 | ) | (135,560,388 | ) | (27,406 | ) | (70,831 | ) | (211,608,136 | ) | (261,820,771 | ) | ||||||||||||
|
|
|
|
|
|
|
|
|
|
|
| |||||||||||||
Total Institutional Class Shares | (25,225,227 | ) | (62,190,068 | ) | (15,467 | ) | 21,171 | (26,522,710 | ) | (61,195,284 | ) | |||||||||||||
|
|
|
|
|
|
|
|
|
|
|
| |||||||||||||
Total change in shares: | (25,249,180 | ) | (62,129,162 | ) | (149,854 | ) | (564,621 | ) | (37,076,372 | ) | (50,564,314 | ) | ||||||||||||
|
|
|
|
|
|
|
|
|
|
|
| |||||||||||||
Amounts listed as “–” are $0 or round to $0.
See accompanying Notes to Financial Statements.
2016 Annual Report
91
Statements of Changes in Net Assets (continued)
| Aberdeen Equity Long-Short Fund | Aberdeen Global Equity Fund | Aberdeen Global Natural Resources Fund | ||||||||||||||||||||||
| Year Ended October 31, 2016 | Year Ended October 31, 2015 | Year Ended October 31, 2016 | Year Ended October 31, 2015 | Year Ended October 31, 2016 | Year Ended October 31, 2015 | |||||||||||||||||||
FROM INVESTMENT ACTIVITIES: | ||||||||||||||||||||||||
Operations: | ||||||||||||||||||||||||
Net investment income/(loss) | $ | (1,386,505 | ) | $ | (2,282,850 | ) | $ | 854,636 | $ | 1,439,376 | $ | 253,794 | $ | 299,856 | ||||||||||
Net realized gain/(loss) from investments and foreign currency transactions | 8,305,077 | 28,680,799 | (1,042,768 | ) | 6,772,402 | (3,817,457 | ) | (1,237,359 | ) | |||||||||||||||
Net change in unrealized appreciation/(depreciation) on investments and translation of assets and liabilities denominated in foreign currencies | (8,792,526 | ) | (21,714,443 | ) | 2,181,772 | (19,946,667 | ) | 5,022,488 | (3,484,406 | ) | ||||||||||||||
|
|
|
|
|
|
|
|
|
|
|
| |||||||||||||
Changes in net assets resulting from operations | (1,873,954 | ) | 4,683,506 | 1,993,640 | (11,734,889 | ) | 1,458,825 | (4,421,909 | ) | |||||||||||||||
|
|
|
|
|
|
|
|
|
|
|
| |||||||||||||
Distributions to Shareholders From: | ||||||||||||||||||||||||
Net investment income: | ||||||||||||||||||||||||
Class A | – | – | (148,771 | ) | (947,673 | ) | (33,870 | ) | (277,478 | ) | ||||||||||||||
Class C | – | – | (1,764 | ) | (19,782 | ) | (2,953 | ) | (39,537 | ) | ||||||||||||||
Class R | – | – | (2,908 | ) | (23,246 | ) | (7,927 | ) | (60,806 | ) | ||||||||||||||
Institutional Service Class | – | – | (4 | ) | (21,079 | ) | (1,266 | ) | (15,913 | ) | ||||||||||||||
Institutional Class | – | – | (112,925 | ) | (624,752 | ) | (25,248 | ) | (32,853 | ) | ||||||||||||||
Net realized gains: | ||||||||||||||||||||||||
Class A | (2,108,773 | ) | (4,787,502 | ) | – | – | – | – | ||||||||||||||||
Class C | (1,068,641 | ) | (2,468,282 | ) | – | – | – | – | ||||||||||||||||
Class R | (422,735 | ) | (595,930 | ) | – | – | – | – | ||||||||||||||||
Institutional Service Class | (78,807 | ) | (196,312 | ) | – | – | – | – | ||||||||||||||||
Institutional Class | (11,086,196 | ) | (42,575,701 | ) | – | – | – | – | ||||||||||||||||
|
|
|
|
|
|
|
|
|
|
|
| |||||||||||||
Change in net assets from shareholder distributions | (14,765,152 | ) | (50,623,727 | ) | (266,372 | ) | (1,636,532 | ) | (71,264 | ) | (426,587 | ) | ||||||||||||
|
|
|
|
|
|
|
|
|
|
|
| |||||||||||||
Common Stock Transactions: | ||||||||||||||||||||||||
Change in net assets from capital transactions | (33,908,882 | ) | (182,307,148 | ) | (6,961,159 | ) | (51,797,861 | ) | (5,797,792 | ) | 641,702 | |||||||||||||
|
|
|
|
|
|
|
|
|
|
|
| |||||||||||||
Change in net assets | (50,547,988 | ) | (228,247,369 | ) | (5,233,891 | ) | (65,169,282 | ) | (4,410,231 | ) | (4,206,794 | ) | ||||||||||||
|
|
|
|
|
|
|
|
|
|
|
| |||||||||||||
Net Assets: | ||||||||||||||||||||||||
Beginning of year | 121,227,536 | 349,474,905 | 92,594,841 | 157,764,123 | 18,970,123 | 23,176,917 | ||||||||||||||||||
|
|
|
|
|
|
|
|
|
|
|
| |||||||||||||
End of year | $ | 70,679,548 | $ | 121,227,536 | $ | 87,360,950 | $ | 92,594,841 | $ | 14,559,892 | $ | 18,970,123 | ||||||||||||
|
|
|
|
|
|
|
|
|
|
|
| |||||||||||||
Accumulated net investment income/(loss) at end of year | $ | (1,081,442 | ) | $ | (1,635,324 | ) | $ | 641,885 | $ | 77,978 | $ | 148,025 | $ | (43,214 | ) | |||||||||
|
|
|
|
|
|
|
|
|
|
|
| |||||||||||||
Amounts listed as “–” are $0 or round to $0.
See accompanying Notes to Financial Statements.
Annual Report 2016
92
Statements of Changes in Net Assets (continued)
| Aberdeen Equity Long-Short Fund | Aberdeen Global Equity Fund | Aberdeen Global Natural Resources Fund | ||||||||||||||||||||||
| Year Ended October 31, 2016 | Year Ended October 31, 2015 | Year Ended October 31, 2016 | Year Ended October 31, 2015 | Year Ended October 31, 2016 | Year Ended October 31, 2015 | |||||||||||||||||||
CAPITAL TRANSACTIONS: | ||||||||||||||||||||||||
Class A Shares | ||||||||||||||||||||||||
Proceeds from shares issued | $ | 2,759,203 | $ | 5,152,033 | $ | 4,537,758 | $ | 8,666,402 | $ | 3,041,541 | $ | 1,958,091 | ||||||||||||
Proceeds of shares issued in connection with fund merger | – | – | – | 4,987,280 | – | – | ||||||||||||||||||
Dividends reinvested | 1,729,534 | 3,575,942 | 142,616 | 906,975 | 25,237 | 228,343 | ||||||||||||||||||
Cost of shares redeemed | (7,567,474 | ) | (17,666,912 | ) | (15,955,649 | ) | (20,706,517 | ) | (3,081,607 | ) | (5,101,063 | ) | ||||||||||||
|
|
|
|
|
|
|
|
|
|
|
| |||||||||||||
Total Class A | (3,078,737 | ) | (8,938,937 | ) | (11,275,275 | ) | (6,145,860 | ) | (14,829 | ) | (2,914,629 | ) | ||||||||||||
|
|
|
|
|
|
|
|
|
|
|
| |||||||||||||
Class C Shares | ||||||||||||||||||||||||
Proceeds from shares issued | 554,407 | 3,450,983 | 215,386 | 287,504 | 276,398 | 291,092 | ||||||||||||||||||
Dividends reinvested | 555,252 | 1,160,512 | 903 | 10,488 | 1,765 | 24,198 | ||||||||||||||||||
Cost of shares redeemed | (3,921,692 | ) | (4,848,113 | ) | (470,429 | ) | (2,416,066 | ) | (545,558 | ) | (852,044 | ) | ||||||||||||
|
|
|
|
|
|
|
|
|
|
|
| |||||||||||||
Total Class C | (2,812,033 | ) | (236,618 | ) | (254,140 | ) | (2,118,074 | ) | (267,395 | ) | (536,754 | ) | ||||||||||||
|
|
|
|
|
|
|
|
|
|
|
| |||||||||||||
Class R Shares | ||||||||||||||||||||||||
Proceeds from shares issued | 524,352 | 749,645 | 847,398 | 474,767 | 752,099 | 1,230,825 | ||||||||||||||||||
Dividends reinvested | 422,735 | 595,930 | 1,954 | 16,050 | 2,054 | 17,227 | ||||||||||||||||||
Cost of shares redeemed | (1,028,877 | ) | (1,004,594 | ) | (990,969 | ) | (769,993 | ) | (1,046,573 | ) | (1,150,723 | ) | ||||||||||||
|
|
|
|
|
|
|
|
|
|
|
| |||||||||||||
Total Class R | (81,790 | ) | 340,981 | (141,617 | ) | (279,176 | ) | (292,420 | ) | 97,329 | ||||||||||||||
|
|
|
|
|
|
|
|
|
|
|
| |||||||||||||
Institutional Service Class Shares | ||||||||||||||||||||||||
Proceeds from shares issued | 641,210 | 170,222 | – | 5,084,974 | 853,232 | 71,956 | ||||||||||||||||||
Dividends reinvested | 78,807 | 196,312 | – | 21,079 | 1,157 | 15,104 | ||||||||||||||||||
Cost of shares redeemed | (721,684 | ) | (1,263,015 | ) | – | (4,903,350 | ) | (628,566 | ) | (277,980 | ) | |||||||||||||
|
|
|
|
|
|
|
|
|
|
|
| |||||||||||||
Total Institutional Service Class | (1,667 | ) | (896,481 | ) | – | 202,703 | 225,823 | (190,920 | ) | |||||||||||||||
|
|
|
|
|
|
|
|
|
|
|
| |||||||||||||
Institutional Class Shares | ||||||||||||||||||||||||
Proceeds from shares issued | 34,050,649 | 80,651,606 | 10,245,231 | 11,253,800 | 1,599,771 | 5,298,335 | ||||||||||||||||||
Proceeds of shares issued in connection with fund merger | – | – | – | 1,191,494 | – | – | ||||||||||||||||||
Dividends reinvested | 10,198,090 | 39,384,673 | 110,584 | 610,081 | 23,320 | 13,437 | ||||||||||||||||||
Cost of shares redeemed | (72,183,394 | ) | (292,612,372 | ) | (5,645,942 | ) | (56,512,829 | ) | (7,072,062 | ) | (1,125,096 | ) | ||||||||||||
|
|
|
|
|
|
|
|
|
|
|
| |||||||||||||
Total Institutional Class | (27,934,655 | ) | (172,576,093 | ) | 4,709,873 | (43,457,454 | ) | (5,448,971 | ) | 4,186,676 | ||||||||||||||
|
|
|
|
|
|
|
|
|
|
|
| |||||||||||||
Change in net assets from capital transactions: | $ | (33,908,882 | ) | $ | (182,307,148 | ) | $ | (6,961,159 | ) | $ | (51,797,861 | ) | $ | (5,797,792 | ) | $ | 641,702 | |||||||
|
|
|
|
|
|
|
|
|
|
|
| |||||||||||||
Amounts listed as “–” are $0 or round to $0.
See accompanying Notes to Financial Statements.
2016 Annual Report
93
Statements of Changes in Net Assets (continued)
| Aberdeen Equity Long-Short Fund | Aberdeen Global Equity Fund | Aberdeen Global Natural Resources Fund | ||||||||||||||||||||||
| Year Ended October 31, 2016 | Year Ended October 31, 2015 | Year Ended October 31, 2016 | Year Ended October 31, 2015 | Year Ended October 31, 2016 | Year Ended October 31, 2015 | |||||||||||||||||||
SHARE TRANSACTIONS: | ||||||||||||||||||||||||
Class A Shares | ||||||||||||||||||||||||
Issued | 312,183 | 492,145 | 393,651 | 665,273 | 277,152 | 145,257 | ||||||||||||||||||
Issued in connection with fund merger | – | – | – | 364,123 | – | – | ||||||||||||||||||
Reinvested | 198,569 | 349,213 | 12,599 | 69,648 | 2,499 | 17,605 | ||||||||||||||||||
Redeemed | (854,794 | ) | (1,680,205 | ) | (1,324,550 | ) | (1,559,538 | ) | (273,545 | ) | (376,475 | ) | ||||||||||||
|
|
|
|
|
|
|
|
|
|
|
| |||||||||||||
Total Class A Shares | (344,042 | ) | (838,847 | ) | (918,300 | ) | (460,494 | ) | 6,106 | (213,613 | ) | |||||||||||||
|
|
|
|
|
|
|
|
|
|
|
| |||||||||||||
Class C Shares | ||||||||||||||||||||||||
Issued | 110,555 | 537,603 | 19,784 | 23,121 | 27,823 | 22,873 | ||||||||||||||||||
Reinvested | 113,548 | 181,898 | 84 | 841 | 184 | 1,966 | ||||||||||||||||||
Redeemed | (699,556 | ) | (752,203 | ) | (41,616 | ) | (191,142 | ) | (52,785 | ) | (66,556 | ) | ||||||||||||
|
|
|
|
|
|
|
|
|
|
|
| |||||||||||||
Total Class C Shares | (475,453 | ) | (32,702 | ) | (21,748 | ) | (167,180 | ) | (24,778 | ) | (41,717 | ) | ||||||||||||
|
|
|
|
|
|
|
|
|
|
|
| |||||||||||||
Class R Shares | ||||||||||||||||||||||||
Issued | 62,746 | 76,137 | 75,422 | 37,233 | 69,844 | 96,199 | ||||||||||||||||||
Reinvested | 51,679 | 61,184 | 179 | 1,272 | 207 | 1,353 | ||||||||||||||||||
Redeemed | (123,427 | ) | (101,236 | ) | (86,515 | ) | (62,922 | ) | (99,618 | ) | (86,835 | ) | ||||||||||||
|
|
|
|
|
|
|
|
|
|
|
| |||||||||||||
Total Class R Shares | (9,002 | ) | 36,085 | (10,914 | ) | (24,417 | ) | (29,567 | ) | 10,717 | ||||||||||||||
|
|
|
|
|
|
|
|
|
|
|
| |||||||||||||
Institutional Service Class Shares | ||||||||||||||||||||||||
Issued | 70,476 | 15,778 | – | 370,670 | 79,708 | 5,166 | ||||||||||||||||||
Reinvested | 8,864 | 18,840 | – | 1,566 | 113 | 1,136 | ||||||||||||||||||
Redeemed | (77,601 | ) | (109,805 | ) | – | (372,305 | ) | (55,823 | ) | (22,756 | ) | |||||||||||||
|
|
|
|
|
|
|
|
|
|
|
| |||||||||||||
Total Institutional Service Class Shares | 1,739 | (75,187 | ) | – | (69 | ) | 23,998 | (16,454 | ) | |||||||||||||||
|
|
|
|
|
|
|
|
|
|
|
| |||||||||||||
Institutional Class Shares | ||||||||||||||||||||||||
Issued | 3,666,069 | 7,543,322 | 858,209 | 872,856 | 148,124 | 475,428 | ||||||||||||||||||
Issued in connection with fund merger | – | – | – | 86,882 | – | – | ||||||||||||||||||
Reinvested | 1,128,107 | 3,733,144 | 9,760 | 46,737 | 2,277 | 1,005 | ||||||||||||||||||
Redeemed | (7,799,527 | ) | (26,720,883 | ) | (472,110 | ) | (4,146,443 | ) | (591,730 | ) | (85,949 | ) | ||||||||||||
|
|
|
|
|
|
|
|
|
|
|
| |||||||||||||
Total Institutional Class Shares | (3,005,351 | ) | (15,444,417 | ) | 395,859 | (3,139,968 | ) | (441,329 | ) | 390,484 | ||||||||||||||
|
|
|
|
|
|
|
|
|
|
|
| |||||||||||||
Total change in shares: | (3,832,109 | ) | (16,355,068 | ) | (555,103 | ) | (3,792,128 | ) | (465,570 | ) | 129,417 | |||||||||||||
|
|
|
|
|
|
|
|
|
|
|
| |||||||||||||
Amounts listed as “–” are $0 or round to $0.
See accompanying Notes to Financial Statements.
Annual Report 2016
94
Statements of Changes in Net Assets (continued)
| Aberdeen International Equity Fund | Aberdeen International Small Cap Fund | Aberdeen Japanese Equities Fund | ||||||||||||||||||
| Year Ended October 31, 2016 | Year Ended October 31, 2015 | Year Ended October 31, 2016 | Year Ended October 31, 2015 | Period Ended October 31, 2016(a) | ||||||||||||||||
FROM INVESTMENT ACTIVITIES: | ||||||||||||||||||||
Operations: | ||||||||||||||||||||
Net investment income | $ | 8,043,904 | $ | 15,537,904 | $ | 448,764 | $ | 2,340,000 | $ | 7,191 | ||||||||||
Net realized gain/(loss) from investments and foreign currency transactions | (38,630,494 | ) | (2,601,242 | ) | 144,209 | 11,965,259 | 7,139 | |||||||||||||
Net change in unrealized appreciation/(depreciation) on investments and translation of assets and liabilities denominated in foreign currencies | 30,908,013 | (138,532,873 | ) | 4,409,248 | (17,384,539 | ) | 90,821 | |||||||||||||
|
|
|
|
|
|
|
|
|
| |||||||||||
Changes in net assets resulting from operations | 321,423 | (125,596,211 | ) | 5,002,221 | (3,079,280 | ) | 105,151 | |||||||||||||
|
|
|
|
|
|
|
|
|
| |||||||||||
Distributions to Shareholders From: | ||||||||||||||||||||
Net investment income: | ||||||||||||||||||||
Class A | (256,405 | ) | (2,318,371 | ) | (228,225 | ) | (1,066,895 | ) | (6 | ) | ||||||||||
Class C | (23,654 | ) | (436,483 | ) | (4,732 | ) | (21,328 | ) | – | |||||||||||
Class R | (31,721 | ) | (272,867 | ) | (2,339 | ) | (11,468 | ) | (5 | ) | ||||||||||
Institutional Service Class | (508,720 | ) | (3,874,530 | ) | (3,609 | ) | (36,391 | ) | (9 | ) | ||||||||||
Institutional Class | (1,114,495 | ) | (10,748,446 | ) | (172,512 | ) | (2,096,848 | ) | (827 | ) | ||||||||||
Net realized gains: | ||||||||||||||||||||
Class A | – | – | (4,916,418 | ) | (3,337,012 | ) | – | |||||||||||||
Class C | – | – | (133,270 | ) | (90,199 | ) | – | |||||||||||||
Class R | – | – | (57,580 | ) | (45,117 | ) | – | |||||||||||||
Institutional Service Class | – | – | (76,860 | ) | (121,392 | ) | – | |||||||||||||
Institutional Class | – | – | (3,082,076 | ) | (9,941,153 | ) | – | |||||||||||||
|
|
|
|
|
|
|
|
|
| |||||||||||
Change in net assets from shareholder distributions | (1,934,995 | ) | (17,650,697 | ) | (8,677,621 | ) | (16,767,803 | ) | (847 | ) | ||||||||||
|
|
|
|
|
|
|
|
|
| |||||||||||
Common Stock Transactions: | ||||||||||||||||||||
Change in net assets from capital transactions | (158,316,614 | ) | (120,887,487 | ) | (28,808,504 | ) | (132,879,015 | ) | 1,011,847 | |||||||||||
|
|
|
|
|
|
|
|
|
| |||||||||||
Change in net assets | (159,930,186 | ) | (264,134,395 | ) | (32,483,904 | ) | (152,726,098 | ) | 1,116,151 | |||||||||||
|
|
|
|
|
|
|
|
|
| |||||||||||
Net Assets: | ||||||||||||||||||||
Beginning of year | 618,027,557 | 882,161,952 | 106,038,911 | 258,765,009 | – | |||||||||||||||
|
|
|
|
|
|
|
|
|
| |||||||||||
End of year | $ | 458,097,371 | $ | 618,027,557 | $ | 73,555,007 | $ | 106,038,911 | $ | 1,116,151 | ||||||||||
|
|
|
|
|
|
|
|
|
| |||||||||||
Accumulated net investment income/(loss) at end of year | $ | 6,581,245 | $ | 380,619 | $ | (29,281 | ) | $ | (282,331 | ) | $ | 3,919 | ||||||||
|
|
|
|
|
|
|
|
|
| |||||||||||
| (a) | For the period from November 30, 2015 (commencement of operations) through October 31, 2016. |
Amounts listed as “–” are $0 or round to $0.
See accompanying Notes to Financial Statements.
2016 Annual Report
95
Statements of Changes in Net Assets (continued)
| Aberdeen International Equity Fund | Aberdeen International Small Cap Fund | Aberdeen Japanese Equities Fund | ||||||||||||||||||
| Year Ended October 31, 2016 | Year Ended October 31, 2015 | Year Ended October 31, 2016 | Year Ended October 31, 2015 | Period Ended October 31, 2016(a) | ||||||||||||||||
CAPITAL TRANSACTIONS: | ||||||||||||||||||||
Class A Shares | ||||||||||||||||||||
Proceeds from shares issued | $ | 25,523,814 | $ | 18,990,820 | $ | 2,572,432 | $ | 2,680,883 | $ | 21,000 | ||||||||||
Dividends reinvested | 197,190 | 1,711,458 | 4,951,615 | 4,222,975 | 6 | |||||||||||||||
Cost of shares redeemed | (67,763,373 | ) | (56,569,720 | ) | (8,114,176 | ) | (11,520,088 | ) | – | |||||||||||
|
|
|
|
|
|
|
|
|
| |||||||||||
Total Class A | (42,042,369 | ) | (35,867,442 | ) | (590,129 | ) | (4,616,230 | ) | 21,006 | |||||||||||
|
|
|
|
|
|
|
|
|
| |||||||||||
Class C Shares | ||||||||||||||||||||
Proceeds from shares issued | 768,809 | 4,394,274 | 243,990 | 319,987 | 10,000 | |||||||||||||||
Dividends reinvested | 15,675 | 275,266 | 130,352 | 92,698 | – | |||||||||||||||
Cost of shares redeemed | (9,210,419 | ) | (12,204,447 | ) | (517,245 | ) | (489,511 | ) | – | |||||||||||
|
|
|
|
|
|
|
|
|
| |||||||||||
Total Class C | (8,425,935 | ) | (7,534,907 | ) | (142,903 | ) | (76,826 | ) | 10,000 | |||||||||||
|
|
|
|
|
|
|
|
|
| |||||||||||
Class R Shares | ||||||||||||||||||||
Proceeds from shares issued | 3,815,917 | 6,856,626 | 537,271 | 308,871 | 10,000 | |||||||||||||||
Dividends reinvested | 25,349 | 206,862 | 51,645 | 51,790 | 5 | |||||||||||||||
Cost of shares redeemed | (9,972,641 | ) | (7,366,078 | ) | (248,342 | ) | (515,973 | ) | – | |||||||||||
|
|
|
|
|
|
|
|
|
| |||||||||||
Total Class R | (6,131,375 | ) | (302,590 | ) | 340,574 | (155,312 | ) | 10,005 | ||||||||||||
|
|
|
|
|
|
|
|
|
| |||||||||||
Institutional Service Class Shares | ||||||||||||||||||||
Proceeds from shares issued | 8,867,501 | 43,974,126 | 7,085 | 702,784 | 10,000 | |||||||||||||||
Dividends reinvested | 494,160 | 3,785,630 | 80,469 | 157,784 | 9 | |||||||||||||||
Cost of shares redeemed | (62,712,882 | ) | (45,841,932 | ) | (1,287,799 | ) | (1,530,319 | ) | – | |||||||||||
|
|
|
|
|
|
|
|
|
| |||||||||||
Total Institutional Service Class | (53,351,221 | ) | 1,917,824 | (1,200,245 | ) | (669,751 | ) | 10,009 | ||||||||||||
|
|
|
|
|
|
|
|
|
| |||||||||||
Institutional Class Shares | ||||||||||||||||||||
Proceeds from shares issued | 54,535,342 | 93,817,549 | 2,252,064 | 4,894,321 | 960,000 | |||||||||||||||
Dividends reinvested | 1,096,585 | 10,464,649 | 3,107,449 | 11,579,955 | 827 | |||||||||||||||
Cost of shares redeemed | (103,997,641 | ) | (183,382,570 | ) | (32,575,314 | ) | (143,835,172 | ) | – | |||||||||||
|
|
|
|
|
|
|
|
|
| |||||||||||
Total Institutional Class | (48,365,714 | ) | (79,100,372 | ) | (27,215,801 | ) | (127,360,896 | ) | 960,827 | |||||||||||
|
|
|
|
|
|
|
|
|
| |||||||||||
Change in net assets from capital transactions: | $ | (158,316,614 | ) | $ | (120,887,487 | ) | $ | (28,808,504 | ) | $ | (132,879,015 | ) | $ | 1,011,847 | ||||||
|
|
|
|
|
|
|
|
|
| |||||||||||
| (a) | For the period from November 30, 2015 (commencement of operations) through October 31, 2016. |
Amounts listed as “–” are $0 or round to $0.
See accompanying Notes to Financial Statements.
Annual Report 2016
96
Statements of Changes in Net Assets (continued)
| Aberdeen International Equity Fund | Aberdeen International Small Cap Fund | Aberdeen Japanese Equities Fund | ||||||||||||||||||
| Year Ended October 31, 2016 | Year Ended October 31, 2015 | Year Ended October 31, 2016 | Year Ended October 31, 2015 | Period Ended October 31, 2016(a) | ||||||||||||||||
SHARE TRANSACTIONS: | ||||||||||||||||||||
Class A Shares | ||||||||||||||||||||
Issued | 2,075,542 | 1,367,259 | 99,041 | 94,982 | 2,013 | |||||||||||||||
Reinvested | 17,014 | 123,855 | 211,336 | 154,458 | 1 | |||||||||||||||
Redeemed | (5,674,695 | ) | (4,113,969 | ) | (326,163 | ) | (414,833 | ) | – | |||||||||||
|
|
|
|
|
|
|
|
|
| |||||||||||
Total Class A Shares | (3,582,139 | ) | (2,622,855 | ) | (15,786 | ) | (165,393 | ) | 2,014 | |||||||||||
|
|
|
|
|
|
|
|
|
| |||||||||||
Class C Shares | ||||||||||||||||||||
Issued | 67,584 | 327,993 | 10,073 | 11,981 | 1,000 | |||||||||||||||
Reinvested | 1,435 | 21,045 | 6,015 | 3,637 | – | |||||||||||||||
Redeemed | (809,232 | ) | (945,212 | ) | (22,955 | ) | (18,731 | ) | – | |||||||||||
|
|
|
|
|
|
|
|
|
| |||||||||||
Total Class C Shares | (740,213 | ) | (596,174 | ) | (6,867 | ) | (3,113 | ) | 1,000 | |||||||||||
|
|
|
|
|
|
|
|
|
| |||||||||||
Class R Shares | ||||||||||||||||||||
Issued | 349,780 | 530,191 | 22,015 | 11,280 | 1,000 | |||||||||||||||
Reinvested | 2,288 | 15,714 | 2,305 | 1,970 | – | |||||||||||||||
Redeemed | (898,467 | ) | (559,488 | ) | (10,229 | ) | (19,417 | ) | – | |||||||||||
|
|
|
|
|
|
|
|
|
| |||||||||||
Total Class R Shares | (546,399 | ) | (13,583 | ) | 14,091 | (6,167 | ) | 1,000 | ||||||||||||
|
|
|
|
|
|
|
|
|
| |||||||||||
Institutional Service Class Shares | ||||||||||||||||||||
Issued | 733,622 | 3,050,696 | 267 | 25,264 | 1,000 | |||||||||||||||
Reinvested | 41,807 | 268,876 | 3,433 | 5,768 | 1 | |||||||||||||||
Redeemed | (5,196,160 | ) | (3,285,914 | ) | (51,801 | ) | (54,734 | ) | – | |||||||||||
|
|
|
|
|
|
|
|
|
| |||||||||||
Total Institutional Service Class Shares | (4,420,731 | ) | 33,658 | (48,101 | ) | (23,702 | ) | 1,001 | ||||||||||||
|
|
|
|
|
|
|
|
|
| |||||||||||
Institutional Class Shares | ||||||||||||||||||||
Issued | 4,432,097 | 6,554,392 | 92,718 | 177,655 | 96,000 | |||||||||||||||
Reinvested | 92,461 | 740,959 | 132,684 | 422,082 | 85 | |||||||||||||||
Redeemed | (8,471,661 | ) | (13,988,851 | ) | (1,284,223 | ) | (5,180,832 | ) | – | |||||||||||
|
|
|
|
|
|
|
|
|
| |||||||||||
Total Institutional Class Shares | (3,947,103 | ) | (6,693,500 | ) | (1,058,821 | ) | (4,581,095 | ) | 96,085 | |||||||||||
|
|
|
|
|
|
|
|
|
| |||||||||||
Total change in shares: | (13,236,585 | ) | (9,892,454 | ) | (1,115,484 | ) | (4,779,470 | ) | 101,100 | |||||||||||
|
|
|
|
|
|
|
|
|
| |||||||||||
| (a) | For the period from November 30, 2015 (commencement of operations) through October 31, 2016. |
Amounts listed as “–” are $0 or round to $0.
See accompanying Notes to Financial Statements.
2016 Annual Report
97
Statements of Changes in Net Assets (continued)
| Aberdeen U.S. Mid Cap Equity Fund | Aberdeen U.S. Multi-Cap Equity Fund | Aberdeen U.S. Small Cap Equity Fund | ||||||||||||||||||||||
| Period Ended October 31, 2016(a) | Year Ended October 31, 2016 | Year Ended October 31, 2015 | Year Ended October 31, 2016 | Year Ended October 31, 2015 | ||||||||||||||||||||
FROM INVESTMENT ACTIVITIES: | ||||||||||||||||||||||||
Operations: | ||||||||||||||||||||||||
Net investment income/(loss) | $ | 2,335 | $ | 914,774 | $ | 3,650,930 | $ | (1,031,157 | ) | $ | (566,430 | ) | ||||||||||||
Net realized gain from investments and foreign currency transactions | 21,483 | 47,768,727 | 26,358,277 | 52,542,317 | 18,850,106 | |||||||||||||||||||
Net change in unrealized appreciation/(depreciation) on investments and translation of assets and liabilities denominated in foreign currencies | 72,618 | (40,899,885 | ) | (27,364,444 | ) | (18,311,897 | ) | 2,523,650 | ||||||||||||||||
|
|
|
|
|
|
|
|
|
| |||||||||||||||
Changes in net assets resulting from operations | 96,436 | 7,783,616 | 2,644,763 | 33,199,263 | 20,807,326 | |||||||||||||||||||
|
|
|
|
|
|
|
|
|
| |||||||||||||||
Distributions to Shareholders From: | ||||||||||||||||||||||||
Net investment income: | ||||||||||||||||||||||||
Class A | – | (377,830 | ) | (2,505,584 | ) | – | – | |||||||||||||||||
Class C | – | – | (24,330 | ) | – | – | ||||||||||||||||||
Class R | – | (543 | ) | (3,074 | ) | – | – | |||||||||||||||||
Institutional Service Class | – | (214,903 | ) | (1,278,061 | ) | – | – | |||||||||||||||||
Institutional Class | – | (15,558 | ) | (70,221 | ) | – | – | |||||||||||||||||
Net realized gains: | ||||||||||||||||||||||||
Class A | – | (11,902,823 | ) | (17,284,152 | ) | – | – | |||||||||||||||||
Class C | – | (366,439 | ) | (576,102 | ) | – | – | |||||||||||||||||
Class R | – | (24,769 | ) | (23,350 | ) | – | – | |||||||||||||||||
Institutional Service Class | – | (5,033,508 | ) | (7,660,936 | ) | – | – | |||||||||||||||||
Institutional Class | – | (325,415 | ) | (225,732 | ) | – | – | |||||||||||||||||
|
|
|
|
|
|
|
|
|
| |||||||||||||||
Change in net assets from shareholder distributions | – | (18,261,788 | ) | (29,651,542 | ) | – | – | |||||||||||||||||
|
|
|
|
|
|
|
|
|
| |||||||||||||||
Common Stock Transactions: | ||||||||||||||||||||||||
Change in net assets from capital transactions | 1,001,000 | (20,846,509 | ) | (18,905,686 | ) | 751,947,122 | 204,647,443 | |||||||||||||||||
|
|
|
|
|
|
|
|
|
| |||||||||||||||
Change in net assets | 1,097,436 | (31,324,681 | ) | (45,912,465 | ) | 785,146,385 | 225,454,769 | |||||||||||||||||
|
|
|
|
|
|
|
|
|
| |||||||||||||||
Net Assets: | ||||||||||||||||||||||||
Beginning of year | – | 371,488,447 | 417,400,912 | 359,773,296 | 134,318,527 | |||||||||||||||||||
|
|
|
|
|
|
|
|
|
| |||||||||||||||
End of year | $ | 1,097,436 | $ | 340,163,766 | $ | 371,488,447 | $ | 1,144,919,681 | $ | 359,773,296 | ||||||||||||||
|
|
|
|
|
|
|
|
|
| |||||||||||||||
Accumulated net investment income/(loss) at end of year | $ | 2,382 | $ | 582,068 | $ | 266,956 | $ | (1,581,355 | ) | $ | (650,591 | ) | ||||||||||||
|
|
|
|
|
|
|
|
|
| |||||||||||||||
| (a) | For the period from February 29, 2016 (commencement of operations) through October 31, 2016. |
Amounts listed as “–” are $0 or round to $0.
See accompanying Notes to Financial Statements.
Annual Report 2016
98
Statements of Changes in Net Assets (continued)
| Aberdeen U.S. Mid Cap Equity Fund | Aberdeen U.S. Multi-Cap Equity Fund | Aberdeen U.S. Small Cap Equity Fund | ||||||||||||||||||||||
| Period Ended October 31, 2016(a) | Year Ended October 31, 2016 | Year Ended October 31, 2015 | Year Ended October 31, 2016 | Year Ended October 31, 2015 | ||||||||||||||||||||
CAPITAL TRANSACTIONS: | ||||||||||||||||||||||||
Class A Shares | ||||||||||||||||||||||||
Proceeds from shares issued | $ | 11,000 | $ | 2,630,781 | $ | 2,707,890 | $ | 227,746,549 | $ | 16,952,916 | ||||||||||||||
Dividends reinvested | – | 11,221,671 | 18,131,210 | – | – | |||||||||||||||||||
Cost of shares redeemed | – | (28,392,609 | ) | (31,889,462 | ) | (47,729,228 | ) | (22,790,262 | ) | |||||||||||||||
|
|
|
|
|
|
|
|
|
| |||||||||||||||
Total Class A | 11,000 | (14,540,157 | ) | (11,050,362 | ) | 180,017,321 | (5,837,346 | ) | ||||||||||||||||
|
|
|
|
|
|
|
|
|
| |||||||||||||||
Class C Shares | ||||||||||||||||||||||||
Proceeds from shares issued | 10,000 | 227,349 | 468,052 | 47,256,350 | 5,625,655 | |||||||||||||||||||
Dividends reinvested | – | 202,196 | 314,566 | – | – | |||||||||||||||||||
Cost of shares redeemed | – | (1,397,791 | ) | (1,523,576 | ) | (7,552,388 | ) | (4,608,416 | ) | |||||||||||||||
|
|
|
|
|
|
|
|
|
| |||||||||||||||
Total Class C | 10,000 | (968,246 | ) | (740,958 | ) | 39,703,962 | 1,017,239 | |||||||||||||||||
|
|
|
|
|
|
|
|
|
|
|
| |||||||||||||
Class R Shares | ||||||||||||||||||||||||
Proceeds from shares issued | 10,000 | 89,376 | 179,165 | 11,136,893 | 4,042,095 | |||||||||||||||||||
Dividends reinvested | – | 11 | 746 | – | – | |||||||||||||||||||
Cost of shares redeemed | – | (250,111 | ) | (43,983 | ) | (2,788,520 | ) | (803,779 | ) | |||||||||||||||
|
|
|
|
|
|
|
|
|
| |||||||||||||||
Total Class R | 10,000 | (160,724 | ) | 135,928 | 8,348,373 | 3,238,316 | ||||||||||||||||||
|
|
|
|
|
|
|
|
|
| |||||||||||||||
Institutional Service Class Shares | ||||||||||||||||||||||||
Proceeds from shares issued | 10,000 | 1,161,701 | 1,215,725 | 54,259,256 | 7,503,260 | |||||||||||||||||||
Dividends reinvested | – | 5,105,142 | 8,700,314 | – | – | |||||||||||||||||||
Cost of shares redeemed | – | (11,290,046 | ) | (21,023,674 | ) | (17,874,597 | ) | (355,909 | ) | |||||||||||||||
|
|
|
|
|
|
|
|
|
| |||||||||||||||
Total Institutional Service Class | 10,000 | (5,023,203 | ) | (11,107,635 | ) | 36,384,659 | 7,147,351 | |||||||||||||||||
|
|
|
|
|
|
|
|
|
| |||||||||||||||
Institutional Class Shares | ||||||||||||||||||||||||
Proceeds from shares issued | 960,000 | 1,534,156 | 5,219,479 | 593,765,521 | 229,072,532 | |||||||||||||||||||
Dividends reinvested | – | 303,370 | 243,190 | – | – | |||||||||||||||||||
Cost of shares redeemed | – | (1,991,705 | ) | (1,605,328 | ) | (106,272,714 | ) | (29,990,649 | ) | |||||||||||||||
|
|
|
|
|
|
|
|
|
| |||||||||||||||
Total Institutional Class | 960,000 | (154,179 | ) | 3,857,341 | 487,492,807 | 199,081,883 | ||||||||||||||||||
|
|
|
|
|
|
|
|
|
| |||||||||||||||
Change in net assets from capital transactions: | $ | 1,001,000 | $ | (20,846,509 | ) | $ | (18,905,686 | ) | $ | 751,947,122 | $ | 204,647,443 | ||||||||||||
|
|
|
|
|
|
|
|
|
| |||||||||||||||
| (a) | For the period from February 29, 2016 (commencement of operations) through October 31, 2016. |
Amounts listed as “–” are $0 or round to $0.
See accompanying Notes to Financial Statements.
2016 Annual Report
99
Statements of Changes in Net Assets (concluded)
| Aberdeen U.S. Mid Cap Equity Fund | Aberdeen U.S. Multi-Cap Equity Fund | Aberdeen U.S. Small Cap Equity Fund | ||||||||||||||||||||||
| Period Ended October 31, 2016(a) | Year Ended October 31, 2016 | Year Ended October 31, 2015 | Year Ended October 31, 2016 | Year Ended October 31, 2015 | ||||||||||||||||||||
SHARE TRANSACTIONS: | ||||||||||||||||||||||||
Class A Shares | ||||||||||||||||||||||||
Issued | 1,087 | 225,383 | 211,670 | 7,902,280 | 668,104 | |||||||||||||||||||
Reinvested | – | 984,357 | 1,407,017 | – | – | |||||||||||||||||||
Redeemed | – | (2,379,388 | ) | (2,496,108 | ) | (1,679,187 | ) | (896,625 | ) | |||||||||||||||
|
|
|
|
|
|
|
|
|
| |||||||||||||||
Total Class A Shares | 1,087 | (1,169,648 | ) | (877,421 | ) | 6,223,093 | (228,521 | ) | ||||||||||||||||
|
|
|
|
|
|
|
|
|
| |||||||||||||||
Class C Shares | ||||||||||||||||||||||||
Issued | 1,000 | 21,448 | 39,644 | 1,896,422 | 247,305 | |||||||||||||||||||
Reinvested | – | 19,574 | 26,739 | – | – | |||||||||||||||||||
Redeemed | – | (128,581 | ) | (129,686 | ) | (307,606 | ) | (205,378 | ) | |||||||||||||||
|
|
|
|
|
|
|
|
|
| |||||||||||||||
Total Class C Shares | 1,000 | (87,559 | ) | (63,303 | ) | 1,588,816 | 41,927 | |||||||||||||||||
|
|
|
|
|
|
|
|
|
| |||||||||||||||
Class R Shares | ||||||||||||||||||||||||
Issued | 1,000 | 7,806 | 14,533 | 435,778 | 167,201 | |||||||||||||||||||
Reinvested | – | 1 | 60 | – | – | |||||||||||||||||||
Redeemed | – | (23,035 | ) | (3,561 | ) | (106,850 | ) | (33,203 | ) | |||||||||||||||
|
|
|
|
|
|
|
|
|
| |||||||||||||||
Total Class R Shares | 1,000 | (15,228 | ) | 11,032 | 328,928 | 133,998 | ||||||||||||||||||
|
|
|
|
|
|
|
|
|
| |||||||||||||||
Institutional Service Class Shares | ||||||||||||||||||||||||
Issued | 1,000 | 91,476 | 89,704 | 1,859,960 | 274,390 | |||||||||||||||||||
Reinvested | – | 427,208 | 646,288 | – | – | |||||||||||||||||||
Redeemed | – | (892,439 | ) | (1,567,694 | ) | (614,501 | ) | (13,285 | ) | |||||||||||||||
|
|
|
|
|
|
|
|
|
| |||||||||||||||
Total Institutional Service Class Shares | 1,000 | (373,755 | ) | (831,702 | ) | 1,245,459 | 261,105 | |||||||||||||||||
|
|
|
|
|
|
|
|
|
| |||||||||||||||
Institutional Class Shares | ||||||||||||||||||||||||
Issued | 96,000 | 124,587 | 397,483 | 19,876,666 | 8,460,001 | |||||||||||||||||||
Reinvested | – | 25,366 | 18,101 | – | – | |||||||||||||||||||
Redeemed | – | (160,107 | ) | (122,665 | ) | (3,571,621 | ) | (1,111,789 | ) | |||||||||||||||
|
|
|
|
|
|
|
|
|
| |||||||||||||||
Total Institutional Class Shares | 96,000 | (10,154 | ) | 292,919 | 16,305,045 | 7,348,212 | ||||||||||||||||||
|
|
|
|
|
|
|
|
|
| |||||||||||||||
Total change in shares: | 100,087 | (1,656,344 | ) | (1,468,475 | ) | 25,691,341 | 7,556,721 | |||||||||||||||||
|
|
|
|
|
|
|
|
|
| |||||||||||||||
| (a) | For the period from February 29, 2016 (commencement of operations) through October 31, 2016. |
Amounts listed as “–” are $0 or round to $0.
See accompanying Notes to Financial Statements.
Annual Report 2016
100
Financial Highlights
Selected Data for Each Share of Capital Outstanding Throughout the Periods Indicated
Aberdeen Asia-Pacific (ex-Japan) Equity Fund
| Investment Activities | Distributions | |||||||||||||||||||||||||||||||||||
| Net Asset Value, Beginning of Period | Net Investment Income (a) | Net Realized and Unrealized Gains (Losses) on Investments | Total from Investment Activities | Net Investment Income | Net Realized Gains | Total Distributions | Redemption Fees | Net Asset Value, End of Period | ||||||||||||||||||||||||||||
Class A Shares | ||||||||||||||||||||||||||||||||||||
Year Ended October 31, 2016 | $ | 10.04 | $ | 0.18 | (g) | $ | 0.48 | $ | 0.66 | $ | (0.21 | ) | $ | – | $ | (0.21 | ) | $ | – | $ | 10.49 | |||||||||||||||
Year Ended October 31, 2015 | 12.08 | 0.14 | (1.68 | ) | (1.54 | ) | (0.30 | ) | (0.20 | ) | (0.50 | ) | – | 10.04 | ||||||||||||||||||||||
Year Ended October 31, 2014 | 12.01 | 0.14 | 0.15 | 0.29 | (0.15 | ) | (0.07 | ) | (0.22 | ) | – | 12.08 | ||||||||||||||||||||||||
Year Ended October 31, 2013 | 11.73 | 0.17 | 0.54 | 0.71 | (0.27 | ) | (0.16 | ) | (0.43 | ) | – | 12.01 | ||||||||||||||||||||||||
Period Ended October 31, 2012(i) | 11.26 | 0.01 | 0.46 | 0.47 | – | – | – | – | 11.73 | |||||||||||||||||||||||||||
Class C Shares | ||||||||||||||||||||||||||||||||||||
Year Ended October 31, 2016 | 10.01 | 0.12 | (g) | 0.44 | 0.56 | (0.19 | ) | – | (0.19 | ) | – | �� | 10.38 | |||||||||||||||||||||||
Year Ended October 31, 2015 | 12.05 | 0.07 | (1.67 | ) | (1.60 | ) | (0.24 | ) | (0.20 | ) | (0.44 | ) | – | 10.01 | ||||||||||||||||||||||
Year Ended October 31, 2014 | 12.00 | 0.05 | 0.15 | 0.20 | (0.08 | ) | (0.07 | ) | (0.15 | ) | – | 12.05 | ||||||||||||||||||||||||
Year Ended October 31, 2013 | 11.66 | 0.13 | 0.50 | 0.63 | (0.13 | ) | (0.16 | ) | (0.29 | ) | – | 12.00 | ||||||||||||||||||||||||
Period Ended October 31, 2012(i) | 11.26 | 0.12 | 0.28 | 0.40 | – | – | – | – | 11.66 | |||||||||||||||||||||||||||
Class R Shares | ||||||||||||||||||||||||||||||||||||
Year Ended October 31, 2016 | 10.02 | 0.16 | (g) | 0.48 | 0.64 | (0.21 | ) | – | (0.21 | ) | – | 10.45 | ||||||||||||||||||||||||
Year Ended October 31, 2015 | 12.07 | 0.15 | (1.72 | ) | (1.57 | ) | (0.28 | ) | (0.20 | ) | (0.48 | ) | – | 10.02 | ||||||||||||||||||||||
Year Ended October 31, 2014 | 12.02 | 0.05 | 0.20 | 0.25 | (0.13 | ) | (0.07 | ) | (0.20 | ) | – | 12.07 | ||||||||||||||||||||||||
Year Ended October 31, 2013 | 11.70 | 0.18 | 0.51 | 0.69 | (0.21 | ) | (0.16 | ) | (0.37 | ) | – | 12.02 | ||||||||||||||||||||||||
Period Ended October 31, 2012(i) | 11.26 | 0.15 | 0.29 | 0.44 | – | – | – | – | 11.70 | |||||||||||||||||||||||||||
Institutional Service Class Shares |
| |||||||||||||||||||||||||||||||||||
Year Ended October 31, 2016 | 10.06 | 0.21 | (g) | 0.47 | 0.68 | (0.21 | ) | – | (0.21 | ) | – | 10.53 | ||||||||||||||||||||||||
Year Ended October 31, 2015 | 12.10 | 0.17 | (1.69 | ) | (1.52 | ) | (0.32 | ) | (0.20 | ) | (0.52 | ) | – | 10.06 | ||||||||||||||||||||||
Year Ended October 31, 2014 | 12.03 | 0.17 | 0.14 | 0.31 | (0.17 | ) | (0.07 | ) | (0.24 | ) | – | 12.10 | ||||||||||||||||||||||||
Year Ended October 31, 2013 | 11.73 | 0.16 | 0.58 | 0.74 | (0.28 | ) | (0.16 | ) | (0.44 | ) | – | 12.03 | ||||||||||||||||||||||||
Year Ended October 31, 2012 | 11.34 | 0.22 | 0.96 | 1.18 | (0.23 | ) | (0.56 | ) | (0.79 | ) | – | 11.73 | ||||||||||||||||||||||||
Institutional Class Shares | ||||||||||||||||||||||||||||||||||||
Year Ended October 31, 2016 | 10.07 | 0.05 | (g) | 0.62 | 0.67 | (0.21 | ) | – | (0.21 | ) | – | 10.53 | ||||||||||||||||||||||||
Year Ended October 31, 2015 | 12.11 | 0.21 | (1.72 | ) | (1.51 | ) | (0.33 | ) | (0.20 | ) | (0.53 | ) | – | 10.07 | ||||||||||||||||||||||
Year Ended October 31, 2014 | 12.04 | 0.16 | 0.16 | 0.32 | (0.18 | ) | (0.07 | ) | (0.25 | ) | – | 12.11 | ||||||||||||||||||||||||
Year Ended October 31, 2013 | 11.74 | 0.19 | 0.56 | 0.75 | (0.29 | ) | (0.16 | ) | (0.45 | ) | – | 12.04 | ||||||||||||||||||||||||
Year Ended October 31, 2012 | 11.34 | 0.22 | 0.97 | 1.19 | (0.23 | ) | (0.56 | ) | (0.79 | ) | – | 11.74 | ||||||||||||||||||||||||
| (a) | Net investment income/(loss) is based on average shares outstanding during the period. |
| (b) | Excludes sales charge. |
| (c) | Not annualized for periods less than one year. |
| (d) | Annualized for periods less than one year. |
| (e) | During the period, certain fees were waived and/or reimbursed. If such waivers/reimbursements had not occurred, the ratios would have been as indicated. |
Amounts listed as “–” are $0 or round to $0.
See accompanying Notes to Financial Statements.
2016 Annual Report
101
Financial Highlights (continued)
Selected Data for Each Share of Capital Outstanding Throughout the Periods Indicated
Aberdeen Asia-Pacific (ex-Japan) Equity Fund (concluded)
| Ratios/Supplemental Data | ||||||||||||||||||||||
| Total Return (b)(c) | Net Assets at End of Period (000’s) | Ratio of Expenses (Net of Reimbursements/Waivers) to Average Net Assets (d) | Ratio of Net Investment Income to Average Net Assets (d) | Ratio of Expenses (Prior to Reimbursements) to Average Net Assets (d)(e) | Portfolio Turnover (f) | |||||||||||||||||
| 6.86 | %(g) | $ | 748 | 1.54 | %(h) | 1.88 | %(g) | 1.70 | %(h) | 39.84 | % | |||||||||||
| (12.94 | %) | 815 | 1.51 | %(h) | 1.21 | % | 1.52 | %(h) | 58.06 | % | ||||||||||||
| 2.43 | % | 1,173 | 1.50 | % | 1.21 | % | 1.52 | % | 36.48 | % | ||||||||||||
| 6.12 | % | 1,328 | 1.50 | % | 1.43 | % | 1.51 | % | 3.33 | % | ||||||||||||
| 4.17 | % | 327 | 1.45 | % | 0.19 | % | 1.46 | % | 21.73 | % | ||||||||||||
| 5.90 | %(g) | 58 | 2.26 | %(h) | 1.24 | %(g) | 2.44 | %(h) | 39.84 | % | ||||||||||||
| (13.42 | %) | 280 | 2.26 | %(h) | 0.66 | % | 2.27 | %(h) | 58.06 | % | ||||||||||||
| 1.67 | % | 288 | 2.25 | % | 0.46 | % | 2.27 | % | 36.48 | % | ||||||||||||
| 5.47 | % | 146 | 2.25 | % | 1.09 | % | 2.26 | % | 3.33 | % | ||||||||||||
| 3.55 | % | 10 | 2.18 | % | 1.56 | % | 2.19 | % | 21.73 | % | ||||||||||||
| 6.63 | %(g) | 10 | 1.76 | %(h) | 1.68 | %(g) | 1.92 | %(h) | 39.84 | % | ||||||||||||
| (13.17 | %) | 10 | 1.76 | %(h) | 1.30 | % | 1.77 | %(h) | 58.06 | % | ||||||||||||
| 2.06 | % | 11 | 1.76 | % | 0.40 | % | 1.78 | % | 36.48 | % | ||||||||||||
| 5.97 | % | 36 | 1.75 | % | 1.50 | % | 1.76 | % | 3.33 | % | ||||||||||||
| 3.91 | % | 10 | 1.69 | % | 2.05 | % | 1.70 | % | 21.73 | % | ||||||||||||
| 7.08 | %(g) | 4,291 | 1.28 | %(h) | 2.14 | %(g) | 1.44 | %(h) | 39.84 | % | ||||||||||||
| (12.73 | %) | 4,017 | 1.29 | %(h) | 1.54 | % | 1.30 | %(h) | 58.06 | % | ||||||||||||
| 2.59 | % | 3,950 | 1.30 | % | 1.45 | % | 1.32 | % | 36.48 | % | ||||||||||||
| 6.44 | % | 3,841 | 1.28 | % | 1.35 | % | 1.29 | % | 3.33 | % | ||||||||||||
| 11.83 | % | 3,717 | 1.24 | % | 2.00 | % | 1.25 | % | 21.73 | % | ||||||||||||
| 6.97 | %(g) | 9,558 | 1.26 | %(h) | 0.57 | %(g) | 1.43 | %(h) | 39.84 | % | ||||||||||||
| (12.68 | %) | 263,176 | 1.26 | %(h) | 1.83 | % | 1.27 | %(h) | 58.06 | % | ||||||||||||
| 2.64 | % | 1,069,989 | 1.25 | % | 1.32 | % | 1.27 | % | 36.48 | % | ||||||||||||
| 6.48 | % | 1,004,859 | 1.25 | % | 1.59 | % | 1.26 | % | 3.33 | % | ||||||||||||
| 11.92 | % | 617,471 | 1.22 | % | 2.01 | % | 1.23 | % | 21.73 | % | ||||||||||||
| (f) | Portfolio turnover is calculated on the basis of the Fund as a whole without distinguishing among the classes of shares. |
| (g) | Included within Net Investment Income per share, Total Return, and Ratio of Net Investment Income to Average Net Assets are the effects of a one-time reimbursement for overbilling of prior years’ custodian out-of-pocket fees. If such amounts were excluded, Net Investment Income per share would be reduced by $0.02, $0.01, $0.01, $0.02 and $0.02, Total Return would be reduced by 0.21%, 0.10%, 0.10%, 0.20% and 0.20%, and Ratio of Net Investment Income to Average Net Assets would be reduced by 0.14%, 0.05%, 0.16%, 0.16% and 0.02% for Class A, Class C, Class R, Institutional Service Class and Institutional Class, respectively. |
| (h) | Includes interest expense that amounts to less than 0.01%. |
| (i) | For the period from February 28, 2012 (commencement of operations) through October 31, 2012. |
Annual Report 2016
102
Financial Highlights (continued)
Selected Data for Each Share of Capital Outstanding Throughout the Periods Indicated
Aberdeen China Opportunities Fund
| Investment Activities | Distributions | |||||||||||||||||||||||||||||||
| Net Asset Value, Beginning of Period | Net Investment Income (Loss) (a) | Net Realized | Total from Investment Activities | Net Investment Income | Total Distributions | Redemption Fees | Net Asset Value, End of Period | |||||||||||||||||||||||||
Class A Shares | ||||||||||||||||||||||||||||||||
Year Ended October 31, 2016 | $ | 17.94 | $ | 0.19 | $ | 0.33 | $ | 0.52 | $ | – | $ | – | $ | – | $ | 18.46 | ||||||||||||||||
Year Ended October 31, 2015 | 20.19 | 0.22 | (2.14 | ) | (1.92 | ) | (0.33 | ) | (0.33 | ) | – | 17.94 | ||||||||||||||||||||
Year Ended October 31, 2014 | 20.54 | 0.16 | (0.33 | ) | (0.17 | ) | (0.18 | ) | (0.18 | ) | – | 20.19 | ||||||||||||||||||||
Year Ended October 31, 2013 | 19.64 | 0.15 | 0.82 | 0.97 | (0.08 | ) | (0.08 | ) | 0.01 | 20.54 | ||||||||||||||||||||||
Year Ended October 31, 2012 | 18.81 | 0.35 | 0.88 | 1.23 | (0.41 | ) | (0.41 | ) | 0.01 | 19.64 | ||||||||||||||||||||||
Class C Shares | ||||||||||||||||||||||||||||||||
Year Ended October 31, 2016 | 17.26 | 0.06 | 0.32 | 0.38 | – | – | – | 17.64 | ||||||||||||||||||||||||
Year Ended October 31, 2015 | 19.50 | 0.18 | (2.17 | ) | (1.99 | ) | (0.25 | ) | (0.25 | ) | – | 17.26 | ||||||||||||||||||||
Year Ended October 31, 2014 | 19.87 | 0.01 | (0.32 | ) | (0.31 | ) | (0.06 | ) | (0.06 | ) | – | 19.50 | ||||||||||||||||||||
Year Ended October 31, 2013 | 19.09 | (0.01 | ) | 0.81 | 0.80 | (0.02 | ) | (0.02 | ) | – | 19.87 | |||||||||||||||||||||
Year Ended October 31, 2012 | 18.30 | 0.19 | 0.87 | 1.06 | (0.28 | ) | (0.28 | ) | 0.01 | 19.09 | ||||||||||||||||||||||
Class R Shares | ||||||||||||||||||||||||||||||||
Year Ended October 31, 2016 | 17.68 | 0.16 | 0.29 | 0.45 | – | – | – | 18.13 | ||||||||||||||||||||||||
Year Ended October 31, 2015 | 19.92 | 0.23 | (2.19 | ) | (1.96 | ) | (0.28 | ) | (0.28 | ) | – | 17.68 | ||||||||||||||||||||
Year Ended October 31, 2014 | 20.29 | 0.10 | (0.35 | ) | (0.25 | ) | (0.12 | ) | (0.12 | ) | – | 19.92 | ||||||||||||||||||||
Year Ended October 31, 2013 | 19.43 | 0.10 | 0.79 | 0.89 | (0.03 | ) | (0.03 | ) | – | 20.29 | ||||||||||||||||||||||
Year Ended October 31, 2012 | 18.62 | 0.26 | 0.89 | 1.15 | (0.35 | ) | (0.35 | ) | 0.01 | 19.43 | ||||||||||||||||||||||
Institutional Service Class Shares | ||||||||||||||||||||||||||||||||
Year Ended October 31, 2016 | 18.00 | 0.22 | 0.33 | 0.55 | – | – | – | 18.55 | ||||||||||||||||||||||||
Year Ended October 31, 2015 | 20.28 | 0.30 | (2.18 | ) | (1.88 | ) | (0.40 | ) | (0.40 | ) | – | 18.00 | ||||||||||||||||||||
Year Ended October 31, 2014 | 20.62 | 0.21 | (0.33 | ) | (0.12 | ) | (0.22 | ) | (0.22 | ) | – | 20.28 | ||||||||||||||||||||
Year Ended October 31, 2013 | 19.72 | 0.18 | 0.84 | 1.02 | (0.13 | ) | (0.13 | ) | 0.01 | 20.62 | ||||||||||||||||||||||
Year Ended October 31, 2012 | 18.88 | 0.38 | 0.91 | 1.29 | (0.46 | ) | (0.46 | ) | 0.01 | 19.72 | ||||||||||||||||||||||
Institutional Class Shares | ||||||||||||||||||||||||||||||||
Year Ended October 31, 2016 | 18.00 | 0.26 | 0.32 | 0.58 | – | – | – | 18.58 | ||||||||||||||||||||||||
Year Ended October 31, 2015 | 20.28 | 0.35 | (2.23 | ) | (1.88 | ) | (0.40 | ) | (0.40 | ) | – | 18.00 | ||||||||||||||||||||
Year Ended October 31, 2014 | 20.64 | 0.25 | (0.38 | ) | (0.13 | ) | (0.23 | ) | (0.23 | ) | – | 20.28 | ||||||||||||||||||||
Year Ended October 31, 2013 | 19.74 | 0.19 | 0.83 | 1.02 | (0.13 | ) | (0.13 | ) | 0.01 | 20.64 | ||||||||||||||||||||||
Year Ended October 31, 2012 | 18.90 | 0.39 | 0.90 | 1.29 | (0.46 | ) | (0.46 | ) | 0.01 | 19.74 | ||||||||||||||||||||||
| (a) | Net investment income/(loss) is based on average shares outstanding during the period. |
| (b) | Excludes sales charge. |
| (c) | During the period, certain fees were waived and/or reimbursed. If such waivers/reimbursements had not occurred, the ratios would have been as indicated. |
Amounts listed as “–” are $0 or round to $0.
See accompanying Notes to Financial Statements.
2016 Annual Report
103
Financial Highlights (continued)
Selected Data for Each Share of Capital Outstanding Throughout the Periods Indicated
Aberdeen China Opportunities Fund (concluded)
| Ratios/Supplemental Data | ||||||||||||||||||||||
| Total Return (b) | Net Assets at End of Period (000’s) | Ratio of Expenses (Net of Reimbursements/Waivers) to Average Net Assets | Ratio of Net Investment Income (Loss) to Average Net Assets | Ratio of Expenses (Prior to Reimbursements) to Average Net Assets (c) | Portfolio Turnover (d) | |||||||||||||||||
| 2.90 | % | $ | 7,301 | 1.95 | %(e) | 1.10 | % | 2.84 | %(e) | 15.75 | % | |||||||||||
| (9.50 | %) | 8,221 | 1.89 | %(e) | 1.12 | % | 2.48 | %(e) | 10.48 | % | ||||||||||||
| (0.82 | %) | 19,425 | 1.89 | % | 0.79 | % | 2.30 | % | 30.61 | % | ||||||||||||
| 4.98 | % | 21,682 | 1.89 | % | 0.71 | % | 2.18 | % | 14.51 | % | ||||||||||||
| 6.68 | % | 21,882 | 1.90 | % | 1.81 | % | 2.13 | % | 21.42 | % | ||||||||||||
| 2.20 | % | 3,609 | 2.62 | %(e) | 0.37 | % | 3.60 | %(e) | 15.75 | % | ||||||||||||
| (10.18 | %) | 4,711 | 2.62 | %(e) | 0.95 | % | 3.21 | %(e) | 10.48 | % | ||||||||||||
| (1.57 | %) | 6,064 | 2.62 | % | 0.04 | % | 3.03 | % | 30.61 | % | ||||||||||||
| 4.18 | % | 7,704 | 2.62 | % | (0.06 | %) | 2.91 | % | 14.51 | % | ||||||||||||
| 5.90 | % | 9,164 | 2.62 | % | 1.02 | % | 2.85 | % | 21.42 | % | ||||||||||||
| 2.55 | % | 1,378 | 2.28 | %(e) | 0.95 | % | 3.17 | %(e) | 15.75 | % | ||||||||||||
| (9.83 | %) | 1,293 | 2.29 | %(e) | 1.20 | % | 2.88 | %(e) | 10.48 | % | ||||||||||||
| (1.25 | %) | 1,495 | 2.27 | % | 0.50 | % | 2.68 | % | 30.61 | % | ||||||||||||
| 4.61 | % | 1,599 | 2.25 | % | 0.47 | % | 2.54 | % | 14.51 | % | ||||||||||||
| 6.32 | % | 1,225 | 2.24 | % | 1.36 | % | 2.47 | % | 21.42 | % | ||||||||||||
| 3.06 | % | 735 | 1.79 | %(e) | 1.29 | % | 2.68 | %(e) | 15.75 | % | ||||||||||||
| (9.30 | %) | 825 | 1.63 | %(e) | 1.53 | % | 2.22 | %(e) | 10.48 | % | ||||||||||||
| (0.56 | %) | 1,778 | 1.64 | % | 1.05 | % | 2.05 | % | 30.61 | % | ||||||||||||
| 5.22 | % | 2,383 | 1.62 | % | 0.88 | % | 1.91 | % | 14.51 | % | ||||||||||||
| 6.99 | % | 4,529 | 1.62 | % | 1.99 | % | 1.85 | % | 21.42 | % | ||||||||||||
| 3.22 | % | 1,575 | 1.62 | %(e) | 1.47 | % | 2.56 | %(e) | 15.75 | % | ||||||||||||
| (9.27 | %) | 1,804 | 1.63 | %(e) | 1.80 | % | 2.22 | %(e) | 10.48 | % | ||||||||||||
| (0.65 | %) | 1,604 | 1.62 | % | 1.23 | % | 2.03 | % | 30.61 | % | ||||||||||||
| 5.22 | % | 1,250 | 1.62 | % | 0.90 | % | 1.91 | % | 14.51 | % | ||||||||||||
| 6.99 | % | 1,683 | 1.62 | % | 2.01 | % | 1.85 | % | 21.42 | % | ||||||||||||
| (d) | Portfolio turnover is calculated on the basis of the Fund as a whole without distinguishing among the classes of shares. |
| (e) | Includes interest expense that amounts to less than 0.01%. |
Annual Report 2016
104
Financial Highlights (continued)
Selected Data for Each Share of Capital Outstanding Throughout the Periods Indicated
Aberdeen Emerging Markets Fund
| Investment Activities | Distributions | |||||||||||||||||||||||||||||||
| Net Asset Value, Beginning of Period | Net Investment Income (a) | Net Realized and Unrealized Gains (Losses) on Investments | Total from Investment Activities | Net Investment Income | Net Realized Gains | Total Distributions | Net Asset Value, End of Period | |||||||||||||||||||||||||
Class A Shares | ||||||||||||||||||||||||||||||||
Year Ended October 31, 2016 | $ | 12.22 | $ | 0.11 | $ | 1.33 | $ | 1.44 | $ | – | (g) | $ | (0.13 | ) | $ | (0.13 | ) | $ | 13.53 | |||||||||||||
Year Ended October 31, 2015 | 14.88 | 0.11 | (2.20 | ) | (2.09 | ) | (0.13 | ) | (0.44 | ) | (0.57 | ) | 12.22 | |||||||||||||||||||
Year Ended October 31, 2014 | 15.30 | 0.16 | (0.37 | ) | (0.21 | ) | (0.21 | ) | – | (0.21 | ) | 14.88 | ||||||||||||||||||||
Year Ended October 31, 2013 | 15.00 | 0.17 | 0.36 | 0.53 | (0.23 | ) | – | (0.23 | ) | 15.30 | ||||||||||||||||||||||
Period Ended October 31, 2012(i) | 13.07 | 0.09 | 1.84 | 1.93 | – | – | – | 15.00 | ||||||||||||||||||||||||
Class C Shares | ||||||||||||||||||||||||||||||||
Year Ended October 31, 2016 | 12.14 | 0.03 | 1.31 | 1.34 | – | (0.13 | ) | (0.13 | ) | 13.35 | ||||||||||||||||||||||
Year Ended October 31, 2015 | 14.79 | 0.02 | (2.17 | ) | (2.15 | ) | (0.06 | ) | (0.44 | ) | (0.50 | ) | 12.14 | |||||||||||||||||||
Year Ended October 31, 2014 | 15.23 | 0.05 | (0.36 | ) | (0.31 | ) | (0.13 | ) | – | (0.13 | ) | 14.79 | ||||||||||||||||||||
Year Ended October 31, 2013 | 14.95 | 0.09 | 0.34 | 0.43 | (0.15 | ) | – | (0.15 | ) | 15.23 | ||||||||||||||||||||||
Period Ended October 31, 2012(i) | 13.07 | 0.05 | 1.83 | 1.88 | – | – | – | 14.95 | ||||||||||||||||||||||||
Class R Shares | ||||||||||||||||||||||||||||||||
Year Ended October 31, 2016 | 12.17 | 0.08 | 1.31 | 1.39 | – | (0.13 | ) | (0.13 | ) | 13.43 | ||||||||||||||||||||||
Year Ended October 31, 2015 | 14.83 | 0.06 | (2.19 | ) | (2.13 | ) | (0.09 | ) | (0.44 | ) | (0.53 | ) | 12.17 | |||||||||||||||||||
Year Ended October 31, 2014 | 15.27 | 0.11 | (0.38 | ) | (0.27 | ) | (0.17 | ) | – | (0.17 | ) | 14.83 | ||||||||||||||||||||
Year Ended October 31, 2013 | 14.98 | 0.14 | 0.35 | 0.49 | (0.20 | ) | – | (0.20 | ) | 15.27 | ||||||||||||||||||||||
Period Ended October 31, 2012(i) | 13.07 | 0.08 | 1.83 | 1.91 | – | – | – | 14.98 | ||||||||||||||||||||||||
Institutional Service Class Shares | ||||||||||||||||||||||||||||||||
Year Ended October 31, 2016 | 12.22 | 0.14 | 1.33 | 1.47 | (0.01 | ) | (0.13 | ) | (0.14 | ) | 13.55 | |||||||||||||||||||||
Year Ended October 31, 2015 | 14.89 | 0.18 | (2.25 | ) | (2.07 | ) | (0.16 | ) | (0.44 | ) | (0.60 | ) | 12.22 | |||||||||||||||||||
Year Ended October 31, 2014 | 15.30 | 0.13 | (0.33 | ) | (0.20 | ) | (0.21 | ) | – | (0.21 | ) | 14.89 | ||||||||||||||||||||
Year Ended October 31, 2013 | 14.99 | 0.19 | 0.35 | 0.54 | (0.23 | ) | – | (0.23 | ) | 15.30 | ||||||||||||||||||||||
Year Ended October 31, 2012 | 13.68 | 0.18 | 1.40 | 1.58 | (0.15 | ) | (0.12 | ) | (0.27 | ) | 14.99 | |||||||||||||||||||||
Institutional Class Shares | ||||||||||||||||||||||||||||||||
Year Ended October 31, 2016 | 12.24 | 0.16 | 1.33 | 1.49 | (0.02 | ) | (0.13 | ) | (0.15 | ) | 13.58 | |||||||||||||||||||||
Year Ended October 31, 2015 | 14.90 | 0.16 | (2.20 | ) | (2.04 | ) | (0.18 | ) | (0.44 | ) | (0.62 | ) | 12.24 | |||||||||||||||||||
Year Ended October 31, 2014 | 15.31 | 0.20 | (0.35 | ) | (0.15 | ) | (0.26 | ) | – | (0.26 | ) | 14.90 | ||||||||||||||||||||
Year Ended October 31, 2013 | 15.02 | 0.22 | 0.36 | 0.58 | (0.29 | ) | – | (0.29 | ) | 15.31 | ||||||||||||||||||||||
Year Ended October 31, 2012 | 13.70 | 0.22 | 1.40 | 1.62 | (0.18 | ) | (0.12 | ) | (0.30 | ) | 15.02 | |||||||||||||||||||||
| (a) | Net investment income/(loss) is based on average shares outstanding during the period. |
| (b) | Excludes sales charge. |
| (c) | Not annualized for periods less than one year. |
| (d) | Annualized for periods less than one year. |
| (e) | During the period, certain fees were waived and/or reimbursed. If such waivers/reimbursements had not occurred, the ratios would have been as indicated. |
Amounts listed as “–” are $0 or round to $0.
See accompanying Notes to Financial Statements.
2016 Annual Report
105
Financial Highlights (continued)
Selected Data for Each Share of Capital Outstanding Throughout the Periods Indicated
Aberdeen Emerging Markets Fund (concluded)
Ratios/Supplemental Data | ||||||||||||||||||||||
| Total Return (b)(c) | Net Assets at End of Period (000’s) | Ratio of Expenses (Net of Reimbursements/Waivers) to Average Net Assets (d) | Ratio of Net Investment Income to Average Net Assets (d) | Ratio of Expenses (Prior to Reimbursements) to Average Net Assets (d)(e) | Portfolio Turnover (f) | |||||||||||||||||
| 12.04 | % | $ | 188,315 | 1.48 | %(h) | 0.91 | % | 1.49 | %(h) | 9.19 | % | |||||||||||
| (14.28 | %) | 192,039 | 1.44 | %(h) | 0.81 | % | 1.47 | %(h) | 11.58 | % | ||||||||||||
| (1.37 | %) | 341,483 | 1.41 | % | 1.05 | % | 1.43 | % | 5.00 | % | ||||||||||||
| 3.50 | % | 417,896 | 1.43 | % | 1.13 | % | 1.43 | % | 2.79 | % | ||||||||||||
| 14.77 | % | 274,047 | 1.40 | % | 1.46 | % | 1.40 | % | 1.14 | % | ||||||||||||
| 11.26 | % | 25,054 | 2.10 | %(h) | 0.28 | % | 2.20 | %(h) | 9.19 | % | ||||||||||||
| (14.80 | %) | 30,850 | 2.10 | %(h) | 0.17 | % | 2.13 | %(h) | 11.58 | % | ||||||||||||
| (2.04 | %) | 45,077 | 2.10 | % | 0.36 | % | 2.12 | % | 5.00 | % | ||||||||||||
| 2.85 | % | 49,826 | 2.10 | % | 0.60 | % | 2.10 | % | 2.79 | % | ||||||||||||
| 14.38 | % | 19,328 | 2.09 | % | 0.77 | % | 2.09 | % | 1.14 | % | ||||||||||||
| 11.65 | % | 47,410 | 1.77 | %(h) | 0.69 | % | 1.78 | %(h) | 9.19 | % | ||||||||||||
| (14.59 | %) | 33,881 | 1.83 | %(h) | 0.46 | % | 1.86 | %(h) | 11.58 | % | ||||||||||||
| (1.76 | %) | 31,720 | 1.79 | % | 0.76 | % | 1.81 | % | 5.00 | % | ||||||||||||
| 3.26 | % | 22,968 | 1.74 | % | 0.90 | % | 1.74 | % | 2.79 | % | ||||||||||||
| 14.61 | % | 8,811 | 1.64 | % | 1.19 | % | 1.64 | % | 1.14 | % | ||||||||||||
| 12.25 | % | 333,964 | 1.28 | %(h) | 1.13 | % | 1.29 | %(h) | 9.19 | % | ||||||||||||
| (14.20 | %) | 409,406 | 1.32 | %(h) | 1.35 | % | 1.35 | %(h) | 11.58 | % | ||||||||||||
| (1.29 | %) | 234,846 | 1.34 | % | 0.90 | % | 1.36 | % | 5.00 | % | ||||||||||||
| 3.61 | % | 443,469 | 1.35 | % | 1.22 | % | 1.35 | % | 2.79 | % | ||||||||||||
| 11.94 | % | 298,472 | 1.29 | % | 1.31 | % | 1.29 | % | 1.14 | % | ||||||||||||
| 12.41 | %(j) | 7,365,757 | 1.10 | %(h) | 1.32 | % | 1.14 | %(h) | 9.19 | % | ||||||||||||
| (13.98 | %)(j) | 6,963,195 | 1.10 | %(h) | 1.15 | % | 1.13 | %(h) | 11.58 | % | ||||||||||||
| (1.01 | %) | 9,389,216 | 1.10 | % | 1.35 | % | 1.12 | % | 5.00 | % | ||||||||||||
| 3.86 | % | 11,114,896 | 1.10 | % | 1.43 | % | 1.10 | % | 2.79 | % | ||||||||||||
| 12.25 | % | 7,651,960 | 1.05 | % | 1.59 | % | 1.05 | % | 1.14 | % | ||||||||||||
| (f) | Portfolio turnover is calculated on the basis of the Fund as a whole without distinguishing among the classes of shares. |
| (g) | Less than $0.005 per share. |
| (h) | Includes interest expense that amounts to less than 0.01%. |
| (i) | For the period from May 21, 2012 (commencement of operations) through October 31, 2012. |
| (j) | The total return shown above includes the impact of financial statement rounding of the NAV per share and/or financial statement adjustments. |
Annual Report 2016
106
Financial Highlights (continued)
Selected Data for Each Share of Capital Outstanding Throughout the Periods Indicated
Aberdeen Equity Long-Short Fund
| Investment Activities | Distributions | |||||||||||||||||||||||||||
| Net Asset Value, Beginning of Period | Net Investment Income (Loss) (a) | Net Realized and Unrealized Gains (Losses) on Investments | Total from Investment Activities | Net Realized Gains | Total Distributions | Net Asset Value, End of Period | ||||||||||||||||||||||
Class A Shares | ||||||||||||||||||||||||||||
Year Ended October 31, 2016 | $ | 10.30 | $ | (0.15 | ) | $ | (0.04 | ) | $ | (0.19 | ) | $ | (1.30 | ) | $ | (1.30 | ) | $ | 8.81 | |||||||||
Year Ended October 31, 2015 | 12.26 | (0.13 | ) | 0.26 | 0.13 | (2.09 | ) | (2.09 | ) | 10.30 | ||||||||||||||||||
Year Ended October 31, 2014 | 12.12 | (0.13 | ) | 0.48 | 0.35 | (0.21 | ) | (0.21 | ) | 12.26 | ||||||||||||||||||
Year Ended October 31, 2013 | 11.29 | (0.14 | ) | 1.10 | 0.96 | (0.13 | ) | (0.13 | ) | 12.12 | ||||||||||||||||||
Year Ended October 31, 2012 | 11.17 | (0.19 | ) | 0.42 | 0.23 | (0.11 | ) | (0.11 | ) | 11.29 | ||||||||||||||||||
Class C Shares | ||||||||||||||||||||||||||||
Year Ended October 31, 2016 | 6.38 | (0.12 | ) | (0.04 | ) | (0.16 | ) | (1.30 | ) | (1.30 | ) | 4.92 | ||||||||||||||||
Year Ended October 31, 2015 | 8.43 | (0.13 | ) | 0.17 | 0.04 | (2.09 | ) | (2.09 | ) | 6.38 | ||||||||||||||||||
Year Ended October 31, 2014 | 8.45 | (0.15 | ) | 0.34 | 0.19 | (0.21 | ) | (0.21 | ) | 8.43 | ||||||||||||||||||
Year Ended October 31, 2013 | 7.96 | (0.15 | ) | 0.77 | 0.62 | (0.13 | ) | (0.13 | ) | 8.45 | ||||||||||||||||||
Year Ended October 31, 2012 | 7.97 | (0.19 | ) | 0.29 | 0.10 | (0.11 | ) | (0.11 | ) | 7.96 | ||||||||||||||||||
Class R Shares | ||||||||||||||||||||||||||||
Year Ended October 31, 2016 | 9.76 | (0.17 | ) | (0.04 | ) | (0.21 | ) | (1.30 | ) | (1.30 | ) | 8.25 | ||||||||||||||||
Year Ended October 31, 2015 | 11.77 | (0.16 | ) | 0.24 | 0.08 | (2.09 | ) | (2.09 | ) | 9.76 | ||||||||||||||||||
Year Ended October 31, 2014 | 11.69 | (0.18 | ) | 0.47 | 0.29 | (0.21 | ) | (0.21 | ) | 11.77 | ||||||||||||||||||
Year Ended October 31, 2013 | 10.94 | (0.18 | ) | 1.06 | 0.88 | (0.13 | ) | (0.13 | ) | 11.69 | ||||||||||||||||||
Year Ended October 31, 2012 | 10.88 | (0.23 | ) | 0.40 | 0.17 | (0.11 | ) | (0.11 | ) | 10.94 | ||||||||||||||||||
Institutional Service Class Shares | ||||||||||||||||||||||||||||
Year Ended October 31, 2016 | 10.48 | (0.14 | ) | (0.04 | ) | (0.18 | ) | (1.30 | ) | (1.30 | ) | 9.00 | ||||||||||||||||
Year Ended October 31, 2015 | 12.44 | (0.12 | ) | 0.25 | 0.13 | (2.09 | ) | (2.09 | ) | 10.48 | ||||||||||||||||||
Year Ended October 31, 2014 | 12.28 | (0.12 | ) | 0.49 | 0.37 | (0.21 | ) | (0.21 | ) | 12.44 | ||||||||||||||||||
Year Ended October 31, 2013 | 11.43 | (0.12 | ) | 1.10 | 0.98 | (0.13 | ) | (0.13 | ) | 12.28 | ||||||||||||||||||
Year Ended October 31, 2012 | 11.30 | (0.18 | ) | 0.42 | 0.24 | (0.11 | ) | (0.11 | ) | 11.43 | ||||||||||||||||||
Institutional Class Shares | ||||||||||||||||||||||||||||
Year Ended October 31, 2016 | 10.64 | (0.13 | ) | (0.04 | ) | (0.17 | ) | (1.30 | ) | (1.30 | ) | 9.17 | ||||||||||||||||
Year Ended October 31, 2015 | 12.56 | (0.10 | ) | 0.27 | 0.17 | (2.09 | ) | (2.09 | ) | 10.64 | ||||||||||||||||||
Year Ended October 31, 2014 | 12.37 | (0.10 | ) | 0.50 | 0.40 | (0.21 | ) | (0.21 | ) | 12.56 | ||||||||||||||||||
Year Ended October 31, 2013 | 11.48 | (0.10 | ) | 1.12 | 1.02 | (0.13 | ) | (0.13 | ) | 12.37 | ||||||||||||||||||
Year Ended October 31, 2012 | 11.33 | (0.16 | ) | 0.42 | 0.26 | (0.11 | ) | (0.11 | ) | 11.48 | ||||||||||||||||||
| (a) | Net investment income/(loss) is based on average shares outstanding during the period. |
| (b) | Excludes sales charge. |
| (c) | During the period, certain fees were waived and/or reimbursed. If such waivers/reimbursements had not occurred, the ratios would have been as indicated. |
| (d) | Indicates the dividend expense charged for the period to average net assets. |
Amounts listed as “–” are $0 or round to $0.
See accompanying Notes to Financial Statements.
2016 Annual Report
107
Financial Highlights (continued)
Selected Data for Each Share of Capital Outstanding Throughout the Periods Indicated
Aberdeen Equity Long-Short Fund (concluded)
| Ratios/Supplemental Data | ||||||||||||||||||||||||||
| Total Return (b) | Net Assets at End of Period (000’s) | Ratio of Expenses (Net of Reimbursements/Waivers) to Average Net Assets | Ratio of Net Investment Income (Loss) to Average Net Assets | Ratio of Expenses (Prior to Reimbursements) to Average Net Assets (c) | Dividend Expense (d)(e) | Portfolio Turnover (f) | ||||||||||||||||||||
| (1.68 | %) | $ | 11,397 | 3.04 | % | (1.70 | %) | 3.28 | % | 1.45 | % | 36.34 | % | |||||||||||||
| 1.18 | % | 16,869 | 2.93 | %(g) | (1.21 | %) | 3.12 | %(g) | 1.36 | % | 14.04 | % | ||||||||||||||
| 2.90 | % | 30,368 | 2.64 | % | (1.09 | %) | 2.79 | % | 1.08 | % | 31.13 | % | ||||||||||||||
| 8.54 | % | 62,819 | 2.62 | % | (1.15 | %) | 2.72 | % | 1.04 | % | 41.95 | % | ||||||||||||||
| 2.10 | % | 70,070 | 2.79 | % | (1.70 | %) | 2.79 | % | 1.10 | % | 47.63 | % | ||||||||||||||
| (2.35 | %) | 3,430 | 3.69 | % | (2.33 | %) | 4.02 | % | 1.44 | % | 36.34 | % | ||||||||||||||
| 0.51 | % | 7,480 | 3.61 | %(g) | (1.90 | %) | 3.80 | %(g) | 1.35 | % | 14.04 | % | ||||||||||||||
| 2.26 | % | 10,162 | 3.36 | % | (1.81 | %) | 3.51 | % | 1.11 | % | 31.13 | % | ||||||||||||||
| 7.83 | % | 12,104 | 3.32 | % | (1.85 | %) | 3.42 | % | 1.05 | % | 41.95 | % | ||||||||||||||
| 1.31 | % | 13,681 | 3.46 | % | (2.36 | %) | 3.46 | % | 1.10 | % | 47.63 | % | ||||||||||||||
| (2.01 | %) | 2,633 | 3.34 | % | (2.01 | %) | 3.58 | % | 1.44 | % | 36.34 | % | ||||||||||||||
| 0.74 | % | 3,202 | 3.35 | %(g) | (1.65 | %) | 3.54 | %(g) | 1.34 | % | 14.04 | % | ||||||||||||||
| 2.49 | % | 3,437 | 3.12 | % | (1.56 | %) | 3.27 | % | 1.12 | % | 31.13 | % | ||||||||||||||
| 8.07 | % | 2,759 | 3.01 | % | (1.55 | %) | 3.12 | % | 1.01 | % | 41.95 | % | ||||||||||||||
| 1.60 | % | 2,118 | 3.22 | % | (2.12 | %) | 3.22 | % | 1.11 | % | 47.63 | % | ||||||||||||||
| (1.54 | %) | 693 | 2.85 | % | (1.54 | %) | 3.10 | % | 1.43 | % | 36.34 | % | ||||||||||||||
| 1.16 | % | 789 | 2.86 | %(g) | (1.13 | %) | 3.05 | %(g) | 1.35 | % | 14.04 | % | ||||||||||||||
| 3.03 | % | 1,871 | 2.59 | % | (1.02 | %) | 2.75 | % | 1.09 | % | 31.13 | % | ||||||||||||||
| 8.61 | % | 3,551 | 2.47 | % | (1.00 | %) | 2.59 | % | 0.99 | % | 41.95 | % | ||||||||||||||
| 2.17 | % | 1,992 | 2.72 | % | (1.60 | %) | 2.72 | % | 1.11 | % | 47.63 | % | ||||||||||||||
| (1.40 | %) | 52,527 | 2.71 | % | (1.36 | %) | 3.01 | % | 1.46 | % | 36.34 | % | ||||||||||||||
| 1.52 | % | 92,887 | 2.61 | %(g) | (0.89 | %) | 2.80 | %(g) | 1.36 | % | 14.04 | % | ||||||||||||||
| 3.26 | % | 303,638 | 2.33 | % | (0.78 | %) | 2.49 | % | 1.08 | % | 31.13 | % | ||||||||||||||
| 8.92 | % | 581,327 | 2.29 | % | (0.82 | %) | 2.40 | % | 1.03 | % | 41.95 | % | ||||||||||||||
| 2.34 | % | 480,181 | 2.48 | % | (1.37 | %) | 2.48 | % | 1.11 | % | 47.63 | % | ||||||||||||||
| (e) | Dividend expense ratio includes broker related expenses for securities sold short. |
| (f) | Portfolio turnover is calculated on the basis of the Fund as a whole without distinguishing among the classes of shares. |
| (g) | Includes interest expense that amounts to less than 0.01%. |
Annual Report 2016
108
Financial Highlights (continued)
Selected Data for Each Share of Capital Outstanding Throughout the Periods Indicated
Aberdeen Global Equity Fund
| Investment Activities | Distributions | |||||||||||||||||||||||||||
| Net Asset Value, Beginning of Period | Net Investment Income (a) | Net Realized and Unrealized Gains (Losses) on Investments | Total from Investment Activities | Net Investment Income | Total Distributions | Net Asset Value, End of Period | ||||||||||||||||||||||
Class A Shares | ||||||||||||||||||||||||||||
Year Ended October 31, 2016 | $ | 12.15 | $ | 0.10 | $ | 0.13 | $ | 0.23 | $ | (0.03 | ) | $ | (0.03 | ) | $ | 12.35 | ||||||||||||
Year Ended October 31, 2015 | 13.83 | 0.17 | (1.66 | ) | (1.49 | ) | (0.19 | ) | (0.19 | ) | 12.15 | |||||||||||||||||
Year Ended October 31, 2014 | 13.83 | 0.45 | 0.01 | 0.46 | (0.46 | ) | (0.46 | ) | 13.83 | |||||||||||||||||||
Year Ended October 31, 2013 | 12.01 | 0.18 | 1.80 | 1.98 | (0.16 | ) | (0.16 | ) | 13.83 | |||||||||||||||||||
Year Ended October 31, 2012 | 11.14 | 0.20 | 0.88 | 1.08 | (0.21 | ) | (0.21 | ) | 12.01 | |||||||||||||||||||
Class C Shares | ||||||||||||||||||||||||||||
Year Ended October 31, 2016 | 11.52 | 0.02 | 0.12 | 0.14 | (0.01 | ) | (0.01 | ) | 11.65 | |||||||||||||||||||
Year Ended October 31, 2015 | 13.13 | 0.06 | (1.55 | ) | (1.49 | ) | (0.12 | ) | (0.12 | ) | 11.52 | |||||||||||||||||
Year Ended October 31, 2014 | 13.15 | 0.33 | 0.03 | 0.36 | (0.38 | ) | (0.38 | ) | 13.13 | |||||||||||||||||||
Year Ended October 31, 2013 | 11.44 | 0.12 | 1.68 | 1.80 | (0.09 | ) | (0.09 | ) | 13.15 | |||||||||||||||||||
Year Ended October 31, 2012 | 10.63 | 0.14 | 0.82 | 0.96 | (0.15 | ) | (0.15 | ) | 11.44 | |||||||||||||||||||
Class R Shares | ||||||||||||||||||||||||||||
Year Ended October 31, 2016 | 11.71 | 0.08 | 0.11 | 0.19 | (0.02 | ) | (0.02 | ) | 11.88 | |||||||||||||||||||
Year Ended October 31, 2015 | 13.34 | 0.12 | (1.59 | ) | (1.47 | ) | (0.16 | ) | (0.16 | ) | 11.71 | |||||||||||||||||
Year Ended October 31, 2014 | 13.36 | 0.40 | – | (h) | 0.40 | (0.42 | ) | (0.42 | ) | 13.34 | ||||||||||||||||||
Year Ended October 31, 2013 | 11.61 | 0.16 | 1.73 | 1.89 | (0.14 | ) | (0.14 | ) | 13.36 | |||||||||||||||||||
Year Ended October 31, 2012 | 10.78 | 0.19 | 0.83 | 1.02 | (0.19 | ) | (0.19 | ) | 11.61 | |||||||||||||||||||
Institutional Service Class Shares | ||||||||||||||||||||||||||||
Year Ended October 31, 2016 | 12.30 | 0.14 | 0.13 | 0.27 | (0.04 | ) | (0.04 | ) | 12.53 | |||||||||||||||||||
Year Ended October 31, 2015 | 13.86 | 0.31 | (1.78 | ) | (1.47 | ) | (0.09 | ) | (0.09 | ) | 12.30 | |||||||||||||||||
Year Ended October 31, 2014 | 13.88 | 0.44 | 0.05 | 0.49 | (0.51 | ) | (0.51 | ) | 13.86 | |||||||||||||||||||
Year Ended October 31, 2013 | 12.01 | 0.23 | 1.85 | 2.08 | (0.21 | ) | (0.21 | ) | 13.88 | |||||||||||||||||||
Period Ended October 31, 2012(j)(k) | 10.56 | 0.23 | 1.41 | 1.64 | (0.19 | ) | (0.19 | ) | 12.01 | |||||||||||||||||||
Institutional Class Shares | ||||||||||||||||||||||||||||
Year Ended October 31, 2016 | 12.16 | 0.14 | 0.14 | 0.28 | (0.04 | ) | (0.04 | ) | 12.40 | |||||||||||||||||||
Year Ended October 31, 2015 | 13.84 | 0.14 | (1.59 | ) | (1.45 | ) | (0.23 | ) | (0.23 | ) | 12.16 | |||||||||||||||||
Year Ended October 31, 2014 | 13.84 | 0.47 | 0.04 | 0.51 | (0.51 | ) | (0.51 | ) | 13.84 | |||||||||||||||||||
Year Ended October 31, 2013 | 12.02 | 0.25 | 1.78 | 2.03 | (0.21 | ) | (0.21 | ) | 13.84 | |||||||||||||||||||
Year Ended October 31, 2012 | 11.15 | 0.23 | 0.89 | 1.12 | (0.25 | ) | (0.25 | ) | 12.02 | |||||||||||||||||||
| (a) | Net investment income/(loss) is based on average shares outstanding during the period. |
| (b) | Excludes sales charge. |
| (c) | Not annualized for periods less than one year. |
| (d) | Annualized for periods less than one year. |
| (e) | During the period, certain fees were waived and/or reimbursed. If such waivers/reimbursements had not occurred, the ratios would have been as indicated. |
| (f) | Portfolio turnover is calculated on the basis of the Fund as a whole without distinguishing among the classes of shares. |
Amounts listed as “–” are $0 or round to $0.
See accompanying Notes to Financial Statements.
2016 Annual Report
109
Financial Highlights (continued)
Selected Data for Each Share of Capital Outstanding Throughout the Periods Indicated
Aberdeen Global Equity Fund (concluded)
| Ratios/Supplemental Data | ||||||||||||||||||||||
| Total Return (b)(c) | Net Assets at End of Period (000’s) | Ratio of Expenses (Net of Reimbursements/Waivers) to Average Net Assets (d) | Ratio of Net Investment Income to Average Net Assets (d) | Ratio of Expenses (Prior to Reimbursements) to Average Net Assets (d)(e) | Portfolio Turnover (f) | |||||||||||||||||
| 1.93 | % | $ | 48,350 | 1.56 | %(g) | 0.82 | % | 1.63 | %(g) | 21.59 | % | |||||||||||
| (10.85 | %) | 58,730 | 1.55 | %(g) | 1.33 | % | 1.61 | %(g) | 31.45 | % | ||||||||||||
| 3.37 | % | 73,230 | 1.56 | % | 3.22 | % | 1.56 | % | 24.09 | % | ||||||||||||
| 16.59 | % | 83,800 | 1.57 | % | 1.42 | % | 1.57 | % | 12.87 | % | ||||||||||||
| 9.86 | % | 76,894 | 1.49 | % | 1.73 | % | 1.68 | % | 24.83 | % | ||||||||||||
| 1.24 | % | 1,495 | 2.19 | %(g) | 0.20 | % | 2.36 | %(g) | 21.59 | % | ||||||||||||
| (11.43 | %) | 1,729 | 2.20 | %(g) | 0.45 | % | 2.26 | %(g) | 31.45 | % | ||||||||||||
| 2.78 | % | 4,165 | 2.19 | % | 2.50 | % | 2.19 | % | 24.09 | % | ||||||||||||
| 15.83 | % | 5,278 | 2.19 | % | 0.96 | % | 2.19 | % | 12.87 | % | ||||||||||||
| 9.11 | % | 3,348 | 2.20 | % | 1.28 | % | 2.39 | % | 24.83 | % | ||||||||||||
| 1.64 | % | 1,348 | 1.84 | %(g) | 0.66 | % | 1.91 | %(g) | 21.59 | % | ||||||||||||
| (11.13 | %) | 1,457 | 1.88 | %(g) | 0.96 | % | 1.94 | %(g) | 31.45 | % | ||||||||||||
| 3.06 | % | 1,986 | 1.85 | % | 2.96 | % | 1.85 | % | 24.09 | % | ||||||||||||
| 16.35 | % | 2,312 | 1.76 | % | 1.26 | % | 1.76 | % | 12.87 | % | ||||||||||||
| 9.61 | % | 2,265 | 1.71 | % | 1.70 | % | 1.90 | % | 24.83 | % | ||||||||||||
| 2.26 | % | 1 | 1.19 | %(g) | 1.17 | % | 1.26 | %(g) | 21.59 | % | ||||||||||||
| (10.60 | %) | 1 | 1.26 | %(g) | 2.29 | % | 1.33 | %(g) | 31.45 | % | ||||||||||||
| 3.62 | %(i) | 2 | 1.19 | % | 3.12 | % | 1.19 | % | 24.09 | % | ||||||||||||
| 17.44 | %(i) | 1 | 1.19 | % | 1.80 | % | 1.20 | % | 12.87 | % | ||||||||||||
| 15.65 | %(i) | 1 | 1.19 | % | 2.28 | % | 1.39 | % | 24.83 | % | ||||||||||||
| 2.36 | % | 36,167 | 1.19 | %(g) | 1.19 | % | 1.27 | %(g) | 21.59 | % | ||||||||||||
| (10.55 | %) | 30,678 | 1.19 | %(g) | 1.08 | % | 1.25 | %(g) | 31.45 | % | ||||||||||||
| 3.77 | %(i) | 78,381 | 1.19 | % | 3.36 | % | 1.19 | % | 24.09 | % | ||||||||||||
| 17.01 | %(i) | 67,843 | 1.19 | % | 1.89 | % | 1.19 | % | 12.87 | % | ||||||||||||
| 10.16 | % | 39,134 | 1.20 | % | 1.95 | % | 1.39 | % | 24.83 | % | ||||||||||||
| (g) | Includes interest expense that amounts to less than 0.01%. |
| (h) | Less than $0.005 per share. |
| (i) | The total return shown above includes the impact of financial statement rounding of the NAV per share and/or financial statement adjustments. |
| (j) | For the period from December 19, 2011 (commencement of operations) through October 31, 2012. |
| (k) | There were no shareholders in the class for the period from April 23, 2009 through December 18, 2011. The financial highlights information presented in the table above and in Note 5 in the accompanying notes to the financial statements is for two separate periods of time when shareholders were invested in the class. See Note 5 for Financial Highlight information prior to year ended October 31, 2009. |
Annual Report 2016
110
Financial Highlights (continued)
Selected Data for Each Share of Capital Outstanding Throughout the Periods Indicated
Aberdeen Global Natural Resources Fund
| Investment Activities | Distributions | |||||||||||||||||||||||||||
| Net Asset Value, Beginning of Period | Net Investment Income (a) | Net Realized and Unrealized Gains (Losses) on Investments | Total from Investment Activities | Net Investment Income | Total Distributions | Net Asset Value, End of Period | ||||||||||||||||||||||
Class A Shares | ||||||||||||||||||||||||||||
Year Ended October 31, 2016 | $ | 11.52 | $ | 0.15 | $ | 0.75 | $ | 0.90 | $ | (0.04 | ) | $ | (0.04 | ) | $ | 12.38 | ||||||||||||
Year Ended October 31, 2015 | 15.35 | 0.23 | (3.73 | ) | (3.50 | ) | (0.33 | ) | (0.33 | ) | 11.52 | |||||||||||||||||
Year Ended October 31, 2014 | 16.37 | 0.22 | (0.98 | ) | (0.76 | ) | (0.26 | ) | (0.26 | ) | 15.35 | |||||||||||||||||
Year Ended October 31, 2013 | 16.30 | 0.16 | 0.04 | 0.20 | (0.13 | ) | (0.13 | ) | 16.37 | |||||||||||||||||||
Year Ended October 31, 2012 | 16.23 | 0.17 | 0.07 | 0.24 | (0.17 | ) | (0.17 | ) | 16.30 | |||||||||||||||||||
Class C Shares | ||||||||||||||||||||||||||||
Year Ended October 31, 2016 | 10.94 | 0.07 | 0.71 | 0.78 | (0.02 | ) | (0.02 | ) | 11.70 | |||||||||||||||||||
Year Ended October 31, 2015 | 14.59 | 0.13 | (3.54 | ) | (3.41 | ) | (0.24 | ) | (0.24 | ) | 10.94 | |||||||||||||||||
Year Ended October 31, 2014 | 15.56 | 0.10 | (0.93 | ) | (0.83 | ) | (0.14 | ) | (0.14 | ) | 14.59 | |||||||||||||||||
Year Ended October 31, 2013 | 15.52 | 0.05 | 0.04 | 0.09 | (0.05 | ) | (0.05 | ) | 15.56 | |||||||||||||||||||
Year Ended October 31, 2012 | 15.50 | 0.05 | 0.08 | 0.13 | (0.11 | ) | (0.11 | ) | 15.52 | |||||||||||||||||||
Class R Shares | ||||||||||||||||||||||||||||
Year Ended October 31, 2016 | 11.33 | 0.11 | 0.74 | 0.85 | (0.03 | ) | (0.03 | ) | 12.15 | |||||||||||||||||||
Year Ended October 31, 2015 | 15.11 | 0.20 | (3.68 | ) | (3.48 | ) | (0.30 | ) | (0.30 | ) | 11.33 | |||||||||||||||||
Year Ended October 31, 2014 | 16.11 | 0.18 | (0.96 | ) | (0.78 | ) | (0.22 | ) | (0.22 | ) | 15.11 | |||||||||||||||||
Year Ended October 31, 2013 | 16.05 | 0.13 | 0.04 | 0.17 | (0.11 | ) | (0.11 | ) | 16.11 | |||||||||||||||||||
Year Ended October 31, 2012 | 15.99 | 0.14 | 0.07 | 0.21 | (0.15 | ) | (0.15 | ) | 16.05 | |||||||||||||||||||
Institutional Service Class Shares | ||||||||||||||||||||||||||||
Year Ended October 31, 2016 | 11.68 | 0.19 | 0.75 | 0.94 | (0.05 | ) | (0.05 | ) | 12.57 | |||||||||||||||||||
Year Ended October 31, 2015 | 15.55 | 0.29 | (3.78 | ) | (3.49 | ) | (0.38 | ) | (0.38 | ) | 11.68 | |||||||||||||||||
Year Ended October 31, 2014 | 16.60 | 0.28 | (1.01 | ) | (0.73 | ) | (0.32 | ) | (0.32 | ) | 15.55 | |||||||||||||||||
Year Ended October 31, 2013 | 16.51 | 0.21 | 0.06 | 0.27 | (0.18 | ) | (0.18 | ) | 16.60 | |||||||||||||||||||
Year Ended October 31, 2012 | 16.43 | 0.22 | 0.08 | 0.30 | (0.22 | ) | (0.22 | ) | 16.51 | |||||||||||||||||||
Institutional Class Shares | ||||||||||||||||||||||||||||
Year Ended October 31, 2016 | 11.69 | 0.22 | 0.76 | 0.98 | (0.05 | ) | (0.05 | ) | 12.62 | |||||||||||||||||||
Year Ended October 31, 2015 | 15.56 | 0.23 | (3.72 | ) | (3.49 | ) | (0.38 | ) | (0.38 | ) | 11.69 | |||||||||||||||||
Year Ended October 31, 2014 | 16.61 | 0.26 | (0.99 | ) | (0.73 | ) | (0.32 | ) | (0.32 | ) | 15.56 | |||||||||||||||||
Year Ended October 31, 2013 | 16.54 | 0.18 | 0.07 | 0.25 | (0.18 | ) | (0.18 | ) | 16.61 | |||||||||||||||||||
Year Ended October 31, 2012 | 16.47 | 0.21 | 0.08 | 0.29 | (0.22 | ) | (0.22 | ) | 16.54 | |||||||||||||||||||
| (a) | Net investment income/(loss) is based on average shares outstanding during the period. |
| (b) | Excludes sales charge. |
| (c) | During the period, certain fees were waived and/or reimbursed. If such waivers/reimbursements had not occurred, the ratios would have been as indicated. |
Amounts listed as “–” are $0 or round to $0.
See accompanying Notes to Financial Statements.
2016 Annual Report
111
Financial Highlights (continued)
Selected Data for Each Share of Capital Outstanding Throughout the Periods Indicated
Aberdeen Global Natural Resources Fund (concluded)
| Ratios/Supplemental Data | ||||||||||||||||||||||
| Total Return (b) | Net Assets at End of Period (000’s) | Ratio of Expenses (Net of Reimbursements/Waivers) to Average Net Assets | Ratio of Net Investment Income to Average Net Assets | Ratio of Expenses (Prior to Reimbursements) to Average Net Assets (c) | Portfolio Turnover (d) | |||||||||||||||||
| 7.90 | % | $ | 9,572 | 1.53 | %(e) | 1.30 | % | 2.16 | %(e) | 24.58 | % | |||||||||||
| (23.00 | %) | 8,838 | 1.35 | %(e)(f) | 1.72 | %(f) | 2.12 | %(e) | 31.83 | % | ||||||||||||
| (4.75 | %) | 15,053 | 1.48 | % | 1.30 | % | 1.84 | % | 2.02 | % | ||||||||||||
| 1.28 | % | 21,396 | 1.49 | % | 1.00 | % | 1.64 | % | 12.50 | % | ||||||||||||
| 1.54 | % | 28,898 | 1.48 | % | 1.06 | % | 1.51 | % | 7.98 | % | ||||||||||||
| 7.17 | % | 1,463 | 2.16 | %(e) | 0.69 | % | 2.89 | %(e) | 24.58 | % | ||||||||||||
| (23.54 | %) | 1,639 | 2.03 | %(e)(f) | 1.05 | %(f) | 2.80 | %(e) | 31.83 | % | ||||||||||||
| (5.39 | %) | 2,793 | 2.16 | % | 0.62 | % | 2.52 | % | 2.02 | % | ||||||||||||
| 0.58 | % | 4,345 | 2.16 | % | 0.32 | % | 2.31 | % | 12.50 | % | ||||||||||||
| 0.86 | % | 5,786 | 2.16 | % | 0.35 | % | 2.19 | % | 7.98 | % | ||||||||||||
| 7.61 | % | 2,293 | 1.78 | %(e) | 1.01 | % | 2.41 | %(e) | 24.58 | % | ||||||||||||
| (23.22 | %) | 2,473 | 1.60 | %(e)(f) | 1.52 | %(f) | 2.37 | %(e) | 31.83 | % | ||||||||||||
| (4.94 | %) | 3,134 | 1.70 | % | 1.09 | % | 2.06 | % | 2.02 | % | ||||||||||||
| 1.06 | % | 3,942 | 1.70 | % | 0.80 | % | 1.85 | % | 12.50 | % | ||||||||||||
| 1.34 | % | 5,279 | 1.69 | % | 0.90 | % | 1.72 | % | 7.98 | % | ||||||||||||
| 8.16 | % | 638 | 1.23 | %(e) | 1.73 | % | 1.86 | %(e) | 24.58 | % | ||||||||||||
| (22.68 | %) | 312 | 1.03 | %(e)(f) | 2.11 | %(f) | 1.80 | %(e) | 31.83 | % | ||||||||||||
| (4.52 | %) | 672 | 1.16 | % | 1.66 | % | 1.53 | % | 2.02 | % | ||||||||||||
| 1.67 | % | 816 | 1.16 | % | 1.31 | % | 1.31 | % | 12.50 | % | ||||||||||||
| 1.90 | % | 1,156 | 1.17 | % | 1.33 | % | 1.20 | % | 7.98 | % | ||||||||||||
| 8.49 | % | 594 | 1.16 | %(e) | 1.98 | % | 1.83 | %(e) | 24.58 | % | ||||||||||||
| (22.67 | %) | 5,708 | 1.03 | %(e)(f) | 1.79 | %(f) | 1.80 | %(e) | 31.83 | % | ||||||||||||
| (4.52 | %) | 1,524 | 1.16 | % | 1.54 | % | 1.52 | % | 2.02 | % | ||||||||||||
| 1.55 | % | 2,206 | 1.16 | % | 1.10 | % | 1.31 | % | 12.50 | % | ||||||||||||
| 1.85 | % | 6,781 | 1.16 | % | 1.31 | % | 1.19 | % | 7.98 | % | ||||||||||||
| (d) | Portfolio turnover is calculated on the basis of the Fund as a whole without distinguishing among the classes of shares. |
| (e) | Includes interest expense that amounts to less than 0.01%. |
| (f) | Includes 0.13% reimbursement from Aberdeen relating to certain Transfer Agent expenses paid by the Fund that are not attributable to the Fund. |
Annual Report 2016
112
Financial Highlights (continued)
Selected Data for Each Share of Capital Outstanding Throughout the Periods Indicated
Aberdeen International Equity Fund
| Investment Activities | Distributions | |||||||||||||||||||||||||||
| Net Asset Value, Beginning of Period | Net Investment Income (a) | Net Realized and Unrealized Gains (Losses) on Investments | Total from Investment Activities | Net Investment Income | Total Distributions | Net Asset Value, End of Period | ||||||||||||||||||||||
Class A Shares | ||||||||||||||||||||||||||||
Year Ended October 31, 2016 | $ | 12.52 | $ | 0.18 | $ | 0.04 | $ | 0.22 | $ | (0.04 | ) | $ | (0.04 | ) | $ | 12.70 | ||||||||||||
Year Ended October 31, 2015 | 14.85 | 0.23 | (2.29 | ) | (2.06 | ) | (0.27 | ) | (0.27 | ) | 12.52 | |||||||||||||||||
Year Ended October 31, 2014 | 15.34 | 0.50 | (0.42 | ) | 0.08 | (0.57 | ) | (0.57 | ) | 14.85 | ||||||||||||||||||
Year Ended October 31, 2013 | 13.57 | 0.26 | 1.73 | 1.99 | (0.22 | ) | (0.22 | ) | 15.34 | |||||||||||||||||||
Year Ended October 31, 2012 | 13.00 | 0.31 | 0.56 | 0.87 | (0.30 | ) | (0.30 | ) | 13.57 | |||||||||||||||||||
Class C Shares | ||||||||||||||||||||||||||||
Year Ended October 31, 2016 | 11.79 | 0.08 | 0.03 | 0.11 | (0.01 | ) | (0.01 | ) | 11.89 | |||||||||||||||||||
Year Ended October 31, 2015 | 14.01 | 0.13 | (2.16 | ) | (2.03 | ) | (0.19 | ) | (0.19 | ) | 11.79 | |||||||||||||||||
Year Ended October 31, 2014 | 14.51 | 0.39 | (0.42 | ) | (0.03 | ) | (0.47 | ) | (0.47 | ) | 14.01 | |||||||||||||||||
Year Ended October 31, 2013 | 12.86 | 0.15 | 1.64 | 1.79 | (0.14 | ) | (0.14 | ) | 14.51 | |||||||||||||||||||
Year Ended October 31, 2012 | 12.35 | 0.20 | 0.54 | 0.74 | (0.23 | ) | (0.23 | ) | 12.86 | |||||||||||||||||||
Class R Shares | ||||||||||||||||||||||||||||
Year Ended October 31, 2016 | 11.97 | 0.12 | 0.05 | 0.17 | (0.03 | ) | (0.03 | ) | 12.11 | |||||||||||||||||||
Year Ended October 31, 2015 | 14.22 | 0.18 | (2.20 | ) | (2.02 | ) | (0.23 | ) | (0.23 | ) | 11.97 | |||||||||||||||||
Year Ended October 31, 2014 | 14.71 | 0.46 | (0.42 | ) | 0.04 | (0.53 | ) | (0.53 | ) | 14.22 | ||||||||||||||||||
Year Ended October 31, 2013 | 13.03 | 0.21 | 1.65 | 1.86 | (0.18 | ) | (0.18 | ) | 14.71 | |||||||||||||||||||
Year Ended October 31, 2012 | 12.49 | 0.27 | 0.55 | 0.82 | (0.28 | ) | (0.28 | ) | 13.03 | |||||||||||||||||||
Institutional Service Class Shares | ||||||||||||||||||||||||||||
Year Ended October 31, 2016 | 12.77 | 0.20 | 0.05 | 0.25 | (0.04 | ) | (0.04 | ) | 12.98 | |||||||||||||||||||
Year Ended October 31, 2015 | 15.16 | 0.27 | (2.36 | ) | (2.09 | ) | (0.30 | ) | (0.30 | ) | 12.77 | |||||||||||||||||
Year Ended October 31, 2014 | 15.64 | 0.56 | (0.44 | ) | 0.12 | (0.60 | ) | (0.60 | ) | 15.16 | ||||||||||||||||||
Year Ended October 31, 2013 | 13.84 | 0.28 | 1.77 | 2.05 | (0.25 | ) | (0.25 | ) | 15.64 | |||||||||||||||||||
Year Ended October 31, 2012 | 13.25 | 0.35 | 0.56 | 0.91 | (0.32 | ) | (0.32 | ) | 13.84 | |||||||||||||||||||
Institutional Class Shares | ||||||||||||||||||||||||||||
Year Ended October 31, 2016 | 12.82 | 0.22 | 0.05 | 0.27 | (0.05 | ) | (0.05 | ) | 13.04 | |||||||||||||||||||
Year Ended October 31, 2015 | 15.21 | 0.29 | (2.36 | ) | (2.07 | ) | (0.32 | ) | (0.32 | ) | 12.82 | |||||||||||||||||
Year Ended October 31, 2014 | 15.70 | 0.58 | (0.45 | ) | 0.13 | (0.62 | ) | (0.62 | ) | 15.21 | ||||||||||||||||||
Year Ended October 31, 2013 | 13.88 | 0.32 | 1.76 | 2.08 | (0.26 | ) | (0.26 | ) | 15.70 | |||||||||||||||||||
Year Ended October 31, 2012 | 13.29 | 0.41 | 0.51 | 0.92 | (0.33 | ) | (0.33 | ) | 13.88 | |||||||||||||||||||
| (a) | Net investment income/(loss) is based on average shares outstanding during the period. |
| (b) | Excludes sales charge. |
| (c) | During the period, certain fees were waived and/or reimbursed. If such waivers/reimbursements had not occurred, the ratios would have been as indicated. |
Amounts listed as “–” are $0 or round to $0.
See accompanying Notes to Financial Statements.
2016 Annual Report
113
Financial Highlights (continued)
Selected Data for Each Share of Capital Outstanding Throughout the Periods Indicated
Aberdeen International Equity Fund (concluded)
| Ratios/Supplemental Data | ||||||||||||||||||||||
| Total Return (b) | Net Assets at End of Period (000’s) | Ratio of Expenses (Net of Reimbursements/Waivers) to Average Net Assets | Ratio of Net Investment Income to Average Net Assets | Ratio of Expenses (Prior to Reimbursements) to Average Net Assets (c) | Portfolio Turnover (d) | |||||||||||||||||
| 1.76 | % | $ | 47,736 | 1.39 | %(e) | 1.49 | % | 1.39 | %(e) | 27.99 | % | |||||||||||
| (14.02 | %) | 91,902 | 1.32 | %(e)(f) | 1.65 | %(f) | 1.35 | %(e) | 14.52 | % | ||||||||||||
| 0.49 | % | 148,018 | 1.33 | % | 3.30 | % | 1.33 | % | 10.08 | % | ||||||||||||
| 14.75 | % | 222,275 | 1.33 | % | 1.77 | % | 1.33 | % | 23.35 | % | ||||||||||||
| 6.84 | % | 200,574 | 1.37 | % | 2.37 | % | 1.37 | % | 15.29 | % | ||||||||||||
| 0.97 | % | 14,400 | 2.10 | %(e) | 0.70 | % | 2.12 | %(e) | 27.99 | % | ||||||||||||
| (14.61 | %) | 22,999 | 2.01 | %(e)(f) | 0.97 | %(f) | 2.04 | %(e) | 14.52 | % | ||||||||||||
| (0.24 | %) | 35,696 | 2.03 | % | 2.68 | % | 2.03 | % | 10.08 | % | ||||||||||||
| 14.02 | % | 42,861 | 2.01 | % | 1.08 | % | 2.01 | % | 23.35 | % | ||||||||||||
| 6.09 | % | 35,754 | 2.05 | % | 1.64 | % | 2.05 | % | 15.29 | % | ||||||||||||
| 1.42 | % | 7,647 | 1.67 | %(e) | 1.08 | % | 1.67 | %(e) | 27.99 | % | ||||||||||||
| (14.32 | %) | 14,095 | 1.62 | %(e)(f) | 1.34 | %(f) | 1.65 | %(e) | 14.52 | % | ||||||||||||
| 0.26 | % | 16,938 | 1.62 | % | 3.13 | % | 1.62 | % | 10.08 | % | ||||||||||||
| 14.42 | % | 17,303 | 1.59 | % | 1.51 | % | 1.59 | % | 23.35 | % | ||||||||||||
| 6.67 | % | 11,531 | 1.58 | % | 2.10 | % | 1.58 | % | 15.29 | % | ||||||||||||
| 2.01 | % | 101,655 | 1.14 | %(e) | 1.62 | % | 1.14 | %(e) | 27.99 | % | ||||||||||||
| (13.97 | %) | 156,489 | 1.15 | %(e)(f) | 1.89 | %(f) | 1.18 | %(e) | 14.52 | % | ||||||||||||
| 0.75 | % | 185,166 | 1.16 | % | 3.57 | % | 1.16 | % | 10.08 | % | ||||||||||||
| 14.91 | % | 206,212 | 1.13 | % | 1.92 | % | 1.13 | % | 23.35 | % | ||||||||||||
| 7.07 | % | 191,580 | 1.17 | % | 2.61 | % | 1.17 | % | 15.29 | % | ||||||||||||
| 2.14 | % | 286,659 | 1.04 | %(e) | 1.75 | % | 1.04 | %(e) | 27.99 | % | ||||||||||||
| (13.80 | %) | 332,542 | 1.01 | %(e)(f) | 2.04 | %(f) | 1.04 | %(e) | 14.52 | % | ||||||||||||
| 0.81 | % | 496,344 | 1.03 | % | 3.73 | % | 1.03 | % | 10.08 | % | ||||||||||||
| 15.14 | % | 558,986 | 1.01 | % | 2.13 | % | 1.01 | % | 23.35 | % | ||||||||||||
| 7.18 | % | 475,051 | 1.01 | % | 3.02 | % | 1.01 | % | 15.29 | % | ||||||||||||
| (d) | Portfolio turnover is calculated on the basis of the Fund as a whole without distinguishing among the classes of shares. |
| (e) | Includes interest expense that amounts to less than 0.01%. |
| (f) | Includes 0.03% reimbursement from Aberdeen relating to certain Transfer Agent expenses paid by the Fund that are not attributable to the Fund. |
Annual Report 2016
114
Financial Highlights (continued)
Selected Data for Each Share of Capital Outstanding Throughout the Periods Indicated
Aberdeen International Small Cap Fund
| Investment Activities | Distributions | |||||||||||||||||||||||||||||||||||
| Net Asset Value, Beginning of Period | Net Investment Income (Loss) (a) | Net Realized and Unrealized Gains (Losses) on Investments | Total from Investment Activities | Net Investment Income | Net Realized Gains | Total Distributions | Redemption Fees | Net Asset Value, End of Period | ||||||||||||||||||||||||||||
Class A Shares | ||||||||||||||||||||||||||||||||||||
Year Ended October 31, 2016 | $ | 26.87 | $ | 0.13 | $ | 1.61 | $ | 1.74 | $ | (0.12 | ) | $ | (2.52 | ) | $ | (2.64 | ) | $ | – | $ | 25.97 | |||||||||||||||
Year Ended October 31, 2015 | 29.64 | 0.48 | (1.17 | ) | (0.69 | ) | (0.52 | ) | (1.56 | ) | (2.08 | ) | – | 26.87 | ||||||||||||||||||||||
Year Ended October 31, 2014 | 28.71 | 0.19 | 1.32 | 1.51 | (0.27 | ) | (0.31 | ) | (0.58 | ) | – | 29.64 | ||||||||||||||||||||||||
Year Ended October 31, 2013 | 25.95 | 0.17 | 2.65 | 2.82 | (0.07 | ) | – | (0.07 | ) | 0.01 | 28.71 | |||||||||||||||||||||||||
Year Ended October 31, 2012 | 21.68 | 0.14 | 4.48 | 4.62 | (0.35 | ) | – | (0.35 | ) | – | 25.95 | |||||||||||||||||||||||||
Class C Shares | ||||||||||||||||||||||||||||||||||||
Year Ended October 31, 2016 | 25.04 | (0.05 | ) | 1.50 | 1.45 | (0.09 | ) | (2.52 | ) | (2.61 | ) | – | 23.88 | |||||||||||||||||||||||
Year Ended October 31, 2015 | 27.81 | 0.27 | (1.11 | ) | (0.84 | ) | (0.37 | ) | (1.56 | ) | (1.93 | ) | – | 25.04 | ||||||||||||||||||||||
Year Ended October 31, 2014 | 26.97 | (0.01 | ) | 1.24 | 1.23 | (0.08 | ) | (0.31 | ) | (0.39 | ) | – | 27.81 | |||||||||||||||||||||||
Year Ended October 31, 2013 | 24.50 | 0.02 | 2.46 | 2.48 | (0.02 | ) | – | (0.02 | ) | 0.01 | 26.97 | |||||||||||||||||||||||||
Year Ended October 31, 2012 | 20.46 | (0.04 | ) | 4.27 | 4.23 | (0.19 | ) | – | (0.19 | ) | – | 24.50 | ||||||||||||||||||||||||
Class R Shares | ||||||||||||||||||||||||||||||||||||
Year Ended October 31, 2016 | 25.81 | 0.05 | 1.53 | 1.58 | (0.10 | ) | (2.52 | ) | (2.62 | ) | – | 24.77 | ||||||||||||||||||||||||
Year Ended October 31, 2015 | 28.57 | 0.37 | (1.13 | ) | (0.76 | ) | (0.44 | ) | (1.56 | ) | (2.00 | ) | – | 25.81 | ||||||||||||||||||||||
Year Ended October 31, 2014 | 27.68 | 0.09 | 1.30 | 1.39 | (0.19 | ) | (0.31 | ) | (0.50 | ) | – | 28.57 | ||||||||||||||||||||||||
Year Ended October 31, 2013 | 25.06 | 0.15 | 2.51 | 2.66 | (0.05 | ) | – | (0.05 | ) | 0.01 | 27.68 | |||||||||||||||||||||||||
Year Ended October 31, 2012 | 20.95 | 0.06 | 4.34 | 4.40 | (0.29 | ) | – | (0.29 | ) | – | 25.06 | |||||||||||||||||||||||||
Institutional Service Class Shares |
| |||||||||||||||||||||||||||||||||||
Year Ended October 31, 2016 | 26.87 | 0.06 | 1.71 | 1.77 | (0.12 | ) | (2.52 | ) | (2.64 | ) | – | 26.00 | ||||||||||||||||||||||||
Year Ended October 31, 2015 | 29.64 | 0.48 | (1.17 | ) | (0.69 | ) | (0.52 | ) | (1.56 | ) | (2.08 | ) | – | 26.87 | ||||||||||||||||||||||
Year Ended October 31, 2014 | 28.72 | 0.23 | 1.31 | 1.54 | (0.31 | ) | (0.31 | ) | (0.62 | ) | – | 29.64 | ||||||||||||||||||||||||
Year Ended October 31, 2013 | 25.95 | 0.31 | 2.56 | 2.87 | (0.11 | ) | – | (0.11 | ) | 0.01 | 28.72 | |||||||||||||||||||||||||
Year Ended October 31, 2012 | 21.74 | 0.16 | 4.47 | 4.63 | (0.42 | ) | – | (0.42 | ) | – | 25.95 | |||||||||||||||||||||||||
Institutional Class Shares | ||||||||||||||||||||||||||||||||||||
Year Ended October 31, 2016 | 26.87 | 0.18 | 1.65 | 1.83 | (0.14 | ) | (2.52 | ) | (2.66 | ) | – | 26.04 | ||||||||||||||||||||||||
Year Ended October 31, 2015 | 29.66 | 0.36 | (0.99 | ) | (0.63 | ) | (0.60 | ) | (1.56 | ) | (2.16 | ) | – | 26.87 | ||||||||||||||||||||||
Year Ended October 31, 2014 | 28.74 | 0.29 | 1.32 | 1.61 | (0.38 | ) | (0.31 | ) | (0.69 | ) | – | 29.66 | ||||||||||||||||||||||||
Year Ended October 31, 2013 | 25.98 | 0.25 | 2.66 | 2.91 | (0.16 | ) | – | (0.16 | ) | 0.01 | 28.74 | |||||||||||||||||||||||||
Year Ended October 31, 2012 | 21.72 | 0.20 | 4.48 | 4.68 | (0.42 | ) | – | (0.42 | ) | – | 25.98 | |||||||||||||||||||||||||
| (a) | Net investment income/(loss) is based on average shares outstanding during the period. |
| (b) | Excludes sales charge. |
| (c) | During the period, certain fees were waived and/or reimbursed. If such waivers/reimbursements had not occurred, the ratios would have been as indicated. |
Amounts listed as “–” are $0 or round to $0.
See accompanying Notes to Financial Statements.
2016 Annual Report
115
Financial Highlights (continued)
Selected Data for Each Share of Capital Outstanding Throughout the Periods Indicated
Aberdeen International Small Cap Fund (concluded)
| Ratios/Supplemental Data | ||||||||||||||||||||||
| Total Return (b) | Net Assets at End of Period (000’s) | Ratio of Expenses (Net of Reimbursements/Waivers) to Average Net Assets | Ratio of Net Investment Income (Loss) to Average Net Assets | Ratio of Expenses (Prior to Reimbursements) to Average Net Assets (c) | Portfolio Turnover (d) | |||||||||||||||||
| 7.53 | %(e) | $ | 51,530 | 1.63 | %(f) | 0.53 | % | 2.09 | %(f) | 36.40 | % | |||||||||||
| (2.39 | %)(e) | 53,726 | 1.61 | %(f) | 1.70 | % | 1.84 | %(f) | 12.11 | % | ||||||||||||
| 5.32 | % | 64,189 | 1.60 | % | 0.65 | % | 1.73 | % | 12.93 | % | ||||||||||||
| 10.91 | % | 80,191 | 1.61 | % | 0.63 | % | 1.76 | % | 34.85 | % | ||||||||||||
| 21.77 | % | 60,672 | 1.59 | % | 0.62 | % | 2.04 | % | 22.21 | % | ||||||||||||
| 6.85 | % | 1,175 | 2.30 | %(f) | (0.20 | %) | 2.86 | %(f) | 36.40 | % | ||||||||||||
| (3.10 | %) | 1,404 | 2.30 | %(f) | 1.03 | % | 2.53 | %(f) | 12.11 | % | ||||||||||||
| 4.60 | % | 1,646 | 2.30 | % | (0.03 | %) | 2.43 | % | 12.93 | % | ||||||||||||
| 10.17 | % | 2,208 | 2.30 | % | 0.08 | % | 2.45 | % | 34.85 | % | ||||||||||||
| 20.92 | % | 521 | 2.30 | % | (0.17 | %) | 2.75 | % | 22.21 | % | ||||||||||||
| 7.20 | %(e) | 947 | 1.95 | %(f) | 0.20 | % | 2.41 | %(f) | 36.40 | % | ||||||||||||
| (2.74 | %)(e) | 623 | 1.91 | %(f) | 1.38 | % | 2.14 | %(f) | 12.11 | % | ||||||||||||
| 5.07 | % | 866 | 1.86 | % | 0.32 | % | 1.99 | % | 12.93 | % | ||||||||||||
| 10.67 | % | 1,749 | 1.82 | % | 0.55 | % | 1.97 | % | 34.85 | % | ||||||||||||
| 21.44 | % | 499 | 1.86 | % | 0.25 | % | 2.31 | % | 22.21 | % | ||||||||||||
| 7.65 | % | 64 | 1.52 | %(f) | 0.24 | % | 1.98 | %(f) | 36.40 | % | ||||||||||||
| (2.38 | %) | 1,359 | 1.55 | %(f) | 1.71 | % | 1.78 | %(f) | 12.11 | % | ||||||||||||
| 5.41 | % | 2,201 | 1.54 | % | 0.78 | % | 1.67 | % | 12.93 | % | ||||||||||||
| 11.11 | % | 1,803 | 1.47 | % | 1.10 | % | 1.62 | % | 34.85 | % | ||||||||||||
| 21.88 | % | 45 | 1.54 | % | 0.69 | % | 1.99 | % | 22.21 | % | ||||||||||||
| 7.92 | % | 19,840 | 1.30 | %(f) | 0.71 | % | 1.79 | %(f) | 36.40 | % | ||||||||||||
| (2.16 | %) | 48,927 | 1.30 | %(f) | 1.27 | % | 1.53 | %(f) | 12.11 | % | ||||||||||||
| 5.67 | % | 189,864 | 1.30 | % | 0.99 | % | 1.43 | % | 12.93 | % | ||||||||||||
| 11.29 | % | 212,642 | 1.30 | % | 0.91 | % | 1.45 | % | 34.85 | % | ||||||||||||
| 22.13 | % | 24,276 | 1.30 | % | 0.87 | % | 1.75 | % | 22.21 | % | ||||||||||||
| (d) | Portfolio turnover is calculated on the basis of the Fund as a whole without distinguishing among the classes of shares. |
| (e) | The total return shown above includes the impact of financial statement rounding of the NAV per share and/or financial statement adjustments. |
| (f) | Includes interest expense that amounts to less than 0.01%. |
Annual Report 2016
116
Financial Highlights (continued)
Selected Data for Each Share of Capital Outstanding Throughout the Periods Indicated
Aberdeen Japanese Equities Fund
| Investment Activities | Distributions | |||||||||||||||||||||||||||
| Net Asset Value, Beginning of Period | Net Investment Income (Loss) (a) | Net Realized and Unrealized Gains on Investments | Total from Investment Activities | Net Investment Income | Total Distributions | Net Asset Value, End of Period | ||||||||||||||||||||||
Class A Shares | ||||||||||||||||||||||||||||
Year Ended October 31, 2016(g) | $ | 10.00 | $ | 0.06 | $ | 0.97 | $ | 1.03 | $ | (0.01 | ) | $ | (0.01 | ) | $ | 11.02 | ||||||||||||
Class C Shares | ||||||||||||||||||||||||||||
Year Ended October 31, 2016(g) | 10.00 | (0.02 | ) | 0.97 | 0.95 | – | (h) | – | (h) | 10.95 | ||||||||||||||||||
Class R Shares | ||||||||||||||||||||||||||||
Year Ended October 31, 2016(g) | 10.00 | 0.03 | 0.97 | 1.00 | – | (h) | – | (h) | 11.00 | |||||||||||||||||||
Institutional Service Class Shares | ||||||||||||||||||||||||||||
Year Ended October 31, 2016(g) | 10.00 | 0.07 | 0.98 | 1.05 | (0.01 | ) | (0.01 | ) | 11.04 | |||||||||||||||||||
Institutional Class Shares | ||||||||||||||||||||||||||||
Year Ended October 31, 2016(g) | 10.00 | 0.07 | 0.98 | 1.05 | (0.01 | ) | (0.01 | ) | 11.04 | |||||||||||||||||||
| (a) | Net investment income/(loss) is based on average shares outstanding during the period. |
| (b) | Excludes sales charge. |
| (c) | Not annualized for periods less than one year. |
| (d) | Annualized for periods less than one year. |
Amounts listed as “–” are $0 or round to $0.
See accompanying Notes to Financial Statements.
2016 Annual Report
117
Financial Highlights (continued)
Selected Data for Each Share of Capital Outstanding Throughout the Periods Indicated
Aberdeen Japanese Equities Fund (concluded)
| Ratios/Supplemental Data | ||||||||||||||||||||||
| Total Return (b)(c) | Net Assets at End of Period (000’s) | Ratio of Expenses (Net of Reimbursements/Waivers) to Average Net Assets (d) | Ratio of Net Investment Income (Loss) to Average Net Assets (d) | Ratio of Expenses (Prior to Reimbursements) to Average Net Assets (d)(e) | Portfolio Turnover (c)(f) | |||||||||||||||||
| 10.27 | % | $ | 22 | 1.25 | % | 0.67 | % | 19.03 | % | 8.21 | % | |||||||||||
| 9.50 | % | 11 | 2.00 | % | (0.22 | %) | 19.78 | % | 8.21 | % | ||||||||||||
| 10.05 | % | 11 | 1.50 | % | 0.28 | % | 19.28 | % | 8.21 | % | ||||||||||||
| 10.50 | % | 11 | 1.00 | % | 0.78 | % | 18.78 | % | 8.21 | % | ||||||||||||
| 10.50 | % | 1,061 | 1.00 | % | 0.79 | % | 18.78 | % | 8.21 | % | ||||||||||||
| (e) | During the period, certain fees were waived and/or reimbursed. If such waivers/reimbursements had not occurred, the ratios would have been as indicated. |
| (f) | Portfolio turnover is calculated on the basis of the Fund as a whole without distinguishing among the classes of shares. |
| (g) | For the period from November 30, 2015 (commencement of operations) through October 31, 2016. |
| (h) | Less than $0.005 per share. |
Annual Report 2016
118
Financial Highlights (continued)
Selected Data for Each Share of Capital Outstanding Throughout the Periods Indicated
Aberdeen U.S. Mid Cap Equity Fund
| Investment Activities | ||||||||||||||||||||
| Net Asset Value, Beginning of Period | Net Investment Income (Loss) (a) | Net Realized and Unrealized Gains on Investments | Total from Investment Activities | Net Asset Value, End of Period | ||||||||||||||||
Class A Shares | ||||||||||||||||||||
Year Ended October 31, 2016(g) | $ | 10.00 | $ | 0.01 | $ | 0.94 | $ | 0.95 | $ | 10.95 | ||||||||||
Class C Shares | ||||||||||||||||||||
Year Ended October 31, 2016(g) | 10.00 | (0.05 | ) | 0.94 | 0.89 | 10.89 | ||||||||||||||
Class R Shares | ||||||||||||||||||||
Year Ended October 31, 2016(g) | 10.00 | (0.01 | ) | 0.94 | 0.93 | 10.93 | ||||||||||||||
Institutional Service Class Shares | ||||||||||||||||||||
Year Ended October 31, 2016(g) | 10.00 | 0.02 | 0.95 | 0.97 | 10.97 | |||||||||||||||
Institutional Class Shares | ||||||||||||||||||||
Year Ended October 31, 2016(g) | 10.00 | 0.02 | 0.95 | 0.97 | 10.97 | |||||||||||||||
| (a) | Net investment income/(loss) is based on average shares outstanding during the period. |
| (b) | Excludes sales charge. |
| (c) | Not annualized for periods less than one year. |
| (d) | Annualized for periods less than one year. |
Amounts listed as “–” are $0 or round to $0.
See accompanying Notes to Financial Statements.
2016 Annual Report
119
Financial Highlights (continued)
Selected Data for Each Share of Capital Outstanding Throughout the Periods Indicated
Aberdeen U.S. Mid Cap Equity Fund (concluded)
| Ratios/Supplemental Data | ||||||||||||||||||||||
| Total Return (b)(c) | Net Assets at End of Period (000’s) | Ratio of Expenses (Net of Reimbursements/Waivers) | Ratio of Net to Average Net Assets | Ratio of Expenses (Prior to Reimbursements) to Average Net Assets (d)(e) | Portfolio Turnover (c)(f) | |||||||||||||||||
| 9.50 | % | $ | 12 | 1.25 | % | 0.09 | % | 15.77 | % | 18.10 | % | |||||||||||
| 8.90 | % | 11 | 2.00 | % | (0.67 | %) | 16.52 | % | 18.10 | % | ||||||||||||
| 9.30 | % | 11 | 1.50 | % | (0.17 | %) | 16.02 | % | 18.10 | % | ||||||||||||
| 9.70 | % | 11 | 1.00 | % | 0.33 | % | 15.52 | % | 18.10 | % | ||||||||||||
| 9.70 | % | 1,053 | 1.00 | % | 0.33 | % | 15.52 | % | 18.10 | % | ||||||||||||
| (e) | During the period, certain fees were waived and/or reimbursed. If such waivers/reimbursements had not occurred, the ratios would have been as indicated. |
| (f) | Portfolio turnover is calculated on the basis of the Fund as a whole without distinguishing among the classes of shares. |
| (g) | For the period from February 29, 2016 (commencement of operations) through October 31, 2016. |
Annual Report 2016
120
Financial Highlights (continued)
Selected Data for Each Share of Capital Outstanding Throughout the Periods Indicated
Aberdeen U.S. Multi-Cap Equity Fund
| Investment Activities | Distributions | |||||||||||||||||||||||||||||||
| Net Asset Value, Beginning of Period | Net Investment Income (Loss) (a) | Net Realized and Unrealized Gains (Losses) on Investments | Total from Investment Activities | Net Investment Income | Net Realized Gains | Total Distributions | Net Asset Value, End of Period | |||||||||||||||||||||||||
Class A Shares | ||||||||||||||||||||||||||||||||
Year Ended October 31, 2016 | $ | 12.52 | $ | 0.03 | $ | 0.21 | $ | 0.24 | $ | (0.02 | ) | $ | (0.61 | ) | $ | (0.63 | ) | $ | 12.13 | |||||||||||||
Year Ended October 31, 2015 | 13.40 | 0.11 | (0.02 | ) | 0.09 | (0.12 | ) | (0.85 | ) | (0.97 | ) | 12.52 | ||||||||||||||||||||
Year Ended October 31, 2014 | 12.41 | 0.12 | 1.09 | 1.21 | (0.13 | ) | (0.09 | ) | (0.22 | ) | 13.40 | |||||||||||||||||||||
Year Ended October 31, 2013 | 9.97 | 0.11 | 2.43 | 2.54 | (0.10 | ) | – | (0.10 | ) | 12.41 | ||||||||||||||||||||||
Year Ended October 31, 2012 | 9.04 | 0.08 | 0.91 | 0.99 | (0.06 | ) | – | (0.06 | ) | 9.97 | ||||||||||||||||||||||
Class C Shares | �� | |||||||||||||||||||||||||||||||
Year Ended October 31, 2016 | 11.40 | (0.05 | ) | 0.19 | 0.14 | – | (0.61 | ) | (0.61 | ) | 10.93 | |||||||||||||||||||||
Year Ended October 31, 2015 | 12.29 | 0.02 | (0.02 | ) | – | (h) | (0.04 | ) | (0.85 | ) | (0.89 | ) | 11.40 | |||||||||||||||||||
Year Ended October 31, 2014 | 11.40 | 0.02 | 1.00 | 1.02 | (0.04 | ) | (0.09 | ) | (0.13 | ) | 12.29 | |||||||||||||||||||||
Year Ended October 31, 2013 | 9.18 | 0.02 | 2.23 | 2.25 | (0.03 | ) | – | (0.03 | ) | 11.40 | ||||||||||||||||||||||
Year Ended October 31, 2012 | 8.34 | 0.01 | 0.84 | 0.85 | (0.01 | ) | – | (0.01 | ) | 9.18 | ||||||||||||||||||||||
Class R Shares | ||||||||||||||||||||||||||||||||
Year Ended October 31, 2016 | 11.96 | (0.01 | ) | 0.20 | 0.19 | (0.01 | ) | (0.61 | ) | (0.62 | ) | 11.53 | ||||||||||||||||||||
Year Ended October 31, 2015 | 12.85 | 0.08 | (0.02 | ) | 0.06 | (0.10 | ) | (0.85 | ) | (0.95 | ) | 11.96 | ||||||||||||||||||||
Year Ended October 31, 2014 | 11.91 | 0.09 | 1.04 | 1.13 | (0.10 | ) | (0.09 | ) | (0.19 | ) | 12.85 | |||||||||||||||||||||
Year Ended October 31, 2013 | 9.58 | 0.08 | 2.32 | 2.40 | (0.07 | ) | – | (0.07 | ) | 11.91 | ||||||||||||||||||||||
Year Ended October 31, 2012 | 8.67 | 0.05 | 0.89 | 0.94 | (0.03 | ) | – | (0.03 | ) | 9.58 | ||||||||||||||||||||||
Institutional Service Class Shares | ||||||||||||||||||||||||||||||||
Year Ended October 31, 2016 | 13.09 | 0.05 | 0.24 | 0.29 | (0.03 | ) | (0.61 | ) | (0.64 | ) | 12.74 | |||||||||||||||||||||
Year Ended October 31, 2015 | 13.98 | 0.14 | (0.03 | ) | 0.11 | (0.15 | ) | (0.85 | ) | (1.00 | ) | 13.09 | ||||||||||||||||||||
Year Ended October 31, 2014 | 12.93 | 0.15 | 1.14 | 1.29 | (0.15 | ) | (0.09 | ) | (0.24 | ) | 13.98 | |||||||||||||||||||||
Year Ended October 31, 2013 | 10.38 | 0.14 | 2.53 | 2.67 | (0.12 | ) | – | (0.12 | ) | 12.93 | ||||||||||||||||||||||
Year Ended October 31, 2012 | 9.40 | 0.11 | 0.95 | 1.06 | (0.08 | ) | – | (0.08 | ) | 10.38 | ||||||||||||||||||||||
Institutional Class Shares | ||||||||||||||||||||||||||||||||
Year Ended October 31, 2016 | 13.10 | 0.06 | 0.24 | 0.30 | (0.03 | ) | (0.61 | ) | (0.64 | ) | 12.76 | |||||||||||||||||||||
Year Ended October 31, 2015 | 13.99 | 0.15 | (0.03 | ) | 0.12 | (0.16 | ) | (0.85 | ) | (1.01 | ) | 13.10 | ||||||||||||||||||||
Year Ended October 31, 2014 | 12.94 | 0.16 | 1.15 | 1.31 | (0.17 | ) | (0.09 | ) | (0.26 | ) | 13.99 | |||||||||||||||||||||
Year Ended October 31, 2013 | 10.38 | 0.14 | 2.54 | 2.68 | (0.12 | ) | – | (0.12 | ) | 12.94 | ||||||||||||||||||||||
Year Ended October 31, 2012 | 9.40 | 0.11 | 0.95 | 1.06 | (0.08 | ) | – | (0.08 | ) | 10.38 | ||||||||||||||||||||||
| (a) | Net investment income/(loss) is based on average shares outstanding during the period. |
| (b) | Excludes sales charge. |
| (c) | Not annualized for periods less than one year. |
| (d) | Annualized for periods less than one year. |
Amounts listed as “–” are $0 or round to $0.
See accompanying Notes to Financial Statements.
2016 Annual Report
121
Financial Highlights (continued)
Selected Data for Each Share of Capital Outstanding Throughout the Periods Indicated
Aberdeen U.S. Multi-Cap Equity Fund (concluded)
| Ratios/Supplemental Data | ||||||||||||||||||||||
| Total Return (b)(c) | Net Assets at End of Period (000’s) | Ratio of Expenses | Ratio of Net Investment Income (Loss) to Average Net Assets (d) | Ratio of Expenses (Prior to Reimbursements) to Average Net Assets (d)(e) | Portfolio Turnover (f) | |||||||||||||||||
| 2.25 | % | $ | 225,723 | 1.19 | %(g) | 0.21 | % | 1.28 | %(g) | 63.11 | % | |||||||||||
| 0.50 | % | 247,549 | 1.17 | %(g) | 0.87 | % | 1.25 | %(g) | 16.92 | % | ||||||||||||
| 9.87 | % | 276,861 | 1.17 | % | 0.92 | % | 1.25 | % | 20.60 | % | ||||||||||||
| 25.54 | % | 282,602 | 1.15 | % | 0.94 | % | 1.23 | % | 19.53 | % | ||||||||||||
| 11.03 | % | 187,216 | 1.15 | % | 0.85 | % | 1.28 | % | 27.95 | % | ||||||||||||
| 1.56 | % | 5,883 | 1.90 | %(g) | (0.50 | %) | 2.08 | %(g) | 63.11 | % | ||||||||||||
| (0.27 | %) | 7,134 | 1.90 | %(g) | 0.15 | % | 1.98 | %(g) | 16.92 | % | ||||||||||||
| 9.07 | % | 8,469 | 1.90 | % | 0.19 | % | 1.98 | % | 20.60 | % | ||||||||||||
| 24.60 | % | 9,637 | 1.90 | % | 0.20 | % | 1.95 | % | 19.53 | % | ||||||||||||
| 10.23 | % | 7,899 | 1.90 | % | 0.10 | % | 2.00 | % | 27.95 | % | ||||||||||||
| 1.95 | % | 266 | 1.51 | %(g) | (0.12 | %) | 1.60 | %(g) | 63.11 | % | ||||||||||||
| 0.23 | % | 458 | 1.40 | %(g) | 0.62 | % | 1.48 | %(g) | 16.92 | % | ||||||||||||
| 9.62 | % | 351 | 1.40 | % | 0.69 | % | 1.48 | % | 20.60 | % | ||||||||||||
| 25.16 | % | 405 | 1.40 | % | 0.73 | % | 1.45 | % | 19.53 | % | ||||||||||||
| 10.91 | % | 416 | 1.40 | % | 0.56 | % | 1.50 | % | 27.95 | % | ||||||||||||
| 2.52 | % | 101,549 | 1.00 | %(g) | 0.40 | % | 1.09 | %(g) | 63.11 | % | ||||||||||||
| 0.59 | % | 109,288 | 0.99 | %(g) | 1.06 | % | 1.07 | %(g) | 16.92 | % | ||||||||||||
| 10.13 | % | 128,283 | 0.96 | % | 1.12 | % | 1.07 | % | 20.60 | % | ||||||||||||
| 25.84 | % | 128,368 | 0.90 | % | 1.21 | % | 1.05 | % | 19.53 | % | ||||||||||||
| 11.37 | % | 115,150 | 0.90 | % | 1.10 | % | 1.11 | % | 27.95 | % | ||||||||||||
| 2.63 | % | 6,742 | 0.90 | %(g) | 0.50 | % | 1.02 | %(g) | 63.11 | % | ||||||||||||
| 0.68 | % | 7,059 | 0.90 | %(g) | 1.13 | % | 0.98 | %(g) | 16.92 | % | ||||||||||||
| 10.23 | % | 3,437 | 0.90 | % | 1.18 | % | 0.98 | % | 20.60 | % | ||||||||||||
| 26.00 | % | 3,867 | 0.90 | % | 1.21 | % | 0.95 | % | 19.53 | % | ||||||||||||
| 11.37 | % | 2,584 | 0.90 | % | 1.13 | % | 1.00 | % | 27.95 | % | ||||||||||||
| (e) | During the period, certain fees were waived and/or reimbursed. If such waivers/reimbursements had not occurred, the ratios would have been as indicated. |
| (f) | Portfolio turnover is calculated on the basis of the Fund as a whole without distinguishing among the classes of shares. |
| (g) | Includes interest expense that amounts to less than 0.01%. |
| (h) | Less than $0.005 per share. |
Annual Report 2016
122
Financial Highlights (continued)
Selected Data for Each Share of Capital Outstanding Throughout the Periods Indicated
Aberdeen U.S. Small Cap Equity Fund
| Investment Activities | ||||||||||||||||||||
| Net Asset Value, Beginning of Period | Net Investment Income (Loss) (a) | Net Realized and Unrealized Gains on Investments | Total from Investment Activities | Net Asset Value, End of Period | ||||||||||||||||
Class A Shares | ||||||||||||||||||||
Year Ended October 31, 2016 | $ | 26.62 | $ | (0.09 | ) | $ | 2.18 | $ | 2.09 | $ | 28.71 | |||||||||
Year Ended October 31, 2015 | 23.90 | (0.08 | ) | 2.80 | 2.72 | 26.62 | ||||||||||||||
Year Ended October 31, 2014 | 21.86 | 0.01 | 2.03 | 2.04 | 23.90 | |||||||||||||||
Year Ended October 31, 2013 | 15.85 | 0.05 | 5.96 | 6.01 | 21.86 | |||||||||||||||
Year Ended October 31, 2012 | 14.06 | (0.07 | ) | 1.86 | 1.79 | 15.85 | ||||||||||||||
Class C Shares | ||||||||||||||||||||
Year Ended October 31, 2016 | 23.46 | (0.24 | ) | 1.90 | 1.66 | 25.12 | ||||||||||||||
Year Ended October 31, 2015 | 21.20 | (0.23 | ) | 2.49 | 2.26 | 23.46 | ||||||||||||||
Year Ended October 31, 2014 | 19.53 | (0.14 | ) | 1.81 | 1.67 | 21.20 | ||||||||||||||
Year Ended October 31, 2013 | 14.26 | (0.07 | ) | 5.34 | 5.27 | 19.53 | ||||||||||||||
Year Ended October 31, 2012 | 12.73 | (0.16 | ) | 1.69 | 1.53 | 14.26 | ||||||||||||||
Class R Shares | ||||||||||||||||||||
Year Ended October 31, 2016 | 24.78 | (0.13 | ) | 2.02 | 1.89 | 26.67 | ||||||||||||||
Year Ended October 31, 2015 | 22.30 | (0.14 | ) | 2.62 | 2.48 | 24.78 | ||||||||||||||
Year Ended October 31, 2014 | 20.44 | (0.04 | ) | 1.90 | 1.86 | 22.30 | ||||||||||||||
Year Ended October 31, 2013 | 14.85 | 0.01 | 5.58 | 5.59 | 20.44 | |||||||||||||||
Year Ended October 31, 2012 | 13.21 | (0.10 | ) | 1.74 | 1.64 | 14.85 | ||||||||||||||
Institutional Service Class Shares | ||||||||||||||||||||
Year Ended October 31, 2016 | 27.90 | (0.02 | ) | 2.29 | 2.27 | 30.17 | ||||||||||||||
Year Ended October 31, 2015 | 24.96 | (1.71 | ) | 4.65 | 2.94 | 27.90 | ||||||||||||||
Year Ended October 31, 2014 | 22.76 | 0.08 | 2.12 | 2.20 | 24.96 | |||||||||||||||
Year Ended October 31, 2013 | 16.47 | 0.09 | 6.20 | 6.29 | 22.76 | |||||||||||||||
Year Ended October 31, 2012 | 14.56 | (0.02 | ) | 1.93 | 1.91 | 16.47 | ||||||||||||||
Institutional Class Shares | ||||||||||||||||||||
Year Ended October 31, 2016 | 27.87 | – | (f) | 2.27 | 2.27 | 30.14 | ||||||||||||||
Year Ended October 31, 2015 | 24.93 | – | 2.94 | 2.94 | 27.87 | |||||||||||||||
Year Ended October 31, 2014 | 22.73 | 0.07 | 2.13 | 2.20 | 24.93 | |||||||||||||||
Year Ended October 31, 2013 | 16.43 | 0.12 | 6.18 | 6.30 | 22.73 | |||||||||||||||
Year Ended October 31, 2012 | 14.53 | (0.02 | ) | 1.92 | 1.90 | 16.43 | ||||||||||||||
| (a) | Net investment income/(loss) is based on average shares outstanding during the period. |
| (b) | Excludes sales charge. |
| (c) | During the period, certain fees were waived and/or reimbursed. If such waivers/reimbursements had not occurred, the ratios would have been as indicated. |
Amounts listed as “–” are $0 or round to $0.
See accompanying Notes to Financial Statements.
2016 Annual Report
123
Financial Highlights (concluded)
Selected Data for Each Share of Capital Outstanding Throughout the Periods Indicated
Aberdeen U.S. Small Cap Equity Fund (concluded)
| Ratios/Supplemental Data | ||||||||||||||||||||||
| Total Return (b) | Net Assets at End of Period (000’s) | Ratio of Expenses (Net of Reimbursements/Waivers) to Average Net Assets (c) | Ratio of Net Investment Income (Loss) to Average Net Assets (c) | Ratio of Expenses (Prior to Reimbursements) to Average Net Assets (c) | Portfolio Turnover (d) | |||||||||||||||||
| 7.85 | % | $ | 259,556 | 1.46 | % | (0.33 | %) | 1.39 | % | 32.20 | % | |||||||||||
| 11.38 | % | 75,005 | 1.46 | % | (0.33 | %) | 1.53 | % | 29.43 | % | ||||||||||||
| 9.33 | % | 72,790 | 1.47 | % | 0.03 | % | 1.59 | % | 29.32 | % | ||||||||||||
| 37.92 | % | 81,916 | 1.47 | % | 0.25 | % | 1.58 | % | 39.71 | % | ||||||||||||
| 12.73 | % | 70,189 | 1.47 | % | (0.46 | %) | 1.55 | % | 23.05 | % | ||||||||||||
| 7.08 | % | 78,109 | 2.15 | % | (0.96 | %) | 2.12 | % | 32.20 | % | ||||||||||||
| 10.66 | % | 35,665 | 2.15 | % | (1.02 | %) | 2.22 | % | 29.43 | % | ||||||||||||
| 8.55 | % | 31,346 | 2.15 | % | (0.66 | %) | 2.27 | % | 29.32 | % | ||||||||||||
| 36.96 | % | 32,664 | 2.15 | % | (0.42 | %) | 2.26 | % | 39.71 | % | ||||||||||||
| 12.02 | % | 29,734 | 2.15 | % | (1.13 | %) | 2.23 | % | 23.05 | % | ||||||||||||
| 7.63 | %(e) | 13,722 | 1.68 | % | (0.49 | %) | 1.65 | % | 32.20 | % | ||||||||||||
| 11.12 | % | 4,601 | 1.71 | % | (0.59 | %) | 1.78 | % | 29.43 | % | ||||||||||||
| 9.10 | % | 1,152 | 1.70 | % | (0.19 | %) | 1.82 | % | 29.32 | % | ||||||||||||
| 37.64 | % | 1,507 | 1.67 | % | 0.08 | % | 1.78 | % | 39.71 | % | ||||||||||||
| 12.41 | % | 2,195 | 1.73 | % | (0.68 | %) | 1.81 | % | 23.05 | % | ||||||||||||
| 8.14 | % | 47,421 | 1.14 | % | (0.06 | %) | 1.13 | % | 32.20 | % | ||||||||||||
| 11.78 | % | 9,101 | 1.18 | % | (6.38 | %) | 1.25 | % | 29.43 | % | ||||||||||||
| 9.67 | % | 1,626 | 1.15 | % | 0.33 | % | 1.27 | % | 29.32 | % | ||||||||||||
| 38.19 | % | 1,694 | 1.15 | % | 0.48 | % | 1.26 | % | 39.71 | % | ||||||||||||
| 13.12 | % | 11,909 | 1.15 | % | (0.13 | %) | 1.23 | % | 23.05 | % | ||||||||||||
| 8.15 | %(e) | 746,112 | 1.14 | % | 0.01 | % | 1.12 | % | 32.20 | % | ||||||||||||
| 11.79 | % | 235,400 | 1.15 | % | 0.02 | % | 1.22 | % | 29.43 | % | ||||||||||||
| 9.68 | % | 27,404 | 1.15 | % | 0.30 | % | 1.27 | % | 29.32 | % | ||||||||||||
| 38.34 | % | 19,619 | 1.15 | % | 0.61 | % | 1.26 | % | 39.71 | % | ||||||||||||
| 13.08 | % | 26,346 | 1.15 | % | (0.10 | %)�� | 1.23 | % | 23.05 | % | ||||||||||||
| (d) | Portfolio turnover is calculated on the basis of the Fund as a whole without distinguishing among the classes of shares. |
| (e) | The total return shown above includes the impact of financial statement rounding of the NAV per share and/or financial statement adjustments. |
| (f) | Less than $0.005 per share. |
Annual Report 2016
124
This page intentionally left blank.
October 31, 2016
1. Organization
Aberdeen Funds (the “Trust”) was organized as a statutory trust under the laws of the state of Delaware by a Certificate of Trust filed on September 27, 2007 and is registered under the Investment Company Act of 1940, as amended (the “1940 Act”), as an open-end management investment company. As of October 31, 2016, the Trust had authorized an unlimited number of shares of beneficial interest (“shares”) without par value. As of October 31, 2016, the Trust operated nineteen (19) separate series, or mutual funds, each with its own investment objective(s) and strategies. This report contains the financial statements and financial highlights of the twelve (12) funds listed below (each a “Fund”; collectively, the “Funds”):
| – | Aberdeen Asia-Pacific (ex-Japan) Equity Fund (“Asia-Pacific (ex-Japan) Equity Fund”) |
| – | Aberdeen China Opportunities Fund (“China Opportunities Fund”) |
| – | Aberdeen Emerging Markets Fund (“Emerging Markets Fund”) |
| – | Aberdeen Equity Long-Short Fund (“Equity Long-Short Fund”) |
| – | Aberdeen Global Equity Fund (“Global Equity Fund”)*,** |
| – | Aberdeen Global Natural Resources Fund (“Global Natural Resources Fund”)** |
| – | Aberdeen International Equity Fund (“International Equity Fund”) |
| – | Aberdeen International Small Cap Fund (“International Small Cap Fund”, formerly the “Aberdeen Global Small Cap Fund”) |
| – | Aberdeen Japanese Equities Fund (“Japanese Equities Fund”)*** |
| – | Aberdeen U.S. Mid Cap Equity Fund (“U.S. Mid Cap Equity Fund”)**** |
| – | Aberdeen U.S. Multi-Cap Equity Fund (“U.S. Multi-Cap Equity Fund”, formerly the “Aberdeen U.S. Equity Fund”) |
| – | Aberdeen U.S. Small Cap Equity Fund (“U.S. Small Cap Equity Fund”, formerly the “Aberdeen Small Cap Fund”) |
| * | On February 25, 2015, the Global Equity Fund acquired the assets and assumed the liabilities of the Aberdeen Global Select Opportunities Fund Inc. (the “Global Select Opportunities Fund”). The Global Equity Fund is considered the accounting survivor of the reorganization. |
| In connection with the reorganization, the Global Select Opportunities Fund’s Class A and Institutional Class shares were exchanged for Class A and Institutional Class shares of the Global Equity Fund, respectively. |
| The following is a summary of the net assets reorganized and net asset value per share issued as of February 25, 2015. |
| Shares Issued of the Global Equity Fund | Fund Net Assets Reorganized from the Global Select Opportunities Fund | Net Asset Value Per Shares Issued of the Global Equity Fund | ||||||||||
Class A | 364,123 | $4,987,280 | $13.70 | |||||||||
Class C | – | – | – | |||||||||
Class R | – | – | – | |||||||||
Institutional Service Class | – | – | – | |||||||||
Institutional Class | 86,882 | 1,191,495 | 13.71 | |||||||||
| ** | Subsequent to the close of this reporting period, on November 21, 2016, the Global Equity Fund acquired the assets and assumed the liabilities of the Global Natural Resources Fund in a reorganization. In connection with the reorganization, each shareholder of the Global Natural Resources Fund received corresponding shares of the Global Equity Fund. Please see Note 12 for additional information. |
| *** | On November 30, 2015, the Japanese Equities Fund commenced operations. |
| **** | On February 29, 2016, the U.S. Mid Cap Equity Fund commenced operations. |
The Board of Trustees of the Trust (the “Board”) approved a Plan of Liquidation for each of the Aberdeen Asia-Pacific Smaller Companies Fund, Aberdeen Latin American Equity Fund and Aberdeen European Equity Fund pursuant to which each Fund was liquidated on August 15, 2016 (the “Liquidations”). Shareholder approval of the Liquidations was not required.
2. Summary of Significant Accounting Policies
The following is a summary of significant accounting policies followed by the Funds in the preparation of their financial statements. The policies conform to accounting principles generally accepted in the United States of America (“GAAP”). The preparation of financial statements requires management to make estimates and assumptions that affect the reported amounts of assets and liabilities, disclosure of contingent assets and liabilities at the date of the financial statements, and the reported amounts of income and expenses for the period. Actual results could differ from those estimates. The accounting records of the Funds are maintained in U.S. Dollars.
Annual Report 2016
126
Notes to Financial Statements (continued)
October 31, 2016
| a. | Security Valuation |
The Funds value their securities at current market value or fair value, consistent with regulatory requirements. “Fair value” is defined in the Funds’ Valuation and Liquidity Procedures as the price that could be received to sell an asset or paid to transfer a liability in an orderly transaction between willing market participants without a compulsion to contract at the measurement date.
Equity securities that are traded on an exchange are valued at the last quoted sale price on the principal exchange on which the security is traded at the “Valuation Time” subject to application, when appropriate, of the valuation factors described in the paragraph below. Under normal circumstances, the Valuation Time is as of the close of regular trading on the New York Stock Exchange (usually 4:00 p.m. Eastern Time). In the absence of a sale price, the security is valued at the mean of the bid/ask price quoted at the close on the principal exchange on which the security is traded. Securities traded on NASDAQ are valued at the NASDAQ official closing price.
In accordance with the authoritative guidance on fair value measurements and disclosures under GAAP, the Funds disclose the fair value of their investments using a three-level hierarchy that classifies the inputs to valuation techniques used to measure the fair value. The hierarchy assigns Level 1 measurements to valuations based upon unadjusted quoted prices in active markets for identical assets, Level 2 measurements to valuations based upon other significant observable inputs, including adjusted quoted prices in active markets for similar assets, and Level 3 measurements to valuations based upon unobservable inputs that are significant to the valuation. Observable inputs are inputs that reflect the assumptions market participants would use in pricing the asset or liability, which are based on market data obtained from sources independent of the reporting entity. Unobservable inputs are inputs that reflect the reporting entity’s own assumptions about the assumptions market participants would use in pricing the asset or liability developed based on the best information available in the circumstances. A financial instrument’s level within the fair value hierarchy is based upon the lowest level of any input that is significant to the fair value measurement. Open-end mutual funds are valued at the respective net asset value as reported by such company. The prospectuses for the registered open-end management investment companies in which a Fund invests explain the circumstances under which those companies will use fair value pricing and the effects of using fair value pricing. Closed-end funds and exchange-traded funds (“ETFs”) are valued at the market price of the security at the Valuation Time. A security using any of these pricing methodologies is determined to be a Level 1 investment.
Foreign equity securities that are traded on foreign exchanges that close prior to Valuation Time are valued by applying valuation factors to the last sale price or the mean price as noted above. Valuation factors are provided by an independent pricing service provider approved by the Board. These valuation factors are used when pricing a Fund’s portfolio holdings to estimate market movements between the time foreign markets close and the time a Fund values such foreign securities. These valuation factors are based on inputs such as depositary receipts, indices, futures, sector indices/ETFs, exchange rates, and local exchange opening and closing prices of each security. When prices with the application of valuation factors are utilized, the value assigned to the foreign securities may not be the same as quoted or published prices of the securities on their primary markets. A security that applies a valuation factor is determined to be a Level 2 investment because the exchange-traded price has been adjusted. Valuation factors are not utilized if the independent pricing service provider is unable to provide a valuation factor or if the valuation factor falls below a predetermined threshold; in such case, the security is determined to be a Level 1 investment.
Short-term investments are comprised of cash and cash equivalents invested in short-term investment funds which are redeemable daily. The Funds sweep available cash into the State Street Institutional U.S. Government Money Market Fund, which has elected to qualify as a “government money market fund” pursuant to Rule 2a-7 under the 1940 Act and has an objective to maintain a $1.00 NAV, which is not guaranteed. Generally, these investment types are categorized as Level 1 investments.
Forward foreign currency contracts are generally valued based on the bid price of the forward rates and the current spot rate. Forward exchange rate quotations are available for scheduled settlement dates, such as 1-, 3-, 6-, 9- and 12-month periods. An interpolated valuation is derived based on the actual settlement dates of the forward contracts held. Futures contracts are valued at the settlement price or at the last bid price if no settlement price is available. Interest rate swaps agreements are generally valued by an approved pricing agent based on the terms of the swap agreement (including future cash flows).
In the event that a security’s market quotations are not readily available or are deemed unreliable (for reasons other than because the foreign exchange on which it trades closed before the Valuation Time), the security is valued at fair value as determined by the Funds’ pricing committee (the “Pricing Committee”), taking into account the relevant factors and surrounding circumstances using Valuation and Liquidity Procedures approved by the Board. A security that has been fair valued by the Pricing Committee may be classified as Level 2 or Level 3 depending on the nature of the inputs.
The three-level hierarchy of inputs is summarized below:
| • | Level 1- quoted prices in active markets for identical investments; |
2016 Annual Report
127
Notes to Financial Statements (continued)
October 31, 2016
| • | Level 2- other significant observable inputs (including quoted prices for similar securities, interest rates, prepayment speeds, and credit risk); or |
| • | Level 3- significant unobservable inputs (including a Fund’s own assumptions in determining the fair value of investments). |
A summary of standard inputs is listed below:
| Security Type | Standard Inputs | |
Foreign equities utilizing a fair value factor | Depositary receipts, indices, futures, sector indices/ETFs, exchange rates, and local exchange opening and closing prices of each security. |
The following is a summary of the inputs used as of October 31, 2016 in valuing the Funds’ investments at fair value. The inputs or methodologies used for valuing securities are not necessarily an indication of the risk associated with investing in those securities.
Please refer to the Statements of Investments for a detailed breakout of the security types:
| Investments, at Value | LEVEL 1–Quoted Prices ($) | LEVEL 2–Other Significant Observable Inputs ($) | LEVEL 3–Significant Unobservable Inputs ($) | Total ($) | ||||||||||||
| Asia-Pacific (ex-Japan) Equity Fund | ||||||||||||||||
| Investments in Securities | ||||||||||||||||
Common Stocks | 743,907 | 12,959,071 | – | 13,702,978 | ||||||||||||
Preferred Stocks | – | 875,832 | – | 875,832 | ||||||||||||
Short-Term Investment | 150,052 | – | – | 150,052 | ||||||||||||
|
|
|
|
|
|
|
| |||||||||
| 893,959 | 13,834,903 | – | 14,728,862 | |||||||||||||
|
|
|
|
|
|
|
| |||||||||
| China Opportunities Fund | ||||||||||||||||
| Investments in Securities | ||||||||||||||||
Common Stocks | 721,849 | 13,490,796 | – | 14,212,645 | ||||||||||||
Short-Term Investment | 214,463 | – | – | 214,463 | ||||||||||||
|
|
|
|
|
|
|
| |||||||||
| 936,312 | 13,490,796 | – | 14,427,108 | |||||||||||||
|
|
|
|
|
|
|
| |||||||||
| Emerging Markets Fund | ||||||||||||||||
| Investments in Securities | ||||||||||||||||
Common Stocks | 2,179,834,549 | 4,926,681,678 | – | 7,106,516,227 | ||||||||||||
Preferred Stocks | 267,438,788 | 396,269,058 | – | 663,707,846 | ||||||||||||
Short-Term Investment | 200,531,487 | – | – | 200,531,487 | ||||||||||||
|
|
|
|
|
|
|
| |||||||||
| 2,647,804,824 | 5,322,950,736 | – | 7,970,755,560 | |||||||||||||
|
|
|
|
|
|
|
| |||||||||
| Equity Long-Short Fund | ||||||||||||||||
| Investments in Securities | ||||||||||||||||
Common Stocks–Long Positions | 59,359,506 | – | – | 59,359,506 | ||||||||||||
Short-Term Investment | 10,646,044 | – | – | 10,646,044 | ||||||||||||
Common Stocks–Short Positions | (30,385,051 | ) | – | – | (30,385,051 | ) | ||||||||||
Exchange Traded Funds–Short Positions | (1,402,823 | ) | – | – | (1,402,823 | ) | ||||||||||
|
|
|
|
|
|
|
| |||||||||
| 38,217,676 | – | – | 38,217,676 | |||||||||||||
|
|
|
|
|
|
|
| |||||||||
Annual Report 2016
128
Notes to Financial Statements (continued)
October 31, 2016
| Investments, at Value | LEVEL 1–Quoted Prices ($) | LEVEL 2–Other Significant Observable Inputs ($) | LEVEL 3–Significant Unobservable Inputs ($) | Total ($) | ||||||||||||
| Global Equity Fund | ||||||||||||||||
| Investments in Securities | ||||||||||||||||
Common Stocks | 38,917,102 | 40,912,992 | – | 79,830,094 | ||||||||||||
Preferred Stocks | 3,956,988 | 1,748,017 | – | 5,705,005 | ||||||||||||
Short-Term Investment | 3,417,398 | – | – | 3,417,398 | ||||||||||||
|
|
|
|
|
|
|
| |||||||||
| 46,291,488 | 42,661,009 | – | 88,952,497 | |||||||||||||
|
|
|
|
|
|
|
| |||||||||
| Global Natural Resources Fund | ||||||||||||||||
| Investments in Securities | ||||||||||||||||
Common Stocks | 6,958,660 | 7,014,633 | – | 13,973,293 | ||||||||||||
Preferred Stocks | 488,642 | – | – | 488,642 | ||||||||||||
Short-Term Investment | 93,005 | – | – | 93,005 | ||||||||||||
|
|
|
|
|
|
|
| |||||||||
| 7,540,307 | 7,014,633 | – | 14,554,940 | |||||||||||||
|
|
|
|
|
|
|
| |||||||||
| International Equity Fund | ||||||||||||||||
| Investments in Securities | ||||||||||||||||
Common Stocks | 54,058,515 | 356,950,266 | – | 411,008,781 | ||||||||||||
Preferred Stocks | 23,797,531 | 11,284,992 | – | 35,082,523 | ||||||||||||
Short-Term Investment | 10,521,547 | – | – | 10,521,547 | ||||||||||||
|
|
|
|
|
|
|
| |||||||||
| 88,377,593 | 368,235,258 | – | 456,612,851 | |||||||||||||
|
|
|
|
|
|
|
| |||||||||
| International Small Cap Fund | ||||||||||||||||
| Investments in Securities | ||||||||||||||||
Common Stocks | 25,715,985 | 47,208,476 | – | 72,924,461 | ||||||||||||
Short-Term Investment | 581,817 | – | – | 581,817 | ||||||||||||
|
|
|
|
|
|
|
| |||||||||
| 26,297,802 | 47,208,476 | – | 73,506,278 | |||||||||||||
|
|
|
|
|
|
|
| |||||||||
| Japanese Equities Fund | ||||||||||||||||
| Investments in Securities | ||||||||||||||||
Common Stocks | – | 1,079,604 | – | 1,079,604 | ||||||||||||
Short-Term Investment | 17,194 | – | – | 17,194 | ||||||||||||
|
|
|
|
|
|
|
| |||||||||
| 17,194 | 1,079,604 | – | 1,096,798 | |||||||||||||
|
|
|
|
|
|
|
| |||||||||
| U.S. Mid Cap Equity Fund | ||||||||||||||||
| Investments in Securities | ||||||||||||||||
Common Stocks | 1,118,017 | – | – | 1,118,017 | ||||||||||||
Short-Term Investment | 17,982 | – | – | 17,982 | ||||||||||||
|
|
|
|
|
|
|
| |||||||||
| 1,135,999 | – | – | 1,135,999 | |||||||||||||
|
|
|
|
|
|
|
| |||||||||
| U.S. Multi-Cap Equity Fund | ||||||||||||||||
| Investments in Securities | ||||||||||||||||
Common Stocks | 333,515,395 | – | – | 333,515,395 | ||||||||||||
Short-Term Investment | 7,522,891 | – | – | 7,522,891 | ||||||||||||
|
|
|
|
|
|
|
| |||||||||
| 341,038,286 | – | – | 341,038,286 | |||||||||||||
|
|
|
|
|
|
|
| |||||||||
2016 Annual Report
129
Notes to Financial Statements (continued)
October 31, 2016
| Investments, at Value | LEVEL 1–Quoted Prices ($) | LEVEL 2–Other Significant Observable Inputs ($) | LEVEL 3–Significant Unobservable Inputs ($) | Total ($) | ||||||||||||
| U.S. Small Cap Equity Fund | ||||||||||||||||
| Investments in Securities | ||||||||||||||||
Common Stocks | 1,133,904,836 | – | – | 1,133,904,836 | ||||||||||||
Short-Term Investment | 14,764,752 | – | – | 14,764,752 | ||||||||||||
|
|
|
|
|
|
|
| |||||||||
| 1,148,669,588 | – | – | 1,148,669,588 | |||||||||||||
|
|
|
|
|
|
|
| |||||||||
For movements between the Levels within the fair value hierarchy, the Funds have adopted a policy of recognizing transfers at the end of each fiscal period. As described above, certain foreign securities are valued utilizing valuation factors provided by an independent pricing service to reflect any significant market movements between the time foreign markets close and the time the Fund values such foreign securities. The utilization of valuation factors may result in transfers between Level 1 and Level 2. The following is a summary of transfers from Level 1 and Level 2 as of October 31, 2016.
| Fund | Transfer from Level 1 | Transfer from Level 2 | ||||||
Asia-Pacific (ex-Japan) Equity Fund | $ | – | $ | 583,512 | ||||
China Opportunities Fund | $ | 758,437 | $ | 308,850 | ||||
Emerging Markets Fund | $ | – | $ | 305,809,807 | ||||
Global Equity Fund | $ | – | $ | 1,425,294 | ||||
Global Natural Resources Fund | $ | 241,371 | $ | – | ||||
International Equity Fund | $ | – | $ | 9,343,594 | ||||
International Small Cap Fund | $ | 3,133,996 | $ | 5,522,632 | ||||
| b. | Restricted Securities |
Restricted securities are privately-placed securities whose resale is restricted under U.S. securities laws. The Funds may invest in restricted securities, including unregistered securities eligible for resale without registration pursuant to Rule 144A and privately-placed securities of U.S. and non-U.S. issuers offered outside the U.S. without registration pursuant to Regulation S under the Securities Act of 1933, as amended (the “1933 Act”). Rule 144A securities may be freely traded among certain qualified institutional investors, such as the Funds, but resale of such securities in the U.S. is permitted only in limited circumstances.
| c. | Foreign Currency Translation |
Foreign currency amounts are translated into U.S. Dollars at the current rate of exchange as of the Valuation Time to determine the value of investments, assets and liabilities. Purchases and sales of securities, and income and expenses are translated at the prevailing rate of exchange on the respective date of these transactions. The Funds do not isolate that portion of the results of operations resulting from changes in foreign exchange rates on investments from fluctuations arising from changes in market prices of securities held. These fluctuations are included with the net realized and unrealized gain or loss from investments and foreign currencies within the Statements of Operations.
Foreign securities, currencies, and other assets and liabilities denominated in foreign currencies are translated into U.S. Dollars at the exchange rate of said currencies against the U.S. Dollar, as of the Valuation Time, as provided by an independent pricing service.
| d. | Rights Issues and Warrants |
Rights issues give the right, normally to existing shareholders, to buy a proportional number of additional securities at a given price (generally at a discount) within a fixed period (generally on a short term period) and are offered at the company’s discretion. Warrants are securities that give the holder the right to buy common stock at a specified price for a specified period of time. Rights issues and warrants are speculative and have no value if they are not exercised before the expiration date. Rights issues and warrants are valued at the last sale price on the exchange on which they are traded.
| e. | Short Sales |
During the fiscal year, the Equity Long-Short Fund engaged in short-selling of portfolio securities, which obligates the Fund to replace any security that it has borrowed by purchasing the security at current market value sometime in the future. The Fund will incur a loss if the price of the security increases between the date of the short sale and the date on which the Fund replaces the borrowed security. The Fund generally will realize a gain if the price of the security declines between these dates. Until the Fund replaces the borrowed security, the Fund will segregate or earmark cash, other liquid assets and/or securities held long to sufficiently cover the Fund’s short position on a daily basis.
Annual Report 2016
130
Notes to Financial Statements (continued)
October 31, 2016
Dividends declared on securities sold short are recorded as an expense on the ex-dividend date and paid to the counterparty on the dividend pay date. The collateral for securities sold short includes the deposits with brokers and securities held long as shown in the Statement of Investments for the Fund.
| f. | Security Transactions, Investment Income and Expenses |
Security transactions are recorded on the trade date. Realized and unrealized gains/(losses) from security and currency transactions are calculated on the identified cost basis. Dividend income and corporate actions are recorded generally on the ex-date, except for certain dividends and corporate actions which may be recorded after the ex-date, as soon as a Fund acquires information regarding such dividends or corporate actions.
Interest income and expenses are recorded on an accrual basis. Expenses directly attributable to a Fund are charged to that Fund. Expenses not directly attributable to a Fund are allocated proportionately among the relevant Funds based on net assets of each. For each of the Funds, the method for allocating income, fund level expenses, and realized and unrealized gains or losses to a class is based on the total net asset value of that class’s shares in proportion to the total net assets of the relevant Fund. Expenses specific to a class (such as Rule 12b-1 and administrative services fees) are charged to that class.
| g. | Distributions |
Distributions from net investment income, if any, are declared and paid quarterly for all Funds. The Funds will also declare and pay distributions at least annually from net realized gains on investment transactions and net realized foreign exchange gains, if any. Dividends and distributions to shareholders are recorded on the ex-dividend date.
Dividends and distributions to shareholders are determined in accordance with federal income tax regulations, which may differ from GAAP. These differences are primarily due to differing treatments for foreign currencies and loss deferrals.
| h. | Federal Income Taxes |
Each Fund intends to continue to qualify as a “regulated investment company” by complying with the provisions available to certain investment companies, as defined in Subchapter M of the Internal Revenue Code of 1986, as amended, and to make distributions of net investment income and net realized capital gains sufficient to relieve the Funds from all federal income taxes. Therefore, no federal income tax provision is required. Management of the Funds has concluded that there are no significant uncertain tax positions that would require recognition in the financial statements. Since tax authorities can examine previously filed tax returns, the Funds’ U.S. federal and state tax returns for each of the four fiscal years up to the most recent fiscal year ended October 31 are subject to such review.
| i. | Foreign Withholding Tax |
Dividend and interest income from non-U.S. sources received by the Funds are generally subject to non-U.S. withholding taxes. In addition, the Funds may be subject to capital gains tax in certain countries in which they invest. The above taxes may be reduced or eliminated under the terms of applicable U.S. income tax treaties with some of these countries. The Funds accrue such taxes when the related income is earned.
| j. | Repurchase Agreements |
The Funds may enter into repurchase agreements under the terms of a Master Repurchase Agreement. It is each Fund’s policy that its custodian/counterparty segregate the underlying collateral securities, the value of which exceeds the principal amount of the repurchase transaction, including accrued interest. The repurchase price generally equals the price paid by a Fund plus interest negotiated on the basis of current short-term rates. To the extent that any repurchase transaction exceeds one business day, the collateral is valued on a daily basis to determine its adequacy. Under the Master Repurchase Agreement, if the counterparty defaults and the value of the collateral declines, or if bankruptcy proceedings are commenced with respect to the counterparty of the security, realization of the collateral by the Funds may be delayed or limited. Repurchase agreements are subject to contractual netting arrangements with the counterparty, Fixed Income Clearing Corp. To the extent a Fund enters into repurchase agreements, additional information on individual repurchase agreements is included in the Statements of Investments.
3. Agreements and Transactions with Affiliates
| a. | Investment Adviser |
Under the Investment Advisory Agreement with the Trust, Aberdeen Asset Management Inc. (“Aberdeen” or the “Adviser”) manages the Funds in accordance with the policies and procedures established by the Board.
2016 Annual Report
131
Notes to Financial Statements (continued)
October 31, 2016
For services provided under the terms of the current Investment Advisory Agreement, each Fund pays the Adviser an annual management fee (as a percentage of its average daily net assets) paid monthly according to the following schedule:
| Fund | Fee Schedule | |||||||
Asia-Pacific (ex-Japan) Equity Fund | On all assets | 1.00% | ||||||
China Opportunities Fund | Up to $500 million | 1.25% | ||||||
| $500 million up to $2 billion | 1.20% | |||||||
| On $2 billion and more | 1.15% | |||||||
Emerging Markets Fund | On all assets | 0.90% | ||||||
Equity Long-Short Fund | Up to $1 billion | 1.15% | ||||||
| On $1 billion and more | 1.00% | |||||||
Global Equity Fund | Up to $500 million | 0.90% | ||||||
| $500 million up to $2 billion | 0.85% | |||||||
| On $2 billion and more | 0.80% | |||||||
Global Natural Resources Fund | Up to $500 million | 0.70% | ||||||
| $500 million up to $2 billion | 0.65% | |||||||
| On $2 billion and more | 0.60% | |||||||
International Equity Fund | On all assets | 0.80% | ||||||
International Small Cap Fund | Up to $100 million | 1.25% | ||||||
| On $100 million and more | 1.00% | |||||||
Japanese Equities Fund | On all assets | 0.65% | ||||||
U.S. Mid Cap Equity Fund | Up to $500 million | 0.75% | ||||||
| $500 million up to $2 billion | 0.70% | |||||||
| On $2 billion and more | 0.65% | |||||||
U.S. Multi-Cap Equity Fund | Up to $500 million | 0.75% | ||||||
| $500 million up to $2 billion | 0.70% | |||||||
| On $2 billion and more | 0.65% | |||||||
U.S. Small Cap Equity Fund | Up to $100 million | 0.95% | ||||||
| On $100 million and more | 0.80% | |||||||
The Adviser has engaged the services of affiliates Aberdeen Asset Management Asia Limited (“AAMAL”) and Aberdeen Asset Managers Limited (“AAML”) as subadvisers (the “Subadvisers”) pursuant to subadvisory agreements. The Subadvisers manage a portion of certain Funds’ investments and have the responsibility for making all investment decisions for the portion of a Fund’s assets they manage. Pursuant to the subadvisory agreements, the Adviser pays fees to the Subadvisers, if any.
The Trust and Aberdeen have entered into a written contract (“Expense Limitation Agreement”) limiting operating expenses for all classes of the Funds from exceeding the amounts listed below. This contractual limitation may not be terminated before February 28, 2017 without the approval of the Board. This limit excludes certain expenses, including any taxes, interest, brokerage fees, short-sale dividend expenses, Acquired Fund Fees and Expenses, Rule 12b-1 fees, administrative services fees, transfer agent out-of-pocket expenses for Class A shares, Class R shares, and Institutional Service Class shares and extraordinary expenses.
| Fund | Limit | |||
Asia-Pacific (ex-Japan) Equity Fund | 1.25% | |||
China Opportunities Fund | 1.62% | |||
Emerging Markets Fund | 1.10% | |||
Equity Long-Short Fund | 1.40% | |||
Global Equity Fund | 1.19% | |||
Global Natural Resources Fund | 1.16% | |||
International Equity Fund | 1.10% | |||
International Small Cap Fund | 1.30% | |||
Japanese Equities Fund | 1.00% | |||
U.S. Mid Cap Equity Fund | 1.00% | |||
Annual Report 2016
132
Notes to Financial Statements (continued)
October 31, 2016
| Fund | Limit | |||
U.S. Multi-Cap Equity Fund | 0.90% | |||
U.S. Small Cap Equity Fund | 1.15% | |||
The Adviser has also entered into a written contract to reimburse the Equity Long-Short Fund for short-sale brokerage expenses at an annual rate of up to 0.15% of the Fund’s average daily net assets. Amounts reimbursed by the Adviser for short sale brokerage expenses are not subject to recoupment at a later date. This contract may not be terminated before February 28, 2018 without the approval of the Board.
Aberdeen may request and receive reimbursement from a Fund of the advisory fees waived and other expenses reimbursed pursuant to the Expense Limitation Agreement at a later date not to exceed three years from the fiscal year in which the corresponding reimbursement to the Funds was made. However, no reimbursement will be made unless:
(i) the total annual expense ratio of the class making such reimbursement is less than the limit set forth above; and
(ii) the payment of such reimbursement is approved by the Board on a quarterly basis (the “Reimbursement Requirements”).
If the Board approves any changes in the waiver terms or limitations, reimbursements are only permitted to the extent that the terms of the Expense Limitation Agreement in effect at the time of the waiver are met at the time that reimbursement is approved. Except as provided for in the Expense Limitation Agreement, reimbursement of amounts previously waived or assumed by Aberdeen is not permitted.
During the year ended October 31, 2016, the following Funds received reimbursement from Aberdeen for certain previously paid Transfer Agent expenses not attributable to the Funds as follows:
Equity Long-Short Fund | $ | 19,386 | ||
Global Equity Fund | $ | 17,201 | ||
Global Natural Resources Fund | $ | 24,439 | ||
International Equity Fund | $ | 264,886 |
In addition and related to the Transfer Agent expenses not attributable to the Funds, Aberdeen has reduced the amounts of prior advisory fees waived and other expenses reimbursed that are eligible for reimbursement in future periods by the following amounts for the following Funds:
China Opportunities Fund | $ | 11,010 | ||
Emerging Markets Fund | $ | 36,985 | ||
Global Natural Resources Fund | $ | 77,643 | ||
International Small Cap Fund | $ | 1,423 | ||
U.S. Multi-Cap Equity Fund | $ | 14,357 | ||
U.S. Small Cap Equity Fund | $ | 75,732 |
As of October 31, 2016, to the extent the Reimbursement Requirements are met, the cumulative potential reimbursements for each Fund, based on expenses reimbursed by Aberdeen, including adjustments described above, would be:
| Fund | Amount Fiscal Year 2014 (Expires 10/31/17) | Amount Fiscal Year 2015 (Expires 10/31/18) | Amount Fiscal Year 2016 (Expires 10/31/19) | Total* | ||||||||||||
Asia-Pacific (ex-Japan) Equity Fund | $ | 170,934 | $ | 136,242 | $ | 89,826 | $ | 397,002 | ||||||||
China Opportunities Fund | 134,971 | 137,165 | 136,771 | 408,907 | ||||||||||||
Emerging Markets Fund | 1,662,213 | 3,028,391 | 2,402,413 | 7,093,017 | ||||||||||||
Equity Long-Short Fund | 23,669 | 98,729 | 132,760 | 255,158 | ||||||||||||
Global Equity Fund | – | 70,298 | 67,616 | 137,914 | ||||||||||||
Global Natural Resources Fund | 86,066 | 116,650 | 117,499 | 320,215 | ||||||||||||
International Equity Fund | – | – | 4,248 | 4,248 | ||||||||||||
International Small Cap Fund | 365,671 | 369,096 | 366,445 | 1,101,212 | ||||||||||||
Japanese Equities Fund | – | – | 165,646 | 165,646 | ||||||||||||
2016 Annual Report
133
Notes to Financial Statements (continued)
October 31, 2016
| Fund | Amount Fiscal Year 2014 (Expires 10/31/17) | Amount Fiscal Year 2015 (Expires 10/31/18) | Amount Fiscal Year 2016 (Expires 10/31/19) | Total* | ||||||||||||
U.S. Mid Cap Equity Fund | $ | – | $ | – | $ | 103,780 | $ | 103,780 | ||||||||
U.S. Multi-Cap Equity Fund | 319,455 | 330,663 | 329,278 | 979,396 | ||||||||||||
U.S. Small Cap Equity Fund | 10,945 | 157,239 | – | 168,184 | ||||||||||||
| * | Amounts reported are due to expire throughout the respective 3-year expiration period presented above. |
Amounts listed as “–” are $0 or round to $0.
During the period ended October 31, 2016, the Adviser paid initial registration fees on behalf of the U.S. Mid Cap Equity Fund and Japanese Equities Fund, which commenced operations during the fiscal year totaling approximately $70,000 and $77,000, respectively. As of October 31, 2016, $17,568 for the U.S. Mid Cap Equity Fund remains payable and is included in Payable to Adviser on the Statement of Assets and Liabilities.
| b. | Fund Administration |
Under the terms of the Fund Administration Agreement, Aberdeen provides various administrative and accounting services, including daily valuation of the Funds’ shares, preparation of financial statements, tax returns, regulatory reports, and presentation of quarterly reports to the Board. For services provided pursuant to the Fund Administration Agreement, the Trust pays Aberdeen an annual fee of 0.08% based on the Trust’s average daily net assets. The fee is then allocated proportionately among all funds within the Trust (including the Funds) in relation to the average daily net assets of each fund. This asset-based fee is subject to an annual minimum fee based on the number of funds served. Pursuant to a sub-administration agreement with Aberdeen. State Street Bank and Trust Company provides sub-administration services with respect to the Funds.
| c. | Distributor and Shareholder Servicing |
The Trust and Aberdeen Fund Distributors, LLC (the “Distributor” or “AFD”) are parties to the current Underwriting Agreement (the “Underwriting Agreement”) whereby the Distributor acts as principal underwriter for the Trust’s shares.
The Trust has adopted a Distribution Plan (the “Plan”) pursuant to Rule 12b-1 under the 1940 Act with respect to certain classes of shares. The Plan permits the Funds to compensate AFD, as the Funds’ Distributor, for expenses associated with the distribution of certain classes of shares of the Funds of the Trust. Although actual distribution expenses may be more or less, under the Plan, the Funds of the Trust pay the Distributor an annual fee of the following amounts:
| Fund | Class A Shares | Class C Shares (a) | Class R Shares (a) | |||||||||
Asia-Pacific (ex-Japan) Equity Fund | 0.25% | 1.00% | 0.50% | |||||||||
China Opportunities Fund | 0.25% | 1.00% | 0.50% | |||||||||
Emerging Markets Fund | 0.25% | 1.00% | 0.50% | |||||||||
Equity Long-Short Fund | 0.25% | 1.00% | 0.50% | |||||||||
Global Equity Fund | 0.25% | 1.00% | 0.50% | |||||||||
Global Natural Resources Fund | 0.25% | 1.00% | 0.50% | |||||||||
International Equity Fund | 0.25% | 1.00% | 0.50% | |||||||||
International Small Cap Fund | 0.25% | 1.00% | 0.50% | |||||||||
Japanese Equities Fund | 0.25% | 1.00% | 0.50% | |||||||||
U.S. Mid Cap Equity Fund | 0.25% | 1.00% | 0.50% | |||||||||
U.S. Multi-Cap Equity Fund | 0.25% | 1.00% | 0.50% | |||||||||
U.S. Small Cap Equity Fund | 0.25% | 1.00% | 0.50% | |||||||||
| (a) | 0.25% of which is service fees. |
The Adviser or an affiliate of the Adviser may pay additional amounts from its own resources to dealers or other financial intermediaries, for aid in distribution or for aid in providing administrative services to shareholders.
Pursuant to the current Underwriting Agreement, the Distributor will also receive the proceeds of contingent deferred sales charges (“CDSCs”) of 1% imposed on certain redemptions of Class C (and up to 1% for certain Class A) shares.
Annual Report 2016
134
Notes to Financial Statements (continued)
October 31, 2016
In addition, the Distributor will re-allow to dealers 5.00% of sales charges on Class A shares of the Funds, which have a maximum front-end sales charge of 5.75% and the Distributor or the Adviser may compensate broker dealers or financial intermediaries from its own resources at the rate of 1.00% on sales of Class C shares of the Funds, which have a maximum CDSC of 1.00% (the CDSC assessed on sales within one year of purchase). For the fiscal year ended October 31, 2016, AFD retained commissions of $856,186 from front-end sales charges of Class A shares and $31,726 from CDSC fees from Class C (and certain Class A) shares of the Funds.
| d. | Administrative Services |
Under the terms of the current Administrative Services Plan, a series of the Trust is permitted to enter into Servicing Agreements with servicing organizations, none of which are affiliated with the Trust, such as any bank, trust company, thrift institution, broker-dealer, insurance company, or other financial institution, which agree to provide certain administrative support services in connection with the Class A, Class R and Institutional Service Class shares of the series of the Trust (as applicable). Under the Administrative Services Plan, a Fund may pay a broker-dealer or other intermediary a maximum annual administrative services fee of 0.25% (or a maximum of 0.15% under an amendment to the Administrative Services Plan that is in effect until at least February 28, 2017) of the average daily net assets of Class A, Class R and Institutional Service Class shares. The amount of expenses incurred under the terms of the Administrative Services Plan during the fiscal year ended October 31, 2016 was as follows:
| Fund | Amount | |||
Asia-Pacific (ex-Japan) Equity Fund | $ | – | ||
China Opportunities Fund | 1,709 | |||
Emerging Markets Fund | 380,476 | |||
Equity Long-Short Fund | 4,005 | |||
Global Equity Fund | 18,793 | |||
Global Natural Resources Fund | 1,878 | |||
International Equity Fund | 72,448 | |||
International Small Cap Fund | 8,386 | |||
Japanese Equities Fund | – | |||
U.S. Mid Cap Equity Fund | – | |||
U.S. Multi-Cap Equity Fund | 49,261 | |||
U.S. Small Cap Equity Fund | 20,759 | |||
The Funds may pay and/or reimburse transfer agent out-of-pocket expenses to certain broker-dealers and financial intermediaries who provide administrative support services to beneficial shareholders on behalf of the Funds, subject to certain limitations approved by the Board. These fees may be in addition to Rule 12b-1 fees. Transfer agent out-of-pocket expenses generally include, but are not limited to, costs associated with recordkeeping, networking, sub-transfer agency or other administrative or shareholder services.
The Funds are permitted to buy or sell securities with funds that have a common investment adviser (or investment advisers which are affiliates) under specific procedures which have been approved by the Board of Trustees of the Trust. The procedures are designed to satisfy the requirements of Rule 17a-7 of the Investment Company Act of 1940 (“Rule 17a-7”). During the year ended October 31, 2016, the Funds engaged in purchases and sales of securities pursuant to Rule 17a-7 as follows:
| Fund | Purchases | Sales | ||||||
Emerging Markets Fund | $ | 1,079,380 | $ | – | ||||
Equity Long-Short Fund | 421,652 | 38,595 | ||||||
Global Natural Resources Fund | 9,870 | – | ||||||
U.S. Mid Cap Equity Fund | – | 2,053 | ||||||
U.S. Multi-Cap Equity Fund | – | 768,540 | ||||||
Other Aberdeen Funds | – | 701,714 | ||||||
2016 Annual Report
135
Notes to Financial Statements (continued)
October 31, 2016
4. Investment Transactions
Purchases and sales of securities (excluding short-term securities) for the fiscal year ended October 31, 2016, were as follows:
| Fund | Purchases | Sales | ||||||
Asia-Pacific (ex-Japan) Equity Fund | $ | 24,237,776 | $ | 255,611,495 | ||||
China Opportunities Fund | 2,266,413 | 4,112,523 | ||||||
Emerging Markets Fund | 659,609,720 | 1,275,904,799 | ||||||
Equity Long-Short Fund | 29,637,710 | 72,651,429 | ||||||
Global Equity Fund | 19,029,707 | 24,628,513 | ||||||
Global Natural Resources Fund | 4,331,923 | 9,007,054 | ||||||
International Equity Fund | 136,570,196 | 276,231,615 | ||||||
International Small Cap Fund | 28,336,142 | 64,154,538 | ||||||
Japanese Equities Fund | 1,065,665 | 86,746 | ||||||
U.S. Mid Cap Equity Fund | 1,221,282 | 197,365 | ||||||
U.S. Multi-Cap Equity Fund | 218,024,065 | 258,173,980 | ||||||
U.S. Small Cap Equity Fund | 970,756,656 | 222,662,077 | ||||||
5. Financial Highlights
The Global Equity Fund Institutional Service Class Financial Highlights prior to the fiscal year ended October 31, 2009 were as follows:
| Investment Activities | Distributions | Ratios / Supplemental Data | ||||||||||||||||||||||||||||||||||||||||||||||||||||||||||
| Net Asset Value, Beginning of Period | Net Investment Income (Loss) | Net Realized and Unrealized Gain (Loss) on Investments | Total from Investment Activities | Net Investment Income | Tax Return of Capital | Total Distributions | Redemption Fees | Net Asset Value, End of Period | Total Return (a)(b) | Net Assets at End of Period (000’s) | Ratio of Expenses to Average Net Assets (c) | Ratio of Net Investment Income (Loss) to Average Net Assets (c) | Ratio of Expenses (Prior to Reimbursements) to Average Net Assets (c)(d) | Portfolio Turnover (e) | ||||||||||||||||||||||||||||||||||||||||||||||
Year Ended October 31, 2008 | $ | 15.55 | 0.06 | (6.91 | ) | (6.85 | ) | (0.06 | ) | (0.01 | ) | (0.07) | – | $ | 8.63 | (44.20% | ) | $ | 15 | 1.35% | 0.55% | 1.54% | 241.73% | |||||||||||||||||||||||||||||||||||||
| (a) | Excludes sales charge. |
| (b) | Not annualized for periods less than one year. |
| (c) | Annualized for periods less than one year. |
| (d) | During the period, certain fees were waived and/or reimbursed. If such waivers/reimbursements had not occurred, the ratios would have been as indicated. |
| (e) | Portfolio turnover is calculated on the basis of the Fund as a whole without distinguishing among the classes of shares. |
6. Portfolio Investment Risks
| a. | Concentration Risk |
Investing 25% or more of the Global Natural Resources Fund’s net assets in a select group of companies in natural resources industries could subject the Global Natural Resources Fund to greater risk of loss and could be considerably more volatile than a broad-based market index or other mutual funds that are diversified across a greater number of industries.
| b. | Country/Regional Focus Risk |
Certain Funds may have significant exposure to a single country or geographical region, which involves increased currency, political, regulatory and other risks. Market swings in the targeted country or geographical region likely will have a greater effect on portfolio performance than they would in a more geographically diversified fund.
| c. | Emerging Markets Risk |
Certain Funds are subject to Emerging Markets Risk. This is a magnification of the risks that apply to foreign investments. These risks are greater for securities of companies in emerging markets countries because the countries may have less stable governments, more volatile currencies and less established markets (see “Foreign Securities Risk” below).
| d. | Equity-Linked Notes |
Certain Funds may invest in equity-linked notes, which are generally subject to the same risks as the foreign equity securities or the basket of foreign securities they are linked to. If the linked security(ies) declines in value, the note may return a lower amount at maturity. The trading price of an equity-linked note also depends on the value of the linked security(ies).
Annual Report 2016
136
Notes to Financial Statements (continued)
October 31, 2016
| e. | Foreign Currency Exposure Risk |
The value of foreign currencies relative to the U.S. Dollar fluctuates in response to market, economic, political, regulatory, geopolitical or other conditions. A decline in the value of a foreign currency versus the U.S. Dollar reduces the value in U.S. Dollars of investments denominated in that foreign currency. This risk may impact a Fund more greatly to the extent the Fund does not hedge its currency risk, or hedging techniques used by the Adviser are unsuccessful.
| f. | Foreign Securities Risk |
Certain Funds are subject to Foreign Securities Risk. Foreign securities may be more volatile, harder to price and less liquid than U.S. securities. They are subject to different accounting and regulatory standards and political and economical risks.
Asia-Pacific (ex-Japan) Region. The Asia-Pacific (ex-Japan) region generally refers to the part of the world in or near the Western Pacific Ocean. The area includes much of East Asia, South Asia, Australasia and Oceania, but excludes Japan. Parts of the Asian-Pacific region may be subject to a greater degree of economic, political and social instability, as described below under “— Asian Risk.”
Asian Risk. Parts of the Asian region may be subject to a greater degree of economic, political and social instability than is the case in the United States and Europe. Some Asian countries can be characterized as emerging markets or newly industrialized and may experience more volatile economic cycles than developed countries. The developing nature of securities markets in many countries in the Asian region may lead to a lack of liquidity while some countries have restricted the flow of money in and out of the country. Some countries in Asia have historically experienced political uncertainty, corruption, military intervention and social unrest. A Fund investing heavily in Asia may be more volatile than a fund which is broadly diversified geographically.
China Risk. Certain Funds may concentrate investments in China and Hong Kong, which subjects those Funds to additional risks, and may make such Funds significantly more volatile than geographically diverse mutual funds. Additional risks associated with investments in China and Hong Kong include exposure to currency fluctuations, less liquidity, expropriation, confiscatory taxation, nationalization, exchange control regulations (including currency blockage), trading halts, limitations on repatriation and differing legal standards.
Europe – Recent Events. A number of countries in Europe have experienced severe economic and financial difficulties. Many non-governmental issuers, and even certain governments, have defaulted on, or been forced to restructure, their debts; many other issuers have faced difficulties obtaining credit or refinancing existing obligations; financial institutions have in many cases required government or central bank support, have needed to raise capital, and/or have been impaired in their ability to extend credit; and financial markets in Europe and elsewhere have experienced extreme volatility and declines in asset values and liquidity. These difficulties may continue, worsen or spread within and outside Europe. Responses to the financial problems by European governments, central banks and others, including austerity measures and reforms, may not work, may result in social unrest and may limit future growth and economic recovery or have other unintended consequences. Further defaults or restructurings by governments and others of their debt could have additional adverse effects on economies, financial markets and asset valuations around the world. In addition, the United Kingdom has voted to withdraw from the European Union and one or more other countries may abandon the euro, the common currency of the European Union, and/or withdraw from the European Union. The impact of these actions, especially if they occur in a disorderly fashion, is not clear but could be significant and far-reaching. Whether or not a Fund invests in securities of issuers located in Europe or with significant exposure to European issuers or countries, these events could negatively affect the value and liquidity of a Fund’s investments.
Japan Risk. The Japanese economy has only recently emerged from a prolonged economic downturn. Since the year 2000, Japan’s economic growth has remained relatively low. The economy is characterized by an aging demographic, declining population, large government debt and highly regulated labor market. Economic growth is dependent on domestic consumption, deregulation and consistent government policy. International trade, particularly with the U.S., also impacts growth and adverse economic conditions in the U.S. or other such trade partners may affect Japan. Japan also has a growing economic relationship with China and other Southeast Asian countries, and thus Japan’s economy may also be affected by economic, political or social instability in those countries (whether resulting from local or global events).
Latin American Risk. Latin American countries may be subject to a greater degree of political, sovereign and economic instability than is the case in the United States and Europe. Some Latin American countries can be characterized as emerging markets or newly industrialized and may experience more volatile economic cycles than developed countries. The developing nature of securities markets in many countries in the Latin American region may lead to a lack of liquidity. A Fund investing heavily in Latin America may be more volatile than a fund which is broadly diversified geographically.
| g. | Illiquid Securities Risk |
Illiquid securities are assets which may not be sold or disposed of in the ordinary course of business within seven days at approximately the price at which a Fund has valued the investment on its books and may include such securities as those not registered under U.S. securities laws or securities that cannot be sold in public transactions. An inability to sell a portfolio position can adversely affect a Fund’s value or
2016 Annual Report
137
Notes to Financial Statements (continued)
October 31, 2016
prevent the Fund from being able to take advantage of other investment opportunities. Illiquid securities and relatively less liquid securities may also be difficult to value.
Each Fund employs proprietary procedures and tests using third-party and internal data inputs that seek to assess and manage the liquidity of its portfolio holdings. A Fund’s procedures and tests take into account relevant market, trading and other factors, and monitor whether liquidity assessments should be adjusted based on changed market conditions. These procedures and tests are designed to assist a Fund in determining its ability to meet redemption requests in various market conditions. In light of the dynamic nature of markets, there can be no assurance that these procedures and tests will enable a Fund to ensure that it has sufficient liquidity to meet redemption requests.
| h. | Impact of Large Redemptions and Purchases of Fund Shares |
Occasionally, shareholders may make large redemptions or purchases of Fund shares, which may cause the Fund to have to sell securities or invest additional cash. These transactions may adversely affect a Fund’s performance and increase transaction costs. In addition, large redemption requests may exceed the cash balance of a Fund and result in credit line borrowing fees and/or overdraft charges to the Fund until the sale of portfolio securities to cover the redemption request settle. For additional information on redemptions, please see the Statement of Changes in Net Assets.
| i. | Issuer Risk |
The value of a security may decline for reasons directly related to the issuer, such as management performance, financial leverage and reduced demand for the issuer’s goods or service.
| j. | Long-Short Strategy Risk |
The strategy used by Equity Long-Short Fund’s investment team may fail to produce the intended result. There is no guarantee that the use of long and short positions will succeed in limiting the Equity Long-Short Fund’s exposure to stock market movements, capitalization, sector swings or other risk factors.
| k. | Market Risk |
Deteriorating market conditions might cause a general weakness in the market that reduces the prices of securities in that market in which a Fund invests.
| l. | Mid-Cap Securities Risk |
Certain Funds are subject to Mid-Cap Securities Risk. Stocks of medium-sized companies tend to be more volatile and less liquid than stocks of larger companies.
| m. | Natural Resources Industry Risk |
The Global Natural Resources Fund concentrates its investments in the natural resources industry. The natural resources industry can be significantly affected by events relating to international political and economic developments, energy conservation, the success of exploration projects, commodity prices, and tax and other government regulations. The securities of companies in the natural resources sector may experience more price volatility than securities of companies in other industries.
| n. | Sector Risk |
To the extent that a Fund has a significant portion of its assets invested in securities of companies conducting business in a broadly related group of industries within an economic sector, the Fund may be more vulnerable to unfavorable developments in that economic sector than funds that invest more broadly.
Consumer Staples Sector Risk. To the extent the consumer staples sector represents a significant portion of a Fund, the Fund will be sensitive to changes in, and its performance may depend to a greater extent on, factors impacting this sector. The consumer staples sector may be affected by the regulation of various product components and production methods, marketing campaigns and other factors affecting consumer demand. Tobacco companies, in particular, may be adversely affected by new laws, regulations and litigation. The consumer staples sector may also be adversely affected by changes or trends in commodity prices, which may be influenced by unpredictable factors.
Financial Sector Risk. To the extent that the financials sector represents a significant portion of a Fund, the Fund will be sensitive to changes in, and its performance may depend to a greater extent on, factors impacting this sector. Performance of companies in the financials sector may be adversely impacted by many factors, including, among others, government regulations, economic conditions, credit rating downgrades, changes in interest rates, and decreased liquidity in credit markets. The impact of more stringent capital requirements, recent or future regulation of any individual financial company, or recent or future regulation of the financials sector as a whole cannot be predicted. In recent years, cyber attacks and technology malfunctions and failures have become increasingly frequent in this sector and have caused significant losses.
Annual Report 2016
138
Notes to Financial Statements (continued)
October 31, 2016
Industrials Sector Risk. To the extent that the industrials sector represents a significant portion of a Fund, the Fund will be sensitive to changes in, and its performance may depend to a greater extent on, factors impacting this sector. The industrials sector may be adversely affected by changes in the supply of and demand for products and services, product obsolescence, claims for environmental damage or product liability and general economic conditions, among other factors.
| o. | Securities Selection Risk |
Each Fund’s investment team may take long positions in securities that underperform the stock market or other funds with similar investment objectives and strategies or take short positions in securities that have positive performance.
| p. | Short Sale Risk |
Certain Funds are subject to Short Sale Risk. This is the risk that the price of a security sold short will increase in value between the time of the short sale and the time a Fund must purchase the security to return it to the lender. A Fund’s potential loss on a short sale could theoretically be unlimited in a case where the Fund is unable, for whatever reason, to close out its short position. A loss on a short sale is increased by the amount of the premium or interest the Fund must pay to the lender of the security.
| q. | Small-Cap Securities Risk |
Certain Funds are subject to Small-Cap Securities Risk. Stocks of smaller companies are usually less stable in price and less liquid than those of larger, more established companies. Therefore, they generally involve greater risk.
| r. | Valuation Risk |
Certain Funds are subject to greater Valuation Risk than other funds. The lack of active trading markets may make it difficult to obtain an accurate price for a security held by a Fund.
Please read the prospectus for more detailed information regarding these and other risks.
7. Contingencies
In the normal course of business, the Funds may provide general indemnifications pursuant to certain contracts and organizational documents. The Funds’ maximum exposure under these arrangements is dependent on future claims that may be made against the Funds, and therefore, cannot be estimated; however, based on experience, the risk of loss from such claims is considered remote.
8. Tax Information
As of October 31, 2016, the tax cost of securities and the breakdown of unrealized appreciation/(depreciation) for each Fund were as follows:
| Tax Cost of Securities | Unrealized Appreciation | Unrealized Depreciation | Net Unrealized Appreciation/ (Depreciation) | |||||||||||||
Asia-Pacific (ex-Japan) Equity Fund | $ | 16,363,181 | $ | 828,423 | $ | (2,462,742 | ) | $ | (1,634,319 | ) | ||||||
China Opportunities Fund | 17,105,351 | 1,099,470 | (3,777,713 | ) | (2,678,243 | ) | ||||||||||
Emerging Markets Fund | 8,076,106,487 | 1,130,680,794 | (1,236,031,721 | ) | (105,350,927 | ) | ||||||||||
Equity Long-Short Fund | 61,941,466 | 8,904,262 | (840,178 | ) | 8,064,084 | |||||||||||
Global Equity Fund | 89,834,915 | 7,316,951 | (8,199,369 | ) | (882,418 | ) | ||||||||||
Global Natural Resources Fund | 14,907,123 | 1,092,198 | (1,444,381 | ) | (352,183 | ) | ||||||||||
International Equity Fund | 470,952,163 | 47,589,550 | (61,928,862 | ) | (14,339,312 | ) | ||||||||||
International Small Cap Fund | 68,686,619 | 9,892,839 | (5,073,180 | ) | 4,819,659 | |||||||||||
Japanese Equities Fund | 1,005,730 | 122,473 | (31,405 | ) | 91,068 | |||||||||||
U.S. Mid Cap Equity Fund | 1,063,381 | 92,546 | (19,928 | ) | 72,618 | |||||||||||
U.S. Multi-Cap Equity Fund | 302,059,391 | 46,256,655 | (7,277,760 | ) | 38,978,895 | |||||||||||
U.S. Small Cap Equity Fund | 1,135,492,733 | 66,620,312 | (53,443,457 | ) | 13,176,855 | |||||||||||
2016 Annual Report
139
Notes to Financial Statements (continued)
October 31, 2016
The tax character of distributions paid during the fiscal year ended October 31, 2016 was as follows (total distributions paid may differ from the Statements of Changes in Net Assets because for tax purposes dividends are recognized when actually paid):
| Distributions paid from | ||||||||||||||||||||||||
| Fund | Ordinary Income | Net Long Term Capital Gains | Total Taxable Distributions | Tax Exempt Distributions | Return of Capital | Total Distributions Paid | ||||||||||||||||||
Asia-Pacific (ex-Japan) Equity Fund | $ | 1,991,125 | $ | – | $ | 1,991,125 | $ | – | $ | – | $ | 1,991,125 | ||||||||||||
China Opportunities Fund | – | – | – | – | – | – | ||||||||||||||||||
Emerging Markets Fund | 9,497,669 | 79,747,978 | 89,245,647 | – | – | 89,245,647 | ||||||||||||||||||
Equity Long-Short Fund | – | 14,765,152 | 14,765,152 | – | – | 14,765,152 | ||||||||||||||||||
Global Equity Fund | 266,372 | – | 266,372 | – | – | 266,372 | ||||||||||||||||||
Global Natural Resources Fund | 71,264 | – | 71,264 | – | – | 71,264 | ||||||||||||||||||
International Equity Fund | 1,934,995 | – | 1,934,995 | – | – | 1,934,995 | ||||||||||||||||||
International Small Cap Fund | 467,389 | 8,210,232 | 8,677,621 | – | – | 8,677,621 | ||||||||||||||||||
Japanese Equities Fund | 847 | – | 847 | – | – | 847 | ||||||||||||||||||
U.S. Mid Cap Equity Fund | – | – | – | – | – | – | ||||||||||||||||||
U.S. Multi-Cap Equity Fund | 608,834 | 17,652,954 | 18,261,788 | – | – | 18,261,788 | ||||||||||||||||||
U.S. Small Cap Equity Fund | – | – | – | – | – | – | ||||||||||||||||||
The tax character of distributions paid during the fiscal year ended October 31, 2015 was as follows (total distributions paid may differ from the Statements of Changes in Net Assets because for tax purposes dividends are recognized when actually paid):
| Distributions paid from | ||||||||||||||||||||||||
| Fund | Ordinary Income* | Net Long Term Capital Gains* | Total Taxable Distributions | Tax Exempt Distributions | Return of Capital | Total Distributions Paid | ||||||||||||||||||
Asia-Pacific (ex-Japan) Equity Fund | $ | 22,860,018 | $ | 17,473,584 | $ | 40,333,602 | $ | – | $ | – | $ | 40,333,602 | ||||||||||||
China Opportunities Fund | 324,609 | – | 324,609 | – | – | 324,609 | ||||||||||||||||||
Emerging Markets Fund | 116,164,014 | 286,807,723 | 402,971,737 | – | – | 402,971,737 | ||||||||||||||||||
Equity Long-Short Fund | – | 50,623,727 | 50,623,727 | – | – | 50,623,727 | ||||||||||||||||||
Global Equity Fund | 1,636,532 | – | 1,636,532 | – | – | 1,636,532 | ||||||||||||||||||
Global Natural Resources Fund | 426,587 | – | 426,587 | – | – | 426,587 | ||||||||||||||||||
International Equity Fund | 17,650,697 | – | 17,650,697 | – | – | 17,650,697 | ||||||||||||||||||
International Small Cap Fund | 3,232,930 | 13,534,873 | 16,767,803 | – | – | 16,767,803 | ||||||||||||||||||
Japanese Equities Fund | – | – | – | – | – | – | ||||||||||||||||||
U.S. Mid Cap Equity Fund | – | – | – | – | – | – | ||||||||||||||||||
U.S. Multi-Cap Equity Fund | 3,881,270 | 25,770,272 | 29,651,542 | – | – | 29,651,542 | ||||||||||||||||||
U.S. Small Cap Equity Fund | – | – | – | – | – | – | ||||||||||||||||||
| * | The Funds may utilize equalization accounting for tax purposes and designate earnings and profits, including net realized gains distribution to shareholders, on redemption of shares, as part of the dividends paid deduction for income tax purposes. Any available tax equalization will be applied pro-rata to short-term capital gains, long-term capital gains and net investment income, as applicable. |
Amounts listed as “–” are $0 or round to $0.
Annual Report 2016
140
Notes to Financial Statements (continued)
October 31, 2016
As of October 31, 2016, the components of accumulated earnings/(deficit) on a tax basis were as follows:
| Fund | Undistributed Tax Exempt Income | Undistributed Ordinary Income | Undistributed Long-Term Capital Gains | Accumulated Earnings | Distributions Payable | Late Year Ordinary and Post-October Capital Loss Deferrals | Other Temporary Differences | Unrealized Appreciation/ (Depreciation)* | Accumulated Capital and Other Losses** | Total Accumulated Earnings/ (Deficit) | ||||||||||||||||||||||||||||||
Asia-Pacific (ex-Japan) Equity Fund | $ | – | $ | – | $ | – | $ | – | $ | – | $ | – | $ | – | $ | (1,644,706 | ) | $ | (201,670,068 | ) | $ | (203,314,774 | ) | |||||||||||||||||
China Opportunities Fund | – | 102,867 | – | – | – | – | 3 | (2,677,794 | ) | (10,617,640 | ) | (13,192,564 | ) | |||||||||||||||||||||||||||
Emerging Markets Fund | – | 85,177,083 | – | – | – | – | – | (115,908,468 | ) | (84,529,236 | ) | (115,260,621 | ) | |||||||||||||||||||||||||||
Equity Long-Short Fund | – | – | 8,130,719 | – | – | (1,081,442 | ) | – | 6,905,121 | – | 13,954,398 | |||||||||||||||||||||||||||||
Global Equity Fund | – | 733,201 | – | – | – | – | – | (989,619 | ) | (11,780,752 | ) | (12,037,170 | ) | |||||||||||||||||||||||||||
Global Natural Resources Fund | – | 200,909 | – | – | – | – | (2 | ) | (353,181 | ) | (33,599,102 | ) | (33,751,376 | ) | ||||||||||||||||||||||||||
International Equity Fund | – | 6,884,921 | – | – | – | – | – | (14,830,832 | ) | (124,780,216 | ) | (132,726,127 | ) | |||||||||||||||||||||||||||
International Small Cap Fund | – | 386,064 | 211,787 | – | – | – | – | 4,774,619 | – | 5,372,470 | ||||||||||||||||||||||||||||||
Japanese Equities Fund | – | 13,537 | – | – | – | – | – | 90,821 | – | 104,358 | ||||||||||||||||||||||||||||||
U.S. Mid Cap Equity Fund | – | 23,865 | – | – | – | – | – | 72,618 | – | 96,483 | ||||||||||||||||||||||||||||||
U.S. Multi-Cap Equity Fund | – | 582,068 | 39,016,569 | – | – | – | – | 38,978,895 | (14,297,643 | ) | 64,279,889 | |||||||||||||||||||||||||||||
U.S. Small Cap Equity Fund | – | – | – | – | – | (1,581,355 | ) | (1 | ) | 13,176,855 | (305,602,110 | ) | (294,006,611 | ) | ||||||||||||||||||||||||||
| * | The difference between the book-basis and tax-basis unrealized appreciation/(depreciation) is attributable primarily to passive foreign investment companies and tax deferral of losses on wash sales. |
| ** | As of October 31, 2016, for Federal income tax purposes, the following Funds have capital loss carryforwards available to offset capital gains, if any, to the extent provided by the Treasury regulations, which expire in the years set forth below. |
As of October 31, 2016, for federal income tax purposes, capital loss carryforwards, as shown in the table below, were available to the extent provided by the regulations to offset future realized gains of each respective Fund through the years indicated.
| Fund | Amount | Expires | ||||
Asia-Pacific (ex-Japan) Equity Fund | $ | 123,092,545 | Unlimited (Short-Term) | |||
Asia-Pacific (ex-Japan) Equity Fund | 78,577,523 | Unlimited (Long-Term) | ||||
China Opportunities Fund | 10,001,079 | 2017 (Short-Term) | ||||
China Opportunities Fund | 616,561 | Unlimited (Long-Term) | ||||
Emerging Markets Fund | 1,777,779 | Unlimited (Short-Term) | ||||
Emerging Markets Fund | 82,751,457 | Unlimited (Long-Term) | ||||
Global Equity Fund | 10,233,313 | 2017 (Short-Term) | ||||
Global Equity Fund | 38,612 | Unlimited (Short-Term) | ||||
Global Equity Fund | 1,508,827 | Unlimited (Long-Term) | ||||
Global Natural Resources Fund | 28,882,345 | 2017 (Short-Term) | ||||
Global Natural Resources Fund | 4,716,757 | Unlimited (Long-Term) | ||||
International Equity Fund | 84,636,377 | 2017 (Short-Term) | ||||
International Equity Fund | 1,844,228 | Unlimited (Short-Term) | ||||
International Equity Fund | 38,299,611 | Unlimited (Long-Term) | ||||
U.S. Multi-Cap Equity Fund | 14,297,643 | 2017 (Short-Term) | ||||
U.S. Small Cap Equity Fund | 305,602,110 | 2017 (Short-Term) | ||||
Amounts listed as “–” are $0 or round to $0.
2016 Annual Report
141
Notes to Financial Statements (continued)
October 31, 2016
Under the Regulated Investment Company Modernization Act of 2010, the Funds are permitted to carry forward capital losses incurred in taxable years beginning after December 22, 2010 for an unlimited period. However, any losses incurred during those taxable years will be required to be utilized prior to the losses incurred in pre-enactment taxable years. As a result of this ordering rule, pre-enactment capital loss carryforwards may be more likely to expire unused. Additionally, post-enactment capital losses that are carried forward will retain their character as either short-term or long-term capital losses rather than being considered all short-term as under previous law.
GAAP requires that certain components of net assets be adjusted to reflect permanent differences between financial and tax reporting. Accordingly, the table below details the necessary reclassifications, which are a result of permanent differences primarily attributable to net operating losses, expired capital loss carryforwards, litigation reclass, spinoff adjustment, Indian capital gains tax, foreign currency gain/(loss), passive foreign investment company gain/(loss), capital gains tax, distribution redesignation, merger tax attributes, non-deductible excise tax and non-deductible organization expenses and 12b-1 fees. These reclassifications have no effect on net assets or net asset values per share.
| Fund | Paid-in Capital | Accumulated Net Investment Income/(Loss) | Accumulated Net Realized Gain/(Loss) | |||||||||
Asia-Pacific (ex-Japan) Equity Fund | $ | (544,386 | ) | $ | 224,406 | $ | 319,980 | |||||
China Opportunities Fund | – | (38,745 | ) | 38,745 | ||||||||
Emerging Markets Fund | – | (2,649,392 | ) | 2,649,392 | ||||||||
Equity Long-Short Fund | (1,943,598 | ) | 1,940,387 | 3,211 | ||||||||
Global Equity Fund | (18,019,690 | ) | (24,357 | ) | 18,044,047 | |||||||
Global Natural Resources Fund | – | 8,709 | (8,709 | ) | ||||||||
International Equity Fund | – | 91,717 | (91,717 | ) | ||||||||
International Small Cap Fund | – | 215,703 | (215,703 | ) | ||||||||
Japanese Equities Fund | (54 | ) | (2,425 | ) | 2,479 | |||||||
U.S. Mid Cap Equity Fund | (47 | ) | 47 | – | ||||||||
U.S. Multi-Cap Equity Fund | – | 9,172 | (9,172 | ) | ||||||||
U.S. Small Cap Equity Fund | (30,019,829 | ) | 100,393 | 29,919,436 | ||||||||
9. Significant Shareholders
As of October 31, 2016, the following Funds had shareholders with the percentage ownership indicated, which are considered significant shareholders (holdings greater than 5.0%) for financial reporting purposes:
| Fund | Record Ownership % | Number of Account Owners | ||||
Asia-Pacific (ex-Japan) Equity Fund | 52.1 | % | 5 | |||
China Opportunities Fund | 29.9 | 3 | ||||
Emerging Markets Fund | 53.6 | 4 | ||||
Equity Long-Short Fund | 60.8 | 4 | ||||
Global Equity Fund | 65.7 | 3 | ||||
Global Natural Resources Fund | 48.6 | 3 | ||||
International Equity Fund | 52.2 | 4 | ||||
International Small Cap Fund | 27.9 | 2 | ||||
Japanese Equities Fund | 95.1 | 1 | ||||
U.S. Mid Cap Equity Fund | 95.9 | 1 | ||||
U.S. Multi-Cap Equity Fund | 12.6 | 2 | ||||
U.S. Small Cap Equity Fund | 43.8 | 3 | ||||
10. Line of Credit
The Trust, on behalf of each of the funds of the Trust (the “Borrowers”), has entered into an agreement (the “Agreement”) with State Street Bank and Trust Company (the “Bank”), subject to annual renewal. The Agreement provides for a revolving credit facility (the “Credit Facility”) for the amount of $250,000,000 to be utilized for temporary or emergency purposes to fund shareholder redemptions or other short-term liquidity purposes.
Annual Report 2016
142
Notes to Financial Statements (continued)
October 31, 2016
Principal on each outstanding loan made under the Agreement bears interest at a variable rate per annum equal to the higher of (a) the Federal Funds Rate as in effect of that day (not less than zero) plus 1.25% or (b) the One-Month London Interbank Offered Rate as in effect on that day (not less than zero) plus 1.25%. In addition, effective August 12, 2016, the Borrowers shall pay to the Bank a commitment fee at the rate of 0.22% per annum on the daily unused portion of the Credit Facility, as applicable, which is allocated among the Borrowers in such manner as is determined by the Board to be reasonable. During the period November 1, 2015 to August 11, 2016, the commitment fee rate was 0.18%, per annum. For each Fund that borrowed under the Credit Facility during the fiscal year, the following table shows the average outstanding daily balance for the Fund under the Credit Facility and the average weighted interest rate paid by the Fund during the fiscal year.
| Average Outstanding Daily Balance | Average Weighted Interest Rate | Days Utilized | ||||||||||
Asia-Pacific (ex-Japan) Equity Fund | $ | 1,291,215 | 1.61 | % | 65 | |||||||
China Opportunities Fund | 100,000 | 1.63 | % | 1 | ||||||||
Emerging Markets Fund | 56,138,010 | 1.57 | % | 16 | ||||||||
Global Equity Fund | 1,970,082 | 1.67 | % | 2 | ||||||||
Global Natural Resources Fund | 138,448 | 1.70 | % | 16 | ||||||||
International Equity Fund | 4,252,445 | 1.62 | % | 20 | ||||||||
International Small Cap Fund | 1,920,325 | 1.50 | % | 28 | ||||||||
U.S. Multi-Cap Equity Fund | 1,115,914 | 1.62 | % | 4 | ||||||||
11. Fund Reorganization
Effective February 25, 2015, the Global Equity Fund acquired all of the assets and assumed all of the liabilities of the Global Select Opportunities Fund. The acquisition was accomplished by a tax-free exchange as follows:
157,476 shares of the Global Select Opportunities Fund, fair valued at $6,178,775 for 451,005 shares of the Global Equity Fund.
The investment portfolio and cash of the Global Select Opportunities Fund with a fair value of $6,178,775 were the principal assets acquired by the Global Equity Fund. For financial reporting purposes, assets received and shares issued by the Global Equity Fund were recorded at value; however, the cost basis of the investments received from the Global Select Opportunities Fund was carried forward to align ongoing reporting of the Global Equity Fund’s realized and unrealized gains and losses with amounts distributable to shareholders for tax purposes. The Global Equity Fund acquired capital loss carryovers of $27,810,422 (subject to future annual limitations). Immediately prior to the reorganization, the net assets of the Global Select Opportunities Fund were $6,178,775.
Assuming that the Global Equity Fund reorganization had been completed on November 1, 2014, the pro forma results of operations for the year ended October 31, 2015 are as follows:
Net investment income | $ | 1,442,001 | ||
Net realized and unrealized loss from investments | 6,766,918 | |||
Net decrease in net assets resulting from operations | 8,208,919 |
Because the combined investment portfolios have been managed as a single integrated portfolio since the reorganization was completed, it is not practical to separate the amounts of revenue and earnings of the Global Select Opportunities Fund that have been reflected in the statements of operations since February 25, 2015 for the Global Equity Fund.
2016 Annual Report
143
Notes to Financial Statements (concluded)
October 31, 2016
The chart below shows a summary of net assets, shares outstanding, net asset value per share, net unrealized appreciation/(depreciation), and accumulated net realized gains/(losses), before and after the reorganization.
Before Reorganization | After Reorganization | |||||||||||
| Global Select Opportunities Fund | Global Equity Fund | Global Equity Fund | ||||||||||
| Net Assets: | ||||||||||||
Class A/Class A | $ | 4,987,280 | $ | 67,762,995 | $ | 72,750,275 | ||||||
Class C/Class C | – | 4,029,590 | 4,029,590 | |||||||||
Class R/Class R | – | 1,906,287 | 1,906,287 | |||||||||
Institutional Service Class/ Institutional Service Class | – | 4,899,984 | 4,899,984 | |||||||||
Institutional Class/ Institutional Class | 1,191,495 | 42,089,456 | 43,280,951 | |||||||||
| Shares Outstanding: | ||||||||||||
Class A/Class A | 127,266 | 4,947,407 | 5,311,530 | |||||||||
Class C/Class C | – | 310,287 | 310,287 | |||||||||
Class R/Class R | – | 144,318 | 144,318 | |||||||||
Institutional Service Class/ Institutional Service Class | – | 357,052 | 357,052 | |||||||||
Institutional Class/ Institutional Class | 30,210 | 3,069,115 | 3,155,997 | |||||||||
| Net Asset Value per Share: | ||||||||||||
Class A/Class A | $ | 39.19 | $ | 13.70 | $ | 13.70 | ||||||
Class C/Class C | – | 12.99 | 12.99 | |||||||||
Class R/Class R | – | 13.21 | 13.21 | |||||||||
Institutional Service Class/ Institutional Service Class | – | 13.72 | 13.72 | |||||||||
Institutional Class/ Institutional Class | 39.44 | 13.71 | 13.71 | |||||||||
Net unrealized appreciation/(depreciation) | 156,212 | 11,716,846 | 11,873,058 | |||||||||
Accumulated net realized gain/(loss) | (27,845,556 | ) | (3,895,237 | ) | (31,740,793 | ) | ||||||
12. Subsequent Events
Management has evaluated the need for disclosures and/or adjustments resulting from subsequent events through the date the financial statements were issued. Based on this evaluation, no disclosures and/or adjustments were required to the financial statements as of October 31, 2016, except as disclosed in Note 1 and below.
Effective November 21, 2016, the Global Equity Fund acquired all of the assets and assumed all of the liabilities of the Global Natural Resources Fund. The acquisition was accomplished by a tax-free exchange as follows:
1,128,647 shares of the Global Natural Resources Fund, fair valued at $13,539,464 for 1,142,540 shares of the Global Equity Fund.
The investment portfolio and cash of the Global Natural Resources Fund with a fair value of $13,539,464 were the principal assets acquired by the Global Equity Fund. For financial reporting purposes, assets received and shares issued by the Global Equity Fund were recorded at value; however, the cost basis of the investments received from the Global Natural Resources Fund was carried forward to align ongoing reporting of the Global Equity Fund’s realized and unrealized gains and losses with amounts distributable to shareholders for tax purposes. The Global Equity Fund acquired capital loss carryovers of $33,599,102 (subject to future annual limitations). Immediately prior to the reorganization, the net assets of the Global Natural Resources Fund were $13,539,464.
Assuming that the Global Equity Fund reorganization had been completed on November 1, 2015, the pro forma results of operations for the year ended October 31, 2016 are as follows:
Net investment income | $ | 1,108,430 | ||
Net realized and unrealized gain from investments | 2,344,035 | |||
Net increase in net assets resulting from operations | 3,452,465 |
Annual Report 2016
144
Notes to Financial Statements (continued)
October 31, 2016
Because the combined investment portfolios have been managed as a single integrated portfolio since the reorganization was completed, it is not practical to separate the amounts of revenue and earnings of the Global Natural Resources Fund that have been reflected in the statements of operations since November 21, 2016 for the Global Equity Fund.
The chart below shows a summary of net assets, shares outstanding, net asset value per share, net unrealized appreciation/(depreciation), and accumulated net realized gains/(losses), before and after the reorganization.
Before Reorganization | After Reorganization | |||||||||||
| Global Natural Resources Fund | Global Equity Fund | Global Equity Fund | ||||||||||
| Net Assets: | ||||||||||||
Class A/Class A | $ | 8,732,862 | $ | 46,748,477 | $ | 55,481,339 | ||||||
Class C/Class C | 1,432,891 | 1,403,669 | 2,836,560 | |||||||||
Class R/Class R | 2,166,589 | 1,207,119 | 3,373,708 | |||||||||
Institutional Service Class/ Institutional Service Class | 624,420 | 1,072 | 625,492 | |||||||||
Institutional Class/ Institutional Class | 582,702 | 34,989,410 | 35,572,110 | |||||||||
| Shares Outstanding: | ||||||||||||
Class A/Class A | 723,033 | 3,898,835 | 4,627,156 | |||||||||
Class C/Class C | 124,828 | 124,095 | 250,774 | |||||||||
Class R/Class R | 182,410 | 104,667 | 292,529 | |||||||||
Institutional Service Class/ Institutional Service Class | 51,044 | 88 | 51,371 | |||||||||
Institutional Class/ Institutional Class | 47,332 | 2,906,011 | 2,954,407 | |||||||||
| Net Asset Value per Share: | ||||||||||||
Class A/Class A | $ | 12.08 | $ | 11.99 | $ | 11.99 | ||||||
Class C/Class C | 11.48 | 11.31 | 11.31 | |||||||||
Class R/Class R | 11.88 | 11.53 | 11.53 | |||||||||
Institutional Service Class/ Institutional Service Class | 12.23 | 12.18 | 12.18 | |||||||||
Institutional Class/ Institutional Class | 12.31 | 12.04 | 12.04 | |||||||||
Net unrealized appreciation/(depreciation) | 300,710 | (3,024,250 | ) | (2,723,540 | ) | |||||||
Accumulated net realized gain/(loss) | (232,050 | ) | 391,054 | 159,004 | ||||||||
2016 Annual Report
145
Results of Special Meeting of Shareholders of Global Natural Resources Fund
A Special Meeting of Shareholders was held on October 17, 2016, and adjourned to October 31, 2016, at AAMI’s offices at 1735 Market Street, 32nd Floor, Philadelphia, PA 19103 (the “Meeting”). The description of the proposal and number of shares voted at the Meeting are as follows:
| • | To approve an Agreement and Plan of Reorganization (the “Reorganization Agreement”) which contemplates the reorganization of the Aberdeen Global Natural Resources Fund (the “Target Fund”) into the Aberdeen Global Equity Fund, a series of Aberdeen Funds (the “Acquiring Fund”), and provides that the Target Fund will transfer all of its assets and liabilities to the Acquiring Fund in exchange for shares of certain classes of the Acquiring Fund, which shares will be distributed to the shareholders of the corresponding class of the Target Fund in complete liquidation and dissolution of the Target Fund (the “Reorganization”). |
| Votes For* | Votes Against* | Abstained* | ||||||
451,406 | 30,396 | 117,727 | ||||||
|
|
|
|
| ||||
| * | Unaudited |
| In connection with the reorganization, the Global Natural Resources Fund’s Class A, Class C, Class R, Institutional Service Class and Institutional Class were exchanged for Class A, Class C, Class R, Institutional Service Class and Institutional Class of the Global Equity Fund, respectively. |
| The following is a summary of the net assets reorganized and net asset value per share issued as of November 18, 2016. |
| Shares Issued of the Global Equity Fund | Fund Net Assets Reorganized from the Global Natural Resources Fund | Net Asset Value Per Shares Issued of the Global Equity Fund | ||||||||||
Class A | 728,321 | $8,732,862 | $11.99 | |||||||||
Class C | 126,679 | 1,432,891 | 11.31 | |||||||||
Class R | 187,862 | 2,166,589 | 11.53 | |||||||||
Institutional Service Class | 51,283 | 624,420 | 12.18 | |||||||||
Institutional Class | 48,395 | 582,702 | 12.04 | |||||||||
Annual Report 2016
146
Report of Independent Registered Public Accounting Firm
The Board of Trustees and Shareholders of Aberdeen Funds:
We have audited the accompanying statements of assets and liabilities, including the statements of investments, of the Aberdeen Asia-Pacific (ex-Japan) Equity Fund, Aberdeen China Opportunities Fund, Aberdeen Emerging Markets Fund, Aberdeen Equity Long-Short Fund, Aberdeen Global Equity Fund, Aberdeen Global Natural Resources Fund, Aberdeen International Equity Fund, Aberdeen International Small Cap Fund (formerly, Aberdeen Global Small Cap Fund), Aberdeen U.S. Multi-Cap Equity Fund (formerly, Aberdeen U.S. Equity Fund), and Aberdeen U.S. Small Cap Equity Fund (formerly, Aberdeen Small Cap Fund), ten of the funds comprising Aberdeen Funds, as of October 31, 2016, and the related statements of operations for the year then ended, the statements of changes in net assets for each of the years or periods in the two-year period then ended and the financial highlights for each of the years or periods in the five-year period then ended. We have also audited the statements of assets and liabilities, including the statements of investments, of the Aberdeen Japanese Equities Fund and the Aberdeen U.S. Mid Cap Equity Fund, two of the funds comprising the Aberdeen Funds (collectively, the “Funds”), as of October 31, 2016, and the related statements of operations, statements of changes in net assets and the financial highlights for the period from November 30, 2015 (commencement of operations) through October 31, 2016 for the Aberdeen Japanese Equities Fund and for the period from February 29, 2016 (commencement of operations) through October 31, 2016 for the Aberdeen U.S. Mid Cap Equity Fund. These financial statements and financial highlights are the responsibility of the Funds’ management. Our responsibility is to express an opinion on these financial statements and financial highlights based on our audits.
We conducted our audits in accordance with the standards of the Public Company Accounting Oversight Board (United States). Those standards require that we plan and perform the audit to obtain reasonable assurance about whether the financial statements and financial highlights are free of material misstatement. An audit includes examining, on a test basis, evidence supporting the amounts and disclosures in the financial statements. Our procedures included confirmation of securities owned as of October 31, 2016, by correspondence with custodians and brokers, or by other appropriate auditing procedures. An audit also includes assessing the accounting principles used and significant estimates made by management, as well as evaluating the overall financial statement presentation. We believe that our audits provide a reasonable basis for our opinion.
In our opinion, the financial statements and financial highlights referred to above present fairly, in all material respects, the financial position of the Funds as of October 31, 2016, the results of their operations for the year or period then ended, the changes in their net assets and the financial highlights for each of the years or periods presented in the first paragraph above, in conformity with U.S. generally accepted accounting principles.

Philadelphia, Pennsylvania
December 29, 2016
2016 Annual Report
147
Other Tax Information (Unaudited)
For the period ended October 31, 2016, certain dividends paid by the Funds may be subject to a maximum tax rate of 15% as provided for by the Jobs and Growth Tax Relief Reconciliation Act of 2003. The Funds intend to designate the maximum amount allowable as taxed at a maximum rate of 15%. Complete information will be reported in conjunction with your 2016 Form 1099-DIV.
For the year ended October 31, 2016, the following Funds paid qualified dividend income:
| Fund | Qualified Dividend Income | |||
Asia-Pacific (ex-Japan) Equity Fund | 91.00 | % | ||
China Opportunities Fund | 100.00 | % | ||
Emerging Markets Fund | 100.00 | % | ||
Global Equity Fund | 100.00 | % | ||
Global Natural Resources Fund | 100.00 | % | ||
International Equity Fund | 100.00 | % | ||
International Small Cap Fund | 96.39 | % | ||
Japanese Equities Fund | 100.00 | % | ||
U.S. Multi-Cap Equity Fund | 100.00 | % | ||
For the taxable year ended October 31, 2016, the following percentage of income dividends paid by the Funds qualify for the dividends received deduction available to corporate shareholders:
| Fund | Dividends Deduction | |||
Asia-Pacific (ex-Japan) Equity Fund | 1.76 | % | ||
China Opportunities Fund | 3.75 | % | ||
Emerging Markets Fund | 2.53 | % | ||
Global Equity Fund | 48.47 | % | ||
Global Natural Resources Fund | 28.61 | % | ||
International Small Cap Fund | 6.92 | % | ||
U.S. Multi-Cap Equity Fund | 100.00 | % | ||
The Funds intend to elect to pass through to their shareholders the credit for taxes paid in foreign countries during its fiscal year ended October 31, 2016. In accordance with the current tax laws, the foreign income and foreign tax per share (for a share outstanding as of October 31, 2016) was as follows:
| Fund | Foreign Tax | |||
Asia-Pacific (ex-Japan) Equity Fund | $ | 0.6096 | ||
China Opportunities Fund | $ | 0.0107 | ||
Emerging Markets Fund | $ | 0.0270 | ||
Global Equity Fund | $ | 0.0189 | ||
Global Natural Resources Fund | $ | 0.0374 | ||
International Equity Fund | $ | 0.0289 | ||
International Small Cap Fund | $ | 0.0299 | ||
Japanese Equities Fund | $ | 0.0283 | ||
Annual Report 2016
148
Other Tax Information (Unaudited) (concluded)
During the year ended October 31, 2016, the following Funds designated dividends as long-term capital gains:
| Fund | Amount | |||
Emerging Markets Fund | $ | 79,747,978 | ||
Equity Long-Short Fund | $ | 14,765,152 | ||
International Small Cap Fund | $ | 8,210,232 | ||
U.S. Multi-Cap Equity Fund | $ | 17,652,954 | ||
2016 Annual Report
149
Shareholder Expense Examples (Unaudited)
As a shareholder of the Aberdeen Funds, you incur two types of costs: (1) transaction costs, including sales charges (loads) paid on purchase payments and (2) ongoing costs, including investment advisory fees, administration fees, transfer agent out-of-pocket expenses, distribution fees and other Fund expenses. The examples below are intended to help you understand your ongoing costs (in dollars) of investing in the Aberdeen Funds and to compare these costs with the ongoing costs of investing in other mutual funds.
The examples assume that you had a $1,000 investment in the Class at the beginning of the reporting period, May 1, 2016 and continued to hold your shares at the end of the reporting period, October 31, 2016.
Actual Expenses
The table below provides information about actual account values and actual expenses. You may use the information together with the amount you invested, to estimate the expenses that you paid over the period. Simply divide your account value by $1,000 (for example, an $8,600 account value divided by $1,000 = 8.6), then multiply the result by the number under the heading entitled “Actual Expenses Paid During Period” for the class of a Fund that you own to estimate the expenses you paid on your account during the period.
Hypothetical Example for Comparison Purposes
The table below provides information about hypothetical account values and hypothetical expenses based on the Class’ actual expense ratio and an assumed rate of return of 5% per year before expenses, which is not the Class’ actual return. The hypothetical account values and expenses may not be used to estimate the actual ending account balance or expenses you paid for the period. You may use this information to compare the ongoing costs of investing in the Class of a Fund and other funds. To do so, compare the 5% hypothetical example with the 5% hypothetical examples that appear in the shareholder reports of the other funds.
Please note that the expenses shown in the table are meant to highlight your ongoing costs only and do not reflect any transaction costs, such as sales charges (loads). Therefore, the information for each Class in the table is useful in comparing ongoing costs only, and will not help you determine the relative total costs of owning different funds. In addition, if these transaction costs were included, your costs would have been higher. The examples also assume all dividends and distributions have been reinvested.
| Beginning Account Value, May 1, 2016 | Actual Ending Account Value, October 31, 2016 | Hypothetical Ending Account Value | Actual Expenses Paid During Period* | Hypothetical Expenses Paid During Period*1 | Annualized Expense Ratio** | |||||||||||||||||||||
Asia-Pacific (ex-Japan) Equity Fund | Class A | $ | 1,000.00 | $ | 1,090.40 | $ | 1,017.34 | $ | 8.14 | $ | 7.86 | 1.55% | ||||||||||||||
Class C | 1,000.00 | 1,085.80 | 1,013.83 | 11.80 | 11.39 | 2.25% | ||||||||||||||||||||
Class R | 1,000.00 | 1,089.70 | 1,016.34 | 9.19 | 8.87 | 1.75% | ||||||||||||||||||||
Institutional Service Class | 1,000.00 | 1,092.30 | 1,018.75 | 6.68 | 6.44 | 1.27% | ||||||||||||||||||||
Institutional Class | 1,000.00 | 1,092.30 | 1,018.80 | 6.63 | 6.39 | 1.26% | ||||||||||||||||||||
China Opportunities Fund | Class A | 1,000.00 | 1,070.10 | 1,015.13 | 10.36 | 10.08 | 1.99% | |||||||||||||||||||
Class C | 1,000.00 | 1,066.50 | 1,011.97 | 13.61 | 13.25 | 2.62% | ||||||||||||||||||||
Class R | 1,000.00 | 1,069.00 | 1,013.83 | 11.70 | 11.39 | 2.25% | ||||||||||||||||||||
Institutional Service Class | 1,000.00 | 1,070.40 | 1,015.48 | 9.99 | 9.73 | 1.92% | ||||||||||||||||||||
Institutional Class | 1,000.00 | 1,072.10 | 1,016.99 | 8.44 | 8.21 | 1.62% | ||||||||||||||||||||
Emerging Markets Fund | Class A | 1,000.00 | 1,082.40 | 1,017.70 | 7.75 | 7.51 | 1.48% | |||||||||||||||||||
Class C | 1,000.00 | 1,078.40 | 1,014.58 | 10.97 | 10.63 | 2.10% | ||||||||||||||||||||
Class R | 1,000.00 | 1,081.30 | 1,016.44 | 9.05 | 8.77 | 1.73% | ||||||||||||||||||||
Institutional Service Class | 1,000.00 | 1,083.10 | 1,018.80 | 6.60 | 6.39 | 1.26% | ||||||||||||||||||||
Institutional Class | 1,000.00 | 1,084.70 | 1,019.61 | 5.76 | 5.58 | 1.10% | ||||||||||||||||||||
Equity Long-Short Fund | Class A | 1,000.00 | 995.50 | 1,010.56 | 14.55 | 14.66 | 2.90% | |||||||||||||||||||
Class C | 1,000.00 | 991.90 | 1,007.19 | 17.87 | 18.01 | 3.57% | ||||||||||||||||||||
Class R | 1,000.00 | 992.80 | 1,008.95 | 16.13 | 16.26 | 3.22% | ||||||||||||||||||||
Institutional Service Class | 1,000.00 | 995.60 | 1,011.26 | 13.84 | 13.95 | 2.76% | ||||||||||||||||||||
Institutional Class | 1,000.00 | 996.70 | 1,012.27 | 12.85 | 12.95 | 2.56% | ||||||||||||||||||||
Global Equity Fund | Class A | 1,000.00 | 1,034.30 | 1,017.29 | 7.98 | 7.91 | 1.56% | |||||||||||||||||||
Class C | 1,000.00 | 1,031.00 | 1,014.13 | 11.18 | 11.09 | 2.19% | ||||||||||||||||||||
Class R | 1,000.00 | 1,033.00 | 1,016.14 | 9.15 | 9.07 | 1.79% | ||||||||||||||||||||
Institutional Service Class | 1,000.00 | 1,035.50 | 1,019.15 | 6.09 | 6.04 | 1.19% | ||||||||||||||||||||
Institutional Class | 1,000.00 | 1,036.80 | 1,019.15 | 6.09 | 6.04 | 1.19% | ||||||||||||||||||||
Annual Report 2016
150
Shareholder Expense Examples (Unaudited) (concluded)
| Beginning Account Value, May 1, 2016 | Actual Ending Account Value, October 31, 2016 | Hypothetical Ending Account Value | Actual Expenses Paid During Period* | Hypothetical Expenses Paid During Period*1 | Annualized Expense Ratio** | |||||||||||||||||||||
Global Natural Resources Fund | Class A | $ | 1,000.00 | $ | 1,040.30 | $ | 1,017.45 | $ | 7.85 | $ | 7.76 | 1.53% | ||||||||||||||
Class C | 1,000.00 | 1,036.30 | 1,014.28 | 11.06 | 10.94 | 2.16% | ||||||||||||||||||||
Class R | 1,000.00 | 1,038.50 | 1,016.14 | 9.17 | 9.07 | 1.79% | ||||||||||||||||||||
Institutional Service Class | 1,000.00 | 1,041.40 | 1,018.70 | 6.57 | 6.50 | 1.28% | ||||||||||||||||||||
Institutional Class | 1,000.00 | 1,044.70 | 1,019.31 | 5.96 | 5.89 | 1.16% | ||||||||||||||||||||
International Equity Fund | Class A | 1,000.00 | 1,036.70 | 1,018.40 | 6.86 | 6.80 | 1.34% | |||||||||||||||||||
Class C | 1,000.00 | 1,032.10 | 1,014.58 | 10.73 | 10.63 | 2.10% | ||||||||||||||||||||
Class R | 1,000.00 | 1,035.00 | 1,017.04 | 8.24 | 8.16 | 1.61% | ||||||||||||||||||||
Institutional Service Class | 1,000.00 | 1,037.60 | 1,019.96 | 5.28 | 5.23 | 1.03% | ||||||||||||||||||||
Institutional Class | 1,000.00 | 1,039.00 | 1,020.06 | 5.18 | 5.13 | 1.01% | ||||||||||||||||||||
International Small Cap Fund | Class A | 1,000.00 | 1,044.20 | 1,016.84 | 8.48 | 8.36 | 1.65% | |||||||||||||||||||
Class C | 1,000.00 | 1,041.40 | 1,013.57 | 11.80 | 11.64 | 2.30% | ||||||||||||||||||||
Class R | 1,000.00 | 1,043.00 | 1,015.28 | 10.07 | 9.93 | 1.96% | ||||||||||||||||||||
Institutional Service Class | 1,000.00 | 1,044.60 | 1,017.85 | 7.45 | 7.35 | 1.45% | ||||||||||||||||||||
Institutional Class | 1,000.00 | 1,046.20 | 1,018.60 | 6.69 | 6.60 | 1.30% | ||||||||||||||||||||
Japanese Equities Fund | Class A | 1,000.00 | 1,106.40 | 1,019.05 | 6.41 | 6.14 | 1.21% | |||||||||||||||||||
Class C | 1,000.00 | 1,102.70 | 1,015.08 | 10.57 | 10.13 | 2.00% | ||||||||||||||||||||
Class R | 1,000.00 | 1,105.50 | 1,017.85 | 7.67 | 7.35 | 1.45% | ||||||||||||||||||||
Institutional Service Class | 1,000.00 | 1,108.40 | 1,020.36 | 5.03 | 4.82 | 0.95% | ||||||||||||||||||||
Institutional Class | 1,000.00 | 1,107.30 | 1,020.11 | 5.30 | 5.08 | 1.00% | ||||||||||||||||||||
U.S. Mid Cap Equity Fund | Class A | 1,000.00 | 1,015.80 | 1,019.05 | 6.13 | 6.14 | 1.21% | |||||||||||||||||||
Class C | 1,000.00 | 1,011.10 | 1,015.08 | 10.11 | 10.13 | 2.00% | ||||||||||||||||||||
Class R | 1,000.00 | 1,013.90 | 1,017.80 | 7.39 | 7.41 | 1.46% | ||||||||||||||||||||
Institutional Service Class | 1,000.00 | 1,016.70 | 1,020.31 | 4.87 | 4.88 | 0.96% | ||||||||||||||||||||
Institutional Class | 1,000.00 | 1,016.70 | 1,020.11 | 5.07 | 5.08 | 1.00% | ||||||||||||||||||||
U.S. Multi-Cap Equity Fund | Class A | 1,000.00 | 1,013.40 | 1,019.15 | 6.02 | 6.04 | 1.19% | |||||||||||||||||||
Class C | 1,000.00 | 1,010.20 | 1,015.59 | 9.60 | 9.63 | 1.90% | ||||||||||||||||||||
Class R | 1,000.00 | 1,011.40 | 1,017.04 | 8.14 | 8.16 | 1.61% | ||||||||||||||||||||
Institutional Service Class | 1,000.00 | 1,014.30 | 1,020.11 | 5.06 | 5.08 | 1.00% | ||||||||||||||||||||
Institutional Class | 1,000.00 | 1,015.10 | 1,020.61 | 4.56 | 4.57 | 0.90% | ||||||||||||||||||||
U.S. Small Cap Equity Fund | Class A | 1,000.00 | 1,021.00 | 1,017.70 | 7.52 | 7.51 | 1.48% | |||||||||||||||||||
Class C | 1,000.00 | 1,017.40 | 1,014.28 | 10.95 | 10.94 | 2.16% | ||||||||||||||||||||
Class R | 1,000.00 | 1,019.90 | 1,016.64 | 8.58 | 8.57 | 1.69% | ||||||||||||||||||||
Institutional Service Class | 1,000.00 | 1,022.70 | 1,019.36 | 5.85 | 5.84 | 1.15% | ||||||||||||||||||||
Institutional Class | 1,000.00 | 1,022.40 | 1,019.36 | 5.85 | 5.84 | 1.15% | ||||||||||||||||||||
| * | Expenses are equal to the Fund’s annualized expense ratio multiplied by the average account value over the period multiplied by 184/366 (to reflect the one-half year period). |
| ** | The expense ratio presented represents a six-month, annualized ratio. |
| 1 | Represents the hypothetical 5% return before expenses. |
2016 Annual Report
151
Supplemental Information (Unaudited)
Board of Trustees’ Consideration of Advisory and Sub-Advisory Agreements
At an in-person meeting of the Board of Trustees (the “Board” or the “Trustees”) of the Aberdeen Funds (the “Trust”) held on June 15, 2016, the Board, including a majority of the Trustees who are not considered to be “interested persons” of the Trust (the “Independent Trustees”) under the Investment Company Act of 1940, as amended (the “1940 Act”), approved for an annual period the continuation of the Trust’s advisory agreement (the “Advisory Agreement”) with Aberdeen Asset Management Inc. (“AAMI”) and the applicable sub-advisory agreements (each a “Sub-Advisory Agreement,” and collectively with the Advisory Agreement, the “Agreements”) between: (i) AAMI and Aberdeen Asset Management Asia Limited (“AAMAL”) and (ii) AAMI and Aberdeen Asset Managers Limited (“AAML”) (each a “Sub-Adviser,” and collectively, the “Sub-Advisers”) for each of the following series of the Trust: Aberdeen Asia-Pacific (ex-Japan) Equity Fund, Aberdeen China Opportunities Fund, Aberdeen Emerging Markets Fund, Aberdeen Equity Long-Short Fund, Aberdeen Global Equity Fund, Aberdeen Global Natural Resources Fund, Aberdeen International Small Cap Fund (formerly Aberdeen Global Small Cap Fund), Aberdeen International Equity Fund, Aberdeen U.S. Small Cap Equity Fund (formerly Aberdeen Small Cap Fund), and Aberdeen U.S. Multi-Cap Equity Fund (formerly Aberdeen U.S. Equity Fund) (each a “Fund,” and collectively the “Funds”). AAMAL and AAML are affiliates of AAMI. AAMI and the Sub-Advisers are sometimes referred to collectively as the “Advisers.”
In connection with contract review meetings, the Board reviews a variety of information provided by the Advisers relating to the Funds, the Agreements and the Advisers, including comparative performance, fee and expense information and other information regarding the nature, extent and quality of services provided by the Advisers under their respective Agreements. The materials provided to the Board generally included, among other items: (i) information on the investment performance of the Funds and the performance of peer groups of funds and the Funds’ performance benchmarks; (ii) information on the Funds’ advisory fees and other expenses, including information comparing each Fund’s expenses to those of a peer group of funds and information about any applicable expense limitations and fee “breakpoints”; (iii) sales and redemption data with respect to each Fund; (iv) information about the profitability of the Agreements to the Advisers; (v) a report prepared by the Advisers in response to a request submitted by the Independent Trustees’ independent legal counsel on behalf of such Trustees; and (vi) a memorandum from the Independent Trustees’ independent legal counsel on the responsibilities of the Board in considering for approval the investment advisory and investment sub-advisory arrangements under the 1940 Act and Delaware law. The Board, including the Independent Trustees, also considers other matters such as: (i) the Advisers’ financial results and financial condition; (ii) each Fund’s investment objective and strategies; (iii) the Advisers’ investment personnel and operations; (iv) arrangements relating to the distribution of the Funds’ shares and the related costs; (v) the procedures employed to determine the value of the Funds’ assets; (vi) the allocation of the Funds’ brokerage, if any, including, if applicable, allocations to brokers affiliated with the Advisers and the use, if any, of “soft” commission dollars to pay Fund expenses and to pay for research and other similar services; (vii) the resources devoted to, and the record of compliance with, the Funds’ investment policies and restrictions, policies on personal securities transactions and other compliance policies; and (viii) possible conflicts of interest. The Board also considers the nature, extent and quality of the services provided to the Funds by AAMI’s affiliates. Throughout the process, the Trustees are afforded the opportunity to ask questions of and request additional materials from AAMI and the Sub-Advisers.
In addition to the materials requested by the Trustees in connection with their annual consideration of the continuation of the Agreements, the Trustees receive materials in advance of each regular quarterly meeting of the Board that provide information relating to the services provided by the Advisers, including detailed information about the Funds’ investment performance. This information generally includes, among other things, third-party performance rankings for various periods (including prior to the Advisers’ management of the Funds, to the extent applicable) comparing each Fund against its peer group, total return information for various periods, and details of sales and redemptions of Fund shares for the period. The Board also receives periodic presentations from the portfolio management teams in connection with the performance of the Funds.
The Independent Trustees were advised by separate independent legal counsel throughout the process. The Independent Trustees also consulted in executive sessions with counsel to the Independent Trustees regarding consideration of the renewal of the Agreements. In considering whether to approve the continuation of the Agreements, the Board of Trustees, including the Independent Trustees, did not identify any single factor as determinative. Individual Trustees may have evaluated the information presented differently from one another, giving different weights to various factors. Matters considered by the Trustees, including the Independent Trustees, in connection with their approval of the continuation of the Agreements included the factors listed below.
The nature, extent and quality of the services provided to the Funds under the Agreements. The Trustees considered the nature, extent and quality of the services provided by AAMI and the Sub-Advisers, as applicable, to the Funds and the resources dedicated to the Funds by AAMI and its affiliates. The Board considered, among other things, the Advisers’ investment experience. The Board also considered the background and experience of the Advisers’ senior management personnel and the qualifications, background and responsibilities of the portfolio managers that are primarily responsible for the day-to-day portfolio management services for the Funds. The Board also considered the allocation of responsibilities among the Advisers. The Trustees considered not only the advisory services provided by AAMI to the Funds, but also the administrative services provided by AAMI to the Funds under a separate administration agreement. AAMI’s role in coordinating the activities of the Trust’s other service providers was also considered. The Board also considered that it receives information on a regular basis from the Trust’s
Annual Report 2016
152
Supplemental Information (Unaudited) (continued)
Chief Compliance Officer regarding the Advisers’ compliance policies and procedures. The Board also considered the Advisers’ risk management processes. The Board was also mindful of the Advisers’ focus on the monitoring of the performance of the Funds and in addressing performance matters. The Trustees also considered the benefits to shareholders of investing in a mutual fund that is part of a family of funds that offers shareholders the right to exchange shares of one type of fund for shares of another type of fund, and provides a variety of fund and shareholder services. The Board also took into account its knowledge of management and the quality of the performance of management’s duties through Board meetings, discussion and reports during the preceding year.
After reviewing these and related factors, the Board concluded that the nature, extent and quality of the services provided were extensive in nature and of high quality and supported the renewal of the Agreements.
Investment performance of the Funds and the Advisers. The Trustees received information about the performance of the Funds over various time periods, including information which compared the performance of the Funds to the performance of peer groups of funds and each Fund’s performance benchmark. The Trustees also considered that certain of the Funds had changed their respective performance benchmarks to better reflect the respective Fund’s investment strategy. The Trustees also considered the performance of the Funds compared to the performance of comparable funds or accounts managed by AAMI and its affiliates to the extent available. In addition, the Trustees also reviewed data prepared by an independent third party which analyzed the performance of the Funds using a variety of performance metrics.
The Trustees also considered AAMI’s and the Sub-Advisers’ performance and reputation generally, the performance of the fund family generally, the historical responsiveness of AAMI to Trustee concerns about performance and the willingness of AAMI and the Sub-Advisers to take steps intended to improve performance. The Trustees also considered the performance of the Advisers since they commenced management of the Funds.
Based on these factors, the Board determined that the Advisers are appropriate investment advisers for the Funds.
The Board further noted that it will continue to monitor the Funds’ performance and any actions taken by AAMI and its affiliates relating to performance.
The costs of the services provided and profits realized by the Advisers and their affiliates from their relationships with the Funds. The Trustees considered the fees charged to the Funds for advisory services as well as the total expense levels of the Funds. This information included comparisons (provided both by management and also by an independent third party) of each Fund’s net management fee and total expense level to those of its expense peer group and information about the advisory fees charged by AAMI to any separately managed accounts with a similar strategy. In comparing each Fund’s net management fee to that of comparable funds, the Board noted that such fee includes both advisory and administrative fees. In considering the fees charged to any comparable accounts, the Trustees considered, among other things, management’s discussion of the different objectives, policies or restrictions that may be involved in managing the different types of accounts. In evaluating the Funds’ advisory fees, the Trustees also took into account the demands, complexity and quality of the investment management of the Funds.
The Trustees also noted that the sub-advisory fees, as applicable, for the Funds would be paid by AAMI out of its advisory fee, not by the Funds. The Board also considered that AAMI had entered into expense limitation agreements with the Funds, pursuant to which AAMI agreed to waive a portion of its advisory fee and/or reimburse certain expenses as a means of limiting each Fund’s total annual operating expenses for a period of time.
The Trustees also considered the compensation directly or indirectly received by AAMI and its affiliates from their relationships with the Funds. The Trustees reviewed information provided by management as to the profitability of AAMI and its affiliates’ relationships with the Funds, such as the engagement of affiliates of AAMI to provide distribution and administrative services to the Funds. The Trustees also examined the profitability of AAMI and its affiliates on a Fund-by-Fund basis. The Trustees also considered information about the allocation of expenses used to calculate profitability. When reviewing profitability, the Trustees also considered information about court cases regarding adviser profitability, the performance of the Funds, the expense levels of the Funds, and whether AAMI had implemented breakpoints and expense limitations with respect to the Funds.
After reviewing these and related factors, including taking into account management’s discussion regarding Fund expenses, the Board concluded that the advisory fee, and as applicable, the sub- advisory fees, were fair and reasonable, and that the costs of these services generally and the related profitability of AAMI and its affiliates from their relationships with the Funds were reasonable and supported the renewal of the Agreements.
Economies of Scale. The Trustees considered the existence of any economies of scale in the provision of services by AAMI and the Sub-Advisers and whether those economies would be shared with the Funds through breakpoints in the investment advisory fees or other means, such as expense waivers or limitations. The Trustees noted that each of the Funds was subject to an expense limitation and considered that certain Funds
2016 Annual Report
153
Supplemental Information (Unaudited) (concluded)
were subject to breakpoints. The Board noted management’s discussion of the Funds’ advisory fee structure. The Trustees also took note of the costs of the services provided and the profitability to AAMI and its affiliates from their relationships with the Funds, as discussed above. The Board also considered the potential effect of each Fund’s growth and size on fees, noting that if a Fund’s assets increase over time, the Fund may realize other economies of scale if assets increase proportionally more than certain expenses.
After reviewing these and related factors, the Board concluded that the advisory fee, and as applicable, sub-advisory fees, were reasonable and supported the renewal of the Agreements.
The Trustees also considered other factors, which included but were not limited to the following:
| • | the effect of any market and economic volatility on the performance, asset levels and expense ratios of the Funds. |
| • | whether the Funds have operated in accordance with their investment objectives and the Funds’ record of compliance with their investment restrictions, and the compliance programs of the Trust and AAMI. The Trustees also considered the compliance-related resources AAMI and its affiliates were providing to the Funds. |
| • | the nature, quality, cost and extent of administrative services performed by AAMI under the Advisory Agreement and under a separate agreement covering administrative services. |
| • | so-called “fallout benefits” to AAMI, such as the benefits of research made available to AAMI by reason of brokerage commissions generated by the Funds’ securities transactions or reputational and other indirect benefits. The Trustees considered any possible conflicts of interest associated with these fallout and other benefits, and the reporting, disclosure and other processes in place to disclose and monitor such possible conflicts of interest. |
* * *
Based on their evaluation of all factors that they deemed to be material, including those factors described above, and assisted by the advice of independent counsel, the Trustees, including the Independent Trustees, concluded that renewal of the Agreements would be in the best interest of each of the Funds and its shareholders. Accordingly, the Board, and the Independent Trustees voting separately, approved the Agreements for an additional one-year period.
Annual Report 2016
154
Management of the Funds (Unaudited)
As of October 31, 2016
| Name, Address, and Year of Birth | Position(s) Held, Length of Time Served and Term of Office* | Principal Occupation During Past 5 Years | Number of Portfolios in Fund Complex Overseen by Trustee** | Other Directorships Held by Trustee | ||||
Trustees who are not Interested Persons (as defined in the 1940 Act) of the Trust (“Independent Trustees”) | ||||||||
P. Gerald Malone**** Year of Birth: 1950 | Trustee since December 2007 Chairman of the Board | Mr. Malone is, by profession, a solicitor of some 40 years standing. He has served as a Minister of State in the United Kingdom Government. Mr. Malone currently serves as Independent Chairman of two UK companies, Crescent OTC Ltd (pharmaceutical services) and fluidOil Ltd. (oil services). He also serves as a director of US company Rejuvenan llc (wellbeing services). He previously served as chairman of Ultrasis plc (healthcare software services company) until October 2014. He is Chairman of the Board of Trustees of Aberdeen Funds, Chairman of the Board of Directors of Aberdeen Global Income Fund, Inc. and Aberdeen Asia-Pacific Income Fund, Inc. and serves on the boards of Aberdeen Australia Equity Fund, Inc. and Aberdeen Asia-Pacific Income Investment Company Limited. | 23 | None. | ||||
Richard H. McCoy**** Year of Birth: 1942 | Trustee since December 2007 | Prior to retiring in 2003, Mr. McCoy was Vice-Chairman, Investment Banking, at TD Securities Inc. He is currently a Director of Uranium Participation Corp. and Pizza Pizza Royalty Corp. and Chair of Chorus Aviation Inc. Mr. McCoy has also been Chairman of Aberdeen Asia-Pacific Income Investment Company Limited since 2010. | 20 | None. | ||||
Neville J. Miles**** Year of Birth: 1946 | Trustee since December 2011 | Mr. Miles is, and has been for over ten years, Chairman of Ballyshaw Pty. Ltd. (share trading, real estate development and investment). He is Chairman of the Board of Directors of Aberdeen Australia Equity Fund, Inc. He also is a non-executive director of a number of Australian and overseas companies. | 22 | None. | ||||
Rahn K. Porter**** Year of Birth: 1954 | Trustee since September 2016 | Mr. Porter has been the Chief Financial and Administrative Officer of The Colorado Health Foundation since 2013, and was the Interim Chief Executive Officer of The Colorado Health Foundation from 2014 to 2015. Previously, he was Senior Vice President and Treasurer, Qwest Communications International Inc. (telecommunications) from 2008 to 2011. Mr. Porter serves on the boards of Aberdeen Singapore Fund, Inc. and Aberdeen Japan Equity Fund, Inc. | 21 | Director, CenturyLink Asset Management Company, since 2006; Director, BlackRidge Financial Inc., since March, 2005. | ||||
2016 Annual Report
155
Management of the Funds (Unaudited) (continued)
As of October 31, 2016
| Name, Address, and Year of Birth | Position(s) Held, Length of Time Served and Term of Office* | Principal Occupation During Past 5 Years | Number of Portfolios in Fund Complex Overseen by Trustee** | Other Directorships Held by Trustee | ||||
Steven N. Rappaport**** Year of Birth: 1948 | Trustee since September 2016 | Mr. Rappaport has been a Partner of Lehigh Court, LLC (private investment firm) and RZ Capital LLC (private investment firm) since 2004. Mr. Rappaport serves on the boards of Aberdeen Indonesia Fund, Inc., Aberdeen Israel Fund, Inc., Aberdeen Latin America Equity Fund, Inc., Aberdeen Chile Fund, Inc. and Aberdeen Emerging Markets Smaller Company Opportunities Fund, Inc. | 24 | Director of iCAD, Inc., since 2006; Director of Credit Suisse Funds (9) since 1999; Director of Credit Suisse Asset Management Income Fund, Inc. since 2005 and Director of Credit Suisse High Yield Bond Fund, Inc. since 2005. | ||||
Peter D. Sacks**** Year of Birth: 1945 | Trustee since December 2007 | Mr. Sacks was a Director and Founding Partner of Toron AMI International Asset Management (investment management) from 1988 to 2015. He is currently a Director of Aberdeen Asia-Pacific Income Fund Inc., Aberdeen Global Income Fund Inc., Aberdeen Australia Equity Fund Inc. and Tricon Capital Group Inc. | 22 | None. | ||||
John T. Sheehy**** Year of Birth: 1942 | Trustee since December 2007 | Mr. Sheehy has been a Senior Managing Director of B.V. Murray and Company (investment banking) since 2001 and Director of Macquarie AIR-serv Holding, Inc. (automotive services) from 2006 to 2013. He was a Managing Member of Pristina Capital Partners, LLC (water purification technology development) from 2007 to 2011 and a Director of Smarte Carte, Inc. (airport services) from 2007 to 2010. | 23 | None. | ||||
Warren C. Smith**** Year of Birth: 1955 | Trustee since December 2007 | Mr. Smith has been a founding partner of MRB Partners Inc. (independent investment research and consultancy firm) since 2010. Mr. Smith was a Managing Editor with The Bank Credit Analyst Research Group (independent publishers of financial market research and publications, including The Bank Credit Analyst) from 1982 to 2009. | 20 | None. |
Annual Report 2016
156
Management of the Funds (Unaudited) (continued)
As of October 31, 2016
| Name, Address, and Year of Birth | Position(s) Held, Length of Time Served and Term of Office* | Principal Occupation During Past 5 Years | Number of Portfolios in Fund Complex Overseen by Trustee** | Other Directorships Held by Trustee | ||||
Trustees who are Interested Persons (as defined in the 1940 Act) of the Trust (“Interested Trustees”) | ||||||||
Martin Gilbert****† Year of Birth: 1955 | Trustee since December 2007 | Mr. Gilbert is a founding director and shareholder, and Chief Executive of Aberdeen Asset Management PLC, the holding company of the fund management group that was established in 1983 (“Aberdeen Group”). He was a Director (1991–2014) of Aberdeen Asset Management Asia Limited and a Director (2000–2014) of Aberdeen Asset Management Limited. He was a Director (1995–2014) and was President (September 2006–2014) of Aberdeen Asset Management Inc. Mr. Gilbert also serves as officer and/or director of various Aberdeen Group subsidiary companies, Aberdeen-managed investment trusts and funds’ boards. | 24 | None. | ||||
| * | Each Trustee holds office for an indefinite term until his successor is elected and qualified. |
| ** | As of October 31, 2016, the Aberdeen Fund Complex consists of the Trust (which consists of 19 portfolios), Aberdeen Asia-Pacific Income Fund, Inc., Aberdeen Global Income Fund, Inc., Aberdeen Australia Equity Fund, Inc., Aberdeen Chile Fund, Inc., Aberdeen Israel Fund, Inc., Aberdeen Indonesia Fund, Inc., Aberdeen Latin America Equity Fund, Inc., Aberdeen Emerging Markets Smaller Company Opportunities Fund, Inc., Aberdeen Singapore Fund, Inc., The Asia Tigers Fund, Inc., The India Fund, Inc., Aberdeen Greater China Fund, Inc., Aberdeen Japan Equity Fund, Inc. and Aberdeen Investment Funds. |
| *** | Directorships held in (1) any other investment companies registered under the 1940 Act, (2) any company with a class of securities registered pursuant to Section 12 of the Securities Exchange Act of 1934, as amended (the “Exchange Act”) or (3) any company subject to the requirements of Section 15(d) of the Exchange Act. |
| **** | Each Trustee may be contacted by writing to the Trustee c/o Aberdeen Asset Management Inc., 1735 Market Street, 32nd Floor, Philadelphia, Pennsylvania 19103, Attn: Alan Goodson. |
| † | Mr. Gilbert is considered to be an “interested person” of the Trust as defined in the 1940 Act because of his affiliation with the Adviser. |
2016 Annual Report
157
Management of the Funds (Unaudited) (continued)
As of October 31, 2016
Officers of the Trust
| Name, Address, and Year of Birth | Position(s) Held, Length of Time Served and Term of Office* | Principal Occupation During Past 5 Years | ||
Bev Hendry** Aberdeen Asset Management Inc. 1735 Market Street 32nd Floor Philadelphia, PA 19103 Year of Birth: 1953 | President, Chief Executive Officer and Principal Executive Officer (Since September 2014) | Currently, Co-Head of Americas and Director for Aberdeen Asset Management Inc. since June 2014. He first joined Aberdeen in 1987 and helped establish Aberdeen’s business in the Americas in Fort Lauderdale. Mr. Hendry left Aberdeen in 2008 when the company moved to consolidate its headquarters in Philadelphia. Mr. Hendry re-joined Aberdeen from Hansberger Global Investors in Fort Lauderdale, Florida, where he worked for six years as Chief Operating Officer. | ||
Jeffrey Cotton** Aberdeen Asset Management Inc. 1735 Market Street 32nd Floor Philadelphia, PA 19103 Year of Birth: 1977 | Vice President and Chief Compliance Officer (Since March 2011) | Currently, Director, Vice President and Head of Compliance–Americas for Aberdeen Asset Management Inc. Mr. Cotton joined Aberdeen in 2010. Prior to joining Aberdeen, Mr. Cotton was a Senior Compliance Officer at Old Mutual Asset Management (2009-2010) supporting its affiliated investment advisers and mutual fund platform. Mr. Cotton was also a Vice President and Senior Compliance Manager at Bank of America/Columbia Management (2006-2009). | ||
Andrea Melia** Aberdeen Asset Management Inc. 1735 Market Street 32nd Floor Philadelphia, PA 19103 Year of Birth: 1969 | Treasurer, Chief Financial Officer, and Principal Accounting Officer (Since September 2009) | Currently, Vice President and Head of Fund Administration for Aberdeen Asset Management Inc. (since 2009). Prior to joining Aberdeen, Ms. Melia was Director of Fund Administration and accounting oversight for Princeton Administrators LLC, a division of BlackRock Inc. and had worked with Princeton Administrators since 1992. | ||
Megan Kennedy** Aberdeen Asset Management Inc. 1735 Market Street 32nd Floor Philadelphia, PA 19103 Year of Birth: 1974 | Secretary and Vice President (Since September 2009) | Currently, Head of Product Management for Aberdeen Asset Management Inc. Ms. Kennedy joined Aberdeen Asset Management Inc. in 2005 as a Senior Fund Administrator. Ms. Kennedy was promoted to Assistant Treasurer Collective Funds/North American Mutual Funds in February 2008 and promoted to Treasurer Collective Funds/North American Mutual Funds in July 2008. | ||
Lucia Sitar** Aberdeen Asset Management Inc. 1735 Market Street 32nd Floor Philadelphia, PA 19103 Year of Birth: 1971 | Vice President (Since December 2008) | Currently, Vice President and Managing U.S. Counsel for Aberdeen Asset Management Inc. Ms. Sitar joined Aberdeen Asset Management Inc. in July 2007. | ||
Brad Crombie Aberdeen Asset Management Bow Bells House 1 Bread Street London EC4M 9HH Year of Birth: 1970 | Vice President (Since June 2013) | Currently, Global Head of Fixed Income for Aberdeen Asset Management PLC. Mr. Crombie re-joined Aberdeen in 2012. Prior to re-joining Aberdeen, Mr. Crombie was a Managing Director at Bank of America Merrill Lynch for the bank’s non-financial corporate and high yield credit research team for the Europe, Middle East and Africa region from 2003 to 2012. |
Annual Report 2016
158
Management of the Funds (Unaudited) (continued)
As of October 31, 2016
| Name, Address, and Year of Birth | Position(s) Held, Length of Time Served and Term of Office* | Principal Occupation During Past 5 Years | ||
Alan Goodson** Aberdeen Asset Management Inc. 1735 Market Street 32nd Floor Philadelphia, PA 19103 Year of Birth: 1974 | Vice President (Since March 2009) | Currently, Head of Product–US, overseeing Product Management, Product Development and Investor Services for Aberdeen’s registered and unregistered investment companies in the US and Canada. Mr. Goodson is Director and Vice President of Aberdeen Asset Management Inc. and joined Aberdeen in 2000. | ||
Adam McCabe** Aberdeen Asset Management Asia Limited 21 Church Street #01-01 Capital Square Two Singapore 049480 Year of Birth: 1979 | Vice President (Since March 2010) | Currently, Head of Asian Fixed Income on the Fixed Income–Asia Pacific desk, responsible for currency and interest rate strategies in Aberdeen’s Asian fixed income portfolios. Mr. McCabe joined Aberdeen in 2009 following the acquisition of certain asset management businesses from Credit Suisse. Mr. McCabe worked for Credit Suisse since 2001, where he was an investment manager responsible for the development and implementation of its Asian currency and interest rate strategies. | ||
Jennifer Nichols** Aberdeen Asset Management Inc. 1735 Market Street 32nd Floor Philadelphia, PA 19103 Year of Birth: 1978 | Vice President (Since December 2007) | Currently, Global Head of Legal for Aberdeen Asset Management PLC. Director and Vice President for Aberdeen Asset Management Inc. (since October 2006). | ||
Hugh Young** Aberdeen Asset Management Asia Limited 21 Church Street #01-01 Capital Square Two Singapore 049480 Year of Birth: 1958 | Vice President (Since June 2011) | Currently, Managing Director of Aberdeen Asset Management Asia Limited (since 1991) and member of the Executive Management Committee and Director of Aberdeen Asset Management PLC (since 1991 and 2011, respectively). Mr. Young joined Aberdeen in 1991. | ||
Russell Barlow Aberdeen Asset Management Bow Bells House 1 Bread Street London EC4M 9HH Year of Birth: 1974 | Vice President (Since October 2015) | Currently, Head of Hedge Funds, based in Aberdeen’s London office, chairman of the Hedge Fund Investment Committee, Deputy Chair of the Pan Alternatives Investment Committee and responsible for co-mingled Hedge Fund portfolios. Mr. Barlow joined Aberdeen in 2010 via the acquisition of various asset management businesses from Royal Bank of Scotland where he was the Head of the Global Event Team. | ||
Brian O’Neill** Aberdeen Asset Management Inc. 1735 Market Street 32nd Floor Philadelphia, PA 19103 Year of Birth: 1968 | Assistant Treasurer (Since September 2008) | Currently, Senior Fund Administration Manager–US for Aberdeen Asset Management Inc. Mr. O’Neill joined Aberdeen Asset Management Inc. in 2008. Prior to joining Aberdeen Asset Management Inc., Mr. O’Neill was a Director of Fund Accounting with Nationwide Funds Group (2002-2008). |
2016 Annual Report
159
Management of the Funds (Unaudited) (concluded)
As of October 31, 2016
| Name, Address, and Year of Birth | Position(s) Held, Length of Time Served and Term of Office* | Principal Occupation During Past 5 Years | ||
Eric Olsen** Aberdeen Asset Management Inc. 1735 Market Street 32nd Floor Philadelphia, PA 19103 Year of Birth: 1970 | Assistant Treasurer (Since December 2013) | Currently, Deputy Head of Fund Administration–US for Aberdeen Asset Management Inc. Mr. Olsen joined Aberdeen Asset Management Inc. in August 2013. Prior to joining Aberdeen Asset Management Inc., Mr. Olsen was a Director of Financial Reporting for BNY Mellon Asset Servicing and had worked with BNY Mellon since 1998. |
| * | Each officer holds office for an indefinite term at the pleasure of the Board of Trustees and until his or her successor is elected and qualified. |
| ** | Mr. Hendry, Ms. Melia, Ms. Kennedy, Mr. Goodson, Ms. Nichols, Mr. Cotton, Mr. McCabe, Mr. Young, Ms. Sitar, Mr. Olsen and Mr. O’Neill hold officer position(s) in one or more of the following: Aberdeen Asia-Pacific Income Fund, Inc., Aberdeen Australia Equity Fund, Inc., Aberdeen Global Income Fund, Inc., Aberdeen Chile Fund, Inc., Aberdeen Israel Fund, Inc., Aberdeen Indonesia Fund, Inc., Aberdeen Latin America Equity Fund, Inc., Aberdeen Emerging Markets Smaller Company Opportunities Fund, Inc., Aberdeen Singapore Fund, Inc., The Asia Tigers Fund, Inc., The India Fund, Inc., Aberdeen Greater China Fund, Inc., Aberdeen Japan Equity Fund, Inc. and Aberdeen Investment Funds, each of which may also be deemed to be a part of the same “Fund Complex” as the Trust. |
Annual Report 2016
160
Corporate Information
Trustees
P. Gerald Malone, Chairman
Martin J. Gilbert
Richard H. McCoy
Neville J. Miles
Rahn K. Porter
Steven N. Rappaport
Peter D. Sacks
John T. Sheehy
Warren C. Smith
Officers
Bev Hendry, President and Chief Executive Officer
Jeffrey Cotton, Chief Compliance Officer and Vice President
Andrea Melia, Treasurer and Chief Financial Officer
Megan Kennedy, Secretary and Vice President
Brad Crombie, Vice President
Lucia Sitar, Vice President
Alan Goodson, Vice President
Adam McCabe, Vice President
Jennifer Nichols, Vice President
Hugh Young, Vice President
Russell Barlow, Vice President
Eric Olsen, Assistant Treasurer
Brian O’Neill, Assistant Treasurer
Investment Manager
Aberdeen Asset Management Inc.
1735 Market Street, 32nd Floor
Philadelphia, PA 19103
Fund Administrator
Aberdeen Asset Management Inc.
1735 Market Street, 32nd Floor
Philadelphia, PA 19103
Transfer Agent
Boston Financial Data Services, Inc.
30 Dan Road
Canton, MA 02021
Distributor
Aberdeen Fund Distributors LLC
1735 Market Street, 32nd Floor
Philadelphia, PA 19103
Sub-Administrator, Custodian & Fund Accountant
State Street Bank and Trust Company
1 Heritage Drive, 3rd Floor
North Quincy, MA 02171
Independent Registered Public Accounting Firm
KPMG LLP
1601 Market Street
Philadelphia, PA 19103
Fund Counsel
Willkie Farr & Gallagher LLP
787 Seventh Avenue
New York, NY 10019
Aberdeen Asset Management Inc. 1735 Market Street, 32nd Floor Philadelphia, PA 19103 aberdeen-asset.us | |
AOE-0140-AR

Aberdeen Funds
Asset Allocations Series
Annual Report
October 31, 2016
Aberdeen Diversified Alternatives Fund
Aberdeen Diversified Income Fund
Aberdeen Dynamic Allocation Fund

| Page 1 | ||||
| Page 3 | ||||
| Page 8 | ||||
| Page 13 | ||||
| Page 18 | ||||
| Page 30 | ||||
| Page 43 | ||||
| Page 44 | ||||
| Page 45 | ||||
| Page 46 | ||||
| Page 49 | ||||
Investors should carefully consider a fund’s investment objectives, risks, fees, charges and expenses before investing any money. To obtain this and other fund information, please call 866-667-9231 to request a prospectus, or download a prospectus at www.aberdeen-asset.us. Please read it carefully before investing any money.
Investing in mutual funds involves risk, including possible loss of principal.
Aberdeen Funds is distributed by Aberdeen Fund Distributors LLC, Member FINRA, 1735 Market Street, 32nd Floor, Philadelphia, PA 19103.
Aberdeen Asset Management Inc. (“AAMI”) has been registered as an investment adviser under the Investment Advisers Act of 1940 since August 23, 1995.
Statement Regarding Availability of Quarterly Portfolio Schedule.
The complete schedule of portfolio holdings for each fund of Aberdeen Funds (each, a “Fund” and collectively, the “Funds”) is included in the Funds’ semi-annual and annual reports to shareholders. Aberdeen Funds also files complete schedules of portfolio holdings for each Fund with the Securities and Exchange Commission (the “Commission”) for the first and third quarters of each fiscal year on Form N-Q. The Funds’ Form N-Q filings are available on the Commission’s website at http://www.sec.gov. The Funds’ Form N-Q filings may be reviewed and copied at the Commission’s Public Reference Room in Washington, DC, and information on the operation of the Public Reference Room may be obtained by calling 800-SEC-0330; and the Funds make the information on Form N-Q available to shareholders on www.aberdeen-asset.us or upon request without charge.
Statement Regarding Availability of Proxy Voting Record.
Information regarding the policies and procedures that the Funds use to determine how to vote proxies relating to portfolio securities is available without charge, upon request, by calling 1-866-667-9231. The information is also included in the Funds’ Statement of Additional Information, which is available on the Funds’ website at www.aberdeen-asset.us and on the Commission’s website at www.sec.gov.
Information relating to how each Fund voted proxies relating to portfolio securities held during the most recent twelve months ended June 30 is available by August 30 of the relevant year: (i) upon request and without charge by calling 1-866-667-9231; and (ii) on the Commission’s website at www.sec.gov.
The 12-month reporting period ended October 31, 2016 appeared to encapsulate the adage: “Expect the unexpected.” Myriad economic and geopolitical events prompted numerous bouts of volatility in the global financial markets over the period – and beyond. There was abundant speculation regarding U.S. Federal Reserve (Fed) monetary policy, with investor sentiment alternatively shifting towards and away from interest-rate hikes with each release of economic data. In early 2016, oil and commodity prices ended their prolonged slump and led to a rally in global equities. However, in June 2016, the UK’s surprising approval of a referendum to leave the European Union (EU) – commonly referred to as “Brexit” – sent tremors through the global markets. Stock prices fell sharply, oil prices slumped, and the British sterling plummeted to a 30-year low against the U.S. dollar. Investor sentiment recovered soon thereafter as central banks in Japan and parts of Europe unexpectedly imposed negative interest rates in a bid to combat low inflation and boost spending. In the U.S., Fed policy remained on hold for most of the reporting period after the central bank increased its benchmark interest rate for the first time in more than nine years in December 2015. Additionally, for much of the reporting period, investors focused on the pending U.S. presidential election and its possible impact on the global economy and financial markets. Shortly after the end of the reporting period in early November, real estate magnate Donald Trump, seemingly benefiting from a global surge in populism that had led to the successful campaign for Brexit, secured what generally had been deemed an improbable victory in the presidential election versus former U.S. Secretary of State Hillary Clinton.
The Morgan Stanley Capital International (MSCI) World Index, a global equity market benchmark, registered a modest gain of 1.8% for the reporting period. Shares of U.S. large-cap companies significantly outperformed their developed-market peers in Europe, but lagged large-cap Asian stocks. The U.S. broader-market S&P 500 Index was up 4.5% for the period, versus the corresponding -7.5% and 8.0% returns of the MSCI Europe and MSCI All-Country (AC) Asia Pacific indices. Emerging-markets and global natural resources stocks benefited from the sharp rebound in oil and commodity prices, with the MSCI Emerging Markets and the S&P Global Natural Resources indices climbing 9.7% and 13.6%, respectively, for the reporting period.1
U.S. equities saw modest gains over the reporting period, with large-cap stocks slightly outperforming small-cap company stocks. Economic growth was sluggish for most of the period before expanding sharply in the third quarter of 2016. The U.S. employment picture continued to improve, albeit at a somewhat slower rate in the second half of the reporting period. However, average hourly wages rose 2.8% over the 12-month reporting period – the largest year-over-year increase since June 2009. Corporate results were generally positive, with 72% of S&P 500 Index companies exceeding consensus earnings estimates and 54% posting better-than-expected revenue for the third-quarter 2016 earnings season.2
Given their significant exposure to the uncertainty generated by Brexit, UK and European stocks lost ground and were the weakest global equity market performers over the reporting period. The UK electorate’s surprising vote to leave the EU counterbalanced the upturn in the European markets for much of the first half of 2016, as the European Central Bank’s aggressive monetary easing had boosted investor sentiment. Earlier in the reporting period, stocks in the region fell amid concerns regarding the terror attacks in Paris and Brussels in November 2015 and March 2016, respectively.
The Asian stock markets performed well during the reporting period despite a slowdown in economic growth in China and the government’s devaluation of its currency, the renminbi, as well as the Brent crude oil price dropping to a multi-year low at the beginning of the 2016 calendar year. The strength in the second half of the period was attributable primarily to investors’ optimism regarding rising oil and commodity prices and global central bank monetary policy. Stock prices rose in response to the European Central Bank’s package of fresh monetary stimulus and the Bank of Japan’s (BoJ’s) move to impose negative interest rates. Additionally, the Japanese yen moved higher amid the flight to safety shortly after the Brexit vote and investors’ hopes that the BoJ would take further stimulus measures. China’s economy strengthened due to increased infrastructure spending and a robust real estate market.
The strong performance of emerging-market equities over the reporting period was attributable primarily to a significant upturn in the Latin America region – particularly Brazil. That market rallied sharply after former President Dilma Rousseff was impeached on charges of fiscal mismanagement and subsequently removed from office. Vice President Michel Temer succeeded her as president. Temer’s economic team, which includes former central bank president Henrique Meirelles serving as finance minister, unveiled an ambitious program of reforms in an effort to buttress the country’s public finances. In contrast, Mexican stocks declined over the reporting period, hampered by an economic slowdown and the global slump in oil prices. Additionally, the Mexican peso weakened against the U.S. dollar on concerns regarding the possible impact of trade restrictions and tariffs and tougher immigration laws under a Trump administration.
Global fixed-income securities saw positive returns over the reporting period as most central banks maintained accommodative monetary policy. Benchmark interest rates remained slightly above 0% in the U.S. and dipped into negative territory in Europe and Japan. Global investment-grade bonds, as measured by the Bloomberg Barclays Global Aggregate Bond Index, gained 5.6% during the reporting period. High-yield issues significantly outperformed their investment-grade counterparts for the period. The Bank of America Merrill Lynch Global High Yield Constrained Index climbed 10.6%, as the asset class was bolstered mainly by the upturn in global commodity prices for much of the reporting period.
2016 Annual Report
1
Market Review (concluded)
Outlook
It seems that the global financial markets have been subjected to heavy doses of Trump- and Brexit-related news, in our view. Both trending topics caused upheaval in equity and bond prices and prompted furious but short-lived sell-offs in the markets. With the continued rise of insurgent populist movements elsewhere in the developed world, we think that we may be heading for an economic and political “crunch point.” The electoral tests thus far in 2016 have brought de-globalization and protectionist tendencies into the front line of government in both the U.S. and the UK. Other incumbent governments facing such challenges in the year ahead – most obviously in France and Germany – are taking notice and contemplating how to explain the benefits of globalization, while acknowledging they could and should be shared more widely.
We feel that it is worth bearing in mind that the story of populism and de-globalization is nuanced, with both negative and positive implications for champions of globalization. On the downside, this complexity may make it harder to successfully address the causes of discontent and reduce the risk of damaging de-globalization. Nonetheless, protectionism is not an inevitable, reflexive response to the challenges the world faces on the other side of the global financial crisis. Returning to the UK, and specifically the EU referendum result, young people voted “remain” overall, whereas older demographic groups favored “leave.” At least in this case, in our opinion, those who have spent all their lives in a globalized world appear most reluctant to give up on it just yet.
Hugh Young
Managing Director
Aberdeen Asset Management
| 1 | Indexes are unmanaged and have been provided for comparison purposes only. No fees or expenses are reflected. You cannot invest directly in an index. |
| 2 | Source: FactSet, “Earnings Insight,” November 2016 |
Annual Report 2016
2
Aberdeen Diversified Alternatives Fund (Unaudited)
The Aberdeen Diversified Alternatives Fund (Institutional Class shares net of fees) returned -0.51% for the 12-month period ended October 31, 2016, versus the 0.22% return of its benchmark, the Citigroup 3-Month Treasury Bill Index, for the same period. For broader comparison, the average return of the Fund’s peer category of Alternative Multi-Strategy Funds (consisting of 76 funds), as measured by Lipper, Inc., was -0.04%.
The 12-month reporting period was characterized by weak global economic growth and heightened concerns around deflation in the developed economies. After raising its benchmark interest rate for the first time in nearly 10 years in December 2015, the U.S. Federal Reserve (Fed) had been expected to continue to increase rates over the course of 2016. However, weakening growth in economies outside of the U.S. made the Federal Open Market Committee turn cautious, and there were no further rate increases over the balance of the reporting period. Emerging markets in particular started 2016 under pressure, with China continuing to devalue the renminbi and commodity prices falling. The European Central Bank (ECB) and the Bank of Japan (BoJ), confronted with sluggish domestic growth, declining inflation expectations and strengthening currencies, responded by pushing deposit rates deeper into negative territory. However, over the second and third quarters of 2016, emerging markets began a strong recovery as China unleashed substantial fiscal stimulus via a renewed state-directed credit expansion. A recovery in Chinese growth and a rally in commodity prices, coinciding with monetary policy easing in developed markets, provided strong support for emerging-market equities and credit. The Latin American market was a particularly strong performer, as investors took a favorable view of political change in Brazil. The MSCI Emerging Markets Index gained 9.7% over the reporting period. In U.S. dollar terms, Brazil’s Bovespa Index1 climbed 72% over the 12-month reporting period. Conversely, in Europe, investor sentiment continued to deteriorate in the wake of the UK’s decision to exit the European Union (Brexit). The sterling fell heavily in the wake of the Brexit vote and European equities generally underperformed their global counterparts over the reporting period. The Europe Stoxx 6002 declined by 6.5% over the reporting period compared to gains of 4.5% and 1.2% for the U.S. broader-market S&P 500 and MSCI World indices, respectively.
Developed-market bond yields fell over the reporting period. The long end of the yield curve was supported by low inflation expectations and continued asset purchases by the ECB and the BoJ (underpinning global demand for low-risk assets with higher yields). In the U.S., however, short-term interest rates rose as investors still anticipated that the Fed would gradually raise the federal funds rate over the coming months. The low interest-rate environment hampered the banking sector over the reporting period. Further interest-rate cuts by global central banks came to be viewed as counterproductive, primarily because of the negative effects on the economy of reduced credit availability from a banking sector increasingly struggling to maintain profitability. Therefore, the policy consensus among global governments appeared to move in favor of using fiscal easing to stimulate the economy rather than additional monetary easing.
The reporting period was challenging in terms of performance across several of the Fund’s strategies. The Fund’s holdings in Eaton Vance Floating Rate Fund, Nuveen Preferred Securities Fund, and iShares TIPS Bond ETF, an exchange-traded fund, bolstered performance as they performed well in the generally favorable interest-rate environment during the period. The holding in iShares Global Infrastructure Fund also posted a strong performance amid the recovery in the energy sector and investors’ search for yield. Conversely, a significant detractor from Fund performance for the reporting period was the holding in BlackRock Global Long/Short Equity Fund, which had a difficult first half of 2016. Additionally, the Fund’s position in Deutsche x-Trackers MSCI Japan Hedged Equity Fund, a currency-hedged equity strategy that generally benefits from yen-weakening, faced significant headwinds from the yen-strengthening relative to the U.S. dollar during the period. Fund performance also was hampered by the positions in AQR Managed Futures Fund and First Trust Health Care AlphaDex Fund.
At the end of the 12-month period ended October 31, 2016, the Fund was invested in line with its alternatives orientation and lower-volatility objective, and we believe that it is consistent with our current views on the global macroeconomic outlook. We remain cautiously inclined toward risk assets in the medium term, given sluggish global growth and key geopolitical events in Europe. We are also mindful of the looming divergence in global central bank policies as the Fed contemplates more interest-rate increases. In terms of asset-class exposures, we remain significantly focused on minimizing downside capture;3 therefore, we are maintaining the Fund’s positioning in less correlated4 and lower-beta5 assets as a hedge against near-term volatility.
Portfolio Management
Aberdeen Alternatives and Multi-Asset Team
PAST PERFORMANCE DOES NOT GUARANTEE FUTURE RESULTS.
The performance data quoted represents past performance and current returns may be lower or higher. Class A shares have up to a 5.75% front-end sales charge and a 0.25% 12b-1 fee. The investment return and principal value will fluctuate so that an investor’s shares, when redeemed, may be worth more or less than the original cost. To obtain performance information current to the most recent month-end, which may be higher or lower than the performance shown above, please call 866-667-9231 or go to www.aberdeen-asset.us.
2016 Annual Report
3
| 1 | The Bovespa Index tracks the performance of approximately 50 stocks traded on the São Paulo Stock, Mercantile & Futures Exchange. Indexes are unmanaged and have been provided for comparison purposes only. No fees or expenses are reflected. You cannot invest directly in an index. |
| 2 | The Europe Stoxx 600 tracks the performance of 600 large-, mid- and small-capitalization companies across 17 countries within the European region: Austria, Belgium, Czech Republic, Denmark, Finland, France, Germany, Ireland, Italy, Luxembourg, the Netherlands, Norway, Portugal, Spain, Sweden, Switzerland and the UK. |
| 3 | Downside capture is used to evaluate how well or poorly an investment manager performed relative to an index during periods when that index has declined. |
| 4 | Correlation is a statistical measure of how two securities move in relation to each other |
| 5 | Beta is a measure of the volatility of a portfolio in comparison to a benchmark index. |
Aberdeen Diversified Alternatives Fund (Unaudited) (concluded)
Investing in mutual funds involves risk, including the possible loss of principal.
Indexes are unmanaged and have been provided for comparison purposes only. No fees or expenses are reflected. You cannot invest directly in an index.
Lipper is a leading global provider of mutual fund information and analysis to fund companies, financial intermediaries and media organizations.
Risk Considerations
The Fund is subject to different levels and combinations of risk, based on its actual allocation among the various asset classes and underlying funds. The Fund will be affected by stock and bond market risks, among others.
Foreign securities may be more volatile, harder to price and less liquid than U.S. securities, and are subject to different accounting and regulatory standards, and political and economic risks and, to the extent denominated in foreign currencies, currency exchange rate risk (unless otherwise hedged). These risks are enhanced in emerging market countries.
Fixed income securities are subject to certain risks including, but not limited to: interest rate (changes in interest rates may cause a decline in the market value of an investment), credit (changes in the financial condition of the issuer, borrower, counterparty, or underlying collateral), prepayment (debt issuers may repay or refinance their loans or obligations earlier than anticipated), call (some bonds allow the issuer to call a bond for redemption before it matures), and extension (principal repayments may not occur as quickly as anticipated, causing the expected maturity of a security to increase).
The Fund invests a significant proportion of its assets in non-traditional asset classes, which may involve riskier types of securities or investments than those offered by other asset classes.
Please read the prospectus for more detailed information regarding these and other risks.
Annual Report 2016
4
Aberdeen Diversified Alternatives Fund (Unaudited)
Average Annual Total Return1 (For periods ended October 31, 2016) | 1 Yr. | 5 Yr. | 10 Yr. | |||||||||||
Class A | w/o SC | (0.87% | ) | 4.30% | 2.33% | |||||||||
| w/SC2 | (6.56% | ) | 3.07% | 1.72% | ||||||||||
Class C | w/o SC | (1.45% | ) | 3.58% | 1.60% | |||||||||
| w/SC3 | (2.43% | ) | 3.58% | 1.60% | ||||||||||
Class R4 | w/o SC | (1.17% | ) | 3.95% | 2.03% | |||||||||
Institutional Service Class4,5 | w/o SC | (0.55% | ) | 4.55% | 2.45% | |||||||||
Institutional Class4 | w/o SC | (0.51% | ) | 4.60% | 2.61% | |||||||||
All figures showing the effect of a sales charge (SC) reflect the maximum charge possible because it has the most significant effect on performance data. The total returns shown above do not include the impact of financial statement rounding of the net asset value (NAV) per share and/or financial statement adjustments.
| 1 | The Fund changed its investment objective and strategy effective September 24, 2012. Performance information for periods prior to September 24, 2012 does not reflect the current investment strategy. Returns also incorporate the performance of a predecessor fund (the “Predecessor Fund”) from inception to June 23, 2008. Returns of the Predecessor Fund have not been adjusted to reflect the expenses applicable to the respective classes. Prior to the change of investment objective and strategy of the Fund effective September 24, 2012, the Fund and the Predecessor Fund had substantially similar investment objectives and strategies. Please consult the Fund’s prospectus for more detail. |
| 2 | A 5.75% front-end sales charge was deducted. |
| 3 | A 1.00% contingent deferred sales charge (CDSC) was deducted from the one year return because it is charged when Class C shares are sold within the first year after purchase. |
| 4 | Not subject to any sales charges. |
| 5 | Returns before the first offering of the Institutional Service Class (September 24, 2012) are based on the performance of the Fund’s Class A shares. Excluding the effect of any fee waivers or reimbursements, this performance is substantially similar to what the Institutional Service Class shares would have produced because both classes invest in the same portfolio of securities. Returns for the Institutional Service Class shares would only differ to the extent of the differences in expenses of the two classes. |
2016 Annual Report
5
Aberdeen Diversified Alternatives Fund (Unaudited)
Performance of a $10,000 Investment (as of October 31, 2016)
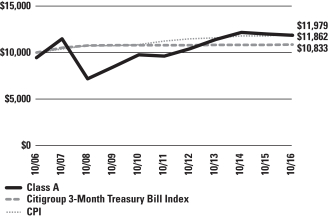
Comparative performance of $10,000 invested in Class A shares of the Aberdeen Diversified Alternatives Fund, the Citigroup 3-Month Treasury Bill Index and the Consumer Price Index (CPI) over a 10-year period ended October 31, 2016. Unlike the Fund, the returns for these unmanaged indexes do not reflect any fees, expenses, or sales charges. Investors cannot invest directly in market indexes.
The Citigroup 3-Month Treasury Bill Index consists of the last three-month Treasury bill issues and measures monthly returns equivalents of yield averages that are not marked to market.
The CPI is a measure of the average change over time in the prices paid by urban consumers for a market basket of consumer goods and services.
Investment return and principal value will fluctuate, and when redeemed, shares may be worth more or less than original cost. Past performance is no guarantee of future results. The Average Annual Total Return table and Performance graph do not reflect the deduction of taxes that a shareholder would pay on fund distributions or the redemption of fund shares. Investing in mutual funds involves market risk, including loss of principal. Performance returns assume the reinvestment of all distributions. Performance returns reflect fee waivers and reimbursements in effect, without which returns would have been lower.
Portfolio Summary (as a percentage of net assets)
October 31, 2016 (Unaudited)
| Asset Allocation | ||||
Mutual Funds | 86.4% | |||
Exchange Traded Funds | 9.2% | |||
Short-Term Investment | 4.6% | |||
Liabilities in excess of other assets | (0.2)% | |||
| 100.0% | ||||
| Top Industries | ||||
Alternative Investment | 60.1% | |||
Fixed Income Funds | 32.5% | |||
Equity Funds | 3.0% | |||
Other | 4.4% | |||
| 100.0% | ||||
| Top Holdings* | ||||
Gotham Neutral Fund, Institutional Class | 14.3% | |||
Eaton Vance Floating-Rate Fund, Class I | 13.4% | |||
Boston Partners Long/Short Research Fund, Institutional Class | 12.2% | |||
Aberdeen Equity Long-Short Fund, Institutional Class | 9.2% | |||
Nuveen Preferred Securities Fund, Institutional Class | 8.8% | |||
AQR Managed Futures Strategy Fund, Class I | 7.0% | |||
Arbitrage Event Driven Fund, Institutional Class | 6.3% | |||
Otter Creek Long/Short Opportunity Fund, Institutional Class | 6.0% | |||
BlackRock Global Long/Short Equity Fund, Institutional Class | 5.1% | |||
iShares TIPS Bond ETF | 4.2% | |||
Other | 13.5% | |||
| 100.0% | ||||
| * | For the purpose of listing top holdings, Short-Term Investments are included as part of Other. |
Annual Report 2016
6
Statement of Investments
October 31, 2016
Aberdeen Diversified Alternatives Fund
| Shares or Principal Amount | Value | |||||||
MUTUAL FUNDS (86.4%) | ||||||||
Alternative Investment (60.1%) | ||||||||
Aberdeen Equity Long-Short Fund, Institutional Class (a) | 595,567 | $ | 5,461,353 | |||||
AQR Managed Futures Strategy Fund, Class I | 421,921 | 4,122,170 | ||||||
Arbitrage Event Driven Fund, Institutional Class | 412,429 | 3,740,728 | ||||||
BlackRock Global Long/Short Equity Fund, Institutional Class | 283,152 | 3,038,217 | ||||||
Boston Partners Long/Short Research Fund, Institutional Class | 477,466 | 7,181,094 | ||||||
Gotham Neutral Fund, Institutional Class | 835,325 | 8,428,426 | ||||||
Otter Creek Long/Short Opportunity Fund, Institutional Class (b) | 288,968 | 3,560,090 | ||||||
| 35,532,078 | ||||||||
Fixed Income Funds (26.3%) | ||||||||
Aberdeen Asia Bond Fund, Institutional Class (a) | 234,243 | 2,398,648 | ||||||
Eaton Vance Floating-Rate Fund, Class I | 891,729 | 7,909,635 | ||||||
Nuveen Preferred Securities Fund, Institutional Class | 304,609 | 5,233,187 | ||||||
| 15,541,470 | ||||||||
Total Mutual Funds | 51,073,548 | |||||||
EXCHANGE TRADED FUNDS (9.2%) | ||||||||
Equity Fund (3.0%) | ||||||||
iShares Global Infrastructure ETF | 44,358 | 1,784,079 | ||||||
Fixed Income Funds (6.2%) | ||||||||
iShares 7-10 Year Treasury Bond ETF | 10,825 | 1,191,399 | ||||||
iShares TIPS Bond ETF | 21,210 | 2,457,391 | ||||||
| 3,648,790 | ||||||||
Total Exchange Traded Funds | 5,432,869 | |||||||
SHORT-TERM INVESTMENT (4.6%) | ||||||||
State Street Institutional U.S. Government Money Market Fund (c) | 2,722,596 | 2,722,596 | ||||||
Total Short-Term Investment | 2,722,596 | |||||||
Total Investments | 59,229,013 | |||||||
Liabilities in excess of other assets—(0.2)% | (151,462 | ) | ||||||
Net Assets—100.0% | $ | 59,077,551 | ||||||
| (a) | Investment in affiliate. Aberdeen Asset Management, Inc. is the investment adviser to the Fund and the investment adviser to the Aberdeen Equity Long-Short Fund and the Aberdeen Asia Bond Fund. |
| (b) | Non-income producing security. |
| (c) | Registered investment company advised by State Street Global Advisors. |
| (d) | See accompanying Notes to Financial Statements for tax unrealized appreciation/depreciation of securities. |
| ETF | Exchange-Traded Fund |
| TIPS | Treasury Inflation Protected Securities |
See accompanying Notes to Financial Statements.
2016 Annual Report
7
Aberdeen Diversified Income Fund (Unaudited)
The Aberdeen Diversified Income Fund (Institutional Class shares net of fees) returned 4.30% for the 12-month period ended October 31, 2016, versus the 4.37% return of its benchmark, the Bloomberg Barclays U.S. Aggregate Bond Index, for the same period. For broader comparison, the average return of the Fund’s peer category of Flexible Portfolio Funds (consisting of 231 funds), as measured by Lipper, Inc., was 2.59%.
The 12-month reporting period was characterized by weak global economic growth and heightened concerns around deflation in the developed economies. After raising its benchmark interest rate for the first time in nearly 10 years in December 2015, the U.S. Federal Reserve (Fed) had been expected to continue to increase rates over the course of 2016. However, weakening growth in economies outside of the U.S. made the Federal Open Market Committee turn cautious, and there were no further rate increases over the balance of the reporting period. Emerging markets in particular started 2016 under pressure, with China continuing to devalue the renminbi and commodity prices falling. The European Central Bank (ECB) and the Bank of Japan (BoJ), confronted with sluggish domestic growth, declining inflation expectations and strengthening currencies, responded by pushing deposit rates deeper into negative territory. However, over the second and third quarters of 2016, emerging markets began a strong recovery as China unleashed substantial fiscal stimulus via a renewed state-directed credit expansion. A recovery in Chinese growth and a rally in commodity prices, coinciding with monetary policy easing in developed markets, provided strong support for emerging-market equities and credit. The Latin American market was a particularly strong performer, as investors took a favorable view of political change in Brazil. The MSCI Emerging Markets Index gained 9.7% over the reporting period. In U.S. dollar terms, Brazil’s Bovespa Index1 climbed 72% over the twelve months. Conversely, in Europe, investor sentiment continued to deteriorate in the wake of the UK’s decision to exit the European Union (Brexit). The sterling fell heavily in the wake of the Brexit vote and European equities generally underperformed their global counterparts over the reporting period. The Europe Stoxx 6002 declined by 6.5% over the reporting period compared to gains of 4.5% and 1.2% for the U.S. broader-market S&P 500 and MSCI World indices, respectively.
Developed-market bond yields fell over the reporting period. The long end of the yield curve was supported by low inflation expectations and continued asset purchases by the ECB and the BoJ (underpinning global demand for low-risk assets with higher yields). In the U.S., however, short-term interest rates rose as investors still anticipated that the Fed would gradually raise the federal funds rate over the coming months. The low interest-rate environment hampered the banking sector over the reporting period. Further interest-rate cuts by global central banks came to be viewed as counterproductive, primarily because of the negative effects on the economy of reduced credit availability from a banking sector increasingly struggling to maintain profitability. Therefore, the policy consensus among global governments appeared to move in favor of using fiscal easing to stimulate the economy rather than additional monetary easing.
Amid a market environment of generally declining bond yields, the Fund posted a positive return for the 12-month reporting period. Fund performance benefited from the exposures to Vanguard High Dividend Yield Index Fund, Nuveen Preferred Securities Fund, Eaton Vance Floating Rate Fund, and Oppenheimer International Bond Fund. The Fund’s holdings in Aberdeen Asia Bond Fund and Aberdeen Total Return Bond Fund also performed well during the reporting period. Conversely, the position in ETRACS Alerian MLP Infrastructure ETN3 was the most significant detractor from Fund performance for the period, followed by the holding in Aberdeen International Equity Fund.
At the end of the 12-month period ended October 31, 2016, the Fund was invested in line with its alternatives orientation and lower-volatility objective, and we believe that it is consistent with our current views on the global macroeconomic outlook. We remain cautiously inclined toward risk assets in the medium term, given sluggish global growth and key geopolitical events in Europe. We are also mindful of the looming divergence in global central bank policies as the Fed contemplates more interest-rate increases. The Fund remains highly diversified4 and we believe that it has the flexibility to tilt specific allocations based on changes in relative valuations or specific macroeconomic events. We believe that this allows us to respond effectively to changing market conditions and position the Fund’s asset class exposures accordingly.
Portfolio Management
Aberdeen Alternatives and Multi-Asset Team
PAST PERFORMANCE DOES NOT GUARANTEE FUTURE RESULTS.
The performance data quoted represents past performance and current returns may be lower or higher. Class A shares have up to a 5.75% front-end sales charge and a 0.25% 12b-1 fee. The investment return and principal value will fluctuate so that an investor’s shares, when redeemed, may be worth more or less than the original cost. To obtain performance information current to the most recent month-end, which may be higher or lower than the performance shown above, please call 866-667-9231 or go to www.aberdeen-asset.us.
Investing in mutual funds involves risk, including the possible loss of principal.
Indexes are unmanaged and have been provided for comparison purposes only. No fees or expenses are reflected. You cannot invest directly in an index.
Lipper is a leading global provider of mutual fund information and analysis to fund companies, financial intermediaries and media organizations.
Annual Report 2016
8
| 1 | The Bovespa Index tracks the performance of approximately 50 stocks traded on the São Paulo Stock, Mercantile & Futures Exchange. Indexes are unmanaged and have been provided for comparison purposes only. No fees or expenses are reflected. You cannot invest directly in an index. |
| 2 | The Europe Stoxx 600 tracks the performance of 600 large-, mid- and small-capitalization companies across 17 countries within the European region: Austria, Belgium, Czech Republic, Denmark, Finland, France, Germany, Ireland, Italy, Luxembourg, the Netherlands, Norway, Portugal, Spain, Sweden, Switzerland and the UK. |
| 3 | The ETRACS Alerian MLP Infrastructure ETN tracks the Alerian MLP Infrastructure Index, a capped, float-adjusted, capitalization-weighted composite of energy infrastructure master limited partnerships (MLPs) that earn the majority of their cash flow from the transportation, storage, and processing of energy commodities. |
| 4 | Diversification does not ensure a profit or protect against a loss in a declining market. |
Aberdeen Diversified Income Fund (Unaudited) (concluded)
Risk Considerations
The Fund is subject to different levels and combinations of risk, based on its actual allocation among the various asset classes and underlying funds. The Fund will be affected by stock and bond market risks, among others.
Foreign securities may be more volatile, harder to price and less liquid than U.S. securities, and are subject to different accounting and regulatory standards, political and economic risks and, to the extent denominated in foreign currencies, currency exchange rate risk (unless otherwise hedged). These risks are enhanced in emerging market countries.
Fixed income securities are subject to certain risks including, but not limited to: interest rate (changes in interest rates may cause a decline in the market value of an investment), credit (changes in the financial condition of the issuer, borrower, counterparty, or underlying collateral), prepayment (debt issuers may repay or refinance their loans or obligations earlier than anticipated), call (some bonds allow the issuer to call a bond for redemption before it matures), and extension (principal repayments may not occur as quickly as anticipated, causing the expected maturity of a security to increase). Additionally, non-investment grade debt securities (high yield/junk bonds) may be subject to greater market fluctuations, risk of default or loss of income and principal than higher rated securities.
The Fund may allocate its assets, to a limited extent, to alternative investment strategies, which may involve riskier types of securities or investments than those offered by investment in traditional asset classes.
Please read the prospectus for more detailed information regarding these and other risks.
2016 Annual Report
9
Aberdeen Diversified Income Fund (Unaudited)
Average Annual Total Return1 (For periods ended October 31, 2016) | 1 Yr. | 5 Yr. | 10 Yr. | |||||||||||
Class A | w/o SC | 4.00% | 4.79% | 4.19% | ||||||||||
| w/SC2 | (2.02% | ) | 3.57% | 3.58% | ||||||||||
Class C | w/o SC | 3.24% | 4.03% | 3.43% | ||||||||||
| w/SC3 | 2.24% | 4.03% | 3.43% | |||||||||||
Class R4 | w/o SC | 3.65% | 4.34% | 3.80% | ||||||||||
Institutional Service Class4,5 | w/o SC | 4.28% | 5.03% | 4.31% | ||||||||||
Institutional Class4 | w/o SC | 4.30% | 5.08% | 4.45% | ||||||||||
All figures showing the effect of a sales charge (SC) reflect the maximum charge possible because it has the most significant effect on performance data. The total returns shown above do not include the impact of financial statement rounding of the net asset value (NAV) per share and/or financial statement adjustments.
| 1 | The Fund changed its investment objective and strategy effective September 24, 2012. Performance information for periods prior to September 24, 2012 does not reflect the current investment strategy. Returns also incorporate the performance of a predecessor fund (the “Predecessor Fund”) from inception to June 23, 2008. Returns of the Predecessor Fund have not been adjusted to reflect the expenses applicable to the respective classes. Prior to the change of investment objective and strategy of the Fund effective September 24, 2012, the Fund and the Predecessor Fund had substantially similar investment objectives and strategies. Please consult the Fund’s prospectus for more detail. |
| 2 | A 5.75% front-end sales charge was deducted. |
| 3 | A 1.00% contingent deferred sales charge (CDSC) was deducted from the one year return because it is charged when Class C shares are sold within the first year after purchase. |
| 4 | Not subject to any sales charges. |
| 5 | Returns before the first offering of the Institutional Service Class (September 24, 2012) are based on the performance of the Fund’s Class A shares. Excluding the effect of any fee waivers or reimbursements, this performance is substantially similar to what the Institutional Service Class shares would have produced because both classes invest in the same portfolio of securities. Returns for the Institutional Service Class shares would only differ to the extent of the differences in expenses of the two classes. |
Annual Report 2016
10
Aberdeen Diversified Income Fund (Unaudited)
Performance of a $10,000 Investment (as of October 31, 2016)
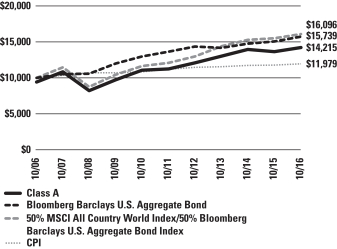
Comparative performance of $10,000 invested in Class A shares of the Aberdeen Diversified Income Fund, Bloomberg Barclays U.S. Aggregate Bond Index, a blended benchmark of 50% Morgan Stanley Capital International All Country (MSCI AC) World Index/50% Bloomberg Barclays U.S. Aggregate Bond Index, and the Consumer Price Index (CPI) over a 10-year period ended October 31, 2016. Unlike the Fund, the returns for these unmanaged indexes do not reflect any fees, expenses, or sales charges. Investors cannot invest directly in market indexes.
The Bloomberg Barclays U.S. Aggregate Bond Index is a broad-based benchmark that measures the investment grade, U.S. dollar-denominated, fixed-rate taxable bond market, including Treasuries, government-related and corporate securities, mortgage-backed securities (agency fixed-rate and hybrid adjustable-rate mortgage passthroughs), asset-backed securities, and commercial mortgage-backed securities.
The MSCI AC World Index is a free float-adjusted market capitalization-weighted index that captures the large- and mid-cap representation across 23 developed markets and 23 emerging markets. The developed markets countries are: Australia, Austria, Belgium, Canada, Denmark, Finland, France, Germany, Hong Kong, Ireland, Israel, Italy, Japan, Netherlands, New Zealand, Norway, Portugal, Singapore, Spain, Sweden, Switzerland, the U.K. and the U.S. The emerging markets countries are: Brazil, Chile, China, Colombia, Czech Republic, Egypt, Greece, Hungary, India, Indonesia, Korea, Malaysia, Mexico, Peru, Philippines, Poland, Qatar, Russia, South Africa, Taiwan, Thailand, Turkey and United Arab Emirates.
The CPI is a measure of the average change over time in the prices paid by urban consumers for a market basket of consumer goods and services.
Investment return and principal value will fluctuate, and when redeemed, shares may be worth more or less than original cost. Past performance is no guarantee of future results. The Average Annual Total Return table and Performance graph do not reflect the deduction of taxes that a shareholder would pay on fund distributions or the redemption of fund shares. Investing in mutual funds involves market risk, including loss of principal. Performance returns assume the reinvestment of all distributions. Performance returns reflect fee waivers and reimbursements in effect, without which returns would have been lower.
Portfolio Summary (as a percentage of net assets)
October 31, 2016 (Unaudited)
| Asset Allocation | ||||
Mutual Funds | 61.7% | |||
Exchange Traded Funds | 37.1% | |||
Short-Term Investment | 1.2% | |||
Liabilities in excess of other assets | –% | |||
| 100.0% | ||||
| Amounts | listed as “–” are 0% or round to 0% |
| Top Industries | ||||
Fixed Income Funds | 63.7% | |||
Equity Funds | 30.3% | |||
Real Estate Investment Trust (REIT) Funds | 4.8% | |||
Other | 1.2% | |||
| 100.0% | ||||
| Top Holdings* | ||||
Nuveen Preferred Securities Fund, Institutional Class | 15.8% | |||
Vanguard High Dividend Yield ETF | 15.2% | |||
Eaton Vance Floating-Rate Fund, Class I | 14.4% | |||
Aberdeen Global High Income Fund, Class I | 9.9% | |||
Oppenheimer International Bond Fund, Class Y | 9.3% | |||
Aberdeen Total Return Bond Fund, Class I | 6.3% | |||
Aberdeen Asia Bond Fund, Institutional Class | 6.0% | |||
iShares Cohen & Steers REIT ETF | 4.8% | |||
WisdomTree Europe Hedged Equity Fund | 4.1% | |||
iShares MSCI EAFE ETF | 4.0% | |||
Other | 10.2% | |||
| 100.0% | ||||
| * | For the purpose of listing top holdings, Short-Term Investments are included as part of Other. |
2016 Annual Report
11
Statement of Investments
October 31, 2016
Aberdeen Diversified Income Fund
| Shares or Principal Amount | Value | |||||||
MUTUAL FUNDS (61.7%) | ||||||||
Fixed Income Funds (61.7%) | ||||||||
Aberdeen Asia Bond Fund, Institutional Class (a) | 112,241 | $ | 1,149,349 | |||||
Aberdeen Global High Income Fund, Class I (a) | 229,884 | 1,903,438 | ||||||
Aberdeen Total Return Bond Fund, Class I (a) | 88,371 | 1,205,381 | ||||||
Eaton Vance Floating-Rate Fund, Class I | 310,613 | 2,755,139 | ||||||
Nuveen Preferred Securities Fund, Institutional Class | 175,787 | 3,020,014 | ||||||
Oppenheimer International Bond Fund, Class Y | 306,595 | 1,790,518 | ||||||
| 11,823,839 | ||||||||
Total Mutual Funds | 11,823,839 | |||||||
EXCHANGE TRADED FUNDS (37.1%) | ||||||||
Equity Funds (30.3%) | ||||||||
iShares Core S&P 500 ETF | 3,549 | 758,386 | ||||||
iShares Global Infrastructure ETF | 14,445 | 580,978 | ||||||
iShares MSCI EAFE ETF | 13,236 | 765,306 | ||||||
Vanguard High Dividend Yield ETF | 40,827 | 2,907,699 | ||||||
WisdomTree Europe Hedged Equity Fund | 14,435 | 784,109 | ||||||
| 5,796,478 | ||||||||
Fixed Income Fund (2.0%) | ||||||||
iShares 7-10 Year Treasury Bond ETF | 3,539 | 389,502 | ||||||
Real Estate Investment Trust (REIT) Funds (4.8%) |
| |||||||
iShares Cohen & Steers REIT ETF | 9,243 | 913,578 | ||||||
Total Exchange Traded Funds | 7,099,558 | |||||||
SHORT-TERM INVESTMENT (1.2%) | ||||||||
State Street Institutional U.S. Government Money Market Fund (b) | 241,394 | 241,394 | ||||||
Total Short-Term Investment | 241,394 | |||||||
Total Investments | 19,164,791 | |||||||
Liabilities in excess of other assets—0.0% | (6,521 | ) | ||||||
Net Assets—100.0% |
| $ | 19,158,270 | |||||
| (a) | Investment in affiliate. Aberdeen Asset Management, Inc. is the investment adviser to the Fund and the investment adviser to the Aberdeen Asia Bond Fund, Aberdeen Global High Income Fund and Aberdeen Total Return Bond Fund. |
| (b) | Registered investment company advised by State Street Global Advisors. |
| (c) | See accompanying Notes to Financial Statements for tax unrealized appreciation/depreciation of securities. |
| ETF | Exchange-Traded Fund |
| REIT | Real Estate Investment Trust |
See accompanying Notes to Financial Statements.
Annual Report 2016
12
Aberdeen Dynamic Allocation Fund (Unaudited)
The Aberdeen Dynamic Allocation Fund (Institutional Class shares net of fees) returned 1.57% for the 12-month period ended October 31, 2016, versus the 2.64% return of its benchmark, the MSCI All Country (AC) World Index, for the same period. For broader comparison, the average return of the Fund’s peer category of Flexible Portfolio Funds (consisting of 231 funds), as measured by Lipper, Inc., was 2.59%.
The 12-month reporting period was characterized by weak global economic growth and heightened concerns around deflation in the developed economies. After raising its benchmark interest rate for the first time in nearly 10 years in December 2015, the U.S. Federal Reserve (Fed) had been expected to continue to increase rates over the course of 2016. However, weakening growth in economies outside of the U.S. made the Federal Open Market Committee turn cautious, and there were no further rate increases over the balance of the reporting period. Emerging markets in particular started 2016 under pressure, with China continuing to devalue the renminbi and commodity prices falling. The European Central Bank (ECB) and the Bank of Japan (BoJ), confronted with sluggish domestic growth, declining inflation expectations and strengthening currencies, responded by pushing deposit rates deeper into negative territory. However, over the second and third quarters of 2016, emerging markets began a strong recovery as China unleashed substantial fiscal stimulus via a renewed state-directed credit expansion. A recovery in Chinese growth and a rally in commodity prices, coinciding with monetary policy easing in developed markets, provided strong support for emerging-market equities and credit. The Latin American market was a particularly strong performer, as investors took a favorable view of political change in Brazil. The MSCI Emerging Markets Index gained 9.7% over the reporting period. In U.S. dollar terms, Brazil’s Bovespa Index1 climbed 72% over the twelve months. Conversely, in Europe, investor sentiment continued to deteriorate in the wake of the UK’s decision to exit the European Union (Brexit). The sterling fell heavily in the wake of the Brexit vote and European equities generally underperformed their global counterparts over the reporting period. The STOXX Europe 600 Index2 declined by 6.5% over the reporting period compared to gains of 4.5% and 1.2% for the U.S. broader-market S&P 500 and MSCI World indices, respectively.
Developed-market bond yields fell over the reporting period. The long end of the yield curve was supported by low inflation expectations and continued asset purchases by the ECB and the BoJ (underpinning global demand for low-risk assets with higher yields). In the U.S., however, short-term interest rates rose as investors still anticipated that the Fed would gradually raise the federal funds rate over the coming months. The low interest-rate environment hampered the banking sector over the reporting period. Further interest-rate cuts by global central banks came to be viewed as counterproductive, primarily because of the negative effects on the economy of reduced credit availability from a banking sector increasingly struggling to maintain profitability. Therefore, the policy consensus among global governments appeared to move in favor of using fiscal easing to stimulate the economy rather than additional monetary easing.
Amid generally declining bond yields, the Fund’s exposure to fixed-income and relatively higher-yielding funds enhanced performance for the reporting period. The primary contributors included Nuveen Preferred Securities Fund, Eaton Vance Floating Rate Fund, and iShares Cohen & Steers REIT, a real estate investment trust. The Fund’s holdings in Aberdeen U.S. Small Cap Equity Fund, as well as two exchange-traded funds – iShares Core S&P 500 ETF and iShares MSCI EAFE ETF – also performed well during the period and bolstered performance. A significant detractor from Fund performance was the holding in Deutsche x-Trackers MSCI Japan Hedged Equity Fund, a currency-hedged equity strategy that benefits from yen-weakening, which faced significant headwinds from the yen-strengthening relative to the U.S. dollar during the reporting period. The positions in Aberdeen International Equity Fund, First Trust Health Care AlphaDEX Fund, and WisdomTree Europe Hedged Equity Fund ETF also weighed on Fund performance.
At the end of the 12-month period ended October 31, 2016, the Fund was invested consistent with our current views on the global macroeconomic outlook. We remain cautiously inclined toward risk assets in the medium term, given sluggish global growth and key geopolitical events in Europe. We are also mindful of the looming divergence in global central bank policies as the Fed contemplates more interest-rate increases. The Fund remains highly diversified3 and we believe that it has the flexibility to tilt specific allocations based on changes in relative valuations or specific macroeconomic events. We believe that this allows us to respond effectively to changing market conditions and position the Fund’s asset class exposures accordingly.
Portfolio Management
Aberdeen Alternatives and Multi-Asset Team
PAST PERFORMANCE DOES NOT GUARANTEE FUTURE RESULTS.
The performance data quoted represents past performance and current returns may be lower or higher. Class A shares have up to a 5.75% front-end sales charge and a 0.25% 12b-1 fee. The investment return and principal value will fluctuate so that an investor’s shares, when redeemed, may be worth more or less than the original cost. To obtain performance information current to the most recent month-end, which may be higher or lower than the performance shown above, please call 866-667-9231 or go to www.aberdeen-asset.us.
Investing in mutual funds involves risk, including the possible loss of principal.
Indexes are unmanaged and have been provided for comparison purposes only. No fees or expenses are reflected. You cannot invest directly in an index.
Lipper is a leading global provider of mutual fund information and analysis to fund companies, financial intermediaries and media organizations.
| 1 | The Bovespa Index tracks the performance of approximately 50 stocks traded on the São Paulo Stock, Mercantile & Futures Exchange. Indexes are unmanaged and have been provided for comparison purposes only. No fees or expenses are reflected. You cannot invest directly in an index. |
| 2 | The STOXX Europe 600 Index tracks the performance of 600 large-, mid- and small-capitalization companies across 17 countries within the European region: Austria, Belgium, Czech Republic, Denmark, Finland, France, Germany, Ireland, Italy, Luxembourg, the Netherlands, Norway, Portugal, Spain, Sweden, Switzerland and the UK. |
| 3 | Diversification does not ensure a profit or protect against a loss in a declining market. |
2016 Annual Report
13
Aberdeen Dynamic Allocation Fund (Unaudited) (concluded)
Risk Considerations
The Fund is subject to different levels and combinations of risk, based on its actual allocation among the various asset classes and underlying funds. The Fund will be affected by stock and bond market risks, among others.
Foreign securities may be more volatile, harder to price and less liquid than U.S. securities, and are subject to different accounting and regulatory standards, and political and economic risks and, to the extent denominated in foreign currencies, currency exchange rate risk (unless otherwise hedged). These risks are enhanced in emerging market countries.
Fixed income securities are subject to certain risks including, but not limited to: interest rate (changes in interest rates may cause a decline in the market value of an investment), credit (changes in the financial condition of the issuer, borrower, counterparty, or underlying collateral), prepayment (debt issuers may repay or refinance their loans or obligations earlier than anticipated), call (some bonds allow the issuer to call a bond for redemption before it matures), and extension (principal repayments may not occur as quickly as anticipated, causing the expected maturity of a security to increase).
The Fund allocates its assets, to a limited extent, to alternative investment strategies, which may involve riskier types of securities or investments than those offered by investment in traditional asset classes.
Please read the prospectus for more detailed information regarding these and other risks.
Annual Report 2016
14
Aberdeen Dynamic Allocation Fund (Unaudited)
Average Annual Total Return1 (For periods ended October 31, 2016) | 1 Yr. | 5 Yr. | 10 Yr. | |||||||||||
Class A | w/o SC | 1.30% | 5.25% | 4.19% | ||||||||||
| w/SC2 | (4.49% | ) | 4.02% | 3.58% | ||||||||||
Class C | w/o SC | 0.58% | 4.49% | 3.43% | ||||||||||
| w/SC3 | (0.41% | ) | 4.49% | 3.43% | ||||||||||
Class R4 | w/o SC | 0.84% | 4.86% | 3.80% | ||||||||||
Institutional Service Class4,5 | w/o SC | 1.58% | 5.49% | 4.31% | ||||||||||
Institutional Class4 | w/o SC | 1.57% | 5.55% | 4.45% | ||||||||||
All figures showing the effect of a sales charge (SC) reflect the maximum charge possible because it has the most significant effect on performance data. The total returns shown above do not include the impact of financial statement rounding of the net asset value (NAV) per share and/or financial statement adjustments.
| 1 | The Fund changed its investment objective and strategy effective September 24, 2012. Performance information for periods prior to September 24, 2012 does not reflect the current investment strategy. Returns also incorporate the performance of a predecessor fund (the “Predecessor Fund”) from inception to June 23, 2008. Returns of the Predecessor Fund have not been adjusted to reflect the expenses applicable to the respective classes. Prior to the change of investment objective and strategy of the Fund effective September 24, 2012, the Fund and the Predecessor Fund had substantially similar investment objectives and strategies. Please consult the Fund’s prospectus for more detail. |
| 2 | A 5.75% front-end sales charge was deducted. |
| 3 | A 1.00% contingent deferred sales charge (CDSC) was deducted from the one year return because it is charged when Class C shares are sold within the first year after purchase. |
| 4 | Not subject to any sales charges. |
| 5 | Returns before the first offering of the Institutional Service Class (September 24, 2012) are based on the performance of the Fund’s Class A shares. Excluding the effect of any fee waivers or reimbursements, this performance is substantially similar to what the Institutional Service Class shares would have produced because both classes invest in the same portfolio of securities. Returns for the Institutional Service Class shares would only differ to the extent of the differences in expenses of the two classes. |
2016 Annual Report
15
Aberdeen Dynamic Allocation Fund (Unaudited)
Performance of a $10,000 Investment (as of October 31, 2016)
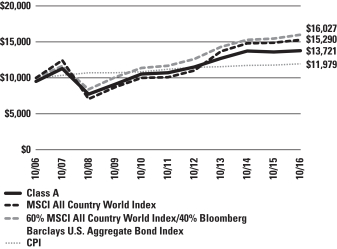
Comparative performance of $10,000 invested in Class A shares of the Aberdeen Dynamic Allocation Fund, the Morgan Stanley Capital International All Country (MSCI AC) World Index, a blended benchmark of 60% MSCI AC World Index/40% Bloomberg Barclays U.S. Aggregate Bond Index, and the Consumer Price Index (CPI) over a 10-year period ended October 31, 2016. Unlike the Fund, the returns for these unmanaged indexes do not reflect any fees, expenses, or sales charges. Investors cannot invest directly in market indexes.
The MSCI AC World Index is a free float-adjusted market capitalization-weighted index that captures the large- and mid-cap representation across 23 developed markets and 23 emerging markets. The developed markets countries are: Australia, Austria, Belgium, Canada, Denmark, Finland, France, Germany, Hong Kong, Ireland, Israel, Italy, Japan, Netherlands, New Zealand, Norway, Portugal, Singapore, Spain, Sweden, Switzerland, the U.K. and the U.S. The emerging markets countries are: Brazil, Chile, China, Colombia, Czech Republic, Egypt, Greece, Hungary, India, Indonesia, Korea, Malaysia, Mexico, Peru, Philippines, Poland, Qatar, Russia, South Africa, Taiwan, Thailand, Turkey and United Arab Emirates.
The Bloomberg Barclays U.S. Aggregate Bond Index is a broad-based benchmark that measures the investment grade, U.S. dollar-denominated, fixed rate taxable bond market, including Treasuries, government-related and corporate securities, mortgage-backed securities (agency fixed-rate and hybrid adjustable-rate mortgage passthroughs), asset-backed securities, and commercial mortgage-backed securities.
The CPI is a measure of the average change over time in the prices paid by urban consumers for a market basket of consumer goods and services.
Investment return and principal value will fluctuate, and when redeemed, shares may be worth more or less than original cost. Past performance is no guarantee of future results. The Average Annual Total Return table and Performance graph do not reflect the deduction of taxes that a shareholder would pay on fund distributions or the redemption of fund shares. Investing in mutual funds involves market risk, including loss of principal. Performance returns assume the reinvestment of all distributions. Performance returns reflect fee waivers and reimbursements in effect, without which returns would have been lower.
Portfolio Summary (as a percentage of net assets)
October 31, 2016 (Unaudited)
| Asset Allocation | ||||
Mutual Funds | 56.1% | |||
Exchange Traded Funds | 40.1% | |||
Short-Term Investment | 3.9% | |||
Liabilities in excess of other assets | (0.1)% | |||
| 100.0% | ||||
| Top Industries | ||||
Fixed Income Funds | 49.4% | |||
Equity Funds | 36.1% | |||
Alternative Investment | 5.9% | |||
Real Estate Investment Trust (REIT) Funds | 4.8% | |||
Other | 3.8% | |||
| 100.0% | ||||
| Top Holdings* | ||||
Nuveen Preferred Securities Fund, Institutional Class | 11.4% | |||
Aberdeen Total Return Bond Fund, Class I | 8.4% | |||
Eaton Vance Floating-Rate Fund, Class I | 8.2% | |||
Aberdeen U.S. Small Cap Equity Fund, Institutional Class | 7.0% | |||
iShares Russell Midcap ETF | 7.0% | |||
AQR Managed Futures Strategy Fund, Class I | 5.9% | |||
iShares Core S&P 500 ETF | 5.6% | |||
iShares TIPS Bond ETF | 5.3% | |||
Aberdeen Asia Bond Fund, Institutional Class | 5.0% | |||
iShares Cohen & Steers REIT ETF | 4.8% | |||
Other | 31.4% | |||
| 100.0% | ||||
| * | For the purpose of listing top holdings, Short-Term Investments are included as part of Other. |
Annual Report 2016
16
Statement of Investments
October 31, 2016
Aberdeen Dynamic Allocation Fund
| Shares or Principal Amount | Value | |||||||
MUTUAL FUNDS (56.1%) | ||||||||
Alternative Investment (5.9%) | ||||||||
AQR Managed Futures Strategy Fund, Class I | 113,622 | $ | 1,110,082 | |||||
Equity Funds (10.1%) | ||||||||
Aberdeen Emerging Markets Fund, Institutional Class (a) | 42,988 | 583,774 | ||||||
Aberdeen U.S. Small Cap Equity Fund, Institutional Class (a)(b) | 44,288 | 1,335,292 | ||||||
| 1,919,066 | ||||||||
Fixed Income Funds (40.1%) | ||||||||
Aberdeen Asia Bond Fund, Institutional Class (a) | 93,070 | 953,037 | ||||||
Aberdeen Global High Income Fund, Class I (a) | 90,778 | 751,638 | ||||||
Aberdeen Total Return Bond Fund, Class I (a) | 115,750 | 1,578,835 | ||||||
Eaton Vance Floating-Rate Fund, Class I | 175,450 | 1,556,240 | ||||||
Nuveen Preferred Securities Fund, Institutional Class | 125,842 | 2,161,972 | ||||||
Oppenheimer International Bond Fund, Class Y | 99,917 | 583,516 | ||||||
| 7,585,238 | ||||||||
Total Mutual Funds | 10,614,386 | |||||||
EXCHANGE TRADED FUNDS (40.1%) | ||||||||
Equity Funds (26.0%) | ||||||||
Deutsche X-trackers MSCI Japan Hedged Equity ETF | 11,863 | 406,545 | ||||||
iShares Core S&P 500 ETF | 4,940 | 1,055,629 | ||||||
iShares Global Infrastructure ETF | 9,766 | 392,788 | ||||||
iShares MSCI EAFE ETF | 13,148 | 760,217 | ||||||
iShares Russell Midcap ETF | 7,866 | 1,327,702 | ||||||
Vanguard High Dividend Yield ETF | 5,413 | 385,514 | ||||||
WisdomTree Europe Hedged Equity Fund | 10,818 | 587,634 | ||||||
| 4,916,029 | ||||||||
Fixed Income Funds (9.3%) | ||||||||
iShares 7-10 Year Treasury Bond ETF | 6,982 | 768,439 | ||||||
iShares TIPS Bond ETF | 8,599 | 996,280 | ||||||
| 1,764,719 | ||||||||
Real Estate Investment Trust (REIT) Funds (4.8%) |
| |||||||
iShares Cohen & Steers REIT ETF | 9,066 | 896,084 | ||||||
Total Exchange Traded Funds | 7,576,832 | |||||||
SHORT-TERM INVESTMENT (3.9%) | ||||||||
State Street Institutional U.S. Government Money Market Fund (c) | 732,820 | 732,820 | ||||||
Total Short-Term Investment | 732,820 | |||||||
Total Investments | 18,924,038 | |||||||
Liabilities in excess of other assets—(0.1)% | (19,873 | ) | ||||||
Net Assets—100.0% |
| $ | 18,904,165 | |||||
| (a) | Investment in affiliate. Aberdeen Asset Management, Inc. is the investment adviser to the Fund and the investment adviser to the Aberdeen Emerging Markets Fund, Aberdeen U.S. Small Cap Equity Fund, Aberdeen Asia Bond Fund, Aberdeen Global High Income Fund and Aberdeen Total Return Bond Fund. |
| (b) | Non-income producing security. |
| (c) | Registered investment company advised by State Street Global Advisors. |
| (d) | See accompanying Notes to Financial Statements for tax unrealized appreciation/depreciation of securities. |
| ETF | Exchange-Traded Fund |
| REIT | Real Estate Investment Trust |
| TIPS | Treasury Inflation Protected Securities |
See accompanying Notes to Financial Statements.
2016 Annual Report
17
Statements of Assets and Liabilities
October 31, 2016
| Aberdeen Diversified Alternatives Fund | Aberdeen Diversified Income Fund | Aberdeen Dynamic Allocation Fund | ||||||||||
Assets: | ||||||||||||
Investments, at value | $ | 48,646,416 | $ | 14,665,229 | $ | 12,988,642 | ||||||
Investments in affiliates, at value | 7,860,001 | 4,258,168 | 5,202,576 | |||||||||
Short-term investments, at value | 2,722,596 | 241,394 | 732,820 | |||||||||
|
|
|
|
|
| |||||||
Total investments | 59,229,013 | 19,164,791 | 18,924,038 | |||||||||
|
|
|
|
|
| |||||||
Interest and dividends receivable | 47,335 | 30,361 | 16,682 | |||||||||
Receivable from Adviser | 10,084 | 15,428 | 15,564 | |||||||||
Receivable for capital shares issued | 17,735 | – | 216 | |||||||||
Other receivables | 1,551 | 1,605 | 1,634 | |||||||||
Prepaid expenses | 43,751 | 40,186 | 41,515 | |||||||||
|
|
|
|
|
| |||||||
Total assets | 59,349,469 | 19,252,371 | 18,999,649 | |||||||||
|
|
|
|
|
| |||||||
Liabilities: | ||||||||||||
Payable for investments purchased | 51,871 | 31,466 | 18,017 | |||||||||
Payable for capital shares redeemed | 152,080 | 24,668 | 39,515 | |||||||||
Accrued expenses and other payables: | ||||||||||||
Audit fees | 14,748 | 14,748 | 14,748 | |||||||||
Distribution fees | 13,391 | 11,914 | 10,019 | |||||||||
Printing fees | 10,573 | 1,499 | 2,541 | |||||||||
Investment advisory fees | 7,574 | 2,468 | 2,438 | |||||||||
Transfer agent fees | 5,799 | 2,737 | 3,306 | |||||||||
Sub-transfer agent and administrative services fees | 7,563 | 2,004 | 2,261 | |||||||||
Administration fees | 4,039 | 1,316 | 1,300 | |||||||||
Custodian fees | 1,133 | 479 | 518 | |||||||||
Fund accounting fees | 1,152 | 342 | 353 | |||||||||
Legal fees | 160 | 52 | 51 | |||||||||
Other | 1,835 | 408 | 417 | |||||||||
|
|
|
|
|
| |||||||
Total liabilities | 271,918 | 94,101 | 95,484 | |||||||||
|
|
|
|
|
| |||||||
Net Assets | $ | 59,077,551 | $ | 19,158,270 | $ | 18,904,165 | ||||||
|
|
|
|
|
| |||||||
Cost: | ||||||||||||
Investments | $ | 48,973,799 | $ | 14,567,046 | $ | 12,857,612 | ||||||
Investments in affiliates | 8,233,363 | 4,430,569 | 5,067,147 | |||||||||
Short-term investments | 2,722,596 | 241,394 | 732,820 | |||||||||
Represented by: | ||||||||||||
Capital | $ | 85,140,721 | $ | 19,698,749 | $ | 19,702,458 | ||||||
Accumulated net investment income/(loss) | 40,312 | 64,673 | 47,602 | |||||||||
Accumulated net realized (loss) from investments | (25,402,737 | ) | (530,934 | ) | (1,112,354 | ) | ||||||
Net unrealized appreciation/(depreciation) on investments | (700,745 | ) | (74,218 | ) | 266,459 | |||||||
|
|
|
|
|
| |||||||
Net Assets | $ | 59,077,551 | $ | 19,158,270 | $ | 18,904,165 | ||||||
|
|
|
|
|
| |||||||
Net Assets: | ||||||||||||
Class A Shares | $ | 16,106,102 | $ | 5,390,180 | $ | 7,640,717 | ||||||
Class C Shares | 10,663,690 | 12,293,265 | 9,469,792 | |||||||||
Class R Shares | 1,857,623 | 312,863 | 508,014 | |||||||||
Institutional Service Class Shares | 19,009 | 32,946 | 10,223 | |||||||||
Institutional Class Shares | 30,431,127 | 1,129,016 | 1,275,419 | |||||||||
|
|
|
|
|
| |||||||
Total | $ | 59,077,551 | $ | 19,158,270 | $ | 18,904,165 | ||||||
|
|
|
|
|
| |||||||
Amounts listed as “–” are $0 or round to $0.
See accompanying Notes to Financial Statements.
Annual Report 2016
18
Statements of Assets and Liabilities (concluded)
October 31, 2016
| Aberdeen Diversified Alternatives Fund | Aberdeen Diversified Income Fund | Aberdeen Dynamic Allocation Fund | ||||||||||
Shares Outstanding (unlimited number of shares authorized): | ||||||||||||
Class A Shares | 1,282,423 | 458,506 | 598,976 | |||||||||
Class C Shares | 885,166 | 1,070,007 | 758,257 | |||||||||
Class R Shares | 149,326 | 26,898 | 40,070 | |||||||||
Institutional Service Class Shares | 1,499 | 2,807 | 805 | |||||||||
Institutional Class Shares | 2,399,401 | 96,109 | 100,253 | |||||||||
|
|
|
|
|
| |||||||
Total | 4,717,815 | 1,654,327 | 1,498,361 | |||||||||
|
|
|
|
|
| |||||||
Net asset value and redemption price per share (Net assets by class divided by shares outstanding by class, respectively): | ||||||||||||
Class A Shares | $ | 12.56 | $ | 11.76 | $ | 12.76 | ||||||
Class C Shares (a) | $ | 12.05 | $ | 11.49 | $ | 12.49 | ||||||
Class R Shares | $ | 12.44 | $ | 11.63 | $ | 12.68 | ||||||
Institutional Service Class Shares | $ | 12.68 | $ | 11.74 | $ | 12.70 | ||||||
Institutional Class Shares | $ | 12.68 | $ | 11.75 | $ | 12.72 | ||||||
Maximum offering price per share (100%/(100%-maximum sales charge) of net asset value adjusted to the nearest cent): | ||||||||||||
Class A Shares | $ | 13.33 | $ | 12.48 | $ | 13.54 | ||||||
Maximum Sales Charge: | ||||||||||||
Class A Shares | 5.75 | % | 5.75 | % | 5.75 | % | ||||||
| (a) | For Class C Shares, the redemption price per share is reduced by 1.00% for shares held less than one year. |
See accompanying Notes to Financial Statements.
2016 Annual Report
19
Statements of Operations
For the Year Ended October 31, 2016
| Aberdeen Diversified Alternatives Fund | Aberdeen Diversified Income Fund | Aberdeen Dynamic Allocation Fund | ||||||||||
INVESTMENT INCOME: | ||||||||||||
Dividend income | $ | 1,545,436 | $ | 611,718 | $ | 447,035 | ||||||
Dividend income from affiliates | 41,720 | 117,959 | 72,735 | |||||||||
Interest income | 2,907 | 204 | 757 | |||||||||
Other income | 1,551 | 1,605 | 1,635 | |||||||||
|
|
|
|
|
| |||||||
| 1,591,614 | 731,486 | 522,162 | ||||||||||
|
|
|
|
|
| |||||||
EXPENSES: | ||||||||||||
Investment advisory fees | 137,083 | 30,676 | 31,475 | |||||||||
Administration fees | 73,111 | 16,360 | 16,787 | |||||||||
Distribution fees Class A | 55,174 | 14,274 | 20,324 | |||||||||
Distribution fees Class C | 127,877 | 131,811 | 105,822 | |||||||||
Distribution fees Class R | 8,620 | 1,960 | 2,473 | |||||||||
Sub-transfer agent and administrative service fees Class A | 25,568 | 3,287 | 5,164 | |||||||||
Sub-transfer agent and administrative service fees Institutional Class | 23,309 | 475 | 1,676 | |||||||||
Sub-transfer agent and administrative service fees Class C | 11,002 | 7,167 | 7,255 | |||||||||
Sub-transfer agent and administrative service fees Class R | 2,984 | 399 | 899 | |||||||||
Sub-transfer agent and administrative service fees Institutional Service Class | 12 | – | – | |||||||||
Fund accounting fees | 9,586 | 2,103 | 2,171 | |||||||||
Transfer agent fees | 83,313 | 24,536 | 30,428 | |||||||||
Trustee fees | 5,432 | 1,387 | 1,431 | |||||||||
Legal fees | 5,195 | 1,274 | 1,324 | |||||||||
Printing fees | 43,068 | 15,713 | 17,556 | |||||||||
Custodian fees | 7,660 | 3,077 | 3,362 | |||||||||
Registration and filing fees | 66,775 | 61,073 | 60,894 | |||||||||
Audit fees | 24,064 | 24,064 | 24,064 | |||||||||
Other | 11,590 | 5,250 | 5,290 | |||||||||
|
|
|
|
|
| |||||||
Total expenses before reimbursed/waived expenses | 721,423 | 344,886 | 338,395 | |||||||||
Interest expense (Note 10) | 558 | – | – | |||||||||
|
|
|
|
|
| |||||||
Total operating expenses before reimbursed/waived expenses | 721,981 | 344,886 | 338,395 | |||||||||
Expenses reimbursed/waived by investment advisor | (272,716 | ) | (142,028 | ) | (151,253 | ) | ||||||
|
|
|
|
|
| |||||||
Net expenses | 449,265 | 202,858 | 187,142 | |||||||||
|
|
|
|
|
| |||||||
Net Investment Income | 1,142,349 | 528,628 | 335,020 | |||||||||
|
|
|
|
|
| |||||||
REALIZED/UNREALIZED GAIN/(LOSS) FROM INVESTMENTS: | ||||||||||||
Realized gain distributions from underlying affiliated funds | 1,989,648 | – | 10,210 | |||||||||
Realized gain distributions from underlying non-affiliated funds | 1,499,563 | 84,055 | 175,019 | |||||||||
Realized loss from investment transactions from affiliated funds | (2,725,485 | ) | (299,755 | ) | (475,085 | ) | ||||||
Realized loss from investment transactions from non-affiliated funds | (5,484,946 | ) | (324,643 | ) | (76,057 | ) | ||||||
|
|
|
|
|
| |||||||
Net realized loss from investments | (4,721,220 | ) | (540,343 | ) | (365,913 | ) | ||||||
|
|
|
|
|
| |||||||
Net change in unrealized appreciation/(depreciation) on affiliated funds | 321,798 | 231,518 | 512,349 | |||||||||
Net change in unrealized appreciation/(depreciation) on non-affiliated funds | 806,581 | 423,108 | (350,790 | ) | ||||||||
|
|
|
|
|
| |||||||
Net change in unrealized appreciation/(depreciation) on investments | 1,128,379 | 654,626 | 161,559 | |||||||||
|
|
|
|
|
| |||||||
Net realized/unrealized gain/(loss) from investments | (3,592,841 | ) | 114,283 | (204,354 | ) | |||||||
|
|
|
|
|
| |||||||
CHANGE IN NET ASSETS RESULTING FROM OPERATIONS | $ | (2,450,492 | ) | $ | 642,911 | $ | 130,666 | |||||
|
|
|
|
|
| |||||||
Amounts listed as “–” are $0 or round to $0.
See accompanying Notes to Financial Statements.
Annual Report 2016
20
Statements of Changes in Net Assets
| Aberdeen Diversified Alternatives Fund | Aberdeen Diversified Income Fund | Aberdeen Dynamic Allocation Fund | ||||||||||||||||||||||
| Year Ended October 31, 2016 | Year Ended October 31, 2015 | Year Ended October 31, 2016 | Year Ended October 31, 2015 | Year Ended October 31, 2016 | Year Ended October 31, 2015 | |||||||||||||||||||
FROM INVESTMENT ACTIVITIES: | ||||||||||||||||||||||||
Operations: | ||||||||||||||||||||||||
Net investment income | $ | 1,142,349 | $ | 2,113,150 | $ | 528,628 | $ | 642,973 | $ | 335,020 | $ | 516,748 | ||||||||||||
Net realized gain/(loss) from investments | (4,721,220 | ) | (926,020 | ) | (540,343 | ) | 211,411 | (365,913 | ) | 1,350,301 | ||||||||||||||
Net change in unrealized appreciation/(depreciation) on investments | 1,128,379 | (4,579,696 | ) | 654,626 | (1,513,578 | ) | 161,559 | (2,131,227 | ) | |||||||||||||||
|
|
|
|
|
|
|
|
|
|
|
| |||||||||||||
Changes in net assets resulting from operations | (2,450,492 | ) | (3,392,566 | ) | 642,911 | (659,194 | ) | 130,666 | (264,178 | ) | ||||||||||||||
|
|
|
|
|
|
|
|
|
|
|
| |||||||||||||
Distributions to Shareholders From: | ||||||||||||||||||||||||
Net investment income: | ||||||||||||||||||||||||
Class A | (287,575 | ) | (551,092 | ) | (164,376 | ) | (207,023 | ) | (166,526 | ) | (233,946 | ) | ||||||||||||
Class C | (114,337 | ) | (345,029 | ) | (288,554 | ) | (372,688 | ) | (151,820 | ) | (252,553 | ) | ||||||||||||
Class R | (17,432 | ) | (9,146 | ) | (10,003 | ) | (11,199 | ) | (7,968 | ) | (10,233 | ) | ||||||||||||
Institutional Service Class | (280 | ) | (309 | ) | (1,018 | ) | (944 | ) | (239 | ) | (420 | ) | ||||||||||||
Institutional Class | (1,037,869 | ) | (1,946,934 | ) | (35,748 | ) | (59,239 | ) | (42,445 | ) | (48,674 | ) | ||||||||||||
Net realized gains: | ||||||||||||||||||||||||
Class A | – | – | (49,208 | ) | (351,054 | ) | (4,466 | ) | – | |||||||||||||||
Class C | – | – | (112,812 | ) | (711,126 | ) | (6,061 | ) | – | |||||||||||||||
Class R | – | – | (3,342 | ) | (19,693 | ) | (247 | ) | – | |||||||||||||||
Institutional Service Class | – | – | (249 | ) | (550 | ) | (6 | ) | – | |||||||||||||||
Institutional Class | – | – | (9,596 | ) | (102,209 | ) | (1,217 | ) | – | |||||||||||||||
|
|
|
|
|
|
|
|
|
|
|
| |||||||||||||
Change in net assets from shareholder distributions | (1,457,493 | ) | (2,852,510 | ) | (674,906 | ) | (1,835,725 | ) | (380,995 | ) | (545,826 | ) | ||||||||||||
|
|
|
|
|
|
|
|
|
|
|
| |||||||||||||
Common Stock Transactions: | ||||||||||||||||||||||||
Change in net assets from capital transactions | (86,643,398 | ) | 52,268,213 | (3,263,715 | ) | (257,827 | ) | (3,395,198 | ) | (1,057,167 | ) | |||||||||||||
|
|
|
|
|
|
|
|
|
|
|
| |||||||||||||
Change in net assets | (90,551,383 | ) | 46,023,137 | (3,295,710 | ) | (2,752,746 | ) | (3,645,527 | ) | (1,867,171 | ) | |||||||||||||
|
|
|
|
|
|
|
|
|
|
|
| |||||||||||||
Net Assets: | ||||||||||||||||||||||||
Beginning of year | 149,628,934 | 103,605,797 | 22,453,980 | 25,206,726 | 22,549,692 | 24,416,863 | ||||||||||||||||||
|
|
|
|
|
|
|
|
|
|
|
| |||||||||||||
End of year | $ | 59,077,551 | $ | 149,628,934 | $ | 19,158,270 | $ | 22,453,980 | $ | 18,904,165 | $ | 22,549,692 | ||||||||||||
|
|
|
|
|
|
|
|
|
|
|
| |||||||||||||
Accumulated net investment income/(loss) at end of year | $ | 40,312 | $ | 158,222 | $ | 64,673 | $ | 51,775 | $ | 47,602 | $ | 42,000 | ||||||||||||
|
|
|
|
|
|
|
|
|
|
|
| |||||||||||||
Amounts listed as “–” are $0 or round to $0.
See accompanying Notes to Financial Statements.
2016 Annual Report
21
Statements of Changes in Net Assets (continued)
| Aberdeen Diversified Alternatives Fund | Aberdeen Diversified Income Fund | Aberdeen Dynamic Allocation Fund | ||||||||||||||||||||||
| Year Ended October 31, 2016 | Year Ended October 31, 2015 | Year Ended October 31, 2016 | Year Ended October 31, 2015 | Year Ended October 31, 2016 | Year Ended October 31, 2015 | |||||||||||||||||||
CAPITAL TRANSACTIONS: | ||||||||||||||||||||||||
Class A Shares | ||||||||||||||||||||||||
Proceeds from shares issued | $ | 10,166,808 | $ | 26,509,629 | $ | 669,224 | $ | 807,811 | $ | 532,382 | $ | 819,802 | ||||||||||||
Dividends reinvested | 258,875 | 477,065 | 161,355 | 405,007 | 131,001 | 170,961 | ||||||||||||||||||
Cost of shares redeemed | (20,964,553 | ) | (19,956,837 | ) | (1,717,964 | ) | (1,755,141 | ) | (1,605,693 | ) | (1,527,901 | ) | ||||||||||||
|
|
|
|
|
|
|
|
|
|
|
| |||||||||||||
Total Class A | (10,538,870 | ) | 7,029,857 | (887,385 | ) | (542,323 | ) | (942,310 | ) | (537,138 | ) | |||||||||||||
|
|
|
|
|
|
|
|
|
|
|
| |||||||||||||
Class C Shares | ||||||||||||||||||||||||
Proceeds from shares issued | 625,277 | 5,654,893 | 538,381 | 3,584,256 | 298,508 | 792,192 | ||||||||||||||||||
Dividends reinvested | 67,563 | 172,265 | 270,661 | 652,281 | 97,862 | 150,724 | ||||||||||||||||||
Cost of shares redeemed | (6,415,616 | ) | (3,846,485 | ) | (2,898,023 | ) | (3,204,459 | ) | (2,487,871 | ) | (1,763,800 | ) | ||||||||||||
|
|
|
|
|
|
|
|
|
|
|
| |||||||||||||
Total Class C | (5,722,776 | ) | 1,980,673 | (2,088,981 | ) | 1,032,078 | (2,091,501 | ) | (820,884 | ) | ||||||||||||||
|
|
|
|
|
|
|
|
|
|
|
| |||||||||||||
Class R Shares | ||||||||||||||||||||||||
Proceeds from shares issued | 1,062,944 | 1,453,268 | 47,890 | 305,861 | 102,113 | 84,055 | ||||||||||||||||||
Dividends reinvested | 12,891 | 3,837 | 34 | 15,600 | 6,602 | 8,513 | ||||||||||||||||||
Cost of shares redeemed | (528,285 | ) | (428,413 | ) | (155,883 | ) | (277,395 | ) | (100,541 | ) | (30,042 | ) | ||||||||||||
|
|
|
|
|
|
|
|
|
|
|
| |||||||||||||
Total Class R | 547,550 | 1,028,692 | (107,959 | ) | 44,066 | 8,174 | 62,526 | |||||||||||||||||
|
|
|
|
|
|
|
|
|
|
|
| |||||||||||||
Institutional Service Class Shares | ||||||||||||||||||||||||
Proceeds from shares issued | – | 19,369 | – | 32,059 | – | 10,493 | ||||||||||||||||||
Dividends reinvested | 280 | 309 | 1,267 | 1,494 | 245 | 420 | ||||||||||||||||||
Cost of shares redeemed | – | (11,501 | ) | – | (11,126 | ) | – | (11,644 | ) | |||||||||||||||
|
|
|
|
|
|
|
|
|
|
|
| |||||||||||||
Total Institutional Service Class | 280 | 8,177 | 1,267 | 22,427 | 245 | (731 | ) | |||||||||||||||||
|
|
|
|
|
|
|
|
|
|
|
| |||||||||||||
Institutional Class Shares | ||||||||||||||||||||||||
Proceeds from shares issued | 10,414,345 | 82,724,806 | 154,738 | 304,986 | 941,551 | 831,443 | ||||||||||||||||||
Dividends reinvested | 914,983 | 1,756,493 | 37,357 | 138,379 | 24,499 | 30,997 | ||||||||||||||||||
Cost of shares redeemed | (82,258,910 | ) | (42,260,485 | ) | (372,752 | ) | (1,257,440 | ) | (1,335,856 | ) | (623,380 | ) | ||||||||||||
|
|
|
|
|
|
|
|
|
|
|
| |||||||||||||
Total Institutional Class | (70,929,582 | ) | 42,220,814 | (180,657 | ) | (814,075 | ) | (369,806 | ) | 239,060 | ||||||||||||||
|
|
|
|
|
|
|
|
|
|
|
| |||||||||||||
Change in net assets from capital transactions: | $ | (86,643,398 | ) | $ | 52,268,213 | $ | (3,263,715 | ) | $ | (257,827 | ) | $ | (3,395,198 | ) | $ | (1,057,167 | ) | |||||||
|
|
|
|
|
|
|
|
|
|
|
| |||||||||||||
Amounts listed as “–” are $0 or round to $0.
See accompanying Notes to Financial Statements.
Annual Report 2016
22
Statements of Changes in Net Assets (concluded)
| Aberdeen Diversified Alternatives Fund | Aberdeen Diversified Income Fund | Aberdeen Dynamic Allocation Fund | ||||||||||||||||||||||
| Year Ended October 31, 2016 | Year Ended October 31, 2015 | Year Ended October 31, 2016 | Year Ended October 31, 2015 | Year Ended October 31, 2016 | Year Ended October 31, 2015 | |||||||||||||||||||
SHARE TRANSACTIONS: | ||||||||||||||||||||||||
Class A Shares | ||||||||||||||||||||||||
Issued | 811,324 | 2,001,090 | 57,547 | 66,395 | 42,528 | 61,066 | ||||||||||||||||||
Reinvested | 20,553 | 36,261 | 14,081 | 33,481 | 10,317 | 12,913 | ||||||||||||||||||
Redeemed | (1,674,760 | ) | (1,534,103 | ) | (149,232 | ) | (144,205 | ) | (128,320 | ) | (114,313 | ) | ||||||||||||
|
|
|
|
|
|
|
|
|
|
|
| |||||||||||||
Total Class A Shares | (842,883 | ) | 503,248 | (77,604 | ) | (44,329 | ) | (75,475 | ) | (40,334 | ) | |||||||||||||
|
|
|
|
|
|
|
|
|
|
|
| |||||||||||||
Class C Shares | ||||||||||||||||||||||||
Issued | 51,813 | 442,785 | 47,760 | 298,388 | 24,214 | 59,807 | ||||||||||||||||||
Reinvested | 5,572 | 13,532 | 24,183 | 55,138 | 7,858 | 11,605 | ||||||||||||||||||
Redeemed | (529,963 | ) | (305,861 | ) | (256,867 | ) | (268,053 | ) | (201,023 | ) | (135,259 | ) | ||||||||||||
|
|
|
|
|
|
|
|
|
|
|
| |||||||||||||
Total Class C Shares | (472,578 | ) | 150,456 | (184,924 | ) | 85,473 | (168,951 | ) | (63,847 | ) | ||||||||||||||
|
|
|
|
|
|
|
|
|
|
|
| |||||||||||||
Class R Shares | ||||||||||||||||||||||||
Issued | 85,462 | 111,742 | 4,272 | 26,479 | 8,321 | 6,488 | ||||||||||||||||||
Reinvested | 1,032 | 295 | 2 | 1,292 | 523 | 647 | ||||||||||||||||||
Redeemed | (42,629 | ) | (32,884 | ) | (13,623 | ) | (23,164 | ) | (7,983 | ) | (2,223 | ) | ||||||||||||
|
|
|
|
|
|
|
|
|
|
|
| |||||||||||||
Total Class R Shares | 43,865 | 79,153 | (9,349 | ) | 4,607 | 861 | 4,912 | |||||||||||||||||
|
|
|
|
|
|
|
|
|
|
|
| |||||||||||||
Institutional Service Class Shares | ||||||||||||||||||||||||
Issued | – | 1,472 | – | 2,639 | – | 772 | ||||||||||||||||||
Reinvested | 23 | 23 | 110 | 125 | 19 | 32 | ||||||||||||||||||
Redeemed | – | (888 | ) | – | (958 | ) | – | (915 | ) | |||||||||||||||
|
|
|
|
|
|
|
|
|
|
|
| |||||||||||||
Total Institutional Service Class Shares | 23 | 607 | 110 | 1,806 | 19 | (111 | ) | |||||||||||||||||
|
|
|
|
|
|
|
|
|
|
|
| |||||||||||||
Institutional Class Shares | ||||||||||||||||||||||||
Issued | 824,872 | 6,240,242 | 13,360 | 24,311 | 74,306 | 62,755 | ||||||||||||||||||
Reinvested | 72,024 | 133,210 | 3,263 | 11,443 | 1,942 | 2,348 | ||||||||||||||||||
Redeemed | (6,563,532 | ) | (3,226,701 | ) | (32,647 | ) | (103,936 | ) | (106,695 | ) | (48,140 | ) | ||||||||||||
|
|
|
|
|
|
|
|
|
|
|
| |||||||||||||
Total Institutional Class Shares | (5,666,636 | ) | 3,146,751 | (16,024 | ) | (68,182 | ) | (30,447 | ) | 16,963 | ||||||||||||||
|
|
|
|
|
|
|
|
|
|
|
| |||||||||||||
Total change in shares: | (6,938,209 | ) | 3,880,215 | (287,791 | ) | (20,625 | ) | (273,993 | ) | (82,417 | ) | |||||||||||||
|
|
|
|
|
|
|
|
|
|
|
| |||||||||||||
Amounts listed as “–” are $0 or round to $0.
See accompanying Notes to Financial Statements.
2016 Annual Report
23
Financial Highlights
Selected Data for Each Share of Capital Outstanding Throughout the Periods Indicated
Aberdeen Diversified Alternatives Fund
| Investment Activities | Distributions | |||||||||||||||||||||||||||
| Net Asset Value, Beginning of Period | Net Investment Income (Loss) (a) | Net | Total from Investment Activities | Net Invest- ment Income | Total Distri- butions | Net Asset Value, End of Period | ||||||||||||||||||||||
Class A Shares | ||||||||||||||||||||||||||||
Year Ended October 31, 2016 | $ | 12.82 | $ | 0.13 | $ | (0.24 | ) | $ | (0.11 | ) | $ | (0.15 | ) | $ | (0.15 | ) | $ | 12.56 | ||||||||||
Year Ended October 31, 2015 | 13.32 | 0.17 | (0.39 | ) | (0.22 | ) | (0.28 | ) | (0.28 | ) | 12.82 | |||||||||||||||||
Year Ended October 31, 2014 | 12.63 | 0.05 | 0.79 | 0.84 | (0.15 | ) | (0.15 | ) | 13.32 | |||||||||||||||||||
Year Ended October 31, 2013 | 11.64 | 0.12 | 1.01 | 1.13 | (0.14 | ) | (0.14 | ) | 12.63 | |||||||||||||||||||
Year Ended October 31, 2012 | 10.93 | 0.18 | 0.70 | 0.88 | (0.17 | ) | (0.17 | ) | 11.64 | |||||||||||||||||||
Class C Shares | ||||||||||||||||||||||||||||
Year Ended October 31, 2016 | 12.33 | 0.04 | (0.22 | ) | (0.18 | ) | (0.10 | ) | (0.10 | ) | 12.05 | |||||||||||||||||
Year Ended October 31, 2015 | 12.89 | 0.10 | (0.39 | ) | (0.29 | ) | (0.27 | ) | (0.27 | ) | 12.33 | |||||||||||||||||
Year Ended October 31, 2014 | 12.22 | (0.05 | ) | 0.77 | 0.72 | (0.05 | ) | (0.05 | ) | 12.89 | ||||||||||||||||||
Year Ended October 31, 2013 | 11.33 | 0.03 | 0.97 | 1.00 | (0.11 | ) | (0.11 | ) | 12.22 | |||||||||||||||||||
Year Ended October 31, 2012 | 10.67 | 0.10 | 0.68 | 0.78 | (0.12 | ) | (0.12 | ) | 11.33 | |||||||||||||||||||
Class R Shares | ||||||||||||||||||||||||||||
Year Ended October 31, 2016 | 12.72 | 0.07 | (0.22 | ) | (0.15 | ) | (0.13 | ) | (0.13 | ) | 12.44 | |||||||||||||||||
Year Ended October 31, 2015 | 13.25 | 0.11 | (0.36 | ) | (0.25 | ) | (0.28 | ) | (0.28 | ) | 12.72 | |||||||||||||||||
Year Ended October 31, 2014 | 12.56 | 0.02 | 0.78 | 0.80 | (0.11 | ) | (0.11 | ) | 13.25 | |||||||||||||||||||
Year Ended October 31, 2013 | 11.61 | 0.06 | 1.01 | 1.07 | (0.12 | ) | (0.12 | ) | 12.56 | |||||||||||||||||||
Year Ended October 31, 2012 | 10.90 | 0.14 | 0.71 | 0.85 | (0.14 | ) | (0.14 | ) | 11.61 | |||||||||||||||||||
Institutional Service Class Shares | ||||||||||||||||||||||||||||
Year Ended October 31, 2016 | 12.94 | 0.15 | (0.22 | ) | (0.07 | ) | (0.19 | ) | (0.19 | ) | 12.68 | |||||||||||||||||
Year Ended October 31, 2015 | 13.44 | 0.20 | (0.38 | ) | (0.18 | ) | (0.32 | ) | (0.32 | ) | 12.94 | |||||||||||||||||
Year Ended October 31, 2014 | 12.75 | 0.09 | 0.80 | 0.89 | (0.20 | ) | (0.20 | ) | 13.44 | |||||||||||||||||||
Year Ended October 31, 2013 | 11.73 | 0.15 | 1.02 | 1.17 | (0.15 | ) | (0.15 | ) | 12.75 | |||||||||||||||||||
Period from September 24, 2012 through October 31, 2012(i)(j) | 11.81 | 0.01 | (0.09 | ) | (0.08 | ) | – | – | 11.73 | |||||||||||||||||||
Institutional Class Shares | ||||||||||||||||||||||||||||
Year Ended October 31, 2016 | 12.93 | 0.20 | (0.27 | ) | (0.07 | ) | (0.18 | ) | (0.18 | ) | 12.68 | |||||||||||||||||
Year Ended October 31, 2015 | 13.43 | 0.21 | (0.39 | ) | (0.18 | ) | (0.32 | ) | (0.32 | ) | 12.93 | |||||||||||||||||
Year Ended October 31, 2014 | 12.75 | 0.08 | 0.80 | 0.88 | (0.20 | ) | (0.20 | ) | 13.43 | |||||||||||||||||||
Year Ended October 31, 2013 | 11.73 | 0.15 | 1.02 | 1.17 | (0.15 | ) | (0.15 | ) | 12.75 | |||||||||||||||||||
Year Ended October 31, 2012 | 11.00 | 0.22 | 0.71 | 0.93 | (0.20 | ) | (0.20 | ) | 11.73 | |||||||||||||||||||
| (a) | Net investment income/(loss) is based on average shares outstanding during the period. |
| (b) | Excludes sales charge. |
| (c) | Not annualized for periods less than one year. |
| (d) | Annualized for periods less than one year. |
Amounts listed as “–” are $0 or round to $0.
See accompanying Notes to Financial Statements.
Annual Report 2016
24
Financial Highlights (continued)
Selected Data for Each Share of Capital Outstanding Throughout the Periods Indicated
Aberdeen Diversified Alternatives Fund (concluded)
| Ratios/Supplemental Data | ||||||||||||||||||||||
| Total Return (b)(c) | Net Assets at End of Period (000’s) | Ratio of Expenses (Net of Reimbursements/ Waivers) to Average Net Assets (d) | Ratio of Net Investment Income (Loss) to Average Net Assets (d) | Ratio of Expenses (Prior to Reimbursements) to Average Net Assets (d)(e) | Portfolio Turnover (f) | |||||||||||||||||
| (0.87 | %) | $ | 16,106 | 0.62 | %(g) | 1.01 | % | 0.88 | %(g) | 36.02 | % | |||||||||||
| (1.68 | %) | 27,238 | 0.57 | % | 1.31 | % | 0.80 | % | 78.72 | % | ||||||||||||
| 6.70 | % | 21,608 | 0.52 | % | 0.36 | % | 0.88 | % | 54.26 | % | ||||||||||||
| 9.76 | % | 6,135 | 0.52 | % | 1.02 | % | 1.20 | % | 47.20 | % | ||||||||||||
| 8.14 | % | 6,418 | 0.52 | % | 1.65 | % | 1.14 | % | 51.62 | % | ||||||||||||
| (1.45 | %) | 10,664 | 1.25 | %(g) | 0.34 | % | 1.60 | %(g) | 36.02 | % | ||||||||||||
| (2.35 | %) | 16,740 | 1.25 | % | 0.79 | % | 1.48 | % | 78.72 | % | ||||||||||||
| 5.91 | % | 15,565 | 1.25 | % | (0.36 | %) | 1.61 | % | 54.26 | % | ||||||||||||
| 8.91 | % | 12,467 | 1.25 | % | 0.26 | % | 1.93 | % | 47.20 | % | ||||||||||||
| 7.39 | % | 13,368 | 1.25 | % | 0.93 | % | 1.87 | % | 51.62 | % | ||||||||||||
| (1.17 | %) | 1,858 | 0.92 | %(g) | 0.58 | % | 1.18 | %(g) | 36.02 | % | ||||||||||||
| (1.98 | %) | 1,341 | 0.87 | % | 0.81 | % | 1.10 | % | 78.72 | % | ||||||||||||
| 6.37 | %(h) | 348 | 0.83 | % | 0.14 | % | 1.19 | % | 54.26 | % | ||||||||||||
| 9.32 | %(h) | 371 | 0.88 | % | 0.51 | % | 1.56 | % | 47.20 | % | ||||||||||||
| 7.85 | %(h) | 277 | 0.91 | % | 1.22 | % | 1.53 | % | 51.62 | % | ||||||||||||
| (0.55 | %) | 19 | 0.32 | %(g) | 1.22 | % | 0.58 | %(g) | 36.02 | % | ||||||||||||
| (1.38 | %) | 19 | 0.25 | % | 1.54 | % | 0.48 | % | 78.72 | % | ||||||||||||
| 7.02 | % | 12 | 0.25 | % | 0.65 | % | 0.61 | % | 54.26 | % | ||||||||||||
| 10.03 | % | 11 | 0.25 | % | 1.22 | % | 0.93 | % | 47.20 | % | ||||||||||||
| (0.68 | %) | 10 | 0.25 | % | 0.56 | % | 0.87 | % | 51.62 | % | ||||||||||||
| (0.51 | %) | 30,431 | 0.25 | %(g) | 1.58 | % | 0.55 | %(g) | 36.02 | % | ||||||||||||
| (1.38 | %) | 104,291 | 0.25 | % | 1.59 | % | 0.48 | % | 78.72 | % | ||||||||||||
| 6.94 | % | 66,073 | 0.25 | % | 0.58 | % | 0.61 | % | 54.26 | % | ||||||||||||
| 10.03 | % | 3,261 | 0.25 | % | 1.19 | % | 0.93 | % | 47.20 | % | ||||||||||||
| 8.54 | %(h) | 2,970 | 0.25 | % | 1.95 | % | 0.87 | % | 51.62 | % | ||||||||||||
| (e) | During the period, certain fees were waived and/or reimbursed. If such waivers/reimbursements had not occurred, the ratios would have been as indicated. |
| (f) | Portfolio turnover is calculated on the basis of the Fund as a whole without distinguishing among the classes of shares. |
| (g) | Includes interest expense that amounts to less than 0.01%. |
| (h) | The total return shown above includes the impact of financial statement rounding of the NAV per share and/or financial statement adjustments. |
| (i) | There were no shareholders in the class for the period from April 23, 2009 through September 23, 2012. The financial highlights information presented in the table above and in Note 5 in the accompanying notes to the financial statements is for two separate periods of time when shareholders were invested in the class. |
| (j) | For the period from September 24, 2012 through October 31, 2012. |
2016 Annual Report
25
Financial Highlights (continued)
Selected Data for Each Share of Capital Outstanding Throughout the Periods Indicated
Aberdeen Diversified Income Fund
| Investment Activities | Distributions | |||||||||||||||||||||||||||||||
| Net Asset Value, Beginning of Period | Net Investment Income (a) | Net | Total from Investment Activities | Net Invest- ment Income | Net Realized Gains | Total Distri- butions | Net Asset Value, End of Period | |||||||||||||||||||||||||
Class A Shares | ||||||||||||||||||||||||||||||||
Year Ended October 31, 2016 | $ | 11.73 | $ | 0.35 | $ | 0.10 | $ | 0.45 | $ | (0.33 | ) | $ | (0.09 | ) | $ | (0.42 | ) | $ | 11.76 | |||||||||||||
Year Ended October 31, 2015 | 12.99 | 0.38 | (0.65 | ) | (0.27 | ) | (0.37 | ) | (0.62 | ) | (0.99 | ) | 11.73 | |||||||||||||||||||
Year Ended October 31, 2014 | 12.58 | 0.39 | 0.48 | 0.87 | (0.46 | ) | – | (0.46 | ) | 12.99 | ||||||||||||||||||||||
Year Ended October 31, 2013 | 12.03 | 0.35 | 0.56 | 0.91 | (0.36 | ) | – | (0.36 | ) | 12.58 | ||||||||||||||||||||||
Year Ended October 31, 2012 | 11.39 | 0.25 | 0.62 | 0.87 | (0.23 | ) | – | (0.23 | ) | 12.03 | ||||||||||||||||||||||
Class C Shares | ||||||||||||||||||||||||||||||||
Year Ended October 31, 2016 | 11.47 | 0.26 | 0.10 | 0.36 | (0.25 | ) | (0.09 | ) | (0.34 | ) | 11.49 | |||||||||||||||||||||
Year Ended October 31, 2015 | 12.75 | 0.28 | (0.64 | ) | (0.36 | ) | (0.30 | ) | (0.62 | ) | (0.92 | ) | 11.47 | |||||||||||||||||||
Year Ended October 31, 2014 | 12.35 | 0.29 | 0.48 | 0.77 | (0.37 | ) | – | (0.37 | ) | 12.75 | ||||||||||||||||||||||
Year Ended October 31, 2013 | 11.81 | 0.25 | 0.56 | 0.81 | (0.27 | ) | – | (0.27 | ) | 12.35 | ||||||||||||||||||||||
Year Ended October 31, 2012 | 11.18 | 0.17 | 0.61 | 0.78 | (0.15 | ) | – | (0.15 | ) | 11.81 | ||||||||||||||||||||||
Class R Shares | ||||||||||||||||||||||||||||||||
Year Ended October 31, 2016 | 11.61 | 0.32 | 0.09 | 0.41 | (0.30 | ) | (0.09 | ) | (0.39 | ) | 11.63 | |||||||||||||||||||||
Year Ended October 31, 2015 | 12.90 | 0.32 | (0.66 | ) | (0.34 | ) | (0.33 | ) | (0.62 | ) | (0.95 | ) | 11.61 | |||||||||||||||||||
Year Ended October 31, 2014 | 12.49 | 0.33 | 0.49 | 0.82 | (0.41 | ) | – | (0.41 | ) | 12.90 | ||||||||||||||||||||||
Year Ended October 31, 2013 | 11.94 | 0.29 | 0.57 | 0.86 | (0.31 | ) | – | (0.31 | ) | 12.49 | ||||||||||||||||||||||
Year Ended October 31, 2012 | 11.31 | 0.19 | 0.62 | 0.81 | (0.18 | ) | – | (0.18 | ) | 11.94 | ||||||||||||||||||||||
Institutional Service Class Shares | ||||||||||||||||||||||||||||||||
Year Ended October 31, 2016 | 11.72 | 0.38 | 0.10 | 0.48 | (0.37 | ) | (0.09 | ) | (0.46 | ) | 11.74 | |||||||||||||||||||||
Year Ended October 31, 2015 | 12.97 | 0.38 | (0.61 | ) | (0.23 | ) | (0.40 | ) | (0.62 | ) | (1.02 | ) | 11.72 | |||||||||||||||||||
Year Ended October 31, 2014 | 12.57 | 0.42 | 0.48 | 0.90 | (0.50 | ) | – | (0.50 | ) | 12.97 | ||||||||||||||||||||||
Year Ended October 31, 2013 | 12.01 | 0.39 | 0.57 | 0.96 | (0.40 | ) | – | (0.40 | ) | 12.57 | ||||||||||||||||||||||
Period from September 24, 2012 through October 31, 2012(i)(j) | 12.06 | 0.03 | (0.08 | ) | (0.05 | ) | – | – | – | 12.01 | ||||||||||||||||||||||
Institutional Class Shares | ||||||||||||||||||||||||||||||||
Year Ended October 31, 2016 | 11.72 | 0.38 | 0.10 | 0.48 | (0.36 | ) | (0.09 | ) | (0.45 | ) | 11.75 | |||||||||||||||||||||
Year Ended October 31, 2015 | 12.97 | 0.40 | (0.63 | ) | (0.23 | ) | (0.40 | ) | (0.62 | ) | (1.02 | ) | 11.72 | |||||||||||||||||||
Year Ended October 31, 2014 | 12.56 | 0.42 | 0.49 | 0.91 | (0.50 | ) | – | (0.50 | ) | 12.97 | ||||||||||||||||||||||
Year Ended October 31, 2013 | 12.01 | 0.38 | 0.57 | 0.95 | (0.40 | ) | – | (0.40 | ) | 12.56 | ||||||||||||||||||||||
Year Ended October 31, 2012 | 11.38 | 0.28 | 0.61 | 0.89 | (0.26 | ) | – | (0.26 | ) | 12.01 | ||||||||||||||||||||||
| (a) | Net investment income/(loss) is based on average shares outstanding during the period. |
| (b) | Excludes sales charge. |
| (c) | Not annualized for periods less than one year. |
| (d) | Annualized for periods less than one year. |
Amounts listed as “–” are $0 or round to $0.
See accompanying Notes to Financial Statements.
Annual Report 2016
26
Financial Highlights (continued)
Selected Data for Each Share of Capital Outstanding Throughout the Periods Indicated
Aberdeen Diversified Income Fund (concluded)
| Ratios/Supplemental Data | ||||||||||||||||||||||
| Total Return (b)(c) | Net Assets at End of Period (000’s) | Ratio of Expenses (Net of Reimbursements/ Waivers) to Average Net Assets (d) | Ratio of Net Investment Income to Average Net Assets (d) | Ratio of Expenses (Prior to Reimbursements) to Average Net Assets (d)(e) | Portfolio Turnover (f) | |||||||||||||||||
| 4.00 | % | $ | 5,390 | 0.56 | % | 3.02 | % | 1.22 | % | 20.87 | % | |||||||||||
| (2.21 | %) | 6,291 | 0.53 | %(g) | 3.07 | % | 1.16 | %(g) | 50.74 | % | ||||||||||||
| 7.10 | % | 7,542 | 0.51 | % | 3.06 | % | 1.08 | % | 29.19 | % | ||||||||||||
| 7.69 | % | 8,357 | 0.53 | % | 2.82 | % | 1.00 | % | 37.01 | % | ||||||||||||
| 7.73 | %(h) | 10,538 | 0.53 | % | 2.15 | % | 1.00 | % | 65.34 | % | ||||||||||||
| 3.24 | % | 12,293 | 1.25 | % | 2.33 | % | 1.96 | % | 20.87 | % | ||||||||||||
| (2.96 | %) | 14,396 | 1.25 | %(g) | 2.33 | % | 1.88 | %(g) | 50.74 | % | ||||||||||||
| 6.34 | %(h) | 14,906 | 1.25 | % | 2.31 | % | 1.82 | % | 29.19 | % | ||||||||||||
| 6.96 | %(h) | 17,824 | 1.25 | % | 2.09 | % | 1.72 | % | 37.01 | % | ||||||||||||
| 7.01 | %(h) | 22,488 | 1.25 | % | 1.45 | % | 1.72 | % | 65.34 | % | ||||||||||||
| 3.65 | % | 313 | 0.85 | % | 2.77 | % | 1.51 | % | 20.87 | % | ||||||||||||
| (2.75 | %) | 421 | 0.98 | %(g) | 2.64 | % | 1.61 | %(g) | 50.74 | % | ||||||||||||
| 6.66 | % | 408 | 0.97 | % | 2.58 | % | 1.54 | % | 29.19 | % | ||||||||||||
| 7.29 | % | 387 | 0.96 | % | 2.39 | % | 1.43 | % | 37.01 | % | ||||||||||||
| 7.20 | % | 384 | 0.99 | % | 1.63 | % | 1.46 | % | 65.34 | % | ||||||||||||
| 4.28 | % | 33 | 0.25 | % | 3.32 | % | 0.91 | % | 20.87 | % | ||||||||||||
| (1.91 | %) | 32 | 0.25 | %(g) | 3.16 | % | 0.88 | %(g) | 50.74 | % | ||||||||||||
| 7.32 | %(h) | 12 | 0.25 | % | 3.31 | % | 0.82 | % | 29.19 | % | ||||||||||||
| 8.10 | %(h) | 11 | 0.25 | % | 3.10 | % | 0.72 | % | 37.01 | % | ||||||||||||
| (0.41 | %)(h) | 10 | 0.25 | % | 2.52 | % | 0.72 | % | 65.34 | % | ||||||||||||
| 4.30 | % | 1,129 | 0.25 | % | 3.32 | % | 0.95 | % | 20.87 | % | ||||||||||||
| (1.91 | %) | 1,314 | 0.25 | %(g) | 3.30 | % | 0.88 | %(g) | 50.74 | % | ||||||||||||
| 7.40 | % | 2,339 | 0.25 | % | 3.32 | % | 0.82 | % | 29.19 | % | ||||||||||||
| 8.01 | % | 1,953 | 0.25 | % | 3.10 | % | 0.72 | % | 37.01 | % | ||||||||||||
| 7.95 | % | 1,756 | 0.25 | % | 2.39 | % | 0.72 | % | 65.34 | % | ||||||||||||
| (e) | During the period, certain fees were waived and/or reimbursed. If such waivers/reimbursements had not occurred, the ratios would have been as indicated. |
| (f) | Portfolio turnover is calculated on the basis of the Fund as a whole without distinguishing among the classes of shares. |
| (g) | Includes interest expense that amounts to less than 0.01%. |
| (h) | The total return shown above includes the impact of financial statement rounding of the NAV per share and/or financial statement adjustments. |
| (i) | There were no shareholders in the class for the period from April 23, 2009 through September 23, 2012. The financial highlights information presented in the table above and in Note 5 in the accompanying notes to the financial statements is for two separate periods of time when shareholders were invested in the class. |
| (j) | For the period from September 24, 2012 through October 31, 2012. |
2016 Annual Report
27
Financial Highlights (continued)
Selected Data for Each Share of Capital Outstanding Throughout the Periods Indicated
Aberdeen Dynamic Allocation Fund
| Investment Activities | Distributions | |||||||||||||||||||||||||||||||
| Net Asset Value, Beginning of Period | Net Investment Income (a) | Net | Total from Investment Activities | Net Invest- ment Income | Net Realized Gains | Total Distri- butions | Net Asset Value, End of Period | |||||||||||||||||||||||||
Class A Shares | ||||||||||||||||||||||||||||||||
Year Ended October 31, 2016 | $ | 12.86 | $ | 0.24 | $ | (0.07 | ) | $ | 0.17 | $ | (0.26 | ) | $ | (0.01 | ) | $ | (0.27 | ) | $ | 12.76 | ||||||||||||
Year Ended October 31, 2015 | 13.30 | 0.33 | (0.43 | ) | (0.10 | ) | (0.34 | ) | – | (0.34 | ) | 12.86 | ||||||||||||||||||||
Year Ended October 31, 2014 | 12.51 | 0.20 | 0.80 | 1.00 | (0.21 | ) | – | (0.21 | ) | 13.30 | ||||||||||||||||||||||
Year Ended October 31, 2013 | 11.52 | 0.17 | 1.01 | 1.18 | (0.19 | ) | – | (0.19 | ) | 12.51 | ||||||||||||||||||||||
Year Ended October 31, 2012 | 10.87 | 0.21 | 0.64 | 0.85 | (0.20 | ) | – | (0.20 | ) | 11.52 | ||||||||||||||||||||||
Class C Shares | ||||||||||||||||||||||||||||||||
Year Ended October 31, 2016 | 12.60 | 0.15 | (0.07 | ) | 0.08 | (0.18 | ) | (0.01 | ) | (0.19 | ) | 12.49 | ||||||||||||||||||||
Year Ended October 31, 2015 | 13.06 | 0.23 | (0.43 | ) | (0.20 | ) | (0.26 | ) | – | (0.26 | ) | 12.60 | ||||||||||||||||||||
Year Ended October 31, 2014 | 12.28 | 0.11 | 0.78 | 0.89 | (0.11 | ) | – | (0.11 | ) | 13.06 | ||||||||||||||||||||||
Year Ended October 31, 2013 | 11.32 | 0.08 | 1.00 | 1.08 | (0.12 | ) | – | (0.12 | ) | 12.28 | ||||||||||||||||||||||
Year Ended October 31, 2012 | 10.69 | 0.13 | 0.62 | 0.75 | (0.12 | ) | – | (0.12 | ) | 11.32 | ||||||||||||||||||||||
Class R Shares | ||||||||||||||||||||||||||||||||
Year Ended October 31, 2016 | 12.79 | 0.19 | (0.08 | ) | 0.11 | (0.21 | ) | (0.01 | ) | (0.22 | ) | 12.68 | ||||||||||||||||||||
Year Ended October 31, 2015 | 13.23 | 0.27 | (0.42 | ) | (0.15 | ) | (0.29 | ) | – | (0.29 | ) | 12.79 | ||||||||||||||||||||
Year Ended October 31, 2014 | 12.45 | 0.15 | 0.78 | 0.93 | (0.15 | ) | – | (0.15 | ) | 13.23 | ||||||||||||||||||||||
Year Ended October 31, 2013 | 11.47 | 0.12 | 1.02 | 1.14 | (0.16 | ) | – | (0.16 | ) | 12.45 | ||||||||||||||||||||||
Year Ended October 31, 2012 | 10.83 | 0.15 | 0.66 | 0.81 | (0.17 | ) | – | (0.17 | ) | 11.47 | ||||||||||||||||||||||
Institutional Service Class Shares | ||||||||||||||||||||||||||||||||
Year Ended October 31, 2016 | 12.81 | 0.28 | (0.08 | ) | 0.20 | (0.30 | ) | (0.01 | ) | (0.31 | ) | 12.70 | ||||||||||||||||||||
Year Ended October 31, 2015 | 13.24 | 0.34 | (0.40 | ) | (0.06 | ) | (0.37 | ) | – | (0.37 | ) | 12.81 | ||||||||||||||||||||
Year Ended October 31, 2014 | 12.46 | 0.24 | 0.78 | 1.02 | (0.24 | ) | – | (0.24 | ) | 13.24 | ||||||||||||||||||||||
Year Ended October 31, 2013 | 11.47 | 0.20 | 1.02 | 1.22 | (0.23 | ) | – | (0.23 | ) | 12.46 | ||||||||||||||||||||||
Period from September 24, 2012 through October 31, 2012(h)(i) | 11.58 | 0.01 | (0.12 | ) | (0.11 | ) | – | – | – | 11.47 | ||||||||||||||||||||||
Institutional Class Shares | ||||||||||||||||||||||||||||||||
Year Ended October 31, 2016 | 12.81 | 0.28 | (0.08 | ) | 0.20 | (0.28 | ) | (0.01 | ) | (0.29 | ) | 12.72 | ||||||||||||||||||||
Year Ended October 31, 2015 | 13.24 | 0.36 | (0.42 | ) | (0.06 | ) | (0.37 | ) | – | (0.37 | ) | 12.81 | ||||||||||||||||||||
Year Ended October 31, 2014 | 12.46 | 0.24 | 0.78 | 1.02 | (0.24 | ) | – | (0.24 | ) | 13.24 | ||||||||||||||||||||||
Year Ended October 31, 2013 | 11.47 | 0.19 | 1.03 | 1.22 | (0.23 | ) | – | (0.23 | ) | 12.46 | ||||||||||||||||||||||
Year Ended October 31, 2012 | 10.83 | 0.19 | 0.68 | 0.87 | (0.23 | ) | – | (0.23 | ) | 11.47 | ||||||||||||||||||||||
| (a) | Net investment income/(loss) is based on average shares outstanding during the period. |
| (b) | Excludes sales charge. |
| (c) | Not annualized for periods less than one year. |
| (d) | Annualized for periods less than one year. |
Amounts listed as “–” are $0 or round to $0.
See accompanying Notes to Financial Statements.
Annual Report 2016
28
Financial Highlights (concluded)
Selected Data for Each Share of Capital Outstanding Throughout the Periods Indicated
Aberdeen Dynamic Allocation Fund (concluded)
| Ratios/Supplemental Data | ||||||||||||||||||||||
| Total Return (b)(c) | Net Assets at End of Period (000’s) | Ratio of Expenses (Net of Reimbursements/ Waivers) to Average Net Assets (d) | Ratio of Net Investment Income to Average Net Assets (d) | Ratio of Expenses (Prior to Reimbursements) to Average Net Assets (d)(e) | Portfolio Turnover (f) | |||||||||||||||||
| 1.30 | % | $ | 7,641 | 0.56 | % | 1.92 | % | 1.24 | % | 40.08 | % | |||||||||||
| (0.82 | %) | 8,677 | 0.53 | % | 2.50 | % | 1.19 | % | 40.49 | % | ||||||||||||
| 8.03 | % | 9,506 | 0.52 | % | 1.58 | % | 1.16 | % | 52.34 | % | ||||||||||||
| 10.35 | % | 9,937 | 0.52 | % | 1.44 | % | 1.07 | % | 67.49 | % | ||||||||||||
| 7.93 | %(g) | 11,682 | 0.53 | % | 1.90 | % | 1.08 | % | 60.45 | % | ||||||||||||
| 0.58 | % | 9,470 | 1.25 | % | 1.24 | % | 2.00 | % | 40.08 | % | ||||||||||||
| (1.55 | %) | 11,687 | 1.25 | % | 1.78 | % | 1.91 | % | 40.49 | % | ||||||||||||
| 7.28 | % | 12,939 | 1.25 | % | 0.85 | % | 1.89 | % | 52.34 | % | ||||||||||||
| 9.58 | % | 15,123 | 1.25 | % | 0.71 | % | 1.80 | % | 67.49 | % | ||||||||||||
| 7.10 | % | 16,890 | 1.25 | % | 1.18 | % | 1.80 | % | 60.45 | % | ||||||||||||
| 0.84 | % | 508 | 0.93 | % | 1.52 | % | 1.61 | % | 40.08 | % | ||||||||||||
| (1.16 | %) | 501 | 0.96 | % | 2.04 | % | 1.62 | % | 40.49 | % | ||||||||||||
| 7.52 | % | 454 | 0.95 | % | 1.15 | % | 1.59 | % | 52.34 | % | ||||||||||||
| 9.99 | % | 406 | 0.92 | % | 1.02 | % | 1.47 | % | 67.49 | % | ||||||||||||
| 7.55 | % | 288 | 0.89 | % | 1.38 | % | 1.44 | % | 60.45 | % | ||||||||||||
| 1.58 | % | 10 | 0.25 | % | 2.22 | % | 0.93 | % | 40.08 | % | ||||||||||||
| (0.53 | %)(g) | 10 | 0.25 | % | 2.56 | % | 0.91 | % | 40.49 | % | ||||||||||||
| 8.36 | % | 12 | 0.25 | % | 1.85 | % | 0.89 | % | 52.34 | % | ||||||||||||
| 10.72 | % | 11 | 0.25 | % | 1.68 | % | 0.80 | % | 67.49 | % | ||||||||||||
| (0.95 | %) | 10 | 0.25 | % | 1.13 | % | 0.80 | % | 60.45 | % | ||||||||||||
| 1.57 | % | 1,275 | 0.25 | % | 2.26 | % | 1.02 | % | 40.08 | % | ||||||||||||
| (0.53 | %) | 1,675 | 0.25 | % | 2.73 | % | 0.91 | % | 40.49 | % | ||||||||||||
| 8.28 | % | 1,506 | 0.25 | % | 1.86 | % | 0.89 | % | 52.34 | % | ||||||||||||
| 10.72 | % | 1,223 | 0.25 | % | 1.62 | % | 0.80 | % | 67.49 | % | ||||||||||||
| 8.18 | % | 596 | 0.25 | % | 1.65 | % | 0.80 | % | 60.45 | % | ||||||||||||
| (e) | During the period, certain fees were waived and/or reimbursed. If such waivers/reimbursements had not occurred, the ratios would have been as indicated. |
| (f) | Portfolio turnover is calculated on the basis of the Fund as a whole without distinguishing among the classes of shares. |
| (g) | The total return shown above includes the impact of financial statement rounding of the NAV per share and/or financial statement adjustments. |
| (h) | There were no shareholders in the class for the period from April 23, 2009 through September 23, 2012. The financial highlights information presented in the table above and in Note 5 in the accompanying notes to the financial statements is for two separate periods of time when shareholders were invested in the class. |
| (i) | For the period from September 24, 2012 through October 31, 2012. |
2016 Annual Report
29
October 31, 2016
1. Organization
Aberdeen Funds (the “Trust”) was organized as a statutory trust under the laws of the state of Delaware by a Certificate of Trust filed on September 27, 2007 and is registered under the Investment Company Act of 1940, as amended (the “1940 Act”), as an open-end management investment company. As of October 31, 2016, the Trust had authorized an unlimited number of shares of beneficial interest (“shares”) without par value. As of October 31, 2016, the Trust operated nineteen (19) separate series, or mutual funds, each with its own investment objective(s) and strategies. This report contains the financial statements and financial highlights of the three (3) funds listed below (each a “Fund”; collectively, the “Funds”):
| – | Aberdeen Diversified Alternatives Fund (“Diversified Alternatives Fund”) |
| – | Aberdeen Diversified Income Fund (“Diversified Income Fund”) |
| – | Aberdeen Dynamic Allocation Fund (“Dynamic Allocation Fund”) |
Each of the Funds is operated as a “fund of funds,” which means that each of these Funds pursues its investment objective primarily by allocating its investments among other affiliated and unaffiliated mutual funds and exchange traded funds (“Underlying Funds”).
2. Summary of Significant Accounting Policies
The following is a summary of significant accounting policies followed by the Funds in the preparation of their financial statements. The policies conform to accounting principles generally accepted in the United States of America (“GAAP”). The preparation of financial statements requires management to make estimates and assumptions that affect the reported amounts of assets and liabilities, disclosure of contingent assets and liabilities at the date of the financial statements, and the reported amounts of income and expenses for the period. Actual results could differ from those estimates. The accounting records of the Funds are maintained in U.S. Dollars.
| a. | Security Valuation |
The Funds value their securities at current market value or fair value, consistent with regulatory requirements. “Fair value” is defined in the Funds’ Valuation and Liquidity Procedures as the price that could be received to sell an asset or paid to transfer a liability in an orderly transaction between willing market participants without a compulsion to contract at the measurement date.
In accordance with the authoritative guidance on fair value measurements and disclosures under GAAP, the Funds disclose the fair value of their investments using a three-level hierarchy that classifies the inputs to valuation techniques used to measure the fair value. The hierarchy assigns Level 1 measurements to valuations based upon unadjusted quoted prices in active markets for identical assets, Level 2 measurements to valuations based upon other significant observable inputs, including adjusted quoted prices in active markets for similar assets, and Level 3 measurements to valuations based upon unobservable inputs that are significant to the valuation. Observable inputs are inputs that reflect the assumptions market participants would use in pricing the asset or liability, which are based on market data obtained from sources independent of the reporting entity. Unobservable inputs are inputs that reflect the reporting entity’s own assumptions about the assumptions market participants would use in pricing the asset or liability developed based on the best information available in the circumstances. A financial instrument’s level within the fair value hierarchy is based upon the lowest level of any input that is significant to the fair value measurement.
Equity securities that are traded on an exchange are valued at the last quoted sale price on the principal exchange on which the security is traded at the “Valuation Time” subject to application, when appropriate, of the valuation factors described in the paragraph below. Under normal circumstances, the Valuation Time is as of the close of regular trading on the New York Stock Exchange (usually 4:00 p.m. Eastern Time). In the absence of a sale price, the security is valued at the mean of the bid/ask price quoted at the close on the principal exchange on which the security is traded. Securities traded on NASDAQ are valued at the NASDAQ official closing price. Open-end mutual funds are valued at the respective net asset value as reported by such company. The prospectuses for the registered open-end management investment companies in which a Fund invests explain the circumstances under which those companies will use fair value pricing and the effects of using fair value pricing. Closed-end funds and exchange-traded funds (“ETFs”) are valued at the market price of the security at the Valuation Time. A security using any of these pricing methodologies is determined to be a Level 1 investment.
Short-term investments are comprised of cash and cash equivalents invested in short-term investment funds which are redeemable daily. The Funds sweep available cash into the State Street Institutional U.S. Government Money Market Fund, which has elected to qualify as a “government money market fund” pursuant to Rule 2a-7 under the 1940 Act and has an objective to maintain a $1.00 NAV, which is not guaranteed. Registered investment companies are valued at their net asset value as reported by such company. Generally, these investment types are categorized as Level 1 investments.
Annual Report 2016
30
Notes to Financial Statements (continued)
October 31, 2016
In the event that a security’s market quotations are not readily available or are deemed unreliable (for reasons other than because the foreign exchange on which it trades closed before the Valuation Time), the security is valued at fair value as determined by the Funds’ Pricing Committee (the “Pricing Committee”), taking into account the relevant factors and surrounding circumstances using Valuation and Liquidity Procedures approved by the Funds’ Board of Trustees (the “Board”). A security that has been fair valued by the Pricing Committee may be classified as Level 2 or Level 3 depending on the nature of the inputs.
The three-level hierarchy of inputs is summarized below:
| • | Level 1- quoted prices in active markets for identical investments; |
| • | Level 2- other significant observable inputs (including quoted prices for similar securities, interest rates, prepayment speeds, and credit risk); or |
| • | Level 3- significant unobservable inputs (including a Fund’s own assumptions in determining the fair value of investments). |
The following is a summary of the inputs used as of October 31, 2016 in valuing the Funds’ investments at fair value. The inputs or methodologies used for valuing securities are not necessarily an indication of the risk associated with investing in those securities.
Please refer to the Statements of Investments for a detailed breakout of the security types:
| Investments, at Value | Level 1 ($) | Level 2 ($) | Level 3 ($) | Total ($) | ||||||||||||
| Diversified Alternatives Fund | ||||||||||||||||
| Investments in Securities | ||||||||||||||||
Mutual Funds | 51,073,548 | – | – | 51,073,548 | ||||||||||||
Exchange Traded Funds | 5,432,869 | – | – | 5,432,869 | ||||||||||||
Short-Term Investment | 2,722,596 | – | – | 2,722,596 | ||||||||||||
|
|
|
|
|
|
|
| |||||||||
| 59,229,013 | – | – | 59,229,013 | |||||||||||||
|
|
|
|
|
|
|
| |||||||||
| Diversified Income Fund | ||||||||||||||||
| Investments in Securities | ||||||||||||||||
Mutual Funds | 11,823,839 | – | – | 11,823,839 | ||||||||||||
Exchange Traded Funds | 7,099,558 | – | – | 7,099,558 | ||||||||||||
Short-Term Investment | 241,394 | – | – | 241,394 | ||||||||||||
|
|
|
|
|
|
|
| |||||||||
| 19,164,791 | – | – | 19,164,791 | |||||||||||||
|
|
|
|
|
|
|
| |||||||||
| Dynamic Allocation Fund | ||||||||||||||||
| Investments in Securities | ||||||||||||||||
Mutual Funds | 10,614,386 | – | – | 10,614,386 | ||||||||||||
Exchange Traded Funds | 7,576,832 | – | – | 7,576,832 | ||||||||||||
Short-Term Investment | 732,820 | – | – | 732,820 | ||||||||||||
|
|
|
|
|
|
|
| |||||||||
| 18,924,038 | – | – | 18,924,038 | |||||||||||||
|
|
|
|
|
|
|
| |||||||||
Amounts listed as “–” are $0 or round to $0.
For movements between the Levels within the fair value hierarchy, the Funds have adopted a policy of recognizing transfers at the end of each fiscal period. During the fiscal year ended October 31, 2016, there were no transfers between Levels. For the fiscal year ended October 31, 2016, there were no significant changes to the fair valuation methodologies.
| b. | Restricted Securities |
Restricted securities are privately-placed securities whose resale is restricted under U.S. securities laws. The Funds may invest in restricted securities, including unregistered securities eligible for resale without registration pursuant to Rule 144A and privately-placed securities of U.S. and non-U.S. issuers offered outside the U.S. without registration pursuant to Regulation S under the Securities Act of 1933, as amended (the “1933 Act”). Rule 144A securities may be freely traded among certain qualified institutional investors, such as the Funds, but resale of such securities in the U.S. is permitted only in limited circumstances.
2016 Annual Report
31
Notes to Financial Statements (continued)
October 31, 2016
| c. | Security Transactions, Investment Income and Expenses |
Security transactions are recorded on the trade date. Realized and unrealized gains/(losses) from security and currency transactions are calculated on the identified cost basis. Dividend income and corporate actions are recorded generally on the ex-date, except for certain dividends and corporate actions which may be recorded after the ex-date, as soon as the Fund acquires information regarding such dividends or corporate actions.
Interest income and expenses are recorded on an accrual basis. Expenses directly attributable to a Fund are charged to that Fund. Expenses not directly attributable to a Fund are allocated proportionately among the relevant Funds based on net assets of each. For each of the Funds, the method for allocating income, fund level expenses, and realized and unrealized gains or losses to a class is based on the total net asset value of that class’s shares in proportion to the total net assets of the relevant Fund. Expenses specific to a class (such as Rule 12b-1 and administrative services fees) are charged to that class.
| d. | Distributions |
Distributions from net investment income, if any, are declared and paid quarterly for all Funds. The Funds will also declare and pay distributions at least annually from net realized gains on investment transactions and net realized foreign exchange gains, if any. Dividends and distributions to shareholders are recorded on the ex-dividend date.
Dividends and distributions to shareholders are determined in accordance with federal income tax regulations, which may differ from GAAP. These differences are primarily due to differing treatments for foreign currencies and loss deferrals.
| e. | Federal Income Taxes |
Each Fund intends to continue to qualify as a “regulated investment company” by complying with the provisions available to certain investment companies, as defined in Subchapter M of the Internal Revenue Code of 1986, as amended, and to make distributions of net investment income and net realized capital gains sufficient to relieve the Funds from all federal income taxes. Therefore, no federal income tax provision is required.
Management of the Funds has concluded that there are no significant uncertain tax positions that would require recognition in the financial statements. Since tax authorities can examine previously filed tax returns, the Funds’ U.S. federal and state tax returns for each of the four fiscal years up to the most recent fiscal year ended October 31 are subject to such review.
| f. | Repurchase Agreements |
The Funds may enter into repurchase agreements under the terms of a Master Repurchase Agreement. It is each Fund’s policy that its custodian/counterparty segregate the underlying collateral securities, the value of which exceeds the principal amount of the repurchase transaction, including accrued interest. The repurchase price generally equals the price paid by a Fund plus interest negotiated on the basis of current short-term rates. To the extent that any repurchase transaction exceeds one business day, the collateral is valued on a daily basis to determine its adequacy. Under the Master Repurchase Agreement, if the counterparty defaults and the value of the collateral declines, or if bankruptcy proceedings are commenced with respect to the counterparty of the security, realization of the collateral by the Funds may be delayed or limited. Repurchase agreements are subject to contractual netting arrangements with the counterparty, Fixed Income Clearing Corp. To the extent a Fund enters into repurchase agreements, additional information on individual repurchase agreements is included in the Statements of Investments.
3. Agreements and Transactions with Affiliates
| a. | Investment Adviser |
Under the Investment Advisory Agreement with the Trust, Aberdeen Asset Management Inc. (“Aberdeen” or the “Adviser”) manages the Funds in accordance with the policies and procedures established by the Board. Under the terms of the Investment Advisory Agreement, each Fund pays Aberdeen an annual management fee of 0.15% based on the Fund’s average daily net assets, paid monthly.
The Trust and Aberdeen have entered into a written contract (the “Expense Limitation Agreement”) limiting operating expenses to 0.25% for all classes of the Funds. This contractual limitation may not be terminated before February 28, 2017 without the approval of the Board of Trustees. This limit excludes certain expenses, including any taxes, interest, brokerage fees, short-sale dividend expenses, Acquired Fund Fees and Expenses, Rule 12b-1 fees, administrative services fees, transfer agent out-of-pocket expenses for Class A shares, Class R shares, and Institutional Service Class shares and extraordinary expenses.
Annual Report 2016
32
Notes to Financial Statements (continued)
October 31, 2016
Aberdeen may request and receive reimbursement from a Fund of the advisory fees waived and other expenses reimbursed pursuant to the Expense Limitation Agreement at a later date not to exceed three years from the fiscal year in which the corresponding reimbursement to the Funds was made. However, no reimbursement will be made for fees waived unless:
(i) the total annual expense ratio of the class making such reimbursement is less than the limit set forth above; and
(ii) the payment of such reimbursement is approved by the Board on a quarterly basis (the “Reimbursement Requirements”).
If the Board approves any changes in the waiver terms or limitations, reimbursements are only permitted to the extent that the terms of the Expense Limitation Agreement in effect at the time of the waiver are met at the time that reimbursement is approved. Except as provided for in the Expense Limitation Agreement, reimbursement of amounts previously waived or assumed by Aberdeen is not permitted.
As of October 31, 2016, to the extent the Reimbursement Requirements are met, the cumulative potential reimbursements for each Fund, based on expenses reimbursed by Aberdeen would be:
| Fund | Amount Fiscal Year 2014 (Expires 10/31/17) | Amount Fiscal Year 2015 (Expires 10/31/18) | Amount Fiscal Year 2016 (Expires 10/31/19) | Total* | ||||||||||||
Diversified Alternatives Fund | $ | 218,423 | $ | 341,817 | $ | 272,716 | $ | 832,956 | ||||||||
Diversified Income Fund | 151,342 | 153,561 | 142,028 | 446,931 | ||||||||||||
Dynamic Allocation Fund | 162,128 | 160,791 | 151,253 | 474,172 | ||||||||||||
| * | Amounts reported are due to expire throughout the respective 3-year expiration period presented above. |
In accordance with the Funds’ Expense Limitation Agreement and criteria, as described above, the Adviser did not recapture any expenses for which it previously reimbursed the Funds. Accordingly, at October 31, 2016, the Funds did not have liabilities payable to the Adviser for recapture of previously reimbursed expenses.
| b. | Fund Administration |
Under the terms of the Fund Administration Agreement, Aberdeen provides various administrative and accounting services, including daily valuation of the Funds’ shares, preparation of financial statements, tax returns, regulatory reports, and presentation of quarterly reports to the Board. For services provided pursuant to the Fund Administration Agreement, the Trust pays Aberdeen an annual fee of 0.08% based on the Trust’s average daily net assets. The fee is then allocated proportionately among all funds within the Trust (including the Funds) in relation to the average daily net assets of each fund. This asset-based fee is subject to an annual minimum fee based on the number of funds served. Pursuant to a sub-administration agreement with Aberdeen, State Street Bank and Trust Company provides sub-administration services with respect to the Funds.
| c. | Distributor and Shareholder Servicing |
The Trust and Aberdeen Fund Distributors, LLC (the “Distributor” or “AFD”) are parties to the current Underwriting Agreement (the “Underwriting Agreement”) whereby the Distributor acts as principal underwriter for the Trust’s shares. The Trust has adopted a Distribution Plan (the “Plan”) pursuant to Rule 12b-1 under the 1940 Act with respect to certain classes of shares. The Plan permits the Funds to compensate AFD, as the Funds’ Distributor, for expenses associated with the distribution of certain classes of shares of the Funds of the Trust. Although actual distribution expenses may be more or less, under the Plan, the Funds of the Trust pay the Distributor an annual fee of the following amounts:
| Fund | Class A Shares | Class C Shares (a) | Class R Shares (a) | |||||||||
Diversified Alternatives Fund | 0.25% | 1.00% | 0.50% | |||||||||
Diversified Income Fund | 0.25% | 1.00% | 0.50% | |||||||||
Dynamic Allocation Fund | 0.25% | 1.00% | 0.50% | |||||||||
| (a) | 0.25% of which is service fees |
The Adviser or an affiliate of the Adviser may pay additional amounts from its own resources to dealers or other financial intermediaries, for aid in distribution or for aid in providing administrative services to shareholders.
2016 Annual Report
33
Notes to Financial Statements (continued)
October 31, 2016
Pursuant to the current Underwriting Agreement, the Distributor will also receive the proceeds of contingent deferred sales charges (“CDSCs”) of 1% imposed on certain redemptions of Class C (and up to 1% for certain Class A) shares.
In addition, the Distributor will re-allow to dealers 5.00% of sales charges on Class A shares of the Funds, which have a maximum front-end sales charge of 5.75% and the Distributor or the Adviser may compensate broker dealers or financial intermediaries from its own resources at the rate 1.00% on sales of Class C shares of the Funds, which have a maximum CDSC of 1.00%, (on the CDSC assessed on sales within one year of purchase). For the fiscal year ended October 31, 2016, AFD retained commissions of $14,044 from front-end sales charges of Class A shares and $7,237 from CDSC fees from Class C (and certain Class A) shares of the Funds.
| d. | Administrative Services |
Under the terms of the current Administrative Services Plan, a series of the Trust is permitted to enter into Servicing Agreements with servicing organizations, none of which are affiliated with the Trust, such as any bank, trust company, thrift institution, broker-dealer, insurance company, or other financial institution, which agree to provide certain administrative support services in connection with the Class A, Class R and Institutional Service Class shares of the series of the Trust (as applicable). Under the Administrative Services Plan, a Fund may pay a broker-dealer or other intermediary a maximum annual administrative services fee of 0.25% (or a maximum of 0.15% under an amendment to the Administrative Services Plan that is in effect until at least February 28, 2017) of the average daily net assets of Class A, Class R and Institutional Service Class shares. The amount of expenses incurred under the terms of the Administrative Services Plan during the fiscal year ended October 31, 2016 was as follows:
| Fund | Amount | |||
Diversified Alternatives Fund | $ | 6,634 | ||
Diversified Income Fund | 254 | |||
Dynamic Allocation Fund | 1,007 | |||
The Funds may pay and/or reimburse transfer agent out-of-pocket expenses to certain broker-dealers and financial intermediaries who provide administrative support services to beneficial shareholders on behalf of the Funds, subject to certain limitations approved by the Board. These fees may be in addition to Rule 12b-1 fees. Transfer agent out-of-pocket expenses generally include, but are not limited to, costs associated with recordkeeping, networking, sub-transfer agency or other administrative or shareholder services.
4. Investment Transactions
Purchases and sales of Underlying Funds for the fiscal year ended October 31, 2016, were as follows:
| Fund | Purchases | Sales | ||||||
Diversified Alternatives Fund | $ | 31,828,367 | $ | 116,448,363 | ||||
Diversified Income Fund | 4,212,783 | 7,740,031 | ||||||
Dynamic Allocation Fund | 8,034,027 | 11,213,952 | ||||||
A summary of the Funds’ investments in securities of affiliated issuers for the fiscal year ended October 31, 2016 is set forth below:
Diversified Alternatives Fund
| Fund | 10/31/2015 Share Balance | Purchase Cost | Sales Cost | Realized Gain (Loss) | Distributions Received(1) | 10/31/2016 Share Balance | 10/31/2016 Market Value | |||||||||||||||||||||
Aberdeen Equity Long-Short Fund | 1,719,759 | $ | 1,989,648 | 14,850,509 | $ | (2,575,077 | ) | $ | 1,989,648 | 595,567 | $ | 5,461,353 | ||||||||||||||||
Aberdeen Asia Bond Fund | 524,752 | 1,051,055 | 4,071,803 | (150,408 | ) | 41,720 | 234,243 | 2,398,648 | ||||||||||||||||||||
Total | 3,040,703 | 18,922,312 | (2,725,485 | ) | 2,031,368 | 7,860,001 | ||||||||||||||||||||||
| (1) | Distributions received includes both Income and Gains Distributions, if any. |
Annual Report 2016
34
Notes to Financial Statements (continued)
October 31, 2016
Diversified Income Fund
| Fund | 10/31/2015 Share Balance | Purchase Cost | Sales Cost | Realized Gain (Loss) | Distributions Received(1) | 10/31/2016 Share Balance | 10/31/2016 Market Value | |||||||||||||||||||||
Aberdeen International Equity Fund | 66,230 | $ | 50,238 | 1,026,346 | $ | (239,451 | ) | $ | 3,267 | – | $ | – | ||||||||||||||||
Aberdeen Asia Bond Fund | 114,621 | 266,444 | 293,418 | (9,461 | ) | 11,122 | 112,241 | 1,149,349 | ||||||||||||||||||||
Aberdeen Global High Income Fund | 240,442 | 229,911 | 358,276 | (43,304 | ) | 84,532 | 229,884 | 1,903,438 | ||||||||||||||||||||
Aberdeen Total Return Bond Fund | 104,678 | 64,791 | 286,477 | (7,539 | ) | 19,038 | 88,371 | 1,205,381 | ||||||||||||||||||||
Total | 611,384 | 1,964,517 | (299,755 | ) | 117,959 | 4,258,168 | ||||||||||||||||||||||
| (1) | Distributions received includes both Income and Gains Distributions, if any. |
Dynamic Allocation Fund
| Fund | 10/31/2015 Share Balance | Purchase Cost | Sales Cost | Realized Gain (Loss) | Distributions Received(1) | 10/31/2016 Share Balance | 10/31/2016 Market Value | |||||||||||||||||||||
Aberdeen International Equity Fund | 90,794 | $ | 88,896 | 1,471,180 | $ | (374,643 | ) | $ | 4,479 | – | $ | – | ||||||||||||||||
Aberdeen Emerging Markets Fund | 58,043 | 477,673 | 795,905 | (159,797 | ) | 11,504 | 42,988 | 583,774 | ||||||||||||||||||||
Aberdeen U.S. Small Cap Equity Fund | 73,323 | – | 678,798 | 124,570 | – | 44,288 | 1,335,292 | |||||||||||||||||||||
Aberdeen Asia Bond Fund | 98,613 | 424,440 | 477,762 | (12,703 | ) | 6,910 | 93,070 | 953,037 | ||||||||||||||||||||
Aberdeen Global High Income Fund | 108,342 | 52,628 | 245,869 | (49,182 | ) | 37,659 | 90,778 | 751,638 | ||||||||||||||||||||
Aberdeen Total Return Bond Fund | 121,997 | 22,393 | 106,793 | (3,330 | ) | 22,393 | 115,750 | 1,578,835 | ||||||||||||||||||||
Total | 1,066,030 | 3,776,307 | (475,085 | ) | 82,945 | 5,202,576 | ||||||||||||||||||||||
| (1) | Distributions received includes both Income and Gains Distributions, if any. |
5. Financial Highlights
The Financial Highlights of the Institutional Service Class, which was audited by other auditors whose report was unqualified, for each of the Diversified Alternatives Fund, Diversified Income Fund and Dynamic Allocation Fund prior to fiscal year end October 31, 2009 were as follows:
Diversified Alternatives Fund
| Investment Activities | Distributions | Ratios / Supplemental Data | ||||||||||||||||||||||||||||||||||||||||||||||||||||||||||
| Net Asset Value, Beginning of Period | Net Investment Income/ (Loss) | Net Realized and Unrealized Gain/(Loss) on Investments | Total from Investment Activities | Net Investment Income | Net Realized Gain/ (Loss) | Tax Return of Capital | Total Distributions | Net Asset Value, End of Period | Total Return (a)(b) | Net Assets at End of Period (000’s) | Ratio of Expenses to Average Net Assets (c) | Ratio of Net Investment Income/ (Loss) to Average Net Assets (c) | Ratio of Expenses (Prior to | Portfolio Turnover (e) | ||||||||||||||||||||||||||||||||||||||||||||||
Year Ended October 31, | $ | 15.43 | 0.62 | (5.80 | ) | (5.18 | ) | (0.86 | ) | (0.79 | ) | (0.10) | (1.75 | ) | $ | 8.50 | (37.39% | ) | $ | 3 | 0.24% | 0.70% | 0.68% | 46.75% | ||||||||||||||||||||||||||||||||||||
| (a) | Excludes sales charge. |
| (b) | Not annualized for periods less than one year. |
| (c) | Annualized for periods less than one year. |
| (d) | During the period, certain fees were waived and/or reimbursed. If such waivers/reimbursements had not occurred, the ratios would have been as indicated. |
| (e) | Portfolio turnover is calculated on the basis of the Fund as a whole without distinguishing among the classes of shares. |
| (f) | Net investment income/(loss) is based on average shares outstanding during the period. |
Amounts designated as “–” are $0 or round to $0.
2016 Annual Report
35
Notes to Financial Statements (continued)
October 31, 2016
Diversified Income Fund
| Investment Activities | Distributions | Ratios / Supplemental Data | ||||||||||||||||||||||||||||||||||||||||||||||||||||||||||
| Net Asset Value, Beginning of Period | Net Investment Income/ (Loss) | Net Realized and Unrealized Gain/(Loss) on Investments | Total from Investment Activities | Net Investment Income | Net Realized Gain/ (Loss) | Tax Return of Capital | Total Distributions | Net Asset Value, End of Period | Total Return (a)(b) | Net Assets at End of Period (000’s) | Ratio of Expenses to Average Net Assets (c) | Ratio of Net Investment Income/ (Loss) to Average Net Assets (c) | Ratio of Expenses (Prior to | Portfolio Turnover (e) | ||||||||||||||||||||||||||||||||||||||||||||||
Year Ended October 31, | $ | 13.02 | 0.34 | (3.16 | ) | (2.82 | ) | (0.68 | ) | (0.74 | ) | (0.01) | (1.43 | ) | $ | 8.77 | (24.08% | ) | $ | 1 | 0.26% | 2.56% | 0.56% | 53.11% | ||||||||||||||||||||||||||||||||||||
| (a) | Excludes sales charge. |
| (b) | Not annualized for periods less than one year. |
| (c) | Annualized for periods less than one year. |
| (d) | During the period, certain fees were waived and/or reimbursed. If such waivers/reimbursements had not occurred, the ratios would have been as indicated. |
| (e) | Portfolio turnover is calculated on the basis of the Fund as a whole without distinguishing among the classes of shares. |
| (f) | Net investment income/(loss) is based on average shares outstanding during the period. |
Amounts designated as “–” are $0 or round to $0.
Dynamic Allocation Fund
| Investment Activities | Distributions | Ratios / Supplemental Data | ||||||||||||||||||||||||||||||||||||||||||||||||||||||||||
| Net Asset Value, Beginning of Period | Net Investment Income/ (Loss) | Net Realized and Unrealized Gain/(Loss) on Investments | Total from Investment Activities | Net Investment Income | Net Realized Gain/ (Loss) | Tax Return of Capital | Total Distributions | Net Asset Value, End of Period | Total Return (a)(b) | Net Assets at End of Period (000’s) | Ratio of Expenses to Average Net Assets (c) | Ratio of Net Investment Income/ (Loss) to Average Net Assets (c) | Ratio of Expenses (Prior to Reimbursements) to Average Net Assets (c)(d) | Portfolio Turnover (e) | ||||||||||||||||||||||||||||||||||||||||||||||
Year Ended October 31, | $ | 13.86 | 0.29 | (4.15 | ) | (3.86 | ) | (0.84 | ) | (0.95 | ) | (0.05) | (1.84 | ) | $ | 8.16 | (31.66% | ) | $ | 1 | 0.25% | 1.71% | 0.71% | 44.74% | ||||||||||||||||||||||||||||||||||||
| (a) | Excludes sales charge. |
| (b) | Not annualized for periods less than one year. |
| (c) | Annualized for periods less than one year. |
| (d) | During the period, certain fees were waived and/or reimbursed. If such waivers/reimbursements had not occurred, the ratios would have been as indicated. |
| (e) | Portfolio turnover is calculated on the basis of the Fund as a whole without distinguishing among the classes of shares. |
| (f) | Net investment income/(loss) is based on average shares outstanding during the period. |
Amounts designated as “–” are $0 or round to $0.
6. Portfolio Investment Risks
| Principal | Risks of the Funds |
| a. | Affiliated Funds Risk |
The Funds’ Adviser serves as the adviser of certain Underlying Funds. It is possible that a conflict of interest among the Funds and the Underlying Funds could affect how the Funds’ Adviser fulfills its fiduciary duties to each Fund and the Underlying Funds.
| b. | Asset Allocation Risk |
Each Fund is subject to different levels and combinations of risk, based on its actual allocation among the various asset classes and Underlying Funds. Each Fund will be exposed to risks of the Underlying Funds in which it invests. The Funds will be affected by stock and bond market risks, among others. To the extent a Fund invests in Underlying Funds that expose it to non-traditional or alternative asset classes (which include investments that focus on a specialized asset class (e.g. long-short strategies), as well as specific market sectors within a broader asset class), the Fund will be exposed to the increased risk associated with those asset classes. The potential impact of the risks related to an asset class depends on the size of a Fund’s investment allocation to it.
| c. | Asset Class Variation Risk |
The Underlying Funds invest principally in the securities or investments constituting their asset class. However, under normal market conditions, an Underlying Fund may vary the percentage of its assets in these securities or investments (subject to any applicable regulatory requirements). Depending upon the percentage of securities or investments in a particular asset class held by the Underlying Funds at any
Annual Report 2016
36
Notes to Financial Statements (continued)
October 31, 2016
given time and the percentage of the Fund’s assets invested in various Underlying Funds, the Fund’s actual exposure to the securities or investments in a particular asset class may vary substantially from its allocation model for that asset class.
| d. | Derivatives Risk |
Derivatives are speculative and may hurt a Fund’s performance. Derivatives present the risk of disproportionately increased losses and/or reduced opportunities for gains when the financial asset or measure to which the derivative is linked changes in unexpected ways. The potential benefits to be derived from a Fund’s derivatives strategy are dependent upon the portfolio managers’ ability to discern pricing inefficiencies and predict trends in markets, which decisions could prove to be inaccurate. This requires different skills and techniques than predicting changes in the price of individual securities, and there can be no assurance that the use of this strategy will be successful.
Hedged Exposure Risk – Losses generated by a derivative or practice used by a Fund for hedging purposes should be offset in part by gains on the hedged investment depending on the degree of correlation between the hedging instrument and the assets hedged. However, while hedging can reduce or eliminate losses, it can also reduce or eliminate gains.
Correlation Risk – The Funds are exposed to the risk that changes in the value of a hedging instrument will not match those of the investment being hedged.
Counterparty Risk – Derivative transactions depend on the creditworthiness of the counterparty and the counterparty’s ability to fulfill its contractual obligations.
| e. | Exchange-Traded Notes Risk |
Certain Funds may invest in exchange-traded notes (ETNs). ETNs are a type of unsecured, unsubordinated debt security that have characteristics and risks similar to those of fixed income securities and trade on a major exchange similar to shares of exchange-traded funds. However, this type of debt security differs from other types of bonds and notes because ETN returns are based upon the performance of a financial asset or market index minus applicable fees, no periodic coupon payments are distributed, and no principal protections exist. The purpose of ETNs is to create a type of security that combines the aspects of both bonds and exchange-traded funds. The value of an ETN may be influenced by time to maturity, level of supply and demand for the ETN, volatility and lack of liquidity in underlying commodities or securities markets, changes in the applicable interest rates, changes in the issuer’s credit rating and economic, legal, political or geographic events that affect the referenced asset or index.
| f. | Fund of Funds Risk |
Your cost of investing in one of the Funds, as a fund of funds, may be higher than the cost of investing in a mutual fund that only invests directly in individual securities. An Underlying Fund may change its investment objective or policies without a Fund’s approval, which could force the Fund to withdraw its investment from such Underlying Fund at a time that is unfavorable to the Fund. In addition, one Underlying Fund may buy the same securities that another Underlying Fund sells. Therefore, the Fund would indirectly bear the costs of these trades without accomplishing any investment purpose.
| g. | Impact of Large Redemptions and Purchases of Fund Shares |
Occasionally, shareholders may make large redemptions or purchases of Fund shares, which may cause a Fund to have to sell securities or invest additional cash. These transactions may adversely affect a Fund’s performance and increase transaction costs. In addition, large redemption requests may exceed the cash balance of a Fund and result in credit line borrowing fees and/or overdraft charges to the Fund until the sale of portfolio securities to cover the redemption request settles. For additional information on redemptions, please see the Statement of Changes in Net Assets.
| h. | Performance Risk |
Each Fund’s investment performance is directly tied to the performance of the Underlying Funds and other investments in which the Fund invests. If one or more of the Underlying Funds fails to meet its investment objective, a Fund’s performance could be negatively affected. There can be no assurance that each Fund or any Underlying Fund will achieve its investment objective.
Principal Risks of Underlying Funds
| a. | Alternative Strategies Risk |
Certain Funds invest in Underlying Funds that involve Alternative Strategies Risk. The performance of Underlying Funds that pursue alternative strategies is linked to the performance of highly volatile alternative asset classes (e.g., commodities and currencies) and alternative strategies (e.g., managed futures). To the extent a Fund invests in such Underlying Funds, the Fund’s share price will be exposed to potentially significant fluctuations in value. In addition, Underlying Funds that employ alternative strategies have the risk that anticipated opportunities do not play out as planned, resulting in potentially substantial losses to the Underlying Fund. Furthermore, alternative
2016 Annual Report
37
Notes to Financial Statements (continued)
October 31, 2016
strategies may employ leverage, involve extensive short positions and/or focus on narrow segments of the market, which may magnify the overall risks and volatility associated with such Underlying Funds’ investments. Depending on the particular alternative strategies used by an Underlying Fund, it may be subject to risks not associated with more traditional investments. These risks may include, but are not limited to, derivatives risk, liquidity risk, credit risk, commodity risk and counterparty risk.
| b. | Commodity Risk |
The Funds may invest in Underlying Funds that involve Commodity Risk. The value of commodities may be more volatile than the value of equity securities or debt instruments and their value may be affected by changes in overall market movements, commodity index volatility, changes in interest rates, or factors affecting a particular industry or commodity. The price of a commodity may be affected by demand/supply imbalances in the market for the commodity.
| c. | Counterparty and Third Party Risk |
Transactions involving a counterparty or third party (other than the issuer of the instrument) are subject to the counterparty’s or third party’s credit risk and ability to perform in accordance with the terms of the transaction.
| d. | Credit Risk |
A debt instrument’s price depends, in part, on the credit quality of the issuer, borrower, counterparty, or underlying collateral and can decline in response to changes in the financial condition of the issuer, borrower, counterparty, or underlying collateral, or changes in specific or general market, economic, industry, political, regulatory, geopolitical, or other conditions. High yield bonds (“junk bonds”) may be subject to an increased risk of default, a more limited secondary market than investment grade bonds, and greater price volatility.
| e. | Derivatives Risk |
Derivatives can be highly volatile and involve risks in addition to the risks of the underlying security. Gains or losses from derivatives can be substantially greater than the derivatives’ original cost and can involve leverage.
| f. | Emerging Markets Risk |
Emerging market securities are subject to a magnification of the risks that apply to foreign investments; such risks are greater for securities of companies in emerging market countries because the countries may have less stable governments, more volatile currencies and less established markets (see “Foreign Securities Risk” below).
| g. | Floating Rate Loan Risk |
Floating rate loans generally are subject to restrictions on resale. Floating rate loans sometimes trade infrequently in the secondary market. As a result, valuing a floating rate loan can be more difficult and buying and selling a floating rate loan at an acceptable price can be more difficult or delayed. Difficulty in selling a floating rate loan can result in a loss. In addition, a floating rate loan may not be fully collateralized which may cause the floating rate loan to decline significantly in value.
| h. | Foreign Currency Exposure Risk |
The value of foreign currencies relative to the U.S. Dollar fluctuates in response to market, economic, political, regulatory, geopolitical or other conditions. A decline in the value of a foreign currency versus the U.S. Dollar reduces the value in U.S. Dollars of investments denominated in that foreign currency. This risk may impact a Fund more greatly to the extent the Underlying Fund does not hedge its currency risk, or hedging techniques used by the Underlying Fund are unsuccessful.
| i. | Foreign Securities Risk |
Foreign securities may be more volatile, harder to price and less liquid than U.S. securities. They are subject to different accounting and regulatory standards, and political and economic risks.
| j. | High-Yield Bond and Other Lower-Rated Securities Risk |
An Underlying Fund’s investments in high-yield bonds (commonly referred to as “junk bonds”) and other lower-rated securities will subject the Underlying Fund to substantial risk of loss. Investments in high-yield bonds are speculative and issuers of these securities are generally considered to be less financially secure and less able to repay interest and principal than issuers of investment-grade securities. Prices of high-yield bonds tend to be very volatile. These securities are less liquid than investment-grade debt securities and may be difficult to price or sell, particularly in times of negative sentiment toward high-yield securities.
| k. | Illiquid Securities Risk |
The Funds may invest in Underlying Funds that hold illiquid securities. Illiquid securities are assets which may not be sold or disposed of in the ordinary course of business within seven days at approximately the price at which the Underlying Fund has valued the investment on its books and may include such securities as those not registered under U.S. securities laws or securities that cannot be sold in public
Annual Report 2016
38
Notes to Financial Statements (continued)
October 31, 2016
transactions. An inability to sell a portfolio position can adversely affect the Underlying Fund’s value or prevent the Underlying Fund from being able to take advantage of other investment opportunities. Illiquid securities and relatively less liquid securities may also be difficult to value. Over recent years, the capacity of dealers to make markets in fixed income securities have been outpaced by the growth in the size of the fixed income markets. Liquidity risk may be magnified in a rising interest rate environment or when investor redemptions from fixed income funds may be higher than normal, due to the increased supply in the market that would result from selling activity.
| l. | Impact of Large Redemptions and Purchases of Underlying Fund Shares |
Occasionally, shareholders of an Underlying Fund may make large redemptions or purchases of the Underlying Fund’s shares, which may cause the Underlying Fund to have to sell securities or invest additional cash. These transactions may adversely affect the Underlying Fund’s performance and increase transaction costs to Underlying Fund shareholders, including the Fund. In addition, large redemption requests may exceed the cash balance of the Underlying Fund and result in credit line borrowing fees and/or overdraft charges to the Underlying Fund until the sale of portfolio securities to cover the redemption request settles. For additional information on redemptions, please see the Statement of Changes in Net Assets.
| m. | Interest Rate Risk |
Certain Funds invest in underlying Funds that involve interest rate risk. Fixed income investments are subject to interest rate risk, which generally causes the value of a fixed income portfolio to decrease when interest rates rise resulting in a decrease in the Underlying Fund’s, and possibly a Fund’s, net assets. An Underlying Fund may be subject to a greater risk of rising interest rates due to the current period of historically low rates and the effect of potential government fiscal policy initiatives and resulting market reaction to those initiatives. Interest rate fluctuations tend to have a greater impact on fixed income securities with a greater time to maturity and/or lower coupon. In periods of market volatility, the market values of fixed income securities may be more sensitive to changes in interest rates.
| n. | Market Risk |
Deteriorating market conditions might cause a general weakness in the market that reduces the prices of securities in that market in which an Underlying Fund invests.
| o. | Mid-Cap Securities Risk |
A Fund may invest in Underlying Funds that hold mid-cap securities. Stocks of medium-sized companies tend to be more volatile and less liquid than stocks of larger companies.
| p. | REIT and Real Estate Risk |
The Funds may invest in Underlying Funds that are subject to REIT and Real Estate Risk. Investment in REITs and real estate involves the risks that are associated with direct ownership of real estate and with the real estate industry in general. These risks include risks related to general, regional and local economic conditions; fluctuations in interest rates; property tax rates, zoning laws, environmental regulations and other governmental action; cash flow dependency; increased operating expenses; lack of availability of mortgage funds; losses due to natural disasters; changes in property values and rental rates; and other factors.
| q. | Sector Risk |
At times, a Fund may have a significant portion of its assets invested in Underlying Funds that invest primarily in securities of companies conducting business in a broadly related group of industries within an economic sector. Companies in the same economic sector may be similarly affected by economic or market events, making a Fund more vulnerable to unfavorable developments in that economic sector than funds that invest more broadly.
| r. | Short Sale Risk |
The Funds may invest in Underlying Funds that sell securities short. Short Sale risk is the risk that the price of a security sold short will increase in value between the time of the short sale and the time the Underlying Fund must purchase the security to return it to the lender. The Underlying Fund’s potential loss on a short sale could theoretically be unlimited in a case where the Underlying Fund is unable, for whatever reason, to close out its short position.
| s. | Small-Cap Securities Risk |
The Funds may invest in Underlying Funds that hold small-cap securities. Stocks of smaller companies are usually less stable in price and less liquid than larger, more established companies. Therefore, they generally involve greater risk. If the value of the Funds’ investment decrease, you may lose money.
Please read the prospectus for more detailed information regarding these and other risks.
2016 Annual Report
39
Notes to Financial Statements (continued)
October 31, 2016
7. Contingencies
In the normal course of business, the Funds may provide general indemnifications pursuant to certain contracts and organizational documents. The Funds’ maximum exposure under these arrangements is dependent on future claims that may be made against the Funds, and therefore, cannot be estimated; however, based on experience, the risk of loss from such claims is considered remote.
8. Tax Information
As of October 31, 2016, the tax cost of securities and the breakdown of unrealized appreciation/(depreciation) for each Fund were as follows:
| Tax Cost of Securities | Unrealized Appreciation | Unrealized Depreciation | Net Unrealized Appreciation/ (Depreciation) | |||||||||||||
Diversified Alternatives Fund | $ | 60,931,150 | $ | 743,698 | $ | (2,445,835 | ) | $ | (1,702,137 | ) | ||||||
Diversified Income Fund | 19,250,037 | 353,280 | (438,526 | ) | (85,246 | ) | ||||||||||
Dynamic Allocation Fund | 18,652,422 | 676,748 | (405,132 | ) | 271,616 | |||||||||||
The tax character of distributions paid during the fiscal year ended October 31, 2016 was as follows (total distributions paid may differ from the Statements of Changes in Net Assets because for tax purposes dividends are recognized when actually paid):
| Distributions paid from | ||||||||||||||||||||||||
| Fund | Ordinary Income* | Net Long Term Capital Gains* | Total Taxable Distributions | Tax Exempt Distributions | Return of Capital | Total Distributions Paid | ||||||||||||||||||
Diversified Alternatives Fund | $ | 1,457,493 | $ | – | $ | 1,457,493 | $ | – | $ | – | $ | 1,457,493 | ||||||||||||
Diversified Income Fund | 488,373 | 186,533 | 674,906 | – | – | 674,906 | ||||||||||||||||||
Dynamic Allocation Fund | 355,975 | 25,020 | 380,995 | – | – | 380,995 | ||||||||||||||||||
Amounts listed as “–” are $0 or round to $0.
The tax character of distributions paid during the fiscal year ended October 31, 2015 was as follows (total distributions paid may differ from the Statements of Changes in Net Assets because for tax purposes dividends are recognized when actually paid):
| Distributions paid from | ||||||||||||||||||||||||
| Fund | Ordinary Income* | Net Long Term Capital Gains* | Total Taxable Distributions | Tax Exempt Distributions | Return of Capital | Total Distributions Paid | ||||||||||||||||||
Diversified Alternatives Fund | $ | 2,852,510 | $ | – | $ | 2,852,510 | $ | – | $ | – | $ | 2,852,510 | ||||||||||||
Diversified Income Fund | 651,093 | 1,184,632 | 1,835,725 | – | – | 1,835,725 | ||||||||||||||||||
Dynamic Allocation Fund | 545,826 | – | 545,826 | – | – | 545,826 | ||||||||||||||||||
Amounts listed as “–” are $0 or round to $0.
Annual Report 2016
40
Notes to Financial Statements (continued)
October 31, 2016
As of October 31, 2016, the components of accumulated earnings/(deficit) on a tax basis were as follows:
| Fund | Undistributed Tax Exempt Income | Undistributed Ordinary Income | Undistributed Long-Term Capital Gains | Accumulated Earnings | Distributions Payable | Late Year Ordinary and Post- October Capital Loss Deferrals | Other Temporary Differences | Unrealized Appreciation/ (Depreciation)* | Accumulated Capital and Other Losses** | Total Accumulated Earnings/ (Deficit) | ||||||||||||||||||||||||||||||
Diversified Alternatives Fund | $ | – | $ | 40,312 | $ | – | $ | – | $ | – | $ | – | $ | – | $ | (1,702,137 | ) | $ | (24,401,345 | ) | $ | (26,063,170 | ) | |||||||||||||||||
Diversified Income Fund | – | 64,671 | – | – | – | – | – | (85,242 | ) | (519,908 | ) | (540,479 | ) | |||||||||||||||||||||||||||
Dynamic Allocation Fund | – | 47,602 | – | – | – | – | – | 271,616 | (1,117,511 | ) | (798,293 | ) | ||||||||||||||||||||||||||||
| * | The difference between the book-basis and tax-basis unrealized appreciation/(depreciation) is attributable primarily to tax deferral of losses on wash sales. |
| ** | As of October 31, 2016, for Federal income tax purposes, the following Funds have capital loss carryforwards available to offset capital gains, if any, to the extent provided by the Treasury regulations, which expire in the years set forth below. |
Amounts listed as “–” are $0 or round to $0.
| Fund | Amount | Expires | ||||
Diversified Alternatives Fund | $ | 10,674,825 | 2017 (Short-Term) | |||
Diversified Alternatives Fund | 6,953,184 | 2018 (Short-Term) | ||||
Diversified Alternatives Fund | 1,084,237 | 2019 (Short-Term) | ||||
Diversified Alternatives Fund | 4,724,046 | Unlimited (Short-Term) | ||||
Diversified Alternatives Fund | 965,053 | Unlimited (Long-Term) | ||||
Diversified Income Fund | 50,215 | Unlimited (Short-Term) | ||||
Diversified Income Fund | 469,693 | Unlimited (Long-Term) | ||||
Dynamic Allocation Fund | 468,980 | 2017 (Short-Term) | ||||
Dynamic Allocation Fund | 144,109 | 2018 (Short-Term) | ||||
Dynamic Allocation Fund | 303,780 | Unlimited (Short-Term) | ||||
Dynamic Allocation Fund | 200,642 | Unlimited (Long-Term) | ||||
Under the Regulated Investment Company Modernization Act of 2010, the Funds are permitted to carry forward capital losses incurred in taxable years beginning after December 22, 2010 for an unlimited period. However, any losses incurred during those taxable years will be required to be utilized prior to the losses incurred in pre-enactment taxable years. As a result of this ordering rule, pre-enactment capital loss carryforwards may be more likely to expire unused. Additionally, post-enactment capital losses that are carried forward will retain their character as either short-term or long-term capital losses rather than being considered all short-term as under previous law.
GAAP requires that certain components of net assets be adjusted to reflect permanent differences between financial and tax reporting. Accordingly, the table below details the necessary reclassifications, which are a result of permanent differences primarily attributable to capital gains distribution reclassification, non-taxable dividend adjustment, taxable dividend adjustment, distribution re-designations and litigation. These reclassifications have no effect on net assets or net asset values per share.
| Fund | Accumulated Net Investment Income/(Loss) | Accumulated Net Realized Gain/(Loss) | ||||||
Diversified Alternatives Fund | $ | 197,234 | $ | (197,234 | ) | |||
Diversified Income Fund | (16,031 | ) | 16,031 | |||||
Dynamic Allocation Fund | 39,580 | (39,580 | ) | |||||
2016 Annual Report
41
Notes to Financial Statements (concluded)
October 31, 2016
9. Significant Shareholders
As of October 31, 2016, the following Funds had shareholders with the percentage ownership indicated, which are considered significant shareholders (holdings greater than 5.0%) for financial reporting purposes:
| Fund | Record Ownership % | Number of Account Owners | ||||
Diversified Alternatives Fund | 37.8 | % | 4 | |||
Diversified Income Fund | 54.6 | 4 | ||||
Dynamic Allocation Fund | 35.5 | 3 | ||||
10. Line of Credit
The Trust, on behalf of each of the funds of the Trust (the “Borrowers”), has entered into an agreement (the “Agreement”) with State Street Bank and Trust Company (the “Bank”), subject to annual renewal. The Agreement provides for a revolving credit facility (the “Credit Facility”) for the amount of $250,000,000 to be utilized for temporary or emergency purposes to fund shareholder redemptions or other short-term liquidity purposes.
Principal on each outstanding loan made under the Agreement bears interest at a variable rate per annum equal to the higher of (a) the Federal Funds Rate as in effect of that day (not less than zero) plus 1.25% or (b) the One-Month London Interbank Offered Rate as in effect on that day (not less than zero) plus 1.25%. In addition, effective August 12, 2016, the Borrowers shall pay to the Bank a commitment fee at the rate of 0.22% per annum on the daily unused portion of the Credit Facility, as applicable, which is allocated among the Borrowers in such manner as is determined by the Board to be reasonable. During the period November 1, 2015 to August 11, 2016, the commitment fee rate was 0.18%, per annum. For each Fund that borrowed under the Credit Facility during the fiscal year, the following table shows the average outstanding daily balance for the Fund under the Credit Facility and the average weighted interest rate paid by the Fund during the fiscal year.
| Average Outstanding Daily Balance | Average Weighted Interest Rate | Days Utilized | ||||||||||
Diversified Alternatives Fund | $ | 6,125,000 | 1.66 | % | 2 | |||||||
11. Subsequent Events
Management has evaluated the need for disclosures and/or adjustments resulting from subsequent events through the date the financial statements were issued. Based on this evaluation, no disclosures and/or adjustments were required to the financial statements as of October 31, 2016.
Annual Report 2016
42
Report of Independent Registered Public Accounting Firm
The Board of Trustees and Shareholders of Aberdeen Funds:
We have audited the accompanying statements of assets and liabilities, including the statements of investments, of the Aberdeen Diversified Alternatives Fund, Aberdeen Diversified Income Fund, and Aberdeen Dynamic Allocation Fund, three of the funds comprising Aberdeen Funds (the “Funds”), as of October 31, 2016, and the related statements of operations for the year then ended, the statements of changes in net assets for each of the years in the two-year period then ended and the financial highlights for each of the years or periods in the five-year period then ended. These financial statements and financial highlights are the responsibility of the Funds’ management. Our responsibility is to express an opinion on these financial statements and financial highlights based on our audits.
We conducted our audits in accordance with the standards of the Public Company Accounting Oversight Board (United States). Those standards require that we plan and perform the audit to obtain reasonable assurance about whether the financial statements and financial highlights are free of material misstatement. An audit includes examining, on a test basis, evidence supporting the amounts and disclosures in the financial statements. Our procedures included confirmation of securities owned as of October 31, 2016, by correspondence with the custodian, brokers and transfer agent of the underlying funds or other appropriate auditing procedures. An audit also includes assessing the accounting principles used and significant estimates made by management, as well as evaluating the overall financial statement presentation. We believe that our audits provide a reasonable basis for our opinion.
In our opinion, the financial statements and financial highlights referred to above present fairly, in all material respects, the financial position of the Funds as of October 31, 2016, the results of their operations for the year then ended, the changes in their net assets for each of the years in the two-year period then ended and the financial highlights for each of the years or periods in the five-year period then ended, in conformity with U.S. generally accepted accounting principles.

Philadelphia, Pennsylvania
December 29, 2016
2016 Annual Report
43
Other Tax Information (Unaudited)
For the period ended October 31, 2016, certain dividends paid by the Funds may be subject to a maximum tax rate of 15% as provided for by the Jobs and Growth Tax Relief Reconciliation Act of 2003. The Funds intend to designate the maximum amount allowable as taxed at a maximum rate of 15%. Complete information will be reported in conjunction with your 2016 Form 1099-DIV.
For the year ended October 31, 2016, the following Funds paid qualified dividend income:
| Fund | Qualified Dividend Income | |||
Diversified Alternatives Fund | 21.36% | |||
Diversified Income Fund | 55.52% | |||
Dynamic Allocation Fund | 48.51% | |||
For the taxable year ended October 31, 2016, the following percentage of income dividends paid by the Funds qualify for the dividends received deduction available to corporate shareholders:
| Fund | Dividend Received Deduction | |||
Diversified Alternatives Fund | 7.71% | |||
Diversified Income Fund | 32.92% | |||
Dynamic Allocation Fund | 21.80% | |||
During the year ended October 31, 2016, the following Funds designated dividends as long-term capital gains:
| Fund | Amount | |||
Diversified Income Fund | $ | 186,533 | ||
Dynamic Allocation Fund | 25,020 | |||
Annual Report 2016
44
Shareholder Expense Examples (Unaudited)
As a shareholder of the Aberdeen Funds, you incur two types of costs: (1)��transaction costs, including sales charges (loads) paid on purchase payments and (2) ongoing costs, including investment advisory fees, administration fees, transfer agent out-of-pocket expenses, distribution fees and other Fund expenses. The examples below are intended to help you understand your ongoing costs (in dollars) of investing in the Aberdeen Funds and to compare these costs with the ongoing costs of investing in other mutual funds.
The examples assume that you had a $1,000 investment in the Class at the beginning of the reporting period, May 1, 2016 and continued to hold your shares at the end of the reporting period, October 31, 2016.
Actual Expenses
The table below provides information about actual account values and actual expenses. You may use the information together with the amount you invested, to estimate the expenses that you paid over the period. Simply divide your account value by $1,000 (for example, an $8,600 account value divided by $1,000 = 8.6), then multiply the result by the number under the heading entitled “Actual Expenses Paid During Period” for the class of a Fund that you own to estimate the expenses you paid on your account during the period.
Hypothetical Example for Comparison Purposes
The table below provides information about hypothetical account values and hypothetical expenses based on the Class’ actual expense ratio and an assumed rate of return of 5% per year before expenses, which is not the Class’ actual return. The hypothetical account values and expenses may not be used to estimate the actual ending account balance or expenses you paid for the period. You may use this information to compare the ongoing costs of investing in the Class of a Fund and other funds. To do so, compare the 5% hypothetical example with the 5% hypothetical examples that appear in the shareholder reports of the other funds.
Please note that the expenses shown in the table are meant to highlight your ongoing costs only and do not reflect any transaction costs, such as sales charges (loads). Therefore, the information for each Class in the table is useful in comparing ongoing costs only, and will not help you determine the relative total costs of owning different funds. In addition, if these transaction costs were included, your costs would have been higher. The examples also assume all dividends and distributions have been reinvested.
| Beginning Account Value, May 1, 2016 | Actual Ending Account Value, October 31, 2016 | Hypothetical Ending Account Value | Actual Expenses Paid During Period*+ | Hypothetical Expenses Paid During Period*+1 | Annualized Expense Ratio** | |||||||||||||||||||||
Diversified Alternatives Fund | Class A | $ | 1,000.00 | $ | 1,008.30 | $ | 1,022.02 | $ | 3.13 | $ | 3.15 | 0.62% | ||||||||||||||
Class C | $ | 1,000.00 | $ | 1,005.10 | $ | 1,018.85 | $ | 6.30 | $ | 6.34 | 1.25% | |||||||||||||||
Class R | $ | 1,000.00 | $ | 1,006.60 | $ | 1,020.31 | $ | 4.84 | $ | 4.88 | 0.96% | |||||||||||||||
Institutional Service Class | $ | 1,000.00 | $ | 1,009.60 | $ | 1,023.38 | $ | 1.77 | $ | 1.78 | 0.35% | |||||||||||||||
Institutional Class | $ | 1,000.00 | $ | 1,010.80 | $ | 1,023.88 | $ | 1.26 | $ | 1.27 | 0.25% | |||||||||||||||
Diversified Income Fund | Class A | $ | 1,000.00 | $ | 1,034.70 | $ | 1,022.32 | $ | 2.86 | $ | 2.85 | 0.56% | ||||||||||||||
Class C | $ | 1,000.00 | $ | 1,030.70 | $ | 1,018.85 | $ | 6.38 | $ | 6.34 | 1.25% | |||||||||||||||
Class R | $ | 1,000.00 | $ | 1,032.70 | $ | 1,021.01 | $ | 4.19 | $ | 4.17 | 0.82% | |||||||||||||||
Institutional Service Class | $ | 1,000.00 | $ | 1,035.90 | $ | 1,023.88 | $ | 1.28 | $ | 1.27 | 0.25% | |||||||||||||||
Institutional Class | $ | 1,000.00 | $ | 1,036.20 | $ | 1,023.88 | $ | 1.28 | $ | 1.27 | 0.25% | |||||||||||||||
Dynamic Allocation Fund | Class A | $ | 1,000.00 | $ | 1,025.30 | $ | 1,022.27 | $ | 2.90 | $ | 2.90 | 0.57% | ||||||||||||||
Class C | $ | 1,000.00 | $ | 1,021.50 | $ | 1,018.85 | $ | 6.35 | $ | 6.34 | 1.25% | |||||||||||||||
Class R | $ | 1,000.00 | $ | 1,023.50 | $ | 1,020.51 | $ | 4.68 | $ | 4.67 | 0.92% | |||||||||||||||
Institutional Service Class | $ | 1,000.00 | $ | 1,026.70 | $ | 1,023.88 | $ | 1.27 | $ | 1.27 | 0.25% | |||||||||||||||
Institutional Class | $ | 1,000.00 | $ | 1,026.70 | $ | 1,023.88 | $ | 1.27 | $ | 1.27 | 0.25% | |||||||||||||||
| * | Expenses are equal to the Fund’s annualized expense ratio multiplied by the average account value over the period multiplied by 184/366 (to reflect the one-half year period). |
| ** | The expense ratio presented represents a six-month, annualized ratio. |
| + | Expenses are based on the direct expenses of the Fund and do not include the effect of the Underlying Funds’ expenses, which are disclosed in the Fee and expense table and described more fully in a footnote to that table in your Fund Prospectus. |
| 1 | Represents the hypothetical 5% return before expenses. |
2016 Annual Report
45
Board of Trustees’ Consideration of Advisory Agreement
At an in-person meeting of the Board of Trustees (the “Board” or the “Trustees”) of the Aberdeen Funds (the “Trust”) held on June 15, 2016, the Board, including a majority of the Trustees who are not considered to be “interested persons” of the Trust (the “Independent Trustees”) under the Investment Company Act of 1940, as amended (the “1940 Act”), approved for an annual period the continuation of the Trust’s advisory agreement (the “Agreement”) with Aberdeen Asset Management Inc. (“AAMI” or the “Adviser”) for each of the following series of the Trust: Aberdeen Diversified Alternatives Fund, Aberdeen Diversified Income Fund and Aberdeen Dynamic Allocation Fund, (each a “Fund,” and collectively the “Funds”).
In connection with contract review meetings, the Board reviews a variety of information provided by the Adviser relating to the Funds, the Agreement and the Adviser, including comparative performance, fee and expense information and other information regarding the nature, extent and quality of services provided by the Adviser under the Agreement. The materials provided to the Board generally included, among other items: (i) information on the investment performance of the Funds and the performance of peer groups of funds and the Funds’ performance benchmarks; (ii) information on the Funds’ advisory fees and other expenses, including information comparing each Fund’s expenses to those of a peer group of funds and information about any applicable expense limitations and fee “breakpoints”; (iii) sales and redemption data with respect to each Fund; (iv) information about the profitability of the Agreement to the Adviser; (v) a report prepared by the Adviser in response to a request submitted by the Independent Trustees’ independent legal counsel on behalf of such Trustees; and (vi) a memorandum from the Independent Trustees’ independent legal counsel on the responsibilities of the Board in considering for approval the investment advisory arrangements under the 1940 Act and Delaware law. The Board, including the Independent Trustees, also considers other matters such as: (i) the Adviser’s financial results and financial condition; (ii) each Fund’s investment objective and strategies; (iii) the Adviser’s investment personnel and operations; (iv) arrangements relating to the distribution of the Funds’ shares and the related costs; (v) the procedures employed to determine the value of the Funds’ assets; (vi) the allocation of the Funds’ brokerage, if any, including, if applicable, allocations to brokers affiliated with the Adviser and the use, if any, of “soft” commission dollars to pay Fund expenses and to pay for research and other similar services; (vii) the resources devoted to, and the record of compliance with, the Funds’ investment policies and restrictions, policies on personal securities transactions and other compliance policies; and (viii) possible conflicts of interest. The Board also considers the nature, extent and quality of the services provided to the Funds by AAMI’s affiliates. Throughout the process, the Trustees are afforded the opportunity to ask questions of and request additional materials from the Adviser.
In addition to the materials requested by the Trustees in connection with their annual consideration of the continuation of the Agreement, the Trustees receive materials in advance of each regular quarterly meeting of the Board that provide information relating to the services provided by the Adviser, including detailed information about the Funds’ investment performance. This information generally includes, among other things, third-party performance rankings for various periods (including prior to the Adviser’s management of the Funds, to the extent applicable) comparing each Fund against its peer group, total return information for various periods, and details of sales and redemptions of Fund shares for the period. The Board also receives periodic presentations from the portfolio management teams in connection with the performance of the Funds.
The Independent Trustees were advised by separate independent legal counsel throughout the process. The Independent Trustees also consulted in executive sessions with counsel to the Independent Trustees regarding consideration of the renewal of the Agreement. In considering whether to approve the continuation of the Agreement, the Board of Trustees, including the Independent Trustees, did not identify any single factor as determinative. Individual Trustees may have evaluated the information presented differently from one another, giving different weights to various factors. Matters considered by the Trustees, including the Independent Trustees, in connection with their approval of the continuation of the Agreement included the factors listed below.
The nature, extent and quality of the services provided to the Funds under the Agreement. The Trustees considered the nature, extent and quality of the services provided by AAMI to the Funds and the resources dedicated to the Funds by AAMI and its affiliates. The Board considered, among other things, the Adviser’s investment experience. The Board also considered the background and experience of the Adviser’s senior management personnel and the qualifications, background and responsibilities of the portfolio managers that are primarily responsible for the day-to-day portfolio management services for the Funds. The Trustees considered not only the advisory services provided by AAMI to the Funds, but also the administrative services provided by AAMI to the Funds under a separate administration agreement. AAMI’s role in coordinating the activities of the Trust’s other service providers was also considered. The Board also considered that it receives information on a regular basis from the Trust’s Chief Compliance Officer regarding the Adviser’s compliance policies and procedures. The Board also considered the Adviser’s risk management processes. The Board was also mindful of the Advisers’ focus on the monitoring of the performance of the Funds and in addressing performance matters. The Trustees also considered the benefits to shareholders of investing in a mutual fund that is part of a family of funds that offers shareholders the right to exchange shares of one type of fund for shares of another type of fund, and provides a variety of fund and shareholder
Annual Report 2016
46
Supplemental Information (continued)
services. The Board also took into account its knowledge of management and the quality of the performance of management’s duties through Board meetings, discussion and reports during the preceding year.
After reviewing these and related factors, the Board concluded that the nature, extent and quality of the services provided were extensive in nature and of high quality and supported the renewal of the Agreement.
Investment performance of the Funds and the Adviser. The Trustees received information about the performance of the Funds over various time periods, including information which compared the performance of the Funds to the performance of peer groups of funds and each Fund’s performance benchmark. The Trustees also considered the performance of the Funds compared to the performance of comparable funds or accounts managed by AAMI and its affiliates to the extent available. In addition, the Trustees also reviewed data prepared by an independent third party which analyzed the performance of the Funds using a variety of performance metrics.
The Trustees also considered AAMI’s performance and reputation generally, the performance of the fund family generally, the historical responsiveness of AAMI to Trustee concerns about performance and the willingness of AAMI to take steps intended to improve performance. The Trustees also considered the performance of the Adviser since it commenced management of the Funds.
Based on these factors, the Board determined that the Adviser is an appropriate investment adviser for the Funds.
The Board further noted that it will continue to monitor the Funds’ performance and any actions taken by AAMI and its affiliates relating to performance.
The costs of the services provided and profits realized by the Adviser and its affiliates from their relationships with the Funds. The Trustees considered the fees charged to the Funds for advisory services as well as the total expense levels of the Funds. This information included comparisons (provided both by management and also by an independent third party) of each Fund’s net management fee and total expense level to those of its expense peer group and information about the advisory fees charged by AAMI to any separately managed accounts with a similar strategy. In comparing each Fund’s net management fee to that of comparable funds, the Board noted that such fee includes both advisory and administrative fees. In considering the fees charged to any comparable accounts, the Trustees considered, among other things, management’s discussion of the different objectives, policies or restrictions that may be involved in managing the different types of accounts. In evaluating the Funds’ advisory fees, the Trustees also took into account the demands, complexity and quality of the investment management of the Funds.
The Board considered that AAMI had entered into expense limitation agreements with the Funds, pursuant to which AAMI agreed to waive a portion of its advisory fee and/or reimburse certain expenses as a means of limiting each Fund’s total annual operating expenses for a period of time.
The Trustees also considered the compensation directly or indirectly received by AAMI and its affiliates from their relationships with the Funds. The Trustees reviewed information provided by management as to the profitability of AAMI and its affiliates’ relationships with the Funds, such as the engagement of affiliates of AAMI to provide distribution and administrative services to the Funds. The Trustees also examined the profitability of AAMI and its affiliates on a Fund-by-Fund basis. The Trustees also considered information about the allocation of expenses used to calculate profitability. When reviewing profitability, the Trustees also considered information about court cases regarding adviser profitability, the performance of the Funds, the expense levels of the Funds, and whether AAMI had implemented breakpoints and expense limitations with respect to the Funds.
After reviewing these and related factors, including taking into account management’s discussion regarding Fund expenses, the Board concluded that the advisory fee was fair and reasonable, and that the costs of these services generally and the related profitability of AAMI and its affiliates from their relationships with the Funds were reasonable and supported the renewal of the Agreement.
Economies of Scale. The Trustees considered the existence of any economies of scale in the provision of services by AAMI and whether those economies would be shared with the Funds through breakpoints in the investment advisory fees or other means, such as expense waivers or limitations. The Trustees noted that each of the Funds was subject to an expense limitation. The Board noted management’s discussion of the Funds’ advisory fee structure. The Trustees also took note of the costs of the services provided and the profitability to AAMI and its affiliates from their relationships with the Funds, as discussed above. The Board also considered the potential effect of each Fund’s growth and size on fees, noting that if a Fund’s assets increase over time, the Fund may realize other economies of scale if assets increase proportionally more than certain expenses.
After reviewing these and related factors, the Board concluded that the advisory fees were reasonable and supported the renewal of the Agreement.
2016 Annual Report
47
Supplemental Information (concluded)
The Trustees also considered other factors, which included but were not limited to the following:
| • | the effect of any market and economic volatility on the performance, asset levels and expense ratios of the Funds. |
| • | whether the Funds have operated in accordance with their investment objectives and the Funds’ record of compliance with their investment restrictions, and the compliance programs of the Trust and AAMI. The Trustees also considered the compliance-related resources AAMI and its affiliates were providing to the Funds. |
| • | the nature, quality, cost and extent of administrative services performed by AAMI under the Advisory Agreement and under a separate agreement covering administrative services. |
| • | so-called “fallout benefits” to AAMI, such as the benefits of research made available to AAMI by reason of brokerage commissions generated by the Funds’ securities transactions or reputational and other indirect benefits. The Trustees considered any possible conflicts of interest associated with these fallout and other benefits, and the reporting, disclosure and other processes in place to disclose and monitor such possible conflicts of interest. |
* * *
Based on their evaluation of all factors that they deemed to be material, including those factors described above, and assisted by the advice of independent counsel, the Trustees, including the Independent Trustees, concluded that renewal of the Agreement would be in the best interest of each of the Funds and its shareholders. Accordingly, the Board, and the Independent Trustees voting separately, approved the Agreement for an additional one-year period.
Annual Report 2016
48
Management of the Funds (Unaudited)
As of October 31, 2016
| Name, Address, and Year of Birth | Position(s) Held, Length of Time Served and Term of Office* | Principal Occupation During Past 5 Years | Number of Portfolios in Fund Complex Overseen by Trustee** | Other Directorships Held by Trustee During Past 5 Years*** | ||||
Trustees who are not Interested Persons (as defined in the 1940 Act) of the Trust (“Independent Trustees”) | ||||||||
P. Gerald Malone**** Year of Birth: 1950 | Trustee since December 2007 Chairman of the Board | Mr. Malone is, by profession, a solicitor of some 40 years standing. He has served as a Minister of State in the United Kingdom Government. Mr. Malone currently serves as Independent Chairman of two UK companies, Crescent OTC Ltd (pharmaceutical services) and fluidOil Ltd. (oil services). He also serves as a director of US company Rejuvenan llc (wellbeing services). He previously served as chairman of Ultrasis plc (healthcare software services company) until October 2014. He is Chairman of the Board of Trustees of Aberdeen Funds, Chairman of the Board of Directors of Aberdeen Global Income Fund, Inc. and Aberdeen Asia-Pacific Income Fund, Inc. and serves on the boards of Aberdeen Australia Equity Fund, Inc. and Aberdeen Asia-Pacific Income Investment Company Limited. | 23 | None. | ||||
Richard H. McCoy**** Year of Birth: 1942 | Trustee since December 2007 | Prior to retiring in 2003, Mr. McCoy was Vice-Chairman, Investment Banking, at TD Securities Inc. He is currently a Director of Uranium Participation Corp. and Pizza Pizza Royalty Corp. and Chair of Chorus Aviation Inc. Mr. McCoy has also been Chairman of Aberdeen Asia-Pacific Income Investment Company Limited since 2010. | 20 | None. | ||||
Neville J. Miles**** Year of Birth: 1946 | Trustee since December 2011 | Mr. Miles is, and has been for over ten years, Chairman of Ballyshaw Pty. Ltd. (share trading, real estate development and investment). He is Chairman of the Board of Directors of Aberdeen Australia Equity Fund, Inc. He also is a non-executive director of a number of Australian and overseas companies. | 22 | None. | ||||
Rahn K. Porter**** Year of Birth: 1954 | Trustee since September 2016 | Mr. Porter has been the Chief Financial and Administrative Officer of The Colorado Health Foundation since 2013, and was the Interim Chief Executive Officer of The Colorado Health Foundation from 2014 to 2015. Previously, he was Senior Vice President and Treasurer, Qwest Communications International Inc. (telecommunications) from 2008 to 2011. Mr. Porter serves on the boards of Aberdeen Singapore Fund, Inc. and Aberdeen Japan Equity Fund, Inc. | 21 | Director, CenturyLink Asset Management Company, since 2006; Director, BlackRidge Financial Inc., since March, 2005. | ||||
2016 Annual Report
49
Management of the Funds (Unaudited) (continued)
As of October 31, 2016
| Name, Address, and Year of Birth | Position(s) Held, Length of Time Served and Term of Office* | Principal Occupation During Past 5 Years | Number of Portfolios in Fund Complex Overseen by Trustee** | Other Directorships Held by Trustee During Past 5 Years*** | ||||
Steven N. Rappaport**** Year of Birth: 1948 | Trustee since September 2016 | Mr. Rappaport has been a Partner of Lehigh Court, LLC (private investment firm) and RZ Capital LLC (private investment firm) since 2004. Mr. Rappaport serves on the boards of Aberdeen Indonesia Fund, Inc., Aberdeen Israel Fund, Inc., Aberdeen Latin America Equity Fund, Inc., Aberdeen Chile Fund, Inc. and Aberdeen Emerging Markets Smaller Company Opportunities Fund, Inc. | 24 | Director of iCAD, Inc., since 2006; Director of Credit Suisse Funds (9) since 1999; Director of Credit Suisse Asset Management Income Fund, Inc. since 2005 and Director of Credit Suisse High Yield Bond Fund, Inc. since 2005. | ||||
Peter D. Sacks**** Year of Birth: 1945 | Trustee since December 2007 | Mr. Sacks was a Director and Founding Partner of Toron AMI International Asset Management (investment management) from 1988 to 2015. He is currently a Director of Aberdeen Asia-Pacific Income Fund Inc., Aberdeen Global Income Fund Inc., Aberdeen Australia Equity Fund Inc. and Tricon Capital Group Inc. | 22 | None. | ||||
John T. Sheehy**** Year of Birth: 1942 | Trustee since December 2007 | Mr. Sheehy has been a Senior Managing Director of B.V. Murray and Company (investment banking) since 2001 and Director of Macquarie AIR-serv Holding, Inc. (automotive services) from 2006 to 2013. He was a Managing Member of Pristina Capital Partners, LLC (water purification technology development) from 2007 to 2011 and a Director of Smarte Carte, Inc. (airport services) from 2007 to 2010. | 23 | None. | ||||
Warren C. Smith**** Year of Birth: 1955 | Trustee since December 2007 | Mr. Smith has been a founding partner of MRB Partners Inc. (independent investment research and consultancy firm) since 2010. Mr. Smith was a Managing Editor with The Bank Credit Analyst Research Group (independent publishers of financial market research and publications, including The Bank Credit Analyst) from 1982 to 2009. | 20 | None. |
Annual Report 2016
50
Management of the Funds (Unaudited) (continued)
As of October 31, 2016
| Name, Address, and Year of Birth | Position(s) Held, Length of Time Served and Term of Office* | Principal Occupation During Past 5 Years | Number of Portfolios in Fund Complex Overseen by Trustee** | Other Directorships Held by Trustee During Past 5 Years*** | ||||
Trustees who are Interested Persons (as defined in the 1940 Act) of the Trust (“Interested Trustees ”) | ||||||||
Martin Gilbert****† Year of Birth: 1955 | Trustee since December 2007 | Mr. Gilbert is a founding director and shareholder, and Chief Executive of Aberdeen Asset Management PLC, the holding company of the fund management group that was established in 1983 (“Aberdeen Group”). He was a Director (1991-2014) of Aberdeen Asset Management Asia Limited and a Director (2000-2014) of Aberdeen Asset Management Limited. He was a Director (1995-2014) and was President (September 2006-2014) of Aberdeen Asset Management Inc. Mr. Gilbert also serves as officer and/or director of various Aberdeen Group subsidiary companies, Aberdeen-managed investment trusts and funds’ boards. | 24 | None. | ||||
| * | Each Trustee holds office for an indefinite term until his successor is elected and qualified. |
| ** | As of October 31, 2016, the Aberdeen Fund Complex consists of the Trust (which consists of 19 portfolios), Aberdeen Asia-Pacific Income Fund, Inc., Aberdeen Global Income Fund, Inc., Aberdeen Australia Equity Fund, Inc., Aberdeen Chile Fund, Inc., Aberdeen Israel Fund, Inc., Aberdeen Indonesia Fund, Inc., Aberdeen Latin America Equity Fund, Inc., Aberdeen Emerging Markets Smaller Company Opportunities Fund, Inc., Aberdeen Singapore Fund, Inc., The Asia Tigers Fund, Inc., The India Fund, Inc., Aberdeen Greater China Fund, Inc., Aberdeen Japan Equity Fund, Inc. and Aberdeen Investment Funds. |
| *** | Directorships held in (1) any other investment companies registered under the 1940 Act, (2) any company with a class of securities registered pursuant to Section 12 of the Securities Exchange Act of 1934, as amended (the “Exchange Act”) or (3) any company subject to the requirements of Section 15(d) of the Exchange Act. |
| **** | Each Trustee may be contacted by writing to the Trustee c/o Aberdeen Asset Management Inc., 1735 Market Street, 32nd Floor, Philadelphia, Pennsylvania 19103, Attn: Alan Goodson. |
| † | Mr. Gilbert is considered to be an “interested person” of the Trust as defined in the 1940 Act because of his affiliation with the Adviser. |
2016 Annual Report
51
Management of the Funds (Unaudited) (continued)
As of October 31, 2016
Officers of the Trust
| Name, Address, and Year of Birth | Position(s) Held, Length of Time Served and Term of Office* | Principal Occupation During Past 5 Years | ||
Bev Hendry** Aberdeen Asset Management Inc. 1735 Market Street 32nd Floor Philadelphia, PA 19103 Year of Birth: 1953 | President, Chief Executive Officer and Principal Executive Officer (Since September 2014) | Currently, Co-Head of Americas and Director for Aberdeen Asset Management Inc. since June 2014. He first joined Aberdeen in 1987 and helped establish Aberdeen’s business in the Americas in Fort Lauderdale. Mr. Hendry left Aberdeen in 2008 when the company moved to consolidate its headquarters in Philadelphia. Mr. Hendry re-joined Aberdeen from Hansberger Global Investors in Fort Lauderdale, Florida, where he worked for six years as Chief Operating Officer. | ||
Jeffrey Cotton** Aberdeen Asset Management Inc. 1735 Market Street 32nd Floor Philadelphia, PA 19103 Year of Birth: 1977 | Vice President and Chief Compliance Officer (Since March 2011) | Currently, Director, Vice President and Head of Compliance – Americas for Aberdeen Asset Management Inc. Mr. Cotton joined Aberdeen in 2010. Prior to joining Aberdeen, Mr. Cotton was a Senior Compliance Officer at Old Mutual Asset Management (2009-2010) supporting its affiliated investment advisers and mutual fund platform. Mr. Cotton was also a Vice President and Senior Compliance Manager at Bank of America/Columbia Management (2006-2009). | ||
Andrea Melia** Aberdeen Asset Management Inc. 1735 Market Street 32nd Floor Philadelphia, PA 19103 Year of Birth: 1969 | Treasurer, Chief Financial Officer, and Principal Accounting Officer (Since September 2009) | Currently, Vice President and Head of Fund Administration for Aberdeen Asset Management Inc. (since 2009). Prior to joining Aberdeen, Ms. Melia was Director of Fund Administration and accounting oversight for Princeton Administrators LLC, a division of BlackRock Inc. and had worked with Princeton Administrators since 1992. | ||
Megan Kennedy** Aberdeen Asset Management Inc. 1735 Market Street 32nd Floor Philadelphia, PA 19103 Year of Birth: 1974 | Secretary and Vice President (Since September 2009) | Currently, Head of Product Management for Aberdeen Asset Management Inc. Ms. Kennedy joined Aberdeen Asset Management Inc. in 2005 as a Senior Fund Administrator. Ms. Kennedy was promoted to Assistant Treasurer Collective Funds/North American Mutual Funds in February 2008 and promoted to Treasurer Collective Funds/North American Mutual Funds in July 2008. | ||
Lucia Sitar** Aberdeen Asset Management Inc. 1735 Market Street 32nd Floor Philadelphia, PA 19103 Year of Birth: 1971 | Vice President (Since December 2008) | Currently, Vice President and Managing U.S. Counsel for Aberdeen Asset Management Inc. Ms. Sitar joined Aberdeen Asset Management Inc. in July 2007. |
Annual Report 2016
52
Management of the Funds (Unaudited) (continued)
As of October 31, 2016
| Name, Address, and Year of Birth | Position(s) Held, Length of Time Served and Term of Office* | Principal Occupation During Past 5 Years | ||
Brad Crombie Aberdeen Asset Management Bow Bells House 1 Bread Street London EC4M 9HH Year of Birth: 1970 | Vice President (Since June 2013) | Currently, Global Head of Fixed Income for Aberdeen Asset Management PLC. Mr. Crombie re-joined Aberdeen in 2012. Prior to re-joining Aberdeen, Mr. Crombie was a Managing Director at Bank of America Merrill Lynch for the bank’s non-financial corporate and high yield credit research team for the Europe, Middle East and Africa region from 2003 to 2012. | ||
Alan Goodson** Aberdeen Asset Management Inc. 1735 Market Street 32nd Floor Philadelphia, PA 19103 Year of Birth: 1974 | Vice President (Since March 2009) | Currently, Head of Product – US, overseeing Product Management, Product Development and Investor Services for Aberdeen’s registered and unregistered investment companies in the US and Canada. Mr. Goodson is Director and Vice President of Aberdeen Asset Management Inc. and joined Aberdeen in 2000. | ||
Adam McCabe** Aberdeen Asset Management Asia Limited 21 Church Street #01-01 Capital Square Two Singapore 049480 Year of Birth: 1979 | Vice President (Since March 2010) | Currently, Head of Asian Fixed Income on the Fixed Income – Asia Pacific desk, responsible for currency and interest rate strategies in Aberdeen’s Asian fixed income portfolios. Mr. McCabe joined Aberdeen in 2009 following the acquisition of certain asset management businesses from Credit Suisse. Mr. McCabe worked for Credit Suisse since 2001, where he was an investment manager responsible for the development and implementation of its Asian currency and interest rate strategies. | ||
Jennifer Nichols** Aberdeen Asset Management Inc. 1735 Market Street 32nd Floor Philadelphia, PA 19103 Year of Birth: 1978 | Vice President (Since December 2007) | Currently, Global Head of Legal for Aberdeen Asset Management PLC. Director and Vice President for Aberdeen Asset Management Inc. (since October 2006). | ||
Hugh Young** Aberdeen Asset Management Asia Limited 21 Church Street #01-01 Capital Square Two Singapore 049480 Year of Birth: 1958 | Vice President (Since June 2011) | Currently, Managing Director of Aberdeen Asset Management Asia Limited (since 1991) and member of the Executive Management Committee and Director of Aberdeen Asset Management PLC (since 1991 and 2011, respectively). Mr. Young joined Aberdeen in 1991. | ||
Russell Barlow Aberdeen Asset Management Bow Bells House 1 Bread Street London EC4M 9HH Year of Birth: 1974 | Vice President (Since October 2015) | Currently, Head of Hedge Funds, based in Aberdeen’s London office, chairman of the Hedge Fund Investment Committee, Deputy Chair of the Pan Alternatives Investment Committee and responsible for co-mingled Hedge Fund portfolios. Mr. Barlow joined Aberdeen in 2010 via the acquisition of various asset management businesses from Royal Bank of Scotland where he was the Head of the Global Event Team. |
2016 Annual Report
53
Management of the Funds (Unaudited) (concluded)
As of October 31, 2016
| Name, Address, and Year of Birth | Position(s) Held, Length of Time Served and Term of Office* | Principal Occupation During Past 5 Years | ||
Brian O’Neill** Aberdeen Asset Management Inc. 1735 Market Street 32nd Floor Philadelphia, PA 19103 Year of Birth: 1968 | Assistant Treasurer (Since September 2008) | Currently, Senior Fund Administration Manager – US for Aberdeen Asset Management Inc. Mr. O’Neill joined Aberdeen Asset Management Inc. in 2008. Prior to joining Aberdeen Asset Management Inc., Mr. O’Neill was a Director of Fund Accounting with Nationwide Funds Group (2002-2008). | ||
Eric Olsen** Aberdeen Asset Management Inc. 1735 Market Street 32nd Floor Philadelphia, PA 19103 Year of Birth: 1970 | Assistant Treasurer (Since December 2013) | Currently, Deputy Head of Fund Administration – US for Aberdeen Asset Management Inc. Mr. Olsen joined Aberdeen Asset Management Inc. in August 2013. Prior to joining Aberdeen Asset Management Inc., Mr. Olsen was a Director of Financial Reporting for BNY Mellon Asset Servicing and had worked with BNY Mellon since 1998. |
| * | Each officer holds office for an indefinite term at the pleasure of the Board of Trustees and until his or her successor is elected and qualified. |
| ** | Mr. Hendry, Ms. Melia, Ms. Kennedy, Mr. Goodson, Ms. Nichols, Mr. Cotton, Mr. McCabe, Mr. Young, Ms. Sitar, Mr. Olsen and Mr. O’Neill hold officer position(s) in one or more of the following: Aberdeen Asia-Pacific Income Fund, Inc., Aberdeen Australia Equity Fund, Inc., Aberdeen Global Income Fund, Inc., Aberdeen Chile Fund, Inc., Aberdeen Israel Fund, Inc., Aberdeen Indonesia Fund, Inc., Aberdeen Latin America Equity Fund, Inc., Aberdeen Emerging Markets Smaller Company Opportunities Fund, Inc., Aberdeen Singapore Fund, Inc., The Asia Tigers Fund, Inc., The India Fund, Inc., Aberdeen Greater China Fund, Inc., Aberdeen Japan Equity Fund, Inc. and Aberdeen Investment Funds, each of which may also be deemed to be a part of the same “Fund Complex” as the Trust. |
Annual Report 2016
54
Corporate Information
Trustees
P. Gerald Malone, Chairman
Martin J. Gilbert
Richard H. McCoy
Neville J. Miles
Rahn K. Porter
Steven N. Rappaport
Peter D. Sacks
John T. Sheehy
Warren C. Smith
Officers
Bev Hendry, President and Chief Executive Officer
Jeffrey Cotton, Chief Compliance Officer and Vice President
Andrea Melia, Treasurer and Chief Financial Officer
Megan Kennedy, Secretary and Vice President
Brad Crombie, Vice President
Lucia Sitar, Vice President
Alan Goodson, Vice President
Adam McCabe, Vice President
Jennifer Nichols, Vice President
Hugh Young, Vice President
Russell Barlow, Vice President
Eric Olsen, Assistant Treasurer
Brian O’Neill, Assistant Treasurer
Investment Manager
Aberdeen Asset Management Inc.
1735 Market Street, 32nd Floor
Philadelphia, PA 19103
Fund Administrator
Aberdeen Asset Management Inc.
1735 Market Street, 32nd Floor
Philadelphia, PA 19103
Transfer Agent
Boston Financial Data Services, Inc.
30 Dan Road
Canton, MA 02021
Distributor
Aberdeen Fund Distributors LLC
1735 Market Street, 32nd Floor
Philadelphia, PA 19103
Sub-Administrator, Custodian & Fund Accountant
State Street Bank and Trust Company
1 Heritage Drive, 3rd Floor
North Quincy, MA 02171
Independent Registered Public Accounting Firm
KPMG LLP
1601 Market Street
Philadelphia, PA 19103
Fund Counsel
Willkie Farr & Gallagher LLP
787 Seventh Avenue
New York, NY 10019
Aberdeen Asset Management Inc. 1735 Market Street, 32nd Floor Philadelphia, PA 19103 aberdeen-asset.us | |
AOE-0142-AR

Aberdeen Funds
Fixed Income Series
Annual Report
October 31, 2016
Aberdeen Asia Bond Fund
Aberdeen Emerging Markets Debt Fund
Aberdeen Global Unconstrained Fixed Income Fund (formerly, Aberdeen Global Fixed Income Fund)
Aberdeen Tax-Free Income Fund

| Page 1 | ||||
| Page 2 | ||||
| Page 11 | ||||
| Page 19 | ||||
| Page 31 | ||||
| Page 38 | ||||
| Page 56 | ||||
| Page 76 | ||||
| Page 77 | ||||
| Page 78 | ||||
| Page 79 | ||||
| Page 82 | ||||
Investors should carefully consider a fund’s investment objectives, risks, fees, charges and expenses before investing any money. To obtain this and other fund information, please call 866-667-9231 to request a prospectus, or download a prospectus at www.aberdeen-asset.us. Please read it carefully before investing any money.
Investing in mutual funds involves risk, including possible loss of principal.
Aberdeen Funds is distributed by Aberdeen Fund Distributors, LLC, Member FINRA, 1735 Market Street, 32nd Floor, Philadelphia, PA 19103.
Aberdeen Asset Management Inc. (“AAMI”) has been registered as an investment adviser under the Investment Advisers Act of 1940 since August 23,1995.
Statement Regarding Availability of Quarterly Portfolio Schedule.
The complete schedule of portfolio holdings for each fund of Aberdeen Funds (each a “Fund” and collectively, the “Funds”) is included in the Funds’ semi-annual and annual reports to shareholders. Aberdeen Funds also files complete schedules of portfolio holdings for each Fund with the Securities and Exchange Commission (the “Commission”) for the first and third quarters of each fiscal year on Form N-Q. The Funds’ Form N-Q filings are available on the Commission’s website at http://www.sec.gov. The Funds’ Form N-Q filings may be reviewed and copied at the Commission’s Public Reference Room in Washington, DC, and information on the operation of the Public Reference Room may be obtained by calling 800-SEC-0330; and the Funds make the information on Form N-Q available to shareholders on www.aberdeen-asset.us or upon request without charge.
Statement Regarding Availability of Proxy Voting Record.
Information regarding the policies and procedures that the Funds use to determine how to vote proxies relating to portfolio securities is available without charge, upon request, by calling 1-866-667-9231. The information is also included in the Funds’ Statement of Additional Information, which is available on the Funds’ website at www.aberdeen-asset.us and on the Commission’s website at www.sec.gov.
Information relating to how each Fund voted proxies relating to portfolio securities held during the most recent twelve months ended June 30 is available by August 30 of the relevant year: (i) upon request and without charge by calling 1-866-667-9231; and (ii) on the Commission’s website at www.sec.gov.
The 12-month reporting period ended October 31, 2016 appeared to encapsulate the adage: “Expect the unexpected.” Myriad economic and geopolitical events prompted numerous bouts of volatility in the global financial markets over the period – and beyond. There was abundant speculation regarding U.S. Federal Reserve (Fed) monetary policy, with investor sentiment alternatively shifting towards and away from interest-rate hikes with each release of economic data. In early 2016, oil and commodity prices ended their prolonged slump and led to a rally in global equities. However, in June 2016, the UK’s surprising approval of a referendum to leave the European Union (EU) – commonly referred to as “Brexit” – sent tremors through the global markets. Stock prices fell sharply, oil prices slumped, and the British sterling plummeted to a 30-year low against the U.S. dollar. Investor sentiment recovered soon thereafter as central banks in Japan and parts of Europe unexpectedly imposed negative interest rates in a bid to combat low inflation and boost spending. In the U.S., Fed policy remained on hold for most of the reporting period after the central bank increased its benchmark interest rate for the first time in more than nine years in December 2015. Additionally, for much of the reporting period, investors focused on the pending U.S. presidential election and its possible impact on the global economy and financial markets. Shortly after the end of the reporting period in early November, real estate magnate Donald Trump, seemingly benefiting from a global surge in populism that had led to the successful campaign for Brexit, secured what generally had been deemed an improbable victory in the presidential election versus former U.S. Secretary of State Hillary Clinton.
The Morgan Stanley Capital International (MSCI) World Index, a global equity market benchmark, registered a modest gain of 1.8% for the reporting period. Shares of U.S. large-cap companies significantly outperformed their developed-market peers in Europe, but lagged large-cap Asian stocks. The U.S. broader-market S&P 500 Index was up 4.5% for the period, versus the corresponding -7.5% and 8.0% returns of the MSCI Europe and MSCI All-Country (AC) Asia Pacific indices. Emerging-markets and global natural resources stocks benefited from the sharp rebound in oil and commodity prices, with the MSCI Emerging Markets and the S&P Global Natural Resources indices climbing 9.7% and 13.6%, respectively, for the reporting period.1
U.S. equities saw modest gains over the reporting period, with large-cap stocks slightly outperforming small-cap company stocks. Economic growth was sluggish for most of the period before expanding sharply in the third quarter of 2016. The U.S. employment picture continued to improve, albeit at a somewhat slower rate in the second half of the reporting period. However, average hourly wages rose 2.8% over the 12-month reporting period – the largest year-over-year increase since June 2009. Corporate results were generally positive, with 72% of S&P 500 Index companies exceeding consensus earnings estimates and 54% posting better-than-expected revenue for the third-quarter 2016 earnings season.2
Given their significant exposure to the uncertainty generated by Brexit, UK and European stocks lost ground and were the weakest global equity market performers over the reporting period. The UK electorate’s surprising vote to leave the EU counterbalanced the upturn in the European markets for much of the first half of 2016, as the European Central Bank’s aggressive monetary easing had boosted investor sentiment. Earlier in the reporting period, stocks in the region fell amid concerns regarding the terror attacks in Paris and Brussels in November 2015 and March 2016, respectively.
The Asian stock markets performed well during the reporting period despite a slowdown in economic growth in China and the government’s devaluation of its currency, the renminbi, as well as the Brent crude oil price dropping to a multi-year low at the beginning of the 2016 calendar year. The strength in the second half of the period was attributable primarily to investors’ optimism regarding rising oil and commodity prices and global central bank monetary policy. Stock prices rose in response to the European Central Bank’s package of fresh monetary stimulus and the Bank of Japan’s (BoJ’s) move to impose negative interest rates. Additionally, the Japanese yen moved higher amid the flight to safety shortly after the Brexit vote and investors’ hopes that the BoJ would take further stimulus measures. China’s economy strengthened due to increased infrastructure spending and a robust real estate market.
The strong performance of emerging-market equities over the reporting period was attributable primarily to a significant upturn in the Latin America region – particularly Brazil. That market rallied sharply after former President Dilma Rousseff was impeached on charges of fiscal mismanagement and subsequently removed from office. Vice President Michel Temer succeeded her as president. Temer’s economic team, which includes former central bank president Henrique Meirelles serving as finance minister, unveiled an ambitious program of reforms in an effort to buttress the country’s public finances. In contrast, Mexican stocks declined over the reporting period, hampered by an economic slowdown and the global slump in oil prices. Additionally, the Mexican peso weakened against the U.S. dollar on concerns regarding the possible impact of trade restrictions and tariffs and tougher immigration laws under a Trump administration.
Global fixed-income securities saw positive returns over the reporting period as most central banks maintained accommodative monetary policy. Benchmark interest rates remained slightly above 0% in the U.S. and dipped into negative territory in Europe and Japan. Global investment-grade bonds, as measured by the Bloomberg Barclays Global Aggregate Bond Index, gained 5.6% during the reporting period. High-yield issues significantly outperformed their investment-grade counterparts for the period. The Bank of America Merrill Lynch Global High Yield Constrained Index climbed 10.6%, as the asset class was bolstered mainly by the upturn in global commodity prices for much of the reporting period.
It seems that the global financial markets have been subjected to heavy doses of Trump- and Brexit-related news, in our view. Both trending topics caused upheaval in equity and bond prices and prompted furious but short-lived sell-offs in the markets. With the continued rise of insurgent populist movements elsewhere in the developed world, we think that we may be heading for an economic and political “crunch point.” The electoral tests thus far in 2016 have brought de-globalization and protectionist tendencies into the front line of government in both the U.S. and the UK. Other incumbent governments facing such challenges in the year ahead – most obviously in France and Germany – are taking notice and contemplating how to explain the benefits of globalization, while acknowledging they could and should be shared more widely.
We feel that it is worth bearing in mind that the story of populism and de-globalization is nuanced, with both negative and positive implications for champions of globalization. On the downside, this complexity may make it harder to successfully address the causes of discontent and reduce the risk of damaging de-globalization. Nonetheless, protectionism is not an inevitable, reflexive response to the challenges the world faces on the other side of the global financial crisis. Returning to the UK, and specifically the EU referendum result, young people voted “remain” overall, whereas older demographic groups favored “leave.” At least in this case, in our opinion, those who have spent all their lives in a globalized world appear most reluctant to give up on it just yet.
Hugh Young
Managing Director
Aberdeen Asset Management
| 1 | Indexes are unmanaged and have been provided for comparison purposes only. No fees or expenses are reflected. You cannot invest directly in an index. |
| 2 | Source: FactSet, “Earnings Insight,” November 2016 |
2016 Annual Report
1
Aberdeen Asia Bond Fund (Unaudited)
Effective April 1, 2016, the Fund’s benchmark changed from the HSBC Asian Local Bond Index to the Markit iBoxx Asia Government Index.
The Aberdeen Asia Bond Fund (Institutional Class shares net of fees) returned 6.02% for the 12-month period ended October 31, 2016, versus the 6.36% return of its benchmark, the Markit iBoxx Asia Government Index, during the same period. For broader comparison, the average return of the Fund’s peer category of International Income Funds (comprising 45 funds), as measured by Lipper, Inc., was 5.16% for the period.
Asian fixed-income assets rallied over the 12-month period ended October 31, 2016, despite a volatile start attributable to an interest-rate hike by the U.S. Federal Reserve (Fed) in December 2015, sharp declines in Chinese equities, and the tumble in commodity prices. Just when investor sentiment appeared to stabilize going into the second half of the reporting period, risk aversion spiked again, this time caused by the UK’s unexpected Brexit1 vote in June 2016. After a brief sell-off, Asian bonds rebounded as record-low interest rates in developed markets drove global fund flows in search of higher yields. Towards the end of the reporting period, caution rose ahead of the U.S. presidential election in early November. Republican Donald Trump subsequently won the election on November 8, garnering a majority of electoral votes in the race against his Democratic Party opponent, former U.S. Secretary of State Hillary Clinton. Regional currencies ended the reporting period mixed against the U.S. dollar; the Indonesian rupiah, Malaysian ringgit and Thai baht led gains, but the Chinese yuan, Philippine peso and Indian rupee weakened.
In Asian bond markets, Indonesia and India were the strongest market performers over the reporting period as their respective central banks continued to cut interest rates. The Indonesian market was further boosted by fiscal stimulus measures and the tax amnesty bill that investors hoped would encourage overseas asset repatriation. In India, reform momentum accelerated with the ratification of the bankruptcy code and the upper house’s approval of the goods and services tax (GST) bill. The market also reacted positively to the appointment of Urjit Patel as the new central bank governor and formation of the monetary policy committee. Chinese bonds were buttressed by ample liquidity and Beijing’s assurance that its economic growth targets would be met. In Malaysia, investor sentiment was lifted by the central bank’s interest-rate cut and J.P. Morgan’s decision to include Islamic bonds in its emerging-market indices. Thai bond yields fell on hopes of easier monetary policy, which gained credence after King Bhumibol’s death in October.
Yields in Singapore also trended lower over the reporting period, even though the central bank removed the appreciation bias from its currency policy. Korean bonds benefited from the central bank’s policy rate cut and the government’s 20 trillion-won (about US$17 billion) stimulus package. However, gains were pared in the last few months of the period by protests calling for President Park Geun-hye’s resignation for allowing a friend to gain inappropriate access to government documents. Philippine bonds underperformed the overall market during the reporting period. Investors initially welcomed President Rodrigo Duterte’s election win, but his more strident invectives against the U.S. later reignited market jitters.
Asian credit markets strengthened over the reporting period, with spreads versus comparable-duration2 U.S. Treasuries narrowing substantially, led by the high-yield sector. As commodity prices rebounded and fears over Chinese economic growth subsided, investors’ risk appetite improved. Nevertheless, some headwinds emerged later, particularly rising concerns over overheating Chinese property prices and corporate bond defaults in the hard-hit oil-and-gas sector. Towards the end of the reporting period, gains were capped by increasingly stretched valuations.
The Fund slightly underperformed versus its benchmark, the Markit iBoxx Asia Government Index, during the reporting period. The Fund’s interest-rate strategies contributed to the relative performance, while the currency strategies had a negative impact.
Regarding interest-rate strategies, the Fund’s overweight exposure to Indian bonds relative to the benchmark was the largest contributor to performance. However, the underweight allocation to Singapore and Thai bonds weighed on the Fund’s relative return. In currency management, the Fund’s overweight to the Indian rupee relative to the benchmark and underweight to the Malaysian ringgit detracted from performance, but was mitigated by positive impact of the overweight exposure to the Indonesian rupiah.
The Fund’s positioning within the Asian U.S.-dollar credit segment enhanced the performance relative to the benchmark for the reporting period. This was attributable mainly to the underweight allocation to financials and overweight exposure to high-yield industrials excluding China. Conversely, security selection in quasi-sovereign bonds and high-quality real estate pared gains.
Regarding the use of derivatives over the reporting period, the employment of forwards3 to manage exposure to Asian currencies contributed negatively to Fund performance, exacerbating the overall negative impact of currency management on relative return. The Fund’s use of U.S. Treasury futures to hedge the U.S. interest-rate risk contributed to the relative performance for the period. Overall, the derivatives positions detracted 0.55% from Fund performance for the reporting period.
| 1 | Brexit is an abbreviation of “British exit,” which refers to the June 23, 2016 referendum by British voters to exit the European Union. |
| 2 | Duration is an estimate of bond price sensitivity to changes in interest rates. The higher the duration, the greater the change (i.e., higher risk) in relation to interest-rate movements. |
| 3 | A currency forward is a binding contract in the foreign exchange market that locks in the exchange rate for the purchase or sale of a currency on a future date. |
Annual Report 2016
2
Aberdeen Asia Bond Fund (Unaudited) (concluded)
As part of the liberalization of the domestic bond market, in February 2016, the People’s Republic of China (PRC) announced a new path for international investors to access onshore bonds through the China Interbank Bond Market (CIBM). Because more than 90% of current PRC bond trading activity is transacted in the CIBM, the Fund’s new ability to access PRC bonds (and other products) through CIBM provides greater flexibility and liquidity, while subjecting the Fund to similar risks associated with other methods of investing directly in China.
During the reporting period, we reduced the Fund’s overall short-duration positioning to an underweight of 0.7% for the year versus that of the benchmark. We accomplished this primarily by moving from short- to long-duration positions in Malaysia and Indonesia, while reducing the short-duration position in Korea. This was offset by a reduction in long-duration positions in non-local currency exposure in India and China.
With respect to currency positioning over the reporting period, we decreased the Fund’s long U.S.-dollar exposure from an overweight allocation of about 10% to an underweight position of 10% relative to the benchmark. Specifically, we moved the Fund from a virtually flat position in the Philippine peso to an overweight allocation of 3% versus the benchmark, while we increased the overweight exposure to the Bangladeshi taka by 1.5% to 2.5%. We increased the underweight allocation to the Singapore dollar by 1% to 3% versus the benchmark. We also increased the overweight position in the rupiah by 1.4% to 2.5%. A 10% underweight to the Korean won was reduced to 4%. In the currency overlay,4 we exited the Fund’s 3% short position in each of the Australian and New Zealand dollars. Furthermore, we decreased the Fund’s overweight to the Indian rupee from 14.5% to 9.5%.
Market reaction in the immediate aftermath of the U.S. presidential election reflected not only surprise over Donald Trump’s win but also elevated uncertainty that we believe could prevail going into 2017. U.S. Treasuries and some Asian bond markets initially rallied, but subsequently sold off, with current yields generally higher than their pre-election levels. The U.S. dollar weakened against its G105 peers but later reversed course, and recently was stronger against most G10 and emerging-market currencies. Credit spreads narrowed after initially widening immediately after the election. We believe that investors will need to wait for President-elect Trump to set policy direction when he takes office in January. Early assumptions are that the U.S. may embark on fiscal stimulus, which could prove inflationary and cause U.S. Treasury yields to rise further. The Fed is also expected to continue on its path of monetary policy normalization in December 2016, provided that market sentiment and financial conditions are stable. For Asia, we think that a key risk stems from a potential increase in U.S. protectionism and its impact on global trade. The Italian referendum on constitutional reform in early December 2016, along with the Supreme Court ruling in the UK on the need for parliamentary approval to invoke Article 50,6 also present further headwinds, in our view.
Portfolio Management:
Aberdeen Asian Fixed Income Team
PAST PERFORMANCE DOES NOT GUARANTEE FUTURE RESULTS.
The performance data quoted represents past performance and current returns may be lower or higher. Class A shares have up to a 4.25% front-end sales charge and a 0.25% 12b-1 fee. The investment return and principal value will fluctuate so that an investor’s shares, when redeemed, may be worth more or less than the original cost. To obtain performance information current to the most recent month-end, which may be higher or lower than the performance shown above, please call 866-667-9231 or go to www.aberdeen-asset.us.
Investing in mutual funds involves risk, including the possible loss of principal.
Indexes are unmanaged and have been provided for comparison purposes only. No fees or expenses are reflected. You cannot invest directly in an index.
Lipper is a leading global provider of mutual fund information and analysis to fund companies, financial intermediaries and media organizations.
Risk Considerations
Concentrating investments in the Asian region subjects the Fund to more volatility and greater risk of loss than geographically diverse mutual funds.
Fixed income securities are subject to certain risks including, but not limited to: interest rate (changes in interest rates may cause a decline in the market value of an investment), credit (changes in the financial condition of the issuer, borrower, counterparty, or underlying collateral), prepayment (debt issuers may repay or refinance their loans or obligations earlier than anticipated), and extension (principal repayments may not occur as quickly as anticipated, causing the expected maturity of a security to increase).
Foreign securities may be more volatile, harder to price and less liquid than U.S. securities. They are subject to different accounting and regulatory standards, currency exchange rates, and political and economic risks. Fluctuation in currency exchange rates may impact the Fund’s returns more greatly to the extent the Fund does not hedge currency exposure or hedging techniques are unsuccessful. The foregoing risks are enhanced in emerging market countries.
Derivatives are speculative and may hurt the Fund’s performance. They present the risk of disproportionately increased losses and/or reduced gains when the financial asset or measure to which the derivative is linked changes in unexpected ways.
Investing a significant portion of the Fund’s assets in securities of companies conducting business in a broadly related group of industries within an economic sector may make the Fund more vulnerable to unfavorable developments in that sector.
Please read the prospectus for more detailed information regarding these and other risks.
| 4 | A currency overlay segregates the currency component from other investments within a portfolio, allowing its separate management overlaid over the top of other assets. |
| 5 | The G10 nations include Belgium, Canada, France, Germany, Italy, Japan, the Netherlands, Sweden, Switzerland, the UK and the U.S. |
| 6 | Article 50 stipulates that “Any Member State may decide to withdraw from the [European] Union in accordance with its own constitutional requirements.” |
2016 Annual Report
3
Aberdeen Asia Bond Fund (Unaudited)
| Average Annual Total Return1 (For periods ended October 31, 2016) | 1 Yr. | 5 Yr. | Inception2 | |||||||||||
Class A3 | w/o SC | 5.67% | 1.33% | 1.09% | ||||||||||
| w/SC4 | 1.20% | 0.45% | 0.16% | |||||||||||
Class C3 | w/o SC | 4.88% | 0.62% | 0.33% | ||||||||||
| w/SC5 | 3.88% | 0.62% | 0.33% | |||||||||||
Class R3,6 | w/o SC | 5.44% | 1.08% | 0.82% | ||||||||||
Institutional Service Class6,7 | w/o SC | 5.78% | 1.35% | 3.33% | ||||||||||
Institutional Class6,7 | w/o SC | 6.02% | 1.58% | 3.75% | ||||||||||
All figures showing the effect of a sales charge (SC) reflect the maximum charge possible because it has the most significant effect on performance data. The total returns shown above do not include the impact of financial statement rounding of the net asset value (NAV) per share and/or financial statement adjustments.
| 1 | Returns presented for the Fund for periods prior to July 20, 2009 reflect the performance of the predecessor fund (the “Predecessor Fund”). Returns of the Predecessor Fund have not been adjusted to reflect the expenses applicable to the respective classes. The Fund and the Predecessor Fund have substantially similar investment objectives and strategies. Please consult the Fund’s prospectus for more detail. |
| 2 | The Fund commenced operations on May 1, 2007. |
| 3 | Returns before the first offering of Class A, Class C and Class R (February 27, 2012) are based on the previous performance of the Institutional Class shares. Excluding the effect of any fee waivers or reimbursements, this performance of Class A, Class C and Class R is substantially similar to what the Institutional Class would have produced because all classes invest in the same portfolio of securities. Returns would only differ to the extent of the differences in expenses of the classes. |
| 4 | A 4.25% front-end sales charge was deducted. |
| 5 | A 1.00% contingent deferred sales charge (CDSC) was deducted from the one year return because it is charged when Class C shares are sold within the first year after purchase. |
| 6 | Returns before the first offering of the Institutional Service Class (January 4, 2010) are based on the previous performance of the Institutional Class shares. Excluding the effect of any fee waivers or reimbursements, this performance is substantially similar to what the Institutional Service Class would have produced because both classes invest in the same portfolio of securities. Returns would only differ to the extent of the differences in expenses of the two classes. |
| 7 | Not subject to any sales charges. |
Annual Report 2016
4
Aberdeen Asia Bond Fund (Unaudited)
Performance of a $1,000,000* Investment (as of October 31, 2016)
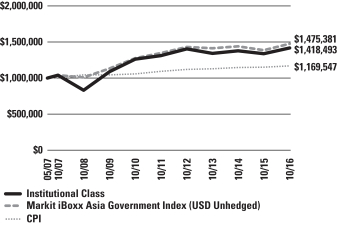
| * | Minimum Initial Investment |
Comparative performance of $1,000,000 invested in Institutional Class shares of the Aberdeen Asia Bond Fund, the Markit iBoxxR Asia Government Index and the Consumer Price Index (CPI) since inception. Unlike the Fund, the returns for these unmanaged indexes do not reflect any fees, expenses, or sales charges. Investors cannot invest directly in market indexes.
The Markit iBoxxR Asia Government Index is part of the Markit iBoxx ex-Japan Index family. The Markit iBoxx Asia ex-Japan Index family covers local currency sovereign and quasi-sovereign debt from 10 Asian markets. The 10 Asian markets are China, Hong Kong, India, Indonesia, Malaysia, Philippines, Singapore, South Korea, Taiwan and Thailand. The indices serve as benchmarks for asset managers and investors and may form the basis for traded products, such as ETFs. Multiple-source pricing ensures that they are an accurate reflection of the underlying markets.
Effective April 1, 2016, the Markit iBoxxR Asia Government Index replaced the HSBC Asian Local Bond IndexTM as the Fund’s benchmark index because the HSBC Asian Local Bond IndexTM was discontinued in April 2016.
The CPI is a measure of the average change over time in the prices paid by urban consumers for a market basket of consumer goods and services.
Investment return and principal value will fluctuate, and when redeemed, shares may be worth more or less than original cost. Past performance is no guarantee of future results. The Average Annual Total Return table and Performance graph do not reflect the deduction of taxes that a shareholder would pay on fund distributions or the redemption of fund shares. Investing in mutual funds involves market risk, including loss of principal. Performance returns assume the reinvestment of all distributions. Total returns reflect waivers and reimbursements in effect, without which returns would have been lower.
Portfolio Summary (as a percentage of net assets)
October 31, 2016 (Unaudited)
| Asset Allocation | ||||
Government Bonds | 48.6% | |||
Corporate Bonds | 45.6% | |||
Short-Term Investment | 3.5% | |||
Government Agencies | 0.7% | |||
Other assets in excess of liabilities | 1.6% | |||
| 100.0% | ||||
The following chart summarizes the composition of the Fund’s portfolio, expressed as a percentage of net assets. The industries listed below may include more than one industry group. As of October 31, 2016, the Fund did not have more than 25% of its assets invested in any industry group.
| Top Industries | ||||
Commercial Banks | 12.6% | |||
Oil, Gas & Consumable Fuels | 7.2% | |||
Diversified Financial Services | 5.9% | |||
Real Estate | 3.9% | |||
Diversified Telecommunication Services | 2.2% | |||
Commercial Services & Supplies | 1.8% | |||
Gas Utilities | 1.8% | |||
Electric Utilities | 1.6% | |||
Machinery-Diversified | 1.4% | |||
Transportation | 1.4% | |||
Other | 60.2% | |||
| 100.0% | ||||
2016 Annual Report
5
Aberdeen Asia Bond Fund (Unaudited) (concluded)
| Top Holdings* | ||||
Malaysia Government Bond 05/31/2035 | 6.3% | |||
China Government Bond, Series 1110 04/28/2031 | 5.7% | |||
Indonesia Treasury Bond, Series FR72 05/15/2036 | 5.7% | |||
Korea Treasury Bond, Series 3509 09/10/2035 | 4.0% | |||
India Government Bond 06/02/2028 | 4.0% | |||
India Government Bond 11/10/2033 | 3.9% | |||
Malaysia Government Bond 03/15/2046 | 3.3% | |||
Indonesia Treasury Bond, Series FR73 05/15/2031 | 3.3% | |||
ICICI Bank Ltd. 08/06/2024 | 2.8% | |||
Power Finance Corp. Ltd., Series 137 07/24/2020 | 2.6% | |||
Other | 58.4% | |||
| 100.0% | ||||
| * | For the purpose of listing top holdings, Short-Term Investments are included as part of Other. |
| Top Countries | ||||
China | 24.3% | |||
India | 21.5% | |||
Indonesia | 14.7% | |||
Malaysia | 10.9% | |||
Republic of South Korea | 6.4% | |||
Hong Kong | 5.3% | |||
United States | 3.5% | |||
Thailand | 2.9% | |||
Singapore | 2.5% | |||
Bangladesh | 2.4% | |||
Other | 5.6% | |||
| 100.0% | ||||
Annual Report 2016
6
Statement of Investments
October 31, 2016
Aberdeen Asia Bond Fund
| Shares or Principal Amount | Value (US$) | |||||||
CORPORATE BONDS (45.6%) |
| |||||||
CHINA (14.6%) | ||||||||
Diversified Telecommunication Services (1.4%) |
| |||||||
Proven Honour Capital Ltd. (USD), 4.13%, 05/19/2025 (a) | $ | 400,000 | $ | 418,656 | ||||
Engineering & Construction (1.1%) |
| |||||||
China Railway Resources Huitung Ltd. (USD), 3.85%, 02/05/2023 (a) | 301,000 | 314,077 | ||||||
Gas Utilities (1.8%) | ||||||||
China Resources Gas Group Ltd. (USD), 4.50%, 04/05/2022 (a) | 200,000 | 216,083 | ||||||
ENN Energy Holdings Ltd. (USD), 6.00%, 05/13/2021 (a) | 283,000 | 319,151 | ||||||
| 535,234 | ||||||||
Machinery-Diversified (0.7%) | ||||||||
Shanghai Electric Group Investment Ltd. (USD), 3.00%, 08/14/2019 (a) | 200,000 | 204,371 | ||||||
Oil, Gas & Consumable Fuels (5.3%) | ||||||||
CNOOC Nexen Finance 2014 ULC (USD), 4.25%, 04/30/2024 | 256,000 | 272,657 | ||||||
CNPC General Capital Ltd. (USD), 2.75%, 05/14/2019 (a) | 200,000 | 203,861 | ||||||
Kunlun Energy Co. Ltd. (USD), 3.75%, 05/13/2025 (a) | 314,000 | 325,706 | ||||||
Sinopec Capital 2013 Ltd., 144A (USD), 3.13%, 04/24/2023 (a) | 350,000 | 354,941 | ||||||
Sinopec Group Overseas Development 2013 Ltd. (USD), 4.38%, 10/17/2023 (a) | 200,000 | 218,500 | ||||||
Sinopec Group Overseas Development 2016 Ltd. (USD), 4.25%, 05/03/2046 (a) | 200,000 | 203,945 | ||||||
| 1,579,610 | ||||||||
Real Estate (2.4%) | ||||||||
Agile Group Holdings Ltd. (USD), 8.38%, 02/18/2019 (a) | 200,000 | 210,251 | ||||||
China Overseas Finance Cayman III Ltd. (USD), 5.38%, 10/29/2023 (a) | 200,000 | 225,736 | ||||||
Future Land Development Holdings Ltd. (USD), 10.25%, 07/21/2019 (a) | 250,000 | 272,180 | ||||||
| 708,167 | ||||||||
Semiconductors (1.2%) | ||||||||
Semiconductor Manufacturing International Corp. (USD), 4.13%, 10/07/2019 (a) | 330,000 | 342,825 | ||||||
Transportation (0.7%) |
| |||||||
Eastern Creation II Investment Holdings Ltd. (USD), 2.63%, 11/20/2017 (a) | 200,000 | 201,350 | ||||||
| 4,304,290 | ||||||||
HONG KONG (4.2%) | ||||||||
Diversified Holding Companies (1.1%) |
| |||||||
Hutchison Whampoa International Ltd. | ||||||||
(USD), 7.63%, 04/09/2019 (a) | 100,000 | 113,724 | ||||||
(USD), 4.63%, 01/13/2022 (a) | 200,000 | 221,938 | ||||||
| 335,662 | ||||||||
Electric Utilities (0.7%) | ||||||||
Hongkong Electric Finance Ltd. (USD), 2.88%, 05/03/2026 (a) | 200,000 | 197,641 | ||||||
Food Products (0.7%) | ||||||||
FPC Treasury Ltd. (USD), 4.50%, 04/16/2023 (a) | 200,000 | 204,936 | ||||||
Real Estate (0.8%) |
| |||||||
Hongkong Land Finance Cayman Islands Co. Ltd. (The) (USD), 4.50%, 06/01/2022 | 200,000 | 221,646 | ||||||
Real Estate Investment Trust (REIT) (1.0%) |
| |||||||
Champion MTN Ltd. (USD), 3.75%, 01/17/2023 (a) | 278,000 | 284,761 | ||||||
| 1,244,647 | ||||||||
INDIA (12.5%) | ||||||||
Commercial Banks (3.5%) |
| |||||||
ICICI Bank Ltd. (INR), 9.15%, 08/06/2024 | 50,000,000 | 813,637 | ||||||
State Bank of India (USD), 3.62%, 04/17/2019 (a) | 200,000 | 206,384 | ||||||
| 1,020,021 | ||||||||
Diversified Financial Services (5.6%) |
| |||||||
Housing Development Finance Corp. Ltd. (INR), 8.65%, 09/18/2020 | 50,000,000 | 773,726 | ||||||
Indian Railway Finance Corp. Ltd. (USD), 3.92%, 02/26/2019 (a) | 114,000 | 118,717 | ||||||
Power Finance Corp. Ltd., Series 137 (INR), 8.53%, 07/24/2020 | 50,000,000 | 774,826 | ||||||
| 1,667,269 | ||||||||
Diversified Telecommunication Services (0.8%) |
| |||||||
GCX Ltd. (USD), 7.00%, 08/01/2019 (a) | 250,000 | 241,869 | ||||||
Electric Utilities (0.7%) | ||||||||
NTPC Ltd. (USD), 4.25%, 02/26/2026 (a) | 200,000 | 209,278 | ||||||
Oil, Gas & Consumable Fuels (1.9%) |
| |||||||
Bharat Petroleum Corp. Ltd. (USD), 4.00%, 05/08/2025 (a) | 280,000 | 287,071 | ||||||
ONGC Videsh Ltd. (USD), 4.63%, 07/15/2024 (a) | 260,000 | 278,140 | ||||||
| 565,211 | ||||||||
| 3,703,648 | ||||||||
INDONESIA (3.5%) | ||||||||
Commercial Banks (2.6%) |
| |||||||
Bank OCBC Nisp Tbk PT, Series OB (IDR), | 10,000,000,000 | 768,082 | ||||||
Electric Utilities (0.2%) |
| |||||||
Majapahit Holding BV (USD), 7.88%, 06/29/2037 (a) | 50,000 | 64,625 | ||||||
See accompanying Notes to Financial Statements.
2016 Annual Report
7
Statement of Investments (continued)
October 31, 2016
Aberdeen Asia Bond Fund
| Shares or Principal Amount | Value (US$) | |||||||
Transportation (0.7%) |
| |||||||
Pelabuhan Indonesia II PT (USD), 4.25%, 05/05/2025 (a) | $ | 200,000 | $ | 200,750 | ||||
| 1,033,457 | ||||||||
PHILIPPINES (1.3%) | ||||||||
Commercial Banks (0.6%) |
| |||||||
Rizal Commercial Banking Corp. (USD), 4.25%, 01/22/2020 (a) | 150,000 | 157,490 | ||||||
Commercial Services & Supplies (0.7%) |
| |||||||
ICTSI Treasury BV (USD), 5.88%, 09/17/2025 (a) | 200,000 | 214,849 | ||||||
| 372,339 | ||||||||
REPUBLIC OF SOUTH KOREA (2.4%) | ||||||||
Commercial Banks (0.7%) |
| |||||||
Shinhan Bank (USD), 1.88%, 07/30/2018 (a) | 200,000 | 200,602 | ||||||
Diversified Financial Services (0.3%) | ||||||||
Hyundai Capital Services, Inc. (USD), 2.63%, 09/29/2020 (a) | 100,000 | 101,533 | ||||||
Machinery-Diversified (0.7%) |
| |||||||
Doosan Heavy Industries & Construction Co. Ltd. (USD), 2.13%, 04/27/2020 (a) | 215,000 | 214,268 | ||||||
Metals & Mining (0.7%) | ||||||||
Minera y Metalurgica del Boleo SA de CV (USD), 2.88%, 05/07/2019 (a) | 200,000 | 204,107 | ||||||
| 720,510 | ||||||||
SINGAPORE (2.5%) | ||||||||
Commercial Banks (0.7%) | ||||||||
United Overseas Bank Ltd. (USD), 3.50%, 09/16/2026 (a)(b) | 200,000 | 203,892 | ||||||
Commercial Services & Supplies (1.1%) |
| |||||||
HPHT Finance 15 Ltd. (USD), 2.88%, 03/17/2020 (a) | 318,000 | 324,494 | ||||||
Real Estate (0.7%) | ||||||||
Global Logistic Properties Ltd. (USD), 3.88%, 06/04/2025 (a) | 200,000 | 204,367 | ||||||
| 732,753 | ||||||||
THAILAND (2.9%) | ||||||||
Commercial Banks (2.9%) | ||||||||
Bangkok Bank PCL (USD), 9.03%, 03/15/2029 (a) | 50,000 | 72,507 | ||||||
Krung Thai Bank PCL (USD), 5.20%, 12/26/2024 (a)(b) | 379,000 | 396,823 | ||||||
Siam Commercial Bank PCL (USD), 3.50%, 04/07/2019 (a) | 389,000 | 402,024 | ||||||
| 871,354 | ||||||||
UNITED KINGDOM (1.6%) | ||||||||
Commercial Banks (1.6%) | ||||||||
HSBC Holdings PLC (USD), 6.38%, 03/30/2025 (b)(c) | 170,000 | 170,638 | ||||||
Standard Chartered PLC (USD), 4.05%, 04/12/2026 (a) | 300,000 | 308,727 | ||||||
| 479,364 | ||||||||
Total Corporate Bonds | 13,462,362 | |||||||
GOVERNMENT BONDS (48.6%) | ||||||||
BANGLADESH (2.4%) | ||||||||
Bangladesh Treasury Bond, Series 5YR (BDT), 11.78%, 08/14/2018 (d) | 50,000,000 | 706,438 | ||||||
CHINA (9.7%) | ||||||||
China Government Bond | ||||||||
Series 1019 (CNY), 3.41%, 06/24/2020 (e) | 1,000,000 | 152,784 | ||||||
Series 1124 (CNY), 3.57%, 11/17/2021 (e) | 2,000,000 | 309,997 | ||||||
Series 1505 (CNY), 3.64%, 04/09/2025 (e) | 2,000,000 | 315,479 | ||||||
Series 1604 (CNY), 2.85%, 01/28/2026 (e) | 2,700,000 | 402,042 | ||||||
Series 1110 (CNY), 4.15%, 04/28/2031 (e) | 10,000,000 | 1,672,535 | ||||||
| 2,852,837 | ||||||||
INDIA (8.3%) | ||||||||
India Government Bond | ||||||||
(INR), 8.40%, 07/28/2024 | 6,280,000 | 101,749 | ||||||
(INR), 8.60%, 06/02/2028 | 71,260,000 | 1,187,799 | ||||||
(INR), 8.24%, 11/10/2033 | 70,000,000 | 1,158,285 | ||||||
| 2,447,833 | ||||||||
INDONESIA (11.2%) | ||||||||
Indonesia Government International Bond (USD), 6.75%, 01/15/2044 (a) | 200,000 | 263,668 | ||||||
Indonesia Treasury Bond | ||||||||
Series FR61 (IDR), 7.00%, 05/15/2022 | 2,500,000,000 | 190,807 | ||||||
Series FR73 (IDR), 8.75%, 05/15/2031 | 11,400,000,000 | 976,357 | ||||||
Series FR72 (IDR), 8.25%, 05/15/2036 | 21,000,000,000 | 1,671,771 | ||||||
Perusahaan Penerbit SBSN Indonesia III (USD), 4.35%, 09/10/2024 (a) | 200,000 | 210,000 | ||||||
| 3,312,603 | ||||||||
MALAYSIA (10.9%) | ||||||||
Malaysia Government Bond | ||||||||
Series 0411 (MYR), 4.23%, 06/30/2031 | 1,600,000 | 390,164 | ||||||
(MYR), 4.25%, 05/31/2035 | 7,800,000 | 1,843,738 | ||||||
(MYR), 4.74%, 03/15/2046 | 4,000,000 | 981,263 | ||||||
| 3,215,165 | ||||||||
REPUBLIC OF SOUTH KOREA (4.0%) | ||||||||
Korea Treasury Bond, Series 3509 (KRW), 2.63%, 09/10/2035 | 1,200,000,000 | 1,193,677 | ||||||
See accompanying Notes to Financial Statements.
Annual Report 2016
8
Statement of Investments (continued)
October 31, 2016
Aberdeen Asia Bond Fund
| Shares or Principal Amount | Value (US$) | |||||||
SRI LANKA (2.1%) | ||||||||
Sri Lanka Government Bonds | ||||||||
Series A (LKR), 8.00%, 11/15/2018 | $ | 50,000,000 | $ | 319,141 | ||||
Series A (LKR), 11.40%, 01/01/2024 | 48,000,000 | 317,120 | ||||||
| 636,261 | ||||||||
Total Government Bonds | 14,364,814 | |||||||
GOVERNMENT AGENCIES (0.7%) | ||||||||
INDIA (0.7%) | ||||||||
Export-Import Bank of India (USD), 3.38%, 08/05/2026 (a) | 200,000 | 198,309 | ||||||
Total Government Agencies | 198,309 | |||||||
SHORT-TERM INVESTMENT (3.5%) | ||||||||
UNITED STATES (3.5%) | ||||||||
State Street Institutional U.S. Government Money Market Fund (f) | 1,039,337 | 1,039,337 | ||||||
Total Short-Term Investment | 1,039,337 | |||||||
Total Investments | 29,064,822 | |||||||
Other assets in excess of liabilities—1.6% | 487,174 | |||||||
Net Assets—100.0% | $ | 29,551,996 | ||||||
| (a) | Denotes a security issued under Regulation S or Rule 144A. |
| (b) | Variable or Floating Rate Security. Rate disclosed is as of October 31, 2016. |
| (c) | Perpetual bond. This is a bond that has no maturity date, is redeemable and pays a steady stream of interest indefinitely. The maturity date presented for these instruments represents the next call/put date. |
| (d) | Illiquid security. |
| (e) | China A securities. These securities are issued in local currency, traded in the local markets and are held through a qualified foreign institutional investor license. |
| (f) | Registered investment company advised by State Street Global Advisors. |
| (g) | See accompanying Notes to Financial Statements for tax unrealized appreciation/(depreciation) of securities. |
| BDT | Bangladesh Taka |
| CNH | Chinese Yuan Renminbi Offshore |
| CNY | Chinese Yuan Renminbi |
| IDR | Indonesian Rupiah |
| INR | Indian Rupee |
| KRW | South Korean Won |
| LKR | Sri Lanka Rupee |
| MYR | Malaysian Ringgit |
| PHP | Philippine Peso |
| SGD | Singapore Dollar |
| THB | Thai Baht |
| USD | U.S. Dollar |
At October 31, 2016, the Fund held the following futures contracts:
| Futures Contracts | Number of Contracts Long/(Short) | Expiration Date | Unrealized Appreciation/ (Depreciation) | |||||||||
United States Treasury Note 6%-10 year | (11 | ) | 12/20/2016 | $ | 10,458 | |||||||
United States Treasury Note 6%-10 year | 56 | 12/20/2016 | (48,591 | ) | ||||||||
United States Treasury Note 6%-30 year | 5 | 12/20/2016 | (32,824 | ) | ||||||||
United States Treasury Note 6%-2 year | 1 | 12/30/2016 | 25 | |||||||||
United States Treasury Note 6%-5 year | 1 | 12/30/2016 | (487 | ) | ||||||||
United States Treasury Note 6%-5 year | (146 | ) | 12/30/2016 | 28,174 | ||||||||
| $ | (43,245 | ) | ||||||||||
See accompanying Notes to Financial Statements.
2016 Annual Report
9
Statement of Investments (concluded)
October 31, 2016
Aberdeen Asia Bond Fund
At October 31, 2016, the Fund’s open forward foreign currency exchange contracts were as follows:
| Purchase Contracts Settlement Date* | Counterparty | Amount Purchased | Amount Sold | Fair Value | Unrealized Appreciation/ (Depreciation) | |||||||||||||||||||||||
| Chinese Yuan Renminbi Offshore/United States Dollar | ||||||||||||||||||||||||||||
11/10/2016 | Credit Suisse | CNH | 9,323,860 | USD | 1,400,000 | $ | 1,374,708 | $ | (25,292 | ) | ||||||||||||||||||
11/10/2016 | Royal Bank of Canada | CNH | 2,683,000 | USD | 400,001 | 395,581 | (4,420 | ) | ||||||||||||||||||||
| Indonesian Rupiah/United States Dollar | ||||||||||||||||||||||||||||
11/18/2016 | Standard Chartered Bank | IDR | 21,456,000,000 | USD | 1,600,000 | 1,641,024 | 41,024 | |||||||||||||||||||||
| Malaysian Ringgit/United States Dollar | ||||||||||||||||||||||||||||
01/20/2017 | BNP Paribas | MYR | 1,686,400 | USD | 400,000 | 400,538 | 538 | |||||||||||||||||||||
01/20/2017 | Credit Suisse | MYR | 3,736,170 | USD | 900,000 | 887,381 | (12,619 | ) | ||||||||||||||||||||
01/20/2017 | Royal Bank of Canada | MYR | 3,777,289 | USD | 904,999 | 897,147 | (7,852 | ) | ||||||||||||||||||||
| Philippine Peso/United States Dollar | ||||||||||||||||||||||||||||
11/14/2016 | Standard Chartered Bank | PHP | 136,480,400 | USD | 2,800,000 | 2,818,614 | �� | 18,614 | ||||||||||||||||||||
| Singapore Dollar/United States Dollar | ||||||||||||||||||||||||||||
12/15/2016 | Goldman Sachs | SGD | 3,803,800 | USD | 2,800,000 | 2,735,291 | (64,709 | ) | ||||||||||||||||||||
12/15/2016 | Standard Chartered Bank | SGD | 832,380 | USD | 600,000 | 598,560 | (1,440 | ) | ||||||||||||||||||||
| South Korean Won/United States Dollar | ||||||||||||||||||||||||||||
12/02/2016 | BNP Paribas | KRW | 4,012,488,000 | USD | 3,600,000 | 3,506,960 | (93,040 | ) | ||||||||||||||||||||
12/02/2016 | Credit Suisse | KRW | 451,960,000 | USD | 400,000 | 395,018 | (4,982 | ) | ||||||||||||||||||||
12/02/2016 | Goldman Sachs | KRW | 223,539,506 | USD | 200,000 | 195,376 | (4,624 | ) | ||||||||||||||||||||
| Thai Baht/United States Dollar | ||||||||||||||||||||||||||||
| 11/23/2016 | Goldman Sachs | THB | 41,595,600 | USD | 1,200,000 | 1,187,986 | (12,014 | ) | ||||||||||||||||||||
| $ | 17,034,184 | $ | (170,816 | ) | ||||||||||||||||||||||||
| * | Certain contracts with different trade dates and like characteristics have been shown net. |
| Sale Contracts Settlement Date* | Counterparty | Amount Purchased | Amount Sold | Fair Value | Unrealized Appreciation/ (Depreciation) | |||||||||||||||||||||||
| United States Dollar/Chinese Yuan Renminbi Offshore | ||||||||||||||||||||||||||||
11/10/2016 | Citibank | USD | 200,000 | CNH | 1,340,395 | $ | 197,628 | $ | 2,372 | |||||||||||||||||||
11/10/2016 | Credit Suisse | USD | 600,000 | CNH | 3,995,940 | 589,160 | 10,840 | |||||||||||||||||||||
| United States Dollar/Indonesian Rupiah | ||||||||||||||||||||||||||||
11/18/2016 | Standard Chartered Bank | USD | 1,700,000 | IDR | 22,797,000,000 | 1,743,588 | (43,588 | ) | ||||||||||||||||||||
| United States Dollar/Malaysian Ringgit | ||||||||||||||||||||||||||||
01/20/2017 | Credit Suisse | USD | 1,800,000 | MYR | 7,472,340 | 1,774,762 | 25,238 | |||||||||||||||||||||
| United States Dollar/South Korean Won | ||||||||||||||||||||||||||||
12/02/2016 | Goldman Sachs | USD | 100,000 | KRW | 110,520,000 | 96,596 | 3,404 | |||||||||||||||||||||
12/02/2016 | Standard Chartered Bank | USD | 700,000 | KRW | 777,840,000 | 679,841 | 20,159 | |||||||||||||||||||||
| United States Dollar/Thai Baht | ||||||||||||||||||||||||||||
| 11/23/2016 | Goldman Sachs | USD | 100,000 | THB | 3,470,400 | 99,116 | 884 | |||||||||||||||||||||
| $ | 5,180,691 | $ | 19,309 | |||||||||||||||||||||||||
| * | Certain contracts with different trade dates and like characteristics have been shown net. |
See accompanying Notes to Financial Statements.
Annual Report 2016
10
Aberdeen Emerging Markets Debt Fund (Unaudited)
The Aberdeen Emerging Markets Debt Fund (Institutional Class net of fees) returned 14.78% for the 12-month period ended October 31, 2016, versus the 11.70% return of its benchmark, the J.P. Morgan Emerging Markets Bond (EMBI) Global Diversified Index, for the same period. For broader comparison, the average return of the Fund’s peer category of Emerging Markets Hard Currency Debt Funds (comprising 95 funds), as measured by Lipper, Inc., was 10.53% for the period.
Emerging-market debt posted significant gains over the 12-month period ended October 31, 2016. The asset class was under pressure in late 2015 due to “risk-off” market sentiment in the run-up to the U.S. Federal Reserve’s (Fed’s) first interest-rate hike in more than nine years in December 2015, but improved throughout the rest of the reporting period, across local and hard currency sovereign bonds, as well as corporate debt. The upward trend in oil prices throughout much of 2016, as well as record-low yields in developed markets, bolstered investor sentiment towards emerging markets. Additionally, investors reacted positively to regime changes in Argentina, Brazil and Peru.
The UK’s referendum on its European Union (EU) membership was the key risk event in the second quarter, but aside from a short-lived negative investor reaction, emerging markets maintained their strong performance.
The Fed, European Central Bank (ECB), Bank of England, Bank of Japan and People’s Bank of China all signaled the maintenance of accommodative monetary policy, providing a relative benign macroeconomic backdrop for emerging-market debt.
Regarding hard currency assets, high-yield sovereign bonds outperformed their investment-grade counterparts over the reporting period, with Venezuela, Ecuador, Zambia, Argentina and Ghana comprising the top performers within the benchmark J.P. Morgan EMBI Global Diversified Index, while Mozambique and Belize were the only markets to record negative returns. High-yield local-currency bonds also outperformed investment-grade bonds, led by Brazil, Indonesia and Russia. Mexico suffered losses as the market began to price in the risk of a victory by Donald Trump in the U.S. presidential election in early November 2016.
Fund performance for the reporting period was bolstered by an overweight in Brazil bonds and currency versus the benchmark, as well as overweight positions in Kazakhstan, Argentina and Ghana. Underweight positions in Poland, Lebanon, the Philippines and China also contributed to Fund performance. Conversely, the Fund’s currency allocations to Mexico and South Africa were the primary detractors from performance, along with the overweight position in Iraq and local currency exposure in Peru.
The Fund may invest in derivatives for hedging purposes and to gain risk exposure to countries, currencies and securities in which the Fund is permitted to invest. During the reporting period, the Fund’s use of currency forwards1 detracted 1.29% from Fund performance for the reporting period.
During the reporting period, we initiated a switch within Morocco, preferring the state-controlled fertilizer company Office Chérifien des Phosphates (OCP) to the sovereign issue, and exited the Fund’s position in Egypt. We added to the position in Ghana due to our expectation of further fiscal consolidation success. We participated in new issues from Mexican state-owned oil company Pemex, Paraguay, Ecuador, Mongolia and a new quasi-sovereign issue from Azerbaijan, Southern Gas Corridor – all of which we believed were attractively priced relative to their existing yield curves. Furthermore, we participated in Argentina’s first new Eurobond issuance since the country defaulted on its debt in 2001, choosing the 10-year bond, and also purchased Abu Dhabi’s new 10-year issue. We increased the Fund’s positions in Gabon, Senegal and Bahrain, where we think that the risk-return profile has become attractive. We exited the Fund’s position in Mozambique as the International Monetary Fund (IMF) deemed that the government had entered into a high risk of debt distress. In the local currency space, we added to the Fund’s position in Indonesia, while increasing the exposure to the Argentine peso, Mexican peso and Indonesian rupiah.
In our view, the U.S. presidential election in which Republican Donald Trump unexpectedly defeated former U.S. Secretary of State Hillary Clinton provides short-term risk to the asset class. However, looking beyond this event, we believe that a Fed interest-rate hike in December 2016, a constitutional referendum in Italy, a reversal of the Organization of the Petroleum Exporting Countries’ (OPEC’s) supply quota agreement, as well as a chance that the ECB moves away from its easing bias, provide other potential events which could cause an increase in market volatility. In contrast, we think that for most investors, the case for reallocating risk away from developed markets has become even more relevant, given the low yields in traditional fixed-income securities – roughly 25% of the bonds represented in the J.P. Morgan EMBI Global Diversified Index carry negative yields. We believe that fund flows into emerging-market debt should continue to provide a welcome backstop to market volatility, absorbing primary market issuance and providing the marginal demand for emerging-market assets.
Portfolio Management:
Aberdeen Emerging Markets Debt Team
PAST PERFORMANCE DOES NOT GUARANTEE FUTURE RESULTS.
The performance data quoted represents past performance and current returns may be lower or higher. Class A Shares have up to a 4.25% front-end sales charge and a 0.25% 12b-1 fee. The investment return and principal value will fluctuate so that an investor’s shares, when redeemed, may be worth more or less than the original cost. To obtain performance information
| 1 | A currency forward is a binding contract in the foreign exchange market that locks in the exchange rate for the purchase or sale of a currency on a future date. |
2016 Annual Report
11
Aberdeen Emerging Markets Debt Fund (Unaudited) (concluded)
current to the most recent month-end, which may be higher or lower than the performance shown above, please call 866-667-9231 or go to www.aberdeen-asset.us.
Investing in mutual funds involves risk, including the possible loss of principal.
Indexes are unmanaged and have been provided for comparison purposes only. No fees or expenses are reflected. You cannot invest directly in an index.
Lipper is a leading global provider of mutual fund information and analysis to fund companies, financial intermediaries and media organizations.
Risk Considerations
Fixed income securities are subject to certain risks including, but not limited to: interest rate (changes in interest rates may cause a decline in the market value of an investment), credit (changes in the financial condition of the issuer, borrower, counterparty, or underlying collateral), prepayment (debt issuers may repay or refinance their loans or obligations earlier than anticipated), and extension (principal repayments may not occur as quickly as anticipated, causing the expected maturity of a security to increase). The Fund’s investments in high yield bonds and other lower-rated securities will subject the Fund to substantial risk of loss.
Foreign securities may be more volatile, harder to price and less liquid than U.S. securities. They are subject to different accounting and regulatory standards, currency exchange rates, and political and economic risks. Fluctuation in currency exchange rates may impact the Fund’s returns more greatly to the extent the Fund does not hedge currency exposure or hedging techniques are unsuccessful. The foregoing risks are enhanced in emerging market countries.
The Fund is non-diversified and may hold larger positions in fewer securities than other funds and have greater risk than more diversified funds.
Derivatives are speculative and may hurt the Fund’s performance. They present the risk of disproportionately increased losses and/or reduced gains when the financial asset or measure to which the derivative is linked changes in unexpected ways.
Investing a significant portion of the Fund’s assets in securities of companies conducting business in a broadly related group of industries within an economic sector may make the Fund more vulnerable to unfavorable developments in that sector.
Please read the prospectus for more detailed information regarding these and other risks.
Annual Report 2016
12
Aberdeen Emerging Markets Debt Fund (Unaudited)
| Average Annual Total Return (For periods ended October 31, 2016) | 1 Yr. | Inception1 | ||||||||
Class A | w/o SC | 14.45% | 2.51% | |||||||
| w/SC2 | 9.58% | 1.41% | ||||||||
Class C | w/o SC | 13.62% | 1.77% | |||||||
| w/SC3 | 12.62% | 1.77% | ||||||||
Class R4 | w/o SC | 14.22% | 2.28% | |||||||
Institutional Service Class4 | w/o SC | 14.76% | 2.78% | |||||||
Institutional Class4 | w/o SC | 14.78% | 2.75% | |||||||
All figures showing the effect of a sales charge (SC) reflect the maximum charge possible because it has the most significant effect on performance data. The total returns shown above do not include the impact of financial statement rounding of the net asset value (NAV) per share and/or financial statement adjustments.
| 1 | The Fund commenced operations on November 1, 2012. |
| 2 | A 4.25% front-end sales charge was deducted. |
| 3 | A 1.00% contingent deferred sales charge (CDSC) was deducted from the one year return because it is charged when Class C shares are sold within the first year after purchase. |
| 4 | Not subject to any sales charges. |
2016 Annual Report
13
Aberdeen Emerging Markets Debt Fund (Unaudited)
Performance of a $1,000,000* Investment (as of October 31, 2016)
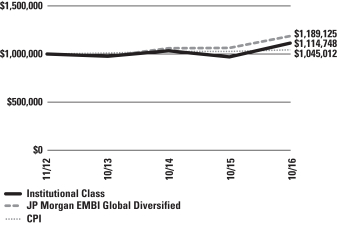
| * | Minimum Initial Investment |
Comparative performance of $1,000,000 invested in Institutional Class shares of the Aberdeen Emerging Markets Debt Fund, the J.P. Morgan Emerging Markets Bond Index (EMBI) Global Diversified Index and the Consumer Price Index (CPI) since inception. Unlike the Fund, the returns for these unmanaged indexes do not reflect any fees, expenses, or sales charges. Investors cannot invest directly in market indexes.
The J.P. Morgan EMBI Global Diversified Index is an alternatively weighted index that assigns a larger weight to less liquid issues from countries with smaller debt stocks and limits the weights of those index countries with larger debt stocks by only including a specified portion of these countries’ eligible current face amounts of debt outstanding. The index consists of U.S. dollar-denominated Brady bonds, Eurobonds, and traded loans issued by sovereign and quasisovereign entities issued in emerging markets countries.
The CPI is a measure of the average change over time in the prices paid by urban consumers for a market basket of consumer goods and services.
Investment return and principal value will fluctuate, and when redeemed, shares may be worth more or less than original cost. Past performance is no guarantee of future results. The Average Annual Total Return table and Performance graph do not reflect the deduction of taxes that a shareholder would pay on fund distributions or the redemption of fund shares. Investing in mutual funds involves market risk, including loss of principal. Performance returns assume the reinvestment of all distributions. Total returns reflect waivers and reimbursements in effect, without which returns would have been lower.
Portfolio Summary (as a percentage of net assets)
October 31, 2016 (Unaudited)
| Asset Allocation | ||||
Government Bonds | 76.1% | |||
Government Agencies | 10.6% | |||
Corporate Bonds | 10.4% | |||
Short-Term Investment | 2.3% | |||
Other assets in excess of liabilities | 0.6% | |||
| 100.0% | ||||
The following chart summarizes the composition of the Fund’s portfolio, expressed as a percentage of net assets. The industries listed below may include more than one industry group. As of October 31, 2016, the Fund did not have more than 25% of its assets invested in any industry group.
| Top Industries | ||||
Oil, Gas & Consumable Fuels | 4.0% | |||
Commercial Banks | 1.3% | |||
Diversified Telecommunication Services | 1.2% | |||
Chemicals | 1.1% | |||
Diversified Financial Services | 1.1% | |||
Electric Utilities | 1.0% | |||
Metals & Mining | 0.5% | |||
Airlines | 0.2% | |||
Engineering & Construction | –% | |||
Other | 89.6% | |||
| 100.0% | ||||
Amounts listed as “–” are 0% or round to 0%
| Top Holdings* | ||||
Argentine Republic Government International Bond 04/22/2026 | 5.2% | |||
Brazil Notas do Tesouro Nacional, Series F 01/01/2027 | 3.0% | |||
Turkey Government International Bond 10/09/2026 | 2.9% | |||
Mexico Government International Bond 01/11/2040 | 2.8% | |||
Ghana Government International Bond 01/18/2026 | 2.7% | |||
Dominican Republic International Bond 01/29/2026 | 2.6% | |||
Indonesia Government International Bond 01/15/2024 | 2.5% | |||
Ukraine Government International Bond 09/01/2019 | 2.4% | |||
Georgian Railway JSC 07/11/2022 | 2.4% | |||
Petrobras Global Finance BV 03/17/2024 | 2.4% | |||
Other | 71.1% | |||
| 100.0% | ||||
| * | For the purpose of listing top holdings, Short-Term Investments are included as part of Other. |
| Top Countries | ||||
Brazil | 8.1% | |||
Argentina | 7.3% | |||
Indonesia | 6.3% | |||
Mexico | 5.9% | |||
Turkey | 5.7% | |||
Ukraine | 4.0% | |||
Uruguay | 3.8% | |||
Dominican Republic | 3.2% | |||
Russia | 2.9% | |||
Ghana | 2.7% | |||
Other | 50.1% | |||
| 100.0% | ||||
Annual Report 2016
14
Statement of Investments
October 31, 2016
Aberdeen Emerging Markets Debt Fund
| Shares or Principal Amount | Value (US$) | |||||||
CORPORATE BONDS (10.4%) |
| |||||||
BRAZIL (3.2%) | ||||||||
Commercial Banks (0.2%) | ||||||||
Banco do Brasil SA (BRL), 9.75%, 07/18/2017 (a) | $ | 120,000 | $ | 36,513 | ||||
Engineering & Construction (0.0%) | ||||||||
OAS Investments GmbH (USD), 8.25%, 10/19/2019 (a)(b)(c) | 200,000 | 7,250 | ||||||
Oil, Gas & Consumable Fuels (3.0%) | ||||||||
Petrobras Global Finance BV | ||||||||
(USD), 7.88%, 03/15/2019 | 56,000 | 60,200 | ||||||
(USD), 8.38%, 05/23/2021 | 50,000 | 55,315 | ||||||
(USD), 6.25%, 03/17/2024 | 450,000 | 444,825 | ||||||
| 560,340 | ||||||||
| 604,103 | ||||||||
CHILE (1.2%) | ||||||||
Airlines (0.2%) | ||||||||
Latam Airlines 2015-1 Pass Through Trust A (USD), 4.20%, 11/15/2027 | 38,691 | 38,304 | ||||||
Electric Utilities (1.0%) | ||||||||
Empresa Electrica Angamos SA, 144A (USD), 4.88%, 05/25/2029 (a) | 200,000 | 196,637 | ||||||
| 234,941 | ||||||||
KAZAKHSTAN (1.0%) | ||||||||
Oil, Gas & Consumable Fuels (1.0%) | ||||||||
Tengizchevroil Finance Co. International Ltd. (USD), 4.00%, 08/15/2026 (a) | 200,000 | 192,815 | ||||||
KUWAIT (1.1%) | ||||||||
Diversified Financial Services (1.1%) | ||||||||
Equate Petrochemical BV, 144A (USD), 4.25%, 11/03/2026 (a) | 200,000 | 198,162 | ||||||
MOROCCO (1.1%) | ||||||||
Chemicals (1.1%) | ||||||||
OCP SA (USD), 5.63%, 04/25/2024 (a) | 200,000 | 215,040 | ||||||
PANAMA (1.1%) | ||||||||
Commercial Banks (1.1%) | ||||||||
Global Bank Corp., 144A (USD), 4.50%, 10/20/2021 (a) | 200,000 | 199,160 | ||||||
PERU (0.5%) | ||||||||
Metals & Mining (0.5%) | ||||||||
Southern Copper Corp. (USD), 5.88%, 04/23/2045 | 98,000 | 97,907 | ||||||
RUSSIA (1.2%) | ||||||||
Diversified Telecommunication Services (1.2%) | ||||||||
Vimpel Communications Via VIP Finance Ireland Ltd. OJSC (USD), 7.75%, 02/02/2021 (a) | 200,000 | 220,958 | ||||||
Total Corporate Bonds | 1,963,086 | |||||||
GOVERNMENT BONDS (76.1%) |
| |||||||
ANGOLA (1.0%) | ||||||||
Angolan Government International Bond (USD), 9.50%, 11/12/2025 (a) | 200,000 | 195,690 | ||||||
ARGENTINA (7.3%) | ||||||||
Argentine Bonos del Tesoro | ||||||||
(ARS), 18.20%, 10/03/2021 | 682,000 | 47,280 | ||||||
(ARS), 16.00%, 10/17/2023 | 2,168,000 | 144,867 | ||||||
Argentine Republic Government International Bond |
| |||||||
(USD), 7.50%, 04/22/2026 (a) | 901,000 | 984,343 | ||||||
(USD), 0.00%, 12/15/2035 (d) | 440,000 | 46,420 | ||||||
(USD), 7.13%, 07/06/2036 (a) | 150,000 | 154,650 | ||||||
| 1,377,560 | ||||||||
ARMENIA (1.1%) | ||||||||
Armenia International Bond (USD), 6.00%, 09/30/2020 (a) | 200,000 | 206,750 | ||||||
BAHRAIN (1.1%) | ||||||||
Bahrain Government International Bond, 144A (USD), 7.00%, 10/12/2028 (a) | 210,000 | 216,300 | ||||||
BRAZIL (4.9%) | ||||||||
Brazil Notas do Tesouro Nacional | ||||||||
Series F (BRL), 10.00%, 01/01/2025 | 1,010,000 | 295,474 | ||||||
Series F (BRL), 10.00%, 01/01/2027 | 2,000,000 | 577,273 | ||||||
Series B (BRL), 6.00%, 08/15/2050 (e) | 176,416 | 57,362 | ||||||
| 930,109 | ||||||||
CROATIA (1.2%) | ||||||||
Croatia Government International Bond (USD), 5.50%, 04/04/2023 (a) | 200,000 | 218,000 | ||||||
DOMINICAN REPUBLIC (3.2%) | ||||||||
Dominican Republic International Bond | ||||||||
(USD), 6.88%, 01/29/2026 (a) | 440,000 | 487,300 | ||||||
(USD), 6.85%, 01/27/2045 (a) | 120,000 | 124,800 | ||||||
| 612,100 | ||||||||
ECUADOR (2.2%) | ||||||||
Ecuador Government International Bond (USD), 10.75%, 03/28/2022 (a) | 400,000 | 423,000 | ||||||
EL SALVADOR (1.2%) | ||||||||
El Salvador Government International Bond (USD), 5.88%, 01/30/2025 (a) | 230,000 | 227,700 | ||||||
ETHIOPIA (2.0%) | ||||||||
Ethiopia International Bond (USD), 6.63%, 12/11/2024 (a) | 400,000 | 378,440 | ||||||
GABON (1.9%) | ||||||||
Gabon Government International Bond (USD), 6.38%, 12/12/2024 (a) | 400,000 | 366,712 | ||||||
GHANA (2.7%) | ||||||||
Ghana Government International Bond (USD), 8.13%, 01/18/2026 (a) | 530,000 | 507,618 | ||||||
HONDURAS (1.7%) | ||||||||
Honduras Government International Bond (USD), 7.50%, 03/15/2024 (a) | 290,000 | 323,350 | ||||||
See accompanying Notes to Financial Statements.
2016 Annual Report
15
Statement of Investments (continued)
October 31, 2016
Aberdeen Emerging Markets Debt Fund
| Shares or Principal Amount | Value (US$) | |||||||
INDONESIA (4.7%) | ||||||||
Indonesia Government International Bond (USD), 5.88%, 01/15/2024 (a) | $ | 410,000 | $ | 475,634 | ||||
Indonesia Treasury Bond | ||||||||
Series FR71 (IDR), 9.00%, 03/15/2029 | 2,970,000,000 | 252,204 | ||||||
Series FR68 (IDR), 8.38%, 03/15/2034 | 2,020,000,000 | 162,167 | ||||||
| 890,005 | ||||||||
IVORY COAST (1.9%) |
| |||||||
Ivory Coast Government International Bond (USD), 5.75%, 12/31/2032 (a)(f) | 366,300 | 358,813 | ||||||
JAMAICA (1.2%) |
| |||||||
Jamaica Government International Bond (USD), 7.88%, 07/28/2045 | 200,000 | 230,528 | ||||||
KENYA (1.1%) |
| |||||||
Kenya Government International Bond (USD), 6.88%, 06/24/2024 (a) | 200,000 | 199,500 | ||||||
MALAYSIA (0.8%) |
| |||||||
Malaysia Government Bond (MYR), 4.25%, 05/31/2035 | 600,000 | 141,826 | ||||||
MEXICO (3.5%) |
| |||||||
Mexican Bonos, Series M (MXN), 5.75%, 03/05/2026 | 2,570,000 | 131,155 | ||||||
Mexico Government International Bond (USD), 6.05%, 01/11/2040 | 452,000 | 537,315 | ||||||
| 668,470 | ||||||||
MONGOLIA (1.1%) |
| |||||||
Mongolia Government International Bond (USD), 10.88%, 04/06/2021 (a) | 200,000 | 216,006 | ||||||
NAMIBIA (1.2%) |
| |||||||
Namibia International Bonds (USD), 5.25%, 10/29/2025 (a) | 220,000 | 228,538 | ||||||
PAKISTAN (1.2%) |
| |||||||
Pakistan Government International Bond (USD), 8.25%, 04/15/2024 (a) | 200,000 | 225,288 | ||||||
PARAGUAY (1.7%) |
| |||||||
Paraguay Government International Bond (USD), 6.10%, 08/11/2044 (a) | 300,000 | 331,500 | ||||||
QATAR (1.1%) |
| |||||||
Qatar Government International Bond (USD), 3.25%, 06/02/2026 (a) | 200,000 | 202,500 | ||||||
RUSSIA (1.7%) |
| |||||||
Russian Federal Bond — OFZ (RUB), 8.50%, 09/17/2031 | 7,350,000 | 115,986 | ||||||
Russian Foreign Bond — Eurobond (USD), 5.00%, 04/29/2020 (a) | 200,000 | 213,376 | ||||||
| 329,362 | ||||||||
RWANDA (1.3%) |
| |||||||
Rwanda International Government Bond (USD), 6.63%, 05/02/2023 (a) | 250,000 | 250,043 | ||||||
SENEGAL (1.1%) |
| |||||||
Senegal Government International Bond (USD), 6.25%, 07/30/2024 (a) | 200,000 | 205,608 | ||||||
SERBIA (2.2%) |
| |||||||
Serbia International Bond (USD), 7.25%, 09/28/2021 (a) | 360,000 | 413,460 | ||||||
SOUTH AFRICA (1.8%) |
| |||||||
Republic of South Africa Government International Bond (USD), 5.88%, 05/30/2022 | 310,000 | 349,797 | ||||||
TANZANIA (0.9%) |
| |||||||
Tanzania Government International Bond (USD), 7.25%, 03/09/2020 (a)(d) | 155,556 | 162,036 | ||||||
TURKEY (5.7%) |
| |||||||
Turkey Government International Bond |
| |||||||
(USD), 6.25%, 09/26/2022 | 200,000 | 217,558 | ||||||
(USD), 5.75%, 03/22/2024 | 200,000 | 212,586 | ||||||
(USD), 7.38%, 02/05/2025 | 90,000 | 105,415 | ||||||
(USD), 4.88%, 10/09/2026 | 550,000 | 548,350 | ||||||
| 1,083,909 | ||||||||
UKRAINE (4.0%) |
| |||||||
Ukraine Government International Bond | ||||||||
(USD), 7.75%, 09/01/2019 (a) | 462,000 | 460,614 | ||||||
(USD), 7.75%, 09/01/2020 (a) | 100,000 | 99,105 | ||||||
(USD), 7.75%, 09/01/2026 (a) | 120,000 | 114,396 | ||||||
(USD), 0.00%, 05/31/2040 (a)(d) | 295,000 | 93,241 | ||||||
| 767,356 | ||||||||
UNITED ARAB EMIRATES (1.0%) | ||||||||
Emirate of Dubai Government International Bonds (USD), 5.25%, 01/30/2043 (a) | 200,000 | 191,000 | ||||||
URUGUAY (3.8%) | ||||||||
Uruguay Government International Bond | ||||||||
(UYU), 4.25%, 04/05/2027 (e) | 8,273,121 | 267,728 | ||||||
(USD), 4.38%, 10/27/2027 | 30,000 | 31,688 | ||||||
(USD), 5.10%, 06/18/2050 | 420,000 | 418,425 | ||||||
| 717,841 | ||||||||
VENEZUELA (1.6%) | ||||||||
Venezuela Government International Bond (USD), 7.75%, 10/13/2019 (a) | 583,500 | 296,126 | ||||||
Total Government Bonds | 14,442,841 | |||||||
GOVERNMENT AGENCIES (10.6%) | ||||||||
AZERBAIJAN (1.5%) | ||||||||
Southern Gas Corridor CJSC (USD), 6.88%, 03/24/2026 (a)(g) | 250,000 | 282,020 | ||||||
GEORGIA (2.4%) | ||||||||
Georgian Railway JSC (USD), 7.75%, 07/11/2022 (a) | 400,000 | 446,000 | ||||||
See accompanying Notes to Financial Statements.
Annual Report 2016
16
Statement of Investments (continued)
October 31, 2016
Aberdeen Emerging Markets Debt Fund
| Shares or Principal Amount | Value (US$) | |||||||
INDONESIA (1.6%) | ||||||||
Pertamina Persero PT (USD), 6.00%, 05/03/2042 (a) | $ | 290,000 | $ | 305,769 | ||||
KAZAKHSTAN (1.1%) | ||||||||
Kazakhstan Temir Zholy Finance BV (USD), 6.95%, 07/10/2042 (a) | 200,000 | 206,172 | ||||||
MEXICO (2.4%) | ||||||||
Petroleos Mexicanos | ||||||||
(USD), 6.63%, 06/15/2038 | 170,000 | 168,725 | ||||||
(USD), 5.63%, 01/23/2046 | 340,000 | 294,015 | ||||||
| 462,740 | ||||||||
TUNISIA (1.2%) | ||||||||
Banque Centrale de Tunisie International Bond (USD), 5.75%, 01/30/2025 (a) | 240,000 | 231,439 | ||||||
VENEZUELA (0.4%) | ||||||||
Petroleos de Venezuela SA (USD), 5.25%, 04/12/2017 (a) | 98,300 | 79,132 | ||||||
Total Government Agencies | 2,013,272 | |||||||
SHORT-TERM INVESTMENT (2.3%) |
| |||||||
UNITED STATES (2.3%) | ||||||||
State Street Institutional U.S. Government Money Market Fund (h) | 429,660 | 429,660 | ||||||
Total Short-Term Investment | 429,660 | |||||||
Total Investments | 18,848,859 | |||||||
Other assets in excess of liabilities—0.6% | 125,860 | |||||||
Net Assets—100.0% | $ | 18,974,719 | ||||||
| (a) | Denotes a security issued under Regulation S or Rule 144A. |
| (b) | Security is in default. |
| (c) | Illiquid security. |
| (d) | Variable or Floating Rate Security. Rate disclosed is as of October 31, 2016. |
| (e) | Inflation linked security. |
| (f) | Indicates a stepped coupon bond. This bond was issued with a low coupon that gradually increases over the life of the bond. |
| (g) | This security is government guaranteed. |
| (h) | Registered investment company advised by State Street Global Advisors. |
| (i) | See accompanying Notes to Financial Statements for tax unrealized appreciation/(depreciation) of securities. |
| ARS | Argentine Peso |
| BRL | Brazilian Real |
| COP | Colombian Peso |
| IDR | Indonesian Rupiah |
| INR | Indian Rupee |
| MXN | Mexican Peso |
| MYR | Malaysian Ringgit |
| RUB | New Russian Ruble |
| USD | U.S. Dollar |
| UYU | Uruguayan Peso |
At October 31, 2016, the Fund’s open forward foreign currency exchange contracts were as follows:
| Purchase Contracts Settlement Date* | Counterparty | Amount Purchased | Amount Sold | Fair Value | Unrealized Appreciation/ (Depreciation) | |||||||||||||||||||||||
| Argentine Peso/United States Dollar | ||||||||||||||||||||||||||||
11/21/2016 | Citibank | ARS | 3,989,000 | USD | 235,504 | $ | 260,010 | $ | 24,506 | |||||||||||||||||||
12/20/2016 | Citibank | ARS | 1,477,000 | USD | 84,642 | 94,699 | 10,057 | |||||||||||||||||||||
| Indian Rupee/United States Dollar | ||||||||||||||||||||||||||||
11/23/2016 | Citibank | INR | 12,454,000 | USD | 184,133 | 185,908 | 1,775 | |||||||||||||||||||||
| Malaysian Ringgit/United States Dollar | ||||||||||||||||||||||||||||
11/23/2016 | Goldman Sachs | MYR | 256,000 | USD | 63,952 | 60,951 | (3,001 | ) | ||||||||||||||||||||
11/23/2016 | JPMorgan Chase | MYR | 508,000 | USD | 127,606 | 120,950 | (6,656 | ) | ||||||||||||||||||||
| Mexican Peso/United States Dollar | ||||||||||||||||||||||||||||
| 01/11/2017 | Citibank | MXN | 1,131,000 | USD | 59,443 | 59,391 | (52 | ) | ||||||||||||||||||||
| $ | 781,909 | $ | 26,629 | |||||||||||||||||||||||||
| * | Certain contracts with different trade dates and like characteristics have been shown net. |
See accompanying Notes to Financial Statements.
2016 Annual Report
17
Statement of Investments (concluded)
October 31, 2016
Aberdeen Emerging Markets Debt Fund
| Sale Contracts Settlement Date* | Counterparty | Amount Purchased | Amount Sold | Fair Value | Unrealized Appreciation/ (Depreciation) | |||||||||||||||||||||||
| United States Dollar/Argentine Peso | ||||||||||||||||||||||||||||
11/21/2016 | Citibank | USD | 82,857 | ARS | 1,334,000 | $ | 86,952 | $ | (4,095 | ) | ||||||||||||||||||
11/21/2016 | JPMorgan Chase | USD | 169,648 | ARS | 2,655,000 | 173,057 | (3,409 | ) | ||||||||||||||||||||
12/20/2016 | Goldman Sachs | USD | 93,186 | ARS | 1,477,000 | 94,699 | (1,513 | ) | ||||||||||||||||||||
| United States Dollar/Brazilian Real | ||||||||||||||||||||||||||||
11/23/2016 | Goldman Sachs | USD | 579,842 | BRL | 1,920,000 | 598,027 | (18,185 | ) | ||||||||||||||||||||
| United States Dollar/Colombian Peso | ||||||||||||||||||||||||||||
11/23/2016 | Deutsche Bank | USD | 279,098 | COP | 820,954,000 | 272,119 | 6,979 | |||||||||||||||||||||
11/23/2016 | Goldman Sachs | USD | 102,712 | COP | 306,355,000 | 101,547 | 1,165 | |||||||||||||||||||||
| United States Dollar/Indian Rupee | ||||||||||||||||||||||||||||
11/23/2016 | Citibank | USD | 184,059 | INR | 12,454,000 | 185,908 | (1,849 | ) | ||||||||||||||||||||
| United States Dollar/Indonesian Rupiah | ||||||||||||||||||||||||||||
11/23/2016 | Citibank | USD | 92,524 | IDR | 1,226,399,000 | 93,738 | (1,214 | ) | ||||||||||||||||||||
11/23/2016 | Deutsche Bank | USD | 161,063 | IDR | 2,125,224,000 | 162,439 | (1,376 | ) | ||||||||||||||||||||
| United States Dollar/Malaysian Ringgit | ||||||||||||||||||||||||||||
| 11/23/2016 | Goldman Sachs | USD | 143,030 | MYR | 593,000 | 141,188 | 1,842 | |||||||||||||||||||||
| $ | 1,909,674 | $ | (21,655 | ) | ||||||||||||||||||||||||
| * | Certain contracts with different trade dates and like characteristics have been shown net. |
See accompanying Notes to Financial Statements.
Annual Report 2016
18
Aberdeen Global Unconstrained Fixed Income Fund (Unaudited)
Effective August 15, 2016, the Fund changed its investment objective and strategy and changed its name from Aberdeen Global Fixed Income Fund to Aberdeen Global Unconstrained Fixed Income Fund. The Bank of America Merrill Lynch (BofA ML) 3-Month U.S. Treasury Note Index replaced the Bloomberg Barclays Global Aggregate Bond Index as the Fund’s benchmark index in connection with the change in the Fund’s investment objective and strategy. Performance information for periods prior to August 15, 2016 does not reflect the current investment strategy.
The Aberdeen Global Unconstrained Fixed Income Fund (Institutional Class shares net of fees) returned 8.45% for the 12-month period ended October 31, 2016, versus the 0.33% return for its benchmark, the Bank of America Merrill Lynch (BofA ML) 3-Month U.S. Treasury Note Index, and the 5.59% return of the broad-market Bloomberg Barclays Global Aggregate Bond Index, for the same period. For broader comparison, the average return of the Fund’s peer category of Global Income Funds (comprising 65 funds), as measured by Lipper, Inc., was 4.71% for the period.
Global yield curves flattened over the 12-month reporting period amid accommodative central bank monetary policy, tumbling commodity prices and political uncertainty – a favorable environment for the performance of government bonds. However, yield curves steepened in the final quarter of 2016, driven mainly by expectations of monetary stimulus in Japan. In December 2015, the U.S. the Federal Reserve (Fed) raised the fed funds rate by 25 basis points (0.25%) to a range of 0.25% to 0.50%. The move was widely anticipated after several months of signals from various Fed governors. At the Federal Open Market Committee meeting in September 2016, the Fed’s comments generally were more dovish than expected, which the market viewed as supportive of both risk assets and core government bonds.
In late June 2016, The UK voted to leave the European Union (EU) by a margin of 52% to 48%. As the outcome was widely unexpected, the sterling fell to a 30-year low against the U.S. dollar, while risk assets initially sold off. Theresa May became Britain’s prime minister in July 2016. Her first move was to appoint a number of “Brexit”1 campaigners in key roles to drive EU-exit negotiations, including Phillip Hammond as the new Chancellor of the Exchequer. After the initial shock, markets were assuaged by the Bank of England’s assurance of intervention; the central bank announced a comprehensive package of monetary easing – including an interest-rate cut and credit easing – driving equity and bond prices above their pre-Brexit referendum levels
The European Central Bank (ECB) eased monetary policy several times, initially disappointing the market in December with a deposit-rate cut and extending bond purchases to March 2017. However, at its meeting in December 2015, the central bank exceeded expectations by increasing its monthly purchases to €80 billion (about US$83.5 billion), and extending the scope of its purchases to include euro-denominated corporate bonds. Furthermore, the ECB cut the deposit rate to -0.4%. With continued soft European economic data concerns over the Italian banking sector, and fallout from the UK referendum, the market anticipated another extension or expansion of bond purchases. However, the ECB failed to deliver, and European government bonds sold off sharply.
The Bank of Japan (BoJ) unexpectedly cut its policy rate to -0.1% in January in an effort to combat deflation. In September 2016, the central bank announced its latest change to its monetary policy package – qualitative and quantitative easing with “yield-curve control.”2 The BoJ indicated that it would target purchases at varying maturities in a bid to maintain the 10-year Japanese government bond yield close to 0%, and steepen the yield curve in a bid to support the banking sector.
The Fund’s overweight allocations to the credit and financial sectors relative to the broad-market Bloomberg Barclays Global Aggregate Bond Index had a positive impact on performance for the reporting period. The global corporate bond markets saw weak performance in the beginning of the first quarter of 2016 amid investors’ concerns surrounding the decline in oil prices, economic growth in China, and credit concerns at Deutsche Bank. We reduced the Fund’s overweight to the corporate sector, especially within the energy segment. However, we maintained the Fund’s overweight positioning in other sectors, as we believe that the relatively low valuations of oversold bonds will increase.
In currency positioning over the reporting period, the underweight allocation to the euro versus the Japanese yen bolstered performance following the UK’s vote to leave the EU, as investors sought “safe-haven” assets. The Fund’s underweight position in the euro versus the sterling also performed well in the first half of the reporting period. Conversely, short exposures to the Australian and New Zealand dollars weighed on Fund performance despite both central banks cutting interest rates as policymakers’ rhetoric suggested that further monetary easing was unlikely.
Within the Fund’s interest-rate strategies, overweight positions in the front end of the yield curve in Australia and New Zealand detracted from Fund performance for the reporting period. However, this was offset by a short UK duration position relative to the Bloomberg Barclays Global Aggregate Bond Index, which performed well towards the end of the period as expectations of fiscal stimulus from the UK government following the Brexit vote prompted a rise in yields. Fund
| 1 | “Brexit” is an abbreviation of “British exit,” which refers to the June 23, 2016 referendum by British voters to exit the European Union. |
| 2 | Under its monetary easing policy of “yield curve control,” the Bank of Japan is maintaining the yield on its 10-year government bond at 0% in an effort to increase the yield difference between short-term bonds, which are negative, and their long-term counterparts |
2016 Annual Report
19
Aberdeen Global Unconstrained Fixed Income Fund (Unaudited) (concluded)
performance also benefited from the U.S. and Australia yield-curve positioning, as well as a long breakeven3 position in the U.S.
Regarding the use of derivatives in the Fund, we employed bond futures over the reporting period in a bid to achieve efficient portfolio management purposes and to hedge interest-rate risk. We employed interest rate swaps in an effort to efficiently gain or hedge interest-rate risk. We also used credit default swaps4 as part of the Fund’s hedging strategy to reduce the Fund’s exposure to the performance of the credit market. Finally, we employed foreign exchange forwards as a hedging strategy to manage currency exposure. The derivatives positions contributed 3.11% to Fund performance for the reporting period.
During the reporting period, we increased the Fund’s overweight position in corporate bonds following the Brexit vote as our uncertainty about fundamentals in the sector receded. Additionally, we rotated out of certain financial positions during the rally in the third quarter of 2016, as they achieved our performance targets. At the end of the reporting period, the Fund remained overweight to corporate bonds, but broadly neutral with respect to interest-rate positioning.
The global markets’ reaction in the immediate aftermath of the U.S. presidential election not only reflected surprise over Donald Trump’s win but also resulted in elevated uncertainty that we think could prevail going into 2017. U.S. Treasuries and some Asian bond markets initially rallied but subsequently sold off, with current yields generally higher than their pre-election levels. The U.S. dollar weakened against its G105 peers but later reversed course, and more recently was firmer against most G10 and emerging-market currencies. Credit spreads narrowed after widening initially. We believe that investors will have to wait for President-elect Trump to set policy direction when he takes office in January 2017. Early assumptions are for the U.S. to embark on fiscal stimulus, which could prove inflationary and cause U.S. Treasury yields to rise further. The Fed also is generally expected to continue on its path of monetary policy normalization, provided that investor sentiment and financial conditions are stable. For Asia and emerging markets, we think that a key risk stems from a potential increase in U.S. protectionism and its impact on global trade. On a positive note, we believe that most central banks still have some room to cut rates if they choose.
We remain constructive on corporate bond valuations and cautious about the direction of interest rates. It appears that investors are beginning to shift their attention away from central banking monetary policy easing and are seeking to establish how successful governments’ fiscal policies will be in fostering growth in the global economy.
Portfolio Management:
Aberdeen Global Fixed Income Team
PAST PERFORMANCE DOES NOT GUARANTEE FUTURE RESULTS.
The performance data quoted represents past performance and current returns may be lower or higher. Class A Shares have up to a 4.25% front-end sales charge and a 0.25% 12b-1 fee. The investment return and principal value will fluctuate so that an investor’s shares, when redeemed, may be worth more or less than the original cost. To obtain performance information current to the most recent month-end, which may be higher or lower than the performance shown above, please call 866-667-9231 or go to www.aberdeen-asset.us.
Investing in mutual funds involves risk, including the possible loss of principal.
Indexes are unmanaged and have been provided for comparison purposes only. No fees or expenses are reflected. You cannot invest directly in an index.
Lipper is a leading global provider of mutual fund information and analysis to fund companies, financial intermediaries and media organizations.
Risk Considerations
Fixed income securities are subject to certain risks including, but not limited to: interest rate (changes in interest rates may cause a decline in the market value of an investment), credit (changes in the financial condition of the issuer, borrower, counterparty, or underlying collateral), prepayment (debt issuers may repay or refinance their loans or obligations earlier than anticipated), and extension (principal repayments may not occur as quickly as anticipated, causing the expected maturity of a security to increase).
Foreign securities may be more volatile, harder to price and less liquid than U.S. securities. They are subject to different accounting and regulatory standards, currency exchange rates, and political and economic risks. Fluctuation in currency exchange rates may impact the Fund’s returns more greatly to the extent the Fund does not hedge currency exposure or hedging techniques are unsuccessful. The foregoing risks are enhanced in emerging market countries.
Derivatives are speculative and may hurt the Fund’s performance. They present the risk of disproportionately increased losses and/or reduced gains when the financial asset or measure to which the derivative is linked changes in unexpected ways.
Investing a significant portion of the Fund’s assets in securities of companies conducting business in a broadly related group of industries within an economic sector may make the Fund more vulnerable to unfavorable developments in that sector.
Please read the prospectus for more detailed information regarding these and other risks.
| 3 | The breakeven rate is the difference between the yield on a nominal fixed-rate bond and the real yield on an inflation-linked bond (such as a Treasury Inflation-Protected Security, or TIPS) of similar maturity and credit quality. |
| 4 | A credit default swap is contract that transfers the credit exposure of fixed income products between two or more parties. |
| 5 | The G10 nations include Belgium, Canada, France, Germany, Italy, Japan, the Netherlands, Sweden, Switzerland, the UK and the U.S. |
Annual Report 2016
20
Aberdeen Global Unconstrained Fixed Income Fund (Unaudited)
| Average Annual Total Return1 (For periods ended October 31, 2016) | 1 Yr. | 5 Yr. | 10 Yr. | |||||||||||
Class A | w/o SC | 8.13% | 0.55% | 3.30% | ||||||||||
| w/SC2 | 3.51% | (0.33% | ) | 2.85% | ||||||||||
Class C | w/o SC | 7.44% | (0.17% | ) | 2.53% | |||||||||
| w/SC3 | 6.44% | (0.17% | ) | 2.53% | ||||||||||
Institutional Service Class4,5 | w/o SC | 8.34% | 0.65% | 3.46% | ||||||||||
Institutional Class4,6 | w/o SC | 8.45% | 0.84% | 3.56% | ||||||||||
All figures showing the effect of a sales charge (SC) reflect the maximum charge possible because it has the most significant effect on performance data. The total returns shown above do not include the impact of financial statement rounding of the net asset value (NAV) per share and/or financial statement adjustments.
| 1 | The Fund changed its investment objective and strategies effective August 15, 2016. Performance information for periods prior to August 15, 2016 does not reflect the current investment strategy. Returns presented for the Fund prior to July 20, 2009 reflect the performance of the predecessor fund (the “Predecessor Fund”). Returns of the Predecessor Fund have not been adjusted to reflect the expenses applicable to the respective classes. The investment objective and strategies of the Fund, prior to the changes noted above, and those of the Predecessor Fund were substantially similar. Please consult the Fund’s prospectus for more detail. |
| 2 | A 4.25% front-end sales charge was deducted. |
| 3 | A 1.00% contingent deferred sales charge (CDSC) was deducted from the one year return because it is charged when Class C shares are sold within the first year after purchase. |
| 4 | Not subject to any sales charges. |
| 5 | Returns before the first offering of the Institutional Service Class Shares (July 20, 2009) are based on the previous performance of Common Class shares of the Predecessor Fund. Excluding the effect of any fee waivers or reimbursements, this performance is substantially similar to what Institutional Service Class would have produced because both classes invest in the same portfolio of securities. Returns would only differ to the extent of the differences in expenses between the two classes. |
| 6 | Returns before the first offering of the Institutional Class Shares (July 20, 2009) are based on the previous performance of the Common Class shares of the Predecessor Fund. Excluding the effect of any fee waivers or reimbursements, this performance is substantially similar to what Institutional Class shares would have produced because both classes invest in the same portfolio of securities. Returns would only differ to the extent of the differences in expenses between the two classes. |
2016 Annual Report
21
Aberdeen Global Unconstrained Fixed Income Fund (Unaudited)
Performance of a $1,000,000 Investment* (as of October 31, 2016)
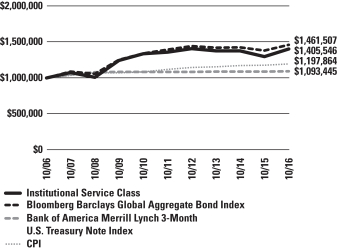
| * | Minimum Initial Investment |
Comparative performance of $1,000,000 invested in Institutional Service Class shares of the Aberdeen Global Unconstrained Fixed Income Fund, the Bank of America Merrill Lynch 3-Month U.S. Treasury Note Index, the Bloomberg Barclays Global Aggregate Bond Index and the Consumer Price Index (CPI) over a 10-year period ended October 31, 2016. Unlike the Fund, the returns for these unmanaged indexes do not reflect any fees, expenses, or sales charges. Investors cannot invest directly in market indexes.
Effective August 15, 2016, the Bank of America Merrill Lynch 3-Month U.S. Treasury Note Index replaced the Bloomberg Barclays Global Aggregate Bond Index as the Fund’s benchmark index in connection with the change in the Fund’s investment objective and strategy. The Bloomberg Barclays Global Aggregate Bond Index is a broad-based index that measures the global investment grade fixed-rate debt markets inclusive of three major components: U.S. Aggregate Bond Index, the Pan-European Aggregate Index, and the Asian-Pacific Aggregate Index.
The CPI is a measure of the average change over time in the prices paid by urban consumers for a market basket of consumer goods and services.
Investment return and principal value will fluctuate, and when redeemed, shares may be worth more or less than original cost. Past performance is no guarantee of future results. The Average Annual Total Return table and Performance graph do not reflect the deduction of taxes that a shareholder would pay on fund distributions or the redemption of fund shares. Investing in mutual funds involves market risk, including loss of principal. Performance returns assume the reinvestment of all distributions. Total returns reflect waivers and reimbursements in effect, without which returns would have been lower.
Portfolio Summary (as a percentage of net assets)
October 31, 2016 (Unaudited)
| Asset Allocation | ||||
Corporate Bonds | 74.7% | |||
Government Bonds | 10.4% | |||
U.S. Treasuries | 9.8% | |||
Short-Term Investment | 3.1% | |||
Government Agencies | 1.3% | |||
Commercial Mortgage-Backed Securities | 1.1% | |||
Residential Mortgage-Backed Securities | 0.4% | |||
Liabilities in excess of other assets | (0.8)% | |||
| 100.0% | ||||
The following chart summarizes the composition of the Fund’s portfolio, expressed as a percentage of net assets. The industries listed below may include more than one industry group. As of October 31, 2016, the Fund did not have more than 25% of its assets invested in any industry group.
| Top Industries | ||||
Commercial Banks | 23.4% | |||
Oil, Gas & Consumable Fuels | 7.1% | |||
Insurance | 6.8% | |||
Diversified Financial Services | 5.7% | |||
Auto Manufacturers | 4.4% | |||
Electric Utilities | 3.7% | |||
Diversified Telecommunication Services | 3.4% | |||
Metals & Mining | 3.2% | |||
Pharmaceutical | 2.7% | |||
Media | 2.5% | |||
Other | 37.1% | |||
| 100.0% | ||||
Annual Report 2016
22
Aberdeen Global Unconstrained Fixed Income Fund (Unaudited) (concluded)
| Top Holdings* | ||||
U.S. Treasury Bill 01/19/2017 | 3.9% | |||
Spain Government Bond 01/31/2017 | 2.5% | |||
U.S. Treasury Notes 09/30/2021 | 1.9% | |||
U.S. Treasury Note 09/30/2020 | 1.8% | |||
U.S. Treasury Notes 03/31/2021 | 1.8% | |||
Industrial & Commercial Bank of China Ltd. 10/20/2021 | 1.6% | |||
Capital One NA/Mclean VA 09/13/2019 | 1.6% | |||
Sumitomo Mitsui Banking Corp. 10/19/2018 | 1.6% | |||
Svenska Handelsbanken AB 09/06/2019 | 1.6% | |||
Ford Motor Credit Co. LLC 02/01/2021 | 1.4% | |||
Other | 80.3% | |||
| 100.0% | ||||
| * | For the purpose of listing top holdings, Short-Term Investments are included as part of Other. |
| Top Countries | ||||
United States | 42.7% | |||
Netherlands | 12.3% | |||
United Kingdom | 11.7% | |||
France | 4.8% | |||
Canada | 3.1% | |||
Japan | 2.9% | |||
Sweden | 2.9% | |||
Spain | 2.5% | |||
Republic of Ireland | 1.7% | |||
China | 1.5% | |||
Other | 13.9% | |||
| 100.0% | ||||
2016 Annual Report
23
Statement of Investments
October 31, 2016
Aberdeen Global Unconstrained Fixed Income Fund
| Shares or Principal Amount | Value (US$) | |||||||
COMMERCIAL MORTGAGE-BACKED SECURITIES (1.1%) |
| |||||||
UNITED STATES (1.1%) | ||||||||
Commercial Mortgage Pass Through Certificates, Series 2007-C9, Class AMFL (USD), 1.17%, 12/10/2049 (a)(b) | $ | 10,000 | $ | 9,868 | ||||
JP Morgan Mortgage Trust, Series 14-IVR3, Class 2A1 (USD), 3.00%, 09/25/2044 (a)(b) | 39,398 | 40,273 | ||||||
SFAVE Commercial Mortgage Securities Trust, Series 2015-5AVE, Class D (USD), 4.39%, 01/05/2043 (a)(b) | 138,000 | 116,050 | ||||||
Wells Fargo Mortgage Backed Securities Trust, Series 2003-N, Class 1A1 (USD), 2.76%, 12/25/2033 (b) | 8,535 | 8,458 | ||||||
| 174,649 | ||||||||
Total Commercial Mortgage-Backed Securities | 174,649 | |||||||
RESIDENTIAL MORTGAGE-BACKED SECURITIES (0.4%) |
| |||||||
UNITED STATES (0.4%) | ||||||||
BCAP LLC Trust, Series 2009-RR6, Class 3A1 (USD), 3.21%, 12/26/2037 (a)(b) | 21,191 | 21,168 | ||||||
JP Morgan Re-Remic | ||||||||
Series 2009-8, Class A1 (USD), 3.29%, 04/20/2036 (a)(b) | 2,223 | 2,223 | ||||||
Series 2009-7, Class 2A1 (USD), 6.00%, 02/27/2037 (a)(b) | 13,728 | 13,930 | ||||||
Series 2009-7, Class 17A1 (USD), 5.56%, 07/27/2037 (a)(b) | 27,583 | 27,185 | ||||||
| 64,506 | ||||||||
Total Residential Mortgage-Backed Securities | 64,506 | |||||||
CORPORATE BONDS (74.7%) | ||||||||
AUSTRALIA (0.9%) | ||||||||
Commercial Banks (0.1%) | ||||||||
Suncorp-Metway Ltd. (USD), 2.10%, 05/03/2019 (a) | 20,000 | 20,090 | ||||||
Metals & Mining (0.8%) | ||||||||
BHP Billiton Finance Ltd. (EUR), 4.75%, 04/22/2076 (a)(b) | 100,000 | 119,250 | ||||||
| 139,340 | ||||||||
BRAZIL (0.3%) | ||||||||
Food Products (0.3%) | ||||||||
Marfrig Overseas Ltd. (USD), 9.63%, 11/16/2016 (a) | 60,000 | 59,925 | ||||||
BRITISH VIRGIN ISLANDS (1.2%) | ||||||||
Oil, Gas & Consumable Fuels (1.2%) | ||||||||
Sinopec Group Overseas Development 2016 Ltd. (USD), 2.13%, 05/03/2019 (a) | 200,000 | 200,886 | ||||||
CANADA (3.1%) | ||||||||
Media (0.5%) | ||||||||
Shaw Communications, Inc. (CAD), 5.65%, 10/01/2019 | 100,000 | 81,866 | ||||||
Metals & Mining (1.1%) | ||||||||
Glencore Canada Financial Corp. (GBP), 7.38%, 05/27/2020 | 50,000 | 71,076 | ||||||
Glencore Finance Canada Ltd. (USD), 2.70%, 10/25/2017 (a)(b) | 100,000 | 100,360 | ||||||
| 171,436 | ||||||||
Oil, Gas & Consumable Fuels (0.5%) |
| |||||||
Canadian Natural Resources Ltd. (USD), 1.75%, 01/15/2018 | 81,000 | 80,917 | ||||||
Pharmaceutical (1.0%) | ||||||||
Valeant Pharmaceuticals International, Inc. (EUR), 4.50%, 05/15/2023 (a) | 100,000 | 83,758 | ||||||
VPII Escrow Corp. (USD), 6.75%, 08/15/2018 (a) | 70,000 | 68,320 | ||||||
| 152,078 | ||||||||
| 486,297 | ||||||||
CHINA (1.6%) | ||||||||
Commercial Banks (1.6%) | ||||||||
Industrial & Commercial Bank of China Ltd. (USD), 2.45%, 10/20/2021 | 250,000 | 250,404 | ||||||
DENMARK (1.2%) | ||||||||
Commercial Banks (1.2%) | ||||||||
Danske Bank AS (USD), 1.42%, 09/06/2019 (a)(b) | 200,000 | 200,225 | ||||||
FRANCE (4.8%) | ||||||||
Commercial Banks (2.5%) | ||||||||
Banque Federative du Credit Mutuel SA (USD), 2.50%, 10/29/2018 (a) | 200,000 | 203,060 | ||||||
Societe Generale SA (EUR), 9.38%, 09/04/2019 (a)(b)(c) | 150,000 | 199,036 | ||||||
| 402,096 | ||||||||
Insurance (1.6%) | ||||||||
AXA SA | ||||||||
(USD), 6.46%, 12/14/2018 (a)(b)(c) | 130,000 | 135,551 | ||||||
(EUR), 3.88%, 10/08/2025 (a)(b)(c) | 100,000 | 112,662 | ||||||
| 248,213 | ||||||||
Oil, Gas & Consumable Fuels (0.7%) | ||||||||
TOTAL SA (EUR), 2.25%, 02/26/2021 (a)(b)(c) | 100,000 | 109,067 | ||||||
| 759,376 | ||||||||
GERMANY (0.9%) | ||||||||
Insurance (0.9%) | ||||||||
Muenchener Rueckversicherungs-Gesellschaft AG in Muenchen (GBP), 7.63%, 06/21/2028 (b) | 100,000 | 133,134 | ||||||
HONG KONG (0.7%) | ||||||||
Holding Companies-Diversified Operations (0.7%) |
| |||||||
Hutchison Whampoa Europe Finance 13 Ltd. (EUR), 3.75%, 05/10/2018 (a)(b)(c) | 100,000 | 113,006 | ||||||
JAPAN (2.9%) | ||||||||
Commercial Banks (2.9%) | ||||||||
Mizuho Financial Group, Inc. (USD), 1.99%, 09/13/2021 (b) | 200,000 | 200,530 | ||||||
See accompanying Notes to Financial Statements.
Annual Report 2016
24
Statement of Investments (continued)
October 31, 2016
Aberdeen Global Unconstrained Fixed Income Fund
| Shares or Principal Amount | Value (US$) | |||||||
Sumitomo Mitsui Banking Corp. (USD), 1.76%, 10/19/2018 | $ | 250,000 | $ | 250,283 | ||||
| 450,813 | ||||||||
JERSEY (0.4%) | ||||||||
Commercial Banks (0.4%) | ||||||||
HBOS Capital Funding LP (GBP), 6.46%, 11/30/2018 (a)(b)(c) | 50,000 | 65,102 | ||||||
LUXEMBOURG (0.7%) | ||||||||
Miscellaneous Manufacturing (0.7%) | ||||||||
Pentair Finance SA (EUR), 2.45%, 09/17/2019 | 100,000 | 115,423 | ||||||
MEXICO (0.4%) | ||||||||
Oil, Gas & Consumable Fuels (0.4%) | ||||||||
Petroleos Mexicanos (USD), 5.50%, 01/21/2021 | 60,000 | 63,675 | ||||||
NETHERLANDS (12.3%) | ||||||||
Auto Manufacturers (0.8%) | ||||||||
Volkswagen International Finance NV (EUR), 3.88%, 09/04/2018 (a)(b)(c) | 110,000 | 123,168 | ||||||
Commercial Banks (2.9%) | ||||||||
ABN AMRO Bank NV (USD), 1.80%, 09/20/2019 (a) | 200,000 | 199,228 | ||||||
Cooperatieve Rabobank UA | ||||||||
(USD), 11.00%, 06/30/2019 (a)(b)(c) | 140,000 | 168,686 | ||||||
(AUD), 4.25%, 10/13/2021 (a) | 100,000 | 79,270 | ||||||
| 447,184 | ||||||||
Diversified Financial Services (1.3%) | ||||||||
Equate Petrochemical BV (USD), 3.00%, 03/03/2022 (a) | 200,000 | 197,142 | ||||||
Diversified Telecommunication Services (2.5%) | ||||||||
Bharti Airtel International Netherlands BV (EUR), 3.38%, 05/20/2021 (a) | 100,000 | 119,516 | ||||||
Deutsche Telekom International Finance BV (USD), 1.50%, 09/19/2019 (a) | 150,000 | 149,499 | ||||||
Koninklijke KPN NV (EUR), 6.13%, 09/14/2018 (a)(b)(c) | 100,000 | 117,734 | ||||||
| 386,749 | ||||||||
Electric Utilities (0.7%) | ||||||||
Gas Natural Fenosa Finance BV (EUR), 3.38%, 04/24/2024 (a)(b)(c) | 100,000 | 105,187 | ||||||
Oil, Gas & Consumable Fuels (2.6%) | ||||||||
Lukoil International Finance BV (USD), 6.36%, 06/07/2017 (a) | 100,000 | 102,365 | ||||||
Petrobras Global Finance BV (EUR), 4.88%, 03/07/2018 | 100,000 | 113,065 | ||||||
Shell International Finance BV (USD), 1.20%, 09/12/2019 (b) | 200,000 | 200,174 | ||||||
| 415,604 | ||||||||
Pharmaceutical (0.8%) | ||||||||
Mylan (USD), 3.00%, 12/15/2018 (a) | 130,000 | 132,769 | ||||||
Real Estate (0.7%) | ||||||||
Vonovia Finance BV (EUR), 4.00%, 12/17/2021 (a)(b)(c) | 100,000 | 114,956 | ||||||
| 1,922,759 | ||||||||
REPUBLIC OF IRELAND (1.7%) | ||||||||
Insurance (0.8%) | ||||||||
PGH Capital PLC (GBP), 5.75%, 07/07/2021 (a) | 100,000 | 132,245 | ||||||
Pharmaceutical (0.9%) | ||||||||
Shire Acquisitions Investments Ireland DAC (USD), 1.90%, 09/23/2019 | 140,000 | 139,737 | ||||||
| 271,982 | ||||||||
SWEDEN (1.6%) | ||||||||
Commercial Banks (1.6%) | ||||||||
Svenska Handelsbanken AB (USD), 1.50%, 09/06/2019 | 250,000 | 248,428 | ||||||
UNITED KINGDOM (11.7%) | ||||||||
Auto Manufacturers (1.0%) | ||||||||
Jaguar Land Rover Automotive PLC (USD), 5.63%, 02/01/2023 | 150,000 | 155,178 | ||||||
Commercial Banks (3.2%) | ||||||||
Barclays Bank PLC (GBP), 6.75%, 01/16/2023 (b) | 50,000 | 63,879 | ||||||
HSBC Holdings PLC (GBP), 6.38%, 10/18/2022 (b) | 100,000 | 127,313 | ||||||
Royal Bank of Scotland Group PLC (USD), 6.99%, 10/05/2017 (a)(b)(c) | 100,000 | 111,750 | ||||||
Standard Chartered PLC (USD), 2.10%, 08/19/2019 (a) | 200,000 | 199,829 | ||||||
| 502,771 | ||||||||
Electric Utilities (0.8%) | ||||||||
SSE PLC (GBP), 3.88%, 09/10/2020 (a)(b)(c) | 100,000 | 123,012 | ||||||
Food Products (0.8%) | ||||||||
Tesco PLC (GBP), 5.50%, 12/13/2019 | 100,000 | 134,404 | ||||||
Insurance (1.7%) | ||||||||
Aviva PLC | ||||||||
(USD), 8.25%, 11/03/2017 (a)(c) | 200,000 | 210,858 | ||||||
(GBP), 6.88%, 11/21/2019 (b)(c) | 40,000 | 52,050 | ||||||
| 262,908 | ||||||||
Media (0.7%) | ||||||||
Virgin Media Secured Finance PLC (GBP), 6.00%, 04/15/2021 (a) | 90,000 | 115,117 | ||||||
Metals & Mining (1.3%) | ||||||||
Anglo American Capital PLC (USD), 2.63%, 04/03/2017 (a) | 200,000 | 200,000 | ||||||
Oil, Gas & Consumable Fuels (0.8%) | ||||||||
BG Energy Capital PLC (GBP), 6.50%, 11/30/2072 (a)(b) | 100,000 | 128,579 | ||||||
See accompanying Notes to Financial Statements.
2016 Annual Report
25
Statement of Investments (continued)
October 31, 2016
Aberdeen Global Unconstrained Fixed Income Fund
| Shares or Principal Amount | Value (US$) | |||||||
Real Estate (1.4%) | ||||||||
Annington Finance No 4 PLC, Series A (GBP), 0.00%, 12/07/2022 (d) | $ | 200,000 | $ | 214,883 | ||||
| 1,836,852 | ||||||||
UNITED STATES (28.3%) | ||||||||
Aerospace & Defense (1.6%) | ||||||||
United Technologies Corp. | ||||||||
(USD), 1.78%, 05/04/2018 (e) | 86,000 | 86,312 | ||||||
(USD), 1.24%, 11/01/2019 (b) | 160,000 | 160,097 | ||||||
| 246,409 | ||||||||
Auto Manufacturers (2.6%) | ||||||||
American Honda Finance Corp. (USD), 1.20%, 07/12/2019 | 18,000 | 17,874 | ||||||
Daimler Finance North America LLC (USD), 1.51%, 10/30/2019 (a)(b) | 160,000 | 160,200 | ||||||
General Motors Financial Co., Inc. (USD), 2.13%, 10/04/2019 (b) | 140,000 | 140,804 | ||||||
Toyota Motor Credit Corp. (USD), 1.55%, 10/18/2019 | 93,000 | 93,007 | ||||||
| 411,885 | ||||||||
COMMERCIAL BANKS (7.0%) | ||||||||
Bank of America Corp. (USD), 2.06%, 10/21/2022 (b) | 140,000 | 140,115 | ||||||
Bank of New York Mellon Corp. (USD), 1.94%, 10/30/2023 (b) | 150,000 | 150,006 | ||||||
Capital One NA/Mclean VA (USD), 1.62%, 09/13/2019 (b) | 250,000 | 250,384 | ||||||
Citigroup, Inc., Series MPLE (CAD), 3.39%, 11/18/2021 | 100,000 | 78,716 | ||||||
Goldman Sachs Group, Inc. (USD), 2.24%, 11/15/2021 (b) | 140,000 | 139,847 | ||||||
JPMorgan Chase & Co. | ||||||||
Series V (USD), 5.00%, 07/01/2019 (b)(c) | 60,000 | 58,800 | ||||||
(USD), 2.11%, 10/24/2023 (b) | 140,000 | 139,449 | ||||||
Morgan Stanley (USD), 2.28%, 10/24/2023 (b) | 150,000 | 149,820 | ||||||
| 1,107,137 | ||||||||
Computers & Peripherals (1.0%) | ||||||||
Apple, Inc. (USD), 2.25%, 02/23/2021 | 22,000 | 22,403 | ||||||
Diamond 1 Finance Corp. / Diamond 2 Finance Corp. (USD), 3.48%, 06/01/2019 (a) | 130,000 | 133,380 | ||||||
| 155,783 | ||||||||
Diversified Financial Services (4.4%) | ||||||||
American Express Credit Corp. (USD), 1.46%, 10/30/2019 (b) | 150,000 | 150,177 | ||||||
Ford Motor Credit Co. LLC (USD), 5.75%, 02/01/2021 | 200,000 | 224,123 | ||||||
HSBC Finance Corp. (USD), 6.68%, 01/15/2021 | 100,000 | 114,135 | ||||||
SLM Student Loan Trust 2003-10 (GBP), 0.93%, 12/15/2039 (a)(b) | 200,000 | 208,080 | ||||||
| 696,515 | ||||||||
Diversified Telecommunication Services (0.9%) |
| |||||||
Cisco Systems, Inc. (USD), 1.20%, 09/20/2019 (b) | 140,000 | 140,207 | ||||||
Electric Utilities (2.2%) | ||||||||
Dominion Resources, Inc. (USD), 2.96%, 07/01/2019 (e) | 155,000 | 158,546 | ||||||
Exelon Generation Co. LLC (USD), 2.95%, 01/15/2020 | 46,000 | 47,200 | ||||||
Ipalco Enterprises, Inc. (USD), 5.00%, 05/01/2018 | 35,000 | 36,575 | ||||||
NextEra Energy Capital Holdings, Inc. (USD), 1.65%, 09/01/2018 | 100,000 | 100,224 | ||||||
| 342,545 | ||||||||
Electronics (1.3%) | ||||||||
Honeywell International, Inc. (USD), 1.17%, 10/30/2019 (b) | 200,000 | 200,060 | ||||||
Energy Equipment & Services (0.7%) | ||||||||
Columbia Pipeline Group, Inc. (USD), 2.45%, 06/01/2018 | 18,000 | 18,076 | ||||||
Energy Transfer Partners LP (USD), 5.20%, 02/01/2022 | 50,000 | 54,799 | ||||||
Kinder Morgan Energy Partners LP (USD), 3.50%, 03/01/2021 | 22,000 | 22,615 | ||||||
Sabine Pass Liquefaction LLC (USD), 5.00%, 03/15/2027 (a) | 21,000 | 21,368 | ||||||
| 116,858 | ||||||||
Food Products (1.1%) | ||||||||
Kraft Heinz Foods Co. (USD), 2.00%, 07/02/2018 | 100,000 | 100,720 | ||||||
Kroger Co. (USD), 1.50%, 09/30/2019 | 75,000 | 74,599 | ||||||
| 175,319 | ||||||||
Gas Utilities (0.3%) | ||||||||
Sempra Energy (USD), 1.63%, 10/07/2019 | 41,000 | 40,955 | ||||||
Healthcare Products (0.6%) | ||||||||
Becton Dickinson and Co. (USD), 1.80%, 12/15/2017 | 100,000 | 100,435 | ||||||
Insurance (1.8%) | ||||||||
Metropolitan Life Global Funding I (USD), 1.19%, 09/14/2018 (a)(b) | 150,000 | 149,839 | ||||||
New York Life Global Funding (USD), 1.27%, 10/24/2019 (a)(b) | 140,000 | 139,919 | ||||||
| 289,758 | ||||||||
Media (1.3%) | ||||||||
Charter Communications Operating LLC / Charter Communications Operating Capital (USD), 4.91%, 07/23/2025 (a) | 15,000 | 16,178 | ||||||
Viacom, Inc. (USD), 2.50%, 09/01/2018 | 150,000 | 151,666 | ||||||
Walt Disney Co. (USD), 7.55%, 07/15/2093 | 25,000 | 31,962 | ||||||
| 199,806 | ||||||||
Oil, Gas & Consumable Fuels (0.9%) | ||||||||
Exxon Mobil Corp. (USD), 1.21%, 03/06/2022 (b) | 140,000 | 138,780 | ||||||
See accompanying Notes to Financial Statements.
Annual Report 2016
26
Statement of Investments (continued)
October 31, 2016
Aberdeen Global Unconstrained Fixed Income Fund
| Shares or Principal Amount | Value (US$) | |||||||
Real Estate Investment Trust (REIT) (0.3%) |
| |||||||
Crown Castle International Corp. (USD), 2.25%, 09/01/2021 | $ | 47,000 | $ | 46,607 | ||||
Retail (0.3%) | ||||||||
CVS Health Corp. (USD), 3.50%, 07/20/2022 | 43,000 | 45,432 | ||||||
| 4,454,491 | ||||||||
Total Corporate Bonds | 11,772,118 | |||||||
GOVERNMENT BONDS (10.4%) | ||||||||
CROATIA (1.3%) | ||||||||
Croatia Government International Bond (USD), 6.25%, 04/27/2017 (a) | 200,000 | 204,120 | ||||||
ITALY (1.4%) | ||||||||
Italy Buoni Poliennali Del Tesoro (EUR), 1.50%, 12/15/2016 | 200,000 | 220,015 | ||||||
RUSSIA (1.3%) | ||||||||
Russian Foreign Bond — Eurobond (USD), 3.25%, 04/04/2017 (a) | 200,000 | 201,018 | ||||||
SERBIA (1.3%) | ||||||||
Serbia International Bond (USD), 5.25%, 11/21/2017 (a) | 200,000 | 205,760 | ||||||
SPAIN (2.5%) | ||||||||
Spain Government Bond (EUR), 3.80%, 01/31/2017 (a) | 350,000 | 388,055 | ||||||
SWEDEN (1.3%) | ||||||||
Svensk Exportkredit AB (USD), 2.88%, 11/14/2023 (a)(b) | 200,000 | 200,478 | ||||||
TURKEY (1.3%) | ||||||||
Turkey Government International Bond (USD), 7.50%, 07/14/2017 | 200,000 | 207,390 | ||||||
Total Government Bonds | 1,626,836 | |||||||
GOVERNMENT AGENCIES (1.3%) | ||||||||
INDIA (1.3%) | ||||||||
Export-Import Bank of India (USD), 2.75%, 04/01/2020 (a) | 200,000 | 201,788 | ||||||
Total Government Agencies | 201,788 | |||||||
U.S. TREASURIES (9.8%) | ||||||||
UNITED STATES (9.8%) | ||||||||
U.S. Treasury Bill (USD), 0.00%, 01/19/2017 (d) | 609,000 | 608,619 | ||||||
U.S. Treasury Bonds (USD), 4.50%, 02/15/2036 | 50,000 | 67,983 | ||||||
U.S. Treasury Note (USD), 1.38%, 09/30/2020 | 285,000 | 286,915 | ||||||
U.S. Treasury Notes | ||||||||
(USD), 1.25%, 03/31/2021 | 281,000 | 280,627 | ||||||
(USD), 1.13%, 09/30/2021 | 300,000 | 297,164 | ||||||
| 1,541,308 | ||||||||
Total U.S. Treasuries | 1,541,308 | |||||||
SHORT-TERM INVESTMENT (3.1%) | ||||||||
UNITED STATES (3.1%) | ||||||||
State Street Institutional U.S. Government Money Market Fund (f) | 494,794 | 494,794 | ||||||
Total Short-Term Investment | 494,794 | |||||||
Total Investments | 15,875,999 | |||||||
Liabilities in excess of other assets—(0.8)% | (127,138 | ) | ||||||
Net Assets—100.0% | $ | 15,748,861 | ||||||
| (a) | Denotes a security issued under Regulation S or Rule 144A. |
| (b) | Variable or Floating Rate Security. Rate disclosed is as of October 31, 2016. |
| (c) | Perpetual bond. This is a bond that has no maturity date, is redeemable and pays a steady stream of interest indefinitely. The maturity date presented for these instruments represents the next call/put date. |
| (d) | Issued with a zero coupon. |
| (e) | Indicates a stepped coupon bond. This bond was issued with a low coupon that gradually increases over the life of the bond. |
| (f) | Registered investment company advised by State Street Global Advisors. |
| (g) | See accompanying Notes to Financial Statements for tax unrealized appreciation/(depreciation) of securities. |
| AUD | Australian Dollar |
| BRL | Brazilian Real |
| CAD | Canadian Dollar |
| EUR | Euro Currency |
| GBP | British Pound Sterling |
| HUF | Hungarian Forint |
| JPY | Japanese Yen |
| KRW | South Korean Won |
| MXN | Mexican Peso |
| MYR | Malaysian Ringgit |
| NZD | New Zealand Dollar |
| RUB | New Russian Ruble |
| SEK | Swedish Krona |
| USD | U.S. Dollar |
See accompanying Notes to Financial Statements.
2016 Annual Report
27
Statement of Investments (continued)
October 31, 2016
Aberdeen Global Unconstrained Fixed Income Fund
At October 31, 2016, the Fund held the following futures contracts:
| Futures Contracts | Number of Contracts Long/(Short) | Expiration Date | Unrealized Appreciation/ (Depreciation) | |||||||||
90 Day Euro Futures | 31 | 12/19/2016 | $ | (6,664 | ) | |||||||
90 Day Euro Futures | (31 | ) | 06/18/2018 | 11,048 | ||||||||
Euro Bund Futures | 15 | 12/08/2016 | (32,945 | ) | ||||||||
Euro Bobl Futures | (8 | ) | 12/08/2016 | 6,047 | ||||||||
Euro OAT Futures | (21 | ) | 12/08/2016 | 62,988 | ||||||||
Euro Schatz Futures | (8 | ) | 12/08/2016 | 592 | ||||||||
Long Gilt Futures | (3 | ) | 12/28/2016 | 16,054 | ||||||||
United States Treasury Note 6%-10 year | (2 | ) | 12/20/2016 | 1,792 | ||||||||
United States Treasury Note 6%-2 year | 5 | 12/30/2016 | (152 | ) | ||||||||
United States Treasury Note 6%-5 year | (15 | ) | 12/30/2016 | 6,434 | ||||||||
United States Treasury Note 6%-Long Bond | (1 | ) | 12/20/2016 | 8,076 | ||||||||
United States Treasury Note 6%-Ultra Long | 12 | 12/20/2016 | (18,317 | ) | ||||||||
| $ | 54,953 | |||||||||||
At October 31, 2016, the Fund’s open forward foreign currency exchange contracts were as follows:
| Purchase Contracts Settlement Date* | Counterparty | Amount Purchased | Amount Sold | Fair Value | Unrealized Appreciation/ (Depreciation) | |||||||||||||||||||||||
| Brazilian Real/United States Dollar | ||||||||||||||||||||||||||||
11/23/2016 | Goldman Sachs | BRL | 203,000 | USD | 62,034 | $ | 63,229 | $ | 1,195 | |||||||||||||||||||
| Euro/United States Dollar | ||||||||||||||||||||||||||||
01/11/2017 | Goldman Sachs | EUR | 219,000 | USD | 239,901 | 241,195 | 1,294 | |||||||||||||||||||||
| Japanese Yen/United States Dollar | ||||||||||||||||||||||||||||
01/11/2017 | Goldman Sachs | JPY | 20,236,000 | USD | 196,018 | 193,557 | (2,461 | ) | ||||||||||||||||||||
01/11/2017 | Royal Bank Of Canada | JPY | 4,090,000 | USD | 39,168 | 39,121 | (47 | ) | ||||||||||||||||||||
| Malaysian Ringgit/United States Dollar | ||||||||||||||||||||||||||||
11/22/2016 | Citibank | MYR | 98,000 | USD | 23,586 | 23,334 | (252 | ) | ||||||||||||||||||||
11/23/2016 | Goldman Sachs | MYR | 564,000 | USD | 137,662 | 134,283 | (3,379 | ) | ||||||||||||||||||||
11/23/2016 | Morgan Stanley | MYR | 140,000 | USD | 35,064 | 33,333 | (1,731 | ) | ||||||||||||||||||||
| New Russian Ruble/United States Dollar | ||||||||||||||||||||||||||||
11/23/2016 | Barclays Bank | RUB | 8,801,000 | USD | 134,203 | 138,097 | 3,894 | |||||||||||||||||||||
| South Korean Won/United States Dollar | ||||||||||||||||||||||||||||
11/23/2016 | Deutsche Bank | KRW | 53,530,000 | USD | 48,863 | 46,785 | (2,078 | ) | ||||||||||||||||||||
| Swedish Krona / Euro | ||||||||||||||||||||||||||||
01/11/2017 | JPMorgan Chase | SEK | 3,598,139 | EUR | 408,135 | 400,476 | (7,659 | ) | ||||||||||||||||||||
| Swedish Krona/United States Dollar | ||||||||||||||||||||||||||||
| 01/11/2017 | Royal Bank Of Canada | SEK | 490,000 | USD | 54,980 | 54,451 | (529 | ) | ||||||||||||||||||||
| $ | 1,367,861 | $ | (11,753 | ) | ||||||||||||||||||||||||
| * | Certain contracts with different trade dates and like characteristics have been shown net. |
See accompanying Notes to Financial Statements.
Annual Report 2016
28
Statement of Investments (continued)
October 31, 2016
Aberdeen Global Unconstrained Fixed Income Fund
| Sale Contracts Settlement Date* | Counterparty | Amount Purchased | Amount Sold | Fair Value | Unrealized Appreciation/ (Depreciation) | |||||||||||||||||||||||
| United States Dollar/Australian Dollar | ||||||||||||||||||||||||||||
01/11/2017 | Morgan Stanley | USD | 82,040 | AUD | 108,000 | $ | 82,012 | $ | 28 | |||||||||||||||||||
| United States Dollar/Brazilian Real | ||||||||||||||||||||||||||||
11/23/2016 | Goldman Sachs | USD | 130,813 | BRL | 429,000 | 133,622 | (2,809 | ) | ||||||||||||||||||||
| United States Dollar/British Pound | ||||||||||||||||||||||||||||
01/11/2017 | Goldman Sachs | USD | 113,458 | GBP | 93,000 | 114,023 | (565 | ) | ||||||||||||||||||||
01/11/2017 | Royal Bank Of Canada | USD | 1,426,295 | GBP | 1,156,000 | 1,417,323 | 8,972 | |||||||||||||||||||||
01/12/2017 | Royal Bank Of Canada | USD | 53,778 | GBP | 44,000 | 53,948 | (170 | ) | ||||||||||||||||||||
| United States Dollar/Canadian Dollar | ||||||||||||||||||||||||||||
01/11/2017 | Royal Bank Of Canada | USD | 374,450 | CAD | 493,000 | 367,780 | 6,670 | |||||||||||||||||||||
| United States Dollar/Euro | ||||||||||||||||||||||||||||
01/11/2017 | Citibank | USD | 2,223,305 | EUR | 1,986,000 | 2,187,277 | 36,028 | |||||||||||||||||||||
01/11/2017 | Royal Bank Of Canada | USD | 31,590 | EUR | 29,000 | 31,939 | (349 | ) | ||||||||||||||||||||
| United States Dollar/Hungarian Forint | ||||||||||||||||||||||||||||
01/11/2017 | Goldman Sachs | USD | 208,405 | HUF | 56,707,000 | 201,922 | 6,483 | |||||||||||||||||||||
01/11/2017 | Royal Bank Of Canada | USD | 31,308 | HUF | 8,899,000 | 31,687 | (379 | ) | ||||||||||||||||||||
| United States Dollar/Malaysian Ringgit | ||||||||||||||||||||||||||||
11/23/2016 | JPMorgan Chase | USD | 35,533 | MYR | 142,000 | 33,809 | 1,724 | |||||||||||||||||||||
| United States Dollar/Mexican Peso | ||||||||||||||||||||||||||||
01/11/2017 | Goldman Sachs | USD | 206,342 | MXN | 3,933,000 | 206,530 | (188 | ) | ||||||||||||||||||||
01/11/2017 | Royal Bank Of Canada | USD | 23,379 | MXN | 437,000 | 22,948 | 431 | |||||||||||||||||||||
| United States Dollar/New Russian Ruble | ||||||||||||||||||||||||||||
11/23/2016 | Goldman Sachs | USD | 66,726 | RUB | 4,324,000 | 67,848 | (1,122 | ) | ||||||||||||||||||||
| United States Dollar/South Korean Won | ||||||||||||||||||||||||||||
11/22/2016 | JPMorgan Chase | USD | 39,160 | KRW | 44,390,000 | 38,797 | 363 | |||||||||||||||||||||
11/23/2016 | JPMorgan Chase | USD | 254,515 | KRW | 278,744,000 | 243,624 | 10,891 | |||||||||||||||||||||
| United States Dollar/Swedish Krona | ||||||||||||||||||||||||||||
| 01/11/2017 | Citibank | USD | 17,303 | SEK | 149,000 | 16,557 | 746 | |||||||||||||||||||||
| $ | 5,251,646 | $ | 66,754 | |||||||||||||||||||||||||
| * | Certain contracts with different trade dates and like characteristics have been shown net. |
At October 31, 2016, the Fund held the following centrally cleared credit default swaps:
| Buy Protection: | ||||||||||||||||||||||||||||
| Expiration Date | Notional Amount | Receive (Pay) Floating Rate | Credit Index | Fund Pays Fixed Rate | Premiums Paid (Received) | Unrealized Appreciation/ (Depreciation) | Implied Credit Spread* | |||||||||||||||||||||
| 12/20/2021 | 180,000 | Receive | iTRAXX-Crossover 5-year | Equal to 5.00% | (15,795 | ) | $ | (618 | ) | 3.30% | ||||||||||||||||||
| 12/20/2021 | 780,000 | Receive | iTRAXX-Europe 5-year | Equal to 1.00% | (12,026 | ) | (661 | ) | 0.73% | |||||||||||||||||||
| 12/20/2021 | 600,000 | Receive | iTRAXX-FinSen 5-year | Equal to 1.00% | (1,582 | ) | (140 | ) | 0.97% | |||||||||||||||||||
| (29,403 | ) | $ | (1,419 | ) | ||||||||||||||||||||||||
| * | Implied credit spreads, represented in absolute terms, are utilized in determining the market value of credit default swap contracts agreements on credit indices and serve as an indicator of the current status of the payment/performance risk and represent the likelihood or risk of default for the credit derivative. The implied credit spread of particular referenced entity reflects the cost of buying/selling protection and may include upfront payments required to be made prior to entering into the agreement. For credit default swap contracts with credit indices as the underlying assets, the quoted market prices and resulting market values serve as an indicator of the current status of the payment/performance risk. Wider credit spreads and increasing market values, in absolute terms when compared to the notional amount of the swap, represent a deterioration of the reference entity’s credit soundness and a greater likelihood or risk of default or other credit event occurring as defined under the terms of the agreement. |
See accompanying Notes to Financial Statements.
2016 Annual Report
29
Statement of Investments (concluded)
October 31, 2016
Aberdeen Global Unconstrained Fixed Income Fund
At October 31, 2016, the Fund’s centrally cleared interest rate swaps were as follows:
| Currency | Notional Amount | Expiration Date | Receive (Pay) Floating Rate | Floating Rate Index | Premiums Paid (Received) | Fixed Rate | Unrealized Appreciation/ (Depreciation) | |||||||||||||||||||
EUR | 1,120,000 | 11/21/2018 | Receive | 6-month EURIBOR | 1,092 | (0.22)% | $ | 353 | ||||||||||||||||||
EUR | 6,010,000 | 11/21/2018 | Receive | 6-month EURIBOR | – | (0.22)% | 7,753 | |||||||||||||||||||
EUR | 120,000 | 12/27/2026 | Receive | 6-month EURIBOR | – | 0.31% | 763 | |||||||||||||||||||
EUR | 610,000 | 12/27/2026 | Receive | 6-month EURIBOR | – | 0.31% | 14,976 | |||||||||||||||||||
SEK | 11,620,000 | 11/26/2026 | Receive | 3-month STIBOR | – | 0.66% | 18,711 | |||||||||||||||||||
SEK | 2,480,000 | 11/26/2026 | Receive | 3-month STIBOR | 3,145 | 0.66% | 849 | |||||||||||||||||||
USD | 7,010,000 | 09/03/2019 | Receive | 3-month LIBOR Index | – | 1.22% | 5,375 | |||||||||||||||||||
| USD | 960,000 | 09/03/2019 | Receive | 3-month LIBOR Index | 950 | 1.22% | (214 | ) | ||||||||||||||||||
| 5,187 | $ | 48,566 | ||||||||||||||||||||||||
AUD | 6,520,000 | 10/11/2018 | Pay | 3-month BBR | (3,926 | ) | 1.73% | $ | 1,772 | |||||||||||||||||
AUD | 9,150,000 | 10/11/2018 | Pay | 3-month BBR | – | 1.73% | (3,023 | ) | ||||||||||||||||||
EUR | 1,220,000 | 11/26/2026 | Pay | 6-month EURIBOR | 2,183 | 0.30% | (29,991 | ) | ||||||||||||||||||
EUR | 230,000 | 11/26/2026 | Pay | 6-month EURIBOR | (4,367 | ) | 0.30% | (1,287 | ) | |||||||||||||||||
GBP | 1,180,000 | 10/15/2021 | Pay | 12-month UK-RPI | – | 3.48% | 698 | |||||||||||||||||||
NZD | 1,280,000 | 01/19/2022 | Pay | 6-month BBR | – | 2.36% | (3,986 | ) | ||||||||||||||||||
SEK | 41,150,000 | 09/30/2020 | Pay | 3-month STIBOR | – | 0.13% | (3,965 | ) | ||||||||||||||||||
USD | 7,040,000 | 09/04/2018 | Pay | 3-month LIBOR Index | – | 1.11% | (2,853 | ) | ||||||||||||||||||
USD | 830,000 | 09/04/2018 | Pay | 3-month LIBOR Index | (450 | ) | 1.11% | 114 | ||||||||||||||||||
| USD | 3,450,000 | 11/21/2018 | Pay | 3-month LIBOR Index | – | 1.03% | (4,556 | ) | ||||||||||||||||||
| (6,560 | ) | $ | (47,077 | ) | ||||||||||||||||||||||
| (1,373 | ) | $ | 1,489 | |||||||||||||||||||||||
See accompanying Notes to Financial Statements.
Annual Report 2016
30
Aberdeen Tax-Free Income Fund (Unaudited)
The Aberdeen Tax-Free Income Fund (Institutional Class shares net of fees) returned 2.47% for the 12-month period ended October 31, 2016, versus the 4.06% return of its benchmark, the Bloomberg Barclays Municipal Bond Index. For broader comparison, the average return of the Fund’s peer category of General & Insured Municipal Debt Funds (consisting of 90 funds), as measured by Lipper, Inc., was 4.27% for the period.
The U.S. municipal bond market experienced strong performance over the first nine months of the reporting period. The benchmark Bloomberg Barclays Municipal Bond Index posted a gain in each of the first nine months of the period, continuing a string of 13 consecutive months of positive returns. Municipal bond funds saw positive inflows throughout the reporting period, while the total new supply of municipal bonds declined when compared to the same period a year earlier. This supply/demand imbalance contributed to the strong performance of the municipal bond market during the period. The net decline in intermediate- and long-term U.S. Treasury yields over the period also had a positive impact on the municipal sector’s performance.
The municipal market appeared to be immune to the volatility in commodities over the reporting period as oil prices declined steadily through mid-February 2016, and then rose sharply through the end of the period. The market also shrugged off several events that caused turmoil in other financial markets, including the first increases in the Federal Reserve’s (Fed’s) federal funds rate and discount rates in nearly 10 years, as well as the relative weakness in U.S. economic activity in the first quarter of 2016. The continued deterioration of the fiscal situation in Puerto Rico, including payment defaults and the moratorium on litigation, the state government budget stalemates in Illinois and Pennsylvania, continuing concerns about municipal pension shortfalls, and the weakness in municipal revenues in oil-producing states, also did not have a significant impact on the municipal market during the reporting period.
U.S. economic data reports released over the reporting period were generally mixed, in our view. Gross domestic product (GDP) expanded by 1.4% in the fourth quarter of 2015, but subsequently decelerated to a 0.5% rate in the first quarter of 2016, increased to 1.1% in the second quarter and then accelerated to 2.9% in the third quarter. According to the U.S. Department of Labor, the U.S. economy added an average of over 173,000 jobs per month over the twelve-month reporting period, and the unemployment rate ended the period at 4.9%. The labor force participation rate1 rose 0.3% over the reporting period, ending at 62.8%. Additionally, average hourly earnings rose 2.8% year-over-year for the period ended October 31, 2016, outpacing the core inflation rate (which excludes food and energy costs) of 2.2%.
The Fund was positioned with a shorter duration2 relative to that of its benchmark, the Bloomberg Barclays Municipal Bond Index, during the reporting period. Interest rates declined through June 2016, bolstering bond prices. Thereafter, interest rates began to rise for several reasons: Brexit3 fears subsided, the U.S. continued to show moderate but steady GDP and employment growth, and an increase in the Fed’s discount rate became more likely. Consequently, the Fund underperformed relative to its benchmark, the Bloomberg Barclays Municipal Bond Index, until interest rates began to rise, and the Fund subsequently began to mitigate the underperformance later in the reporting period.
The Fund’s overweight allocation to pre-refunded bonds versus the benchmark also detracted from performance for the reporting period. Issuers of pre-refunded bonds post U.S. Treasury securities as collateral for repayment. While this reduces the risk for these bonds, during stretches of increased investor risk appetite – similar to the market environment over the reporting period – these securities historically have underperformed the overall municipal bond market.
On the positive side, Fund performance benefited from the overweight exposure to the electric power utility sector and an underweight position in special tax revenue-supported bonds relative to the Fund’s benchmark.
The Fund did not employ any derivatives during the twelve-month reporting period.
Over the period, the Fund’s portfolio turnover was approximately 10.7% of net assets and comprised the use of proceeds from maturing issues and from new investment funds to purchase higher-yielding bonds with intermediate- and longer-term maturities.
We believe that the municipal market may be facing new headwinds in 2017. We think that intermediate- and long-term interest rates are likely to continue to rise as the Fed continues to raise the discount rate and the U.S. economy continues to grow moderately. Furthermore, the possible expansion of infrastructure investment and income tax rate changes following the recent U.S. presidential election could potentially increase the federal debt, putting further upward pressure on interest rates. Additionally, lower marginal federal income tax rates could reduce the after-tax yields on municipal bonds, depressing the prices of existing tax-exempt securities and reducing demand for the bonds. Credit fundamentals have improved since the recession of 2007-2009, but revenue growth has slowed as sales tax receipts and state income tax collections are not growing at the same rate as earlier in the economic recovery. States that rely on taxes based on oil and gas production continue to experience financial stress as they try to balance budgets on the
| 1 | The labor force participation rate is expressed as a percentage of the U.S. population aged 16 years and older working or actively seeking work. |
| 2 | Duration is an estimate of bond price sensitivity to changes in interest rates. The higher the duration, the greater the change (i.e., higher risk) in relation to interest-rate movements. |
| 3 | “Brexit” is an abbreviation of “British exit,” which refers to the June 23, 2016 referendum by British voters to exit the European Union. |
2016 Annual Report
31
Aberdeen Tax-Free Income Fund (Unaudited) (concluded)
lower revenues. States that are dependent on income taxes on high-income citizens, such as California, may experience slower revenue growth if the stock market does not maintain its strong performance. In our view, states and local governments that have not addressed their pension funding shortfalls may find it more difficult to resolve their problems as lower discount rates applied to calculations of future pension obligations will make pension underfunding a more serious problem.
The U.S. Congress approved a legislative framework for allowing the Commonwealth of Puerto Rico and its creditors to begin a bankruptcy-like resolution to the Commonwealth’s excessive debt load and payment defaults. The resolution may take several years to implement and may face resistance from various parties. The economy of Puerto Rico most likely will continue to struggle, making a final resolution difficult, in our view.
Portfolio Management:
Aberdeen North American Fixed Income Team
PAST PERFORMANCE DOES NOT GUARANTEE FUTURE RESULTS.
The performance data quoted represents past performance and current returns may be lower or higher. Class A Shares have up to a 4.25% front-end sales charge and a 0.25% 12b-1 fee. The investment return and principal value will fluctuate so that an investor’s shares, when redeemed, may be worth more or less than the original cost. To obtain performance information current to the most recent month-end, which may be higher or lower than the performance shown above, please call 866-667-9231 or go to www.aberdeen-asset.us.
Investing in mutual funds involves risk, including the possible loss of principal.
Indexes are unmanaged and have been provided for comparison purposes only. No fees or expenses are reflected. You cannot invest directly in an index.
Lipper is a leading global provider of mutual fund information and analysis to fund companies, financial intermediaries and media organizations.
Risk Considerations
Fixed income securities are subject to certain risks including, but not limited to: interest rate (changes in interest rates may cause a decline in the market value of an investment), credit (changes in the financial condition of the issuer, borrower, counterparty, or underlying collateral), prepayment (debt issuers may repay or refinance their loans or obligations earlier than anticipated), and extension (principal repayments may not occur as quickly as anticipated, causing the expected maturity of a security to increase).
Municipal securities can be affected by adverse tax, legislative or political changes and the financial condition of the issuers of municipal securities.
Derivatives are speculative and may hurt the Fund’s performance. They present the risk of disproportionately increased losses and/or reduced gains when the financial asset or measure to which the derivative is linked changes in unexpected ways.
Investing a significant portion of the Fund’s assets in securities of companies conducting business in a broadly related group of industries within an economic sector may make the Fund more vulnerable to unfavorable developments in that sector.
Please read the prospectus for more detailed information regarding these and other risks.
Annual Report 2016
32
Aberdeen Tax-Free Income Fund (Unaudited)
| Average Annual Total Return1 (For periods ended October 31, 2016) | 1 Yr. | 5 Yr. | 10 Yr. | |||||||||||
Class A | w/o SC | 2.19% | 3.27% | 3.57% | ||||||||||
| w/SC2 | (2.13% | ) | 2.37% | 3.12% | ||||||||||
Class C | w/o SC | 1.36% | 2.49% | 2.81% | ||||||||||
| w/SC3 | 0.37% | 2.49% | 2.81% | |||||||||||
Class R4 | w/o SC | 1.96% | 3.16% | 3.65% | ||||||||||
Institutional Service Class4 | w/o SC | 2.48% | 3.54% | 3.84% | ||||||||||
Institutional Class4,5 | w/o SC | 2.47% | 3.54% | 3.84% | ||||||||||
All figures showing the effect of a sales charge (SC) reflect the maximum charge possible because it has the most significant effect on performance data. The total returns shown above do not include the impact of financial statement rounding of the net asset value (NAV) per share and/or financial statement adjustments.
| 1 | Returns prior to June 23, 2008 reflect the performance of a predecessor fund (the “Predecessor Fund”). Returns of the Predecessor Fund have not been adjusted to reflect the expenses applicable to the respective classes. The Fund and the Predecessor Fund have substantially similar investment objectives and strategies. Please consult the Fund’s prospectus for more detail. |
| 2 | A 4.25% front-end sales charge was deducted. |
| 3 | A 1.00% contingent deferred sales charge (CDSC) was deducted from the one year return because it is charged when Class C shares are sold within the first year after purchase. |
| 4 | Not subject to any sales charge. Returns before the first offering of the Class R, Institutional Class and Institutional Service Class shares (February 25, 2013) are based on the previous performance of Class D shares. Excluding the effect of any fee waivers or reimbursements, this performance is substantially similar to the Class R, Institutional Service Class, and Institutional Class shares would have produced because all classes invest in the same portfolio of securities. Returns for the Class R, Institutional Service Class, and Institutional Class shares would only differ to the extent of the differences in expenses of the classes. |
| 5 | Effective February 25, 2013, all Class D shares of the Fund were converted into Institutional Class shares of the Fund. |
2016 Annual Report
33
Aberdeen Tax-Free Income Fund (Unaudited)
Performance of a $10,000 Investment (as of October 31, 2016)
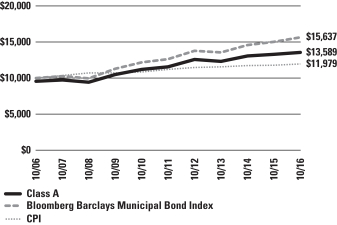
Comparative performance of $10,000 invested in Class A shares of the Aberdeen Tax-Free Income Fund, the Bloomberg Barclays Municipal Bond Index and the Consumer Price Index (CPI) over a 10-year period ended October 31, 2016. Unlike the Fund, the returns for these unmanaged indexes do not reflect any fees, expenses, or sales charges. Investors cannot invest directly in market indexes.
The Bloomberg Barclays Municipal Bond Index is a broad market performance benchmark for the tax exempt bond market, the bonds included in this index must have a minimum credit rating of at least Baa. They must have an outstanding par value of at least $3 million and be issued as part of a transaction of at least $50 million. The index includes both zero coupon bonds and bonds subject to the Alternative Minimum Tax.
The CPI is a measure of the average change over time in the prices paid by urban consumers for a market basket of consumer goods and services.
Investment return and principal value will fluctuate, and when redeemed, shares may be worth more or less than original cost. Past performance is no guarantee of future results. The Average Annual Total Return table and Performance graph do not reflect the deduction of taxes that a shareholder would pay on fund distributions or the redemption of fund shares. Investing in mutual funds involves market risk, including loss of principal. Performance returns assume the reinvestment of all distributions. Total returns reflect waivers and reimbursements in effect, without which returns would have been lower.
Portfolio Summary (as a percentage of net assets)
October 31, 2016 (Unaudited)
| Asset Allocation | ||||
Municipal Bonds | 97.6% | |||
Short-Term Investment | 3.0% | |||
Liabilities in excess of other assets | (0.6% | ) | ||
| 100.0% | ||||
| Top Holdings* | ||||
Harris County Health Facilities Development Corp. Revenue Bonds (SCH Health Care System), Prerefunded/Escrowed to Maturity, Series B 07/01/2027 | 7.4% | |||
Pennsylvania Turnpike Commission Revenue Bonds, Series A 07/15/2029 | 5.8% | |||
New York State Dormitory Authority Revenue Bonds (State University Dormitory Facilities), Series A 07/01/2039 | 3.0% | |||
State of Texas General Obligation Unlimited Bonds (Transportation Commission), Unrefunded 04/01/2020 | 2.7% | |||
Fort Bend Independent School District General Obligation Unlimited Bonds, Prerefunded/Escrowed to Maturity 02/15/2018 | 2.6% | |||
University of California Revenue Bonds, Series Q 05/15/2029 | 2.6% | |||
New Jersey Economic Development Authority Revenue Bonds (School Facilities Conservation), Series BB 09/01/2024 | 2.5% | |||
Commonwealth of Massachusetts General Obligation Limited Bonds, Series D 10/01/2018 | 2.4% | |||
State of Washington General Obligation Unlimited Bonds, Series R-2010A 01/01/2022 | 2.4% | |||
County of King General Obligation Limited Bonds 01/01/2025 | 2.3% | |||
Other | 66.3% | |||
| 100.0% | ||||
| * | For the purpose of listing top holdings, Short-Term Investments are included as part of Other. |
| Top States | ||||
Texas | 28.3% | |||
California | 10.0% | |||
Pennsylvania | 8.4% | |||
New York | 8.3% | |||
Washington | 6.1% | |||
Georgia | 5.0% | |||
New Jersey | 4.8% | |||
Massachusetts | 4.8% | |||
Louisiana | 4.4% | |||
New Hampshire | 3.7% | |||
Other | 16.2% | |||
| 100.0% | ||||
Annual Report 2016
34
Statement of Investments
October 31, 2016
Aberdeen Tax-Free Income Fund
| Shares or Principal Amount | Value (US$) | |||||||
MUNICIPAL BONDS (97.6%) | ||||||||
Alabama (0.4%) | ||||||||
Industrial Development Board of the City of Mobile Alabama Revenue Bonds (Alabama Power Co.), 1.63%, | $ | 400,000 | $ | 402,220 | ||||
Alaska (1.2%) | ||||||||
City of Valdez Revenue Bonds Pipelines Project, Series B, 5.00%, 01/01/2021 | 1,000,000 | 1,137,620 | ||||||
California (10.0%) | ||||||||
Brea Redevelopment Agency Tax Allocation Refunding Bonds, Series A, 0.00%, 08/01/2025 (b) | 1,000,000 | 692,330 | ||||||
California Educational Facilities Authority Revenue Bonds (California Institute of Technology), 5.00%, 11/01/2039 | 1,000,000 | 1,117,400 | ||||||
Los Angeles Community College District General Obligation Unlimited Bonds | ||||||||
Series A, 5.50%, 08/01/2025 | 1,000,000 | 1,123,240 | ||||||
Series I, 4.00%, 08/01/2029 | 400,000 | 457,920 | ||||||
M-S-R Energy Authority Gas Revenue Bonds, Series B, 6.13%, 11/01/2029 | 500,000 | 643,985 | ||||||
M-S-R Energy Authority Revenue Bonds, Series A, 6.50%, 11/01/2039 | 500,000 | 690,535 | ||||||
San Francisco City & County Public Utilities Commission Revenue Bonds, Series F, 5.00%, 11/01/2024 | 300,000 | 346,746 | ||||||
Santa Clara Unified School District General Obligation Unlimited Bonds, 5.00%, 07/01/2026 | 465,000 | 513,848 | ||||||
Turlock Irrigation District Revenue Bonds, 5.00%, 01/01/2029 | 1,000,000 | 1,145,880 | ||||||
University of California Revenue Bonds, Series Q, 5.25%, 05/15/2029 | 2,320,000 | 2,399,715 | ||||||
| 9,131,599 | ||||||||
Florida (2.7%) | ||||||||
City of Tampa Revenue Bonds (Baycare Health Care System), Series A, 4.00%, 11/15/2033 | 1,000,000 | 1,054,810 | ||||||
CityPlace Community Development District, Special Assessment & Revenue Refunding Bonds, 5.00%, 05/01/2019 | 1,000,000 | 1,080,770 | ||||||
Volusia County Educational Facility Authority Revenue Bonds, Series B, 5.00%, 10/15/2023 | 250,000 | 299,152 | ||||||
| 2,434,732 | ||||||||
Georgia (5.0%) | ||||||||
Burke County Development Authority Pollution Control Revenue Bonds (Transmission Corp. Vogtle Project), 1.30%, 01/01/2052 (a) | 1,000,000 | 1,005,650 | ||||||
Burke County Development Authority Revenue Bonds (Georgia Power Company Plant Vogtle Project), 1.75%, 12/01/2049 (a) | 1,000,000 | 1,004,650 | ||||||
Cherokee County General Obligation Unlimited Bonds, 5.00%, 04/01/2021 | 500,000 | 547,900 | ||||||
Forsyth County General Obligation Unlimited Bonds, Series A, 5.00%, 03/01/2028 | 100,000 | 109,398 | ||||||
Monroe Country Development Authority Revenue Bonds, 2.35%, 10/01/2048 (a) | 1,000,000 | 1,031,290 | ||||||
Municipal Electric Authority of Georgia Revenue Bonds | ||||||||
Prerefunded/Escrowed to Maturity, Series V, 6.60%, 01/01/2018 | 240,000 | 248,249 | ||||||
Unrefunded, Series V, 6.60%, 01/01/2018 | 585,000 | 596,723 | ||||||
| 4,543,860 | ||||||||
Illinois (0.6%) | ||||||||
Illinois Finance Authority Revenue Bonds (Carle Foundation), Series A, 6.00%, 08/15/2041 | 500,000 | 585,325 | ||||||
Louisiana (4.4%) | ||||||||
East Baton Rouge Parish Sales Tax Revenue Bonds (Road & Street Improvement), 5.00%, 08/01/2024 | 540,000 | 598,477 | ||||||
Louisiana Public Facilities Authority Revenue Bonds, 3.00%, 05/15/2031 | 1,000,000 | 966,700 | ||||||
Louisiana Public Facilities Authority Revenue Bonds (Entergy Louisiana LLC), Series B, 3.50%, 06/01/2030 | 1,000,000 | 1,022,080 | ||||||
Saint Charles Parish Revenue Bonds (Valero Energy Corp.), 4.00%, 12/01/2040 (a) | 1,250,000 | 1,375,762 | ||||||
| 3,963,019 | ||||||||
Massachusetts (4.8%) | ||||||||
Commonwealth of Massachusetts General Obligation Limited Bonds, Series D | ||||||||
5.50%, 10/01/2018 | 2,000,000 | 2,175,900 | ||||||
5.50%, 08/01/2019 | 1,000,000 | 1,121,500 | ||||||
Massachusetts Development Finance Agency Revenue Bonds (Boston Medical Center) | ||||||||
Series C, 5.00%, 07/01/2017 | 500,000 | 513,575 | ||||||
Unrefunded, Series C, 5.00%, 07/01/2017 | 500,000 | 512,400 | ||||||
| 4,323,375 | ||||||||
Michigan (1.1%) | ||||||||
Grand Rapids Building Authority Revenue Bonds, 5.00%, 08/01/2020 | 900,000 | 992,304 | ||||||
Minnesota (0.6%) | ||||||||
University of Minnesota Revenue Bonds, Series A, 5.25%, 04/01/2029 | 500,000 | 549,610 | ||||||
Nebraska (0.9%) | ||||||||
Central Plains Energy Project, Gas Project Revenue Bonds (Project No.3), 5.00%, 09/01/2021 | 750,000 | 861,233 | ||||||
New Hampshire (3.7%) | ||||||||
New Hampshire Business Finance Authority Pollution Control Refunding Revenue Bonds (United Illuminating Company Project), Series A, 1.06%, 10/01/2033 (a) | 1,230,000 | 1,131,957 | ||||||
New Hampshire Health & Education Facilities Authority Revenue Bonds (Dartmouth College), 5.25%, 06/01/2039 | 1,000,000 | 1,108,420 | ||||||
See accompanying Notes to Financial Statements.
2016 Annual Report
35
Statement of Investments (continued)
October 31, 2016
Aberdeen Tax-Free Income Fund
| Shares or Principal Amount | Value (US$) | |||||||
New Hampshire Health & Education Facilities Authority Revenue Bonds (University Systems), Series A, 5.00%, 07/01/2023 | $ | 1,000,000 | $ | 1,102,540 | ||||
| 3,342,917 | ||||||||
New Jersey (4.8%) | ||||||||
New Jersey Economic Development Authority Revenue Bonds (School Facilities Conservation), Series BB, 5.25%, 09/01/2024 | 2,000,000 | 2,233,400 | ||||||
New Jersey Educational Facilities Authority Revenue Bonds (The College of New Jersey), Series F, 4.00%, 07/01/2033 | 100,000 | 108,068 | ||||||
New Jersey Transportation Trust Fund Authority Revenue Bonds (Transportation System), Series A, 5.75%, 06/15/2017 | 1,000,000 | 1,028,300 | ||||||
New Jersey Turnpike Authority Revenue Bonds, Series A, 5.00%, 01/01/2031 | 850,000 | 1,017,611 | ||||||
| 4,387,379 | ||||||||
New York (8.3%) | ||||||||
Nassau County Local Economic Assistance Corp. Revenue Bonds (Catholic Health Services), 5.00%, 07/01/2030 | 1,000,000 | 1,160,430 | ||||||
New York State Dormitory Authority Revenue Bonds (State University Dormitory Facilities), Series A, 5.00%, 07/01/2039 | 2,500,000 | 2,715,075 | ||||||
New York State Dormitory Authority Revenue Bonds (State University Educational Facilities 3rd Generation), Series A, 5.50%, 05/15/2023 | 1,160,000 | 1,450,186 | ||||||
Oneida County Industrial Development Agency Revenue Bonds (Hamilton College Civic Facilities), 5.00%, 09/15/2027 | 1,000,000 | 1,073,590 | ||||||
Tompkins County Industrial Development Agency Revenue Bonds (Cornell University Civic Facilities), Series A, 5.25%, 07/01/2030 | 1,000,000 | 1,153,960 | ||||||
| 7,553,241 | ||||||||
North Dakota (1.2%) | ||||||||
City of Grand Forks, Health Care System Revenue Bonds (Altru Health System Obligated Group), 4.50%, 12/01/2032 | 1,000,000 | 1,057,570 | ||||||
Pennsylvania (8.4%) | ||||||||
Beaver County Industrial Development Authority Revenue Bonds (FirstEnergy Nuclear Generation LLC) | ||||||||
Series A, 4.38%, 01/01/2035 (a) | 500,000 | 492,220 | ||||||
Series B, 3.50%, 12/01/2035 (a) | 500,000 | 428,920 | ||||||
Lehigh County Industrial Development Authority Revenue Bonds (PPL Electric Utilities Corp), VRN, 0.90%, 09/01/2029 (a) | 250,000 | 249,773 | ||||||
Montgomery County Industrial Development Authority Health System Revenue Bonds, Series A, 5.00%, 01/15/2022 | 250,000 | 283,027 | ||||||
Pennsylvania Higher Educational Facilities Authority Revenue Bonds (University of Pennsylvania), Series A, 5.00%, 09/01/2019 | 800,000 | 888,992 | ||||||
Pennsylvania Turnpike Commission Revenue Bonds, Series A, 5.25%, 07/15/2029 | 4,100,000 | 5,299,496 | ||||||
| 7,642,428 | ||||||||
Rhode Island (0.8%) | ||||||||
Tobacco Settlement Financing Corp. Revenue Bonds, Series B, 4.50%, 06/01/2045 | 750,000 | 764,415 | ||||||
South Carolina (1.8%) | ||||||||
Rock Hill South Carolina Combined Utility System Revenue Bonds (City of Rock Hill South Carolina Combined Utility System Revenue) | ||||||||
5.00%, 01/01/2025 | 500,000 | 610,735 | ||||||
5.00%, 01/01/2026 | 500,000 | 617,905 | ||||||
University of South Carolina Revenue Bonds, Series A, 5.00%, 06/01/2030 | 350,000 | 372,600 | ||||||
| 1,601,240 | ||||||||
Tennessee (1.3%) | ||||||||
Knox County Health Educational & Housing Facilities Board Revenue Bonds (University Health System Inc), 5.00%, 09/01/2036 | 500,000 | 561,245 | ||||||
Tennessee Energy Acquisition Corp. Revenue Bonds, Series A, 5.25%, 09/01/2023 | 500,000 | 597,225 | ||||||
| 1,158,470 | ||||||||
Texas (28.3%) | ||||||||
City of Houston General Obligation Limited Bonds (Public Improvement), Series A, 5.00%, 03/01/2030 | 1,575,000 | 1,705,977 | ||||||
Dallas Area Rapid Transit Revenue Bonds | ||||||||
5.00%, 12/01/2036 | 730,000 | 732,460 | ||||||
Unrefunded, 5.00%, 12/01/2036 | 520,000 | 521,752 | ||||||
Dallas/Fort Worth International Airport Revenue Bonds, Joint Revenue Refunding Bonds, Series B, 5.00%, 11/01/2020 | 1,000,000 | 1,151,150 | ||||||
Fort Bend Independent School District General Obligation Unlimited Bonds, Prerefunded/Escrowed to Maturity, 5.00%, 02/15/2018 | 2,300,000 | 2,423,671 | ||||||
Harris County Health Facilities Development Corp. Revenue Bonds (SCH Health Care System), Prerefunded/Escrowed to Maturity, Series B, 5.75%, 07/01/2027 | 5,325,000 | 6,771,217 | ||||||
Lower Colorado River Authority Revenue Bonds, Prerefunded/Escrowed to Maturity, Series B, 6.00%, 01/01/2017 | 1,245,000 | 1,255,595 | ||||||
Matagorda County Navigation District No. 1 Revenue Bonds, Series B-1, 4.00%, 06/01/2030 | 1,000,000 | 1,064,860 | ||||||
State of Texas General Obligation Unlimited Bonds (Transportation Commission) | ||||||||
Prerefunded, 5.00%, 04/01/2020 | 95,000 | 96,658 | ||||||
Unrefunded, 5.00%, 04/01/2020 | 2,405,000 | 2,447,977 | ||||||
State of Texas General Obligation Unlimited Bonds (Water Financial Assistance), Series C, 5.25%, 08/01/2018 | 1,050,000 | 1,129,821 | ||||||
State of Texas Transportation Commission Revenue Bonds, 5.00%, 04/01/2027 | 1,500,000 | 1,526,805 | ||||||
See accompanying Notes to Financial Statements.
Annual Report 2016
36
Statement of Investments (concluded)
October 31, 2016
Aberdeen Tax-Free Income Fund
| Shares or Principal Amount | Value (US$) | |||||||
Tarrant County Cultural Education Facilities Finance Corp. Revenue Bonds (Baylor Scott & White Obligated Group), 5.00%, 11/15/2029 | $ | 800,000 | $ | 966,448 | ||||
Tarrant County Cultural Education Facilities Finance Corp. Revenue Bonds (Texas Health Resources Obligated Group), Series A, 4.00%, 02/15/2036 | 1,000,000 | 1,062,160 | ||||||
Texas A&M University Revenue Bonds (Financing System), Series A, 5.00%, 05/15/2025 | 1,065,000 | 1,170,733 | ||||||
Texas Municipal Gas Acquisition & Supply Corp. I Revenue Bonds, Series D, 6.25%, 12/15/2026 | 500,000 | 605,345 | ||||||
University of North Texas Revenue Bonds (Financing System), Series A, 5.00%, 04/15/2028 | 1,000,000 | 1,092,990 | ||||||
| 25,725,619 | ||||||||
Washington (6.1%) | ||||||||
City of Seattle Water System Revenue Bonds, 5.00%, 02/01/2026 | 1,000,000 | 1,052,150 | ||||||
County of King General Obligation Limited Bonds, 5.00%, 01/01/2025 | 2,000,000 | 2,092,340 | ||||||
State of Washington General Obligation Unlimited Bonds | ||||||||
Series R-2010A, 5.00%, 01/01/2022 | 2,000,000 | 2,172,840 | ||||||
Series C, 5.00%, 01/01/2026 | 200,000 | 209,638 | ||||||
| 5,526,968 | ||||||||
West Virginia (0.6%) | ||||||||
West Virginia Economic Development Authority Revenue Bonds, Unrefunded, Series A, 1.90%, 03/01/2040 (a) | 550,000 | 552,717 | ||||||
Wisconsin (0.6%) | ||||||||
Wisconsin Health & Educational Facilities Authority Revenue Bonds (Aurora Health Care), Series A, 5.00%, 07/15/2028 | 500,000 | 563,365 | ||||||
Total Municipal Bonds | 88,801,226 | |||||||
SHORT-TERM INVESTMENT (3.0%) | ||||||||
UNITED STATES (3.0%) | ||||||||
State Street Institutional U.S. Government Money Market Fund (c) | 2,741,532 | 2,741,532 | ||||||
Total Short-Term Investment | 2,741,532 | |||||||
Total Investments | 91,542,758 | |||||||
Liabilities in excess of other assets—(0.6)% | (575,976 | ) | ||||||
Net Assets—100.0% | $ | 90,966,782 | ||||||
| (a) | Variable or Floating Rate Security. Rate disclosed is as of October 31, 2016. |
| (b) | Issued with a zero coupon. |
| (c) | Registered investment company advised by State Street Global Advisors. |
| (d) | See accompanying Notes to Portfolio of Investments for tax unrealized appreciation/(depreciation) of securities. |
See accompanying Notes to Financial Statements.
2016 Annual Report
37
Statements of Assets and Liabilities
October 31, 2016
| Aberdeen Asia Bond Fund | Aberdeen Emerging Markets Debt Fund | Aberdeen Global Unconstrained Fixed Income Fund | Aberdeen Tax-Free Income Fund | |||||||||||||
Assets: | ||||||||||||||||
Investments, at value | $ | 28,025,485 | $ | 18,419,199 | $ | 15,381,205 | $ | 88,801,226 | ||||||||
Short-term investments, at value | 1,039,337 | 429,660 | 494,794 | 2,741,532 | ||||||||||||
|
|
|
|
|
|
|
| |||||||||
Total investments | 29,064,822 | 18,848,859 | 15,875,999 | 91,542,758 | ||||||||||||
|
|
|
|
|
|
|
| |||||||||
Foreign currency, at value | 324,066 | 1,623 | 87,381 | – | ||||||||||||
Cash collateral pledged for swaps | – | – | 162,279 | – | ||||||||||||
Cash collateral pledged for futures | 73,637 | – | 86,502 | – | ||||||||||||
Cash | 5,440 | – | 102,227 | – | ||||||||||||
Cash at broker for China A shares | 505 | – | – | – | ||||||||||||
Receivable for interest rate swaps closed | – | – | 5,992,352 | – | ||||||||||||
Interest receivable | 443,282 | 271,987 | 135,424 | 1,139,344 | ||||||||||||
Unrealized appreciation on forward foreign currency exchange contracts | 123,073 | 46,324 | 78,719 | – | ||||||||||||
Variation margin receivable for futures contracts | 35,533 | – | 56,048 | – | ||||||||||||
Receivable from Adviser | – | 15,755 | 19,861 | 11,551 | ||||||||||||
Receivable for capital shares issued | – | – | 1,239 | 50 | ||||||||||||
Variation margin receivable for centrally cleared swaps | – | – | 47,613 | – | ||||||||||||
Other receivables (a) | 10,955 | 55,798 | 21,766 | 2,529 | ||||||||||||
Prepaid expenses | 16,027 | 37,478 | 27,905 | 23,005 | ||||||||||||
|
|
|
|
|
|
|
| |||||||||
Total assets | 30,097,340 | 19,277,824 | 22,695,315 | 92,719,237 | ||||||||||||
|
|
|
|
|
|
|
| |||||||||
Liabilities: | ||||||||||||||||
Payable for investments purchased | 159,946 | 197,562 | 874,471 | 1,642,135 | ||||||||||||
Unrealized depreciation on forward foreign currency exchange contracts | 274,580 | 41,350 | 23,718 | – | ||||||||||||
Distributions payable | – | – | – | 9,350 | ||||||||||||
Payable for capital shares redeemed | 20,060 | 5,710 | 15,617 | 8,700 | ||||||||||||
Accrued foreign capital gains tax | 25,364 | 357 | – | – | ||||||||||||
Payable for interest rate swaps closed | – | – | 5,992,352 | – | ||||||||||||
Accrued expenses and other payables: | ||||||||||||||||
Audit fees | 22,327 | 22,327 | 16,827 | 20,356 | ||||||||||||
Investment advisory fees | 14,569 | 12,119 | 7,211 | 32,941 | ||||||||||||
Printing fees | 7,230 | 3,448 | 5,410 | 10,293 | ||||||||||||
Transfer agent fees | 2,076 | 2,147 | 2,520 | 12,939 | ||||||||||||
Custodian fees | 5,686 | 3,477 | 3,743 | 857 | ||||||||||||
Administration fees | 2,011 | 1,293 | 962 | 6,200 | ||||||||||||
Sub-transfer agent and administrative services fees | 2,601 | 808 | 1,693 | 1,250 | ||||||||||||
Distribution fees | 423 | 1,022 | 609 | 3,019 | ||||||||||||
Fund accounting fees | 570 | 193 | 224 | 1,579 | ||||||||||||
Legal fees | 79 | 51 | 38 | 244 | ||||||||||||
Other | 7,822 | 11,241 | 1,059 | 2,592 | ||||||||||||
|
|
|
|
|
|
|
| |||||||||
Total liabilities | 545,344 | 303,105 | 6,946,454 | 1,752,455 | ||||||||||||
|
|
|
|
|
|
|
| |||||||||
Net Assets | $ | 29,551,996 | $ | 18,974,719 | $ | 15,748,861 | $ | 90,966,782 | ||||||||
|
|
|
|
|
|
|
| |||||||||
Cost: | ||||||||||||||||
Investments | $ | 27,890,552 | $ | 18,515,051 | $ | 15,579,503 | $ | 82,214,582 | ||||||||
Short-term investments | 1,039,337 | 429,660 | 494,794 | 2,741,532 | ||||||||||||
Up-front payments made/(received) on open swaps | – | – | (30,776 | ) | – | |||||||||||
Foreign currency | 325,514 | 1,616 | 218,137 | – | ||||||||||||
Represented by: | ||||||||||||||||
Capital | $ | 34,806,865 | $ | 23,573,467 | $ | 15,760,452 | $ | 84,559,224 | ||||||||
Accumulated net investment income/(loss) | 22,146 | (142,399 | ) | (58,636 | ) | (9,349 | ) | |||||||||
Accumulated net realized gain/(loss) from investments, futures contracts, swaps and foreign currency transactions | (5,204,216 | ) | (3,645,714 | ) | 135,156 | (169,737 | ) | |||||||||
Net unrealized appreciation/(depreciation) on investments, futures contracts, forwards and translation of assets and liabilities denominated in foreign currencies | (72,799 | ) | (810,635 | ) | (88,111 | ) | 6,586,644 | |||||||||
|
|
|
|
|
|
|
| |||||||||
Net Assets | $ | 29,551,996 | $ | 18,974,719 | $ | 15,748,861 | $ | 90,966,782 | ||||||||
|
|
|
|
|
|
|
| |||||||||
Net Assets: | ||||||||||||||||
Class A Shares | $ | 1,028,510 | $ | 246,835 | $ | 1,823,573 | $ | 10,798,226 | ||||||||
Class C Shares | 321,674 | 389,754 | 402,790 | 850,613 | ||||||||||||
Class R Shares | 10,388 | 1,493,014 | – | 10,658 | ||||||||||||
Institutional Service Class Shares | 9,708,910 | 19,801 | 10,939,917 | 28,059 | ||||||||||||
Institutional Class Shares | 18,482,514 | 16,825,315 | 2,582,581 | 79,279,226 | ||||||||||||
|
|
|
|
|
|
|
| |||||||||
Total | $ | 29,551,996 | $ | 18,974,719 | $ | 15,748,861 | $ | 90,966,782 | ||||||||
|
|
|
|
|
|
|
| |||||||||
| (a) | Included within Other receivables for the Global Unconstrained Fixed Income Fund is a $7,593 receivable from sub-administrator. |
Amounts listed as “–” are $0 or round to $0.
See accompanying Notes to Financial Statements.
Annual Report 2016
38
Statements of Assets and Liabilities (concluded)
October 31, 2016
| Aberdeen Asia Bond Fund | Aberdeen Emerging Markets Debt Fund | Aberdeen Global Unconstrained Fixed Income Fund | Aberdeen Tax-Free Income Fund | |||||||||||||
Shares Outstanding (unlimited number of shares authorized): | ||||||||||||||||
Class A Shares | 100,788 | 25,373 | 179,075 | 1,067,941 | ||||||||||||
Class C Shares | 32,157 | 40,275 | 40,242 | 84,265 | ||||||||||||
Class R Shares | 1,024 | 153,671 | – | 1,053 | ||||||||||||
Institutional Service Class Shares | 951,966 | 2,031 | 1,071,254 | 2,773 | ||||||||||||
Institutional Class Shares | 1,805,547 | 1,727,883 | 251,602 | 7,834,732 | ||||||||||||
|
|
|
|
|
|
|
| |||||||||
Total | 2,891,482 | 1,949,233 | 1,542,173 | 8,990,764 | ||||||||||||
|
|
|
|
|
|
|
| |||||||||
Net asset value and redemption price per share (Net assets by class divided by shares outstanding by class, respectively): | ||||||||||||||||
Class A Shares | $ | 10.20 | $ | 9.73 | $ | 10.18 | $ | 10.11 | ||||||||
Class C Shares (a) | $ | 10.00 | $ | 9.68 | $ | 10.01 | $ | 10.09 | ||||||||
Class R Shares | $ | 10.14 | $ | 9.72 | $ | – | $ | 10.12 | ||||||||
Institutional Service Class Shares | $ | 10.20 | $ | 9.75 | $ | 10.21 | $ | 10.12 | ||||||||
Institutional Class Shares | $ | 10.24 | $ | 9.74 | $ | 10.26 | $ | 10.12 | ||||||||
Maximum offering price per share (100%/(100%-maximum sales charge) of net asset value adjusted to the nearest cent): | ||||||||||||||||
Class A Shares | $ | 10.65 | $ | 10.16 | $ | 10.63 | $ | 10.56 | ||||||||
Maximum Sales Charge: | ||||||||||||||||
Class A Shares | 4.25 | % | 4.25 | % | 4.25 | % | 4.25 | % | ||||||||
| (a) | For Class C Shares, the redemption price per share is reduced by 1.00% for shares held less than one year due to contingent deferred sales charge. |
See accompanying Notes to Financial Statements.
2016 Annual Report
39
Statements of Operations
For the Year Ended October 31, 2016
| Aberdeen Asia Bond Fund | Aberdeen Emerging Markets Debt Fund | Aberdeen Global Unconstrained Fixed Income Fund | Aberdeen Tax-Free Income Fund | |||||||||||||
INVESTMENT INCOME: | ||||||||||||||||
Dividend income | $ | 11,230 | $ | – | $ | – | $ | – | ||||||||
Interest income | 1,940,977 | 1,858,505 | 326,190 | 3,584,623 | ||||||||||||
Foreign tax withholding | (65,868 | ) | 351 | (3,832 | ) | – | ||||||||||
Other income (a) | 9,954 | 3,315 | 14,565 | 2,528 | ||||||||||||
|
|
|
|
|
|
|
| |||||||||
| 1,896,293 | 1,862,171 | 336,923 | 3,587,151 | |||||||||||||
|
|
|
|
|
|
|
| |||||||||
Expenses: | ||||||||||||||||
Investment advisory fees | 189,169 | 169,461 | 82,723 | 396,016 | ||||||||||||
Administration fees | 30,267 | 18,076 | 11,030 | 74,544 | ||||||||||||
Distribution fees Class A | 1,649 | 126 | 2,028 | 25,939 | ||||||||||||
Distribution fees Class C | 4,179 | 5,585 | 3,134 | 7,068 | ||||||||||||
Distribution fees Class R | 50 | 1,564 | – | 52 | ||||||||||||
Sub-transfer agent and administrative service fees Class A | 101 | 22 | 275 | 1,456 | ||||||||||||
Sub-transfer agent and administrative service fees Class C | 134 | 223 | 271 | 394 | ||||||||||||
Sub-transfer agent and administrative service fees Institutional Service Class | 17,531 | – | 17,550 | – | ||||||||||||
Sub-transfer agent and administrative service fees Institutional Class | 9,833 | 777 | 887 | 1,275 | ||||||||||||
Fund accounting fees | 2,478 | 2,194 | 1,409 | 9,638 | ||||||||||||
Transfer agent fees | 3,997 | 5,664 | 16,191 | 71,989 | ||||||||||||
Trustee fees | 1,922 | 1,484 | 925 | 6,447 | ||||||||||||
Legal fees | 5,258 | 1,479 | 1,477 | 5,871 | ||||||||||||
Printing fees | 27,228 | 10,223 | 27,697 | 27,247 | ||||||||||||
Custodian fees | 30,487 | 14,988 | 30,146 | 4,775 | ||||||||||||
Registration and filing fees | 65,736 | 64,152 | 61,939 | 62,669 | ||||||||||||
Audit fees | 39,525 | 39,525 | 39,525 | 36,626 | ||||||||||||
Other | 33,277 | 9,285 | 11,377 | 17,023 | ||||||||||||
|
|
|
|
|
|
|
| |||||||||
Total expenses before reimbursed/waived expenses | 462,821 | 344,828 | 308,584 | 749,029 | ||||||||||||
Interest expense (Note 9) | 1,980 | 275 | 7 | – | ||||||||||||
|
|
|
|
|
|
|
| |||||||||
Total operating expenses before reimbursed/waived expenses | 464,801 | 345,103 | 308,591 | 749,029 | ||||||||||||
Expenses reimbursed | (174,473 | ) | (134,178 | ) | (168,405 | ) | (136,796 | ) | ||||||||
|
|
|
|
|
|
|
| |||||||||
Net expenses | 290,328 | 210,925 | 140,186 | 612,233 | ||||||||||||
|
|
|
|
|
|
|
| |||||||||
Net Investment Income | 1,605,965 | 1,651,246 | 196,737 | 2,974,918 | ||||||||||||
|
|
|
|
|
|
|
| |||||||||
REALIZED/UNREALIZED GAIN/(LOSS) FROM INVESTMENTS: | ||||||||||||||||
Realized gain/(loss) on investment transactions | (1,516,960 | ) | (2,155,167 | ) | (15,998 | ) | 38,085 | |||||||||
Realized gain on swap contracts | – | – | 36,680 | – | ||||||||||||
Realized gain/(loss) on futures contracts | 38,715 | – | (56,760 | ) | – | |||||||||||
Realized gain/(loss) on foreign currency transactions | (778,058 | ) | (264,980 | ) | 380,524 | – | ||||||||||
Payment from affiliate (Note 10) | – | 65,833 | – | – | ||||||||||||
|
|
|
|
|
|
|
| |||||||||
Net realized gain/(loss) from investments, futures contracts, swaps and foreign currency transactions | (2,256,303 | ) | (2,354,314 | ) | 344,446 | 38,085 | ||||||||||
|
|
|
|
|
|
|
| |||||||||
Net change in unrealized appreciation/(depreciation) on investment transactions | 1,658,479 | 2,598,140 | 470,971 | (748,133 | ) | |||||||||||
Net change in unrealized appreciation/(depreciation) on swap contracts | – | – | 70 | – | ||||||||||||
Net change in unrealized appreciation/(depreciation) on futures contracts | (15,892 | ) | – | 44,606 | – | |||||||||||
Net change in unrealized appreciation/(depreciation) on translation of assets and liabilities denominated in foreign currencies | 485,031 | (58,412 | ) | 63,274 | – | |||||||||||
|
|
|
|
|
|
|
| |||||||||
Net change in unrealized appreciation/(depreciation) from investments, futures contracts, swaps and translation of assets and liabilities denominated in foreign currencies | 2,127,618 | 2,539,728 | 578,921 | (748,133 | ) | |||||||||||
|
|
|
|
|
|
|
| |||||||||
Net realized/unrealized gain/(loss) from investments, futures contracts, swaps and foreign currency transactions | (128,685 | ) | 185,414 | 923,367 | (710,048 | ) | ||||||||||
|
|
|
|
|
|
|
| |||||||||
CHANGE IN NET ASSETS RESULTING FROM OPERATIONS | $ | 1,477,280 | $ | 1,836,660 | $ | 1,120,104 | $ | 2,264,870 | ||||||||
|
|
|
|
|
|
|
| |||||||||
| (a) | Other income includes a one-time reimbursement for overbilling of prior year custodian out-of-pocket fees. |
Amounts listed as “–” are $0 or round to $0.
See accompanying Notes to Financial Statements.
Annual Report 2016
40
Statements of Changes in Net Assets
Aberdeen Asia Bond Fund | Aberdeen Emerging Markets Debt Fund | |||||||||||||||
| Year Ended October 31, 2016 | Year Ended October 31, 2015 | Year Ended October 31, 2016 | Year Ended October 31, 2015 | |||||||||||||
FROM INVESTMENT ACTIVITIES: | ||||||||||||||||
Operations: | ||||||||||||||||
Net investment income | $ | 1,605,965 | $ | 8,860,617 | $ | 1,651,246 | $ | 1,697,019 | ||||||||
Net realized loss from investments, futures contracts, swaps and foreign currency transactions (including payment from affiliate) | (2,256,303 | ) | (22,887,120 | ) | (2,354,314 | ) | (1,242,397 | ) | ||||||||
Net change in unrealized appreciation/(depreciation) on investments, futures contracts, swaps and translation of assets and liabilities denominated in foreign currencies | 2,127,618 | 2,903,111 | 2,539,728 | (2,373,318 | ) | |||||||||||
|
|
|
|
|
|
|
| |||||||||
Changes in net assets resulting from operations | 1,477,280 | (11,123,392 | ) | 1,836,660 | (1,918,696 | ) | ||||||||||
|
|
|
|
|
|
|
| |||||||||
Distributions to Shareholders From: | ||||||||||||||||
Net investment income: | ||||||||||||||||
Class A | – | (3,241 | ) | (257 | ) | (382 | ) | |||||||||
Class C | – | (82 | ) | (17,166 | ) | (304 | ) | |||||||||
Class R | – | (27 | ) | (236 | ) | (345 | ) | |||||||||
Institutional Service Class | – | (64,826 | ) | (266 | ) | (388 | ) | |||||||||
Institutional Class | – | (1,726,330 | ) | (752,149 | ) | (1,168,032 | ) | |||||||||
Tax return of capital: | ||||||||||||||||
Class A | (7,596 | ) | (6,427 | ) | (43 | ) | – | |||||||||
Class C | (5,446 | ) | (4,710 | ) | (283 | ) | – | |||||||||
Class R | (93 | ) | (80 | ) | (42 | ) | – | |||||||||
Institutional Service Class | (107,254 | ) | (93,150 | ) | (42 | ) | – | |||||||||
Institutional Class | (331,890 | ) | (1,778,188 | ) | (119,327 | ) | – | |||||||||
|
|
|
|
|
|
|
| |||||||||
Change in net assets from shareholder distributions | (452,279 | ) | (3,677,061 | ) | (889,811 | ) | (1,169,451 | ) | ||||||||
|
|
|
|
|
|
|
| |||||||||
Common Stock Transactions: | ||||||||||||||||
Change in net assets from capital transactions | (57,849,596 | ) | (136,620,706 | ) | (10,121,916 | ) | 24,284 | |||||||||
|
|
|
|
|
|
|
| |||||||||
Change in net assets | (56,824,595 | ) | (151,421,159 | ) | (9,175,067 | ) | (3,063,863 | ) | ||||||||
|
|
|
|
|
|
|
| |||||||||
Net Assets: | ||||||||||||||||
Beginning of year | 86,376,591 | 237,797,750 | 28,149,786 | 31,213,649 | ||||||||||||
|
|
|
|
|
|
|
| |||||||||
End of year | $ | 29,551,996 | $ | 86,376,591 | $ | 18,974,719 | $ | 28,149,786 | ||||||||
|
|
|
|
|
|
|
| |||||||||
Accumulated net investment income at end of year | $ | 22,146 | $ | 141,733 | $ | (142,399 | ) | $ | 372,026 | |||||||
|
|
|
|
|
|
|
| |||||||||
Amounts listed as “–” are $0 or round to $0.
See accompanying Notes to Financial Statements.
2016 Annual Report
41
Statements of Changes in Net Assets (continued)
Aberdeen Asia Bond Fund | Aberdeen Emerging Markets Debt Fund | |||||||||||||||
| Year Ended October 31, 2016 | Year Ended October 31, 2015 | Year Ended October 31, 2016 | Year Ended October 31, 2015 | |||||||||||||
CAPITAL TRANSACTIONS: | ||||||||||||||||
Class A Shares | ||||||||||||||||
Proceeds from shares issued | $ | 406,446 | $ | 11,688 | $ | 202,894 | $ | 1,844 | ||||||||
Proceeds of shares issued in connection with fund merger | – | – | 40,646 | – | ||||||||||||
Dividends reinvested | 7,596 | 9,668 | 300 | 382 | ||||||||||||
Cost of shares redeemed(a) | (182,171 | ) | (34,783 | ) | (11,029 | ) | (1,491 | ) | ||||||||
|
|
|
|
|
|
|
| |||||||||
Total Class A | 231,871 | (13,427 | ) | 232,811 | 735 | |||||||||||
|
|
|
|
|
|
|
| |||||||||
Class C Shares | ||||||||||||||||
Proceeds from shares issued | 56,014 | 130,000 | – | 672,910 | ||||||||||||
Proceeds of shares issued in connection with fund merger | – | – | 114,371 | – | ||||||||||||
Dividends reinvested | 3,688 | 2,278 | 17,449 | 304 | ||||||||||||
Cost of shares redeemed(a) | (355,875 | ) | (94,335 | ) | (449,962 | ) | (9,321 | ) | ||||||||
|
|
|
|
|
|
|
| |||||||||
Total Class C | (296,173 | ) | 37,943 | (318,142 | ) | 663,893 | ||||||||||
|
|
|
|
|
|
|
| |||||||||
Class R Shares | ||||||||||||||||
Proceeds from shares issued | – | – | 215,021 | – | ||||||||||||
Proceeds of shares issued in connection with fund merger | – | – | 1,098,312 | – | ||||||||||||
Dividends reinvested | 93 | 108 | 278 | 345 | ||||||||||||
Cost of shares redeemed(a) | – | – | (57,592 | ) | – | |||||||||||
|
|
|
|
|
|
|
| |||||||||
Total Class R | 93 | 108 | 1,256,019 | 345 | ||||||||||||
|
|
|
|
|
|
|
| |||||||||
Institutional Service Class Shares | ||||||||||||||||
Proceeds from shares issued | 381,000 | 2,206,195 | – | – | ||||||||||||
Proceeds of shares issued in connection with fund merger | – | – | 6,938 | – | ||||||||||||
Dividends reinvested | 106,653 | 157,975 | 308 | 388 | ||||||||||||
Cost of shares redeemed(a) | (2,316,823 | ) | (2,108,634 | ) | – | – | ||||||||||
|
|
|
|
|
|
|
| |||||||||
Total Institutional Service Class | (1,829,170 | ) | 255,536 | 7,246 | 388 | |||||||||||
|
|
|
|
|
|
|
| |||||||||
Institutional Class Shares | ||||||||||||||||
Proceeds from shares issued | 2,415,016 | 55,863,369 | 239,361 | 3,564,492 | ||||||||||||
Proceeds of shares issued in connection with fund merger | – | – | 10,985,000 | – | ||||||||||||
Dividends reinvested | 326,914 | 2,585,481 | 858,055 | 1,146,714 | ||||||||||||
Cost of shares redeemed(a) | (58,698,147 | ) | (195,349,716 | ) | (23,382,266 | ) | (5,352,283 | ) | ||||||||
|
|
|
|
|
|
|
| |||||||||
Total Institutional Class | (55,956,217 | ) | (136,900,866 | ) | (11,299,850 | ) | (641,077 | ) | ||||||||
|
|
|
|
|
|
|
| |||||||||
Change in net assets from capital transactions: | $ | (57,849,596 | ) | $ | (136,620,706 | ) | $ | (10,121,916 | ) | $ | 24,284 | |||||
|
|
|
|
|
|
|
| |||||||||
| (a) | Includes redemption fees, if any. |
Amounts listed as “–” are $0 or round to $0.
See accompanying Notes to Financial Statements.
Annual Report 2016
42
Statements of Changes in Net Assets (continued)
Aberdeen Asia Bond Fund | Aberdeen Emerging Markets Debt Fund | |||||||||||||||
| Year Ended October 31, 2016 | Year Ended October 31, 2015 | Year Ended October 31, 2016 | Year Ended October 31, 2015 | |||||||||||||
SHARE TRANSACTIONS: | ||||||||||||||||
Class A Shares | ||||||||||||||||
Issued | 39,806 | 1,158 | 20,968 | 203 | ||||||||||||
Issued in connection with fund merger | – | – | 4,393 | – | ||||||||||||
Reinvested | 798 | 976 | 36 | 42 | ||||||||||||
Redeemed | (19,199 | ) | (3,540 | ) | (1,157 | ) | (171 | ) | ||||||||
|
|
|
|
|
|
|
| |||||||||
Total Class A Shares | 21,405 | (1,406 | ) | 24,240 | 74 | |||||||||||
|
|
|
|
|
|
|
| |||||||||
Class C Shares | ||||||||||||||||
Issued | 5,903 | 13,046 | – | 74,198 | ||||||||||||
Issued in connection with fund merger | – | – | 12,044 | – | ||||||||||||
Reinvested | 393 | 232 | 2,095 | 34 | ||||||||||||
Redeemed | (37,085 | ) | (9,540 | ) | (48,062 | ) | (1,078 | ) | ||||||||
|
|
|
|
|
|
|
| |||||||||
Total Class C Shares | (30,789 | ) | 3,738 | (33,923 | ) | 73,154 | ||||||||||
|
|
|
|
|
|
|
| |||||||||
Class R Shares | ||||||||||||||||
Issued | – | – | 22,022 | – | ||||||||||||
Issued in connection with fund merger | – | – | 136,435 | – | ||||||||||||
Reinvested | 10 | 10 | 34 | 38 | ||||||||||||
Redeemed | – | – | (5,912 | ) | – | |||||||||||
|
|
|
|
|
|
|
| |||||||||
Total Class R Shares | 10 | 10 | 152,579 | 38 | ||||||||||||
|
|
|
|
|
|
|
| |||||||||
Institutional Service Class Shares | ||||||||||||||||
Issued | 38,233 | 221,151 | – | – | ||||||||||||
Issued in connection with fund merger | – | – | 886 | – | ||||||||||||
Reinvested | 11,227 | 15,973 | 38 | 43 | ||||||||||||
Redeemed | (236,302 | ) | (214,232 | ) | – | – | ||||||||||
|
|
|
|
|
|
|
| |||||||||
Total Institutional Service Class Shares | (186,842 | ) | 22,892 | 924 | 43 | |||||||||||
|
|
|
|
|
|
|
| |||||||||
Institutional Class Shares | ||||||||||||||||
Issued | 247,614 | 5,575,054 | 25,251 | 403,185 | ||||||||||||
Issued in connection with fund merger | – | – | 1,023,421 | – | ||||||||||||
Reinvested | 34,340 | 261,424 | 103,255 | 127,086 | ||||||||||||
Redeemed | (6,049,506 | ) | (20,286,804 | ) | (2,555,245 | ) | (604,220 | ) | ||||||||
|
|
|
|
|
|
|
| |||||||||
Total Institutional Class Shares | (5,767,552 | ) | (14,450,326 | ) | (1,403,318 | ) | (73,949 | ) | ||||||||
|
|
|
|
|
|
|
| |||||||||
Total change in shares: | (5,963,768 | ) | (14,425,092 | ) | (1,259,498 | ) | (640 | ) | ||||||||
|
|
|
|
|
|
|
| |||||||||
Amounts listed as “–” are $0 or round to $0.
See accompanying Notes to Financial Statements.
2016 Annual Report
43
Statements of Changes in Net Assets (continued)
| Aberdeen Global Unconstrained Fixed Income Fund | Aberdeen Tax-Free Income Fund | |||||||||||||||
| Year Ended October 31, 2016 | Year Ended October 31, 2015 | Year Ended October 31, 2016 | Year Ended October 31, 2015 | |||||||||||||
FROM INVESTMENT ACTIVITIES: | ||||||||||||||||
Operations: | ||||||||||||||||
Net investment income | $ | 196,737 | $ | 424,958 | $ | 2,974,918 | $ | 3,198,764 | ||||||||
Net realized gain/(loss) from investments, futures contracts, swaps and foreign currency transactions | 344,446 | (1,666,221 | ) | 38,085 | (207,822 | ) | ||||||||||
Net change in unrealized appreciation/(depreciation) on investments, futures contracts, swaps and translation of assets and liabilities denominated in foreign currencies | 578,921 | 1,245 | (748,133 | ) | (1,335,081 | ) | ||||||||||
|
|
|
|
|
|
|
| |||||||||
Changes in net assets resulting from operations | 1,120,104 | (1,240,018 | ) | 2,264,870 | 1,655,861 | |||||||||||
|
|
|
|
|
|
|
| |||||||||
Distributions to Shareholders From: | ||||||||||||||||
Net investment income: | ||||||||||||||||
Class A | (2,781 | ) | (11,375 | ) | (305,772 | ) | (288,498 | ) | ||||||||
Class C | (551 | ) | (3,078 | ) | (15,726 | ) | (13,999 | ) | ||||||||
Class R | – | – | (289 | ) | (294 | ) | ||||||||||
Institutional Service Class | (40,809 | ) | (158,896 | ) | (736 | ) | (578 | ) | ||||||||
Institutional Class | (5,182 | ) | (26,118 | ) | (2,643,402 | ) | (2,867,751 | ) | ||||||||
Net realized gains: | ||||||||||||||||
Class A | – | – | – | (31,102 | ) | |||||||||||
Class C | – | – | – | (1,976 | ) | |||||||||||
Class R | – | – | – | (34 | ) | |||||||||||
Institutional Service Class | – | – | – | (56 | ) | |||||||||||
Institutional Class | – | – | – | (290,135 | ) | |||||||||||
Tax return of capital: | ||||||||||||||||
Class A | – | – | (1,002 | ) | (2,701 | ) | ||||||||||
Class C | – | – | (68 | ) | (171 | ) | ||||||||||
Class R | – | – | (1 | ) | (3 | ) | ||||||||||
Institutional Service Class | – | – | (2 | ) | (5 | ) | ||||||||||
Institutional Class | – | – | (7,922 | ) | (24,764 | ) | ||||||||||
|
|
|
|
|
|
|
| |||||||||
Change in net assets from shareholder distributions | (49,323 | ) | (199,467 | ) | (2,974,920 | ) | (3,522,067 | ) | ||||||||
|
|
|
|
|
|
|
| |||||||||
Common Stock Transactions: | ||||||||||||||||
Change in net assets from capital transactions | (579,023 | ) | (4,305,552 | ) | (1,442,082 | ) | (4,988,346 | ) | ||||||||
|
|
|
|
|
|
|
| |||||||||
Change in net assets | 491,758 | (5,745,037 | ) | (2,152,132 | ) | (6,854,552 | ) | |||||||||
|
|
|
|
|
|
|
| |||||||||
Net Assets: | ||||||||||||||||
Beginning of year | 15,257,103 | 21,002,140 | 93,118,914 | 99,973,466 | ||||||||||||
|
|
|
|
|
|
|
| |||||||||
End of year | $ | 15,748,861 | $ | 15,257,103 | $ | 90,966,782 | $ | 93,118,914 | ||||||||
|
|
|
|
|
|
|
| |||||||||
Accumulated net investment income/(loss) at end of year | $ | (58,636 | ) | $ | (26,429 | ) | $ | (9,349 | ) | $ | (18,342 | ) | ||||
|
|
|
|
|
|
|
| |||||||||
Amounts listed as “–” are $0 or round to $0.
See accompanying Notes to Financial Statements.
Annual Report 2016
44
Statements of Changes in Net Assets (continued)
| Aberdeen Global Unconstrained Fixed Income Fund | Aberdeen Tax-Free Income Fund | |||||||||||||||
| Year Ended October 31, 2016 | Year Ended October 31, 2015 | Year Ended October 31, 2016 | Year Ended October 31, 2015 | |||||||||||||
CAPITAL TRANSACTIONS: | ||||||||||||||||
Class A Shares | ||||||||||||||||
Proceeds from shares issued | $ | 1,153,055 | $ | 96,008 | $ | 4,280,512 | $ | 1,527,840 | ||||||||
Dividends reinvested | 2,151 | 8,304 | 228,631 | 244,174 | ||||||||||||
Cost of shares redeemed(a) | (221,735 | ) | (379,939 | ) | (2,703,863 | ) | (1,897,534 | ) | ||||||||
|
|
|
|
|
|
|
| |||||||||
Total Class A | 933,471 | (275,627 | ) | 1,805,280 | (125,520 | ) | ||||||||||
|
|
|
|
|
|
|
| |||||||||
Class C Shares | ||||||||||||||||
Proceeds from shares issued | 321,590 | 4,586 | 484,388 | 604,777 | ||||||||||||
Dividends reinvested | 518 | 2,886 | 12,550 | 11,062 | ||||||||||||
Cost of shares redeemed(a) | (190,410 | ) | (106,663 | ) | (515,847 | ) | (370,995 | ) | ||||||||
|
|
|
|
|
|
|
| |||||||||
Total Class C | 131,698 | (99,191 | ) | (18,909 | ) | 244,844 | ||||||||||
|
|
|
|
|
|
|
| |||||||||
Class R Shares | ||||||||||||||||
Dividends reinvested | – | – | 291 | 333 | ||||||||||||
|
|
|
|
|
|
|
| |||||||||
Total Class R | – | – | 291 | 333 | ||||||||||||
|
|
|
|
|
|
|
| |||||||||
Institutional Service Class Shares | ||||||||||||||||
Proceeds from shares issued | 649,399 | 2,140,657 | 10,061 | – | ||||||||||||
Dividends reinvested | 39,375 | 153,422 | 738 | 644 | ||||||||||||
Cost of shares redeemed(a) | (3,372,599 | ) | (5,096,813 | ) | (15 | ) | (15 | ) | ||||||||
|
|
|
|
|
|
|
| |||||||||
Total Institutional Service Class | (2,683,825 | ) | (2,802,734 | ) | 10,784 | 629 | ||||||||||
|
|
|
|
|
|
|
| |||||||||
Institutional Class Shares | ||||||||||||||||
Proceeds from shares issued | 1,639,260 | 297,735 | 1,472,091 | 921,676 | ||||||||||||
Dividends reinvested | 5,179 | 26,109 | 1,973,683 | 2,414,223 | ||||||||||||
Cost of shares redeemed(a) | (604,806 | ) | (1,451,844 | ) | (6,685,302 | ) | (8,444,531 | ) | ||||||||
|
|
|
|
|
|
|
| |||||||||
Total Institutional Class | 1,039,633 | (1,128,000 | ) | (3,239,528 | ) | (5,108,632 | ) | |||||||||
|
|
|
|
|
|
|
| |||||||||
Change in net assets from capital transactions: | $ | (579,023 | ) | $ | (4,305,552 | ) | $ | (1,442,082 | ) | $ | (4,988,346 | ) | ||||
|
|
|
|
|
|
|
| |||||||||
| (a) | Includes redemption fees, if any. |
Amounts listed as “–” are $0 or round to $0.
See accompanying Notes to Financial Statements.
2016 Annual Report
45
Statements of Changes in Net Assets (concluded)
| Aberdeen Global Unconstrained Fixed Income Fund | Aberdeen Tax-Free Income Fund | |||||||||||||||
| Year Ended October 31, 2016 | Year Ended October 31, 2015 | Year Ended October 31, 2016 | Year Ended October 31, 2015 | |||||||||||||
SHARE TRANSACTIONS: | ||||||||||||||||
Class A Shares | ||||||||||||||||
Issued | 114,100 | 9,806 | 419,435 | 148,282 | ||||||||||||
Reinvested | 233 | 853 | 22,384 | 23,786 | ||||||||||||
Redeemed | (23,113 | ) | (39,780 | ) | (264,292 | ) | (184,867 | ) | ||||||||
|
|
|
|
|
|
|
| |||||||||
Total Class A Shares | 91,220 | (29,121 | ) | 177,527 | (12,799 | ) | ||||||||||
|
|
|
|
|
|
|
| |||||||||
Class C Shares | ||||||||||||||||
Issued | 32,470 | 481 | 47,491 | 59,395 | ||||||||||||
Reinvested | 57 | 298 | 1,231 | 1,080 | ||||||||||||
Redeemed | (19,242 | ) | (11,369 | ) | (50,729 | ) | (36,217 | ) | ||||||||
|
|
|
|
|
|
|
| |||||||||
Total Class C Shares | 13,285 | (10,590 | ) | (2,007 | ) | 24,258 | ||||||||||
|
|
|
|
|
|
|
| |||||||||
Class R Shares | ||||||||||||||||
Reinvested | – | – | 29 | 32 | ||||||||||||
|
|
|
|
|
|
|
| |||||||||
Total Class R Shares | – | – | 29 | 32 | ||||||||||||
|
|
|
|
|
|
|
| |||||||||
Institutional Service Class Shares | ||||||||||||||||
Issued | 65,888 | 219,035 | 982 | – | ||||||||||||
Reinvested | 4,252 | 15,752 | 72 | 63 | ||||||||||||
Redeemed | (353,276 | ) | (532,422 | ) | (1 | ) | (2 | ) | ||||||||
|
|
|
|
|
|
|
| |||||||||
Total Institutional Service Class Shares | (283,136 | ) | (297,635 | ) | 1,053 | 61 | ||||||||||
|
|
|
|
|
|
|
| |||||||||
Institutional Class Shares | ||||||||||||||||
Issued | 162,450 | 30,652 | 143,745 | 89,700 | ||||||||||||
Reinvested | 557 | 2,675 | 193,056 | 234,881 | ||||||||||||
Redeemed | (61,379 | ) | (151,061 | ) | (653,558 | ) | (823,655 | ) | ||||||||
|
|
|
|
|
|
|
| |||||||||
Total Institutional Class Shares | 101,628 | (117,734 | ) | (316,757 | ) | (499,074 | ) | |||||||||
|
|
|
|
|
|
|
| |||||||||
Total change in shares: | (77,003 | ) | (455,080 | ) | (140,155 | ) | (487,522 | ) | ||||||||
|
|
|
|
|
|
|
| |||||||||
Amounts listed as “–” are $0 or round to $0.
See accompanying Notes to Financial Statements.
Annual Report 2016
46
This page intentionally left blank.
Financial Highlights
Selected Data for Each Share of Capital Outstanding Throughout the Periods Indicated
Aberdeen Asia Bond Fund
| Investment Activities | Distributions | |||||||||||||||||||||||||||||||||||||||
| Net Asset Value, Beginning of Period | Net Investment Income (a) | Net Realized and Unrealized Gains (Losses) on Invest- ments | Total from Invest- ment Activities | Net Invest- ment Income | Net Realized Gains | Tax Return of Capital | Total Distri- butions | Redemp- tion Fees | Net Asset Value, End of Period | |||||||||||||||||||||||||||||||
Class A Shares | ||||||||||||||||||||||||||||||||||||||||
Year Ended October 31, 2016 | $ | 9.75 | $ | 0.41 | $ | 0.14 | $ | 0.55 | $ | – | $ | – | $ | (0.10 | ) | $ | (0.10 | ) | $ | – | $ | 10.20 | ||||||||||||||||||
Year Ended October 31, 2015 | 10.19 | 0.39 | (0.71 | ) | (0.32 | ) | (0.04 | ) | – | (0.08 | ) | (0.12 | ) | – | 9.75 | |||||||||||||||||||||||||
Year Ended October 31, 2014 | 10.43 | 0.35 | (0.12 | ) | 0.23 | (0.14 | ) | (0.33 | ) | – | (0.47 | ) | – | 10.19 | ||||||||||||||||||||||||||
Year Ended October 31, 2013 | 11.26 | 0.34 | (0.85 | ) | (0.51 | ) | (0.25 | ) | (0.07 | ) | – | (0.32 | ) | – | 10.43 | |||||||||||||||||||||||||
Period Ended October 31, 2012(i) | 10.92 | 0.23 | 0.29 | 0.52 | (0.18 | ) | – | – | (0.18 | ) | – | 11.26 | ||||||||||||||||||||||||||||
Class C Shares | ||||||||||||||||||||||||||||||||||||||||
Year Ended October 31, 2016 | 9.62 | 0.32 | 0.14 | 0.46 | – | – | (0.08 | ) | (0.08 | ) | – | 10.00 | ||||||||||||||||||||||||||||
Year Ended October 31, 2015 | 10.10 | 0.31 | (0.71 | ) | (0.40 | ) | – | – | (0.08 | ) | (0.08 | ) | – | 9.62 | ||||||||||||||||||||||||||
Year Ended October 31, 2014 | 10.37 | 0.28 | (0.11 | ) | 0.17 | (0.11 | ) | (0.33 | ) | – | (0.44 | ) | – | 10.10 | ||||||||||||||||||||||||||
Year Ended October 31, 2013 | 11.24 | 0.26 | (0.86 | ) | (0.60 | ) | (0.20 | ) | (0.07 | ) | – | (0.27 | ) | – | 10.37 | |||||||||||||||||||||||||
Period Ended October 31, 2012(i) | 10.92 | 0.17 | 0.31 | 0.48 | (0.16 | ) | – | – | (0.16 | ) | – | 11.24 | ||||||||||||||||||||||||||||
Class R Shares | ||||||||||||||||||||||||||||||||||||||||
Year Ended October 31, 2016 | 9.71 | 0.38 | 0.14 | 0.52 | – | – | (0.09 | ) | (0.09 | ) | – | 10.14 | ||||||||||||||||||||||||||||
Year Ended October 31, 2015 | 10.16 | 0.36 | (0.70 | ) | (0.34 | ) | (0.03 | ) | – | (0.08 | ) | (0.11 | ) | – | 9.71 | |||||||||||||||||||||||||
Year Ended October 31, 2014 | 10.42 | 0.33 | (0.12 | ) | 0.21 | (0.14 | ) | (0.33 | ) | – | (0.47 | ) | – | 10.16 | ||||||||||||||||||||||||||
Year Ended October 31, 2013 | 11.27 | 0.31 | (0.86 | ) | (0.55 | ) | (0.23 | ) | (0.07 | ) | – | (0.30 | ) | – | 10.42 | |||||||||||||||||||||||||
Period Ended October 31, 2012(i) | 10.92 | 0.22 | 0.29 | 0.51 | (0.16 | ) | – | – | (0.16 | ) | – | 11.27 | ||||||||||||||||||||||||||||
Institutional Service Class Shares | ||||||||||||||||||||||||||||||||||||||||
Year Ended October 31, 2016 | 9.74 | 0.41 | 0.15 | 0.56 | – | – | (0.10 | ) | (0.10 | ) | – | 10.20 | ||||||||||||||||||||||||||||
Year Ended October 31, 2015 | 10.20 | 0.39 | (0.72 | ) | (0.33 | ) | (0.05 | ) | – | (0.08 | ) | (0.13 | ) | – | 9.74 | |||||||||||||||||||||||||
Year Ended October 31, 2014 | 10.43 | 0.35 | (0.10 | ) | 0.25 | (0.15 | ) | (0.33 | ) | – | (0.48 | ) | – | 10.20 | ||||||||||||||||||||||||||
Year Ended October 31, 2013 | 11.27 | 0.34 | (0.86 | ) | (0.52 | ) | (0.25 | ) | (0.07 | ) | – | (0.32 | ) | – | 10.43 | |||||||||||||||||||||||||
Year Ended October 31, 2012 | 10.99 | 0.35 | 0.38 | 0.73 | (0.45 | ) | – | – | (0.45 | ) | – | 11.27 | ||||||||||||||||||||||||||||
Institutional Class Shares | ||||||||||||||||||||||||||||||||||||||||
Year Ended October 31, 2016 | 9.76 | 0.42 | 0.16 | 0.58 | – | – | (0.10 | ) | (0.10 | ) | – | 10.24 | ||||||||||||||||||||||||||||
Year Ended October 31, 2015 | 10.22 | 0.40 | (0.70 | ) | (0.30 | ) | (0.08 | ) | – | (0.08 | ) | (0.16 | ) | – | 9.76 | |||||||||||||||||||||||||
Year Ended October 31, 2014 | 10.45 | 0.38 | (0.12 | ) | 0.26 | (0.16 | ) | (0.33 | ) | – | (0.49 | ) | – | 10.22 | ||||||||||||||||||||||||||
Year Ended October 31, 2013 | 11.27 | 0.36 | (0.84 | ) | (0.48 | ) | (0.27 | ) | (0.07 | ) | – | (0.34 | ) | – | 10.45 | |||||||||||||||||||||||||
Year Ended October 31, 2012 | 11.00 | 0.38 | 0.36 | 0.74 | (0.47 | ) | – | – | (0.47 | ) | – | 11.27 | ||||||||||||||||||||||||||||
| (a) | Net investment income/(loss) is based on average shares outstanding during the period. |
| (b) | Excludes sales charge. |
| (c) | Annualized for periods less than one year. |
| (d) | During the period, certain fees were waived and/or reimbursed. If such waivers/reimbursements had not occurred, the ratios would have been as indicated. |
| (e) | Not annualized for periods less than one year. |
Amounts listed as “–” are $0 or round to $0.
See accompanying Notes to Financial Statements.
Annual Report 2016
48
Financial Highlights (continued)
Selected Data for Each Share of Capital Outstanding Throughout the Periods Indicated
Aberdeen Asia Bond Fund (concluded)
| Ratios/Supplemental Data | ||||||||||||||||||||||
| Total Return (b) | Net Assets at End of Period (000’s) | Ratio of Expenses (Net of Reimbursements/Waivers) to Average Net Assets (c) | Ratio of Net Investment Income to Average Net Assets (c) | Ratio of Expenses (Prior to Reimbursements) to Average Net Assets (c)(d) | Portfolio Turnover (e)(f) | |||||||||||||||||
| 5.67 | % | $ | 1,029 | 0.97 | %(g) | 4.12 | % | 1.40 | %(g) | 96.06 | % | |||||||||||
| (3.16 | %) | 774 | 0.96 | %(h) | 3.91 | % | 1.09 | %(h) | 93.16 | % | ||||||||||||
| 2.41 | % | 824 | 0.95 | % | 3.52 | % | 1.05 | % | 57.03 | % | ||||||||||||
| (4.64 | %) | 1,807 | 0.95 | % | 3.18 | % | 1.03 | % | 77.93 | % | ||||||||||||
| 4.87 | % | 1,275 | 0.92 | % | 3.14 | % | 0.99 | % | 62.96 | % | ||||||||||||
| 4.88 | % | 322 | 1.71 | %(g) | 3.34 | % | 2.17 | %(g) | 96.06 | % | ||||||||||||
| (3.97 | %)(j) | 606 | 1.71 | %(h) | 3.19 | % | 1.84 | %(h) | 93.16 | % | ||||||||||||
| 1.76 | %(j) | 598 | 1.70 | % | 2.77 | % | 1.80 | % | 57.03 | % | ||||||||||||
| (5.46 | %)(j) | 637 | 1.70 | % | 2.39 | % | 1.78 | % | 77.93 | % | ||||||||||||
| 4.44 | % | 393 | 1.67 | % | 2.31 | % | 1.74 | % | 62.96 | % | ||||||||||||
| 5.44 | % | 10 | 1.20 | %(g) | 3.85 | % | 1.63 | %(g) | 96.06 | % | ||||||||||||
| (3.40 | %) | 10 | 1.20 | %(h) | 3.69 | % | 1.33 | %(h) | 93.16 | % | ||||||||||||
| 2.14 | % | 10 | 1.20 | % | 3.25 | % | 1.31 | % | 57.03 | % | ||||||||||||
| (5.04 | %) | 10 | 1.20 | % | 2.84 | % | 1.28 | % | 77.93 | % | ||||||||||||
| 4.76 | % | 11 | 1.17 | % | 2.97 | % | 1.24 | % | 62.96 | % | ||||||||||||
| 5.78 | % | 9,709 | 0.88 | %(g) | 4.17 | % | 1.31 | %(g) | 96.06 | % | ||||||||||||
| (3.21 | %) | 11,087 | 0.96 | %(h) | 3.92 | % | 1.09 | %(h) | 93.16 | % | ||||||||||||
| 2.54 | %(j) | 11,377 | 0.94 | % | 3.52 | % | 1.04 | % | 57.03 | % | ||||||||||||
| (4.74 | %) | 11,083 | 0.95 | % | 3.09 | % | 1.03 | % | 77.93 | % | ||||||||||||
| 6.93 | % | 12,449 | 0.93 | % | 3.21 | % | 0.97 | % | 62.96 | % | ||||||||||||
| 6.02 | % | 18,483 | 0.71 | %(g) | 4.29 | % | 1.18 | %(g) | 96.06 | % | ||||||||||||
| (2.99 | %) | 73,900 | 0.70 | %(h) | 3.99 | % | 0.83 | %(h) | 93.16 | % | ||||||||||||
| 2.72 | % | 224,989 | 0.70 | % | 3.77 | % | 0.80 | % | 57.03 | % | ||||||||||||
| (4.40 | %)(j) | 232,639 | 0.70 | % | 3.27 | % | 0.78 | % | 77.93 | % | ||||||||||||
| 7.07 | %(j) | 467,668 | 0.69 | % | 3.46 | % | 0.72 | % | 62.96 | % | ||||||||||||
| (f) | Portfolio turnover is calculated on the basis of the Fund as a whole without distinguishing among the classes of shares. |
| (g) | Includes interest expense that amounts to 0.01% |
| (h) | Includes interest expense that amounts to less than 0.01%. |
| (i) | For the period from February 28, 2012 (commencement of operations) through October 31, 2012. |
| (j) | The total return shown above includes the impact of financial statement rounding of the NAV per share and/or financial statement adjustments. |
2016 Annual Report
49
Financial Highlights (continued)
Selected Data for Each Share of Capital Outstanding Throughout the Periods Indicated
Aberdeen Emerging Markets Debt Fund*
| Investment Activities | Distributions | |||||||||||||||||||||||||||||||
| Net Asset Value, Beginning of Period | Net Investment Income (a) | Net Realized and Unrealized Gains (Losses) on Invest- ments | Total from Invest- ment Activities | Net Invest- ment Income | Tax Return of Capital | Total Distri- butions | Net Asset Value, End of Period | |||||||||||||||||||||||||
Class A Shares | ||||||||||||||||||||||||||||||||
Year Ended October 31, 2016 | $ | 8.77 | $ | 0.57 | $ | 0.65 | $ | 1.22 | $ | (0.22 | ) | $ | (0.04 | ) | $ | (0.26 | ) | $ | 9.73 | |||||||||||||
Year Ended October 31, 2015 | 9.73 | 0.49 | (1.11 | ) | (0.62 | ) | (0.34 | ) | – | (0.34 | ) | 8.77 | ||||||||||||||||||||
Year Ended October 31, 2014 | 9.54 | 0.42 | 0.11 | 0.53 | (0.34 | ) | – | (0.34 | ) | 9.73 | ||||||||||||||||||||||
Year Ended October 31, 2013 | 10.00 | 0.35 | (0.59 | ) | (0.24 | ) | (0.22 | ) | – | (0.22 | ) | 9.54 | ||||||||||||||||||||
Class C Shares | ||||||||||||||||||||||||||||||||
Year Ended October 31, 2016 | 8.76 | 0.57 | 0.59 | 1.16 | (0.21 | ) | (0.03 | ) | (0.24 | ) | 9.68 | |||||||||||||||||||||
Year Ended October 31, 2015 | 9.72 | 0.38 | (1.05 | ) | (0.67 | ) | (0.29 | ) | – | (0.29 | ) | 8.76 | ||||||||||||||||||||
Year Ended October 31, 2014 | 9.53 | 0.34 | 0.11 | 0.45 | (0.26 | ) | – | (0.26 | ) | 9.72 | ||||||||||||||||||||||
Year Ended October 31, 2013 | 10.00 | 0.27 | (0.59 | ) | (0.32 | ) | (0.15 | ) | – | (0.15 | ) | 9.53 | ||||||||||||||||||||
Class R Shares | ||||||||||||||||||||||||||||||||
Year Ended October 31, 2016 | 8.77 | 0.51 | 0.69 | 1.20 | (0.22 | ) | (0.03 | ) | (0.25 | ) | 9.72 | |||||||||||||||||||||
Year Ended October 31, 2015 | 9.73 | 0.46 | (1.10 | ) | (0.64 | ) | (0.32 | ) | – | (0.32 | ) | 8.77 | ||||||||||||||||||||
Year Ended October 31, 2014 | 9.54 | 0.39 | 0.11 | 0.50 | (0.31 | ) | – | (0.31 | ) | 9.73 | ||||||||||||||||||||||
Year Ended October 31, 2013 | 10.00 | 0.32 | (0.58 | ) | (0.26 | ) | (0.20 | ) | – | (0.20 | ) | 9.54 | ||||||||||||||||||||
Institutional Service Class Shares | ||||||||||||||||||||||||||||||||
Year Ended October 31, 2016 | 8.78 | 0.64 | 0.61 | 1.25 | (0.24 | ) | (0.04 | ) | (0.28 | ) | 9.75 | |||||||||||||||||||||
Year Ended October 31, 2015 | 9.74 | 0.51 | (1.11 | ) | (0.60 | ) | (0.36 | ) | – | (0.36 | ) | 8.78 | ||||||||||||||||||||
Year Ended October 31, 2014 | 9.55 | 0.44 | 0.11 | 0.55 | (0.36 | ) | – | (0.36 | ) | 9.74 | ||||||||||||||||||||||
Year Ended October 31, 2013 | 10.00 | 0.37 | (0.58 | ) | (0.21 | ) | (0.24 | ) | – | (0.24 | ) | 9.55 | ||||||||||||||||||||
Institutional Class Shares | ||||||||||||||||||||||||||||||||
Year Ended October 31, 2016 | 8.77 | 0.65 | 0.60 | 1.25 | (0.24 | ) | (0.04 | ) | (0.28 | ) | 9.74 | |||||||||||||||||||||
Year Ended October 31, 2015 | 9.73 | 0.52 | (1.12 | ) | (0.60 | ) | (0.36 | ) | – | (0.36 | ) | 8.77 | ||||||||||||||||||||
Year Ended October 31, 2014 | 9.54 | 0.47 | 0.08 | 0.55 | (0.36 | ) | – | (0.36 | ) | 9.73 | ||||||||||||||||||||||
Year Ended October 31, 2013 | 10.00 | 0.37 | (0.59 | ) | (0.22 | ) | (0.24 | ) | – | (0.24 | ) | 9.54 | ||||||||||||||||||||
| * | The Fund commenced operations on November 1, 2012. |
| (a) | Net investment income/(loss) is based on average shares outstanding during the period. |
| (b) | Excludes sales charge. |
| (c) | During the period, certain fees were waived and/or reimbursed. If such waivers/reimbursements had not occurred, the ratios would have been as indicated. |
| (d) | Portfolio turnover is calculated on the basis of the Fund as a whole without distinguishing among the classes of shares. |
Amounts listed as “–” are $0 or round to $0.
See accompanying Notes to Financial Statements.
Annual Report 2016
50
Financial Highlights (continued)
Selected Data for Each Share of Capital Outstanding Throughout the Periods Indicated
Aberdeen Emerging Markets Debt Fund (concluded)
| Ratios/Supplemental Data | ||||||||||||||||||||||
| Total Return (b) | Net Assets at End of Period (000’s) | Ratio of Expenses (Net of Reimbursements/Waivers) to Average Net Assets | Ratio of Net Investment Income to Average Net Assets | Ratio of Expenses (Prior to Reimbursements) to Average Net Assets (c) | Portfolio Turnover (d) | |||||||||||||||||
| 14.45 | %(e) | $ | 247 | 1.20 | %(f) | 5.88 | % | 1.79 | %(f) | 103.26 | % | |||||||||||
| (6.41 | %) | 10 | 1.17 | %(f) | 5.39 | % | 1.65 | %(f) | 64.60 | % | ||||||||||||
| 5.64 | % | 10 | 1.15 | % | 4.35 | % | 1.85 | % | 60.31 | % | ||||||||||||
| (2.43 | %) | 10 | 1.15 | % | 3.58 | % | 2.57 | % | 55.26 | % | ||||||||||||
| 13.62 | %(e) | 390 | 1.90 | %(f) | 6.39 | % | 2.53 | %(f) | 103.26 | % | ||||||||||||
| (6.98 | %) | 650 | 1.90 | %(f) | 4.29 | % | 2.38 | %(f) | 64.60 | % | ||||||||||||
| 4.83 | %(g) | 10 | 1.89 | % | 3.60 | % | 2.60 | % | 60.31 | % | ||||||||||||
| (3.20 | %)(g) | 10 | 1.90 | % | 2.83 | % | 3.32 | % | 55.26 | % | ||||||||||||
| 14.22 | %(e) | 1,493 | 1.40 | %(f) | 5.04 | % | 1.99 | %(f) | 103.26 | % | ||||||||||||
| (6.60 | %) | 10 | 1.40 | %(f) | 5.09 | % | 1.88 | %(f) | 64.60 | % | ||||||||||||
| 5.37 | % | 10 | 1.40 | % | 4.10 | % | 2.10 | % | 60.31 | % | ||||||||||||
| (2.66 | %) | 10 | 1.40 | % | 3.34 | % | 2.82 | % | 55.26 | % | ||||||||||||
| 14.76 | %(e) | 20 | 0.90 | %(f) | 7.01 | % | 1.49 | %(f) | 103.26 | % | ||||||||||||
| (6.22 | %)(g) | 10 | 0.90 | %(f) | 5.62 | % | 1.38 | %(f) | 64.60 | % | ||||||||||||
| 5.80 | %(g) | 10 | 0.90 | % | 4.60 | % | 1.60 | % | 60.31 | % | ||||||||||||
| (2.11 | %)(g) | 10 | 0.90 | % | 3.83 | % | 2.32 | % | 55.26 | % | ||||||||||||
| 14.78 | %(e) | 16,825 | 0.90 | %(f) | 7.37 | % | 1.49 | %(f) | 103.26 | % | ||||||||||||
| (6.23 | %) | 27,471 | 0.90 | %(f) | 5.71 | % | 1.38 | %(f) | 64.60 | % | ||||||||||||
| 5.91 | % | 31,173 | 0.90 | % | 4.79 | % | 1.60 | % | 60.31 | % | ||||||||||||
| (2.21 | %) | 9,742 | 0.90 | % | 3.81 | % | 2.32 | % | 55.26 | % | ||||||||||||
| (e) | Included within Net Realized and Unrealized Gains (Losses) on Investments per share is a payment from affiliate (Note 10). If such payment was excluded, the total return would have been 14.33% for Class A Shares, 13.15% for Class C Shares, 13.87% for Class R Shares, 14.41% for Institutional Service Class Shares, and 14.31% for Institutional Class Shares. |
| (f) | Includes interest expense that amounts to less than 0.01%. |
| (g) | The total return shown above includes the impact of financial statement rounding of the NAV per share and/or financial statement adjustments. |
2016 Annual Report
51
Financial Highlights (continued)
Selected Data for Each Share of Capital Outstanding Throughout the Periods Indicated
Aberdeen Global Unconstrained Fixed Income Fund
| Investment Activities | Distributions | |||||||||||||||||||||||||||
| Net Asset Value, Beginning of Period | Net Investment Income (a) | Net Realized and Unrealized Gains (Losses) on Invest- ments | Total from Invest- ment Activities | Net Invest- ment Income | Total Distri- butions | Net Asset Value, End of Period | ||||||||||||||||||||||
Class A Shares | ||||||||||||||||||||||||||||
Year Ended October 31, 2016 | $ | 9.41 | $ | 0.13 | (e) | $ | 0.67 | $ | 0.80 | $ | (0.03 | ) | $ | (0.03 | ) | $ | 10.18 | |||||||||||
Year Ended October 31, 2015 | 10.12 | 0.22 | (0.84 | ) | (0.62 | ) | (0.09 | ) | (0.09 | ) | 9.41 | |||||||||||||||||
Year Ended October 31, 2014 | 10.37 | 0.24 | (0.23 | ) | 0.01 | (0.26 | ) | (0.26 | ) | 10.12 | ||||||||||||||||||
Year Ended October 31, 2013 | 10.61 | 0.14 | (0.38 | ) | (0.24 | ) | – | – | 10.37 | |||||||||||||||||||
Year Ended October 31, 2012 | 10.50 | 0.17 | 0.19 | 0.36 | (0.25 | ) | (0.25 | ) | 10.61 | |||||||||||||||||||
Class C Shares | ||||||||||||||||||||||||||||
Year Ended October 31, 2016 | 9.30 | 0.05 | (e) | 0.68 | 0.73 | (0.02 | ) | (0.02 | ) | 10.01 | ||||||||||||||||||
Year Ended October 31, 2015 | 10.07 | 0.14 | (0.83 | ) | (0.69 | ) | (0.08 | ) | (0.08 | ) | 9.30 | |||||||||||||||||
Year Ended October 31, 2014 | 10.23 | 0.16 | (0.23 | ) | (0.07 | ) | (0.09 | ) | (0.09 | ) | 10.07 | |||||||||||||||||
Year Ended October 31, 2013 | 10.55 | 0.06 | (0.38 | ) | (0.32 | ) | – | – | 10.23 | |||||||||||||||||||
Year Ended October 31, 2012 | 10.44 | 0.09 | 0.21 | 0.30 | (0.19 | ) | (0.19 | ) | 10.55 | |||||||||||||||||||
Institutional Service Class Shares | ||||||||||||||||||||||||||||
Year Ended October 31, 2016 | 9.42 | 0.14 | (e) | 0.68 | 0.82 | (0.03 | ) | (0.03 | ) | 10.21 | ||||||||||||||||||
Year Ended October 31, 2015 | 10.12 | 0.22 | (0.83 | ) | (0.61 | ) | (0.09 | ) | (0.09 | ) | 9.42 | |||||||||||||||||
Year Ended October 31, 2014 | 10.39 | 0.25 | (0.24 | ) | 0.01 | (0.28 | ) | (0.28 | ) | 10.12 | ||||||||||||||||||
Year Ended October 31, 2013 | 10.62 | 0.15 | (0.38 | ) | (0.23 | ) | – | – | 10.39 | |||||||||||||||||||
Year Ended October 31, 2012 | 10.51 | 0.18 | 0.19 | 0.37 | (0.26 | ) | (0.26 | ) | 10.62 | |||||||||||||||||||
Institutional Class Shares | ||||||||||||||||||||||||||||
Year Ended October 31, 2016 | 9.46 | 0.16 | (e) | 0.68 | 0.84 | (0.04 | ) | (0.04 | ) | 10.26 | ||||||||||||||||||
Year Ended October 31, 2015 | 10.15 | 0.25 | (0.84 | ) | (0.59 | ) | (0.10 | ) | (0.10 | ) | 9.46 | |||||||||||||||||
Year Ended October 31, 2014 | 10.43 | 0.27 | (0.24 | ) | 0.03 | (0.31 | ) | (0.31 | ) | 10.15 | ||||||||||||||||||
Year Ended October 31, 2013 | 10.64 | 0.17 | (0.38 | ) | (0.21 | ) | – | – | 10.43 | |||||||||||||||||||
Year Ended October 31, 2012 | 10.52 | 0.17 | 0.23 | 0.40 | (0.28 | ) | (0.28 | ) | 10.64 | |||||||||||||||||||
| (a) | Net investment income/(loss) is based on average shares outstanding during the period. |
| (b) | Excludes sales charge. |
| (c) | During the period, certain fees were waived and/or reimbursed. If such waivers/reimbursements had not occurred, the ratios would have been as indicated. |
Amounts listed as “–” are $0 or round to $0.
See accompanying Notes to Financial Statements.
Annual Report 2016
52
Financial Highlights (continued)
Selected Data for Each Share of Capital Outstanding Throughout the Periods Indicated
Aberdeen Global Unconstrained Fixed Income Fund (concluded)
| Ratios/Supplemental Data | ||||||||||||||||||||||
| Total Return (b) | Net Assets at End of Period (000’s) | Ratio of Expenses (Net of Reimbursements/Waivers) to Average Net Assets | Ratio of Net Investment Income to Average Net Assets | Ratio of Expenses (Prior to Reimbursements) to Average Net Assets (c) | Portfolio Turnover (d) | |||||||||||||||||
| 8.55 | %(e) | $ | 1,824 | 1.13 | %(f) | 1.38 | %(e) | 2.34 | %(f) | 219.22 | % | |||||||||||
| (6.13 | %)(g) | 826 | 1.11 | % | 2.26 | % | 2.06 | % | 173.93 | % | ||||||||||||
| 0.05 | %(g) | 1,183 | 1.10 | % | 2.27 | % | 1.71 | % | 183.14 | % | ||||||||||||
| (2.26 | %) | 1,888 | 1.16 | % | 1.32 | % | 1.64 | % | 208.61 | % | ||||||||||||
| 3.56 | % | 2,781 | 1.21 | % | 1.61 | % | 1.51 | % | 135.98 | % | ||||||||||||
| 7.87 | %(e) | 403 | 1.85 | %(f) | 0.52 | %(e) | 3.15 | %(f) | 219.22 | % | ||||||||||||
| (6.86 | %) | 251 | 1.85 | % | 1.51 | % | 2.80 | % | 173.93 | % | ||||||||||||
| (0.70 | %) | 378 | 1.85 | % | 1.54 | % | 2.46 | % | 183.14 | % | ||||||||||||
| (3.03 | %) | 518 | 1.89 | % | 0.59 | % | 2.37 | % | 208.61 | % | ||||||||||||
| 2.90 | % | 967 | 1.95 | % | 0.86 | % | 2.25 | % | 135.98 | % | ||||||||||||
| 8.76 | %(e) | 10,940 | 1.01 | %(f) | 1.43 | %(e) | 2.22 | %(f) | 219.22 | % | ||||||||||||
| (6.02 | %) | 12,761 | 1.03 | % | 2.33 | % | 1.98 | % | 173.93 | % | ||||||||||||
| 0.07 | % | 16,724 | 1.01 | % | 2.39 | % | 1.62 | % | 183.14 | % | ||||||||||||
| (2.17 | %) | 19,547 | 1.05 | % | 1.44 | % | 1.53 | % | 208.61 | %�� | ||||||||||||
| 3.64 | % | 25,168 | 1.13 | % | 1.69 | % | 1.42 | % | 135.98 | % | ||||||||||||
| 8.87 | %(e) | 2,583 | 0.85 | %(f) | 1.61 | %(e) | 2.12 | %(f) | 219.22 | % | ||||||||||||
| (5.88 | %) | 1,419 | 0.85 | % | 2.56 | % | 1.80 | % | 173.93 | % | ||||||||||||
| 0.25 | % | 2,717 | 0.85 | % | 2.63 | % | 1.46 | % | 183.14 | % | ||||||||||||
| (1.97 | %) | 1,556 | 0.87 | % | 1.65 | % | 1.37 | % | 208.61 | % | ||||||||||||
| 3.93 | % | 850 | 0.95 | % | 1.68 | % | 1.25 | % | 135.98 | % | ||||||||||||
| (d) | Portfolio turnover is calculated on the basis of the Fund as a whole without distinguishing among the classes of shares. |
| (e) | Included within Net Investment Income per share, Total Return, and Ratio of Net Investment Income to Average Net Assets are the effects of a one-time reimbursement for overbilling of prior years’ custodian out-of-pocket fees. If such amounts were excluded, the impact to Net Investment Income per share would be $0.01, $0.01, $0.01 and $0.01, Total Return would be 0.11%, 0.11%, 0.11% and 0.11%, and the impact to Ratio of Net Investment Income to Average Net Assets would be 0.20%, 0.11%, 0.09% and 0.16% for Class A, Class C, Institutional Service Class and Institutional Class, respectively. |
| (f) | Interest expense is less than 0.001%. |
| (g) | The total return shown above includes the impact of financial statement rounding of the NAV per share and/or financial statement adjustments. |
2016 Annual Report
53
Financial Highlights (continued)
Selected Data for Each Share of Capital Outstanding Throughout the Periods Indicated
Aberdeen Tax-Free Income Fund
| Investment Activities | Distributions | |||||||||||||||||||||||||||||||||||
| Net Asset Value, Beginning of Period | Net Investment Income (a) | Net Realized and Unrealized Gains (Losses) on Invest- ments | Total from Invest- ment Activities | Net Invest- ment Income | Net Realized Gains | Tax Return of Capital | Total Distri- butions | Net Asset Value, End of Period | ||||||||||||||||||||||||||||
Class A Shares | ||||||||||||||||||||||||||||||||||||
Year Ended October 31, 2016 | $ | 10.19 | $ | 0.30 | $ | (0.08 | ) | $ | 0.22 | $ | (0.30 | ) | $ | – | $ | – | $ | (0.30 | ) | $ | 10.11 | |||||||||||||||
Year Ended October 31, 2015 | 10.38 | 0.32 | (0.16 | ) | 0.16 | (0.32 | ) | (0.03 | ) | – | (0.35 | ) | 10.19 | |||||||||||||||||||||||
Year Ended October 31, 2014 | 10.24 | 0.32 | 0.29 | 0.61 | (0.32 | ) | (0.15 | ) | – | (0.47 | ) | 10.38 | ||||||||||||||||||||||||
Year Ended October 31, 2013 | 10.86 | 0.32 | (0.53 | ) | (0.21 | ) | (0.32 | ) | (0.09 | ) | – | (0.41 | ) | 10.24 | ||||||||||||||||||||||
Year Ended October 31, 2012 | 10.32 | 0.34 | 0.55 | 0.89 | (0.34 | ) | (0.01 | ) | – | (0.35 | ) | 10.86 | ||||||||||||||||||||||||
Class C Shares | ||||||||||||||||||||||||||||||||||||
Year Ended October 31, 2016 | 10.18 | 0.23 | (0.09 | ) | 0.14 | (0.23 | ) | – | – | (0.23 | ) | 10.09 | ||||||||||||||||||||||||
Year Ended October 31, 2015 | 10.37 | 0.24 | (0.16 | ) | 0.08 | (0.24 | ) | (0.03 | ) | – | (0.27 | ) | 10.18 | |||||||||||||||||||||||
Year Ended October 31, 2014 | 10.23 | 0.24 | 0.29 | 0.53 | (0.24 | ) | (0.15 | ) | – | (0.39 | ) | 10.37 | ||||||||||||||||||||||||
Year Ended October 31, 2013 | 10.85 | 0.25 | (0.54 | ) | (0.29 | ) | (0.24 | ) | (0.09 | ) | – | (0.33 | ) | 10.23 | ||||||||||||||||||||||
Year Ended October 31, 2012 | 10.31 | 0.26 | 0.55 | 0.81 | (0.26 | ) | (0.01 | ) | – | (0.27 | ) | 10.85 | ||||||||||||||||||||||||
Class R Shares | ||||||||||||||||||||||||||||||||||||
Year Ended October 31, 2016 | 10.20 | 0.28 | (0.08 | ) | 0.20 | (0.28 | ) | – | – | (0.28 | ) | 10.12 | ||||||||||||||||||||||||
Year Ended October 31, 2015 | 10.40 | 0.29 | (0.17 | ) | 0.12 | (0.29 | ) | (0.03 | ) | – | (0.32 | ) | 10.20 | |||||||||||||||||||||||
Year Ended October 31, 2014 | 10.25 | 0.30 | 0.30 | 0.60 | (0.30 | ) | (0.15 | ) | – | (0.45 | ) | 10.40 | ||||||||||||||||||||||||
Period Ended October 31, 2013(g) | 10.72 | 0.20 | (0.47 | ) | (0.27 | ) | (0.20 | ) | – | – | (0.20 | ) | 10.25 | |||||||||||||||||||||||
Institutional Service Class Shares | ||||||||||||||||||||||||||||||||||||
Year Ended October 31, 2016 | 10.20 | 0.33 | (0.08 | ) | 0.25 | (0.33 | ) | – | – | (0.33 | ) | 10.12 | ||||||||||||||||||||||||
Year Ended October 31, 2015 | 10.40 | 0.34 | (0.17 | ) | 0.17 | (0.34 | ) | (0.03 | ) | – | (0.37 | ) | 10.20 | |||||||||||||||||||||||
Year Ended October 31, 2014 | 10.25 | 0.35 | 0.30 | 0.65 | (0.35 | ) | (0.15 | ) | – | (0.50 | ) | 10.40 | ||||||||||||||||||||||||
Period Ended October 31, 2013(g) | 10.72 | 0.23 | (0.47 | ) | (0.24 | ) | (0.23 | ) | – | – | (0.23 | ) | 10.25 | |||||||||||||||||||||||
Institutional Class Shares(h) | ||||||||||||||||||||||||||||||||||||
Year Ended October 31, 2016 | 10.20 | 0.33 | (0.08 | ) | 0.25 | (0.33 | ) | – | – | (0.33 | ) | 10.12 | ||||||||||||||||||||||||
Year Ended October 31, 2015 | 10.40 | 0.34 | (0.17 | ) | 0.17 | (0.34 | ) | (0.03 | ) | – | (0.37 | ) | 10.20 | |||||||||||||||||||||||
Year Ended October 31, 2014 | 10.25 | 0.35 | 0.30 | 0.65 | (0.35 | ) | (0.15 | ) | – | (0.50 | ) | 10.40 | ||||||||||||||||||||||||
Year Ended October 31, 2013 | 10.87 | 0.35 | (0.53 | ) | (0.18 | ) | (0.35 | ) | (0.09 | ) | – | (0.44 | ) | 10.25 | ||||||||||||||||||||||
Year Ended October 31, 2012 | 10.33 | 0.37 | 0.55 | 0.92 | (0.37 | ) | (0.01 | ) | – | (0.38 | ) | 10.87 | ||||||||||||||||||||||||
| (a) | Net investment income/(loss) is based on average shares outstanding during the period. |
| (b) | Excludes sales charge. |
| (c) | Annualized for periods less than one year. |
| (d) | During the period, certain fees were waived and/or reimbursed. If such waivers/reimbursements had not occurred, the ratios would have been as indicated. |
Amounts listed as “–” are $0 or round to $0.
See accompanying Notes to Financial Statements.
Annual Report 2016
54
Financial Highlights (concluded)
Selected Data for Each Share of Capital Outstanding Throughout the Periods Indicated
Aberdeen Tax-Free Income Fund (concluded)
| Ratios/Supplemental Data | ||||||||||||||||||||||
| Total Return (b) | Net Assets at End of Period (000’s) | Ratio of Expenses (Net of Reimbursements/Waivers) to Average Net Assets (c) | Ratio of Net Investment Income to Average Net Assets (c) | Ratio of Expenses (Prior to Reimbursements) to Average Net Assets (c)(d) | Portfolio Turnover (e)(f) | |||||||||||||||||
| 2.19 | % | $ | 10,798 | 0.88 | % | 2.96 | % | 1.03 | % | 10.71 | % | |||||||||||
| 1.56 | % | 9,073 | 0.88 | % | 3.09 | % | 1.01 | % | 4.85 | % | ||||||||||||
| 6.12 | % | 9,379 | 0.87 | % | 3.14 | % | 1.00 | % | 5.58 | % | ||||||||||||
| (1.93 | %) | 9,477 | 0.88 | % | 3.07 | % | 0.98 | % | 6.11 | % | ||||||||||||
| 8.74 | % | 11,416 | 0.94 | % | 3.18 | % | 0.94 | % | 13.27 | % | ||||||||||||
| 1.36 | % | 851 | 1.62 | % | 2.24 | % | 1.82 | % | 10.71 | % | ||||||||||||
| 0.82 | % | 878 | 1.62 | % | 2.37 | % | 1.75 | % | 4.85 | % | ||||||||||||
| 5.34 | % | 643 | 1.62 | % | 2.39 | % | 1.75 | % | 5.58 | % | ||||||||||||
| (2.66 | %) | 788 | 1.62 | % | 2.31 | % | 1.73 | % | 6.11 | % | ||||||||||||
| 7.95 | % | 2,410 | 1.68 | % | 2.43 | % | 1.68 | % | 13.27 | % | ||||||||||||
| 1.96 | % | 11 | 1.12 | % | 2.72 | % | 1.27 | % | 10.71 | % | ||||||||||||
| 1.24 | % | 10 | 1.12 | % | 2.85 | % | 1.25 | % | 4.85 | % | ||||||||||||
| 5.96 | % | 10 | 1.12 | % | 2.89 | % | 1.25 | % | 5.58 | % | ||||||||||||
| (2.53 | %) | 10 | 1.12 | % | 2.82 | % | 1.27 | % | 6.11 | % | ||||||||||||
| 2.48 | % | 28 | 0.62 | % | 3.22 | % | 0.77 | % | 10.71 | % | ||||||||||||
| 1.74 | % | 18 | 0.62 | % | 3.35 | % | 0.75 | % | 4.85 | % | ||||||||||||
| 6.49 | % | 17 | 0.62 | % | 3.39 | % | 0.75 | % | 5.58 | % | ||||||||||||
| (2.19 | %) | 10 | 0.62 | % | 3.32 | % | 0.77 | % | 6.11 | % | ||||||||||||
| 2.47 | % | 79,279 | 0.62 | % | 3.23 | % | 0.77 | % | 10.71 | % | ||||||||||||
| 1.72 | % | 83,140 | 0.62 | % | 3.35 | % | 0.75 | % | 4.85 | % | ||||||||||||
| 6.49 | % | 89,924 | 0.62 | % | 3.38 | % | 0.75 | % | 5.58 | % | ||||||||||||
| (1.67 | %) | 93,692 | 0.62 | % | 3.32 | % | 0.72 | % | 6.11 | % | ||||||||||||
| 9.02 | % | 104,318 | 0.68 | % | 3.43 | % | 0.68 | % | 13.27 | % | ||||||||||||
| (e) | Not annualized for periods less than one year. |
| (f) | Portfolio turnover is calculated on the basis of the Fund as a whole without distinguishing among the classes of shares. |
| (g) | For the period from February 25, 2013 (commencement of operations) through October 31, 2013. |
| (h) | Formerly Class D shares. |
2016 Annual Report
55
October 31, 2016
1. Organization
Aberdeen Funds (the “Trust”) was organized as a statutory trust under the laws of the state of Delaware by a Certificate of Trust filed on September 27, 2007 and is registered under the Investment Company Act of 1940, as amended (the “1940 Act”), as an open-end management investment company. As of October 31, 2016, the Trust had authorized an unlimited number of shares of beneficial interest (“shares”) without par value. As of October 31, 2016, the Trust operated nineteen (19) separate series, or mutual funds, each with its own investment objective(s) and strategies. This report contains the financial statements and financial highlights of the four (4) funds listed below (each a “Fund”; collectively, the “Funds”):
| – | Aberdeen Asia Bond Fund (“Asia Bond Fund”) |
| – | Aberdeen Emerging Markets Debt Fund (“Emerging Markets Debt Fund”)* |
| – | Aberdeen Global Unconstrained Fixed Income Fund (formerly the Aberdeen Global Fixed Income Fund) (the “Global Unconstrained Fixed Income Fund”) |
| – | Aberdeen Tax-Free Income Fund (“Tax-Free Income Fund”) |
| * | On August 15, 2016, the Emerging Markets Debt Fund acquired the assets and assumed the liabilities of the Aberdeen Emerging Markets Debt Local Currency Fund (the “Emerging Markets Debt Local Currency Fund”). The Emerging Markets Debt Fund is considered the accounting survivor of the reorganization. |
| In connection with the reorganization, the Emerging Markets Debt Local Currency Fund’s Class A, Class C, Class R, Institutional Service Class and Institutional Class shares were exchanged for Class A, Class C, Class R, Institutional Service Class and Institutional Class shares of the Emerging Markets Debt Fund, respectively. |
| The following is a summary of the net assets reorganized and net asset value per share issued as of August 15, 2016. |
| Shares Issued of the Emerging Markets Debt Fund | Fund Net Assets Reorganized from the Emerging Markets Debt Local Currency Fund | Net Asset Value Per Shares Issued of the Emerging Markets Debt Fund | ||||||||||
Class A | 4,393 | $ | 42,840 | $ | 9.75 | |||||||
Class C | 12,044 | 116,997 | 9.71 | |||||||||
Class R | 136,435 | 1,329,234 | 9.74 | |||||||||
Institutional Service Class | 886 | 8,657 | 9.77 | |||||||||
Institutional Class | 1,023,421 | 9,982,250 | 9.75 | |||||||||
The Board of Trustees of the Trust (the “Board”) approved a Plan of Liquidation for the Aberdeen Ultra-Short Duration Bond Fund pursuant to which the Fund was liquidated on August 15, 2016 (the “Liquidation”). Shareholder approval of the Liquidation was not required.
2. Summary of Significant Accounting Policies
The following is a summary of significant accounting policies followed by the Funds in the preparation of their financial statements. The policies conform to accounting principles generally accepted in the United States of America (“GAAP”). The preparation of financial statements requires management to make estimates and assumptions that affect the reported amounts of assets and liabilities, disclosure of contingent assets and liabilities at the date of the financial statements, and the reported amounts of income and expenses for the period. Actual results could differ from those estimates. The accounting records of the Funds are maintained in U.S. Dollars.
| a. | Security Valuation |
The Funds value their securities at current market value or fair value, consistent with regulatory requirements. “Fair value” is defined in the Funds’ Valuation and Liquidity Procedures as the price that could be received to sell an asset or paid to transfer a liability in an orderly transaction between willing market participants without a compulsion to contract at the measurement date.
In accordance with the authoritative guidance on fair value measurements and disclosures under GAAP, the Funds disclose the fair value of their investments using a three-level hierarchy that classifies the inputs to valuation techniques used to measure the fair value. The hierarchy assigns Level 1 measurements to valuations based upon unadjusted quoted prices in active markets for identical assets, Level 2 measurements to valuations based upon other significant observable inputs, including adjusted quoted prices in active markets for identical assets, and Level 3 measurements to valuations based upon unobservable inputs that are significant to the valuation. Observable inputs are inputs that reflect the assumptions market participants would use in pricing the asset or liability, which are based on market data obtained from sources independent
Annual Report 2016
56
Notes to Financial Statements (continued)
October 31, 2016
of the reporting entity. Unobservable inputs are inputs that reflect the reporting entity’s own assumptions about the assumptions market participants would use in pricing the asset or liability developed based on the best information available in the circumstances. A financial instrument’s level within the fair value hierarchy is based upon the lowest level of any input that is significant to the fair value measurement.
Long-term debt and other fixed-income securities are valued at the last quoted or evaluated bid price on the valuation date provided by an independent pricing service provider approved by the Board. Pricing services generally price debt securities assuming orderly transactions of an institutional “round lot” size, but some trades occur in smaller, “odd lot” sizes which may be executed at lower prices than institutional round lot trades. If there are no current day bids, the security is valued at the previously applied bid. Short-term debt securities (such as commercial paper and U.S. treasury bills) having a remaining maturity of 60 days or less are valued at the last quoted or evaluated bid price on the valuation date provided by an independent pricing service, or on the basis of amortized cost if it represents the best approximation for fair value. Debt and other fixed-income securities are generally determined to be Level 2 investments.
Short-term investments are comprised of cash and cash equivalents invested in short-term investment funds which are redeemable daily. The Fund sweeps available cash into the State Street Institutional U.S. Government Money Market Fund, which has elected to qualify as a “government money market fund” pursuant to Rule 2a-7 under The 1940 Act and has an objective to maintain a $1.00 NAV, which is not guaranteed. Generally, these investment types are categorized as Level 1 investments.
Derivative instruments are generally valued according to the following procedures. Exchange traded derivatives are generally Level 1 investments and over-the-counter derivatives are generally Level 2 investments. Forward currency exchange contracts are generally valued based on the current spot exchange rates and the forward exchange rate points (ex. 1-month, 3-month) that are obtained from an approved pricing agent. Based on the actual settlement dates of the forward contracts held, an interpolated value of the forward points is combined with the spot exchange rate to derive the valuation. Futures contracts are generally valued at the most recent settlement price as of NAV determination. Swap agreements are generally valued by an approved pricing agent based on the terms of the swap agreement (including future cash flows). When market quotations or exchange rates are not readily available, or if the Funds’ investment adviser, Aberdeen Asset Management Inc. (the “Adviser”), concludes that such market quotations do not accurately reflect fair value, the fair value of a Fund’s assets are determined in good faith in accordance with the Valuation Procedures.
In the event that a security’s market quotations are not readily available or are deemed unreliable (for reasons other than because the foreign exchange on which it trades closed before the Valuation Time (as defined below)), the security is valued at fair value as determined by the Funds’ pricing committee (the “Pricing Committee”), taking into account the relevant factors and surrounding circumstances using Valuation and Liquidity Procedures approved by the Board. Under normal circumstances, the Valuation Time is as of the close of regular trading on the New York Stock Exchange (usually 4:00 p.m. Eastern Time). A security that has been fair valued by the Pricing Committee may be classified as Level 2 or Level 3 depending on the nature of the inputs.
The three-level hierarchy of inputs is summarized below:
| • | Level 1- quoted prices in active markets for identical investments; |
| • | Level 2- other significant observable inputs (including quoted prices for similar securities, interest rates, prepayment speeds, and credit risk); or |
| • | Level 3- significant unobservable inputs (including the Fund’s own assumptions in determining the fair value of investments). |
A summary of standard inputs is listed below:
| Security Type | Standard Inputs | |
Debt and other fixed-income securities | Reported trade data, broker-dealer price quotations, benchmark yields, issuer spreads on comparable securities, credit quality, yield, and maturity. | |
Forward foreign currency contracts | Forward exchange rate quotations. | |
Swap agreements | Market information pertaining to the underlying reference assets, i.e., credit spreads, credit event probabilities, fair values, forward rates, and volatility measures. |
2016 Annual Report
57
Notes to Financial Statements (continued)
October 31, 2016
The following is a summary of the inputs used as of October 31, 2016 in valuing the Funds’ investments at fair value. The inputs or methodologies used for valuing securities are not necessarily an indication of the risk associated with investing in those securities.
Please refer to the Statements of Investments for a detailed breakout of the security types:
| Investments, at Value | Level 1–Quoted Prices ($) | Level 2–Other Significant Observable Inputs ($) | Level 3–Significant Unobservable Inputs ($) | Total | ||||||||||||
| Asia Bond Fund | ||||||||||||||||
| Investments in Securities | ||||||||||||||||
Corporate Bonds | – | 13,462,362 | – | 13,462,362 | ||||||||||||
Government Bonds | – | 14,364,814 | – | 14,364,814 | ||||||||||||
Government Agencies | – | 198,309 | – | 198,309 | ||||||||||||
Short-Term Investment | 1,039,337 | – | – | 1,039,337 | ||||||||||||
| Other Financial Instruments | ||||||||||||||||
| Assets | ||||||||||||||||
Futures Contracts | 38,657 | – | – | 38,657 | ||||||||||||
Forward Foreign Currency Exchange Contracts | – | 123,073 | – | 123,073 | ||||||||||||
| Liabilities | ||||||||||||||||
Futures Contracts | (81,902 | ) | – | – | (81,902 | ) | ||||||||||
Forward Foreign Currency Exchange Contracts | – | (274,580 | ) | – | (274,580 | ) | ||||||||||
|
|
|
|
|
|
|
| |||||||||
| 996,092 | 27,873,978 | – | 28,870,070 | |||||||||||||
|
|
|
|
|
|
|
| |||||||||
| Emerging Markets Debt Fund | ||||||||||||||||
| Investments in Securities | ||||||||||||||||
Corporate Bonds | – | 1,963,086 | – | 1,963,086 | ||||||||||||
Government Bonds | – | 14,442,841 | – | 14,442,841 | ||||||||||||
Government Agencies | – | 2,013,272 | – | 2,013,272 | ||||||||||||
Short-Term Investment | 429,660 | – | – | 429,660 | ||||||||||||
| Other Financial Instruments | ||||||||||||||||
| Assets | ||||||||||||||||
Forward Foreign Currency Exchange Contracts | – | 46,324 | – | 46,324 | ||||||||||||
| Liabilities | ||||||||||||||||
Forward Foreign Currency Exchange Contracts | – | (41,350 | ) | – | (41,350 | ) | ||||||||||
|
|
|
|
|
|
|
| |||||||||
| 429,660 | 18,424,173 | – | 18,853,833 | |||||||||||||
|
|
|
|
|
|
|
| |||||||||
| Global Unconstrained Fixed Income Fund | ||||||||||||||||
| Investments in Securities | ||||||||||||||||
Commercial Mortgage-Backed Securities | – | 174,649 | – | 174,649 | ||||||||||||
Residential Mortgage-Backed Securities | – | 64,506 | – | 64,506 | ||||||||||||
Corporate Bonds | – | 11,772,118 | – | 11,772,118 | ||||||||||||
Government Bonds | – | 1,626,836 | – | 1,626,836 | ||||||||||||
Government Agencies | – | 201,788 | – | 201,788 | ||||||||||||
U.S. Treasuries | – | 1,541,308 | – | 1,541,308 | ||||||||||||
Short-Term Investment | 494,794 | – | – | 494,794 | ||||||||||||
Annual Report 2016
58
Notes to Financial Statements (continued)
October 31, 2016
| Investments, at Value | Level 1–Quoted Prices ($) | Level 2–Other Significant Observable Inputs ($) | Level 3–Significant Unobservable Inputs ($) | Total | ||||||||||||
| Global Unconstrained Fixed Income Fund (continued) | ||||||||||||||||
| Other Financial Instruments | ||||||||||||||||
| Assets | ||||||||||||||||
Futures Contracts | 113,031 | – | – | 113,031 | ||||||||||||
Forward Foreign Currency Exchange Contracts | – | 78,719 | – | 78,719 | ||||||||||||
Interest Rate Swap Agreements | – | 51,364 | – | 51,364 | ||||||||||||
| Liabilities | ||||||||||||||||
Futures Contracts | (58,078 | ) | – | – | (58,078 | ) | ||||||||||
Forward Foreign Currency Exchange Contracts | – | (23,718 | ) | – | (23,718 | ) | ||||||||||
Credit Default Swap Contracts | – | (1,419 | ) | – | (1,419 | ) | ||||||||||
Interest Rate Swap Agreements | – | (49,875 | ) | – | (49,875 | ) | ||||||||||
|
|
|
|
|
|
|
| |||||||||
| 549,747 | 15,436,276 | – | 15,986,023 | |||||||||||||
|
|
|
|
|
|
|
| |||||||||
| Tax-Free Income Fund | ||||||||||||||||
| Investments in Securities | ||||||||||||||||
Municipal Bonds | – | 88,801,226 | – | 88,801,226 | ||||||||||||
Short-Term Investment | 2,741,532 | – | – | 2,741,532 | ||||||||||||
|
|
|
|
|
|
|
| |||||||||
| 2,741,532 | 88,801,226 | – | 91,542,758 | |||||||||||||
|
|
|
|
|
|
|
| |||||||||
For movements between the Levels within the fair value hierarchy, the Funds have adopted a policy of recognizing transfers at the end of each fiscal period. During the fiscal year ended October 31, 2016, there were no transfers between Levels.
For the fiscal year ended October 31, 2016, there were no significant changes to the fair valuation methodologies.
| b. | Restricted Securities |
Restricted securities are privately-placed securities whose resale is restricted under U.S. securities laws. The Funds may invest in restricted securities, including unregistered securities eligible for resale without registration pursuant to Rule 144A and privately-placed securities of U.S. and non-U.S. issuers offered outside the U.S. without registration pursuant to Regulation S under the Securities Act of 1933, as amended (the “1933 Act”). Rule 144A securities may be freely traded among certain qualified institutional investors, such as the Funds, but resale of such securities in the U.S. is permitted only in limited circumstances.
| c. | Foreign Currency Translation |
Foreign currency amounts are translated into U.S. Dollars at the current rate of exchange as of the Valuation Time to determine the value of investments, assets and liabilities. Purchases and sales of securities, and income and expenses are translated at the prevailing rate of exchange on the respective date of these transactions. The Funds do not isolate that portion of the results of operations resulting from changes in foreign exchange rates on investments from fluctuations arising from changes in market prices of securities held. These fluctuations are included with the net realized and unrealized gain or loss from investments and foreign currencies within the Statements of Operations.
Foreign securities, currencies, and other assets and liabilities denominated in foreign currencies are translated into U.S. Dollars at the exchange rate of said currencies against the U.S. Dollar, as of the Valuation Time, as provided by an independent pricing service.
| d. | Derivative Financial Instruments |
The Funds are authorized to use derivatives to manage currency risk, credit risk, and interest rate risk and to replicate, or use as a substitute for, physical securities. Losses may arise due to changes in the value of the contract or if the counterparty does not perform under the contract. The use of derivative instruments involves, to varying degrees, elements of market risk in excess of the amount recognized in the Statements of Assets and Liabilities.
2016 Annual Report
59
Notes to Financial Statements (continued)
October 31, 2016
Forward Foreign Currency Exchange Contracts
A forward foreign currency exchange contract (“forward contract”) involves an obligation to purchase and sell a specific currency at a future date, which may be any fixed number of days from the date of the contract agreed upon by the parties, at a price set at the time of the contract. Forward contracts are used to manage a Fund’s currency exposure in an efficient manner. They are used to sell unwanted currency exposure that comes with holding securities in a market, or to buy currency exposure where the exposure from holding securities is insufficient to give the desired currency exposure either in absolute terms or relative to the benchmark. The use of forward contracts allows the separation of decision-making between markets and their currencies. The forward contract is marked-to market daily and the change in market value is recorded by a Fund as unrealized appreciation/(depreciation). Forward contracts’ prices are received daily from an independent pricing provider. When the forward contract is closed, a Fund records a realized gain or loss equal to the difference between the value at the time it was opened and the value at the time it was closed. These realized and unrealized gains and losses are reported on the Statements of Operations. During the year, the Funds used forward contracts for the purposes of efficient portfolio management and managing active currency risk relative to the benchmark, the latter of which involves both hedging currency risk and adding currency risk in excess of underlying bond positions.
While a Fund may enter into forward contracts to seek to reduce currency exchange rate risks, transactions in such contracts involve certain risks. A Fund could be exposed to risks if the counterparties to the contracts are unable to meet the terms of their contracts and from unanticipated movements in exchange rates. Thus, while a Fund may benefit from such transactions, unanticipated changes in currency prices may result in a poorer overall performance for a Fund than if it had not engaged in any such transactions. Moreover, there may be imperfect correlation between a Fund’s portfolio holdings or securities quoted or denominated in a particular currency and forward contracts entered into by the Fund. Such imperfect correlation may prevent a Fund from achieving a complete hedge, which will expose the Fund to the risk of foreign exchange loss.
Forward contracts are subject to the risk that the counterparties to such contracts may default on their obligations. Since a forward foreign currency exchange contract is not guaranteed by an exchange or clearing house, a default on the contract would deprive a Fund of unrealized profits, transaction costs or the benefits of a currency hedge or force a Fund to cover its purchase or sale commitments, if any, at the market price at the time of the default.
Futures Contracts
Certain Funds may invest in financial futures contracts (“futures contracts”) for the purpose of hedging their existing portfolio securities, or securities that a Fund intends to purchase, against fluctuations in value caused by changes in prevailing market interest rates or prices. Futures contracts may also be entered into for non-hedging purposes; however, in those instances, the aggregate initial margin and premiums required to establish a Fund’s positions may not exceed 5% of a Fund’s net asset value after taking into account unrealized profits and unrealized losses on any such contract into which it has entered.
Upon entering into a futures contract, a Fund is required to pledge to the broker an amount of cash and/or other assets equal to a certain percentage of the contract amount. This payment is known as “initial margin”. Subsequent payments, known as “variation margin,” are calculated each day, depending on the daily fluctuations in the fair value/market value of the underlying assets. An unrealized gain/(loss) equal to the variation margin is recognized on a daily basis. When the contract expires or is closed, the gain/(loss) is realized and is presented in the Statements of Operations as a net realized gain/(loss) on futures contracts. Futures contracts are valued daily at their last quoted sale price on the exchange on which they are traded.
A “sale” of a futures contract means a contractual obligation to deliver the securities or foreign currency called for by the contract at a fixed price at a specified time in the future. A “purchase” of a futures contract means a contractual obligation to acquire the securities or foreign currency at a fixed price at a specified time in the future.
There are significant risks associated with a Fund’s use of futures contracts, including the following: (1) the success of a hedging strategy may depend on the ability of a Fund’s investment adviser and/or sub-adviser to predict movements in the prices of individual securities, fluctuations in markets and movements in interest rates; (2) there may be an imperfect or no correlation between the movement in the price of futures contracts, interest rates and the value/market value of the securities held by a Fund; (3) there may not be a liquid secondary market for a futures contract; (4) trading restrictions or limitations may be imposed by an exchange; and (5) government regulations may restrict trading in futures contracts. In addition, should market conditions change unexpectedly, a Fund may not achieve the anticipated benefits of the futures contracts and may realize a loss.
As of fiscal year ended October 31, 2016, the Asia Bond Fund invests in futures to hedge the U.S. interest-rate risk and the Global Unconstrained Fixed Income Fund invests in futures to achieve more efficient portfolio management and to hedge interest-rate risk.
Annual Report 2016
60
Notes to Financial Statements (continued)
October 31, 2016
Swaps
A swap is an agreement that obligates two parties to exchange a series of cash flows and/or meet certain obligations at specified intervals based upon or calculated by reference to changes in specified prices or rates (interest rates in the case of interest rate swaps, currency exchange rates in the case of currency swaps) or the occurrence of a credit event with respect to an underlying reference obligation (in the case of a credit default swap) for a specified amount of an underlying asset or notional principal amount. The Fund will enter into swaps only on a net basis, which means that the two payment streams are netted out, with the Fund receiving or paying, as the case may be, only the amount of the difference between the two payments. Except for currency swaps and credit default swaps, the notional principal amount is used solely to calculate the payment streams but is not exchanged. With respect to currency swaps, actual principal amounts of currencies may be exchanged by the counterparties at the initiation, and again upon the termination of the transaction.
Traditionally, swaps were customized, privately negotiated agreements executed between two parties (“OTC Swaps”) but since 2013, certain swaps are required to be cleared pursuant to rules and regulations related to the Dodd–Frank Wall Street Reform and Consumer Protection Act (“Dodd Frank”) and/or Regulation (EU) No 648/2012 on OTC Derivatives, Central Counterparties and Trade Repositories (“EMIR”) (“Cleared Swaps”). Like OTC Swaps, Cleared Swaps are negotiated bilaterally. Unlike OTC Swaps, the act of clearing results in two swaps executed between each of the parties and a central counterparty (“CCP”), and thus the counterparty credit exposure of the parties is to the CCP rather than to one another. Upon entering into a Cleared Swap, a Fund is required to pledge an amount of cash and/or other assets equal to a certain percentage of the contract amount. This payment is known as “initial margin”. Subsequent payments, known as “variation margin,” are calculated each day, depending on the daily fluctuations in the fair value/market value of the underlying assets. An unrealized gain/(loss) equal to the variation margin is recognized on a daily basis. When the contract matures or is terminated, the gain or loss is realized and is presented in the Statements of Operations as a net realized gain or loss on swap contracts. As of March 2017, a Fund may be required to provide variation and/or initial margin for OTC Swaps pursuant to further rules and regulations related to Dodd Frank and EMIR. The margin requirements associated with OTC Swaps and Cleared Swaps may not be the same.
Entering into swap agreements involves, to varying degrees, elements of credit, market and interest risk in excess of the amounts reported on the Statement of Assets and Liabilities. Such risks involve the possibility that there will be no liquid market for these agreements, that the counterparty to the agreements may default on its obligation to perform and that there may be unfavorable changes in the value of the index or securities underlying the agreement. The Funds’ maximum risk of loss from counterparty risk related to swaps is the fair value of the contract. This risk is mitigated by the posting of collateral by the counterparties to the Funds to cover the Funds’ exposure to the counterparty.
Credit Default Swaps
A credit default swap is an agreement whereby one party, the buyer, is obligated to pay the other party, the seller, a periodic stream of payments over the term of the contract in return for a contingent payment upon the occurrence of a credit event with respect to an underlying reference obligation. A Fund might use credit default swap contracts to limit or to reduce risk exposure of the Fund to defaults of corporate and sovereign issues (i.e., to reduce risk when the Fund owns or has exposure to such issuers). A Fund also might use credit default swap contracts to create direct or synthetic short or long exposure to domestic or foreign corporate debt securities or certain sovereign debt securities to which the Fund is not otherwise exposed.
During the fiscal year ended October 31, 2016, the Global Unconstrained Fixed Income Fund held credit default swaps to hedge the Fund’s exposure to the credit market.
Interest Rate Swaps
A Fund uses interest rate swap contracts to manage its exposure to interest rates. Interest rate swap contracts typically represent the exchange between a Fund and a counterparty of respective commitments to make variable rate and fixed rate payments with respect to a notional amount of principal. Interest rate swap contracts may have a term that is greater than one year, but typically require periodic interim settlement in cash, at which time the specified value of the variable interest rate is reset for the next settlement period. Net payments of interest are recorded as realized gains or losses. During the period that the swap contract is open, the contract is marked-to-market as the net amount due to or from a Fund and changes in the value of swap contracts are recorded as unrealized gains or losses.
During the fiscal year ended October 31, 2016, the Global Unconstrained Fixed Income Fund held interest rate swaps to hedge interest-rate risk.
2016 Annual Report
61
Notes to Financial Statements (continued)
October 31, 2016
Summary of Derivative Instruments
Certain Funds may use derivatives for various purposes as noted above. The following is a summary of the location of fair value amounts of derivatives, not accounted for as hedging instruments, as of October 31, 2016:
| Location on the Statement of Assets and Liabilities | ||||
| Derivative Instrument Risk Type | Asset Derivatives | Liability Derivatives | ||
| Interest Rate Risk | Variation margin receivable for centrally cleared swap contracts | |||
| Variation margin receivable for futures contracts | ||||
| Credit Risk | Variation margin receivable for centrally cleared swap contracts | |||
| Foreign Exchange Risk | Unrealized appreciation on forward foreign currency exchange contracts | Unrealized depreciation on forward foreign currency exchange contracts | ||
The following is a summary of the fair value of Derivative Instruments, not accounted for as hedging instruments, as of October 31, 2016:
Asset Derivatives | ||||||||||||||||||||
| Funds | Total Value at October 31, 2016 | Credit Default Swaps (Credit Risk)* | Interest Rate | Forward Foreign Exchange Contracts (Foreign Exchange Risk) | Futures Contracts (Interest Rate Risk)* | |||||||||||||||
Asia Bond Fund | $ | 161,730 | – | $ | – | $ | 123,073 | $ | 38,657 | |||||||||||
Emerging Markets Debt Fund | 46,324 | – | – | 46,324 | – | |||||||||||||||
Global Unconstrained Fixed Income Fund | 243,114 | – | 51,364 | 78,719 | 113,031 | |||||||||||||||
| Liabilities Derivatives | ||||||||||||||||||||
| Funds | Total Value at October 31, 2016 | Credit Default Swaps (Credit Risk)* | Interest Rate Swaps (Interest Rate Risk)* | Forward Foreign Exchange Contracts (Foreign Exchange Risk) | Futures Contracts (Interest Rate Risk)* | |||||||||||||||
Asia Bond Fund | $ | 356,482 | $ | – | $ | – | $ | 274,580 | $ | 81,902 | ||||||||||
Emerging Markets Debt Fund | 41,350 | – | – | 41,350 | – | |||||||||||||||
Global Unconstrained Fixed Income Fund | 133,090 |
| 1,419 |
| 49,875 | 23,718 | 58,078 | |||||||||||||
| * | The values shown reflect unrealized appreciation/(depreciation) and the values shown in the Statement of Assets and Liabilities reflects variation margin. |
Annual Report 2016
62
Notes to Financial Statements (continued)
October 31, 2016
Certain funds have transactions that may be subject to enforceable master netting arrangements. A reconciliation of the gross amounts on the Statement of Assets and Liabilities to the net amounts by broker and derivative type, including any collateral received or pledged, is included in the following tables:
| Gross Amounts Not Offset in Statement of Assets & Liabilities | Gross Amounts Not Offset in Statement of Assets and Liabilities | |||||||||||||||||||||||||||||||
| Description | Gross Amounts of Assets Presented in Statement of Financial Position | Financial Instruments | Collateral Received (1) | Net Amount (3) | Gross Amounts of Liabilities Presented in Statement of Financial Position | Financial Instruments | Collateral Pledged (1) | Net Amount (3) | ||||||||||||||||||||||||
| Assets | Liabilities | |||||||||||||||||||||||||||||||
| Asia Bond Fund | ||||||||||||||||||||||||||||||||
Forward foreign currency (2) | ||||||||||||||||||||||||||||||||
BNP Paribas | $ | 538 | $ | (538 | ) | $ | — | $ | — | $ | 93,040 | $ | (538 | ) | $ | — | $ | 92,502 | ||||||||||||||
Citibank | 2,372 | — | — | 2,372 | — | — | — | — | ||||||||||||||||||||||||
Credit Suisse | 36,078 | (36,078 | ) | — | — | 42,893 | (36,078 | ) | — | 6,815 | ||||||||||||||||||||||
Goldman Sachs | 4,288 | (4,288 | ) | — | — | 81,347 | (4,288 | ) | — | 77,059 | ||||||||||||||||||||||
Royal Bank of Canada | — | — | — | — | 12,272 | — | — | 12,272 | ||||||||||||||||||||||||
Standard Chartered Bank | 79,797 | (45,028 | ) | — | 34,769 | 45,028 | (45,028 | ) | — | — | ||||||||||||||||||||||
| 1. | In some instances, the actual collateral received and/or pledged may be more than the amount shown here due to overcollateralization. |
| 2. | Includes financial instrument (forwards) which are not subject to master netting arrangement across funds, or other another similar arrangement. |
| 3. | Net amounts represent the net receivables/(payable) that would be due from/to the counterparty in the event of default. Exposure from financial derivative instruments can only be netted across transactions governed under the same master agreement with the same legal entity. |
| Gross Amounts Not Offset in Statement of Assets & Liabilities | Gross Amounts Not Offset in Statement of Assets and Liabilities | |||||||||||||||||||||||||||||||
| Description | Gross Amounts of Assets Presented in Statement of Financial Position | Financial Instruments | Collateral Received (1) | Net Amount (3) | Gross Amounts of Liabilities Presented in Statement of Financial Position | Financial Instruments | Collateral Pledged (1) | Net Amount (3) | ||||||||||||||||||||||||
| Assets | Liabilities | |||||||||||||||||||||||||||||||
| Emerging Markets Debt Fund | ||||||||||||||||||||||||||||||||
Forward foreign currency (2) | ||||||||||||||||||||||||||||||||
Citibank | $ | 36,338 | $ | (7,210 | ) | $ | — | $ | 29,128 | $ | 7,210 | $ | (7,210 | ) | $ | — | $ | — | ||||||||||||||
Deutsche Bank | 6,979 | (1,376 | ) | — | 5,603 | 1,376 | (1,376 | ) | — | — | ||||||||||||||||||||||
Goldman Sachs | 3,007 | (3,007 | ) | — | — | 22,699 | (3,007 | ) | — | 19,692 | ||||||||||||||||||||||
JPMorgan Chase | — | — | — | — | 10,065 | — | — | 10,065 | ||||||||||||||||||||||||
| 1. | In some instances, the actual collateral received and/or pledged may be more than the amount shown here due to overcollateralization. |
| 2. | Includes financial instrument (forwards) which are not subject to master netting arrangement across funds, or other another similar arrangement. |
| 3. | Net amounts represent the net receivables/(payable) that would be due from/to the counterparty in the event of default. Exposure from financial derivative instruments can only be netted across transactions governed under the same master agreement with the same legal entity. |
2016 Annual Report
63
Notes to Financial Statements (continued)
October 31, 2016
| Gross Amounts Not Offset in Statement of Assets & Liabilities | Gross Amounts Not Offset in Statement of Assets and Liabilities | |||||||||||||||||||||||||||||||
| Description | Gross Amounts of Assets Presented in Statement of Financial Position | Financial Instruments | Collateral Received (1) | Net Amount (3) | Gross Amounts of Liabilities Presented in Statement of Financial Position | Financial Instruments | Collateral Pledged (1) | Net Amount (3) | ||||||||||||||||||||||||
| Assets | Liabilities | |||||||||||||||||||||||||||||||
| Global Unconstrained Fixed Income Fund | ||||||||||||||||||||||||||||||||
Forward foreign currency (2) | ||||||||||||||||||||||||||||||||
Barclays Bank | $ | 3,894 | $ | — | $ | — | $ | 3,894 | $ | — | $ | — | $ | — | $ | — | ||||||||||||||||
Citibank | 36,774 | (252 | ) | — | 36,522 | 252 | (252 | ) | — | — | ||||||||||||||||||||||
Deutsche Bank | — | — | — | — | 2,078 | — | — | 2,078 | ||||||||||||||||||||||||
Goldman Sachs | 8,972 | (8,972 | ) | — | — | 10,524 | (8,972 | ) | — | 1,552 | ||||||||||||||||||||||
JPMorgan Chase | 12,978 | (7,659 | ) | — | 5,319 | 7,659 | (7,659 | ) | — | — | ||||||||||||||||||||||
Morgan Stanley | 28 | (28 | ) | — | — | 1,731 | (28 | ) | — | 1,703 | ||||||||||||||||||||||
Royal Bank Of Canada | 16,073 | (1,474 | ) | — | 14,599 | 1,474 | (1,474 | ) | — | — | ||||||||||||||||||||||
| 1. | In some instances, the actual collateral received and/or pledged may be more than the amount shown here due to overcollateralization. |
| 2. | Includes financial instrument (forwards and swaps) which are not subject to master netting arrangement across funds, or other another similar arrangement. |
| 3. | Net amounts represent the net receivables/(payable) that would be due from/to the counterparty in the event of default. Exposure from financial derivative instruments can only be netted across transactions governed under the same master agreement with the same legal entity. |
The following is a summary of the location of realized gain/(loss) and net change in unrealized appreciation/(depreciation) on derivatives in the Statement of Operations for the fiscal year ended October 31, 2016:
| Location on the Statement of Operations Derivative Instrument Risk Type | ||
Credit Risk | Realized gain/(loss) on swap contracts | |
| Net change in unrealized appreciation/(depreciation) on swap contracts | ||
Interest Rate Risk | Realized gain/(loss) on future contracts transactions | |
| Net change in unrealized appreciation/(depreciation) on futures contracts | ||
| Realized gain/(loss) on swap contracts | ||
| Net change in unrealized appreciation/(depreciation) on swap contracts | ||
Foreign Exchange Risk | Realized gain/(loss) on foreign currency transactions | |
| Net change in unrealized appreciation/(depreciation) on foreign currency transactions | ||
The following is a summary of the effect of derivative instruments on the Statement of Operations for the fiscal year ended October 31, 2016:
| Realized Gain or (Loss) on Derivatives Recognized in the Statement of Operations | ||||||||||||||||||||
| Funds | Total | Credit Default Swaps (Credit Risk) | Interest Rate Swaps (Interest Rate Risk) | Forward Foreign Exchange Contracts (Foreign Exchange Risk) | Futures Contracts (Interest Rate Risk) | |||||||||||||||
Asia Bond Fund | $ | (650,374 | ) | $ | – | $ | – | $ | (689,089 | ) | $ | 38,715 | ||||||||
Emerging Markets Debt Fund | (232,265 | ) | – | – | (232,265 | ) | – | |||||||||||||
Global Unconstrained Fixed Income Fund | 379,470 | (676 | ) | 37,356 | 399,550 | (56,760 | ) | |||||||||||||
Annual Report 2016
64
Notes to Financial Statements (continued)
October 31, 2016
| Change in Unrealized Appreciation/ (Depreciation) on Derivatives Recognized in the Statement of Operations | ||||||||||||||||||||
| Funds | Total | Credit Default Swaps (Credit Risk) | Interest Rate Swaps (Interest Rate Risk) | Forward Foreign Exchange Contracts (Foreign Exchange Risk) | Futures Contracts (Interest Rate Risk) | |||||||||||||||
Asia Bond Fund | $ | 442,918 | $ | – | $ | – | $ | 458,810 | $ | (15,892 | ) | |||||||||
Emerging Markets Debt Fund | (59,440 | ) | – | – | (59,440 | ) | – | |||||||||||||
Global Unconstrained Fixed Income Fund | 104,700 | (1,419 | ) | 1,489 | 60,025 | 44,605 | ||||||||||||||
Information about derivatives reflected as of the date of this report is generally indicative of the type of activity for the fiscal year ended October 31, 2016. The table below summarizes the weighted average values of derivatives holdings by the Funds during the fiscal year ended October 31, 2016.
| Fund | Forward foreign exchange contracts (Average Notional Value) | Futures contracts (Average Notional Value) | Swap contracts (Average Notional Value) | |||||||||
Asia Bond Fund | $ | 61,564,139 | $ | (9,833,333 | ) | $ | – | |||||
Emerging Markets Debt Fund | 6,891,433 | – | – | |||||||||
Global Unconstrained Fixed Income Fund | 9,185,445 | (535,732 | ) | 48,998,439 | * | |||||||
| * | Average notional value for the period from September 1, 2016 through October 31, 2016. |
| e. | Security Transactions, Investment Income and Expenses |
Security transactions are recorded on the trade date. Realized and unrealized gains/(losses) from security and currency transactions are calculated on the identified cost basis. Dividend income and corporate actions are recorded generally on the ex-date, except for certain dividends and corporate actions which may be recorded after the ex-date, as soon as the Fund acquires information regarding such dividends or corporate actions.
Interest income and expenses are recorded on an accrual basis. Expenses directly attributable to a Fund are charged to that Fund. Expenses not directly attributable to a Fund are allocated proportionately among the relevant Funds based on net assets of each. For each of the Funds, the method for allocating income, fund level expenses, and realized and unrealized gains or losses to a class is based on the total net asset value of that class’s shares in proportion to the total net assets of the relevant Fund. Expenses specific to a class (such as Rule 12b-1 and administrative services fees) are charged to that class.
| f. | Distributions |
Distributions from net investment income, if any, are declared and paid quarterly for the Asia Bond Fund, the Emerging Markets Debt Fund and the Global Unconstrained Fixed Income Fund. Distributions from net investment income are declared daily and paid monthly for the Tax-Free Income Fund. The Funds will also declare and pay distributions at least annually from net realized gains on investment transactions and net realized foreign exchange gains, if any. Dividends and distributions to shareholders are recorded on the ex-dividend date.
Dividends and distributions to shareholders are determined in accordance with federal income tax regulations, which may differ from GAAP. These differences are primarily due to differing treatments for foreign currencies and loss deferrals.
| g. | Federal Income Taxes |
Each Fund intends to continue to qualify as a “regulated investment company” by complying with the provisions available to certain investment companies, as defined in Subchapter M of the Internal Revenue Code of 1986, as amended, and to make distributions of net investment income and net realized capital gains sufficient to relieve the Funds from all federal income taxes. Therefore, no federal income tax provision is required.
Management of the Funds has concluded that there are no significant uncertain tax positions that would require recognition in the financial statements. Since tax authorities can examine previously filed tax returns, the Funds’ U.S. federal and state tax returns for each of the four fiscal years up to the most recent fiscal year ended October 31 are subject to such review.
2016 Annual Report
65
Notes to Financial Statements (continued)
October 31, 2016
| h. | Repurchase Agreements |
The Funds may enter into repurchase agreements under the terms of a Master Repurchase Agreement. It is each Fund’s policy that its custodian/counterparty segregate the underlying collateral securities, the value of which exceeds the principal amount of the repurchase transaction, including accrued interest. The repurchase price generally equals the price paid by a Fund plus interest negotiated on the basis of current short-term rates. To the extent that any repurchase transaction exceeds one business day, the collateral is valued on a daily basis to determine its adequacy. Under the Master Repurchase Agreement, if the counterparty defaults and the value of the collateral declines, or if bankruptcy proceedings are commenced with respect to the counterparty of the security, realization of the collateral by the Funds may be delayed or limited. Repurchase agreements are subject to contractual netting arrangements with the counterparty, Fixed Income Clearing Corp. To the extent a Fund enters into repurchase agreements, additional information on individual repurchase agreements is included in the Statements of Investments.
3. Agreements and Transactions with Affiliates
| a. | Investment Adviser |
Under the Investment Advisory Agreement with the Trust, Aberdeen Asset Management Inc. (“Aberdeen” or the “Adviser”) manages the Funds in accordance with the policies and procedures established by the Board.
For services provided under the terms of the current Investment Advisory Agreement, each Fund pays the Adviser an annual management fee (as a percentage of its average daily net assets) paid monthly according to the following schedule:
| Fund | Fee Schedule | |||||||
Asia Bond Fund | On all assets | 0.500% | ||||||
Emerging Markets Debt Fund | Up to $500 million | 0.750% | ||||||
| On $500 million and more | 0.700% | |||||||
Global Unconstrained Fixed Income Fund | Up to $500 million | 0.600% | ||||||
| $500 million up to $1 billion | 0.550% | |||||||
| On $1 billion and more | 0.500% | |||||||
Tax-Free Income Fund | Up to $250 million | 0.425% | ||||||
| $250 million up to $1 billion | 0.375% | |||||||
| On $1 billion and more | 0.355% | |||||||
The Adviser has engaged the services of affiliates Aberdeen Asset Management Asia Limited (“AAMAL”) and Aberdeen Asset Managers Limited (“AAML”) as subadvisers (the “Subadvisers”) pursuant to subadvisory agreements. The Subadvisers manage a portion of certain Funds’ investments and have the responsibility for making all investment decisions for the portion of a Fund’s assets they manage. Pursuant to the subadvisory agreements, the Adviser pays fees to the Subadvisers, if any.
The Trust and Aberdeen have entered into a written contract (“Expense Limitation Agreement”) limiting operating expenses for all classes of the Funds from exceeding the amounts listed below. This contractual limitation may not be terminated before February 28, 2017 (for the Global Unconstrained Fixed Income Fund, February 28, 2018) without the approval of the Board. This limit excludes certain expenses, including any taxes, interest, brokerage fees, short-sale dividend expenses, Acquired Fund Fees and Expenses, Rule 12b-1 fees, administrative services fees, transfer agent out-of-pocket expenses for Class A shares, Class R shares and Institutional Service Class shares and extraordinary expenses.
| Fund | Limit | |||
Asia Bond Fund | 0.70% | |||
Emerging Markets Debt Fund | 0.90% | |||
Global Unconstrained Fixed Income Fund | 0.85% | |||
Tax-Free Income Fund | 0.62% | |||
Aberdeen may request and receive reimbursement from a Fund of the advisory fees waived and other expenses reimbursed pursuant to the Expense Limitation Agreement at a later date not to exceed three years from the fiscal year in which the corresponding reimbursement to the Funds was made.
Annual Report 2016
66
Notes to Financial Statements (continued)
October 31, 2016
However, no reimbursement will be made for fees waived unless:
(i) the total annual expense ratio of the class making such reimbursement is less than the limit set forth above; and
(ii) the payment of such reimbursement is approved by the Board on a quarterly basis (the “Reimbursement Requirements”).
If the Board approves any changes in the waiver terms or limitations, reimbursements are only permitted to the extent that the terms of the Expense Limitation Agreement in effect at the time of the waiver are met at the time that reimbursement is approved. Except as provided for in the Expense Limitation Agreement, reimbursement of amounts previously waived or assumed by Aberdeen is not permitted.
As of October 31, 2016, to the extent the Reimbursement Requirements are met, the cumulative potential reimbursements for each Fund, based on expenses reimbursed by Aberdeen would be:
| Fund | Amount Fiscal Year 2014 (Expires 10/31/17) | Amount Fiscal Year 2015 (Expires 10/31/18) | Amount Fiscal Year 2016 (Expires 10/31/19) | Total* | ||||||||||||
Asia Bond Fund | $ | 205,651 | $ | 290,081 | $ | 174,473 | $ | 670,205 | ||||||||
Emerging Markets Debt Fund | 141,808 | 144,411 | 134,178 | 420,397 | ||||||||||||
Global Unconstrained Fixed Income Fund | 133,386 | 173,469 | 168,405 | 475,260 | ||||||||||||
Tax-Free Income Fund | 134,346 | 121,485 | 136,796 | 392,627 | ||||||||||||
| * | Amounts reported are due to expire throughout the respective 3-year expiration period presented above. |
Amounts listed as “–” are $0 or round to $0.
In accordance with the Funds’ Expense Limitation Agreement and criteria, as described above, the Adviser did not recapture any expenses for which it previously reimbursed the Funds. Accordingly, at October 31, 2016, the Funds did not have liabilities payable to the Adviser for recapture of previously reimbursed expenses.
| b. | Fund Administration |
Under the terms of the Fund Administration Agreement, Aberdeen provides various administrative and accounting services, including daily valuation of the Funds’ shares, preparation of financial statements, tax returns, regulatory reports, and presentation of quarterly reports to the Board. For services provided pursuant to the Fund Administration Agreement, the Trust pays Aberdeen an annual fee of 0.08% based on the Trust’s average daily net assets. The fee is then allocated proportionately among all funds within the Trust (including the Funds) in relation to the average daily net assets of each fund. This asset-based fee is subject to an annual minimum fee based on the number of funds served. Pursuant to a sub-administration agreement with Aberdeen, State Street Bank and Trust Company provides sub-administration services with respect to the Funds.
| c. | Distributor and Shareholder Servicing |
The Trust and Aberdeen Fund Distributors, LLC (the “Distributor” or “AFD”) are parties to the current Underwriting Agreement (the “Underwriting Agreement”) whereby the Distributor acts as principal underwriter for the Trust’s shares.
The Trust has adopted a Distribution Plan (the “Plan”) pursuant to Rule 12b-1 under the 1940 Act with respect to certain classes of shares. The Plan permits the Funds to compensate AFD, as the Funds’ Distributor, for expenses associated with the distribution of certain classes of shares of the Funds of the Trust. Although actual distribution expenses may be more or less, under the Plan, the Funds of the Trust pay the Distributor an annual fee of the following amounts:
| Fund | Class A Shares | Class C Shares (a) | Class R Shares (a) | |||||||||
Asia Bond Fund | 0.25% | 1.00% | 0.50% | |||||||||
Emerging Markets Debt Fund | 0.25% | 1.00% | 0.50% | |||||||||
Global Unconstrained Fixed Income Fund | 0.25% | 1.00% | 0.50% | |||||||||
Tax-Free Income Fund | 0.25% | 1.00% | 0.50% | |||||||||
| (a) | 0.25% of which is service fees. |
The Adviser or an affiliate of the Adviser may pay additional amounts from its own resources to dealers or other financial intermediaries, for aid in distribution or for aid in providing administrative services to shareholders.
2016 Annual Report
67
Notes to Financial Statements (continued)
October 31, 2016
Pursuant to the current Underwriting Agreement, the Distributor will also receive the proceeds of contingent deferred sales charges (“CDSCs”) of 1% imposed on certain redemptions of Class C (and up to 1% for certain Class A) shares.
In addition, the Distributor will re-allow to dealers 3.75% of sales charges on Class A shares of the Funds, which have a maximum front-end sales charge of 4.25%, and the Distributor or Adviser may compensate broker dealers or financial intermediaries for sales of Class C shares from its own resources at the rate of 1.00% on sales of Class C shares, which have a maximum CDSC of 1.00% (on the deferred sales charge assessed on sales within one year of purchase). For the fiscal year ended October 31, 2016, AFD retained commissions of $18,788 from front-end sales charges of Class A shares and $66 from CDSC fees from Class C (and certain Class A) shares of the Funds.
| d. | Administrative Services |
Under the terms of the current Administrative Services Plan, a series of the Trust is permitted to enter into Servicing Agreements with servicing organizations, such as any bank, trust company, thrift institution, broker-dealer, insurance company, or other financial institution, which agree to provide certain administrative support services in connection with the Class A, Class R and Institutional Service Class shares of the series of the Trust (as applicable). Under the Administrative Services Plan, a Fund may pay a broker-dealer or other intermediary a maximum annual administrative services fee of 0.25% (or a maximum of 0.15% under an amendment to the Administrative Services Plan that is in effect until at least February 28, 2017 (February 28, 2018 for Global Unconstrained Fixed Income Fund)) of the average daily net assets of Class A, Class R and Institutional Service Class shares. The amount of expenses incurred under the terms of the Administrative Services Plan during the fiscal year ended October 31, 2016 was as follows:
| Fund | Amount | |||
Asia Bond Fund | $ | 7,435 | ||
Emerging Markets Debt Fund | – | |||
Global Unconstrained Fixed Income Fund | 6,524 | |||
Tax-Free Income Fund | 429 | |||
Amounts listed as “–” are $0 or round to $0.
The Funds may pay and/or reimburse transfer agent out-of-pocket expenses to certain broker-dealers and financial intermediaries who provide administrative support services to beneficial shareholders on behalf of the Funds, subject to certain limitations approved by the Board. These fees may be in addition to Rule 12b-1 fees. Transfer agent out-of-pocket expenses generally include, but are not limited to, costs associated with recordkeeping, networking, sub-transfer agency or other administrative or shareholder services.
4. Investment Transactions
Purchases and sales of securities (excluding short-term securities) for the fiscal year ended October 31, 2016, were as follows:
| Fund | Purchases | Sales | ||||||
Asia Bond Fund | $ | 34,761,647 | $ | 85,233,513 | ||||
Emerging Markets Debt Fund | 21,865,144 | 38,452,049 | ||||||
Global Unconstrained Fixed Income Fund | 25,755,679 | 26,553,893 | ||||||
Tax-Free Income Fund | 9,682,337 | 10,489,261 | ||||||
5. Portfolio Investment Risks
| a. | Active Trading Risk |
Certain Funds may engage in active and frequent trading of portfolio securities to achieve its investment objective. If a Fund does trade this way, it may incur increased costs, which can lower the actual return of the Fund.
| b. | Asset-Backed Securities |
Like traditional fixed income securities, the value of asset-backed securities typically increases when interest rates fall and decreases when interest rates rise. Certain asset-backed securities may also be subject to the risk of prepayment.
| c. | Call and Redemption Risk |
Some bonds allow the issuer to call a bond for redemption before it matures. If this happens, a Fund may be required to invest the proceeds in securities with lower yields.
Annual Report 2016
68
Notes to Financial Statements (continued)
October 31, 2016
| d. | Corporate Bonds |
Corporate bonds are debt instruments issued by domestic or foreign corporations or similar entities. Corporate bonds can decline in value in response to changes in the financial condition of the issuer and involve a risk of loss in case of issuer default or insolvency.
| e. | Country/Regional Focus Risk |
Significant exposure to a single country or geographical region involves increased currency, political, regulatory and other risks. Market swings in the targeted country or geographical region likely will have a greater effect on portfolio performance than they would in a more geographically diversified fund.
| f. | Credit Risk |
A debt instrument’s price depends, in part, on the credit quality of the issuer, borrower, counterparty, or underlying collateral and can decline in response to changes in the financial condition of the issuer, borrower, counterparty, or underlying collateral, or changes in specific or general market, economic, industry, political, regulatory, geopolitical, or other conditions.
| g. | Derivatives Risk (including Options, Futures, and Swaps) |
Derivatives are speculative and may hurt a Fund’s performance. Derivatives present the risk of disproportionately increased losses and/or reduced opportunities for gains when the financial asset or measure to which the derivative is linked changes in unexpected ways. The potential benefits to be derived from a Fund’s options, futures and derivatives strategy are dependent upon the portfolio managers’ ability to discern pricing inefficiencies and predict trends in these markets, which decisions could prove to be inaccurate. This requires different skills and techniques than predicting changes in the price of individual debt securities, and there can be no assurance that the use of this strategy will be successful.
Speculative Exposure Risk – To the extent that a derivative or practice is not used as a hedge, a Fund is directly exposed to its risks. Gains or losses from speculative positions in a derivative may be much greater than the derivative’s original cost. For example, potential losses from writing uncovered call options and from speculative short sales are unlimited.
Hedged Exposure Risk – Losses generated by a derivative or practice used by a Fund for hedging purposes should be substantially offset by gains on the hedged investment. However, while hedging can reduce or eliminate losses, it can also reduce or eliminate gains.
Correlation Risk – A Fund is exposed to the risk that changes in the value of a hedging instrument will not match those of the investment being hedged.
Counterparty Risk – Derivative transactions depend on the creditworthiness of the counterparty and the counterparty’s ability to fulfill its contractual obligations.
| h. | Emerging Markets Risk |
Certain Funds are subject to Emerging Markets Risk. This is a magnification of the risks that apply to foreign investments. These risks are greater for securities of companies in emerging market countries because the countries may have less stable governments, more volatile currencies and less established markets (see “Foreign Securities Risk” below).
| i. | Extension Risk |
Principal repayments may not occur as quickly as anticipated, causing the expected maturity of a security to increase. Rapidly rising interest rates may cause prepayments to occur more slowly than expected, thereby lengthening the maturity of the securities held by the Fund and making their prices more sensitive to rate changes and more volatile.
| j. | Foreign Government Securities Risk |
Debt securities issued by foreign governments are often supported by the full faith and credit of the foreign governments. These foreign governments may permit their subdivisions, agencies or instrumentalities to have the full faith and credit of the foreign governments. The issuer of foreign government securities may be unwilling or unable to pay interest or repay principal when due. A government entity’s willingness or ability to repay principal and interest due in a timely manner may be affected by a number of political, economic, financial and other factors. A Fund may have limited recourse to compel payment in the event of a default. Periods of economic uncertainty may result in the illiquidity and increased price volatility of a foreign government’s debt securities. A foreign government’s default on its debt securities may cause the value of securities held by a Fund to decline significantly.
| k. | Foreign Currency Exposure Risk |
The value of foreign currencies relative to the U.S. Dollar fluctuates in response to market, economic, political, regulatory, geopolitical or other conditions. A decline in the value of a foreign currency versus the U.S. Dollar reduces the value in U.S. Dollars of investments denominated in that foreign currency. This risk may impact a Fund more greatly to the extent the Fund does not hedge its currency risk, or hedging techniques used by the Fund are unsuccessful.
2016 Annual Report
69
Notes to Financial Statements (continued)
October 31, 2016
| l. | Foreign Securities Risk |
Foreign securities may be more volatile, harder to price and less liquid than U.S. securities. They are subject to different accounting and regulatory standards, and political and economic risks.
Asian Risk. Parts of the Asian region may be subject to a greater degree of economic, political and social instability than is the case in the United States and Europe. Some Asian countries can be characterized as emerging markets or newly industrialized and may experience more volatile economic cycles than developed countries. The developing nature of securities markets in many countries in the Asian region may lead to a lack of liquidity while some countries have restricted the flow of money in and out of the country. Some countries in Asia have historically experienced political uncertainty, corruption, military intervention and social unrest. A Fund may be more volatile than a fund which is broadly diversified geographically.
China Risk. Concentrating investments in China and Hong Kong subjects a Fund to additional risks, and may make it significantly more volatile than geographically diverse mutual funds. Additional risks associated with investments in China and Hong Kong include exposure to currency fluctuations, less liquidity, expropriation, confiscatory taxation, nationalization, exchange control regulations (including currency blockage), trading halts, limitation on repatriation and differing legal standards.
| m. | High-Yield Bonds and Other Lower-Rated Securities Risk |
A Fund’s investments in high-yield bonds (commonly referred to as “junk bonds”) and other lower-rated securities will subject the Fund to substantial risk of loss. Investments in high-yield bonds are speculative and issuers of these securities are generally considered to be less financially secure and less able to repay interest and principal than issuers of investment-grade securities. Prices of high-yield bonds tend to be very volatile. These securities are less liquid than investment-grade debt securities and may be difficult to price or sell, particularly in times of negative sentiment toward high-yield securities.
| n. | Illiquid Securities Risk |
Illiquid securities are assets which may not be sold or disposed of in the ordinary course of business within seven days at approximately the price at which a Fund has valued the investment on its books and may include such securities as those not registered under U.S. securities laws or securities that cannot be sold in public transactions. An inability to sell a portfolio position can adversely affect a Fund’s value or prevent the Fund from being able to take advantage of other investment opportunities. Over recent years, the capacity of dealers to make markets in fixed income securities has been outpaced by the growth in the size of the fixed income markets. Liquidity risk may be magnified in a rising interest rate environment or when investor redemptions from fixed income funds may be higher than normal, due to the increased supply in the market that would result from selling activity.
Each Fund employs proprietary procedures and tests using third-party and internal data inputs that seek to assess and manage the liquidity of its portfolio holdings. A Fund’s procedures and tests take into account relevant market, trading and other factors, and monitor whether liquidity assessments should be adjusted based on changed market conditions. These procedures and tests are designed to assist a Fund in determining its ability to meet redemption requests in various market conditions. In light of the dynamic nature of markets, there can be no assurance that these procedures and tests will enable a Fund to ensure that it has sufficient liquidity to meet redemption requests.
| o. | Impact of Large Redemptions and Purchases of Fund Shares |
Occasionally, shareholders may make large redemptions or purchases of Fund shares, which may cause a Fund to have to sell securities or invest additional cash. These transactions may adversely affect a Fund’s performance and increase transaction costs. In addition, large redemption requests may exceed the cash balance of a Fund and result in credit line borrowing fees and/or overdraft charges to the Fund until the sale of portfolio securities to cover the redemption request settle. For additional information on redemptions, please see the Statement of Changes in Net Assets.
| p. | Interest Rate Risk |
A Fund’s fixed income investments are subject to interest rate risk, which generally causes the value of a fixed income portfolio to decrease when interest rates rise resulting in a decrease in the Fund’s net assets. A Fund may be subject to a greater risk of rising interest rates due to the current period of historically low rates and the effect of potential government fiscal policy initiatives and resulting market reaction to those initiatives. Interest rate fluctuations tend to have a greater impact on fixed income-securities with a greater time to maturity and/or lower coupon. In periods of market volatility, the market values of fixed income securities may be more sensitive to changes in interest rates. A fund with a longer average portfolio duration will be more sensitive to changes in interest rates than a fund with a shorter average portfolio duration.
| q. | Issuer Risk |
The value of a security may decline for reasons directly related to the issuer, such as management performance, financial leverage and reduced demand for the issuer’s goods or service.
Annual Report 2016
70
Notes to Financial Statements (continued)
October 31, 2016
| r. | Market Risk |
Deteriorating market conditions might cause a general weakness in the market that reduces the prices of securities in that market in which a Fund invests.
| s. | Mortgage-Related Securities Risk |
Certain Funds may invest in mortgage-related securities. Rising interest rates may cause an issuer to exercise its right to pay principal later than expected which tends to extend the duration of mortgage-related securities, making them more sensitive to changes in interest rates. As a result, in a period of rising interest rates, a fund that holds mortgage-related securities may exhibit additional volatility. This is known as extension risk. In addition, mortgage-related securities are subject to prepayment risk. When interest rates decline, borrowers may pay off their mortgages sooner than expected. This can reduce the returns of a Fund because the Fund will have to reinvest that money at the lower prevailing interest rates.
| t. | Non-Diversified Fund Risk |
Because Aberdeen Asia Bond Fund and Aberdeen Emerging Markets Debt Fund are non-diversified, the Funds may hold larger positions in fewer securities than other funds. As a result, a single security’s increase or decrease in value may have a greater impact on each Fund’s value and total return.
| u. | Non-Hedging Foreign Currency Trading Risk |
Foreign exchange rates can be extremely volatile and a variance in the degree of volatility of the market or in the direction of the market from the Adviser’s expectations may produce significant losses to a Fund.
| v. | Prepayment Risk |
As interest rates decline, debt issuers may repay or refinance their loans or obligations earlier than anticipated. The issuers of fixed income securities may, therefore, repay principal in advance. This forces the Fund to reinvest the proceeds from the principal prepayments at lower rates, which reduces the Fund’s income.
| w. | Private Placements and Other Restricted Securities Risk |
Investments in private placements and other restricted securities, including Regulation S Securities and Rule 144A Securities, could have the effect of increasing a Fund’s level of illiquidity. Private placements and restricted securities may be less liquid than other investments because such securities may not always be readily sold in broad public markets and the Fund might be unable to dispose of such securities promptly or at prices reflecting their true value.
| x. | Sector Risk |
To the extent that a Fund has a significant portion of its assets invested in securities of companies conducting business in a broadly related group of industries within an economic sector, the Fund may be more vulnerable to unfavorable developments in that economic sector than funds that invest more broadly.
Consumer Staples Sector Risk. To the extent the consumer staples sector represents a significant portion of a Fund, the Fund will be sensitive to changes in, and its performance may depend to a greater extent on, factors impacting this sector. The consumer staples sector may be affected by the regulation of various product components and production methods, marketing campaigns and other factors affecting consumer demand. Tobacco companies, in particular, may be adversely affected by new laws, regulations and litigation. The consumer staples sector may also be adversely affected by changes or trends in commodity prices, which may be influenced by unpredictable factors.
Financial Sector Risk. To the extent that the financials sector represents a significant portion of a Fund, the Fund will be sensitive to changes in, and its performance may depend to a greater extent on, factors impacting this sector. Performance of companies in the financials sector may be adversely impacted by many factors, including, among others, government regulations, economic conditions, credit rating downgrades, changes in interest rates, and decreased liquidity in credit markets. The impact of more stringent capital requirements, recent or future regulation of any individual financial company, or recent or future regulation of the financials sector as a whole cannot be predicted. In recent years, cyber attacks and technology malfunctions and failures have become increasingly frequent in this sector and have caused significant losses.
Industrials Sector Risk. To the extent that the industrials sector represents a significant portion of a Fund, the Fund will be sensitive to changes in, and its performance may depend to a greater extent on, factors impacting this sector. The industrials sector may be adversely affected by changes in the supply of and demand for products and services, product obsolescence, claims for environmental damage or product liability and general economic conditions, among other factors.
| y. | Securities Selection Risk |
The investment team may select securities that underperform the market or other funds with similar investment objectives and strategies.
2016 Annual Report
71
Notes to Financial Statements (continued)
October 31, 2016
| z. | Valuation Risk |
The lack of active trading markets may make it difficult to obtain an accurate price for a security held by a Fund.
Please read the prospectus for more detailed information regarding these and other risks.
6. Contingencies
In the normal course of business, the Funds may provide general indemnifications pursuant to certain contracts and organizational documents. The Funds’ maximum exposure under these arrangements is dependent on future claims that may be made against the Funds, and therefore, cannot be estimated; however, based on experience, the risk of loss from such claims is considered remote.
7. Tax Information
As of October 31, 2016, the tax cost of securities and the breakdown of unrealized appreciation/(depreciation) for each Fund were as follows:
| Tax Cost of Securities | Unrealized Appreciation | Unrealized Depreciation | Net Unrealized Appreciation/ (Depreciation) | |||||||||||||
Asia Bond Fund | $ | 28,929,889 | $ | 479,218 | $ | (344,285 | ) | $ | 134,933 | |||||||
Emerging Markets Debt Fund | 19,024,158 | 367,891 | (543,190 | ) | (175,299 | ) | ||||||||||
Global Unconstrained Fixed Income Fund | 16,074,297 | 30,079 | (228,377 | ) | (198,298 | ) | ||||||||||
Tax-Free Income Fund | 84,956,114 | 6,737,757 | (151,113 | ) | 6,586,644 | |||||||||||
The tax character of distributions paid during the fiscal year ended October 31, 2016 was as follows (total distributions paid may differ from the Statements of Changes in Net Assets because for tax purposes dividends are recognized when actually paid):
| Distributions paid from | ||||||||||||||||||||||||
| Fund | Ordinary Income* | Net Long Term Capital Gains* | Total Taxable Distributions | Tax Exempt Distributions | Return of Capital | Total Distributions Paid | ||||||||||||||||||
Asia Bond Fund | $ | – | $ | – | $ | – | $ | – | $ | 452,279 | $ | 452,279 | ||||||||||||
Emerging Markets Debt Fund | 770,074 | – | 770,074 | – | 119,737 | 889,811 | ||||||||||||||||||
Global Unconstrained Fixed Income Fund | 49,323 | – | 49,323 | – | – | 49,323 | ||||||||||||||||||
Tax-Free Income Fund | 20,914 | – | 20,914 | 2,945,011 | 8,995 | 2,974,920 | ||||||||||||||||||
| * | The difference between the book-basis and tax-basis unrealized appreciation/(depreciation) is attributable primarily to tax deferral of losses on wash sales. |
The tax character of distributions paid during the fiscal year ended October 31, 2015 was as follows (total distributions paid may differ from the Statements of Changes in Net Assets because for tax purposes dividends are recognized when actually paid):
| Distributions paid from | ||||||||||||||||||||||||||||
| Fund | Ordinary Income* | Net Long Term Capital Gains* | Total Taxable Distributions | Tax Exempt Distributions | Taxable Over- distribution | Return of Capital | Total Distributions Paid | |||||||||||||||||||||
Asia Bond Fund | $ | 1,794,506 | $ | – | $ | 1,794,506 | $ | – | $ | – | $ | 1,882,555 | $ | 3,677,061 | ||||||||||||||
Emerging Markets Debt Fund | 1,169,451 | – | 1,169,451 | – | – | – | 1,169,451 | |||||||||||||||||||||
Global Unconstrained Fixed Income Fund | 199,462 | – | 199,462 | – | 5 | – | 199,467 | |||||||||||||||||||||
Tax-Free Income Fund | 118,665 | 231,719 | 350,384 | 3,144,039 | – | 27,644 | 3,522,067 | |||||||||||||||||||||
| * | The difference between the book-basis and tax-basis unrealized appreciation/(depreciation) is attributable primarily to tax deferral of losses on wash sales. |
Annual Report 2016
72
Notes to Financial Statements (continued)
October 31, 2016
As of October 31, 2016, the components of accumulated earnings/(deficit) on a tax basis were as follows:
| Fund | Undistributed Tax Exempt Income | Undistributed Ordinary Income | Undistributed Long-Term Capital Gains | Accumulated Earnings | Distributions Payable | Late Year Ordinary and Post-October Capital Loss Deferrals | Other Temporary Differences | Unrealized Appreciation/ (Depreciation)* | Accumulated Capital and Other Losses** | Total Accumulated Earnings/ (Deficit) | ||||||||||||||||||||||||||||||
Asia Bond Fund | $ | – | $ | – | $ | – | $ | – | $ | – | $ | – | $ | (73,437 | ) | $ | 66,020 | $ | (5,247,452 | ) | $ | (5,254,869 | ) | |||||||||||||||||
Emerging Markets Debt Fund | – | – | – | – | – | – | (62,874 | ) | (944,445 | ) | (3,591,429 | ) | (4,598,748 | ) | ||||||||||||||||||||||||||
Global Unconstrained Fixed Income Fund | – | 190,016 | – | – | – | – | – | (201,607 | ) | – | (11,591 | ) | ||||||||||||||||||||||||||||
Tax-Free Income Fund | – | – | – | – | – | – | (9,349 | ) | 6,586,644 | (169,737 | ) | 6,407,558 | ||||||||||||||||||||||||||||
| * | The difference between the book-basis and tax-basis unrealized appreciation/(depreciation) is attributable primarily to tax deferral of losses on wash sales. |
| ** | As of October 31, 2016, for Federal income tax purposes, the following Funds have capital loss carryforwards available to offset capital gains, if any, to the extent provided by the Treasury regulations, which expire in the years set forth below. |
| Fund | Amount | Expires | ||||
Asia Bond Fund | $ | 3,840,364 | Unlimited (Short-Term) | |||
Asia Bond Fund | 1,407,088 | Unlimited (Long-Term) | ||||
Emerging Markets Debt Fund | 785,485 | Unlimited (Short-Term) | ||||
Emerging Markets Debt Fund | 2,805,944 | Unlimited (Long-Term) | ||||
Tax-Free Income Fund | 169,737 | Unlimited (Long-Term) | ||||
Amounts listed as “–” are $0 or round to $0.
Under the Regulated Investment Company Modernization Act of 2010, the Funds are permitted to carry forward capital losses incurred in taxable years beginning after December 22, 2010 for an unlimited period. However, any losses incurred during those taxable years will be required to be utilized prior to the losses incurred in pre-enactment taxable years. As a result of this ordering rule, pre-enactment capital loss carryforwards may be more likely to expire unused. Additionally, post-enactment capital losses that are carried forward will retain their character as either short-term or long-term capital losses rather than being considered all short-term as under previous law.
GAAP requires that certain components of net assets be adjusted to reflect permanent differences between financial and tax reporting. Accordingly, the table below details the necessary reclassifications, which are a result of permanent differences primarily attributable to foreign currency gain/(loss), paydowns, ordinary losses, distribution re-designation, distributions in excess of current earnings, capital gain tax, swap gain/(loss) and net operating losses. These reclassifications have no effect on net assets or net asset values per share.
| Fund | Paid-in Capital | Accumulated Net Investment Income/(Loss) | Accumulated Net Realized Gain/(Loss) | |||||||||
Asia Bond Fund | $ | (805,557 | ) | $ | (1,725,552 | ) | $ | 2,531,109 | ||||
Emerging Markets Debt Fund | 1,668,141 | (1,395,597 | ) | (272,544 | ) | |||||||
Global Unconstrained Fixed Income Fund | – | (179,621 | ) | 179,621 | ||||||||
Tax-Free Income Fund | – | – | – | |||||||||
2016 Annual Report
73
Notes to Financial Statements (continued)
October 31, 2016
8. Significant Shareholders
As of October 31, 2016, the following Funds had shareholders with the percentage ownership indicated, which are considered significant shareholders (holdings greater than 5.0%) for financial reporting purposes:
| Fund | Record Ownership % | Number of Account Owners | ||||
Asia Bond Fund | 81.7 | % | 5 | |||
Emerging Markets Debt Fund | 92.2 | 4 | ||||
Global Unconstrained Fixed Income Fund | 57.8 | 4 | ||||
Tax-Free Income Fund | – | – | ||||
Amounts listed as “–” are $0 or round to $0.
9. Line of Credit
The Trust, on behalf of each of the funds of the Trust (the “Borrowers”), has entered into an agreement (the “Agreement”) with State Street Bank and Trust Company (the “Bank”), subject to annual renewal. The Agreement provides for a revolving credit facility (the “Credit Facility”) for the amount of $250,000,000 to be utilized for temporary or emergency purposes to fund shareholder redemptions or other short-term liquidity purposes.
Principal on each outstanding loan made under the Agreement bears interest at a variable rate per annum equal to the higher of (a) the Federal Funds Rate as in effect of that day (not less than zero) plus 1.25% or (b) the One-Month London Interbank Offered Rate as in effect on that day (not less than zero) plus 1.25%. In addition, effective August 12, 2016, the Borrowers shall pay to the Bank a commitment fee at the rate of 0.22% per annum on the daily unused portion of the Credit Facility, as applicable, which is allocated among the Borrowers in such manner as is determined by the Board to be reasonable. During the period November 1, 2015 to August 11, 2016, the commitment fee rate was 0.18%, per annum. For each Fund that borrowed under the Credit Facility during the fiscal year, the following table shows the average outstanding daily balance for the Fund under the Credit Facility and the average weighted interest rate paid by the Fund during the fiscal year.
| Average Outstanding Daily Balance | Average Weighted Interest Rate | Days Utilized | ||||||||||
Asia Bond Fund | $ | 1,866,208 | 1.5% | 26 | ||||||||
Emerging Markets Debt Fund | 751,619 | 1.6% | 8 | |||||||||
Global Unconstrained Fixed Income Fund | 150,000 | 1.6% | 1 | |||||||||
10. Fund Reorganization
Effective August 15, 2016, the Emerging Markets Debt Fund acquired all of the assets and assumed all of the liabilities of the Emerging Markets Debt Local Currency Fund. The acquisition was accomplished by a tax-free exchange as follows:
1,457,186 shares of the Emerging Markets Debt Local Currency Fund, fair valued at $11,479,980 for 1,177,180 shares of the Emerging Markets Debt Fund.
The investment portfolio and cash of the Emerging Markets Debt Local Currency Fund with a fair value of $11,479,980 were the principal assets acquired by the Emerging Markets Debt Fund. For financial reporting purposes, assets received and shares issued by the Emerging Markets Debt Fund were recorded at value; however, the cost basis of the investments received from the Emerging Markets Debt Local Currency Fund was carried forward to align ongoing reporting of the Emerging Market Debt Fund’s realized and unrealized gains and losses with amounts distributable to shareholders for tax purposes. The Emerging Market Debt Fund acquired capital loss carryovers of $1,839,338 (subject to future annual limitations). Immediately prior to the reorganization, the net assets of the Emerging Markets Debt Local Currency Fund were $11,479,980.
Assuming that the Emerging Markets Debt Fund reorganization had been completed on November 1, 2015, the pro forma results of operations for the year ended October 31, 2016 are as follows:
Net investment income | $ | 2,285,931 | ||
Net realized and unrealized loss from investments | (1,102,222 | ) | ||
Net increase in net assets resulting from operations | 1,183,709 |
Annual Report 2016
74
Notes to Financial Statements (concluded)
October 31, 2016
Because the combined investment portfolios have been managed as a single integrated portfolio since the reorganization was completed, it is not practical to separate the amounts of revenue and earnings of the Emerging Markets Debt Local Currency Fund that have been reflected in the statements of operations since August 15, 2016 for the Emerging Markets Debt Fund.
The chart below shows a summary of net assets, shares outstanding, net asset value per share, net unrealized appreciation/(depreciation), and accumulated net realized gains/(losses), before and after the reorganization.
Before Reorganization | After Reorganization | |||||||||||
| Emerging Markets Debt Local Currency Fund | Emerging Markets Debt Fund | Emerging Markets Debt Fund | ||||||||||
| Net Assets: | ||||||||||||
Class A/Class A | $ | 42,840 | $ | 53,173 | $ | 96,014 | ||||||
Class C/Class C | 116,997 | 367,693 | 484,690 | |||||||||
Class R/Class R | 1,329,234 | 10,968 | 1,340,208 | |||||||||
Institutional Service Class/ Institutional Service Class | 8,657 | 11,177 | 19,834 | |||||||||
Institutional Class/ Institutional Class | 9,982,250 | 6,917,995 | 16,900,241 | |||||||||
| Shares Outstanding: | ||||||||||||
Class A/Class A | 5,472 | 5,453 | 9,847 | |||||||||
Class C/Class C | 15,250 | 37,852 | 49,896 | |||||||||
Class R/Class R | 171,776 | 1,126 | 137,560 | |||||||||
Institutional Service Class/ Institutional Service Class | 1,096 | 1,144 | 2,031 | |||||||||
Institutional Class/ Institutional Class | 1,263,591 | 709,264 | 1,732,685 | |||||||||
| Net Asset Value per Share: | ||||||||||||
Class A/Class A | $ | 7.83 | $ | 9.75 | $ | 9.75 | ||||||
Class C/Class C | 7.67 | 9.71 | 9.71 | |||||||||
Class R/Class R | 7.74 | 9.74 | 9.74 | |||||||||
Institutional Service Class/ Institutional Service Class | 7.90 | 9.77 | 9.77 | |||||||||
Institutional Class/ Institutional Class | 7.90 | 9.75 | 9.75 | |||||||||
Net unrealized appreciation/(depreciation) | (719,124 | ) | 212,572 | (506,552 | ) | |||||||
Accumulated net realized gain/(loss) | (1,333,801 | ) | (1,635,568 | ) | (2,969,369 | ) | ||||||
Subsequent to the effective date of the reorganization, the Adviser agreed to reimburse the Emerging Markets Debt Fund $65,833 related to transaction costs from the rebalancing of the investment portfolios.
11. Subsequent Events
Management has evaluated the need for disclosures and/or adjustments resulting from subsequent events through the date the financial statements were issued. Based on this evaluation, no disclosures and/or adjustments were required to the financial statements as of October 31, 2016.
2016 Annual Report
75
Report of Independent Registered Public Accounting Firm
The Board of Trustees and Shareholders of Aberdeen Funds:
We have audited the accompanying statements of assets and liabilities, including the statements of investments, of the Aberdeen Asia Bond Fund, Aberdeen Emerging Markets Debt Fund, Aberdeen Global Unconstrained Fixed Income Fund (formerly Aberdeen Global Fixed Income Fund), and Aberdeen Tax-Free Income Fund, four of the funds comprising Aberdeen Funds (the “Funds”), as of October 31, 2016, and the related statements of operations for the year then ended, the statements of changes in net assets for each of the years in the two-year period then ended, and the financial highlights for each of the years or periods presented. These financial statements and financial highlights are the responsibility of the Funds’ management. Our responsibility is to express an opinion on these financial statements and financial highlights based on our audits.
We conducted our audits in accordance with the standards of the Public Company Accounting Oversight Board (United States). Those standards require that we plan and perform the audit to obtain reasonable assurance about whether the financial statements and financial highlights are free of material misstatement. An audit includes examining, on a test basis, evidence supporting the amounts and disclosures in the financial statements. Our procedures included confirmation of securities owned as of October 31, 2016, by correspondence with custodians and brokers, or by other appropriate auditing procedures. An audit also includes assessing the accounting principles used and significant estimates made by management, as well as evaluating the overall financial statement presentation. We believe that our audits provide a reasonable basis for our opinion.
In our opinion, the financial statements and financial highlights referred to above present fairly, in all material respects, the financial position of the Funds as of October 31, 2016, the results of their operations, changes in their net assets for each of the years in the two-year period then ended and the financial highlights for each of the years or periods presented, in conformity with U.S. generally accepted accounting principles.

Philadelphia, Pennsylvania
December 29, 2016
Annual Report 2016
76
Other Tax Information (Unaudited)
For the period ended October 31, 2016, certain dividends paid by the Funds may be subject to a maximum tax rate of 15% as provided for by the Jobs and Growth Tax Relief Reconciliation Act of 2003. The Funds intend to designate the maximum amount allowable as taxed at a maximum rate of 15%. Complete information will be reported in conjunction with your 2016 Form 1099-DIV.
The Funds intend to elect to pass through to their shareholders the credit for taxes paid in foreign countries during its fiscal year ended October 31, 2016. In accordance with the current tax laws, the foreign income and foreign tax per share (for a share outstanding as of October 31, 2016) was as follows:
| Fund | Foreign Tax | |||
Asia Bond Fund | $ | 0.0620 | ||
2016 Annual Report
77
Shareholder Expense Examples (Unaudited)
As a shareholder of the Aberdeen Funds, you incur two types of costs: (1) transaction costs, including sales charges (loads) paid on purchase payments and (2) ongoing costs, including investment advisory fees, administration fees, transfer agent out-of-pocket expenses, distribution fees and other Fund expenses. The examples below are intended to help you understand your ongoing costs (in dollars) of investing in the Aberdeen Funds and to compare these costs with the ongoing costs of investing in other mutual funds.
The examples assume that you had a $1,000 investment in the Class at the beginning of the reporting period, May 1, 2016 and continued to hold your shares at the end of the reporting period, October 31, 2016.
Actual Expenses
The table below provides information about actual account values and actual expenses. You may use the information together with the amount you invested, to estimate the expenses that you paid over the period. Simply divide your account value by $1,000 (for example, an $8,600 account value divided by $1,000 = 8.6), then multiply the result by the number under the heading entitled “Actual Expenses Paid During Period” for the class of a Fund that you own to estimate the expenses you paid on your account during the period.
Hypothetical Example for Comparison Purposes
The table below provides information about hypothetical account values and hypothetical expenses based on the Class’ actual expense ratio and an assumed rate of return of 5% per year before expenses, which is not the Class’ actual return. The hypothetical account values and expenses may not be used to estimate the actual ending account balance or expenses you paid for the period. You may use this information to compare the ongoing costs of investing in the Class of a Fund and other funds. To do so, compare the 5% hypothetical example with the 5% hypothetical examples that appear in the shareholder reports of the other funds.
Please note that the expenses shown in the table are meant to highlight your ongoing costs only and do not reflect any transaction costs, such as sales charges (loads). Therefore, the information for each Class in the table is useful in comparing ongoing costs only, and will not help you determine the relative total costs of owning different funds. In addition, if these transaction costs were included, your costs would have been higher. The examples also assume all dividends and distributions have been reinvested.
| Beginning Account Value, May 1, 2016 | Actual Ending Account Value, October 31, 2016 | Hypothetical Ending Account Value | Actual Expenses Paid During Period* | Hypothetical Expenses Paid During Period*1 | Annualized Expense Ratio** | |||||||||||||||||||||
Asia Bond Fund | Class A | $ | 1,000.00 | $ | 1,018.00 | $ | 1,020.26 | $ | 4.92 | $ | 4.93 | 0.97% | ||||||||||||||
Class C | 1,000.00 | 1,014.20 | 1,016.54 | 8.66 | 8.67 | 1.71% | ||||||||||||||||||||
Class R | 1,000.00 | 1,017.10 | 1,019.10 | 6.08 | 6.09 | 1.20% | ||||||||||||||||||||
Institutional Service Class | 1,000.00 | 1,019.00 | 1,020.86 | 4.31 | 4.32 | 0.85% | ||||||||||||||||||||
Institutional Class | 1,000.00 | 1,020.90 | 1,021.62 | 3.56 | 3.56 | 0.70% | ||||||||||||||||||||
Emerging Markets | Class A | 1,000.00 | 1,084.70 | 1,019.10 | 6.29 | 6.09 | 1.20% | |||||||||||||||||||
Class C | 1,000.00 | 1,080.40 | 1,015.53 | 9.99 | 9.68 | 1.91% | ||||||||||||||||||||
Class R | 1,000.00 | 1,083.60 | 1,018.10 | 7.33 | 7.10 | 1.40% | ||||||||||||||||||||
Institutional Service Class | 1,000.00 | 1,085.80 | 1,020.61 | 4.72 | 4.57 | 0.90% | ||||||||||||||||||||
Institutional Class | 1,000.00 | 1,085.80 | 1,016.99 | 8.49 | 8.21 | 1.62% | ||||||||||||||||||||
Global Unconstrained Fixed Income Fund | Class A | 1,000.00 | 1,026.30 | 1,019.41 | 5.81 | 5.79 | 1.14% | |||||||||||||||||||
Class C | 1,000.00 | 1,022.60 | 1,015.84 | 9.41 | 9.37 | 1.85% | ||||||||||||||||||||
Institutional Service Class | 1,000.00 | 1,027.30 | 1,020.26 | 4.94 | 4.93 | 0.97% | ||||||||||||||||||||
Institutional Class | 1,000.00 | 1,027.10 | 1,020.86 | 4.33 | 4.32 | 0.85% | ||||||||||||||||||||
Tax-Free Income Fund | Class A | 1,000.00 | 1,002.50 | 1,020.71 | 4.43 | 4.47 | 0.88% | |||||||||||||||||||
Class C | 1,000.00 | 997.80 | 1,016.99 | 8.14 | 8.21 | 1.62% | ||||||||||||||||||||
Class R | 1,000.00 | 1,001.20 | 1,019.51 | 5.63 | 5.69 | 1.12% | ||||||||||||||||||||
Institutional Service Class | 1,000.00 | 1,003.90 | 1,022.02 | 3.12 | 3.15 | 0.62% | ||||||||||||||||||||
Institutional Class | 1,000.00 | 1,003.80 | 1,022.02 | 3.12 | 3.15 | 0.62% | ||||||||||||||||||||
| * | Expenses are equal to the Fund’s annualized expense ratio multiplied by the average account value over the period multiplied by 184/366 (to reflect the one-half year period). |
| ** | The expense ratio presented represents a six-month, annualized ratio. |
| 1 | Represents the hypothetical 5% return before expenses. |
Annual Report 2016
78
Supplemental Information (Unaudited)
Board of Trustees’ Consideration of Advisory
At an in-person meeting of the Board of Trustees (the “Board” or the “Trustees”) of the Aberdeen Funds (the “Trust”) held on June 15, 2016, the Board, including a majority of the Trustees who are not considered to be “interested persons” of the Trust (the “Independent Trustees”) under the Investment Company Act of 1940, as amended (the “1940 Act”), approved for an annual period the continuation of the Trust’s advisory agreement (the “Advisory Agreement”) with Aberdeen Asset Management Inc. (“AAMI”) and the applicable sub-advisory agreements (each a “Sub-Advisory Agreement,” and collectively with the Advisory Agreement, the “Agreements”) between: (i) AAMI and Aberdeen Asset Management Asia Limited (“AAMAL”) and (ii) AAMI and Aberdeen Asset Managers Limited (“AAML”) (each a “Sub-Adviser,” and collectively, the “Sub-Advisers”) for each of the following series of the Trust: Aberdeen Asia Bond Fund, Aberdeen Emerging Markets Debt Fund, Aberdeen Global Unconstrained Fixed Income Fund (formerly Aberdeen Global Fixed Income Fund) and Aberdeen Tax- Free Income Fund, (each a “Fund,” and collectively the “Funds”). AAMAL and AAML are affiliates of AAMI. AAMI and the Sub-Advisers are sometimes referred to collectively as the “Advisers.”
In connection with contract review meetings, the Board reviews a variety of information provided by the Advisers relating to the Funds, the Agreements and the Advisers, including comparative performance, fee and expense information and other information regarding the nature, extent and quality of services provided by the Advisers under their respective Agreements. The materials provided to the Board generally included, among other items: (i) information on the investment performance of the Funds and the performance of peer groups of funds and the Funds’ performance benchmarks; (ii) information on the Funds’ advisory fees and other expenses, including information comparing each Fund’s expenses to those of a peer group of funds and information about any applicable expense limitations and fee “breakpoints”; (iii) sales and redemption data with respect to each Fund; (iv) information about the profitability of the Agreements to the Advisers; (v) a report prepared by the Advisers in response to a request submitted by the Independent Trustees’ independent legal counsel on behalf of such Trustees; and (vi) a memorandum from the Independent Trustees’ independent legal counsel on the responsibilities of the Board in considering for approval the investment advisory and investment sub-advisory arrangements under the 1940 Act and Delaware law. The Board, including the Independent Trustees, also considers other matters such as: (i) the Advisers’ financial results and financial condition; (ii) each Fund’s investment objective and strategies; (iii) the Advisers’ investment personnel and operations; (iv) arrangements relating to the distribution of the Funds’ shares and the related costs; (v) the procedures employed to determine the value of the Funds’ assets; (vi) the allocation of the Funds’ brokerage, if any, including, if applicable, allocations to brokers affiliated with the Advisers and the use, if any, of “soft” commission dollars to pay Fund expenses and to pay for research and other similar services; (vii) the resources devoted to, and the record of compliance with, the Funds’ investment policies and restrictions, policies on personal securities transactions and other compliance policies; and (viii) possible conflicts of interest. The Board also considers the nature, extent and quality of the services provided to the Funds by AAMI’s affiliates. Throughout the process, the Trustees are afforded the opportunity to ask questions of and request additional materials from AAMI and the Sub-Advisers.
In addition to the materials requested by the Trustees in connection with their annual consideration of the continuation of the Agreements, the Trustees receive materials in advance of each regular quarterly meeting of the Board that provide information relating to the services provided by the Advisers, including detailed information about the Funds’ investment performance. This information generally includes, among other things, third-party performance rankings for various periods (including prior to the Advisers’ management of the Funds, to the extent applicable) comparing each Fund against its peer group, total return information for various periods, and details of sales and redemptions of Fund shares for the period. The Board also receives periodic presentations from the portfolio management teams in connection with the performance of the Funds.
The Independent Trustees were advised by separate independent legal counsel throughout the process. The Independent Trustees also consulted in executive sessions with counsel to the Independent Trustees regarding consideration of the renewal of the Agreements. In considering whether to approve the continuation of the Agreements, the Board of Trustees, including the Independent Trustees, did not identify any single factor as determinative. Individual Trustees may have evaluated the information presented differently from one another, giving different weights to various factors. Matters considered by the Trustees, including the Independent Trustees, in connection with their approval of the continuation of the Agreements included the factors listed below.
The nature, extent and quality of the services provided to the Funds under the Agreements. The Trustees considered the nature, extent and quality of the services provided by AAMI and the Sub-Advisers, as applicable, to the Funds and the resources dedicated to the Funds by AAMI and its affiliates. The Board considered, among other things, the Advisers’ investment experience. The Board also considered the background and experience of the Advisers’ senior management personnel and the qualifications, background and responsibilities of the portfolio managers that are primarily responsible for the day-to-day portfolio management services for the Funds. The Board also considered the allocation of responsibilities among the Advisers. The Trustees considered not only the advisory services provided by AAMI to the Funds, but also the administrative services provided by AAMI to the Funds under a separate administration agreement. AAMI’s role in coordinating the activities of the Trust’s other service providers was also considered. The Board also considered that it receives information on a regular basis from the Trust’s Chief Compliance Officer regarding the Advisers’ compliance policies and procedures. The Board also considered the Advisers’ risk management
2016 Annual Report
79
Supplemental Information (Unaudited) (continued)
processes. The Board was also mindful of the Advisers’ focus on the monitoring of the performance of the Funds and in addressing performance matters. The Trustees also considered the benefits to shareholders of investing in a mutual fund that is part of a family of funds that offers shareholders the right to exchange shares of one type of fund for shares of another type of fund, and provides a variety of fund and shareholder services. The Board also took into account its knowledge of management and the quality of the performance of management’s duties through Board meetings, discussion and reports during the preceding year.
After reviewing these and related factors, the Board concluded that the nature, extent and quality of the services provided were extensive in nature and of high quality and supported the renewal of the Agreements.
Investment performance of the Funds and the Advisers. The Trustees received information about the performance of the Funds over various time periods, including information which compared the performance of the Funds to the performance of peer groups of funds and each Fund’s performance benchmark. The Trustees also considered that certain of the Funds had changed their respective performance benchmarks to better reflect the respective Fund’s investment strategy. The Trustees also considered the performance of the Funds compared to the performance of comparable funds or accounts managed by AAMI and its affiliates to the extent available. In addition, the Trustees also reviewed data prepared by an independent third party which analyzed the performance of the Funds using a variety of performance metrics.
The Trustees also considered AAMI’s and the Sub-Advisers’ performance and reputation generally, the performance of the fund family generally, the historical responsiveness of AAMI to Trustee concerns about performance and the willingness of AAMI and the Sub-Advisers to take steps intended to improve performance. The Trustees also considered the performance of the Advisers since they commenced management of the Funds.
Based on these factors, the Board determined that the Advisers are appropriate investment advisers for the Funds.
The Board further noted that it will continue to monitor the Funds’ performance and any actions taken by AAMI and its affiliates relating to performance.
The costs of the services provided and profits realized by the Advisers and their affiliates from their relationships with the Funds. The Trustees considered the fees charged to the Funds for advisory services as well as the total expense levels of the Funds. This information included comparisons (provided both by management and also by an independent third party) of each Fund’s net management fee and total expense level to those of its expense peer group and information about the advisory fees charged by AAMI to any separately managed accounts with a similar strategy. In comparing each Fund’s net management fee to that of comparable funds, the Board noted that such fee includes both advisory and administrative fees. In considering the fees charged to any comparable accounts, the Trustees considered, among other things, management’s discussion of the different objectives, policies or restrictions that may be involved in managing the different types of accounts. In evaluating the Funds’ advisory fees, the Trustees also took into account the demands, complexity and quality of the investment management of the Funds.
The Trustees also noted that the sub-advisory fees, as applicable, for the Funds would be paid by AAMI out of its advisory fee, not by the Funds. The Board also considered that AAMI had entered into expense limitation agreements with the Funds, pursuant to which AAMI agreed to waive a portion of its advisory fee and/or reimburse certain expenses as a means of limiting each Fund’s total annual operating expenses for a period of time.
The Trustees also considered the compensation directly or indirectly received by AAMI and its affiliates from their relationships with the Funds. The Trustees reviewed information provided by management as to the profitability of AAMI and its affiliates’ relationships with the Funds, such as the engagement of affiliates of AAMI to provide distribution and administrative services to the Funds. The Trustees also examined the profitability of AAMI and its affiliates on a Fund-by-Fund basis. The Trustees also considered information about the allocation of expenses used to calculate profitability. When reviewing profitability, the Trustees also considered information about court cases regarding adviser profitability, the performance of the Funds, the expense levels of the Funds, and whether AAMI had implemented breakpoints and expense limitations with respect to the Funds.
After reviewing these and related factors, including taking into account management’s discussion regarding Fund expenses, the Board concluded that the advisory fee, and as applicable, the sub-advisory fees, were fair and reasonable, and that the costs of these services generally and the related profitability of AAMI and its affiliates from their relationships with the Funds were reasonable and supported the renewal of the Agreements.
Economies of Scale. The Trustees considered the existence of any economies of scale in the provision of services by AAMI and the Sub-Advisers and whether those economies would be shared with the Funds through breakpoints in the investment advisory fees or other means, such as expense waivers or limitations. The Trustees noted that each of the Funds was subject to an expense limitation and considered that certain Funds were subject to breakpoints. The Board noted management’s discussion of the Funds’ advisory fee structure. The Trustees also took note of the
Annual Report 2016
80
Supplemental Information (Unaudited) (concluded)
costs of the services provided and the profitability to AAMI and its affiliates from their relationships with the Funds, as discussed above. The Board also considered the potential effect of each Fund’s growth and size on fees, noting that if a Fund’s assets increase over time, the Fund may realize other economies of scale if assets increase proportionally more than certain expenses.
After reviewing these and related factors, the Board concluded that the advisory fee, and as applicable, sub-advisory fees, were reasonable and supported the renewal of the Agreements.
The Trustees also considered other factors, which included but were not limited to the following:
| • | the effect of any market and economic volatility on the performance, asset levels and expense ratios of the Funds. |
| • | whether the Funds have operated in accordance with their investment objectives and the Funds’ record of compliance with their investment restrictions, and the compliance programs of the Trust and AAMI. The Trustees also considered the compliance-related resources AAMI and its affiliates were providing to the Funds. |
| • | the nature, quality, cost and extent of administrative services performed by AAMI under the Advisory Agreement and under a separate agreement covering administrative services. |
| • | so-called “fallout benefits” to AAMI, such as the benefits of research made available to AAMI by reason of brokerage commissions generated by the Funds’ securities transactions or reputational and other indirect benefits. The Trustees considered any possible conflicts of interest associated with these fallout and other benefits, and the reporting, disclosure and other processes in place to disclose and monitor such possible conflicts of interest. |
* * *
Based on their evaluation of all factors that they deemed to be material, including those factors described above, and assisted by the advice of independent counsel, the Trustees, including the Independent Trustees, concluded that renewal of the Agreements would be in the best interest of each of the Funds and its shareholders. Accordingly, the Board, and the Independent Trustees voting separately, approved the Agreements for an additional one-year period.
2016 Annual Report
81
Management of the Funds (Unaudited)
As of October 31, 2016
| Name, Address, and Year of Birth | Position(s) Held, Length of Time Served and Term of Office* | Principal Occupation During Past 5 Years | Number of Portfolios in Fund Complex Overseen by Trustee** | Other Directorships Held by Trustee During Past 5 Years*** | ||||
Trustees who are not interested persons (as defined in the 1940 act) of the trust (“Independent Trustees”) | ||||||||
P. Gerald Malone**** Year of Birth: 1950 | Trustee since December 2007 Chairman of the Board | Mr. Malone is, by profession, a solicitor of some 40 years standing. He has served as a Minister of State in the United Kingdom Government. Mr. Malone currently serves as Independent Chairman of two UK companies, Crescent OTC Ltd (pharmaceutical services) and fluidOil Ltd. (oil services). He also serves as a director of US company Rejuvenan llc (wellbeing services). He previously served as chairman of Ultrasis plc (healthcare software services company) until October 2014. He is Chairman of the Board of Trustees of Aberdeen Funds, Chairman of the Board of Directors of Aberdeen Global Income Fund, Inc. and Aberdeen Asia-Pacific Income Fund, Inc. and serves on the boards of Aberdeen Australia Equity Fund, Inc. and Aberdeen Asia-Pacific Income Investment Company Limited. | 23 | None. | ||||
Richard H. McCoy**** Year of Birth: 1942 | Trustee since December 2007 | Prior to retiring in 2003, Mr. McCoy was Vice-Chairman, Investment Banking, at TD Securities Inc. He is currently a Director of Uranium Participation Corp. and Pizza Pizza Royalty Corp. and Chair of Chorus Aviation Inc. Mr. McCoy has also been Chairman of Aberdeen Asia-Pacific Income Investment Company Limited since 2010. | 20 | None. | ||||
Neville J. Miles**** Year of Birth: 1946 | Trustee since December 2011 | Mr. Miles is, and has been for over ten years, Chairman of Ballyshaw Pty. Ltd. (share trading, real estate development and investment). He is Chairman of the Board of Directors of Aberdeen Australia Equity Fund, Inc. He also is a non-executive director of a number of Australian and overseas companies. | 22 | None. | ||||
Rahn K. Porter**** Year of Birth: 1954 | Trustee since September 2016 | Mr. Porter has been the Chief Financial and Administrative Officer of The Colorado Health Foundation since 2013, and was the Interim Chief Executive Officer of The Colorado Health Foundation from 2014 to 2015. Previously, he was Senior Vice President and Treasurer, Qwest Communications International Inc. (telecommunications) from 2008 to 2011. Mr. Porter serves on the boards of Aberdeen Singapore Fund, Inc. and Aberdeen Japan Equity Fund, Inc. | 21 | Director, CenturyLink Asset Management Company, since 2006; Director, BlackRidge Financial Inc., since March, 2005. | ||||
Annual Report 2016
82
Management of the Funds (Unaudited) (continued)
As of October 31, 2016
| Name, Address, and Year of Birth | Position(s) Held, Length of Time Served and Term of Office* | Principal Occupation During Past 5 Years | Number of Portfolios in Fund Complex Overseen by Trustee** | Other Directorships Held by Trustee During Past 5 Years*** | ||||
Steven N. Rappaport**** Year of Birth: 1948 | Trustee since September 2016 | Mr. Rappaport has been a Partner of Lehigh Court, LLC (private investment firm) and RZ Capital LLC (private investment firm) since 2004. Mr. Rappaport serves on the boards of Aberdeen Indonesia Fund, Inc., Aberdeen Israel Fund, Inc., Aberdeen Latin America Equity Fund, Inc., Aberdeen Chile Fund, Inc. and Aberdeen Emerging Markets Smaller Company Opportunities Fund, Inc. | 24 | Director of iCAD, Inc., since 2006; Director of Credit Suisse Funds (9) since 1999; Director of Credit Suisse Asset Management Income Fund, Inc. since 2005 and Director of Credit Suisse High Yield Bond Fund, Inc. since 2005. | ||||
Peter D. Sacks**** Year of Birth: 1945 | Trustee since December 2007 | Mr. Sacks has been a Director and Founding Partner of Toron AMI International Asset Management (formerly, Toron Investment Management) (investment management) since 1988. He is also a Director and Investment Advisory Committee member of several private and public sector funds in Canada. | 22 | None. | ||||
John T. Sheehy**** Year of Birth: 1942 | Trustee since December 2007 | Mr. Sheehy has been a Senior Managing Director of B.V. Murray and Company (investment banking) since 2001 and Director of Macquarie AIR-serv Holding, Inc. (automotive services) from 2006 to 2013. He was a Managing Member of Pristina Capital Partners, LLC (water purification technology development) from 2007 to 2011 and a Director of Smarte Carte, Inc. (airport services) from 2007 to 2010. | 23 | None. | ||||
Warren C. Smith**** Year of Birth: 1955 | Trustee since December 2007 | Mr. Smith has been a founding partner of MRB Partners Inc. (independent investment research and consultancy firm) since 2010. Mr. Smith was a Managing Editor with The Bank Credit Analyst Research Group (independent publishers of financial market research and publications, including The Bank Credit Analyst) from 1982 to 2009. | 20 | None. |
2016 Annual Report
83
Management of the Funds (Unaudited) (continued)
As of October 31, 2016
| Name, Address, and Year of Birth | Position(s) Held, Length of Time Served and Term of Office* | Principal Occupation During Past 5 Years | Number of Portfolios in Fund Complex Overseen by Trustee** | Other Directorships Held by Trustee During Past 5 Years*** | ||||
Trustees who are Interested Persons (as defined in the 1940 Act) of the Trust (“Interested Trustees”) | ||||||||
Martin Gilbert****† Year of Birth: 1955 | Trustee since December 2007 | Mr. Gilbert is a founding director and shareholder, and Chief Executive of Aberdeen Asset Management PLC, the holding company of the fund management group that was established in 1983 (“Aberdeen Group”). He was a Director (1991–2014) of Aberdeen Asset Management Asia Limited and a Director (2000–2014) of Aberdeen Asset Management Limited. He was a Director (1995–2014) and was President (September 2006–2014) of Aberdeen Asset Management Inc. Mr. Gilbert also serves as officer and/or director of various Aberdeen Group subsidiary companies, Aberdeen-managed investment trusts and funds’ boards. | 24 | None. | ||||
| * | Each Trustee holds office for an indefinite term until his successor is elected and qualified. |
| ** | The Aberdeen Fund Complex consists of the Trust which currently consists of [19] portfolios, Aberdeen Asia-Pacific Income Fund, Inc., Aberdeen Global Income Fund, Inc., Aberdeen Australia Equity Fund, Inc., Aberdeen Chile Fund, Inc., Aberdeen Israel Fund, Inc., Aberdeen Indonesia Fund, Inc., Aberdeen Latin America Equity Fund, Inc., Aberdeen Emerging Markets Smaller Company Opportunities Fund, Inc., Aberdeen Singapore Fund, Inc., The Asia Tigers Fund, Inc., The India Fund, Inc., Aberdeen Greater China Fund, Inc., Aberdeen Japan Equity Fund, Inc. and Aberdeen Investment Funds. |
| *** | Directorships held in (1) any other investment companies registered under the 1940 Act, (2) any company with a class of securities registered pursuant to Section 12 of the Securities Exchange Act of 1934, as amended (the “Exchange Act”) or (3) any company subject to the requirements of Section 15(d) of the Exchange Act. |
| **** | Each Trustee may be contacted by writing to the Trustee c/o Aberdeen Asset Management Inc., 1735 Market Street, 32nd Floor, Philadelphia, Pennsylvania 19103, Attn: Alan Goodson. |
| † | Mr. Gilbert is considered to be an “interested person” of the Trust as defined in the 1940 Act because of his affiliation with the Adviser. |
Annual Report 2016
84
Management of the Funds (Unaudited) (continued)
As of October 31, 2016
Officers of the Trust
| Name, Address, and Year of Birth | Position(s) Held, Length of Time Served and Term of Office* | Principal Occupation During Past 5 Years | ||
Bev Hendry** Aberdeen Asset Management Inc. 1735 Market Street 32nd Floor Philadelphia, PA 19103 Year of Birth: 1953 | President, Chief Executive Officer and Principal Executive Officer (Since September 2014) | Currently, Co-Head of Americas and Director for Aberdeen Asset Management Inc. since June 2014. He first joined Aberdeen in 1987 and helped establish Aberdeen’s business in the Americas in Fort Lauderdale. Mr. Hendry left Aberdeen in 2008 when the company moved to consolidate its headquarters in Philadelphia. Mr. Hendry re-joined Aberdeen from Hansberger Global Investors in Fort Lauderdale, Florida, where he worked for six years as Chief Operating Officer. | ||
Jeffrey Cotton** Aberdeen Asset Management Inc. 1735 Market Street 32nd Floor Philadelphia, PA 19103 Year of Birth: 1977 | Vice President and Chief Compliance Officer (Since March 2011) | Currently, Director, Vice President and Head of Compliance–Americas for Aberdeen Asset Management Inc. Mr. Cotton joined Aberdeen in 2010. Prior to joining Aberdeen, Mr. Cotton was a Senior Compliance Officer at Old Mutual Asset Management (2009-2010) supporting its affiliated investment advisers and mutual fund platform. Mr. Cotton was also a Vice President and Senior Compliance Manager at Bank of America/Columbia Management (2006-2009). | ||
Andrea Melia** Aberdeen Asset Management Inc. 1735 Market Street 32nd Floor Philadelphia, PA 19103 Year of Birth: 1969 | Treasurer, Chief Financial Officer, and Principal Accounting Officer (Since September 2009) | Currently, Vice President and Head of Fund Administration for Aberdeen Asset Management Inc. (since 2009). Prior to joining Aberdeen, Ms. Melia was Director of Fund Administration and accounting oversight for Princeton Administrators LLC, a division of BlackRock Inc. and had worked with Princeton Administrators since 1992. | ||
Megan Kennedy** Aberdeen Asset Management Inc. 1735 Market Street 32nd Floor Philadelphia, PA 19103 Year of Birth: 1974 | Secretary and Vice President (Since September 2009) | Currently, Head of Product Management for Aberdeen Asset Management Inc. Ms. Kennedy joined Aberdeen Asset Management Inc. in 2005 as a Senior Fund Administrator. Ms. Kennedy was promoted to Assistant Treasurer Collective Funds/North American Mutual Funds in February 2008 and promoted to Treasurer Collective Funds/North American Mutual Funds in July 2008. | ||
Lucia Sitar** Aberdeen Asset Management Inc. 1735 Market Street 32nd Floor Philadelphia, PA 19103 Year of Birth: 1971 | Vice President (Since December 2008) | Currently, Vice President and Managing U.S. Counsel for Aberdeen Asset Management Inc. Ms. Sitar joined Aberdeen Asset Management Inc. in July 2007. |
2016 Annual Report
85
Management of the Funds (Unaudited) (continued)
As of October 31, 2016
| Name, Address, and Year of Birth | Position(s) Held, Length of Time Served and Term of Office* | Principal Occupation During Past 5 Years | ||
Brad Crombie Aberdeen Asset Management Bow Bells House 1 Bread Street London EC4M 9HH Year of Birth: 1970 | Vice President (Since June 2013) | Currently, Global Head of Fixed Income for Aberdeen Asset Management PLC. Mr. Crombie re-joined Aberdeen in 2012. Prior to re-joining Aberdeen, Mr. Crombie was a Managing Director at Bank of America Merrill Lynch for the bank’s non-financial corporate and high yield credit research team for the Europe, Middle East and Africa region from 2003 to 2012. | ||
Alan Goodson** Aberdeen Asset Management Inc. 1735 Market Street 32nd Floor Philadelphia, PA 19103 Year of Birth: 1974 | Vice President (Since March 2009) | Currently, Head of Product–US, overseeing Product Management, Product Development and Investor Services for Aberdeen’s registered and unregistered investment companies in the US and Canada. Mr. Goodson is Director and Vice President of Aberdeen Asset Management Inc. and joined Aberdeen in 2000. | ||
Adam McCabe** Aberdeen Asset Management Asia Limited 21 Church Street #01-01 Capital Square Two Singapore 049480 Year of Birth: 1979 | Vice President (Since March 2010) | Currently, Head of Asian Fixed Income on the Fixed Income–Asia Pacific desk, responsible for currency and interest rate strategies in Aberdeen’s Asian fixed income portfolios. Mr. McCabe joined Aberdeen in 2009 following the acquisition of certain asset management businesses from Credit Suisse. Mr. McCabe worked for Credit Suisse since 2001, where he was an investment manager responsible for the development and implementation of its Asian currency and interest rate strategies. | ||
Jennifer Nichols** Aberdeen Asset Management Inc. 1735 Market Street 32nd Floor Philadelphia, PA 19103 Year of Birth: 1978 | Vice President (Since December 2007) | Currently, Global Head of Legal for Aberdeen Asset Management PLC. Director and Vice President for Aberdeen Asset Management Inc. (since October 2006). | ||
Hugh Young** Aberdeen Asset Management Asia Limited 21 Church Street #01-01 Capital Square Two Singapore 049480 Year of Birth: 1958 | Vice President (Since June 2011) | Currently, Managing Director of Aberdeen Asset Management Asia Limited (since 1991) and member of the Executive Management Committee and Director of Aberdeen Asset Management PLC (since 1991 and 2011, respectively). Mr. Young joined Aberdeen in 1991. | ||
Russell Barlow Aberdeen Asset Management Bow Bells House 1 Bread Street London EC4M 9HH Year of Birth: 1974 | Vice President (Since October 2015) | Currently, Head of Hedge Funds, based in Aberdeen’s London office, chairman of the Hedge Fund Investment Committee, Deputy Chair of the Pan Alternatives Investment Committee and responsible for co-mingled Hedge Fund portfolios. Mr. Barlow joined Aberdeen in 2010 via the acquisition of various asset management businesses from Royal Bank of Scotland where he was the Head of the Global Event Team. |
Annual Report 2016
86
Management of the Funds (Unaudited) (concluded)
As of October 31, 2016
| Name, Address, and Year of Birth | Position(s) Held, Length of Time Served and Term of Office* | Principal Occupation During Past 5 Years | ||
Brian O’Neill** Aberdeen Asset Management Inc. 1735 Market Street 32nd Floor Philadelphia, PA 19103 Year of Birth: 1968 | Assistant Treasurer (Since September 2008) | Currently, Senior Fund Administration Manager–US for Aberdeen Asset Management Inc. Mr. O’Neill joined Aberdeen Asset Management Inc. in 2008. Prior to joining Aberdeen Asset Management Inc., Mr. O’Neill was a Director of Fund Accounting with Nationwide Funds Group (2002-2008). | ||
Eric Olsen** Aberdeen Asset Management Inc. 1735 Market Street 32nd Floor Philadelphia, PA 19103 Year of Birth: 1970 | Assistant Treasurer (Since December 2013) | Currently, Deputy Head of Fund Administration–US for Aberdeen Asset Management Inc. Mr. Olsen joined Aberdeen Asset Management Inc. in August 2013. Prior to joining Aberdeen Asset Management Inc., Mr. Olsen was a Director of Financial Reporting for BNY Mellon Asset Servicing and had worked with BNY Mellon since 1998. |
| * | Each officer holds office for an indefinite term at the pleasure of the Board of Trustees and until his or her successor is elected and qualified. |
| ** | Mr. Hendry, Ms. Melia, Ms. Kennedy, Mr. Goodson, Ms. Nichols, Mr. Cotton, Mr. McCabe, Mr. Young, Ms. Sitar, Mr. Olsen and Mr. O’Neill hold officer position(s) in one or more of the following: Aberdeen Asia-Pacific Income Fund, Inc., Aberdeen Australia Equity Fund, Inc., Aberdeen Global Income Fund, Inc., Aberdeen Chile Fund, Inc., Aberdeen Israel Fund, Inc., Aberdeen Indonesia Fund, Inc., Aberdeen Latin America Equity Fund, Inc., Aberdeen Emerging Markets Smaller Company Opportunities Fund, Inc., Aberdeen Singapore Fund, Inc., The Asia Tigers Fund, Inc., The India Fund, Inc., Aberdeen Greater China Fund, Inc., Aberdeen Japan Equity Fund, Inc. and Aberdeen Investment Funds, each of which may also be deemed to be a part of the same “Fund Complex” as the Trust. |
2016 Annual Report
87
Management Information
Trustees
P. Gerald Malone, Chairman
Martin J. Gilbert
Richard H. McCoy
Neville J. Miles
Rahn K. Porter
Steven N. Rappaport
Peter D. Sacks
John T. Sheehy
Warren C. Smith
Officers
Bev Hendry, President and Chief Executive Officer
Jeffrey Cotton, Chief Compliance Officer and Vice President
Andrea Melia, Treasurer and Chief Financial Officer
Megan Kennedy, Secretary and Vice President
Brad Crombie, Vice President
Lucia Sitar, Vice President
Alan Goodson, Vice President
Adam McCabe, Vice President
Jennifer Nichols, Vice President
Hugh Young, Vice President
Russell Barlow, Vice President
Eric Olsen, Assistant Treasurer
Brian O’Neill, Assistant Treasurer
Investment Manager
Aberdeen Asset Management Inc.
1735 Market Street, 32nd Floor
Philadelphia, PA 19103
Fund Administrator
Aberdeen Asset Management Inc.
1735 Market Street, 32nd Floor
Philadelphia, PA 19103
Transfer Agent
Boston Financial Data Services, Inc.
30 Dan Road
Canton, MA 02021
Distributor
Aberdeen Fund Distributors LLC
1735 Market Street, 32nd Floor
Philadelphia, PA 19103
Sub-Administrator, Custodian & Fund Accountant
State Street Bank and Trust Company
1 Heritage Drive, 3rd Floor
North Quincy, MA 02171
Independent Registered Public Accounting Firm
KPMG LLP
1601 Market Street
Philadelphia, PA 19103
Fund Counsel
Willkie Farr & Gallagher LLP
787 Seventh Avenue
New York, NY 10019
Aberdeen Asset Management Inc. 1735 Market Street, 32nd Floor Philadelphia, PA 19103 aberdeen-asset.us | |
AOE-0143-AR
Item 2. Code of Ethics.
(a) As of October 31, 2016, the Registrant had adopted a code of ethics that applies to the Registrant’s principal executive officer, principal financial officer, principal accounting officer or controller, or persons performing similar functions, regardless of whether these individuals are employed by the Registrant or a third party (the “Code of Ethics”).
(c) There have been no amendments during the period covered by this report to a provision of the Code of Ethics.
(d) During the period covered by the report, the Registrant did not grant any waivers to the provisions of the Code of Ethics.
(f) The Code of Ethics is included with this Form N-CSR as Exhibit 12(a)(1).
Item 3. Audit Committee Financial Expert.
The Registrant’s Board of Trustees has determined that there is at least one member who qualifies as an “audit committee financial expert” serving on its Audit Committee. Mr. Rahn K. Porter is the “audit committee financial expert” and is considered to be an independent” Trustee as each term is defined in Item 3 of Form N-CSR.
Item 4. Principal Accountant Fees and Services.
Fiscal Year Ended | (a) Audit Fees | (b) Audit-Related Fees | (c)1 Tax Fees | (d) All Other Fees | ||||||||||||
October 31, 2016 | $ | 561,500 | $ | 33,000 | $ | 180,000 | $ | — | ||||||||
October 31, 2015 | $ | 593,000 | $ | 16,000 | $ | 172,500 | $ | — | ||||||||
| 1 | The Tax Fees are for the completion of the Registrant’s federal and state tax returns. |
(e)(1) Pre-Approval Policies and Procedures. Except as permitted by Rule 2-01(c)(7)(i)(C) of Regulation S-X, the Registrant’s (hereinafter, the “Trust”) Audit Committee Charter authorizes the Audit Committee (“Committee”) to annually select, retain or terminate the Trust’s independent auditor and, in connection therewith, to evaluate the terms of the engagement and the qualifications and independence of the independent auditor, including whether the independent auditor provides any consulting, auditing or tax services to the investment adviser (hereinafter, the “Adviser”) or a sub-adviser, and to receive the independent auditor’s specific representations as to their independence, delineating all relationships between the independent auditor and the Trust, consistent with PCAOB 3526 or any other applicable auditing standard. PCAOB Rule 3526 requires that, at least annually, the auditor: (1) disclose to the Committee in writing all relationships between the auditor and its related entities and the Trust and its related entities that in the auditor’s professional judgment may reasonably be thought to bear on independence; (2) confirm in its letter that, in its professional judgment, it is independent of the Trust within the meaning of the Securities Acts administered by the SEC; and (3) discuss the auditor’s independence with the Committee. The Committee is responsible for actively engaging in a dialogue with the independent auditor with respect to any disclosed relationships or services that may impact the objectivity and independence of the independent auditor and for taking, or recommending that the full Board take, appropriate action to oversee the independence of the independent auditor. The Committee is also authorized to review in advance, and consider approval of, any and all proposals by management or
the Adviser that the Trust, Adviser or their affiliated persons, employ the independent auditor to render “permissible non-audit services” to the Trust and to consider whether such services are consistent with the independent auditor’s independence. The Committee may delegate to one or more of its members (“Delegates”) authority to pre-approve permissible non-audit services to be provided to the Trust. Any pre-approval determination of a Delegate shall be presented to the full Committee at its next meeting. The Committee shall communicate any pre-approval made by it or a Delegate to the Adviser, who will ensure that the appropriate disclosure is made in the Trust’s periodic reports required by Section 30 of the Investment Company Act of 1940, as amended, and other documents as required under the federal securities laws.
(e)(2) None of the services described in each of paragraphs (b) through (d) of this Item involved a waiver of the pre-approval requirement by the Audit Committee pursuant to Rule 2-01 (c)(7)(i)(C) of Regulation S-X.
(f) Not applicable.
(g) The aggregate non-audit fees billed by the Registrant’s accountant for services to the Registrant and to the Registrant’s investment adviser and all entities controlling, controlled by, or under common control with the Adviser that provide services to the Registrant for the Registrant’s fiscal years ended October 31, 2016 and October 31, 2015 were $1,049,768 and $365,753, respectively.
(h) The Registrant’s Audit Committee of the Board of Trustees has considered whether the provision of non-audit services that were rendered to the Registrant’s investment adviser (not including any sub-adviser whose role is primarily portfolio management and is subcontracted with or overseen by another investment adviser), and any entity controlling, controlled by, or under common control with the investment adviser that provides ongoing services to the Registrant that were not pre-approved pursuant to paragraph (c)(7)(ii) or Rule 2-01 of Regulation S-X is compatible with maintaining the principal accountant’s independence and has concluded that it is.
Item 5. Audit Committee of Listed Registrants.
Not applicable.
Item 6. Investments.
(a) Included as part of the Reports to Shareholders filed under Item 1 of this Form N-CSR.
(b) Not applicable.
Item 7. Disclosure of Proxy Voting Policies and Procedures for Closed-End Management Investment Companies.
Not applicable.
Item 8. Portfolio Managers of Closed-End Management Investment Companies.
Not applicable.
Item 9. Purchases of Equity Securities by Closed-End Management Investment Company and Affiliated Purchasers.
Not applicable.
Item 10. Submission of Matters to a Vote of Security Holders.
During the period ended October 31, 2016, there were no material changes to the procedures by which shareholders may recommend nominees to the Registrant’s Board of Trustees.
Item 11. Controls and Procedures.
(a) The Registrant’s principal executive and principal financial officers, or persons performing similar functions, have concluded that the Registrant’s disclosure controls and procedures (as defined in Rule 30a-3(c) under the Investment Company Act of 1940 (the “Act”) (17 CFR 270.30a-3(c))) are effective, as of a date within 90 days of the filing date of the report that includes the disclosure required by this paragraph, based on the evaluation of these controls and procedures required by Rule 30a-3(b) under the Act (17 CFR 270.30a3(b)) and Rule 13a-15(b) or 15d-15(b) under the Securities Exchange Act of 1934 (17 CFR 240.13a-15(b) or 240.15d15(b)).
(b) There were no changes in the Registrant’s internal control over financial reporting (as defined in Rule 30a-3(d) under the Act (17 CFR 270.30a-3(d))) that occurred during the second fiscal quarter of the period covered by this report that have materially affected, or are reasonably likely to materially affect, the Registrant’s internal control over financial reporting.
Item 12. Exhibits.
(a)(1) The Code of Ethics of the Registrant for the period covered by this report as required pursuant to Item 2 of this Form N-CSR.
(a)(2) Certifications of the Registrant pursuant to Rule 30a-2(a) under the Act are exhibits to this report.
(a)(3) Not applicable.
(b) Certifications of the Registrant pursuant to Rule 30a-2(b) under the Act are exhibits to this report.
SIGNATURES
Pursuant to the requirements of the Securities Exchange Act of 1934 and the Investment Company Act of 1940, the registrant has duly caused this report to be signed on its behalf by the undersigned, thereunto duly authorized.
| Aberdeen Funds | ||
| By: | /s/ Bev Hendry | |
| Bev Hendry | ||
| Principal Executive Officer | ||
| Aberdeen Funds | ||
| Date: January 6, 2017 | ||
Pursuant to the requirements of the Securities Exchange Act of 1934 and the Investment Company Act of 1940, this report has been signed below by the following persons on behalf of the registrant and in the capacities and on the dates indicated.
| By: | /s/ Bev Hendry | |
| Bev Hendry | ||
| Principal Executive Officer | ||
| Aberdeen Funds | ||
| Date: January 6, 2017 | ||
| By: | /s/ Andrea Melia | |
| Andrea Melia | ||
| Principal Financial Officer | ||
| Aberdeen Funds | ||
| Date: January 6, 2017 | ||