UNITED STATES
SECURITIES AND EXCHANGE COMMISSION
Washington, D.C. 20549
FORM N-CSR
CERTIFIED SHAREHOLDER REPORT OF REGISTERED
MANAGEMENT INVESTMENT COMPANIES
Investment Company Act file number:
811-22175
ALPS ETF TRUST
(Exact name of registrant as specified in charter)
1290 Broadway, Suite 1100, Denver, Colorado 80203
(Address of principal executive offices) (Zip code)
Tané Tyler, Esq., Secretary
ALPS ETF Trust
1290 Broadway, Suite 1100
Denver, Colorado 80203
(Name and address of agent for service)
Registrant’s Telephone Number, including Area Code: (303) 623-2577
Date of fiscal year end: November 30
Date of reporting period: December 1, 2011 – May 31, 2012
Item 1. Report to Stockholders.
| | | | |
| | | | 1 |
| Semi-Annual (Unaudited) | May 31, 2012 | |
| | |

| | PERFORMANCE OVERVIEW |
| | May 31, 2012 (Unaudited) |
FUND DESCRIPTION
The Cohen & Steers Global Realty Majors ETF (the “Fund”) seeks investment results that correspond generally to the performance (before the Fund’s fees and expenses) of an equity index called the Cohen & Steers Global Realty Majors Index (the “Index”). The Shares of the Fund are listed and trade on the NYSE Arca under the ticker symbol “GRI.” The Fund will normally invest substantially all of its assets in the 75 stocks that comprise the Cohen & Steers Global Realty Majors Index. The Fund began trading on May 9, 2008.
The Index is a free-float, market-cap-weighted total return index of selected real estate equity securities maintained by Cohen & Steers. It is quoted intraday on a real-time basis by the Chicago Mercantile Exchange under the symbol GRM. The Index’s free-float market capitalization approach and qualitative screening process emphasize companies that the Cohen & Steers Index Committee believes are leading the securitization of real estate globally.
PERFORMANCE OVERVIEW
For the six months ended May 31, 2012 the Fund’s market price increased 6.74% and the Fund’s net asset value (“NAV”) increased 8.20%. Over the same time period the Fund’s benchmark increased 8.65%.
Average Annual Total Return as of May 31, 2012
| | | | | | |
| | | 1 Year | | 3 Year | | Since Inception* |
Fund Performance | | | | | | |
NAV | | -6.30% | | 17.15% | | -4.48% |
Market Price** | | -6.62% | | 17.27% | | -4.42% |
Index Performance | | | | | | |
Cohen & Steers Global Realty Majors Portfolio Index | | -5.67% | | 18.05% | | -3.62% |
FTSE EPRA/NAREIT Developed Real Estate Index | | -6.28% | | 17.03% | | -3.51% |
S&P 500® Total Return Index | | -0.41% | | 14.92% | | -0.30% |
Total Expense Ratio (per the current prospectus) 0.55%.
Performance data quoted represents past performance. Past performance does not guarantee future results. Investment return and principal value of an investment will fluctuate so that an investor’s shares, when sold or redeemed, may be worth more or less than the original cost. Current performance data may be higher or lower than actual data quoted. For most current month-end performance data please visit www.alpsfunds.com.
| | | | | | |
2 | | | | | | |
| | An ALPS Advisors, Inc. Solution | www.alpsetfs.com | 866.513.5856 |
|
PERFORMANCE OVERVIEW |
May 31, 2012 (Unaudited) |
NAV is an exchange-traded fund’s per-share value. The per-share dollar amount of the fund is derived by dividing the total value of all the securities in its portfolio, less any liabilities, by the number of fund shares outstanding. Information detailing the number of days the Market Price of the Fund was greater than the Fund’s NAV and the number of days it was less than the Fund’s NAV can be obtained at www.alpsfunds.com.
| ** | Market Price is based on the midpoint of the bid/ask spread at 4p.m. ET and does not represent the returns an investor would receive if shares were traded at other times. |
Cohen & Steers Global Realty Majors® Portfolio Index: A free-float adjusted, modified market capitalization-weighted index of global real estate equities. The modified market capitalization weighting approach and qualitative screening process emphasize those companies that, in the opinion of the Cohen & Steers investment committee, are leading the securitization of real estate globally.
FTSE EPRA/NAREIT Developed Real Estate Index: An unmanaged market-weighted total return index that consists of many companies from developed markets whose floats are larger than $100 million and which derive more than half of their revenue from property-related activities.
S&P 500® Index: The Standard & Poor’s composite index of 500 stocks, a widely recognized, unmanaged index of common stock prices.
An investor cannot invest directly in an index.
GROWTH OF $10k as of May 31, 2012
Comparison of Change in Value of $10,000 Investment in Cohen & Steers Global Realty Majors ETF and Cohen & Steers Global Realty Majors Index.
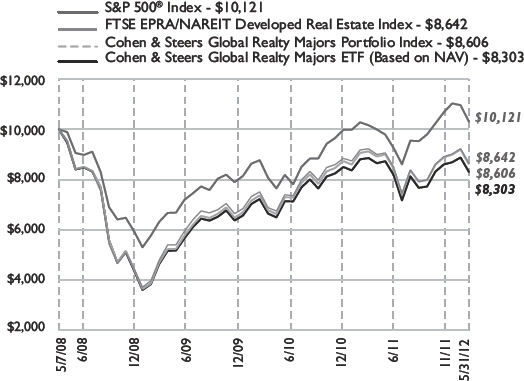
The chart above represents historical performance of a hypothetical investment of $10,000 in the Fund over the life of the Fund. Performance calculations are as of the end of each month. Past performance does not guarantee future results. This chart does not reflect the deduction of taxes that a shareholder would pay on Fund distributions or the redemption of Fund shares.
| | | | |
| | | | 3 |
| Semi-Annual (Unaudited) | May 31, 2012 | |
| | |
| | PERFORMANCE OVERVIEW |
| | May 31, 2012 (Unaudited) |
TOP 10 HOLDINGS (as a % of Net Assets)* as of May 31, 2012
| | | | |
Simon Property Group, Inc. | | | 4.04 | % |
Mitsubishi Estate Co., Ltd. | | | 3.62 | |
Public Storage | | | 3.57 | |
Westfield Group | | | 3.51 | |
Equity Residential | | | 3.45 | |
Sun Hung Kai Properties, Ltd. | | | 3.27 | |
Ventas, Inc. | | | 3.19 | |
| | | | |
HCP, Inc. | | | 3.14 | % |
Boston Properties, Inc. | | | 2.87 | |
Vornado Realty Trust | | | 2.85 | |
Percent of Net Assets In Top Ten Holdings: | | | 33.51 | % |
| * | Future holdings are subject to change. |
GEOGRAPHIC BREAKDOWN**
| | | | |
United States | | | 50.50 | % |
Hong Kong | | | 12.85 | |
Australia | | | 9.12 | |
Japan | | | 8.92 | |
United Kingdom | | | 5.81 | |
France | | | 4.14 | |
Singapore | | | 3.61 | |
| | | | |
Canada | | | 2.31 | % |
Netherlands | | | 0.95 | |
Brazil | | | 0.88 | |
Switzerland | | | 0.55 | |
Sweden | | | 0.36 | |
| | | | | | |
4 | | | | | | |
| | An ALPS Advisors, Inc. Solution | www.alpsetfs.com | 866.513.5856 |
|
DISCLOSURE OF FUND EXPENSES |
May 31, 2012 (Unaudited) |
Shareholder Expense Example: As a shareholder of the Fund, you incur two types of costs: (1) transaction costs which may include creation and redemption fees or brokerage charges, and (2) ongoing costs, including management fees and other Fund expenses. These examples are intended to help you understand your ongoing costs (in dollars) of investing in the Fund and to compare these costs with the ongoing costs of investing in other funds. It is based on an investment of $1,000 invested at December 1, 2011, and held through the period ended May 31, 2012.
Actual Return: The first line of the table provides information about actual account values and actual expenses. You may use the information in this table, together with the amount you invested, to estimate the expenses that you incurred over the period. Simply divide your account value by $1,000 (for example, an $8,600 account value divided by $1,000 = 8.6), then multiply the result by the number in the first line under the heading entitled “Expenses Paid During the Period” to estimate the expenses attributable to your investment during this period.
Hypothetical 5% Return: The second line of the table provides information about hypothetical account values and hypothetical expenses based on the Fund’s actual expense ratio and an assumed rate of return of 5% per year before expenses, which is not the Fund’s actual return. The hypothetical account values and expenses may not be used to estimate the actual ending account balance or expenses you paid for the period. You may use this information to compare ongoing costs of investing in the Fund and other funds. To do so, compare this 5% hypothetical example with the 5% hypothetical examples that appear in the shareholder reports of the other funds.
The expenses shown in the table are meant to highlight ongoing Fund costs only and do not reflect any transaction costs, such as creation and redemption fees, or brokerage charges. Therefore, the second line is useful in comparing ongoing costs only, and will not help you determine the relative total costs of owning different funds. In addition, if these costs were included, your costs would have been higher.
| | | | | | | | | | | | | | | | | | | | |
| | | Beginning Account Value 12/01/11 | | Ending Account Value 5/31/12 | | Expense Ratio(a) | | Expenses Paid During the Period 12/01/11-5/31/11(b) |
Actual | | | $ | 1,000.00 | | | | $ | 1,082.00 | | | | | 0.55 | % | | | $ | 2.86 | |
Hypothetical (5% return before expenses) | | | $ | 1,000.00 | | | | $ | 1,022.25 | | | | | 0.55 | % | | | $ | 2.78 | |
| (a) | The Fund’s expense ratios have been based on the Fund’s most recent fiscal half-year expenses. |
| (b) | Expenses are equal to the Fund’s annualized expense ratio multiplied by the average account value over the period, multiplied by the number of days in the most recent fiscal half year (183), then divided by 366. |
| | | | |
| | | | 5 |
| Semi-Annual (Unaudited) | May 31, 2012 | |
| | |
| | SCHEDULE OF INVESTMENTS |
| | May 31, 2012 (Unaudited) |
| | | | | | | | |
| Security Description | | Shares | | | Value | |
COMMON STOCKS (99.54%) | | | | | | | | |
Australia (9.08%) | | | | | | | | |
CFS Retail Property Trust | | | 276,206 | | | $ | 503,663 | |
Dexus Property Group | | | 569,213 | | | | 518,982 | |
Goodman Group | | | 161,645 | | | | 529,942 | |
GPT Group | | | 196,783 | | | | 618,418 | |
Mirvac Group | | | 401,741 | | | | 479,293 | |
Stockland Trust Group | | | 273,114 | | | | 845,053 | |
Westfield Group | | | 249,672 | | | | 2,201,319 | |
| | | | | | | | |
| | | | | | | 5,696,670 | |
| | | | | | | | |
| | |
Brazil (0.88%) | | | | | | | | |
BR Malls Participacoes SA | | | 50,000 | | | | 549,749 | |
| | | | | | | | |
| | |
Canada (2.30%) | | | | | | | | |
Boardwalk Real Estate Investment Trust | | | 4,609 | | | | 261,064 | |
Dundee Real Estate Investment Trust | | | 9,947 | | | | 345,908 | |
RioCan Real Estate Investment Trust | | | 32,459 | | | | 836,701 | |
| | | | | | | | |
| | | | | | | 1,443,673 | |
| | | | | | | | |
| | |
France (4.11%) | | | | | | | | |
Gecina SA | | | 3,072 | | | | 260,569 | |
ICADE* | | | 2,692 | | | | 207,933 | |
Klepierre | | | 10,953 | | | | 339,248 | |
Unibail-Rodamco | | | 10,742 | | | | 1,774,468 | |
| | | | | | | | |
| | | | | | | 2,582,218 | |
| | | | | | | | |
| | |
Hong Kong (12.79%) | | | | | | | | |
China Overseas Land & Investment, Ltd. | | | 452,000 | | | | 944,670 | |
China Resources Land, Ltd. | | | 234,500 | | | | 442,359 | |
Hang Lung Properties, Ltd. | | | 237,000 | | | | 755,813 | |
Henderson Land Development Co., Ltd. | | | 108,000 | | | | 544,116 | |
Hongkong Land Holdings, Ltd. | | | 138,000 | | | | 772,800 | |
The Link Real Estate Investment Trust | | | 266,664 | | | | 1,023,933 | |
Sino Land Co., Ltd. | | | 406,000 | | | | 560,804 | |
Sun Hung Kai Properties, Ltd. | | | 181,000 | | | | 2,050,020 | |
The Wharf Holdings, Ltd. | | | 177,700 | | | | 928,472 | |
| | | | | | | | |
| | | | | | | 8,022,987 | |
| | | | | | | | |
| | |
Japan (8.88%) | | | | | | | | |
Mitsubishi Estate Co., Ltd. | | | 146,000 | | | | 2,269,642 | |
Mitsui Fudosan Co., Ltd. | | | 98,000 | | | | 1,634,687 | |
Nippon Building Fund, Inc. | | | 65 | | | | 592,680 | |
Sumitomo Realty & Development Co., Ltd. | | | 51,000 | | | | 1,071,836 | |
| | | | | | | | |
| | | | | | | 5,568,845 | |
| | | | | | | | |
| | | | | | |
6 | | | | | | |
| | An ALPS Advisors, Inc. Solution | www.alpsetfs.com | 866.513.5856 |
|
SCHEDULE OF INVESTMENTS |
May 31, 2012 (Unaudited) |
| | | | | | | | |
| Security Description | | Shares | | | Value | |
| | |
Netherlands (0.95%) | | | | | | | | |
Corio N.V. | | | 11,011 | | | $ | 456,632 | |
Eurocommercial Properties N.V. | | | 4,201 | | | | 137,364 | |
| | | | | | | | |
| | | | | | | 593,996 | |
| | | | | | | | |
| | |
Singapore (3.59%) | | | | | | | | |
Ascendas Real Estate Investment Trust | | | 215,066 | | | | 342,103 | |
CapitaLand, Ltd. | | | 305,000 | | | | 601,125 | |
CapitaMall Trust | | | 320,347 | | | | 451,158 | |
City Developments, Ltd. | | | 55,000 | | | | 424,636 | |
Global Logistic Properties, Ltd.* | | | 270,000 | | | | 435,771 | |
| | | | | | | | |
| | | | | | | 2,254,793 | |
| | | | | | | | |
| | |
Sweden (0.36%) | | | | | | | | |
Castellum AB | | | 20,234 | | | | 226,807 | |
| | | | | | | | |
| | |
Switzerland (0.55%) | | | | | | | | |
PSP Swiss Property AG* | | | 4,090 | | | | 345,130 | |
| | | | | | | | |
| | |
United Kingdom (5.78%) | | | | | | | | |
British Land Co., Plc | | | 104,382 | | | | 775,986 | |
Capital Shopping Centres Group Plc | | | 70,432 | | | | 334,756 | |
Derwent London Plc | | | 9,610 | | | | 257,959 | |
Great Portland Estates Plc | | | 36,867 | | | | 214,265 | |
Hammerson Plc | | | 82,972 | | | | 532,280 | |
Land Securities Group Plc | | | 91,179 | | | | 994,998 | |
Segro Plc | | | 87,447 | | | | 286,955 | |
Shaftesbury Plc | | | 29,452 | | | | 228,922 | |
| | | | | | | | |
| | | | | | | 3,626,121 | |
| | | | | | | | |
| | |
United States (50.27%) | | | | | | | | |
Alexandria Real Estate Equities, Inc. | | | 7,288 | | | | 498,936 | |
American Campus Communities, Inc. | | | 8,716 | | | | 382,632 | |
AvalonBay Communities, Inc. | | | 11,274 | | | | 1,575,542 | |
Boston Properties, Inc. | | | 17,487 | | | | 1,799,937 | |
Brookfield Office Properties, Inc. | | | 25,436 | | | | 425,799 | |
Camden Property Trust | | | 9,268 | | | | 603,439 | |
Corporate Office Properties Trust | | | 8,461 | | | | 186,227 | |
Digital Realty Trust, Inc. | | | 12,680 | | | | 897,364 | |
Douglas Emmett, Inc. | | | 16,292 | | | | 348,649 | |
Duke Realty Corp. | | | 30,501 | | | | 422,134 | |
Equity Residential | | | 35,377 | | | | 2,161,535 | |
Essex Property Trust, Inc. | | | 4,060 | | | | 610,868 | |
Federal Realty Investment Trust | | | 7,495 | | | | 736,609 | |
| | | | |
| | | | 7 |
| Semi-Annual (Unaudited) | May 31, 2012 | |
| | |
| | SCHEDULE OF INVESTMENTS |
| | May 31, 2012 (Unaudited) |
| | | | | | | | |
| Security Description | | Shares | | | Value | |
| | |
United States (continued) | | | | | | | | |
General Growth Properties, Inc. | | | 69,454 | | | $ | 1,163,354 | |
HCP, Inc. | | | 48,314 | | | | 1,973,144 | |
Health Care REIT, Inc. | | | 24,798 | | | | 1,375,545 | |
Host Hotels & Resorts, Inc. | | | 83,466 | | | | 1,273,691 | |
Kimco Realty Corp. | | | 47,773 | | | | 857,525 | |
Liberty Property Trust | | | 13,602 | | | | 471,581 | |
The Macerich Co. | | | 15,417 | | | | 879,540 | |
ProLogis | | | 54,086 | | | | 1,729,670 | |
Public Storage | | | 16,767 | | | | 2,237,891 | |
Regency Centers Corp. | | | 10,503 | | | | 460,136 | |
Simon Property Group, Inc. | | | 17,204 | | | | 2,537,934 | |
SL Green Realty Corp. | | | 10,161 | | | | 762,177 | |
Tanger Factory Outlet Centers | | | 10,700 | | | | 331,807 | |
UDR, Inc. | | | 26,371 | | | | 683,009 | |
Ventas, Inc. | | | 34,067 | | | | 2,003,821 | |
Vornado Realty Trust | | | 21,795 | | | | 1,785,446 | |
Weingarten Realty Investors | | | 14,243 | | | | 364,336 | |
| | | | | | | | |
| | | | | | | 31,540,278 | |
| | | | | | | | |
| | |
TOTAL COMMON STOCKS
(Cost $60,093,118) | | | | | | | 62,451,267 | |
| | | | | | | | |
| | |
TOTAL INVESTMENTS (99.54%) (Cost $60,093,118) | | | | | | | 62,451,267 | |
| | |
NET OTHER ASSETS AND LIABILITIES (0.46%) | | | | | | | 291,497 | |
| | | | | | | | |
| | |
NET ASSETS (100.00%) | | | | | | $ | 62,742,764 | |
| | | | | | | | |
| * | Non-income producing security. |
Common Abbreviations:
| AB - | Aktiebolag is the Swedish equivalent of the term corporation. |
| AG - | Aktiengesellschaft is a German term that refers to a corporation that is limited by shares, i.e., owned by shareholders. |
| N.V. - | Naamloze Vennootschap is the Dutch term for a public limited liability corporation. |
| REIT - | Real Estate Investment Trust |
| SA - | Generally designated corporations in various countries, mostly those employing the civil law. |
See Notes to Financial Statements.
| | | | | | |
8 | | | | | | |
| | An ALPS Advisors, Inc. Solution | www.alpsetfs.com | 866.513.5856 |
|
STATEMENT OF ASSETS & LIABILITIES |
May 31, 2012 (Unaudited) |
| | | | |
ASSETS: | | | | |
Investments, at value | | $ | 62,451,267 | |
Cash | | | 226,026 | |
Foreign currency, at value (Cost $21,169) | | | 21,173 | |
Foreign tax reclaims | | | 9,091 | |
Interest and dividends receivable | | | 65,328 | |
| |
Total Assets | | | 62,772,885 | |
| |
| |
LIABILITIES: | | | | |
Payable to advisor | | | 30,121 | |
| |
Total Liabilities | | | 30,121 | |
| |
NET ASSETS | | $ | 62,742,764 | |
| |
| |
NET ASSETS CONSIST OF: | | | | |
Paid-in capital | | $ | 63,962,227 | |
Overdistributed net investment income | | | (298,003 | ) |
Accumulated net realized loss on investments and foreign currency transactions | | | (3,280,552 | ) |
Net unrealized appreciation on investments and translation of assets and liabilities denominated in foreign currencies | | | 2,359,092 | |
| |
NET ASSETS | | $ | 62,742,764 | |
| |
| |
INVESTMENTS, AT COST | | $ | 60,093,118 | |
| |
PRICING OF SHARES | | | | |
Net Assets | | $ | 62,742,764 | |
Shares of beneficial interest outstanding
(Unlimited number of shares authorized, par value $0.01 per share) | | | 1,800,000 | |
Net Asset Value, offering and redemption price per share | | $ | 34.86 | |
| | | | |
See Notes to Financial Statements. | | 9 |
| Semi-Annual (Unaudited) | May 31, 2012 | |
| | |
| | STATEMENT OF OPERATIONS |
| | |
| | | | | | | | |
| | | For the Six Months
Ended May 31, 2012
(Unaudited) | | | For the Period
January 1, 2011 to
November 30, 2011(a) | |
INVESTMENT INCOME: | | | | | | | | |
Dividends(b) | | | $ 1,138,614 | | | | $ 1,697,951 | |
| |
Total Investment Income | | | 1,138,614 | | | | 1,697,951 | |
| |
| | |
EXPENSES: | | | | | | | | |
Investment advisory fee | | | 162,120 | | | | 261,699 | |
| |
Total Net Expenses | | | 162,120 | | | | 261,699 | |
| |
NET INVESTMENT INCOME | | | 976,494 | | | | 1,436,252 | |
| |
| | |
Net realized gain on investments | | | 28,251 | | | | 777,361 | |
Net realized loss on foreign currency transactions | | | (1,800) | | | | (5,226) | |
Net change in unrealized appreciation/(depreciation) on investments | | | 2,747,203 | | | | (5,846,321) | |
Net change in unrealized appreciation/(depreciation) on translation of assets and liabilities denominated in foreign currencies | | | 1,404 | | | | (1,971) | |
| |
NET REALIZED AND UNREALIZED GAIN/(LOSS) ON INVESTMENTS | | | 2,775,058 | | | | (5,076,157) | |
| |
NET INCREASE/(DECREASE) IN NET ASSETS RESULTING FROM OPERATIONS | | | $ 3,751,552 | | | | $(3,639,905) | |
| |
| (a) | Effective March 7, 2011, the Board approved changing the fiscal year end of the Fund from December 31 to November 30. |
| (b) | Net of foreign withholding tax of $56,137 and $77,454, respectively. |
| | | | | | |
10 | | See Notes to Financial Statements. | | | | |
| | An ALPS Advisors, Inc. Solution | www.alpsetfs.com | 866.513.5856 |
|
STATEMENTS OF CHANGES IN NET ASSETS |
|
| | | | | | | | | | | | |
| | | For the Six Months Ended May 31, 2012
(Unaudited) | | | For the Period January 1, 2011 to November 30, 2011(a) | | | For the Year
Ended
December 31, 2010 | |
OPERATIONS: | | | | | | | | | | | | |
Net investment income | | $ | 976,494 | | | $ | 1,436,252 | | | $ | 1,104,720 | |
Net realized gain/(loss) on investments and foreign currency transactions | | | 26,451 | | | | 772,135 | | | | (961,629) | |
Net change in unrealized appreciation/(depreciation) on investments and foreign currency | | | 2,748,607 | | | | (5,848,292) | | | | 5,070,740 | |
| |
Net increase/(decrease) in net assets resulting from operations | | | 3,751,552 | | | | (3,639,905) | | | | 5,213,831 | |
| |
| | | |
DISTRIBUTIONS TO SHAREHOLDERS: | | | | | | | | | | | | |
From net investment income | | | (546,480) | | | | (1,593,186) | | | | (1,865,795) | |
| |
Total distributions | | | (546,480) | | | | (1,593,186) | | | | (1,865,795) | |
| |
| | | |
SHARE TRANSACTIONS: | | | | | | | | | | | | |
Proceeds from sale of shares | | | 10,836,059 | | | | 19,906,094 | | | | 26,743,914 | |
Cost of shares redeemed | | | (1,716,387) | | | | (6,881,318) | | | | (68,866) | |
| |
Net increase from share transactions | | | 9,119,672 | | | | 13,024,776 | | | | 26,675,048 | |
| |
Net increase in net assets | | | 12,324,744 | | | | 7,791,685 | | | | 30,023,084 | |
| |
| | | |
NET ASSETS: | | | | | | | | | | | | |
Beginning of year | | | 50,418,020 | | | | 42,626,335 | | | | 12,603,251 | |
| |
End of period* | | $ | 62,742,764 | | | $ | 50,418,020 | | | $ | 42,626,335 | |
| |
| | | |
*Including overdistributed net investment income of: | | $ | (298,003) | | | $ | (728,017) | | | $ | (1,044,296) | |
| | | |
Other Information: | | | | | | | | | | | | |
SHARE TRANSACTIONS: | | | | | | | | | | | | |
Beginning shares | | | 1,550,000 | | | | 1,200,000 | | | | 402,000 | |
Shares sold | | | 300,000 | | | | 550,000 | | | | 800,000 | |
Shares redeemed | | | (50,000) | | | | (200,000) | | | | (2,000) | |
| |
Shares outstanding, end of period | | | 1,800,000 | | | | 1,550,000 | | | | 1,200,000 | |
| |
| (a) | Effective March 7, 2011, the Board approved changing the fiscal year end of the Fund from December 31 to November 30. |
| | | | |
| See Notes to Financial Statements. | | 11 |
| Semi-Annual (Unaudited) | May 31, 2012 | |
| | | | |
| | | For the Six Months Ended May 31, 2012 (Unaudited) | |
NET ASSET VALUE, BEGINNING OF PERIOD | | $ | 32.53 | |
| |
INCOME/(LOSS) FROM OPERATIONS: | | | | |
Net investment income | | | 0.59 | (b) |
Net realized and unrealized gain/(loss) on investments | | | 2.07 | |
| |
Total from Investment Operations | | | 2.66 | |
| |
| |
LESS DISTRIBUTIONS: | | | | |
From net investment income | | | (0.33 | ) |
| |
Total Distributions | | | (0.33 | ) |
| |
NET INCREASE/(DECREASE) IN NET ASSET VALUE | | | 2.33 | |
| |
NET ASSET VALUE, END OF PERIOD | | $ | 34.86 | |
| |
TOTAL RETURN(C) | | | 8.20 | % |
| |
RATIOS/ SUPPLEMENTAL DATA: | | | | |
Net assets, end of period (in 000s) | | $ | 62,743 | |
| |
RATIOS TO AVERAGE NET ASSETS: | | | | |
Net investment income including reimbursement/waiver | | | 3.31 | %(d) |
Operating expenses including reimbursement/waiver | | | 0.55 | %(d) |
Operating expenses excluding reimbursement/waiver | | | 0.55 | %(d) |
PORTFOLIO TURNOVER RATE(e) | | | 1 | % |
| (a) | Effective March 7, 2011, the Board approved changing the fiscal year end of the Fund from December 31 to November 30. |
| (b) | Calculated using average shares outstanding. |
| (c) | Total return is calculated assuming an initial investment made at the net asset value at the beginning of the period and redemption at the net asset value on the last day of the period and assuming all distributions are reinvested at actual reinvestment prices. Total return calculated for a period of less than one year is not annualized. |
| (e) | Portfolio turnover is not annualized and does not include securities received or delivered from processing creations or redemptions. |
| | | | | | |
12 | | See Notes to Financial Statements. | | | | |
| | An ALPS Advisors, Inc. Solution | www.alpsetfs.com | 866.513.5856 |
|
FINANCIAL HIGHLIGHTS |
For a Share Outstanding Throughout the Periods Presented |
| | | | | | | | | | | | | | | | | | |
For the Period January 1, 2011 to November 30, 2011(a) | | For the Year Ended December 31, 2010 | | For the Year
Ended December 31, 2009 | | For the Period May 7, 2008 (Inception) through December 31, 2008 |
| | | $ 35.52 | | | | $ | 31.35 | | | | $ | 25.06 | | | | $ | 50.00 | |
| | | |
| | | | | | | | | | | | | | | | | | | |
| | | 0.97(b) | | | | | 1.43 | (b) | | | | 0.98 | | | | | 0.47 | |
| | | (2.87) | | | | | 4.68 | | | | | 7.00 | | | | | (24.92 | ) |
| | | | |
| | | (1.90) | | | | | 6.11 | | | | | 7.98 | | | | | (24.45 | ) |
| | | | |
| | | | | | | | | | | | | | | | | | | |
| | | (1.09) | | | | | (1.94 | ) | | | | (1.69 | ) | | | | (0.49 | ) |
| | | | |
| | | (1.09) | | | | | (1.94 | ) | | | | (1.69 | ) | | | | (0.49 | ) |
| | | | |
| | | (2.99) | | | | | 4.17 | | | | | 6.29 | | | | | (24.94 | ) |
| | | | |
| | | $ 32.53 | | | | $ | 35.52 | | | | $ | 31.35 | | | | $ | 25.06 | |
| | | | |
| | | (5.53)% | | | | | 19.91 | % | | | | 32.51 | % | | | | (48.90 | )% |
| | | |
| | | | | | | | | | | | | | | | | | | |
| | | $ 50,418 | | | | $ | 42,626 | | | | $ | 12,603 | | | | $ | 5,063 | |
| | | |
| | | | | | | | | | | | | | | | | | | |
| | | 3.02%(d) | | | | | 4.33 | % | | | | 3.24 | % | | | | 3.49 | %(d) |
| | | 0.55%(d) | | | | | 0.55 | % | | | | 0.55 | % | | | | 0.55 | %(d) |
| | | 0.55%(d) | | | | | 0.55 | % | | | | 0.55 | % | | | | 0.55 | %(d) |
| | | 15% | | | | | 14 | % | | | | 18 | % | | | | 18 | % |
| | | | |
| | | | 13 |
| Semi-Annual (Unaudited) | May 31, 2012 | |
| | |
| | NOTES TO FINANCIAL STATEMENTS |
| | May 31, 2012 (Unaudited) |
1. ORGANIZATION
The ALPS ETF Trust (the “Trust”) is an open-end management investment company organized as a Delaware statutory trust on September 13, 2007 and is registered with the Securities and Exchange Commission (“SEC”) under the Investment Company Act of 1940, as amended (the “1940 Act”). As of June 30, 2012, the Trust consists of four separate portfolios. Each portfolio represents a separate series of the Trust. This report pertains solely to the Cohen & Steers Global Realty Majors ETF (the “Fund”), which commenced operations on May 7, 2008. The investment objective of the Fund is to seek investment results that correspond generally to the price and yield (before the Fund’s fees and expenses) of the Cohen & Steers Global Realty Majors Index.
The Fund’s Shares (“Shares”) are listed on the New York Stock Exchange (“NYSE”) Arca. The Fund issues and redeems Shares at Net Asset Value (“NAV”) in blocks of 50,000 Shares, each of which is called a “Creation Unit.” Creation Units are issued and redeemed principally in-kind for securities included in a specified index. Except when aggregated in Creation Units, Shares are not redeemable securities of the Fund.
2. SIGNIFICANT ACCOUNTING POLICIES
The following is a summary of significant accounting policies consistently followed by the Fund in the preparation of the financial statements. The accompanying financial statements were prepared in accordance with accounting principles generally accepted in the United States of America (“U.S. GAAP”). The preparation of financial statements in conformity with U.S. GAAP requires management to make certain estimates and assumptions that affect the reported amounts of assets and liabilities and disclosures of contingent assets and liabilities at the date of the financial statements and the reported amounts of revenue and expenses during the period. Actual results could differ from those estimates.
A. Portfolio Valuation
The Fund’s NAV is determined daily, as of the close of regular trading on the NYSE, normally 4:00 p.m. Eastern time, on each day the NYSE is open for trading. The NAV is computed by dividing the value of all assets of the Fund (including accrued interest and dividends), less all liabilities (including accrued expenses and dividends declared but unpaid), by the total number of shares outstanding.
Portfolio securities listed on any exchange other than the National Association of Securities Dealer Automated Quotation (“NASDAQ”) exchange are valued at the last sale price on the business day as of which such value is being determined. If there has been no sale on such day, the securities are valued at the mean of the most recent bid and asked prices on such day. Securities traded on the NASDAQ are valued at the NASDAQ Official Closing Price as determined by NASDAQ. Short-term investments that mature in less than 60 days are valued at amortized cost, which approximates market value.
| | | | | | |
14 | | | | | | |
| | An ALPS Advisors, Inc. Solution | www.alpsetfs.com | 866.513.5856 |
|
NOTES TO FINANCIAL STATEMENTS |
|
The Fund’s investments are valued at market value or, in the absence of market value with respect to any portfolio securities, at fair value according to procedures adopted by the Trust’s Board of Trustees (the “Board”). When market quotations are not readily available or when events occur that make established valuation methods unreliable, securities of the Fund may be valued in good faith by or under the direction of the Board. These securities generally include, but are not limited to, restricted securities (securities which may not be publicly sold without registration under the Securities Act of 1933) for which a pricing service is unable to provide a market price; securities whose trading has been formally suspended; a security whose market price is not available from a pre-established primary pricing source or the pricing source is not willing to provide a price; a security with respect to which an event has occurred that is most likely to materially affect the value of the security after the market has closed but before the calculation of the Fund’s NAV or make it difficult or impossible to obtain a reliable market quotation; or a security whose price, as provided by the pricing service, does not reflect the security’s “fair value” due to the security being de-listed from a national exchange or the security’s primary trading market is temporarily closed at a time when, under normal conditions, it would be open. As a general principle, the current “fair value” of a security would be the amount which the owner might reasonably expect to receive from the closing sale prices on the applicable exchange and fair value prices may not reflect the actual value of a security. A variety of factors may be considered in determining the fair value of such securities.
B. Foreign Currency Translation and Foreign Investments
The Fund invests in foreign securities which may involve a number of risk factors and special considerations not present with investments in securities of U.S. corporations.
Investment in non-U.S. issuers may involve unique risks compared to investing in securities of U.S. issuers. These risks may include, but are not limited to: (i) less information about non-U.S. issuers or markets may be available due to less rigorous disclosure, accounting standards or regulatory practices; (ii) many non-U.S. markets are smaller, less liquid and more volatile thus, in a changing market, the advisers may not be able to sell the Fund’s portfolio securities at times, in amounts and at prices they consider reasonable; (iii) currency exchange rates or controls may adversely affect the value of the Fund’s investments; (iv) the economies of non-U.S. countries may grow at slower rates than expected or may experience downturns or recessions; and, (v) withholdings and other non-U.S. taxes may decrease the Fund’s return.
The accounting records of the Fund are maintained in U.S. dollars. Portfolio securities and other assets and liabilities denominated in a foreign currency are translated to U.S. dollars at the prevailing rates of exchange at period end. Amounts related to the purchases and sales of securities and investment income are translated into U.S. dollars at the prevailing exchange rate on the respective dates of transactions. The effects of changes in foreign currency exchange rates on portfolio investments are included in the net realized and unrealized gains and losses on investments. Net gains and losses on foreign currency transactions include disposition of foreign currencies, and currency gains and losses between the accrual and receipt dates of
| | | | |
| | | | 15 |
| Semi-Annual (Unaudited) | May 31, 2012 | |
| | |
| | NOTES TO FINANCIAL STATEMENTS |
| | May 31, 2012 (Unaudited) |
portfolio investment income and between the trade and settlement dates of portfolio investment transactions.
C. Securities Transactions and Investment Income
Securities transactions are recorded as of the trade date. Realized gains and losses from securities transactions are recorded on the identified cost basis. Dividend income is recorded on the ex-dividend date. Interest income, if any, is recorded on the accrual basis.
D. Federal Tax Information
The timing and character of income and capital gain distributions are determined in accordance with income tax regulations, which may differ from U.S. GAAP. Reclassifications are made to the Fund’s capital accounts for permanent tax differences to reflect income and gains available for distribution (or available capital loss carryforwards) under income tax regulations.
For the period ended November 30, 2011, permanent book and tax differences resulting primarily from differing treatment of foreign currency and in-kind transactions were identified and reclassified among the components of the Fund’s net assets as follows:
| | | | |
Undistributed Net Investment Income | | Accumulated Net Realized Loss | | Paid-in Capital |
$473,213 | | $(1,697,434) | | $1,224,221 |
Net investment income and net realized (loss), as disclosed on the Statement of Operations, and net assets were not affected by this reclassification.
Under the Regulated Investment Company Modernization Act of 2010 (“the Modernization Act”), net capital losses recognized in tax years beginning after December 22, 2010 may be carried forward indefinitely, and the character of the losses is retained as short-term and/or long-term. Under the law in effect prior to the Modernization Act, net capital losses were carried forward for eight years and treated as short-term. As a transition rule, the Modernization Act requires that post-enactment net capital losses be used before pre-enactment net capital losses. Additionally, post-enactment capital losses that are carried forward will retain their character as either short-term or long-term losses rather than being considered all short-term as under previous law.
At November 30, 2011, the Fund had available for tax purposes unused pre-enactment capital loss carryforwards as follows:
| | | | | | |
| Year of Expiration | | |
| 2016 | | 2017 | | 2018 | | Total |
| $176,692 | | $809,982 | | $187,815 | | $1,174,489 |
| | | | | | |
16 | | | | | | |
| | An ALPS Advisors, Inc. Solution | www.alpsetfs.com | 866.513.5856 |
|
NOTES TO FINANCIAL STATEMENTS |
|
At November 30, 2011, the Fund had available for tax purposes unused post-enactment capital loss carryforwards as follows:
E. Dividends and Distributions to Shareholders
Dividends from net investment income of the Fund, if any, are declared and paid quarterly or as the Board of Trustees may determine from time to time. Distributions of net realized capital gains earned by the Fund, if any, are distributed at least annually.
Distributions from net investment income and capital gains are determined in accordance with income tax regulations, which may differ from U.S. GAAP. These differences are primarily due to differing treatments of income and gains on various investment securities held by the Fund, timing differences and differing characterization of distributions made by the Fund.
The tax character of the distributions paid was as follows:
| | | | | | | | |
| | | For the Period Ended
November 30, 2011 | | | For the Year Ended
December 31, 2010 | |
Distributions paid from: | | | | | | | | |
Ordinary income | | | $ 1,593,186 | | | | $ 1,865,795 | |
| |
Total | | | $ 1,593,186 | | | | $ 1,865,795 | |
| |
As of November 30, 2011, the components of distributable earnings on a tax basis for the Fund were as follows:
| | | | |
Undistributed net investment income | | $ | 145,438 | |
Accumulated net realized loss on investments and foreign currency transactions | | | (2,003,640) | |
Net unrealized depreciation on investments and translation of assets and liabilities denominated in foreign currencies | | | (2,566,425) | |
Other Cumulative Effect of Timing Differences | | | 92 | |
| |
Total | | $ | (4,424,535) | |
| |
The differences between book-basis and tax-basis are primarily due to deferral of losses from wash sales and the differing treatment of certain other investments.
F. Income Taxes
No provision for income taxes is included in the accompanying financial statements, as the Fund intends to distribute to shareholders all taxable investment income and realized gains and otherwise comply with Subchapter M of the Internal Revenue Code applicable to regulated investment companies.
The Fund evaluates tax positions taken (or expected to be taken) in the course of preparing the Fund’s tax returns to determine whether these positions meet a
| | | | |
| | | | 17 |
| Semi-Annual (Unaudited) | May 31, 2012 | |
| | |
| | NOTES TO FINANCIAL STATEMENTS |
| | May 31, 2012 (Unaudited) |
“more-likely-than-not” standard that, based on the technical merits, have a more than fifty percent likelihood of being sustained by a taxing authority upon examination. A tax position that meets the “more-likely-than-not” recognition threshold is measured to determine the amount of benefit to recognize in the financial statements.
Management of the Fund analyzes all open tax years, as defined by the Statute of Limitations, for all major jurisdictions, including federal tax authorities and certain state tax authorities. As of and during the fiscal year ended November 30, 2011, the Fund did not have a liability for any unrecognized tax benefits. The Fund will file income tax returns in the U.S. federal jurisdiction and Colorado. For the years ended December 31, 2008 through November 30, 2011, the Fund’s returns are still open to examination by the appropriate taxing authority.
G. Fair Value Measurements
The Fund discloses the classification of its fair value measurements following a three-tier hierarchy based on the inputs used to measure fair value. Inputs refer broadly to the assumptions that market participants would use in pricing the asset or liability, including assumptions about risk. Inputs may be observable or unobservable. Observable inputs reflect the assumptions market participants would use in pricing the asset or liability that are developed based on market data obtained from sources independent of the reporting entity. Unobservable inputs reflect the reporting entity’s own assumptions about the assumptions market participants would use in pricing the asset or liability that are developed based on the best information available.
Various inputs are used in determining the value of the Fund’s investments as of the end of the reporting period. When inputs used fall into different levels of the fair value hierarchy, the level in the hierarchy within which the fair value measurement falls is determined based on the lowest level input that is significant to the fair value measurement in its entirety. The designated input levels are not necessarily an indication of the risk or liquidity associated with these investments. These inputs are categorized in the following hierarchy under applicable financial accounting standards:
| | |
Level 1 - | | Unadjusted quoted prices in active markets for identical assets or liabilities that the Fund has the ability to access. |
| |
Level 2 - | | Observable inputs other than quoted prices included in level 1 that are observable for the asset or liability, either directly or indirectly. These inputs may include quoted prices for the identical instrument on an inactive market, prices for similar instruments, interest rates, prepayment speeds, credit risk, yield curves, default rates, and similar data. |
| |
Level 3 - | | Unobservable inputs for the asset or liability, to the extent relevant observable inputs are not available, representing the Fund’s own assumptions about the assumptions a market participant would use in valuing the asset or liability, and would be based on the best information available. |
| | | | | | |
18 | | | | | | |
| | An ALPS Advisors, Inc. Solution | www.alpsetfs.com | 866.513.5856 |
|
NOTES TO FINANCIAL STATEMENTS |
|
| | | | | | | | | | | | | | | | |
| Investments in Securities at Value* | | Level 1-
Unadjusted
Quoted Prices | | | Level 2-
Other
Significant
Observable
Inputs | | | Level 3-
Significant
Unobservable
Inputs | | | Total | |
Common Stocks | | $ | 62,451,267 | | | $ | – | | | $ | – | | | $ | 62,451,267 | |
| |
TOTAL | | $ | 62,451,267 | | | $ | – | | | $ | – | | | $ | 62,451,267 | |
| |
*For a detailed geographical breakdown, see the accompanying Schedule of Investments.
For the six months ended May 31, 2012, the Fund did not have any significant transfers between Level 1 and Level 2 securities. The Fund did not have any securities which used significant unobservable inputs (Level 3) in determining fair value.
3. INVESTMENT ADVISORY FEE AND OTHER AFFILIATED TRANSACTIONS
ALPS Advisors, Inc. (the “Investment Adviser”) acts as the Fund’s investment adviser pursuant to an Advisory Agreement with the Trust on behalf of the Fund (the “Advisory Agreement”). Pursuant to the Advisory Agreement, the Fund pays the Investment Adviser a unitary fee for the services and facilities it provides payable on a monthly basis at the annual rate of 0.55% of the Fund’s average daily net assets. From time to time, the Investment Adviser may waive all or a portion of its fee.
Out of the unitary management fee, the Investment Adviser pays substantially all expenses of the Fund, including the licensing fee of the Index provider, and the cost of transfer agency, custody, fund administration, legal, audit and other services, except for interest expenses, distribution fees or expenses, brokerage expenses, taxes and extraordinary expenses not incurred in the ordinary course of the Fund’s business. In addition, the Investment Adviser’s unitary management fee is designed to compensate the Investment Adviser for providing services for the Fund.
ALPS Fund Services, Inc. (“ALPS”), an affiliate of the Investment Adviser, is the administrator of the Fund.
The Bank of New York Mellon is the custodian, fund accounting agent and transfer agent for the Fund.
Each Trustee who is not an officer or employee of the Investment Adviser, any subadviser or any of their affiliates (“Independent Trustees”) is paid a quarterly retainer of $3,500, $1,500 for each regularly scheduled Board meeting attended and $750 for each special meeting held outside of regularly scheduled meetings.
| | | | |
| | | | 19 |
| Semi-Annual (Unaudited) | May 31, 2012 | |
| | |
| | NOTES TO FINANCIAL STATEMENTS |
| | May 31, 2012 (Unaudited) |
4. PURCHASES AND SALES OF SECURITIES
For the six months ended May 31, 2012, the cost of purchases and proceeds from sales of investment securities, excluding in-kind transactions and short-term investments, were as follows:
| | |
| Purchases | | Sales |
$1,257,852 | | $875,650 |
For the six months ended May 31, 2012, the cost of in-kind purchases and proceeds from in-kind sales were as follows:
| | |
| Purchases | | Sales |
$9,671,084 | | $610,874 |
Gains on in-kind transactions are not considered taxable for federal income tax purposes.
As of May 31, 2012, the costs of investments for federal income tax purposes and accumulated net unrealized appreciation/(depreciation) on investments were as follows:
| | | | |
Gross Appreciation (excess of value over tax cost) | | $ | 4,649,610 | |
Gross Depreciation (excess of tax cost over value) | | | (3,598,574 | ) |
| |
Net unrealized depreciation | | $ | 1,051,036 | |
| |
Cost of investment for income tax purposes | | $ | 61,400,231 | |
| |
5. CAPITAL SHARE TRANSACTIONS
Shares are created and redeemed by the Fund only in Creation Unit size aggregations of 50,000 shares. Only broker-dealers or large institutional investors with creation and redemption agreements called Authorized Participants (“AP”) are permitted to purchase or redeem Creation Units from the Fund. Such transactions are generally permitted on an in-kind basis, with a balancing cash component to equate the transaction to the net asset value per unit of the Fund on the transaction date. Cash may be substituted equivalent to the value of certain securities generally when they are not available in sufficient quantity for delivery, not eligible for trading by the AP or as a result of other market circumstances.
6. INDEMNIFICATIONS
Under the Trust’s organizational documents, its officers and Trustees are indemnified against certain liability arising out of the performance of their duties to the Trust. Additionally, in the normal course of business, the Trust enters into contracts with service providers that contain general indemnification clauses. The Trust’s maximum exposure under these arrangements is unknown, as this would involve future claims that may be made against the Trust that have not yet occurred.
| | | | | | |
20 | | | | | | |
| | An ALPS Advisors, Inc. Solution | www.alpsetfs.com | 866.513.5856 |
|
NOTES TO FINANCIAL STATEMENTS |
May 31, 2012 (Unaudited) |
7. NEW ACCOUNTING PRONOUNCEMENTS
In May 2011, the FASB issued ASU No. 2011-04 “Amendments to Achieve Common Fair Value Measurement and Disclosure Requirements” in GAAP and the International Financial Reporting Standards (“IFRSs”). ASU No. 2011-04 amends FASB ASC Topic 820, “Fair Value Measurements and Disclosures”, to establish common requirements for measuring fair value and for disclosing information about fair value measurements in accordance with GAAP and IFRSs. ASU No. 2011-04 is effective for fiscal years beginning after December 15, 2011 and for interim periods within those fiscal years. Management is currently evaluating the impact these amendments may have on the Funds financial statements.
In December 2011, the FASB issued ASU No. 2011-11 “Disclosures about Offsetting Assets and Liabilities” to expand current disclosure requirements on the offsetting of certain assets and liabilities. The new disclosures will be required for investments and derivative financial instruments subject to master netting or similar agreements which are eligible for offset in the Statements of Assets and Liabilities and will require an entity to disclose both gross and net information about such investments and transactions in the financial statements. The guidance is effective for financial statements with fiscal years beginning on or after January 1, 2013, and interim periods within those fiscal years. Management is evaluating the impact of this guidance on the Funds’ financial statement disclosures.
| | | | |
| | | | 21 |
| Semi-Annual (Unaudited) | May 31, 2012 | |
| | |
| | ADDITIONAL INFORMATION |
| | May 31, 2012 (Unaudited) |
PROXY VOTING POLICIES AND PROCEDURES
A description of the Fund’s proxy voting policies and procedures used in determining how to vote for proxies and information regarding how the Fund voted proxies related to portfolio securities during the most recent 12-month period ended June 30th is available without charge, (1) on the Securities and Exchange Commission’s (“SEC”) website at http://www.sec.gov; (2) upon request, by calling 1-866-513-5856; and (3) on the Trust’s website located at http://www.alpsfunds.com.
PORTFOLIO HOLDINGS
The Trust will file its complete schedule of portfolio holdings with the SEC for the first and third quarters of each fiscal year on Form N-Q. The Trust’s Form N-Q will be available (1) on the SEC’s website at http://www.sec.gov; (2) by calling 1-866-513-5856; (3) on the Trust’s website located at http://www.alpsfunds.com; and (4) for review and copying at the SEC’s Public Reference Room (“PRR”) in Washington D.C. Information regarding the operation of the PRR may be obtained by calling 1-800-732-0330.
| | | | | | |
22 | | | | | | |
| | An ALPS Advisors, Inc. Solution | www.alpsetfs.com | 866.513.5856 |
Intentionally Left Blank
Intentionally Left Blank

| | |
| | PERFORMANCE OVERVIEW |
| | JEFFERIES | TR/J CRB GLOBAL COMMODITY EQUITY INDEX FUND | May 31, 2012 (Unaudited) |
The jefferies | TR/J CRB global Commodity Equity Index Fund is an Exchange Traded Fund (“ETF”), which provides exposure to the equity securities of a global universe of listed companies engaged in the production and distribution of commodities and commodity-related products and services in the agriculture, base/industrial metals, energy and precious metals sectors. The ETF seeks investment results that replicate as closely as possible, before fees and expenses, the price and yield performance of the Thomson Reuters/Jefferies CRB in-The-Ground Global Commodity Equity Index.
For the six-month period ended May 31, 2012, the ETF’s market price decreased 10.24% and its net asset value (“NAV”) decreased 9.79%. Over the same time period the ETF’s benchmark was down 9.45%.
| | | | |
TOP 10 HOLDINGS^ (% of Total Investments) | | | | |
Exxon Mobil Corp. | | | 6.6 | % |
Monsanto Co. | | | 6.2 | % |
Potash Corp. of Saskatchewan, Inc. | | | 5.0 | % |
Syngenta AG | | | 4.5 | % |
Deere & Co. | | | 4.4 | % |
Chevron Corp. | | | 3.5 | % |
Archer-Daniels-Midland Co. | | | 3.1 | % |
BP Plc | | | 2.0 | % |
Royal Dutch Shell Plc, Class A | | | 2.0 | % |
The Mosaic Co. | | | 2.0 | % |
Total % of Top 10 Holdings | | | 39.3 | % |
^ Future holdings are subject to change | | | | |
| | | | |
COUNTRY ALLOCATION (% of Total Investments) | | | | |
United States | | | 40.1 | % |
Canada | | | 16.5 | % |
United Kingdom | | | 9.9 | % |
Switzerland | | | 4.9 | % |
Russia | | | 3.7 | % |
Australia | | | 2.2 | % |
South Africa | | | 2.2 | % |
Netherlands | | | 2.0 | % |
Malaysia | | | 1.6 | % |
France | | | 1.6 | % |
Other | | | 15.3 | % |
AVERAGE ANNUAL TOTAL RETURN as of 5.31.12
| | | | |
| | | 1 Year | | Since Inception*
Annualized |
Jefferies | TR/J CRB Global Commodity Equity Index Fund | | | | |
NAV | | -21.24% | | 1.44% |
Market Price** | | -21.38% | | 1.16% |
Thomson Reuters/Jefferies CRB In-The-Ground Global Commodity Equity Index | | -20.77% | | 2.23% |
S&P GSCI Commodity Index | | -16.48% | | 2.06% |
S&P 500® Index | | -0.41% | | 10.10% |
Total Expense Ratio (per the current prospectus) 0.65%
| * | The Fund commenced Investment Operations on September 18, 2009 with an Inception Date, the first day of trading on the Exchange, of September 21, 2009. |
| ** | Market Price is based on the midpoint of the bid/ask spread at 4 p.m. ET and does not represent the returns an investor would receive if shares were traded at other times. |
Performance data quoted represents past performance. Past performance does not guarantee future results. Investment return and principal value of an investment will fluctuate so that an investor’s shares, when sold or redeemed, may be worth more or less than the original cost. Current performance data may be higher or lower than actual data quoted. For the most current month-end performance data please visit JAMFUNDS.COM.
NAV is an exchange-traded fund’s per-share value. The per-share dollar amount of the fund is derived by dividing the total value of all the securities in its portfolio, less any liabilities, by the number of fund shares outstanding. Market Price is the price at which a share can currently be traded in the market. Information detailing the number of days the Market Price of the Fund was greater than the Fund’s NAV and the number of days it was less than the Fund’s NAV can be obtained at www.alpsfunds.com.
Thomson Reuters/Jefferies CRB In-The-Ground Global Commodity Equity Index: measures the performance of equity securities of companies engaged in the production and distribution of certain commodities and commodity-related products. S&P GSCI Commodity Index: A composite index of commodity sector returns which represents a broadly diversified, unleveraged, long-only position in commodity futures. S&P 500® Index: the Standard & Poor’s composite index of 500 stocks, a widely recognized, unmanaged index of common stock prices. Index return does not represent fund return. An investor can not invest directly in an index.
GROWTH OF A HYPOTHETICAL $10,000 INVESTMENT as of 5.31.12
Comparison of Change in Value of a hypothetical $10,000 investment in the Jefferies | TR/J CRB Global Commodity Equity Index Fund.
| | |
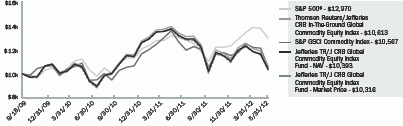 | | The chart represents historical performance of a hypothetical investment of $10,000 in the Fund over the life of the Fund. Performance calculations are as of the end of each month. Past performance does not guarantee future results. This chart does not reflect the deduction of taxes that a shareholder would pay on Fund distributions or the redemption of Fund shares. |
| | |
| | | |
2 | | Semi-Annual Report (Unaudited) | May 31, 2012 |
| | | |
| | |
| | DISCLOSURE OF FUND EXPENSES |
| | For the Six Months Ended May 31, 2012 (Unaudited) |
Shareholder Expense Example: As a shareholder of the Fund, you incur two types of costs: (1) transaction costs which may include creation and redemption fees or brokerage charges, and (2) ongoing costs, including management fees and other Fund expenses. These examples are intended to help you understand your ongoing costs (in dollars) of investing in the Fund and to compare these costs with the ongoing costs of investing in other funds. It is based on an investment of $1,000 invested at December 1, 2011 and held through the period ended May 31, 2012.
Actual Return: The first line of the table provides information about actual account values and actual expenses. You may use the information in this table, together with the amount you invested, to estimate the expenses that you incurred over the period. Simply divide your account value by $1,000 (for example, an $8,600 account value divided by $1,000 = 8.6), then multiply the result by the number in the first table under the heading entitled “Expenses Paid During the Period” to estimate the expenses attributable to your investment during this period.
Hypothetical 5% Return: The second line of the table provides information about hypothetical account values and hypothetical expenses based on the Fund’s actual expense ratio and an assumed rate of return of 5% per year before expenses, which is not the Fund’s actual return. The hypothetical account values and expenses may not be used to estimate the actual ending account balance or expenses you paid for the period. You may use this information to compare ongoing costs of investing in the Fund and other funds. To do so, compare this 5% hypothetical example with the 5% hypothetical examples that appear in the shareholder reports of the other funds.
The expenses shown in the table are meant to highlight ongoing Fund costs only and do not reflect any transaction costs, such as creation and redemption fees, or brokerage charges. Therefore, the second table is useful in comparing ongoing costs only, and will not help you determine the relative total costs of owning different funds. In addition, if these costs were included, your costs would have been higher.
| | | | | | | | | | | | | | |
| | | Beginning
Account Value
12/01/11 | | | Ending
Account Value
5/31/12 | | | Expense Ratio(a) | | Expenses Paid During the Period
12/01/11 -
5/31/12(b) | |
Jefferies | TR/J CRB Global Commodity Equity Index Fund | | | | | | | | | | | | | | |
Actual | | $ | 1,000.00 | | | $ | 902.10 | | | 0.65% | | $ | 3.09 | |
Hypothetical (5% return before expenses) | | $ | 1,000.00 | | | $ | 1,021.75 | | | 0.65% | | $ | 3.29 | |
| (a) | The Fund’s expense ratio has been based on the Fund’s most recent fiscal half-year expenses. |
| (b) | The example in the table above is equal to the Fund’s annualized expense ratio multiplied by the average account value over the period, multiplied by the number of days in the most recent fiscal half year (183), then divided by 366. |
| | |
| | SCHEDULE OF INVESTMENTS |
| �� | JEFFERIES | TR/J CRB GLOBAL COMMODITY EQUITY INDEX FUND | May 31, 2012 (Unaudited) |
| | | | | | | | |
| Security Description | | Shares | | | Value | |
COMMON STOCKS (99.22%) | |
Australia (2.20%) | | | | | | | | |
Fortescue Metals Group, Ltd. | | | 30,804 | | | $ | 138,038 | |
Incitec Pivot, Ltd. | | | 192,111 | | | | 529,200 | |
Newcrest Mining, Ltd. | | | 28,815 | | | | 696,492 | |
Nufarm, Ltd. | | | 28,018 | | | | 134,521 | |
Woodside Petroleum, Ltd. | | | 8,602 | | | | 268,411 | |
| | | | | | | | |
| | | | | | | 1,766,662 | |
| | | | | | | | |
| | |
Bermuda (1.25%) | | | | | | | | |
Bunge, Ltd. | | | 16,200 | | | | 963,900 | |
Sinofert Holdings, Ltd. | | | 212,000 | | | | 36,604 | |
| | | | | | | | |
| | | | | | | 1,000,504 | |
| | | | | | | | |
| | |
Brazil (1.51%) | | | | | | | | |
Companhia Siderurgica Nacional SA, ADR | | | 16,125 | | | | 104,490 | |
Gerdau SA, ADR | | | 18,893 | | | | 150,199 | |
Petroleo Brasileiro SA, ADR | | | 22,594 | | | | 441,939 | |
Vale SA, ADR | | | 27,864 | | | | 510,190 | |
| | | | | | | | |
| | | | | | | 1,206,818 | |
| | | | | | | | |
| | |
Canada (16.41%) | | | | | | | | |
Agnico-Eagle Mines, Ltd. | | | 6,432 | | | | 240,067 | |
Agrium, Inc. | | | 18,742 | | | | 1,463,461 | |
Barrick Gold Corp. | | | 37,614 | | | | 1,473,984 | |
Cameco Corp. | | | 8,214 | | | | 157,492 | |
Canadian Natural Resources, Ltd. | | | 14,709 | | | | 421,190 | |
Eldorado Gold Corp. | | | 26,716 | | | | 295,584 | |
EnCana Corp. | | | 10,505 | | | | 209,329 | |
First Quantum Minerals, Ltd. | | | 9,728 | | | | 169,897 | |
Goldcorp, Inc. | | | 30,306 | | | | 1,103,047 | |
IAMGOLD Corp. | | | 13,732 | | | | 146,759 | |
Inmet Mining Corp. | | | 2,043 | | | | 85,602 | |
Ivanhoe Mines, Ltd.* | | | 9,879 | | | | 92,991 | |
Kinross Gold Corp. | | | 42,752 | | | | 342,165 | |
New Gold, Inc.* | | | 16,086 | | | | 141,789 | |
Osisko Mining Corp.* | | | 14,407 | | | | 107,239 | |
Pan American Silver Corp. | | | 3,433 | | | | 57,504 | |
Potash Corp. of Saskatchewan, Inc. | | | 101,376 | | | | 4,003,951 | |
SEMAFO, Inc. | | | 8,956 | | | | 45,394 | |
Silver Wheaton Corp. | | | 13,268 | | | | 339,834 | |
Suncor Energy, Inc. | | | 21,995 | | | | 595,211 | |
Teck Resources, Ltd., Class B | | | 9,671 | | | | 288,879 | |
TransCanada Corp. | | | 9,845 | | | | 402,335 | |
Viterra, Inc. | | | 36,240 | | | | 559,799 | |
Yamana Gold, Inc. | | | 28,045 | | | | 410,467 | |
| | | | | | | | |
| | | | | | | 13,153,970 | |
| | | | | | | | |
| |
Cayman Islands (0.00%)(a) | | | | | |
Chaoda Modern Agriculture Holdings, Ltd.* | | | 348,000 | | | | 448 | |
| | | | | | | | |
| | | | | | | | |
| Security Description | | Shares | | | Value | |
Chile (0.38%) | | | | | | | | |
Sociedad Quimica y Minera de Chile SA, ADR | | | 5,833 | | | $ | 303,141 | |
| | | | | | | | |
| | |
China (1.29%) | | | | | | | | |
China BlueChemical, Ltd.,
Class H* | | | 218,000 | | | | 150,561 | |
China Petroleum & Chemical Corp., Class H | | | 228,000 | | | | 203,003 | |
China Shenhua Energy Co., Ltd., Class H | | | 48,500 | | | | 170,919 | |
Jiangxi Copper Co., Ltd., Class H | | | 28,000 | | | | 58,880 | |
PetroChina Co., Ltd.,
Class H | | | 300,000 | | | | 379,598 | |
Zijin Mining Group Co., Ltd., Class H* | | | 227,000 | | | | 71,953 | |
| | | | | | | | |
| | | | | | | 1,034,914 | |
| | | | | | | | |
| | |
France (1.60%) | | | | | | | | |
Total SA | | | 29,916 | | | | 1,285,945 | |
| | | | | | | | |
| | |
Germany (1.17%) | | | | | | | | |
K+S AG | | | 20,409 | | | | 813,819 | |
ThyssenKrupp AG | | | 7,699 | | | | 127,037 | |
| | | | | | | | |
| | | | | | | 940,856 | |
| | | | | | | | |
| | |
Great Britain (0.04%) | | | | | | | | |
Evraz Plc | | | 6,524 | | | | 29,652 | |
| | | | | | | | |
| | |
Hong Kong (0.69%) | | | | | | | | |
China Agri-Industries Holdings, Ltd. | | | 191,000 | | | | 137,574 | |
CNOOC, Ltd. | | | 228,000 | | | | 412,470 | |
| | | | | | | | |
| | | | | | | 550,044 | |
| | | | | | | | |
| | |
India (0.36%) | | | | | | | | |
Reliance Industries, Ltd., GDR(b) | | | 11,477 | | | | 277,973 | |
Sterlite Industries India, Ltd., ADR | | | 1,928 | | | | 12,860 | |
| | | | | | | | |
| | | | | | | 290,833 | |
| | | | | | | | |
| | |
Israel (0.97%) | | | | | | | | |
Israel Chemicals, Ltd. | | | 50,554 | | | | 524,038 | |
The Israel Corp., Ltd. | | | 454 | | | | 254,857 | |
| | | | | | | | |
| | | | | | | 778,895 | |
| | | | | | | | |
| | |
Italy (0.84%) | | | | | | | | |
Eni SpA | | | 35,097 | | | | 676,973 | |
| | | | | | | | |
| | |
Japan (0.89%) | | | | | | | | |
INPEX Corp. | | | 31 | | | | 179,086 | |
JFE Holdings, Inc. | | | 9,900 | | | | 160,592 | |
Nippon Steel Corp. | | | 113,000 | | | | 253,625 | |
Sumitomo Metal Industries, Ltd. | | | 72,000 | | | | 116,610 | |
| | | | | | | | |
| | | | | | | 709,913 | |
| | | | | | | | |
| | |
| | | |
4 | | Semi-Annual Report (Unaudited) | May 31, 2012 |
| | | |
| | |
| | SCHEDULE OF INVESTMENTS |
| | JEFFERIES | TR/J CRB GLOBAL COMMODITY EQUITY INDEX FUND | May 31, 2012 (Unaudited) |
| | | | | | | | |
| Security Description | | Shares | | | Value | |
Jersey (0.61%) | | | | | | | | |
Glencore International Plc | | | 44,100 | | | $ | 231,120 | |
Randgold Resources, Ltd. | | | 3,223 | | | | 257,707 | |
| | | | | | | | |
| | | | | | | 488,827 | |
| | | | | | | | |
| | |
Luxembourg (0.46%) | | | | | | | | |
ArcelorMittal | | | 19,048 | | | | 263,193 | |
Tenaris SA, ADR | | | 3,379 | | | | 105,357 | |
| | | | | | | | |
| | | | | | | 368,550 | |
| | | | | | | | |
| | |
Malaysia (1.62%) | | | | | | | | |
Genting Plantations BHD | | | 29,900 | | | | 88,142 | |
IOI Corp., BHD | | | 343,800 | | | | 569,071 | |
Kuala Lumpur Kepong BHD | | | 49,420 | | | | 348,398 | |
PPB Group BHD | | | 55,100 | | | | 295,326 | |
| | | | | | | | |
| | | | | | | 1,300,937 | |
| | | | | | | | |
| | |
Mauritius (0.45%) | | | | | | | | |
Golden Agri-Resources, Ltd. | | | 717,000 | | | | 361,629 | |
| | | | | | | | |
| | |
Mexico (0.26%) | | | | | | | | |
Grupo Mexico SAB de CV, Series B | | | 79,406 | | | | 210,012 | |
| | | | | | | | |
| | |
Netherlands (1.96%) | | | | | | | | |
CNH Global N.V.* | | | 3,239 | | | | 123,860 | |
Nutreco Holding N.V. | | | 3,854 | | | | 252,893 | |
Schlumberger, Ltd. | | | 18,900 | | | | 1,195,425 | |
| | | | | | | | |
| | | | | | | 1,572,178 | |
| | | | | | | | |
| | |
Norway (0.98%) | | | | | | | | |
Norsk Hydro ASA | | | 15,800 | | | | 65,583 | |
Yara International ASA | | | 19,212 | | | | 723,273 | |
| | | | | | | | |
| | | | | | | 788,856 | |
| | | | | | | | |
| | |
Peru (0.40%) | | | | | | | | |
Companhia de Minas Buenaventura SA, ADR | | | 8,183 | | | | 320,282 | |
| | | | | | | | |
| | |
Russia (3.66%) | | | | | | | | |
Gazprom OAO, ADR* | | | 83,461 | | | | 731,536 | |
LUKOIL OAO, ADR* | | | 8,335 | | | | 432,586 | |
Mechel Steel Group, ADR | | | 1,564 | | | | 8,305 | |
MMC Norilsk Nickel, ADR* | | | 16,310 | | | | 241,714 | |
NovaTek OAO, GDR (c) | | | 1,343 | | | | 127,585 | |
Phosagro OAO, GDR (c) | | | 13,244 | | | | 117,872 | |
Rosneft Oil Co., GDR*(c) | | | 23,211 | | | | 142,748 | |
Uralkali, GDR (c) | | | 32,581 | | | | 1,127,302 | |
| | | | | | | | |
| | | | | | | 2,929,648 | |
| | | | | | | | |
| | |
Singapore (1.34%) | | | | | | | | |
Olam International, Ltd. | | | 225,000 | | | | 290,689 | |
Wilmar International, Ltd. | | | 275,000 | | | | 780,989 | |
| | | | | | | | |
| | | | | | | 1,071,678 | |
| | | | | | | | |
| | | | | | | | |
| Security Description | | Shares | | | Value | |
South Africa (2.15%) | | | | | | | | |
Anglo Platinum, Ltd. | | | 1,743 | | | $ | 96,934 | |
AngloGold Ashanti, Ltd., ADR | | | 14,443 | | | | 520,815 | |
Gold Fields, Ltd. | | | 24,518 | | | | 327,019 | |
Harmony Gold Mining Co., Ltd. | | | 13,815 | | | | 136,370 | |
Impala Platinum Holdings, Ltd. | | | 17,025 | | | | 266,472 | |
Kumba Iron Ore, Ltd. | | | 1,183 | | | | 72,545 | |
Sasol, Ltd. | | | 7,170 | | | | 302,459 | |
| | | | | | | | |
| | | | | | | 1,722,614 | |
| | | | | | | | |
| | |
South Korea (0.53%) | | | | | | | | |
POSCO | | | 1,394 | | | | 427,560 | |
| | | | | | | | |
| | |
Spain (0.26%) | | | | | | | | |
Repsol YPF SA | | | 13,806 | | | | 206,211 | |
| | | | | | | | |
| | |
Switzerland (4.86%) | | | | | | | | |
Syngenta AG | | | 11,147 | | | | 3,567,499 | |
Transocean, Ltd. | | | 4,913 | | | | 200,598 | |
Weatherford International, Ltd.* | | | 10,600 | | | | 127,306 | |
| | | | | | | | |
| | | | | | | 3,895,403 | |
| | | | | | | | |
| | |
Taiwan (0.49%) | | | | | | | | |
China Steel Corp. | | | 216,258 | | | | 202,869 | |
Taiwan Fertilizer Co., Ltd. | | | 81,000 | | | | 188,334 | |
| | | | | | | | |
| | | | | | | 391,203 | |
| | | | | | | | |
| |
United Kingdom (9.81%) | | | | | |
Anglo American Plc | | | 23,590 | | | | 715,642 | |
Antofagasta Plc | | | 7,218 | | | | 111,318 | |
BG Group Plc | | | 46,397 | | | | 887,294 | |
BHP Billiton Plc | | | 42,027 | | | | 1,096,102 | |
BP Plc | | | 267,535 | | | | 1,626,106 | |
Kazakhmys Plc | | | 5,239 | | | | 53,623 | |
Lonmin Plc | | | 5,049 | | | | 54,670 | |
Petropavlosk Plc | | | 5,428 | | | | 30,661 | |
Rio Tinto Plc | | | 26,961 | | | | 1,153,618 | |
Royal Dutch Shell Plc, Class A | | | 51,683 | | | | 1,599,503 | |
Xstrata Plc | | | 37,582 | | | | 533,614 | |
| | | | | | | | |
| | | | | | | 7,862,151 | |
| | | | | | | | |
| | |
United States (39.78%) | | | | | | | | |
AGCO Corp.* | | | 11,366 | | | | 457,027 | |
Alcoa, Inc. | | | 22,155 | | | | 189,425 | |
Allegheny Technologies, Inc. | | | 2,159 | | | | 69,347 | |
Allied Nevada Gold Corp.* | | | 2,998 | | | | 77,768 | |
Anadarko Petroleum Corp. | | | 7,004 | | | | 427,244 | |
Apache Corp. | | | 5,468 | | | | 444,986 | |
Archer-Daniels-Midland Co. | | | 76,777 | | | | 2,447,651 | |
Baker Hughes, Inc. | | | 6,224 | | | | 259,728 | |
Cameron International Corp.* | | | 3,469 | | | | 158,499 | |
CF Industries Holdings, Inc. | | | 7,750 | | | | 1,324,940 | |
Chesapeake Energy Corp. | | | 9,302 | | | | 157,204 | |
Chevron Corp. | | | 28,079 | | | | 2,760,446 | |
Cliffs Natural Resources, Inc. | | | 2,964 | | | | 141,620 | |
Coeur d’Alene Mines Corp.* | | | 2,953 | | | | 49,906 | |
ConocoPhillips | | | 18,055 | | | | 941,749 | |
CONSOL Energy, Inc. | | | 3,232 | | | | 90,755 | |
| | |
| | SCHEDULE OF INVESTMENTS |
| | JEFFERIES | TR/J CRB GLOBAL COMMODITY EQUITY INDEX FUND | May 31, 2012 (Unaudited) |
| | | | | | | | |
| Security Description | | Shares | | | Value | |
United States (continued) | | | | | | | | |
Corn Products International, Inc. | | | 8,873 | | | $ | 453,322 | |
Deere & Co. | | | 47,652 | | | | 3,520,053 | |
Devon Energy Corp. | | | 5,295 | | | | 315,158 | |
EOG Resources, Inc. | | | 3,809 | | | | 378,234 | |
Exxon Mobil Corp. | | | 66,718 | | | | 5,246,036 | |
Freeport-McMoRan Copper & Gold, Inc. | | | 19,610 | | | | 628,304 | |
Halliburton Co. | | | 13,123 | | | | 394,477 | |
Hecla Mining Co. | | | 9,198 | | | | 39,091 | |
Hess Corp. | | | 4,603 | | | | 201,151 | |
Intrepid Potash, Inc.* | | | 6,487 | | | | 127,340 | |
Kinder Morgan, Inc. | | | 9,700 | | | | 331,643 | |
Marathon Oil Corp. | | | 9,936 | | | | 247,506 | |
Monsanto Co. | | | 63,398 | | | | 4,894,326 | |
The Mosaic Co. | | | 32,774 | | | | 1,562,664 | |
National Oilwell Varco, Inc. | | | 5,947 | | | | 396,962 | |
Newmont Mining Corp. | | | 18,413 | | | | 868,357 | |
Noble Energy, Inc. | | | 2,484 | | | | 209,799 | |
Nucor Corp. | | | 6,565 | | | | 234,764 | |
Occidental Petroleum Corp. | | | 11,344 | | | | 899,239 | |
Peabody Energy Corp. | | | 3,864 | | | | 90,263 | |
Royal Gold, Inc. | | | 2,116 | | | | 143,126 | |
Southern Copper Corp. | | | 3,389 | | | | 96,417 | |
Southwestern Energy Co.* | | | 4,877 | | | | 136,702 | |
United States Steel Corp. | | | 2,987 | | | | 60,636 | |
Valero Energy Corp. | | | 7,678 | | | | 162,006 | |
The Williams Co., Inc. | | | 8,358 | | | | 255,170 | |
| | | | | | | | |
| | | | | | | 31,891,041 | |
| | | | | | | | |
| |
TOTAL COMMON STOCKS | | | | | |
(Cost $97,491,495) | | | | | | | 79,538,348 | |
| | | | | | | | |
| |
TOTAL INVESTMENTS (99.22%) | | | | | |
(Cost $97,491,495) | | | | | | | 79,538,348 | |
| |
NET OTHER ASSETS AND LIABILITIES (0.78%) | | | | 623,737 | |
| | | | | | | | |
| |
NET ASSETS (100.00%) | | | $ | 80,162,085 | |
| | | | | | | | |
| | |
* Non-income producing security. (a) Less than 0.005% of Net Assets. (b) Security exempt from registration under Rule 144A of the Securities Act of 1933. This security may be resold in transactions exempt from registration, normally to qualified institutional buyers. At period end, the market value of this security restricted under Rule 144A was $277,973, representing 0.35% of the Fund’s net assets. (c) These securities initially sold to other parties pursuant to Regulation S under the 1933 Act and subsequently resold to the Fund. At the period end, the aggregate market value of this security was $1,515,507, representing 1.89% of the Fund’s net assets. | | |
Common Abbreviations:
| ADR - | American Depositary Receipt. |
| AG - | Aktiengesellschaft is a German term that refers to a corporation that is limited by shares, i.e., owned by shareholders. |
| ASA - | Allmennaksjeselskap is the Norwegian term for public limited company. |
| BHD - | Berhad (in Malaysia; equivalent to Public Limited Company). |
| GDR - | Global Depository Receipt. |
| N.V. - | Naamloze Vennootschap is the Dutch term for a public limited liability corporation. |
| OAO - | Otkytoe Aktsionernoe Obshchestvo (open Joint Stock Corporation) is a Russian term for a stock-based corporation. |
| SA - | Generally designated corporations in various countries, mostly those employing the civil law. |
SAB de CV -A variable capital company.
| SpA - | Società Per Azioni is an Italian shared company. |
See Notes to Financial Statements.
| | |
| | | |
6 | | Semi-Annual Report (Unaudited) | May 31, 2012 |
| | | |
| | |
| | STATEMENT OF ASSETS & LIABILITIES |
| | JEFFERIES | TR/J CRB GLOBAL COMMODITY EQUITY INDEX FUND | May 31, 2012 (Unaudited) |
| | | | |
ASSETS: | | | | |
Investments, at value | | $ | 79,538,348 | |
Cash | | | 389,502 | |
Foreign currency, at value (Cost $11,449) | | | 11,302 | |
Foreign tax reclaims | | | 48,509 | |
Interest and dividends receivable | | | 220,593 | |
| | |
Total Assets | | | 80,208,254 | |
| | |
| |
LIABILITIES: | | | | |
Payable to advisor | | | 46,169 | |
| | |
Total Liabilities | | | 46,169 | |
| | |
NET ASSETS | | $ | 80,162,085 | |
| | |
| |
NET ASSETS CONSIST OF: | | | | |
Paid-in capital | | $ | 100,789,961 | |
Undistributed net investment income | | | 468,459 | |
Accumulated net realized loss on investments and foreign currency transactions | | | (3,140,250 | ) |
Net unrealized depreciation on investments and translation of assets and liabilities denominated in foreign currencies | | | (17,956,085 | ) |
| | |
NET ASSETS | | $ | 80,162,085 | |
| | |
| |
INVESTMENTS, AT COST | | $ | 97,491,495 | |
| |
PRICING OF SHARES | | | | |
Net Assets | | $ | 80,162,085 | |
Shares of beneficial interest outstanding (Unlimited number of shares authorized, par value $0.01 per share) | | | 2,000,020 | |
Net Asset Value, offering and redemption price per share | | $ | 40.08 | |
See Notes to Financial Statements.
| | |
| | STATEMENTS OF OPERATIONS |
| | JEFFERIES | TR/J CRB GLOBAL COMMODITY EQUITY INDEX FUND |
| | | | | | | | |
| | | For the Six Months Ended
May 31, 2012
(Unaudited) | | | For the Period
January 1, 2011 to
November 30, 2011(a) | |
INVESTMENT INCOME: | | | | | | | | |
Dividends (b) | | $ | 995,445 | | | $ | 2,270,769 | |
| | |
Total Investment Income | | | 995,445 | | | | 2,270,769 | |
| | |
| | |
EXPENSES: | | | | | | | | |
Investment advisory fee | | | 285,089 | | | | 760,339 | |
| | |
Total Net Expenses | | | 285,089 | | | | 760,339 | |
| | |
NET INVESTMENT INCOME | | | 710,356 | | | | 1,510,430 | |
| | |
| | |
Net realized gain/(loss) on investments | | | (785,457 | ) | | | 7,331,222 | |
Net realized loss on foreign currency transactions | | | (4,174 | ) | | | (78,592 | ) |
Net change in unrealized depreciation on investments | | | (9,269,691 | ) | | | (23,593,900 | ) |
Net change in unrealized depreciation on translation of assets and liabilities in foreign currencies | | | (4,790 | ) | | | (888 | ) |
| | |
| | |
NET REALIZED AND UNREALIZED LOSS ON INVESTMENTS | | | (10,064,112 | ) | | | (16,342,158 | ) |
| | |
| | |
NET DECREASE IN NET ASSETS RESULTING FROM OPERATIONS | | $ | (9,353,756 | ) | | $ | (14,831,728 | ) |
| | |
| (a) | Effective March 7, 2011, the Board approved changing the fiscal year end of the Fund from December 31 to November 30. |
| (b) | Net of foreign tax withholdings of $71,791 and $143,298, respectively. |
See Notes to Financial Statements.
| | |
| | | |
8 | | Semi-Annual Report (Unaudited) | May 31, 2012 |
| | | |
| | |
| | STATEMENTS OF CHANGES IN NET ASSETS |
| | JEFFERIES | TR/J CRB GLOBAL COMMODITY EQUITY INDEX FUND |
| | | | | | | | | | | | |
| | | For the Six Months Ended
May 31, 2012 (Unaudited) | | | For the Period
January 1, 2011 to
November 30, 2011(a) | | | For the Year Ended
December 31, 2010 | |
OPERATIONS: | | | | | | | | | | | | |
Net investment income | | $ | 710,356 | | | $ | 1,510,430 | | | $ | 823,825 | |
Net realized gain(loss) on investments and foreign currency transactions | | | (789,631 | ) | | | 7,252,630 | | | | (464,490 | ) |
Net change in unrealized appreciation/ (depreciation) on investments and foreign currency | | | (9,274,481 | ) | | | (23,594,788 | ) | | | 11,822,126 | |
Net increase/(decrease) in net assets resulting from operations | | | (9,353,756 | ) | | | (14,831,728 | ) | | | 12,181,461 | |
| | | |
DISTRIBUTIONS TO SHAREHOLDERS: | | | | | | | | | | | | |
From net investment income | | | (434,323 | ) | | | (1,248,722 | ) | | | (873,185 | ) |
Total distributions | | | (434,323 | ) | | | (1,248,722 | ) | | | (873,185 | ) |
| | | |
SHARE TRANSACTIONS: | | | | | | | | | | | | |
Proceeds from sale of shares | | | 7,202,489 | | | | 55,309,332 | | | | 51,567,090 | |
Cost of shares redeemed | | | (8,791,669 | ) | | | (58,690,822 | ) | | | (22,531,834 | ) |
Net increase/(decrease) from share transactions | | | (1,589,180 | ) | | | (3,381,490 | ) | | | 29,035,256 | |
Net increase/(decrease) in net assets | | | (11,377,259 | ) | | | (19,461,940 | ) | | | 40,343,532 | |
| | | |
NET ASSETS: | | | | | | | | | | | | |
Beginning of period | | | 91,539,344 | | | | 111,001,284 | | | | 70,657,752 | |
End of period* | | $ | 80,162,085 | | | $ | 91,539,344 | | | $ | 111,001,284 | |
| | |
| | | |
*Including (over)/undistributed net investment income of: | | $ | 468,459 | | | $ | 192,426 | | | $ | (27,176 | ) |
| | | |
Other information: | | | | | | | | | | | | |
SHARE TRANSACTIONS: | | | | | | | | | | | | |
Beginning shares | | | 2,050,017 | | | | 2,250,001 | | | | 1,650,000 | |
Shares sold | | | 150,003 | | | | 1,050,016 | | | | 1,150,001 | |
Shares redeemed | | | (200,000 | ) | | | (1,250,000 | ) | | | (550,000 | ) |
Shares outstanding, end of period | | | 2,000,020 | | | | 2,050,017 | | | | 2,250,001 | |
| | |
| (a) | Effective March 7, 2011, the Board approved changing the fiscal year end of the Fund from December 31 to November 30. |
See Notes to Financial Statements.
| | |
| | FINANCIAL HIGHLIGHTS |
| | JEFFERIES | TR/J CRB GLOBAL COMMODITY EQUITY INDEX FUND |
| | For a Share Outstanding Throughout the Periods Presented |
| | | | | | | | | | | | | | | | |
| | | For the Six Months Ended
May 31, 2012
(Unaudited) | | | For the Period
January 1, 2011 to
November 30, 2011(a) | | | For the Year Ended
December 31, 2010 | | | For the Period Ended
September 21, 2009
(inception) through
December 31, 2009 | |
NET ASSET VALUE, BEGINNING OF PERIOD | | $ | 44.65 | | | $ | 49.33 | | | $ | 42.82 | | | $ | 39.74 | |
| | | | |
INCOME/(LOSS) FROM OPERATIONS: | | | | | | | | | | | | | | | | |
Net investment income | | | 0.36 | (b) | | | 0.58 | (b) | | | 0.46 | (b) | | | 0.12 | |
Net realized and unrealized gain/(loss) on investments | | | (4.71 | ) | | | (4.78 | ) | | | 6.54 | | | | 3.08 | |
Total from Investment Operations | | | (4.35 | ) | | | (4.20 | ) | | | 7.00 | | | | 3.20 | |
| | | | |
LESS DISTRIBUTIONS: | | | | | | | | | | | | | | | | |
From net investment income | | | (0.22 | ) | | | (0.48 | ) | | | (0.49 | ) | | | (0.12 | ) |
Total Distributions | | | (0.22 | ) | | | (0.48 | ) | | | (0.49 | ) | | | (0.12 | ) |
NET INCREASE/(DECREASE) IN NET ASSET VALUE | | | (4.57 | ) | | | (4.68 | ) | | | 6.51 | | | | 3.08 | |
NET ASSET VALUE, END OF PERIOD | | $ | 40.08 | | | $ | 44.65 | | | $ | 49.33 | | | $ | 42.82 | |
| | |
| TOTAL RETURN(c) | | | (9.79 | )% | | | (8.56 | )% | | | 16.60 | % | | | 8.06 | % |
| | | | |
RATIOS/ SUPPLEMENTAL DATA: | | | | | | | | | | | | | | | | |
Net assets, end of period (in 000s) | | $ | 80,162 | | | $ | 91,539 | | | $ | 111,001 | | | $ | 70,658 | |
| | | | |
RATIOS TO AVERAGE NET ASSETS: | | | | | | | | | | | | | | | | |
Net investment income | | | 1.62 | %(d) | | | 1.29 | %(d) | | | 1.09 | % | | | 1.53 | %(d) |
Operating Expenses | | | 0.65 | %(d) | | | 0.65 | %(d) | | | 0.65 | % | | | 0.65 | %(d) |
PORTFOLIO TURNOVER RATE(e) | | | 9 | % | | | 10 | % | | | 18 | % | | | 7 | % |
| (a) | Effective March 7, 2011, the Board approved changing the fiscal year end of the Fund from December 31 to November 30. |
| (b) | Calculated using average shares outstanding. |
| (c) | Total return is calculated assuming an initial investment made at the net asset value at the beginning of the period and redemption at the net asset value on the last day of the period and assuming all distributions are reinvested at actual reinvestment prices. Total return calculated for a period of less than one year is not annualized. |
| (e) | Portfolio turnover is not annualized and does not include securities received or delivered from processing creations or redemptions. |
See Notes to Financial Statements.
| | |
| | | |
10 | | Semi-Annual Report (Unaudited) | May 31, 2012 |
| | | |
| | |
| | NOTES TO FINANCIAL STATEMENTS |
| | May 31, 2012 (Unaudited) |
1. ORGANIZATION
The ALPS ETF Trust (the “Trust”) is an open-end management investment company organized as a Delaware statutory trust on September 13, 2007 and is registered with the Securities and Exchange Commission (“SEC”) under the Investment Company Act of 1940, as amended (the “1940 Act”). As of May 31, 2012, the Trust consists of four separate portfolios. Each portfolio represents a separate series of the Trust. This report pertains to the Jefferies | TR/J CRB Global Commodity Equity Index Fund (the “Fund”). The investment objective of the Fund is to seek investment results that correspond generally to the price and yield (before the Fund’s fees and expenses) of the Thomson Reuters/Jefferies CRB In-The-Ground Global Commodity Equity Index (the “Underlying Index”).
The Fund’s Shares (“Shares”) are listed on the New York Stock Exchange (“NYSE”) Arca. The Fund issues and redeems Shares, at net asset value (“NAV”) in blocks of 50,000 Shares, each of which is called a “Creation Unit.” Creation Units are issued and redeemed principally in-kind for securities included in a specified index. Except when aggregated in Creation Units, Shares are not redeemable securities of the Fund.
2. SIGNIFICANT ACCOUNTING POLICIES
The following is a summary of significant accounting policies consistently followed by the Fund in the preparation of the financial statements. The accompanying financial statements were prepared in accordance with accounting principles generally accepted in the United States of America (“U.S. GAAP”). The preparation of financial statements in conformity with U.S. GAAP requires management to make certain estimates and assumptions that affect the reported amounts of assets and liabilities and disclosures of contingent assets and liabilities at the date of the financial statements and the reported amounts of revenue and expenses during the period. Actual results could differ from those estimates.
A. Portfolio Valuation
The Fund’s NAV is determined daily, as of the close of regular trading on the NYSE, normally 4:00 p.m. Eastern time, on each day the NYSE is open for trading. The NAV is computed by dividing the value of all assets of the Fund (including accrued interest and dividends), less all liabilities (including accrued expenses and dividends declared but unpaid), by the total number of shares outstanding.
Portfolio securities listed on any exchange other than the National Association of Securities Dealer Automated Quotation (“NAS-DAQ”) exchange are valued at the last sale price on the business day as of which such value is being determined. If there has been no sale on such day, the securities are valued at the mean of the most recent bid and asked prices on such day. Securities traded on the NASDAQ are valued at the NASDAQ Official Closing Price as determined by NASDAQ. Portfolio securities traded on more than one securities exchange are valued at the last sale price on the business day as of which such value is being determined at the close of the exchange representing the principal market for such securities. Portfolio securities traded in the over-the-counter market, but excluding securities traded on the NASDAQ, are valued at the closing bid prices. Short-term investments that mature in less than 60 days are valued at amortized cost, which approximates market value.
The Fund’s investments are valued at market value or, in the absence of market value with respect to any portfolio securities, at fair value according to procedures adopted by the Trust’s Board of Trustees (the “Board”). When market quotations are not readily available or when events occur that make established valuation methods unreliable, securities of the Fund may be valued in good faith by or under the direction of the Board. These securities generally include, but are not limited to, restricted securities (securities which may not be publicly sold without registration under the Securities Act of 1933) for which a pricing service is unable to provide a market price; securities whose trading has been formally suspended; a security whose market price is not available from a pre-established primary pricing source or the pricing source is not willing to provide a price; a security with respect to which an event has occurred that is most likely to materially affect the value of the security after the market has closed but before the calculation of the Fund’s NAV or make it difficult or impossible to obtain a reliable market quotation; or a security whose price, as provided by the pricing service, does not reflect the security’s “fair value” due to the security being de-listed from a national exchange or the security’s primary trading market is temporarily closed at a time when, under normal conditions, it would be open. As a general principle, the current “fair value” of a security would be the amount which the owner might reasonably expect to receive from the closing sale prices on the applicable exchange and fair value prices may not reflect the actual value of a security. A variety of factors may be considered in determining the fair value of such securities.
B. Foreign Currency Translation and Foreign Investments
The Fund invests in foreign securities which may involve a number of risk factors and special considerations not present with investments in securities of U.S. Corporations. The accounting records of the Fund are maintained in U.S. dollars. Investment in non-U.S. issuers may involve unique risks compared to investing in securities of U.S. issuers. These risks may include, but
| | |
| | NOTES TO FINANCIAL STATEMENTS |
| | May 31, 2012 (Unaudited) |
are not limited to: (i) less information about non-U.S. issuers or markets may be available due to less rigorous disclosure, accounting standards or regulatory practices; (ii) many non-U.S. markets are smaller, less liquid and more volatile thus, in a changing market, the advisers may not be able to sell the Fund’s portfolio securities at times, in amounts and at prices they consider reasonable; (iii) currency exchange rates or controls may adversely affect the value of the Fund’s investments; (iv) the economies of non-U.S. countries may grow at slower rates than expected or may experience downturns or recessions; and, (v) withholdings and other non-U.S. taxes may decrease the Fund’s return.
Portfolio securities and other assets and liabilities denominated in a foreign currency are translated to U.S. dollars at the prevailing rates of exchange at period end. Amounts related to the purchases and sales of securities and investment income are translated into U.S. dollars at the prevailing exchange rate on the respective dates of transactions. The effects of changes in foreign currency exchange rates on portfolio investments are included in the net realized and unrealized gains and losses on investments. Net gains and losses on foreign currency transactions include disposition of foreign currencies, and currency gains and losses between the accrual and receipt dates of portfolio investment income and between the trade and settlement dates of portfolio investment transactions.
C. Securities Transactions and Investment Income
Securities transactions are recorded as of the trade date. Realized gains and losses from securities transactions are recorded on the identified cost basis. Dividend income is recorded on the ex-dividend date. Interest income, if any, is recorded on the accrual basis.
D. Federal Tax Information
The timing and character of income and capital gain distributions are determined in accordance with income tax regulations, which may differ from U.S. GAAP. Reclassifications are made to the Fund’s capital accounts for permanent tax differences to reflect income and gains available for distribution (or available capital loss carryforwards) under income tax regulations.
For the period ended November 30, 2011, permanent book and tax differences resulting primarily from differing treatment of foreign currency and in-kind transactions were identified and reclassified among the components of the Fund’s net assets as follows:
| | | | | | |
| | | Undistributed
Net Investment
Loss | | Accumulated
Net Realized
Loss | | Paid-in Capital |
Jefferies | TR/J CRB Global Commodity Equity Index Fund | | $ (42,106) | | $ (8,114,581) | | $ 8,156,687 |
Under the Regulated Investment Company Modernization Act of 2010 (“the Modernization Act”), net capital losses recognized in tax years beginning after December 22, 2010 may be carried forward indefinitely, and the character of the losses is retained as short-term and/or long-term. Under the law in effect prior to the Modernization Act, net capital losses were carried forward for eight years and treated as short-term. As a transition rule, the Modernization Act requires that post-enactment net capital losses be used before pre-enactment net capital losses. Additionally, post-enactment capital losses that are carried forward will retain their character as either short-term or long-term losses rather than being considered all short-term as under previous law.
At November 30, 2011, the Fund had available for tax purposes unused pre-enactment capital loss carryforwards as follows:
| | |
| | | Expiring December 31, 2018 |
Jefferies | TR/J CRB Global Commodity Equity Index Fund | | $ 684,426 |
At November 30, 2011, the Fund had available for tax purposes unused post-enactment capital loss carryforwards as follows:
| | | | |
| | | Short-Term | | Long-Term |
Jefferies | TR/J CRB Global Commodity Equity Index Fund | | $ 856,228 | | $ 177,522 |
E. Dividends and Distributions to Shareholders
Dividends from net investment income of the Fund, if any, are declared and paid quarterly or as the Board of Trustees may determine from time to time. Distributions of net realized capital gains earned by the Fund, if any, are distributed at least annually.
Distributions from net investment income and capital gains are determined in accordance with income tax regulations, which may differ from U.S. GAAP. These differences are primarily due to differing treatments of income and gains on various investment securities held by the Fund, timing differences and differing characterization of distributions made by the Fund.
| | |
| | | |
12 | | Semi-Annual Report (Unaudited) | May 31, 2012 |
| | | |
| | |
| | NOTES TO FINANCIAL STATEMENTS |
| | May 31, 2012 (Unaudited) |
The tax character of the distributions paid was as follows:
| | | | |
| | | Period Ended
November 30, 2011
Distributions paid from:
Ordinary Income | | Period Ended
December 31, 2010
Distributions paid from:
Ordinary Income |
Jefferies | TR/J CRB Global Commodity Equity Index Fund | | $ 1,248,722 | | $ 873,185 |
As of November 30, 2011, the components of distributable earnings on a tax basis for the Fund were as follows:
| | | | |
| | | Jefferies | TR/J CRB Global
Commodity Equity Index Fund | |
Undistributed net investment income | | | $ 192,405 | |
Accumulated Capital (losses) | | | (1,718,176 | ) |
Net unrealized depreciation on investments and translation of assets and liabilities denominated in foreign currencies | | | (9,314,047 | ) |
Other Cumulative Effect of Timing Differences | | | 21 | |
Total | | | $ (10,839,797 | ) |
The differences between book-basis and tax-basis are primarily due to the deferral of post-October losses and the differing treatment of certain other investments.
F. Income Taxes
No provision for income taxes is included in the accompanying financial statements, as the Fund intends to distribute to shareholders all taxable investment income and realized gains and otherwise comply with Subchapter M of the Internal Revenue Code applicable to regulated investment companies.
The Fund evaluates tax positions taken (or expected to be taken) in the course of preparing the Fund’s tax returns to determine whether these positions meet a “more-likely-than-not” standard that, based on the technical merits, have a more than fifty percent likelihood of being sustained by a taxing authority upon examination. A tax position that meets the “more-likely-than-not” recognition threshold is measured to determine the amount of benefit to recognize in the financial statements.
Management of the Fund analyzes all open tax years, as defined by the Statute of Limitations, for all major jurisdictions, including federal tax authorities and certain state tax authorities. As of and during the fiscal year ended November 30, 2011, the Fund did not have a liability for any unrecognized tax benefits. The Fund will file income tax returns in the U.S. federal jurisdiction and Colorado. For the years ended December 31, 2009 through November 30, 2011, the Fund’s returns will be open to examination by the appropriate taxing authority.
G. Fair Value Measurements
The Fund discloses the classification of fair value measurements following a three-tier hierarchy based on the inputs used to measure fair value. Inputs refer broadly to the assumptions that market participants would use in pricing the asset or liability, including assumptions about risk. Inputs may be observable or unobservable. Observable inputs reflect the assumptions market participants would use in pricing the asset or liability that are developed based on market data obtained from sources independent of the reporting entity. Unobservable inputs reflect the reporting entity’s own assumptions about the assumptions market participants would use in pricing the asset or liability that are developed based on the best information available.
Various inputs are used in determining the value of the Fund’s investments as of the end of the reporting period. When inputs used fall into different levels of the fair value hierarchy, the level in the hierarchy within which the fair value measurement falls is determined based on the lowest level input that is significant to the fair value measurement in its entirety. The designated input levels are not necessarily an indication of the risk or liquidity associated with these investments. These inputs are categorized in the following hierarchy under applicable financial accounting standards:
| | | | |
Level 1 | | – | | Unadjusted quoted prices in active markets for identical assets or liabilities that the Fund has the ability to access. |
| | |
Level 2 | | – | | Observable inputs other than quoted prices included in level 1 that are observable for the asset or liability, either directly or indirectly. These inputs may include quoted prices for the identical instrument on an inactive market, prices for similar instruments, interest rates, prepayment speeds, credit risk, yield curves, default rates, and similar data. |
| | |
| | NOTES TO FINANCIAL STATEMENTS |
| | May 31, 2012 (Unaudited) |
| | | | |
Level 3 | | – | | Unobservable inputs for the asset or liability, to the extent relevant observable inputs are not available, representing the Fund’s own assumptions about the assumptions a market participant would use in valuing the asset or liability, and would be based on the best information available. |
Jefferies | TR/J CRB Global Commodity Equity Index Fund
| | | | | | | | | | | | | | | | |
| Investments in Securities at Value* | | Level 1 -
Unadjusted
Quoted Prices | | | Level 2 -
Other Significant
Observable Inputs | | | Level 3 -
Significant
Unobservable
Inputs | | | Total | |
Common Stocks | | $ | 79,537,900 | | | $ | 448 | | | $ | – | | | $ | 79,538,348 | |
TOTAL | | $ | 79,537,900 | | | $ | 448 | | | $ | – | | | $ | 79,538,348 | |
| * | For detailed country descriptions, see the accompanying Schedule of Investments. |
For the six months ended May 31, 2012, the Fund did not have any significant transfers between Level 1 and Level 2 securities. The Fund did not have any securities which used significant unobservable inputs (Level 3) in determining fair value.
3. INVESTMENT ADVISORY FEE AND OTHER AFFILIATED TRANSACTIONS
ALPS Advisors, Inc. (the “Investment Adviser”) acts as the Fund’s investment adviser pursuant to an advisory agreement with the Trust on behalf of the Fund (the “Advisory Agreement”). Pursuant to the Advisory Agreement, the Fund pays the Investment Adviser a unitary fee for the services and facilities it provides payable on a monthly basis at the annual rate of 0.65% of the Fund’s average daily net assets. From time to time, the Investment Adviser may waive all or a portion of its fee.
Out of the unitary management fee, the Investment Adviser pays substantially all expenses of the Fund, including the licensing fee of the Index provider, and the cost of transfer agency, custody, fund administration, legal, audit, trustees and other services, except for interest expenses, distribution fees or expenses, brokerage expenses, taxes and extraordinary expenses not incurred in the ordinary course of the Fund’s business. In addition, the Investment Adviser’s unitary management fee is designed to compensate the Investment Adviser for providing services for the Fund.
ALPS Fund Services, Inc. (“ALPS”), an affiliate of the Investment Adviser, is the administrator of the Fund.
The Bank of New York Mellon is the custodian, fund accounting agent and transfer agent for the Fund.
Each Trustee who is not an officer or employee of the Investment Adviser, any sub-adviser or any of their affiliates (“Independent Trustees”) is paid a quarterly retainer of $3,500, $1,500 for each regularly scheduled Board meeting attended and $750 for each special meeting held outside of regularly scheduled meetings.
4. PURCHASES AND SALES OF SECURITIES
For the six months ended May 31, 2012, the cost of purchases and proceeds from sales of investment securities, excluding short-term investments and in-kind transactions, were as follows:
| | | | | | | | | | |
| | | Purchases | | | | | Sales | |
Jefferies | TR/J CRB Global Commodity Equity Index Fund | | $ | 6,488,880 | | | | | $ | 6,508,353 | |
For the six months ended May 31, 2012, the cost of in-kind purchases and proceeds from in-kind sales were as follows:
| | | | | | | | | | |
| | | Purchases | | | | | Sales | |
Jefferies | TR/J CRB Global Commodity Equity Index Fund | | $ | 7,005,007 | | | | | $ | 8,553,567 | |
Gains on in-kind transactions are not considered taxable for federal income tax purposes.
| | |
| | | |
14 | | Semi-Annual Report (Unaudited) | May 31, 2012 |
| | | |
| | |
| | NOTES TO FINANCIAL STATEMENTS |
| | May 31, 2012 (Unaudited) |
As of May 31, 2012, the costs of investments for federal income tax purposes and accumulated net unrealized appreciation/(depreciation) on investments were as follows:
| | | | | | |
| | | Jefferies | TR/J CRB Global
Commodity Equity��Index Fund |
Gross Appreciation (excess of value over tax cost) | | $ | 720,197 | | | |
Gross Depreciation (excess of tax cost over value) | | | (19,557,140 | ) | | |
Net Unrealized (Depreciation) | | $ | (18,836,943 | ) | | |
| | | | | | | |
Cost of investments for income tax purposes | | $ | 98,375,291 | | | |
| | | | | | | |
5. CAPITAL SHARE TRANSACTIONS
Shares are created and redeemed by the Fund only in Creation Unit size aggregations of 50,000. Only broker-dealers or large institutional investors with creation and redemption agreements called Authorized Participants (“AP”) are permitted to purchase or redeem Creation Units from the Fund. Such transactions are generally permitted on an in-kind basis, with a balancing cash component to equate the transaction to the net asset value per unit of the Fund on the transaction date. Cash may be substituted equivalent to the value of certain securities generally when they are not available in sufficient quantity for delivery, not eligible for trading by the AP or as a result of other market circumstances.
6. INDEMNIFICATIONS
Under the Trust’s organizational documents, its officers and Trustees are indemnified against certain liability arising out of the performance of their duties to the Trust. Additionally, in the normal course of business, the Trust enters into contracts with service providers that contain general indemnification clauses. The Trust’s maximum exposure under these arrangements is unknown, as this would involve future claims that may be made against the Trust that have not yet occurred.
7. NEW ACCOUNTING PRONOUNCEMENTS
In May 2011, the FASB issued ASU No. 2011-04 “Amendments to Achieve Common Fair Value Measurement and Disclosure Requirements” in GAAP and the International Financial Reporting Standards (“IFRSs”). ASU No. 2011-04 amends FASB ASC Topic 820, “Fair Value Measurements and Disclosures”, to establish common requirements for measuring fair value and for disclosing information about fair value measurements in accordance with GAAP and IFRSs. ASU No. 2011-04 is effective for fiscal years beginning after December 15, 2011 and for interim periods within those fiscal years. Management is currently evaluating the impact these amendments may have on the Funds financial statements.
In December 2011, the FASB issued ASU No. 2011-11 “Disclosures about Offsetting Assets & Liabilities” to expand current disclosure requirements on the offsetting of certain assets and liabilities. The new disclosures will be required for investments and derivative financial instruments subject to master netting or similar agreements which are eligible for offset in the Statements of Assets and Liabilities and will require an entity to disclose both gross and net information about such investments and transactions in the financial statements. The guidance is effective for financial statements with fiscal years beginning on or after January 1, 2013, and interim periods within those fiscal years. Management is evaluating the impact of this guidance on the Funds’ financial statement disclosures.
| | |
| | ADDITIONAL INFORMATION |
| | May 31, 2012 (Unaudited) |
PROXY VOTING POLICIES AND PROCEDURES
A description of the Fund’s proxy voting policies and procedures used in determining how to vote for proxies and information regarding how the Fund voted proxies related to portfolio securities during the most recent 12-month period ended June 30th is available without charge, (1) on the Securities and Exchange Commission’s (“SEC”) website at http://www.sec.gov; (2) upon request, by calling 1-866-513-5856; and (3) on the Trust’s website located at http://www.alpsfunds.com.
PORTFOLIO HOLDINGS
The Trust will file its complete schedule of portfolio holdings with the SEC for the first and third quarters of each fiscal year on Form N-Q. The Trust’s Form N-Q will be available (1) on the SEC’s website at http://www.sec.gov; (2) by calling 1-866-513-5856; (3) on the Trust’s website located at http://www.alpsfunds.com; and (4) for review and copying at the SEC’s Public Reference Room (“PRR”) in Washington D.C. Information regarding the operation of the PRR may be obtained by calling 1-800-732-0330.
| | |
| | | |
16 | | Semi-Annual Report (Unaudited) | May 31, 2012 |
| | | |

|
 |
| ALPS Equal Sector Weight ETF |
| | | | |
| | | | |
 | | | | ALPS Equal Sector Weight ETF | www.alpsfunds.com |
| | | | |
| | |

| | 
|
| | Performance Overview May 31, 2012 (Unaudited) |
INVESTMENT OBJECTIVE
The Fund seeks investment results that replicate as closely as possible, before fees and expenses, the performance of the Banc of America Securities – Merrill Lynch Equal Sector Weight Index (the “Underlying Index”). The Fund’s investment objective is not fundamental and may be changed by the Board of Trustees without shareholder approval.
PRIMARY INVESTMENT STRATEGIES
The Adviser will seek to match the performance of the Underlying Index. The Underlying Index is an index of indexes comprised in equal proportions of the nine Select Sector SPDR Indexes (“The Underlying Sector Indexes”). In order to track the securities in the Underlying Index, the Fund will use a “fund of funds” approach, and seek to achieve its investment objective by investing at least 90% of its total assets in the shares of Select Sector SPDR exchange-traded funds (each, an “Underlying Sector ETF” and collectively the “Underlying Sector ETFs”) that track the Underlying Sector indexes of which the Underlying Index is comprised.
PERFORMANCE OVERVIEW
AVERAGE ANNUAL TOTAL RETURN as of May 31, 2012
| | | | | | | | |
| | | 1 Year | | | | | Since
Inception
Annualized* |
ALPS Equal Sector Weight ETF | | | | | | | | |
NAV (Net Asset Value) | | | -1.34% | | | | | 16.31% |
Market Price** | | | -1.34% | | | | | 16.35% |
Banc of America Securities Merrill Lynch Equal Sector Weight Index | | | -3.16% | | | | | 14.32% |
S&P 500® Total Return Index | | | -0.41% | | | | | 16.28% |
Total Expense Ratio (per the current Prospectus) | | | 0.52% | | | | | |
Performance data quoted represents past performance. Past performance does not guarantee future results. Current performance may be higher or lower than actual data quoted. Call 1.866.675.2639 or visit www.alpsfunds.com for current month end performance. The investment return and principal value of an investment will fluctuate so that an investor’s shares, when redeemed, may be worth more or less than their original cost.
NAV is an exchange-traded fund’s per-share value. The per-share dollar amount of the fund is derived by dividing the total value of all the securities in its portfolio, less any liabilities, by the number of fund shares outstanding. Market Price is the price at which a share can currently be traded in the market. Information detailing the number of days the Market Price of the Fund was greater than the Fund’s NAV and the number of days it was less than the Fund’s NAV can be obtained at www.alpsfunds.com.
| * | The Fund commenced Investment Operations on July 06, 2009 with an Inception Date, the first day of trading on the Exchange, of July 7, 2009. |
| | | | |
| | | | |
| Semi-Annual Report | May 31, 2012 | | 2 | |  |
| | | | |
|
|
Performance Overview May 31, 2012 (Unaudited) |
| ** | Market Price is based on the midpoint of the bid/ask spread at 4 p.m. ET and does not represent the returns an investor would receive if shares were traded at other times. |
Banc of America Securities Merrill Lynch Equal Sector Weight Index: a U.S. equity index comprised, in equal weights, of nine sub-indices, and is a price-return index.
S&P 500® Index: the Standard & Poor’s composite index of 500 stocks, a widely recognized, unmanaged index of common stock prices.
An investor cannot invest directly in an index.
The following table shows the sector weights of both the Fund and the S&P 500® as of May 31, 2012:
SECTOR WEIGHTING COMPARISON as of May 31, 2012
| | | | | | | | | | | | | | | | | | |
| | | | | EQL | | | | | | S&P 500® | | |
Utilities (XLU) | | | | | | 12.1 | % | | | | | | | | 3.7 | % | | |
Consumer Staples (XLP) | | | | | | 11.8 | | | | | | | | | 11.4 | | | |
Healthcare (XLV) | | | | | | 11.6 | | | | | | | | | 11.8 | | | |
Consumer Discretionary (XLY) | | | | | | 11.5 | | | | | | | | | 11.3 | | | |
Technology (XLK) | | | | | | 11.0 | | | | | | | | | 23.0 | | | |
Industrials (XLI) | | | | | | 10.8 | | | | | | | | | 10.5 | | | |
Materials (XLB) | | | | | | 10.7 | | | | | | | | | 3.4 | | | |
Financials (XLF) | | | | | | 10.5 | | | | | | | | | 14.3 | | | |
Energy (XLE) | | | | | | 10.0 | | | | | | | | | 10.6 | | | |
Source: S&P 500®.
SECTOR ALLOCATION as of May 31, 2012
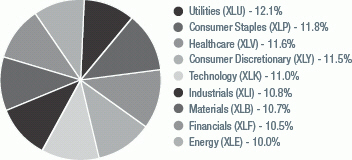
| | | | |
| | | | |
| | 3 | | ALPS Equal Sector Weight ETF | www.alpsfunds.com |
| | | | |
| | |
| |
|
| | Performance Overview May 31, 2012 (Unaudited) |
GROWTH OF $10,000 as of May 31, 2012
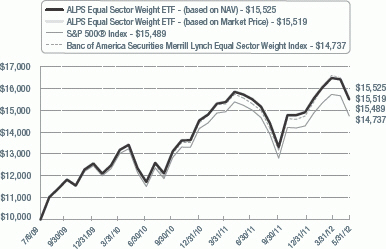
The chart above represents historical performance of a hypothetical investment of $10,000 in the Fund over the life of the Fund. Performance calculations are as of the end of each month. Past performance does not guarantee future results. This chart does not reflect the deduction of taxes that a shareholder would pay on Fund distributions or the redemption of Fund shares.
| | | | |
| | | | |
| Semi-Annual Report | May 31, 2012 | | 4 | |  |
| | | | |
|
|
Disclosure of Fund Expenses For the Six Months Ended May 31, 2012 (Unaudited) |
Shareholder Expense Example: As a shareholder of the Fund, you incur two types of costs: (1) transaction costs which may include creation and redemption fees or brokerage charges, and (2) ongoing costs, including management fees and other Fund expenses. These examples are intended to help you understand your ongoing costs (in dollars) of investing in the Fund and to compare these costs with the ongoing costs of investing in other funds. It is based on an investment of $1,000 invested at December 1, 2011 and held through the period ended May 31, 2012.
Actual Return: The first line of the table provides information about actual account values and actual expenses. You may use the information in this table, together with the amount you invested, to estimate the expenses that you incurred over the period. Simply divide your account value by $1,000 (for example, an $8,600 account value divided by $1,000 = 8.6), then multiply the result by the number in the first line under the heading entitled “Expenses Paid During the Period” to estimate the expenses attributable to your investment during this period.
Hypothetical 5% Return: The second line of the table provides information about hypothetical account values and hypothetical expenses based on the Fund’s actual expense ratio and an assumed rate of return of 5% per year before expenses, which is not the Fund’s actual return. The hypothetical account values and expenses may not be used to estimate the actual ending account balance or expenses you paid for the period. You may use this information to compare ongoing costs of investing in the Fund and other funds. To do so, compare this 5% hypothetical example with the 5% hypothetical examples that appear in the shareholder reports of the other funds.
The expenses shown in the table are meant to highlight ongoing Fund costs only and do not reflect any transaction costs, such as creation and redemption fees, or brokerage charges. Therefore, the second table is useful in comparing ongoing costs only, and will not help you determine the relative total costs of owning different funds. In addition, if these costs were included, your costs would have been higher.
| | | | | | | | |
| | | Beginning Account Value 12/01/11 | | Ending Account Value 5/31/12 | | Expense Ratio(a) | | Expenses Paid
During the Period(b) 12/01/11- 5/31/12 |
Actual | | $1,000.00 | | $1,049.40 | | 0.34% | | $1.74 |
Hypothetical (5% return before expenses) | | $1,000.00 | | $1,023.30 | | 0.34% | | $1.72 |
| (a) | The Fund’s expense ratios have been based on the Fund’s most recent fiscal half-year expenses. |
| (b) | Expenses are equal to the Fund’s annualized expense ratio multiplied by the average account value over the period, multiplied by the number of days in the most recent fiscal half year (183), then divided by 366. |
| | | | |
| | | | |
| | 5 | | ALPS Equal Sector Weight ETF | www.alpsfunds.com |
| | | | |
| | |
| |
|
| | Statement of Investments |
| | | | |
| Security Description | | Shares | | Value |
| | |
| EXCHANGE TRADED FUNDS (100.03%) | | | | |
Consumer Discretionary (11.45%) | | | | |
Consumer Discretionary Select
Sector SPDR Fund | | 210,537 | | $ 9,076,250 |
| | | | |
| | |
Consumer Staples (11.84%) | | | | |
Consumer Staples Select
Sector SPDR Fund | | 277,933 | | 9,383,018 |
| | | | |
| | |
Energy (10.02%) | | | | |
Energy Select Sector SPDR Fund | | 124,923 | | 7,942,604 |
| | | | |
| | |
Financials (10.50%) | | | | |
Financial Select Sector SPDR Fund | | 593,846 | | 8,319,782 |
| | | | |
| | |
Healthcare (11.57%) | | | | |
Health Care Select Sector SPDR Fund | | 253,568 | | 9,166,483 |
| | | | |
| | |
Industrials (10.76%) | | | | |
Industrial Select Sector SPDR Fund | | 246,057 | | 8,525,875 |
| | | | |
| | |
Materials (10.74%) | | | | |
Materials Select Sector SPDR Fund | | 251,624 | | 8,509,924 |
| | | | |
| | |
Technology (11.01%) | | | | |
Technology Select Sector SPDR Fund | | 312,424 | | 8,729,127 |
| | | | |
| | |
Utilities (12.14%) | | | | |
Utilities Select Sector SPDR Fund | | 268,394 | | 9,624,609 |
| | | | |
| | |
TOTAL EXCHANGE TRADED FUNDS (Cost $74,967,128) | | | | 79,277,672 |
| | | | |
| | |
TOTAL INVESTMENTS (100.03%) (Cost $74,967,128) | | | | 79,277,672 |
| | |
NET LIABILITIES LESS OTHER ASSETS (-0.03%) | | | | (21,723) |
| | | | |
| | |
NET ASSETS (100.00%) | | | | $ 79,255,949 |
| | | | |
Common Abbreviations:
SPDR - Standard & Poor’s Depositary Receipts
See Notes to Financial Statements.
| | | | |
| | | | |
| Semi-Annual Report | May 31, 2012 | | 6 | | |
| | | | |
|
|
Statement of Assets and Liabilities May 31, 2012 (Unaudited) |
| | | | |
ASSETS: | | | | |
Investments, at value | | $ | 79,277,672 | |
Cash | | | 1,954 | |
| | |
Total Assets | | | 79,279,626 | |
| | |
| |
LIABILITIES: | | | | |
Payable to advisor | | | 23,677 | |
| | |
Total Liabilities | | | 23,677 | |
| | |
NET ASSETS | | $ | 79,255,949 | |
| | |
| |
NET ASSETS CONSIST OF: | | | | |
Paid-in capital | | $ | 74,161,128 | |
Overdistributed net investment income | | | (52,458) | |
Accumulated net realized gain on investments | | | 836,735 | |
Net unrealized appreciation on investments | | | 4,310,544 | |
| | |
NET ASSETS | | $ | 79,255,949 | |
| | |
| |
INVESTMENTS, AT COST | | $ | 74,967,128 | |
| |
PRICING OF SHARES | | | | |
Net Assets | | $ | 79,255,949 | |
Shares of beneficial interest outstanding (Unlimited number of shares authorized, par value $0.01 per share) | | | 2,150,000 | |
Net Asset Value, offering and redemption price per share | | $ | 36.86 | |
See Notes to Financial Statements.
| | | | |
| | | | |
| | 7 | | ALPS Equal Sector Weight ETF | www.alpsfunds.com |
| | | | |
| | |
| |
|
| | Statements of Operations |
| | | | | | | | |
| | | For the Six Months Ended
May 31, 2012
(Unaudited) | | | For the Period January 1, 2011 to
November 30, 2011(a) | |
| | |
INVESTMENT INCOME: | | | | | | | | |
Dividends | | $ | 800,260 | | | $ | 833,225 | |
| | |
Total Investment Income | | | 800,260 | | | | 833,225 | |
| | |
| | |
EXPENSES: | | | | | | | | |
Investment advisory fee | | | 144,758 | | | | 194,193 | |
| | |
Total expenses before reimbursement | | | 144,758 | | | | 194,193 | |
| | |
Expenses reimbursed/waived by:
Investment advisor | | | (11,737) | | | | (15,745) | |
| | |
NET EXPENSES | | | 133,021 | | | | 178,448 | |
| | |
NET INVESTMENT INCOME | | | 667,239 | | | | 654,777 | |
| | |
| | |
Net realized gain on investments | | | 958,275 | | | | 4,757,896 | |
Net change in unrealized appreciation/(depreciation) on investments | | | 1,682,163 | | | | (4,697,555) | |
| | |
NET REALIZED AND UNREALIZED GAIN ON INVESTMENTS | | | 2,640,438 | | | | 60,341 | |
| | |
NET INCREASE IN NET ASSETS RESULTING FROM OPERATIONS | | $ | 3,307,677 | | | $ | 715,118 | |
| | |
| (a) | Effective March 7, 2011, the Board approved changing the fiscal year end of the Fund from December 31 to November 30. |
See Notes to Financial Statements.
| | | | |
| | | | |
| Semi-Annual Report | May 31, 2012 | | 8 | | |
| | | | |
Intentionally Left Blank Page.
| | |
| |
|
| | |
| | | | |
| | | For the Six Months
Ended May 31, 2012
(Unaudited) | |
OPERATIONS: | | | | |
Net investment income | | $ | 667,239 | |
Net realized gain on investments | | | 958,275 | |
Net change in unrealized appreciation/(depreciation) on investments | | | 1,682,163 | |
Net increase in net assets resulting from operations | | | 3,307,677 | |
| |
DISTRIBUTIONS TO SHAREHOLDERS: | | | | |
From net investment income | | | (729,223) | |
Total distributions | | | (729,223) | |
| |
SHARE TRANSACTIONS: | | | | |
Proceeds from sale of shares | | | 20,341,614 | |
Cost of shares redeemed | | | (5,755,541) | |
Net increase from share transactions | | | 14,586,073 | |
Net increase in net assets | | | 17,164,527 | |
| |
NET ASSETS: | | | | |
Beginning of period | | | 62,091,422 | |
End of period* | | $ | 79,255,949 | |
| | | | | |
| |
* Including (overdistributed)/undistributed net investment income of: | | $ | (52,458) | |
| |
OTHER INFORMATION: | | | | |
SHARE TRANSACTIONS: | | | | |
Beginning shares | | | 1,750,000 | |
Shares sold | | | 550,000 | |
Shares redeemed | | | (150,000) | |
Shares outstanding, end of period | | | 2,150,000 | |
| | | | | |
| (a) | Effective March 7, 2011, the Board approved changing the fiscal year end of the Fund from December 31 to November 30. |
See Notes to Financial Statements.
| | | | |
| | | | |
| Semi-Annual Report | May 31, 2012 | | 10 | | |
| | | | |
|
|
| Statements of Changes in Net Assets |
| | | | | | | | |
For the Period
January 1, 2011 to
November 30, 2011(a) | | | For the Year Ended
December 31, 2010 | | | |
| | | | | | | | |
| $ | 654,777 | | | $ | 758,350 | | | |
| | 4,757,896 | | | | 298,723 | | | |
| | (4,697,555) | | | | 5,854,347 | | | |
| | 715,118 | | | | 6,911,420 | | | |
| | |
| | | | | | | | | |
| | (695,943) | | | | (758,546) | | | |
| | (695,943) | | | | (758,546) | | | |
| | |
| | | | | | | | | |
| | 36,054,358 | | | | 34,389,889 | | | |
| | (26,993,801) | | | | (1,539,300) | | | |
| | 9,060,557 | | | | 32,850,589 | | | |
| | 9,079,732 | | | | 39,003,463 | | | |
| | |
| | | | | | | | | |
| | 53,011,690 | | | | 14,008,227 | | | |
| $ | 62,091,422 | | | $ | 53,011,690 | | | |
| | | | | | | | | |
| | |
| $ | 9,526 | | | $ | 5,557 | | | |
| | |
| | | | | | | | | |
| | | | | | | | |
| | 1,500,000 | | | | 450,000 | | | |
| | 1,000,000 | | | | 1,100,000 | | | |
| | (750,000) | | | | (50,000) | | | |
| | 1,750,000 | | | | 1,500,000 | | | |
| | | | | | | | | |
| | | | |
| | | | |
| | 11 | | ALPS Equal Sector Weight ETF | www.alpsfunds.com |
| | | | |
| | |
| |
|
| | |
| | | | | |
| | | For the Six Months
Ended May 31, 2012
(Unaudited) |
NET ASSET VALUE, BEGINNING OF PERIOD | | | $ | 35.48 | |
| |
INCOME FROM OPERATIONS: | | | | | |
| |
Net investment income | | | | 0.32 | (b) |
Net realized and unrealized gain on investments | | | | 1.43 | |
Total from investment operations | | | | 1.75 | |
| |
LESS DISTRIBUTIONS: | | | | | |
From net investment income | | | | (0.37 | ) |
From capital gains | | | | – | |
Total distributions | | | | (0.37 | ) |
NET INCREASE IN NET ASSET VALUE | | | | 1.38 | |
NET ASSET VALUE, END OF PERIOD | | | $ | 36.86 | |
| | | | | | |
TOTAL RETURN(c) | | | | 4.94 | % |
| |
RATIOS/ SUPPLEMENTAL DATA: | | | | | |
Net assets, end of period (in 000s) | | | $ | 79,256 | |
| |
RATIOS TO AVERAGE NET ASSETS: | | | | | |
Net investment income including reimbursement/waiver | | | | 1.71 | %(d) |
Net investment income excluding reimbursement/waiver | | | | 1.68 | %(d) |
Expenses including reimbursement/waiver | | | | 0.34 | %(d) |
Expenses excluding reimbursement/waiver | | | | 0.37 | %(d) |
PORTFOLIO TURNOVER RATE(e) | | | | 2 | % |
| (a) | Effective March 7, 2011, the Board approved changing the fiscal year end of the Fund from December 31 to November 30. |
| (b) | Calculated using average shares outstanding. |
| (c) | Total return is calculated assuming an initial investment made at the net asset value at the beginning of the period and redemption at the net asset value on the last day of the period and assuming all distributions are reinvested at actual reinvestment prices. Total return calculated for a period of less than one year is not annualized. |
| (e) | Portfolio turnover is not annualized and does not include securities received or delivered from processing creations or redemptions. |
See Notes to Financial Statements.
| | | | |
| | | | |
| Semi-Annual Report | May 31, 2012 | | 12 | | |
| | | | |
| | |
|
| | Financial Highlights For a Share Outstanding Throughout the Periods Presented |
| | | | | | | | | | | | |
For the Period
January 1, 2011 to
November 30, 2011(a) | | | For the Year Ended
December 31, 2010 | | | For the Period
July 7, 2009
(Inception) through
December 31, 2009 | | | |
| $ | 35.34 | | | $ | 31.13 | | | $ | 25.04 | | | |
| | | |
| | | | | | | | | | | | |
| | | |
| | 0.41 | (b) | | | 0.68 | (b) | | | 0.31 | | | |
| | 0.18 | | | | 4.14 | | | | 6.10 | | | |
| | 0.59 | | | | 4.82 | | | | 6.41 | | | |
| | | |
| | | | | | | | | | | | |
| | (0.45 | ) | | | (0.61 | ) | | | (0.31 | ) | | |
| | – | | | | – | | | | (0.01 | ) | | |
| | (0.45 | ) | | | (0.61 | ) | | | (0.32 | ) | | |
| | 0.14 | | | | 4.21 | | | | 6.09 | | | |
| $ | 35.48 | | | $ | 35.34 | | | $ | 31.13 | | | |
| | | | | | | | | | | | | |
| | 1.67 | % | | | 15.67 | % | | | 25.60 | % | | |
| | | |
| | | | | | | | | | | | |
| $ | 62,091 | | | $ | 53,012 | | | $ | 14,008 | | | |
| | | |
| | | | | | | | | | | | |
| | 1.25 | %(d) | | | 2.14 | % | | | 2.60 | %(d) | | |
| | 1.22 | %(d) | | | 2.11 | % | | | 2.57 | %(d) | | |
| | 0.34 | %(d) | | | 0.34 | % | | | 0.34 | %(d) | | |
| | 0.37 | %(d) | | | 0.37 | % | | | 0.37 | %(d) | | |
| | 4 | % | | | 7 | % | | | 4 | % | | |
| | | | |
| | | | |
| | 13 | | ALPS Equal Sector Weight ETF | www.alpsfunds.com |
| | | | |
| | |
| |
|
| | Notes to Financial Statements May 31, 2012 (Unaudited) |
1. ORGANIZATION
The ALPS ETF Trust (the “Trust”) is an open-end management investment company organized as a Delaware statutory trust on September 13, 2007 and is registered with the Securities and Exchange Commission (“SEC”) under the Investment Company Act of 1940, as amended (the “1940 Act”). As of May 31, 2012, the Trust consists of four separate portfolios. Each portfolio represents a separate series of the Trust. This report pertains solely to the ALPS Equal Sector Weight ETF (the “Fund”), which commenced on July 7, 2009. The investment objective of the Fund is to seek investment results that correspond generally to the price and yield (before the Fund’s fees and expenses) of the Banc of America Securities Merrill Lynch Equal Sector Weight Index.
The Fund’s Shares (“Shares”) are listed on the New York Stock Exchange (“NYSE”) Arca. The Fund issues and redeems Shares at Net Asset Value (“NAV”) in blocks of 50,000 Shares each of which is called a “Creation Unit.” Creation Units are issued and redeemed principally in-kind for securities included in a specified index. Except when aggregated in Creation Units, Shares are not redeemable securities of the Fund.
2. SIGNIFICANT ACCOUNTING POLICIES
The following is a summary of significant accounting policies consistently followed by the Fund in the preparation of the financial statements. The accompanying financial statements were prepared in accordance with accounting principles generally accepted in the United States of America (“U.S. GAAP”). The preparation of financial statements in conformity with U.S. GAAP requires management to make certain estimates and assumptions that affect the reported amounts of assets and liabilities and disclosures of contingent assets and liabilities at the date of the financial statements and the reported amounts of revenue and expenses during the period. Actual results could differ from those estimates.
A. Portfolio Valuation
The Fund’s NAV is determined daily, as of the close of regular trading on the NYSE, normally 4:00 p.m. Eastern time, on each day the NYSE is open for trading. The NAV is computed by dividing the value of all assets of the Fund (including accrued interest and dividends), less all liabilities (including accrued expenses and dividends declared but unpaid), by the total number of shares outstanding.
Portfolio securities listed on any exchange other than the National Association of Securities Dealer Automated Quotation (“NASDAQ”) exchange are valued at the last sale price on the business day as of which such value is being determined. If there has been no sale on such day, the securities are valued at the mean of the most recent bid and asked prices on such day. Securities traded on the
| | | | |
| | | | |
| Semi-Annual Report | May 31, 2012 | | 14 | | |
| | | | |
|
|
Notes to Financial Statements May 31, 2012 (Unaudited) |
NASDAQ are valued at the NASDAQ Official Closing Price as determined by NASDAQ. Short-term investments that mature in less than 60 days are valued at amortized cost, which approximates market value.
The Fund’s investments are valued at market value or, in the absence of market value with respect to any portfolio securities, at fair value according to procedures adopted by the Trust’s Board of Trustees (the “Board”). When market quotations are not readily available or when events occur that make established valuation methods unreliable, securities of the Fund may be valued in good faith by or under the direction of the Board.
B. Securities Transactions and Investment Income
Securities transactions are recorded as of the trade date. Realized gains and losses from securities transactions are recorded on the identified cost basis. Dividend income is recorded on the ex-dividend date. Interest income, if any, is recorded on the accrual basis.
C. Federal Tax Information
The timing and character of income and capital gain distributions are determined in accordance with income tax regulations, which may differ from U.S. GAAP. Reclassifications are made to the Fund’s capital accounts for permanent tax differences to reflect income and gains available for distribution (or available capital loss carryforwards) under income tax regulations.
For the period ended November 30, 2011, permanent book and tax differences resulting primarily from in-kind transactions were identified and reclassified among the components of the Fund’s net assets as follows:
| | | | |
Undistributed Net Investment Income | | Accumulated Net Realized Loss | | Paid-in Capital |
$45,135 | | $(4,897,183) | | $4,852,048 |
Net investment income and net realized gain, as disclosed on the Statement of Operations, and net assets were not affected by these reclassifications.
Under the Regulated Investment Company Modernization Act of 2010 (“the Modernization Act”), net capital losses recognized in tax years beginning after December 22, 2010 may be carried forward indefinitely, and the character of the losses is retained as short-term and/or long-term. Under the law in effect prior to the Modernization Act, net capital losses were carried forward for eight years and treated as short-term. As a transition rule, the Modernization Act requires that post-enactment net capital losses be used before pre-enactment net capital losses. Additionally, post-enactment capital losses that are carried forward will retain their character as either short-term or long-term losses rather than being considered all short-term as under previous law.
| | | | |
| | | | |
| | 15 | | ALPS Equal Sector Weight ETF | www.alpsfunds.com |
| | | | |
| | |
| |
|
| | Notes to Financial Statements May 31, 2012 (Unaudited) |
At November 30, 2011, the Fund had available for tax purposes unused post-enactment capital loss carryforwards as follows:
D. Dividends and Distributions to Shareholders
Dividends from net investment income of the Fund, if any, are declared and paid quarterly or as the Board of Trustees may determine from time to time. Distributions of net realized capital gains earned by the Fund, if any, are distributed at least annually.
Distributions from net investment income and capital gains are determined in accordance with income tax regulations, which may differ from U.S GAAP. These differences are primarily due to differing treatments of income and gains on various investment securities held by the Fund, timing differences and differing characterization of distributions made by the Fund.
The tax character of the distributions paid was as follows:
| | | | | | | | |
| | | Period Ended
November 30, 2011 | | | Period Ended
December 31, 2010 | |
Distributions paid from: | | | | | | | | |
Ordinary Income | | $ | 695,943 | | | $ | 758,546 | |
| | |
Total | | $ | 695,943 | | | $ | 758,546 | |
| | |
As of November 30, 2011, the components of distributable earnings on a tax basis for the Fund were as follows:
| | | | | | |
Undistributed net investment income | | $ | 9,526 | | | |
Accumulated Capital Losses | | $ | (16,008) | | | |
Net unrealized appreciation on investments | | | 2,522,849 | | | |
| |
Total | | $ | 2,516,367 | | | |
| |
The differences between book-basis and tax-basis are primarily due to the deferral of losses from wash sales.
E. Income Taxes
No provision for income taxes is included in the accompanying financial statements, as the Fund intends to distribute to shareholders all taxable investment income and realized gains and otherwise comply with Subchapter M of the Internal Revenue Code applicable to regulated investment companies. The Fund evaluates tax positions taken (or expected to be taken) in the course
| | | | |
| | | | |
| Semi-Annual Report | May 31, 2012 | | 16 | | |
| | | | |
|
|
Notes to Financial Statements May 31, 2012 (Unaudited) |
of preparing the Fund’s tax returns to determine whether these positions meet a “more-likely-than-not” standard that, based on the technical merits, have a more than fifty percent likelihood of being sustained by a taxing authority upon examination. A tax position that meets the “more-likely-than-not” recognition threshold is measured to determine the amount of benefit to recognize in the financial statements.
Management of the Fund analyzes all open tax years, as defined by the Statute of Limitations, for all major jurisdictions, including federal tax authorities and certain state tax authorities. As of, and during the period ended November 30, 2011, the Fund did not have a liability for any unrecognized tax benefits. The Fund will file income tax returns in the U.S. federal jurisdiction and Colorado. For the tax years ended December 31, 2009, December 31, 2010, and November 30, 2011, the Fund’s returns are open to examination by the appropriate taxing authority.
F. Fair Value Measurements
The Fund discloses the classification of its fair value measurements following a three-tier hierarchy based on the inputs used to measure fair value. Inputs refer broadly to the assumptions that market participants would use in pricing the asset or liability, including assumptions about risk. Inputs may be observable or unobservable. Observable inputs reflect the assumptions market participants would use in pricing the asset or liability that are developed based on market data obtained from sources independent of the reporting entity. Unobservable inputs reflect the reporting entity’s own assumptions about the assumptions market participants would use in pricing the asset or liability that are developed based on the best information available. Various inputs are used in determining the value of the Fund’s investments as of the end of the reporting period. When inputs used fall into different levels of the fair value hierarchy, the level in the hierarchy within which the fair value measurement falls is determined based on the lowest level input that is significant to the fair value measurement in its entirety. The designated input levels are not necessarily an indication of the risk or liquidity associated with these investments. These inputs are categorized in the following hierarchy under applicable financial accounting standards:
| | | | |
| | Level 1 – | | Unadjusted quoted prices in active markets for identical assets or liabilities that the Fund has the ability to access. |
| | |
| | Level 2 – | | Observable inputs other than quoted prices included in level 1 that are observable for the asset or liability, either directly or indirectly. These inputs may include quoted prices for the identical instrument on an inactive market, prices for similar instruments, interest rates, prepayment speeds, credit risk, yield curves, default rates, and similar data. |
| | | | |
| | | | |
| | 17 | | ALPS Equal Sector Weight ETF | www.alpsfunds.com |
| | | | |
| | |
| |
|
| | Notes to Financial Statements May 31, 2012 (Unaudited) |
| | | | |
| | Level 3 – | | Unobservable inputs for the asset or liability, to the extent relevant observable inputs are not available, representing the Fund’s own assumptions about the assumptions a market participant would use in valuing the asset or liability, and would be based on the best information available. |
| | | | | | | | |
Investments in Securities at Value* | | Level 1 – Unadjusted Quoted Prices | | Level 2 - Other Significant Observable Inputs | | Level 3 - Significant Unobservable Inputs | | Total |
Exchange Traded Funds | | $ 79,277,672 | | $ – | | $ – | | $79,277,672 |
| |
TOTAL | | $ 79,277,672 | | $ – | | $ – | | $79,277,672 |
| |
| * | For detailed descriptions of the sectors, see the accompanying Statement of Investments. |
For the six months ended May 31, 2012, the Fund did not have any significant transfers between Level 1 and Level 2 securities. The Fund did not have any securities which used significant unobservable inputs (Level 3) in determining fair value.
3. INVESTMENT ADVISORY FEE AND OTHER AFFILIATED TRANSACTIONS
ALPS Advisors, Inc. (the “Investment Adviser”) acts as the Fund’s investment adviser pursuant to an Advisory Agreement with the Trust on behalf of the Fund (the “Advisory Agreement”). Pursuant to the Advisory Agreement, the Fund pays the Investment Adviser a unitary fee for the services and facilities it provides payable on a monthly basis at the annual rate of 0.37% of the Fund’s average daily net assets. ALPS Distributors, Inc. (“ADI”) is both the distributor for the Fund as well as the Select Sector SPDR exchange traded funds (“Underlying Sector ETFs”) that the Fund invests in. As required by exemptive relief obtained by the Underlying Sector ETFs, the Investment Adviser will reimburse the Fund an amount equal to the distribution fee received by ADI from the Underlying Sector ETFs attributable to the Fund’s investment in the Underlying Sector ETFs, for so long as ADI acts as the distributor to the Fund and the Underlying Sector ETFs. From time to time, the Investment Adviser may waive all or a portion of its fee.
Out of the unitary management fee, the Investment Adviser pays substantially all expenses of the Fund, including the licensing fee of the Index provider, and the cost of transfer agency, custody, fund administration, legal, audit, trustees and other services, except for interest expenses,distribution fees or expenses, brokerage expenses, taxes and extraordinary expenses not incurred in the ordinary course of the Fund’s business. In addition, the Investment Adviser’s unitary management fee is designed to compensate the Investment Adviser for providing services for the Fund.
| | | | |
| | | | |
| Semi-Annual Report | May 31, 2012 | | 18 | | |
| | | | |
|
|
Notes to Financial Statements May 31, 2012 (Unaudited) |
ALPS Fund Services, Inc. (“ALPS”), an affiliate of the Investment Adviser, is the administrator of the Fund.
The Bank of New York Mellon is the custodian, fund accounting agent and transfer agent for the Fund.
Each Trustee who is not an officer or employee of the Investment Adviser, or any of its affiliates (“Independent Trustees”) is paid a quarterly retainer of $3,500, $1,500 for each regularly scheduled Board meeting attended and $750 for each special meeting held outside of regularly scheduled meetings.
4. PURCHASES AND SALES OF SECURITIES
For the six months ended May 31, 2012, the cost of purchases and proceeds from sales of investment securities, excluding short-term investments and in-kind transactions, were as follows:
| | |
| Purchases | | Sales |
$ 2,740,647 | | $ 1,812,699 |
For the six months ended May 31, 2012, the cost of in-kind purchases and proceeds from in-kind sales were as follows:
| | |
| Purchases | | Sales |
$ 18,379,390 | | $ 4,751,186 |
Gains on in-kind transactions are generally not considered taxable gains for federal income tax purposes.
As of May 31, 2012, the costs of investments for federal income tax purposes and accumulated net unrealized appreciation/(depreciation) on investments were as follows:
| | |
Gross Appreciation (excess of value over tax cost) | | $ 5,081,034 |
Gross Depreciation (tax cost over value) | | $ (944,330) |
|
Net Unrealized Appreciation | | $ 4,136,704 |
|
Cost of investments for income tax purposes | | $ 75,140,968 |
|
5. CAPITAL SHARE TRANSACTIONS
Shares are created and redeemed by the Fund only in Creation Unit size aggregations of 50,000. Only broker-dealers or large institutional investors with creation and redemption agreements called Authorized Participants (“AP”) are permitted to purchase or redeem Creation Units from the Fund. Such transactions
| | | | |
| | | | |
| | 19 | | ALPS Equal Sector Weight ETF | www.alpsfunds.com |
| | | | |
| | |
| |
|
| | Notes to Financial Statements May 31, 2012 (Unaudited) |
are generally permitted on an in-kind basis, with a balancing cash component to equate the transaction to the net asset value per unit of the Fund on the transaction date. Cash may be substituted equivalent to the value of certain securities generally when they are not available in sufficient quantity for delivery, not eligible for trading by the AP or as a result of other market circumstances.
6. INDEMNIFICATIONS
Under the Trust’s organizational documents, its Trustees and Officers are indemnified against certain liability arising out of the performance of their duties to the Trust. Additionally, in the normal course of business, the Trust enters into contracts with service providers that contain general indemnification clauses. The Trust’s maximum exposure under these arrangements is unknown, as this would involve future claims that may be made against the Trust that have not yet occurred.
7. NEW ACCOUNTING PRONOUNCEMENTS
In May 2011, the FASB issued ASU No. 2011-04 “Amendments to Achieve Common Fair Value Measurement and Disclosure Requirements” in GAAP and the International Financial Reporting Standards (“IFRSs”). ASU No. 2011-04 amends FASB ASC Topic 820, “Fair Value Measurements and Disclosures”, to establish common requirements for measuring fair value and for disclosing information about fair value measurements in accordance with GAAP and IFRSs. ASU No. 2011-04 is effective for fiscal years beginning after December 15, 2011 and for interim periods within those fiscal years. Management is currently evaluating the impact these amendments may have on the Funds financial statements.
In December 2011, the FASB issued ASU NO. 2011-11 “Disclosures about Offsetting Assets and Liabilites” to expand current disclosure requirements on the offsetting of certain assets and liabilities. The new disclosures will be required for investments and derivative financial instruments subject to master netting or similar agreements which are eligible for offset in the Statements of Assets and Liabilities and will require an entity to disclose both gross and net information about such investments and transactions in the financial statements. The guidance is effective for financial statements with fiscal years beginning on or after January 1, 2013, and interim periods within those fiscal years. Management is evaluating the impact of this guidance on the Funds’ financial statement disclosures.
| | | | |
| | | | |
| Semi-Annual Report | May 31, 2012 | | 20 | | |
| | | | |
|
|
Additional Information May 31, 2012 (Unaudited) |
PROXY VOTING POLICIES AND PROCEDURES
A description of the Fund’s proxy voting policies and procedures used in determining how to vote for proxies and information regarding how the Fund voted proxies related to portfolio securities during the most recent 12-month period ended June 30th is available without charge, (1) on the Securities and Exchange Commission’s (“SEC”) website at http://www.sec.gov; (2) upon request, by calling 1-866-513-5856; and (3) on the Trust’s website located at http://www.alpsfunds.com.
PORTFOLIO HOLDINGS
The Trust will file its complete schedule of portfolio holdings with the SEC for the first and third quarters of each fiscal year on Form N-Q. The Trust’s Form N-Q will be available (1) on the SEC’s website at http://www.sec.gov; (2) by calling 1-866-513-5856; (3) on the Trust’s website located at http://www.alpsfunds.com; and (4) for review and copying at the SEC’s Public Reference Room (“PRR”) in Washington D.C. Information regarding the operation of the PRR may be obtained by calling 1-800-732-0330.
| | | | |
| | | | |
| | 21 | | ALPS Equal Sector Weight ETF | www.alpsfunds.com |
| | | | |
| | |

| | Table of Contents |
| | |
| | www.alpsfunds.com | 866.513.5856 |
| | |
| | Performance Overview |
| | May 31, 2012 (Unaudited) |
Fund Description
The Alerian MLP ETF (the “Fund”) seeks investment results that correspond (before fees and expenses) generally to the price and yield performance of its underlying index, the Alerian MLP Infrastructure Index (the “Index”). The Shares of the Fund are listed and trade on the New York Stock Exchange (“NYSE”) Arca under the ticker symbol AMLP. The Fund generally will invest in all of the securities that comprise the Index in proportion to their weightings in the Index. The Fund began trading on August 25, 2010.
The Index is a rules based, modified capitalization weighted, float adjusted index intended to give investors a means of tracking the overall performance of the United States energy infrastructure Master Limited Partnership (“MLP”) asset class. The Index is comprised of 25 energy infrastructure MLPs that earn a majority of their cash flow from the transportation and storage of energy commodities.
Performance Overview
During the six-month period ending May 31, 2012, the Alerian MLP Infrastructure Index (AMZI) gained 2.4% on a total return basis, compared to a 6.2% gain for the S&P 500. During the same period, the Alerian MLP ETF (AMLP) lost 1.5% on a price return basis, but paid out $0.49 in distributions, for a total return of 1.6%.
Master Limited Partnerships (MLPs) posted steady gains through April, but were unable to disconnect from poor broader market performance in May, during which MLPs suffered their worst one-month decline since November 2008. Broader market weakness was tied to concerns over the Euro and the European economy, which also led to a 15% drop in front-month crude oil prices to $88 per barrel. Though MLPs generally do not take title to the commodities that they handle, they are viewed as energy equities by the investment community at large and are consequently susceptible to the headline risk of declining crude oil prices. Despite the aforementioned volatility in their unit prices, midstream energy MLPs continued to generate stable and growing cash flow.
As a testament to the consistency of their cash flow stream, 21 of 25 partnerships owned by AMLP raised their distributions during the period, while the remaining four maintained their distributions from the previous period. Distributions grew quarter-over-quarter by an average of 1.3% and 1.4% during the first and second quarter, respectively, in line with sell-side analyst expectations of 3%-8% distribution growth for 2012. MLPs were active in the capital markets during the period as well, raising $13.7 billion in debt and $17.7 billion in public secondary offerings and private investments in public equity (PIPEs). Five initial public offerings (IPOs) during the period raised a total of $1.3 billion, as compared to five IPOs raising $826 million in the six-month period ending November 30, 2011.
Year-to-date MLP analyst days and industry conferences have highlighted the oversupply of natural gas, how the imbalance will be corrected, as well as how MLPs are adjusting in the current environment. The combination of advances in drilling technology and tapping unconventional shale areas has created a glut in the natural gas markets. Utilization for domestic natural gas storage is above the five-year historical high, and during the 2012 injection season (April 1 through October 31), storage facilities are expected to be full. Until
| | |
Semi-Annual | May 31, 2012 | | 1 |
| | |
| | Performance Overview |
| | May 31, 2012 (Unaudited) |
the United States experiences a significant increase in natural gas demand via increases in gas-fired electricity generation, industrial demand, or gas exports, industry analysts forecast natural gas prices to remain below $3.50 per million British thermal unit (MMBtu). In response, producers have shifted their drilling plans away from dry gas areas and into wet gas areas. MLPs have followed suit by focusing their infrastructure development efforts on handling natural gas liquids (NGLs), including the construction of new NGL pipelines stretching the 700 miles between the NGL market hubs of Conway, Kansas, and Mont Belvieu, Texas, as well as new processing plants in Mont Belvieu.
MLPs are also actively trying to find a solution for the lack of propane takeaway capacity in the Marcellus Shale. As liquids-rich production increases over the next few years, the supply of propane – a valuable byproduct of natural gas processing – will outpace local demand. Possible solutions include shipping the propane to Gulf Coast fractionation facilities along a Y-Grade NGL pipeline, or to Northeast terminals, where export capacity is expanding.
Month-to-month volatility in MLP unit prices is likely to continue. This should not, however, discourage investors with a longer-term investment horizon that view MLPs as the way to participate in the build-out of domestic energy infrastructure, connecting areas with takeaway constraints to areas with rising consumption needs. The underlying MLP story continues to be one of growth through organic expansion opportunities and third-party acquisitions, resulting in stable and growing cash flows.
Average Annual Total Returns as of May 31, 2012
| | | | | | |
| | | 1 Year | | | Since Inception Annualized* |
NAV | | | 5.17 | % | | 9.17% |
Market Price** | | | 5.04 | % | | 9.21% |
Alerian MLP Infrastructure Index | | | 8.62 | % | | 15.05% |
Total Expense Ratio (per the current prospectus) 4.86%.
Performance data quoted represents past performance. Past performance does not guarantee future results. Investment return and principal value of an investment will fluctuate so that an investor’s shares, when sold or redeemed, may be worth more or less than the original cost. Current performance data may be higher or lower than actual data quoted. For most current month-end performance data please visit www.alpsfunds.com.
NAV is an exchange-traded fund’s per-share value. The per-share dollar amount of the fund is derived by dividing the total value of all the securities in its portfolio, less any liabilities, by the number of fund shares outstanding. Market Price is the price at which a share can currently be traded in the market. Information detailing the number of days the Market Price of the Fund was greater than the Fund’s NAV and the number of days it was less than the Fund’s NAV can be obtained at www.alpsfunds.com.
S&P 500® Index is the Standard & Poor’s composite index of 500 stocks, a widely recognized, unmanaged index of common stock prices. One cannot invest directly in an index. Index perfor-mance does not reflect fund performance.
| * | The Fund commenced Investment Operations on August 24, 2010 with an Inception Date, the first day of trading on the Exchange, of August 25, 2010. |
| ** Market | Price is based on the midpoint of the bid-ask spread at 4 p.m. ET and does not represent the returns an investor would receive if shares were traded at other times. |
The Alerian MLP Infrastructure Index is comprised of 25 midstream energy Master Limited Partnerships.
| | |
2 | | www.alpsfunds.com | 866.513.5856 |
| | |
| | Performance Overview |
| | May 31, 2012 (Unaudited) |
Top 10 Holdings* as of May 31, 2012
| | | | |
Enterprise Products Partners LP | | | 10.0 | % |
Kinder Morgan Energy Partners LP | | | 9.4 | % |
Plains All American Pipeline LP | | | 7.6 | % |
Magellan Midstream Partners LP | | | 7.4 | % |
ONEOK Partners LP | | | 7.3 | % |
Energy Transfer Partners LP | | | 7.2 | % |
Enbridge Energy Partners LP | | | 4.8 | % |
Williams Partners LP | | | 4.6 | % |
| | | | |
El Paso Pipeline Partners LP | | | 4.4 | % |
Buckeye Partners LP | | | 4.1 | % |
Percent of Total Investments in Top Ten Holdings: | | | 66.8 | % |
* % of Total Investments.
Holdings are subject to change.
Growth of $10k as of May 31, 2012
Comparison of Change in Value of $10,000 Investment in Alerian MLP ETF and Alerian MLP Infrastructure Index.
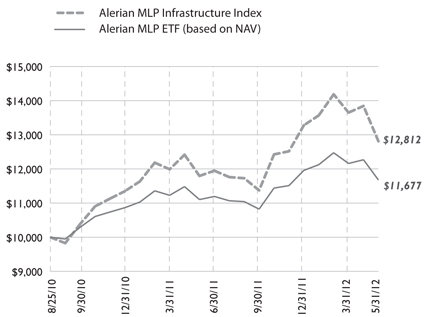
The chart above represents historical performance of a hypothetical investment of $10,000 in the Fund over the life of the Fund. Performance calculations are as of the end of each month. Past performance does not guarantee future results. This chart does not reflect the deduction of taxes that a shareholder would pay on Fund distributions or the redemption of Fund shares.
| | |
Semi-Annual | May 31, 2012 | | 3 |
| | |
| | Disclosure of Fund Expenses |
| | May 31, 2012 (Unaudited) |
Shareholder Expense Example: As a shareholder of the Fund, you incur two types of costs: (1) transaction costs which may include creation and redemption fees or brokerage charges, and (2) ongoing costs, including management fees and other Fund expenses. These examples are intended to help you understand your ongoing costs (in dollars) of investing in the Fund and to compare these costs with the ongoing costs of investing in other funds. It is based on an investment of $1,000 invested at December 1, 2011, and held through the period ended May 31, 2012.
Actual Return: The first line of the table provides information about actual account values and actual expenses. You may use the information in this table, together with the amount you invested, to estimate the expenses that you incurred over the period. Simply divide your account value by $1,000 (for example, an $8,600 account value divided by $1,000 = 8.6), then multiply the result by the number in the first line under the heading entitled “Expenses Paid During the Period” to estimate the expenses attributable to your investment during this period.
Hypothetical 5% Return: The second line of the table provides information about hypothetical account values and hypothetical expenses based on the Fund’s actual expense ratio and an assumed rate of return of 5% per year before expenses, which is not the Fund’s actual return. The hypothetical account values and expenses may not be used to estimate the actual ending account balance or ex-penses you paid for the period. You may use this information to compare ongoing costs of investing in the Fund and other funds. To do so, compare this 5% hypothetical example with the 5% hypothetical examples that appear in the shareholder reports of the other funds.
The expenses shown in the table are meant to highlight ongoing Fund costs only and do not reflect any transaction costs, such as creation and redemption fees, or brokerage charges. Therefore, the second line is useful in comparing ongoing costs only, and will not help you deter-mine the relative total costs of owning different funds. In addition, if these costs were included, your costs would have been higher.
| | | | | | | | | | | | | | | | |
| | | Beginning Account
Value 12/1/11 | | | Ending Account
Value 5/31/12 | | | Expense Ratio(a) | | | Expenses Paid
During the Period
12/1/11 - 5/31/12(b) | |
Actual | | $ | 1,000.00 | | | $ | 1,014.40 | | | | 0.85 | % | | $ | 4.28 | |
| |
Hypothetical | | | | | | | | | | | | | | | | |
(5% return be- fore expenses) | | $ | 1,000.00 | | | $ | 1,020.75 | | | | 0.85 | % | | $ | 4.29 | |
| |
| (a) | The Fund’s expense ratios have been based on the Fund’s most recent fiscal half- year expenses. |
| (b) | Expenses are equal to the Fund’s annualized expense ratio multiplied by the average account value over the period, multiplied by the number of days in the most recent fiscal half year (183), then divided by 366. |
| | |
4 | | www.alpsfunds.com | 866.513.5856 |
| | |
| | Schedule of Investments |
| | May 31, 2012 (Unaudited) |
| | | | | | | | |
| | | | | Value | |
Master Limited Partnerships Shares (100.90%) | | | | | | | | |
Energy (1.97%) | | | | | | | | |
Chesapeake Midstream Partners LP | | | 1,648,501 | | | $ | 41,261,980 | |
Exterran Partners LP | | | 1,068,249 | | | | 21,076,553 | |
| | | | | | | | |
| | | | | | | 62,338,533 | |
| | | | | | | | |
Gathering & Processing (18.67%) | | | | | | | | |
Copano Energy LLC | | | 2,615,874 | | | | 70,105,423 | |
DCP Midstream Partners LP | | | 1,395,485 | | | | 54,884,425 | |
MarkWest Energy Partners LP | | | 2,738,618 | | | | 131,289,347 | |
Targa Resources Partners LP | | | 2,773,409 | | | | 108,773,101 | |
Western Gas Partners LP | | | 1,808,606 | | | | 79,741,439 | |
Williams Partners LP | | | 2,771,517 | | | | 146,613,249 | |
| | | | | | | | |
| | | | | | | 591,406,984 | |
| | | | | | | | |
Natural Gas Pipelines (37.84%) | | | | | | | | |
Boardwalk Pipeline Partners LP | | | 2,999,778 | | | | 77,844,239 | |
El Paso Pipeline Partners LP | | | 4,279,916 | | | | 140,424,044 | |
Energy Transfer Partners LP | | | 5,278,652 | | | | 229,040,710 | |
Enterprise Products Partners LP | | | 6,544,455 | | | | 319,107,626 | |
ONEOK Partners LP | | | 4,291,453 | | | | 234,313,334 | |
Regency Energy Partners LP | | | 4,803,708 | | | | 103,375,796 | |
Spectra Energy Partners LP | | | 1,290,880 | | | | 40,236,730 | |
TC Pipelines LP | | | 1,329,857 | | | | 54,524,137 | |
| | | | | | | | |
| | | | | | | 1,198,866,616 | |
| | | | | | | | |
Petroleum Transportation (42.42%) | | | | | | | | |
Buckeye Partners LP | | | 2,765,605 | | | | 131,421,549 | |
Crosstex Energy LP | | | 1,234,979 | | | | 19,253,323 | |
Enbridge Energy Partners LP | | | 5,270,620 | | | | 154,112,929 | |
Genesis Energy LP | | | 2,074,006 | | | | 59,669,153 | |
Kinder Morgan Energy Partners LP | | | 3,854,554 | | | | 301,927,215 | |
Magellan Midstream Partners LP | | | 3,430,806 | | | | 236,073,761 | |
NuStar Energy LP | | | 2,143,116 | | | | 111,892,086 | |
Plains All American Pipeline LP | | | 3,097,766 | | | | 243,267,564 | |
Sunoco Logistics Partners LP | | | 2,554,343 | | | | 86,030,272 | |
| | | | | | | | |
| | | | | | | 1,343,647,852 | |
| | | | | | | | |
Total Master Limited Partnerships Shares | | | | | | | | |
(Cost $3,134,962,243) | | | | | | | 3,196,259,985 | |
| | | | | | | | |
| | |
Semi-Annual | May 31, 2012 | | 5 |
| | |
| | Schedule of Investments |
| | May 31, 2012 (Unaudited) |
| | | | | | |
| Security Description | | Shares | | Value | |
| | |
Total Investments (100.90%) | | | | | | |
(Cost $3,134,962,243) | | | | $ | 3,196,259,985 | |
| | |
Net Liabilities Less Other Assets (-0.90%) | | | | | (28,628,773 | ) |
| | | | | | |
Net Assets (100.00%) | | | | $ | 3,167,631,212 | |
| | | | | | |
Common Abbreviations:
LLC - Limited Liability Company.
LP - Limited Partnerships.
See Notes to Financial Statements.
| | |
6 | | www.alpsfunds.com | 866.513.5856 |
| | |
| | Statement of Assets & Liabilities |
| | May 31, 2012 (Unaudited) |
| | | | |
Assets: | | | | |
Investments, at value | | $ | 3,196,259,985 | |
Cash | | | 4,232,292 | |
Receivable for shares sold | | | 13,615,099 | |
Deferred tax asset | | | 33,877,180 | |
Income tax receivable | | | 562,053 | |
| |
Total Assets | | | 3,248,546,609 | |
| |
Liabilities: | | | | |
Payable for investments purchased | | | 13,644,600 | |
Deferred tax liability | | | 64,179,807 | |
Payable to advisor | | | 3,090,990 | |
| |
Total Liabilities | | | 80,915,397 | |
| |
Net Assets | | $ | 3,167,631,212 | |
| |
Net Assets Consist Of: | | | | |
Paid-in capital | | $ | 3,117,417,111 | |
Distributions in excess of net investment loss, net of income taxes | | | (12,831,356 | ) |
Accumulated net realized gain on investments, net of income taxes | | | 24,734,368 | |
Net unrealized appreciation on investments, net of income taxes | | | 38,311,089 | |
| |
Net Assets | | $ | 3,167,631,212 | |
| |
Investments, At Cost | | $ | 3,134,962,243 | |
Pricing of Shares | | | | |
Net Assets | | $ | 3,167,631,212 | |
Shares of beneficial interest outstanding | | | | |
(Unlimited number of shares authorized, par value $0.01 per share) | | | 201,412,168 | |
Net Asset Value, offering and redemption price per share | | $ | 15.73 | |
See Notes to Financial Statements.
| | |
Semi-Annual | May 31, 2012 | | 7 |
| | |
| | Statements of Operations |
| | | | | | | | |
| | | For the Six Months
Ended May 31, 2012
(Unaudited) | | | For the Period
January 1, 2011 to
November 30, 2011(a) | |
| |
Investment Income: | | | | | | | | |
Distributions from master limited partnerships | | $ | – | | | $ | 71,324,489 | |
Less return of capital distributions | | | – | | | | (71,324,489) | |
| |
Total Investment Income | | | – | | | | – | |
| |
| | |
Expenses: | | | | | | | | |
Investment advisory fee | | | 10,982,198 | | | | 8,693,575 | |
| |
Total Expenses | | | 10,982,198 | | | | 8,693,575 | |
| |
Net Investment Loss, before Income Taxes | | | (10,982,198) | | | | (8,693,575) | |
Income tax benefit | | | 4,119,033 | | | | 3,251,178 | |
| |
Net Investment Loss | | | (6,863,165) | | | | (5,442,397) | |
| |
| | |
Realized and Unrealized Gain/(Loss): | | | | | | | | |
Net realized gain on investments, before income taxes | | | 33,513,535 | | | | 23,993,717 | |
Deferred income tax expense | | | (12,247,834) | | | | (9,011,335) | |
Current income tax expense | | | (311,327) | | | | – | |
| |
Net realized gain on investments | | | 20,954,374 | | | | 14,982,382 | |
| |
| | |
Net change in unrealized appreciation/(depreciation) on investments, before income taxes | | | (69,399,704) | | | | 95,035,171 | |
Income tax (expense)/benefit | | | 26,015,730 | | | | (35,285,113) | |
| |
Net change in unrealized appreciation/(depreciation) on investments | | | (43,383,974) | | | | 59,750,058 | |
| |
Net Realized and Unrealized Gain/(Loss) | | | (22,429,600) | | | | 74,732,440 | |
| |
Net Increase/(Decrease) in Net Assets from Operations | | $ | (29,292,765) | | | $ | 69,290,043 | |
| |
| (a) | Effective March 7, 2011 the Board approved changing the fiscal year end of the Fund from December 31 to November 30. |
See Notes to Financial Statements.
| | |
8 | | www.alpsfunds.com | 866.513.5856 |
| | |
| | Statements of Changes in Net Assets |
| | | | | | | | | | | | |
| | | For the Six Months
Ended May 31, 2012
(Unaudited) | | | For the Period January
1, 2011 to
November 30, 2011(a) | | | For the Period
August 25, 2010
(Inception) to
December 31, 2010 | |
| |
Operations: | | | | | | | | | | | | |
Net investment loss | | $ | (6,863,165 | ) | | $ | (5,442,397 | ) | | $ | (525,794 | ) |
Net realized gain/(loss) on investments | | | 20,954,374 | | | | 14,982,382 | | | | (973,891 | ) |
Net change in unrealized appreciation/(depreciation) on investments | | | (43,383,974 | ) | | | 59,750,058 | | | | 21,945,005 | |
| |
Net increase/(decrease) in net assets resulting from operations | | | (29,292,765 | ) | | | 69,290,043 | | | | 20,445,320 | |
| |
| | | |
Distributions To Shareholders: | | | | | | | | | | | | |
From net realized gains | | | – | | | | (10,228,497 | ) | | | – | |
Tax return of capital | | | (82,947,801 | ) | | | (62,790,879 | ) | | | (5,380,298 | ) |
| |
Total distributions | | | (82,947,801 | ) | | | (73,019,376 | ) | | | (5,380,298 | ) |
| |
| | | |
Share Transactions: | | | | | | | | | | | | |
Proceeds from sale of shares | | | 1,566,484,667 | | | | 1,189,599,389 | | | | 596,401,556 | |
Cost of shares redeemed | | | – | | | | (83,949,523 | ) | | | – | |
| |
Net increase from share transactions | | | 1,566,484,667 | | | | 1,105,649,866 | | | | 596,401,556 | |
| |
Net increase in net assets | | | 1,454,244,101 | | | | 1,101,920,533 | | | | 611,466,578 | |
| | | |
Net Assets: | | | | | | | | | | | | |
Beginning of period | | | 1,713,387,111 | | | | 611,466,578 | | | | – | |
| |
End of period* | | $ | 3,167,631,212 | | | $ | 1,713,387,111 | | | $ | 611,466,578 | |
| |
*Including distributions in excess of net investment loss, net of income taxes of: | | $ | (12,831,356 | ) | | $ | (5,968,191 | ) | | $ | (525,794 | ) |
| | | |
Other Information: | | | | | | | | | | | | |
Share Transactions: | | | | | | | | | | | | |
Beginning shares | | | 107,276,019 | | | | 38,100,000 | | | | – | |
Shares sold | | | 94,136,149 | | | | 74,576,019 | | | | 38,100,000 | |
Shares redeemed | | | – | | | | (5,400,000 | ) | | | – | |
| |
Shares outstanding, end of period | | | 201,412,168 | | | | 107,276,019 | | | | 38,100,000 | |
| |
| (a) | Effective March 7, 2011 the Board approved changing the fiscal year end of the Fund from December 31 to November 30. |
See Notes to Financial Statements.
| | |
Semi-Annual | May 31, 2012 | | 9 |
| | |
| | Financial Highlights |
| | For a Share Outstanding Throughout the Periods Presented |
| | | | | | | | | | | | |
| | | For the Six Months
Ended May 31, 2012
(Unaudited) | | | For the Period
January 1, 2011 to
November 30, 2011(a) | | | For the Period
August 25, 2010
(Inception) to
December 31, 2010 | |
| |
Net Asset Value, Beginning of Period | | $ | 15.97 | | | $ | 16.05 | | | $ | 15.00 | |
| | | |
Income From Operations: | | | | | | | | | | | | |
Net investment loss(b) | | | (0.04) | | | | (0.08) | | | | (0.03) | |
Net realized and unrealized gain on investments | | | 0.29 | | | | 1.00 | | | | 1.33 | |
| |
Total from Investment Operations | | | 0.25 | | | | 0.92 | | | | 1.30 | |
| |
| | | |
Less Distributions: | | | | | | | | | | | | |
From net realized gains | | | – | | | | (0.14)(b) | | | | – | |
From tax return of capital | | | (0.49) | | | | (0.86) | | | | (0.25) | |
| |
Total Distributions | | | (0.49) | | | | (1.00) | | | | (0.25) | |
| |
Net Increase/(Decrease) In Net Asset Value | | | (0.24) | | | | (0.08) | | | | 1.05 | |
| |
Net Asset Value, End Of Period | | $ | 15.73 | | | $ | 15.97 | | | $ | 16.05 | |
| |
Total Return(c) | | | 1.44% | | | | 5.93% | | | | 8.66% | |
| | | |
Ratios/Supplemental Data: | | | | | | | | | | | | |
Net assets, end of period (in 000s) | | $ | 3,167,631 | | | $ | 1,713,387 | | | $ | 611,467 | |
| | | |
Ratios To Average Net Assets: | | | | | | | | | | | | |
Ratio of expenses (including net deferred tax expense/benefit) to average net assets(e) | | | (0.51%)(d) | | | | 4.86%(d) | | | | 13.56%(d) | |
Ratio of expenses (including deferred tax benefit) to average net assets(f) | | | 0.53%(d) | | | | 0.53%(d) | | | | 0.52%(d) | |
Ratio of expenses (excluding net deferred tax expenses/benefits) to average net assets | | | 0.85%(d) | | | | 0.85%(d) | | | | 0.85%(d) | |
Ratio of net investment loss (including deferred tax benefit) to average net assets | | | (0.53%)(d) | | | | (0.53%)(d) | | | | (0.52%)(d) | |
Ratio of net investment loss (excluding deferred tax benefit) to average net assets | | | (0.85%)(d) | | | | (0.85%)(d) | | | | (0.85%)(d) | |
Portfolio Turnover Rate(g) | | | 6% | | | | 10% | | | | 12% | |
| (a) | Effective March 7, 2011 the Board approved changing the fiscal year end of the Fund from December 31 to November 30. |
| (b) | Calculated using average shares outstanding. |
| (c) | Total return is calculated assuming an initial investment made at the net asset value at the beginning of the period and redemption at the net asset value on the last day of the period, and assuming all distributions are reinvested at actual reinvestment prices. Total return calculated for a period of less than one year is not annualized. |
| (e) | Includes amount of deferred taxes/benefits for all components of the Statement of Operations. |
| (f) | Includes amount of deferred tax benefit associated with net investment income. |
| (g) | Portfolio turnover is not annualized and does not include securities received or delivered from processing creations or redemptions. |
See Notes to Financial Statements.
| | |
10 | | www.alpsfunds.com | 866.513.5856 |
| | |
| | Notes to Financial Statements |
| | May 31, 2012 (Unaudited) |
1. Organization
The ALPS ETF Trust (the “Trust”) is an open-end management investment company organized as a Delaware statutory trust on September 13, 2007 and is registered with the Securities and Exchange Commission (“SEC”) under the Investment Company Act of 1940, as amended (the “1940 Act”). As of May 31, 2012, the Trust consists of four separate portfolios. Each portfolio represents a separate series of the Trust. This report pertains to the Alerian MLP ETF (the “Fund”), which commenced investment operations on August 24, 2010 and began trading on the exchange on August 25, 2010. The investment objective of the Fund is to seek investment results that correspond generally to the price and yield performance (before the Fund’s fees and expenses) of its underlying index, the Alerian MLP Infrastructure Index (the “Index”).
The Fund’s Shares (“Shares”) are listed on the New York Stock Exchange (“NYSE”) Arca. The Fund issues and redeems Shares at Net Asset Value (“NAV”), in blocks of 50,000 Shares, each of which is called a “Creation Unit.” Creation Units are issued and redeemed principally in-kind for securities included in a specified index. Except when aggregated in Creation Units, Shares are not redeemable securities of the Fund.
2. Significant Accounting Policies
A. Use of Estimates
The following is a summary of significant accounting policies consistently followed by the Fund in the preparation of the financial statements. The accompanying financial statements were prepared in accordance with accounting principles generally accepted in the United States of America (“U.S. GAAP”). The preparation of financial statements in conformity with U.S. GAAP requires management to make certain estimates and assumptions that affect the reported amounts of assets and liabilities and disclosures of contingent assets and liabilities at the date of the financial statements and the reported amounts of revenue and expenses during the period. Actual results could differ from those estimates.
B. Portfolio Valuation
The Fund’s NAV is determined daily, as of the close of regular trading on the NYSE, normally 4:00 p.m. Eastern time, on each day the NYSE is open for trading. The NAV is computed by dividing the value of all assets of the Fund (including accrued interest and dividends), less all liabilities (including accrued expenses and dividends declared but unpaid), by the total number of shares outstanding.
Portfolio securities listed on any exchange other than the National Association of Securities Dealer Automated Quotation (“NASDAQ”) exchange are valued at the last sale price on the business day as of which such value is being determined. If there has been no sale on such day, the securities are valued at the mean of the most recent bid and asked prices on such day. Securities traded on the NASDAQ are valued at the NASDAQ Official Closing Price as determined by NASDAQ. Short-term investments that mature in less than 60 days are valued at amortized cost, which approximates market value.
| | |
Semi-Annual | May 31, 2012 | | 11 |
| | |
| | Notes to Financial Statements |
| | May 31, 2012 (Unaudited) |
The Fund’s investments are valued at market value or, in the absence of market value with respect to any portfolio securities, at fair value according to procedures adopted by the Trust’s Board of Trustees (the “Board”). When market quotations are not readily available or when events occur that make established valuation methods unreliable, securities of the Fund may be valued in good faith by or under the direction of the Board. These securities generally include, but are not limited to, restricted securities (securities which may not be publicly sold without registration under the Securities Act of 1933) for which a pricing service is unable to provide a market price; securities whose trading has been formally suspended; a security whose market price is not available from a pre-established primary pricing source or the pricing source is not willing to provide a price; a security with respect to which an event has occurred that is most likely to materially affect the value of the security after the market has closed but before the calculation of the Fund’s NAV or make it difficult or impossible to obtain a reliable market quotation; or a security whose price, as provided by the pricing service, does not reflect the security’s “fair value” due to the security being de-listed from a national exchange or the security’s primary trading market is temporarily closed at a time when, under normal conditions, it would be open. As a general principle, the current “fair value” of a security would be the amount which the owner might reasonably expect to receive from the closing sale prices on the applicable exchange and fair value prices may not reflect the actual value of a security. A variety of factors may be considered in determining the fair value of such securities.
C. Securities Transactions and Investment Income
Securities transactions are recorded as of the trade date. Realized gains and losses from securities transactions are recorded on the identified cost basis. Dividend income is recorded on the ex-dividend date. Interest income, if any, is recorded on the accrual basis, including amortization of premiums and accretion of discounts.
D. Dividends and Distributions to Shareholders
The Fund intends to declare and make quarterly distributions, or as the Board of Trustees may determine from time to time. Distributions of net realized capital gains earned by the Fund, if any, are distributed at least annually. Distributions from net investment income and capital gains are determined in accordance with income tax regulations, which may differ from U.S. GAAP. These differences are primarily due to differing treatments of income and gains on various investment securities held by the Fund, timing differences and differing characterization of distributions made by the Fund.
Distributions received from the Fund’s investments in Master Limited Partnerships (“MLPs”) generally are comprised of income and return of capital. The Fund records investment income and return of capital based on estimates made at the time such distributions are received. Such estimates are based on historical information available from each MLP and other industry sources. These estimates may subsequently be revised based on information received from MLPs after their tax reporting periods are concluded. For the period ended May 31, 2012, the Fund distributed $82,947,801, which was characterized as return of capital from MLP distributions received.
The Fund also expects that a portion of the distributions it receives from MLPs may be treated as a tax deferred return of capital, thus reducing the Fund’s current tax liability. Return of capital distributions are not taxable income to the shareholder, but reduce the investor’s tax basis in the investor’s Fund Shares. Such a reduction in tax basis will result in larger
| | |
12 | | www.alpsfunds.com | 866.513.5856 |
| | |
| | Notes to Financial Statements |
| | May 31, 2012 (Unaudited) |
taxable gains and/or lower tax losses on a subsequent sale of Fund Shares. Shareholders who periodically receive the payment of dividends or other distributions consisting of a return of capital may be under the impression that they are receiving net profits from the Fund when, in fact, they are not. Shareholders should not assume that the source of the distributions is from the net profits of the Fund.
E. Federal Income Taxation
The Fund is taxed as a regular C-corporation for federal income tax purposes. Currently, the maximum marginal regular federal income tax rate for a corporation is 35 percent. The Fund may be subject to a 20 percent federal alternative minimum tax on its federal alternative taxable income to the extent that its alternative minimum tax exceeds its regular federal income tax. This differs from most investment companies, which elect to be treated as “regulated investment companies” under the Code in order to avoid paying entity level income taxes. Under current law, the Fund is not eligible to elect treatment as a regulated investment company due to its investments primarily in MLPs invested in energy assets. As a result, the Fund will be obligated to pay applicable federal and state corporate income taxes on its taxable income as opposed to most other investment companies which are not so obligated. The Fund expects that a portion of the distributions it receives from MLPs may be treated as a tax-deferred return of capital, thus reducing the Fund’s current tax liability. However, the amount of taxes currently paid by the Fund will vary depending on the amount of income and gains derived from investments and/or sales of MLP interests and such taxes will reduce your return from an investment in the Fund.
Cash distributions from MLPs to the Fund that exceed such Fund’s allocable share of such MLP’s net taxable income are considered a tax-deferred return of capital that will reduce the Fund’s adjusted tax basis in the equity securities of the MLP. These reductions in such Fund’s adjusted tax basis in the MLP equity securities will increase the amount of gain (or decrease the amount of loss) recognized by the Fund on a subsequent sale of the securities. The Fund will accrue deferred income taxes for any future tax liability associated with (i) that portion of MLP distributions considered to be a tax-deferred return of capital as well as (ii) capital appreciation of its investments. Upon the sale of an MLP security, the Fund may be liable for previously deferred taxes. The Fund will rely to some extent on information provided by the MLPs, which is not necessarily timely, to estimate deferred tax liability for purposes of financial statement reporting and determining the NAV. From time to time, ALPS Advisors, Inc. will modify the estimates or assumptions related to the Fund’s deferred tax liability as new information becomes available. The Fund will generally compute deferred income taxes based on the marginal regular federal income tax rate applicable to corporations and an assumed rate attributable to state taxes.
The Fund recognizes interest and penalties related to unrecognized tax benefits within the income tax expense line in the accompanying statement of operations. Accrued interest and penalties are included within the related tax liability line in the balance sheet.
Since the Fund will be subject to taxation on its taxable income, the NAV of Fund shares will also be reduced by the accrual of any deferred tax liabilities. The Index however is calculated without any adjustments for taxes. As a result, the Fund’s after tax performance could differ significantly from the Index even if the pretax performance of the Fund and the performance of the Index are closely correlated.
| | |
Semi-Annual | May 31, 2012 | | 13 |
| | |
| | Notes to Financial Statements |
| | May 31, 2012 (Unaudited) |
The Fund’s income tax expense/(benefit) consists of the following:
| | | | | | | | | | | | |
| | | May 31, 2012 | |
| |
| | | Current | | | Deferred | | | Total | |
| | | | |
Federal | | $ | 290,571 | | | $ | (16,694,467 | ) | | $ | (16,403,896) | |
| | | |
State | | | 20,756 | | | | (1,192,462 | ) | | | (1,171,706) | |
| |
Total tax expense | | $ | 311,327 | | | $ | (17,886,929 | ) | | $ | (17,575,602) | |
| |
| |
| | | November 30, 2011 | |
| |
| | | Current | | | Deferred | | | Total | |
| | | | |
Federal | | $ | 5,304,722 | | | $ | 33,251,895 | | | $ | 38,556,617 | |
| | | |
State | | | 330,849 | | | | 2,157,804 | | | | 2,488,653 | |
| |
Total tax expense | | $ | 5,635,571 | | | $ | 35,409,699 | | | $ | 41,045,270 | |
| |
Deferred income taxes reflect the net tax effect of temporary differences between the carrying amount of assets and liabilities for financial reporting and tax purposes.
Components of the Fund’s deferred tax assets and liabilities are as follows:
| | | | | | | | |
| | | As of May 31, 2012 | | | As of November 30, 2011 | |
| |
Deferred tax assets: | | | | | | | | |
| | |
Income recognized from MLP investments | | | – | | | $ | 2,494,257 | |
Net operating loss carryforwards | | $ | 33,877,180 | | | | – | |
| | |
Less Deferred tax liabilities: | | | | | | | | |
| | |
Net unrealized gain on investment securities | | | (64,179,807) | | | | (50,683,811) | |
| |
Net Deferred tax liability | | $ | (30,302,627) | | | $ | (48,189,554) | |
| |
The net operating loss carryforward of the Fund is available to offset future taxable income and may be available for carryback. The fund has the net operating loss of $90m for the semi-annual period ended May 31, 2012 that is eligible for a 2 year carryback and a 20 year carryforward. This carryforward will expire on November 30, 2032.
Although the Fund currently has a net deferred tax liability, it reviews the recoverability of its deferred tax assets based upon the weight of available evidence. When assessing the recoverability of its deferred tax assets, significant weight was given to the effects of potential future realized and unrealized gains on investments and the period over which these deferred tax assets can be realized.
Currently, any capital losses that may be generated by the Fund in the future are eligible to be carried back up to three years and can be carried forward for five years to offset capital gains recognized by the fund in those years. Net operating losses that may be generated by the Fund in the future are eligible to be carried back up to two years and can be carried forward for 20 years to offset income generated by the Fund in those years.
| | |
14 | | www.alpsfunds.com | 866.513.5856 |
| | |
| | Notes to Financial Statements |
| | May 31, 2012 (Unaudited) |
Based upon the Fund’s assessment, it has determined that it is more likely than not that its deferred tax assets will be realized through future taxable income of the appropriate character. Accordingly, no valuation allowance has been established for the Fund’s deferred tax assets. The Fund will continue to assess the need for a valuation allowance in the future. Significant declines in the fair value of its portfolio of investments may change the Fund’s assessment of the recoverability of these assets and may result in the recording of a valuation allowance against all or a portion of the Fund’s gross deferred tax assets.
Total income tax expense/(benefit) (current and deferred) differs from the amount computed by applying the federal statutory income tax rate of 35% to net investment and realized and unrealized gain/(losses) on investment before taxes as follows:
| | | | | | | | |
| | | December 1, 2011 to
May 31, 2012 | | | January 1 to
November 30, 2011 | |
| |
Income tax expense at statutory rate | | $ | (16,403,928) | | | $ | 38,617,363 | |
| | |
State income taxes (net of federal benefit) | | | (1,191,091) | | | | 2,795,518 | |
| | |
Change in estimated state deferred rate | | | – | | | | (320,414 | ) |
| | |
Other | | | 19,417 | | | | (47,197 | ) |
| |
Net income tax expense/(benefit) | | $ | (17,575,602) | | | $ | 41,045,270 | |
| |
The following is a tabular reconciliation of the total amounts of unrecognized tax benefits: | | | | | | | | |
| | |
| | | December 1, 2011 to
May 31, 2012 | | | January 1 to
November 30, 2011 | |
| |
Unrecognized tax benefit – Beginning | | $ | – | | | $ | – | |
| | |
Gross increases – tax positions in prior period | | | – | | | | – | |
| | |
Gross decreases – tax positions in prior period | | | – | | | | – | |
| | |
Gross increases – tax positions in current period | | | – | | | | – | |
| | |
Settlement | | | – | | | | – | |
| | |
Lapse of statute of limitations | | | – | | | | – | |
| |
Unrecognized tax benefit – Ending | | $ | – | | | $ | – | |
| |
The Fund recognizes interest accrued related to unrecognized tax benefits and penalties as income tax expense. For the period December 1, 2011 to May 31, 2012, the Fund had no accrued penalties or interest.
The Fund recognizes the tax benefits of uncertain tax positions only where the position is “more likely than not” to be sustained assuming examination by tax authorities. Management has analyzed the Fund’s tax positions, and has concluded that no liability for unrecognized tax benefits should be recorded related to uncertain tax positions taken on U.S. tax returns
| | |
Semi-Annual | May 31, 2012 | | 15 |
| | |
| | Notes to Financial Statements |
| | May 31, 2012 (Unaudited) |
and state tax returns filed since inception of the fund. No U.S. federal or state income tax returns are currently under examination. The tax periods ended November 30, 2010 and 2011 remain subject to examination by tax authorities in the United States. Due to the nature of the Fund’s investments, the Fund may be required to file income tax returns in several states. The Fund is not aware of any tax positions for which it is reasonably possible that the total amounts of unrecognized tax benefits will change materially in the next 6 months.
The adjusted cost basis of investment and gross unrealized appreciation and depreciation of investments for federal income tax purposes were as follows:
| | | | | | | | |
| | | As of May 31, 2012 | | | As of November 30, 2011 | |
| |
Gross unrealized appreciation –
investment securities | | $ | 304,363,628 | | | $ | 164,199,507 | |
| | |
Gross unrealized depreciation –
investment securities | | | (133,959,428 | ) | | | (29,342,979) | |
| |
Net Unrealized appreciation –
investment securities | | $ | 170,404,200 | | | $ | 134,856,528 | |
| |
Cost basis of investments | | $ | 3,025,855,785 | | | $ | 1,629,684,649 | |
| |
The difference between cost amounts for financial statement purposes is due primarily to the recognition of pass-through income from the Fund’s investments in master limited partnerships and wash sale adjustments.
F. Fair Value Measurements
The Fund discloses the classification of its fair value measurements following a three-tier hierarchy based on the inputs used to measure fair value. Inputs refer broadly to the assumptions that market participants would use in pricing the asset or liability, including assumptions about risk. Inputs may be observable or unobservable. Observable inputs reflect the assumptions market participants would use in pricing the asset or liability that are developed based on market data obtained from sources independent of the reporting entity. Unobservable inputs reflect the reporting entity’s own assumptions about the assumptions market participants would use in pricing the asset or liability that are developed based on the best information available.
Various inputs are used in determining the value of the Fund’s investments as of the end of the reporting period. When inputs used fall into different levels of the fair value hierarchy, the level in the hierarchy within which the fair value measurement falls is determined based on the lowest level input that is significant to the fair value measurement in its entirety. The designated input levels are not necessarily an indication of the risk or liquidity associated with these investments. These inputs are categorized in the following hierarchy under applicable financial accounting standards:
| | |
Level 1 — | | Unadjusted quoted prices in active markets for identical assets or liabilities that the Fund has the ability to access. |
Level 2 — | | Observable inputs other than quoted prices included in level 1 that are observable for the asset or liability, either directly or indirectly. These inputs |
| | |
16 | | www.alpsfunds.com | 866.513.5856 |
| | |
| | Notes to Financial Statements |
| | May 31, 2012 (Unaudited) |
| | |
| | may include quoted prices for the identical instrument on an inactive market, prices for similar instruments, interest rates, prepayment speeds, credit risk, yield curves, default rates, and similar data. |
| | |
| |
Level 3 — | | Unobservable inputs for the asset or liability, to the extent relevant observable inputs are not available, representing the Fund’s own assumptions about the assumptions a market participant would use in valuing the asset or liability, and would be based on the best information available. |
| | | | | | | | | | | | | | | | |
Investments in Securities at Value* | | Level 1 -
Unadjusted Quoted Prices | | | Level 2 -
Other
Significant
Observable
Inputs | | | Level 3 -
Significant
Unobservable
Inputs | | | Total | |
| |
| Master Limited | | | | | | | | | | | | | | | | |
| Partnerships Shares | | $ | 3,196,259,985 | | | $ | – | | | $ | – | | | $ | 3,196,259,985 | |
| |
| TOTAL | | $ | 3,196,259,985 | | | $ | – | | | $ | – | | | $ | 3,196,259,985 | |
| |
* For detailed descriptions of sectors, see the accompanying Schedule of Investments.
For the six months ended May 31, 2012, the Fund did not have any transfers between Level 1 and Level 2 securities. The Fund did not have any securities which used significant unobservable inputs (Level 3) in determining fair value.
3. Investment Advisory Fee and Other Affiliated Transactions
ALPS Advisors, Inc. (the “Investment Adviser”) acts as the Fund’s investment adviser pursuant to an advisory agreement with the Trust on behalf of the Fund (the “Advisory Agreement”). Pursuant to the Advisory Agreement, the Fund pays the Investment Adviser a unitary fee for the services and facilities it provides payable on a monthly basis at the annual rate of 0.85% of the Fund’s average daily net assets. From time to time, the Investment Adviser may waive all or a portion of its fee.
Out of the unitary management fee, the Investment Adviser pays substantially all expenses of the Fund, including the fee of the Index Provider, and the cost of transfer agency, custody, fund administration, legal, audit, trustees and other services, other than taxes, interest expenses, distribution fees or expenses, brokerage expenses, and extraordinary expenses such as litigation not incurred in the ordinary course of the Fund’s business.
ALPS Fund Services, Inc. (“ALPS”), an affiliate of the Investment Adviser, is the administrator of the Fund.
The Bank of New York Mellon is the custodian, fund accounting agent and transfer agent for the Fund.
Each Trustee who is not an officer or employee of the Investment Adviser, any sub-adviser or any of their affiliates (“Independent Trustees”) is paid a quarterly retainer of $3,500, $1,500
| | |
Semi-Annual | May 31, 2012 | | 17 |
| | |
| | Notes to Financial Statements |
| | May 31, 2012 (Unaudited) |
for each regularly scheduled Board meeting attended and $750 for each special meeting held outside of regularly scheduled meetings.
4. Purchases and Sales of Securities
For the six months ended May 31, 2012, the cost of purchases and proceeds from sales of investment securities, excluding short-term investments and in-kind transactions, were as follows:
| | |
Purchases | | Sales |
$ 160,175,573 | | $ 242,776,089 |
For the six months ended May 31, 2012, the cost of in-kind purchases and proceeds from in-kind sales were as follows:
| | |
Purchases | | Sales |
$ 1,550,205,399 | | $ – |
Gains on in-kind transactions are not considered taxable for federal income tax purposes.
5. Capital Share Transactions
Shares are created and redeemed by the Fund only in Creation Unit size aggregations of 50,000. Only broker-dealers or large institutional investors with creation and redemption agreements called Authorized Participants (“AP”) are permitted to purchase or redeem Creation Units from the Fund. Such transactions are generally permitted on an in-kind basis, with a balancing cash component to equate the transaction to the net asset value per unit of the Fund on the transaction date. Cash may be substituted equivalent to the value of certain securities generally when they are not available in sufficient quantity for delivery, not eligible for trading by the AP or as a result of other market circumstances.
6. Master Limited Partnerships
MLPs are publicly traded partnerships engaged in the transportation, storage and processing of minerals and natural resources. By confining their operations to these specific activities, their interests, or units, are able to trade on public securities exchanges exactly like the shares of a corporation, without entity level taxation. Of the seventy MLPs eligible for inclusion in the Index, approximately two-thirds trade on the NYSE and the rest trade on the NASDAQ. To qualify as a MLP and to not be taxed as a corporation, a partnership must receive at least 90% of its income from qualifying sources as set forth in Section 7704(d) of the Internal Revenue Code of 1986, as amended (the “Code”). These qualifying sources include natural resource based activities such as the processing, transportation and storage of mineral or natural resources. MLPs generally have two classes of owners, the general partner and limited partners. The general partner of an MLP is typically owned by a major energy company, an investment fund, the direct management of the MLP, or is an entity owned by one or more of such parties. The general partner may be structured as a private or publicly traded corporation or other entity. The general partner typically controls the operations and management of the MLP through an up to 2% equity interest in the MLP plus, in many cases, ownership of common units and subordinated units. Limited partners typically own
| | |
18 | | www.alpsfunds.com | 866.513.5856 |
| | |
| | Notes to Financial Statements |
| | May 31, 2012 (Unaudited) |
the remainder of the partnership, through ownership of common units, and have a limited role in the partnership’s operations and management. MLPs are typically structured such that common units and general partner interests have first priority to receive quarterly cash distributions up to an established minimum amount (“minimum quarterly distributions” or “MQD”). Common and general partner interests also accrue arrearages in distributions to the extent the MQD is not paid. Once common and general partner interests have been paid, subordinated units receive distributions of up to the MQD; however, subordinated units do not accrue arrearages. Distributable cash in excess of the MQD is paid to both common and subordinated units and is distributed to both common and subordinated units generally on a pro rata basis. The general partner is also eligible to receive incentive distributions if the general partner operates the business in a manner which results in distributions paid per common unit surpassing specified target levels. As the general partner increases cash distributions to the limited partners, the general partner receives an increasingly higher percentage of the incremental cash distributions.
7. Indemnifications
Under the Trust’s organizational documents, its officers and Trustees are indemnified against certain liability arising out of the performance of their duties to the Trust. Additionally, in the normal course of business, the Trust enters into contracts with service providers that contain general indemnification clauses. The Trust’s maximum exposure under these arrangements is unknown, as this would involve future claims that may be made against the Trust that have not yet occurred.
8. New Accounting Pronouncements
In May 2011, the FASB issued ASU No. 2011-04 “Amendments to Achieve Common Fair Value Measurement and Disclosure Requirements” in GAAP and the International Financial Reporting Standards (“IFRSs”). ASU No. 2011-04 amends FASB ASC Topic 820, “Fair Value Measurements and Disclosures”, to establish common requirements for measuring fair value and for disclosing information about fair value measurements in accordance with GAAP and IFRSs. ASU No. 2011-04 is effective for fiscal years beginning after December 15, 2011 and for interim periods within those fiscal years. Management is currently evaluating the impact these amendments may have on the Funds financial statements.
In December 2011, the FASB issued ASU No. 2011-11 “Disclosures About Offsetting Assets and Liabilities” to expand current disclosure requirements on the offsetting of certain assets and liabilities. The new disclosures will be required for investments and derivative financial instruments subject to master netting or similar agreements which are eligible for offset in the Statements of Assets and Liabilities and will require an entity to disclose both gross and net information about such investments and transactions in the financial statements. The guidance is effective for financial statements with fiscal years beginning on or after January 1, 2013, and interim periods within those fiscal years. Management is evaluating the impact of this guidance on the Funds’ financial statement disclosures.
| | |
Semi-Annual | May 31, 2012 | | 19 |
| | |
| | Additional Information |
| | May 31, 2012 (Unaudited) |
Proxy Voting Policies And Procedures
A description of the Fund’s proxy voting policies and procedures used in determining how to vote for proxies and information regarding how the Fund voted proxies related to portfolio securities during the most recent 12-month period ended June 30th is available without charge, (1) on the Securities and Exchange Commission’s (“SEC”) website at http://www.sec.gov; (2) upon request, by calling 1-866-513-5856; and (3) on the Trust’s website located at http://www.alpsfunds.com.
Portfolio Holdings
The Trust will file its complete schedule of portfolio holdings with the SEC for the first and third quarters of each fiscal year on Form N-Q. The Trust’s Form N-Q will be available (1) on the SEC’s website at http:// www.sec.gov; (2) by calling 1-866-513-5856; (3) on the Trust’s website located at http://www.alpsfunds. com; and (4) for review and copying at the SEC’s Public Reference Room (“PRR”) in Washington D.C. Information regarding the operation of the PRR may be obtained by calling 1-800-732-0330.
| | |
20 | | www.alpsfunds.com | 866.513.5856 |
| | | | |
| Item 2. | | | | Code of Ethics. |
| |
| | Not Applicable to this Report. |
| | |
| Item 3. | | | | Audit Committee Financial Expert. |
| |
| | Not Applicable to this Report. |
| | |
| Item 4. | | | | Principal Accountant Fees and Services. |
| |
| | Not Applicable to this Report. |
| | |
| Item 5. | | | | Audit Committee of Listed Registrants. |
| |
| | Not applicable to Registrant. |
| | |
| Item 6. | | | | Investments. |
| |
| | (a) Schedule of Investments is included as part of the Report to Stockholders filed under Item 1 of this Form N-CSR. |
| |
| | (b) Not applicable |
| | |
| Item 7. | | | | Disclosure of Proxy Voting Policies and Procedures for Closed-End Management Investment
Companies. |
| |
| | Not applicable to Registrant. |
| | |
| Item 8. | | | | Portfolio Managers of Closed-End Management Investment Companies. |
| |
| | Not applicable to Registrant. |
-2-
| | | | |
Item 9. | | | | Purchases of Equity Securities by Closed-End Management Investment Company and
Affiliated Purchasers. |
| | |
| | | | Not applicable to Registrant. |
| | |
Item 10. | | | | Submission of Matters to a Vote of Security Holders. |
| | |
| | | | No material changes to the procedures by which the shareholders may recommend nominees to the Registrant’s Board of Trustees have been implemented after the Registrant’s last provided disclosure in response to the requirements of Item 407(c)(2)(iv) of Regulation S-K (17 CFR 229.407) (as required by Item 22(b)(15) of Schedule 14A (17 CFR 240.14a-101)), or this Item. |
| | |
Item 11. | | | | Controls and Procedures. |
| | |
| | (a) | | The Registrant’s principal executive and principal financial officers, or persons performing similar functions, have concluded that the Registrant’s disclosure controls and procedures (as defined in Rule 30a-3(c) under the Investment Company Act of 1940, as amended (the “1940 Act”) (17 CFR 270.30a-3(c))) are effective, as of a date within 90 days of the filing date of the report that includes the disclosure required by this paragraph, based on their evaluation of these controls and procedures required by Rule 30a-3(b) under the 1940 Act (17 CFR 270.30a-3(b)) and Rules 13a-15(b) or 15d-15(b) under the Securities Exchange Act of 1934, as amended (17 CFR 240.13a-15(b) or 240.15d-15(b)). |
| | |
| | (b) | | No changes in the Registrant’s internal control over financial reporting (as defined in Rule 30a-3(d) under the 1940 Act (17 CFR 270.30a-3(d)) occurred during the Registrant’s second fiscal quarter of the period covered by this report that have materially affected, or are reasonably likely to materially affect, the Registrant’s internal control over financial reporting. |
| | |
Item 12. | | | | Exhibits. |
| | |
| | (a)(1) | | Not applicable to this Report. |
| | |
| | (a)(2) | | The certifications required by Rule 30a-2(a) of the Investment Company Act of 1940, as amended, and Section 302 of the Sarbanes-Oxley Act of 2002 are attached hereto as Exhibit 99.Cert. |
| | |
| | (a)(3) | | Not applicable. |
| | |
| | (b) | | The certifications by the Registrant’s principal executive officer and principal financial officer, as required by Rule 30a-2(b) of the Investment Company Act of 1940, as amended, and Section 906 of the Sarbanes-Oxley Act of 2002 are attached hereto as Exhibit 99.906Cert. |
-3-
SIGNATURES
Pursuant to the requirements of the Securities Exchange Act of 1934 and the Investment Company Act of 1940, the Registrant has duly caused this report to be signed on its behalf by the undersigned, thereunto duly authorized.
| | |
ALPS ETF TRUST |
| |
By: | | /s/ Thomas A. Carter |
| | Thomas A. Carter (Principal Executive Officer) |
| | President |
| |
Date: | | August 6, 2012 |
Pursuant to the requirements of the Securities Exchange Act of 1934 and the Investment Company Act of 1940, this report has been signed below by the following persons on behalf of the registrant and in the capacities and on the dates indicated.
| | |
By: | | /s/ Thomas A. Carter |
| | Thomas A. Carter (Principal Executive Officer) |
| | President |
| |
Date: | | August 6, 2012 |
| |
By: | | /s/ Patrick D. Buchanan |
| | Patrick D. Buchanan (Principal Financial Officer) |
| | Treasurer |
| |
Date: | | August 6, 2012 |
-4-