UNITED STATES
SECURITIES AND EXCHANGE COMMISSION
Washington, D.C. 20549
FORM N-CSR
CERTIFIED SHAREHOLDER REPORT OF REGISTERED
MANAGEMENT INVESTMENT COMPANIES
Investment Company Act file number:
811-22175
ALPS ETF TRUST
(Exact name of registrant as specified in charter)
1290 Broadway, Suite 1100, Denver, Colorado 80203
(Address of principal executive offices) (Zip code)
Tané Tyler, Esq., Secretary
ALPS ETF Trust
1290 Broadway, Suite 1100
Denver, Colorado 80203
(Name and address of agent for service)
Registrant’s Telephone Number, including Area Code: (303) 623-2577
Date of fiscal year end: November 30
Date of reporting period: December 1, 2012 – May 31, 2013
Item 1. Report to Stockholders.
| | |

| | Table of Contents |
| | |
| | |
| | 1 |
| Semi-Annual | May 31, 2013 (Unaudited) | |
| | |
| | Performance Overview |
| | May 31, 2013 (Unaudited) |
FUND DESCRIPTION
The Cohen & Steers Global Realty Majors ETF (the “Fund”) seeks investment results that correspond generally to the performance (before the Fund’s fees and expenses) of an equity index called the Cohen & Steers Global Realty Majors Index (the “Index”). The Shares of the Fund are listed and trade on the NYSE Arca under the ticker symbol “GRI.” The Fund will normally invest substantially all of its assets in the 75 stocks that comprise the Cohen & Steers Global Realty Majors Index. The Fund began trading on May 9, 2008.
The Index is a free-float, market-cap-weighted total return index of selected real estate equity securities maintained by Cohen & Steers. It is quoted intraday on a real-time basis by the Chicago Mercantile Exchange under the symbol GRM. The Index’s free-float market capitalization approach and qualitative screening process emphasize companies that the Cohen & Steers Index Committee believes are leading the securitization of real estate globally.
PERFORMANCE OVERVIEW
Average Annual Total Return as of May 31, 2013
| | | | | | | | | | | | | | | | | | | | | | | | | |
| | | 6 Months | | 1 Year | | 3 Year | | 5 Year | | Since
Inception* |
Fund Performance | | | | | | | | | | | | | | | | | | | | | | | | | |
NAV | | | | 8.39 | % | | | | 24.73 | % | | | | 15.92 | % | | | | 1.78 | % | | | | 0.69 | % |
Market Price** | | | | 7.91 | % | | | | 23.82 | % | | | | 15.94 | % | | | | 1.38 | % | | | | 0.59 | % |
Index Performance | | | | | | | | | | | | | | | | | | | | | | | | | |
Cohen & Steers Global Realty Majors Portfolio Index | | | | 8.82 | % | | | | 25.60 | % | | | | 16.81 | % | | | | 2.55 | % | | | | 1.55 | % |
FTSE EPRA/NAREIT Developed Real Estate Index | | | | 9.26 | % | | | | 25.07 | % | | | | 16.27 | % | | | | 2.55 | % | | | | 1.56 | % |
S&P 500® Total Return Index | | | | 16.43 | % | | | | 27.27 | % | | | | 16.87 | % | | | | 5.43 | % | | | | 5.13 | % |
Total Expense Ratio (per the current prospectus) 0.55%.
Performance data quoted represents past performance. Past performance does not guarantee future results. Investment return and principal value of an investment will fluctuate so that an investor’s shares, when sold or redeemed, may be worth more or less than the original cost. Current performance data may be higher or lower than actual data quoted. For most current month-end performance data please visit www.alpsfunds.com.
NAV is an exchange-traded fund’s per-share value. The per-share dollar amount of the fund is derived by dividing the total value of all the securities in its portfolio, less any liabilities, by the number of fund shares outstanding. Information detailing the number of days the Market Price of the Fund was greater than the Fund’s NAV and the number of days it was less than the Fund’s NAV can be obtained at www.alpsfunds.com.
| ** | Market Price is based on the midpoint of the bid/ask spread at 4p.m. ET and does not represent the returns an investor would receive if shares were traded at other times. |
Cohen & Steers Global Realty Majors® Portfolio Index: A free-float adjusted, modified market capitalization-weighted index of global real estate equities. The modified market capitalization weighting approach and qualitative screening process emphasize those companies that, in the opinion of the Cohen & Steers investment committee, are leading the securitization of real estate globally.
FTSE EPRA/NAREIT Developed Real Estate Index: An unmanaged market-weighted total return index that consists of many companies from developed markets whose floats are larger than $100 million and which derive more than half of their revenue from property-related activities.
S&P 500® Index: The Standard & Poor’s composite index of 500 stocks, a widely recognized, unmanaged index of common stock prices.
An investor cannot invest directly in an index.
| | |
2 | | |
| | An ALPS Advisors Solution | www.alpsfunds.com | 866.513.5856 |
| | |
| | Performance Overview |
| | May 31, 2013 (Unaudited) |
GROWTH OF $10K as of May 31, 2013
Comparison of Change in Value of $10,000 Investment in Cohen & Steers Global Realty Majors ETF and Cohen & Steers Global Realty Majors Index.
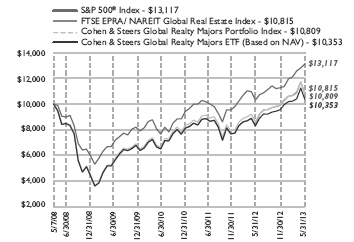
The chart above represents historical performance of a hypothetical investment of $10,000 in the Fund over the life of the Fund. Performance calculations are as of the end of each month. Past performance does not guarantee future results. This chart does not reflect the deduction of taxes that a shareholder would pay on Fund distributions or the redemption of Fund shares.
TOP 10 HOLDINGS (as a % of Net Assets)* as of May 31, 2013
| | | | |
Simon Property Group, Inc. | | | 4.00 | % |
Mitsui Fudosan Co., Ltd. | | | 3.64 | |
Unibail-Rodamco | | | 3.53 | |
Westfield Group | | | 3.40 | |
Mitsubishi Estate Co., Ltd. | | | 3.40 | |
Public Storage | | | 3.29 | |
HCP REIT, Inc. | | | 3.23 | |
| | | | |
Ventas, Inc. | | | 3.13 | % |
Sun Hung Kai Properties, Ltd. | | | 3.08 | |
ProLogis | | | 3.00 | |
Percent of Net assets in Top Ten Holdings: | | | 33.70 | % |
* Future holdings are subject to change.
GEOGRAPHIC BREAKDOWN**†
| | | | |
United States | | | 47.42 | % |
Hong Kong | | | 12.91 | |
Japan | | | 11.59 | |
Australia | | | 8.20 | |
United Kingdom | | | 6.15 | |
France | | | 4.98 | |
Singapore | | | 3.67 | |
| | | | |
Canada | | | 2.05 | % |
Germany | | | 0.76 | |
Brazil | | | 0.70 | |
Netherlands | | | 0.65 | |
Switzerland | | | 0.53 | |
Sweden | | | 0.39 | |
** % of Total Investments.
† Future breakdown are subject to change.
| | |
| | 3 |
| Semi-Annual | May 31, 2013 (Unaudited) | |
| | |
| | Disclosure of Fund Expenses |
| | For the six months ended May 31, 2013 (Unaudited) |
Shareholder Expense Example: As a shareholder of the Fund, you incur two types of costs: (1) transaction costs which may include creation and redemption fees or brokerage charges, and (2) ongoing costs, including management fees and other Fund expenses. These examples are intended to help you understand your ongoing costs (in dollars) of investing in the Fund and to compare these costs with the ongoing costs of investing in other funds. It is based on an investment of $1,000 invested at the beginning of the (six month) period and held through May 31, 2013.
Actual Return: The first line of the table provides information about actual account values and actual expenses. You may use the information in this table, together with the amount you invested, to estimate the expenses that you incurred over the period. Simply divide your account value by $1,000 (for example, an $8,600 account value divided by $1,000 = 8.6), then multiply the result by the number in the first line under the heading entitled “Expenses Paid During the Period” to estimate the expenses attributable to your investment during this period.
Hypothetical 5% Return: The second line of the table provides information about hypothetical account values and hypothetical expenses based on the Fund’s actual expense ratio and an assumed rate of return of 5% per year before expenses, which is not the Fund’s actual return. The hypothetical account values and expenses may not be used to estimate the actual ending account balance or expenses you paid for the period. You may use this information to compare ongoing costs of investing in the Fund and other funds. To do so, compare this 5% hypothetical example with the 5% hypothetical examples that appear in the shareholder reports of the other funds.
The expenses shown in the table are meant to highlight ongoing Fund costs only and do not reflect any transaction costs, such as creation and redemption fees, or brokerage charges. Therefore, the second line is useful in comparing ongoing costs only, and will not help you determine the relative total costs of owning different funds. In addition, if these costs were included, your costs would have been higher.
| | | | | | | | | | | | | | | | | | | | |
| | | Beginning
Account Value
12/1/12 | | Ending
Account Value
05/31/13 | | Expense
Ratio(a) | | Expenses Paid
During the Period
12/1/12 to
05/31/13(b) |
Actual | | | $ | 1,000.00 | | | | $ | 1,083.90 | | | | | 0.55 | % | | | $ | 2.86 | |
Hypothetical
(5% return before expenses) | | | $ | 1,000.00 | | | | $ | 1,022.19 | | | | | 0.55 | % | | | $ | 2.77 | |
| (a) | Annualized, based on the Fund’s most recent fiscal half year expenses. |
| (b) | Expenses are equal to the Fund’s annualized expense ratio multiplied by the average account value over the period, multiplied by the number of days in the most recent fiscal half year (182), then divided by 365. |
| | |
4 | | |
| | An ALPS Advisors Solution | www.alpsfunds.com | 866.513.5856 |
| | |
| | Schedule of Investments |
| | May 31, 2013 (Unaudited) |
| | | | | | | | |
| Security Description | | Shares | | | Value | |
| |
COMMON STOCKS (99.68%) | | | | | | | | |
Australia (8.18%) | | | | | | | | |
Dexus Property Group | | | 794,708 | | | $ | 836,631 | |
Goodman Group | | | 248,434 | | | | 1,222,103 | |
GPT Group | | | 267,652 | | | | 996,446 | |
Mirvac Group | | | 560,925 | | | | 899,193 | |
Stockland Trust Group | | | 366,227 | | | | 1,279,313 | |
Westfield Group | | | 338,223 | | | | 3,728,973 | |
| | | | | | | | |
| | | | | | | 8,962,659 | |
| | | | | | | | |
Brazil (0.70%) | | | | | | | | |
BR Malls Participacoes SA | | | 75,400 | | | | 768,504 | |
| | | | | | | | |
| | |
Canada (2.05%) | | | | | | | | |
Boardwalk REIT* | | | 6,465 | | | | 380,386 | |
Dundee REIT | | | 16,651 | | | | 547,512 | |
RioCan REIT | | | 49,639 | | | | 1,316,684 | |
| | | | | | | | |
| | | | | | | 2,244,582 | |
| | | | | | | | |
France (4.96%) | | | | | | | | |
Gecina SA | | | 4,324 | | | | 530,145 | |
ICADE | | | 3,753 | | | | 341,603 | |
Klepierre | | | 16,110 | | | | 695,173 | |
Unibail-Rodamco | | | 15,745 | | | | 3,872,912 | |
| | | | | | | | |
| | | | | | | 5,439,833 | |
| | | | | | | | |
Germany (0.75%) | | | | | | | | |
Deutsche EuroShop AG | | | 7,538 | | | | 327,236 | |
Deutsche Wohnen AG | | | 26,531 | | | | 498,116 | |
| | | | | | | | |
| | | | | | | 825,352 | |
| | | | | | | | |
Hong Kong (12.88%) | | | | | | | | |
China Overseas Land & Investment, Ltd. | | | 633,000 | | | | 1,887,763 | |
China Resources Land, Ltd. | | | 305,500 | | | | 938,626 | |
Hang Lung Properties, Ltd. | | | 318,000 | | | | 1,118,362 | |
Hongkong Land Holdings, Ltd. | | | 194,600 | | | | 1,352,470 | |
The Link Real Estate Investment Trust | | | 376,164 | | | | 1,945,609 | |
Sino Land Co., Ltd. | | | 486,000 | | | | 724,999 | |
Sun Hung Kai Properties, Ltd. | | | 254,000 | | | | 3,376,807 | |
Swire Properties, Ltd. | | | 173,000 | | | | 541,558 | |
The Wharf Holdings, Ltd. | | | 249,700 | | | | 2,222,744 | |
| | | | | | | | |
| | | | | | | 14,108,938 | |
| | | | | | | | |
Japan (11.56%) | | | | | | | | |
Japan Retail Fund Investment Corp. | | | 350 | | | | 668,956 | |
Mitsubishi Estate Co., Ltd. | | | 147,000 | | | | 3,727,132 | |
Mitsui Fudosan Co., Ltd. | | | 140,000 | | | | 3,990,045 | |
| | |
| | 5 |
| Semi-Annual | May 31, 2013 (Unaudited) | |
| | |
| | Schedule of Investments |
| | May 31, 2013 (Unaudited) |
| | | | | | | | |
| Security Description | | Shares | | | Value | |
| |
Japan (11.56%) (continued) | | | | | | | | |
Nippon Building Fund, Inc. | | | 113 | | | $ | 1,175,502 | |
Sumitomo Realty & Development Co., Ltd. | | | 79,000 | | | | 3,110,298 | |
| | | | | | | | |
| | | | | | | 12,671,933 | |
| | | | | | | | |
| | |
Netherlands (0.65%) | | | | | | | | |
Corio N.V. | | | 15,783 | | | | 708,140 | |
| | | | | | | | |
| | |
Singapore (3.66%) | | | | | | | | |
Ascendas Real Estate Investment Trust | | | 303,066 | | | | 556,282 | |
CapitaLand, Ltd. | | | 423,000 | | | | 1,157,941 | |
CapitaMall Trust | | | 422,347 | | | | 718,419 | |
City Developments, Ltd. | | | 74,000 | | | | 631,133 | |
Global Logistic Properties, Ltd. | | | 424,000 | | | | 945,987 | |
| | | | | | | | |
| | | | | | | 4,009,762 | |
| | | | | | | | |
| | |
Sweden (0.39%) | | | | | | | | |
Castellum AB | | | 28,249 | | | | 426,080 | |
| | | | | | | | |
| | |
Switzerland (0.52%) | | | | | | | | |
PSP Swiss Property AG | | | 6,323 | | | | 574,938 | |
| | | | | | | | |
| | |
United Kingdom (6.13%) | | | | | | | | |
British Land Co. Plc | | | 164,638 | | | | 1,523,430 | |
Derwent London Plc | | | 14,102 | | | | 511,670 | |
Great Portland Estates Plc | | | 56,783 | | | | 477,973 | |
Hammerson Plc | | | 117,048 | | | | 912,339 | |
Intu Properties Plc | | | 110,201 | | | | 567,456 | |
Land Securities Group Plc | | | 128,732 | | | | 1,825,896 | |
Segro Plc | | | 121,918 | | | | 517,570 | |
Shaftesbury Plc | | | 41,312 | | | | 386,349 | |
| | | | | | | | |
| | | | | | | 6,722,683 | |
| | | | | | | | |
| | |
United States (47.25%) | | | | | | | | |
Alexandria Real Estate Equities, Inc. | | | 11,563 | | | | 792,066 | |
American Campus Communities, Inc. | | | 17,314 | | | | 706,931 | |
AvalonBay Communities, Inc. | | | 18,780 | | | | 2,491,355 | |
Boston Properties, Inc. | | | 25,056 | | | | 2,670,469 | |
Brookfield Office Properties, Inc. | | | 41,339 | | | | 709,791 | |
Camden Property Trust | | | 13,979 | | | | 968,046 | |
Digital Realty Trust, Inc. | | | 20,693 | | | | 1,260,411 | |
Douglas Emmett, Inc. | | | 21,712 | | | | 553,439 | |
Equity Residential | | | 52,943 | | | | 2,993,927 | |
Essex Property Trust, Inc. | | | 6,272 | | | | 985,582 | |
Federal Realty Investment Trust | | | 10,731 | | | | 1,156,265 | |
General Growth Properties, Inc. | | | 74,340 | | | | 1,526,200 | |
| | |
6 | | |
| | An ALPS Advisors Solution | www.alpsfunds.com | 866.513.5856 |
| | |
| | Schedule of Investments |
| | May 31, 2013 (Unaudited) |
| | | | | | | | | | |
| Security Description | | | | Shares | | | Value | |
| |
United States (47.25%) (continued) | | | | | | | | | | |
HCP REIT, Inc. | | | | | 74,758 | | | $ | 3,542,034 | |
Health Care REIT, Inc. | | | | | 43,081 | | | | 2,930,800 | |
Host Hotels & Resorts, Inc. | | | | | 119,915 | | | | 2,133,288 | |
Kimco Realty Corp. | | | | | 67,255 | | | | 1,489,698 | |
Liberty Property Trust | | | | | 19,768 | | | | 802,185 | |
The Macerich Co. | | | | | 22,628 | | | | 1,468,783 | |
ProLogis | | | | | 81,475 | | | | 3,283,443 | |
Public Storage | | | | | 23,761 | | | | 3,606,920 | |
Realty Income Corp. | | | | | 32,000 | | | | 1,454,400 | |
Regency Centers Corp. | | | | | 14,849 | | | | 766,208 | |
Simon Property Group, Inc. | | | | | 26,366 | | | | 4,388,357 | |
SL Green Realty Corp. | | | | | 15,033 | | | | 1,307,570 | |
Tanger Factory Outlet Centers | | | | | 15,460 | | | | 533,061 | |
UDR, Inc. | | | | | 41,112 | | | | 1,001,899 | |
Ventas, Inc. | | | | | 48,131 | | | | 3,435,109 | |
Vornado Realty Trust | | | | | 27,911 | | | | 2,231,484 | |
Weingarten Realty Investors | | | | | 18,329 | | | | 584,329 | |
| | | | | | | | | | |
| | | | | | | | | 51,774,050 | |
| | | | | | | | | | |
TOTAL COMMON STOCKS | | | | | | | | | | |
(Cost $95,594,264) | | | | | | | | | 109,237,454 | |
| | | | | | | | | | |
| | | |
| | | 7 Day Yield | | Shares | | | Value | |
| |
| | | |
SHORT TERM INVESTMENTS (0.05%) | | | | | | | | | | |
Dreyfus Treasury Prime Cash Management, Institutional Class | | 0.000%(a) | | | 51,169 | | | | 51,169 | |
| | | | | | | �� | | | |
| | | |
TOTAL SHORT TERM INVESTMENTS | | | | | | | | | | |
(Cost $51,169) | | | | | | | | | 51,169 | |
| | | | | | | | | | |
| | | |
TOTAL INVESTMENTS (99.73%) | | | | | | | | | | |
(Cost $95,645,433) | | | | | | | | $ | 109,288,623 | |
| | | | | | | | | | |
| | | |
NET OTHER ASSETS AND LIABILITIES (0.27%) | | | | | | | | | 295,591 | |
| | | | | | | | | | |
| | | |
NET ASSETS (100.00%) | | | | | | | | $ | 109,584,214 | |
| | | | | | | | | | |
| * | Non-income producing security. |
| | |
| | 7 |
| Semi-Annual | May 31, 2013 (Unaudited) | |
| | |
| | Schedule of Investments |
| | May 31, 2013 (Unaudited) |
| | |
| Common Abbreviations: |
AB - | | Aktiebolag is the Swedish equivalent of the term corporation. |
AG - | | Aktiengesellschaft is a German term that refers to a corporation that is limited by shares, i.e., owned by shareholders. |
Ltd. - | | Limited. |
N.V. - | | Naamloze Vennootschap is the Dutch term for a public limited liability corporation. |
Plc - | | Public Limited Company. |
REIT - | | Real Estate Investment Trust. |
SA - | | Generally designated corporations in various countries, mostly those employing the civil law. |
See Notes to Financial Statements.
| | |
8 | | |
| | An ALPS Advisors Solution | www.alpsfunds.com | 866.513.5856 |
| | |
| | Statement of Assets & Liabilities |
| | May 31, 2013 (Unaudited) |
| | | | |
ASSETS: | | | | |
Investments, at value | | $ | 109,288,623 | |
Cash | | | 6,055 | |
Foreign currency, at value (Cost $17,368) | | | 17,382 | |
Foreign tax reclaims | | | 20,216 | |
Dividends receivable | | | 305,844 | |
Total Assets | | | 109,638,120 | |
| | | | | |
| |
LIABILITIES: | | | | |
Payable to advisor | | | 53,906 | |
Total Liabilities | | | 53,906 | |
NET ASSETS | | $ | 109,584,214 | |
| | | | | |
| |
NET ASSETS CONSIST OF: | | | | |
Paid-in capital | | $ | 102,409,295 | |
Accumulated undistributed net investment loss | | | (3,085,308 | ) |
Accumulated net realized loss on investments and foreign currency transactions | | | (3,378,807 | ) |
Net unrealized appreciation on investments and translation of assets and liabilities denominated in foreign currencies | | | 13,639,034 | |
NET ASSETS | | $ | 109,584,214 | |
| | | | | |
| |
INVESTMENTS, AT COST | | $ | 95,645,433 | |
| |
PRICING OF SHARES | | | | |
Net Assets | | $ | 109,584,214 | |
Shares of beneficial interest outstanding (Unlimited number of shares authorized, par value $0.01 per share) | | | 2,700,000 | |
Net Asset Value, offering and redemption price per share | | $ | 40.59 | |
| | |
| See Notes to Financial Statements. | | 9 |
| Semi-Annual | May 31, 2013 (Unaudited) | |
| | |
| | Statement of Operations |
| | |
| | | | | |
| | | For the
Six Months Ended
May 31, 2013
(Unaudited) |
INVESTMENT INCOME: | | | | | |
Dividends(a) | | | $ | 1,500,952 | |
Total Investment Income | | | | 1,500,952 | |
| |
EXPENSES: | | | | | |
Investment advisory fee | | | | 250,427 | |
Total Net Expenses | | | | 250,427 | |
NET INVESTMENT INCOME | | | | 1,250,525 | |
| |
Net realized gain on investments | | | | 93,351 | |
Net realized loss on foreign currency transactions | | | | (10,011) | |
Net change in unrealized appreciation on investments | | | | 4,094,010 | |
Net change in unrealized depreciation on translation of assets and liabilities in foreign currencies | | | | (2,493) | |
NET REALIZED AND UNREALIZED GAIN ON INVESTMENTS | | | | 4,174,857 | |
NET INCREASE IN NET ASSETS RESULTING FROM OPERATIONS | | | $ | 5,425,382 | |
| (a) | Net of foreign withholding tax of $86,541. |
| | |
10 | | See Notes to Financial Statements. |
| | An ALPS Advisors Solution | www.alpsfunds.com | 866.513.5856 |
| | |
| | Statements of Changes in Net Assets |
| | |
| | | | | | | | |
| | | For the
Six Months Ended
May 31, 2013
(Unaudited) | | | For the
Year Ended November 30, 2012 | |
OPERATIONS: | | | | | | | | |
Net investment income | | $ | 1,250,525 | | | $ | 1,557,853 | |
Net realized gain on investments and foreign currency transactions | | | 83,340 | | | | 1,515,849 | |
Net change in unrealized appreciation on investments and foreign currency | | | 4,091,517 | | | | 9,937,032 | |
Net increase in net assets resulting from operations | | | 5,425,382 | | | | 13,010,734 | |
| | |
DISTRIBUTIONS TO SHAREHOLDERS: | | | | | | | | |
From net investment income | | | (4,021,295) | | | | (1,417,294) | |
Total distributions | | | (4,021,295) | | | | (1,417,294) | |
| | |
SHARE TRANSACTIONS: | | | | | | | | |
Proceeds from sale of shares | | | 41,345,340 | | | | 18,618,717 | |
Cost of shares redeemed | | | (4,423,476) | | | | (9,371,914) | |
Net increase from share transactions | | | 36,921,864 | | | | 9,246,803 | |
Net increase in net assets | | | 38,325,951 | | | | 20,840,243 | |
| | |
NET ASSETS: | | | | | | | | |
Beginning of year | | | 71,258,263 | | | | 50,418,020 | |
End of period* | | $ | 109,584,214 | | | $ | 71,258,263 | |
| | | | | | | | | |
| | |
*Including accumulated net investment loss of: | | $ | (3,085,308) | | | $ | (314,538) | |
| | |
Other Information: | | | | | | | | |
SHARE TRANSACTIONS: | | | | | | | | |
Beginning shares | | | 1,800,000 | | | | 1,550,000 | |
Shares sold | | | 1,000,000 | | | | 500,000 | |
Shares redeemed | | | (100,000) | | | | (250,000) | |
Shares outstanding, end of period | | | 2,700,000 | | | | 1,800,000 | |
| | | | | | | | | |
| | |
| See Notes to Financial Statements. | | 11 |
| Semi-Annual | May 31, 2013 (Unaudited) | |
| | | | | | | | | | |
| | | For the
Six Months Ended
May 31, 2013
(Unaudited) | | |
NET ASSET VALUE, BEGINNING OF PERIOD | | | $ | 39.59 | | | |
| | |
INCOME/(LOSS) FROM OPERATIONS: | | | | | | | |
Net investment income | | | | 0.56 | (b) | | |
Net realized and unrealized gain/(loss) on investments | | | | 2.67 | | | |
Total from Investment Operations | | | | 3.23 | | | |
| | |
LESS DISTRIBUTIONS: | | | | | | | |
From net investment income | | | | (2.23 | ) | | |
Total Distributions | | | | (2.23 | ) | | |
NET INCREASE/(DECREASE) IN NET ASSET VALUE | | | | 1.00 | | | |
NET ASSET VALUE, END OF PERIOD | | | $ | 40.59 | | | |
| | | | | | | | | |
TOTAL RETURN(c) | | | | 8.39 | % | | |
| | |
RATIOS/ SUPPLEMENTAL DATA: | | | | | | | |
Net assets, end of period (in 000s) | | | $ | 109,584 | | | |
| | |
RATIOS TO AVERAGE NET ASSETS: | | | | | | | |
Operating expenses | | | | 0.55 | %(d) | | |
Net investment income | | | | 2.75 | %(d) | | |
PORTFOLIO TURNOVER RATE(e) | | | | 7 | % | | |
| (a) | Effective March 7, 2011, the Board approved changing the fiscal year end of the Fund from December 31 to November 30. |
| (b) | Calculated using average shares outstanding. |
| (c) | Total return is calculated assuming an initial investment made at the net asset value at the beginning of the period and redemption at the net asset value on the last day of the period and assuming all distributions are reinvested at actual reinvestment prices. Total return calculated for a period of less than one year is not annualized. |
| (e) | Portfolio turnover is not annualized and does not include securities received or delivered from processing creations or redemptions. |
| | |
12 | | See Notes to Financial Statements. |
| | An ALPS Advisors Solution | www.alpsfunds.com | 866.513.5856 |
|
Financial Highlights |
For a Share Outstanding Throughout the Periods Presented |
| | | | | | | | | | | | | | | | | | |
For the Year
Ended
November 30,
2012 | | | For the Period
January 1, 2011
to
November 30,
2011(a) | | | For the Year
Ended
December 31,
2010 | | | For the Year
Ended
December 31,
2009 | | | For the Period
May 7, 2008
(Inception)
through
December 31,
2008 | |
| $ | 32.53 | | | $ | 35.52 | | | $ | 31.35 | | | $ | 25.06 | | | $ | 50.00 | |
| | | | |
| | 0.91 | (b) | | | 0.97 | (b) | | | 1.43 | (b) | | | 0.98 | | | | 0.47 | |
| | 6.97 | | | | (2.87 | ) | | | 4.68 | | | | 7.00 | | | | (24.92 | ) |
| | 7.88 | | | | (1.90 | ) | | | 6.11 | | | | 7.98 | | | | (24.45 | ) |
| | | | |
| | (0.82 | ) | | | (1.09 | ) | | | (1.94 | ) | | | (1.69 | ) | | | (0.49 | ) |
| | (0.82 | ) | | | (1.09 | ) | | | (1.94 | ) | | | (1.69 | ) | | | (0.49 | ) |
| | 7.06 | | | | (2.99 | ) | | | 4.17 | | | | 6.29 | | | | (24.94 | ) |
| $ | 39.59 | | | $ | 32.53 | | | $ | 35.52 | | | $ | 31.35 | | | $ | 25.06 | |
| | | | | | | | | | | | | | | | | | | |
| | 24.50 | % | | | (5.53 | )% | | | 19.91 | % | | | 32.51 | % | | | (48.90 | )% |
| | | | |
| $ | 71,258 | | | $ | 50,418 | | | $ | 42,626 | | | $ | 12,603 | | | $ | 5,063 | |
| | | | |
| | 0.55 | % | | | 0.55% | (d) | | | 0.55 | % | | | 0.55 | % | | | 0.55 | %(d) |
| | 2.47 | % | | | 3.02% | (d) | | | 4.33 | % | | | 3.24 | % | | | 3.49 | %(d) |
| | 4 | % | | | 15% | | | | 14 | % | | | 18 | % | | | 18 | % |
| | |
| | 13 |
| Semi-Annual | May 31, 2013 (Unaudited) | |
| | |
| | Notes to Financial Statements |
| | May 31, 2013 (Unaudited) |
1. ORGANIZATION
The ALPS ETF Trust (the “Trust”), a Delaware statutory trust, is an open-end management investment company registered under the Investment Company Act of 1940, as amended (the “1940 Act”). As of May 31, 2013, the Trust consists of thirteen separate portfolios. Each portfolio represents a separate series of the Trust. This report pertains solely to the Cohen & Steers Global Realty Majors ETF (the “Fund”). The investment objective of the Fund is to seek investment results that correspond generally to the price and yield (before the Fund’s fees and expenses) of the Cohen & Steers Global Realty Majors Index.
The Fund’s Shares (“Shares”) are listed on the New York Stock Exchange (“NYSE”) Arca. The Fund issues and redeems Shares at Net Asset Value (“NAV”) in blocks of 50,000 Shares, each of which is called a “Creation Unit.” Creation Units are issued and redeemed principally in-kind for securities included in a specified index. Except when aggregated in Creation Units, Shares are not redeemable securities of the Fund.
2. SIGNIFICANT ACCOUNTING POLICIES
The following is a summary of significant accounting policies consistently followed by the Fund in the preparation of the financial statements. The accompanying financial statements were prepared in accordance with accounting principles generally accepted in the United States of America (“U.S. GAAP”). The preparation of financial statements in conformity with U.S. GAAP requires management to make certain estimates and assumptions that affect the reported amounts of assets and liabilities and disclosures of contingent assets and liabilities at the date of the financial statements and the reported amounts of revenue and expenses during the period. Actual results could differ from those estimates.
A. Portfolio Valuation
The Fund’s NAV is determined daily, as of the close of regular trading on the NYSE, normally 4:00 p.m. Eastern time, on each day the NYSE is open for trading. The NAV is computed by dividing the value of all assets of the Fund (including accrued interest and dividends), less all liabilities (including accrued expenses and dividends declared but unpaid), by the total number of shares outstanding.
Portfolio securities listed on any exchange other than the National Association of Securities Dealer Automated Quotation (“NASDAQ”) exchange are valued at the last sale price on the business day as of which such value is being determined. If there has been no sale on such day, the securities are valued at the mean of the most recent bid and asked prices on such day. Securities traded on the NASDAQ are valued at the NASDAQ Official Closing Price as determined by NASDAQ. Short-term investments that mature in less than 60 days are valued at amortized cost, which approximates market value.
| | |
14 | | |
| | An ALPS Advisors Solution | www.alpsfunds.com | 866.513.5856 |
| | |
| | Notes to Financial Statements |
| | May 31, 2013 (Unaudited) |
The Fund’s investments are valued at market value or, in the absence of market value with respect to any portfolio securities, at fair value according to procedures adopted by the Trust’s Board of Trustees (the “Board”). When market quotations are not readily available or when events occur that make established valuation methods unreliable, securities of the Fund may be valued in good faith by or under the direction of the Board. These securities generally include, but are not limited to, restricted securities (securities which may not be publicly sold without registration under the Securities Act of 1933) for which a pricing service is unable to provide a market price; securities whose trading has been formally suspended; a security whose market price is not available from a pre-established primary pricing source or the pricing source is not willing to provide a price; a security with respect to which an event has occurred that is most likely to materially affect the value of the security after the market has closed but before the calculation of the Fund’s NAV or make it difficult or impossible to obtain a reliable market quotation; or a security whose price, as provided by the pricing service, does not reflect the security’s “fair value” due to the security being de-listed from a national exchange or the security’s primary trading market is temporarily closed at a time when, under normal conditions, it would be open. As a general principle, the current “fair value” of a security would be the amount which the owner might reasonably expect to receive from the closing sale prices on the applicable exchange and fair value prices may not reflect the actual value of a security. A variety of factors may be considered in determining the fair value of such securities.
B. Foreign Currency Translation and Foreign Investments
The Fund invests in foreign securities which may involve a number of risk factors and special considerations not present with investments in securities of U.S. corporations.
Investment in non-U.S. issuers may involve unique risks compared to investing in securities of U.S. issuers. These risks may include, but are not limited to: (i) less information about non-U.S. issuers or markets may be available due to less rigorous disclosure, accounting standards or regulatory practices; (ii) many non-U.S. markets are smaller, less liquid and more volatile thus, in a changing market, the advisers may not be able to sell the Fund’s portfolio securities at times, in amounts and at prices they consider reasonable; (iii) currency exchange rates or controls may adversely affect the value of the Fund’s investments; (iv) the economies of non-U.S. countries may grow at slower rates than expected or may experience downturns or recessions; and, (v) withholdings and other non-U.S. taxes may decrease the Fund’s return.
The accounting records of the Fund are maintained in U.S. dollars. Portfolio securities and other assets and liabilities denominated in a foreign currency are translated to U.S. dollars at the prevailing rates of exchange at period end. Amounts related to the purchases and sales of securities and investment income are translated into U.S. dollars at the prevailing exchange rate on the respective dates of transactions. The effects of changes in foreign currency exchange rates on portfolio investments are included in the net realized and unrealized gains and losses on investments. Net gains and losses on foreign currency transactions include disposition of foreign currencies, and currency
| | |
| | 15 |
| Semi-Annual | May 31, 2013 (Unaudited) | |
| | |
| | Notes to Financial Statements |
| | May 31, 2013 (Unaudited) |
gains and losses between the accrual and receipt dates of portfolio investment income and between the trade and settlement dates of portfolio investment transactions.
C. Securities Transactions and Investment Income
Securities transactions are recorded as of the trade date. Realized gains and losses from securities transactions are recorded on the highest cost basis. Dividend income is recorded on the ex-dividend date. Interest income, if any, is recorded on the accrual basis.
D. Dividends and Distributions to Shareholders
Dividends from net investment income of the Fund, if any, are declared and paid quarterly or as the Board may determine from time to time. Distributions of net realized capital gains earned by the Fund, if any, are distributed at least annually.
E. Federal Tax and Tax Basis Information
The timing and character of income and capital gain distributions are determined in accordance with income tax regulations, which may differ from U.S. GAAP. Reclassifications are made to the Fund’s capital accounts for permanent tax differences to reflect income and gains available for distribution (or available capital loss carry forwards) under income tax regulations. The amounts and characteristics of tax basis distributions and composition of distributable earnings/(accumulated losses) are finalized at fiscal year end; accordingly, tax basis balances have not been determined as of May 31, 2013.
Under the Regulated Investment Company Modernization Act of 2010 (“the Modernization Act”), net capital losses recognized in tax years beginning after December 22, 2010 may be carried forward indefinitely, and the character of the losses is retained as short-term and/or long-term. Under the law in effect prior to the Modernization Act, net capital losses were carried forward for eight years and treated as short-term. As a transition rule, the Modernization Act requires that post-enactment net capital losses be used before pre-enactment net capital losses. Additionally, post-enactment capital losses that are carried forward will retain their character as either short-term or long-term losses rather than being considered all short-term as under previous law.
At November 30, 2012, the Fund had available for tax purposes unused pre-enactment capital loss carryforwards as follows:
| | | | | | |
| Year of Expiration | | |
| 2016 | | 2017 | | 2018 | | Total |
| $176,692 | | $809,982 | | $187,815 | | $1,174,489 |
| | | | | | |
|
At November 30, 2012, the Fund had available for tax purposes unused post-enactment capital loss carry forwards as follows: |
| | | |
| | | Short-Term | | Long-Term | | |
| | $372,477 | | $651,795 | | |
| | |
16 | | |
| | An ALPS Advisors Solution | www.alpsfunds.com | 866.513.5856 |
| | |
| | Notes to Financial Statements |
| | May 31, 2013 (Unaudited) |
Distributions from net investment income and capital gains are determined in accordance with income tax regulations, which may differ from U.S. GAAP. These differences are primarily due to differing treatments of income and gains on various investment securities held by the Fund, timing differences and differing characterization of distributions made by the Fund.
The tax character of the distributions paid was as follows:
| | | | |
| | | For the Year Ended November 30, 2012 | | |
Distributions paid from: | | | | |
Ordinary income | | $ 1,417,294 | | |
Total | | $ 1,417,294 | | |
| | | | | |
As of May 31, 2013, the costs of investments for federal income tax purposes and accumulated net unrealized appreciation/(depreciation) on investments were as follows:
| | | | |
Cost of investment for income tax purposes | | $ 96,997,089 | | |
| | | | | |
| | |
Gross Appreciation (excess of value over tax cost) | | $ 13,765,000 | | |
Gross Depreciation (excess of tax cost over value) | | (1,473,466) | | |
Net Unrealized Appreciation | | $ 12,291,534 | | |
| | | | | �� |
F. Income Taxes
No provision for income taxes is included in the accompanying financial statements, as the Fund intends to distribute to shareholders all taxable investment income and realized gains and otherwise comply with Subchapter M of the Internal Revenue Code of 1986, as amended, applicable to regulated investment companies.
The Fund evaluates tax positions taken (or expected to be taken) in the course of preparing the Fund’s tax returns to determine whether these positions meet a “more-likely-than-not” standard that, based on the technical merits, have a more than fifty percent likelihood of being sustained by a taxing authority upon examination. A tax position that meets the “more-likely-than-not” recognition threshold is measured to determine the amount of benefit to recognize in the financial statements.
As of and during the period ended May 31, 2013, the fund did not have a liability for any unrecognized tax benefits. The fund files U.S. federal, state, and local tax returns as required. The fund’s tax returns are subject to examination by the relevant tax authorities until expiration of the applicable statute of limitations which is generally three years after the filing of the tax return Tax returns for open years have incorporated no uncertain tax positions that require a provision for income taxes.
G. Fair Value Measurements
The Fund discloses the classification of its fair value measurements following a three-tier hierarchy based on the inputs used to measure fair value. Inputs refer broadly
| | |
| | 17 |
| Semi-Annual | May 31, 2013 (Unaudited) | |
| | |
| | Notes to Financial Statements |
| | May 31, 2013 (Unaudited) |
to the assumptions that market participants would use in pricing the asset or liability, including assumptions about risk. Inputs may be observable or unobservable. Observable inputs reflect the assumptions market participants would use in pricing the asset or liability that are developed based on market data obtained from sources independent of the reporting entity. Unobservable inputs reflect the reporting entity’s own assumptions about the assumptions market participants would use in pricing the asset or liability that are developed based on the best information available.
Various inputs are used in determining the value of the Fund’s investments as of the end of the reporting period. When inputs used fall into different levels of the fair value hierarchy, the level in the hierarchy within which the fair value measurement falls is determined based on the lowest level input that is significant to the fair value measurement in its entirety. The designated input levels are not necessarily an indication of the risk or liquidity associated with these investments. These inputs are categorized in the following hierarchy under applicable financial accounting standards:
| | |
Level 1 – | | Unadjusted quoted prices in active markets for identical investments, unrestricted assets or liabilities that a Fund has the ability to access at the measurement date; |
| |
Level 2 – | | Quoted prices which are not active, quoted prices for similar assets or liabilities in active markets or inputs other than quoted prices that are observable (either directly or indirectly) for substantially the full term of the asset or liability; and |
| |
Level 3 – | | Significant unobservable prices or inputs (including the Fund’s own assumptions in determining the fair value of investments) where there is little or no market activity for the asset or liability at the measurement date. |
The following is a summary of the inputs used to value the Funds investments as of May 31, 2013:
| | | | | | | | | | | | | | | | |
| Investments in Securities at Value | | Level 1-
Unadjusted
Quoted Prices | | | Level 2-
Other
Significant
Observable
Inputs | | | Level 3-
Significant
Unobservable
Inputs | | | Total | |
Common Stocks* | | $ | 109,237,454 | | | $ | – | | | $ | – | | | $ | 109,237,454 | |
Short Term Investments | | | 51,169 | | | | – | | | | – | | | | 51,169 | |
TOTAL | | $ | 109,288,623 | | | $ | – | | | $ | – | | | $ | 109,288,623 | |
| | | | | | | | | | | | | | | | | |
| * | For a detailed geographical breakdown, see the accompanying Schedule of Investments. |
The Fund recognizes transfers between levels as of the end of the period. For the six months ended May 31, 2013, the Fund did not have any transfers between Level 1 and Level 2 securities. The Fund did not have any securities which used significant unobservable inputs (Level 3) in determining fair value.
| | |
18 | | |
| | An ALPS Advisors Solution | www.alpsfunds.com | 866.513.5856 |
| | |
| | Notes to Financial Statements |
| | May 31, 2013 (Unaudited) |
3. INVESTMENT ADVISORY FEE AND OTHER AFFILIATED TRANSACTIONS
ALPS Advisors, Inc. (the “Investment Adviser”) acts as the Fund’s investment adviser pursuant to an Advisory Agreement with the Trust on behalf of the Fund (the “Advisory Agreement”). Pursuant to the Advisory Agreement, the Fund pays the Investment Adviser a unitary fee for the services and facilities it provides payable on a monthly basis at the annual rate of 0.55% of the Fund’s average daily net assets. From time to time, the Investment Adviser may waive all or a portion of its fee.
Out of the unitary management fee, the Investment Adviser pays substantially all expenses of the Fund, including the licensing fee of the Index provider, and the cost of transfer agency, custody, fund administration, legal, audit and other services, except for interest expenses, distribution fees or expenses, brokerage expenses, taxes and extraordinary expenses not incurred in the ordinary course of the Fund’s business. In addition, the Investment Adviser’s unitary management fee is designed to compensate the Investment Adviser for providing services for the Fund.
ALPS Fund Services, Inc. (“ALPS”), an affiliate of the Investment Adviser, is the administrator of the Fund.
The Bank of New York Mellon is the custodian, fund accounting agent and transfer agent for the Fund.
Each Trustee who is not an officer or employee of the Investment Adviser, any subadviser or any of their affiliates (“Independent Trustees”) is paid a quarterly retainer of $5,000, $3,750 for each regularly scheduled Board meeting attended and $1,500 for each special meeting held outside of regularly scheduled meetings.
4. PURCHASES AND SALES OF SECURITIES
For the six months ended May 31, 2013, the cost of purchases and proceeds from sales of investment securities, excluding in-kind transactions and short-term investments, were as follows:
| | |
| Purchases | | Sales |
| $ 6,104,320 | | $ 6,038,493 |
For the six months ended May 31, 2013, the cost of in-kind purchases and proceeds from in-kind sales were as follows:
| | |
| Purchases | | Sales |
| $ 36,414,265 | | $ 2,447,256 |
Gains on in-kind transactions are not considered taxable for federal income tax purposes.
| | |
| | 19 |
| Semi-Annual | May 31, 2013 (Unaudited) | |
| | |
| | Notes to Financial Statements |
| | May 31, 2013 (Unaudited) |
5. CAPITAL SHARE TRANSACTIONS
Shares are created and redeemed by the Fund only in Creation Unit size aggregations of 50,000 shares. Only broker-dealers or large institutional investors with creation and redemption agreements called Authorized Participants (“AP”) are permitted to purchase or redeem Creation Units from the Fund. Such transactions are generally permitted on an in-kind basis, with a balancing cash component to equate the transaction to the net asset value per unit of the Fund on the transaction date. Cash may be substituted equivalent to the value of certain securities generally when they are not available in sufficient quantity for delivery, not eligible for trading by the AP or as a result of other market circumstances.
6. INDEMNIFICATIONS
Under the Trust’s organizational documents, its officers and Trustees are indemnified against certain liability arising out of the performance of their duties to the Trust. Additionally, in the normal course of business, the Trust enters into contracts with service providers that contain general indemnification clauses. The Trust’s maximum exposure under these arrangements is unknown, as this would involve future claims that may be made against the Trust that have not yet occurred.
| | |
20 | | |
| | An ALPS Advisors Solution | www.alpsfunds.com | 866.513.5856 |
| | |
| | Additional Information |
| | May 31, 2013 (Unaudited) |
PROXY VOTING POLICIES AND PROCEDURES
A description of the Fund’s proxy voting policies and procedures used in determining how to vote for proxies and information regarding how the Fund voted proxies related to portfolio securities during the most recent 12-month period ended June 30th is available without charge, (1) on the Securities and Exchange Commission’s (“SEC”) website at http://www.sec.gov; (2) upon request, by calling (toll-free) 1-866-513-5856; and (3) on the Trust’s website located at http://www.alpsfunds.com.
PORTFOLIO HOLDINGS
The Trust will file its complete schedule of portfolio holdings with the SEC for the first and third quarters of each fiscal year on Form N-Q. The Trust’s Form N-Q will be available (1) on the SEC’s website at http://www.sec.gov; (2) by calling (toll-free) 1-866-513-5856; (3) on the Trust’s website located at http://www.alpsfunds. com; and (4) for review and copying at the SEC’s Public Reference Room (“PRR”) in Washington D.C. Information regarding the operation of the PRR may be obtained by calling (toll-free) 1-800-732-0330.
| | |
| | 21 |
| Semi-Annual | May 31, 2013 (Unaudited) | |

This report has been prepared for Cohen & Steers Global Realty Majors ETF shareholders and may be distributed to others only if preceded or accompanied by a prospectus.
ALPS Portfolio Solutions Distributor, Inc., distributor for the Cohen & Steers Global Realty Majors ETF.
GRI000220
| | |
|
| | ALPS Equal Sector Weight ETF |
| | |
| | | | | | |
 | | | | ALPS Equal Sector Weight ETF | | www.alpsfunds.com |
| | | | |

| |  |
| | ALPS Equal Sector Weight ETF | | Performance Overview |
| | | | May 31, 2013 (Unaudited) |
INVESTMENT OBJECTIVE
The Fund seeks investment results that replicate as closely as possible, before fees and expenses, the performance of the Banc of America Securities – Merrill Lynch Equal Sector Weight Index (the “Underlying Index”). The Fund’s investment objective is not fundamental and may be changed by the Board of Trustees without shareholder approval.
PRIMARY INVESTMENT STRATEGIES
The Adviser will seek to match the performance of the Underlying Index. The Underlying Index is an index of indexes comprised in equal proportions of the nine Select Sector SPDR Indexes (“The Underlying Sector Indexes”). In order to track the securities in the Underlying Index, the Fund will use a “fund of funds” approach, and seek to achieve its investment objective by investing at least 90% of its total assets in the shares of Select Sector SPDR exchange-traded funds (each, an “Underlying Sector ETF” and collectively the “Underlying Sector ETFs”) that track the Underlying Sector indexes of which the Underlying Index is comprised.
PERFORMANCE as of May 31, 2013
| | | | | | | | | | | | | | | | | | | | |
| Average Annual Total Return | | YTD | | | 6 Month | | | 1 Year | | | 3 Year | | | Since Inception Annualized* | |
ALPS Equal Sector Weight ETF | | | | | | | | | | | | | | | | | | | | |
NAV (Net Asset Value) | | | 14.41% | | | | 15.61% | | | | 25.97% | | | | 16.50% | | | | 18.71% | |
Market Price** | | | 14.37% | | | | 15.65% | | | | 26.15% | | | | 16.56% | | | | 18.79% | |
Banc of America Securities Merrill Lynch Equal Sector Weight Index | | | 13.61% | | | | 14.60% | | | | 23.70% | | | | 14.48% | | | | 16.65% | |
S&P 500® Total Return Index | | | 15.37% | | | | 16.43% | | | | 27.27% | | | | 16.87% | | | | 19.00% | |
Total Expense Ratio (per the current Prospectus) | | | 0.55% | | | | | | | | | | | | | | | | | |
Performance data quoted represents past performance. Past performance does not guarantee future results. Current performance may be higher or lower than actual data quoted. Call 1.866.675.2639 or visit www.alpsfunds.com for current month end performance. The investment return and principal value of an investment will fluctuate so that an investor’s shares, when redeemed, may be worth more or less than their original cost.
NAV is an exchange-traded fund’s per-share value. The per-share dollar amount of the fund is derived by dividing the total value of all the securities in its portfolio, less any liabilities, by the number of fund shares outstanding. Market Price is the price at which a share can currently be traded in the market. Information detailing the number of days the Market Price of the Fund was greater than the Fund’s NAV and the number of days it was less than the Fund’s NAV can be obtained at www.alpsfunds.com.
| * | The Fund commenced Investment Operations on July 06, 2009 with an Inception Date, the first day of trading on the Exchange, of July 7, 2009. |
| ** | Market Price is based on the midpoint of the bid/ask spread at 4 p.m. ET and does not represent the returns an investor would receive if shares were traded at other times. |
Banc of America Securities Merrill Lynch Equal Sector Weight Index: a U.S. equity index comprised, in equal weights, of nine sub-indices, and is a price-return index.
S&P 500® Index: the Standard & Poor’s composite index of 500 stocks, a widely recognized, unmanaged index of common stock prices.
An investor cannot invest directly in an index.
| | | | | | |
| Semi-Annual Report | | May 31, 2013 | | 2 | |  |
| | |
|
| ALPS Equal Sector Weight ETF | | Performance Overview |
| | May 31, 2013 (Unaudited) |
The following table shows the sector weights of both the Fund and the S&P 500® as of May 31, 2013:
SECTOR WEIGHTING COMPARISON^ as of May 31, 2013
| | | | | | | | | | | | | | | | |
| | | | | EQL* | | | | | | | S&P 500® | | | |
Healthcare (XLV) | | | | | 11.5% | | | | | | | | 12.5% | | | |
Financials (XLF) | | | | | 11.5 | | | | | | | | 15.9 | | | |
Consumer Discretionary (XLY) | | | | | 11.4 | | | | | | | | 11.6 | | | |
Technology (XLK) | | | | | 11.2 | | | | | | | | 21.1 | | | |
Consumer Staples (XLP) | | | | | 11.1 | | | | | | | | 11.0 | | | |
Industrials (XLI) | | | | | 11.1 | | | | | | | | 10.1 | | | |
Energy (XLE) | | | | | 10.8 | | | | | | | | 10.9 | | | |
Materials (XLB) | | | | | 10.8 | | | | | | | | 3.4 | | | |
Utilities (XLU) | | | | | 10.6 �� | | | | | | | | 3.5 | | | |
Source: S&P 500®
| ^ | Sector weights subject to change. |
| * | Percentages based on Total Investments. |
| | | | | | |
| | 3 | | ALPS Equal Sector Weight ETF | | www.alpsfunds.com |
| | | | |
| | |
| | ALPS Equal Sector Weight ETF | | Performance Overview |
| | | | May 31, 2013 (Unaudited) |
SECTOR ALLOCATION as of May 31, 2013
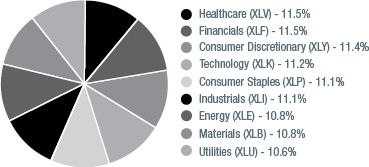
Sector weights and allocations subject to change.
GROWTH OF $10,000 as of May 31, 2013
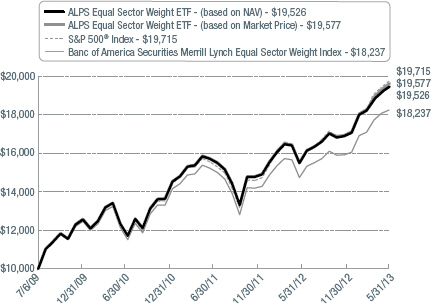
The chart above represents historical performance of a hypothetical investment of $10,000 in the Fund over the life of the Fund. Performance calculations are as of the end of each month. Past performance does not guarantee future results. This chart does not reflect the deduction of taxes that a shareholder would pay on Fund distributions or the redemption of Fund shares.
| | | | | | |
| Semi-Annual Report | | May 31, 2013 | | 4 | | |
| | |
|
| ALPS Equal Sector Weight ETF | | Disclosure of Fund Expenses |
| | For the Six Months Ended May 31, 2013 (Unaudited) |
Shareholder Expense Example: As a shareholder of the Fund, you incur two types of costs: (1) transaction costs which may include creation and redemption fees or brokerage charges, and (2) ongoing costs, including management fees and other Fund expenses. These examples are intended to help you understand your ongoing costs (in dollars) of investing in the Fund and to compare these costs with the ongoing costs of investing in other funds. The example is based on an investment of $1,000 invested at the beginning of the (six month) period and held through May 31, 2013.
Actual Return: The first line of the table provides information about actual account values and actual expenses. You may use the information in this table, together with the amount you invested, to estimate the expenses that you incurred over the period. Simply divide your account value by $1,000 (for example, an $8,600 account value divided by $1,000 = 8.6), then multiply the result by the number in the first line under the heading entitled “Expenses Paid During the Period” to estimate the expenses attributable to your investment during this period.
Hypothetical 5% Return: The second line of the table provides information about hypothetical account values and hypothetical expenses based on the Fund’s actual expense ratio and an assumed rate of return of 5% per year before expenses, which is not the Fund’s actual return. The hypothetical account values and expenses may not be used to estimate the actual ending account balance or expenses you paid for the period. You may use this information to compare ongoing costs of investing in the Fund and other funds. To do so, compare this 5% hypothetical example with the 5% hypothetical examples that appear in the shareholder reports of the other funds.
The expenses shown in the table are meant to highlight ongoing Fund costs only and do not reflect any transaction costs, such as creation and redemption fees, or brokerage charges. Therefore, the second line of the table is useful in comparing ongoing costs only, and will not help you determine the relative total costs of owning different funds. In addition, if these costs were included, your costs would have been higher.
| | | | | | | | |
| | | Beginning Account Value 12/1/12 | | Ending Account Value 5/31/13 | | Expense Ratio(a) | | Expenses Paid During the Period(b) 12/1/12- 5/31/13 |
Actual | | $1,000.00 | | $1,156.10 | | 0.34% | | $1.83 |
Hypothetical (5% return before expenses) | | $1,000.00 | | $1,023.24 | | 0.34% | | $1.72 |
| (a) | Annualized based on the Fund’s most recent fiscal half year expenses. |
| (b) | Expenses are equal to the Fund’s annualized expense ratio multiplied by the average account value over the period, multiplied by the number of days in the most recent fiscal half year (182), then divided by 365. |
| | | | | | |
| | 5 | | ALPS Equal Sector Weight ETF | | www.alpsfunds.com |
| | | | |
| | |
| | ALPS Equal Sector Weight ETF | | Statement of Investments |
| | | | May 31, 2013 (Unaudited) |
| | | | | | | | | | | | | | | |
| Security Description | | | | Shares | | Value |
EXCHANGE TRADED FUNDS (99.96%) | | | | | | | | | | | | | | | |
Consumer Discretionary (11.40%) | | | | | | | | | | | | | | | |
Consumer Discretionary Select Sector SPDR® Fund | | | | | | | | | 189,409 | | | | $ | 10,629,633 | |
| | | | | | | | | | | | | | | |
Consumer Staples (11.11%) | | | | | | | | | | | | | | | |
Consumer Staples Select Sector SPDR® Fund | | | | | | | | | 258,857 | | | | | 10,364,634 | |
| | | | | | | | | | | | | | | |
Energy (10.81%) | | | | | | | | | | | | | | | |
Energy Select Sector SPDR® Fund | | | | | | | | | 125,239 | | | | | 10,085,497 | |
| | | | | | | | | | | | | | | |
Financials (11.49%) | | | | | | | | | | | | | | | |
Financial Select Sector SPDR® Fund | | | | | | | | | 540,003 | | | | | 10,713,660 | |
| | | | | | | | | | | | | | | |
Healthcare (11.51%) | | | | | | | | | | | | | | | |
Health Care Select Sector SPDR® Fund | | | | | | | | | 223,002 | | | | | 10,735,316 | |
| | | | | | | | | | | | | | | |
Industrials (11.07%) | | | | | | | | | | | | | | | |
Industrial Select Sector SPDR® Fund | | | | | | | | | 237,457 | | | | | 10,327,005 | |
| | | | | | | | | | | | | | | |
Materials (10.81%) | | | | | | | | | | | | | | | |
Materials Select Sector SPDR® Fund | | | | | | | | | 250,057 | | | | | 10,077,297 | |
| | | | | | | | | | | | | | | |
Technology (11.19%) | | | | | | | | | | | | | | | |
Technology Select Sector SPDR® Fund | | | | | | | | | 329,499 | | | | | 10,431,938 | |
| | | | | | | | | | | | | | | |
Utilities (10.57%) | | | | | | | | | | | | | | | |
Utilities Select Sector SPDR® Fund | | | | | | | | | 261,541 | | | | | 9,860,096 | |
| | | | | | | | | | | | | | | |
TOTAL EXCHANGE TRADED FUNDS | | | | | | | | | | | | | | | |
(Cost $75,842,794) | | | | | | | | | | | | | | 93,225,076 | |
| | | | | | | | | | | | | | | |
| | | | | | | | | | | | | | | |
| | | 7 Day Yield | | Shares | | Value |
SHORT TERM INVESTMENTS (0.06%) | | | | | | | | | | | | | | | |
Dreyfus Treasury Prime Cash Management, Institutional Class | | | | 0.000%(a) | | | | | 60,318 | | | | | 60,318 | |
| | | | | | | | | | | | | | | |
TOTAL SHORT TERM INVESTMENTS | | | | | | | | | | | | | | | |
(Cost $60,318) | | | | | | | | | | | | | | 60,318 | |
| | | | | | | | | | | | | | | |
TOTAL INVESTMENTS (100.02%) | | | | | | | | | | | | | | | |
(Cost $75,903,112) | | | | | | | | | | | | | $ | 93,285,394 | |
NET LIABILITIES LESS OTHER ASSETS (-0.02%) | | | | | | | | | | | | | | (26,933 | ) |
| | | | | | | | | | | | | | | |
NET ASSETS (100.00%) | | | | | | | | | | | | | $ | 93,258,461 | |
| | | | | | | | | | | | | | | |
SPDR® - Standard & Poor’s Depositary Receipts
See Notes to Financial Statements.
| | | | | | |
| Semi-Annual Report | | May 31, 2013 | | 6 | | |
| | |
|
| ALPS Equal Sector Weight ETF | | Statement of Assets and Liabilities |
| | May 31, 2013 (Unaudited) |
| | | | |
ASSETS: | | | | |
Investments, at value | | $ | 93,285,394 | |
| |
Total Assets | | | 93,285,394 | |
| |
| |
LIABILITIES: | | | | |
Payable to advisor | | | 26,933 | |
| |
Total Liabilities | | | 26,933 | |
| |
NET ASSETS | | $ | 93,258,461 | |
| |
| |
NET ASSETS CONSIST OF: | | | | |
Paid-in capital | | $ | 75,406,486 | |
Accumulated net investment loss | | | (58,446) | |
Accumulated net realized gain on investments | | | 528,139 | |
Net unrealized appreciation on investments | | | 17,382,282 | |
| |
NET ASSETS | | $ | 93,258,461 | |
| |
| |
INVESTMENTS, AT COST | | $ | 75,903,112 | |
| |
PRICING OF SHARES | | | | |
Net Assets | | $ | 93,258,461 | |
Shares of beneficial interest outstanding (Unlimited number of shares authorized, par value $0.01 per share) | | | 2,050,000 | |
Net Asset Value, offering and redemption price per share | | $ | 45.49 | |
See Notes to Financial Statements.
| | | | | | |
| | 7 | | ALPS Equal Sector Weight ETF | | www.alpsfunds.com |
| | | | |
| | |
| | ALPS Equal Sector Weight ETF | | Statement of Operations |
| | | | For the Six Months Ended May 31, 2013 (Unaudited) |
| | | | |
INVESTMENT INCOME: | | | | |
Dividends | | $ | 981,397 | |
| |
Total Investment Income | | | 981,397 | |
| |
| |
EXPENSES: | | | | |
Investment advisory fee | | | 156,593 | |
| |
Total expenses before reimbursement | | | 156,593 | |
| |
Expenses reimbursed/waived by:
Investment advisor | | | (12,757) | |
| |
NET EXPENSES | | | 143,836 | |
| |
NET INVESTMENT INCOME | | | 837,561 | |
| |
| |
Net realized gain on investments | | | 735,855 | |
Net change in unrealized appreciation on investments | | | 10,551,206 | |
| |
NET REALIZED AND UNREALIZED GAIN ON INVESTMENTS | | | 11,287,061 | |
| |
NET INCREASE IN NET ASSETS RESULTING FROM OPERATIONS | | $ | 12,124,622 | |
| |
See Notes to Financial Statements.
| | | | | | |
| Semi-Annual Report | | May 31, 2013 | | 8 | | |
| | |
|
| ALPS Equal Sector Weight ETF | | Statements of Changes in Net Assets |
| | |
| | | | | | | | |
| | | For the Six Months Ended May 31, 2013 (Unaudited) | | | For the Year Ended November 30, 2012 | |
OPERATIONS: | | | | | | | | |
Net investment income | | $ | 837,561 | | | $ | 1,365,947 | |
Net realized gain on investments | | | 735,855 | | | | 3,927,820 | |
Net change in unrealized appreciation on investments | | | 10,551,206 | | | | 4,202,695 | |
| |
Net increase in net assets resulting from operations | | | 12,124,622 | | | | 9,496,462 | |
| |
| | |
DISTRIBUTIONS TO SHAREHOLDERS: | | | | | | | | |
From net investment income | | | (896,007 | ) | | | (1,375,473) | |
From tax return of capital | | | – | | | | (41,418) | |
| |
Total distributions | | | (896,007 | ) | | | (1,416,891) | |
| |
| | |
SHARE TRANSACTIONS: | | | | | | | | |
Proceeds from sale of shares | | | 12,753,099 | | | | 30,174,030 | |
Cost of shares redeemed | | | (6,315,030 | ) | | | (24,753,246) | |
| |
Net increase from share transactions | | | 6,438,069 | | | | 5,420,784 | |
| |
Net increase in net assets | | | 17,666,684 | | | | 13,500,355 | |
| |
| | |
NET ASSETS: | | | | | | | | |
Beginning of period | | | 75,591,777 | | | | 62,091,422 | |
| |
End of period* | | $ | 93,258,461 | | | | 75,591,777 | |
| |
| | |
* Including accumulated net investment loss of: | | $ | (58,446 | ) | | $ | – | |
| | |
OTHER INFORMATION: | | | | | | | | |
SHARE TRANSACTIONS: | | | | | | | | |
Beginning shares | | | 1,900,000 | | | | 1,750,000 | |
Shares sold | | | 300,000 | | | | 800,000 | |
Shares redeemed | | | (150,000 | ) | | | (650,000) | |
| |
Shares outstanding, end of period | | | 2,050,000 | | | | 1,900,000 | |
| |
See Notes to Financial Statements.
| | | | | | |
| | 9 | | ALPS Equal Sector Weight ETF | | www.alpsfunds.com |
| | | | |
| | |
| | ALPS Equal Sector Weight ETF | | |
| | | | |
| | | | |
| | | For The
Six Months Ended
May 31, 2013
(Unaudited) | |
NET ASSET VALUE, BEGINNING OF PERIOD | | $ | 39.79 | |
| |
INCOME FROM OPERATIONS: | | | | |
| |
Net investment income | | | 0.42 | (b) |
Net realized and unrealized gain on investments | | | 5.74 | |
| |
Total from Investment Operations | | | 6.16 | |
| �� |
| |
LESS DISTRIBUTIONS: | | | | |
From net investment income | | | (0.46) | |
From capital gains | | | – | |
From tax return of capital | | | – | |
| |
Total Distributions | | | (0.46) | |
| |
NET INCREASE IN NET ASSET VALUE | | | 5.70 | |
| |
NET ASSET VALUE, END OF PERIOD | | $ | 45.49 | |
| |
TOTAL RETURN(c) | | | 15.61 | % |
| |
RATIOS/SUPPLEMENTAL DATA: | | | | |
Net assets, end of period (in 000s) | | $ | 93,258 | |
| |
RATIOS TO AVERAGE NET ASSETS: | | | | |
Net investment income including reimbursement/waiver | | | 1.98 | %(d) |
Net investment income excluding reimbursement/waiver | | | 1.95 | %(d) |
Expenses including reimbursement/waiver | | | 0.34 | %(d) |
Expenses excluding reimbursement/waiver | | | 0.37 | %(d) |
PORTFOLIO TURNOVER RATE(e) | | | 1 | % |
| (a) | Effective March 7, 2011, the Board approved changing the fiscal year end of the Fund from December 31 to November 30. |
| (b) | Calculated using average shares outstanding. |
| (c) | Total return is calculated assuming an initial investment made at the net asset value at the beginning of the period and redemption at the net asset value on the last day of the period and assuming all distributions are reinvested at actual reinvestment prices. Total return calculated for a period of less than one year is not annualized. |
| (e) | Portfolio turnover is not annualized and does not include securities received or delivered from processing creations or redemptions. |
See Notes to Financial Statements.
| | | | | | |
| Semi-Annual Report | | May 31, 2013 | | 10 | | |
| | |
|
| | Financial Highlights |
| | For a Share Outstanding Throughout the Periods Presented |
| | | | | | | | | | | | | | |
For the Year Ended
November 30, 2012(a) | | | For the Period
January 1, 2011 to
November 30, 2011(a) | | | For the
Year Ended
December 31, 2010 | | | For the Period July 7, 2009 (Inception) through December 31, 2009 | |
| $ | 35.48 | | | $ | 35.34 | | | $ | 31.13 | | | $ | 25.04 | |
| | | |
| | | | | | | | | | | | | | |
| | | |
| | 0.69 | (b) | | | 0.41 | (b) | | | 0.68 | (b) | | | 0.31 | |
| | 4.35 | | | | 0.18 | | | | 4.14 | | | | 6.10 | |
| | |
| | 5.04 | | | | 0.59 | | | | 4.82 | | | | 6.41 | |
| | |
| | | |
| | | | | | | | | | | | | | |
| | (0.71) | | | | (0.45) | | | | (0.61) | | | | (0.31) | |
| | – | | | | – | | | | – | | | | (0.01) | |
| | (0.02) | | | | – | | | | – | | | | – | |
| | |
| | (0.73) | | | | (0.45) | | | | (0.61) | | | | (0.32) | |
| | |
| | 4.31 | | | | 0.14 | | | | 4.21 | | | | 6.09 | |
| | |
| $ | 39.79 | | | $ | 35.48 | | | $ | 35.34 | | | $ | 31.13 | |
| | |
| | 14.35 | % | | | 1.67 | % | | | 15.67 | % | | | 25.60 | % |
| | | |
| | | | | | | | | | | | | | |
| $ | 75,592 | | | $ | 62,091 | | | $ | 53,012 | | | $ | 14,008 | |
| | | |
| | | | | | | | | | | | | | |
| | 1.79 | % | | | 1.25 | %(d) | | | 2.14 | % | | | 2.60 | %(d) |
| | 1.76 | % | | | 1.22 | %(d) | | | 2.11 | % | | | 2.57 | %(d) |
| | 0.34 | % | | | 0.34 | %(d) | | | 0.34 | % | | | 0.34 | %(d) |
| | 0.37 | % | | | 0.37 | %(d) | | | 0.37 | % | | | 0.37 | %(d) |
| | 4 | % | | | 4 | % | | | 7 | % | | | 4 | % |
| | | | | | |
| | 11 | | ALPS Equal Sector Weight ETF | | www.alpsfunds.com |
| | | | |
| | |
| | ALPS Equal Sector Weight ETF | | Notes to Financial Statements |
| | | | May 31, 2013 (Unaudited) |
1. ORGANIZATION
The ALPS ETF Trust (the “Trust”), a Delaware statutory trust, is an open-end management investment company registered under the Investment Company Act of 1940, as amended (the “1940 Act”). As of May 31, 2013, the Trust consists of thirteen separate portfolios. Each portfolio represents a separate series of the Trust. This report pertains solely to the ALPS Equal Sector Weight ETF (the “Fund”), which commenced on July 7, 2009. The investment objective of the Fund is to seek investment results that correspond generally to the price and yield (before the Fund’s fees and expenses) of the Banc of America Securities Merrill Lynch Equal Sector Weight Index.
The Fund’s Shares (“Shares”) are listed on the New York Stock Exchange (“NYSE”) Arca. The Fund issues and redeems Shares at Net Asset Value (“NAV”) in blocks of 50,000 Shares each of which is called a “Creation Unit.” Creation Units are issued and redeemed principally in-kind for securities included in a specified index. Except when aggregated in Creation Units, Shares are not redeemable securities of the Fund.
2. SIGNIFICANT ACCOUNTING POLICIES
The following is a summary of significant accounting policies consistently followed by the Fund in the preparation of the financial statements. The accompanying financial statements were prepared in accordance with accounting principles generally accepted in the United States of America (“U.S. GAAP”). The preparation of financial statements in conformity with U.S. GAAP requires management to make certain estimates and assumptions that affect the reported amounts of assets and liabilities and disclosures of contingent assets and liabilities at the date of the financial statements and the reported amounts of revenue and expenses during the period. Actual results could differ from those estimates.
A. Portfolio Valuation
The Fund’s NAV is determined daily, as of the close of regular trading on the NYSE, normally 4:00 p.m. Eastern time, on each day the NYSE is open for trading. The NAV is computed by dividing the value of all assets of the Fund (including accrued interest and dividends), less all liabilities (including accrued expenses and dividends declared but unpaid), by the total number of shares outstanding.
Portfolio securities listed on any exchange other than the National Association of Securities Dealer Automated Quotation (“NASDAQ”) exchange are valued at the last sale price on the business day as of which such value is being determined. If there has been no sale on such day, the securities are valued at the mean of the most recent bid and asked prices on such day. Securities traded on the NASDAQ are valued at the NASDAQ Official Closing Price as determined by NASDAQ. Short-term investments that mature in less than 60 days are valued at amortized cost, which approximates market value.
The Fund’s investments are valued at market value or, in the absence of market value with respect to any portfolio securities, at fair value according to procedures adopted by the Trust’s Board of Trustees (the “Board”). When market quotations are not readily available
| | | | | | |
| Semi-Annual Report | | May 31, 2013 | | 12 | | |
| | |
|
| ALPS Equal Sector Weight ETF | | Notes to Financial Statements |
| | May 31, 2013 (Unaudited) |
or when events occur that make established valuation methods unreliable, securities of the Fund may be valued in good faith by or under the direction of the Board.
B. Securities Transactions and Investment Income
Securities transactions are recorded as of the trade date. Realized gains and losses from securities transactions are recorded on the highest cost basis. Dividend income is recorded on the ex-dividend date. Interest income, if any, is recorded on the accrual basis.
C. Dividends and Distributions to Shareholders
Dividends from net investment income of the Fund, if any, are declared and paid quarterly or as the Board may determine from time to time. Distributions of net realized capital gains earned by the Fund, if any, are distributed at least annually.
D. Federal Tax and Tax Basis Information
The timing and character of income and capital gain distributions are determined in accordance with income tax regulations, which may differ from U.S. GAAP. Reclassifications are made to the Fund’s capital accounts for permanent tax differences to reflect income and gains available for distribution (or available capital loss carryforwards) under income tax regulations. The amounts and characteristics of tax basis distributions and composition of distributable earnings/(accumulated losses) are finalized at fiscal year end: accordingly, tax basis balances have not been determined as of May 31, 2013.
Under the Regulated Investment Company Modernization Act of 2010 (“the Modernization Act”), net capital losses recognized in tax years beginning after December 22, 2010 may be carried forward indefinitely, and the character of the losses is retained as short-term and/or long-term. Under the law in effect prior to the Modernization Act, net capital losses were carried forward for eight years and treated as short-term. As a transition rule, the Modernization Act requires that post-enactment net capital losses be used before pre-enactment net capital losses. Additionally, post-enactment capital losses that are carried forward will retain their character as either short-term or long-term losses rather than being considered all short-term as under previous law.
At November 30, 2012, the Fund had available for tax purposes unused post-enactment capital loss carryforwards as follows:
| | |
| Short-Term | | Long-Term |
$4,717 | | $32,618 |
Distributions from net investment income and capital gains are determined in accordance with income tax regulations, which may differ from U.S GAAP. These differences are primarily due to differing treatments of income and gains on various investment securities held by the Fund, timing differences and differing characterization of distributions made by the Fund.
| | | | | | |
| | 13 | | ALPS Equal Sector Weight ETF | | www.alpsfunds.com |
| | | | |
| | |
| | ALPS Equal Sector Weight ETF | | Notes to Financial Statements |
| | | | May 31, 2013 (Unaudited) |
The tax character of the distributions paid was as follows:
| | | | |
| | | Year Ended
November 30, 2012 | |
| |
Distributions paid from: | | | | |
Ordinary Income | | $ | 1,375,473 | |
Return of Capital | | | 41,418 | |
| |
Total | | $ | 1,416,891 | |
| |
|
As of May 31, 2013, the costs of investments for federal income tax purposes and accumulated net unrealized appreciation/ (depreciation) on investments were as follows: | |
| |
Cost of investments for income tax purposes | | | $76,063,543 | |
| |
Gross Appreciation (excess of value over tax cost) | | | $17,221,851 | |
Gross Depreciation (tax cost over value) | | | – | |
| |
Net Unrealized Appreciation | | | $17,221,851 | |
| |
The differences between book-basis and tax-basis are primarily due to the deferral of losses from wash sales.
E. Income Taxes
No provision for income taxes is included in the accompanying financial statements, as the Fund intends to distribute to shareholders all taxable investment income and realized gains and otherwise comply with Subchapter M of the Internal Revenue Code of 1986, as amended, applicable to regulated investment companies. The Fund evaluates tax positions taken (or expected to be taken) in the course of preparing the Fund’s tax returns to determine whether these positions meet a “more-likely-than-not” standard that, based on the technical merits, have a more than fifty percent likelihood of being sustained by a taxing authority upon examination. A tax position that meets the “more-likely-than-not” recognition threshold is measured to determine the amount of benefit to recognize in the financial statements.
As of and during the period ended May 31, 2013, the fund did not have a liability for any unrecognized tax benefits. The fund files U.S. federal, state, and local tax returns as required. The fund’s tax returns are subject to examination by the relevant tax authorities until expiration of the applicable statute of limitations which is generally three years after the filing of the tax return Tax returns for open years have incorporated no uncertain tax positions that require a provision for income taxes.
F. Fair Value Measurements
The Fund discloses the classification of its fair value measurements following a three-tier hierarchy based on the inputs used to measure fair value. Inputs refer broadly to the assumptions that market participants would use in pricing the asset or liability, including
| | | | | | |
| Semi-Annual Report | | May 31, 2013 | | 14 | | |
| | |
|
| ALPS Equal Sector Weight ETF | | Notes to Financial Statements |
| | May 31, 2013 (Unaudited) |
assumptions about risk. Inputs may be observable or unobservable. Observable inputs reflect the assumptions market participants would use in pricing the asset or liability that are developed based on market data obtained from sources independent of the reporting entity. Unobservable inputs reflect the reporting entity’s own assumptions about the assumptions market participants would use in pricing the asset or liability that are developed based on the best information available.
Various inputs are used in determining the value of the Fund’s investments as of the end of the reporting period. When inputs used fall into different levels of the fair value hierarchy, the level in the hierarchy within which the fair value measurement falls is determined based on the lowest level input that is significant to the fair value measurement in its entirety. The designated input levels are not necessarily an indication of the risk or liquidity associated with these investments. These inputs are categorized in the following hierarchy under applicable financial accounting standards:
| | | | | | |
Level 1 | | | – | | | Unadjusted quoted prices in active markets for identical investments, unrestricted assets or liabilities that a Fund has the ability to access at the measurement date; |
| | |
Level 2 | | | – | | | Quoted prices which are not active, quoted prices for similar assets or liabilities in active markets or inputs other than quoted prices that are observable (either directly or indirectly) for substantially the full term of the asset or liability; and |
| | |
Level 3 | | | – | | | Significant unobservable prices or inputs (including the Fund’s own assumptions in determining the fair value of investments) where there is little or no market activity for the asset or liability at the measurement date. |
The following is a summary of inputs used to value the Fund’s investments at May 31, 2013:
| | | | | | | | | | | | |
Investments in Securities at Value* | | Level 1 – Unadjusted Quoted Prices | | | Level 2 - Other Significant
Observable Inputs | | Level 3 - Significant Unobservable Inputs | | Total | |
| |
Exchange Traded Funds | | $ | 93,225,076 | | | $ – | | $ – | | $ | 93,225,076 | |
| |
Short Term Investments | | | 60,318 | | | – | | – | | | 60,318 | |
| |
TOTAL | | $ | 93,285,394 | | | $ – | | $ – | | $ | 93,285,394 | |
| |
| * | For detailed descriptions of the sectors, see the accompanying Statement of Investments. |
The Fund recognizes transfers between levels as of the end of the period. For the six months ended May 31, 2013, the Fund did not have any transfers between Level 1 and Level 2 securities. The Fund did not have any securities which used significant unobservable inputs (Level 3) in determining fair value.
| | | | | | |
| | 15 | | ALPS Equal Sector Weight ETF | | www.alpsfunds.com |
| | | | |
| | |
| | ALPS Equal Sector Weight ETF | | Notes to Financial Statements |
| | | | May 31, 2013 (Unaudited) |
3. INVESTMENT ADVISORY FEE AND OTHER AFFILIATED TRANSACTIONS
ALPS Advisors, Inc. (the “Investment Adviser”) acts as the Fund’s investment adviser pursuant to an Advisory Agreement with the Trust on behalf of the Fund (the “Advisory Agreement”). Pursuant to the Advisory Agreement, the Fund pays the Investment Adviser a unitary fee for the services and facilities it provides payable on a monthly basis at the annual rate of 0.37% of the Fund’s average daily net assets. ALPS Portfolio Solutions Distributor, Inc. (“APSD”) is both the distributor for the Fund as well as the Select Sector SPDR exchange traded funds (“Underlying Sector ETFs”) that the Fund invests in. As required by exemptive relief obtained by the Underlying Sector ETFs, the Investment Adviser will reimburse the Fund an amount equal to the distribution fee received by APSD from the Underlying Sector ETFs attributable to the Fund’s investment in the Underlying Sector ETFs, for so long as APSD acts as the distributor to the Fund and the Underlying Sector ETFs. From time to time, the Investment Adviser may waive all or a portion of its fee.
Out of the unitary management fee, the Investment Adviser pays substantially all expenses of the Fund, including the licensing fee of the Index provider, and the cost of transfer agency, custody, fund administration, legal, audit, trustees and other services, except for interest expenses, distribution fees or expenses, brokerage expenses, taxes and extraordinary expenses not incurred in the ordinary course of the Fund’s business. In addition, the Investment Adviser’s unitary management fee is designed to compensate the Investment Adviser for providing services for the Fund.
ALPS Fund Services, Inc. (“ALPS”), an affiliate of the Investment Adviser, is the administrator of the Fund.
The Bank of New York Mellon is the custodian, fund accounting agent and transfer agent for the Fund.
Each Trustee who is not an officer or employee of the Investment Adviser, or any of its affiliates (“Independent Trustees”) is paid a quarterly retainer of $5,000, $3,750 for each regularly scheduled Board meeting attended and $1,500 for each special meeting held outside of regularly scheduled meetings.
4. PURCHASES AND SALES OF SECURITIES
For the six months ended May 31, 2013, the cost of purchases and proceeds from sales of investment securities, excluding short-term investments and in-kind transactions, were as follows:
| | |
| Purchases | | Sales |
$ 1,744,341 | | $ 878,797 |
| | | | | | |
| Semi-Annual Report | | May 31, 2013 | | 16 | | |
| | |
|
| ALPS Equal Sector Weight ETF | | Notes to Financial Statements |
| | May 31, 2013 (Unaudited) |
For the six months ended May 31, 2013, the cost of in-kind purchases and proceeds from in-kind sales were as follows:
| | |
| Purchases | | Sales |
$ 8,539,948 | | $ 3,056,211 |
Gains on in-kind transactions are generally not considered taxable gains for federal income tax purposes.
5. CAPITAL SHARE TRANSACTIONS
Shares are created and redeemed by the Fund only in Creation Unit size aggregations of 50,000. Only broker-dealers or large institutional investors with creation and redemption agreements called Authorized Participants (“AP”) are permitted to purchase or redeem Creation Units from the Fund. Such transactions are generally permitted on an in-kind basis, with a balancing cash component to equate the transaction to the net asset value per unit of the Fund on the transaction date. Cash may be substituted equivalent to the value of certain securities generally when they are not available in sufficient quantity for delivery, not eligible for trading by the AP or as a result of other market circumstances.
6. INDEMNIFICATIONS
Under the Trust’s organizational documents, its Trustees and Officers are indemnified against certain liability arising out of the performance of their duties to the Trust. Additionally, in the normal course of business, the Trust enters into contracts with service providers that contain general indemnification clauses. The Trust’s maximum exposure under these arrangements is unknown, as this would involve future claims that may be made against the Trust that have not yet occurred.
| | | | | | |
| | 17 | | ALPS Equal Sector Weight ETF | | www.alpsfunds.com |
| | | | |
| | |
| | ALPS Equal Sector Weight ETF | | Additional Information |
| | | | May 31, 2013 (Unaudited) |
PROXY VOTING POLICIES AND PROCEDURES
A description of the Fund’s proxy voting policies and procedures used in determining how to vote for proxies and information regarding how the Fund voted proxies related to portfolio securities during the most recent 12-month period ended June 30th is available without charge, (1) on the Securities and Exchange Commission’s (“SEC”) website at http://www.sec.gov; (2) upon request, by calling (toll-free) 1-866-513-5856; and (3) on the Trust’s website located at http://www.alpsfunds.com.
PORTFOLIO HOLDINGS
The Trust will file its complete schedule of portfolio holdings with the SEC for the first and third quarters of each fiscal year on Form N-Q. The Trust’s Form N-Q will be available (1) on the SEC’s website at http://www.sec.gov; (2) by calling (toll-free) 1-866-513-5856; (3) on the Trust’s website located at http://www.alpsfunds.com; and (4) for review and copying at the SEC’s Public Reference Room (“PRR”) in Washington D.C. Information regarding the operation of the PRR may be obtained by calling (toll-free) 1-800-732-0330.
| | | | | | |
| Semi-Annual Report | | May 31, 2013 | | 18 | | |
PAGE INTENTIONALLY LEFT BLANK
PAGE INTENTIONALLY LEFT BLANK

| | |
| | PERFORMANCE OVERVIEW |
| | JEFFERIES | TR/J CRB GLOBAL COMMODITY EQUITY INDEX FUND | May 31, 2013 (Unaudited) |
The Jefferies | TR/J CRB Global Commodity Equity Index Fund is an Exchange Traded Fund (“ETF”), which provides exposure to the equity securities of a global universe of listed companies engaged in the production and distribution of commodities and commodity-related products and services in the agriculture, base/industrial metals, energy and precious metals sectors. The ETF seeks investment results that replicate as closely as possible, before fees and expenses, the price and yield performance of the Thomson Reuters/Jefferies CRB in-The-Ground Global Commodity Equity Index.
TOP 10 Holdings^ (% of Total Investments)
| | | | |
Exxon Mobil Corp. | | | 7.2% | |
Monsanto Co. | | | 6.7% | |
Potash Corp. of Saskatchewan, Inc. | | | 4.6% | |
Syngenta AG | | | 4.6% | |
Deere & Co. | | | 4.2% | |
Chevron Corp. | | | 4.2% | |
Archer-Daniels-Midland Co. | | | 2.6% | |
BP Plc | | | 2.4% | |
Royal Dutch Shell Plc, Class A | | | 2.2% | |
The Mosaic Co. | | | 2.1% | |
Total % of Top 10 Holdings | | | 40.8% | |
| ^ | Future holdings are subject to change |
COUNTRY ALLOCATION^ (% of Total Investments)
| | | | |
United States | | | 44.0% | |
Canada | | | 14.4% | |
United Kingdom | | | 9.4% | |
Switzerland | | | 4.9% | |
Russia | | | 3.5% | |
Netherlands | | | 2.2% | |
Australia | | | 1.9% | |
France | | | 1.8% | |
South Africa | | | 1.3% | |
Brazil | | | 1.3% | |
Other | | | 15.3% | |
| ^ | Future allocations are subject to change |
| | | | | | | | | | | | | | |
AVERAGE ANNUAL TOTAL RETURN as of 5.31.13 | | | 6 Month | | | | 1 Year | | | | 3 Year | | | Since Inception*
Annualized |
Jefferies | TR/J CRB Global Commodity Equity Index Fund | | | | | | | | | | | | | | |
NAV | | | -1.96% | | | | 9.06% | | | | 6.42% | | | 3.45% |
Market Price** | | | -2.20% | | | | 8.64% | | | | 6.32% | | | 3.13% |
Thomson Reuters/Jefferies CRB In-The-Ground Global Commodity Equity Index | | | -1.53% | | | | 9.73% | | | | 7.13% | | | 4.21% |
S&P GSCI Commodity Index | | | -6.24% | | | | 3.02% | | | | 4.79% | | | 2.32% |
S&P 500® Index | | | 16.43% | | | | 27.28% | | | | 16.87% | | | 14.51% |
Total Expense Ratio (per the current prospectus) 0.65%
| * | The Fund commenced Investment Operations on September 18, 2009 with an Inception Date, the first day of trading on the Exchange, of September 21, 2009. |
| ** | Market Price is based on the midpoint of the bid/ask spread at 4 p.m. ET and does not represent the returns an investor would receive if shares were traded at other times. |
Performance data quoted represents past performance. Past performance does not guarantee future results. Investment return and principal value of an investment will fluctuate so that an investor’s shares, when sold or redeemed, may be worth more or less than the original cost. Current performance data may be higher or lower than actual data quoted. For the most current month-end performance data please visit www.alpsfunds.com.
NAV is an exchange-traded fund’s per-share value. The per-share dollar amount of the fund is derived by dividing the total value of all the securities in its portfolio, less any liabilities, by the number of fund shares outstanding. Market Price is the price at which a share can currently be traded in the market. Information detailing the number of days the Market Price of the Fund was greater than the Fund’s NAV and the number of days it was less than the Fund’s NAV can be obtained at www.alpsfunds.com.
Thomson Reuters/Jefferies CRB In-The-Ground Global Commodity Equity Index: measures the performance of equity securities of companies en-gaged in the production and distribution of certain commodities and commodity-related products. S&P GSCI Commodity Index: A composite index of commodity sector returns which represents a broadly diversified, unleveraged, long-only position in commodity futures. S&P 500® Index: the Standard & Poor’s composite index of 500 stocks, a widely recognized, unmanaged index of common stock prices. Index return does not represent fund return. An investor can not invest directly in an index.
GROWTH OF A HYPOTHETICAL $10,000 INVESTMENT as of 5.31.13
Comparison of Change in value of a hypothetical $10,000 investment in the Jefferies | TR/J CRB Global Commodity Equity Index Fund.
| | | | |
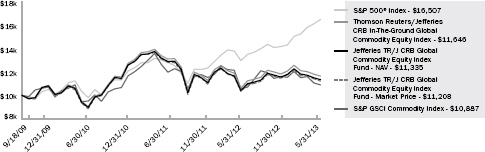 | | The chart represents historical performance of a hypothetical investment of $10,000 in the Fund over the life of the Fund. Performance calculations are as of the end of each month. Past performance does not guarantee future results. This chart does not reflect the deduction of taxes that a shareholder would pay on Fund distributions or the redemption of Fund shares. | | |
| | |
| | | |
2 | | Semi-Annual Report (Unaudited) | May 31, 2013 |
| | | |
| | |
| | DISCLOSURE OF FUND EXPENSES |
| | For the Six Months Ended May 31, 2013 (unaudited) |
Shareholder Expense Example: As a shareholder of the Fund, you incur two types of costs: (1) transaction costs which may include creation and redemption fees or brokerage charges, and (2) ongoing costs, including management fees and other Fund expenses. These examples are intended to help you understand your ongoing costs (in dollars) of investing in the Fund and to compare these costs with the ongoing costs of investing in other funds. The example is based on an investment of $1,000 invested at the beginning of the (six month) period and held through May 31, 2013.
Actual Return: The first line of the table provides information about actual account values and actual expenses. You may use the information in this table, together with the amount you invested, to estimate the expenses that you incurred over the period. Simply divide your account value by $1,000 (for example, an $8,600 account value divided by $1,000 = 8.6), then multiply the result by the number in the first table under the heading entitled “Expenses Paid During the Period” to estimate the expenses attributable to your investment during this period.
Hypothetical 5% Return: The second line of the table provides information about hypothetical account values and hypothetical expenses based on the Fund’s actual expense ratio and an assumed rate of return of 5% per year before expenses, which is not the Fund’s actual return. The hypothetical account values and expenses may not be used to estimate the actual ending account balance or expenses you paid for the period. You may use this information to compare ongoing costs of investing in the Fund and other funds. To do so, compare this 5% hypothetical example with the 5% hypothetical examples that appear in the shareholder reports of the other funds.
The expenses shown in the table are meant to highlight ongoing Fund costs only and do not reflect any transaction costs, such as creation and redemption fees, or brokerage charges. Therefore, the second line of the table is useful in comparing ongoing costs only, and will not help you determine the relative total costs of owning different funds. In addition, if these costs were included, your costs would have been higher.
| | | | | | | | | | | | | | | | |
| | | Beginning Account Value 12/1/12 | | | Ending Account Value 5/31/13 | | | Expense Ratio(a) | | | Expenses Paid During the Period 12/1/12 - 5/31/13(b) | |
Jefferies TR/J CRB Global Commodity Equity Index Fund | | | | | | | | | | | | | | | | |
Actual | | $ | 1,000.00 | | | $ | 980.40 | | | | 0.65 | % | | $ | 3.21 | |
Hypothetical | | $ | 1,000.00 | | | $ | 1,021.69 | | | | 0.65 | % | | $ | 3.28 | |
| (a) | The Fund’s expense ratios have been based on the Fund’s most recent fiscal half-year expenses. |
| (b) | The example in the table above is equal to the Fund’s annualized expense ratio multiplied by the average account value over the period, multiplied by the number of days in the most recent fiscal half year (182), then divided by 365. |
| | |
| | SCHEDULE OF INVESTMENTS |
| | JEFFERIES | TR/J CRB GLOBAL COMMODITY EQUITY INDEX FUND | May 31, 2013 (Unaudited) |
| | | | | | | | |
| Security Description | | Shares | | | Value | |
COMMON STOCKS (99.03%) | |
Australia (1.86%) | | | | | | | | |
Fortescue Metals Group, Ltd. | | | 23,992 | | | $ | 76,921 | |
Iluka Resources, Ltd. | | | 6,104 | | | | 65,662 | |
Incitec Pivot, Ltd. | | | 128,418 | | | | 358,874 | |
Newcrest Mining, Ltd. | | | 28,063 | | | | 389,704 | |
Nufarm, Ltd. | | | 20,158 | | | | 87,972 | |
Woodside Petroleum, Ltd. | | | 7,476 | | | | 257,505 | |
| | | | | | | | |
| | | | | | | 1,236,638 | |
| | | | | | | | |
| | |
Bermuda (1.25%) | | | | | | | | |
Bunge, Ltd. | | | 11,400 | | | | 793,440 | |
Sinofert Holdings, Ltd. | | | 170,000 | | | | 38,982 | |
| | | | | | | | |
| | | | | | | 832,422 | |
| | | | | | | | |
| | |
Brazil (1.26%) | | | | | | | | |
Companhia Siderurgica Nacional SA, ADR | | | 23,547 | | | | 74,173 | |
Gerdau SA, ADR | | | 18,455 | | | | 112,760 | |
Petroleo Brasileiro SA, ADR | | | 19,252 | | | | 342,108 | |
Vale SA, ADR | | | 21,284 | | | | 306,490 | |
| | | | | | | | |
| | | | | | | 835,531 | |
| | | | | | | | |
| | |
Canada (14.34%) | | | | | | | | |
Agnico-Eagle Mines, Ltd. | | | 6,164 | | | | 200,363 | |
Agrium, Inc. | | | 12,489 | | | | 1,154,758 | |
Barrick Gold Corp. | | | 36,608 | | | | 769,059 | |
Cameco Corp. | | | 6,402 | | | | 139,186 | |
Canadian Natural Resources, Ltd. | | | 11,855 | | | | 353,335 | |
Eldorado Gold Corp. | | | 25,741 | | | | 208,063 | |
EnCana Corp. | | | 8,224 | | | | 156,825 | |
First Quantum Minerals, Ltd. | | | 13,879 | | | | 248,463 | |
Goldcorp, Inc. | | | 29,391 | | | | 872,304 | |
IAMGOLD Corp. | | | 13,307 | | | | 69,696 | |
Kinross Gold Corp. | | | 40,784 | | | | 267,501 | |
New Gold, Inc.* | | | 16,652 | | | | 113,235 | |
Osisko Mining Corp.* | | | 15,804 | | | | 67,987 | |
Pan American Silver Corp. | | | 5,432 | | | | 66,122 | |
Potash Corp. of Saskatchewan, Inc. | | | 71,867 | | | | 3,039,660 | |
Silver Wheaton Corp. | | | 12,837 | | | | 304,473 | |
Suncor Energy, Inc. | | | 17,780 | | | | 539,360 | |
Teck Resources, Ltd., Class B | | | 7,504 | | | | 200,420 | |
TransCanada Corp. | | | 8,368 | | | | 383,875 | |
Turquoise Hill Resources, Ltd.* | | | 10,596 | | | | 70,725 | |
Yamana Gold, Inc. | | | 26,838 | | | | 316,335 | |
| | | | | | | | |
| | | | | | | 9,541,745 | |
| | | | | | | | |
| | |
Cayman Islands (0.00%)(a) | | | | | | | | |
Chaoda Modern Agriculture Holdings, Ltd.* | | | 348,000 | | | | 448 | |
| | | | | | | | |
| | |
Chile (0.70%) | | | | | | | | |
Sociedad Quimica y Minera de Chile SA, Sponsored ADR | | | 10,001 | | | | 464,346 | |
| | | | | | | | |
| | | | | | | | |
| Security Description | | Shares | | | Value | |
China (1.25%) | | | | | | | | |
China BlueChemical, Ltd.,
Class H | | | 150,000 | | | $ | 93,139 | |
China Petroleum & Chemical Corp., Class H | | | 217,029 | | | | 224,226 | |
China Shenhua Energy Co., Ltd., Class H | | | 39,216 | | | | 128,571 | |
Jiangxi Copper Co., Ltd., Class H | | | 19,000 | | | | 36,959 | |
PetroChina Co., Ltd., Class H | | | 246,119 | | | | 286,620 | |
Zijin Mining Group Co., Ltd., Class H | | | 221,000 | | | | 61,495 | |
| | | | | | | | |
| | | | | | | 831,010 | |
| | | | | | | | |
| | |
France (1.79%) | | | | | | | | |
Total SA | | | 23,711 | | | | 1,189,125 | |
| | | | | | | | |
| | |
Germany (1.07%) | | | | | | | | |
K+S AG | | | 14,037 | | | | 593,131 | |
ThyssenKrupp AG* | | | 5,980 | | | | 120,124 | |
| | | | | | | | |
| | | | | | | 713,255 | |
| | | | | | | | |
| | |
Hong Kong (0.62%) | | | | | | | | |
China Agri-Industries Holdings, Ltd. | | | 170,000 | | | | 83,657 | |
CNOOC, Ltd. | | | 185,987 | | | | 328,723 | |
| | | | | | | | |
| | | | | | | 412,380 | |
| | | | | | | | |
| | |
India (0.51%) | | | | | | | | |
Reliance Industries, Ltd., Sponsored GDR(b) | | | 9,176 | | | | 263,076 | |
Sterlite Industries India, Ltd., ADR | | | 11,737 | | | | 77,699 | |
| | | | | | | | |
| | | | | | | 340,775 | |
| | | | | | | | |
| | |
Israel (0.89%) | | | | | | | | |
Israel Chemicals, Ltd. | | | 35,793 | | | | 399,906 | |
The Israel Corp., Ltd.* | | | 310 | | | | 191,924 | |
| | | | | | | | |
| | | | | | | 591,830 | |
| | | | | | | | |
| | |
Italy (0.99%) | | | | | | | | |
Eni SpA | | | 28,908 | | | | 657,529 | |
| | | | | | | | |
| | |
Japan (0.91%) | | | | | | | | |
INPEX Corp. | | | 22 | | | | 95,705 | |
JFE Holdings, Inc. | | | 8,000 | | | | 170,823 | |
Nippon Steel & Sumitomo Metal Corp. | | | 131,000 | | | | 339,057 | |
| | | | | | | | |
| | | | | | | 605,585 | |
| | | | | | | | |
| | |
Jersey (1.19%) | | | | | | | | |
Glencore International Plc | | | 113,148 | | | | 555,468 | |
Randgold Resources, Ltd. | | | 3,006 | | | | 238,872 | |
| | | | | | | | |
| | | | | | | 794,340 | |
| | | | | | | | |
| | |
Luxembourg (0.29%) | | | | | | | | |
ArcelorMittal | | | 15,102 | | | | 194,325 | |
| | | | | | | | |
| | |
| | | |
4 | | Semi-Annual Report (Unaudited) | May 31, 2013 |
| | | |
| | |
| | SCHEDULE OF INVESTMENTS |
| | JEFFERIES | TR/J CRB GLOBAL COMMODITY EQUITY INDEX FUND | May 31, 2013 (Unaudited) |
| | | | | | | | |
| Security Description | | Shares | | | Value | |
Malaysia (1.20%) | | | | | | | | |
Genting Plantations BHD | | | 16,900 | | | $ | 49,080 | |
IOI Corp., BHD | | | 207,700 | | | | 341,810 | |
Kuala Lumpur Kepong BHD | | | 33,920 | | | | 231,825 | |
PPB Group BHD | | | 40,700 | | | | 178,613 | |
| | | | | | | | |
| | | | | | | 801,328 | |
| | | | | | | | |
| | |
Mauritius (0.37%) | | | | | | | | |
Golden Agri-Resources, Ltd. | | | 538,000 | | | | 244,749 | |
| | | | | | | | |
| | |
Mexico (0.57%) | | | | | | | | |
Grupo Mexico SAB de CV,
Series B | | | 58,684 | | | | 194,262 | |
Industrias Penoles SAB de CV | | | 4,769 | | | | 181,363 | |
| | | | | | | | |
| | | | | | | 375,625 | |
| | | | | | | | |
| | |
Netherlands (2.22%) | | | | | | | | |
CNH Global N.V. | | | 2,519 | | | | 109,199 | |
Nutreco Holding N.V. | | | 5,624 | | | | 241,990 | |
Schlumberger, Ltd. | | | 15,395 | | | | 1,124,297 | |
| | | | | | | | |
| | | | | | | 1,475,486 | |
| | | | | | | | |
| | |
Norway (0.99%) | | | | | | | | |
Norsk Hydro ASA | | | 12,200 | | | | 55,568 | |
Yara International ASA | | | 13,500 | | | | 605,454 | |
| | | | | | | | |
| | | | | | | 661,022 | |
| | | | | | | | |
| | |
Peru (0.24%) | | | | | | | | |
Companhia de Minas Buenaventura SA, ADR | | | 8,759 | | | | 157,224 | |
| | | | | | | | |
| | |
Russia (3.52%) | | | | | | | | |
Gazprom OAO, ADR* | | | 68,575 | | | | 518,427 | |
LUKOIL OAO, Sponsored ADR | | | 6,278 | | | | 371,030 | |
Mechel Steel Group, Sponsored ADR* | | | 6,769 | | | | 20,307 | |
MMC Norilsk Nickel JSC, ADR* | | | 11,272 | | | | 163,219 | |
NovaTek OAO, Sponsored GDR(c) | | | 3,467 | | | | 388,997 | |
Phosagro OAO, GDR(c) | | | 2,885 | | | | 37,822 | |
Rosneft Oil Co., GDR(c) | | | 12,858 | | | | 85,441 | |
Severstal OAO, GDR(c) | | | 2,854 | | | | 22,404 | |
Uralkali, GDR(c) | | | 20,305 | | | | 734,026 | |
| | | | | | | | |
| | | | | | | 2,341,673 | |
| | | | | | | | |
| | |
Singapore (0.99%) | | | | | | | | |
Olam International, Ltd. | | | 122,000 | | | | 168,915 | |
Wilmar International, Ltd. | | | 190,000 | | | | 490,051 | |
| | | | | | | | |
| | | | | | | 658,966 | |
| | | | | | | | |
| | |
South Africa (1.32%) | | | | | | | | |
Anglo Platinum, Ltd. | | | 1,308 | | | | 42,768 | |
AngloGold Ashanti, Ltd., Sponsored ADR | | | 12,828 | | | | 232,700 | |
Gold Fields, Ltd. | | | 24,213 | | | | 147,849 | |
Harmony Gold Mining Co., Ltd. | | | 10,313 | | | | 42,833 | |
| | | | | | | | |
| Security Description | | Shares | | | Value | |
South Africa (1.32%) (continued) | |
Impala Platinum Holdings, Ltd. | | | 14,916 | | | $ | 157,136 | |
Kumba Iron Ore, Ltd. | | | 473 | | | | 24,351 | |
Sasol, Ltd. | | | 5,166 | | | | 232,558 | |
| | | | | | | | |
| | | | | | | 880,195 | |
| | | | | | | | |
| | |
South Korea (0.46%) | | | | | | | | |
POSCO | | | 1,077 | | | | 306,979 | |
| | | | | | | | |
| | |
Spain (0.38%) | | | | | | | | |
Repsol YPF SA | | | 11,083 | | | | 253,962 | |
| | | | | | | | |
| | |
Switzerland (4.85%) | | | | | | | | |
Syngenta AG | | | 7,679 | | | | 3,019,403 | |
Transocean, Ltd. | | | 4,145 | | | | 208,203 | |
| | | | | | | | |
| | | | | | | 3,227,606 | |
| | | | | | | | |
| | |
Taiwan (0.44%) | | | | | | | | |
China Steel Corp. | | | 173,276 | | | | 147,389 | |
Taiwan Fertilizer Co., Ltd. | | | 56,400 | | | | 147,220 | |
| | | | | | | | |
| | | | | | | 294,609 | |
| | | | | | | | |
| | |
United Kingdom (9.33%) | | | | | | | | |
Anglo American Plc* | | | 19,525 | | | | 452,859 | |
Antofagasta Plc | | | 5,618 | | | | 80,708 | |
BG Group Plc | | | 37,973 | | | | 699,859 | |
BHP Billiton Plc | | | 32,110 | | | | 934,539 | |
BP Plc | | | 223,609 | | | | 1,608,565 | |
Kazakhmys Plc | | | 4,064 | | | | 20,223 | |
Lonmin Plc* | | | 18,87 | | | | 684,607 | |
Rio Tinto Plc | | | 19,611 | | | | 851,305 | |
Royal Dutch Shell Plc, Class A | | | 44,052 | | | | 1,475,214 | |
| | | | | | | | |
| | | | | | | 6,207,879 | |
| | | | | | | | |
| | |
United States (43.23%) | | | | | | | | |
AGCO Corp. | | | 7,540 | | | | 418,244 | |
Alcoa, Inc. | | | 17,275 | | | | 146,837 | |
Allegheny Technologies, Inc. | | | 1,695 | | | | 46,731 | |
Allied Nevada Gold Corp.* | | | 2,992 | | | | 23,098 | |
American Vanguard Corp. | | | 1,974 | | | | 60,128 | |
Anadarko Petroleum Corp. | | | 5,922 | | | | 517,997 | |
Apache Corp. | | | 4,559 | | | | 374,431 | |
Archer-Daniels-Midland Co. | | | 53,512 | | | | 1,724,692 | |
Baker Hughes, Inc. | | | 5,045 | | | | 229,447 | |
Cameron International Corp.* | | | 2,844 | | | | 173,114 | |
CF Industries Holdings, Inc. | | | 5,206 | | | | 994,138 | |
Chesapeake Energy Corp. | | | 6,677 | | | | 145,826 | |
Chevron Corp. | | | 22,647 | | | | 2,779,919 | |
Cliffs Natural Resources, Inc. | | | 2,302 | | | | 41,528 | |
Coeur Mining, Inc.* | | | 3,284 | | | | 46,600 | |
ConocoPhillips | | | 14,252 | | | | 874,218 | |
Deere & Co. | | | 32,019 | | | | 2,789,175 | |
Detour Gold Corp.* | | | 4,227 | | | | 43,544 | |
Devon Energy Corp. | | | 4,319 | | | | 245,535 | |
Ensco Plc, Class A | | | 2,748 | | | | 165,347 | |
| | |
| | SCHEDULE OF INVESTMENTS |
| | JEFFERIES | TR/J CRB GLOBAL COMMODITY EQUITY INDEX FUND |May 31, 2013 (Unaudited) |
| | | | | | | | |
| Security Description | | Shares | | | Value | |
United States (43.23%) (continued) | |
EOG Resources, Inc. | | | 3,105 | | | $ | 400,856 | |
Exxon Mobil Corp. | | | 52,623 | | | | 4,760,803 | |
Freeport-McMoRan Copper & Gold, Inc. | | | 15,058 | | | | 467,551 | |
Halliburton Co. | | | 10,147 | | | | 424,652 | |
Hecla Mining Co. | | | 10,462 | | | | 40,069 | |
Hess Corp. | | | 3,435 | | | | 231,553 | |
Ingredion, Inc. | | | 6,162 | | | | 419,755 | |
Intrepid Potash, Inc. | | | 4,711 | | | | 88,473 | |
Kinder Morgan, Inc. | | | 7,480 | | | | 284,090 | |
Marathon Oil Corp. | | | 8,360 | | | | 287,500 | |
Monsanto Co. | | | 44,085 | | | | 4,436,714 | |
The Mosaic Co. | | | 22,665 | | | | 1,378,485 | |
National Oilwell Varco, Inc. | | | 4,915 | | | | 345,525 | |
Newmont Mining Corp. | | | 17,607 | | | | 603,568 | |
Noble Energy, Inc. | | | 3,994 | | | | 230,254 | |
Nucor Corp. | | | 5,007 | | | | 222,862 | |
Occidental Petroleum Corp. | | | 9,250 | | | | 851,648 | |
Peabody Energy Corp. | | | 2,956 | | | | 58,145 | |
Pioneer Natural Resources Co. | | | 1,470 | | | | 203,860 | |
Royal Gold, Inc. | | | 2,222 | | | | 121,677 | |
Southern Copper Corp. | | | 2,642 | | | | 82,298 | |
Southwestern Energy Co.* | | | 4,119 | | | | 155,245 | |
Spectra Energy Corp. | | | 7,895 | | | | 241,350 | |
United States Steel Corp. | | | 2,319 | | | | 41,023 | |
Valero Energy Corp. | | | 6,519 | | | | 264,867 | |
The Williams Co., Inc. | | | 8,133 | | | | 286,119 | |
| | | | | | | | |
| | | | | | | 28,769,491 | |
| | | | | | | | |
TOTAL COMMON STOCKS (Cost $76,832,024) | | | | 65,898,078 | |
| | | | | | | | |
| | | | | | | | |
| | | | | | | | | | |
| 7 Day Yield | | | | Shares | | | Value | |
|
SHORT TERM INVESTMENTS (0.62%) | |
Dreyfus Treasury Prime Cash Management, Institutional Class | | 0.000%(d) | | | 414,216 | | | | 414,216 | |
| | | | | | | | | | |
| |
TOTAL SHORT TERM INVESTMENTS (Cost $414,216) | | | | 414,216 | |
| | | | | | | | | | |
| |
TOTAL INVESTMENTS (99.65%) (Cost $77,246,240) | | | | 66,312,294 | |
| |
NET OTHER ASSETS AND
LIABILITIES (0.35%) | | | | 232,713 | |
| | | | | | | | | | |
| |
NET ASSETS (100.00%) | | | $ | 66,545,007 | |
| | | | | | | | | | |
* Non-income producing security. | |
| (a) | Less than 0.005% of Net Assets. |
| (b) | Security exempt from registration under Rule 144A of the Securities Act of 1933. This security may be resold in transactions exempt from registration, normally to qualified institutional buyers. At period end, the market value of this security restricted under Rule 144A was $263,076, representing 0.40% of the Fund’s net assets. |
| (c) | These securities initially sold to other parties pursuant to Regulation S under the 1933 Act and subsequently resold to the Fund. At the period end, the aggregate market values of these securities were $1,268,690, representing 1.91% of the Fund’s net assets. |
Common Abbreviations:
ADR - American Depositary Receipt.
AG - Aktiengesellschaft is a German term that refers to a
corporation that is limited by shares, i.e., owned by shareholders.
ASA - Allmennaksjeselskap is the Norwegian term
for public limited company.
BHD - Berhad (in Malaysia; equivalent to
Public Limited Company).
GDR - Global Depository Receipt.
JSC - Joint Stock Company.
Ltd. - Limited.
N.V. - Naamloze Vennootschap is the Dutch term for a
public limited liability corporation.
OAO - Otkytoe Aktsionernoe Obshchestvo
(open Joint Stock Corporation) is a Russian term
for a stock-based corporation.
Plc - Public Limited Co.
SA - Generally designated corporations in various
countries, mostly those employing the civil law.
SAB de CV - A variable capital company.
SpA - Società Per Azioni is an Italian shared company.
See Notes to Financial Statements.
| | |
| | | |
6 | | Semi-Annual Report (Unaudited) | May 31, 2013 |
| | | |
| | |
| | STATEMENT OF ASSETS & LIABILITIES |
| | JEFFERIES | TR/J CRB GLOBAL COMMODITY EQUITY INDEX FUND | MAY 31, 2013 (unaudited) |
| | | | |
ASSETS: | | | | |
Investments, at value | | $ | 66,312,294 | |
Foreign currency, at value (Cost $27,505) | | | 27,486 | |
Foreign tax reclaims | | | 47,318 | |
Interest and dividends receivable | | | 199,866 | |
Total Assets | | | 66,586,964 | |
| |
LIABILITIES: | | | | |
Payable to advisor | | | 41,955 | |
Payable for currency contracts sold | | | 2 | |
Total Liabilities | | | 41,957 | |
NET ASSETS | | $ | 66,545,007 | |
| | | | | |
| |
NET ASSETS CONSIST OF: | | | | |
Paid-in capital | | $ | 81,920,497 | |
Accumulated net investment income | | | 428,821 | |
Accumulated net realized loss on investments and foreign currency transactions | | | (4,870,195 | ) |
Net unrealized depreciation on investments and translation of assets and liabilities denominated in foreign currencies | | | (10,934,116 | ) |
NET ASSETS | | $ | 66,545,007 | |
| | | | | |
| |
INVESTMENTS, AT COST | | $ | 77,246,240 | |
| |
PRICING OF SHARES | | | | |
Net Assets | | $ | 66,545,007 | |
Shares of beneficial interest outstanding (Unlimited number of shares authorized, par value $0.01 per share) | | | 1,550,020 | |
Net Asset Value, offering and redemption price per share | | $ | 42.93 | |
See Notes to Financial Statements.
| | |
| | STATEMENT OF OPERATIONS |
| | JEFFERIES | TR/J CRB GLOBAL COMMODITY EQUITY INDEX FUND |
| | | | |
| |
| For the
Six Months Ended May 31, 2013 (Unaudited) |
|
INVESTMENT INCOME: | | | | |
Dividends(a) | | $ | 957,799 | |
Total Investment Income | | | 957,799 | |
| |
EXPENSES: | | | | |
Investment advisory fee | | | 239,155 | |
Total Expenses | | | 239,155 | |
NET INVESTMENT INCOME | | | 718,644 | |
| |
Net realized loss on investments | | | (77,802 | ) |
Net realized loss on foreign currency transactions | | | (6,714 | ) |
Net change in unrealized depreciation on investments | | | (1,852,686 | ) |
Net change in unrealized depreciation on translation of assets and liabilities in foreign currencies | | | (2,023 | ) |
| |
NET REALIZED AND UNREALIZED LOSS ON INVESTMENTS | | | (1,939,225 | ) |
| |
NET DECREASE IN NET ASSETS RESULTING FROM OPERATIONS | | $ | (1,220,581 | ) |
| | | | | |
| (a) | Net of foreign tax withholdings of $75,038. |
See Notes to Financial Statements.
| | |
| | | |
8 | | Semi-Annual Report (Unaudited) | May 31, 2013 |
| | | |
| | |
| | STATEMENTS OF CHANGES IN NET ASSETS |
| | JEFFERIES | TR/J CRB GLOBAL COMMODITY EQUITY INDEX FUND |
| | | | | | | | |
| |
| For the Six Months Ended
May 31, 2013 (Unaudited) |
| |
| For the Year Ended
November 30, 2012 |
|
OPERATIONS: | | | | | | | | |
Net investment income | | $ | 718,644 | | | $ | 1,339,773 | |
Net realized loss on investments and foreign currency transactions | | | (84,516 | ) | | | (1,686,119 | ) |
Net change in unrealized depreciation on investments and foreign currency | | | (1,854,709 | ) | | | (397,803 | ) |
Net decrease in net assets resulting from operations | | | (1,220,581 | ) | | | (744,149 | ) |
| | |
DISTRIBUTIONS TO SHAREHOLDERS: | | | | | | | | |
From net investment income | | | (540,664 | ) | | | (1,276,823 | ) |
Total distributions | | | (540,664 | ) | | | (1,276,823 | ) |
| | |
SHARE TRANSACTIONS: | | | | | | | | |
Proceeds from sale of shares | | | – | | | | 9,514,413 | |
Cost of shares redeemed | | | (8,893,088 | ) | | | (21,833,445 | ) |
Net decrease from share transactions | | | (8,893,088 | ) | | | (12,319,032 | ) |
Net decrease in net assets | | | (10,654,333 | ) | | | (14,340,004 | ) |
| | |
NET ASSETS: | | | | | | | | |
Beginning of period | | | 77,199,340 | | | | 91,539,344 | |
End of period* | | $ | 66,545,007 | | | $ | 77,199,340 | |
| | | | | | | | | |
| | |
*Including accumulated net investment income of: | | $ | 428,821 | | | $ | 250,841 | |
| | |
OTHER INFORMATION: | | | | | | | | |
SHARE TRANSACTIONS: | | | | | | | | |
Beginning shares | | | 1,750,020 | | | | 2,050,017 | |
Shares sold | | | – | | | | 200,003 | |
Shares redeemed | | | (200,000 | ) | | | (500,000 | ) |
Shares outstanding, end of period | | | 1,550,020 | | | | 1,750,020 | |
| | | | | | | | | |
See Notes to Financial Statements.
| | |
| | FINANCIAL HIGHLIGHTS |
| | JEFFERIES | TR/J CRB GLOBAL COMMODITY EQUITY INDEX FUND For a Share Outstanding Throughout the Periods Presented |
| | | | | | | | | | | | | | | | | | | | | | | | | |
| | | For the Six Month Ended
May 31, 2013
(Unaudited) | | For the
Year Ended
November 30,
2012 | | For the Period
January 1, 2011 to
November 30,
2011(a) | | For the Year
Ended
December 31,
2010 | | For the
Period Ended
September 21, 2009
(inception) through
December 31, 2009 |
NET ASSET VALUE, BEGINNING OF PERIOD | | | $ | 44.11 | | | | $ | 44.65 | | | | $ | 49.33 | | | | $ | 42.82 | | | | $ | 39.74 | |
| | | |
INCOME FROM OPERATIONS: | | | | | | | | | | | | | | | | |
Net investment income | | | | 0.44 | (b) | | | | 0.71 | (b) | | | | 0.58 | (b) | | | | 0.46 | (b) | | | | 0.12 | |
Net realized and unrealized gain/(loss) on investments | | | | (1.29 | ) | | | | (0.57 | ) | | | | (4.78 | ) | | | | 6.54 | | | | | 3.08 | |
Total from Investment Operations | | | | (0.85 | ) | | | | 0.14 | | | | | (4.20 | ) | | | | 7.00 | | | | | 3.20 | |
| | | |
LESS DISTRIBUTIONS: | | | | | | | | | | | | | | | | |
From net investment income | | | | (0.33 | ) | | | | (0.68 | ) | | | | (0.48 | ) | | | | (0.49 | ) | | | | (0.12 | ) |
Total Distributions | | | | (0.33 | ) | | | | (0.68 | ) | | | | (0.48 | ) | | | | (0.49 | ) | | | | (0.12 | ) |
NET INCREASE/(DECREASE) IN NET ASSET VALUE | | | | (1.18 | ) | | | | (0.54 | ) | | | | (4.68 | ) | | | | 6.51 | | | | | 3.08 | |
NET ASSET VALUE, END OF PERIOD | | | $ | 42.93 | | | | $ | 44.11 | | | | $ | 44.65 | | | | $ | 49.33 | | | | $ | 42.82 | |
| | | | | | | | | | | | | | | | | | | | | | | | | | |
TOTAL RETURN(c) | | | | (1.96 | )% | | | | 0.35 | % | | | | (8.56 | )% | | | | 16.60 | % | | | | 8.06 | % |
| | | |
RATIOS/ SUPPLEMENTAL DATA: | | | | | | | | | | | | | | | | |
Net assets, end of period
(in 000s) | | | $ | 66,545 | | | | $ | 77,199 | | | | $ | 91,539 | | | | $ | 111,001 | | | | $ | 70,658 | |
| | | |
RATIOS TO AVERAGE NET ASSETS: | | | | | | | | | | | | | | | | |
Net investment income | | | | 1.95 | % (d) | | | | 1.61 | % | | | | 1.29 | % (d) | | | | 1.09 | % | | | | 1.53 | % (d) |
Operating expenses | | | | 0.65 | % (d) | | | | 0.65 | % | | | | 0.65 | % (d) | | | | 0.65 | % | | | | 0.65 | % (d) |
PORTFOLIO TURNOVER RATE(e) | | | | 6 | % | | | | 13 | % | | | | 10 | % | | | | 18 | % | | | | 7 | % |
| (a) | Effective March 7, 2011, the Board approved changing the fiscal year end of the Fund from December 31 to November 30. |
| (b) | Calculated using average shares outstanding. |
| (c) | Total return is calculated assuming an initial investment made at the net asset value at the beginning of the period and redemption at the net asset value on the last day of the period and assuming all distributions are reinvested at actual reinvestment prices. Total return calculated for a period of less than one year is not annualized. |
| (e) | Portfolio turnover is not annualized and does not include securities received or delivered from processing creations or redemptions. |
See Notes to Financial Statements.
| | |
| | | |
10 | | Semi-Annual Report (Unaudited) | May 31, 2013 |
| | | |
| | |
| | NOTES TO FINANCIAL STATEMENTS |
| | May 31, 2013 (Unaudited) |
1. ORGANIZATION
The ALPS ETF Trust (the “Trust”), a Delaware statutory trust, is an open-end management investment company under the Investment Company Act of 1940, as amended (the “1940 Act”). As of May 31, 2013, the Trust consists of thirteen separate portfolios. Each portfolio represents a separate series of the Trust. This report pertains to the Jefferies | TR/J CRB Global Commodity Equity Index Fund (the “Fund”). The investment objective of the Fund is to seek investment results that correspond generally to the price and yield (before the Fund’s fees and expenses) of the Thomson Reuters/Jefferies CRB In-The-Ground Global Commodity Equity Index (the “Underlying Index”).
The Fund’s Shares (“Shares”) are listed on the New York Stock Exchange (“NYSE”) Arca. The Fund issues and redeems Shares, at net asset value (“NAV”) in blocks of 50,000 Shares, each of which is called a “Creation Unit.” Creation Units are issued and redeemed principally in-kind for securities included in a specified index. Except when aggregated in Creation Units, Shares are not redeemable securities of the Fund.
2. SIGNIFICANT ACCOUNTING POLICIES
The following is a summary of significant accounting policies consistently followed by the Fund in the preparation of the financial statements. The accompanying financial statements were prepared in accordance with accounting principles generally accepted in the United States of America (“U.S. GAAP”). The preparation of financial statements in conformity with U.S. GAAP requires management to make certain estimates and assumptions that affect the reported amounts of assets and liabilities and disclosures of contingent assets and liabilities at the date of the financial statements and the reported amounts of revenue and expenses during the period. Actual results could differ from those estimates.
A. Portfolio Valuation
The Fund’s NAV is determined daily, as of the close of regular trading on the NYSE, normally 4:00 p.m. Eastern time, on each day the NYSE is open for trading. The NAV is computed by dividing the value of all assets of the Fund (including accrued interest and dividends), less all liabilities (including accrued expenses and dividends declared but unpaid), by the total number of shares outstanding.
Portfolio securities listed on any exchange other than the National Association of Securities Dealer Automated Quotation (“NAS-DAQ”) exchange are valued at the last sale price on the business day as of which such value is being determined. If there has been no sale on such day, the securities are valued at the mean of the most recent bid and asked prices on such day. Securities traded on the NASDAQ are valued at the NASDAQ Official Closing Price as determined by NASDAQ. Portfolio securities traded on more than one securities exchange are valued at the last sale price on the business day as of which such value is being determined at the close of the exchange representing the principal market for such securities. Portfolio securities traded in the over-the-counter market, but excluding securities traded on the NASDAQ, are valued at the closing bid prices. Short-term investments that mature in less than 60 days are valued at amortized cost, which approximates market value.
The Fund’s investments are valued at market value or, in the absence of market value with respect to any portfolio securities, at fair value according to procedures adopted by the Trust’s Board of Trustees (the “Board”). When market quotations are not readily available or when events occur that make established valuation methods unreliable, securities of the Fund may be valued in good faith by or under the direction of the Board. These securities generally include, but are not limited to, restricted securities (securities which may not be publicly sold without registration under the Securities Act of 1933) for which a pricing service is unable to provide a market price; securities whose trading has been formally suspended; a security whose market price is not available from a pre-established primary pricing source or the pricing source is not willing to provide a price; a security with respect to which an event has occurred that is most likely to materially affect the value of the security after the market has closed but before the calculation of the Fund’s NAV or make it difficult or impossible to obtain a reliable market quotation; or a security whose price, as provided by the pricing service, does not reflect the security’s “fair value” due to the security being de-listed from a national exchange or the security’s primary trading market is temporarily closed at a time when, under normal conditions, it would be open. As a general principle, the current “fair value” of a security would be the amount which the owner might reasonably expect to receive from the closing sale prices on the applicable exchange and fair value prices may not reflect the actual value of a security. A variety of factors may be considered in determining the fair value of such securities.
| | |
| | NOTES TO FINANCIAL STATEMENTS |
| | May 31, 2013 (Unaudited) |
B. Foreign Currency Translation and Foreign Investments
The Fund invests in foreign securities which may involve a number of risk factors and special considerations not present with investments in securities of U.S. Corporations. The accounting records of the Fund are maintained in U.S. dollars. Investment in non-U.S. issuers may involve unique risks compared to investing in securities of U.S. issuers. These risks may include, but are not limited to: (i) less information about non-U.S. issuers or markets may be available due to less rigorous disclosure, accounting standards or regulatory practices; (ii) many non-U.S. markets are smaller, less liquid and more volatile thus, in a changing market, the advisers may not be able to sell the Fund’s portfolio securities at times, in amounts and at prices they consider reasonable; (iii) currency exchange rates or controls may adversely affect the value of the Fund’s investments; (iv) the economies of non-U.S. countries may grow at slower rates than expected or may experience downturns or recessions; and, (v) withholdings and other non-U.S. taxes may decrease the Fund’s return.
Portfolio securities and other assets and liabilities denominated in a foreign currency are translated to U.S. dollars at the prevailing rates of exchange at period end. Amounts related to the purchases and sales of securities and investment income are translated into U.S. dollars at the prevailing exchange rate on the respective dates of transactions. The effects of changes in foreign currency exchange rates on portfolio investments are included in the net realized and unrealized gains and losses on investments. Net gains and losses on foreign currency transactions include disposition of foreign currencies, and currency gains and losses between the accrual and receipt dates of portfolio investment income and between the trade and settlement dates of portfolio investment transactions.
C. Securities Transactions and Investment Income
Securities transactions are recorded as of the trade date. Realized gains and losses from securities transactions are recorded on the highest cost basis. Dividend income is recorded on the ex-dividend date. Interest income, if any, is recorded on the accrual basis.
D. Dividends and Distributions to Shareholders
Dividends from net investment income of the Fund, if any, are declared and paid quarterly or as the Board may determine from time to time. Distributions of net realized capital gains earned by the Fund, if any, are distributed at least annually.
E. Federal Tax and Tax Basis Information
The timing and character of income and capital gain distributions are determined in accordance with income tax regulations, which may differ from U.S. GAAP. Reclassifications are made to the Fund’s capital accounts for permanent tax differences to reflect income and gains available for distribution (or available capital loss carryforwards) under income tax regulations. The amounts and characteristics of tax basis distributions and composition of distributable earnings/(accumulated losses) are finalized at fiscal year end: accordingly, tax basis balances have not been determined as of May 31, 2013.
Under the Regulated Investment Company Modernization Act of 2010 (“the Modernization Act”), net capital losses recognized in tax years beginning after December 22, 2010 may be carried forward indefinitely, and the character of the losses is retained as short-term and/or long-term. Under the law in effect prior to the Modernization Act, net capital losses were carried forward for eight years and treated as short-term. As a transition rule, the Modernization Act requires that post-enactment net capital losses be used before pre-enactment net capital losses. Additionally, post-enactment capital losses that are carried forward will retain their character as either short-term or long-term losses rather than being considered all short-term as under previous law.
At November 30, 2012, the Fund had available for tax purposes unused pre-enactment capital loss carryforwards as follows:
| | |
| | | Expiring December 31, 2018 |
Jefferies | TR/J CRB Global Commodity Equity Index Fund | | $ 684,426 |
At November 30, 2012, the Fund had available for tax purposes unused post-enactment capital loss carryforwards as follows:
| | | | | | | | |
| | | Short-Term | | | Long-Term | |
Jefferies | TR/J CRB Global Commodity Equity Index Fund | | $ | 1,703,230 | | | $ | 1,766,910 | |
Distributions from net investment income and capital gains are determined in accordance with income tax regulations, which may differ from U.S. GAAP. These differences are primarily due to differing treatments of income and gains on various investment securities held by the Fund, timing differences and differing characterization of distributions made by the Fund.
| | |
| | | |
12 | | Semi-Annual Report (Unaudited) | May 31, 2013 |
| | | |
| | |
| | NOTES TO FINANCIAL STATEMENTS |
| | May 31, 2013 (Unaudited) |
The tax character of the distributions paid was as follows:
| | | | | |
| | | Year Ended November 30, 2012
Distributions paid from:
Ordinary Income |
Jefferies | TR/J CRB Global Commodity Equity Index Fund | | | | $ 1,276,823 | |
The differences between book-basis and tax-basis are primarily due to the deferral of losses from wash sales and the differing treatment of certain other investments.
As of May 31, 2013, the costs of investments for federal income tax purposes and accumulated net unrealized appreciation/ (depreciation) on investments were as follows:
| | | | | |
| | | Jefferies | TR/J CRB Global
Commodity Equity Index Fund |
Cost of investments for income tax purposes | | | $ | 77,819,109 | |
| | | | | | |
Gross Appreciation (excess of value over tax cost) | | | $ | 4,308,074 | |
Gross Depreciation (excess of tax cost over value) | | | | (15,814,889) | |
Net Unrealized Depreciation | | | $ | (11,506,815) | |
| | | | | | |
F. Income Taxes
No provision for income taxes is included in the accompanying financial statements, as the Fund intends to distribute to shareholders all taxable investment income and realized gains and otherwise comply with Subchapter M of the Internal Revenue Code of 1986, as amended, applicable to regulated investment companies.
The Fund evaluates tax positions taken (or expected to be taken) in the course of preparing the Fund’s tax returns to determine whether these positions meet a “more-likely-than-not” standard that, based on the technical merits, have a more than fifty percent likelihood of being sustained by a taxing authority upon examination. A tax position that meets the “more-likely-than-not” recognition threshold is measured to determine the amount of benefit to recognize in the financial statements.
As of and during the period ended May 31, 2013, the fund did not have a liability for any unrecognized tax benefits. The fund files U.S. federal, state, and local tax returns as required. The fund’s tax returns are subject to examination by the relevant tax authorities until expiration of the applicable statute of limitations which is generally three years after the filing of the tax return Tax returns for open years have incorporated no uncertain tax positions that require a provision for income taxes.
G. Fair Value Measurements
The Fund discloses the classification of fair value measurements following a three-tier hierarchy based on the inputs used to measure fair value. Inputs refer broadly to the assumptions that market participants would use in pricing the asset or liability, including assumptions about risk. Inputs may be observable or unobservable. Observable inputs reflect the assumptions market participants would use in pricing the asset or liability that are developed based on market data obtained from sources independent of the reporting entity. Unobservable inputs reflect the reporting entity’s own assumptions about the assumptions market participants would use in pricing the asset or liability that are developed based on the best information available.
Various inputs are used in determining the value of the Fund’s investments as of the end of the reporting period. When inputs used fall into different levels of the fair value hierarchy, the level in the hierarchy within which the fair value measurement falls is determined based on the lowest level input that is significant to the fair value measurement in its entirety. The designated input levels are not necessarily an indication of the risk or liquidity associated with these investments. These inputs are categorized in the following hierarchy under applicable financial accounting standards:
| | | | |
Level 1 | | – | | Unadjusted quoted prices in active markets for identical investments, unrestricted assets or liabilities that a Fund has the ability to access at the measurement date; |
| | |
Level 2 | | – | | Quoted prices which are not active, quoted prices for similar assets or liabilities in active markets or inputs other than quoted prices that are observable (either directly or indirectly) for substantially the full term of the asset or liability; and |
| | |
Level 3 | | – | | Significant unobservable prices or inputs (including the Fund’s own assumptions in determining the fair value of investments) where there is little or no market activity for the asset or liability at the measurement date. |
| | |
| | NOTES TO FINANCIAL STATEMENTS |
| | May 31, 2013 (Unaudited) |
The following is a summary of the inputs used to value the Funds investments at May 31, 2013:
| | | | | | | | | | | | | | | | | | |
| Investments in Securities at Value* | | Level 1 -
Unadjusted
Quoted Prices | | | Level 2 -
Other Significant
Observable Inputs | | | Level 3 -
Significant
Unobservable
Inputs | | | | | Total | |
Common Stocks | | | | | | | | | | | | | | | | | | |
Cayman Islands | | $ | – | | | $ | 448 | | | $ | – | | | | | $ | 448 | |
Other Countries | | | 65,897,630 | | | | – | | | | – | | | | | | 65,897,630 | |
Short Term Investments | | | 414,216 | | | | – | | | | – | | | | | | 414,216 | |
TOTAL | | $ | 66,311,846 | | | $ | 448 | | | $ | – | | | | | $ | 66,312,294 | |
| * | For detailed country descriptions, see the accompanying Schedule of Investments. |
The Fund recognizes transfers between levels as of the end of the period. For the six months ended May 31, 2013, the Fund did not have any transfers between Level 1 and Level 2 securities. The Fund did not have any securities which used significant unobservable inputs (Level 3) in determining fair value.
3. INVESTMENT ADVISORY FEE AND OTHER AFFILIATED TRANSACTIONS
ALPS Advisors, Inc. (the “Investment Adviser”) acts as the Fund’s investment adviser pursuant to an advisory agreement with the Trust on behalf of the Fund (the “Advisory Agreement”). Pursuant to the Advisory Agreement, the Fund pays the Investment Adviser a unitary fee for the services and facilities it provides payable on a monthly basis at the annual rate of 0.65% of the Fund’s average daily net assets. From time to time, the Investment Adviser may waive all or a portion of its fee.
Out of the unitary management fee, the Investment Adviser pays substantially all expenses of the Fund, including the licensing fee of the Index provider, and the cost of transfer agency, custody, fund administration, legal, audit, trustees and other services, except for interest expenses, distribution fees or expenses, brokerage expenses, taxes and extraordinary expenses not incurred in the ordinary course of the Fund’s business. In addition, the Investment Adviser’s unitary management fee is designed to compensate the Investment Adviser for providing services for the Fund.
ALPS Fund Services, Inc. (“ALPS”), an affiliate of the Investment Adviser, is the administrator of the Fund.
The Bank of New York Mellon is the custodian, fund accounting agent and transfer agent for the Fund.
Each Trustee who is not an officer or employee of the Investment Adviser, any sub-adviser or any of their affiliates (“Independent Trustees”) is paid a quarterly retainer of $5,000, $3,750 for each regularly scheduled Board meeting attended and $1,500 for each special meeting held outside of regularly scheduled meetings.
4. PURCHASES AND SALES OF SECURITIES
For the six months ended May 31, 2013, the cost of purchases and proceeds from sales of investment securities, excluding short-term investments and in-kind transactions, were as follows:
| | | | | | | | |
| | | Purchases | | | Sales | |
Jefferies | TR/J CRB Global Commodity Equity Index Fund | | $ | 4,210,239 | | | $ | 4,590,847 | |
|
For the six months ended May 31, 2013, the cost of in-kind purchases and proceeds from in-kind sales were as follows: | |
| | | Purchases | | | Sales | |
Jefferies | TR/J CRB Global Commodity Equity Index Fund | | $ | – | | | $ | 8,634,568 | |
Gains on in-kind transactions are not considered taxable for federal income tax purposes.
| | |
| | | |
14 | | Semi-Annual Report (Unaudited) | May 31, 2013 |
| | | |
| | |
| | NOTES TO FINANCIAL STATEMENTS |
| | May 31, 2013 (Unaudited) |
5. CAPITAL SHARE TRANSACTIONS
Shares are created and redeemed by the Fund only in Creation Unit size aggregations of 50,000. Only broker-dealers or large institutional investors with creation and redemption agreements called Authorized Participants (“AP”) are permitted to purchase or redeem Creation Units from the Fund. Such transactions are generally permitted on an in-kind basis, with a balancing cash component to equate the transaction to the net asset value per unit of the Fund on the transaction date. Cash may be substituted equivalent to the value of certain securities generally when they are not available in sufficient quantity for delivery, not eligible for trading by the AP or as a result of other market circumstances.
6. INDEMNIFICATIONS
Under the Trust’s organizational documents, its officers and Trustees are indemnified against certain liability arising out of the performance of their duties to the Trust. Additionally, in the normal course of business, the Trust enters into contracts with service providers that contain general indemnification clauses. The Trust’s maximum exposure under these arrangements is unknown, as this would involve future claims that may be made against the Trust that have not yet occurred.
| | |
| | ADDITIONAL INFORMATION |
| | May 31, 2013 (Unaudited) |
PROXY VOTING POLICIES AND PROCEDURES
A description of the Fund’s proxy voting policies and procedures used in determining how to vote for proxies and information regarding how the Fund voted proxies related to portfolio securities during the most recent 12-month period ended June 30th is available without charge, (1) on the Securities and Exchange Commission’s (“SEC”) website at http://www.sec.gov; (2) upon request, by calling (toll-free) 1-866-513-5856; and (3) on the Trust’s website located at http://www.alpsfunds.com.
PORTFOLIO HOLDINGS
The Trust will file its complete schedule of portfolio holdings with the SEC for the first and third quarters of each fiscal year on Form N-Q. The Trust’s Form N-Q will be available (1) on the SEC’s website at http://www.sec.gov; (2) by calling (toll-free) 1-866-513-5856; (3) on the Trust’s website located at http://www.alpsfunds.com; and (4) for review and copying at the SEC’s Public Reference Room (“PRR”) in Washington D.C. Information regarding the operation of the PRR may be obtained by calling (toll-free) 1-800-732-0330.
| | | | |
 | | Alerian MLP ETF | | Table of Contents |
| | | | |
| | |
| | 1 |
Semi-Annual | May 31, 2013 | |
| | | | |
| | Alerian MLP ETF | | Performance Overview |
| | | | May 31, 2013 (Unaudited) |
Fund Description
The Alerian MLP ETF (the “Fund”) seeks investment results that correspond (before fees and expenses) generally to the price and yield performance of its underlying index, the Alerian MLP Infrastructure Index (the “Index”). The Shares of the Fund are listed and trade on the New York Stock Exchange (“NYSE”) Arca under the ticker symbol AMLP. The Fund generally will invest in all of the securities that comprise the Index in proportion to their weightings in the Index. The Fund began trading on August 25, 2010.
The Index is a rules based, modified capitalization weighted, float-adjusted index intended to give investors a means of tracking the overall performance of the United States energy infrastructure Master Limited Partnership (“MLP”) asset class. The Index is comprised of 25 energy infrastructure MLPs that earn a majority of their cash flow from the transportation and storage of energy commodities.
Performance Overview
The Alerian MLP ETF (AMLP) returned 15.8% on a total return basis from fiscal year end November 30, 2012 until May 31, 2013. Master Limited Partnerships (“MLPs”) benefitted from strong gains in early 2013 as uncertainty surrounding the fiscal cliff and tax changes during the latter part of 2012 ended. Distribution growth1 for the asset class continues to remain strong, anchored by organic growth projects and accretive acquisitions. The weighted average distribution growth2 on a year-over-year basis for the first quarter ending March 31, 2013 was 8.54%.
The International Energy Agency (IEA) notes that the global energy map is being redrawn by the resurgence in oil and gas production in the United States. According to the Energy Information Administration (EIA), domestic crude oil production has increased over 30% in the past four years and in the next decade, could overtake Saudi Arabia as the world’s largest oil producer. Nearly three-quarters of total drilling activity is being directed at oil-rich plays rather than natural gas. That said, natural gas production remains prolific. The United States has become one of the leading producers of natural gas and is expected to become a net exporter of natural gas over the next decade, a shift from a decade ago when the country expected its natural gas needs to be met via liquefied natural gas (LNG) imports. This surge in production has boosted the economy with investment capital inflows, the creation of thousands of jobs, and more importantly, the need for adequate energy infrastructure to move, store, and process such production.
To accommodate for this new energy renaissance, industry analysts note that the US could experience the biggest expansion and re-piping of energy infrastructure seen in more than 50 years. Of note, most of the large crude oil and natural gas interstate pipelines still in use today were built around World War II. Traditional midstream infrastructure MLPs are well positioned to take advantage of this expansion. In 2013 alone, industry analysts expect MLPs will invest $30 billion in infrastructure growth projects to address takeaway constraints. Such projects include converting existing natural gas pipelines to transport crude oil from Canada or the Bakken Shale in North Dakota as well as building ethane or natural gas liquid (NGL) pipelines from the Marcellus Shale in the Northeast to major NGL hubs such as Mont Belvieu, Texas. They also include investments in response to new energy trends, such as expanding rail terminal facilities because more crude oil is being transporting by railroad or building out
| | |
2 | | |
| | www.alpsfunds.com | 866.513.5856 |
| | | | |
| | Alerian MLP ETF | | Performance Overview |
| | | | May 31, 2013 (Unaudited) |
liquefied petroleum gas (LPG) export facilities because there is increased demand to ship cost-advantaged feedstock such as propane, butane, and isobutene to overseas customers. In addition, smaller organic projects include constructing pipeline interconnects, adding compression, or installing additional looping to improve connectivity.
Mergers and acquisitions (M&A) and initial public offering (IPO) activity has thrived over the past six months as the MLP structure has historically been an optimal way for corporations and private firms to monetize assets while simultaneously providing investors access to stable cash flow and distributions, in our view. During 2013, several companies with major infrastructure assets have announced intentions to form MLPs, many of which may come to market late 2013 or early 2014.
Significant changes in the North American production profile have created vast opportunities for MLPs to participate in the energy infrastructure build-out of North America. These opportunities, along with cash flow underpinned with toll-road business models and long-term contracts have made MLPs a compelling opportunity for investors seeking after-tax yield.
| 1 | Distribution Growth: The increase in a partnership’s quarterly or annual distribution. The MLP terminology for distributions is similar to the C corporation terminology for dividends. |
| 2 | Weighted average distribution growth: Calculated by multiplying the weight of each constituent in the AMZI at March 31, 2013 by the constituent’s year-over-year distribution growth percentage. |
Alerian MLP ETF Performance as of May 31, 2013
| | | | | | | | | | | | | | | | | | | | |
| | | 6 Month | | YTD | | 1 Year | | Since Inception
Annualized* |
NAV | | | | 9.84 | % | | | | 12.25 | % | | | | 17.61 | % | | | | 12.15 | % |
Market Price** | | | | 9.77 | % | | | | 12.32 | % | | | | 17.53 | % | | | | 12.15 | % |
Alerian MLP Infrastructure Index | | | | 15.79 | % | | | | 19.66 | % | | | | 29.23 | % | | | | 19.99 | % |
Total Expense Ratio (per the current prospectus) 4.85%.
Performance data quoted represents past performance. Past performance does not guarantee future results. Investment return and principal value of an investment will fluctuate so that an investor’s shares, when sold or redeemed, may be worth more or less than the original cost. Current performance data may be higher or lower than actual data quoted. For most current month-end performance data please visit www.alpsfunds.com.
NAV is an exchange-traded fund’s per-share value. The per-share dollar amount of the fund is derived by dividing the total value of all the securities in its portfolio, less any liabilities, by the number of fund shares outstanding. Market Price is the price at which a share can currently be traded in the market. Information detailing the number of days the Market Price of the Fund was greater than the Fund’s NAV and the number of days it was less than the Fund’s NAV can be obtained at www.alpsfunds.com.
| * | The Fund commenced Investment Operations on August 24, 2010 with an Inception Date, the first day of trading on the Exchange, of August 25, 2010. |
| ** | Market Price is based on the midpoint of the bid-ask spread at 4 p.m. ET and does not represent the returns an investor would receive if shares were traded at other times. |
The Alerian MLP Infrastructure Index is comprised of 25 midstream energy Master Limited Partnerships.
| | |
| | 3 |
Semi-Annual | May 31, 2013 | |
| | | | |
| | Alerian MLP ETF | | Performance Overview |
| | | | May 31, 2013 (Unaudited) |
| | |
Top 10 Holdings* as of May 31, 2013 |
| | | | |
Enterprise Products Partners LP | | | 9.5% | |
Kinder Morgan Energy Partners LP | | | 9.0% | |
Magellan Midstream Partners LP | | | 7.1% | |
Plains All American Pipeline LP | | | 7.0% | |
Energy Transfer Partners LP | | | 7.0% | |
MarkWest Energy Partners LP | | | 6.5% | |
| | | | |
Buckeye Partners LP | | | 5.0% | |
Enbridge Energy Partners LP | | | 4.7% | |
ONEOK Partners LP | | | 4.4% | |
Williams Partners LP | | | 4.3% | |
Percent of Total Investments in Top Ten Holdings | | | 64.5% | |
*% of Total Investments. | | | | |
Holdings are subject to change. | | | | |
Growth of $10k as of May 31, 2013
Comparison of Change in Value of $10,000 Investment in Alerian MLP ETF and Alerian MLP Infrastructure Index.
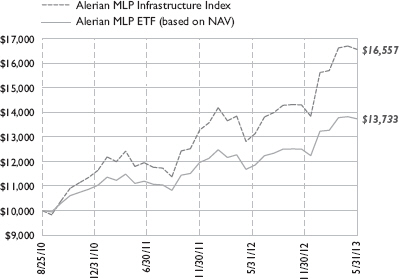
The chart above represents historical performance of a hypothetical investment of $10,000 in the Fund over the life of the Fund. Performance calculations are as of the end of each month. Past performance does not guarantee future results. This chart does not reflect the deduction of taxes that a shareholder would pay on Fund distributions or the redemption of Fund shares.
| | |
4 | | |
| | www.alpsfunds.com | 866.513.5856 |
| | | | |
| | Alerian MLP ETF | | Disclosure of Fund Expenses |
| | | | May 31, 2013 (Unaudited) |
Shareholder Expense Example: As a shareholder of the Fund, you incur two types of costs: (1) transaction costs which may include creation and redemption fees or brokerage charges, and (2) ongoing costs, including management fees and other Fund expenses. These examples are intended to help you understand your ongoing costs (in dollars) of investing in the Fund and to compare these costs with the ongoing costs of investing in other funds. It is based on an investment of $1,000 invested at the beginning of the (six month) period and held though May 31, 2013.
Actual Return: The first line of the table provides information about actual account values and actual expenses. You may use the information in this table, together with the amount you invested, to estimate the expenses that you incurred over the period. Simply divide your account value by $1,000 (for example, an $8,600 account value divided by $1,000 = 8.6), then multiply the result by the number in the first line under the heading entitled “Expenses Paid During the Period” to estimate the expenses attributable to your investment during this period.
Hypothetical 5% Return: The second line of the table provides information about hypothetical account values and hypothetical expenses based on the Fund’s actual expense ratio and an assumed rate of return of 5% per year before expenses, which is not the Fund’s actual return. The hypothetical account values and expenses may not be used to estimate the actual ending account balance or expenses you paid for the period. You may use this information to compare ongoing costs of investing in the Fund and other funds. To do so, compare this 5% hypothetical example with the 5% hypothetical examples that appear in the shareholder reports of the other funds.
The expenses shown in the table are meant to highlight ongoing Fund costs only and do not reflect any transaction costs, such as creation and redemption fees, or brokerage charges. Therefore, the second line is useful in comparing ongoing costs only, and will not help you determine the relative total costs of owning different funds. In addition, if these costs were included, your costs would have been higher.
| | | | | | | | | | | | | | | | | | | | |
| | | Beginning Account Value 12/01/12 | | Ending Account Value 5/31/13 | | Expense Ratio(a) | | Expenses Paid During the Period 12/1/12 - 5/31/13(b) |
Actual | | | $ | 1,000.00 | | | | $ | 1,098.40 | | | | | 0.85 | % | | | $ | 4.45 | |
Hypothetical (5% return before expenses) | | | $ | 1,000.00 | | | | $ | 1,020.69 | | | | | 0.85 | % | | | $ | 4.28 | |
| (a) | The Fund’s expense ratios have been based on the Fund’s most recent fiscal half-year expenses (excluding current and net deferred tax expenses/benefits and franchise tax expense). |
| (b) | Expenses are equal to the Fund’s annualized expense ratio multiplied by the average account value over the period, multiplied by the number of days in the most recent fiscal half year (182), then divided by 365. |
| | |
| | 5 |
Semi-Annual | May 31, 2013 | |
| | | | |
| | Alerian MLP ETF | | Schedule of Investments |
| | | | May 31, 2013 (Unaudited) |
| | | | | | | | |
| Security Description | | Shares | | | Value | |
| | |
Master Limited Partnerships Shares (107.47%) | | | | | | | | |
Gathering & Processing (21.92%) | | | | | | | | |
DCP Midstream Partners LP | | | 2,877,803 | | | $ | 137,558,983 | |
MarkWest Energy Partners LP | | | 6,602,267 | | | | 434,693,259 | |
PVR Partners LP | | | 4,959,710 | | | | 127,762,130 | |
Targa Resources Partners LP | | | 4,535,744 | | | | 210,957,453 | |
Western Gas Partners LP | | | 2,794,926 | | | | 164,425,497 | |
Williams Partners LP | | | 5,798,736 | | | | 289,298,939 | |
| | | | | | | 1,364,696,261 | |
Natural Gas Pipelines (36.68%) | | | | | | | | |
Atlas Pipeline Partners LP | | | 3,022,938 | | | | 112,483,523 | |
Boardwalk Pipeline Partners LP | | | 5,375,585 | | | | 159,117,316 | |
El Paso Pipeline Partners LP | | | 6,422,388 | | | | 263,895,923 | |
Energy Transfer Partners LP | | | 9,665,124 | | | | 469,821,678 | |
Enterprise Products Partners LP | | | 10,702,001 | | | | 635,591,839 | |
ONEOK Partners LP | | | 5,720,775 | | | | 296,107,314 | |
Regency Energy Partners LP | | | 7,444,806 | | | | 190,884,826 | |
Spectra Energy Partners LP | | | 2,091,062 | | | | 74,462,718 | |
TC Pipelines LP | | | 1,864,651 | | | | 81,242,844 | |
| | | | | | | 2,283,607,981 | |
Petroleum Transportation (48.87%) | | | | | | | | |
Access Midstream Partners LP | | | 3,259,940 | | | | 140,242,619 | |
Buckeye Partners LP | | | 5,063,731 | | | | 334,915,168 | |
Enbridge Energy Partners LP | | | 10,646,890 | | | | 314,189,724 | |
Genesis Energy LP | | | 3,455,895 | | | | 173,313,134 | |
Kinder Morgan Energy Partners LP | | | 7,236,146 | | | | 603,494,613 | |
Magellan Midstream Partners LP | | | 9,082,771 | | | | 472,213,264 | |
NuStar Energy LP | | | 3,340,623 | | | | 155,639,626 | |
Plains All American Pipeline LP | | | 8,377,435 | | | | 470,644,298 | |
Sunoco Logistics Partners LP | | | 3,596,936 | | | | 217,758,506 | |
Tesoro Logistics LP | | | 2,577,819 | | | | 159,927,891 | |
| | | | | | | 3,042,338,843 | |
Total Master Limited Partnerships Shares (Cost $5,412,318,250) | | | | | | | 6,690,643,085 | |
| | |
6 | | |
| | www.alpsfunds.com | 866.513.5856 |
| | | | |
| | Alerian MLP ETF | | Schedule of Investments |
| | | | May 31, 2013 (Unaudited) |
| | | | | | | | | | |
| Security Description | | 7 Day Yield | | Shares | | | Value | |
| | | |
Short Term Investments (0.09%) | | | | | | | | | | |
Dreyfus Treasury Prime Cash Management, Institutional Class | | 0.000%(a) | | | 5,465,592 | | | $ | 5,465,592 | |
| | | |
Total Short Term Investments
(Cost $5,465,592) | | | | | 5,465,592 | | | | | |
| | | |
Total Investments (107.56%)
(Cost $5,417,783,842) | | | | | | | | | 6,696,108,677 | |
Net Liabilities Less Other Assets (-7.56%) | | | | | | | (470,338,677) | |
Net Assets (100.00%) | | | | | | | | $ | 6,225,770,000 | |
| | | | | | | | | | |
| | | | | | | | | | | |
Common Abbreviations:
LP - Limited Partnerships.
See Notes to Financial Statements.
| | |
| | 7 |
Semi-Annual | May 31, 2013 | |
| | | | |
| | Alerian MLP ETF | | Statement of Assets & Liabilities |
| | | | May 31, 2013 (Unaudited) |
| | | | |
Assets: | | | | |
Investments, at value | | $ | 6,696,108,677 | |
Cash | | | 127,765 | |
Receivable for securities sold | | | 35,035,397 | |
Receivable for shares sold | | | 55,512 | |
Income tax receivable | | | 5,983,791 | |
Total Assets | | | 6,737,311,142 | |
| |
Liabilities: | | | | |
Payable for investments purchased | | | 35,239,174 | |
Franchise tax payable | | | 668,106 | |
Deferred tax liability | | | 471,158,916 | |
Payable to advisor | | | 4,474,946 | |
Total Liabilities | | | 511,541,142 | |
Net Assets | | $ | 6,225,770,000 | |
| | | | | |
| |
Net Assets Consist Of: | | | | |
Paid-in capital | | $ | 5,448,576,726 | |
Distributions in excess of net investment loss, net of income taxes | | | (38,218,989 | ) |
Accumulated net realized gain on investments, net of income taxes | | | 15,563,149 | |
Net unrealized appreciation on investments, net of income taxes | | | 799,849,114 | |
Net Assets | | $ | 6,225,770,000 | |
| | | | | |
| |
Investments, At Cost | | $ | 5,417,783,842 | |
| |
Pricing Of Shares | | | | |
Net Assets | | $ | 6,225,770,000 | |
Shares of beneficial interest outstanding (Unlimited number of shares authorized, par value $0.01 per share) | | | 357,728,958 | |
Net Asset Value, offering and redemption price per share | | $ | 17.40 | |
See Notes to Financial Statements.
| | |
8 | | |
| | www.alpsfunds.com | 866.513.5856 |
| | | | |
| | Alerian MLP ETF | | Statement of Operations |
| | | | For the Six Months Ended May 31, 2013 (Unaudited) |
| | | | |
Investment Income: | | | | |
Distributions from master limited partnerships | | $ | 171,482,671 | |
Less return of capital distributions | | | (171,482,671 | ) |
Total Investment Income | | | – | |
| |
Expenses: | | | | |
Franchise tax expense | | | 734,808 | |
Investment advisory fee | | | 22,577,176 | |
Total Expenses | | | 23,311,984 | |
Net Investment Loss, before Income Taxes | | | (23,311,984 | ) |
Deferred income tax benefit | | | 8,728,092 | |
Net Investment Loss | | | (14,583,892 | ) |
| |
Realized and Unrealized Gain/(Loss): | | | | |
Net realized loss on investments, before income taxes | | | (8,810,066 | ) |
Deferred income tax benefit | | | 3,298,521 | |
Net realized loss on investments | | | (5,511,545 | ) |
| |
Net change in unrealized appreciation on investments, before income taxes | | | 802,242,283 | |
Deferred income tax expense | | | (300,362,444 | ) |
Net change in unrealized appreciation on investments | | | 501,879,839 | |
Net Realized and Unrealized Gain | | | 496,368,294 | |
Net Increase in Net Assets from Operations | | $ | 481,784,402 | |
| | | | | |
See Notes to Financial Statements.
| | |
| | 9 |
Semi-Annual | May 31, 2013 | |
| | | | |
| | Alerian MLP ETF | | Statements of Changes in Net Assets |
| | | | |
| | | | | | | | |
| | | For the Six Months Ended May 31, 2013 (Unaudited) | | | For the Year Ended November 30, 2012 | |
Operations: | | | | | | | | |
Net investment loss | | $ | (14,583,892 | ) | | $ | (17,666,906 | ) |
Net realized gain/(loss) on investments | | | (5,511,545 | ) | | | 17,955,611 | |
Net change in unrealized appreciation on investments | | | 501,879,839 | | | | 216,274,212 | |
Net increase in net assets resulting from operations | | | 481,784,402 | | | | 216,562,917 | |
| | |
Distributions To Shareholders: | | | | | | | | |
From net realized gains | | | – | | | | (660,911 | ) |
Tax return of capital | | | (169,613,586 | ) | | | (209,317,584 | ) |
Total distributions | | | (169,613,586 | ) | | | (209,978,495 | ) |
| | |
Share Transactions: | | | | | | | | |
Proceeds from sale of shares | | | 1,537,138,103 | | | | 2,788,664,270 | |
Issued to shareholders in reinvestment distributions | | | 277,565 | | | | – | |
Cost of shares redeemed | | | (90,631,874 | ) | | | (41,820,413 | ) |
Net increase from share transactions | | | 1,446,783,794 | | | | 2,746,843,857 | |
Net increase in net assets | | | 1,758,954,610 | | | | 2,753,428,279 | |
| | |
Net Assets: | | | | | | | | |
Beginning of period | | | 4,466,815,390 | | | | 1,713,387,111 | |
End of period* | | $ | 6,225,770,000 | | | $ | 4,466,815,390 | |
| | | | | | | | | |
| | |
*Including distributions in excess of net investment loss, net of income taxes of: | | $ | (38,218,989 | ) | | $ | (23,635,097 | ) |
| | |
Other Information: | | | | | | | | |
Share Transactions: | | | | | | | | |
Beginning shares | | | 273,740,266 | | | | 107,276,019 | |
Shares sold | | | 89,122,607 | | | | 169,164,247 | |
Distributions reinvested | | | 16,085 | | | | – | |
Shares redeemed | | | (5,150,000 | ) | | | (2,700,000 | ) |
Shares outstanding, end of period | | | 357,728,958 | | | | 273,740,266 | |
| | | | | | | | | |
See Notes to Financial Statements.
| | |
10 | | |
| | www.alpsfunds.com | 866.513.5856 |
Intentionally Left Blank
| | | | |
| | Alerian MLP ETF | | |
| | | | |
|
|
| Net Asset Value, Beginning of Period |
|
| Income From Operations: |
| Net investment loss(b) |
| Net realized and unrealized gain on investments |
| Total from Investment Operations |
|
| Less Distributions: |
| From net realized gains |
| From tax return of capital |
| Total Distributions |
| Net Increase/(Decrease) In Net Asset Value |
| Net Asset Value, End Of Period |
| |
| Total Return(c) |
|
| Ratios/Supplemental Data: |
| Net assets, end of period (in 000s) |
|
| Ratios To Average Net Assets: |
Ratio of expenses (including net current and deferred tax expenses/benefits) to average net assets(e) |
Ratio of expenses (including current and deferred tax expenses/benefits) to average net assets(f) |
Ratio of expenses (excluding net current and deferred tax expenses/benefits and franchise tax expense) to average net assets |
Ratio of net investment loss (including deferred tax expenses/benefits) to average net assets |
Ratio of net investment loss (excluding deferred tax expenses/benefits and franchise tax expense) to average net assets |
| Portfolio Turnover Rate(g) |
| (a) | Effective March 7, 2011 the Board approved changing the fiscal year end of the Fund from December 31 to November 30. |
| (b) | Calculated using average shares outstanding. |
| (c) | Total return is calculated assuming an initial investment made at the net asset value at the beginning of the period and redemption at the net asset value on the last day of the period, and assuming all distributions are reinvested at actual reinvestment prices. Total return calculated for a period of less than one year is not annualized. |
| (e) | Includes amount of current and deferred taxes/benefits for all components of the Statement of Operations. |
| (f) | Includes amount of current and deferred tax benefit associated with net investment income. |
| (g) | Portfolio turnover is not annualized and does not include securities received or delivered from processing creations or redemptions. |
| (h) | Less than (0.005) per share. |
See Notes to Financial Statements.
| | |
12 | | |
| | www.alpsfunds.com | 866.513.5856 |
| | | | |
| | | | Financial Highlights |
| | | | For a Share Outstanding Throughout the Periods Presented |
| | | | | | | | | | | | | | | | | | |
For the Six Months Ended May 31, 2013 (Unaudited) | | For the Year Ended
November 30, 2012 | | For the Period January 1, 2011 to November 30, 2011(a) | | For the Period August 25, 2010 (Inception) to December 31, 2010 |
| | | $16.32 | | | | $ | 15.97 | | | | $ | 16.05 | | | | $ | 15.00 | |
| | | |
| | | | | | | | | | | | | | | | | | | |
| | | (0.05) | | | | | (0.09 | ) | | | | (0.08 | ) | | | | (0.03 | ) |
| | | 1.66 | | | | | 1.44 | | | | | 1.00 | | | | | 1.33 | |
| | | 1.61 | | | | | 1.35 | | | | | 0.92 | | | | | 1.30 | |
| | | |
| | | | | | | | | | | | | | | | | | | |
| | | – | | | | | (0.00 | )(b)(h) | | | | (0.14 | )(b) | | | | – | |
| | | (0.53) | | | | | (1.00 | ) | | | | (0.86 | ) | | | | (0.25 | ) |
| | | (0.53) | | | | | (1.00 | ) | | | | (1.00 | ) | | | | (0.25 | ) |
| | | 1.08 | | | | | 0.35 | | | | | (0.08 | ) | | | | 1.05 | |
| | | $17.40 | | | | $ | 16.32 | | | | $ | 15.97 | | | | $ | 16.05 | |
| | | | | | | | | | | | | | | | | | | |
| | | 9.84% | | | | | 8.62 | % | | | | 5.93 | % | | | | 8.66 | % |
| | | |
| | | | | | | | | | | | | | | | | | | |
| | | $6,225,770 | | | | $ | 4,466,815 | | | | $ | 1,713,387 | | | | $ | 611,467 | |
| | | |
| | | | | | | | | | | | | | | | | | | |
| | | 11.73% | | | | | 4.85 | % | | | | 4.86 | %(d) | | | | 13.56 | %(d) |
| | | 0.55% | | | | | 0.54 | % | | | | 0.53 | %(d) | | | | 0.52 | %(d) |
| |
|
0.85% |
| | | | 0.85 | % | | | | 0.85 | %(d) | | | | 0.85 | %(d) |
| | | (0.55%) | | | | | (0.54 | %) | | | | (0.53 | %)(d) | | | | (0.52 | %)(d) |
| | | (0.85%) | | | | | (0.85 | %) | | | | (0.85 | %)(d) | | | | (0.85 | %)(d) |
| | | 9% | | | | | 12 | % | | | | 10 | % | | | | 12 | % |
| | |
| | 13 |
Semi-Annual | May 31, 2013 | |
| | | | |
| | Alerian MLP ETF | | Notes to Financial Statements |
| | | | May 31, 2013 (Unaudited) |
1. Organization
The ALPS ETF Trust (the “Trust”), a Delaware statutory trust, is an open-end management investment company registered under the Investment Company Act of 1940, as amended (the “1940 Act”). As of May 31, 2013, the Trust consists of thirteen separate portfolios. Each portfolio represents a separate series of the Trust. This report pertains to the Alerian MLP ETF (the “Fund”), which commenced investment operations on August 24, 2010 and began trading on the exchange on August 25, 2010. The investment objective of the Fund is to seek investment results that correspond generally to the price and yield performance (before the Fund’s fees and expenses) of its underlying index, the Alerian MLP Infrastructure Index (the “Index”).
The Fund’s Shares (“Shares”) are listed on the New York Stock Exchange (“NYSE”) Arca. The Fund issues and redeems Shares at Net Asset Value (“NAV”), in blocks of 50,000 Shares, each of which is called a “Creation Unit.” Creation Units are issued and redeemed principally in-kind for securities included in a specified index. Except when aggregated in Creation Units, Shares are not redeemable securities of the Fund.
2. Significant Accounting Policies
A. Use of Estimates
The following is a summary of significant accounting policies consistently followed by the Fund in the preparation of the financial statements. The accompanying financial statements were prepared in accordance with accounting principles generally accepted in the United States of America (“U.S. GAAP”). The preparation of financial statements in conformity with U.S. GAAP requires management to make certain estimates and assumptions that affect the reported amounts of assets and liabilities and disclosures of contingent assets and liabilities at the date of the financial statements and the reported amounts of revenue and expenses during the period. Actual results could differ from those estimates.
B. Portfolio Valuation
The Fund’s NAV is determined daily, as of the close of regular trading on the NYSE, normally 4:00 p.m. Eastern time, on each day the NYSE is open for trading. The NAV is computed by dividing the value of all assets of the Fund (including accrued interest and dividends), less all liabilities (including accrued expenses and dividends declared but unpaid), by the total number of shares outstanding.
Portfolio securities listed on any exchange other than the National Association of Securities Dealer Automated Quotation (“NASDAQ”) exchange are valued at the last sale price on the business day as of which such value is being determined. If there has been no sale on such day, the securities are valued at the mean of the most recent bid and asked prices on such day. Securities traded on the NASDAQ are valued at the NASDAQ Official Closing Price as determined by NASDAQ. Short-term investments that mature in less than 60 days are valued at amortized cost, which approximates market value.
| | |
14 | | |
| | www.alpsfunds.com | 866.513.5856 |
| | | | |
| | Alerian MLP ETF | | Notes to Financial Statements |
| | | | May 31, 2013 (Unaudited) |
The Fund’s investments are valued at market value or, in the absence of market value with respect to any portfolio securities, at fair value according to procedures adopted by the Trust’s Board of Trustees (the “Board”). When market quotations are not readily available or when events occur that make established valuation methods unreliable, securities of the Fund may be valued in good faith by or under the direction of the Board. These securities generally include, but are not limited to, restricted securities (securities which may not be publicly sold without registration under the Securities Act of 1933) for which a pricing service is unable to provide a market price; securities whose trading has been formally suspended; a security whose market price is not available from a pre-established primary pricing source or the pricing source is not willing to provide a price; a security with respect to which an event has occurred that is most likely to materially affect the value of the security after the market has closed but before the calculation of the Fund’s NAV or make it difficult or impossible to obtain a reliable market quotation; or a security whose price, as provided by the pricing service, does not reflect the security’s “fair value” due to the security being de-listed from a national exchange or the security’s primary trading market is temporarily closed at a time when, under normal conditions, it would be open. As a general principle, the current “fair value” of a security would be the amount which the owner might reasonably expect to receive from the closing sale prices on the applicable exchange and fair value prices may not reflect the actual value of a security. A variety of factors may be considered in determining the fair value of such securities.
C. Securities Transactions and Investment Income
Securities transactions are recorded as of the trade date. Realized gains and losses from securities transactions are recorded on the highest cost basis. Dividend income is recorded on the ex-dividend date. Interest income, if any, is recorded on the accrual basis, including amortization of premiums and accretion of discounts.
D. Dividends and Distributions to Shareholders
The Fund intends to declare and make quarterly distributions, or as the Board may determine from time to time. Distributions of net realized capital gains earned by the Fund, if any, are distributed at least annually. Distributions from net investment income and capital gains are determined in accordance with income tax regulations, which may differ from U.S. GAAP. These differences are primarily due to differing treatments of income and gains on various investment securities held by the Fund, timing differences and differing characterization of distributions made by the Fund.
Distributions received from the Fund’s investments in Master Limited Partnerships (“MLPs”) generally are comprised of income and return of capital. The Fund records investment income and return of capital based on estimates made at the time such distributions are received. Such estimates are based on historical information available from each MLP and other industry sources. These estimates may subsequently be revised based on information received from MLPs after their tax reporting periods are concluded. For the six months ended May 31, 2013, the Fund distributed $169,613,586, of which 100% is anticipated to be characterized as return of capital from MLP distributions received.
| | |
| | 15 |
Semi-Annual | May 31, 2013 | |
| | | | |
| | Alerian MLP ETF | | Notes to Financial Statements |
| | | | May 31, 2013 (Unaudited) |
The Fund also expects that a portion of the distributions it receives from MLPs may be treated as a tax deferred return of capital, thus reducing the Fund’s current tax liability. Return of capital distributions are not taxable income to the shareholder, but reduce the investor’s tax basis in the investor’s Fund Shares. Such a reduction in tax basis will result in larger taxable gains and/or lower tax losses on a subsequent sale of Fund Shares. Shareholders who periodically receive the payment of dividends or other distributions consisting of a return of capital may be under the impression that they are receiving net profits from the Fund when, in fact, they are not. Shareholders should not assume that the source of the distributions is from the net profits of the Fund.
E. Federal Income Taxation and Tax Basis Information
The Fund is taxed as a regular C-corporation for federal income tax purposes. Currently, the maximum marginal regular federal income tax rate for a corporation is 35 percent. The Fund may be subject to a 20 percent federal alternative minimum tax on its federal alternative taxable income to the extent that its alternative minimum tax exceeds its regular federal income tax. This differs from most investment companies, which elect to be treated as “regulated investment companies” under the Code in order to avoid paying entity level income taxes. Under current law, the Fund is not eligible to elect treatment as a regulated investment company due to its investments primarily in MLPs invested in energy assets. As a result, the Fund will be obligated to pay applicable federal and state corporate income taxes on its taxable income as opposed to most other investment companies which are not so obligated. The Fund expects that a portion of the distributions it receives from MLPs may be treated as a tax-deferred return of capital, thus reducing the Fund’s current tax liability. However, the amount of taxes currently paid by the Fund will vary depending on the amount of income and gains derived from investments and/or sales of MLP interests and such taxes will reduce your return from an investment in the Fund.
Cash distributions from MLPs to the Fund that exceed such Fund’s allocable share of such MLP’s net taxable income are considered a tax-deferred return of capital that will reduce the Fund’s adjusted tax basis in the equity securities of the MLP. These reductions in such Fund’s adjusted tax basis in the MLP equity securities will increase the amount of gain (or decrease the amount of loss) recognized by the Fund on a subsequent sale of the securities. The Fund will accrue deferred income taxes for any future tax liability associated with (i) that portion of MLP distributions considered to be a tax-deferred return of capital as well as (ii) capital appreciation of its investments. Upon the sale of an MLP security, the Fund may be liable for previously deferred taxes. The Fund will rely to some extent on information provided by the MLPs, which is not necessarily timely, to estimate deferred tax liability for purposes of financial statement reporting and determining the NAV. From time to time, ALPS Advisors, Inc. will modify the estimates or assumptions related to the Fund’s deferred tax liability as new information becomes available. The Fund will generally compute deferred income taxes based on the marginal regular federal income tax rate applicable to corporations and an assumed rate attributable to state taxes.
The Fund recognizes interest and penalties related to unrecognized tax benefits within the income tax expense line in the accompanying statement of operations. Accrued interest and penalties are included within the related tax liability line in the balance sheet.
| | |
16 | | |
| | www.alpsfunds.com | 866.513.5856 |
| | | | |
| | Alerian MLP ETF | | Notes to Financial Statements |
| | | | May 31, 2013 (Unaudited) |
Since the Fund will be subject to taxation on its taxable income, the NAV of Fund shares will also be reduced by the accrual of any deferred tax liabilities. The Index however is calculated without any adjustments for taxes. As a result, the Fund’s after tax performance could differ significantly from the Index even if the pretax performance of the Fund and the performance of the Index are closely correlated.
The Fund’s income tax expense/(benefit) consists of the following:
| | | | | | | | | | | | |
| | | | | | May 31, 2013 | | | | |
| | | Current | | | Deferred | | | Total | |
Federal | | $ | – | | | $ | 268,860,272 | | | $ | 268,860,272 | |
State | | | – | | | | 19,475,559 | | | | 19,475,559 | |
Net tax expense (benefit) | | $ | – | | | $ | 288,335,831 | | | $ | 288,335,831 | |
| | | | | | | | | | | | | |
| |
| | | November 30, 2012 | |
| | | Current | | | Deferred | | | Total | |
Federal | | $ | (5,267,314 | ) | | $ | 126,124,904 | | | $ | 120,857,590 | |
State | | | (99,221 | ) | | | 8,508,506 | | | | 8,409,285 | |
Net tax expense (benefit) | | $ | (5,366,535 | ) | | $ | 134,633,410 | | | $ | 129,266,875 | |
| | | | | | | | | | | | | |
Deferred income taxes reflect the net tax effect of temporary differences between the carrying amount of assets and liabilities for financial reporting and tax purposes.
Components of the Fund’s deferred tax assets and liabilities are as follows:
| | | | | | | | |
| | | As of May 31, 2013 | | | As of
November 30, 2012 | |
Deferred tax assets: | | | | | | | | |
Accrued Franchise Taxes | | $ | 230,678 | | | $ | 161,051 | |
Federal capital loss carryforward | | | 2,384,251 | | | | 28,590,449 | |
Federal net operating loss carry forward | | | 150,447,782 | | | | | |
Income recognized from MLP investments | | | 12,841,459 | | | | 12,519,780 | |
Less Deferred tax liabilities: | | | | | | | | |
Net unrealized gain on investment securities | | | (599,056,398 | ) | | | (205,563,236 | ) |
State taxes, net of federal benefit | | | (38,006,688 | ) | | | (18,531,129 | ) |
Total Net Deferred tax assets/(liabilities) | | $ | (471,158,916 | ) | | $ | (182,823,085 | ) |
| | | | | | | | | |
| | |
| | 17 |
Semi-Annual | May 31, 2013 | |
| | | | |
| | Alerian MLP ETF | | Notes to Financial Statements |
| | | | May 31, 2013 (Unaudited) |
As of May 31, 2013, the Fund had net operating loss carryforwards for federal income tax purposes, which may be carried forward for 20 years as follows:
| | | | | | | | |
| | | Year-Ended | | Amount | | | Expiration |
Federal | | 11/30/2012 | | $ | 81,686,998 | | | 11/30/2032 |
| | | 11/30/2013 | | $ | 341,767,120 | | | 11/30/2033 |
Total | | | | $ | 423,454,118 | | | |
| | | | | | | | | |
Although the Fund currently has a net deferred tax liability, it reviews the recoverability of its deferred tax assets based upon the weight of available evidence. When assessing the recoverability of its deferred tax assets, significant weight was given to the effects of potential future realized and unrealized gains on investments and the period over which these deferred tax assets can be realized. Currently, any capital losses that may be generated by the Fund in the future are eligible to be carried back up to three years and can be carried forward for five years to offset capital gains recognized by the fund in those years. For Federal Tax purposes, net operating losses that may be generated by the Fund in the future are eligible to be carried back up to two years and can be carried forward for 20 years to offset income generated by the Fund in those years.
Based upon the Fund’s assessment, it has determined that it is more likely than not that its deferred tax assets will be realized through future taxable income of the appropriate character. Accordingly, no valuation allowance has been established for the Fund’s deferred tax assets. The Fund will continue to assess the need for a valuation allowance in the future. Significant declines in the fair value of its portfolio of investments may change the Fund’s assessment of the recoverability of these assets and may result in the recording of a valuation allowance against all or a portion of the Fund’s gross deferred tax assets.
Total income tax benefit (current and deferred) differs from the amount computed by applying the federal statutory income tax rate of 35% to net investment and realized and unrealized gain/(losses) on investment before taxes as follows:
| | | | | | | | |
| | | Six Months Ended May 31, 2013 | | | Year Ended November 30, 2012 | |
Income tax expense at statutory rate | | $ | 268,860,272 | | | $ | 121,040,427 | |
State income taxes (net of federal benefit) | | | 19,475,559 | | | | 8,126,136 | |
Change in estimated state deferred rate | | | – | | | | (100,501 | ) |
Other | | | – | | | | 200,813 | |
Net income tax expense/(benefit) | | $ | 288,335,831 | | | $ | 129,266,875 | |
| | | | | | | | | |
| | |
18 | | |
| | www.alpsfunds.com | 866.513.5856 |
| | | | |
| | Alerian MLP ETF | | Notes to Financial Statements |
| | | | May 31, 2013 (Unaudited) |
The following is a tabular reconciliation of the total amounts of unrecognized tax benefits:
| | | | | | | | |
| | | December 1, 2012 to May 31, 2013 | | | December 1, 2011 to November 30, 2012 | |
Unrecognized tax benefit – Beginning | | $ | – | | | $ | – | |
Gross increases – tax positions in prior period | | | – | | | | – | |
Gross decreases – tax positions in prior period | | | – | | | | – | |
Gross increases – tax positions in current period | | | – | | | | – | |
Settlement | | | – | | | | – | |
Lapse of statute of limitations | | | – | | | | – | |
Unrecognized tax benefit – Ending | | $ | – | | | $ | – | |
| | | | | | | | | |
The Fund recognizes interest accured related to unrecognized tax benefits and penalties as income tax expense.
For the period from inception to May 31, 2013, the Fund had no accrued penalties or interest.
The Fund recognizes the tax benefits of uncertain tax positions only where the position is “more likely than not” to be sustained assuming examination by tax authorities. Management has analyzed the Fund’s tax positions, and has concluded that no liability for unrecognized tax benefits should be recorded related to uncertain tax positions taken on U.S. tax returns and state tax returns filed since inception of the fund. No U.S. federal or state income tax returns are currently under examination. The tax period ended November 30, 2012 remains subject to examination by tax authorities in the United States. Due to the nature of the Fund’s investments, the Fund may be required to file income tax returns in several states. The Fund is not aware of any tax positions for which it is reasonably possible that the total amounts of unrecognized tax benefits will change materially in the next 12 months.
The adjusted cost basis of investment and gross unrealized appreciation and depreciation of investments for federal income tax purposes were as follows:
| | | | |
| | | As of May 31, 2013 | |
Cost basis of investments | | $ | 4,993,710,218 | |
| | | | | |
Gross unrealized appreciation – investment securities | | $ | 1,744,256,824 | |
Gross unrealized depreciation – investment securities | | | (41,858,365 | ) |
Net unrealized appreciation – investment securities | | $ | 1,702,398,459 | |
| | | | | |
| | |
| | 19 |
Semi-Annual | May 31, 2013 | |
| | | | |
| | Alerian MLP ETF | | Notes to Financial Statements |
| | | | May 31, 2013 (Unaudited) |
The difference between cost amounts for financial statement purposes is due primarily to the recognition of pass-through income from the Fund’s investments in master limited partnerships and wash sale adjustments.
F. Fair Value Measurements
The Fund discloses the classification of its fair value measurements following a three-tier hierarchy based on the inputs used to measure fair value. Inputs refer broadly to the assumptions that market participants would use in pricing the asset or liability, including assumptions about risk. Inputs may be observable or unobservable. Observable inputs reflect the assumptions market participants would use in pricing the asset or liability that are developed based on market data obtained from sources independent of the reporting entity. Unobservable inputs reflect the reporting entity’s own assumptions about the assumptions market participants would use in pricing the asset or liability that are developed based on the best information available.
Various inputs are used in determining the value of the Fund’s investments as of the end of the reporting period. When inputs used fall into different levels of the fair value hierarchy, the level in the hierarchy within which the fair value measurement falls is determined based on the lowest level input that is significant to the fair value measurement in its entirety. The designated input levels are not necessarily an indication of the risk or liquidity associated with these investments. These inputs are categorized in the following hierarchy under applicable financial accounting standards:
| | |
Level 1 – | | Unadjusted quoted prices in active markets for identical investments, unrestricted assets or liabilities that a Fund has the ability to access at the measurement date; |
| |
Level 2 – | | Quoted prices which are not active, quoted prices for similar assets or liabilities in active markets or inputs other than quoted prices that are observable (either directly or indirectly) for substantially the full term of the asset or liability; and |
| |
Level 3 – | | Significant unobservable prices or inputs (including the Fund’s own assumptions in determining the fair value of investments) where there is little or no market activity for the asset or liability at the measurement date. |
| | | | | | | | | | | | | | | | |
Investments in Securities at Value* | | Level 1 -
Unadjusted
Quoted Prices | | | Level 2 - Other Significant Observable Inputs | | | Level 3 - Significant Unobservable Inputs | | | Total | |
Master Limited Partnerships Shares | | $ | 6,690,643,085 | | | $ | – | | | $ | – | | | $ | 6,690,643,085 | |
Short Term Investments | | | 5,465,592 | | | | – | | | | – | | | | 5,465,592 | |
TOTAL | | $ | 6,696,108,677 | | | $ | – | | | $ | – | | | $ | 6,696,108,677 | |
| | | | | | | | | | | | | | | | | |
* For detailed descriptions of sectors, see the accompanying Schedule of Investments.
| | |
20 | | |
| | www.alpsfunds.com | 866.513.5856 |
| | | | |
| | Alerian MLP ETF | | Notes to Financial Statements |
| | | | May 31, 2013 (Unaudited) |
The Fund recognizes transfers between levels as of the end of the period. For the six months ended May 31, 2013, the Fund did not have any transfers between Level 1 and Level 2 securities. The Fund did not have any securities which used significant unobservable inputs (Level 3) in determining fair value.
3. Investment Advisory Fee and Other Affiliated Transactions
ALPS Advisors, Inc. (the “Investment Adviser”) acts as the Fund’s investment adviser pursuant to an advisory agreement with the Trust on behalf of the Fund (the “Advisory Agreement”). Pursuant to the Advisory Agreement, the Fund pays the Investment Adviser a unitary fee for the services and facilities it provides payable on a monthly basis at the annual rate of 0.85% of the Fund’s average daily net assets. From time to time, the Investment Adviser may waive all or a portion of its fee.
Out of the unitary management fee, the Investment Adviser pays substantially all expenses of the Fund, including the fee of the Index Provider, and the cost of transfer agency, custody, fund administration, legal, audit, trustees and other services, other than taxes, interest expenses, distribution fees or expenses, brokerage expenses, and extraordinary expenses such as litigation not incurred in the ordinary course of the Fund’s business.
ALPS Fund Services, Inc. (“ALPS”), an affiliate of the Investment Adviser, is the administrator of the Fund.
The Bank of New York Mellon is the custodian fund accounting and transfer agent for the Fund.
Each Trustee who is not an officer or employee of the Investment Adviser, any sub-adviser or any of their affiliates (“Independent Trustees”) is paid a quarterly retainer of $5,000, $3,750 for each regularly scheduled Board meeting attended and $1,500 for each special meeting held outside of regularly scheduled meetings.
4. Purchases and Sales of Securities
For the six months ended May 31, 2013, the cost of purchases and proceeds from sales of investment securities, excluding short-term investments and in-kind transactions, were as follows:
| | |
Purchases | | Sales |
$ 510,589,281 | | $ 620,123,091 |
| | |
| | 21 |
Semi-Annual | May 31, 2013 | |
| | | | |
| | Alerian MLP ETF | | Notes to Financial Statements |
| | | | May 31, 2013 (Unaudited) |
For the six months ended May 31, 2013, the cost of in-kind purchases and proceeds from in-kind sales were as follows:
| | |
Purchases | | Sales |
$ 1,538,461,369 | | $ – |
5. Capital Share Transactions
Shares are created and redeemed by the Fund only in Creation Unit size aggregations of 50,000. Only broker-dealers or large institutional investors with creation and redemption agreements called Authorized Participants (“AP”) are permitted to purchase or redeem Creation Units from the Fund. Such transactions are generally permitted on an in-kind basis, with a balancing cash component to equate the transaction to the net asset value per unit of the Fund on the transaction date. Cash may be substituted equivalent to the value of certain securities generally when they are not available in sufficient quantity for delivery, not eligible for trading by the AP or as a result of other market circumstances.
6. Master Limited Partnerships
MLPs are publicly traded partnerships engaged in the transportation, storage and processing of minerals and natural resources. By confining their operations to these specific activities, their interests, or units, are able to trade on public securities exchanges exactly like the shares of a corporation, without entity level taxation. Of the seventy MLPs eligible for inclusion in the Index, approximately two-thirds trade on the NYSE and the rest trade on the NASDAQ. To qualify as a MLP and to not be taxed as a corporation, a partnership must receive at least 90% of its income from qualifying sources as set forth in Section 7704(d) of the Internal Revenue Code of 1986, as amended (the “Code”). These qualifying sources include natural resource based activities such as the processing, transportation and storage of mineral or natural resources. MLPs generally have two classes of owners, the general partner and limited partners. The general partner of an MLP is typically owned by a major energy company, an investment fund, the direct management of the MLP, or is an entity owned by one or more of such parties. The general partner may be structured as a private or publicly traded corporation or other entity. The general partner typically controls the operations and management of the MLP through an up to 2% equity interest in the MLP plus, in many cases, ownership of common units and subordinated units. Limited partners typically own the remainder of the partnership, through ownership of common units, and have a limited role in the partnership’s operations and management. MLPs are typically structured such that common units and general partner interests have first priority to receive quarterly cash distributions up to an established minimum amount (“minimum quarterly distributions” or “MQD”). Common and general partner interests also accrue arrearages in distributions to the extent the MQD is not paid. Once common and general partner interests have been paid, subordinated units receive distributions of up to the MQD; however, subordinated units do not accrue arrearages. Distributable cash in excess of the MQD is paid to both common and subordinated units and is distributed to both common and subordinated units generally on a pro rata basis. The general partner is also eligible to receive incentive distributions if the general partner operates the business in a manner which results in distributions paid
| | |
22 | | |
| | www.alpsfunds.com | 866.513.5856 |
| | | | |
| | Alerian MLP ETF | | Notes to Financial Statements |
| | | | May 31, 2013 (Unaudited) |
per common unit surpassing specified target levels. As the general partner increases cash distributions to the limited partners, the general partner receives an increasingly higher percentage of the incremental cash distributions.
7. Indemnifications
Under the Trust’s organizational documents, its Officers and Trustees are indemnified against certain liability arising out of the performance of their duties to the Trust. Additionally, in the normal course of business, the Trust enters into contracts with service providers that contain general indemnification clauses. The Trust’s maximum exposure under these arrangements is unknown, as this would involve future claims that may be made again the Trust that have not yet occurred.
| | |
| | 23 |
Semi-Annual | May 31, 2013 | |
| | | | |
| | Alerian MLP ETF | | Additional Information |
| | | | May 31, 2013 (Unaudited) |
Proxy Voting Policies And Procedures
A description of the Fund’s proxy voting policies and procedures used in determining how to vote for proxies and information regarding how the Fund voted proxies related to portfolio securities during the most recent 12-month period ended June 30th is available without charge, (1) on the Securities and Exchange Commission’s (“SEC”) website at http://www.sec. gov; (2) upon request, by calling (toll free) 1-866-513-5856; and (3) on the Trust’s website located at http://www.alpsfunds.com.
Portfolio Holdings
The Trust will file its complete schedule of portfolio holdings with the SEC for the first and third quarters of each fiscal year on Form N-Q. The Trust’s Form N-Q will be available (1) on the SEC’s website at http://www.sec.gov; (2) by calling (toll free) 1-866-513-5856; (3) on the Trust’s website located at http://www.alpsfunds.com; and (4) for review and copying at the SEC’s Public Reference Room (“PRR”) in Washington D.C. Information regarding the operation of the PRR may be obtained by calling (toll free) 1-800-732-0330.
| | |
24 | | |
| | www.alpsfunds.com | 866.513.5856 |

| | |
ALPS SECTOR DIVIDEND DOGS ETF | | Performance Overview |
| | | May 31, 2013 (Unaudited) |
Investment Objective
The Fund seeks investment results that replicate as closely as possible, before fees and expenses, the performance of the S-Network Sector Dividend Dogs Index (the “Underlying Index”). The Shares of the Fund are listed and trade on the New York Stock Exchange (“NYSE”) Arca under the ticker symbol SDOG. The Fund generally will invest in all of the securities that comprise the Index in proportion to their weightings in the Index. The Fund began trading on June 29, 2012.
The Index is a rules based index intended to give investors a means of tracking the overall performance of the highest dividend paying stocks (i.e. “Dividend Dogs”) in the S&P 500® on a sector-by-sector basis. “Dividend Dogs” refers to the five stocks in each of the ten Global Industry Classification Standard (“GICS”) sectors that make up the S&P 500® which offer the highest dividend yields.
Performance Overview
For the 6 month period ended May 31, 2013 ALPS Sector Dividend Dogs ETF (NYSE: SDOG) generated a total return of 18.53% in-line with the Fund’s Index, net of fees, which returned 18.86% and outperforming the S&P 500 which returned 16.43% for the same period.
The trailing twelve month yield for the Fund’s constituents as of 05/31/2013 was 4.33% vs. 2.03% on the S&P 500.
Compared to the S&P 500 the Fund had a negative impact from sector allocation of 1.40% which was largely driven by the relative overweight in defensive sectors of Utilities and Telecommunication Services. However, the Fund’s security selection and interaction using the Sector Dividend Dogs approach had a very positive impact of 3.50% more than off-setting the negative impact from sector allocation.
The best performing stocks for the period were Best Buy Co., Inc. (Ticker: BBY), which increased 139.94%; Avon Products, Inc. (Ticker: AVP), which increased 69.90%; and H&R Block, Inc. (Ticker: HRB), which increased 65.29%. The worst performing stocks were Cliffs Natural Resources, Inc. (Ticker: CLF), which decreased 48.34%; Frontier Communications Corp. (Ticker: FTR), which decreased 9.83%; and Century Link, Inc. (Ticker: CTL), which decreased 7.60%.
Looking forward we believe the Fund’s strategy of annually selecting the five highest yielding securities in each of the ten sectors in the S&P 500 will provide high yield relative to the S&P 500, potential for market participation in all economic cycles through equal sector weighting, and a deep value portfolio of securities as identified through high yield relative to their sector peers.
| | |
| | 1 |
Semi-Annual | May 31, 2013 | |
| | |
ALPS SECTOR DIVIDEND DOGS ETF | | Performance Overview |
| | | May 31, 2013 (Unaudited) |
Average Annual Total Returns as of May 31, 2013
| | | | | | |
| | | 6 Months | | Year-to-Date | | Since Inception* |
|
NAV | | 18.53% | | 18.12% | | 28.00% |
Market Price** | | 18.59% | | 18.18% | | 28.20% |
|
S-Network Sector Dividend Dogs Index*** | | 18.86% | | 18.38% | | 28.55% |
|
S&P 500® Index**** | | 16.43% | | 15.37% | | 25.29% |
|
Total Expense Ratio (per the current prospectus) 0.40%.
Performance data quoted represents past performance. Past performance does not guarantee future results. Investment return and principal value of an investment will fluctuate so that an investor’s shares, when sold or redeemed, may be worth more or less than the original cost. Current performance data may be higher or lower than actual data quoted. For most current month-end performance data please visit www.alpsfunds.com.
NAV is an exchange-traded fund’s per-share value. The per-share dollar amount of the fund is derived by dividing the total value of all the securities in its portfolio, less any liabilities, by the number of fund shares outstanding. Market Price is the price at which a share can currently be traded in the market. Information detailing the number of days the Market Price of the Fund was greater than the Fund’s NAV and the number of days it was less than the Fund’s NAV can be obtained at www.alpsfunds.com.
S-Network Sector Dividend Dogs Index is a portfolio of fifty stocks derived from the S&P 500® Index. An investor cannot invest directly in an index.
| * | The Fund Inception Date is June 29, 2012. Total return for a period of less than one year is not annualized. |
| ** | Market Price is based on the midpoint of the bid-ask spread at 4 p.m. ET and does not represent the returns an investor would receive if shares were traded at other times. |
| *** | The S-Network Sector Dividend Dogs Index (Ticker: SDOGX) is designed to serve as a fair, impartial and transparent measure of the performance of US large cap equities with above average dividend yields. |
| **** | The S&P 500® is an index of 500 stocks chosen for market size, liquidity and industry grouping among other factors. |
An investor cannot invest directly in an index.
| | |
2 | | |
| | www.alpsfunds.com | 866.675.2639 |
| | |
ALPS SECTOR DIVIDEND DOGS ETF | | Performance Overview |
| | | May 31, 2013 (Unaudited) |
Top 10 Holdings* as of May 31, 2013
| | | | |
Best Buy Co., Inc. | | | 2.6% | |
| |
Seagate Technology Plc | | | 2.5% | |
| |
Northrop Grumman Corp. | | | 2.3% | |
| |
Bristol-Myers Squibb Co. | | | 2.3% | |
| |
Avon Products, Inc. | | | 2.2% | |
| |
Raytheon Co. | | | 2.2% | |
| |
Lockheed Martin Corp. | | | 2.2% | |
| |
El du Pont de Nemours & Co. | | | 2.2% | |
| |
| | | | |
Waste Management, Inc. | | | 2.1% | |
| |
Intel Corp. | | | 2.1% | |
| |
Percent of Total Investments in Top Ten Holdings: | | | 22.7% | |
| |
Holdings are subject to change.
Growth of $10,000 as of May 31, 2013
Comparison of Change in Value of $10,000 Investment in ALPS Sector Dividend Dogs ETF and S-Net Sector Dividend Dogs TR Index.
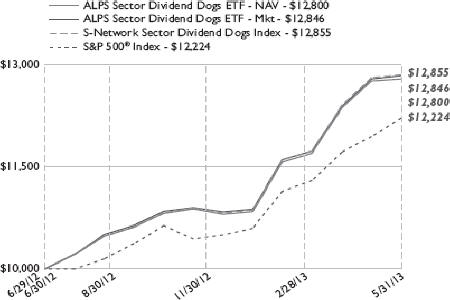
The chart above represents historical performance of a hypothetical investment of $10,000 in the Fund over the life of the Fund. Performance calculations are as of the end of each month. Past performance does not guarantee future results. This chart does not reflect the deduction of taxes that a shareholder would pay on Fund distributions or the redemption of Fund shares.
| | |
| | 3 |
Semi-Annual | May 31, 2013 | |
| | |
ALPS SECTOR DIVIDEND DOGS ETF | | Disclosure of Fund Expenses |
| | | May 31, 2013 (Unaudited) |
Shareholder Expense Example: As a shareholder of the Fund, you incur two types of costs: (1) transaction costs which may include creation and redemption fees or brokerage charges, and (2) ongoing costs, including management fees and other Fund expenses. These examples are intended to help you understand your ongoing costs (in dollars) of investing in the Fund and to compare these costs with the ongoing costs of investing in other funds. It is based on an investment of $1,000 invested at the beginning of the (six month) period and held through May 31, 2013.
Actual Return: The first line of the table provides information about actual account values and actual expenses. You may use the information in this table, together with the amount you invested, to estimate the expenses that you incurred over the period. Simply divide your account value by $1,000 (for example, an $8,600 account value divided by $1,000 = 8.6), then multiply the result by the number in the first line under the heading entitled “Expenses Paid During the Period” to estimate the expenses attributable to your investment during this period.
Hypothetical 5% Return: The second line of the table provides information about hypothetical account values and hypothetical expenses based on the Fund’s actual expense ratio and an assumed rate of return of 5% per year before expenses, which is not the Fund’s actual return. The hypothetical account values and expenses may not be used to estimate the actual ending account balance or expenses you paid for the period. You may use this information to compare ongoing costs of investing in the Fund and other funds. To do so, compare this 5% hypothetical example with the 5% hypothetical examples that appear in the shareholder reports of the other funds.
The expenses shown in the table are meant to highlight ongoing Fund costs only and do not reflect any transaction costs, such as creation and redemption fees, or brokerage charges. Therefore, the second line is useful in comparing ongoing costs only, and will not help you determine the relative total costs of owning different funds. In addition, if these costs were included, your costs would have been higher.
| | | | | | | | | | | | | | | | |
| | | Beginning Account
Value 12/1/12 | | | Ending Account
Value 5/31/13 | | | Expense Ratio(a) | | | Expenses Paid
During the Period 12/1/12 - 5/31/13(b) | |
| |
Actual | | $ | 1,000.00 | | | $ | 1,185.30 | | | | 0.40 | % | | $ | 2.18 | |
| |
Hypothetical (5% return before expenses) | | $ | 1,000.00 | | | $ | 1,022.94 | | | | 0.40 | % | | $ | 2.02 | |
| |
| (a) | Annualized, based on the Fund’s most recent fiscal half-year expenses. |
| (b) | Expenses are equal to the Fund’s annualized expense ratio multiplied by the average account value over the period, multiplied by the number of days in the most recent fiscal half year (182), then divided by 365. |
| | |
4 | | |
| | www.alpsfunds.com | 866.675.2639 |
| | |
ALPS SECTOR DIVIDEND DOGS ETF | | Schedule of Investments |
| | | May 31, 2013 (Unaudited) |
| | | | | | | | |
| Security Description | | Shares | | | Value | |
| |
COMMON STOCK (99.20%) | | | | | | | | |
Consumer Discretionary (10.36%) | | | | | | | | |
Best Buy Co., Inc. | | | 227,614 | | | $ | 6,270,766 | |
Cablevision Systems Corp., Class A | | | 328,809 | | | | 4,971,592 | |
Gannett Co., Inc. | | | 212,658 | | | | 4,572,147 | |
H&R Block, Inc. | | | 168,310 | | | | 4,926,434 | |
Leggett & Platt, Inc. | | | 143,974 | | | | 4,607,168 | |
| | | | | | | | |
Total Consumer Discretionary | | | | | | | 25,348,107 | |
| | | | | | | | |
| | |
Consumer Staples (10.22%) | | | | | | | | |
Altria Group, Inc. | | | 134,971 | | | | 4,872,453 | |
Avon Products, Inc. | | | 232,333 | | | | 5,476,089 | |
Lorillard, Inc. | | | 118,855 | | | | 5,044,206 | |
Reynolds American, Inc. | | | 106,463 | | | | 5,121,935 | |
Safeway, Inc. | | | 194,503 | | | | 4,475,514 | |
| | | | | | | | |
Total Consumer Staples | | | | | | | 24,990,197 | |
| | | | | | | | |
| | |
Energy (9.69%) | | | | | | | | |
Chevron Corp. | | | 38,767 | | | | 4,758,649 | |
ConocoPhillips | | | 78,628 | | | | 4,823,041 | |
Diamond Offshore Drilling, Inc. | | | 67,659 | | | | 4,655,616 | |
Kinder Morgan, Inc. | | | 122,800 | | | | 4,663,944 | |
Spectra Energy Corp. | | | 157,070 | | | | 4,801,630 | |
| | | | | | | | |
Total Energy | | | | | | | 23,702,880 | |
| | | | | | | | |
| | |
Financials (9.68%) | | | | | | | | |
Cincinnati Financial Corp. | | | 99,094 | | | | 4,691,110 | |
CME Group, Inc. | | | 73,671 | | | | 5,004,471 | |
HCP, Inc., REIT | | | 93,874 | | | | 4,447,750 | |
Health Care REIT, Inc. | | | 70,231 | | | | 4,777,815 | |
People’s United Financial, Inc. | | | 345,417 | | | | 4,752,938 | |
| | | | | | | | |
Total Financials | | | | | | | 23,674,084 | |
| | | | | | | | |
| | |
Health Care (9.99%) | | | | | | | | |
Bristol-Myers Squibb Co. | | | 122,700 | | | | 5,645,427 | |
Eli Lilly & Co. | | | 83,270 | | | | 4,426,633 | |
Johnson & Johnson | | | 58,726 | | | | 4,943,555 | |
Merck & Co., Inc. | | | 106,772 | | | | 4,986,252 | |
Pfizer, Inc. | | | 162,859 | | | | 4,434,651 | |
| | | | | | | | |
Total Health Care | | | | | | | 24,436,518 | |
| | | | | | | | |
| | |
| | 5 |
Semi-Annual | May 31, 2013 | |
| | |
ALPS SECTOR DIVIDEND DOGS ETF | | Schedule of Investments |
| | | May 31, 2013 (Unaudited) |
| | | | | | | | |
| Security Description | | Shares | | | Value | |
| |
Industrials (10.89%) | | | | | | | | |
Lockheed Martin Corp. | | | 50,941 | | | $ | 5,391,086 | |
Northrop Grumman Corp. | | | 69,577 | | | | 5,732,449 | |
Pitney Bowes, Inc. | | | 328,811 | | | | 4,826,946 | |
Raytheon Co. | | | 81,910 | | | | 5,458,482 | |
Waste Management, Inc. | | | 124,322 | | | | 5,212,821 | |
| | | | | | | | |
Total Industrials | | | | | | | 26,621,784 | |
| | | | | | | | |
| | |
Information Technology (10.55%) | | | | | | | | |
CA, Inc. | | | 183,018 | | | | 4,998,221 | |
Intel Corp. | | | 212,399 | | | | 5,157,048 | |
Microchip Technology, Inc. | | | 124,608 | | | | 4,545,700 | |
Paychex, Inc. | | | 135,015 | | | | 5,026,608 | |
Seagate Technology Plc | | | 141,259 | | | | 6,085,438 | |
| | | | | | | | |
Total Information Technology | | | | | | | 25,813,015 | |
| | | | | | | | |
| | |
Materials (9.03%) | | | | | | | | |
Cliffs Natural Resources, Inc. | | | 185,658 | | | | 3,349,270 | |
EI du Pont de Nemours & Co. | | | 93,365 | | | | 5,208,834 | |
MeadWestvaco Corp. | | | 125,985 | | | | 4,409,475 | |
Nucor Corp. | | | 96,368 | | | | 4,289,340 | |
The Dow Chemical Co. | | | 140,046 | | | | 4,825,985 | |
| | | | | | | | |
Total Materials | | | | | | | 22,082,904 | |
| | | | | | | | |
| | |
Telecommunication Services (9.22%) | | | | | | | | |
AT&T, Inc. | | | 125,160 | | | | 4,379,349 | |
CenturyLink, Inc. | | | 133,453 | | | | 4,557,420 | |
Frontier Communications Corp. | | | 1,127,893 | | | | 4,669,477 | |
Verizon Communications, Inc. | | | 95,681 | | | | 4,638,615 | |
Windstream Corp. | | | 536,310 | | | | 4,306,569 | |
| | | | | | | | |
Total Telecommunication Services | | | | | | | 22,551,430 | |
| | | | | | | | |
| | |
Utilities (9.57%) | | | | | | | | |
Ameren Corp. | | | 135,440 | | | | 4,610,378 | |
Entergy Corp. | | | 72,414 | | | | 4,987,876 | |
Exelon Corp. | | | 142,871 | | | | 4,477,577 | |
Pepco Holdings, Inc. | | | 224,498 | | | | 4,662,823 | |
TECO Energy, Inc. | | | 264,995 | | | | 4,666,562 | |
| | | | | | | | |
Total Utilities | | | | | | | 23,405,216 | |
| | | | | | | | |
TOTAL COMMON STOCK
(Cost $227,981,585) | | | | | | | 242,626,135 | |
| | | | | | | | |
| | |
6 | | |
| | www.alpsfunds.com | 866.675.2639 |
| | |
ALPS SECTOR DIVIDEND DOGS ETF | | Schedule of Investments |
| | | May 31, 2013 (Unaudited) |
| | | | | | | | | | | | |
| | | 7 Day Yield | | | Shares | | | Value | |
| |
SHORT TERM INVESTMENTS (0.44%) | | | | | | | | | | | | |
Dreyfus Treasury Prime Cash Management, Institutional Class | | | 0.000 | %(a) | | | 1,075,316 | | | $ | 1,075,316 | |
| | | |
TOTAL SHORT TERM INVESTMENTS
(Cost $1,075,316) | | | | | | | | | | | 1,075,316 | |
| | | | | | | | | | | | |
| | | |
TOTAL INVESTMENTS (99.64%)
(Cost $229,056,901) | | | | | | | | | | $ | 243,701,451 | |
| | | |
NET OTHER ASSETS AND LIABILITIES (0.36%) | | | | | | | | | | | 893,057 | |
| | | | | | | | | | | | |
| | | |
NET ASSETS (100.00%) | | | | | | | | | | $ | 244,594,508 | |
| | | | | | | | | | | | |
Common Abbreviations:
Plc - Public Limited Company.
REIT - Real Estate Investment Trust.
See Notes to Financial Statements.
| | |
| | 7 |
Semi-Annual | May 31, 2013 | |
| | |
ALPS SECTOR DIVIDEND DOGS ETF | | Statement of Assets & Liabilities |
| | | May 31, 2013 (Unaudited) |
| | | | |
Assets: | | | | |
Investments, at value | | $ | 243,701,451 | |
Cash | | | 649 | |
Capital shares receivable | | | 16,410 | |
Dividends receivable | | | 953,687 | |
Total Assets | | | 244,672,197 | |
| |
Liabilities: | | | | |
Payable to advisor | | | 77,689 | |
Total Liabilities | | | 77,689 | |
Net Assets | | $ | 244,594,508 | |
| | | | | |
| |
Net Assets Consist Of: | | | | |
Paid-in capital | | $ | 224,548,756 | |
Accumulated net investment income | | | 1,216,182 | |
Accumulated net realized gain on investments | | | 4,185,020 | |
Net unrealized appreciation on investments | | | 14,644,550 | |
Net Assets | | $ | 244,594,508 | |
| | | | | |
| |
Investments, At Cost | | $ | 229,056,901 | |
| |
Pricing Of Shares | | | | |
Net Assets | | $ | 244,594,508 | |
Shares of beneficial interest outstanding (Unlimited number of shares authorized, par value $0.01 per share) | | | 7,900,002 | |
Net Asset Value, offering and redemption price per share | | $ | 30.96 | |
| | |
8 | | See Notes to Financial Statements. |
| | www.alpsfunds.com | 866.675.2639 |
| | |
ALPS SECTOR DIVIDEND DOGS ETF | | Statement of Operations |
| | | |
| | | | |
| | | For the Six Months Ended
May 31, 2013 (Unaudited) | |
Investment Income: | | | | |
Dividends | | $ | 3,097,383 | |
Total Investment Income | | | 3,097,383 | |
| |
Expenses: | | | | |
Investment advisory fee | | | 282,574 | |
Total Expenses | | | 282,574 | |
Net Investment Income | | | 2,814,809 | |
| |
Realized and Unrealized Gain: | | | | |
Net realized gain on investments | | | 4,185,020 | |
Net change in unrealized appreciation on investments | | | 14,676,486 | |
Net Realized and Unrealized Gain on Investments | | | 18,861,506 | |
Net Increase in Net Assets Resulting from Operations | | $ | 21,676,315 | |
| | | | | |
| | |
See Notes to Financial Statements. | | 9 |
Semi-Annual | May 31, 2013 | |
| | |
ALPS SECTOR DIVIDEND DOGS ETF | | Statements of Changes in Net Assets |
| | | |
| | | | | | | | | | |
| | | For the Six Months Ended
May 31, 2013 (Unaudited) | | For the Period
June 29, 2012 (Inception)
to November 30, 2012 |
Operations: | | | | | | | | | | |
Net investment income | | | $ | 2,814,809 | | | | $ | 733,532 | |
Net realized gain on investments | | | | 4,185,020 | | | | | 319,121 | |
Net change in unrealized appreciation/ (depreciation) on investments | | | | 14,676,486 | | | | | (31,936 | ) |
Net increase in net assets resulting from operations | | | | 21,676,315 | | | | | 1,020,717 | |
| | |
Net equalization credits | | | | 450,980 | | | | | 238,003 | |
| | |
Distributions to Shareholders: | | | | | | | | | | |
From net investment income | | | | (1,916,288 | ) | | | | (415,871 | ) |
Total distributions | | | | (1,916,288 | ) | | | | (415,871 | ) |
| | |
Share Transactions: | | | | | | | | | | |
Proceeds from sale of shares | | | | 192,698,941 | | | | | 63,519,127 | |
Cost of shares redeemed | | | | (30,632,645 | ) | | | | (1,355,788 | ) |
Net income equalization (Note 2) | | | | (450,980 | ) | | | | (238,003 | ) |
Net increase from share transactions | | | | 161,615,316 | | | | | 61,925,336 | |
Net increase in net assets | | | | 181,826,323 | | | | | 62,768,185 | |
| | |
Net Assets: | | | | | | | | | | |
Beginning of period | | | | 62,768,185 | | | | | – | |
End of period* | | | $ | 244,594,508 | | | | $ | 62,768,185 | |
| | | | | | | | | | | |
| | |
*Including accumulated net investment income of: | | | $ | 1,216,182 | | | | $ | 317,661 | |
| | |
Other Information: | | | | | | | | | | |
Share Transactions: | | | | | | | | | | |
Beginning shares | | | | 2,350,002 | | | | | – | |
Shares sold | | | | 6,650,000 | | | | | 2,400,002 | |
Shares redeemed | | | | (1,100,000 | ) | | | | (50,000 | ) |
Shares outstanding, end of period | | | | 7,900,002 | | | | | 2,350,002 | |
| | | | | | | | | | | |
| | |
10 | | See Notes to Financial Statements. |
| | www.alpsfunds.com | 866.675.2639 |
| | |
ALPS SECTOR DIVIDEND DOGS ETF | | Financial Highlights |
| | | For a Share Outstanding Throughout the Periods Presented |
| | | | | | | | | | |
| | | For the Six Months Ended
May 31, 2013 (Unaudited) | | For the Period
June 29, 2012 (Inception)
to November 30, 2012 |
NET ASSET VALUE, BEGINNING OF PERIOD | | | $ | 26.71 | | | | $ | 25.00 | |
| | |
INCOME FROM OPERATIONS: | | | | | | | | | | |
Net investment income(a) | | | | 0.67 | | | | | 0.59 | |
Net realized and unrealized gain on investments | | | | 4.21 | | | | | 1.41 | |
Total from Investment Operations | | | | 4.88 | | | | | 2.00 | |
| | |
LESS DISTRIBUTIONS: | | | | | | | | | | |
From net investment income | | | | (0.63 | ) | | | | (0.29 | ) |
Total Distributions | | | | (0.63 | ) | | | | (0.29 | ) |
NET INCREASE IN NET ASSET VALUE | | | | 4.25 | | | | | 1.71 | |
NET ASSET VALUE, END OF PERIOD | | | $ | 30.96 | | | | $ | 26.71 | |
| | | | | | | | | | | |
TOTAL RETURN(b) | | | | 18.53 | % | | | | 7.99 | % |
| | |
RATIOS/SUPPLEMENTAL DATA: | | | | | | | | | | |
Net assets, end of period (in 000s) | | | $ | 244,595 | | | | $ | 62,768 | |
| | |
RATIOS TO AVERAGE NET ASSETS: | | | | | | | | | | |
Net investment income | | | | 3.98 | %(c) | | | | 5.31 | %(c) |
Operating expenses | | | | 0.40 | %(c) | | | | 0.40 | %(c) |
PORTFOLIO TURNOVER RATE(d) | | | | 5 | % | | | | 0 | % |
Undistributed net investment income included in price of units issued and redeemed(a)(e) | | | $ | 0.09 | | | | $ | 0.19 | |
| (a) | Based on average shares outstanding during the period. |
| (b) | Total return is calculated assuming an initial investment made at the net asset value at the beginning of the period and redemption at the net asset value on the last day of the period and assuming all distributions are reinvested at actual reinvestment. | |
| (d) | Portfolio turnover is not annualized and does not include securities received or delivered from processing creations or redemptions. |
| (e) | The per share amount of equalization is presented to show the impact of equalization on distributable earnings per share. |
| | |
See Notes to Financial Statements. | | 11 |
Semi-Annual | May 31, 2013 | |
| | |
ALPS SECTOR DIVIDEND DOGS ETF | | Notes to Financial Statements |
| | | May 31, 2013 (Unaudited) |
1. Organization
The ALPS ETF Trust (the “Trust”), a Delaware statutory trust, is an open-end management investment company under the Investment Company Act of 1940, as amended (the “1940 Act”). As of May 31, 2013, the Trust consists of thirteen separate portfolios. Each portfolio represents a separate series of the Trust. This report pertains to the ALPS Sector Dividend Dogs ETF (the “Fund”), which commenced operations on June 29, 2012. The investment objective of the Fund is to seek investment results that replicate as closely as possible, before fees and expenses, the performance of the S-Network Sector Dividend Dogs Index (the “Underlying Index”).
The Fund’s Shares (“Shares”) are listed on the New York Stock Exchange (“NYSE”) Arca. The Fund issues and redeems Shares, at net asset value (“NAV”) in blocks of 50,000 Shares, each of which is called a “Creation Unit.” Creation Units are issued and redeemed principally in-kind for securities included in a specified index. Except when aggregated in Creation Units, Shares are not redeemable securities of the Fund.
2. Significant Accounting Policies
The following is a summary of significant accounting policies consistently followed by the Fund in the preparation of the financial statements. The accompanying financial statements were prepared in accordance with accounting principles generally accepted in the United States of America (“U.S. GAAP”). The preparation of financial statements in conformity with U.S. GAAP requires management to make certain estimates and assumptions that affect the reported amounts of assets and liabilities and disclosures of contingent assets and liabilities at the date of the financial statements and the reported amounts of revenue and expenses during the period. Actual results could differ from those estimates.
A. Portfolio Valuation
The Fund’s NAV is determined daily, as of the close of regular trading on the NYSE, normally 4:00 p.m. Eastern time, on each day the NYSE is open for trading. The NAV is computed by dividing the value of all assets of the Fund (including accrued interest and dividends), less all liabilities (including accrued expenses and dividends declared but unpaid), by the total number of shares outstanding.
Portfolio securities listed on any exchange other than the National Association of Securities Dealer Automated Quotation (“NASDAQ”) exchange are valued at the last sale price on the business day as of which such value is being determined. If there has been no sale on such day, the securities are valued at the mean of the most recent bid and asked prices on such day. Securities traded on the NASDAQ are valued at the NASDAQ Official Closing Price as determined by NASDAQ. Portfolio securities traded on more than one securities exchange are valued at the last sale price on the business day as of which such value is being determined at the close of the exchange representing the principal market for such securities. Portfolio securities traded in the over-the-counter market, but excluding securities traded on the NASDAQ, are valued at the closing bid prices. Short-term investments that mature in less than 60 days are valued at amortized cost, which approximates market value.
The Fund’s investments are valued at market value or, in the absence of market value with respect to any portfolio securities, at fair value according to procedures adopted by the Trust’s Board of Trustees (the “Board”). When market quotations are not readily available or when
| | |
12 | | |
| | www.alpsfunds.com | 866.675.2639 |
| | |
ALPS SECTOR DIVIDEND DOGS ETF | | Notes to Financial Statements |
| | | May 31, 2013 (Unaudited) |
events occur that make established valuation methods unreliable, securities of the Fund may be valued in good faith by or under the direction of the Board. These securities generally include, but are not limited to, restricted securities (securities which may not be publicly sold without registration under the Securities Act of 1933) for which a pricing service is unable to provide a market price; securities whose trading has been formally suspended; a security whose market price is not available from a pre-established primary pricing source or the pricing source is not willing to provide a price; a security with respect to which an event has occurred that is most likely to materially affect the value of the security after the market has closed but before the calculation of the Fund’s NAV or make it difficult or impossible to obtain a reliable market quotation; or a security whose price, as provided by the pricing service, does not reflect the security’s “fair value” due to the security being de-listed from a national exchange or the security’s primary trading market is temporarily closed at a time when, under normal conditions, it would be open. As a general principle, the current “fair value” of a security would be the amount which the owner might reasonably expect to receive from the closing sale prices on the applicable exchange and fair value prices may not reflect the actual value of a security. A variety of factors may be considered in determining the fair value of such securities.
B. Securities Transactions and Investment Income
Securities transactions are recorded as of the trade date. Realized gains and losses from securities transactions are recorded on the highest cost basis. Dividend income is recorded on the ex-dividend date. Interest income, if any, is recorded on the accrual basis.
C. Dividends and Distributions to Shareholders
Dividends from net investment income of the Fund, if any, are declared and paid quarterly or as the Board may determine from time to time. Distributions of net realized capital gains earned by the Fund, if any, are distributed at least annually.
D. Equalization
The Fund follows the accounting practice known as “Equalization” by which a portion of the proceeds from sales and costs of reacquiring Sector Dividend Dogs shares, equivalent on a per share basis to the amount of distributable net investment income on the date of the transaction, is credited or charged to undistributed net investment income. As a result, undistributed net investment income per share is unaffected by sales or reacquisitions of Sector Dividend Dogs shares. Amounts related to Equalization can be found on the Statement of Changes in Net Assets.
E. Federal Tax and Tax Basis Information
The timing and character of income and capital gain distributions are determined in accordance with income tax regulations, which may differ from U.S. GAAP. Reclassifications are made to the Fund’s capital accounts for permanent tax differences to reflect income and gains available for distribution (or available capital loss carryforwards) under income tax regulations. The amounts and characteristics of tax basis distributions and composition of distributable earnings/(accumulated losses) are finalized at fiscal year end: accordingly, tax basis balances have not been determined as of May 31, 2013.
Distributions from net investment income and capital gains are determined in accordance with income tax regulations, which may differ from U.S. GAAP. These differences are primarily due to differing treatments of income and gains on various investment securities held by the Fund, timing differences and differing characterization of distributions made by the Fund.
| | |
| | 13 |
Semi-Annual | May 31, 2013 | |
| | |
ALPS SECTOR DIVIDEND DOGS ETF | | Notes to Financial Statements |
| | | May 31, 2013 (Unaudited) |
The tax character of the distributions paid was as follows:
| | | | | |
| | | Period Ended November 30, 2012
Distributions paid from: Ordinary Income |
ALPS Sector Dividend Dogs ETF | | | $ | 415,871 | |
As of May 31, 2013, the costs of investments for federal income tax purposes and accumulated net unrealized appreciation/ (depreciation) on investments were as follows:
| | | | | | | | | | |
| | | ALPS Sector Dividend
DOGS ETF | | |
Cost of investments for income tax purposes | | | $ | 229,202,104 | | | |
Gross Appreciation (excess of value over tax cost) | | | $ | 17,947,940 | | | |
Gross Depreciation (excess of tax cost over value) | | | | (3,448,593 | ) | | |
Net Unrealized Appreciation | | | $ | 14,499,347 | | | |
F. Income Taxes
No provision for income taxes is included in the accompanying financial statements, as the Fund intends to distribute to shareholders all taxable investment income and realized gains and otherwise comply with Subchapter M of the Internal Revenue Code of 1986, as amended, applicable to regulated investment companies.
The Fund evaluates tax positions taken (or expected to be taken) in the course of preparing the Fund’s tax returns to determine whether these positions meet a “more-likely-than-not” standard that, based on the technical merits, have a more than fifty percent likelihood of being sustained by a taxing authority upon examination. A tax position that meets the “more-likely-than-not” recognition threshold is measured to determine the amount of benefit to recognize in the financial statements.
As of and during the period ended May 31, 2013, the fund did not have a liability for any unrecognized tax benefits. The fund files U.S. federal, state, and local tax returns as required. The fund’s tax returns are subject to examination by the relevant tax authorities until expiration of the applicable statute of limitations which is generally three years after the filing of the tax return Tax returns for open years have incorporated no uncertain tax positions that require a provision for income taxes.
G. Fair Value Measurements
The Fund discloses the classification of fair value measurements following a three-tier hierarchy based on the inputs used to measure fair value. Inputs refer broadly to the assumptions that market participants would use in pricing the asset or liability, including assumptions about risk. Inputs may be observable or unobservable. Observable inputs reflect the assumptions market participants would use in pricing the asset or liability that are developed based on market data obtained from sources independent of the reporting entity. Unobservable inputs reflect the reporting entity’s own assumptions about the assumptions market participants would use in pricing the asset or liability that are developed based on the best information available.
| | |
14 | | |
| | www.alpsfunds.com | 866.675.2639 |
| | |
ALPS SECTOR DIVIDEND DOGS ETF | | Notes to Financial Statements |
| | | May 31, 2013 (Unaudited) |
Various inputs are used in determining the value of the Fund’s investments as of the end of the reporting period. When inputs used fall into different levels of the fair value hierarchy, the level in the hierarchy within which the fair value measurement falls is determined based on the lowest level input that is significant to the fair value measurement in its entirety. The designated input levels are not necessarily an indication of the risk or liquidity associated with these investments. These inputs are categorized in the following hierarchy under applicable financial accounting standards:
| | |
Level 1 – | | Unadjusted quoted prices in active markets for identical investments, unrestricted assets or liabilities that a Fund has the ability to access at the measurement date; |
| |
Level 2 – | | Quoted prices which are not active, quoted prices for similar assets or liabilities in active markets or inputs other than quoted prices that are observable (either directly or indirectly) for substantially the full term of the asset or liability; and |
| |
Level 3 – | | Significant unobservable prices or inputs (including the Fund’s own assumptions in determining the fair value of investments) where there is little or no market activity for the asset or liability at the measurement date. |
The following is a summary of the inputs used to value the Funds investments at May 31, 2013:
| | | | | | | | | | | | | | | | | | | | |
Investments in Securities at Value | | Level 1 -
Unadjusted
Quoted Prices | | Level 2 - Other
Significant
Observable Inputs | | Level 3 -
Significant
Unobservable
Inputs | | Total |
Common Stocks* | | | $ | 242,626,135 | | | | $ | – | | | | $ | – | | | | $ | 242,626,135 | |
Short Term Investments | | | | 1,075,316 | | | | | – | | | | | – | | | | | 1,075,316 | |
TOTAL | | | $ | 243,701,451 | | | | $ | – | | | | $ | – | | | | $ | 243,701,451 | |
| | | | | | | | | | | | | | | | | | | | | |
| * | For detailed sector descriptions, see the accompanying Schedule of Investments. |
The Fund recognizes transfers between levels as of the end of the period. For the six months ended May 31, 2013, the Fund did not have any transfers between Level 1 and Level 2 securities. The Fund did not have any securities which used significant unobservable inputs (Level 3) in determining fair value.
3. Investment Advisory Fee and Other Affiliated Transactions
ALPS Advisors, Inc. (the “Investment Adviser”) acts as the Fund’s investment adviser pursuant to an advisory agreement with the Trust on behalf of the Fund (the “Advisory Agreement”). Pursuant to the Advisory Agreement, the Fund pays the Investment Adviser a unitary fee for the services and facilities it provides payable on a monthly basis at the annual rate of 0.40% of the Fund’s average daily net assets. From time to time, the Investment Adviser may waive all or a portion of its fee.
Out of the unitary management fee, the Investment Adviser pays substantially all expenses of the Fund, including the licensing fee of the Index provider, and the cost of transfer agency, custody, fund administration, legal, audit, trustees and other services, except for interest expenses, distribution fees or expenses, brokerage expenses, taxes and extraordinary expenses not incurred in the ordinary course of the Fund’s business. In addition, the
| | |
| | 15 |
Semi-Annual | May 31, 2013 | |
| | |
ALPS SECTOR DIVIDEND DOGS ETF | | Notes to Financial Statements |
| | | May 31, 2013 (Unaudited) |
Investment Adviser’s unitary management fee is designed to compensate the Investment Adviser for providing services for the Fund.
ALPS Fund Services, Inc. (“ALPS”), an affiliate of the Investment Adviser, is the administrator of the Fund.
The Bank of New York Mellon is the custodian, fund accounting agent and transfer agent for the Fund.
Each Trustee who is not an officer or employee of the Investment Adviser, any sub-adviser or any of their affiliates (“Independent Trustees”) is paid a quarterly retainer of $5,000, $3,750 for each regularly scheduled Board meeting attended and $1,500 for each special meeting held outside of regularly scheduled meetings.
4. Purchases and Sales of Securities
For the six months ended May 31, 2013, the cost of purchases and proceeds from sales of investment securities, excluding short-term investments and in-kind transactions, were as follows:
| | | | |
| | | Purchases | | Sales |
ALPS Sector Dividend Dogs ETF | | $ 33,218,159 | | $ 7,459,121 |
For the six months ended May 31, 2013, the cost of in-kind purchases and proceeds from in-kind sales were as follows:
| | | | |
| | | Purchases | | Sales |
ALPS Sector Dividend Dogs ETF | | $ 166,386,488 | | $ 30,544,564 |
Gains on in-kind transactions are not considered taxable for federal income tax purposes.
5. Capital Share Transactions
Shares are created and redeemed by the Fund only in Creation Unit size aggregations of 50,000. Only broker-dealers or large institutional investors with creation and redemption agreements called Authorized Participants (“AP”) are permitted to purchase or redeem Creation Units from the Fund. Such transactions are generally permitted on an in-kind basis, with a balancing cash component to equate the transaction to the net asset value per unit of the Fund on the transaction date. Cash may be substituted equivalent to the value of certain securities generally when they are not available in sufficient quantity for delivery, not eligible for trading by the AP or as a result of other market circumstances.
6. Indemnifications
Under the Trust’s organizational documents, its officers and Trustees are indemnified against certain liability arising out of the performance of their duties to the Trust. Additionally, in the normal course of business, the Trust enters into contracts with service providers that contain general indemnification clauses. The Trust’s maximum exposure under these arrangements is unknown, as this would involve future claims that may be made against the Trust that have not yet occurred.
| | |
16 | | |
| | www.alpsfunds.com | 866.675.2639 |
| | |
ALPS SECTOR DIVIDEND DOGS ETF | | Additional Information |
| | | May 31, 2013 (Unaudited) |
Proxy Voting Policies And Procedures
A description of the Fund’s proxy voting policies and procedures used in determining how to vote for proxies and information regarding how the Fund voted proxies related to portfolio securities during the most recent 12-month period ended June 30th is available without charge, (1) on the Securities and Exchange Commission’s (“SEC”) website at http://www.sec. gov; (2) upon request, by calling (toll-free) 1-866-513-5856; and (3) on the Trust’s website located at http://www.alpsfunds.com.
Portfolio Holdings
The Trust will file its complete schedule of portfolio holdings with the SEC for the first and third quarters of each fiscal year on Form N-Q. The Trust’s Form N-Q will be available (1) on the SEC’s website at http:// www.sec.gov; (2) by calling (toll-free) 1-866-513-5856; (3) on the Trust’s website located at http://www.alpsfunds. com; and (4) for review and copying at the SEC’s Public Reference Room (“PRR”) in Washington D.C. Information regarding the operation of the PRR may be obtained by calling (toll-free) 1-800-732-0330.
| | |
| | 17 |
Semi-Annual | May 31, 2013 | |

This report has been prepared for the ALPS Sector Dividend Dogs ETF shareholders and may be distributed to others only if preceded or accompanied by a prospectus.
ALPS Portfolio Solutions Distributor, Inc., distributor for the ALPS Sector Dividend Dogs ETF.
| | |

| | DOG000171 |
| | |
 | | PERFORMANCE OVERVIEW |
| | May 31, 2013 (Unaudited) |
The U.S. Equity High Volatility Put Write Index Fund (the “Fund”) seeks investment results that correspond generally to the performance, before the Fund’s fees and expenses, of the NYSE Arca U.S. Equity High Volatility Put Write IndexSM (the “Index”). The Index reflects the performance of a portfolio of exchange-traded put options on a selection of the largest capitalized stocks which also have listed options and which have the highest volatility, as determined by the NYSE Arca, Inc., the Fund’s index provider.
GROWTH OF A HYPOTHETICAL $10,000 INVESTMENT as of 5.31.13
Comparison of Change in Value of a hypothetical $10,000 investment in the US Equity High Volatility Put Write Index Fund.
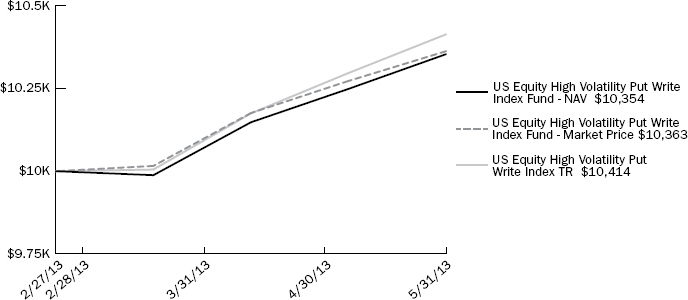
The chart represents historical performance of a hypothetical investment of $10,000 in the Fund over the life of the Fund. Performance calculations are as of the end of each month. Past performance does not guarantee future results. This chart does not reflect the deduction of taxes that a shareholder would pay on Fund distributions or the redemption of Fund shares.
| | | | | | |
AVERAGE ANNUAL TOTAL RETURN as of 5.31.13 | | | | | | |
| | | 3 Months | | YTD | | Since Inception* |
US Equity High Volatility Put Write Index Fund - NAV | | 3.67% | | 3.54% | | 3.54% |
US Equity High Volatility Put Write Index Fund - Market** | | 3.46% | | 3.63% | | 3.63% |
US Equity High Volatility Put Write Index TR | | 4.09% | | 4.14% | | 4.14% |
Total Expense Ratio (per the current prospectus) 0.95%
| * | The Fund commenced Investment Operations on February 27, 2013 and began trading on the exchange on February 28, 2013. Total return for a period of less than one year is not annualized. |
| ** | Market Price is based on the midpoint of the bid/ask spread at 4 p.m. ET and does not represent the returns an investor would receive if shares were traded at other times. |
Performance data quoted represents past performance. Past performance does not guarantee future results. Investment return and principal value of an investment will fluctuate so that an investor’s shares, when sold or redeemed, may be worth more or less than the original cost. Current performance data may be higher or lower than actual data quoted. For the most current month-end performance data please visit www.alpsfunds.com.
NAV is an exchange-traded fund’s per-share value. The per-share dollar amount of the fund is derived by dividing the total value of all the securities in its portfolio, less any liabilities, by the number of fund shares outstanding. Market Price is the price at which a share can currently be traded in the market. Information detailing the number of days the Market Price of the Fund was greater than the Fund’s NAV and the number of days it was less than the Fund’s NAV can be obtained at www.alpsfunds.com.
NYSE Arca U.S. Equity High Volatility Put Write IndexSM: measures the return of a hypothetical portfolio of listed put options on each of 20 stocks and a cash (US T-Bill) position. The 20 underlying stocks on which options are written are a selection of the largest capitalized (over $5 billion in market cap) US listed stocks which also have listed options and which have the highest volatility, as determined by the NYSE Arca, Inc., the Fund’s Index provider. No more than 50% of the Index positions will be from the same industry sector. Full details of the index rules, methodology, values and period, constituents can be found at http://www.nyse.com/about/listed/lcddata.html?ticker=PUTWRT. An investor cannot directly invest in an index.
The “NYSE Arca U.S. Equity High Volatility Put Write IndexSM” is a service mark of NYSE Euronext or its affiliates and has been licensed for use by Rich Investment Solutions, LLC in connection with the U.S. Equity High Volatility Put Write Index Fund. Neither the Trust nor the Fund is sponsored, endorsed, sold or promoted by NYSE Euronext. NYSE Euronext makes no representations or warranties regarding the Trust or the Fund or the ability of the NYSE Arca U.S. Equity HighVolatility Put Write IndexSM to track general stock market performance.
| | | | |
| | | | |
2 | | Semi-Annual Report | | May 31, 2013 |
| | | | |
|
| DISCLOSURE OF FUND EXPENSES |
| May 31, 2013 (Unaudited) |
Shareholder Expense Example: As a shareholder of the Fund, you incur two types of costs: (1) transaction costs which may include creation and redemption fees or brokerage charges, and (2) ongoing costs, including management fees and other Fund expenses. These examples are intended to help you understand your ongoing costs (in dollars) of investing in the Fund and to compare these costs with the ongoing costs of investing in other funds. The example is based on an investment of $1,000 invested at the beginning of the (six month) period and held through May 31, 2013.
Actual Return: The first line of the table provides information about actual account values and actual expenses. You may use the information in this table, together with the amount you invested, to estimate the expenses that you incurred over the period. Simply divide your account value by $1,000 (for example, an $8,600 account value divided by $1,000 = 8.6), then multiply the result by the number in the first line of the table under the heading entitled “Expenses Paid During the Period” to estimate the expenses attributable to your investment during this period.
Hypothetical 5% Return: The second line of the table provides information about hypothetical account values and hypothetical expenses based on the Fund’s actual expense ratio and an assumed rate of return of 5% per year before expenses, which is not the Fund’s actual return. The hypothetical account values and expenses may not be used to estimate the actual ending account balance or expenses you paid for the period. You may use this information to compare ongoing costs of investing in the Fund and other funds. To do so, compare this 5% hypothetical example with the 5% hypothetical examples that appear in the shareholder reports of the other funds.
The expenses shown in the table are meant to highlight ongoing Fund costs only and do not reflect any transaction costs, such as creation and redemption fees, or brokerage charges. Therefore, the second line of the table is useful in comparing ongoing costs only, and will not help you determine the relative total costs of owning different funds. In addition, if these costs were included, your costs would have been higher.
| | | | | | | | | | | | | | |
| | | Beginning Account Value 12/1/12 | | | | Ending Account Value 5/31/13 | | | | Expense Ratio(a) | | | | Expenses Paid During the Period 12/1/12 - 5/31/13 |
U.S. High Volatility Put Write Index Fund | | | | | | | | | | | | | | |
Actual(c) | | $ 1,000.00 | | | | $ 1,035.40 | | | | 0.95% | | | | $ 2.46 |
Hypothetical (5% return before expenses) | | $ 1,000.00 | | | | $ 1,020.19 | | | | 0.95% | | | | $ 4.78(b) |
| (a) | Annualized based on the Fund’s most recent fiscal half year expenses. |
| (b ) | Expenses are equal to the Fund’s annualized expense ratio multiplied by the average account value over the period, multiplied by the number of days in the most recent fiscal half year (182), then divided by 365. |
| (c) | The Fund commenced operations on February 27, 2013, and as such the actual expenses paid during the period were based on 93 days. |
| | |
| | SCHEDULE OF INVESTMENTS |
| | May 31, 2013 (Unaudited) |
| | | | | | | | |
| Security Description | | Principal Amount | | | Value | |
SHORT TERM INVESTMENTS (94.12%) | | | | | | | | |
U.S. Treasury Bills Discount Notes, 08/22/13, 0.020%(a)(b) | | $ | 2,400,000 | | | $ | 2,399,854 | |
| | |
TOTAL SHORT TERM INVESTMENTS (Cost $2,399,891) | | | | | | | 2,399,854 | |
| | |
TOTAL INVESTMENTS (94.12%) (Cost $2,399,891) | | | | | | $ | 2,399,854 | |
| | |
NET OTHER ASSETS AND LIABILITIES (5.88%) | | | | | | | 149,828 | |
| | |
NET ASSETS (100.00%) | | | | | | $ | 2,549,682 | |
| | | | | | | | |
| | | | | | | | | |
| (a) | Rate shown represents the bond equivalent yield to maturity at date of purchase. |
| (b) | This security is being held as collateral for written options. |
SCHEDULE OF WRITTEN OPTIONS
| | | | | | | | | | | | |
| | | Expiration Date | | Exercise Price | | | Contracts | | Value | |
WRITTEN PUT OPTIONS | | | | | | | | | | | | |
Akamai Technologies | | 06/22/13 | | $ | 29.00 | | | (43) | | $ | (43 | ) |
Cheniere Energy, Inc. | | 06/22/13 | | | 23.00 | | | (54) | | | (81 | ) |
Chesapeake Energy Co. | | 06/22/13 | | | 16.00 | | | (78) | | | (117 | ) |
Cree, Inc. | | 06/22/13 | | | 47.00 | | | (26) | | | (91 | ) |
Expedia, Inc. | | 06/22/13 | | | 55.00 | | | (22) | | | (1,815 | ) |
Facebook, Inc. | | 06/22/13 | | | 22.00 | | | (56) | | | (840 | ) |
Green Mountain Coffee | | 06/22/13 | | | 47.00 | | | (26) | | | (26 | ) |
Juniper Networks, Inc. | | 06/22/13 | | | 15.00 | | | (83) | | | (83 | ) |
LinkedIn Corp. | | 06/22/13 | | | 150.00 | | | (8) | | | (768 | ) |
NetFlix, Inc. | | 06/22/13 | | | 150.00 | | | (8) | | | (96 | ) |
Nuance Communication | | 06/22/13 | | | 18.00 | | | (69) | | | (1,552 | ) |
Peabody Energy Corp. | | 06/22/13 | | | 16.00 | | | (78) | | | (351 | ) |
Pulte Group, Inc. | | 06/22/13 | | | 15.00 | | | (83) | | | (83 | ) |
Rackspace Hosting | | 06/22/13 | | | 37.50 | | | (33) | | | (5,280 | ) |
Tesla Motors, Inc. | | 06/22/13 | | | 42.00 | | | (29) | | | (73 | ) |
Tesoro Corp. | | 06/22/13 | | | 44.00 | | | (28) | | | (28 | ) |
TripAdvisor, Inc. | | 06/22/13 | | | 44.00 | | | (28) | | | (70 | ) |
Vertex Pharma. | | 06/22/13 | | | 70.00 | | | (17) | | | (723 | ) |
VMware, Inc. | | 06/22/13 | | | 65.00 | | | (19) | | | (1,045 | ) |
Western Digital | | 06/22/13 | | | 43.00 | | | (29) | | | (29 | ) |
| | | | |
TOTAL WRITTEN PUT OPTIONS | | | | | | | | | | | | |
(Premiums received $62,193) | | | | | | | | | | $ | (13,194 | ) |
| | | | | | | | | | | | |
| | | | | | | | | | | | | |
See Notes to Financial Statements.
| | | | |
| | | | |
4 | | Semi-Annual Report | | May 31, 2013 |
| | | | |
|
| STATEMENT OF ASSETS & LIABILITIES |
| May 31, 2013 (Unaudited) |
| | | | |
ASSETS: | | | | |
Investments, at value | | $ | 2,399,854 | |
Cash | | | 165,073 | |
Total Assets | | | 2,564,927 | |
| |
LIABILITIES: | | | | |
Writtens options, at value (Proceeds $62,193) | | | 13,194 | |
Payable to advisor | | | 2,051 | |
Total Liabilities | | | 15,245 | |
NET ASSETS | | $ | 2,549,682 | |
| | | | | |
| |
NET ASSETS CONSIST OF: | | | | |
Paid-in capital | | $ | 2,500,051 | |
Accumulated net investment loss | | | (43,637 | ) |
Accumulated net realized gain on written option contracts | | | 44,306 | |
Net unrealized appreciation on investments | | | 48,962 | |
NET ASSETS | | $ | 2,549,682 | |
| | | | | |
| |
INVESTMENTS, AT COST | | $ | 2,399,891 | |
| |
PRICING OF SHARES | | | | |
Net Assets | | $ | 2,549,682 | |
Shares of beneficial interest outstanding (Unlimited number of shares authorized, par value $0.01 per share) | | | 100,002 | |
Net Asset Value, offering and redemption price per share | | $ | 25.50 | |
See Notes to Financial Statements.
| | |
| | STATEMENT OF OPERATIONS |
| | |
| | | | |
| | | For the Period February 27, 2013 (Inception) to May 31, 2013 (Unaudited) | |
INVESTMENT INCOME: | | | | |
Interest | | $ | 552 | |
Total Investment Income | | | 552 | |
| |
EXPENSES: | | | | |
Investment advisory fee | | | 6,064 | |
Total Expenses | | | 6,064 | |
NET INVESTMENT LOSS | | | (5,512) | |
| |
Net realized gain on written option contracts | | | 44,306 | |
Net change in unrealized appreciation on written option contracts | | | 48,999 | |
Net change in unrealized depreciation on investments | | | (37) | |
| |
NET REALIZED AND UNREALIZED GAIN ON INVESTMENTS AND WRITTEN OPTION CONTRACTS | | | 93,268 | |
| |
NET INCREASE IN NET ASSETS RESULTING FROM OPERATIONS | | $ | 87,756 | |
| | | | | |
See Notes to Financial Statements.
| | | | |
| | | | |
6 | | Semi-Annual Report | | May 31, 2013 |
| | | | |
|
| STATEMENT OF CHANGES IN NET ASSETS |
| |
| | | | |
| | | For the Period February 27, 2013 (Inception) to May 31, 2013 (Unaudited) | |
OPERATIONS: | | | | |
Net investment loss | | $ | (5,512 | ) |
Net realized gain on written option contracts | | | 44,306 | |
Net change in unrealized appreciation on written option contracts | | | 48,999 | |
Net change in unrealized depreciation on investments | | | (37 | ) |
Net increase in net assets resulting from operations | | | 87,756 | |
| |
DISTRIBUTIONS TO SHAREHOLDERS: | | | | |
From net investment income | | | (38,125 | ) |
Total distributions | | | (38,125 | ) |
| |
SHARE TRANSACTIONS: | | | | |
Proceeds from sale of shares | | | 2,500,051 | |
Net increase from share transactions | | | 2,500,051 | |
Net increase in net assets | | | 2,549,682 | |
| |
NET ASSETS: | | | | |
Beginning of period | | | – | |
End of period* | | $ | 2,549,682 | |
| | | | | |
| |
*Including accumulated net investment loss of: | | $ | (43,637 | ) |
| |
Other Information: | | | | |
SHARE TRANSACTIONS: | | | | |
Beginning shares | | | – | |
Shares sold | | | 100,002 | |
Shares outstanding, end of period | | | 100,002 | |
| | | | | |
See Notes to Financial Statements.
| | |
| | FINANCIAL HIGHLIGHTS |
| | For a Share Outstanding Throughout the Period Presented |
| | | | |
| | | For the Period
February 27, 2013 (Inception)
to May 31, 2013 (Unaudited) | |
| NET ASSET VALUE, BEGINNING OF PERIOD | | $ | 25.00 | |
| |
| INCOME FROM OPERATIONS: | | | | |
Net investment loss(a) | | | (0.06 | )(a) |
Net realized and unrealized gain on investments | | | 0.94 | |
Total from Investment Operations | | | 0.88 | |
| |
| LESS DISTRIBUTIONS: | | | | |
From net investment income | | | (0.38 | ) |
Total Distributions | | | (0.38 | ) |
NET INCREASE IN NET ASSET VALUE | | | 0.50 | |
NET ASSET VALUE, END OF PERIOD | | | $25.50 | |
| | | | | |
TOTAL RETURN(b) | | | 3.54% | |
| |
RATIOS/ SUPPLEMENTAL DATA: | | | | |
Net assets, end of period (in 000s) | | $ | 2,550 | |
| |
RATIOS TO AVERAGE NET ASSETS: | | | | |
Operating expenses | | | 0.95% | (d) |
Net investment loss | | | (0.86)% | (d) |
PORTFOLIO TURNOVER RATE(C) | | | 0% | |
| (a) | Calculated using average shares outstanding. |
| (b) | Total return is calculated assuming an initial investment made at the net asset value at the beginning of the period and redemption at the net asset value on the last day of the period and assuming all distributions are reinvested at actual reinvestment prices. Total return calculated for a period of less than one year is not annualized. |
| (c) | Portfolio turnover is not annualized. |
See Notes to Financial Statements.
| | | | |
| | | | |
8 | | Semi-Annual Report | | May 31, 2013 |
| | | | |
|
| NOTES TO FINANCIAL STATEMENTS |
| May 31, 2013 (Unaudited) |
1. ORGANIZATION
The ALPS ETF Trust (the “Trust”), a Delaware statutory trust, is an open-end management investment company under the Investment Company Act of 1940, as amended (the “1940 Act”). As of May 31, 2013, the Trust consists of thirteen separate portfolios. Each portfolio represents a separate series of the Trust. This report pertains to the U.S. Equity High Volatility Put Write Index Fund (the “Fund”), which commenced operations on February 27, 2013. The investment objective of the Fund is to seek investment results that correspond generally to the performance, before the Fund’s fees and expenses, of the NYSE Arca U.S. Equity High Volatility Put Write Index (the “Index”). The Index reflects the performance of a portfolio of exchange-traded put options on high volatility stocks.
The Fund’s Shares (“Shares”) are listed on the New York Stock Exchange (“NYSE”) Arca. The Fund issues and redeems Shares, at net asset value (“NAV”) in blocks of 100,000 Shares, each of which is called a “Creation Unit.” Creation Units of the Fund are issued and redeemed principally in cash. Except when aggregated in Creation Units, Shares are not redeemable securities of the Fund.
2. SIGNIFICANT ACCOUNTING POLICIES
The following is a summary of significant accounting policies consistently followed by the Fund in the preparation of the financial statements. The accompanying financial statements were prepared in accordance with accounting principles generally accepted in the United States of America (“U.S. GAAP”). The preparation of financial statements in conformity with U.S. GAAP requires management to make certain estimates and assumptions that affect the reported amounts of assets and liabilities and disclosures of contingent assets and liabilities at the date of the financial statements and the reported amounts of revenue and expenses during the period. Actual results could differ from those estimates.
A. Portfolio Valuation
The Fund’s NAV is determined daily, as of the close of the NYSE, usually 4:00 p.m. Eastern time, each day the NYSE is open for trading. The NAV is computed by dividing the value of the Fund’s portfolio securities, cash and other assets (including accrued interest), less all liabilities (including accrued expenses), by the total number of shares outstanding.
Portfolio securities listed on any exchange other than the National Association of Securities Dealer Automated Quotation (“NAS-DAQ”) exchange are valued at the last sale price on the business day as of which such value is being determined. If there has been no sale on such day, the securities are valued at the mean of the most recent bid and asked prices on such day. Securities traded on the NASDAQ are valued at the NASDAQ Official Closing Price as determined by NASDAQ. Portfolio securities traded on more than one securities exchange are valued at the last sale price on the business day as of which such value is being determined at the close of the exchange representing the principal market for such securities. Portfolio securities traded in the over-the-counter market, but excluding securities traded on the NASDAQ, are valued at the closing bid prices. Short-term investments that mature in less than 60 days are valued at amortized cost, which approximates market value.
The Fund’s listed put options are valued at the mean of the most recent bid and asked prices. Other equity securities that are traded in over the counter markets are valued at the NASDAQ Official Closing Price as of the close of regular trading on the NYSE on the day the securities are valued or, if there are no sales, at the mean of the most recent bid and asked prices.
The Fund’s investments are valued at market value or, in the absence of market value with respect to any portfolio securities, at fair value according to procedures adopted by the Trust’s Board of Trustees (the “Board”). When market quotations are not readily available or when events occur that make established valuation methods unreliable, securities of the Fund may be valued in good faith by or under the direction of the Board. These securities generally include, but are not limited to, restricted securities (securities which may not be publicly sold without registration under the Securities Act of 1933) for which a pricing service is unable to provide a market price; securities whose trading has been formally suspended; a security whose market price is not available from a pre-established primary pricing source or the pricing source is not willing to provide a price; a security with respect to which an event has occurred that is most likely to materially affect the value of the security after the market has closed but before the calculation of the Fund’s NAV or make it difficult or impossible to obtain a reliable market quotation; or a security whose price, as provided by the pricing service, does not reflect the security’s “fair value” due to the security being de-listed from a national exchange or the security’s primary trading market is temporarily closed at a time when, under normal conditions, it would be open. As a general principle, the current “fair value” of a security would be the amount which the owner might reasonably expect to receive from the closing sale prices on the applicable exchange and fair value prices may not reflect the actual value of a security. A variety of factors may be considered in determining the fair value of such securities.
| | |
| | NOTES TO FINANCIAL STATEMENTS |
| | May 31, 2013 (Unaudited) |
B. Securities Transactions and Investment Income
Securities transactions are recorded as of the trade date. Realized gains and losses from securities transactions are recorded on the highest cost basis. Dividend income is recorded on the ex-dividend date. Interest income, if any, is recorded on the accrual basis.
C. Dividends and Distributions to Shareholders
Dividends from net investment income, if any, and any net short-term capital gains are distributed to shareholders following each 60 day period. Any other net income or capital gains will be distributed at least annually. Dividends may be declared and paid more frequently to improve Index tracking or to comply with the distribution requirements of the Internal Revenue Code. In addition, the Fund intends to distribute, at the end of each 60-day period out of net investment income and/or net short-term capital gains, an amount of cash equal to 1.5% of the Fund’s net assets at the end of such 60-day period. If the Fund’s net investment income and net short-term capital gains are insufficient to support a 1.5% distribution in any 60-day period, the distribution will be reduced by the amount of the shortfall. As a result of the Fund’s investment strategy, it is not expected that the Fund will have income from long-term capital gains.
While the Fund only intends to make such distributions out of net investment income and/or short-term capital gains, it is possible that in certain circumstances, a portion of a distribution may result in a return of capital (which is a return of the shareholder’s investment in the Fund). Section 19(a) of the Investment Company Act of 1940, as amended (the “1940 Act”), and Rule 19a-1 thereunder require the Fund to provide a written statement accompanying any such distribution that adequately discloses its source or sources to the extent the source includes something other than net investment income. Thus, if the source of the dividend or other distribution were the original capital contribution of the shareholder, and the payment amounted to a return of capital, the Fund would be required to provide written disclosure to that effect. Nevertheless, persons who periodically receive the payment of a dividend or other distribution may be under the impression that they are receiving net profits when they are not. Shareholders should read any written disclosure provided pursuant to Section 19(a) and Rule 19-1 carefully, and should not assume that the source of any distribution from the Fund is net profit.
D. Federal Tax and Tax Basis Information
The timing and character of income and capital gain distributions are determined in accordance with income tax regulations, which may differ from U.S. GAAP. Reclassifications are made to the Fund’s capital accounts for permanent tax differences to reflect income and gains available for distribution (or available capital loss carryforwards) under income tax regulations. The amounts and characteristics of tax basis distributions and composition of distributable earnings/(accumulated losses) are finalized at fiscal year end: accordingly, tax basis balances have not been determined as of May 31, 2013.
Distributions from net investment income and capital gains are determined in accordance with income tax regulations, which may differ from U.S. GAAP. These differences are primarily due to differing treatments of income and gains on various investment securities held by the Fund, timing differences and differing characterization of distributions made by the Fund. The tax character of the distributions paid was as follows:
As of May 31, 2013, the costs of investments for federal income tax purposes and accumulated net unrealized appreciation/ (depreciation) on investments were as follows:
| | | | | | |
| | | U.S. Equity High Volatility
Put Write Index Fund | | | |
Cost of investments for income tax purposes | | $ | 2,399,891 | | | |
| | | | | | | |
Gross Appreciation (excess of value over tax cost) | | $ | – | | | |
Gross Depreciation (excess of tax cost over value) | | | (37 | ) | | |
Net Unrealized Depreciation | | $ | (37 | ) | | |
| | | | | | | |
E. Income Taxes
No provision for income taxes are included in the accompanying financial statements, as the Fund intends to distribute to shareholders all taxable investment income and realized gains and otherwise comply with Subchapter M of the Internal Revenue Code of 1986, as amended, applicable to regulated investment companies.
| | | | |
| | | | |
10 | | Semi-Annual Report | | May 31, 2013 |
| | | | |
|
| NOTES TO FINANCIAL STATEMENTS |
| May 31, 2013 (Unaudited) |
The Fund evaluates tax positions taken (or expected to be taken) in the course of preparing the Fund’s tax returns to determine whether these positions meet a “more-likely-than-not” standard that, based on the technical merits, have a more than fifty percent likelihood of being sustained by a taxing authority upon examination. A tax position that meets the “more-likely-than-not” recognition threshold is measured to determine the amount of benefit to recognize in the financial statements.
As of and during the period ended May 31, 2013, the Fund did not have a liability for any unrecognized tax benefits. The Fund files U.S. federal, state, and local tax returns as required. The Fund’s tax returns are subject to examination by the relevant tax authorities until expiration of the applicable statute of limitations which is generally three years after the filing of the tax return. Being that the Fund commenced operations on February 27, 2013, no tax returns have been filed as of the date of this report.
F. Fair Value Measurements
The Fund discloses the classification of fair value measurements following a three-tier hierarchy based on the inputs used to measure fair value. Inputs refer broadly to the assumptions that market participants would use in pricing the asset or liability, including assumptions about risk. Inputs may be observable or unobservable. Observable inputs reflect the assumptions market participants would use in pricing the asset or liability that are developed based on market data obtained from sources independent of the reporting entity. Unobservable inputs reflect the reporting entity’s own assumptions about the assumptions market participants would use in pricing the asset or liability that are developed based on the best information available.
Various inputs are used in determining the value of the Fund’s investments as of the end of the reporting period. When inputs used fall into different levels of the fair value hierarchy, the level in the hierarchy within which the fair value measurement falls is determined based on the lowest level input that is significant to the fair value measurement in its entirety. The designated input levels are not necessarily an indication of the risk or liquidity associated with these investments. These inputs are categorized in the following hierarchy under applicable financial accounting standards:
Level 1 – Unadjusted quoted prices in active markets for identical investments, unrestricted assets or liabilities that a Fund has the ability to access at the measurement date;
Level 2 – Quoted prices which are not active, quoted prices for similar assets or liabilities in active markets or inputs other than quoted prices that are observable (either directly or indirectly) for substantially the full term of the asset or liability; and
Level 3 – Significant unobservable prices or inputs (including the Fund’s own assumptions in determining the fair value of investments) where there is little or no market activity for the asset or liability at the measurement date.
The following is a summary of the inputs used to value the Fund’s investments at May 31, 2013:
| | | | | | | | | | | | | | | | |
| Investments in Securities at Value | | Level 1 -
Unadjusted
Quoted Prices | | | Level 2 -
Other Significant
Observable Inputs | | | Level 3 -
Significant
Unobservable
Inputs | | | Total | |
Assets | | | | | | | | | | | | | | | | |
Short Term Investments | | $ | 2,399,854 | | | $ | – | | | $ | – | | | $ | 2,399,854 | |
TOTAL | | $ | 2,399,854 | | | $ | – | | | $ | – | | | $ | 2,399,854 | |
| | | | |
Other Financial Instruments* | | | | | | | | | | | | | | | | |
Liabilities | | | | | | | | | | | | | | | | |
Written Option Contracts | | $ | (13,194 | ) | | $ | – | | | $ | – | | | $ | (13,194 | ) |
TOTAL | | $ | (13,194 | ) | | $ | – | | | $ | – | | | $ | (13,194 | ) |
| * | Other financial instruments are instruments not reflected in the Schedule of Investments, such as written option contracts. |
The Fund recognizes transfers between levels as of the end of the period. For the period ended May 31, 2013, the Fund did not have any transfers between Level 1 and Level 2 securities. The Fund did not have any securities which used significant unobservable inputs (Level 3) in determining fair value.
| | |
| | NOTES TO FINANCIAL STATEMENTS |
| | May 31, 2013 (Unaudited) |
G. Derivative Instruments and Hedging Activities: The following discloses the Fund’s use of derivative instruments and hedging activities.
The Fund’s investment objective permits the Fund to purchase derivative contracts including written options. In doing so, the Fund will employ strategies in differing combinations to permit them to increase, decrease, or change the level or types of exposure to market factors. Central to those strategies are features inherent to derivatives that make them more attractive for this purpose than equity or debt securities; they require little or no initial cash investment, they can focus exposure on only certain selected risk factors, and they may not require the ultimate receipt or delivery of the underlying security (or securities) to the contract. This may allow the Fund to pursue its objectives more quickly and efficiently than if it were to make direct purchases or sales of securities capable of affecting a similar response to market factors.
Market Risk Factors: In pursuit of the Fund’s investment objective, the Fund will use derivatives to increase or decrease its exposure to the following market risk factors:
Equity Risk: The value of the options sold by the Fund is based on the value of the stocks underlying such options. Accordingly, the Fund is exposed to equity risk, which is the risk that the value of the stocks underlying options written by the Fund will fall due to general market and economic conditions, perceptions regarding the industries in which the issuers of such stock participate, or factors relating to specific companies. In such event, the value of the options sold by the Fund will likely decline. Additionally, if the value of the stocks underlying the options sold by the Fund increases, the Fund’s returns will not increase accordingly.
The Fund will seek to track the performance of the Index by selling listed 60-day put options in proportion to their weightings in the Index. By selling an option, the Fund will receive premiums from the buyer of the option, which will increase the Fund’s return if the option is not exercised and thus expires worthless. However, if the option’s underlying stock declines below the strike price, the option will finish in-the-money and the Fund will be required to buy the underlying stock at the strike price, effectively paying the buyer the difference between the strike price and the closing price. Therefore, by writing a put option, the Fund is exposed to the amount by which the price of the underlying stock is less than the strike price. Accordingly, the potential return to the Fund is limited to the amount of option premiums it receives, while the Fund can potentially lose up to the entire strike price of each option it sells. Further, if the value of the stocks underlying the options sold by the Fund increases, the Fund’s returns will not increase accordingly.
As the seller of a listed put option, the Fund incurs an obligation to buy the underlying instrument from the purchaser of the option at the option’s strike price, upon exercise by the option purchaser. If a listed put option sold by the Fund is exercised prior to the end of a 60-day period, the Fund will buy the underlying stock at the time of exercise and at the strike price, and will hold the stock until the end of the 60-day period.
Each put option sold by the Fund will be covered through investments in three month Treasury bills at least equal to the Fund’s maximum liability under the option (i.e., the strike price).
Every 60 days, the options included within the Index are exercised or expire and new option positions are established, and the Fund will enter into new option positions accordingly and sell any underlying stocks it owns as a result of the Fund’s prior option positions having been exercised. This 60-day cycle likely will cause the Fund to have frequent and substantial portfolio turnover. If the Fund receives additional inflows (and issues more Shares accordingly in large numbers known as “Creation Units,” as further defined herein) during a 60-day period, the Fund will sell additional listed put options which will be exercised or expire at the end of such 60-day period. Conversely, if the Fund redeems Shares in Creation Unit size during a 60-day period, the Fund will terminate the appropriate portion of the options it has sold accordingly.
Put Option Risk: Options are generally subject to volatile swings in price based on changes in value of the underlying instrument, and the options written by the Fund may be particularly subject to this risk because the underlying stocks are selected by the Index Provider to have high volatility. The Fund will incur a form of economic leverage through its use of options, which will increase the volatility of the Fund’s returns and may increase the risk of loss to the Fund. While the Fund will collect premiums on the options it writes, the Fund’s risk of loss if one or more of its options is exercised and expires in-the-money may substantially outweigh the gains to the Fund from the receipt of such option premiums. The Fund will either earmark or segregate sufficient liquid assets to cover its obligations under each option on an ongoing basis. Moreover, the options sold by the Fund may have imperfect correlation to the returns of their underlying stocks.
Volatility Risk: When the Fund sells a listed put option, it gains the amount of the premium it receives, but also incurs a corresponding liability representing the value of the option it has sold (until the option is exercised and finishes in the money or
| | | | |
| | | | |
12 | | Semi-Annual Report | | May 31, 2013 |
| | | | |
|
| NOTES TO FINANCIAL STATEMENTS |
| May 31, 2013 (Unaudited) |
expires worthless). The value of the options in which the Fund invests is partly based on the volatility used by market participants to price such options (i.e., implied volatility). Accordingly, increases in the implied volatility of such options will cause the value of such options to increase (even if the prices of the options’ underlying stocks do not change), which will result in a corresponding increase in the liabilities of the Fund under such options and thus decrease the Fund’s NAV. The Fund is therefore exposed to implied volatility risk before the options expire or are exercised. This is the risk that the value of the implied volatility of the options sold by the Fund will increase due to general market and economic conditions, perceptions regarding the industries in which the issuers of such stock participate, or factors relating to specific companies.
Transactions in written option contracts during the period ended May 31, 2013, were as follows:
| | | | | | | | | | |
| | | Written Put Options | |
| | | Number of Contracts | | Premiums Received | |
Options outstanding at February 27, 2013(1) | | | – | | | | | $ | – | |
Options written | | | (1,724 | ) | | | | | 107,920 | |
Options expired | | | 900 | | | | | | (41,373 | ) |
Options closed | | | 7 | | | | | | (4,354 | ) |
Options outstanding at May 31, 2013 | | | (817 | ) | | | | $ | 62,193 | |
| | | | | | | | | | |
| | | | | | | | | | | |
| | | | | | | | | | |
Market Value at end of period | | | | | | | | $ | (13,194 | ) |
| | | | | | | | | | |
| | | | | | | | | | | |
| (1) | The Fund commenced operations on February 27, 2013. |
The effect of derivatives instruments on the Statement of Assets and Liabilities as of May 31, 2013:
| | | | | | | | |
| | | Liability Derivatives | | | |
| Risk Exposure | | Statement of Assets and Liabilities Location | | Fair Value | | | |
Equity Contracts (Written Options) | | Options written, at value | | $ | 13,194 | | | |
The effect of derivatives instruments on the Statement of Operations for the period ended May 31, 2013:
| | | | | | | | | | |
| Risk Exposure | | Statement of Operations Location | | Realized Gain/(Loss) on
Derivatives Recognized
in Income | | | Change in Unrealized
Gain/(Loss) on Derivatives
Recognized in Income | |
| Equity Contracts (Written Options) | | Net realized gain on written option contracts/Net change in unrealized appreciation on written option contracts | | $ | 44,306 | | | $ | 48,999 | |
The average written option contracts volume and the average notional value during the period ended May 31, 2013, were as follows:
| | |
| Average Written Option Contract Volume | | Average Written Option Contract Notional Value |
862 | | $ 27,663 |
3. INVESTMENT ADVISORY FEE AND OTHER AFFILIATED TRANSACTIONS
ALPS Advisors, Inc. (the “Investment Adviser”) acts as the Fund’s investment adviser pursuant to an advisory agreement with the Trust on behalf of the Fund (the “Advisory Agreement”). Pursuant to the Advisory Agreement, the Fund pays the Investment Adviser a unitary fee for the services and facilities it provides payable on a monthly basis at the annual rate of 0.95% of the Fund’s average daily net assets. From time to time, the Investment Adviser may waive all or a portion of its fee.
Out of the unitary management fee, the Investment Adviser pays substantially all expenses of the Fund, including the licensing fee of the Index provider, and the cost of transfer agency, custody, fund administration, legal, audit, trustees and other services, except for interest expenses, distribution fees or expenses, brokerage expenses, taxes and extraordinary expenses not incurred in the ordinary course of the Fund’s business. In addition, the Investment Adviser’s unitary management fee is designed to compensate the Investment Adviser for providing services for the Fund.
Rich Investment Solutions, LLC acts as the Fund’s sub-adviser (“Sub-Adviser”) pursuant to a sub-advisory agreement with the Investment Adviser (the ‘‘Sub-Advisory Agreement’’). Pursuant to the Sub-Advisory Agreement, the Adviser pays the Sub-Adviser on a monthly basis a portion of the advisory fees it receives from the Fund, on an annual rate of 0.80% of average net assets.
| | |
| | NOTES TO FINANCIAL STATEMENTS |
| | May 31, 2013 (Unaudited) |
ALPS Fund Services, Inc. (“ALPS”), an affiliate of the Investment Adviser, is the administrator of the Fund.
The Bank of New York Mellon is the custodian, fund accounting agent and transfer agent for the Fund.
Each Trustee who is not an officer or employee of the Investment Adviser, any sub-adviser or any of their affiliates (“Independent Trustees”) is paid a quarterly retainer of $5,000, $3,750 for each regularly scheduled Board meeting attended and $1,500 for each special meeting held outside of regularly scheduled meetings.
4. PURCHASES AND SALES OF SECURITIES
For the period ended May 31, 2013, the cost of purchases and proceeds from sales, excluding short-term investments and written options, were as follows:
| | | | | | | | | | | | | | |
| | | | | Purchases | | | | | Sales | | | |
U.S. Equity Volatility Put Write Index Fund | | | | $ | – | | | | | $ | – | | | |
5. CAPITAL SHARE TRANSACTIONS
Shares are created and redeemed by the Fund on a cash basis only in Creation Unit size aggregations of 100,000. Only broker-dealers or large institutional investors with creation and redemption agreements called Authorized Participants (“AP”) are permitted to purchase or redeem Creation Units from the Fund.
6. INDEMNIFICATIONS
Under the Trust’s organizational documents, its officers and Trustees are indemnified against certain liability arising out of the performance of their duties to the Trust. Additionally, in the normal course of business, the Trust enters into contracts with service providers that contain general indemnification clauses. The Trust’s maximum exposure under these arrangements is unknown, as this would involve future claims that may be made against the Trust that have not yet occurred.
7. NEW ACCOUNTING PRONOUNCEMENTS
In December 2011, the Financial Accounting Standards Board (FASB) issued Accounting Standards Update (ASU) No. 2011-11, Balance Sheet (Topic 210): Disclosures about Offsetting Assets and Liabilities. The amendments in the ASU enhance disclosures about offsetting of financial assets and liabilities to enable investors to understand the effect of these arrangements on a Fund’s financial position. In January 2013, FASB issued ASU No. 2013-01, Balance Sheet (Topic 210): Clarifying the Scope of Disclosures about Offsetting Assets and Liabilities. The amendments in ASU No. 2013-01 clarify the intended scope of disclosures required by ASU No. 2011-11. These ASUs are effective for interim and annual reporting periods beginning on or after January 1, 2013. At this time, management is evaluating the implications of these changes on the financial statements.
| | | | |
| | | | |
14 | | Semi-Annual Report | | May 31, 2013 |
| | | | |
|
| ADDITIONAL INFORMATION |
| May 31, 2013 (Unaudited) |
PROXY VOTING POLICIES AND PROCEDURES
A description of the Fund’s proxy voting policies and procedures used in determining how to vote for proxies and information regarding how the Fund voted proxies related to portfolio securities during the most recent 12-month period ended June 30th is available without charge, (1) on the Securities and Exchange Commission’s (“SEC”) website at http://www.sec.gov; (2) upon request, by calling (toll-free) 1-866-513-5856; and (3) on the Trust’s website located at http://www.alpsfunds.com.
PORTFOLIO HOLDINGS
The Trust will file its complete schedule of portfolio holdings with the SEC for the first and third quarters of each fiscal year on Form N-Q. The Trust’s Form N-Q will be available (1) on the SEC’s website at http://www.sec.gov; (2) by calling (toll-free) 1-866-513-5856; (3) on the Trust’s website located at http://www.alpsfunds.com; and (4) for review and copying at the SEC’s Public Reference Room (“PRR”) in Washington D.C. Information regarding the operation of the PRR may be obtained by calling (toll-free) 1-800-732-0330.
| | |
| | BOARD CONSIDERATIONS REGARDING APPROVAL OF INVESTMENT ADVISORY AGREEMENT |
| | May 31, 2013 (Unaudited) |
At an in-person meeting held on March 12, 2012, the Board of Trustees of the Trust (the “Board”), including the Trustees who are not “interested persons” of the Trust within the meaning of the 1940 Act, as amended (the “Independent Trustees”), evaluated a proposal to approve the Advisory Agreement between the Trust and ALPS Advisors, Inc. (the “Adviser”) and the Sub-Advisory Agreement with Rich Investment Solutions, LLC (the “Sub-Adviser”) with respect to the U.S. High Volatility Put Write Index Fund (“HVPWIF”). The Independent Trustees also met separately to consider the Advisory and Sub-Advisory Agreements.
In evaluating the Advisory and Sub-Advisory Agreements, the Board considered various factors, including (i) the nature, extent and quality of the services expected to be provided by the Adviser and Sub-Adviser with respect to the Fund under the Advisory and Sub-Advisory Agreements, (ii) costs to the Adviser and Sub-Adviser of their respective services; and (iii) the extent to which economies of scale would be realized if and as the Fund grows, and whether the fee level in the Advisory and Sub-Advisory Agreements reflects these economies of scale.
The Board of Trustees, including a majority of the Independent Trustees, determined that approval of the Advisory and Sub-Advisory Agreements was in the best interests of the Fund. The Board of Trustees, including the Independent Trustees, did not identify any single factor or group of factors as all important or controlling and considered all factors together. In evaluating whether to approve the Advisory and Sub-Advisory Agreements for the Fund, the Board considered numerous factors, as described below.
With respect to the nature, extent and quality of the services to be provided by the Adviser under the Advisory Agreement and the Sub-Adviser under the Sub-Advisory Agreement, the Board considered and reviewed information concerning the services proposed to be provided under the Advisory and the Sub- Advisory Agreements, the proposed investment parameters of the index for the Fund, financial information regarding the Adviser, its parent company and the Sub-Adviser, information describing the Adviser’s and Sub-Adviser’s current organizations and the background and experience of the persons who would be responsible for the day-today management of the Fund, the anticipated financial support of the Fund, the nature and quality of services provided to other exchange-traded (“ETFs”), open-end and closed-end funds by the Adviser and the extensive prior experience with the types of put options to be sold by the Fund on the part of the personnel of the Sub-Adviser. Based upon their review, the Board concluded that the Adviser was qualified to oversee the services to be provided by other service providers and that the services to be provided by the Adviser to the Fund are expected to be satisfactory. The Board also concluded that the Sub-Adviser was qualified to manage the Fund and that the services to be provided by the Sub-Adviser to the Fund are expected to be satisfactory.
With respect to the costs of services to be provided and profits to be realized by the Adviser and Sub-Adviser, the Board considered the resources involved in managing the Fund as well as the fact that the Adviser agreed to pay all of the Fund’s expenses (except for interest expenses, distribution fees or expenses, brokerage expenses, taxes and extraordinary expenses such as litigation and other expenses not incurred in the ordinary course of the Fund’s business) out of the unitary advisory fee. Based on its review, the Board concluded that the expected profitability of the Fund to the Adviser and the Sub-Adviser, respectively, were not unreasonable.
The Board also reviewed information provided by the Adviser showing the proposed advisory fee for the Fund as compared to those of a peer group of ETFs and other open-end funds compiled using Lipper fee data as well as other comparative fee data. The Board noted the services to be provided by the Adviser for the annual advisory fee of 0.95% of the Fund’s average daily net assets. The Board also noted that the Sub-Adviser would receive an annual fee of 0.80% of the Fund’s average daily net assets out of the advisory fee. The Board also considered that the advisory fee was a unitary one and that, as set forth above, the Adviser had agreed to pay all of the Fund’s expenses (except for interest expenses, marketing fees, distribution fees or expenses, brokerage expenses, taxes and extraordinary expenses such as litigation and other expenses not incurred in the ordinary course of the Fund’s business) out of the unitary fee. The Board considered that, taking into account the impact of the Fund’s unitary advisory fee, the Fund’s expense ratio was expected to be within range of the expense ratios of the peer group of ETFs and other open-end funds provided by the Adviser. The Board considered the extent to which economies of scale would be realized as the Fund grows and whether fee levels reflect a reasonable sharing of such economies of scale for the benefit of Fund investors. Because the Fund is newly organized, the Board reviewed the Fund’s proposed unitary advisory fee and anticipated expenses and determined to review economies of scale in the future when the Fund had attracted assets.
The Board also considered other benefits that may be realized by the Adviser and/or the Sub-Adviser from their relationship with the Fund.
In voting to approve the Advisory and Sub-Advisory Agreements, the Trustees, including the Independent Trustees, concluded that the terms of the Advisory and Sub-Advisory Agreements are reasonable and fair in light of the services to be performed, the fees paid by certain other funds, expenses to be incurred and such other matters as the Trustees considered relevant in the exercise of their reasonable business judgment.
| | | | |
| | | | |
16 | | Semi-Annual Report | | May 31, 2013 |
| | | | |
This report has been prepared for shareholders of the ETF described herein and may be distributed to others only if preceded or accompanied by a prospectus.
ALPS Portfolio Solutions Distributors, Inc., distributor for the ETF.
RIS000132

| | |

| | PERFORMANCE OVERVIEW |
| | ALPS | GS MOMENTUM BUILDER® GROWTH MARKETS EQUITIES AND U.S. TREASURIES INDEX ETF May 31, 2013 (Unaudited) |
The ALPS | GS Momentum Builder® Growth Markets Equities and U.S. Treasuries Index ETF (the “Fund”) seeks investment results that correspond generally, before fees and expenses, to the performance of the GS Momentum Builder® Growth Markets Equities and U.S. Treasuries Index (the “Index”). The Fund is a “fund of funds” as it principally invests its assets in the ETFs included in the Index (“Underlying ETFs”), instead of individual securities. The Underlying ETFs are also passively managed and seek investment results that correspond to their own indexes. The Underlying ETFs primarily invest in emerging markets equity securities and U.S. Treasury securities.
FUND PERFORMANCE as of May 31, 2013
| | | | | | |
| | | 3 Months | | YTD | | Since Inception* |
ALPS | GS Momentum Builder® Growth Markets Equities and U.S. Treasuries Index ETF - NAV | | -3.02% | | -7.64% | | -6.24% |
ALPS | GS Momentum Builder® Growth Markets Equities and U.S. Treasuries Index ETF - Market Price** | | -3.02% | | -7.60% | | 6.20% |
GS Momentum Builder® Growth Markets Equities and U.S. Treasuries Index*** | | -2.81% | | -7.32% | | -5.87% |
MSCI EM TR Net Index**** | | -3.52% | | -3.42% | | -3.16% |
Total Expense Ratio (per the current prospectus) 1.29%
Performance data quoted represent past performance. Past performance is no guarantee of future results so that shares, when redeemed may be worth more or less than their original cost. The investment return and principal value will fluctuate. Current performance may be higher or lower than the performance quoted. Call 1-866-759-5679 for current month end performance.
NAV is an exchange-traded fund’s per-share value. The per-share dollar amount of the fund is derived by dividing the total value of all the securities in its portfolio, less any liabilities, by the number of fund shares outstanding. Market Price is the price at which a share can currently be traded in the market. Information detailing the number of days the Market Price of the Fund was greater than the Fund’s NAV and the number of days it was less than the Fund’s NAV can be obtained at www.alpsfunds.com.
| * | Fund inception date of 12/20/2012. |
| ** | Market Price is based on the midpoint of the bid/ask spread at 4 p.m. ET and does not represent the returns an investor would receive if shares were traded at other times. |
| *** | GS Momentum Builder® Growth Markets Equities and U.S. Treasuries Index holds ETFs whose underlying indexes track the equity markets of large emerging-markets countries and ETFs that track U.S. bond markets. |
| **** | The MSCI EM (Emerging Markets) TR (Total Return) Net Index is a free float-adjusted market capitalization index that is designed to measure equity market performance of emerging markets. |
An investor cannot invest directly in an index.
TOP HOLDINGS (as a % of Total Investments) as of May 31, 2013
| | | | |
iShares®MSCI Mexico Capped Investable Market Index Fund | | | 30.13 | % |
iShares® MSCI Turkey Index Fund | | | 29.93 | % |
Market Vectors® Indonesia Index ETF | | | 29.83 | % |
iShares® Barclays® 7-10 Year Treasury Bond Fund | | | 10.11 | % |
Top Holdings | | | 100.00 | % |
Holdings are subject to change.
GROWTH OF $10,000 as of May 31, 2013
Comparison of Change in Value of $10,000 Investment in the Fund and the Index.
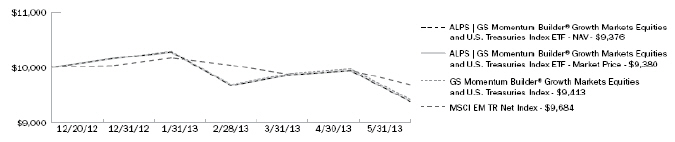
The chart above represents historical performance of a hypothetical investment of $10,000 in the Fund over the life of the Fund. Performance calculations are as of the end of each month. Past performance does not guarantee future results. This chart does not reflect the deduction of taxes that a shareholder would pay on Fund distributions or the redemption of Fund shares.
| | |
| | | |
2 | | Semi-Annual Report | May 31, 2013 |
| | | |
|
PERFORMANCE OVERVIEW |
ALPS | GS MOMENTUM BUILDER® MULTI-ASSET INDEX ETF May 31, 2013 (Unaudited) |
The ALPS | GS Momentum Builder® Multi-Asset Index ETF (the “Fund”) seeks investment results that closely correspond generally, before fees and expenses, to the performance of the GS Momentum Builder® Multi-Asset Index (the “Index”). The Fund is a fund of funds as it principally invests its assets in the ETFs included in the Index (“Underlying ETFs”), instead of individual securities. The Underlying ETFs are also passively managed and seek investment results that correspond to their own indexes (with the exception of one Underlying ETF which is actively managed). The Underlying ETFs invest across asset classes. The Underlying ETFs primarily invest in global equities, including emerging markets, as well as commodities, real estate and U.S. and international fixed income securities.
FUND PERFORMANCE as of May 31, 2013
| | | | | | |
| | | 3 Months | | YTD | | Since Inception* |
ALPS | GS Momentum Builder® Multi-Asset Index ETF - NAV | | -0.83% | | -1.10% | | -0.55% |
ALPS | GS Momentum Builder® Multi-Asset Index ETF - Market Price** | | -0.74% | | -0.98% | | -0.43% |
GS Momentum Builder® Multi-Asset Index*** | | -0.58% | | -0.72% | | -0.16% |
60% S&P 500® Total Return Index and 40% Barclays US Aggregate Index | | 4.59% | | 8.64% | | 8.37% |
Total Expense Ratio (per the current prospectus) 1.14%
Performance data quoted represent past performance. Past performance is no guarantee of future results so that shares, when redeemed may be worth more or less than their original cost. The investment return and principal value will fluctuate. Current performance may be higher or lower than the performance quoted. Call 1-866-759-5679 for current month end performance.
NAV is an exchange-traded fund’s per-share value. The per-share dollar amount of the fund is derived by dividing the total value of all the securities in its portfolio, less any liabilities, by the number of fund shares outstanding. Market Price is the price at which a share can currently be traded in the market. Information detailing the number of days the Market Price of the Fund was greater than the Fund’s NAV and the number of days it was less than the Fund’s NAV can be obtained at www.alpsfunds.com.
| * | Fund inception date of 12/20/2012. |
| ** | Market Price is based on the midpoint of the bid/ask spread at 4 p.m. ET and does not represent the returns an investor would receive if shares were traded at other times. |
| *** | GS Momentum Builder® Multi-Asset Index holds ETFs spanning across United States, developed and emerging equity markets, commodities, real estate, as well as global fixed income markets. |
S&P 500® Total Return Index (SPXTR) is a domestic equity index consisting of 500 stocks representing approximately 75% of the total U.S. equity market focusing on the large-cap sector of the U.S. equities market.
Barclay’s US Aggregate Index is a benchmark index composed of US securities in Treasury, Government-Related, Corporate, and Securitized sectors.
An investor cannot invest directly in an index.
TOP HOLDINGS (as a % of Total Investments) as of May 31, 2013
| | | | |
iShares® MSCI EAFE Index Fund | | | 30.26 | % |
iShares® Dow Jones® U.S. Real Estate Index Fund | | | 29.20 | % |
iShares® Russell 1000® Index Fund | | | 21.23 | % |
iShares® Barclays® 20+ Year Treasury Bond Fund | | | 17.66 | % |
iShares® Russell 2000®Index Fund | | | 1.65 | % |
Top Holdings | | | 100.00 | % |
Holdings are subject to change.
GROWTH OF $10,000 as of May 31, 2013
Comparison of Change in Value of $10,000 Investment in the Fund and the Index.
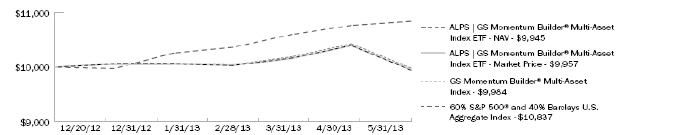
The chart above represents historical performance of a hypothetical investment of $10,000 in the Fund over the life of the Fund. Performance calculations are as of the end of each month. Past performance does not guarantee future results. This chart does not reflect the deduction of taxes that a shareholder would pay on Fund distributions or the redemption of Fund shares.
| | |
| | PERFORMANCE OVERVIEW |
| | ALPS | GS MOMENTUM BUILDER® ASIA EX-JAPAN EQUITIES AND U.S. TREASURIES INDEX ETF May 31, 2013 (Unaudited) |
The ALPS | GS Momentum Builder® Asia ex-Japan Equities and U.S. Treasuries Index ETF (the “Fund”) seeks investment results that correspond generally, before fees and expenses, to the performance of the GS Momentum Builder® Asia ex-Japan Equities and U.S. Treasuries Index (the “Index”). The Fund is a fund of funds as it principally invests its assets in the ETFs included in the Index (“Underlying ETFs”), instead of individual securities. The Underlying ETFs are also passively managed and seek investment results that correspond to their own indexes. The Underlying ETFs invest primarily in securities of equity markets in Asia (excluding Japan) and U.S. Treasury securities.
FUND PERFORMANCE as of May 31, 2013
| | | | | | |
| | | 3 Months | | YTD | | Since Inception 1 |
ALPS | GS Momentum Builder® Asia ex-Japan Equities and U.S. Treasuries Index ETF - NAV | | -6.73% | | -5.52% | | -4.08% |
ALPS | GS Momentum Builder® Asia ex-Japan Equities and U.S. Treasuries Index ETF - Market Price** | | -6.72% | | -5.51% | | -4.00% |
GS Momentum Builder® Asia Ex-Japan Equities and U.S. Treasuries Index*** | | -6.50% | | -5.16% | | -3.69% |
MSCI AC Asia Ex-Japan TR Net Index**** | | -1.53% | | -0.01% | | 0.21% |
Total Expense Ratio (per the current prospectus) 1.22%
Performance data quoted represent past performance. Past performance is no guarantee of future results so that shares, when redeemed may be worth more or less than their original cost. The investment return and principal value will fluctuate. Current performance may be higher or lower than the performance quoted. Call 1-866-759-5679 for current month end performance.
NAV is an exchange-traded fund’s per-share value. The per-share dollar amount of the fund is derived by dividing the total value of all the securities in its portfolio, less any liabilities, by the number of fund shares outstanding. Market Price is the price at which a share can currently be traded in the market. Information detailing the number of days the Market Price of the Fund was greater than the Fund’s NAV and the number of days it was less than the Fund’s NAV can be obtained at www.alpsfunds.com.
| * | Fund inception date of 12/20/2012. |
| ** | Market Price is based on the midpoint of the bid/ask spread at 4 p.m. ET and does not represent the returns an investor would receive if shares were traded at other times. |
| *** | GS Momentum Builder® Asia ex-Japan Equities and U.S. Treasuries Index holds ETFs that track the following equity markets in Asia: India, China, Thailand, Taiwan, Hong Kong, Indonesia, Singapore, Malaysia, South Korea and Australia as well as shares of ETFs who track U.S. fixed income markets. |
| **** | The MSCI AC (All Country) Asia ex–Japan TR (Total Return) Net Index is a free float-adjusted market capitalization weight-ed index that is designed to measure the equity market performance of Asia, excluding Japan. The MSCI AC Asia ex Japan Index consists of the following 10 developed and emerging market country indices: China, Hong Kong, India, Indonesia, Korea, Malaysia, Philippines, Singapore, Taiwan, and Thailand. |
An investor cannot invest directly in an index.
TOP HOLDINGS (as a % of Total Investments) as of May 31, 2013
| | | | |
Market Vectors® Indonesia Index ETF | | | 30.93 | % |
iShares® MSCI Thailand Capped Investable Market Index Fund | | | 29.61 | % |
iShares® MSCI Australia Index Fund | | | 28.79 | % |
iShares® MSCI Taiwan Index Fund | | | 10.67 | % |
Top Holdings | | | 100.00 | % |
Holdings are subject to change.
GROWTH OF $10,000 as of May 31, 2013
Comparison of Change in Value of $10,000 Investment in the Fund and the Index.

The chart above represents historical performance of a hypothetical investment of $10,000 in the Fund over the life of the Fund. Performance calculations are as of the end of each month. Past performance does not guarantee future results. This chart does not reflect the deduction of taxes that a shareholder would pay on Fund distributions or the redemption of Fund shares.
| | |
| | | |
4 | | Semi-Annual Report | May 31, 2013 |
| | | |
|
PERFORMANCE OVERVIEW |
ALPS | GS RISK-ADJUSTED RETURN U.S. LARGE CAP INDEX ETF May 31, 2013 (Unaudited) |
The ALPS | GS Risk-Adjusted Return U.S. Large Cap Index ETF (the “Fund”) seeks investment results that correspond generally, before fees and expenses, to the performance of the GS Risk-Adjusted Return U.S. Large Cap Index (the “Index”). The Index includes U.S. securities within the Russell 1000® Index.
FUND PERFORMANCE as of May 31, 2013
| | | | | | |
| | | 3 Months | | YTD | | Since Inception 1 |
ALPS | GS Risk-Adjusted Return U.S. Large Cap Index ETF - NAV | | 11.77% | | 16.29% | | 15.13% |
ALPS | GS Risk-Adjusted Return U.S. Large Cap Index ETF - Market Price** | | 11.81% | | 16.28% | | 15.17% |
GS Risk-Adjusted Return U.S. Large Cap Index*** | | 11.95% | | 16.60% | | 15.45% |
Russell 1000® Total Return Index**** | | 8.09% | | 15.48% | | 14.82% |
Total Expense Ratio (per the current prospectus) 0.55%
Performance data quoted represent past performance. Past performance is no guarantee of future results so that shares, when redeemed may be worth more or less than their original cost. The investment return and principal value will fluctuate. Current performance may be higher or lower than the performance quoted. Call 1-866-759-5679 for current month end performance.
NAV is an exchange-traded fund’s per-share value. The per-share dollar amount of the fund is derived by dividing the total value of all the securities in its portfolio, less any liabilities, by the number of fund shares outstanding. Market Price is the price at which a share can currently be traded in the market. Information detailing the number of days the Market Price of the Fund was greater than the Fund’s NAV and the number of days it was less than the Fund’s NAV can be obtained at www.alpsfunds.com.
| * | Fund inception date of 12/20/2012. |
| ** | Market Price is based on the midpoint of the bid/ask spread at 4 p.m. ET and does not represent the returns an investor would receive if shares were traded at other times. |
| *** | Goldman Sachs Risk-Adjusted Return Index: designed to reflect the performance of a hypothetical portfolio of U.S. stocks that are anticipated to have the highest risk-adjusted returns based on a methodology developed by Goldman, Sachs & Co. |
| **** | The Russell 1000® Total Return Index measures the performance of the 1,000 largest companies in the Russell 3000 Index. |
An investor cannot invest directly in an index.
TOP TEN HOLDINGS (as a % of Total Investments) as of May 31, 2013
| | | | |
Vertex Pharmaceuticals, Inc. | | | 3.45 | % |
Micron Technology, Inc. | | | 3.30 | % |
Delta Air Lines, Inc. | | | 3.14 | % |
Warner Chilcott PLC, Class A | | | 2.77 | % |
Ford Motor Co. | | | 2.31 | % |
Harman International Industries, Inc. | | | 2.25 | % |
Prudential Financial, Inc. | | | 2.23 | % |
MetLife, Inc. | | | 2.22 | % |
Microsoft Corp. | | | 2.22 | % |
KBR, Inc. | | | 2.19 | % |
Top Ten Holdings | | | 26.08 | % |
Holdings are subject to change.
GROWTH OF $10,000 as of May 31, 2013
Comparison of Change in Value of $10,000 Investment in the Fund and the Index.
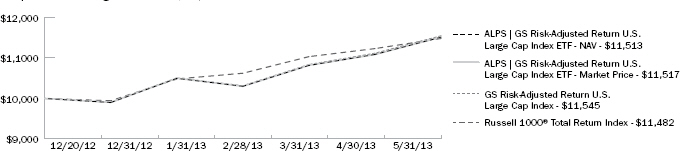
The chart above represents historical performance of a hypothetical investment of $10,000 in the Fund over the life of the Fund. Performance calculations are as of the end of each month. Past performance does not guarantee future results. This chart does not reflect the deduction of taxes that a shareholder would pay on Fund distributions or the redemption of Fund shares.
| | |
| | DISCLOSURE OF FUND EXPENSES |
| | May 31, 2013 (Unaudited) |
Shareholder Expense Example: As a shareholder of the Fund, you incur two types of costs: (1) transaction costs which may include creation and redemption fees or brokerage charges, and (2) ongoing costs, including management fees and other Fund expenses. These examples are intended to help you understand your ongoing costs (in dollars) of investing in the Fund and to compare these costs with the ongoing costs of investing in other funds. The example is based on an investment of $1,000 invested at the beginning of the (six month) period and held through May 31, 2013.
Actual Return: The first line of the table provides information about actual account values and actual expenses. You may use the information in this table, together with the amount you invested, to estimate the expenses that you incurred over the period. Simply divide your account value by $1,000 (for example, an $8,600 account value divided by $1,000 = 8.6), then multiply the result by the number in the first line of the table under the heading entitled “Expenses Paid During the Period” to estimate the expenses attributable to your investment during this period.
Hypothetical 5% Return: The second line of the table provides information about hypothetical account values and hypothetical expenses based on the Fund’s actual expense ratio and an assumed rate of return of 5% per year before expenses, which is not the Fund’s actual return. The hypothetical account values and expenses may not be used to estimate the actual ending account balance or expenses you paid for the period. You may use this information to compare ongoing costs of investing in the Fund and other funds. To do so, compare this 5% hypothetical example with the 5% hypothetical examples that appear in the shareholder reports of the other funds.
The expenses shown in the table are meant to highlight ongoing Fund costs only and do not reflect any transaction costs, such as creation and redemption fees, or brokerage charges. Therefore, the second line of the table is useful in comparing ongoing costs only, and will not help you determine the relative total costs of owning different funds. In addition, if these costs were included, your costs would have been higher.
| | | | | | | | | | | | | | | | | | | | |
| | | Beginning
Account Value
December 1,
2012 | | Ending
Account Value
May 31, 2013 | | Expense Ratio(a) | | Expenses Paid
During the Period
December 1,
2012 to May 31, 2013 |
| ALPS | GS Momentum Builder® Growth Markets Equities and U.S. Treasuries Index ETF | | | | | | | | | | | | | | | | | | | | |
Actual(c) | | | $ | 1,000.00 | | | | $ | 937.60 | | | | | 0.68 | % | | | $ | 2.94 | |
Hypothetical (5% return before expenses) | | | $ | 1,000.00 | | | | $ | 1,021.54 | | | | | 0.68 | % | | | $ | 3.43 | (b) |
| ALPS | GS Momentum Builder® Multi-Asset Index ETF | | | | | | | | | | | | | | | | | | | | |
Actual(c) | | | $ | 1,000.00 | | | | $ | 994.50 | | | | | 0.68 | % | | | $ | 3.03 | |
Hypothetical (5% return before expenses) | | | $ | 1,000.00 | | | | $ | 1,021.54 | | | | | 0.68 | % | | | $ | 3.43 | (b) |
| ALPS | GS Momentum Builder® Asia ex-Japan Equities and U.S. Treasuries Index ETF | | | | | | | | | | | | | | | | | | | | |
Actual(c) | | | $ | 1,000.00 | | | | $ | 959.20 | | | | | 0.68 | % | | | $ | 2.97 | |
Hypothetical (5% return before expenses) | | | $ | 1,000.00 | | | | $ | 1,021.49 | | | | | 0.68 | % | | | $ | 3.43 | (b) |
| ALPS | GS Risk-Adjusted Return U.S Large Cap Index ETF | | | | | | | | | | | | | | | | | | | | |
Actual(c) | | | $ | 1,000.00 | | | | $ | 1,151.30 | | | | | 0.55 | % | | | $ | 2.64 | |
Hypothetical (5% return before expenses) | | | $ | 1,000.00 | | | | $ | 1,022.19 | | | | | 0.55 | % | | | $ | 2.77 | (b) |
| (a) | Annualized based on the Fund’s most recent fiscal half year expenses. |
| (b) | Expenses are equal to the Fund’s annualized expense ratio multiplied by the average account value over the period, multiplied by the number of days in the most recent fiscal half year (182), then divided by 365. |
| (c) | The Fund commenced operations on December 20, 2012 and as such the actual expenses paid during the period were based on 163 days. |
| | |
| | | |
6 | | Semi-Annual Report | May 31, 2013 |
| | | |
|
SCHEDULE OF INVESTMENTS |
ALPS | GS MOMENTUM BUILDER® GROWTH MARKETS EQUITIES AND U.S. TREASURIES INDEX ETF May 31, 2013 (Unaudited) |
| | | | | | | | | | | | |
| Security Description | | | | | Shares | | | Value | |
EXCHANGE TRADED FUNDS (100.04%) | | | | | | | | | | | | |
Debt Funds (10.11%) | | | | | | | | | | | | |
iShares® Barclays® 7-10 Year Treasury Bond Fund | | | | | | | 9,002 | | | | $ 948,091 | |
| | | | | | | | | | | | |
| | | | | | | | | | | 948,091 | |
| | | | | | | | | | | | |
| | | |
Equity Funds (89.93%) | | | | | | | | | | | | |
iShares® MSCI Mexico Capped Investable Market Index Fund | | | | | | | 41,352 | | | | 2,826,409 | |
iShares® MSCI Turkey Index Fund | | | | | | | 40,516 | | | | 2,807,354 | |
Market Vectors® Indonesia Index ETF | | | | | | | 90,647 | | | | 2,797,366 | |
| | | | | | | | | | | | |
| | | | | | | | | | | 8,431,129 | |
| | | | | | | | | | | | |
| | | |
TOTAL EXCHANGE TRADED FUNDS | | | | | | | | | | | | |
(Cost $9,666,454) | | | | | | | | | | | 9,379,220 | |
| | | | | | | | | | | | |
| | | | | | | | | | | | |
| | | 7 Day Yield | | | Shares | | | Value | |
SHORT TERM INVESTMENTS (0.02%) | | | | | | | | | | | | |
Dreyfus Treasury Prime Cash Management, Institutional Class | | | 0.000% (1) | | | | 1,676 | | | | 1,676 | |
| | | | | | | | | | | | |
| | | |
TOTAL SHORT TERM INVESTMENTS | | | | | | | | | | | | |
(Cost $1,676) | | | | | | | | | | | 1,676 | |
| | | | | | | | | | | | |
| | | |
TOTAL INVESTMENTS (100.06%) | | | | | | | | | | | | |
(Cost $9,668,130) | | | | | | | | | | | $ 9,380,896 | |
| | | |
NET LIABILITIES LESS OTHER ASSETS (-0.06%) | | | | | | | | | | | (5,529 | ) |
| | | | | | | | | | | | |
| | | |
NET ASSETS (100.00%) | | | | | | | | | | | $ 9,375,367 | |
| | | | | | | | | | | | |
Common Abbreviations:
MSCI - Morgan Stanley Capital International.
ETF - Exchange Traded Fund.
See Notes to Financial Statements.
| | |
| | SCHEDULE OF INVESTMENTS |
| | ALPS | GS MOMENTUM BUILDER® MULTI-ASSET INDEX ETF May 31, 2013 (Unaudited) |
| | | | | | | | | | | | |
| Security Description | | | | | Shares | | | Value | |
EXCHANGE TRADED FUNDS (100.06%) | | | | | | | | | | | | |
Debt Funds (17.67%) | | | | | | | | | | | | |
iShares® Barclays® 20+ Year Treasury Bond Fund | | | | | | | 19,122 | | | $ | 2,189,278 | |
| | | | | | | | | | | | |
| | | | | | | | | | | 2,189,278 | |
| | | | | | | | | | | | |
| | | |
Equity Funds (82.39%) | | | | | | | | | | | | |
iShares® Dow Jones® U.S. Real Estate Index Fund | | | | | | | 52,678 | | | | 3,620,032 | |
iShares® MSCI EAFE Index Fund | | | | | | | 62,449 | | | | 3,751,936 | |
iShares® Russell 1000® Index Fund | | | | | | | 29,109 | | | | 2,632,036 | |
iShares® Russell 2000® Index Fund | | | | | | | 2,091 | | | | 204,604 | |
| | | | | | | | | | | | |
| | | | | | | | | | | 10,208,608 | |
| | | | | | | | | | | | |
| | | |
TOTAL EXCHANGE TRADED FUNDS | | | | | | | | | | | | |
(Cost $12,609,209) | | | | | | | | | | | 12,397,886 | |
| | | | | | | | | | | | |
| | | | | | | | | | | | |
| | | 7 Day Yield | | | Shares | | | Value | |
SHORT TERM INVESTMENTS (0.05%) | | | | | | | | | | | | |
Dreyfus Treasury Prime Cash Management, Institutional Class | | | 0.000% (1) | | | | 6,550 | | | | 6,550 | |
| | | | | | | | | | | | |
| | | |
TOTAL SHORT TERM INVESTMENTS | | | | | | | | | | | | |
(Cost $6,550) | | | | | | | | | | | 6,550 | |
| | | | | | | | | | | | |
| | | |
TOTAL INVESTMENTS (100.11%) | | | | | | | | | | | | |
(Cost $12,615,759) | | | | | | | | | | $ | 12,404,436 | |
| | | |
‘NET LIABILITIES LESS OTHER ASSETS (-0.11%) | | | | | | | | | | | (13,263 | ) |
| | | | | | | | | | | | |
| | | |
NET ASSETS (100.00%) | | | | | | | | | | $ | 12,391,173 | |
| | | | | | | | | | | | |
Common Abbreviations:
EAFE - Europe, Australasia, and Far East.
MSCI - Morgan Stanley Capital International.
See Notes to Financial Statements.
| | |
| | | |
8 | | Semi-Annual Report | May 31, 2013 |
| | | |
|
SCHEDULE OF INVESTMENTS |
ALPS | GS MOMENTUM BUILDER® ASIA EX-JAPAN EQUITIES AND U.S. TREASURIES INDEX ETF May 31, 2013 (Unaudited) |
| | | | | | | | | | | | |
| Security Description | | | | | Shares | | | Value | |
EXCHANGE TRADED FUNDS (100.05%) | | | | | | | | | | | | |
Equity Funds (100.05%) | | | | | | | | | | | | |
iShares® MSCI Australia Index Fund | | | | | | | 113,209 | | | $ | 2,763,432 | |
iShares® MSCI Taiwan Index Fund | | | | | | | 75,065 | | | | 1,023,887 | |
iShares® MSCI Thailand Capped Investable Market Index Fund | | | | | | | 33,259 | | | | 2,842,314 | |
Market Vectors® Indonesia Index ETF | | | | | | | 96,205 | | | | 2,968,886 | |
| | | | | | | | | | | | |
| | | |
TOTAL EXCHANGE TRADED FUNDS | | | | | | | | | | | | |
(Cost $9,912,547) | | | | | | | | | | | 9,598,519 | |
| | | | | | | | | | | | |
| | | | | | | | | | | | |
| | | 7 Day Yield | | | Shares | | | Value | |
SHORT TERM INVESTMENTS (0.01%) | | | | | | | | | | | | |
Dreyfus Treasury Prime Cash Management, Institutional Class | | | 0.000% (1) | | | | 1,390 | | | | 1,390 | |
| | | | | | | | | | | | |
| | | |
TOTAL SHORT TERM INVESTMENTS | | | | | | | | | | | | |
(Cost $1,390) | | | | | | | | | | | 1,390 | |
| | | | | | | | | | | | |
| | | |
TOTAL INVESTMENTS (100.06%) | | | | | | | | | | | | |
(Cost $9,913,937) | | | | | | | | | | $ | 9,599,909 | |
| | | |
NET LIABILITIES LESS OTHER ASSETS (-0.06%) | | | | | | | | | | | (5,962 | ) |
| | | | | | | | | | | | |
| | | |
NET ASSETS (100.00%) | | | | | | | | | | $ | 9,593,947 | |
| | | | | | | | | | | | |
Common Abbreviations:
MSCI - Morgan Stanley Capital International.
ETF - Exchange Traded Fund
See Notes to Financial Statements.
| | |
| | SCHEDULE OF INVESTMENTS |
ALPS | GS RISK-ADJUSTED RETURN U.S. LARGE CAP INDEX ETF May 31, 2013 (Unaudited) |
| | | | | | | | |
| Security Description | | Shares | | | Value | |
COMMON STOCKS (99.74%) | | | | | | | | |
Basic Materials (5.19%) | | | | | | | | |
Allegheny Technologies, Inc. | | | 7,563 | | | $ | 208,512 | |
Allied Nevada Gold Corp.(1) | | | 6,053 | | | | 46,729 | |
Carpenter Technology Corp. | | | 4,046 | | | | 194,855 | |
Newmont Mining Corp. | | | 4,245 | | | | 145,519 | |
| | | | | | | | |
| | | | | | | 595,615 | |
| | | | | | | | |
| | |
Communications (5.80%) | | | | | | | | |
IAC/InterActive Corp. | | | 4,078 | | | | 197,701 | |
Level 3 Communications, Inc.(1) | | | 10,313 | | | | 221,008 | |
Liberty Global, Inc., Class A(1) | | | 3,350 | | | | 246,895 | |
| | | | | | | | |
| | | | | | | 665,604 | |
| | | | | | | | |
| | |
Consumer, Cyclical (14.11%) | | | | | | | | |
CVS Caremark Corp. | | | 4,157 | | | | 239,360 | |
Delta Air Lines, Inc.(1) | | | 19,997 | | | | 360,146 | |
Ford Motor Co. | | | 16,862 | | | | 264,396 | |
GNC Holdings, Inc., Class A | | | 5,548 | | | | 249,827 | |
Harman International Industries, Inc. | | | 4,861 | | | | 258,119 | |
Nu Skin Enterprises, Inc., Class A | | | 4,230 | | | | 248,724 | |
| | | | | | | | |
| | | | | | | 1,620,572 | |
| | | | | | | | |
| | |
Consumer, Non-cyclical (27.85%) | | | | | | | | |
Apollo Group, Inc., Class A(1) | | | 10,090 | | | | 201,699 | |
Ariad Pharmaceuticals, Inc.(1) | | | 8,683 | | | | 159,246 | |
Beam, Inc. | | | 3,399 | | | | 220,391 | |
Cardinal Health, Inc. | | | 4,781 | | | | 224,516 | |
The Coca-Cola Co. | | | 5,148 | | | | 205,869 | |
Herbalife, Ltd. | | | 4,214 | | | | 196,667 | |
Hologic, Inc.(1) | | | 10,298 | | | | 213,684 | |
Iron Mountain, Inc. | | | 6,133 | | | | 219,807 | |
Medivation, Inc.(1) | | | 3,590 | | | | 174,330 | |
Mondelez International, Inc., Class A | | | 7,531 | | | | 221,863 | |
PepsiCo, Inc. | | | 2,774 | | | | 224,056 | |
UnitedHealth Group, Inc. | | | 3,582 | | | | 224,340 | |
Vertex Pharmaceuticals, Inc.(1) | | | 4,925 | | | | 395,527 | |
Warner Chilcott PLC, Class A | | | 16,502 | | | | 316,839 | |
| | | | | | | | |
| | | | | | | 3,198,834 | |
| | | | | | | | |
| | |
Energy (6.97%) | | | | | | | | |
Apache Corp. | | | 2,519 | | | | 206,885 | |
Devon Energy Corp. | | | 3,719 | | | | 211,426 | |
Newfield Exploration Co.(1) | | | 7,883 | | | | 187,537 | |
ONEOK, Inc. | | | 4,310 | | | | 194,553 | |
| | | | | | | | |
| | | | | | | 800,401 | |
| | | | | | | | |
| | |
Financial (10.66%) | | | | | | | | |
Essex Property Trust, Inc. | | | 1,368 | | | | 214,968 | |
MetLife, Inc. | | | 5,764 | | | | 254,826 | |
The PNC Financial Services Group, Inc. | | | 3,496 | | | | 250,453 | |
Prudential Financial, Inc. | | | 3,702 | | | | 255,327 | |
Reinsurance Group of America, Inc. | | | 3,774 | | | | 248,669 | |
| | | | | | | | |
| | | | | | | 1,224,243 | |
| | | | | | | | |
| | |
| | | |
10 | | Semi-Annual Report | May 31, 2013 |
| | | |
|
SCHEDULE OF INVESTMENTS |
ALPS | GS RISK-ADJUSTED RETURN U.S. LARGE CAP INDEX ETF May 31, 2013 (Unaudited) |
| | | | | | | | | | | | |
| Security Description | | | | | Shares | | | Value | |
Industrial (8.57%) | | | | | | | | | | | | |
CSX Corp. | | | | | | | 9,833 | | | $ | 247,890 | |
KBR, Inc. | | | | | | | 6,948 | | | | 250,822 | |
Tidewater, Inc. | | | | | | | 4,285 | | | | 236,061 | |
URS Corp. | | | | | | | 5,149 | | | | 249,418 | |
| | | | | | | | | | | | |
| | | | | | | | | | | 984,191 | |
| | | | | | | | | | | | |
| | | |
Technology (7.17%) | | | | | | | | | | | | |
Micron Technology, Inc.(1) | | | | | | | 32,389 | | | | 378,303 | |
MICROS Systems, Inc.(1) | | | | | | | 4,541 | | | | 191,630 | |
Microsoft Corp. | | | | | | | 7,277 | | | | 253,822 | |
| | | | | | | | | | | | |
| | | | | | | | | | | 823,755 | |
| | | | | | | | | | | | |
| | | |
Utilities (13.42%) | | | | | | | | | | | | |
AES Corp. | | | | | | | 18,204 | | | | 222,089 | |
Calpine Corp.(1) | | | | | | | 11,185 | | | | 227,167 | |
Edison International | | | | | | | 4,294 | | | | 197,266 | |
MDU Resources Group, Inc. | | | | | | | 9,426 | | | | 243,757 | |
NiSource, Inc. | | | | | | | 7,907 | | | | 227,168 | |
Westar Energy, Inc. | | | | | | | 6,820 | | | | 216,330 | |
Xcel Energy, Inc. | | | | | | | 7,212 | | | | 207,129 | |
| | | | | | | | | | | | |
| | | | | | | | | | | 1,540,906 | |
| | | | | | | | | | | | |
| | | |
TOTAL COMMON STOCKS | | | | | | | | | | | | |
(Cost $10,318,779) | | | | | | | | | | | 11,454,121 | |
| | | | | | | | | | | | |
| | | | | | | | | | | | |
| | | 7 Day Yield | | | Shares | | | Value | |
SHORT TERM INVESTMENTS (0.15%) | | | | | | | | | | | | |
Dreyfus Treasury Prime Cash Management, Institutional Class | | | 0.000% (2) | | | | 17,616 | | | | 17,616 | |
| | | | | | | | | | | | |
| | | |
TOTAL SHORT TERM INVESTMENTS | | | | | | | | | | | | |
(Cost $17,616) | | | | | | | | | | | 17,616 | |
| | | | | | | | | | | | |
| | | |
TOTAL INVESTMENTS (99.89%) | | | | | | | | | | | | |
(Cost $10,336,395) | | | | | | | | | | $ | 11,471,737 | |
| | | |
NET OTHER ASSETS AND LIABILITIES (0.11%) | | | | | | | | | | | 12,849 | |
| | | | | | | | | | | | |
| | | |
NET ASSETS (100.00%) | | | | | | | | | | $ | 11,484,586 | |
| | | | | | | | | | | | |
| (1) | Non-income producing security. |
Common Abbreviations:
Ltd. - Limited.
PLC - Public Liability Company.
See Notes to Financial Statements.
| | |
| | STATEMENTS OF ASSETS & LIABILITIES |
| | May 31, 2013 (Unaudited) |
| | | | | | | | | | | | | | | | |
| | | ALPS | GS Momentum Builder®
Growth Markets
Equities and U.S.
Treasuries Index ETF | | | ALPS | GS
Momentum Builder®
Multi-Asset Index ETF | | | ALPS | GS
Momentum Builder®
Asia ex-Japan
Equities and U.S.
Treasuries Index ETF | | | ALPS | GS Risk-
Adjusted Return U.S
Large Cap Index ETF | |
ASSETS: | | | | | | | | | | | | | | | | |
Investments, at value | | $ | 9,380,896 | | | $ | 12,404,436 | | | $ | 9,599,909 | | | $ | 11,471,737 | |
Cash | | | 6 | | | | – | | | | – | | | | – | |
Interest and dividends receivable | | | – | | | | – | | | | – | | | | 18,200 | |
Total Assets | | | 9,380,902 | | | | 12,404,436 | | | | 9,599,909 | | | | 11,489,937 | |
| | | | |
LIABILITIES: | | | | | | | | | | | | | | | | |
Payable to custodian | | | – | | | | 5,818 | | | | – | | | | – | |
Payable to advisor | | | 5,535 | | | | 7,445 | | | | 5,962 | | | | 5,351 | |
Total Liabilities | | | 5,535 | | | | 13,263 | | | | 5,962 | | | | 5,351 | |
NET ASSETS | | $ | 9,375,367 | | | $ | 12,391,173 | | | $ | 9,593,947 | | | $ | 11,484,586 | |
| | | | | | | | | | | | | | | | | |
| | | | |
NET ASSETS CONSIST OF: | | | | | | | | | | | | | | | | |
Paid-in capital | | $ | 10,264,782 | | | $ | 12,611,490 | | | $ | 10,215,105 | | | $ | 10,324,554 | |
Accumulated net investment income/(loss) | | | (25,979 | ) | | | 41,789 | | | | (27,166 | ) | | | 24,690 | |
Accumulated net realized gain/(loss) on investments | | | (576,202 | ) | | | (50,783 | ) | | | (279,964 | ) | | | – | |
Net unrealized appreciation/(depreciation) on investments | | | (287,234 | ) | | | (211,323 | ) | | | (314,028 | ) | | | 1,135,342 | |
NET ASSETS | | $ | 9,375,367 | | | $ | 12,391,173 | | | $ | 9,593,947 | | | $ | 11,484,586 | |
| | | | | | | | | | | | | | | | | |
| | | | |
INVESTMENTS, AT COST | | $ | 9,668,130 | | | $ | 12,615,759 | | | $ | 9,913,937 | | | $ | 10,336,395 | |
| | | | |
PRICING OF SHARES | | | | | | | | | | | | | | | | |
Net Assets | | $ | 9,375,367 | | | $ | 12,391,173 | | | $ | 9,593,947 | | | $ | 11,484,586 | |
Shares of beneficial interest outstanding (Unlimited number of shares authorized, par value $0.01 per share) | | | 400,002 | | | | 500,002 | | | | 400,002 | | | | 400,002 | |
Net Asset Value, offering and redemption price per share | | $ | 23.44 | | | $ | 24.78 | | | $ | 23.98 | | | $ | 28.71 | |
See Notes to Financial Statements.
| | |
| | | |
12 | | Semi-Annual Report | May 31, 2013 |
| | | |
|
STATEMENTS OF OPERATIONS |
For The Period December 20, 2012 (inception) to may 31, 2013 (Unaudited) |
| | | | | | | | | | | | | | | | |
| | | ALPS | GS
Momentum Builder®
Growth Markets
Equities and U.S.
Treasuries Index ETF | | | ALPS | GS
Momentum Builder®
Multi-Asset Index ETF | | | ALPS | GS
Momentum Builder®
Asia ex-Japan
Equities and U.S.
Treasuries Index ETF | | | ALPS | GS Risk-
Adjusted Return U.S
Large Cap Index ETF | |
INVESTMENT INCOME: | | | | | | | | | | | | | | | | |
Dividends(a) | | $ | – | | | $ | 105,900 | | | $ | – | | | $ | 74,338 | |
Total Investment Income | | | – | | | | 105,900 | | | | – | | | | 74,338 | |
| | | | |
EXPENSES: | | | | | | | | | | | | | | | | |
Investment advisory fee | | | 25,979 | | | | 30,188 | | | | 27,166 | | | | 22,976 | |
TOTAL EXPENSES | | | 25,979 | | | | 30,188 | | | | 27,166 | | | | 22,976 | |
NET INVESTMENT INCOME/(LOSS) | | | (25,979 | ) | | | 75,712 | | | | (27,166 | ) | | | 51,362 | |
| | | | |
Net realized gain/(loss) on investments | | | (576,202 | ) | | | (50,783 | ) | | | (279,964 | ) | | | – | |
Net change in unrealized appreciation/ (depreciation) on investments | | | (287,234 | ) | | | (211,323 | ) | | | (314,028 | ) | | | 1,135,342 | |
NET REALIZED AND UNREALIZED GAIN/ (LOSS) ON INVESTMENTS | | | (863,284 | ) | | | (262,106 | ) | | | (593,992 | ) | | | 1,135,342 | |
NET INCREASE/(DECREASE) IN NET ASSETS RESULTING FROM OPERATIONS | | $ | (889,415 | ) | | $ | (186,394 | ) | | $ | (621,158 | ) | | $ | 1,186,704 | |
| | | | | | | | | | | | | | | | | |
| (a) | Net of foreign tax witholdings of $0, $181, $0, and $0 respectively. |
See Notes to Financial Statements.
| | |
| | STATEMENTS OF CHANGES IN NET ASSETS |
| | For the Period December 20, 2012 (Inception) to May 31, 2013 (Unaudited) |
| | | | | | | | | | | | | | | | |
| | | ALPS | GS
Momentum Builder®
Growth Markets
Equities and U.S.
Treasuries Index ETF | | | ALPS | GS
Momentum Builder®
Multi-Asset Index ETF | | | ALPS | GS
Momentum Builder®
Asia ex-Japan
Equities and U.S.
Treasuries Index ETF | | | ALPS | GS Risk-
Adjusted Return U.S
Large Cap Index ETF | |
OPERATIONS: | | | | | | | | | | | | | | | | |
Net investment income/(loss) | | $ | (25,979 | ) | | $ | 75,712 | | | $ | (27,166 | ) | | $ | 51,362 | |
Net realized gain/(loss) on investments | | | (576,202 | ) | | | (50,783 | ) | | | (279,964 | ) | | | – | |
Net change in unrealized appreciation/ (depreciation) on investments | | | (287,234 | ) | | | (211,323 | ) | | | (314,028 | ) | | | 1,135,342 | |
Net decrease in net assets resulting from operations | | | (889,415 | ) | | | (186,394 | ) | | | (621,158 | ) | | | 1,186,704 | |
| | | | |
DISTRIBUTIONS TO SHAREHOLDERS: | | | | | | | | | | | | | | | | |
From net investment income | | | – | | | | (33,923 | ) | | | – | | | | (26,672 | ) |
Total distributions | | | – | | | | (33,923 | ) | | | – | | | | (26,672 | ) |
| | | | |
SHARE TRANSACTIONS: | | | | | | | | | | | | | | | | |
Proceeds from sale of shares | | | 14,164,135 | | | | 21,584,216 | | | | 12,845,595 | | | | 10,324,554 | |
Cost of shares redeemed | | | (3,899,353 | ) | | | (8,972,726 | ) | | | (2,630,490 | ) | | | – | |
Net increase from share transactions | | | 10,264,782 | | | | 12,611,490 | | | | 10,215,105 | | | | 10,324,554 | |
Net increase in net assets | | | 9,375,367 | | | | 12,391,173 | | | | 9,593,947 | | | | 11,484,586 | |
| | | | |
NET ASSETS: | | | | | | | | | | | | | | | | |
Beginning of period | | | – | | | | – | | | | – | | | | – | |
End of period* | | $ | 9,375,367 | | | $ | 12,391,173 | | | $ | 9,593,947 | | | $ | 11,484,586 | |
| | | | | | | | | | | | | | | | | |
*Including accumulated net investment income/(loss) of: | | $ | (25,979 | ) | | $ | 41,789 | | | $ | (27,166 | ) | | $ | 24,690 | |
| | | | |
OTHER INFORMATION: | | | | | | | | | | | | | | | | |
SHARE TRANSACTIONS: | | | | | | | | | | | | | | | | |
Beginning shares | | | – | | | | – | | | | – | | | | – | |
Shares sold | | | 550,002 | | | | 850,002 | | | | 500,002 | | | | 400,002 | |
Shares redeemed | | | (150,000 | ) | | | (350,000 | ) | | | (100,000 | ) | | | – | |
Shares outstanding, end of period | | | 400,002 | | | | 500,002 | | | | 400,002 | | | | 400,002 | |
| | | | | | | | | | | | | | | | | |
See Notes to Financial Statements.
| | |
| | | |
14 | | Semi-Annual Report | May 31, 2013 |
| | | |
|
FINANCIAL HIGHLIGHTS |
For the Period December 20, 2012 (Inception) to May 31, 2013 (Unaudited) |
| | | | | | | | | | | | | | | | | | | | |
| | | ALPS | GS
Momentum Builder®
Growth Markets
Equities and U.S.
Treasuries Index ETF | | ALPS | GS
Momentum Builder®
Multi-Asset Index ETF | | ALPS | GS
Momentum Builder®
Asia ex-Japan
Equities and U.S.
Treasuries Index ETF | | ALPS | GS Risk-
Adjusted Return U.S
Large Cap Index ETF |
NET ASSET VALUE, BEGINNING OF PERIOD | | | $ | 25.00 | | | | $ | 25.00 | | | | $ | 25.00 | | | | $ | 25.00 | |
| | | | |
INCOME FROM OPERATIONS: | | | | | | | | | | | | | | | | | | | | |
Net investment income/(loss)(a) | | | | (0.07 | ) | | | | 0.19 | | | | | (0.08 | ) | | | | 0.15 | |
Net realized and unrealized gain/(loss) on investments | | | | (1.49 | ) | | | | (0.33 | ) | | | | (0.94 | ) | | | | 3.63 | |
Total from Investment Operations | | | | (1.56 | ) | | | | (0.14 | ) | | | | (1.02 | ) | | | | 3.78 | |
| | | | |
LESS DISTRIBUTIONS: | | | | | | | | | | | | | | | | | | | | |
From net investment income | | | | – | | | | | (0.08 | ) | | | | – | | | | | (0.07 | ) |
Total Distributions | | | | – | | | | | (0.08 | ) | | | | – | | | | | (0.07 | ) |
NET INCREASE/(DECREASE) IN NET ASSET VALUE | | | | (1.56 | ) | | | | (0.22 | ) | | | | (1.02 | ) | | | | 3.71 | |
NET ASSET VALUE, END OF PERIOD | | | $ | 23.44 | | | | $ | 24.78 | | | | $ | 23.98 | | | | $ | 28.71 | |
| | | | | | | | | | | | | | | | | | | | | |
TOTAL RETURN(b) | | | | (6.24 | )% | | | | (0.55 | )% | | | | (4.08 | )% | | | | 15.13 | % |
| | | | |
RATIOS/ SUPPLEMENTAL DATA: | | | | | | | | | | | | | | | | | | | | |
Net assets, end of period (in 000s) | | | $ | 9,375 | | | | $ | 12,391 | | | | $ | 9,594 | | | | $ | 11,485 | |
| | | | |
RATIOS TO AVERAGE NET ASSETS: | | | | | | | | | | | | | | | | | | | | |
Operating expenses | | | | 0.68 | %(c) | | | | 0.68 | %(c) | | | | 0.68 | %(c) | | | | 0.55 | %(c) |
Net investment income/(loss) | | | | (0.68 | )%(c) | | | | 1.71 | %(c) | | | | (0.68 | )%(c) | | | | 1.23 | %(c) |
| | | | |
PORTFOLIO TURNOVER RATE(d) | | | | 91 | % | | | | 126 | % | | | | 79 | % | | | | 0 | % |
| (a) | Calculated using average shares outstanding. |
| (b) | Total return is calculated assuming an initial investment made at the net asset value at the beginning of the period and redemption at the net asset value on the last day of the period and assuming all distributions are reinvested at actual reinvestment prices. Total return calculated for a period of less than one year is not annualized. |
| (d) | Portfolio turnover is not annualized and does not include securities received or delivered from processing creations or redemptions. |
See Notes to Financial Statements.
| | |
| | NOTES TO FINANCIAL STATEMENTS |
| | May 31, 2013 (Unaudited) |
1. ORGANIZATION
The ALPS ETF Trust (the “Trust”), a Delaware statutory trust, is an open-end management investment company under the Investment Company Act of 1940, as amended (the “1940 Act”). As of May 31, 2013, the Trust consists of thirteen separate portfolios. Each portfolio represents a separate series of the Trust. This report pertains to the ALPS | GS Momentum Builder® Growth Markets Equities and U.S. Treasuries Index ETF, ALPS | GS Momentum Builder® Multi-Asset Index ETF, ALPS | GS Momentum Builder® Asia ex-Japan Equities and U.S. Treasuries Index ETF and ALPS | GS Risk-Adjusted Return U.S. Large Cap Index ETF (each a “Fund” and collectively, the “Funds”). The Funds commenced operations on December 20, 2012.
The investment objective of the ALPS | GS Momentum Builder® Growth Markets Equities and U.S. Treasuries Index ETF is to seek investment results that correspond generally, before fees and expenses, to the performance of the GS Momentum Builder® Growth Markets Equities and U.S. Treasuries Index.
The investment objective of the ALPS | GS Momentum Builder® Multi-Asset Index ETF is to seek investment results that closely correspond generally, before fees and expenses, to the performance of the GS Momentum Builder® Multi-Asset Index.
The investment objective of the ALPS | GS Momentum Builder® Asia ex-Japan Equities and U.S. Treasuries Index ETF is to seek investment results that correspond generally, before fees and expenses, to the performance of the GS Momentum Builder® Asia ex-Japan Equities and U.S. Treasuries Index.
The investment objective of the ALPS | GS Risk-Adjusted Return U.S. Large Cap Index ETF is to seek investment results that correspond generally, before fees and expenses, to the performance of the GS Risk-Adjusted Return U.S. Large Cap Index.
Each Fund’s Shares (“Shares”) are listed on the New York Stock Exchange (“NYSE”) Arca. Each Fund issues and redeems Shares, at net asset value (“NAV”) in blocks of 50,000 Shares, each of which is called a “Creation Unit.” Creation Units of the Funds are issued and redeemed principally in-kind for securities included in a specified index. Except when aggregated in Creation Units, Shares are not redeemable securities of the Fund.
2. SIGNIFICANT ACCOUNTING POLICIES
The following is a summary of significant accounting policies consistently followed by the Funds in the preparation of the financial statements. The accompanying financial statements were prepared in accordance with accounting principles generally accepted in the United States of America (“U.S. GAAP”). The preparation of financial statements in conformity with U.S. GAAP requires management to make certain estimates and assumptions that affect the reported amounts of assets and liabilities and disclosures of contingent assets and liabilities at the date of the financial statements and the reported amounts of revenue and expenses during the period. Actual results could differ from those estimates.
A. Portfolio Valuation
Each Fund’s NAV is determined daily, as of the close of the NYSE, usually 4:00 p.m. Eastern time, each day the NYSE is open for trading. The NAV is computed by dividing the value of the Fund’s portfolio securities, cash and other assets (including accrued interest), less all liabilities (including accrued expenses), by the total number of shares outstanding.
Portfolio securities listed on any exchange other than the National Association of Securities Dealer Automated Quotation (“NAS-DAQ”) exchange are valued at the last sale price on the business day as of which such value is being determined. If there has been no sale on such day, the securities are valued at the mean of the most recent bid and asked prices on such day. Securities traded on the NASDAQ are valued at the NASDAQ Official Closing Price as determined by NASDAQ. Portfolio securities traded on more than one securities exchange are valued at the last sale price on the business day as of which such value is being determined at the close of the exchange representing the principal market for such securities. Portfolio securities traded in the over-the-counter market, but excluding securities traded on the NASDAQ, are valued at the closing bid prices. Short-term investments that mature in less than 60 days are valued at amortized cost, which approximates market value.
Each Fund’s investments are valued at market value or, in the absence of market value with respect to any portfolio securities, at fair value according to procedures adopted by the Trust’s Board of Trustees (the “Board”). When market quotations are not readily available or when events occur that make established valuation methods unreliable, securities of the Fund may be valued in good faith by or under the direction of the Board. These securities generally include, but are not limited to, restricted securities (securities which may not be publicly sold without registration under the Securities Act of 1933) for which a pricing service is unable to provide a market price; securities whose trading has been formally suspended; a security whose market price is not available from a pre-established primary pricing source or the pricing source is not willing to provide a price; a security
| | |
| | | |
16 | | Semi-Annual Report | May 31, 2013 |
| | | |
|
NOTES TO FINANCIAL STATEMENTS |
May 31, 2013 (Unaudited) |
with respect to which an event has occurred that is most likely to materially affect the value of the security after the market has closed but before the calculation of the Fund’s NAV or make it difficult or impossible to obtain a reliable market quotation; or a security whose price, as provided by the pricing service, does not reflect the security’s “fair value” due to the security being de-listed from a national exchange or the security’s primary trading market is temporarily closed at a time when, under normal conditions, it would be open. As a general principle, the current “fair value” of a security would be the amount which the owner might reasonably expect to receive from the closing sale prices on the applicable exchange and fair value prices may not reflect the actual value of a security. A variety of factors may be considered in determining the fair value of such securities.
B. Securities Transactions and Investment Income
Securities transactions are recorded as of the trade date. Realized gains and losses from securities transactions are recorded on the highest cost basis. Dividend income is recorded on the ex-dividend date. Interest income, if any, is recorded on the accrual basis.
C. Exchange-Traded Funds (“ETFs”)
The Funds, except the ALPS | GS Risk-Adjusted Return U.S. Large Cap Index ETF, primarily invest in Underlying ETFs. When a Fund invests in Underlying ETFs, in addition to directly bearing the expenses associated with its own operations, it will bear a pro rata portion of the Underlying ETFs’ expenses (including operating costs and management fees). Consequently, an investment in the Fund entails more direct and indirect expenses than a direct investment in the Underlying ETF. The investment performance of the Funds is directly related to the investment performance of the Underlying ETFs in which they invest, and therefore, the Funds are also exposed to the risks arising from the Underlying ETFs’ investments.
D. Money Market Instruments
The Funds may invest a portion of their assets in high-quality money market instruments on an ongoing basis to provide liquidity. The instruments in which the Funds may invest include: (i) short-term obligations issued by the U.S. Government; (ii) negotiable certificates of deposit (“CDs”), fixed time deposits and bankers’ acceptances of U.S. and foreign banks and similar institutions; (iii) commercial paper rated at the date of purchase “Prime-1” by Moody’s Investors Service, Inc. or “A- 1+” or “A-1” by Standard & Poor’s or, if unrated, of comparable quality as determined by the Investment Adviser; (iv) repurchase agreements; and (v) money market mutual funds. CDs are short-term negotiable obligations of commercial banks. Time deposits are non-negotiable deposits maintained in banking institutions for specified periods of time at stated interest rates. Banker’s acceptances are time drafts drawn on commercial banks by borrowers, usually in connection with international transactions.
E. Concentration
To the extent that the Fund’s or the Index’s portfolio is concentrated in the securities of companies in a particular market (including the market of a particular country or geographic region), industry, group of industries, sector or asset class, the Fund may be adversely affected by the performance of those securities, may be subject to increased price volatility and may be more susceptible to adverse economic, market, political or regulatory occurrences affecting that market, industry, group of industries, sector or asset class.
F. Foreign Investment Risk
An Underlying ETF’s investments in non-U.S. issuers may involve unique risks compared to investing in securities of U.S. issuers, including, among others, greater market volatility, the availability of less reliable financial information, higher transactional costs, taxation by foreign governments, decreased market liquidity and political instability. Foreign issuers often are subject to less stringent requirements regarding accounting, auditing, financial reporting and record keeping than are issuers of U.S. securities and, therefore, not all material information regarding these issuers will be available. Securities exchanges or foreign governments may adopt rules or regulations that may negatively impact the Underlying ETF’s ability to invest in foreign securities or may prevent the Underlying ETF from repatriating its investments. A Fund’s return and net asset value may be significantly affected by political or economic conditions and regulatory requirements in a particular country.
G. Emerging Market Securities Risk
An Underlying ETF’s investments in the securities of issuers in emerging market countries involve risks often not associated with investments in the securities of issuers in developed countries. Emerging markets usually are subject to greater market volatility, lower trading volume, political and economic instability, uncertainty regarding the existence of trading markets and more governmental limitations on foreign investment than more developed markets. In addition, securities in emerging markets may be subject to greater price fluctuations than securities in more developed markets. A Fund’s return and net asset value may be significantly affected by political or economic conditions and regulatory requirements in a particular country.
| | |
| | NOTES TO FINANCIAL STATEMENTS |
| | May 31, 2013 (Unaudited) |
H. Dividends and Distributions to Shareholders
Dividends from net investment income, if any, are distributed to shareholders quarterly. Net capital gains are distributed at least annually. Dividends may be declared and paid more frequently to improve Index tracking or to comply with the distribution requirements of the Internal Revenue Code of 1986, as amended. In addition, each Fund intends to distribute at least quarterly amounts representing the full dividend yield net of expenses on the underlying investment securities as if the relevant Fund owned the underlying investment securities for the entire dividend period. As a result, some portion of each distribution may result in a return of capital (which is a return of the shareholder’s investment in the relevant Fund). Section 19(a) of the Investment Company Act of 1940, as amended (the “1940 Act”), and Rule 19(a)-1 thereunder require a Fund to provide a written statement accompanying any such distribution that adequately discloses its source or sources to the extent the source includes something other than net investment income. Thus, if the source of the dividend or other distribution were the original capital contribution of the shareholder, and the payment amounted to a return of capital, the relevant Fund would be required to provide written disclosure to that effect. Nevertheless, persons who periodically receive the payment of a dividend or other distribution may be under the impression that they are receiving net profits when they are not. Shareholders should read any written disclosure provided pursuant to Section 19(a) and Rule 19(a)-1 carefully, and should not assume that the source of any distribution from the relevant Fund is net profit.
I. Federal Tax and Tax Basis Information
The timing and character of income and capital gain distributions are determined in accordance with income tax regulations, which may differ from U.S. GAAP. Reclassifications are made to each Fund’s capital accounts for permanent tax differences to reflect income and gains available for distribution (or available capital loss carryforwards) under income tax regulations. The amounts and characteristics of tax basis distributions and composition of distributable earnings/(accumulated losses) are finalized at fiscal year end: accordingly, tax basis balances have not been determined as of May 31, 2013.
Distributions from net investment income and capital gains are determined in accordance with income tax regulations, which may differ from U.S. GAAP. These differences are primarily due to differing treatments of income and gains on various investment securities held by the Fund, timing differences and differing characterization of distributions made by each Fund.
As of May 31, 2013, the costs of investments for federal income tax purposes and accumulated net unrealized appreciation/ (depreciation) on investments were as follows:
| | | | | | | | | | | | | | | | | | | | |
| | | Cost of investments for
income tax purposes | | Gross Appreciation (excess of value over tax cost) | | Gross Depreciation
(excess of tax cost
over value) | | Net Unrealized
Appreciation/
(Depreciation) |
ALPS | GS Momentum Builder® Growth Markets Equities and U.S. Treasuries Index ETF | | | $ | 9,669,247 | | | | $ | 8,562 | | | | $ | (296,913 | ) | | | $ | (288,351 | ) |
ALPS | GS Momentum Builder® Multi-Asset Index ETF | | | $ | 12,624,568 | | | | $ | 73,955 | | | | $ | (294,087 | ) | | | $ | (220,132 | ) |
ALPS | GS Momentum Builder® Asia ex-Japan Equities and U.S. Treasuries Index ETF | | | $ | 9,913,946 | | | | $ | 84,277 | | | | $ | (398,314 | ) | | | $ | (314,037 | ) |
ALPS | GS Risk-Adjusted Return U.S. Large Cap Index ETF | | | $ | 10,336,395 | | | | $ | 1,461,499 | | | | $ | (326,157 | ) | | | $ | 1,135,342 | |
J. Income Taxes
No provision for income taxes is included in the accompanying financial statements, as each Fund intends to distribute to shareholders all taxable investment income and realized gains and otherwise comply with Subchapter M of the Internal Revenue Code of 1986, as amended, applicable to regulated investment companies.
Each Fund evaluates tax positions taken (or expected to be taken) in the course of preparing each Fund’s tax returns to determine whether these positions meet a “more-likely-than-not” standard that, based on the technical merits, have a more than fifty percent likelihood of being sustained by a taxing authority upon examination. A tax position that meets the “more-likely-than-not” recognition threshold is measured to determine the amount of benefit to recognize in the financial statements.
As of and during the period ended May 31, 2013, each Fund did not have a liability for any unrecognized tax benefits. Each Fund files U.S. federal, state, and local tax returns as required. Each Fund’s tax returns are subject to examination by the relevant tax authorities until expiration of the applicable statute of limitations which is generally three years after the filing of the tax return. Being that the Funds commenced operations on December 20, 2012, no tax returns have been filed as of the date of this report.
| | |
| | | |
18 | | Semi-Annual Report | May 31, 2013 |
| | | |
|
NOTES TO FINANCIAL STATEMENTS |
May 31, 2013 (Unaudited) |
K. Fair Value Measurements
Each Fund discloses the classification of fair value measurements following a three-tier hierarchy based on the inputs used to measure fair value. Inputs refer broadly to the assumptions that market participants would use in pricing the asset or liability, including assumptions about risk. Inputs may be observable or unobservable. Observable inputs reflect the assumptions market participants would use in pricing the asset or liability that are developed based on market data obtained from sources independent of the reporting entity. Unobservable inputs reflect the reporting entity’s own assumptions about the assumptions market participants would use in pricing the asset or liability that are developed based on the best information available.
Various inputs are used in determining the value of each Fund’s investments as of the end of the reporting period. When inputs used fall into different levels of the fair value hierarchy, the level in the hierarchy within which the fair value measurement falls is determined based on the lowest level input that is significant to the fair value measurement in its entirety. The designated input levels are not necessarily an indication of the risk or liquidity associated with these investments. These inputs are categorized in the following hierarchy under applicable financial accounting standards:
| | |
Level 1 – | | Unadjusted quoted prices in active markets for identical investments, unrestricted assets or liabilities that a Fund has the ability to access at the measurement date; |
| |
Level 2 – | | Quoted prices which are not active, quoted prices for similar assets or liabilities in active markets or inputs other than quoted prices that are observable (either directly or indirectly) for substantially the full term of the asset or liability; and |
| |
Level 3 – | | Significant unobservable prices or inputs (including the Fund’s own assumptions in determining the fair value of investments) where there is little or no market activity for the asset or liability at the measurement date. |
The following is a summary of the inputs used to value each Fund’s investments at May 31, 2013:
ALPS | Goldman Sachs Momentum Builder® Growth Markets Equities and U.S. Treasuries Index ETF
Investments in Securities at Value
| | | | | | | | | | | | | | | | |
| | | Level 1 | | | Level 2 | | | Level 3 | | | Total | |
Exchange Traded Funds | | $ | 9,379,220 | | | $ | – | | | $ | – | | | $ | 9,379,220 | |
Short Term Investments | | | 1,676 | | | | – | | | | – | | | | 1,676 | |
TOTAL | | $ | 9,380,896 | | | $ | – | | | $ | – | | | $ | 9,380,896 | |
| | | | | | | | | | | | | | | | | |
ALPS | Goldman Sachs Momentum Builder® Multi-Asset Index ETF
Investments in Securities at Value
| | | | | | | | | | | | | | | | |
| | | Level 1 | | | Level 2 | | | Level 3 | | | Total | |
Exchange Traded Funds | | $ | 12,397,886 | | | $ | – | | | $ | – | | | $ | 12,397,886 | |
Short Term Investments | | | 6,550 | | | | – | | | | – | | | | 6,550 | |
TOTAL | | $ | 12,404,436 | | | $ | – | | | $ | – | | | $ | 12,404,436 | |
| | | | | | | | | | | | | | | | | |
ALPS | Goldman Sachs Momentum Builder® Asia Ex-Japan Equities and U.S. Treasuries Index ETF
Investments in Securities at Value
| | | | | | | | | | | | | | | | |
| | | Level 1 | | | Level 2 | | | Level 3 | | | Total | |
Exchange Traded Funds | | $ | 9,598,519 | | | $ | – | | | $ | – | | | $ | 9,598,519 | |
Short Term Investments | | | 1,390 | | | | – | | | | – | | | | 1,390 | |
TOTAL | | $ | 9,599,909 | | | $ | – | | | $ | – | | | $ | 9,599,909 | |
| | | | | | | | | | | | | | | | | |
| | |
| | NOTES TO FINANCIAL STATEMENTS |
| | May 31, 2013 (Unaudited) |
ALPS | Goldman Sachs Risk-Adjusted Return U.S. Large Cap Index ETF
Investments in Securities at Value
| | | | | | | | | | | | | | | | |
| | | Level 1 | | | Level 2 | | | Level 3 | | | Total | |
Common Stocks* | | $ | 11,454,121 | | | $ | – | | | $ | – | | | $ | 11,454,121 | |
Short Term Investments | | | 17,616 | | | | – | | | | – | | | | 17,616 | |
TOTAL | | $ | 11,471,737 | | | $ | – | | | $ | – | | | $ | 11,471,737 | |
| | | | | | | | | | | | | | | | | |
| * | For detailed sector or industry descriptions, see the accompanying Schedule of Investments. |
Each Fund recognizes transfers between levels as of the end of the period. For the period ended May 31, 2013, each Fund did not have any transfers between Level 1 and Level 2 securities. Each Funds did not have any securities which used significant unobservable inputs (Level 3) in determining fair value.
3. INVESTMENT ADVISORY FEE AND OTHER AFFILIATED TRANSACTIONS
ALPS Advisors, Inc. (the “Investment Adviser”) acts as the Funds’ investment adviser pursuant to an advisory agreement with the Trust on behalf of each Fund (the “Advisory Agreement”). Pursuant to the Advisory Agreement, each Fund pays the Investment Adviser a unitary fee for the services and facilities it provides, accrued on average daily net assets and payable on a monthly basis at the annual rates listed below:
| | | | |
| Fund | | Advisory Fee | | |
ALPS | GS Momentum Builder® Growth Markets Equities and U.S. Treasuries Index ETF | | 0.68% | | |
ALPS | GS Momentum Builder® Multi-Asset Index ETF | | 0.68% | | |
ALPS | GS Momentum Builder® Asia ex-Japan Equities and U.S. Treasuries Index ETF | | 0.68% | | |
ALPS | GS Risk-Adjusted Return U.S. Large Cap Index ETF | | 0.55% | | |
Out of the unitary management fees, the Investment Adviser pays substantially all expenses of the Funds, including the cost of transfer agency, custody, fund administration, legal, audit, trustees and other services, except for interest expenses, distribution fees or expenses, brokerage expenses, taxes and extraordinary expenses not incurred in the ordinary course of the Funds’ business. In addition, the Investment Adviser’s unitary management fees are designed to compensate the Investment Adviser for providing services for the Funds.
ALPS Fund Services, Inc. (“ALPS”), an affiliate of the Investment Adviser, is the administrator of the Funds.
The Bank of New York Mellon is the custodian, fund accounting agent and transfer agent for the Funds.
Each Trustee who is not an officer or employee of the Investment Adviser, any sub-adviser or any of their affiliates (“Independent Trustees”) is paid a quarterly retainer of $5,000, $3,750 for each regularly scheduled Board meeting attended and $1,500 for each special meeting held outside of regularly scheduled meetings.
4. PURCHASES AND SALES OF SECURITIES
For the six months ended May 31, 2013, the cost of purchases and proceeds from sales of investment securities, excluding short-term investments and in-kind transactions, were as follows:
| | | | | | | | | | |
| Fund | | Purchases | | | Sales | | | |
ALPS | GS Momentum Builder® Growth Markets Equities and U.S. Treasuries Index ETF | | $ | 10,950,932 | | | $ | 7,803,347 | | | |
ALPS | GS Momentum Builder® Multi-Asset Index ETF | | | 20,291,734 | | | | 12,721,155 | | | |
ALPS | GS Momentum Builder® Asia ex-Japan Equities and U.S. Treasuries Index ETF | | | 9,147,349 | | | | 7,057,313 | | | |
ALPS | GS Risk-Adjusted Return U.S. Large Cap Index ETF | | | 12,796 | | | | – | | | |
| | |
| | | |
20 | | Semi-Annual Report | May 31, 2013 |
| | | |
|
NOTES TO FINANCIAL STATEMENTS |
May 31, 2013 (Unaudited) |
For the period ended May 31, 2013, the cost of in-kind purchases and proceeds from in-kind sales were as follows:
| | | | | | | | | | |
| Fund | | Purchases | | | Sales | | | |
ALPS | GS Momentum Builder® Growth Markets Equities and U.S. Treasuries Index ETF | | $ | 10,249,646 | | | $ | 3,154,727 | | | |
ALPS | GS Momentum Builder® Multi-Asset Index ETF | | | 12,625,716 | | | | 7,535,516 | | | |
ALPS | GS Momentum Builder® Asia ex-Japan Equities and U.S. Treasuries Index ETF | | | 10,212,836 | | | | 2,110,644 | | | |
ALPS | GS Risk-Adjusted Return U.S. Large Cap Index ETF | | | 10,305,983 | | | | – | | | |
Gains on in-kind transactions are not considered taxable for federal income tax purposes.
5. CAPITAL SHARE TRANSACTIONS
Shares are created and redeemed by each Fund only in Creation Unit size aggregations of 50,000. Only broker-dealers or large institutional investors with creation and redemption agreements called Authorized Participants (“AP”) are permitted to purchase or redeem Creation Units from the Fund. Such transactions are generally permitted on an in-kind basis, with a balancing cash component to equate the transaction to the net asset value per unit of each Fund on the transaction date. Cash may be substituted equivalent to the value of certain securities generally when they are not available in sufficient quantity for delivery, not eligible for trading by the AP or as a result of other market circumstances.
6. INDEMNIFICATIONS
Under the Trust’s organizational documents, its officers and Trustees are indemnified against certain liability arising out of the performance of their duties to the Trust. Additionally, in the normal course of business, the Trust enters into contracts with service providers that contain general indemnification clauses. The Trust’s maximum exposure under these arrangements is unknown, as this would involve future claims that may be made against the Trust that have not yet occurred.
| | |
| | ADDITIONAL INFORMATION |
| | May 31, 2013 (Unaudited) |
PROXY VOTING POLICIES AND PROCEDURES
A description of the Funds’ proxy voting policies and procedures used in determining how to vote for proxies and information regarding how the Funds voted proxies related to portfolio securities during the most recent 12-month period ended June 30th is available without charge, (1) on the Securities and Exchange Commission’s (“SEC”) website at http://www.sec.gov; (2) upon request, by calling (toll-free) 1-866-513-5856; and (3) on the Trust’s website located at http://www.alpsfunds.com.
PORTFOLIO HOLDINGS
The Trust will file its complete schedule of portfolio holdings with the SEC for the first and third quarters of each fiscal year on Form N-Q. The Trust’s Form N-Q will be available (1) on the SEC’s website at http://www.sec.gov; (2) by calling (toll-free) 1-866-513-5856; (3) on the Trust’s website located at http://www.alpsfunds. com; and (4) for review and copying at the SEC’s Public Reference Room (“PRR”) in Washington D.C. Information regarding the operation of the PRR may be obtained by calling (toll-free) 1-800-732-0330.
| | |
| | | |
22 | | Semi-Annual Report | May 31, 2013 |
| | | |
|
BOARD CONSIDERATIONS REGARDING APPROVAL OF INVESTMENT ADVISORY AGREEMENT |
May 31, 2013 (Unaudited) |
At an in-person meeting held on September 10, 2012, the Board of Trustees of the Trust (the “Board”), including the Trustees who are not “interested persons” of the Trust within the meaning of the 1940 Act, as amended (the “Independent Trustees”), evaluated a proposal to approve the Advisory Agreement between the Trust and ALPS Advisors, Inc. (the “Adviser”) with respect to the four Goldman ETFs: ALPS | GS Momentum Builder Growth Markets Index ETF, ALPS | GS Momentum Builder Multi-Asset Index ETF, ALPS | GS Momentum Builder Asia ex-Japan Index ETF and the ALPS | GS Risk Adjusted Return US Large Cap Index ETF (collectively, “Goldman ETFs”). The Independent Trustees also met separately to consider the Advisory Agreement.
In evaluating the Advisory Agreement for the Goldman ETFs, the Board considered various factors, including (i) the nature, extent and quality of the services expected to be provided by the Adviser with respect to the funds under the Advisory Agreement, (ii) costs to the Adviser of its services; and (iii) the extent to which economies of scale would be realized if and as each funds’ assets increase and whether the fee levels in the Advisory Agreement reflect these economies of scale.
The Board of Trustees, including a majority of the Independent Trustees, determined that approval of the Advisory Agreement was in the best interests of the Goldman ETFs. The Board of Trustees, including the Independent Trustees, did not identify any single factor or group of factors as all important or controlling and considered all factors together. In evaluating whether to approve the Advisory Agreement for the Goldman ETFs, the Board considered numerous factors, as described below.
With respect to the nature, extent and quality of the services to be provided by the Adviser under the Advisory Agreement, the Board considered and reviewed information concerning the services proposed to be provided under the Advisory Agreement, the proposed investment parameters of the indices for the Goldman ETFs, financial information regarding the Adviser, its parent company, information describing the Adviser’s current organizations and the background and experience of the persons who would be responsible for the day-to-day management of the Goldman ETFs, the anticipated financial support, the nature and quality of services provided to other exchange-traded (“ETFs”), open-end and closed-end funds by the Adviser. Based upon their review, the Board concluded that the Adviser was qualified to oversee the services to be provided by other service providers and that the services to be provided by the Adviser to the Goldman ETFs are expected to be satisfactory.
With respect to the costs of services to be provided and profits to be realized by the Adviser, the Board considered the resources involved in managing the Goldman ETFs as well as the fact that the Adviser agreed to pay all of the Goldman ETFs’ expenses (except for interest expenses, distribution fees or expenses, brokerage expenses, taxes and extraordinary expenses such as litigation and other expenses not incurred in the ordinary course of the Fund’s business) out of the unitary advisory fee. Based on its review, the Board concluded that the expected profitability of the Goldman ETFs to the Adviser was not unreasonable.
The Board reviewed the comparative fee information, including Lipper data and separate peer group analysis prepared by ALPS. In determining the weight to be accorded the Lipper and ALPS comparative fee data respectively, the Board took into account ALPS arguments that Lipper did not, in assembling its peer group, appropriately reflect the unique characteristics of the Goldman ETFs. Based on its review, the Board concluded that the fees proposed to be charged (i.e. 0.68% for the ALPS | GS Momentum ETFs and 0.55% for ALPS GS Risk Adjusted ETF), were competitive. The Board considered the extent to which economies of scale would be realized as the Goldman ETFs grow and whether fee levels reflect a reasonable sharing of such economies of scale for the benefit of each Fund’s investors. Because each of the Goldman ETFs are newly organized, the Board reviewed the unitary advisory fee proposed for the Goldman ETFs and anticipated expenses of each Fund and determined to review economies of scale in the future when the Goldman ETFs had attracted assets.
The Board also considered other benefits that may be realized by the Adviser from its relationship with the Goldman ETFs.
In voting to approve the separate Advisory Agreement, the Trustees, including the Independent Trustees, concluded that the terms of the Advisory Agreement were reasonable and fair in light of the services to be performed, expenses to be incurred and such other matters as the Trustees considered relevant in the exercise of their reasonable business judgment.
INTENTIONALLY LEFT BLANK
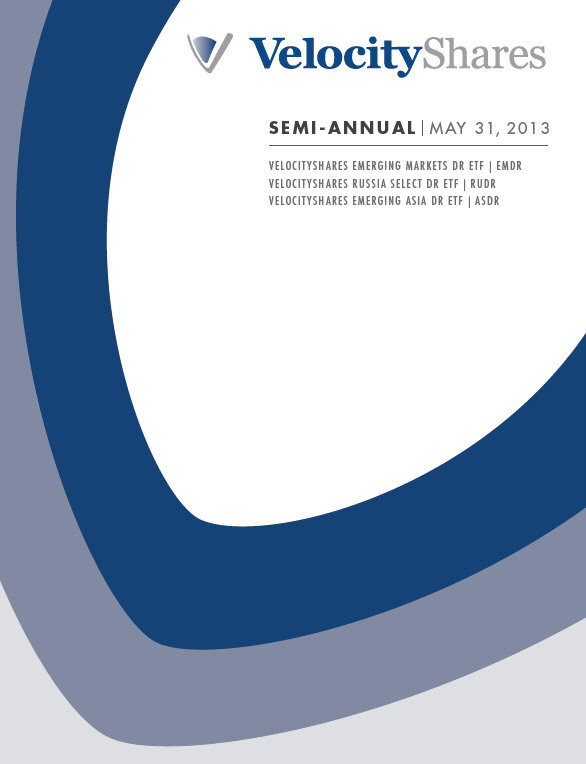
TABLE OF CONTENTS
| | |
www.velocitysharesetfs.com | | 1 |
| |
| | |

| | PERFORMANCE OVERVIEW |
| | VelocityShares Emerging Markets DR ETF May 31, 2013 (Unaudited) |
The VelocityShares Emerging Markets DR ETF seeks to provide investment results that correspond generally, before fees and expenses, to the performance of the BNY Mellon Emerging markets DR Index (the “Underlying Index”). The Exchange Traded Fund (ETF) normally invests at least 90% of its total assets in depositary receipts (DR) that constitute its Underlying Index.
| | | | | | | | | | |
TOP 10 HOLDINGS^ (% of Investments) as of 5.31.13 |
Samsung Electronics Co. Ltd., GDR | | | | 11.74 | % | | |
Taiwan Semiconductor Manufacturing Co. Ltd., Sponsored ADR | | | | 4.44 | % | | |
China Mobile Ltd., Sponsored ADR | | | | 3.48 | % | | |
Gazprom OAO, Sponsored ADR | | | | 2.87 | % | | |
Banco Bradesco SA, ADR | | | | 2.69 | % | | |
Petroleo Brasileiro SA, Class A, Sponsored ADR | | | | 2.54 | % | | |
Itau Unibanco Holding SA, ADR | | | | 2.44 | % | | |
America Movil SAB de CV, Series L, ADR | | | | 2.24 | % | | |
Sberbank of Russia, Sponsored ADR | | | | 2.06 | % | | |
Lukoil OAO, Sponsored ADR | | | | 2.00 | % | | |
Total % of Top 10 Holdings | | | | 36.50 | % | | |
^ Future holdings are subject to change.
GROWTH OF A HYPOTHETICAL $10,000 INVESTMENT as of 5.31.13
Comparison of Change in Value of a hypothetical $10,000 investment in the VelocityShares Emerging Markets DR ETF.
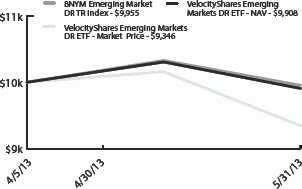
| | | | | | |
COUNTRY ALLOCATION^ (% of Investments) as of 5.31.13 |
Brazil | | | 20.39 | % | | |
South Korea | | | 17.53 | % | | |
China | | | 15.04 | % | | |
Russia | | | 14.26 | % | | |
Taiwan | | | 8.93 | % | | |
India | | | 7.13 | % | | |
Mexico | | | 6.65 | % | | |
Chile | | | 2.53 | % | | |
South Africa | | | 2.42 | % | | |
Turkey | | | 1.14 | % | | |
Colombia | | | 0.99 | % | | |
Indonesia | | | 0.71 | % | | |
Philippines | | | 0.38 | % | | |
Argentina | | | 0.37 | % | | |
Egypt | | | 0.33 | % | | |
Nigeria | | | 0.33 | % | | |
Kazakhstan | | | 0.27 | % | | |
Peru | | | 0.25 | % | | |
Lebanon | | | 0.23 | % | | |
Oman | | | 0.08 | % | | |
Ukraine | | | 0.04 | % | | |
^ Future allocations are subject to change.
The chart represents historical performance of a hypothetical investment of $10,000 in the Fund over the life of the Fund. Performance calculations are as of the end of each month. Past performance does not guarantee future results. This chart does not reflect the deduction of taxes that a shareholder would pay on Fund distributions or the redemption of Fund shares.
| | | | |
AVERAGE ANNUAL TOTAL RETURN as of 5.31.13 | | | | |
| | | Since Inception* | | |
VelocityShares Emerging Markets DR ETF - NAV | | -0.92% | | |
VelocityShares Emerging Markets DR ETF - Market Price** | | -6.54% | | |
BNYM Emerging Market DR TR Index | | -0.45% | | |
| | |
Total Expense Ratio (per the current prospectus) 0.65% | | | | |
| * | The Fund commenced operations on April 5, 2013. Total return for a period of less than one year is not annualized. |
| ** | Market Price is based on the midpoint of the bid/ask spread at 4 p.m. ET and does not represent the returns an investor would receive if shares were traded at other times. | |
Performance data quoted represents past performance. Past performance does not guarantee future results. Investment return and principal value of an investment will fluctuate so that an investor’s shares, when sold or redeemed, may be worth more or less than the original cost. Current performance data may be higher or lower than actual data quoted. For the most current month-end performance data please visit www.alpsfunds.com.
NAV is an exchange-traded fund’s per-share value. The per-share dollar amount of the fund is derived by dividing the total value of all the securities in its portfolio, less any liabilities, by the number of fund shares outstanding. Market Price is the price at which a share can currently be traded in the market. Information detailing the number of days the Market Price of the Fund was greater than the Fund’s NAV and the number of days it was less than the Fund’s NAV can be obtained at www.alpsfunds.com.
BNY Mellon Emerging Markets DR Index: is a capitalization-weighted Index that is designed to reflect the performance of a portfolio of emerging market-based US listed ADRs and LSE-traded GDRs that satisfy the Index’s coverage requirements. An investor cannot directly invest in an index.“VelocityShares” and the VelocityShares logo are trademarks of VelocityShares Index & Calculation Services, a division of VelocityShares, LLC.
| | |
2 | | Semi-Annual Report | May 31, 2013 |
PERFORMANCE OVERVIEW
VelocityShares Russia Select DR ETF
May 31, 2013 (Unaudited)
The VelocityShares Russia Select DR ETF seeks to provide investment results that correspond generally, before fees and expenses, to the performance of the BNY Mellon Russia Select DR index (the “Underlying Index”). The Exchange Traded Fund (ETF) normally invests at least 90% of its total assets in depository receipts (DR) that constitute its Underlying Index.
| | | | | | | | | | |
TOP 10 HOLDINGS^ (% of Investments) as of 5.31.13 |
Gazprom OAO, Sponsored ADR | | | | 20.56 | % | | |
Sberbank of Russia, Sponsored ADR | | | | 14.72 | % | | |
Magnit OJSC, Sponsored GDR | | | | 5.57 | % | | |
Uralkali OJSC, Sponsored GDR | | | | 4.41 | % | | |
Mobile Telesystems OJSC, Sponsored ADR | | | | 4.19 | % | | |
Lukoil OAO, Sponsored ADR | | | | 4.10 | % | | |
Tatneft OAO, Sponsored ADR | | | | 3.75 | % | | |
Rosneft OAO, GDR | | | | 3.72 | % | | |
Surgutneftegas OAO, Sponsored ADR | | | | 3.62 | % | | |
MMC Norilsk Nickel OJSC, ADR | | | | 3.37 | % | | |
Total % of Top 10 Holdings | | | | 68.01 | % | | |
^ Future holdings are subject to change.
GROWTH OF A HYPOTHETICAL $10,000 INVESTMENT as of 5.31.13
Comparison of Change in Value of a hypothetical $ 10,000 investment in the VelocityShares Russia Select DR ETF.
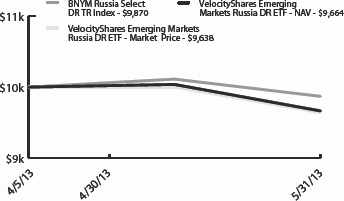
| | | | | | | | | | |
INDUSTRY ALLOCATION^ (% of Investments) as of 5.31.13 |
Integrated Oil | | | | 35.98 | % | | |
Regional Banks | | | | 16.97 | % | | |
Food Retail | | | | 7.95 | % | | |
Wireless Telecommunications | | | | 7.72 | % | | |
Chemicals: Agricultural | | | | 6.19 | % | | |
Oil & Gas Production | | | | 3.77 | % | | |
Other Metals/Minerals | | | | 3.39 | % | | |
Specialty Communications | | | | 2.59 | % | | |
Steel | | | | 2.51 | % | | |
Major Communications | | | | 2.13 | % | | |
Oilfield Services/Equipment | | | | 1.55 | % | | |
Internet Software/Services | | | | 1.51 | % | | |
Pharmaceuticals: Other | | | | 1.40 | % | | |
Railroads | | | | 1.31 | % | | |
Homebuilding | | | | 1.30 | % | | |
Contract Drilling | | | | 1.24 | % | | |
Electric Utilities | | | | 1.22 | % | | |
Construction Materials | | | | 0.64 | % | | |
Other Transportation | | | | 0.63 | % | | |
^ Future allocations are subject to change.
The chart represents historical performance of a hypothetical investment of $10,000 in the Fund over the life of the Fund. Performance calculations are as of the end of each month. Past performance does not guarantee future results. This chart does not reflect the deduction of taxes that a shareholder would pay on Fund distributions or the redemption of Fund shares.
| | | | |
AVERAGE ANNUAL TOTAL RETURN as of 5.31.13 | | | | |
| | | Since Inception* | | |
VelocityShares Russia Select DR ETF - NAV | | -3.36% | | |
VelocityShares Russia Select DR ETF - Market Price** | | -3.62% | | |
BNYM Russia Select DR TR Index | | -1.30% | | |
| | |
Total Expense Ratio (per the current prospectus) 0.65% | | | | |
| * | The Fund commenced operations on April 5, 2013. Total return for a period of less than one year is not annualized. |
| ** | Market Price is based on the midpoint of the bid/ask spread at 4 p.m. ET and does not represent the returns an investor would receive if shares were traded at other times. |
Performance data quoted represents past performance. Past performance does not guarantee future results. Investment return and principal value of an investment will fluctuate so that an investor’s shares, when sold or redeemed, may be worth more or less than the original cost. Current performance data may be higher or lower than actual data quoted. For the most current month-end performance data please visit www.alpsfunds.com.
NAV is an exchange-traded fund’s per-share value. The per-share dollar amount of the fund is derived by dividing the total value of all the securities in its portfolio, less any liabilities, by the number of fund shares outstanding. Market Price is the price at which a share can currently be traded in the market. Information detailing the number of days the Market Price of the Fund was greater than the Fund’s NAV and the number of days it was less than the Fund’s NAV can be obtained at www.alpsfunds.com.
BNY Mellon Russia Select DR Index: is a capitalization-weighted Index that is designed to reflect the performance of a portfolio of Russian-based US listed ADRs and LSE-traded GDRs that satisfy the Index’s coverage requirements. An investor cannot directly invest in an index.
“VelocityShares” and the VelocityShares logo are trademarks of VelocityShares Index & Calculation Services, a division of VelocityShares, LLC.
| | |
www.velocitysharesetfs.com | | 3 |
| |
| | |
| | PERFORMANCE OVERVIEW |
| | VelocityShares Emerging Asia DR ETF May 31, 2013 (Unaudited) |
The VelocityShares Emerging Asia Dr ETF seeks to provide investment results that correspond generally, before fees and expenses, to the performance of the BNy mellon Emerging Asia Dr index (the “underlying index”). The Exchange Traded Fund (ETF) normally invests at least 90% of its total assets in depository receipts (Dr) that constitute its underlying index.
| | | | |
TOP 10 HOLDINGS^ (% of Investments) as of 5.31.13 | |
Samsung Electronics Co. Ltd., GDR | | | 23.82% | |
Taiwan Semiconductor Manufacturing Co. Ltd., Sponsored ADR | | | 8.94% | |
China Mobile Ltd., Sponsored ADR | | | 7.05% | |
CNOOC Ltd., ADR | | | 3.63% | |
Baidu, Inc., Sponsored ADR | | | 3.39% | |
Hon Hai Precision Industry Co. Ltd., GDR | | | 3.32% | |
PetroChina Co. Ltd., ADR | | | 3.17% | |
POSCO, ADR | | | 3.05% | |
Reliance Industries Ltd., Sponsored GDR | | | 2.95% | |
Infosys Ltd., Sponsored ADR | | | 2.62% | |
Total % of Top 10 Holdings | | | 61.94% | |
^ Future holdings are subject to change.
GROWTH OF A HYPOTHETICAL $10,000 INVESTMENT as of 5.31.13
Comparison of Change in Value of a hypothetical $10,000
investment in the VelocityShares Emerging Asia DR ETF.
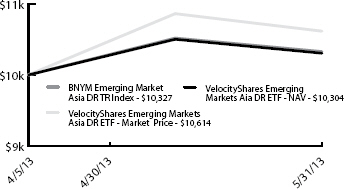
| | | | |
COUNTRY ALLOCATION^ (% of Investments) as of 5.31.13 | |
South Korea | | | 35.36% | |
China | | | 30.15% | |
Taiwan | | | 17.92% | |
India | | | 14.31% | |
Indonesia | | | 1.46% | |
Philippines | | | 0.80% | |
^ Future allocations are subject to change.
The chart represents historical performance of a hypothetical investment of $10,000 in the Fund over the life of the Fund. Performance calculations are as of the end of each month. Past performance does not guarantee future results. This chart does not reflect the deduction of taxes that a shareholder would pay on Fund distributions or the redemption of Fund shares.
| | |
AVERAGE ANNUAL TOTAL RETURN as of 5.31.13 | | Since Inception* |
VelocityShares Emerging Asia DR ETF - NAV | | 3.04% |
VelocityShares Emerging Asia DR ETF - Market Price** | | 6.14% |
BNYM Emerging Market Asia DR TR | | 3.27% |
| |
Total Expense Ratio (per the current prospectus) 0.65% | | |
| * | The Fund commenced operations on April 5, 2013. Total return for a period of less than one year is not annualized. |
| ** | Market Price is based on the midpoint of the bid/ask spread at 4 p.m. ET and does not represent the returns an investor would receive if shares were traded at other times. |
Performance data quoted represents past performance. Past performance does not guarantee future results. Investment return and principal value of an investment will fluctuate so that an investor’s shares, when sold or redeemed, may be worth more or less than the original cost. Current performance data may be higher or lower than actual data quoted. For the most current month-end performance data please visit www.alpsfunds.com.
NAV is an exchange-traded fund’s per-share value. The per-share dollar amount of the fund is derived by dividing the total value of all the securities in its portfolio, less any liabilities, by the number of fund shares outstanding. Market Price is the price at which a share can currently be traded in the market. Information detailing the number of days the Market Price of the Fund was greater than the Fund’s NAV and the number of days it was less than the Fund’s NAV can be obtained at www.alpsfunds.com.
BNY Mellon Emerging Asia DR Index: is a capitalization-weighted Index that is designed to reflect the performance of a portfolio of emerging Asia-based US listed ADRs and LSE-traded GDRs that satisfy the Index’s coverage requirements. An investor cannot directly invest in an index.“VelocityShares” and the VelocityShares logo are trademarks of VelocityShares Index & Calculation Services, a division of VelocityShares, LLC.
| | |
4 | | Semi-Annual Report | May 31, 2013 |
DISCLOSURE OF FUND EXPENSE
May 31, 2013 (Unaudited)
Shareholder Expense Example: As a shareholder of the Fund, you incur two types of costs: (1) transaction costs which may include creation and redemption fees or brokerage charges, and (2) ongoing costs, including management fees and other Fund expenses. These examples are intended to help you understand your ongoing costs (in dollars) of investing in the Fund and to compare these costs with the ongoing costs of investing in other funds. The example is based on an investment of $1,000 invested at the beginning of the (six month) period and held through may 31, 2013.
Actual Return: The first line of the table provides information about actual account values and actual expenses. you may use the information in this table, together with the amount you invested, to estimate the expenses that you incurred over the period. Simply divide your account value by $1,000 (for example, an $8,600 account value divided by $1,000 = 8.6), then multiply the result by the number in the first line of the table under the heading entitled “Expenses Paid During the Period” to estimate the expenses attributable to your investment during this period.
Hypothetical 5% Return: The second line of the table provides information about hypothetical account values and hypothetical expenses based on the Fund’s actual expense ratio and an assumed rate of return of 5% per year before expenses, which is not the Fund’s actual return. The hypothetical account values and expenses may not be used to estimate the actual ending account balance or expenses you paid for the period. you may use this information to compare ongoing costs of investing in the Fund and other funds. To do so, compare this 5% hypothetical example with the 5% hypothetical examples that appear in the shareholder reports of the other funds.
The expenses shown in the table are meant to highlight ongoing Fund costs only and do not reflect any transaction costs, such as creation and redemption fees, or brokerage charges. Therefore, the second line of the table is useful in comparing ongoing costs only, and will not help you determine the relative total costs of owning different funds. in addition, if these costs were included, your costs would have been higher.
| | | | | | | | | | | | | | | | |
| | | Beginning
Account Value
12/01/12 | | | Ending
Account Value
05/31/13 | | | Expense Ratio(a) | | | Expenses Paid
During Period
12/01/12(b) -
05/31/13 | |
Velocity Shares Emerging Markets DR ETF | | | | | | | | | | | | | | | | |
Actual(c) | | $ | 1,000.00 | | | $ | 990.80 | | | | 0.65 | % | | $ | 0.96 | |
Hypothetical | | $ | 1,000.00 | | | $ | 1,021.69 | | | | 0.65 | % | | $ | 3.28 | |
Velocity Shares Russia Select DR ETF | | | | | | | | | | | | | | | | |
Actual(c) | | $ | 1,000.00 | | | $ | 966.40 | | | | 0.65 | % | | $ | 0.95 | |
Hypothetical | | $ | 1,000.00 | | | $ | 1,021.69 | | | | 0.65 | % | | $ | 3.28 | |
Velocity Shares Emerging Asia DR ETF | | | | | | | | | | | | | | | | |
Actual(c) | | $ | 1,000.00 | | | $ | 1,030.40 | | | | 0.65 | % | | $ | 0.98 | |
Hypothetical | | $ | 1,000.00 | | | $ | 1,021.69 | | | | 0.65 | % | | $ | 3.28 | |
| (a) | Annualized based on the Fund’s most recent fiscal half-year expenses. |
| (b) | Expenses are equal to the Fund’s annualized expense ratio multiplied by the average account value over the period, multiplied by the number of days in the most recent fiscal half year (182), then divided by 365. |
| (c) | Actual Expenses Paid During Period is based on expenses paid since inception of the Funds on April 5, 2013. |
| | |
www.velocitysharesetfs.com | | 5 |
| |
| | |
| | SCHEDULE OF INVESTMENTS |
| | VelocityShares Emerging Markets DR ETF May 31, 2013 (Unaudited) |
| | | | | | | | |
| Security Description | | Shares | | | Value | |
COMMON STOCKS (88.61%) | | | | | | | | |
Argentina (0.33%) | | | | | | | | |
Alto Palermo SA, ADR | | | 2 | | | $ | 30 | |
Banco Macro SA, ADR(a) | | | 55 | | | | 831 | |
BBVA Banco Frances SA, ADR(a) | | | 67 | | | | 273 | |
Cresud SACIF y A, Sponsored ADR | | | 49 | | | | 396 | |
Empresa Distribuidora Y
Comercializadora Norte, ADR(a) | | | 14 | | | | 35 | |
Grupo Financiero Galicia SA, ADR | | | 130 | | | | 719 | |
IRSA Inversiones y Representaciones SA, Sponsored ADR | | | 34 | | | | 321 | |
Pampa Energia SA, Sponsored ADR(a) | | | 82 | | | | 268 | |
Petrobras Argentina SA, ADR | | | 104 | | | | 439 | |
Telecom Argentina SA,
Sponsored ADR | | | 37 | | | | 561 | |
Transportadora de Gas del Sur SA,
Sponsored ADR | | | 54 | | | | 97 | |
YPF SA, Sponsored ADR | | | 302 | | | | 4,349 | |
| | | | | | | | |
| | | | | | | 8,319 | |
| | | | | | | | |
| | |
Brazil (10.94%) | | | | | | | | |
Banco Bradesco SA, ADR | | | 3,344 | | | | 53,939 | |
Banco Bradesco SA, ADR | | | 790 | | | | 12,640 | |
Banco Santander Brasil
SA/Brazil, ADR | | | 822 | | | | 5,861 | |
BrasilAgro - Co. Brasileira de
Propriedades Agricolas,
Sponsored ADR(a) | | | 153 | | | | 786 | |
Braskem SA, Sponsored ADR(a) | | | 116 | | | | 1,827 | |
BRF - Brasil Foods SA, ADR | | | 1,071 | | | | 24,986 | |
Centrais Eletricas Brasileiras SA,
Sponsored ADR | | | 426 | | | | 1,099 | |
Cia de Bebidas das Americas,
Class C, ADR | | | 247 | | | | 9,275 | |
Cia de Saneamento Basico do
Estado de Sao Paulo, ADR | | | 534 | | | | 6,793 | |
Cia Energetica de Minas Gerais,
Class C, Sponsored ADR | | | 104 | | | | 1,089 | |
Cia Energetica de Minas Gerais,
Sponsored ADR | | | 847 | | | | 8,826 | |
Cia Siderurgica Nacional SA,
Sponsored ADR | | | 1,187 | | | | 3,739 | |
CPFL Energia SA, ADR | | | 173 | | | | 3,683 | |
Embraer SA, ADR | | | 244 | | | | 8,850 | |
Fibria Celulose SA, Sponsored
ADR(a) | | | 349 | | | | 3,832 | |
Gafisa SA, ADR(a) | | | 340 | | | | 1,190 | |
Gerdau SA, Sponsored ADR | | | 1,400 | | | | 8,554 | |
Gol Linhas Aereas Inteligentes SA, ADR(a) | | | 166 | | | | 740 | |
Oi SA, ADR | | | 1,313 | | | | 2,455 | |
Oi SA, Class C, ADR | | | 425 | | | | 825 | |
Petroleo Brasileiro SA, ADR | | | 2,631 | | | | 46,753 | |
Telefonica Brasil SA, ADR | | | 455 | | | | 11,243 | |
Tim Participacoes SA, ADR | | | 249 | | | | 4,771 | |
Ultrapar Participacoes SA,
Sponsored ADR | | | 647 | | | | 16,324 | |
| | | | | | | | |
| Security Description | | Shares | | | Value | |
Brazil (10.94%) (continued) | | | | | | | | |
Vale SA, Sponsored ADR | | | 2,141 | | | $ | 30,830 | |
| | | | | | | | |
| | | | | | | 270,910 | |
| | | | | | | | |
| | |
Chile (2.51%) | | | | | | | | |
Administradora de Fondos de
Pensiones Provida SA,
Sponsored ADR | | | 17 | | | | 1,563 | |
Banco de Chile, ADR | | | 36 | | | | 3,204 | |
Banco Santander Chile, ADR | | | 244 | | | | 5,941 | |
Cencosud SA, ADR | | | 556 | | | | 8,718 | |
Cia Cervecerais Unidas SA, ADR | | | 86 | | | | 2,294 | |
Corpbanca SA, ADR | | | 163 | | | | 2,903 | |
Embotelladora Andina SA,
Class A, ADR | | | 26 | | | | 776 | |
Embotelladora Andina SA,
Class B, ADR | | | 50 | | | | 1,912 | |
Empresa Nacional de Electricidad
SA/Chile, Sponsored ADR | | | 171 | | | | 8,206 | |
Enersis SA, Sponsored ADR | | | 606 | | | | 10,157 | |
Latam Airlines Group SA,
Sponsored ADR | | | 484 | | | | 8,635 | |
Sociedad Quimica y Minera de
Chile SA, Sponsored ADR | | | 142 | | | | 6,593 | |
Vina Concha y Toro SA,
Sponsored ADR | | | 30 | | | | 1,193 | |
| | | | | | | | |
| | | | | | | 62,095 | |
| | | | | | | | |
| | |
China (14.91%) | | | | | | | | |
21Vianet Group, Inc., ADR(a) | | | 48 | | | | 439 | |
51job, Inc., ADR(a) | | | 14 | | | | 840 | |
7 Days Group Holdings Ltd., ADR(a) | | | 31 | | | | 423 | |
Acorn International, Inc., ADR(a) | | | 9 | | | | 21 | |
Acquity Group Ltd., Sponsored ADR(a) | | | 4 | | | | 51 | |
Actions Semiconductor Co. Ltd., ADR(a) | | | 106 | | | | 314 | |
Agria Corp., ADR(a) | | | 43 | | | | 45 | |
AirMedia Group, Inc., ADR(a) | | | 67 | | | | 125 | |
Aluminum Corp. of China Ltd., ADR(a) | | | 246 | | | | 2,426 | |
ATA, Inc./China, ADR | | | 10 | | | | 43 | |
AutoNavi Holdings Ltd., ADR(a) | | | 43 | | | | 515 | |
Baidu, Inc., Sponsored ADR(a) | | | 439 | | | | 42,425 | |
Bitauto Holdings Ltd., ADR(a) | | | 28 | | | | 286 | |
Bona Film Group Ltd., Sponsored ADR(a) | | | 12 | | | | 57 | |
Camelot Information Systems,
Inc., ADR(a) | | | 62 | | | | 110 | |
Changyou.com Ltd., ADR | | | 17 | | | | 523 | |
Charm Communications, Inc., ADR | | | 10 | | | | 51 | |
China Digital TV Holding Co. Ltd., ADR | | | 82 | | | | 131 | |
China Distance Education Holdings Ltd., ADR | | | 14 | | | | 85 | |
China Eastern Airlines Corp. Ltd., ADR(a) | | | 50 | | | | 837 | |
China Finance Online Co. Ltd., ADR(a) | | | 19 | | | | 29 | |
China Hydroelectric Corp., ADR(a) | | | 38 | | | | 93 | |
China Life Insurance Co. Ltd., ADR | | | 803 | | | | 30,650 | |
| | |
6 | | Semi-Annual Report | May 31, 2013 |
SCHEDULE OF INVESTMENTS
VelocityShares Emerging Markets DR ETF
May 31, 2013 (Unaudited)
| | | | | | | | |
| Security Description | | Shares | | | Value | |
China (14.91%) (continued) | | | | | | | | |
China Lodging Group Ltd., Sponsored ADR(a) | | | 28 | | | $ | 447 | |
China Ming Yang Wind Power Group Ltd., ADR(a) | | | 101 | | | | 184 | |
China Mobile Ltd., Sponsored ADR | | | 1,662 | | | | 86,092 | |
China Nepstar Chain Drugstore Ltd., ADR(a) | | | 40 | | | | 68 | |
China New Borun Corp., ADR(a) | | | 12 | | | | 17 | |
China Petroleum & Chemical Corp., ADR | | | 317 | | | | 32,274 | |
China Southern Airlines Co. Ltd., Sponsored ADR | | | 55 | | | | 1,252 | |
China Sunergy Co. Ltd., ADR(a) | | | 8 | | | | 15 | |
China Techfaith Wireless Communication Technology Ltd., ADR(a) | | | 57 | | | | 62 | |
China Telecom Corp. Ltd., ADR | | | 216 | | | | 10,033 | |
China Unicom Hong Kong Ltd., ADR | | | 665 | | | | 9,011 | |
China Xiniya Fashion Ltd., Sponsored ADR(a) | | | 34 | | | | 37 | |
China Zenix Auto International Ltd., ADR(a) | | | 23 | | | | 59 | |
ChinaCache International Holdings Ltd., Sponsored ADR(a) | | | 22 | | | | 100 | |
ChinaEdu Corp., ADR(a) | | | 24 | | | | 144 | |
CNinsure, Inc., ADR(a) | | | 44 | | | | 271 | |
CNOOC Ltd., ADR | | | 256 | | | | 44,503 | |
Concord Medical Services Holdings Ltd., Sponsored ADR(a) | | | 37 | | | | 152 | |
Country Style Cooking Restaurant Chain Co. Ltd., Sponsored
ADR(a) | | | 11 | | | | 75 | |
Ctrip.com International Ltd., ADR(a) | | | 225 | | | | 7,009 | |
Daqo New Energy Corp., ADR(a) | | | 6 | | | | 43 | |
E-Commerce China Dangdang, Inc., Sponsored ADR(a) | | | 87 | | | | 559 | |
E-House China Holdings Ltd., ADR | | | 111 | | | | 551 | |
eLong, Inc., Sponsored ADR(a) | | | 4 | | | | 56 | |
Giant Interactive Group, Inc., ADR | | | 156 | | | | 1,320 | |
Guangshen Railway Co. Ltd., Sponsored ADR | | | 44 | | | | 966 | |
Hanwha SolarOne Co. Ltd., Sponsored ADR(a) | | | 67 | | | | 107 | |
Home Inns & Hotels Management, Inc., ADR(a) | | | 15 | | | | 435 | |
Huaneng Power International, Inc., Sponsored ADR | | | 124 | | | | 5,008 | |
IFM Investments Ltd., ADR(a) | | | 9 | | | | 27 | |
iSoftStone Holdings Ltd., ADR(a) | | | 69 | | | | 326 | |
JA Solar Holdings Co. Ltd., ADR(a) | | | 44 | | | | 323 | |
Jiayuan.com International Ltd., ADR | | | 21 | | | | 118 | |
JinkoSolar Holding Co. Ltd., ADR(a) | | | 18 | | | | 143 | |
Kingtone Wirelessinfo Solution Holding Ltd., ADR(a) | | | 1 | | | | 2 | |
KongZhong Corp., ADR(a) | | | 40 | | | | 264 | |
| | | | | | | | |
| Security Description | | Shares | | | Value | |
China (14.91%) (continued) | | | | | | | | |
Ku6 Media Co. Ltd., Sponsored ADR(a) | | | 21 | | | $ | 27 | |
LDK Solar Co. Ltd., ADR(a) | | | 103 | | | | 160 | |
Le Gaga Holdings Ltd., ADR(a) | | | 34 | | | | 127 | |
Lentuo International, Inc., Sponsored ADR(a) | | | 18 | | | | 80 | |
Linktone Ltd., ADR(a) | | | 27 | | | | 101 | |
Mecox Lane Ltd., ADR(a) | | | 7 | | | | 19 | |
Mindray Medical International Ltd., ADR | | | 134 | | | | 5,497 | |
NetEase, Inc., ADR | | | 114 | | | | 7,288 | |
New Oriental Education & Technology Group, Sponsored ADR | | | 206 | | | | 4,600 | |
Ninetowns Internet Technology Group Co. Ltd., ADR(a) | | | 35 | | | | 57 | |
Noah Education Holdings Ltd., ADR(a) | | | 22 | | | | 31 | |
Noah Holdings Ltd., Sponsored ADR | | | 27 | | | | 333 | |
NQ Mobile, Inc., ADR(a) | | | 18 | | | | 146 | |
O2Micro International Ltd., ADR(a) | | | 46 | | | | 159 | |
Ossen Innovation Co. Ltd., Sponsored ADR(a) | | | 13 | | | | 9 | |
Pactera Technology International Ltd., ADR(a) | | | 125 | | | | 835 | |
Perfect World Co. Ltd., Sponsored ADR | | | 62 | | | | 957 | |
PetroChina Co. Ltd., ADR | | | 346 | | | | 40,025 | |
Phoenix New Media Ltd., ADR(a) | | | 52 | | | | 242 | |
Qihoo 360 Technology Co. Ltd., ADR(a) | | | 120 | | | | 5,257 | |
RDA Microelectronics, Inc., Sponsored ADR | | | 28 | | | | 300 | |
ReneSola Ltd., ADR(a) | | | 99 | | | | 199 | |
Renren, Inc., ADR(a) | | | 211 | | | | 667 | |
Semiconductor Manufacturing International Corp., ADR(a) | | | 732 | | | | 2,935 | |
Shanda Games Ltd., Sponsored ADR(a) | | | 119 | | | | 490 | |
Simcere Pharmaceutical Group, ADR(a) | | | 31 | | | | 290 | |
Sinopec Shanghai Petrochemical Co. Ltd., Sponsored ADR | | | 37 | | | | 1,336 | |
Sky-mobi Ltd., Sponsored ADR(a) | | | 15 | | | | 52 | |
SouFun Holdings Ltd., ADR | | | 26 | | | | 695 | |
Spreadtrum Communications, Inc., ADR | | | 60 | | | | 1,168 | |
TAL Education Group, ADR | | | 53 | | | | 577 | |
Taomee Holdings Ltd., Sponsored ADR(a) | | | 16 | | | | 62 | |
The9 Ltd., ADR(a) | | | 29 | | | | 92 | |
Trina Solar Ltd., Sponsored
ADR(a) | | | 120 | | | | 701 | |
Vimicro International Corp.,
ADR(a) | | | 30 | | | | 43 | |
Vipshop Holdings Ltd., ADR(a) | | | 23 | | | | 689 | |
VisionChina Media, Inc., ADR(a) | | | 5 | | | | 11 | |
WSP Holdings Ltd., ADR(a) | | | 5 | | | | 15 | |
WuXi PharmaTech Cayman, Inc., ADR(a) | | | 110 | | | | 2,252 | |
| | |
www.velocitysharesetfs.com | | 7 |
| |
| | |
| | SCHEDULE OF INVESTMENTS |
| | VelocityShares Emerging Markets DR ETF May 31, 2013 (Unaudited) |
| | | | | | | | |
| Security Description | | Shares | | | Value | |
China (14.91%) (continued) | | | | | | | | |
Xinyuan Real Estate Co. Ltd., ADR | | | 51 | | | $ | 224 | |
Xueda Education Group, Sponsored ADR | | | 45 | | | | 142 | |
Yanzhou Coal Mining Co. Ltd., Sponsored ADR | | | 307 | | | | 3,088 | |
Yingli Green Energy Holding Co. Ltd., ADR(a) | | | 166 | | | | 473 | |
Youku Tudou, Inc., ADR(a) | | | 199 | | | | 4,070 | |
YY, Inc., ADR(a) | | | 12 | | | | 344 | |
Zuoan Fashion Ltd., Sponsored ADR(a) | | | 14 | | | | 38 | |
| | | | | | | | |
| | | | | | | 369,475 | |
| | | | | | | | |
| | |
Colombia (0.99%) | | | | | | | | |
Bancolombia SA, Sponsored ADR | | | 133 | | | | 7,701 | |
Ecopetrol SA, Sponsored ADR | | | 386 | | | | 16,733 | |
| | | | | | | | |
| | | | | | | 24,434 | |
| | | | | | | | |
| | |
Egypt (0.33%) | | | | | | | | |
Commercial International Bank Egypt SAE, GDR(b) | | | 934 | | | | 4,670 | |
Egyptian Financial Group-Hermes Holding, GDR(a) | | | 250 | | | | 525 | |
Orascom Telecom Holding SAE, GDR(a)(b) | | | 822 | | | | 2,680 | |
Orascom Telecom Media And Technology Holding SAE, GDR | | | 788 | | | | 236 | |
| | | | | | | | |
| | | | | | | 8,111 | |
| | | | | | | | |
| | |
India (7.07%) | | | | | | | | |
Axis Bank Ltd., GDR(b) | | | 359 | | | | 9,348 | |
Dr. Reddy’s Laboratories Ltd., ADR | | | 130 | | | | 4,806 | |
GAIL India Ltd., GDR(b) | | | 79 | | | | 2,716 | |
HDFC Bank Ltd., ADR | | | 618 | | | | 24,868 | |
ICICI Bank Ltd., Sponsored ADR | | | 456 | | | | 20,506 | |
Infosys Ltd., Sponsored ADR | | | 779 | | | | 32,523 | |
Larsen & Toubro Ltd., GDR(b) | | | 230 | | | | 5,778 | |
Mahindra & Mahindra Ltd., Sponsored GDR | | | 472 | | | | 8,095 | |
Ranbaxy Laboratories Ltd., Sponsored GDR(a)(b) | | | 198 | | | | 1,375 | |
Rediff.Com India Ltd., ADR(a) | | | 23 | | | | 64 | |
Reliance Industries Ltd., Sponsored GDR(c) | | | 1,264 | | | | 36,239 | |
Sify Technologies Ltd., Sponsored ADR(a) | | | 38 | | | | 75 | |
State Bank of India, GDR(b) | | | 105 | | | | 7,712 | |
Sterlite Industries India Ltd., ADR | | | 316 | | | | 2,092 | |
Tata Communications Ltd., ADR | | | 53 | | | | 379 | |
Tata Motors Ltd., Sponsored ADR | | | 294 | | | | 8,064 | |
Tata Steel Ltd., GDR(b) | | | 366 | | | | 1,965 | |
Wipro Ltd., ADR | | | 944 | | | | 7,205 | |
WNS Holdings Ltd., ADR(a) | | | 80 | | | | 1,288 | |
| | | | | | | | |
| | | | | | | 175,098 | |
| | | | | | | | |
| | | | | | | | |
| Security Description | | Shares | | | Value | |
Indonesia (0.71%) | | | | | | | | |
Telekomunikasi Indonesia Persero Tbk PT, Sponsored ADR | | | 388 | | | $ | 17,538 | |
| | | | | | | | |
| | |
Kazakhstan (0.26%) | | | | | | | | |
Halyk Savings Bank of Kazakhstan JSC, GDR(b) | | | 140 | | | | 1,021 | |
Kazkommertsbank JSC, GDR(a)(b) | | | 220 | | | | 438 | |
KazMunaiGas Exploration Production JSC, GDR(b) | | | 258 | | | | 4,012 | |
Zhaikmunai LP, GDR(b) | | | 95 | | | | 1,109 | |
| | | | | | | | |
| | | | | | | 6,580 | |
| | | | | | | | |
| | |
Lebanon (0.23%) | | | | | | | | |
Banque Audi SAL-Audi Saradar Group, GDR(b) | | | 409 | | | | 2,781 | |
BLOM Bank SAL, GDR(b) | | | 108 | | | | 950 | |
Solidere, GDR(b) | | | 166 | | | | 2,017 | |
| | | | | | | | |
| | | | | | | 5,748 | |
| | | | | | | | |
| | |
Mexico (6.59%) | | | | | | | | |
America Movil SAB de CV,
Series A, ADR | | | 60 | | | | 1,198 | |
America Movil SAB de CV,
Series L, ADR | | | 2,786 | | | | 55,469 | |
Cemex SAB de CV, Sponsored ADR(a) | | | 1,816 | | | | 20,884 | |
Coca-Cola Femsa SAB de CV, Sponsored ADR | | | 40 | | | | 5,854 | |
Desarrolladora Homex SAB de CV, ADR(a) | | | 57 | | | | 268 | |
Empresas ICA SAB de CV, Sponsored ADR(a) | | | 224 | | | | 1,615 | |
Fomento Economico Mexicano SABde CV, Sponsored ADR | | | 309 | | | | 33,554 | |
Gruma SAB de CV, Sponsored ADR(a) | | | 59 | | | | 1,048 | |
Grupo Aeroportuario del Centro Norte SAB de CV, ADR | | | 39 | | | | 1,088 | |
Grupo Aeroportuario del Pacifico SAB de CV, ADR | | | 58 | | | | 3,049 | |
Grupo Aeroportuario del Sureste SAB de CV, ADR(a) | | | 28 | | | | 3,356 | |
Grupo Financiero Santander Mexico SAB de CV, Class B, ADR(a) | | | 1,041 | | | | 16,469 | |
Grupo Simec SAB de CV, Sponsored ADR(a) | | | 50 | | | | 684 | |
Grupo Televisa SAB de CV, Sponsored ADR | | | 629 | | | | 16,404 | |
Industrias Bachoco SAB de CV, Sponsored ADR | | | 12 | | | | 413 | |
Ternium SA, Sponsored ADR | | | 83 | | | | 1,934 | |
| | | | | | | | |
| | | | | | | 163,287 | |
| | | | | | | | |
Nigeria (0.33%) | | | | | | | | |
Guaranty Trust Bank PLC, GDR(b) | | | 913 | | | | 8,126 | |
| | | | | | | | |
| | |
8 | | Semi-Annual Report | May 31, 2013 |
SCHEDULE OF INVESTMENTS
VelocityShares Emerging Markets DR ETF
May 31, 2013 (Unaudited)
| | | | | | | | |
| Security Description | | Shares | | | Value | |
Oman (0.08%) | | | | | | | | |
BankMuscat SAOG, GDR(b) | | | 303 | | | $ | 2,121 | |
| | | | | | | | |
Peru (0.25%) | | | | | | | | |
Cementos Pacasmayo SAA, ADR | | | 72 | | | | 918 | |
Cia de Minas Buenaventura SA, ADR | | | 289 | | | | 5,188 | |
| | | | | | | | |
| | | | | | | 6,106 | |
| | | | | | | | |
| | |
Phillipines (0.38%) | | | | | | | | |
Philippine Long Distance Telephone Co., Sponsored ADR | | | 130 | | | | 9,357 | |
| | | | | | | | |
| | |
Russia (14.13%) | | | | | | | | |
AFI Development PLC, GDR(a)(b) | | | 295 | | | | 189 | |
Cherkizovo Group OJSC,
GDR(a)(b) | | | 51 | | | | 519 | |
Etalon Group Ltd., GDR(a)(b) | | | 186 | | | | 706 | |
Eurasia Drilling Co. Ltd., GDR(b | | | 49 | | | | 2,021 | |
Federal Hydrogenerating Co. JSC, ADR(a) | | | 1,939 | | | | 2,806 | |
Gazprom Neft OAO, Sponsored ADR(a) | | | 59 | | | | 1,120 | |
Gazprom OAO, Sponsored
ADR(a) | | | 9,416 | | | | 71,185 | |
Global Ports Investments PLC, GDR(b) | | | 61 | | | | 826 | |
Globaltrans Investment PLC, Sponsored GDR(b) | | | 159 | | | | 2,417 | |
Hydraulic Machines and Systems Group PLC, GDR(b) | | | 52 | | | | 190 | |
IG Seismic Service PLC,
GDR(a)(b) | | | 8 | | | | 216 | |
LSR Group, GDR(b) | | | 412 | | | | 1,493 | |
Lukoil OAO, Sponsored ADR | | | 838 | | | | 49,526 | |
Magnit OJSC, Sponsored
GDR(a)(b) | | | 476 | | | | 26,061 | |
Magnitogorsk Iron & Steel Works, Sponsored GDR(b) | | | 398 | | | | 1,158 | |
Mail.ru Group Ltd., GDR(b) | | | 125 | | | | 3,490 | |
Mechel, Sponsored ADR | | | 215 | | | | 645 | |
MegaFon OAO, GDR(a) | | | 145 | | | | 4,534 | |
MMC Norilsk Nickel OJSC, ADR | | | 1,013 | | | | 14,668 | |
Mobile Telesystems OJSC, Sponsored ADR | | | 793 | | | | 15,281 | |
NOMOS-BANK, GDR(a)(b) | | | 15 | | | | 199 | |
Nord Gold NV, GDR(a)(b) | | | 66 | | | | 165 | |
NovaTek OAO, Sponsored
GDR(b) | | | 131 | | | | 14,698 | |
Novolipetsk Steel OJSC, GDR(b) | | | 103 | | | | 1,435 | |
Novorossiysk Commercial Sea Port PJSC, GDR(b) | | | 88 | | | | 581 | |
O’Key Group SA, GDR(b) | | | 58 | | | | 722 | |
Pharmstandard OJSC, GDR(a)(b) | | | 109 | | | | 2,467 | |
Phosagro OAO, GDR(b) | | | 127 | | | | 1,665 | |
PIK Group, GDR(a)(b) | | | 449 | | | | 885 | |
Ros Agro PLC, GDR(a)(b) | | | 46 | | | | 253 | |
Rosneft OAO, GDR(b) | | | 1,659 | | | | 11,024 | |
Rostelecom OJSC, Sponsored ADR | | | 376 | | | | 7,144 | |
Sberbank of Russia, Sponsored ADR(a) | | | 4,132 | | | | 51,071 | |
| | | | | | | | |
| Security Description | | Shares | | | Value | |
Russia (14.13%) (continued) | | | | | | | | |
Severstal OAO, GDR(b) | | | 275 | | | $ | 2,159 | |
Sistema JSFC, Sponsored
GDR(b) | | | 273 | | | | 5,212 | |
Surgutneftegas OAO, Sponsored ADR(a) | | | 1,509 | | | | 11,423 | |
Tatneft OAO, Sponsored
ADR(a) | | | 352 | | | | 12,232 | |
TMK OAO, GDR(b) | | | 84 | | | | 921 | |
Uralkali OJSC, Sponsored
GDR(b) | | | 410 | | | | 14,821 | |
VimpelCom Ltd., Sponsored ADR | | | 356 | | | | 3,542 | |
VTB Bank OJSC, GDR(a)(b) | | | 1,965 | | | | 5,706 | |
X5 Retail Group NV, GDR(a)(b) | | | 135 | | | | 2,673 | |
| | | | | | | | |
| | | | | | | 350,049 | |
| | | | | | | | |
| | |
South Africa (2.40%) | | | | | | | | |
AngloGold Ashanti Ltd., Sponsored ADR | | | 598 | | | | 10,848 | |
DRDGOLD Ltd., Sponsored ADR | | | 61 | | | | 358 | |
Gold Fields Ltd., Sponsored ADR | | | 1,143 | | | | 6,938 | |
Harmony Gold Mining Co. Ltd., Sponsored ADR | | | 574 | | | | 2,399 | |
Sappi Ltd., Sponsored ADR(a) | | | 747 | | | | 1,815 | |
Sasol Ltd., Sponsored ADR | | | 813 | | | | 36,081 | |
Sibanye Gold Ltd., Sponsored ADR(a) | | | 285 | | | | 1,032 | |
| | | | | | | | |
| | | | | | | 59,471 | |
| | | | | | | | |
| | |
South Korea (16.14%) | | | | | | | | |
Gravity Co. Ltd., Sponsored ADR(a) | | | 18 | | | | 19 | |
Hyundai Motor Co., GDR(b) | | | 59 | | | | 2,370 | |
KB Financial Group, Inc., ADR | | | 620 | | | | 20,243 | |
Korea Electric Power Corp., Sponsored ADR(a) | | | 884 | | | | 10,414 | |
KT Corp., Sponsored ADR | | | 401 | | | | 6,761 | |
LG Display Co. Ltd., ADR(a) | | | 695 | | | | 9,535 | |
LG Electronics, Inc., GDR(b)(c) | | | 36 | | | | 513 | |
Lotte Shopping Co. Ltd.,
GDR(c) | | | 433 | | | | 7,019 | |
POSCO, ADR | | | 544 | | | | 38,434 | |
Samsung Electronics Co. Ltd., GDR(b) | | | 385 | | | | 260,260 | |
Shinhan Financial Group Co. Ltd., ADR | | | 768 | | | | 27,325 | |
SK Telecom Co. Ltd., ADR | | | 557 | | | | 11,307 | |
Woori Finance Holdings Co. Ltd., ADR | | | 182 | | | | 5,709 | |
| | | | | | | | |
| | | | | | | 399,909 | |
| | | | | | | | |
| | |
Taiwan (8.86%) | | | | | | | | |
Acer, Inc., Sponsored GDR(a)(b) | | | 826 | | | | 3,169 | |
Advanced Semiconductor Engineering, Inc., ADR | | | 1,858 | | | | 7,804 | |
AU Optronics Corp., Sponsored ADR(a) | | | 1,401 | | | | 6,248 | |
China Steel Corp., Sponsored GDR | | | 1,008 | | | | 16,955 | |
Chunghwa Telecom Co. Ltd., ADR | | | 610 | | | | 19,130 | |
Himax Technologies, Inc., ADR | | | 148 | | | | 1,067 | |
| | |
www.velocitysharesetfs.com | | 9 |
| |
| | |
| | SCHEDULE OF INVESTMENTS |
| | VelocityShares Emerging Markets DR ETF May 31, 2013 (Unaudited) |
| | | | | | | | |
| Security Description | | Shares | | | Value | |
Taiwan (8.86%) (continued) | | | | | | | | |
Hon Hai Precision Industry Co. Ltd., GDR(b) | | | 8,117 | | | $ | 41,031 | |
Silicon Motion Technology Corp., ADR | | | 53 | | | | 596 | |
Siliconware Precision Industries Co., Sponsored ADR | | | 918 | | | | 5,278 | |
Taiwan Semiconductor Manufacturing Co. Ltd., Sponsored ADR | | | 5,888 | | | | 109,870 | |
United Microelectronics Corp., Sponsored ADR | | | 3,809 | | | | 8,265 | |
| | | | | | | | |
| | | | | | | 219,413 | |
| | | | | | | | |
| | |
Turkey (1.13%) | | | | | | | | |
Turkcell Iletisim Hizmetleri AS, ADR(a) | | | 496 | | | | 7,624 | |
Turkiye Garanti Bankasi AS, ADR | | | 3,617 | | | | 20,309 | |
| | | | | | | | |
| | | | | | | 27,933 | |
| | | | | | | | |
Ukraine (0.04%) | | | | | | | | |
Avangardco Investments Public Ltd., GDR(a) | | | 23 | | | | 222 | |
MHP SA, GDR(b) | | | 37 | | | | 688 | |
| | | | | | | | |
| | | | | | | 910 | |
| | | | | | | | |
TOTAL COMMON STOCKS (Cost $2,222,201) | | | | | | | 2,194,990 | |
| | | | | | | | |
| |
PREFERRED STOCK (10.55%) | | | | | |
Argentina (0.03%) | | | | | | | | |
Nortel Inversora SA, Class B, ADR | | | 41 | | | | 699 | |
| | | | | | | | |
| | |
Brazil (9.28%) | | | | | | | | |
Centrais Eletricas Brasileiras SA, Class B, ADR | | | 357 | | | | 1,703 | |
Cia Brasileira de Distribuicao Grupo Pao de Acucar, Sponsored ADR | | | 222 | | | | 10,914 | |
Cia de Bebidas das Americas, ADR | | | 1,208 | | | | 45,989 | |
Cia Paranaense de Energia, Sponsored ADR | | | 157 | | | | 2,444 | |
Itau Unibanco Holding SA, ADR | | | 4,011 | | | | 60,325 | |
Petroleo Brasileiro SA, Class A, Sponsored ADR | | | 3,382 | | | | 63,040 | |
Vale SA, Sponsored ADR | | | 3,377 | | | | 45,522 | |
| | | | | | | | |
| | | | | | | 229,937 | |
| | | | | | | | |
Russia (0.00%)(d) | | | | | | | | |
Mechel, Sponsored ADR | | | 178 | | | | 157 | |
| | | | | | | | |
| | |
South Korea (1.24%) | | | | | | | | |
Samsung Electronics Co. Ltd., GDR(b) | | | 71 | | | | 30,636 | |
| | | | | | | | |
| |
TOTAL PREFERRED STOCK (Cost $272,588) | | |
| 261,429
|
|
| | | | | | | | |
| | | | | | | | | | | | |
| | | 7 Day Yield | | | Shares | | | Value | |
SHORT TERM INVESTMENTS (0.34%) | |
Dreyfus Treasury Prime Cash Management, Institutional Class | | | 0.000 | %(e) | | | 8,343 | | | $ | 8,343 | |
| | | | | | | | | | | | |
| |
TOTAL SHORT TERM INVESTMENTS (Cost $8,343) | | | | 8,343 | |
| | | | | | | | | | | | |
| |
TOTAL INVESTMENTS (99.50%) (Cost $2,503,132) | | | $ | 2,464,762 | |
| |
NET OTHER ASSETS AND
LIABILITIES (0.50%) | | | | 12,253 | |
| | | | | | | | | | | | |
| |
NET ASSETS (100.00%) | | | $ | 2,477,015 | |
| | | | | | | | | | | | |
| (a) | Non-income producing security. |
| (b) | These securities initially sold to other parties pursuant to Regulation S under the 1933 Act and subsequently resold to the Fund. At the period end, the aggregate market values of these securities were $502,358, representing 20.28% of the Fund’s net assets. |
| (c) | Security exempt from registration under Rule 144A of the Securities Act of 1933. This security may be resold in transactions exempt from registration, normally to qualified institutional buyers. At period end, the market value of this security restricted under Rule 144A was $ 43,771, representing 1.77% of the Fund’s net assets. |
Common Abbreviations:
ADR - American Depositary Receipt.
AS - Anonim Sirket is the Turkish term for Incorporation.
GDR - Global Depositary Receipt.
JSC - Joint Stock Company.
JSFC - Joint Stock Financial Corporation.
LP - Limited Partnership.
Ltd. - Limited.
NV - Naamloze Vennootschap is the Dutch term for a public
limited liability corporation.
OAO - Otkrytoe Aktsionernoe Obschestvo is the Russian term
for Open Joint Stock Company.
OJSC - Open Joint Stock Company.
PJSC - Private Joint Stock Company.
PLC - Public Limited Company.
SA - Generally designates corporations in various countries,
mostly those emloying the civil law.
SAA - Sociedad Anonima Abierta is the Peruvian term used
for companies with 20 or more shareholders.
SAB de CV - A variable capital company.
| | |
10 | | Semi-Annual Report | May 31, 2013 |
SCHEDULE OF INVESTMENTS
VelocityShares Emerging Markets DR ETF
May 31, 2013 (Unaudited)
SACIF y A - Sociedad Anonima Comercial, Industrial,
Financiera Y Agropecuaria.
SAE - Societe Anonyme Egyptienne is the French term for a
Joint Stock Company in Egypt.
SAL - Societe Anonyme Libanaise is the French term for a
Joint Stock Company in Lebanon.
SAOG - Societe Anonyme Omanaise Generale the term for an
Open Joint Stock Company in Oman.
Tbk PT - Terbuka Perseroan Terbatas is an Indonesian term
for a limited liability company.
See Notes to Financial Statements.
| | |
www.velocitysharesetfs.com | | 11 |
| |
| | |
| | SCHEDULE OF INVESTMENTS |
| | VelocityShares Russia Select DR ETF May 31, 2013 (Unaudited) |
| | | | | | | | |
| Security Description | | Shares | | | Value | |
COMMON STOCKS (99.47%) | | | | | | | | |
Chemicals: Agricultural (6.16%) | |
Phosagro OAO, GDR(a) | | | 3,222 | | | $ | 42,241 | |
Uralkali OJSC, Sponsored GDR(a) | | | 2,948 | | | | 106,570 | |
| | | | | | | | |
| | | | | | | 148,811 | |
| | | | | | | | |
| |
Construction Materials (0.63%) | | | | | |
LSR Group, GDR(a) | | | 4,220 | | | | 15,293 | |
| | | | | | | | |
| | |
Contract Drilling (1.23%) | | | | | | | | |
Eurasia Drilling Co. Ltd.,
GDR(a) | | | 723 | | | | 29,824 | |
| | | | | | | | |
| | |
Electric Utilities (1.22%) | | | | | | | | |
Federal Hydrogenerating Co. JSC, ADR(b) | | | 20,301 | | | | 29,376 | |
| | | | | | | | |
| | |
Food Retail (7.91%) | | | | | | | | |
Magnit OJSC, Sponsored GDR(a)(b) | | | 2,460 | | | | 134,685 | |
O’Key Group SA, GDR(a) | | | 1,673 | | | | 20,829 | |
X5 Retail Group NV, GDR(a)(b) | | | 1,800 | | | | 35,640 | |
| | | | | | | | |
| | | | | | | 191,154 | |
| | | | | | | | |
| | |
Homebuilding (1.29%) | | | | | | | | |
Etalon Group Ltd., GDR(a)(b) | | | 4,299 | | | | 16,311 | |
PIK Group, GDR(a)(b) | | | 7,547 | | | | 14,875 | |
| | | | | | | | |
| | | | | | | 31,186 | |
| | | | | | | | |
| | |
Integrated Oil (35.79%) | | | | | | | | |
Gazprom Neft OAO, Sponsored ADR(b) | | | 1,048 | | | | 19,901 | |
Gazprom OAO, Sponsored ADR(b) | | | 65,701 | | | | 496,700 | |
Lukoil OAO, Sponsored ADR | | | 1,678 | | | | 99,170 | |
NovaTek OAO, Sponsored GDR(a) | | | 638 | | | | 71,584 | |
Rosneft OAO, GDR(a) | | | 13,532 | | | | 89,920 | |
Surgutneftegas OAO, Sponsored ADR(b) | | | 11,557 | | | | 87,486 | |
| | | | | | | | |
| | | | | | | 864,761 | |
| | | | | | | | |
| |
Internet Software/Services (1.50%) | | | | | |
Mail.ru Group Ltd., GDR(a) | | | 1,299 | | | | 36,268 | |
| | | | | | | | |
| |
Major Communications (2.12%) | | | | | |
Sistema JSFC, Sponsored GDR(a) | | | 2,684 | | | | 51,238 | |
| | | | | | | | |
| |
Oil & Gas Production (3.75%) | | | | | |
Tatneft OAO, Sponsored
ADR(b) | | | 2,606 | | | | 90,558 | |
| | | | | | | | |
| |
Oilfield Services/Equipment (1.55%) | | | | | |
Global Ports Investments | | | | | | | | |
PLC, GDR(a) | | | 1,445 | | | | 19,565 | |
TMK OAO, GDR(a) | | | 1,625 | | | | 17,810 | |
| | | | | | | | |
| | | | | | | 37,375 | |
| | | | | | | | |
| |
Other Metals/Minerals (3.37%) | | | | | |
MMC Norilsk Nickel OJSC, ADR | | | 5,623 | | | | 81,421 | |
| | | | | | | | |
| | | | | | | | |
| Security Description | | Shares | | | Value | |
Other Transportation (0.62%) | |
Novorossiysk Commercial Sea Port PJSC, GDR(a) | | | 2,280 | | | $ | 15,048 | |
| | | | | | | | |
|
Pharmaceuticals: Other (1.39%) | |
Pharmstandard OJSC, GDR(a)(b) | | | 1,486 | | | | 33,628 | |
| | | | | | | | |
| | |
Railroads (1.31%) | | | | | | | | |
Globaltrans Investment PLC, Sponsored GDR(a) | | | 2,075 | | | | 31,540 | |
| | | | | | | | |
| | |
Regional Banks (16.88%) | | | | | | | | |
Sberbank of Russia, Sponsored ADR(b) | | | 28,782 | | | | 355,745 | |
VTB Bank OJSC, GDR(a)(b) | | | 17,941 | | | | 52,101 | |
| | | | | | | | |
| | | | | | | 407,846 | |
| | | | | | | | |
| |
Specialty Communications (2.58%) | | | | | |
Rostelecom OJSC, Sponsored ADR | | | 3,281 | | | | 62,339 | |
| | | | | | | | |
| | |
Steel (2.49%) | | | | | | | | |
Mechel, Sponsored ADR(b) | | | 4,297 | | | | 12,891 | |
Novolipetsk Steel OJSC, GDR(a) | | | 1,537 | | | | 21,410 | |
Severstal OAO, GDR(a) | | | 3,309 | | | | 25,976 | |
| | | | | | | | |
| | | | | | | 60,277 | |
| | | | | | | | |
|
Wireless Telecommunications (7.68%) | |
MegaFon OAO, GDR(b) | | | 1,519 | | | | 47,499 | |
Mobile Telesystems OJSC, Sponsored ADR | | | 5,250 | | | | 101,167 | |
VimpelCom Ltd., Sponsored ADR | | | 3,709 | | | | 36,905 | |
| | | | | | | | |
| | | | | | | 185,571 | |
| | | | | | | | |
| |
TOTAL COMMON STOCKS | | | | | |
(Cost $2,502,687) | | | | | | | 2,403,514 | |
| | | | | | | | |
| | | | | | | | | | | | |
| | | 7 Day Yield | | | Shares | | | Value | |
SHORT TERM INVESTMENTS (0.13%) | |
Dreyfus Treasury Prime Cash Management, Institutional Class | | | 0.000 | %(c) | | | 3,086 | | | | 3,086 | |
| | | | | | | | | | | | |
| |
TOTAL SHORT TERM INVESTMENTS (Cost $3,086) | | | | 3,086 | |
| | | | | | | | | | | | |
| |
TOTAL INVESTMENTS (99.60%) (Cost $2,505,773) | | | $ | 2,406,600 | |
| |
NET OTHER ASSETS AND LIABILITIES (0.40%) | | | | 9,661 | |
| | | | | | | | | | | | |
| | |
NET ASSETS (100.00%) | | | | | | | $ | 2,416,261 | |
| | | | | | | | | | | | |
| | |
12 | | Semi-Annual Report | May 31, 2013 |
SCHEDULE OF INVESTMENTS
VelocityShares Russia Select DR ETF
May 31, 2013 (Unaudited)
| (a) | These securities initially sold to other parties pursuant to Regulation S under the 1933 Act and subsequently resold to the Fund. At the period end, the aggregate market values of these securities were $882,354, representing 36.52% of the Fund’s net assets. |
| (b) | Non-income producing security. |
Common Abbreviations:
ADR - American Depositary Receipt.
GDR - Global Depositary Receipt.
JSC - Joint Stock Company.
JSFC - Joint Stock Financial Corporation.
Ltd. - Limited.
NV - Naamloze Vennootschap is the Dutch term for a public
limited liability corporation.
OAO - Otkrytoe Aktsionernoe Obschestvo is the Russian term
for Open Joint Stock Company.
OJSC - Open Joint Stock Company.
PJSC - Private Joint Stock Company.
PLC - Public Limited Company.
SA - Generally designates corporations in various countries,
mostly those emloying the civil law.
See Notes to Financial Statements.
| | |
www.velocitysharesetfs.com | | 13 |
| |
| | |
| | SCHEDULE OF INVESTMENTS |
| | VelocityShares Emerging Asia DR ETF May 31, 2013 (Unaudited) |
| | | | | | | | |
| Security Description | | Shares | | | Value | |
COMMON STOCKS (96.95%) | | | | | | | | |
China (30.01%) | | | | | | | | |
21Vianet Group, Inc., ADR(a) | | | 200 | | | $ | 1,828 | |
51job, Inc., ADR(a) | | | 58 | | | | 3,480 | |
7 Days Group Holdings Ltd., ADR(a) | | | 130 | | | | 1,775 | |
Acorn International, Inc.,
ADR(a) | | | 44 | | | | 103 | |
Acquity Group Ltd., Sponsored
ADR(a) | | | 18 | | | | 231 | |
Actions Semiconductor Co. Ltd., ADR(a) | | | 446 | | | | 1,320 | |
Agria Corp., ADR(a) | | | 180 | | | | 189 | |
AirMedia Group, Inc., ADR(a) | | | 286 | | | | 532 | |
Aluminum Corp. of China Ltd., ADR(a) | | | 1,040 | | | | 10,254 | |
ATA, Inc./China, ADR | | | 42 | | | | 182 | |
AutoNavi Holdings Ltd., ADR(a) | | | 184 | | | | 2,204 | |
Baidu, Inc., Sponsored ADR(a) | | | 1,809 | | | | 174,822 | |
Bitauto Holdings Ltd., ADR(a) | | | 116 | | | | 1,184 | |
Bona Film Group Ltd., Sponsored ADR(a) | | | 48 | | | | 228 | |
Camelot Information Systems, Inc., ADR(a) | | | 258 | | | | 459 | |
Changyou.com Ltd., ADR | | | 70 | | | | 2,152 | |
Charm Communications, Inc., ADR | | | 42 | | | | 215 | |
China Digital TV Holding Co. Ltd., ADR | | | 348 | | | | 557 | |
China Distance Education Holdings Ltd., ADR | | | 58 | | | | 353 | |
China Eastern Airlines Corp. Ltd., ADR(a) | | | 208 | | | | 3,484 | |
China Finance Online Co. Ltd., ADR(a) | | | 80 | | | | 122 | |
China Hydroelectric Corp., ADR(a) | | | 164 | | | | 402 | |
China Life Insurance Co. Ltd., ADR | | | 3,322 | | | | 126,801 | |
China Lodging Group Ltd., Sponsored ADR(a) | | | 116 | | | | 1,852 | |
China Ming Yang Wind Power Group Ltd., ADR(a) | | | 426 | | | | 775 | |
China Mobile Ltd., Sponsored ADR | | | 7,011 | | | | 363,170 | |
China Nepstar Chain Drugstore Ltd., ADR(a) | | | 172 | | | | 294 | |
China New Borun Corp.,
ADR(a) | | | 50 | | | | 69 | |
China Petroleum & Chemical Corp., ADR | | | 1,314 | | | | 133,778 | |
China Southern Airlines Co. Ltd., Sponsored ADR | | | 228 | | | | 5,189 | |
China Sunergy Co. Ltd.,
ADR(a) | | | 32 | | | | 59 | |
China Techfaith Wireless Communication Technology Ltd., ADR(a) | | | 238 | | | | 257 | |
China Telecom Corp. Ltd., ADR | | | 941 | | | | 43,709 | |
China Unicom Hong Kong Ltd., ADR | | | 2,873 | | | | 38,929 | |
| | | | | | | | |
| Security Description | | Shares | | | Value | |
China (30.01%) (continued) | | | | | | | | |
China Xiniya Fashion Ltd., Sponsored ADR(a) | | | 142 | | | $ | 156 | |
China Zenix Auto International Ltd., ADR(a) | | | 102 | | | | 263 | |
ChinaCache International Holdings Ltd., Sponsored ADR(a) | | | 90 | | | | 411 | |
ChinaEdu Corp., ADR(a) | | | 100 | | | | 599 | |
CNinsure, Inc., ADR(a) | | | 188 | | | | 1,160 | |
CNOOC Ltd., ADR | | | 1,075 | | | | 186,878 | |
Concord Medical Services Holdings Ltd., Sponsored ADR(a) | | | 154 | | | | 633 | |
Country Style Cooking Restaurant Chain Co. Ltd., Sponsored ADR(a) | | | 44 | | | | 302 | |
Ctrip.com International Ltd., ADR(a) | | | 948 | | | | 29,530 | |
Daqo New Energy Corp.,
ADR(a) | | | 24 | | | | 172 | |
E-Commerce China Dangdang, Inc., Sponsored ADR(a) | | | 368 | | | | 2,363 | |
E-House China Holdings Ltd., ADR | | | 466 | | | | 2,311 | |
eLong, Inc., Sponsored ADR(a) | | | 14 | | | | 197 | |
Giant Interactive Group, Inc., ADR | | | 654 | | | | 5,533 | |
Guangshen Railway Co. Ltd., Sponsored ADR | | | 188 | | | | 4,127 | |
Hanwha SolarOne Co. Ltd., Sponsored ADR(a) | | | 278 | | | | 445 | |
Home Inns & Hotels Management, Inc., ADR(a) | | | 68 | | | | 1,971 | |
Huaneng Power International, Inc., Sponsored ADR | | | 522 | | | | 21,084 | |
IFM Investments Ltd., ADR(a) | | | 40 | | | | 119 | |
iSoftStone Holdings Ltd.,
ADR(a) | | | 294 | | | | 1,391 | |
JA Solar Holdings Co. Ltd., ADR(a) | | | 190 | | | | 1,395 | |
Jiayuan.com International Ltd., ADR | | | 86 | | | | 485 | |
JinkoSolar Holding Co. Ltd., ADR(a) | | | 74 | | | | 588 | |
Kingtone Wirelessinfo Solution Holding Ltd., ADR(a) | | | 4 | | | | 9 | |
KongZhong Corp., ADR(a) | | | 168 | | | | 1,109 | |
Ku6 Media Co. Ltd., Sponsored ADR(a) | | | 88 | | | | 114 | |
LDK Solar Co. Ltd., ADR(a) | | | 406 | | | | 629 | |
Le Gaga Holdings Ltd., ADR(a) | | | 148 | | | | 554 | |
Lentuo International, Inc., Sponsored ADR(a) | | | 76 | | | | 336 | |
Linktone Ltd., ADR(a) | | | 110 | | | | 411 | |
Mecox Lane Ltd., ADR(a) | | | 30 | | | | 82 | |
Mindray Medical International Ltd., ADR | | | 568 | | | | 23,299 | |
NetEase, Inc., ADR | | | 486 | | | | 31,070 | |
New Oriental Education & Technology Group, Sponsored ADR | | | 868 | | | | 19,382 | |
| | |
14 | | Semi-Annual Report | May 31, 2013 |
SCHEDULE OF INVESTMENTS
VelocityShares Emerging Asia DR ETF
May 31, 2013 (Unaudited)
| | | | | | | | |
| Security Description | | Shares | | | Value | |
China (30.01%) (continued) | | | | | |
Ninetowns Internet Technology Group Co. Ltd., ADR(a) | | | 146 | | | $ | 237 | |
Noah Education Holdings Ltd., ADR(a) | | | 92 | | | | 131 | |
Noah Holdings Ltd., Sponsored ADR | | | 118 | | | | 1,456 | |
NQ Mobile, Inc., ADR(a) | | | 76 | | | | 617 | |
O2Micro International Ltd., ADR(a) | | | 198 | | | | 683 | |
Ossen Innovation Co. Ltd., Sponsored ADR(a) | | | 54 | | | | 38 | |
Pactera Technology International Ltd., ADR(a) | | | 526 | | | | 3,514 | |
Perfect World Co. Ltd., Sponsored ADR | | | 264 | | | | 4,074 | |
PetroChina Co. Ltd., ADR | | | 1,412 | | | | 163,340 | |
Phoenix New Media Ltd., ADR(a) | | | 222 | | | | 1,035 | |
Qihoo 360 Technology Co. Ltd., ADR(a) | | | 506 | | | | 22,168 | |
RDA Microelectronics, Inc., Sponsored ADR | | | 144 | | | | 1,542 | |
ReneSola Ltd., ADR(a) | | | 416 | | | | 836 | |
Renren, Inc., ADR(a) | | | 890 | | | | 2,812 | |
Semiconductor Manufacturing International Corp.,
ADR(a) | | | 3,082 | | | | 12,359 | |
Shanda Games Ltd., Sponsored ADR(a) | | | 498 | | | | 2,052 | |
Simcere Pharmaceutical Group, ADR(a) | | | 128 | | | | 1,196 | |
Sinopec Shanghai Petrochemical Co. Ltd., Sponsored ADR | | | 154 | | | | 5,559 | |
Sky-mobi Ltd., Sponsored ADR(a) | | | 62 | | | | 213 | |
SouFun Holdings Ltd., ADR | | | 114 | | | | 3,049 | |
Spreadtrum Communications, Inc., ADR | | | 254 | | | | 4,943 | |
TAL Education Group, ADR | | | 226 | | | | 2,459 | |
Taomee Holdings Ltd., Sponsored ADR(a) | | | 66 | | | | 256 | |
The9 Ltd., ADR(a) | | | 122 | | | | 387 | |
Trina Solar Ltd., Sponsored ADR(a) | | | 504 | | | | 2,943 | |
Vimicro International Corp., ADR(a) | | | 124 | | | | 179 | |
Vipshop Holdings Ltd., ADR(a) | | | 94 | | | | 2,817 | |
VisionChina Media, Inc., ADR(a) | | | 22 | | | | 50 | |
WSP Holdings Ltd., ADR(a) | | | 26 | | | | 79 | |
WuXi PharmaTech Cayman, Inc., ADR(a) | | | 462 | | | | 9,457 | |
Xinyuan Real Estate Co. Ltd., ADR | | | 212 | | | | 931 | |
Xueda Education Group, Sponsored ADR | | | 186 | | | | 586 | |
Yanzhou Coal Mining Co. Ltd., Sponsored ADR | | | 1,292 | | | | 12,998 | |
Yingli Green Energy Holding Co. Ltd., ADR(a) | | | 696 | | | | 1,984 | |
Youku Tudou, Inc., ADR(a) | | | 838 | | | | 17,137 | |
YY, Inc., ADR(a) | | | 52 | | | | 1,490 | |
Zuoan Fashion Ltd., Sponsored ADR(a) | | | 56 | | | | 151 | |
| | | | | | | | |
| | | | | | | 1,545,824 | |
| | | | | | | | |
| | | | | | | | |
| Security Description | | Shares | | | Value | |
India (14.24%) | | | | | | | | |
Axis Bank Ltd., GDR(b) | | | 1,510 | | | $ | 39,320 | |
Dr. Reddy’s Laboratories Ltd., ADR | | | 546 | | | | 20,186 | |
GAIL India Ltd., GDR(b) | | | 334 | | | | 11,483 | |
HDFC Bank Ltd., ADR | | | 2,590 | | | | 104,222 | |
ICICI Bank Ltd., Sponsored ADR | | | 1,881 | | | | 84,588 | |
Infosys Ltd., Sponsored ADR | | | 3,230 | | | | 134,852 | |
Larsen & Toubro Ltd., GDR(b) | | | 974 | | | | 24,467 | |
Mahindra & Mahindra Ltd., Sponsored GDR | | | 1,984 | | | | 34,026 | |
Ranbaxy Laboratories Ltd., Sponsored GDR(a)(b) | | | 832 | | | | 5,778 | |
Rediff.Com India Ltd., ADR(a) | | | 96 | | | | 265 | |
Reliance Industries Ltd., Sponsored GDR(c) | | | 5,293 | | | | 151,750 | |
Sify Technologies Ltd., Sponsored ADR(a) | | | 164 | | | | 323 | |
State Bank of India, GDR(b) | | | 442 | | | | 32,465 | |
Sterlite Industries India Ltd., ADR | | | 1,330 | | | | 8,805 | |
Tata Communications Ltd., ADR | | | 226 | | | | 1,614 | |
Tata Motors Ltd., Sponsored ADR | | | 1,265 | | | | 34,699 | |
Tata Steel Ltd., GDR(b) | | | 1,538 | | | | 8,259 | |
Wipro Ltd., ADR | | | 4,080 | | | | 31,132 | |
WNS Holdings Ltd., ADR(a) | | | 340 | | | | 5,474 | |
| | | | | | | | |
| | | | | | | 733,708 | |
| | | | | | | | |
| | |
Indonesia (1.45%) | | | | | | | | |
Telekomunikasi Indonesia Persero Tbk PT, Sponsored ADR | | | 1,655 | | | | 74,806 | |
| | | | | | | | |
| | |
Phillipines (0.79%) | | | | | | | | |
Philippine Long Distance Telephone Co., Sponsored ADR | | | 567 | | | | 40,813 | |
| | | | | | | | |
| | |
South Korea (32.63%) | | | | | | | | |
Gravity Co. Ltd., Sponsored ADR(a) | | | 76 | | | | 81 | |
Hyundai Motor Co., GDR(b) | | | 246 | | | | 9,882 | |
KB Financial Group, Inc., ADR | | | 2,598 | | | | 84,825 | |
Korea Electric Power Corp., Sponsored ADR(a) | | | 3,826 | | | | 45,070 | |
KT Corp., Sponsored ADR | | | 1,763 | | | | 29,724 | |
LG Display Co. Ltd., ADR | | | 3,003 | | | | 41,201 | |
LG Electronics, Inc., GDR(b)(c) | | | 150 | | | | 2,136 | |
Lotte Shopping Co. Ltd., GDR(c) | | | 1,828 | | | | 29,632 | |
POSCO, ADR | | | 2,226 | | | | 157,267 | |
Samsung Electronics Co. Ltd., GDR(b) | | | 1,619 | | | | 1,094,444 | |
Shinhan Financial Group Co. Ltd., ADR | | | 3,178 | | | | 113,073 | |
SK Telecom Co. Ltd., ADR | | | 2,400 | | | | 48,720 | |
Woori Finance Holdings Co. Ltd., ADR | | | 787 | | | | 24,688 | |
| | | | | | | | |
| | | | | | | 1,680,743 | |
| | | | | | | | |
| | |
www.velocitysharesetfs.com | | 15 |
| |
| | |
| | SCHEDULE OF INVESTMENTS |
| | VelocityShares Emerging Asia DR ETF May 31, 2013 (Unaudited) |
| | | | | | | | |
| Security Description | | Shares | | | Value | |
Taiwan (17.83%) | | | | | | | | |
Acer, Inc., Sponsored
GDR(a)(b) | | | 3,478 | | | $ | 13,342 | |
Advanced Semiconductor Engineering, Inc., ADR | | | 8,024 | | | | 33,701 | |
AU Optronics Corp., Sponsored ADR(a) | | | 5,966 | | | | 26,608 | |
China Steel Corp., Sponsored GDR | | | 4,005 | | | | 67,364 | |
Chunghwa Telecom Co. Ltd., ADR | | | 2,558 | | | | 80,219 | |
Himax Technologies, Inc., ADR | | | 626 | | | | 4,513 | |
Hon Hai Precision Industry Co. Ltd., GDR(b) | | | 33,854 | | | | 171,132 | |
Silicon Motion Technology Corp., ADR | | | 228 | | | | 2,563 | |
Siliconware Precision Industries Co., Sponsored ADR | | | 3,966 | | | | 22,804 | |
Taiwan Semiconductor Manufacturing Co. Ltd., Sponsored ADR | | | 24,682 | | | | 460,566 | |
United Microelectronics Corp., Sponsored ADR | | | 16,546 | | | | 35,905 | |
| | | | | | | | |
| | | | | | | 918,717 | |
| | | | | | | | |
| |
TOTAL COMMON STOCKS (Cost $4,878,180) | | | | 4,994,611 | |
| | | | | | | | |
| |
PREFERRED STOCKS (2.57%) | | | | | |
South Korea (2.57%) | | | | | |
Samsung Electronics Co. Ltd., GDR(b) | | | 307 | | | | 132,471 | |
| | | | | | | | |
| |
TOTAL PREFERRED STOCKS (Cost $115,041) | | | | 132,471 | |
| | | | | | | | |
| | | | | | | | | | | | |
| | | 7 Day Yield | | | Shares | | | Value | |
SHORT TERM INVESTMENTS (0.04%) | |
Dreyfus Treasury Prime Cash Management, Institutional Class | | | 0.000 | %(d) | | | 1,868 | | | | 1,868 | |
| | | | | | | | | | | | |
| |
TOTAL SHORT TERM INVESTMENTS (Cost $1,868) | | | | 1,868 | |
| | | | | | | | | | | | |
| |
TOTAL INVESTMENTS (99.56%) (Cost $4,995,089) | | | $ | 5,128,950 | |
| |
NET OTHER ASSETS AND
LIABILITIES (0.44%) | | | | 22,754 | |
| | | | | | | | | | | | |
| |
NET ASSETS (100.00%) | | | $ | 5,151,704 | |
| | | | | | | | | | | | |
| (a) | Non-income producing security. |
| (b) | These securities initially sold to other parties pursuant to Regulation S under the 1933 Act and subsequently resold to the Fund. At the period end, the aggregate market values of these securities were $1,545,178, representing 30.00% of the Fund’s net assets. |
| (c) | Security exempt from registration under Rule 144A of the Securities Act of 1933. This security may be resold in transactions exempt from registration, normally to qualified institutional buyers. At period end, the market value of this security restricted under Rule 144A was $183,518, representing 3.56% of the Fund’s net assets. |
Common Abbreviations:
ADR - American Depositary Receipt.
GDR - Global Depositary Receipt.
Ltd. - Limited.
Tbk PT - Terbuka Perseroan Terbatas is an Indonesian term
for a limited liability company.
See Notes to Financial Statements.
| | |
16 | | Semi-Annual Report | May 31, 2013 |
STATEMENTS OF ASSETS & LIABILITIES
May 31, 2013 (Unaudited)
| | | | | | | | | | | | |
| | | VelocityShares Emerging
Markets DR ETF | | | VelocityShares
Russia Select DR ETF | | | VelocityShares Emerging
Asia DR ETF | |
ASSETS: | | | | | | | | | | | | |
Investments, at value | | $ | 2,464,762 | | | $ | 2,406,600 | | | $ | 5,128,949 | |
Cash | | | 484 | | | | – | | | | – | |
Receivable for investments sold | | | 514 | | | | – | | | | 2,122 | |
Dividends receivable | | | 12,674 | | | | 11,064 | | | | 23,540 | |
Total Assets | | | 2,478,434 | | | | 2,417,664 | | | | 5,154,611 | |
| | | |
LIABILITIES: | | | | | | | | | | | | |
Payable to advisor | | | 1,419 | | | | 1,403 | | | | 2,907 | |
Total Liabilities | | | 1,419 | | | | 1,403 | | | | 2,907 | |
NET ASSETS | | $ | 2,477,015 | | | $ | 2,416,261 | | | $ | 5,151,704 | |
| | | | | | | | | | | | | |
| | | |
NET ASSETS CONSIST OF: | | | | | | | | | | | | |
Paid-in capital | | $ | 2,512,192 | | | $ | 2,617,099 | | | $ | 5,000,050 | |
Accumulated net investment income | | | 20,040 | | | | 14,313 | | | | 18,031 | |
Accumulated net realized loss on investments | | | (16,847 | ) | | | (115,978 | ) | | | (237 | ) |
Net unrealized appreciation/(depreciation) on investments | | | (38,370 | ) | | | (99,173 | ) | | | 133,860 | |
NET ASSETS | | $ | 2,477,015 | | | $ | 2,416,261 | | | $ | 5,151,704 | |
| | | | | | | | | | | | | |
| | | |
INVESTMENTS, AT COST | | $ | 2,503,132 | | | $ | 2,505,773 | | | $ | 4,995,089 | |
| | | |
PRICING OF SHARES | | | | | | | | | | | | |
Net Assets | | $ | 2,477,015 | | | $ | 2,416,261 | | | $ | 5,151,704 | |
Shares of beneficial interest outstanding (Unlimited number of shares authorized, par value $0.01per share) | | | 50,001 | | | | 50,001 | | | | 100,001 | |
Net Asset Value, offering and redemption price per share | | $ | 49.54 | | | $ | 48.32 | | | $ | 51.52 | |
See Notes to Financial Statements.
| | |
www.velocitysharesetfs.com | | 17 |
| |
| | |
| | STATEMENTS OF OPERATIONS |
| | For the Period April 5, 2013 (Inception) to May 31, 2013 (Unaudited) |
| | | | | | | | | | | | |
| | | VelocityShares Emerging
Markets DR ETF | | | VelocityShares
Russia Select DR ETF | | | VelocityShares Emerging
Asia DR ETF | |
INVESTMENT INCOME: | | | | | | | | | | | | |
Dividends(a) | | $ | 23,112 | | | $ | 17,344 | | | $ | 22,934 | |
Total Investment Income | | | 23,112 | | | | 17,344 | | | | 22,934 | |
| | | |
EXPENSES: | | | | | | | | | | | | |
Investment advisory fee | | | 3,072 | | | | 3,031 | | | | 4,903 | |
Total Expenses | | | 3,072 | | | | 3,031 | | | | 4,903 | |
NET INVESTMENT INCOME | | | 20,040 | | | | 14,313 | | | | 18,031 | |
| | | |
Net realized loss on investments | | | (16,847 | ) | | | (115,978 | ) | | | (237 | ) |
Net change in unrealized appreciation/(depreciation) on investments | | | (38,370 | ) | | | (99,173 | ) | | | 133,860 | |
NET REALIZED AND UNREALIZED GAIN/(LOSS) ON INVESTMENTS | | | (55,217 | ) | | | (215,151 | ) | | | 133,623 | |
NET INCREASE/(DECREASE) IN NET ASSETS RESULTING FROM OPERATIONS | | $ | (35,177 | ) | | $ | (200,838 | ) | | $ | 151,654 | |
| | | | | | | | | | | | | |
| (a) | Net of foreign withholding tax of $1,514, $2,624, and $2,168, respectively. |
See Notes to Financial Statements.
| | |
18 | | Semi-Annual Report | May 31, 2013 |
STATEMENT OF CHANGES IN NET ASSETS
For the Period April 5, 2013 (Inception) to
May 31, 2013 (Unaudited)
| | | | | | | | | | | | |
| | | VelocityShares Emerging
Markets DR ETF | | | VelocityShares
Russia Select DR ETF | | | VelocityShares Emerging
Asia DR ETF | |
OPERATIONS: | | | | | | | | | | | | |
Net investment income | | $ | 20,040 | | | $ | 14,313 | | | $ | 18,031 | |
Net realized loss on investments | | | (16,847 | ) | | | (115,978 | ) | | | (237 | ) |
Net change in unrealized appreciation/ (depreciation) on investments | | | (38,370 | ) | | | (99,173 | ) | | | 133,860 | |
Net increase/(decrease) in net assets resulting from operations | | | (35,177 | ) | | | (200,838 | ) | | | 151,654 | |
| | | |
SHARE TRANSACTIONS: | | | | | | | | | | | | |
Proceeds from sale of shares | | | 5,000,050 | | | | 5,000,050 | | | | 5,000,050 | |
Cost of shares redeemed | | | (2,487,858 | ) | | | (2,382,951 | ) | | | – | |
Net increase from share transactions | | | 2,512,192 | | | | 2,617,099 | | | | 5,000,050 | |
Net increase in net assets | | | 2,477,015 | | | | 2,416,261 | | | | 5,151,704 | |
| | | |
NET ASSETS: | | | | | | | | | | | | |
Beginning of period | | | – | | | | – | | | | – | |
End of period* | | $ | 2,477,015 | | | $ | 2,416,261 | | | $ | 5,151,704 | |
| | | | | | | | | | | | | |
| | | |
*Including accumulated net investment income of: | | $ | 20,040 | | | $ | 14,313 | | | $ | 18,031 | |
| | | |
OTHER INFORMATION: | | | | | | | | | | | | |
SHARE TRANSACTIONS: | | | | | | | | | | | | |
Beginning shares | | | – | | | | – | | | | – | |
Shares sold | | | 100,001 | | | | 100,001 | | | | 100,001 | |
Shares redeemed | | | (50,000 | ) | | | (50,000 | ) | | | – | |
Shares outstanding, end of period | | | 50,001 | | | | 50,001 | | | | 100,001 | |
| | | | | | | | | | | | | |
See Notes to Financial Statements.
| | |
www.velocitysharesetfs.com | | 19 |
| |
| | |
| | FINANCIAL HIGHLIGHTS |
| | For the Shares Outstanding For the Period Presented |
| | | | | | | | | | | | |
| | | VelocityShares
Emerging Markets
DR ETF | | | VelocityShares
Russia Select DR ETF | | | VelocityShares
Emerging Asia DR ETF | |
| | | For the Period
April 5, 2013 (Inception)
Through May 31, 2013
(Unaudited)(a) | | | For the Period
April 5, 2013 (Inception)
Through May 31, 2013
(Unaudited)(a) | | | For the Period
April 5, 2013 (Inception)
Through May 31, 2013
(Unaudited)(a) | |
NET ASSET VALUE, BEGINNING OF PERIOD | | $ | 50.00 | | | $ | 50.00 | | | $ | 50.00 | |
| | | |
INCOME/(LOSS) FROM OPERATIONS: | | | | | | | | | | | | |
Net investment income(b) | | | 0.32 | | | | 0.23 | | | | 0.18 | |
Net realized and unrealized gain/(loss) on investments | | | (0.78 | ) | | | (1.91 | ) | | | 1.34 | |
Total from Investment Operations | | | (0.46 | ) | | | (1.68 | ) | | | 1.52 | |
| | | | | | | | | | | | |
| | | |
NET INCREASE/(DECREASE) IN NET ASSET VALUE | | | (0.46 | ) | | | (1.68 | ) | | | 1.52 | |
NET ASSET VALUE, END OF PERIOD | | $ | 49.54 | | | $ | 48.32 | | | $ | 51.52 | |
| | | | | | | | | | | | | |
TOTAL RETURN(c) | | | (0.92 | )% | | | (3.36 | )% | | | 3.04 | % |
| | | |
RATIOS/ SUPPLEMENTAL DATA: | | | | | | | | | | | | |
Net assets, end of period (in 000s) | | $ | 2,477 | | | $ | 2,416 | | | $ | 5,152 | |
| | | |
RATIOS TO AVERAGE NET ASSETS: | | | | | | | | | | | | |
Net investment income(d) | | | 4.24 | % | | | 3.07 | % | | | 2.39 | % |
Operating expenses(d) | | | 0.65 | % | | | 0.65 | % | | | 0.65 | % |
PORTFOLIO TURNOVER RATE(e) | | | 1 | % | | | 5 | % | | | 0 | % |
| (a) | The Velocityshares Emerging Markets ETF, the Velocity Shares Russia Select DR ETF and the VelocityShares Emerging Asia DR ETF commenced operations on April 5, 2013. |
| (b) | Calculated using average shares outstanding. |
| (c) | Total return is calculated assuming an initial investment made at the net asset value at the beginning of the period and redemption at the net asset value on the last day of the period and assuming all distributions are reinvested at actual reinvestment prices. Total return calculated for a period of less than one year is not annualized. |
| (e) | Portfolio turnover is not annualized and does not include securities received or delivered from processing creations or redemptions. |
See Notes to Financial Statements.
| | |
20 | | Semi-Annual Report | May 31, 2013 |
NOTES TO FINANCIAL STATEMENTS
May 31, 2013 (Unaudited)
1. ORGANIZATION
The ALPS ETF Trust (the “Trust”), a Delaware statutory trust, is an open-end management investment company under the Investment Company Act of 1940, as amended (the “1940 Act”). As of May 31, 2013, the Trust consists of thirteen separate portfolios. Each portfolio represents a separate series of the Trust. This report pertains to the VelocityShares Emerging Markets DR ETF, VelocityShares Russia Select DR ETF and Velocity Shares Emerging Asia DR ETF (each a “Fund” and collectively, the “Funds”). The Funds commenced operations on April 5, 2013.
The investment objective of the VelocityShares Emerging Markets DR ETF is to seek investment results that correspond generally to the performance, before fees and expenses, of its underlying index, the BNY Mellon Emerging Markets DR Index (the “Underlying Index”).
The investment objective of the VelocityShares Russia Select DR ETF is to seek investment results that correspond generally to the performance, before fees and expenses, of its underlying index, the BNY Mellon Russia Select DR Index (the “Underlying Index”).
The investment objective of the Velocity Shares Emerging Asia DR ETF is to seek investment results that correspond generally to the performance, before fees and expenses, of its underlying index, the BNY Mellon Emerging Asia DR Index (the “Underlying Index”).
Each Fund’s Shares (“Shares”) are listed on The NASDAQ Stock Market LLC (“NASDAQ”). Each Fund issues and redeems Shares at net asset value (“NAV”), in blocks of 50,000 Shares, each of which is called a “Creation Unit.” Creation Units are issued and redeemed principally in-kind for securities included in a specified index. Except when aggregated in Creation Units, Shares are not redeemable securities of the Fund.
2. SIGNIFICANT ACCOUNTING POLICIES
The following is a summary of significant accounting policies consistently followed by the Funds in the preparation of the financial statements. The accompanying financial statements were prepared in accordance with accounting principles generally accepted in the United States of America (“U.S. GAAP”). The preparation of financial statements in conformity with U.S. GAAP requires management to make certain estimates and assumptions that affect the reported amounts of assets and liabilities and disclosures of contingent assets and liabilities at the date of the financial statements and the reported amounts of revenue and expenses during the period. Actual results could differ from those estimates.
A. Portfolio Valuation
Each Fund’s NAV is determined daily, as of the close of regular trading on the NASDAQ, normally 4:00 p.m. Eastern time, on each day the NYSE is open for trading. The NAV is computed by dividing the value of all assets of the Fund (including accrued interest and dividends), less all liabilities (including accrued expenses and dividends declared but unpaid), by the total number of shares outstanding.
Portfolio securities listed on any exchange other than the National Association of Securities Dealer Automated Quotation (“NASDAQ”) exchange are valued at the last sale price on the business day as of which such value is being determined. If there has been no sale on such day, the securities are valued at the mean of the most recent bid and asked prices on such day. Securities traded on the NASDAQ are valued at the NASDAQ Official Closing Price as determined by NASDAQ. Portfolio securities traded on more than one securities exchange are valued at the last sale price on the business day as of which such value is being determined at the close of the exchange representing the principal market for such securities. Portfolio securities traded in the over-the-counter market, but excluding securities traded on the NASDAQ, are valued at the closing bid prices. Short-term investments that mature in less than 60 days are valued at amortized cost, which approximates market value.
Each Fund’s investments are valued at market value or, in the absence of market value with respect to any portfolio securities, at fair value according to procedures adopted by the Trust’s Board of Trustees (the “Board”). When market quotations are not readily available or when events occur that make established valuation methods unreliable, securities of the Fund may be valued in good faith by or under the direction of the Board. These securities generally include, but are not limited to, restricted securities (securities which may not be publicly sold without registration under the Securities Act of 1933) for which a pricing service is unable to provide a market price; securities whose trading has been formally suspended; a security whose market price is not available from a pre-established primary pricing source or the pricing source is not willing to provide a price; a security with respect to which an event has occurred that is most likely to materially affect the value of the security after the market has closed but before the calculation of the Fund’s NAV or make it difficult or impossible to obtain a reliable market quotation;
| | |
www.velocitysharesetfs.com | | 21 |
| |
| | |
| | NOTES TO FINANCIAL STATEMENTS |
| | May 31, 2013 (Unaudited) |
or a security whose price, as provided by the pricing service, does not reflect the security’s “fair value” due to the security being de-listed from a national exchange or the security’s primary trading market is temporarily closed at a time when, under normal conditions, it would be open. As a general principle, the current “fair value” of a security would be the amount which the owner might reasonably expect to receive from the closing sale prices on the applicable exchange and fair value prices may not reflect the actual value of a security. A variety of factors may be considered in determining the fair value of such securities.
B. Concentration of Risk
The Funds seek to track the Underlying Indexes, which may have concentrations in certain regions, economies, countries, markets, industries or sectors. Underperformance or increased risk in such concentrated areas may result in underperformance or increased risk in the Funds.
C. Securities Transactions and Investment Income
Securities transactions are recorded as of the trade date. Realized gains and losses from securities transactions are recorded on the highest cost basis. Dividend income is recorded on the ex-dividend date. Interest income, if any, is recorded on the accrual basis.
D. Dividends and Distributions to Shareholders
Dividends from net investment income of the Fund, if any, are declared and paid quarterly or as the Board may determine from time to time. Distributions of net realized capital gains earned by the Fund, if any, are distributed at least annually.
E. Federal Tax and Tax Basis Information
The timing and character of income and capital gain distributions are determined in accordance with income tax regulations, which may differ from U.S. GAAP. Reclassifications are made to each Fund’s capital accounts for permanent tax differences to reflect income and gains available for distribution (or available capital loss carryforwards) under income tax regulations. The amounts and characteristics of tax basis distributions and composition of distributable earnings/(accumulated losses) are finalized at fiscal year end: accordingly, tax basis balances have not been determined as of May 31, 2013.
Distributions from net investment income and capital gains are determined in accordance with income tax regulations, which may differ from U.S. GAAP. These differences are primarily due to differing treatments of income and gains on various investment securities held by the Fund, timing differences and differing characterization of distributions made by each Fund.
As of May 31, 2013, the costs of investments for federal income tax purposes and accumulated net unrealized appreciation/ (depreciation) on investments were as follows:
| | | | | | | | | | | | | | | | | | | | | | |
| | | Cost of investments for
income tax purposes | | | | | Gross Appreciation
(excess of value over
tax cost) | | | | | Gross Depreciation
(excess of tax cost
over value) | | | | | Net Unrealized
Appreciation/
(Depreciation) | |
VelocityShares Emerging Markets DR ETF | | $ | 2,503,144 | | | | | $ | 81,492 | | | | | $ | (119,873 | ) | | | | $ | (38,381 | ) |
VelocityShares Russia Select DR ETF | | $ | 2,505,991 | | | | | $ | 53,046 | | | | | $ | (152,437 | ) | | | | $ | (99,391 | ) |
VelocityShares Emerging Asia DR ETF | | $ | 4,995,089 | | | | | $ | 261,975 | | | | | $ | (128,115 | ) | | | | $ | 133,860 | |
F. Income Taxes
No provision for income taxes is included in the accompanying financial statements, as each Fund intends to distribute to shareholders all taxable investment income and realized gains and otherwise comply with Subchapter M of the Internal Revenue Code of 1986, as amended, applicable to regulated investment companies.
Each Fund evaluates tax positions taken (or expected to be taken) in the course of preparing each Fund’s tax returns to determine whether these positions meet a “more-likely-than-not” standard that, based on the technical merits, have a more than fifty percent likelihood of being sustained by a taxing authority upon examination. A tax position that meets the “more-likely-than-not” recognition threshold is measured to determine the amount of benefit to recognize in the financial statements.
As of and during the period ended May 31, 2013, each Fund did not have a liability for any unrecognized tax benefits. Each Fund files U.S. federal, state, and local tax returns as required. Each Fund’s tax returns are subject to examination by the relevant tax authorities until expiration of the applicable statute of limitations which is generally three years after the filing of the tax return. Being that the Funds’ inception date was April 5, 2013, no tax returns have been filed as of the date of this report.
| | |
22 | | Semi-Annual Report | May 31, 2013 |
NOTES TO FINANCIAL STATEMENTS
May 31, 2013 (Unaudited)
G. Fair Value Measurements
Each Fund discloses the classification of fair value measurements following a three-tier hierarchy based on the inputs used to measure fair value. Inputs refer broadly to the assumptions that market participants would use in pricing the asset or liability, including assumptions about risk. Inputs may be observable or unobservable. Observable inputs reflect the assumptions market participants would use in pricing the asset or liability that are developed based on market data obtained from sources independent of the reporting entity. Unobservable inputs reflect the reporting entity’s own assumptions about the assumptions market participants would use in pricing the asset or liability that are developed based on the best information available.
Various inputs are used in determining the value of each Fund’s investments as of the end of the reporting period. When inputs used fall into different levels of the fair value hierarchy, the level in the hierarchy within which the fair value measurement falls is determined based on the lowest level input that is significant to the fair value measurement in its entirety. The designated input levels are not necessarily an indication of the risk or liquidity associated with these investments. These inputs are categorized in the following hierarchy under applicable financial accounting standards:
| | | | |
Level 1 | | – | | Unadjusted quoted prices in active markets for identical investments, unrestricted assets or liabilities that a Fund has the ability to access at the measurement date; |
| | |
Level 2 | | – | | Quoted prices which are not active, quoted prices for similar assets or liabilities in active markets or inputs other than quoted prices that are observable (either directly or indirectly) for substantially the full term of the asset or liability; and |
| | |
Level 3 | | – | | Significant unobservable prices or inputs (including the Fund’s own assumptions in determining the fair value of investments) where there is little or no market activity for the asset or liability at the measurement date. |
The following is a summary of the inputs used to value each Fund’s investments at May 31, 2013:
VelocityShares Emerging Markets DR ETF
| | | | | | | | | | | | | | | | | | | | |
| Investments in Securities at Value* | | Level 1 | | Level 2 | | Level 3 | | Total |
Common Stocks | | | $ | 2,194,990 | | | | $ | – | | | | $ | – | | | | $ | 2,194,990 | |
Preferred Stocks | | | | 261,429 | | | | | – | | | | | – | | | | | 261,429 | |
Short Term Investments | | | | 8,343 | | | | | – | | | | | – | | | | | 8,343 | |
TOTAL | | | $ | 2,464,762 | | | | $ | – | | | | $ | – | | | | $ | 2,464,762 | |
| | | | | | | | | | | | | | | | | | | | | |
| | | | |
VelocityShares Emerging Russia Select DR ETF | | | | | | | | | | | | | | | | | | | | |
| Investments in Securities at Value* | | Level 1 | | Level 2 | | Level 3 | | Total |
Common Stocks | | | $ | 2,403,514 | | | | $ | – | | | | $ | – | | | | $ | 2,403,514 | |
Short Term Investments | | | | 3,086 | | | | | – | | | | | – | | | | | 3,086 | |
TOTAL | | | $ | 2,406,600 | | | | $ | – | | | | $ | – | | | | $ | 2,406,600 | |
| | | | | | | | | | | | | | | | | | | | | |
| | | | |
VelocityShares Emerging Asia DR ETF | | | | | | | | | | | | | | | | | | | | |
| Investments in Securities at Value* | | Level 1 | | Level 2 | | Level 3 | | Total |
Common Stocks | | | $ | 4,994,611 | | | | $ | – | | | | $ | – | | | | $ | 4,994,611 | |
Preferred Stocks | | | | 132,471 | | | | | – | | | | | – | | | | | 132,471 | |
Short Term Investments | | | | 1,868 | | | | | – | | | | | – | | | | | 1,868 | |
TOTAL | | | $ | 5,128,950 | | | | $ | – | | | | $ | – | | | | $ | 5,128,950 | |
| | | | | | | | | | | | | | | | | | | | | |
| * | For detailed country and industry descriptions, see the accompanying Schedule of Investments. |
| | |
www.velocitysharesetfs.com | | 23 |
| |
| | |
| | NOTES TO FINANCIAL STATEMENTS |
| | May 31, 2013 (Unaudited) |
Each Fund recognizes transfers between levels as of the end of the period. For the period ended May 31, 2013, each Fund did not have any transfers between Level 1 and Level 2 securities. Each Fund did not have any securities which used significant unobservable inputs (Level 3) in determining fair value.
3. INVESTMENT ADVISORY FEE AND OTHER AFFILIATED TRANSACTIONS
ALPS Advisors, Inc. (the “Investment Adviser”) acts as each Fund’s investment adviser pursuant to an advisory agreement with the Trust on behalf of each Fund (the “Advisory Agreement”). Pursuant to the Advisory Agreement, each Fund pays the Investment Adviser a unitary fee for the services and facilities it provides, accrued daily on average net assets and payable on a monthly basis, at the annual rates listed below. From time to time, the Adviser may waive all or a portion of its fee.
| | |
| Fund | | Advisory Fee |
VelocityShares Emerging Markets DR ETF | | 0.65% |
VelocityShares Russia Select DR ETF | | 0.65% |
VelocityShares Emerging Asia DR ETF | | 0.65% |
Out of the unitary management fees, the Investment Adviser pays substantially all expenses of the Funds, including the licensing fee of the Index provider, and the cost of transfer agency, custody, fund administration, legal, audit, trustees and other services, except for interest expenses, distribution fees or expenses, brokerage expenses, taxes and extraordinary expenses not incurred in the ordinary course of the Funds’ business. In addition, the Investment Adviser’s unitary management fees are designed to compensate the Investment Adviser for providing services for the Funds.
ALPS Fund Services, Inc. (“ALPS”), an affiliate of the Investment Adviser, is the administrator of the Funds.
The Bank of New York Mellon is the custodian, fund accounting agent and transfer agent for the Funds.
Each Trustee who is not an officer or employee of the Investment Adviser, any sub-adviser or any of their affiliates (“Independent Trustees”) is paid a quarterly retainer of $5,000, $3,750 for each regularly scheduled Board meeting attended and $1,500 for each special meeting held outside of regularly scheduled meetings.
4. PURCHASES AND SALES OF SECURITIES
For the period ended May 31, 2013, the cost of purchases and proceeds from sales of investment securities, excluding short-term investments and in-kind transactions, were as follows:
| | | | | | | | | | |
| | | Purchases | | Sales |
VelocityShares Emerging Markets DR ETF | | | $ | 44,674 | | | | $ | 25,330 | |
VelocityShares Russia Select DR ETF | | | $ | 173,015 | | | | $ | 132,470 | |
VelocityShares Emerging Asia DR ETF | | | $ | 80,101 | | | | $ | 21,870 | |
|
For the period ended May 31, 2013, the cost of in-kind purchases and proceeds from in-kind sales, were as follows: | |
| | | Purchases | | Sales |
VelocityShares Emerging Markets DR ETF | | | $ | 4,980,058 | | | | $ | 2,487,766 | |
VelocityShares Russia Select DR ETF | | | $ | 4,961,152 | | | | $ | 2,383,032 | |
VelocityShares Emerging Asia DR ETF | | | $ | 4,935,228 | | | | $ | – | |
Gains on in-kind transactions are not considered taxable for federal income tax purposes.
| | |
24 | | Semi-Annual Report | May 31, 2013 |
NOTES TO FINANCIAL STATEMENTS
May 31, 2013 (Unaudited)
5. CAPITAL SHARE TRANSACTIONS
Shares are created and redeemed by each Fund only in Creation Unit size aggregations of 50,000. Only broker-dealers or large institutional investors with creation and redemption agreements called Authorized Participants (“AP”) are permitted to purchase or redeem Creation Units from the Fund. Such transactions are generally permitted on an in-kind basis, with a balancing cash component to equate the transaction to the net asset value per unit of each Fund on the transaction date. Cash may be substituted equivalent to the value of certain securities generally when they are not available in sufficient quantity for delivery, not eligible for trading by the AP or as a result of other market circumstances.
6. INDEMNIFICATIONS
Under the Trust’s organizational documents, its officers and Trustees are indemnified against certain liability arising out of the performance of their duties to the Trust. Additionally, in the normal course of business, the Trust enters into contracts with service providers that contain general indemnification clauses. The Trust’s maximum exposure under these arrangements is unknown, as this would involve future claims that may be made against the Trust that have not yet occurred.
| | |
www.velocitysharesetfs.com | | 25 |
| |
| | |
| | ADDITIONAL INFORMATION |
| | May 31, 2013 (Unaudited) |
PROXY VOTING POLICIES AND PROCEDURES
A description of the Funds’ proxy voting policies and procedures used in determining how to vote for proxies and information regarding how the Funds voted proxies related to portfolio securities during the most recent 12-month period ended June 30th is available without charge, (1) on the Securities and Exchange Commission’s (“SEC”) website at http://www.sec.gov; (2) upon request, by calling (toll-free) 1-866-513-5856; and (3) on the Trust’s website located at http://www.alpsfunds.com.
PORTFOLIO HOLDINGS
The Trust will file its complete schedule of portfolio holdings with the SEC for the first and third quarters of each fiscal year on Form N-Q. The Trust’s Form N-Q will be available (1) on the SEC’s website at http://www.sec.gov; (2) by calling (toll-free) 1-866-513-5856; (3) on the Trust’s website located at http://www.alpsfunds.com; and (4) for review and copying at the SEC’s Public Reference Room (“PRR”) in Washington D.C. Information regarding the operation of the PRR may be obtained by calling (toll-free) 1-800-732-0330.
| | |
26 | | Semi-Annual Report | May 31, 2013 |
BOARD CONSIDERATIONS REGARDING APPROVAL OF INVESTMENT ADVISORY AGREEMENT
May 31, 2013 (Unaudited)
At an in-person meeting held on December 10, 2012, the Board of Trustees of the Trust (the “Board”), including the Trustees who are not “interested persons” of the Trust within the meaning of the 1940 Act, as amended (the “Independent Trustees”), evaluated a proposal to approve the Advisory Agreement between the Trust and ALPS Advisors, Inc. (the “Adviser”) with respect to the VelocityShares Emerging Markets DR ETF, VelocityShares Russia Select DR ETF, and Velocity Shares Emerging Asia DR ETF, (collectively, “VS ETFs”). The Independent Trustees also met separately to consider the Advisory Agreement.
In evaluating the Advisory Agreement for the VS ETFs, the Board considered various factors, including (i) the nature, extent and quality of the services expected to be provided by the Adviser with respect to the funds under the Advisory Agreement, (ii) costs to the Adviser of its services; and (iii) the extent to which economies of scale would be realized if and as each Fund’s assets increase and whether the fee levels in the Advisory Agreement reflect these economies of scale.
The Board of Trustees, including a majority of the Independent Trustees, determined that approval of the Advisory Agreement was in the best interests of the VS ETFs. The Board of Trustees, including the Independent Trustees, did not identify any single factor or group of factors as all important or controlling and considered all factors together. In evaluating whether to approve the Advisory Agreement for the VS ETFs, the Board considered numerous factors, as described below.
With respect to the nature, extent and quality of the services to be provided by the Adviser under the Advisory Agreement, the Board considered and reviewed information concerning the services proposed to be provided under the Advisory Agreement, the proposed investment parameters of the indices for the VS ETFs, financial information regarding the Adviser, its parent company, information describing the Adviser’s current organizations and the background and experience of the persons who would be responsible for the day-to-day management of the VS ETFs, the anticipated financial support, the nature and quality of services provided to other exchange-traded (“ETFs”), open-end and closed-end funds by the Adviser. Based upon their review, the Board concluded that the Adviser was qualified to oversee the services to be provided by other service providers and that the services to be provided by the Adviser to the VS ETFs are expected to be satisfactory.
With respect to the costs of services to be provided and profits to be realized by the Adviser, the Board considered the resources involved in managing the VS ETFs as well as the fact that the Adviser agreed to pay all of the VS ETFs’ expenses (except for interest expenses, distribution fees or expenses, brokerage expenses, taxes and extraordinary expenses such as litigation and other expenses not incurred in the ordinary course of the Fund’s business) out of the unitary advisory fee. Based on its review, the Board concluded that the expected profitability of the VS ETFs to the Adviser was not unreasonable.
The Board reviewed the comparative fee information, including Lipper data. Based on its review, the Board concluded that the fees proposed to be charged (i.e. 0.65% for the VS ETFs), were competitive. The Board considered the extent to which economies of scale would be realized as the VS ETFs grow and whether fee levels reflect a reasonable sharing of such economies of scale for the benefit of each Fund’s investors. Because the VS ETFs are newly organized, the Board reviewed the unitary advisory fee proposed for the VS ETFs and anticipated expenses of each Fund and determined to review economies of scale in the future when the VS ETFs had attracted assets.
The Board also considered other benefits that may be realized by the Adviser from its relationship with the VS ETFs.
In voting to approve the Advisory Agreement, the Trustees, including the Independent Trustees, concluded that the terms of the Advisory Agreement were reasonable and fair in light of the services to be performed, expenses to be incurred and such other matters as the Trustees considered relevant in the exercise of their reasonable business judgment.
| | |
www.velocitysharesetfs.com | | 27 |
| |

This report has been prepared for shareholders of the ETFs described herein and may be distributed to others only if preceded or accompanied by a prospectus.
ALPS Portfolio Solutions Distributor, Inc., distributor for the ETFs.
VEL000133
Not Applicable to this Report.
| Item 3. | Audit Committee Financial Expert. |
Not Applicable to this Report.
| Item 4. | Principal Accountant Fees and Services. |
Not Applicable to this Report.
| Item 5. | Audit Committee of Listed Registrants. |
Not applicable to Registrant.
(a) Schedule of Investments is included as part of the Report to Stockholders filed under Item 1 of this Form N-CSR.
(b) Not applicable
| Item 7. | Disclosure of Proxy Voting Policies and Procedures for Closed-End Management Investment Companies. |
Not applicable to Registrant.
| Item 8. | Portfolio Managers of Closed-End Management Investment Companies. |
Not applicable to Registrant.
| Item 9. | Purchases of Equity Securities by Closed-End Management Investment Company and Affiliated Purchasers. |
Not applicable to Registrant.
| Item 10. | Submission of Matters to a Vote of Security Holders. |
No material changes to the procedures by which the shareholders may recommend nominees to the Registrant’s Board of Trustees have been implemented after the Registrant’s last provided disclosure in response to the requirements of Item 407(c)(2)(iv) of Regulation S-K (17 CFR 229.407) (as required by Item 22(b)(15) of Schedule 14A (17 CFR 240.14a-101)), or this Item.
| Item 11. | Controls and Procedures. |
| (a) | The Registrant’s principal executive and principal financial officers, or persons performing similar functions, have concluded that the Registrant’s disclosure controls and procedures (as defined in Rule 30a-3(c) under the Investment Company Act of 1940, as amended (the “1940 Act”) (17 CFR 270.30a-3(c))) are effective, as of a date within 90 days of the filing date of the report that includes the disclosure required by this paragraph, based on their evaluation of these controls and procedures required by Rule 30a-3(b) under the 1940 Act (17 CFR 270.30a-3(b)) and Rules 13a-15(b) or 15d-15(b) under the Securities Exchange Act of 1934, as amended (17 CFR 240.13a-15(b) or 240.15d-15(b)). |
| (b) | No changes in the Registrant’s internal control over financial reporting (as defined in Rule 30a-3(d) under the 1940 Act (17 CFR 270.30a-3(d)) occurred during the Registrant’s second fiscal quarter of the period covered by this report that have materially affected, or are reasonably likely to materially affect, the Registrant’s internal control over financial reporting. |
| | | | |
| | (a)(1) | | Not applicable to this Report. |
| | |
| | (a)(2) | | The certifications required by Rule 30a-2(a) of the Investment Company Act of 1940, as amended, and Section 302 of the Sarbanes-Oxley Act of 2002 are attached hereto as Exhibit 99.Cert. |
| | |
| | (a)(3) | | Not applicable. |
| | |
| | (b) | | The certifications by the Registrant’s principal executive officer and principal financial officer, as required by Rule 30a-2(b) of the Investment Company Act of 1940, as amended, and Section 906 of the Sarbanes-Oxley Act of 2002 are attached hereto as Exhibit 99.906Cert. |
SIGNATURES
Pursuant to the requirements of the Securities Exchange Act of 1934 and the Investment Company Act of 1940, the Registrant has duly caused this report to be signed on its behalf by the undersigned, thereunto duly authorized.
| | | | |
| ALPS ETF TRUST | | |
| | |
By: | | /s/ Thomas A. Carter | | |
| | Thomas A. Carter (Principal Executive Officer) | | |
| | President | | |
| | |
Date: | | August 5, 2013 | | |
Pursuant to the requirements of the Securities Exchange Act of 1934 and the Investment Company Act of 1940, this report has been signed below by the following persons on behalf of the registrant and in the capacities and on the dates indicated.
| | | | |
By: | | /s/ Thomas A. Carter | | |
| | Thomas A. Carter (Principal Executive Officer) | | |
| | President | | |
| | |
Date: | | August 5, 2013 | | |
| | |
By: | | /s/ Patrick D. Buchanan | | |
| | Patrick D. Buchanan (Principal Financial Officer) | | |
| | Treasurer | | |
| | |
Date: | | August 5, 2013 | | |