Table of Contents
UNITED STATES
SECURITIES AND EXCHANGE COMMISSION
Washington, D.C. 20549
FORM N-CSR
CERTIFIED SHAREHOLDER REPORT OF REGISTERED
MANAGEMENT INVESTMENT COMPANIES
Investment Company Act file number:
811-22175
ALPS ETF TRUST
(Exact name of registrant as specified in charter)
1290 Broadway, Suite 1100, Denver, Colorado 80203
(Address of principal executive offices) (Zip code)
Tané Tyler, Esq., Secretary
ALPS ETF Trust
1290 Broadway, Suite 1100
Denver, Colorado 80203
(Name and address of agent for service)
Registrant’s Telephone Number, including Area Code: (303) 623-2577
Date of fiscal year end: December 31
Date of reporting period: January 1, 2010 – June 30, 2010
Table of Contents
Item 1. Report to Stockholders.
Table of Contents
Table of Contents

| 2 | ||
| 3 | ||
| 6 | ||
Financial Statements | ||
| 7 | ||
| 11 | ||
| 12 | ||
| 13 | ||
| 14 | ||
| 15 | ||
| 23 | ||

Table of Contents

Dear Shareholders:
When ALPS launched its ETF Trust in 2008 our goal was to bring innovative solutions to the ETF industry that provide investors with access to a unique market segment or strategy. Our first portfolio – the Cohen & Steers Global Realty Majors ETF – is one of the first ETFs to provide investors with access to a diversified portfolio of global real estate securities. US real estate, while already a mainstream asset class, only covers 1/3 of the global real estate universe. Furthermore, the global market is growing at a rapid pace as foreign countries continue to securitize their private real estate holdings. As a result, a global real estate fund can provide investors with a wider range of opportunities than a purely domestic fund while preserving the diversification and income benefits of US REITs.
By partnering with Cohen & Steers, we have secured a best in breed real estate manager with a great track record and reputation. Furthermore, the transparency(1), low cost and tax efficiency of the ETF structure provides access to global real estate in a very efficient manner. We believe access to global real estate, the benefits of the ETF structure, and the expertise of Cohen & Steers make for a powerful investment combination that will allow investors to build better portfolios.
In the pages that follow our Fund managers have provided a performance overview. We thank you for your investment and for being a GRI shareholder.
|
Thomas A. Carter* |
President, ALPS ETF Trust |
| * | Registered representative of ALPS Distributors, Inc. |
Ordinary brokerage commissions apply.
| (1) | ETFs are considered transparent because their portfolio holdings are disclosed daily. |

Table of Contents

FUND DESCRIPTION
The Cohen & Steers Global Realty Majors ETF (the “Fund”) seeks investment results that correspond generally to the performance (before the Fund’s fees and expenses) of an equity index called the Cohen & Steers Global Realty Majors Index (the “Index”). The Shares of the Fund are listed and trade on the NYSE Arca under the ticker symbol “GRI.” The Fund will normally invest substantially all of its assets in the 75 stocks that comprise the Cohen & Steers Global Realty Majors Index. The Fund began trading on May 9, 2008.
The Index is a free-float, market-cap-weighted total return index of selected real estate equity securities maintained by Cohen & Steers. It is quoted intraday on a real-time basis by the Chicago Mercantile Exchange under the symbol GRM. The Index’s free-float market capitalization approach and qualitative screening process emphasize companies that the Cohen & Steers Index Committee believes are leading the securitization of real estate globally.
PERFORMANCE OVERVIEW
The first half of 2010 was essentially a tale of two quarters for global real estate securities. Healthier balance sheets and signs of an improving economy raised prices for real estate stocks in the first quarter for all three major regions, North America, Europe and Asia. These gains were short-lived, however, as sovereign debt worries and the specter of an economic slowdown in China resulted in steep losses in the 2nd quarter.
US real estate stocks were the only ones to stay in the black year to date and lead the way with a gain of 5.0%. Asian Pacific real estate securities were the 2nd best performers during the first half of 2010, losing 7.8% of their value compared to a loss of 17.3% for European issues, which were much harder hit by the sovereign debt crisis that started in Greece and Spain and sent shockwaves throughout the continent.
Within the US real estate market, regional malls and apartments fared the best, benefiting from stronger than expected consumer spending in the first quarter and stabilization in employment. Amid a slow recovery in global trade, Industrial REITs were the worst performers for the first half of the year. On the positive front, there was an increase in acquisitions and IPO activity for US REITs, especially in the 2nd quarter, and while we expect bouts of volatility to continue, even modest economic growth should allow for the cyclical upturn in prices to continue.
Singapore real estate securities (-6.2%) were the best performers in Asia Pacific in the first half of the year. Compared to their Asian counterparts, Singapore securities benefited from stronger than expected manufacturing data and improving demand for office space. Real estate stocks in Hong Kong were the next best performers (-8.9%). Their performance was impacted dramatically by the slowdown in China

Table of Contents

as well as by steps by the Hong Kong government to cool the luxury residential market. Japanese securities (-10.3%) were the worst performers in the region, suffering contagion from the European debt crisis, fears of a global slowdown and the uncertainty surrounding the resignation of Prime Minister Yukio Hatoyama. Due to their perceived defensiveness, Australian real estate securities fared well on a relative basis, losing only 2.5% in the first six months of the year.
European real estate securities weren’t immune to the damage inflicted by the sovereign debt crisis that started in May and continued to play out in June. Property stocks in the United Kingdom (-13.3%) and the Netherlands (-8.5%) were the worst performers. It is likely that fiscal cutbacks in these regions will impede growth in what are already fragile economies. Real estate stocks in France (-4.6%) and Switzerland (+11.9%) fared much better on a local currency basis but suffered against a strong dollar when their returns were translated back into US dollars.
For the six months ended June 30, 2010 the Fund’s market price decreased 4.84% and the Fund’s net asset value (“NAV”) decreased 4.09%. Over the same time period the Fund’s benchmark was down 4.23%.
| Annualized | Six Months | One Year | Since Inception * | ||||||
Fund Performance | |||||||||
NAV | -4.09 | % | 25.53 | % | -18.21 | % | |||
Market Price | -4.84 | % | 28.37 | % | -18.12 | % | |||
Index Performance | |||||||||
Cohen & Steers Global Realty Majors Index | -3.86 | % | 26.56 | % | -17.44 | % | |||
FTSE EPRA/NAREIT Developed Real Estate Index | -4.23 | % | 25.05 | % | -16.74 | % |
Total Expense Ratio (per the current prospectus) 0.55%.
| * | Fund Inception 5/7/08 |
Performance data quoted represents past performance. Past performance does not guarantee future results. Investment return and principal value of an investment will fluctuate so that an investor’s shares, when sold or redeemed, may be worth more or less than the original cost. Current performance data may be higher or lower than actual data quoted. For most current month-end performance data please visit www.alpsetfs.com.
An investor cannot invest directly in an index.
NAV is an exchange-traded fund’s per-share value. The per-share dollar amount of the fund is derived by dividing the total value of all the securities in its portfolio, less any liabilities, by the number of fund shares outstanding.
Market Price is the price at which a share can currently be traded in the market.
Information detailing the number of days the Market Price of the Fund was greater than the Fund’s NAV and the number of days it was less than the Fund’s NAV can be obtained at www.alpsetfs.com.
FTSE EPRA/NAREIT Developed Real Estate Index: An unmanaged market-weighted total return index that consists of many companies from developed markets whose floats are larger than $100 million and which derive more than half of their revenue from property-related activities.

Table of Contents

| TOP 10 HOLDINGS* as of June 30, 2010 | ||
Sun Hung Kai Properties, Ltd. | 4.32 | % | |
Unibail-Rodamco | 3.96 | ||
Simon Property Group, Inc. | 3.92 | ||
Westfield Group | 3.88 | ||
Mitsubishi Estate Co., Ltd. | 3.34 | ||
Public Storage | 3.14 | ||
Equity Residential | 3.09 |
Mitsui Fudosan Co., Ltd. | 3.05% | |
Vornado Realty Trust | 3.03 | |
Boston Properties, Inc. | 2.61 | |
Percent of Net Assets | ||
in Top Ten Holdings: | 34.34% | |
* Holdings are subject to change. | ||
| GEOGRAPHIC BREAKDOWN** as of June 30, 2010 | ||
United States | 42.77 | % | |
Hong Kong | 15.32 | ||
Japan | 11.39 | ||
Australia | 8.94 | ||
United Kingdom | 6.19 | ||
France | 5.67 | ||
Singapore | 5.20 | ||
Netherlands | 1.88 |
Canada | 0.82 | % | |
Switzerland | 0.54 | ||
Brazil | 0.46 | ||
Sweden | 0.41 | ||
Belgium | 0.38 | ||
Italy | 0.03 | ||
** % of Total Investments | |||
| GROWTH OF $10K as of June 30, 2010 | ||
Comparison of Change in Value of $10,000 Investment in Cohen & Steers Global Realty Majors ETF and Cohen & Steers Global Realty Majors Index.
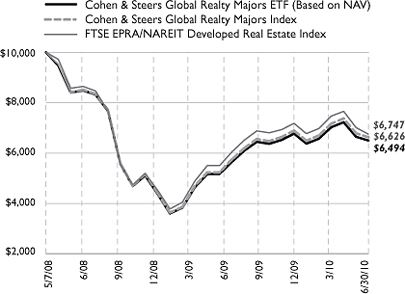

Table of Contents

Shareholder Expense Example: As a shareholder of the Fund, you incur two types of costs: (1) transaction costs which may include creation and redemption fees or brokerage charges, and (2) ongoing costs, including management fees and other Fund expenses. These examples are intended to help you understand your ongoing costs (in dollars) of investing in the Fund and to compare these costs with the ongoing costs of investing in other funds. It is based on an investment of $1,000 invested at January 1, 2010, and held through the period ended June 30, 2010.
Actual Return: The first line of the table provides information about actual account values and actual expenses. You may use the information in this table, together with the amount you invested, to estimate the expenses that you incurred over the period. Simply divide your account value by $1,000 (for example, an $8,600 account value divided by $1,000 = 8.6), then multiply the result by the number in the first line under the heading entitled “Expenses Paid During the Period” to estimate the expenses attributable to your investment during this period.
Hypothetical 5% Return: The second line of the table provides information about hypothetical account values and hypothetical expenses based on the Fund’s actual expense ratio and an assumed rate of return of 5% per year before expenses, which is not the Fund’s actual return. The hypothetical account values and expenses may not be used to estimate the actual ending account balance or expenses you paid for the period. You may use this information to compare ongoing costs of investing in the Fund and other funds. To do so, compare this 5% hypothetical example with the 5% hypothetical examples that appear in the shareholder reports of the other funds.
The expenses shown in the table are meant to highlight ongoing Fund costs only and do not reflect any transaction costs, such as creation and redemption fees, or brokerage charges. Therefore, the second line is useful in comparing ongoing costs only, and will not help you determine the relative total costs of owning different funds. In addition, if these costs were included, your costs would have been higher.
Beginning Account Value 1/01/10 | Ending Account Value 6/30/10 | Expense Ratio | Expenses Paid During the Period(a) 1/01/10-6/30/10 | |||||
Actual | $ 1,000.00 | $ 959.10 | 0.55% | $ 2.67 | ||||
Hypothetical | $ 1,000.00 | $ 1,022.07 | 0.55% | $ 2.76 |
| (a) | Expenses are equal to the Fund’s annualized expense ratio multiplied by the average account value over the period, multiplied by the number of days in the most recent fiscal half year (181), then divided by 365. |

Table of Contents

| Security Description | Shares | Value | |||
COMMON STOCKS (99.58%) | |||||
Australia (8.90%) | |||||
CFS Retail Property Trust | 127,858 | $ | 204,111 | ||
Commonwealth Property Office Fund | 121,643 | 95,554 | |||
Dexus Property Group | 293,442 | 190,849 | |||
Mirvac Group | 205,754 | 228,534 | |||
Stockland Trust Group | 148,649 | 467,070 | |||
Westfield Group | 89,089 | 916,533 | |||
| 2,102,651 | |||||
Belgium (0.38%) | |||||
Confinimmo | 793 | 89,772 | |||
Brazil (0.46%) | |||||
BR Malls Participacoes SA | 8,300 | 109,224 | |||
Canada (0.82%) | |||||
Boardwalk Real Estate Investment Trust | 1,619 | 61,033 | |||
RioCan Real Estate Investment Trust | 7,404 | 132,661 | |||
| 193,694 | |||||
France (5.65%) | |||||
Fonciere des Regions | 1,747 | 145,492 | |||
ICADE | 1,202 | 102,077 | |||
Klepierre | 5,416 | 151,024 | |||
Unibail-Rodamco | 5,670 | 935,863 | |||
| 1,334,456 | |||||
Hong Kong (15.25%) | |||||
China Overseas Land & Investment, Ltd. | 236,000 | 444,897 | |||
Hang Lung Properties, Ltd. | 122,000 | 472,355 | |||
Henderson Land Development Co., Ltd. | 62,000 | 366,244 | |||
Hongkong Land Holdings, Ltd. | 71,000 | 353,580 | |||
Kerry Properties, Ltd. | 42,500 | 185,835 | |||
The Link Real Estate Investment Trust | 137,000 | 341,306 | |||
Sun Hung Kai Properties, Ltd. | 74,000 | 1,020,605 | |||
The Wharf Holdings, Ltd. | 85,000 | 416,423 | |||
| 3,601,245 | |||||
Italy (0.03%) | |||||
Beni Stabili* | 10,482 | 7,960 | |||

Table of Contents

| Security Description | Shares | Value | |||
Japan (11.33%) | |||||
Japan Real Estate Investment Corp. | 29 | $ | 237,597 | ||
Japan Retail Fund Investment Corp. | 93 | 113,925 | |||
Mitsubishi Estate Co., Ltd. | 56,000 | 789,151 | |||
Mitsui Fudosan Co., Ltd. | 51,000 | 720,997 | |||
Nippon Building Fund, Inc. | 31 | 246,627 | |||
Nomura Real Estate Office Fund, Inc. | 17 | 85,106 | |||
Sumitomo Realty & Development Co., Ltd. | 28,000 | 483,173 | |||
| 2,676,576 | |||||
Netherlands (1.87%) | |||||
Corio N.V. | 5,568 | 272,435 | |||
Eurocommercial Properties N.V. | 2,181 | 70,127 | |||
Wereldhave N.V. | 1,317 | 98,405 | |||
| 440,967 | |||||
Singapore (5.18%) | |||||
Ascendas Real Estate Investment Trust | 93,066 | 121,324 | |||
CapitaLand, Ltd. | 195,000 | 502,829 | |||
CapitaMall Trust | 158,347 | 208,695 | |||
CapitaMalls Asia, Ltd. | 57,725 | 87,243 | |||
City Developments, Ltd. | 38,000 | 302,127 | |||
| 1,222,218 | |||||
Sweden (0.41%) | |||||
Castellum AB | 10,650 | 97,303 | |||
Switzerland (0.53%) | |||||
PSP Swiss Property AG* | 2,104 | 126,141 | |||
United Kingdom (6.17%) | |||||
British Land Co., Plc | 53,900 | 351,267 | |||
Derwent London Plc | 5,529 | 103,399 | |||
Great Portland Estates Plc | 19,347 | 84,201 | |||
Hammerson Plc | 43,610 | 224,247 | |||
Land Securities Group Plc | 47,115 | 393,679 | |||
Liberty International Plc* | 27,078 | 126,233 | |||
Segro Plc | 45,545 | 172,939 | |||
| 1,455,965 | |||||

Table of Contents

| Security Description | Shares | Value | |||
United States (42.60%) | |||||
Alexandria Real Estate Equities, Inc. | 2,747 | $ | 174,077 | ||
AMB Property Corp. | 10,136 | 240,325 | |||
Apartment Investment and Management Co. | 7,263 | 140,684 | |||
AvalonBay Communities, Inc. | 5,064 | 472,826 | |||
Boston Properties, Inc. | 8,632 | 615,807 | |||
BRE Properties, Inc. | 3,856 | 142,402 | |||
Brookfield Properties Corp. | 15,242 | 213,998 | |||
Camden Property Trust | 3,981 | 162,624 | |||
Digital Realty Trust, Inc. | 4,834 | 278,825 | |||
Douglas Emmett, Inc. | 7,535 | 107,148 | |||
Duke Realty Corp. | 13,905 | 157,822 | |||
Equity Residential | 17,531 | 729,991 | |||
Essex Property Trust, Inc. | 1,806 | 176,157 | |||
Federal Realty Investment Trust | 3,802 | 267,167 | |||
HCP, Inc. | 18,251 | 588,595 | |||
Health Care REIT, Inc. | 7,665 | 322,850 | |||
Host Hotels & Resorts, Inc. | 40,589 | 547,140 | |||
Kimco Realty Corp. | 25,180 | 338,419 | |||
Liberty Property Trust | 6,997 | 201,863 | |||
The Macerich Co. | 7,950 | 296,694 | |||
ProLogis | 29,439 | 298,217 | |||
Public Storage | 8,428 | 740,906 | |||
Regency Centers Corp. | 5,032 | 173,101 | |||
Simon Property Group, Inc. | 11,463 | 925,637 | |||
SL Green Realty Corp. | 4,831 | 265,898 | |||
UDR, Inc. | 9,687 | 185,312 | |||
Ventas, Inc. | 9,731 | 456,870 | |||
Vornado Realty Trust | 9,793 | 714,399 | |||
Weingarten Realty Investors | 6,476 | 123,368 | |||
| 10,059,122 | |||||
TOTAL COMMON STOCKS | |||||
(Cost $23,919,882) | 23,517,294 | ||||
WARRANTS (0.01%) | |||||
Hong Kong (0.01%) | |||||
Henderson Land Development Co., Ltd., Warrants, strike price 58.00 HKD, Expires 6/1/11* | 11,800 | 2,000 | |||
TOTAL WARRANTS | |||||
(Cost $0) | 2,000 | ||||

Table of Contents

| Security Description | Shares | Value | |||
TOTAL INVESTMENTS (99.59%) | |||||
(Cost $23,919,882) | $ | 23,519,294 | |||
NET OTHER ASSETS AND LIABILITIES (0.41%) | 95,962 | ||||
NET ASSETS (100.00%) | $ | 23,615,256 | |||
| * | Non-income producing security. |
Common Abbreviations:
| AB- | Aktiebolag is the Swedish equivalent of the term corporation. |
| AG- | Aktiengesellschaft is a German term that refers to a corporation that is limited by shares, i.e., owned by shareholders. |
| Ltd.- | Limited. |
| N.V.- | Naamloze Vennootschap is the Dutch term for a public limited liability corporation. |
| Plc- | Public Limited Co. |
| REIT- | Real Estate Investment Trust |
| SA- | Generally designated corporations in various countries, mostly those employing the civil law. |
See Notes to Financial Statements.

Table of Contents

ASSETS: | |||
Investments, at value | $ | 23,519,294 | |
Cash | 5,632 | ||
Foreign currency, at value (Cost $4,813) | 4,825 | ||
Foreign tax reclaims | 4,118 | ||
Interest and dividends receivable | 92,301 | ||
Total Assets | 23,626,170 | ||
LIABILITIES: | |||
Payable to advisor | 10,914 | ||
Total Liabilities | 10,914 | ||
NET ASSETS | $ | 23,615,256 | |
NET ASSETS CONSIST OF: | |||
Paid-in capital | $ | 26,434,745 | |
Overdistributed net investment income | (404,370) | ||
Accumulated net realized loss on investments and foreign currency transactions | (2,013,732) | ||
Net unrealized depreciation on investments and translation of assets and liabilities denominated in foreign currencies | (401,387) | ||
NET ASSETS | $ | 23,615,256 | |
INVESTMENTS, AT COST | $ | 23,919,882 | |
PRICING OF SHARES | |||
Net Assets | $ | 23,615,256 | |
Shares of beneficial interest outstanding (Unlimited number of shares authorized, par value $0.01 per share) | 802,000 | ||
Net Asset Value, offering and redemption price per share | $ | 29.45 | |
See Notes to Financial Statements.

Table of Contents

INVESTMENT INCOME: | |||
Dividends(a) | $ | 369,721 | |
Total Investment Income | 369,721 | ||
EXPENSES: | |||
Investment advisory fee | 52,469 | ||
Total Net Expenses | 52,469 | ||
NET INVESTMENT INCOME | 317,252 | ||
Net realized loss on investments | (602,253) | ||
Net realized loss on foreign currency transactions | (1,267) | ||
Net change in unrealized depreciation on investments | (788,882) | ||
Net change in unrealized depreciation on translation of assets and liabilities in foreign currencies | (542) | ||
NET REALIZED AND UNREALIZED LOSS ON INVESTMENTS | (1,392,944) | ||
NET DECREASE IN NET ASSETS RESULTING FROM OPERATIONS | $ | (1,075,692) | |
| (a) | Net of foreign withholding tax of $18,975. |
See Notes to Financial Statements.

Table of Contents

| For the Six Months Ended June 30, 2010 (Unaudited) | For the Year Ended | |||||
OPERATIONS: | ||||||
Net investment income | $ | 317,252 | $ | 212,230 | ||
Net realized loss on investments and foreign currency transactions | (603,520) | (1,175,772) | ||||
Net change in unrealized appreciation/(depreciation) on investments and foreign currency | (789,424) | 2,832,094 | ||||
Net increase/(decrease) in net assets resulting from operations | (1,075,692) | 1,868,552 | ||||
DISTRIBUTIONS TO SHAREHOLDERS: | ||||||
From net investment income | (426,671) | (504,174) | ||||
Total distributions | (426,671) | (504,174) | ||||
SHARE TRANSACTIONS: | ||||||
Proceeds from sale of shares | 12,514,368 | 6,176,164 | ||||
Net increase from share transactions | 12,514,368 | 6,176,164 | ||||
Net increase in net assets | 11,012,005 | 7,540,542 | ||||
NET ASSETS: | ||||||
Beginning of period | 12,603,251 | 5,062,709 | ||||
End of period* | $ | 23,615,256 | $ | 12,603,251 | ||
*Including overdistributed net investment income of: | $ | (404,370) | $ | (294,951) | ||
Other Information: | ||||||
SHARE TRANSACTIONS: | ||||||
Beginning shares | 402,000 | 202,000 | ||||
Shares sold | 400,000 | 200,000 | ||||
Shares outstanding, end of period | 802,000 | 402,000 | ||||
See Notes to Financial Statements.

Table of Contents

| For the Period Ended June 30, 2010 (Unaudited) | For the Year Ended 2009 | For the Period December 31, 2008 | |||||||
NET ASSET VALUE, BEGINNING OF PERIOD | $ | 31.35 | $ | 25.06 | $ | 50.00 | |||
INCOME/(LOSS) FROM OPERATIONS: | |||||||||
Net investment income | 0.87 | 0.98 | 0.47 | ||||||
Net realized and unrealized gain/(loss) on investments | (2.13) | 7.00 | (24.92) | ||||||
Total from Investment Operations | (1.26) | 7.98 | (24.45) | ||||||
LESS DISTRIBUTIONS: | |||||||||
From net investment income | (0.64) | (1.69) | (0.49) | ||||||
Total Distributions | (0.64) | (1.69) | (0.49) | ||||||
NET INCREASE/(DECREASE) IN NET ASSET VALUE | (1.90) | 6.29 | (24.94) | ||||||
NET ASSET VALUE, END OF PERIOD | $ | 29.45 | $ | 31.35 | $ | 25.06 | |||
TOTAL RETURN(a) | (4.09)% | 32.51% | (48.90)% | ||||||
RATIOS/SUPPLEMENTAL DATA: | |||||||||
Net assets, end of period (in 000s) | $ | 23,615 | $ | 12,603 | $ | 5,063 | |||
RATIOS TO AVERAGE NET ASSETS: | |||||||||
Net investment income including reimbursement/waiver | 3.33%(b) | 3.24% | 3.49%(b) | ||||||
Operating expenses including reimbursement/waiver | 0.55%(b) | 0.55% | 0.55%(b) | ||||||
Operating expenses excluding reimbursement/waiver | 0.55%(b) | 0.55% | 0.55%(b) | ||||||
PORTFOLIO TURNOVER RATE(c) | 7% | 18% | 18% | ||||||
| (a) | Total return is calculated assuming an initial investment made at the net asset value at the beginning of the period and redemption at the net asset value on the last day of the period. The return presented does not reflect the deduction of taxes that a shareholder would pay on Fund distributions or the redemption or sale of Fund shares. Total return calculated for a period of less than one year is not annualized. |
| (b) | Annualized. |
| (c) | Portfolio turnover is not annualized and does not include securities received or delivered from processing creations or redemptions. |
See Notes to Financial Statements.

Table of Contents

1. ORGANIZATION
The ALPS ETF Trust (the “Trust”) is an open-end management investment company organized as a Delaware statutory trust on September 13, 2007 and is registered with the Securities and Exchange Commission (“SEC”) under the Investment Company Act of 1940, as amended (the “1940 Act”). As of June 30, 2010, the Trust consists of ten separate portfolios. Each portfolio represents a separate series of the Trust. This report pertains solely to the Cohen & Steers Global Realty Majors ETF (the “Fund”), which commenced operations on May 7, 2008.
The Fund’s Shares are listed on the NYSE Arca. Unlike conventional mutual funds, the Fund issues and redeems Shares on a continuous basis, at NAV, only in large specified blocks of 50,000 Shares, each of which is called a “Creation Unit.” Creation Units are issued and redeemed principally in-kind for securities included in a specified index. Except when aggregated in Creation Units, Shares are not redeemable securities of the Fund. The investment objective of the Fund is to seek investment results that correspond generally to the price and yield (before the Fund’s fees and expenses) of the Cohen & Steers Global Realty Majors Index.
2. SIGNIFICANT ACCOUNTING POLICIES
The following is a summary of significant accounting policies consistently followed by the Fund in the preparation of the financial statements. The accompanying financial statements were prepared in accordance with accounting principles generally accepted in the United States of America (“U.S. GAAP”). The preparation of financial statements in conformity with U.S. GAAP requires management to make certain estimates and assumptions that affect the reported amounts of assets and liabilities and disclosures of contingent assets and liabilities at the date of the financial statements and the reported amounts of revenue and expenses during the period. Actual results could differ from those estimates.
A. Portfolio Valuation
The Fund’s Net Asset Value (“NAV”) is determined daily, as of the close of regular trading on the New York Stock Exchange (“NYSE”), normally 4:00 p.m. Eastern time, on each day the NYSE is open for trading. The NAV is computed by dividing the value of all assets of the Fund (including accrued interest and dividends), less all liabilities (including accrued expenses and dividends declared but unpaid), by the total number of shares outstanding.
The Fund’s investments are valued at market value or, in the absence of market value with respect to any portfolio securities, at fair value according to procedures adopted by the Trust’s Board of Trustees. Portfolio securities listed on any exchange

Table of Contents

other than the NASDAQ Stock Market, Inc. (“NASDAQ”) are valued at the last sale price on the business day as of which such value is being determined. If there has been no sale on such day, the securities are valued at the mean of the most recent bid and asked prices on such day. Securities traded on the NASDAQ are valued at the NASDAQ Official Closing Price as determined by NASDAQ. Portfolio securities traded on more than one securities exchange are valued at the last sale price on the business day as of which such value is being determined at the close of the exchange representing the principal market for such securities. Portfolio securities traded in the over-the-counter market, but excluding securities traded on the NASDAQ, are valued at the closing bid prices. Short-term investments that mature in less than 60 days are valued at amortized cost, which approximates market value.
When market quotations are not readily available or when events occur that make established valuation methods unreliable, securities of the Fund may be valued in good faith by or under the direction of the Board of Trustees. These securities generally include, but are not limited to, restricted securities (securities which may not be publicly sold without registration under the Securities Act of 1933) for which a pricing service is unable to provide a market price; securities whose trading has been formally suspended; a security whose market price is not available from a pre-established pricing source; a security with respect to which an event has occurred that is most likely to materially affect the value of the security after the market has closed but before the calculation of the Fund’s NAV or make it difficult or impossible to obtain a reliable market quotation; and a security whose price, as provided by the pricing service, does not reflect the security’s “fair value.” As a general principle, the current “fair value” of a security would be the amount which the owner might reasonably expect to receive from the closing sale prices on the applicable exchange and fair value prices may not reflect the actual value of a security. A variety of factors may be considered in determining the fair value of such securities.
Valuing the Fund’s securities using fair value pricing will result in using prices for those securities that may differ from current market valuations. Use of fair value prices and certain market valuations could result in a difference between the prices used to calculate a Fund’s NAV and the prices used by the Index, which, in turn, could result in a difference between a Fund’s performance and the performance of the Index.
B. Foreign Currency Translation and Foreign Investments
The Fund invests in foreign securities which may involve a number of risk factors and special considerations not present with investments in securities of U.S. corporations. The accounting records of the Fund are maintained in U.S. dollars. Portfolio securities and other assets and liabilities denominated in a foreign currency are translated to U.S. dollars at the prevailing rates of exchange at period end. Amounts related to

Table of Contents

the purchases and sales of securities and investment income are translated into U.S. dollars at the prevailing exchange rate on the respective dates of transactions. The effects of changes in foreign currency exchange rates on portfolio investments are included in the net realized and unrealized gains and losses on investments. Net gains and losses on foreign currency transactions include disposition of foreign currencies, and currency gains and losses between the accrual and receipt dates of portfolio investment income and between the trade and settlement dates of portfolio investment transactions.
C. Securities Transactions and Investment Income
Securities transactions are recorded as of the trade date. Realized gains and losses from securities transactions are recorded on the identified cost basis. Dividend income is recorded on the ex-dividend date. Interest income, if any, is recorded on the accrual basis.
D. Federal Tax Information
The timing and character of income and capital gain distributions are determined in accordance with income tax regulations, which may differ from U.S. GAAP Reclassifications are made to the Fund’s capital accounts for permanent tax differences to reflect income and gains available for distribution (or available capital loss carryforwards) under income tax regulations.
For the year ended December 31, 2009, permanent book and tax differences resulting primarily from differing treatment of foreign currency were identified and reclassified among the components of the Fund’s net assets as follows:
Accumulated Net Investment Income | Accumulated Net Realized Loss | Paid-In Capital | ||
| $5,123 | $(5,122) | $(1) |
Net investment income/(loss) and net realized gain/(loss), as disclosed on the Statement of Operations, and net assets were not affected by this reclassification.
Capital losses incurred after October 31 (“post-October losses”) within the taxable year are deemed to arise on the first business day of the Fund’s next taxable year.
At December 31, 2009, the Fund had available for tax purposes unused capital loss carryforwards as follows:
| Year of Expiration | ||||
| 2016 | 2017 | Total | ||
| $176,692 | $809,982 | $986,674 | ||

Table of Contents

The Fund intends to defer to its fiscal year ending December 31, 2010 approximately $165,900 of losses recognized during the period from November 1, 2009 to December 31, 2009.
E. Dividends and Distributions to Shareholders
Dividends from net investment income of the Fund, if any, are declared and paid quarterly or as the Board of Trustees may determine from time to time. Distributions of net realized capital gains earned by the Fund, if any, are distributed at least annually.
Distributions from net investment income and capital gains are determined in accordance with income tax regulations, which may differ from U.S. GAAP. These differences are primarily due to differing treatments of income and gains on various investment securities held by the Fund, timing differences and differing characterization of distributions made by the Fund.
The tax character of the distributions paid was as follows:
| Period Ended December 31, 2009 | Period Ended December 31, 2008 | |||
Distributions paid from: | ||||
Ordinary income | $ 504,174 | $ 98,737 | ||
Total | $ 504,174 | $ 98,737 | ||
| As of December 31, 2009, the components of distributable earnings on a tax basis for the Fund were as follows: | ||||
Undistributed net investment income | $ 205,436 | |||
Accumulated net realized loss on investments and foreign currency transactions | (1,152,574) | |||
Net unrealized depreciation on investments and translation of assets and liabilities denominated in foreign currencies | (373,034) | |||
Other Cumulative Effect of Timing Differences | 3,046 | |||
Total | $ (1,317,126) | |||
The differences between book-basis and tax-basis are primarily due to the deferral of post-October losses and the differing treatment of certain other investments.
F. Income Taxes
No provision for income taxes is included in the accompanying financial statements, as the Fund intends to distribute to shareholders all taxable investment income and realized gains and otherwise comply with Subchapter M of the Internal Revenue Code applicable to regulated investment companies.

Table of Contents

The Fund evaluates tax positions taken (or expected to be taken) in the course of preparing the Fund’s tax returns to determine whether these positions meet a “more-likely-than-not” standard that, based on the technical merits, have a more than fifty percent likelihood of being sustained by a taxing authority upon examination. A tax position that meets the “more-likely-than-not” recognition threshold is measured to determine the amount of benefit to recognize in the financial statements.
Management of the Fund analyzes all open tax years, as defined by the Statute of Limitations, for all major jurisdictions, including federal tax authorities and certain state tax authorities. As of and during the fiscal year ended December 31, 2009, the Fund did not have a liability for any unrecognized tax benefits. The Fund will file income tax returns in the U.S. federal jurisdiction and Colorado. For the years ended December 31, 2008, and December 31, 2009, the Fund’s returns are still open to examination by the appropriate taxing authority.
G. Fair Value Measurements
A three-tier hierarchy has been established to measure fair value based on the extent of use of observable inputs as compared to unobservable inputs for disclosure purposes and requires additional disclosures about these valuations measurements. Inputs refer broadly to the assumptions that market participants would use in pricing a security. Observable inputs are inputs that reflect the assumptions market participants would use in pricing the security developed based on market data obtained from sources independent of the reporting entity. Unobservable inputs are inputs that reflect the reporting entity’s own assumptions about the assumptions market inputs participants would use in pricing the security developed based on the best information available in the circumstances.
The three-tier hierarchy is summarized as follows:
Level 1 | - | quoted prices in active markets for identical securities | ||
Level 2 | - | other significant observable inputs (including quoted prices for similar securities, interest rates, prepayment speeds, credit risk, etc.) | ||
Level 3 | - | significant unobservable inputs (including the Fund’s own assumptions in determining the fair value of investments) | ||

Table of Contents

| Investments in Securities at Value* | Level 1 Quoted Prices | Level 2 Other Significant Observable Inputs | Level 3 Significant Unobservable Inputs | Total | ||||||
Common Stocks | $ 23,517,294 | $ | – | $ | – | $ 23,517,294 | ||||
Warrants | – | 2,000 | – | 2,000 | ||||||
TOTAL | $ 23,517,294 | $ | 2,000 | $ | – | $ 23,519,294 | ||||
| * | For detailed descriptions of sector and industry, see the accompanying Schedule of Investments. |
For the period ended June 30, 2010, the Fund did not have any significant transfers between Level 1 and Level 2 securities. For the period ended June 30, 2010, the Fund did not have any securities which used significant unobservable inputs (Level 3) in determining fair value. Therefore, a reconciliation of assets in which significant unobservable Inputs (Level 3) were used in determining fair value is not applicable.
3. INVESTMENT ADVISORY FEE AND OTHER AFFILIATED TRANSACTIONS
ALPS Advisors, Inc. (the “Investment Adviser”) acts as the Fund’s investment adviser pursuant to an Advisory Agreement with the Trust on behalf of the Fund (the “Advisory Agreement”). Pursuant to the Advisory Agreement, the Fund pays the Investment Adviser a unitary fee for the services and facilities it provides payable on a monthly basis at the annual rate of 0.55% of the Fund’s average daily net assets. From time to time, the Investment Adviser may waive all or a portion of its fee.
Out of the unitary management fee, the Investment Adviser pays substantially all expenses of the Fund, including the fees of the Sub-Adviser, the licensing fee of the Index provider, and the cost of transfer agency, custody, fund administration, legal, audit and other services, except for interest expenses, distribution fees or expenses, brokerage expenses, taxes and extraordinary expenses not incurred in the ordinary course of the Fund’s business. In addition, the Investment Adviser’s unitary management fee is designed to compensate the Investment Adviser for providing services for the Fund.
Mellon Capital Management Corporation acts as the Fund’s sub-adviser (the “Sub-Adviser”) pursuant to a sub-advisory agreement with the Investment Adviser (the “Sub-Advisory Agreement”). According to this agreement, the Investment Adviser pays the Sub-Adviser on a monthly basis, an annual rate of 0.10% of the Fund’s average daily net assets. The Investment Adviser pays the Sub-Adviser a minimum of $125,000 per year.

Table of Contents

ALPS Fund Services, Inc. (“ALPS”), an affiliate of the Investment Adviser, is the administrator of the Fund.
The Bank of New York Mellon is the custodian, fund accounting agent and transfer agent for the Fund.
Each Trustee who is not an officer or employee of the Investment Adviser, any sub-adviser or any of their affiliates (“Independent Trustees”) is paid a quarterly retainer of $3,500, $1,500 for each regularly scheduled Board meeting attended and $750 for each special meeting held outside of regularly scheduled meetings.
4. PURCHASES AND SALES OF SECURITIES
For the period ended June 30, 2010, the cost of purchases and proceeds from sales of investment securities, excluding in-kind transactions and short-term investments, were as follows:
| Purchases | Sales | |||||
Cohen & Steers Global Realty Majors ETF | $ | 1,384,787 | $ | 1,622,654 | ||
| For the period ended June 30, 2010, the cost of in-kind purchases and proceeds from in-kind sales were as follows: | ||||||
Purchases | Sales | |||||
Cohen & Steers Global Realty Majors ETF | $ | 12,386,797 | $ | – | ||
Gains on in-kind transactions are not considered taxable for federal income tax purposes.
As of June 30, 2010, the costs of investments for federal income tax purposes and accumulated net unrealized appreciation/(depreciation) on investments were as follows:
Gross Appreciation (excess of value over tax cost) | $ | 161,423 | |
Gross Depreciation (excess of tax cost over value) | (1,369,871) | ||
Net unrealized depreciation | $ | (1,208,448) | |
Cost of investment for income tax purposes | $ | 24,727,742 | |

Table of Contents

5. CAPITAL SHARE TRANSACTIONS
Shares are created and redeemed by the Fund only in Creation Unit size aggregations of 50,000. Only Authorized Participants are permitted to purchase or redeem Creation Units from the Fund. Such transactions are generally permitted on an in-kind basis, with a balancing cash component to equate the transaction to the net asset value per unit of the Fund on the transaction date. Cash may be substituted equivalent to the value of certain securities generally when they are not available in sufficient quantity for delivery, not eligible for trading by the Authorized Participant or as a result of other market circumstances.
6. INDEMNIFICATIONS
Under the Trust’s organizational documents, its officers and Trustees are indemnified against certain liability arising out of the performance of their duties to the Trust. Additionally, in the normal course of business, the Trust enters into contracts with service providers that contain general indemnification clauses. The Trust’s maximum exposure under these arrangements is unknown, as this would involve future claims that may be made against the Trust that have not yet occurred.
7. SUBSEQUENT EVENTS
Management has evaluated whether any events or transactions occurred subsequent to June 30, 2010 through the issuance date of the Fund’s financial statements, and determined that there were no other material events or transactions that would require recognition or disclosure in the Fund’s financial statements.

Table of Contents

PROXY VOTING POLICIES AND PROCEDURES
A description of the Fund’s proxy voting policies and procedures used in determining how to vote for proxies and information regarding how the Fund voted proxies related to portfolio securities during the most recent 12-month period ended June 30th is available without charge, (1) on the Securities and Exchange Commission’s (“SEC”) website at http://www.sec.gov; (2) upon request, by calling 1-866-513-5856; and (3) on the Trust’s website located at http://www.alpsetfs.com.
PORTFOLIO HOLDINGS
The Trust will file its complete schedule of portfolio holdings with the SEC for the first and third quarters of each fiscal year on Form N-Q. The Trust’s Form N-Q will be available (1) by calling 1-866-513-5856, (2) on the Trust’s website located at http://www.alpsetfs.com, (3) on the SEC’s website at http://www.sec.gov, and (4) for review and copying at the SEC’s Public Reference Room (“PRR”) in Washington D.C. Information regarding the operation of the PRR may be obtained by calling 1-202-551-8090.

Table of Contents


Table of Contents
Table of Contents
Table of Contents

| Page | ||
| 2 | ||
| 6 | ||
| 7 | ||
| 14 | ||
| 15 | ||
| 16 | ||
| 20 | ||
| 24 | ||
| 30 | ||
BOARD CONSIDERATIONS REGARDING APPROVAL OF INVESTMENT ADVISORY AGREEMENT | 31 | |
| www.jamfunds.com | 1 | |
Table of Contents

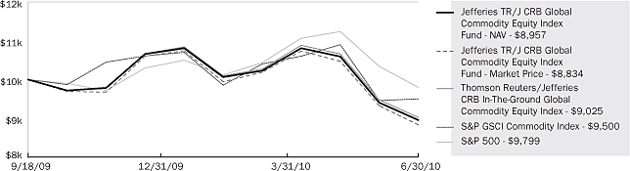
The Jefferies | TR/J CRB Global Commodity Equity Index Fund is an Exchange Traded Fund (“ETF”), which provides exposure to the equity securities of a global universe of listed companies engaged in the production and distribution of commodities and commodity-related products and services in the agriculture, base/industrial metals, energy and precious metals sectors. The ETF seeks investment results that replicate as closely as possible, before fees and expenses, the price and yield performance of the Thomson Reuters/Jefferies CRB In-The-Ground Global Commodity Equity Index.
For the six-month period ended June 30, 2010, the ETF’s market price 17.77% and its net asset value (“NAV”) decreased 17.10% Over the same time period the ETF’s benchmark was down 16.75%.
TOP 10 HOLDINGS^ (% of Total Investments)
|
| ||
Exxon Mobil Corp. | 5.4 | % | |
Potash Corp. of Saskatchewan, Inc. | 4.6 | ||
Monsanto Co. | 4.5 | ||
Deere & Co. | 4.2 | ||
Syngenta AG | 3.9 | ||
Archer-Daniels-Midland Co. | 2.9 | ||
Chevron Corp. | 2.5 | ||
Gazprom OAO, ADR | 2.1 | ||
Barrick Gold Corp. | 2.0 | ||
Total SA | 1.8 | ||
Total % of Top 10 Holdings | 33.9 | % | |
| ^ | Future holdings are subject to change |
COUNTRY ALLOCATION (% of Total Investments)
United States | 33.0 | % | |
Canada | 16.1 | ||
United Kingdom | 8.7 | ||
Russia | 6.4 | ||
Switzerland | 4.5 | ||
Brazil | 3.2 | ||
South Africa | 2.4 | ||
Australia | 1.8 | ||
Singapore | 1.8 | ||
France | 1.8 | ||
Other | 20.3 |
PERFORMANCE as of 06.30.10
| 6 Months | Since Inception* | |||||
Jefferies | TR/J CRB Global Commodity Equity Index Fund | ||||||
NAV | -17.10% | -10.42% | ||||
Market Price | -17.77% | -11.66% | ||||
Thomson Reuters/Jefferies CRB In-The-Ground Global Commodity Equity Index | -16.75% | -9.75% | ||||
S&P GSCI Commodity Index | -11.21% | -5.00% | ||||
S&P 500 Index | -6.65% | -2.01% |
Total Expense Ratio (per the current prospectus) 0.65%
| * | The Fund commenced Investment Operations on September 18, 2009 with an Inception Date, the first day of trading on the Exchange, of September 21, 2009. |
Performance data quoted represents past performance. Past performance does not guarantee future results. Investment return and principal value of an investment will fluctuate so that an investor’s shares, when sold or redeemed, may be worth more or less than the original cost. Current performance data may be higher or lower than actual data quoted. For the most current month-end performance data please visit JAMFUNDS.COM.
NAV is an exchange-traded fund’s per-share value. The per-share dollar amount of the fund is derived by dividing the total value of all the securities in its portfolio, less any liabilities, by the number of fund shares outstanding. Market Price is the price at which a share can currently be traded in the market. Information detailing the number of days the Market Price of the Fund was greater than the Fund’s NAV and the number of days it was less than the Fund’s NAV can be obtained at www.alpsetfs.com.
S&P GSCI Commodity Index: A composite index of commodity sector returns which represents a broadly diversified, unleveraged, long-only position in commodity futures. S&P 500 Index: the Standard & Poor’s composite index of 500 stocks, a widely recognized, unmanaged index of common stock prices. An investor cannot invest directly in an index. Thomson Reuters/Jefferies CRB In-The-Ground Global Commodity Equity Index: measures the performance of equity securities of companies engaged in the production and distribution of certain commodities and commodity-related products.
GROWTH OF $10,000 as of 06.30.10
Comparison of Change in Value of a hypothetical $10,000 investment in the Jefferies | TR/J CRB Global Commodity Equity Index Fund.
2 | Semi-Annual Report (Unaudited) | June 30, 2010 | |
Table of Contents

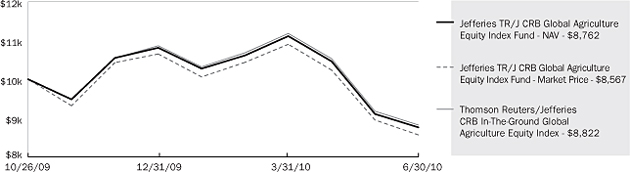
The Jefferies | TR/J CRB Global Agriculture Equity Index Fund is an Exchange Traded Fund (“ETF”), which provides exposure to the equity securities of a global universe of listed companies engaged in the production and distribution of agricultural commodities and agricultural commodity-related products and services in the following sectors: producers of traits (characteristics attained through genetic modification), chemicals and fertilizers, farm machinery, equipment and irrigation, agricultural products, and livestock and aquaculture. The ETF seeks investment results that replicate, as closely as possible, before fees and expenses, the price and yield performance of the Thomson Reuters/Jefferies CRB In-The-Ground Global Agriculture Equity Index.
For the six-month period ended June 30, 2010, the ETF’s market price declined 19.56% and its net asset value (“NAV”) decreased 18.95%. Over the same time period the ETF’s benchmark was down 18.78%.
TOP 10 HOLDINGS^ (% of Total Investments)
Potash Corp. of Saskatchewan, Inc. | 7.0 | % | |
Monsanto Co. | 7.0 | ||
Deere & Co. | 6.5 | ||
Syngenta AG | 6.1 | ||
Archer-Daniels-Midland Co. | 5.1 | ||
Sociedad Quimica y Minera de Chile SA, ADR | 4.8 | ||
Uralkali, GDR | 4.8 | ||
Bunge, Ltd. | 4.6 | ||
Agrium, Inc. | 4.6 | ||
K+S AG | 4.5 | ||
Total % of Top 10 Holdings | 55.0 | % |
COUNTRY ALLOCATION (% of Total Investments)
United States | 29.5 | % | |
Canada | 13.0 | ||
Singapore | 6.8 | ||
Switzerland | 6.1 | ||
Bermuda | 5.1 | ||
Malaysia | 4.9 | ||
Chile | 4.8 | ||
Russia | 4.8 | ||
Israel | 4.5 | ||
Germany | 4.5 | ||
Other | 16.0 |
| ^ | Future holdings are subject to change |
PERFORMANCE as of 06.30.10
| 6 Months | Since Inception* | |||||||
Jefferies | TR/J CRB Global Agriculture Equity Index Fund | ||||||||
NAV | -18.95% | -12.38% | ||||||
Market Price | -19.56% | -14.32% | ||||||
Thomson Reuters/Jefferies CRB In-The-Ground Global Agriculture Equity Index | -18.78% | -11.78% |
Total Expense Ratio (per the current prospectus) 0.65%
| * | The Fund commenced Investment Operations on October 26, 2009 with an Inception Date, the first day of trading on the Exchange, of October 27, 2009. |
Performance data quoted represents past performance. Past performance does not guarantee future results. Investment return and principal value of an investment will fluctuate so that an investor’s shares, when sold or redeemed, may be worth more or less than the original cost. Current performance data may be higher or lower than actual data quoted. For the most current month-end performance data please visit JAMFUNDS. COM.
NAV is an exchange-traded funds per-share value. The per-share dollar amount of the fund is derived by dividing the total value of all the securities in its portfolio, less any liabilities, by the number of fund shares outstanding. Market Price is the price at which a share can currently be traded in the market. Information detailing the number of days the Market Price of the Fund was greater than the Fund’s NAV and the number of days it was less than the Fund’s NAV can be obtained at www.alpsetfs.com.
Thomson Reuters/Jefferies CRB In-The-Ground Global Agriculture Equity Index: measures the performance of equity securities of companies engaged in the production and distribution of agriculture products, including grains, livestock, fertilizers, chemicals, seeds, traits and equipment.
GROWTH OF $10,000 as of 06.30.10
Comparison of Change in Value of a hypothetical $10,000 investment in the Jefferies | TR/J CRB Global Agriculture Equity Index Fund.
| www.jamfunds.com | 3 | |
Table of Contents

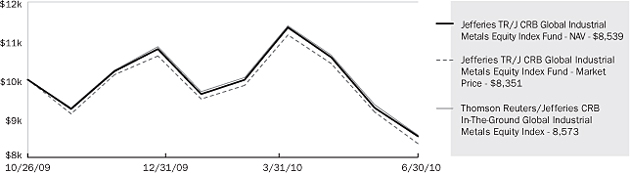
The Jefferies I TR/J CRB Global Industrial Metals Equity Index Fund is an Exchange Traded Fund (“ETF”), which provides exposure to the equity securities of a global universe of listed companies engaged in the production and distribution of base/industrial metals and base/industrial metals products, including copper, aluminum, iron ore, steel and others. The ETF seeks investment results that replicate, as closely as possible, before fees and expenses, the price and yield performance of the Thomson Reuters/Jefferies CRB In-The-Ground Global Industrial Metals Equity Index.
For the six-month period ended June 30, 2010, the ETF’s market price declined 21.28% and its net asset value (“NAV”) decreased 20.84%. Over the same time period the ETF’s benchmark was down 20.96%.
TOP 10 HOLDINGS^ (% of Total Investments)
|
| ||
Rio Tinto Plc | 7.5 | % | |
BHP Billiton Plc | 6.7 | ||
POSCO | 5.2 | ||
Anglo American Plc | 5.0 | ||
MMC Norilsk Nickel, ADR | 4.7 | ||
Vale SA, ADR | 4.7 | ||
ArcelorMittal | 4.7 | ||
Companhia Siderurgica Nacional SA, ADR | 4.7 | ||
Freeport-McMoRan Copper & Gold, Inc. | 4.7 | ||
Xstrata Plc | 4.6 | ||
Total % of Top 10 Holdings | 52.5 | % | |
COUNTRY ALLOCATION (% of Total Investments)
United Kingdom | 25.5 | % | |
United States | 15.1 | ||
Brazil | 12.4 | ||
Japan | 12.0 | ||
Luxembourg | 6.6 | ||
Canada | 6.2 | ||
Russia | 5.4 | ||
South Korea | 5.2 | ||
India | 2.8 | ||
Mexico | 2.3 | ||
Other | 6.5 |
| ^ | Future holdings are subject to change |
PERFORMANCE as of 06.30.10
| 6 Months | Since Inception* | |||||||
Jefferies | TR/J CRB Global Industrial Metals Equity Index Fund | ||||||||
NAV | -20.84% | -14.61% | ||||||
Market Price | -21.28% | -16.50% | ||||||
Thomson Reuters/Jefferies CRB In-The-Ground Global Industrial Metals Equity Index | -20.96% | -14.27% |
Total Expense Ratio (per the current prospectus) 0.65%
| * | The Fund commenced Investment Operations on October 26, 2009 with an Inception Date, the first day of trading on the Exchange, of October 27, 2009. |
Performance data quoted represents past performance. Past performance does not guarantee future results. Investment return and principal value of an investment will fluctuate so that an investor’s shares, when sold or redeemed, may be worth more or less than the original cost. Current performance data may be higher or lower than actual data quoted. For the most current month-end performance data please visit JAMFUNDS. COM.
NAV is an exchange-traded fund’s per-share value. The per-share dollar amount of the fund is derived by dividing the total value of all the securities in its portfolio, less any liabilities, by the number of fund shares outstanding. Market Price is the price at which a share can currently be traded in the market. Information detailing the number of days the Market Price of the Fund was greater than the Fund’s NAV and the number of days it was less than the Fund’s NAV can be obtained at www.alpsetfs.com.
Thomson Reuters/Jefferies CRB In-The-Ground Global Industrial Metals Equity Index: measures the performance of equity securities of companies engaged in the production and distribution of base/industrial metals and related products and/services including copper, aluminum, iron ore, steel, uranium and others.
GROWTH OF $10,000 as of 06.30.10
Comparison of Change in Value of a hypothetical $10,000 investment in the Jefferies | TR/J CRB Global Industrial Metals Equity Index Fund.
4 | Semi-Annual Report (Unaudited) | June 30, 2010 | |
Table of Contents

The Jefferies | TR/J CRB Wildcatters Exploration & Production Equity ETF is an Exchange Traded Fund (“ETF”), which provides exposure to the equity securities of a universe of listed U.S. and Canadian small capitalization companies engaged in the exploration and production (i.e., extraction) of oil and natural gas. The ETF seeks investment results that replicate, as closely as possible, before fees and expenses, the price and yield performance of the Thomson Reuters/Jefferies CRB Wildcatters Energy Exploration & Production Equity Index.
Since inception (1/20/2010) the ETF’s market price declined 11.15% and its net asset value (“NAV”) decreased 11.38%. Over the same time period the ETF’s benchmark was down 10.94%.
TOP 10 HOLDINGS^ (% of Total Investments)
St. Mary Land & Exploration Co. | 5.7 | % | |
Progress Energy Resources Corp. | 5.2 | ||
Mariner Energy, Inc. | 4.9 | ||
Brigham Exploration Co. | 4.0 | ||
Daylight Resources | 3.8 | ||
Bankers Petroleum, Ltd. | 3.2 | ||
Bill Barrett Corp. | 3.2 | ||
Quicksilver Resources, Inc. | 2.9 | ||
Comstock Resources, Inc. | 2.8 | ||
Arena Resources, Inc. | 2.8 | ||
Total % of Top 10 Holdings | 38.5 | % |
COUNTRY ALLOCATION (% of Total Investments)
United States | 62.8 | % | |
Canada | 37.2 |
| ^ | Future holdings are subject to change |
PERFORMANCE as of 06.30.10
| Since Inception* | ||||
Jefferies | TR/J CRB Wildcatters Exploration & Production Equity ETF | ||||
NAV | -11.38% | |||
Market Price | -11.15% | |||
Thomson Reuters/Jefferies CRB Wildcatters Energy Exploration & Production Equity Index | -10.94% |
Total Expense Ratio (per the current prospectus) 0.65%
| * | The Fund commenced Investment Operations on January 19, 2010 with an Inception Date, the first day of trading on the Exchange, of January 20, 2010. |
Performance data quoted represents past performance. Past performance does not guarantee future results. Investment return and principal value of an investment will fluctuate so that an investor’s shares, when sold or redeemed, may be worth more or less than the original cost. Current performance data may be higher or lower than actual data quoted. For the most current month-end performance data please visit JAMFUNDS. COM.
NAV is an exchange-traded fund’s per-share value. The per-share dollar amount of the fund is derived by dividing the total value of all the securities in its portfolio, less any liabilities, by the number of fund shares outstanding. Market Price is the price at which a share can currently be traded in the market. Information detailing the number of days the Market Price of the Fund was greater than the Fund’s NAV and the number of days it was less than the Fund’s NAV can be obtained at www.alpsetfs.com.
Thomson Reuters/Jefferies CRB Wildcatters Energy Exploration & Production Equity Index: measures the performance of equity securities of companies engaged in the exploration and production of oil and natural gas.
GROWTH OF $10,000 as of 06.30.10
Comparison of Change in Value of a hypothetical $10,000 investment in the Jefferies | TR/J CRB Wildcatters Exploration & Production Equity ETF.

| www.jamfunds.com | 5 | |
Table of Contents

Shareholder Expense Example: As a shareholder of the Fund, you incur two types of costs: (1) transaction costs which may include creation and redemption fees or brokerage charges, and (2) ongoing costs, including management fees and other Fund expenses. These examples are intended to help you understand your ongoing costs (in dollars) of investing in the Fund and to compare these costs with the ongoing costs of investing in other funds. It is based on an investment of $1,000 invested at January 1, 2010 and held through the period ended June 30, 2010.
Actual Return: The first line of the table provides information about actual account values and actual expenses. You may use the information in this table, together with the amount you invested, to estimate the expenses that you incurred over the period. Simply divide your account value by $1,000 (for example, an $8,600 account value divided by $1,000 = 8.6), then multiply the result by the number in the first table under the heading entitled “Expenses Paid During the Period” to estimate the expenses attributable to your investment during this period.
Hypothetical 5% Return: The second line of the table provides information about hypothetical account values and hypothetical expenses based on the Fund’s actual expense ratio and an assumed rate of return of 5% per year before expenses, which is not the Fund’s actual return. The hypothetical account values and expenses may not be used to estimate the actual ending account balance or expenses you paid for the period. You may use this information to compare ongoing costs of investing in the Fund and other funds. To do so, compare this 5% hypothetical example with the 5% hypothetical examples that appear in the shareholder reports of the other funds.
The expenses shown in the table are meant to highlight ongoing Funds costs only and do not reflect any transaction costs, such as creation and redemption fees, or brokerage charges. Therefore, the second table is useful in comparing ongoing costs only, and will not help you determine the relative total costs of owning different funds. In addition, if these costs were included, your costs would have been higher.
| Beginning Account Value 1/01/10 | Ending Account Value 6/30/10 | Expense Ratio | Expenses Paid 6/30/10 | |||||||
Jefferies | TR/J CRB Global Commodity Equity Index Fund | ||||||||||
Actual | $ 1,000.00 | $ 829.00 | 0.65% | $2.95 | ||||||
Hypothetical | $ 1,000.00 | $ 1,021.57 | 0.65% | $3.26 | ||||||
Jefferies | TR/J CRB Global Agriculture Equity Index Fund | ||||||||||
Actual | $ 1,000.00 | $ 810.50 | 0.65% | $2.92 | ||||||
Hypothetical | $ 1,000.00 | $ 1,021.57 | 0.65% | $3.26 | ||||||
Jefferies | TR/J CRB Global Industrial Metals Equity Index Fund | ||||||||||
Actual | $ 1,000.00 | $ 791.60 | 0.65% | $2.89 | ||||||
Hypothetical | $ 1,000.00 | $ 1,021.57 | 0.65% | $3.26 | ||||||
Jefferies | TR/J CRB Wildcatters Exploration & Production Equity ETF | ||||||||||
Actual(a) | $ 1,000.00 | $ 886.20 | 0.65% | $2.72 | ||||||
Hypothetical(b) | $ 1,000.00 | $ 1,021.57 | 0.65% | $3.26 |
| (a) | The “Actual” example in the table above is equal to the Fund’s annualized expense ratio multiplied by the average account value over the period, multiplied by the number of days the Fund was in existence in the most recent fiscal half year (162), then divided by 365. |
| (b) | The “Hypothetical” example in the table above is equal to the Fund’s annualized expense ratio multiplied by the average account value over the period, multiplied by the number of days in the most recent fiscal half year (181), then divided by 365. |
6 | Semi-Annual Report (Unaudited) | June 30, 2010 | |
Table of Contents

Security Description
| Shares
| Value
| |||
COMMON STOCKS (99.91%) | |||||
Australia (1.81%) | |||||
Incitec Pivot, Ltd. | 168,057 | $ | 387,522 | ||
Newcrest Mining, Ltd. | 12,605 | 373,703 | |||
Nufarm, Ltd. | 18,217 | 82,936 | |||
Woodside Petroleum, Ltd. | 5,953 | 210,380 | |||
| 1,054,541 | |||||
Bermuda (1.47%) | |||||
Aquarius Platinum, Ltd. | 9,754 | 48,691 | |||
Bunge, Ltd. | 14,900 | 732,931 | |||
Sinofert Holdings, Ltd.* | 186,000 | 73,806 | |||
| 855,428 | |||||
Brazil (3.19%) | |||||
Companhia Siderurgica Nacional SA, ADR | 19,377 | 284,648 | |||
Gerdau SA, ADR | 11,993 | 158,068 | |||
Petroleo Brasileiro SA, ADR | 27,154 | 931,925 | |||
Vale SA, ADR | 19,586 | 476,919 | |||
| 1,851,560 | |||||
Canada (16.06%) | |||||
Agnico-Eagle Mines, Ltd. | 4,117 | 250,201 | |||
Agrium, Inc. | 16,319 | 798,558 | |||
Barrick Gold Corp. | 25,617 | 1,164,836 | |||
Cameco Corp. | 5,031 | 107,187 | |||
Canadian Natural Resources, Ltd. | 11,160 | 371,037 | |||
Eldorado Gold Corp. | 14,040 | 252,090 | |||
EnCana Corp. | 7,969 | 241,773 | |||
Goldcorp, Inc. | 18,995 | 833,160 | |||
IAMGOLD Corp. | 9,713 | 171,564 | |||
Inmet Mining Corp. | 1,322 | 52,437 | |||
Ivanhoe Mines, Ltd.* | 6,444 | 83,624 | |||
Kinross Gold Corp. | 18,429 | 315,633 | |||
Osisko Mining Corp.* | 8,517 | 92,011 | |||
Pan American Silver Corp. | 2,759 | 69,504 | |||
Potash Corp. of Saskatchewan, Inc. | 30,650 | 2,644,613 | |||
Red Back Mining, Inc.* | 6,309 | 159,766 | |||
Silver Wheaton Corp.* | 8,992 | 180,492 | |||
Suncor Energy, Inc. | 16,693 | 492,158 | |||
Talisman Energy, Inc. | 11,000 | 166,659 | |||
Teck Resources, Ltd., Class B | 7,412 | 219,573 | |||
TransCanada Corp. | 7,440 | 249,319 | |||
Viterra, Inc.* | 33,040 | 220,443 | |||
Yamana Gold, Inc. | 19,421 | 199,574 | |||
| 9,336,212 | |||||
Cayman Islands (0.45%) | |||||
Chaoda Modern Agriculture Holdings, Ltd. | 266,000 | 263,023 | |||
Chile (1.54%) | |||||
Sociedad Quimica y Minera de Chile SA, ADR | 27,367 | 892,438 | |||
Security Description
|
Shares
|
Value
| |||
China (1.38%) | |||||
Aluminum Corp. of China, Ltd., ADR* | 2,024 | $ | 37,768 | ||
Angang Steel Co., Ltd. | 14,000 | 16,900 | |||
China BlueChemical, Ltd. | 176,000 | 98,542 | |||
China Petroleum & Chemical Corp. | 182,000 | 148,411 | |||
China Shenhua Energy Co., Ltd. | 36,500 | 133,586 | |||
Jiangxi Copper Co., Ltd. | 18,000 | 33,979 | |||
PetroChina Co., Ltd. | 226,000 | 254,524 | |||
Zijin Mining Group Co., Ltd. | 106,000 | 79,767 | |||
| 803,477 | |||||
Denmark (0.52%) | |||||
Danisco A/S | 4,503 | 304,996 | |||
France (1.76%) | |||||
Total SA | 22,546 | 1,020,848 | |||
Germany (1.37%) | |||||
K+S AG | 14,867 | 689,817 | |||
ThyssenKrupp AG | 4,286 | 106,836 | |||
| 796,653 | |||||
Hong Kong (0.83%) | |||||
China Agri-Industries Holdings, Ltd. | 159,000 | 185,398 | |||
CNOOC, Ltd. | 172,000 | 295,533 | |||
| 480,931 | |||||
India (1.66%) | |||||
Reliance Industries, Ltd., GDR(b) | 17,504 | 817,437 | |||
Sterlite Industries India, Ltd., ADR | 10,250 | 145,960 | |||
| 963,397 | |||||
Israel (1.19%) | |||||
Israel Chemicals, Ltd. | 44,036 | 462,199 | |||
The Israel Corp., Ltd.* | 367 | 228,814 | |||
| 691,013 | |||||
Italy (0.85%) | |||||
Eni SpA | 26,653 | 495,912 | |||
Japan (1.05%) | |||||
JFE Holdings, Inc. | 6,100 | 191,637 | |||
Nippon Steel Corp. | 68,000 | 227,461 | |||
Sumitomo Metal Industries, Ltd. | 45,000 | 103,232 | |||
Sumitomo Metal Mining Co., Ltd. | 7,000 | 88,598 | |||
| 610,928 | |||||
Jersey (0.39%) | |||||
Randgold Resources, Ltd. | 2,358 | 226,661 | |||
Luxembourg (1.08%) | |||||
ArcelorMittal | 11,188 | 306,357 | |||
Evraz Group SA, GDR*(a) | 4,268 | 100,853 | |||
Tenaris SA, ADR | 6,417 | 222,092 | |||
| 629,302 | |||||
| www.jamfunds.com | 7 | |
Table of Contents

Security Description
|
Shares
|
Value
| |||
Malaysia (1.29%) | |||||
Genting Plantations BHD | 23,800 | $ | 49,033 | ||
IOI Corp. BHD | 294,100 | 455,117 | |||
PPB Group BHD | 50,200 | 247,783 | |||
| 751,933 | |||||
Mauritius (0.43%) | |||||
Golden Agri-Resources, Ltd. | 654,000 | 248,277 | |||
Mexico (0.20%) | |||||
Grupo Mexico SAB de CV, Series B | 50,000 | 119,136 | |||
Netherlands (1.59%) | |||||
CNH Global N.V.* | 2,628 | 59,524 | |||
Nutreco Holding N.V. | 3,337 | 180,770 | |||
Schlumberger, Ltd. | 12,400 | 686,216 | |||
| 926,510 | |||||
Norway (0.91%) | |||||
Norsk Hydro ASA* | 7,400 | 33,853 | |||
Yara International ASA | 17,478 | 497,210 | |||
| 531,063 | |||||
Papua New Guinea (0.39%) | |||||
Lihir Gold, Ltd. | 62,287 | 226,752 | |||
Peru (0.48%) | |||||
Companhia de Minas Buenaventura SA, ADR | 7,232 | 277,998 | |||
Russia (6.40%) | |||||
Gazprom OAO, ADR | 63,352 | 1,209,390 | |||
LUKOIL OAO, ADR | 7,193 | 373,317 | |||
Mechel Steel Group, ADR | 1,815 | 32,924 | |||
MMC Norilsk Nickel, ADR | 24,239 | 351,950 | |||
Polyus Gold Co., ADR | 9,228 | 253,770 | |||
Rosneft Oil Co., GDR* | 113,446 | 701,096 | |||
Uralkali, GDR(a) | 44,179 | 796,106 | |||
| 3,718,553 | |||||
Singapore (1.78%) | |||||
Olam International, Ltd. | 199,000 | 369,178 | |||
Wilmar International, Ltd. | 161,000 | 666,557 | |||
| 1,035,735 | |||||
South Africa (2.34%) | |||||
Anglo Platinum, Ltd.* | 1,406 | 133,707 | |||
AngloGold Ashanti, Ltd., ADR | 9,457 | 408,353 | |||
Gold Fields, Ltd. | 17,071 | 231,153 | |||
Harmony Gold Mining Co., Ltd. | 5,670 | 60,207 | |||
Impala Platinum Holdings, Ltd. | 14,642 | 343,808 | |||
Sasol, Ltd. | 5,094 | 182,475 | |||
| 1,359,703 | |||||
Security Description
|
Shares
|
Value
| |||
South Korea (0.54%) | |||||
POSCO | 815 | $ | 311,136 | ||
Spain (0.32%) | |||||
Repsol YPF SA | 9,247 | 188,759 | |||
Switzerland (4.51%) | |||||
Noble Corp.* | 2,800 | 86,548 | |||
Syngenta AG | 9,827 | 2,283,717 | |||
Transocean, Ltd.* | 3,500 | 162,155 | |||
Weatherford International, Ltd.* | 6,800 | 89,352 | |||
| 2,621,772 | |||||
Taiwan (0.48%) | |||||
China Steel Corp. | 120,000 | 111,292 | |||
Taiwan Fertilizer Co., Ltd. | 63,000 | 166,659 | |||
| 277,951 | |||||
United Kingdom (8.72%) | |||||
Anglo American Plc* | 15,160 | 533,114 | |||
Antofagasta Plc | 4,437 | 52,209 | |||
BG Group Plc | 36,145 | 544,009 | |||
BHP Billiton Plc | 27,086 | 710,982 | |||
BP Plc | 200,893 | 958,472 | |||
Kazakhmys Plc | 2,518 | 37,446 | |||
Lonmin Plc* | 4,056 | 85,622 | |||
Petropavlosk Plc | 3,885 | 69,167 | |||
Rio Tinto Plc | 17,877 | 793,948 | |||
Royal Dutch Shell Plc, Class A | 37,954 | 964,665 | |||
Xstrata Plc | 23,944 | 317,675 | |||
| 5,067,309 | |||||
United States (32.93%) | |||||
AGCO Corp.* | 9,642 | 260,045 | |||
Alcoa, Inc. | 13,051 | 131,293 | |||
Allegheny Technologies, Inc. | 1,133 | 50,067 | |||
Anadarko Petroleum Corp. | 5,324 | 192,143 | |||
Apache Corp. | 3,624 | 305,105 | |||
Archer-Daniels-Midland Co. | 65,392 | 1,688,422 | |||
Baker Hughes, Inc. | 4,611 | 191,679 | |||
Cameron International Corp.* | 2,602 | 84,617 | |||
CF Industries Holdings, Inc. | 7,114 | 451,383 | |||
Chesapeake Energy Corp. | 6,952 | 145,644 | |||
Chevron Corp. | 21,492 | 1,458,447 | |||
Cliffs Natural Resources, Inc. | 1,715 | 80,879 | |||
Coeur d’Alene Mines Corp.* | 2,309 | 36,436 | |||
ConocoPhillips | 15,914 | 781,218 | |||
Consol Energy, Inc. | 2,430 | 82,037 | |||
Corn Products International, Inc. | 7,796 | 236,219 | |||
Deere & Co. | 44,099 | 2,455,432 | |||
Devon Energy Corp. | 4,541 | 276,638 | |||
Diamond Offshore Drilling, Inc. | 745 | 46,332 | |||
EOG Resources, Inc. | 2,721 | 267,665 | |||
Exxon Mobil Corp. | 54,548 | 3,113,054 | |||
Freeport-McMoRan Copper & Gold, Inc. | 5,448 | 322,140 | |||
8 | Semi-Annual Report (Unaudited) | June 30, 2010 | |
Table of Contents

Security Description
|
Shares
|
Value
| |||
United States (continued) | |||||
Halliburton Co. | 9,742 | $ | 239,166 | ||
Hecla Mining Co.* | 6,429 | 33,559 | |||
Hess Corp. | 3,278 | 165,015 | |||
Intrepid Potash, Inc.* | 4,636 | 90,727 | |||
Marathon Oil Corp. | 7,641 | 237,559 | |||
Monsanto Co. | 56,494 | 2,611,153 | |||
The Mosaic Co. | 16,545 | 644,924 | |||
National Oilwell Varco, Inc. | 4,514 | 149,278 | |||
Newmont Mining Corp. | 12,583 | 776,874 | |||
Noble Energy, Inc. | 1,855 | 111,912 | |||
Nucor Corp. | 4,020 | 153,886 | |||
Occidental Petroleum Corp. | 8,569 | 661,098 | |||
Peabody Energy Corp. | 2,894 | 113,242 | |||
Southern Copper Corp. | 2,172 | 57,645 | |||
Southwestern Energy Co.* | 3,666 | 141,654 | |||
United States Steel Corp. | 1,830 | 70,547 | |||
Valero Energy Corp. | 6,087 | 109,444 | |||
The Williams Co., Inc. | 6,294 | 115,054 | |||
| 19,139,632 | |||||
TOTAL COMMON STOCKS | |||||
(Cost $67,921,857) | 58,079,539 | ||||
TOTAL INVESTMENTS (99.91%) | |||||
(Cost $67,921,857) | 58,079,539 | ||||
NET OTHER ASSETS AND LIABILITIES (0.09%) | 50,653 | ||||
NET ASSETS (100.00%) | $ | 58,130,192 | |||
| * | Non-income producing security. |
| (a) | Securities were purchased pursuant to Regulation S under the Securities Act of 1933, which exempts securities offered and sold outside of the United States from registration. Such securities cannot be sold in the United States without either an effective registration statement filed pursuant to the Securities Act of 1933, or pursuant to an exemption from registration. These securities have been deemed liquid under guidelines approved by the Fund’s Board of Trustees. At period end, the aggregate market value of those securities was $896, 959, representing 1.54% of the Fund’s net assets. |
| (b) | Security exempt from registration under Rule 144A of the Securities Act of 1933. This security may be resold in transactions exempt from registration, normally to qualified institutional buyers. This security has been determined to be liquid in accordance with procedures adopted by the Fund’s Board of Trustees. The security restricted under Rule 144A comprised 1.41% of the Fund’s net assets. |
Common Abbreviations:
A/S - Aktieselskab is the Danish name for a stock-based corporation.
| ADR | - American Depositary Receipt. |
AG - Aktiengesellschafi is a German term that refers to a corporation that is limited by shares, i.e., owned by shareholders.
ASA - Allmennaksjeselskap is the Norwegian term for public limited company.
BHD - Berhad (in Malaysia; equivalent to Public Limited Company).
GDR - Global Depository Receipt.
Ltd. - Limited.
NV - Naamloze Vennootschap is the Dutch term for a public limited liability corporation.
Plc - Public Limited Co.
SA - Generally designated corporations in various countries, mostly those employing the civil law.
SAB de CV - A variable capital company.
SpA - Società Per Azioni is an Italian shared company.
See Notes to Financial Statements.
| www.jamfunds.com | 9 | |
Table of Contents

Security Description
| Shares
| Value
| |||
COMMON STOCKS (100.01%) | |||||
Australia (3.04%) | |||||
Incitec Pivot, Ltd. | 37,011 | $ | 85,343 | ||
Nufarm, Ltd. | 4,000 | 18,211 | |||
| 103,554 | |||||
Bermuda (5.09%) | |||||
Bunge, Ltd. | 3,200 | 157,408 | |||
Sinofert Holdings, Ltd.* | 40,000 | 15,872 | |||
| 173,280 | |||||
Canada (13.02%) | |||||
Agrium, Inc. | 3,172 | 155,220 | |||
Potash Corp. of Saskatchewan, Inc. | 2,776 | 239,525 | |||
Viterra, Inc.* | 7,255 | 48,405 | |||
| 443,150 | |||||
Cayman Islands (1.69%) | |||||
Chaoda Modern Agriculture | 58,000 | 57,351 | |||
Chile (4.81%) | |||||
Sociedad Quimica y Minera | 5,014 | 163,506 | |||
China (0.62%) | |||||
China BlueChemical, Ltd. | 38,000 | 21,276 | |||
Denmark (1.97%) | |||||
Danisco A/S | 989 | 66,987 | |||
Germany (4.46%) | |||||
K+S AG | 3,274 | 151,911 | |||
Hong Kong (1.20%) | |||||
China Agri-Industries Holdings, Ltd. | 35,000 | 40,811 | |||
Israel (4.48%) | |||||
Israel Chemicals, Ltd. | 9,698 | 101,790 | |||
The Israel Corp., Ltd.* | 81 | 50,501 | |||
| 152,291 | |||||
Malaysia (4.86%) | |||||
Genting Plantations BHD | 5,300 | 10,919 | |||
IOI Corp. BHD | 64,800 | 100,278 | |||
PPB Group BHD | 11,000 | 54,295 | |||
| 165,492 | |||||
Mauritius (1.61%) | |||||
Golden Agri-Resources, Ltd. | 144,000 | 54,667 | |||
Security Description
| Shares
| Value
| |||
Netherlands (1.61%) | |||||
CNH Global N.V.* | 672 | $ | 15,221 | ||
Nutreco Holding N.V. | 732 | 39,653 | |||
| 54,874 | |||||
Norway (3.22%) | |||||
Yara International ASA | 3,850 | 109,524 | |||
Russia (4.77%) | |||||
Uralkali, GDR(a) | 9,002 | 162,216 | |||
Singapore (6.78%) | |||||
Olam International, Ltd. | 44,000 | 81,627 | |||
Wilmar International, Ltd. | 36,000 | 149,044 | |||
| 230,671 | |||||
Switzerland (6.08%) | |||||
Syngenta AG | 890 | 206,829 | |||
Taiwan (1.17%) | |||||
Taiwan Fertilizer Co., Ltd. | 15,000 | 39,681 | |||
United States (29.53%) | |||||
AGCO Corp.* | 2,118 | 57,122 | |||
Archer-Daniels-Midland Co. | 6,786 | 175,214 | |||
CF Industries Holdings, Inc. | 1,567 | 99,426 | |||
Corn Products International, Inc. | 1,712 | 51,874 | |||
Deere & Co. | 3,994 | 222,386 | |||
Intrepid Potash, Inc.* | 1,019 | 19,942 | |||
Monsanto Co. | 5,117 | 236,508 | |||
The Mosaic Co. | 3,644 | 142,043 | |||
| 1,004,515 | |||||
TOTAL COMMON STOCKS | |||||
(Cost $3,989,320) | 3,402,586 | ||||
TOTAL INVESTMENTS (100.01%) | |||||
(Cost $3,989,320) | 3,402,586 | ||||
NET LIABILITIES LESS OTHER ASSETS(-0.01%) | (403) | ||||
NET ASSETS (100.00%) | $ | 3,402,183 | |||
| * | Non-income producing security. |
| (a) | Securities were purchased pursuant to Regulation S under the Securities Act of 1933, which exempts securities offered and sold outside of the United States from registration. Such securities cannot be sold in the United States without either an effective registration statement filed pursuant to the Securities Act of 1933, or pursuant to an exemption from registration. These securities have been deemed liquid under guidelines approved by the Fund’s Board of Trustees. At period end, the aggregate market value of those securities was $162,216, representing 4.77% of the Fund’s net assets. |
10 | Semi-Annual Report (Unaudited) | June 30, 2010 | |
Table of Contents

Common Abbreviations:
A/S - Aktieselskab is the Danish name for a stock-based corporation.
ADR - American Depositary Receipt.
AG - Aktiengesellschaft is a German term that refers to a corporation that is limited by shares, i.e., owned by shareholders.
ASA - Allmennaksjeselskap is the Norwegian term for public limited company.
BHD - Berhad (in Malaysia; equivalent to Public Limited Company).
GDR - Global Depository Receipt.
Ltd. - Limited.
N.V. - Naamloze Vennootschap is the Dutch term for a public limited liability corporation.
SA - Generally designated corporations in various countries, mostly those employing the civil law.
See Notes to Financial Statements.
| www.jamfunds.com | 11 | |
Table of Contents

Security Description
| Shares
| Value
| |||
COMMON STOCKS (99.88%) | |||||
Brazil (12.42%) | |||||
Companhia Siderurgica Nacional | 10,600 | $ | 155,714 | ||
Gerdau SA, ADR | 7,661 | 100,972 | |||
Vale SA, ADR | 6,451 | 157,082 | |||
| 413,768 | |||||
Canada (6.17%) | |||||
Cameco Corp. | 3,214 | 68,475 | |||
Teck Resources, Ltd., Class B | 4,624 | 136,982 | |||
| 205,457 | |||||
China (1.64%) | |||||
Aluminum Corp. of China, Ltd., ADR* | 1,293 | 24,127 | |||
Angang Steel Co., Ltd. | 8,000 | 9,657 | |||
Jiangxi Copper Co., Ltd. | 11,000 | 20,765 | |||
| 54,549 | |||||
Germany (2.05%) | |||||
ThyssenKrupp AG | 2,738 | 68,249 | |||
India (2.80%) | |||||
Sterlite Industries India, Ltd., ADR | 6,547 | 93,229 | |||
Japan (11.99%) | |||||
JFE Holdings, Inc. | 3,900 | 122,522 | |||
Nippon Steel Corp. | 44,000 | 147,181 | |||
Sumitomo Metal Industries, Ltd. | 29,000 | 66,527 | |||
Sumitomo Metal Mining Co., Ltd. | 5,000 | 63,284 | |||
| 399,514 | |||||
Luxembourg (6.61%) | |||||
ArcelorMittal | 5,690 | 155,807 | |||
Evraz Group SA, GDR*(a) | 2,726 | 64,416 | |||
| 220,223 | |||||
Mexico (2.28%) | |||||
Grupo Mexico SAB de CV, Series B | 31,900 | 76,009 | |||
Norway (0.66%) | |||||
Norsk Hydro ASA* | 4,800 | 21,959 | |||
Russia (5.39%) | |||||
Mechel Steel Group, ADR | 1,187 | 21,532 | |||
MMC Norilsk Nickel, ADR | 10,877 | 157,934 | |||
| 179,466 | |||||
South Korea (5.15%) | |||||
POSCO | 450 | 171,793 | |||
Taiwan (2.11%) | |||||
China Steel Corp. | 76,000 | 70,485 | |||
Security Description
| Shares
| Value
| |||
United Kingdom (25.49%) | |||||
Anglo American Plc* | 4,750 | $ | 167,038 | ||
Antofagasta Plc | 2,834 | 33,347 | |||
BHP Billiton Plc | 8,486 | 222,749 | |||
Kazakhmys Plc | 1,609 | 23,928 | |||
Rio Tinto Plc | 5,601 | 248,750 | |||
Xstrata Plc | 11,561 | 153,384 | |||
| 849,196 | |||||
United States (15.12%) | |||||
Alcoa, Inc. | 8,336 | 83,860 | |||
Allegheny Technologies, Inc. | 732 | 32,347 | |||
Cliffs Natural Resources, Inc. | 1,095 | 51,640 | |||
Freeport-McMoRan | 2,631 | 155,571 | |||
Nucor Corp. | 2,568 | 98,303 | |||
Southern Copper Corp. | 1,388 | 36,838 | |||
United States Steel Corp. | 1,169 | 45,065 | |||
| 503,624 | |||||
TOTAL COMMON STOCKS | |||||
(Cost $4,011,849) | 3,327,521 | ||||
TOTAL INVESTMENTS (99.88%) | |||||
(Cost $4,011,849) | 3,327,521 | ||||
NET OTHER ASSETS AND LIABILITIES (0.12%) | 4,066 | ||||
NET ASSETS (100.00%) | $ | 3,331,587 | |||
| * | Non-income producing security. |
| (a) | Securities were purchased pursuant to Regulation S under the Securities Act of 1933, which exempts securities offered and sold outside of the United States from registration. Such securities cannot be sold in the United States without either an effective registration statement filed pursuant to the Securities Act of 1933, or pursuant to an exemption from registration. These securities have been deemed liquid under guidelines approved by the Fund’s Board of Trustees. At period end, the aggregate market value of those securities was $64,416, representing 1.93% of the Fund’s net assets. |
Common Abbreviations:
ADR - American Depositary Receipt.
AG - Aktiengesellschaft is a German term that refers to a corporation that is limited by shares, i.e., owned by shareholders.
ASA - Allmennaksjeselskap is the Norwegian term for public limited company.
GDR - Global Depository Receipt
Ltd. - Limited.
Plc - Public Limited Co.
SA - Generally designated corporations in various countries, mostly those employing the civil law.
SAB de CV - A variable capital company
See Notes to Financial Statements.
12 | Semi-Annual Report (Unaudited) | June 30, 2010 | |
Table of Contents

Security Description
| Shares
| Value
| |||
COMMON STOCKS (100.10%) | |||||
Canada (37.26%) | |||||
Advantage Oil & Gas, Ltd.* | 13,033 | $ | 76,041 | ||
Anderson Energy, Ltd.* | 12,823 | 14,239 | |||
Angle Energy, Inc.* | 4,260 | 28,623 | |||
Bankers Petroleum, Ltd.* | 17,318 | 114,405 | |||
Birchcliff Energy, Ltd.* | 7,131 | 65,093 | |||
Celtic Exploration, Ltd.* | 5,788 | 59,751 | |||
Compton Petroleum Corp.* | 18,432 | 10,407 | |||
Corridor Resources, Inc.* | 6,613 | 32,360 | |||
Crew Energy, Inc.* | 6,137 | 87,090 | |||
Daylight Energy, Ltd. | 15,983 | 134,313 | |||
Delphi Energy Corp.* | 8,800 | 21,945 | |||
Fairborne Energy, Ltd.* | 7,840 | 33,938 | |||
Galleon Energy, Inc., Class A* | 5,278 | 21,407 | |||
Iteration Energy, Ltd.* | 14,059 | 20,110 | |||
Ivanhoe Energy, Inc.* | 22,579 | 43,346 | |||
Legacy Oil + Gas, Inc.* | 4,835 | 52,233 | |||
NuVista Energy, Ltd. | 6,497 | 62,118 | |||
OPTI Canada, Inc.* | 22,870 | 38,524 | |||
Paramount Resources, Ltd., Class A* | 2,602 | 45,495 | |||
Progress Energy Resources Corp. | 16,006 | 186,321 | |||
Questerre Energy Corp.* | 16,604 | 44,532 | |||
Storm Exploration, Inc.* | 2,778 | 35,083 | |||
TransGlobe Energy Corp.* | 3,711 | 27,204 | |||
UTS Energy Corp.* | 38,025 | 73,713 | |||
| 1,328,291 | |||||
United States (62.84%) | |||||
American Oil & Gas, Inc.* | 4,082 | 25,635 | |||
Arena Resources, Inc.* | 3,110 | 99,209 | |||
ATP Oil & Gas Corp.* | 3,613 | 38,262 | |||
Berry Petroleum Co., Class A | 3,528 | 90,740 | |||
Bill Barrett Corp.* | 3,656 | 112,495 | |||
BPZ Resources, Inc.* | 7,944 | 32,968 | |||
Brigham Exploration Co.* | 9,217 | 141,757 | |||
CAMAC Energy, Inc.* | 4,336 | 16,173 | |||
Carrizo Oil & Gas, Inc.* | 2,554 | 39,664 | |||
China North East Petroleum Holdings, Ltd.* | 1,566 | 2,506 | |||
Clayton Williams Energy, Inc.* | 482 | 20,302 | |||
Comstock Resources, Inc.* | 3,630 | 100,624 | |||
Contango Oil & Gas Co.* | 1,078 | 48,240 | |||
Delta Petroleum Corp.* | 14,996 | 12,897 | |||
Endeavour International Corp.* | 10,609 | 11,245 | |||
Energy Partners, Ltd.* | 2,925 | 35,714 | |||
GeoResources, Inc.* | 1,018 | 14,181 | |||
GMX Resources, Inc.* | 2,328 | 15,109 | |||
Goodrich Petroleum Corp.* | 2,227 | 26,724 | |||
Gran Tierra Energy, Inc.* | 16,413 | 82,633 | |||
Gulfport Energy Corp.* | 2,287 | 27,124 | |||
Harvest Natural Resources, Inc.* | 2,588 | 19,073 | |||
Houston American Energy Corp. | 1,467 | 14,465 | |||
Magnum Hunter Resources Corp.* | 3,832 | 16,707 | |||
Security Description
| Shares
| Value
| ||||
United States (continued) | ||||||
Mariner Energy, Inc.* | 8,112 | $ | 174,246 | |||
McMoRan Exploration Co.* | 6,227 | 69,182 | ||||
Northern Oil and Gas, Inc.* | 3,331 | 42,770 | ||||
Oilsands Quest, Inc.* | 23,373 | 14,257 | ||||
Penn Virginia Corp. | 3,666 | 73,723 | ||||
Petroleum Development Corp.* | 1,516 | 38,840 | ||||
Petroquest Energy, Inc.* | 4,494 | 30,379 | ||||
Quicksilver Resources, Inc.* | 9,567 | 105,237 | ||||
Rex Energy Corp.* | 2,570 | 25,957 | ||||
Rosetta Resources, Inc.* | 4,169 | 82,588 | ||||
SandRidge Energy, Inc.* | 12,785 | 74,536 | ||||
St. Mary Land & Exploration Co. | 5,088 | 204,334 | ||||
Stone Energy Corp.* | 3,481 | 38,848 | ||||
Swift Energy Co.* | 2,994 | 80,568 | ||||
Toreador Resources Corp.* | 1,550 | 8,525 | ||||
Vaalco Energy, Inc. | 4,446 | 24,898 | ||||
Vanguard Natural Resources LLC | 1,582 | 33,064 | ||||
Venoco, Inc.* | 1,900 | 31,293 | ||||
W&T Offshore, Inc. | 2,836 | 26,829 | ||||
Warren Resources, Inc.* | 5,569 | 16,150 | ||||
| 2,240,671 | ||||||
TOTAL COMMON STOCKS | ||||||
(Cost $4,085,992) | 3,568,962 | |||||
TOTAL INVESTMENTS (100.10%) | ||||||
(Cost $4,085,992) | 3,568,962 | |||||
NET LIABILITIES LESS OTHER ASSETS (-0.10%) | (3,492 | ) | ||||
NET ASSETS (100.00%) | $ | 3,565,470 | ||||
| * | Non-income producing security. |
Common Abbreviations:
LLC - Limited Liability Company
Ltd. - Limited.
See Notes to Financial Statements.
| www.jamfunds.com | 13 | |
Table of Contents

Jefferies | TR/J CRB
|
Jefferies | TR/J CRB
|
Jefferies | TR/J CRB
|
Jefferies | TR/J CRB Wildcatters Exploration
| |||||
ASSETS: | ||||||||
Investments at market value | $ 58,079,539 | $ 3,402,586 | $ 3,327,521 | $ 3,568,962 | ||||
Foreign currency, at value (Cost $22,409, $1,626, $6,038 and $0, respectively) | 22,395 | 1,626 | 6,013 | – | ||||
Receivable for investments and currency contracts sold | 17,166 | 388 | 1,343 | – | ||||
Foreign tax reclaims | 9,398 | 779 | 159 | – | ||||
Interest and dividends receivable | 123,257 | 4,493 | 23,177 | 2,179 | ||||
Total Assets | 58,251,755 | 3,409,872 | 3,358,213 | 3,571,141 | ||||
LIABILITIES: | ||||||||
Payable to advisor | 34,739 | 1,911 | 2,392 | 2,095 | ||||
Payable to custodian | 72,817 | 5,390 | 22,878 | 3,576 | ||||
Payable for investments and currency contracts purchased | 14,007 | 388 | 1,356 | – | ||||
Total Liabilities | 121,563 | 7,689 | 26,626 | 5,671 | ||||
NET ASSETS | $ 58,130,192 | $ 3,402,183 | $ 3,331,587 | $ 3,565,470 | ||||
NET ASSETS CONSIST OF: | ||||||||
Paid-in capital | $ 68,727,012 | $ 3,930,030 | $ 4,340,729 | $ 4,023,174 | ||||
Overdistributed net investment income | (8,321) | (1,254) | (863) | (5,795) | ||||
Accumulated net realized gain/ (loss) on investments and foreign currency transactions | (745,829) | 60,179 | (323,840) | 65,181 | ||||
Net unrealized depreciation on investments and translation of assets and liabilities denominated in foreign currencies | (9,842,670) | (586,772) | (684,439) | (517,090) | ||||
NET ASSETS | $ 58,130,192 | $ 3,402,183 | $ 3,331,587 | $ 3,565,470 | ||||
INVESTMENTS, AT COST | $ 67,921,857 | $ 3,989,320 | $ 4,011,849 | $ 4,085,992 | ||||
PRICING OF SHARES | ||||||||
Net Assets | $ 58,130,192 | $ 3,402,183 | $ 3,331,587 | $ 3,565,470 | ||||
Shares of beneficial interest outstanding (Unlimited number of shares authorized, par value $0.01 per share) | 1,650,000 | 100,000 | 100,000 | 100,000 | ||||
Net Asset Value, offering and redemption price per share | $ 35.23 | $ 34.02 | $ 33.32 | $ 35.65 | ||||
See Notes to Financial Statements.
14 | Semi-Annual Report (Unaudited) | June 30, 2010 | |
Table of Contents

Jefferies | TR/J CRB
|
Jefferies | TR/J CRB
|
Jefferies | TR/J CRB
|
Jefferies | TR/J CRB
| |||||
INVESTMENT INCOME: | ||||||||
Dividends(a) | $ 718,701 | $ 35,832 | $ 56,744 | $ 5,751 | ||||
Total Investment Income | 718,701 | 35,832 | 56,744 | 5,751 | ||||
EXPENSES: | ||||||||
Investment advisory fee | 237,950 | 13,080 | 18,678 | 11,546 | ||||
Total Net Expenses | 237,950 | 13,080 | 18,678 | 11,546 | ||||
NET INVESTMENT INCOME/(LOSS) | 480,751 | 22,752 | 38,066 | (5,795) | ||||
Net realized gain/(loss) on investments | (679,770) | 30,628 | (322,753) | 66,075 | ||||
Net realized loss on foreign currency transactions | (19,712) | (1,177) | (1,330) | (894) | ||||
Net change in unrealized depreciation on investments | (12,933,249) | (851,463) | (994,905) | (517,030) | ||||
Net change in unrealized depreciation on translation of assets and liabilities in foreign currencies | (479) | (72) | (106) | (60) | ||||
NET REALIZED AND UNREALIZED LOSS ON INVESTMENTS | (13,633,210) | (822,084) | (1,319,094) | (451,909) | ||||
NET DECREASE IN NET ASSETS RESULTING FROM OPERATIONS | $ (13,152,459) | $ (799,332) | $ (1,281,028) | $ (457,704) | ||||
| (a) | Net of foreign tax withholdings of $58,519, $2,793, $2, 709 and $651, respectively. |
| (b) | For the period January 20, 2010 (Inception) through June 30, 2010 for the Jefferies | TR/J CRB Wildcatters Exploration & Production Equity ETF |
See Notes to Financial Statements.
| www.jamfunds.com | 15 | |
Table of Contents

For the Six Months Ended
|
For the Period
| |||
OPERATIONS: | ||||
Net investment income | $ 480,751 | $ 199,284 | ||
Net realized loss on investments and foreign currency transactions | (699,482) | (58,266) | ||
Net change in unrealized appreciation/(depreciation) on investments and foreign currency | (12,933,728) | 3,091,058 | ||
Net increase/(decrease) in net assets resulting from operations | (13,152,459) | 3,232,076 | ||
DISTRIBUTIONS TO SHAREHOLDERS: | ||||
From net investment income | (479,755) | (202,000) | ||
Total distributions | (479,755) | (202,000) | ||
SHARE TRANSACTIONS: | ||||
Proceeds from sale of shares | 12,848,374 | 69,712,566 | ||
Value of shares redeemed | (11,743,720) | (2,084,890) | ||
Net increase from share transactions | 1,104,654 | 67,627,676 | ||
Net increase/(decrease) in net assets | (12,527,560) | 70,657,752 | ||
NET ASSETS: | ||||
Beginning of period | 70,657,752 | – | ||
End of period* | $ 58,130,192 | $ 70,657,752 | ||
*Including overdistributed net investment income of: | $ (8,321) | $ (9,317) | ||
Other Information: | ||||
SHARE TRANSACTIONS: | ||||
Beginning shares | 1,650,000 | – | ||
Shares sold | 300,000 | 1,700,000 | ||
Shares redeemed | (300,000) | (50,000) | ||
Shares outstanding, end of period | 1,650,000 | 1,650,000 | ||
See Notes to Financial Statements.
16 | Semi-Annual Report (Unaudited) | June 30, 2010 | |
Table of Contents

For the Six Months Ended
|
For the Period
| |||
OPERATIONS: | ||||
Net investment income | $ 22,752 | $ 22,578 | ||
Net realized gain on investments and foreign currency transactions | 29,451 | 30,997 | ||
Net change in unrealized appreciation/(depreciation) on investments and foreign currency | (851,535) | 264,763 | ||
Net increase/(decrease) in net assets resulting from operations | (799,332) | 318,338 | ||
DISTRIBUTIONS TO SHAREHOLDERS: | ||||
From net investment income | (21,353) | (25,500) | ||
Total distributions | (21,353) | (25,500) | ||
SHARE TRANSACTIONS: | ||||
Proceeds from sale of shares | 2,173,770 | 3,930,030 | ||
Value of shares redeemed | (2,173,770) | – | ||
Net increase from share transactions | – | 3,930,030 | ||
Net increase/(decrease) in net assets | (820,685) | 4,222,868 | ||
NET ASSETS: | ||||
Beginning of period | 4,222,868 | – | ||
End of period* | $ 3,402,183 | $ 4,222,868 | ||
*Including overdistributed net investment income of: | $ (1,254) | $ (2,653) | ||
Other Information: | ||||
SHARE TRANSACTIONS: | ||||
Beginning shares | 100,000 | – | ||
Shares sold | 50,000 | 100,000 | ||
Shares redeemed | (50,000) | – | ||
Shares outstanding, end of period | 100,000 | 100,000 | ||
See Notes to Financial Statements.
| www.jamfunds.com | 17 | |
Table of Contents

| For the Six Months Ended June 30, 2010 (Unaudited) | For the Period October 27, 2009 (Inception) through December 31, 2009 | |||||
OPERATIONS: | ||||||
Net investment income/(loss) | $ | 38,066 | $ | (264) | ||
Net realized loss on investments and foreign currency transactions | (324,083) | (503) | ||||
Net change in unrealized appreciation/(depreciation) on investments and foreign currency |
| (995,011)
|
| 310,572
| ||
Net increase/(decrease) in net assets resulting from operations |
| (1,281,028)
|
| 309,805
| ||
DISTRIBUTIONS TO SHAREHOLDERS: | ||||||
From net investment income |
| (37,919)
|
| –
| ||
Total distributions |
| (37,919)
|
| –
| ||
SHARE TRANSACTIONS: | ||||||
Proceeds from sale of shares | 6,215,351 | 3,941,376 | ||||
Value of shares redeemed |
| (5,815,998)
|
| –
| ||
Net increase from share transactions |
| 399,353
|
| 3,941,376
| ||
Net increase/(decrease) in net assets |
| (919,594)
|
| 4,251,181
| ||
NET ASSETS: | ||||||
Beginning of period |
| 4,251,181
|
| –
| ||
End of period* | $
| 3,331,587
| $
| 4,251,181
| ||
*Including overdistributed net investment income of: | $ | (863) | $ | (1,010) | ||
Other Information: | ||||||
SHARE TRANSACTIONS: | ||||||
Beginning shares | 100,000 | – | ||||
Shares sold | 150,000 | 100,000 | ||||
Shares redeemed |
| (150,000)
|
| –
| ||
Shares outstanding, end of period |
| 100,000
|
| 100,000
| ||
See Notes to Financial Statements.
18 | Semi-Annual Report (Unaudited) | June 30, 2010 | |
Table of Contents

For the Period January 20, 2010 June 30, 2010 (Unaudited) | |||
OPERATIONS: | |||
Net investment loss | $ | (5,795) | |
Net realized gain on investments and foreign currency transactions | 65,181 | ||
Net change in unrealized depreciation on investments and foreign currency |
| (517,090)
| |
Net decrease in net assets resulting from operations |
| (457,704)
| |
SHARE TRANSACTIONS: | |||
Proceeds from sale of shares | 8,096,191 | ||
Value of shares redeemed |
| (4,073,017)
| |
Net increase from share transactions |
| 4,023,174
| |
Net increase in net assets |
| 3,565,470
| |
NET ASSETS: | |||
Beginning of period |
| –
| |
End of period* | $
| 3,565,470
| |
*Including overdistributed net investment income of: | $ | (5,795) | |
Other Information: | |||
SHARE TRANSACTIONS: | |||
Beginning shares | – | ||
Shares sold | 200,000 | ||
Shares redeemed |
| (100,000)
| |
Shares outstanding, end of period |
| 100,000
| |
See Notes to Financial Statements.
| www.jamfunds.com | 19 | |
Table of Contents

| For the Six Months Ended June 30, 2010 (Unaudited) | For the Period September 21, 2009 (Inception) through December 31, 2009 | |||
NET ASSET VALUE, BEGINNING OF PERIOD |
$ 42.82 |
$ 39.74 | ||
INCOME/(LOSS) FROM OPERATIONS: | ||||
Net investment income | 0.28 | 0.12 | ||
Net realized and unrealized gain/(loss) on investments
| (7.59)
| 3.08
| ||
Total from Investment Operations
| (7.31)
| 3.20
| ||
LESS DISTRIBUTIONS:
| ||||
From net investment income
| (0.28)
| (0.12)
| ||
Total Distributions
| (0.28)
| (0.12)
| ||
NET INCREASE/(DECREASE) IN NET ASSET VALUE
| (7.59)
| 3.08
| ||
NET ASSET VALUE, END OF PERIOD
| $ 35.23
| $ 42.82
| ||
TOTAL RETURN(a) | (17.10)% | 8.06% | ||
RATIOS/ SUPPLEMENTAL DATA: | ||||
Net assets, end of period (in 000s) | $ 58,130 | $ 70,658 | ||
RATIOS TO AVERAGE NET ASSETS: | ||||
Net investment income including reimbursement/waiver | 1.31%(b) | 1.53%(b) | ||
Operating expenses | 0.65%(b) | 0.65%(b) | ||
PORTFOLIO TURNOVER RATE(c) | 6% | 7% | ||
| (a) | Total return is calculated assuming an initial investment made at the net asset value at the beginning of the period and redemption at the net asset value on the last day of the period. The return presented does not reflect the deduction of taxes that a shareholder would pay on Fund distributions or the redemption or sale of Fund shares. Total return calculated for a period of less than one year is not annualized. |
| (b) | Annualized. |
| (c) | Portfolio turnover is not annualized and does not include securities received or delivered from processing creations or redemptions. |
See Notes to Financial Statements.
20 | Semi-Annual Report (Unaudited) | June 30, 2010 | |
Table of Contents

| For the Six Months Ended June 30, 2010 (Unaudited) | For the Period October 27, 2009 (Inception) through December 31, 2009 | |||
NET ASSET VALUE, BEGINNING OF PERIOD |
$ 42.23 |
$ 39.30 | ||
INCOME/(LOSS) FROM OPERATIONS: | ||||
Net investment income | 0.23 | 0.23 | ||
Net realized and unrealized gain/(loss) on investments
| (8.23)
| 2.96
| ||
Total from Investment Operations
| (8.00)
| 3.19
| ||
LESS DISTRIBUTIONS:
| ||||
From net investment income
| (0.21)
| (0.26)
| ||
Total Distributions
| (0.21)
| (0.26)
| ||
NET INCREASE/(DECREASE) IN NET ASSET VALUE
| (8.21)
| 2.93
| ||
NET ASSET VALUE, END OF PERIOD
| $ 34.02
| $ 42.23
| ||
TOTAL RETURN(a) | (18.95)% | 8.10% | ||
RATIOS/ SUPPLEMENTAL DATA: | ||||
Net assets, end of period (in 000s) | $ 3,402 | $ 4,223 | ||
RATIOS TO AVERAGE NET ASSETS: | ||||
Net investment income including reimbursement/waiver | 1.13%(b) | 3.03%(b) | ||
Operating expenses | 0.65%(b) | 0.65%(b) | ||
PORTFOLIO TURNOVER RATE(c) | 9% | 9% | ||
| (a) | Total return is calculated assuming an initial investment made at the net asset value at the beginning of the period and redemption at the net asset value on the last day of the period. The return presented does not reflect the deduction of taxes that a shareholder would pay on Fund distributions or the redemption or sale of Fund shares. Total return calculated for a period of less than one year is not annualized. |
| (b) | Annualized. |
| (c) | Portfolio turnover is not annualized and does not include securities received or delivered from processing creations or redemptions. |
See Notes to Financial Statements.
| www.jamfunds.com | 21 | |
Table of Contents

| For the Six Months Ended June 30, 2010 (Unaudited) | For the Period October 27, 2009 (Inception) through December 31, 2009 | |||||
NET ASSET VALUE, BEGINNING OF PERIOD | $ | 42.51 | $ | 39.41 | ||
INCOME/(LOSS) FROM OPERATIONS:
| ||||||
Net investment income/(loss)
| 0.35 | (0.00)(a) | ||||
Net realized and unrealized gain/(loss) on investments
|
| (9.19)
|
| 3.10
| ||
Total from Investment Operations
|
| (8.84)
|
| 3.10
| ||
LESS DISTRIBUTIONS: | ||||||
From net investment income
|
| (0.35)
|
| –
| ||
Total Distributions
|
| (0.35)
|
| –
| ||
NET INCREASE/(DECREASE) IN NET ASSET VALUE
|
| (9.19)
|
| 3.10
| ||
NET ASSET VALUE, END OF PERIOD
| $
| 33.32
| $
| 42.51
| ||
TOTAL RETURN(b) | (20.84)% | 7.87% | ||||
RATIOS/ SUPPLEMENTAL DATA: | ||||||
Net assets, end of period (in 000s) | $ | 3,332 | $ | 4,251 | ||
RATIOS TO AVERAGE NET ASSETS: | ||||||
Net investment income/(loss) including reimbursement/waiver
| 1.32%(c) | (0.04)%(c) | ||||
Operating expenses
| 0.65%(c) | 0.65%(c) | ||||
PORTFOLIO TURNOVER RATE(d) | 9% | 5% | ||||
| (a) | Less than $0.005 per share. |
| (b) | Total return is calculated assuming an initial investment made at the net asset value at the beginning of the period and redemption at the net asset value on the last day of the period. The return presented does not reflect the deduction of taxes that a shareholder would pay on Fund distributions or the redemption or sale of Fund shares. Total return calculated for a period of less than one year is not annualized. |
| (c) | Annualized. |
| (d) | Portfolio turnover is not annualized and does not include securities received or delivered from processing creations or redemptions. |
See Notes to Financial Statements.
22 | Semi-Annual Report (Unaudited) | June 30, 2010 | |
Table of Contents

| For the Period January 20, 2010 (Inception) through June 30, 2010 (Unaudited) | ||||
NET ASSET VALUE, BEGINNING OF PERIOD |
$ |
40.23 |
| |
LOSS FROM OPERATIONS:
| ||||
Net investment loss
| (0.06) | |||
Net realized and unrealized loss on investments
|
| (4.52)
|
| |
Total from Investment Operations
|
| (4.58)
|
| |
NET DECREASE IN NET ASSET VALUE
|
| (4.58)
|
| |
NET ASSET VALUE, END OF PERIOD
| $
| 35.65
|
| |
TOTAL RETURN(a) | (11.38)% | |||
RATIOS/ SUPPLEMENTAL DATA:
| ||||
Net assets, end of period (in 000s) | $ | 3,565 | ||
RATIOS TO AVERAGE NET ASSETS:
| ||||
Net investment loss including reimbursement/waiver
| (0.33)% | (b) | ||
Operating expenses
| 0.65% | (b) | ||
PORTFOLIO TURNOVER RATE(c) | 12% | |||
| (a) | Total return is calculated assuming an initial investment made at the net asset value at the beginning of the period and redemption at the net asset value on the last day of the period. The return presented does not reflect the deduction of taxes that a shareholder would pay on Fund distributions or the redemption or sale of Fund shares. Total return calculated for a period of less than one year is not annualized. |
| (b) | Annualized. |
| (c) | Portfolio turnover is not annualized and does not include securities received or delivered from processing creations or redemptions. |
See Notes to Financial Statements.
| www.jamfunds.com | 23 | |
Table of Contents
1. ORGANIZATION
The ALPS ETF Trust (the “Trust”) is an open-end management investment company organized as a Delaware statutory trust on September 13, 2007 and is registered with the Securities and Exchange Commission (“SEC”) under the Investment Company Act of 1940, as amended (the “1940 Act”). As of June 30, 2010, the Trust consists of ten separate portfolios. Each portfolio represents a separate series of the Trust. This report pertains to the Jefferies | TR/J CRB Global Commodity Equity Index Fund, Jefferies | TR/J CRB Global Agriculture Equity Index Fund and the Jefferies | TR/J CRB Global Industrial Metals Equity Index Fund (the “Funds”).
The Funds’ Shares are listed on the NYSE Arca. Unlike conventional mutual funds, the Funds issue and redeem Shares on a continuous basis, at NAV, only in large specified blocks of 50,000 Shares, each of which is called a “Creation Unit.” Creation Units are issued and redeemed principally in-kind for securities included in a specified index. Except when aggregated in Creation Units, Shares are not redeemable securities of the Funds. The investment objective of the Funds is to seek investment results that correspond generally to the price and yield (before the Funds’ fees and expenses) of the Thomson Reuters/Jefferies CRB In-The-Ground Global Commodity Equity Index, the Thomson Reuters/Jefferies CRB In-The-Ground Global Agriculture Equity Index and the Thomson Reuters/Jefferies CRB In-The-Ground Global Industrial Metals Equity Index, respectively.
2. SIGNIFICANT ACCOUNTING POLICIES
The following is a summary of significant accounting policies consistently followed by the Funds in the preparation of the financial statements. The accompanying financial statements were prepared in accordance with accounting principles generally accepted in the United States of America (“U.S. GAAP���). The preparation of financial statements in conformity with U.S. GAAP requires management to make certain estimates and assumptions that affect the reported amounts of assets and liabilities and disclosures of contingent assets and liabilities at the date of the financial statements and the reported amounts of revenue and expenses during the period. Actual results could differ from those estimates.
A. Portfolio Valuation
The Funds’ NAV is determined daily, as of the close of regular trading on the New York Stock Exchange (“NYSE”), normally 4:00 p.m. Eastern time, on each day the NYSE is open for trading. The NAV is computed by dividing the value of all assets of the Fund (including accrued interest and dividends), less all liabilities (including accrued expenses and dividends declared but unpaid), by the total number of shares outstanding.
The Funds’ investments are valued at market value or, in the absence of market value with respect to any portfolio securities, at fair value according to procedures adopted by the Trust’s Board of Trustees. Portfolio securities listed on any exchange other than the NASDAQ Stock Market, Inc. (“NASDAQ”) are valued at the last sale price on the business day as of which such value is being determined. If there has been no sale on such day, the securities are valued at the mean of the most recent bid and asked prices on such day. Securities traded on the NASDAQ are valued at the NASDAQ Official Closing Price as determined by NASDAQ. Portfolio securities traded on more than one securities exchange are valued at the last sale price on the business day as of which such value is being determined at the close of the exchange representing the principal market for such securities. Portfolio securities traded in the over-the-counter market, but excluding securities traded on the NASDAQ, are valued at the closing bid prices. Short-term investments that mature in less than 60 days are valued at amortized cost, which approximates market value.
When market quotations are not readily available or when events occur that make established valuation methods unreliable, securities of the Funds may be valued in good faith by or under the direction of the Board of Trustees. These securities generally include, but are not limited to, restricted securities (securities which may not be publicly sold without registration under the Securities Act of 1933) for which a pricing service is unable to provide a market price; securities whose trading has been formally suspended; a security whose market price is not available from a pre-established pricing source; a security with respect to which an event has occurred that is most likely to materially affect the value of the security after the market has closed but before the calculation of the Funds’ NAV or make it difficult or impossible to obtain a reliable market quotation; and a security whose price, as provided by the pricing service, does not reflect the security’s “fair value.” As a general principle, the current “fair value” of a security would be the amount which the owner might reasonably expect to receive from the closing sale prices on the applicable exchange and fair value prices may not reflect the actual value of a security. A variety of factors may be considered in determining the fair value of such securities.
Valuing the Funds’ securities using fair value pricing will result in using prices for those securities that may differ from current market valuations. Use of fair value prices and certain market valuations could result in a difference between the prices used to calculate the Funds’ NAV and the prices used by the Index, which, in turn, could result in a difference between the Funds’ performance and the performance of the underlying Index.
24 | Semi-Annual Report (Unaudited) | June 30, 2010 | |
Table of Contents

B. Foreign Currency Translation and Foreign Investments
The Funds invest in foreign securities which may involve a number of risk factors and special considerations not present with investments in securities of U.S. Corporations.
The accounting records of the Funds are maintained in U.S. dollars. Portfolio securities and other assets and liabilities denominated in a foreign currency are translated to U.S. dollars at the prevailing rates of exchange at period end. Amounts related to the purchases and sales of securities and investment income are translated into U.S. dollars at the prevailing exchange rate on the respective dates of transactions. The effects of changes in foreign currency exchange rates on portfolio investments are included in the net realized and unrealized gains and losses on investments. Net gains and losses on foreign currency transactions include disposition of foreign currencies, and currency gains and losses between the accrual and receipt dates of portfolio investment income and between the trade and settlement dates of portfolio investment transactions.
C. Securities Transactions and Investment Income
Securities transactions are recorded as of the trade date. Realized gains and losses from securities transactions are recorded on the identified cost basis. Dividend income is recorded on the ex-dividend date. Interest income, if any, is recorded on the accrual basis.
D. Federal Tax Information*
The timing and character of income and capital gain distributions are determined in accordance with income tax regulations, which may differ from U.S. GAAP. Reclassifications are made to the Funds’ capital accounts for permanent tax differences to reflect income and gains available for distribution (or available capital loss carryforwards) under income tax regulations.
For the year ended December 31, 2009, permanent book and tax differences resulting primarily from differing treatment of foreign currency were identified and reclassified among the components of the Funds’ net assets as follows:
| Accumulated Net Investment Income/(Loss) | Accumulated Net Realized Gain/(Loss) | Paid-in-Capital | |||||||
Jefferies | TR/J CRB Global Commodity Equity Index Fund | $ | (6,601) | $ | 11,919 | $ | (5,318) | |||
Jefferies | TR/J CRB Global Agriculture Equity Index Fund | $ | 269 | $ | (269) | $ | – | |||
Jefferies | TR/J CRB Global Industrial Metals Equity Index Fund | $ | (746) | $ | 746 | $ | – | |||
Net investment income/(loss) and net realized gain/(loss), as disclosed on the Statement of Operations, and net assets were not affected by this reclassification.
Capital losses incurred after October 31 (“post-October losses”) within the taxable year are deemed to arise on the first business day of each Fund’s next taxable year.
The Funds intend to defer to their fiscal year ending December 31, 2010 the following losses recognized during the period from November 1, 2009 to December 31, 2009:
| Post-October Currency Losses | |||
Jefferies | TR/J CRB Global Commodity Equity Index Fund | $ | 4,166 | |
Jefferies | TR/J CRB Global Agriculture Equity Index Fund | $ | 2,653 | |
Jefferies | TR/J CRB Global Industrial Metals Equity Index Fund | $ | 1,010 | |
| * | The inception date of the Jefferies | TR/J CRB Wildcatters Exploration & Production Equity ETF was 1/20/10; therefore federal tax information for year ended December 31, 2009 is not applicable to this Fund |
E. Dividends and Distributions to Shareholders**
Dividends from net investment income of the Funds, if any, are declared and paid quarterly or as the Board of Trustees may determine from time to time. Distributions of net realized capital gains earned by the Funds, if any, are distributed at least annually.
Distributions from net investment income and capital gains are determined in accordance with income tax regulations, which may differ from U.S. GAAP. These differences are primarily due to differing treatments of income and gains on various investment securities held by the Funds, timing differences and differing characterization of distributions made by the Funds.
| www.jamfunds.com | 25 | |
Table of Contents
The tax character of the distributions paid was as follows:
| Period Ended December 31, 2009 Distributions paid from: Ordinary Income | |||
Jefferies | TR/J CRB Global Commodity Equity Index Fund | $ | 202,000 | |
Jefferies | TR/J CRB Global Agriculture Equity Index Fund | $ | 25,500 | |
Jefferies | TR/J CRB Global Industrial Metals Equity Index Fund | $ | – | |
As of December 31, 2009, the components of distributable earnings on a tax basis for the Funds were as follows:
| Jefferies | TR/J CRB Global Commodity Equity Index Fund | Jefferies | TR/J CRB Global Agriculture Equity Index Fund | Jefferies | TR/J CRB Global Industrial Metals Equity Index Fund | |||||||
Undistributed net investment income | $ | 59,091 | $ | 30,728 | $ | 2,652 | |||
Net unrealized appreciation on investments and translation of assets and liabilities denominated in foreign currencies | 2,980,292 | 264,763 | 308,163 | ||||||
Other Cumulative Effect of Timing Differences | (3,989) | (2,653) | (1,010) | ||||||
Total | $ | 3,035,394 | $ | 292,838 | $ | 309,805 | |||
The differences between book-basis and tax-basis are primarily due to the deferral of post-October losses and the differing treatment of certain other investments.
| ** | The inception date of the Jefferies | TR/J CRB Wildcatters Exploration & Production Equity ETF was 1/20/10; therefore dividends and distributions information for year ended December 31, 2009 is not applicable to this Fund. |
F. Income Taxes
No provision for income taxes is included in the accompanying financial statements, as the Funds intend to distribute to shareholders all taxable investment income and realized gains and otherwise comply with Subchapter M of the Internal Revenue Code applicable to regulated investment companies.
The Funds evaluate tax positions taken (or expected to be taken) in the course of preparing the Funds’ tax returns to determine whether these positions meet a “more-likely-than-not” standard that, based on the technical merits, have a more than fifty percent likelihood of being sustained by a taxing authority upon examination. A tax position that meets the “more-likely-than-not” recognition threshold is measured to determine the amount of benefit to recognize in the financial statements.
Management of the Funds analyzes all open tax years, as defined by the Statute of Limitations, for all major jurisdictions, including federal tax authorities and certain state tax authorities. As of and during the fiscal year ended December 31, 2009, the Funds did not have a liability for any unrecognized tax benefits. The Funds will file income tax returns in the U.S. federal jurisdiction and Colorado. For the year ended December 31, 2009, the Funds’ returns will be open to examination by the appropriate taxing authority.
G. Fair Value Measurements
A three-tier hierarchy has been established to measure fair value based on the extent of use of observable inputs as compared to unobservable inputs for disclosure purposes and requires additional disclosures about these valuations measurements. Inputs refer broadly to the assumptions that market participants would use in pricing a security. Observable inputs are inputs that reflect the assumptions market participants would use in pricing the security developed based on market data obtained from sources independent of the reporting entity. Unobservable inputs are inputs that reflect the reporting entity’s own assumptions about the assumptions market participants would use in pricing the security developed based on the best information available in the circumstances.
The three-tier hierarchy is summarized as follows:
| Level 1 - | quoted prices in active markets for identical securities | |
| Level 2 - | other significant observable inputs (including qouted prices for similar securities, interest rates, prepayment speeds, credit risk, etc.) | |
Level 3 - | significant unobservable inputs (including the Funds’ own assumptions in determining the fair value of investments) | |
26 | Semi-Annual Report (Unaudited) | June 30, 2010 | |
Table of Contents
Jefferies | TR/J CRB Global Commodity Equity Index Fund Assets:
| Investments in Securities at Value* | Level 1 - Quoted Prices | Level 2 - Other Significant | Level 3 - Significant Unobservable Inputs | Total | ||||||
Common Stocks | $ 58,079,539 | $ | – | $ | – | $ 58,079,539 | ||||
TOTAL | $ 58,079,539 | $ | – | $ | – | $ 58,079,539 | ||||
Jefferies | TR/J CRB Global Agriculture Equity Index Fund Assets:
| ||||||||||
| Investments in Securities at Value* | Level 1 - Quoted Prices | Level 2 - Other Significant | Level 3 - Significant Unobservable Inputs | Total | ||||||
Common Stocks | $ 3,402,586 | $ | – | $ | – | $ 3,402,586 | ||||
TOTAL | $ 3,402,586 | $ | – | $ | – | $ 3,402,586 | ||||
Jefferies | TR/J CRB Global Industrial Metals Equity Index Fund Assets:
| ||||||||||
| Investments in Securities at Value* | Level 1 - Quoted Prices | Level 2 - Other Significant | Level 3 - Significant Unobservable Inputs | Total | ||||||
Common Stocks | $ 3,327,521 | $ | – | $ | – | $ 3,327,521 | ||||
TOTAL | $ 3,327,521 | $ | – | $ | – | $ 3,327,521 | ||||
Jefferies | TR/J CRB Wildcatters Exploration & Production Equity ETF:
| ||||||||||
| Investments in Securities at Value* | Level 1 - Quoted Prices | Level 2 - Other Significant | Level 3 - Significant Unobservable Inputs | Total | ||||||
Common Stocks | ||||||||||
Canada | $ 1,328,291 | $ | – | $ | – | $ 1,328,291 | ||||
United States | 2,238,165 | – | 2,506 | 2,240,671 | ||||||
TOTAL | $ 3,566,456 | $ | – | $ | 2,506 | $ 3,568,962 | ||||
| * | For detailed country descriptions, see the accompanying Schedule of Investments. |
All securities of the Funds, except for Jefferies | TR/J CRB Wildcatters Exploration & Production Equity ETF, were valued using either Level 1 or Level 2 inputs during the six months ended June 30, 2010. Thus a reconciliation of assets in which significant unobservable inputs (Level 3) were used is not applicable for these Funds.
The following is a reconciliation of assets in which significant unobservable inputs (Level 3) were used in determining fair value:
Jefferies I TR/J CRB Wildcatters Exploration & Production Equity ETF:
| Investments in Securities | Balance as of December 31, 2009 | Realized gain/ (loss) | Change in unrealized appreciation/ (depreciation) | Net purchases/ (sales) | Transfers in and/or out of Level 3 | Balance as of June 30, 2010 | ||||||||||||
United States | $ | – | $ | – | $ | – | $ | – | $ | 2,506 | $ | 2,506 | ||||||
Total | $ | – | $ | – | $ | – | $ | – | $ | 2,506 | $ | 2,506 | ||||||
| www.jamfunds.com | 27 | |
Table of Contents
3. INVESTMENT ADVISORY FEE AND OTHER AFFILIATED TRANSACTIONS
ALPS Advisors, Inc. (the “Investment Adviser”) acts as the Funds’ investment adviser pursuant to an Advisory Agreement with the Trust on behalf of the Funds (the “Advisory Agreement”). Pursuant to the Advisory Agreement, the Funds pay the Investment Adviser a unitary fee for the services and facilities it provides payable on a monthly basis at the annual rate of 0.65% of the Funds’ average daily net assets. From time to time, the Investment Adviser may waive all or a portion of its fee.
Out of the unitary management fee, the Investment Adviser pays substantially all expenses of the Funds, including the fees of the Sub-Adviser, the licensing fee of the Index provider, and the cost of transfer agency, custody, fund administration, legal, audit and other services, except for interest expenses, distribution fees or expenses, brokerage expenses, taxes and extraordinary expenses not incurred in the ordinary course of the Funds’ business. In addition, the Investment Adviser’s unitary management fee is designed to compensate the Investment Adviser for providing services for the Funds.
Arrow Investment Advisors, LLC acts as the Funds’ sub-adviser (the “Sub-Adviser”) pursuant to a Sub-Advisory Agreement with the Investment Adviser (the “Sub-Advisory Agreement”). According to this agreement, the Investment Adviser pays the Sub-Adviser on a monthly basis, an annual rate of 0.05% of the Funds’ average daily net assets. The Investment Adviser will pay the Sub-Adviser a minimum of $40,000 per year per Fund.
ALPS Fund Services, Inc. (“ALPS”), an affiliate of the Investment Adviser, is the administrator of the Funds.
The Bank of New York Mellon is the custodian, fund accounting agent and transfer agent for the Funds.
Each Trustee who is not an officer or employee of the Investment Adviser, any sub-adviser or any of their affiliates (“Independent Trustees”) is paid a quarterly retainer of $3,500, $1,500 for each regularly scheduled Board meeting attended and $750 for each special meeting held outside of regularly scheduled meetings.
4. PURCHASES AND SALES OF SECURITIES
For the period ended June 30, 2010, the cost of purchases and proceeds from sales of investment securities, excluding short-term investments and in-kind transactions, were as follows:
| Purchases | Sales | |||||||
Jefferies | TR/J CRB Global Commodity Equity Index Fund | $ | 4,086,168 | $ | 5,811,713 | ||||
Jefferies | TR/J CRB Global Agriculture Equity Index Fund | 337,131 | 576,084 | ||||||
Jefferies | TR/J CRB Global Industrial Metals Equity Index Fund | 478,268 | 838,697 | ||||||
Jefferies | TR/J CRB Wildcatters Exploration & Production Equity ETF | 680,630 | 450,614 | ||||||
For the period ended June 30, 2010, the cost of in-kind purchases and proceeds from in-kind sales were as follows:
| ||||||||
| Purchases | Sales | |||||||
Jefferies | TR/J CRB Global Commodity Equity Index Fund | $ | 10,910,612 | $ | 8,080,294 | ||||
Jefferies | TR/J CRB Global Agriculture Equity Index Fund | 499,516 | 250,231 | ||||||
Jefferies | TR/J CRB Global Industrial Metals Equity Index Fund | 4,345,219 | 3,544,205 | ||||||
Jefferies | TR/J CRB Wildcatters Exploration & Production Equity ETF | 4,559,646 | 769,745 | ||||||
Gains on in-kind transactions are not considered taxable for federal income tax purposes.
28 | Semi-Annual Report (Unaudited) | June 30, 2010 | |
Table of Contents
As of June 30, 2010, the costs of investments for federal income tax purposes and accumulated net unrealized appreciation/(depreciation) on investments were as follows:
| Jefferies | TR/J CRB Global Commodity Equity Index Fund | Jefferies | TR/J CRB Global Agriculture Equity Index Fund | Jefferies | TR/J CRB Index Fund | Jefferies | TR/J CRB Wildcatters Exploration & Production Equity ETF | |||||||||
Gross Appreciation (excess of value over tax cost) | $ | 1,061,013 | $ | 50,201 | $ | (31,149) | $ | 125,865 | ||||
Gross Depreciation (excess of tax cost over value) | (11,050,226) | (639,995) | (684,328) | (643,488) | ||||||||
Net Unrealized Appreciation | $ | (9,989,213) | $ | (589,794) | $ | (715,477) | $ | (517,623) | ||||
Cost of investments for income tax purposes | $ | 68,068,752 | $ | 3,992,380 | $ | 4,042,999 | $ | 4,086,585 | ||||
5. CAPITAL SHARE TRANSACTIONS
Shares are created and redeemed by the Fund only in Creation Unit size aggregations of 50,000. Only Authorized Participants are permitted to purchase or redeem Creation Units from the Fund. Such transactions are generally permitted on an in-kind basis, with a balancing cash component to equate the transaction to the net asset value per unit of the Fund on the transaction date. Cash may be substituted equivalent to the value of certain securities generally when they are not available in sufficient quantity for delivery, not eligible for trading by the Authorized Participant or as a result of other market circumstances.
6. INDEMNIFICATIONS
Under the Trust’s organizational documents, its officers and Trustees are indemnified against certain liability arising out of the performance of their duties to the Trust. Additionally, in the normal course of business, the Trust enters into contracts with service providers that contain general indemnification clauses. The Trust’s maximum exposure under these arrangements is unknown, as this would involve future claims that may be made against the Trust that have not yet occurred.
7. SUBSEQUENT EVENTS
Management has evaluated whether any events or transactions occurred subsequent to June 30, 2010 through August 30, 2010, the date of issuance of the Funds’ financial statements and determined that there were no other material events or transactions that would require recognition or disclosure in the Funds’ financial statements.
| www.jamfunds.com | 29 | |
Table of Contents

PROXY VOTING POLICIES AND PROCEDURES
A description of the Funds’ proxy voting policies and procedures used in determining how to vote for proxies and information regarding how each of the Funds voted proxies related to portfolio securities during the most recent 12-month period ended June 30th is available without charge, (1) on the Securities and Exchange Com mission’s (“SEC”) website at http://www.sec.gov; (2) upon request, by calling 1-866-513-5856; and (3) on the Trust’s website located at http://www.alpsetfs.com.
PORTFOLIO HOLDINGS
The Trust will file its complete schedule of portfolio holdings with the SEC for the first and third quarters of each fiscal year on Form N-Q. The Trust’s Form N-Q will be available (1) by calling 1-866-513-5856, (2) on the Trust’s website located at http://www.alpsetfs.com, (3) on the SEC’s website at http://www.sec.gov, and (4) for review and copying at the SEC’s Public Reference Room (“PRR”) in Washington D.C. Information regarding the operation of the PRR may be obtained by calling 1-202-551-8090.
TAX INFORMATION
Tax Designations***
The Funds designate the following amounts for the fiscal year ended December 31, 2009:
| Jefferies | TR/J CRB Global Commodity Equity Index Fund | ||
Qualified Dividend Income | 100.00% | |
Corporate Dividends Received Deduction | 82.39% | |
| Jefferies | TR/J CRB Global Agriculture Equity Index Fund | ||
Qualified Dividend Income | 93.89% | |
Corporate Dividends Received Deduction | 93.89% | |
| Jefferies | TR/J CRB Global Industrial Metals Equity Index Fund | ||
Qualified Dividend Income | 0.00% | |
Corporate Dividends Received Deduction | 0.00% | |
| *** | The inception date of the | Jefferies TR/J CRB Wildcatters Exploration & Production Equity was 1/20/10; therefore tax designations for year ended December 31, 2009 are not applicable to this Fund. |
30 | Semi-Annual Report (Unaudited) | June 30, 2010 | |
Table of Contents

At an in-person meeting held on December 14, 2009, the Board of Trustees of the Trust (the “Board”), including the Trustees who are not “interested persons” of the Trust within the meaning of the 1940 Act, as amended (the “Independent Trustees”), evaluated proposals to approve the Advisory Agreement between the Trust and the Investment Adviser with respect to the Jefferies I TR/J CRB Wildcatters Exploration & Production Equity ETF (the “Fund”). At the same in person meeting, the Board also evaluated the proposal to approve the Sub-Advisory Agreement among the Investment Adviser, the Trust and the Sub-Adviser with respect to the Fund. The Independent Trustees also met separately with their independent legal counsel to consider the Advisory and Sub-Advisory Agreements.
In evaluating the Advisory and Sub-Advisory Agreements, the Board considered various factors, including (i) the nature, extent and quality of the services expected to be provided by the Investment Adviser and Sub-Adviser with respect to the Fund under the Advisory and Sub-Advisory Agreements, (ii) costs to the Investment Adviser and Sub-Adviser of their respective services; and (iii) the extent to which economies of scale would be realized if and as the Fund grows and whether the fee level in the Advisory and Sub-Advisory Agreements reflects these economies of scale.
The Board of Trustees, including a majority of the Independent Trustees, determined that approval of the Advisory and Sub-Advisory Agreements were in the best interests of the Fund. The Board of Trustees, including the Independent Trustees, did not identify any single factor or group of factors as all important or controlling and considered all factors together. In evaluating whether to approve the Advisory and Sub-Advisory Agreements for the Fund, the Board considered numerous factors, as described below.
With respect to the nature, extent and quality of the services to be provided by the Investment Adviser under the Advisory Agreement and the Sub-Adviser under the Sub-Advisory Agreement, the Board considered and reviewed information concerning the services proposed to be provided under the Advisory and the Sub-Advisory Agreements, the proposed investment parameters of the index for the Fund, financial information regarding the Investment Adviser, its parent company and the Sub-Adviser, information describing the Investment Adviser’s and Sub-Adviser’s current organizations and the background and experience of the persons who would be responsible for the day-to-day management of the Fund, the anticipated financial support of the Fund and the nature and quality of services provided to other exchange-traded (“ETFs”), open-end and closed-end funds by the Investment Adviser and nature and quality of services provided to investment products by the Sub-Adviser. Based upon their review, the Board concluded that the Investment Adviser was qualified to oversee the services to be provided by other service providers and that the services to be provided by the Investment Adviser to the Fund are expected to be satisfactory. The Board also concluded that the Sub-Adviser was qualified to manage the Fund and that the services to be provided by the Sub-Adviser to the Fund are expected to be satisfactory.
With respect to the costs of services to be provided and profits to be realized by the Investment Adviser and Sub-Adviser, the Board considered the resources involved in managing the Fund as well as the fact that the Adviser agreed to pay all of the Fund’s expenses (except for interest expenses, distribution fees or expenses, brokerage expenses, taxes and extraordinary expenses such as litigation and other expenses not incurred in the ordinary course of the Fund’s business) out of the unitary advisory fee. The Board also took into account payments that Jefferies Asset Management will make to ALPS pursuant to the Business and Expense Agreements and the effect of these payments on the profitability of the Fund to ALPS. Based on its review, the Board concluded that the expected profitability of the Fund to the Adviser and the Sub-Adviser, respectively, were not unreasonable.
The Board also reviewed information provided by the Investment Adviser showing the proposed advisory fees for the Fund as compared to those of a peer group of ETFs compiled using Lipper comparative fee data. The Board noted the services to be provided by the Adviser for the annual advisory fee of 0.65% of the Fund’s average daily net assets. The Board also considered that the advisory fee was a unitary one and that, as set forth above, the Investment Adviser had agreed to pay all of the Fund’s expenses (except for interest expenses, marketing fees, distribution fees or expenses, brokerage expenses, taxes and extraordinary expenses such as litigation and other expenses not incurred in the ordinary course of the Fund’s business) out of the unitary fee. The Board considered that, taking into account the impact of the Fund’s unitary advisory fee, the Fund’s expense ratios were expected to be within range of the expense ratios of the peer group of ETFs provided by the Adviser. The Board considered the extent to which economies of scale would be realized as the Fund grows and whether fee levels reflect a reasonable sharing of such economies of scale for the benefit of Fund investors. Because the Fund is newly organized, the Board reviewed the Fund’s proposed unitary advisory fee and anticipated expenses and determined to review economies of scale in the future when the Fund had attracted assets.
The Board also considered other benefits that may be realized by the Adviser and/or the Sub-Adviser from their relationship with the Fund.
In voting to approve the Advisory and Sub-Advisory Agreements, the Trustees, including the Independent Trustees, concluded that the terms of the Advisory and Sub-Advisory Agreements are reasonable and fair in light of the services to be performed, the fees paid by certain other funds, expenses to be incurred and such other matters as the Trustees considered relevant in the exercise of their reasonable business judgment.
| www.jamfunds.com | 31 | |
Table of Contents

32 | Semi-Annual Report (Unaudited) | June 30, 2010 | |
Table of Contents

Table of Contents
Table of Contents

ALPS Equal Sector Weight ETF
| PAGE | ||||
| 2 | ||||
Contents | 3 | |||
| 6 | ||||
| 8 | ||||
| 9 | ||||
| 10 | ||||
| 11 | ||||
| 12 | ||||
| 13 | ||||
| 20 | ||||
| ALPS Equal Sector Weight ETF | www.alpsetfs.com |

Table of Contents
|
| |


Dear Shareholders:
When ALPS launched its ETF Trust in 2008 our goal was to bring innovative solutions to the ETF industry that provide investors with access to a unique market segment or strategy. The ALPS Equal Sector Weight ETF is the world’s first ETF to provide access to an Equal Sector Strategy.
Sectors are one of the most important drivers of risk and return in a portfolio. An equal sector strategy can minimize the negative impact of any one sector on the entire portfolio. At the same time by offering meaningful exposure to each sector of the market, it allows investors the ability to participate in market rallies regardless of where they occur.
In the pages that follow our Fund managers have provided a performance overview. We thank you for your investment and for being a EQL shareholder.

Thomas A. Carter*
President, ALPS ETF Trust
| * | Registered representative of ALPS Distributors, Inc. |
Ordinary brokerage commissions apply.
Semi-Annual Report (Unaudited) | June 30, 2010 | 2 |  |
Table of Contents
June 30, 2010 (Unaudited)
INVESTMENT OBJECTIVE
The Fund seeks investment results that replicate as closely as possible, before fees and expenses, the performance of the Banc of America Securities – Merrill Lynch Equal Sector Weight Index (the “Underlying Index”). The Fund’s investment objective is not fundamental and may be changed by the Board of Trustees without shareholder approval.
PRIMARY INVESTMENT STRATEGIES
The Adviser will seek to match the performance of the Underlying Index. The Underlying Index is an index of indexes comprised in equal proportions of the nine Select Sector SPDR Indexes (“The Underlying Sector Indexes”). In order to track the securities in the Underlying Index, the Fund will use a “fund of funds” approach, and seek to achieve its investment objective by investing at least 90% of its total assets in the shares of Select Sector SPDR exchange-traded funds (each, an “Underlying Sector ETF” and collectively the “Underlying Sector ETFs”) that track the Underlying Sector indexes of which the Underlying Index is comprised.
PERFORMANCE OVERVIEW
For the six months ended June 30, 2010, the Fund outperformed its benchmark. Through the first two quarters of the year the Fund declined 6.73% while the Fund’s benchmark declined 7.63% and the S&P 500 declined 6.65%. While all nine sectors of the S&P 500 declined in the period, the early cycle Industrial and Consumer Discretionary stocks fared the best, declining 0.54% and 1.64%, respectively. Technology and natural resource stocks performed the worst, with the Technology, Energy and Materials sectors declining 10.29%, 12.03% and 13.71%, respectively.
Compared to the S&P 500 the Fund benefited from its relative overweight in the Industrials and Consumer Discretionary sectors and was negatively impacted by its underweight in the Financial sector, which was the 4th best performing sector in the first six months of the year (-3.74%). Despite the Fund having an overweight in both the Utilities and Materials sectors, which hurt the performance of the Fund relative to the S&P 500, EQL benefited from an underweight in Technology. Overall, the Fund’s sector weights relative to the S&P 500 resulted in positive outperformance above the index in 6 of the 9 sectors.
| 3 | ALPS Equal Sector Weight ETF | www.alpsetfs.com |

Table of Contents
|
Performance Overview | |
PERFORMANCE as of June 30, 2010 |
| ||||||||||||||
| 1 Month | 3 Month | 6 Month | YTD | Since Inception Cumulative* | |||||||||||
ALPS Equal Sector Weight ETF | |||||||||||||||
NAV | -5.12 | % | -11.15 | % | -6.73 | % | -6.73 | % | 17.15 | % | |||||
Market Price** | -5.09 | % | -11.21 | % | -6.85 | % | -6.85 | % | 17.30 | % | |||||
Banc of America Securities | -5.27 | % | -11.61 | % | -7.63 | % | -7.63 | % | 15.14 | % | |||||
S&P 500 Total Return Index | -5.23 | % | -11.43 | % | -6.65 | % | -6.65 | % | 17.03 | % | |||||
Total Expense Ratio | 0.55 | % | |||||||||||||
Performance data quoted represents past performance. Past performance does not guarantee future results. Current performance may be higher or lower than actual data quoted. Call 1.866.675.2639 or visit www.alpsetfs.com for current month end performance. The investment return and principal value of an investment will fluctuate so that an investor’s shares, when redeemed, may be worth more or less than their original cost.
| * | The Fund commenced Investment Operations on July 06, 2009 with an Inception Date, the first day of trading on the Exchange, of July 7, 2009. |
| ** | Market Price is based on the midpoint of the bid/ask spread at 4 p.m. ET and does not represent the returns an investor would receive if shares were traded at other times. |
S&P 500 Index: the Standard & Poor’s composite index of 500 stocks, a widely recognized, unmanaged index of common stock prices.
The following table shows the sector weights of both the Fund and the S&P 500 as of June 30, 2010:
SECTOR WEIGHTING COMPARISON as of June 30, 2010 | ||||
| EQL | S&P 500 | |||
Consumer Staples (XLP) | 11.5% | 11.5% | ||
Healthcare (XLV) | 11.5 | 12.1 | ||
Utilities (XLU) | 11.3 | 3.7 | ||
Financials (XLF) | 11.2 | 16.3 | ||
Materials (XLB) | 11.0 | 3.4 | ||
Industrials (XLI) | 11.0 | 10.3 | ||
Technology (XLK) | 11.0 | 21.9 | ||
Consumer Discretionary (XLY) | 10.8 | 10.1 | ||
Energy (XLE) | 10.7 | 10.7 | ||
Source: S&P 500.
Semi-Annual Report (Unaudited) | June 30, 2010 | 4 | |
Table of Contents
Performance Overview
June 30, 2010 (Unaudited)
SECTOR ALLOCATION as of June 30, 2010
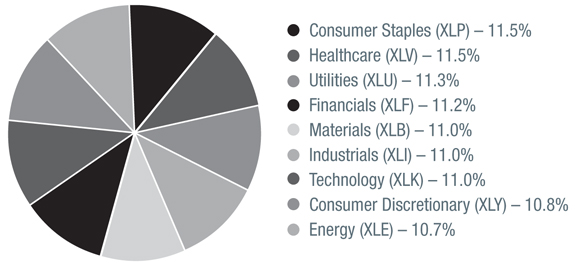
GROWTH OF $10,000 as of June 30, 2010
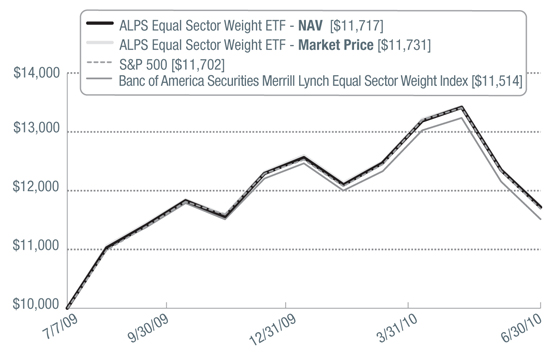
| 5 | ALPS Equal Sector Weight ETF | www.alpsetfs.com |
Table of Contents
|
For the Period Ended June 30, 2010 (Unaudited) | |
Shareholder Expense Example: As a shareholder of the Fund, you incur two types of costs: (1) transaction costs which may include creation and redemption fees or brokerage charges, and (2) ongoing costs, including management fees and other Fund expenses. These examples are intended to help you understand your ongoing costs (in dollars) of investing in the Fund and to compare these costs with the ongoing costs of investing in other funds. It is based on an investment of $1,000 invested at January 1, 2010 and held through the period ended June 30, 2010.
Actual Return: The first line of the table provides information about actual account values and actual expenses. You may use the information in this table, together with the amount you invested, to estimate the expenses that you incurred over the period. Simply divide your account value by $1,000 (for example, an $8,600 account value divided by $1,000 = 8.6), then multiply the result by the number in the first line under the heading entitled “Expenses Paid During the Period” to estimate the expenses attributable to your investment during this period.
Hypothetical 5% Return: The second line of the table provides information about hypothetical account values and hypothetical expenses based on the Fund’s actual expense ratio and an assumed rate of return of 5% per year before expenses, which is not the Fund’s actual return. The hypothetical account values and expenses may not be used to estimate the actual ending account balance or expenses you paid for the period. You may use this information to compare ongoing costs of investing in the Fund and other funds. To do so, compare this 5% hypothetical example with the 5% hypothetical examples that appear in the shareholder reports of the other funds.
The expenses shown in the table are meant to highlight ongoing Fund costs only and do not reflect any transaction costs, such as creation and redemption fees, or brokerage charges. Therefore, the second table is useful in comparing ongoing costs only, and will not help you determine the relative total costs of owning different funds. In addition, if these costs were included, your costs would have been higher.
| Beginning Account Value 1/01/10 | Ending Account Value 6/30/10 | Expense Ratio | Expenses Paid 1/01/10- | |||||
Actual | $1,000.00 | $ 932.70 | 0.34% | $1.63 | ||||
Hypothetical | $1,000.00 | $1,023.11 | 0.34% | $1.71 | ||||
| (a) | Expenses are equal to the Fund’s annualized expense ratio multiplied by the average account value over the period, multiplied by the number of days in the most recent fiscal half year (181), then divided by 365. |
Semi-Annual Report (Unaudited) | June 30, 2010 | 6 | |
Table of Contents
This Page Intentionally Left Blank
Table of Contents
|
| |
| Security Description | Shares | Market Value | |||
EXCHANGE TRADED FUNDS (99.95%) | |||||
Consumer Discretionary (10.78%) | |||||
Consumer Discretionary Select | 127,985 | $ | 3,728,203 | ||
Consumer Staples (11.49%) | |||||
Consumer Staples Select Sector | 155,794 | 3,972,747 | |||
Energy (10.74%) | |||||
Energy Select Sector SPDR Fund | 74,784 | 3,715,269 | |||
Financials (11.19%) | |||||
Financial Select Sector SPDR Fund | 280,195 | 3,869,493 | |||
Healthcare (11.45%) | |||||
Health Care Select Sector SPDR Fund | 140,579 | 3,960,111 | |||
Industrials (11.00%) | |||||
Industrial Select Sector SPDR Fund | 138,626 | 3,805,284 | |||
Materials (11.01%) | |||||
Materials Select Sector SPDR Fund | 134,265 | 3,807,755 | |||
Technology (10.99%) | |||||
Technology Select Sector SPDR Fund | 186,213 | 3,798,745 | |||
Utilities (11.30%) | |||||
Utilities Select Sector SPDR Fund | 138,297 | 3,908,273 | |||
TOTAL EXCHANGE TRADED FUNDS (Cost $36,411,946) | 34,565,880 | ||||
TOTAL INVESTMENTS (99.95%) (Cost $36,411,946) | 34,565,880 | ||||
NET OTHER ASSETS AND LIABILITIES (0.05%) | 18,467 | ||||
NET ASSETS (100.00%) | $ | 34,584,347 | |||
See Notes to Financial Statements.
Semi-Annual Report (Unaudited) | June 30, 2010 | 8 | |
Table of Contents
Statement of Assets and Liabilities
June 30, 2010 (Unaudited)
ASSETS: | |||
Investments, at value | $ | 34,565,880 | |
Cash | 27,209 | ||
Receivable for shares sold | 1,500,547 | ||
Total Assets | 36,093,636 | ||
LIABILITIES: | |||
Payable for investments purchased | 1,500,500 | ||
Payable to advisor | 8,789 | ||
Total Liabilities | 1,509,289 | ||
NET ASSETS | $ | 34,584,347 | |
NET ASSETS CONSIST OF: | |||
Paid-in capital | $ | 36,170,349 | |
Overdistributed net investment income | (3,597) | ||
Accumulated net realized gain on investments | 263,661 | ||
Net unrealized depreciation on investments | (1,846,066) | ||
NET ASSETS | $ | 34,584,347 | |
INVESTMENTS, AT COST | $ | 36,411,946 | |
PRICING OF SHARES | |||
Net Assets | $ | 34,584,347 | |
Shares of beneficial interest outstanding (Unlimited number of shares authorized, par value $0.01 per share) | 1,200,000 | ||
Net Asset Value, offering and redemption price per share | $ | 28.82 | |
See Notes to Financial Statements.
| 9 | ALPS Equal Sector Weight ETF | www.alpsetfs.com |
Table of Contents
|
For the Six Months Ended June 30, 2010 (Unaudited) | |
INVESTMENT INCOME: | ||
Dividends | $ 246,031 | |
Total Investment Income | 246,031 | |
EXPENSES: | ||
Investment advisory fee | 45,272 | |
Total Expenses before Reimbursement | 45,272 | |
Expenses Reimbursed by: | (3,671) | |
NET EXPENSES | 41,601 | |
NET INVESTMENT INCOME | 204,430 | |
Net realized gain on investments | 258,034 | |
Net change in unrealized depreciation on investments | (3,317,655) | |
NET REALIZED AND UNREALIZED LOSS ON INVESTMENTS | (3,059,621) | |
NET DECREASE IN NET ASSETS RESULTING FROM OPERATIONS | $ (2,855,191) | |
See Notes to Financial Statements.
Semi-Annual Report (Unaudited) | June 30, 2010 | 10 | |
Table of Contents
Statements of Changes in Net Assets
| For the Six Months Ended June 30, 2010 (Unaudited) | For the Period July 7, 2009 (Inception) through December 31, 2009 | ||||||
OPERATIONS: | |||||||
Net investment income | $ | 204,430 | $ | 124,209 | |||
Net realized gain on investments | 258,034 | 9,220 | |||||
Net change in unrealized appreciation/(depreciation) on investments | (3,317,655 | ) | 1,471,589 | ||||
Net increase/(decrease) in net assets resulting from operations | (2,855,191 | ) | 1,605,018 | ||||
DISTRIBUTIONS TO SHAREHOLDERS: | |||||||
From net investment income | (208,068 | ) | (124,168) | ||||
From net realized gains on investments | – | (3,593) | |||||
Total distributions | (208,068 | ) | (127,761) | ||||
SHARE TRANSACTIONS: | |||||||
Proceeds from sale of shares | 25,178,679 | 12,530,970 | |||||
Cost of shares redeemed | (1,539,300 | ) | – | ||||
Net increase from share transactions | 23,639,379 | 12,530,970 | |||||
Net increase in net assets | 20,576,120 | 14,008,227 | |||||
NET ASSETS: | |||||||
Beginning of period | 14,008,227 | – | |||||
End of period* | $ | 34,584,347 | $ | 14,008,227 | |||
* Including (overdistributed)/undistributed net investment income of: | $ | (3,597 | ) | $ | 41 | ||
OTHER INFORMATION: | |||||||
SHARE TRANSACTIONS: | |||||||
Beginning shares | 450,000 | – | |||||
Shares sold | 800,000 | 450,000 | |||||
Shares redeemed | (50,000 | ) | – | ||||
Shares outstanding, end of period | 1,200,000 | 450,000 | |||||
See Notes to Financial Statements.
| 11 | ALPS Equal Sector Weight ETF | www.alpsetfs.com |
Table of Contents
|
For a Share Outstanding Throughout the Period Presented | |
| For the Six Months Ended June 30, 2010 (Unaudited) | For the Period July 7, 2009 (Inception) through December 31, 2009 | ||||||
NET ASSET VALUE, BEGINNING OF PERIOD | $ | 31.13 | $ | 25.04 | |||
INCOME/(LOSS) FROM OPERATIONS: | |||||||
Net investment income | 0.22 | 0.31 | |||||
Net realized and unrealized gain/(loss) on investments | (2.30 | ) | 6.10 | ||||
Total from Investment Operations | (2.08 | ) | 6.41 | ||||
LESS DISTRIBUTIONS: | |||||||
From net investment income | (0.23 | ) | (0.31) | ||||
From capital gains | – | (0.01) | |||||
Total Distributions | (0.23 | ) | (0.32) | ||||
NET INCREASE/(DECREASE) IN NET ASSET VALUE | (2.31 | ) | 6.09 | ||||
NET ASSET VALUE, END OF PERIOD | $ | 28.82 | $ | 31.13 | |||
TOTAL RETURN(a) | (6.73 | )% | 25.60% | ||||
RATIOS/ SUPPLEMENTAL DATA: | |||||||
Net assets, end of period (in 000s) | $ | 34,584 | $ | 14,008 | |||
RATIOS TO AVERAGE NET ASSETS: | |||||||
Net investment income including reimbursement/waiver | 1.67 | %(b) | 2.60%(b) | ||||
Net investment income excluding reimbursement/waiver | 1.64 | %(b) | 2.57%(b) | ||||
Operating expenses including reimbursement/waiver | 0.34 | %(b) | 0.34%(b) | ||||
Operating expenses excluding reimbursement/waiver | 0.37 | %(b) | 0.37%(b) | ||||
PORTFOLIO TURNOVER RATE(c) | 3 | % | 4% | ||||
| (a) | Total return is calculated assuming an initial investment made at the net asset value at the beginning of the period and redemption at the net asset value on the last day of the period. The return presented does not reflect the deduction of taxes that a shareholder would pay on Fund distributions or the redemption or sale of Fund shares. Total return calculated for a period of less than one year is not annualized. |
| (b) | Annualized. |
| (c) | Portfolio turnover is not annualized and does not include securities received or delivered from processing creations or redemptions. |
See Notes to Financial Statements.
Semi-Annual Report (Unaudited) | June 30, 2010 | 12 | |
Table of Contents
June 30, 2010 (Unaudited)
1. ORGANIZATION
The ALPS ETF Trust (the “Trust”) is an open-end management investment company organized as a Delaware statutory trust on September 13, 2007 and is registered with the Securities and Exchange Commission (“SEC”) under the Investment Company Act of 1940, as amended (the “1940 Act”). As of June 30, 2010, the Trust consists of ten separate portfolios. Each portfolio represents a separate series of the Trust. This report pertains solely to the ALPS Equal Sector Weight ETF (the “Fund”), which commenced Investment operations on July 6, 2009 and began trading on the exchange on July 7, 2009.
The Fund’s Shares are listed on the NYSE Arca. Unlike conventional mutual funds, the Fund issues and redeems Shares on a continuous basis, at NAV, only in large specified blocks of 50,000 Shares, each of which is called a “Creation Unit.” Creation Units are issued and redeemed principally in-kind for securities included in a specified index. Except when aggregated in Creation Units, Shares are not redeemable securities of the Fund. The investment objective of the Fund is to seek investment results that correspond generally to the price and yield (before the Fund’s fees and expenses) of the Banc of America Securities Merrill Lynch Equal Sector Weight Index.
2. SIGNIFICANT ACCOUNTING POLICIES
The following is a summary of significant accounting policies consistently followed by the Fund in the preparation of the financial statements. The accompanying financial statements were prepared in accordance with accounting principles generally accepted in the United States of America (“U.S. GAAP”). The preparation of financial statements in conformity with U.S. GAAP requires management to make certain estimates and assumptions that affect the reported amounts of assets and liabilities and disclosures of contingent assets and liabilities at the date of the financial statements and the reported amounts of revenue and expenses during the period. Actual results could differ from those estimates.
A. Portfolio Valuation
The Fund’s net asset value (“NAV”) is determined daily, as of the close of regular trading on the New York Stock Exchange (“NYSE”), normally 4:00 p.m. Eastern time, on each day the NYSE is open for trading. The NAV is computed by dividing the value of all assets of the Fund (including accrued interest and dividends), less all liabilities (including accrued expenses and dividends declared but unpaid), by the total number of shares outstanding.
The Fund’s investments are valued at market value or, in the absence of market value with respect to any portfolio securities, at fair value according to procedures adopted by the Trust’s Board of Trustees. Portfolio securities listed on any
| 13 | ALPS Equal Sector Weight ETF | www.alpsetfs.com |
Table of Contents
|
Notes to Financial Statements | |
exchange other than the NASDAQ Stock Market, Inc. (“NASDAQ”) are valued at the last sale price on the business day as of which such value is being determined. If there has been no sale on such day, the securities are valued at the mean of the most recent bid and asked prices on such day. Securities traded on the NASDAQ are valued at the NASDAQ Official Closing Price as determined by NASDAQ. Short-term investments that mature in less than 60 days are valued at amortized cost, which approximates market value.
When market quotations are not readily available or when events occur that make established valuation methods unreliable, securities of the Fund may be valued in good faith by or under the direction of the Board of Trustees. These securities generally include, but are not limited to, restricted securities (securities which may not be publicly sold without registration under the Securities Act of 1933) for which a pricing service is unable to provide a market price; securities whose trading has been formally suspended; a security whose market price is not available from a pre-established pricing source; a security with respect to which an event has occurred that is most likely to materially affect the value of the security after the market has closed but before the calculation of the Fund’s NAV or make it difficult or impossible to obtain a reliable market quotation; and a security whose price, as provided by the pricing service, does not reflect the security’s “fair value.” As a general principle, the current “fair value” of a security would be the amount which the owner might reasonably expect to receive from the closing sale prices on the applicable exchange and fair value prices may not reflect the actual value of a security. A variety of factors may be considered in determining the fair value of such securities.
Valuing the Fund’s securities using fair value pricing will result in using prices for those securities that may differ from current market valuations. Use of fair value prices and certain market valuations could result in a difference between the prices used to calculate a Fund’s NAV and the prices used by the Index, which, in turn, could result in a difference between a Fund’s performance and the performance of the Index.
B. Securities Transactions and Investment Income
Securities transactions are recorded as of the trade date. Realized gains and losses from securities transactions are recorded on the identified cost basis. Dividend income is recorded on the ex-dividend date. Interest income, if any, is recorded on the accrual basis.
Semi-Annual Report (Unaudited) | June 30, 2010 | 14 | |
Table of Contents
Notes to Financial Statements
June 30, 2010 (Unaudited)
C. Federal Tax Information
The timing and character of income and capital gain distributions are determined in accordance with income tax regulations, which may differ from U.S. GAAP. Reclassifications are made to the Fund’s capital accounts for permanent tax differences to reflect income and gains available for distribution (or available capital loss carryforwards) under income tax regulations.
For the year ended December 31, 2009, there were no permanent book and tax differences.
D. Dividends and Distributions to Shareholders
Dividends from net investment income of the Fund, if any, are declared and paid quarterly or as the Board of Trustees may determine from time to time. Distributions of net realized capital gains earned by the Fund, if any, are distributed at least annually.
Distributions from net investment income and capital gains are determined in accordance with income tax regulations, which may differ from U.S GAAP. These differences are primarily due to differing treatments of income and gains on various investment securities held by the Fund, timing differences and differing characterization of distributions made by the Fund.
The tax character of the distributions paid was as follows:
| Period Ended December 31, 2009 | ||
Distributions paid from: | ||
Ordinary Income | $ 127,761 | |
Total | $ 127,761 |
As of December 31, 2009, the components of distributable earnings on a tax basis for the Fund were as follows:
Undistributed net investment income | $ 5,753 | |
Net unrealized appreciation on investments | 1,471,504 | |
Total | $ 1,477,257 |
The differences between book-basis and tax-basis are primarily due to the deferral of losses from wash sales.
| 15 | ALPS Equal Sector Weight ETF | www.alpsetfs.com |
Table of Contents
|
Notes to Financial Statements | |
E. Income Taxes
No provision for income taxes is included in the accompanying financial statements, as the Fund intends to distribute to shareholders all taxable investment income and realized gains and otherwise comply with Subchapter M of the Internal Revenue Code applicable to regulated investment companies.
The Fund evaluates tax positions taken (or expected to be taken) in the course of preparing the Fund’s tax returns to determine whether these positions meet a “more-likely-than-not” standard that, based on the technical merits, have a more than fifty percent likelihood of being sustained by a taxing authority upon examination. A tax position that meets the “more-likely-than-not” recognition threshold is measured to determine the amount of benefit to recognize in the financial statements.
Management of the Fund analyzes all open tax years, as defined by the Statute of Limitations, for all major jurisdictions, including federal tax authorities and certain state tax authorities. As of and during the fiscal year ended December 31, 2009, the Fund did not have a liability for any unrecognized tax benefits. The Fund will file income tax returns in the U.S. federal jurisdiction and Colorado. For the year ended December 31, 2009, the Fund’s returns will be open to examination by the appropriate taxing authority.
F. Fair Value Measurements
A three-tier hierarchy has been established to measure fair value based on the extent of use of observable inputs as compared to unobservable inputs for disclosure purposes and requires additional disclosures about these valuations measurements. Inputs refer broadly to the assumptions that market participants would use in pricing a security. Observable inputs are inputs that reflect the assumptions market participants would use in pricing the security developed based on market data obtained from sources independent of the reporting entity. Unobservable inputs are that reflect the reporting entity’s own assumptions about the assumptions market participants would use in pricing the security developed based on the best information available in the circumstances.
The three-tier hierarchy is summarized as follows:
| Level 1 | - | quoted prices in active markets for identical securities | ||
| Level 2 | - | other significant observable inputs (including quoted prices for similar securities, interest rates, prepayment speeds, credit risk, etc.) | ||
| Level 3 | - | significant unobservable inputs (including the Fund’s own assumptions in determining the fair value of investments) | ||
Semi-Annual Report (Unaudited) | June 30, 2010 | 16 | |
Table of Contents
Notes to Financial Statements
June 30, 2010 (Unaudited)
ALPS EQUAL SECTOR WEIGHT ETF
Assets:
| Investments in Securities at Value* | Level 1- Quoted Prices | Level 2- Other Significant Observable Inputs | Level 3 - Significant Unobserv- able Inputs | Total | ||||||||
Exchange Traded Funds | $ | 34,565,880 | $ | – | $ | – | $ | 34,565,880 | ||||
TOTAL | $ | 34,565,880 | $ | – | $ | – | $ | 34,565,880 | ||||
* For detailed descriptions of sector and industry, see the accompanying Statement of Investments.
For the period ended June 30, 2010, the Fund did not have any significant transfers between Level 1 and Level 2 securities. For the period ended June 30, 2010, the Fund did not have any securities which used significant unobservable inputs (Level 3) in determining fair value. Therefore, a reconciliation of assets in which significant unobservable Inputs (Level 3) were used in determining fair value is not applicable.
3. INVESTMENT ADVISORY FEE AND
OTHER AFFILIATED TRANSACTIONS
ALPS Advisors, Inc. (the “Investment Adviser”) acts as the Fund’s investment adviser pursuant to an Advisory Agreement with the Trust on behalf of the Fund (the “Advisory Agreement”). Pursuant to the Advisory Agreement, the Fund pays the Investment Adviser a unitary fee for the services and facilities it provides payable on a monthly basis at the annual rate of 0.37% of the Fund’s average daily net assets. ALPS Distributors Inc. (“ADI”) is both the distributor for the Fund as well as the Select Sector SPDR exchange traded funds (“Underlying Sector ETFs”) that the Fund invests in. As required by exemptive relief obtained by the Underlying Sector ETFs, the Investment Adviser will reimburse the Fund an amount equal to the distribution fee received by ADI from the Underlying Sector ETFs attributable to the Fund’s investment in the Underlying Sector ETFs, for so long as ADI acts as the distributor to the Fund and the Underlying Sector ETFs. From time to time, the Investment Adviser may waive all or a portion of its fee.
Out of the unitary management fee, the Investment Adviser pays substantially all expenses of the Fund, including the licensing fee of the Index provider, and the cost of transfer agency, custody, fund administration, legal, audit and other services, except for interest expenses, distribution fees or expenses, brokerage expenses, taxes and extraordinary expenses not incurred in the ordinary course
| 17 | ALPS Equal Sector Weight ETF | www.alpsetfs.com |
Table of Contents
|
Notes to Financial Statements | |
of the Fund’s business. In addition, the Investment Adviser’s unitary management fee is designed to compensate the Investment Adviser for providing services for the Fund.
ALPS Fund Services, Inc. (“ALPS”), an affiliate of the Investment Adviser, is the administrator of the Fund.
The Bank of New York Mellon is the custodian, fund accounting agent and transfer agent for the Fund.
Each Trustee who is not an officer or employee of the Investment Adviser, or any of its affiliates (“Independent Trustees”) is paid a quarterly retainer of $3,500, $1,500 for each regularly scheduled Board meeting attended and $750 for each special meeting held outside of regularly scheduled meetings.
4. PURCHASES AND SALES OF SECURITIES
For the period ended June 30, 2010, the cost of purchases and proceeds from sales of investment securities, excluding short-term investments and in-kind transactions, were as follows:
| Purchases | Sales | |||||
ALPS Equal Sector Weight ETF | $ | 798,239 | $ | 818,181 | ||
For the period ended June 30, 2010, the cost of in-kind purchases and proceeds from in-kind sales were as follows:
| Purchases | Sales | |||||
ALPS Equal Sector Weight ETF | $ | 25,185,025 | $ | 1,539,295 | ||
Gains on in-kind transactions are generally not considered taxable gains for federal income tax purposes.
As of June 30, 2010, the costs of investments for federal income tax purposes and accumulated net unrealized appreciation/(depreciation) on investments were as follows:
Gross Depreciation (excess of tax cost over value) | $ | (1,873,419 | ) | |
Net Unrealized Depreciation | $ | (1,873,419 | ) | |
Cost of investments for income tax purposes | $ | 36,439,299 |
Semi-Annual Report (Unaudited) | June 30, 2010 | 18 | |
Table of Contents
Notes to Financial Statements
June 30, 2010 (Unaudited)
5. CAPITAL SHARE TRANSACTIONS
Shares are created and redeemed by the Fund only in Creation Unit size aggregations of 50,000. Only Authorized Participants are permitted to purchase or redeem Creation Units from the Fund. Such transactions are generally permitted on an in-kind basis, with a balancing cash component to equate the transaction to the net asset value per unit of the Fund on the transaction date. Cash may be substituted equivalent to the value of certain securities generally when they are not available in sufficient quantity for delivery, not eligible for trading by the Authorized Participant or as a result of other market circumstances.
6. INDEMNIFICATIONS
Under the Trust’s organizational documents, its officers and Trustees are indemnified against certain liability arising out of the performance of their duties to the Trust. Additionally, in the normal course of business, the Trust enters into contracts with service providers that contain general indemnification clauses. The Trust’s maximum exposure under these arrangements is unknown, as this would involve future claims that may be made against the Trust that have not yet occurred.
7. SUBSEQUENT EVENTS
Management has evaluated whether any events or transactions occurred subsequent to June 30, 2010 through the issuance date of the Fund’s financial statements, and determined that there were no material events or transactions that would require recognition or disclosure in the Fund’s financial statements.
| 19 | ALPS Equal Sector Weight ETF | www.alpsetfs.com |
Table of Contents
|
| |
PROXY VOTING POLICIES AND PROCEDURES
A description of the Fund’s proxy voting policies and procedures used in determining how to vote for proxies and information regarding how the Fund voted proxies related to portfolio securities during the most recent 12-month period ended June 30th is available without charge, (1) on the Securities and Exchange Commission’s (“SEC”) website at http://www.sec.gov; (2) upon request, by calling 1-866-513-5856; and (3) on the Trust’s website located at http://www.alpsetfs.com.
PORTFOLIO HOLDINGS
The Trust will file its complete schedule of portfolio holdings with the SEC for the first and third quarters of each fiscal year on Form N-Q. The Trust’s Form N-Q will be available (1) by calling 1-866-513-5856, (2) on the Trust’s website located at http://www.alpsetfs.com, (3) on the SEC’s website at http://www.sec.gov, and (4) for review and copying at the SEC’s Public Reference Room (“PRR”) in Washington D.C. Information regarding the operation of the PRR may be obtained by calling 202-551-8090.
Semi-Annual Report (Unaudited) | June 30, 2010 | 20 | |
Table of Contents
Table of Contents
| Item 2. | Code of Ethics. |
Not Applicable to this Report.
| Item 3. | Audit Committee Financial Expert. |
Not Applicable to this Report.
| Item 4. | Principal Accountant Fees and Services. |
Not Applicable to this Report.
| Item 5. | Audit Committee of Listed Registrants. |
Not applicable to Registrant.
| Item 6. | Investments. |
(a) Schedule of Investments is included as part of the Report to Stockholders filed under Item 1 of this Form N-CSR.
(b) Not applicable
| Item 7. | Disclosure of Proxy Voting Policies and Procedures for Closed-End Management Investment Companies. |
Not applicable to Registrant.
| Item 8. | Portfolio Managers of Closed-End Management Investment Companies. |
Not applicable to Registrant.
Table of Contents
| Item 9. | Purchases of Equity Securities by Closed-End Management Investment Company and Affiliated Purchasers. |
Not applicable to Registrant.
| Item 10. | Submission of Matters to a Vote of Security Holders. |
No material changes to the procedures by which the shareholders may recommend nominees to the Registrant’s Board of Trustees have been implemented after the Registrant’s last provided disclosure in response to the requirements of Item 407(c)(2)(iv) of Regulation S-K (17 CFR 229.407) (as required by Item 22(b)(15) of Schedule 14A (17 CFR 240.14a-101)), or this Item.
Item 11. Controls and Procedures.
| (a) | The Registrant’s principal executive and principal financial officers, or persons performing similar functions, have concluded that the Registrant’s disclosure controls and procedures (as defined in Rule 30a-3(c) under the Investment Company Act of 1940, as amended (the “1940 Act”) (17 CFR 270.30a-3(c))) are effective, as of a date within 90 days of the filing date of the report that includes the disclosure required by this paragraph, based on their evaluation of these controls and procedures required by Rule 30a-3(b) under the 1940 Act (17 CFR 270.30a-3(b)) and Rules 13a-15(b) or 15d-15(b) under the Securities Exchange Act of 1934, as amended (17 CFR 240.13a-15(b) or 240.15d-15(b)). |
| (b) | No changes in the Registrant’s internal control over financial reporting (as defined in Rule 30a-3(d) under the 1940 Act (17 CFR 270.30a-3(d)) occurred during the Registrant’s second fiscal quarter of the period covered by this report that have materially affected, or are reasonably likely to materially affect, the Registrant’s internal control over financial reporting. |
Item 12. Exhibits.
| (a)(1) | Not applicable to this Report. |
| (a)(2) | The certifications required by Rule 30a-2(a) of the Investment Company Act of 1940, as amended, and Section 302 of the Sarbanes-Oxley Act of 2002 are attached hereto as Exhibit 99.Cert. |
| (a)(3) | Not applicable. |
| (b) | The certifications by the Registrant’s principal executive officer and principal financial officer, as required by Rule 30a-2(b) of the Investment Company Act of 1940, as amended, and Section 906 of the Sarbanes-Oxley Act of 2002 are attached hereto as Exhibit 99.906Cert. |
Table of Contents
SIGNATURES
Pursuant to the requirements of the Securities Exchange Act of 1934 and the Investment Company Act of 1940, the Registrant has duly caused this report to be signed on its behalf by the undersigned, thereunto duly authorized.
ALPS ETF TRUST
By: | /s/ Thomas A. Carter | |
Thomas A. Carter (Principal Executive Officer) President | ||
Date: | September 2, 2010 | |
Pursuant to the requirements of the Securities Exchange Act of 1934 and the Investment Company Act of 1940, this report has been signed below by the following persons on behalf of the registrant and in the capacities and on the dates indicated.
By: | /s/ Thomas A. Carter | |
Thomas A. Carter (Principal Executive Officer) President | ||
Date: | September 2, 2010 | |
By: | /s/ Kimberly R. Storms | |
Kimberly R. Storms (Principal Financial Officer) Treasurer | ||
Date: | September 2, 2010 | |