UNITED STATES
SECURITIES AND EXCHANGE COMMISSION
Washington, D.C. 20549
FORM N-CSR
CERTIFIED SHAREHOLDER REPORT OF REGISTERED
MANAGEMENT INVESTMENT COMPANIES
Investment Company Act file number:
811-22175
ALPS ETF TRUST
(Exact name of registrant as specified in charter)
1290 Broadway, Suite 1100, Denver, Colorado 80203
(Address of principal executive offices) (Zip code)
Abigail J. Murray, Esq., Secretary
ALPS ETF Trust
1290 Broadway, Suite 1100
Denver, Colorado 80203
(Name and address of agent for service)
Registrant’s Telephone Number, including Area Code: (303) 623-2577
Date of fiscal year end: November 30
Date of reporting period: December 1, 2014 – November 30, 2015
Item 1. Reports to Stockholders.
table of
CONTENTS
www.alpsfunds.com
| | |
Alerian MLP ETF | | |
| |
| Performance Overview | | November 30, 2015 (Unaudited) |
| | |
INVESTMENT OBJECTIVE
The Alerian MLP ETF (the “Fund” or “AMLP”) seeks investment results that correspond (before fees and expenses) generally to the price and yield performance of its underlying index, the Alerian MLP Infrastructure Index (the “Index” or “AMZI”). The Shares of the Fund are listed and trade on the New York Stock Exchange (“NYSE”) Arca under the ticker symbol AMLP. The Fund generally will invest in all of the securities that comprise the Index in proportion to their weightings in the Index.
The Index is a rules based, modified capitalization weighted, float-adjusted index intended to give investors a means of tracking the overall performance of the United States energy infrastructure Master Limited Partnership (“MLP”) asset class. The Index is comprised of energy infrastructure MLPs that earn a majority of their cash flow from the transportation, storage, and processing of energy commodities.
PERFORMANCE OVERVIEW
During the twelve-month period of December 1, 2014 to November 30, 2015 the Alerian MLP ETF (AMLP) delivered a total return of -26.7% (-26.8% NAV). This compares to the Fund’s index, the Alerian MLP Infrastructure Index (“AMZI”), which fell -37.7% on a price-return and -33.5% on a total-return basis. The difference in performance between the AMZI and AMLP is primarily attributable to the Fund’s operating expenses and the tax impact of the Fund’s C-Corporation(1) structure.
During the period, the fund paid four distributions:
| | • | | $0.2925 on February 19, 2015 |
| | • | | $0.2955 on May 20, 2015 |
| | • | | $0.2990 on August 19, 2015 |
| | • | | $0.2990 on November 18, 2015 |
The master limited partnerships (MLPs) in the AMZI generated negative returns during the period. The top contributor to the AMZI during the period was Genesis Energy LP (GEL), which fell 10.6%. Bottom contributors included Targa Resources Partners LP (NGLS) and Williams Partners LP (WPZ)(2).
During the period, Shell Midstream Partners (SHLX) was added and Williams Partners, Atlas Pipeline Partners, Regency Energy Partners, and Crestwood Midstream Partners and were removed due to merger activity.
Weakness in the energy markets continued to persist during the period, with crude oil prices falling over 40% from $68/barrel to below $40 by the end of November. Investor sentiment for the energy macro picture remains weak, as North American crude production has not slowed enough to address global oversupply issues, which has been further exacerbated by OPEC’s inability to agree to production quotas and cuts, all with the backdrop of slowing energy demand from China and Europe.
Infrastructure MLPs have not been immune. Estimates for capital spending, distribution growth, and cash flow have come down to reflect a moderated growth outlook. While we recognize these adjustments are necessary, we note that they do not signal that the underlying business model for MLPs is broken. During the period, AMZI distribution growth totaled 7.6%. Of the 22 MLPs in the AMZI, 15 increased their distribution during the third calendar quarter of 2015 and the remaining 7 maintained their distribution.
MLPs continued to announce organic projects backed by long-term binding commitments during the period. These projects vary by product handled, including crude oil, natural gas, NGLs, refined products, and propane. They also vary by asset type, including pipelines, processing plants, and fractionation plants.
Access to capital is of utmost importance during this period of volatility. To finance the aforementioned organic projects, MLPs have traditionally financed new assets with a combination of debt and equity. However, given the 50% peak to trough move in unit prices, management teams are reluctant to fund growth with equity. Funding too much growth through debt can begin to push the limits of the debt covenants. Given this, we expect near-term distributions will not grow at similar rates as previous years, in order to retain more cash flow for projects. In order to preserve distributions, MLPs may need to pursue creative financing options such as sale of non-core assets, PIK unit sales, preferred equity placements, or PIPEs (private investment in public equity). Distribution cuts to finance growth are not preferred, but possible options.
When production stabilizes and begins to inch upward again, we believe commodity prices will move higher, which will change the behavioral psychology of investing in energy, and midstream energy specifically. As such, we continue to believe in the medium- and long-term fundamentals of MLPs as an investment story in the build-out of North American energy infrastructure.
1 | November 30, 2015
| | |
Alerian MLP ETF | | |
| Performance Overview | | November 30, 2015 (Unaudited) |
| (1) | Under current law, the Fund is not eligible to elect treatment as a regulated investment company due to its investments primarily in MLPs. The Fund is classified for federal income tax purposes as a taxable regular corporation or so-called Subchapter “C” corporation. Whereas the NAV of Fund Shares is reduced by the accrual of any deferred tax liabilities, the Alerian MLP Infrastructure Index is calculated without any tax deductions. |
| (2) | After completion of the merger, Access Midstream Partners changed its name to Williams Partners and ticker from “ACMP” to “WPZ”. |
The views and information discussed in this commentary are as of the date of publication, are subject to change, and may not reflect the writer’s current views. The views expressed represent an assessment of market conditions at a specific point in time, are opinions only and should not be relied upon as investment advice regarding a particular investment or markets in general. Such information does not constitute a recommendation to buy or sell specific securities or investment vehicles. It should not be assumed that any investment will be profitable or will equal the performance of the fund or any securities or any sectors mentioned herein. The subject matter contained herein has been derived from several sources believed to be reliable and accurate at the time of compilation. ALPS Advisors, Inc. and Alerian do not accept any liability for losses either direct or consequential caused by the use of this information.
Performance (as of November 30, 2015)
| | | | | | | | |
| | | 1 Year | | 3 Year | | 5 Year | | Since Inception^ |
Alerian MLP ETF – NAV | | -26.84% | | -2.85% | | 1.31% | | 2.62% |
Alerian MLP ETF – Market Price* | | -26.72% | | -2.82% | | 1.35% | | 2.66% |
Alerian MLP Infrastructure Index | | -33.53% | | -2.01% | | 3.87% | | 5.80% |
S&P 500® Total Return Index | | 2.75% | | 16.09% | | 14.40% | | 16.26% |
Total Expense Ratio (per the current prospectus) 5.43%.
Performance data quoted represents past performance. Past performance does not guarantee future results. Investment return and principal value of an investment will fluctuate so that an investor’s shares, when sold or redeemed, may be worth more or less than the original cost. Current performance data may be higher or lower than actual data quoted. For the most current month-end performance data please visit www.alpsfunds.com or call 1.877.398.8461. The Fund accrues deferred income taxes for future tax liabilities associated with the portion of MLP distributions considered to be a tax-deferred return of capital and for any net operating gains as well as capital appreciation of its investment. This deferred tax liability is reflected in the daily NAV and as a result the fund’s after-tax performance could differ significantly from the underlying assets even if the pre-tax performance is closely tracked.
NAV is an exchange-traded fund’s per-share value. The per-share dollar amount of the fund is derived by dividing the total value of all the securities in its portfolio, less any liabilities, by the number of fund shares outstanding. Market Price is the price at which a share can currently be traded in the market. Information detailing the number of days the Market Price of the Fund was greater than the Fund’s NAV and the number of days it was less than the Fund’s NAV can be obtained at www.alpsfunds.com.
| ^ | The Fund commenced Investment Operations on August 24, 2010 with an Inception Date, the first day of trading on the NYSE ARCA, of August 25, 2010. |
| * | Market Price is based on the midpoint of the bid-ask spread at 4 p.m. ET and does not represent the returns an investor would receive if shares were traded at other times. |
The Alerian MLP Infrastructure Index is comprised of 25 midstream energy Master Limited Partnerships and provides investors with an unbiased benchmark for the infrastructure component of this emerging asset class.
S&P 500® Total Return Index is the Standard & Poor’s composite index of 500 stocks, a widely recognized, unmanaged index of common stock prices. Total return assumes reinvestment of any dividends and distributions realized during a given time period.
One cannot invest directly in an index. Index performance does not reflect fund performance.
The Alerian MLP ETF is not suitable for all investors. Subject to investment risks, including possible loss of the principal amount invested.
ALPS Portfolio Solutions Distributor, Inc. is the Distributor for the Fund.
2 | November 30, 2015
| | |
Alerian MLP ETF | | |
| Performance Overview | | November 30, 2015 (Unaudited) |
Top 10 Holdings* (as of November 30, 2015)
| | |
Enterprise Products Partners LP | | 10.94% |
Magellan Midstream Partners LP | | 7.96% |
MarkWest Energy Partners LP | | 7.76% |
Energy Transfer Partners LP | | 7.05% |
Plains All American Pipeline LP | | 6.23% |
Williams Partners LP | | 5.81% |
Buckeye Partners LP | | 5.39% |
ONEOK Partners LP | | 5.26% |
Enbridge Energy Partners LP | | 5.19% |
Sunoco Logistics Partners LP | | 4.80% |
Total % of Top 10 Holdings | | 66.39% |
Future holdings are subject to change.
Growth of $10,000 (as of November 30, 2015)
Comparison of change in value of a $10,000 investment in the Fund and the Indexes
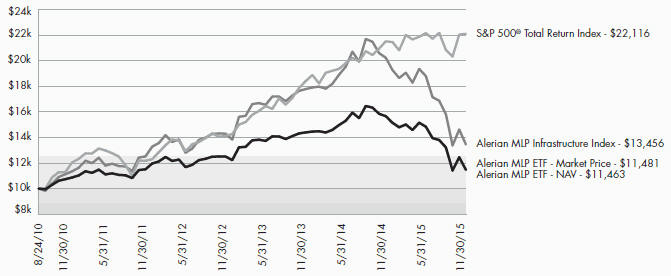
The chart above represents historical performance of a hypothetical investment of $10,000 in the Fund over the life of the Fund. Performance calculations are as of the end of each month. Past performance does not guarantee future results. This chart does not reflect the deduction of taxes that a shareholder would pay on Fund distributions or the redemption of Fund shares.
3 | November 30, 2015
| | |
Alerian Energy Infrastructure ETF | | |
| Performance Overview | | November 30, 2015 (Unaudited) |
INVESTMENT OBJECTIVE
The Alerian Energy Infrastructure ETF (the “Fund” or “ENFR”) seeks investment results that correspond (before fees and expenses) generally to the price and yield performance of its underlying index, the Alerian Energy Infrastructure Index (the “Index” or “AMEI”). As a secondary objective, the Fund seeks to provide total return through income and capital appreciation.
The Index is a composite of North American energy infrastructure companies engaged in the pipeline transportation, storage, and processing of energy commodities (also known as “midstream energy businesses”). Currently, each constituent is assigned to one of four categories: (i) U.S. Energy Infrastructure Master Limited Partnerships (“MLPs”) (ii) U.S. General Partners, (iii) U.S. Energy Infrastructure Companies, and (iv) Canadian Energy Infrastructure Companies. Previously, during the period, the following five categories of issuers were included in the Index: MLPs and limited liability companies taxed as partnerships known as “energy infrastructure MLPs” (25% total index weight), U.S. energy infrastructure companies (30% total index weight) taxed as corporations, Canadian MLP affiliates (10% total index weight), U.S. integrated utilities companies (15% total index weight) and Canadian energy infrastructure companies (20% total index weight).
PERFORMANCE OVERVIEW
During the twelve-month period of December 1, 2014 to November 30, 2015, the Alerian Energy Infrastructure ETF (ENFR) delivered a total return of -32.0% (-31.8% NAV). This compares to the Fund’s index, the Alerian Energy Infrastructure Index (“AMEI”), which fell -34.5% on a price return and -31.5% on a total return basis.
During the period, the fund paid four distributions:
| | • | | $0.115384 on January 1, 2015 |
| | • | | $0.182501 on April 1, 2015 |
| | • | | $0.205854 on July 1, 2015 |
| | • | | $0.131000 on September 30, 2015 |
The constituents in the AMEI generated negative returns during the period. The top contributor to the AMEI during the period was Dominion Resources, Inc. (D), which fell -7.1%. Bottom contributors included Targa Resources Corp (TRGP) and EnLink Midstream LLC (ENLC).
During the period, Alerian changed its methodology for the AMEI. For further details on the new methodology, please visit alerian.com. Cheniere Energy Partners (CQP), EQT GP Holdings (EQGP), Energy Transfer Equity (ETE), Exterran Holdings (EXH), Macquarie Infrastructure (MIC), MPLX (MPLX), NuStar GP Holdings (NSH), Phillips 66 Partners (PSXP), SemGroup (SEMG), Shell Midstream Partners (SHLX), Tallgrass Energy GP (TEGP), and Western Gas Equity Partners (WGP) were added to the AMEI. Atmos Energy (ATO), DTE Energy (DTE), Emera (EMA), EQT Midstream Partners (EQM), Energy Transfer Partners (ETP), Questar (STR), Western Gas Partners (WES), MPLX LP (MPLX), and NiSource Inc. (NI) were removed from the AMEI.
Weakness in the energy markets continued to persist during the period, with crude oil prices falling over 40% from $68/barrel to below $40 by the end of November. Investor sentiment for the energy macro picture remains weak, as North American crude production has not slowed enough to address global oversupply issues, which has been further exacerbated by OPEC’s inability to agree to production quotas and cuts, all with the backdrop of slowing energy demand from China and Europe.
Energy infrastructure companies have not been immune. Estimates for capital spending, distribution growth, and cash flow have come down to reflect a moderated growth outlook. While we recognize these adjustments are necessary, we note that they do not signal that the underlying business model for energy infrastructure companies is broken.
Energy infrastructure companies continued to announce organic projects backed by long-term binding commitments during the period. These projects vary by product handled, including crude oil, natural gas, NGLs, refined products, and propane. They also vary by asset type, including pipelines, processing plants, and fractionation plants.
Access to capital is of utmost importance during this period of volatility. Given the 50% peak to trough move in unit prices, management teams are reluctant to fund growth with equity. Funding too much growth through debt can begin to push the limits of the debt covenants. Given this, we expect near-term distributions will not grow at similar rates as previous years, in order to retain more cash flow for projects. In order to preserve distributions, energy infrastructure companies may need to pursue creative financing options such as sale of non-core assets, PIK unit sales, preferred equity placements, or PIPEs (private investment in public equity). Distribution and dividend cuts to finance growth are not preferred, but possible options.
4 | November 30, 2015
| | |
Alerian Energy Infrastructure ETF | | |
| Performance Overview | | November 30, 2015 (Unaudited) |
When production stabilizes and begins to inch upward again, we believe commodity prices will move higher, which will change the behavioral psychology of investing in energy, and midstream energy specifically. As such, we continue to believe in the medium- and long-term fundamentals of energy infrastructure companies as an investment story in the build-out of North American energy infrastructure.
The views and information discussed in this commentary are as of the date of publication, are subject to change, and may not reflect the writer’s current views. The views expressed represent an assessment of market conditions at a specific point in time, are opinions only and should not be relied upon as investment advice regarding a particular investment or markets in general. Such information does not constitute a recommendation to buy or sell specific securities or investment vehicles. It should not be assumed that any investment will be profitable or will equal the performance of the fund or any securities or any sectors mentioned herein. The subject matter contained herein has been derived from several sources believed to be reliable and accurate at the time of compilation. ALPS Advisors, Inc. and Alerian do not accept any liability for losses either direct or consequential caused by the use of this information.
Performance (as of November 30, 2015)
| | | | | | | | | | |
| | | 1 Year | | Since Inception^ |
Alerian Energy Infrastructure ETF - NAV | | | | -31.83% | | | | | -10.49% | |
Alerian Energy Infrastructure ETF - Market Price* | | | | -31.98% | | | | | -10.46% | |
Alerian Energy Infrastructure Index | | | | -31.49% | | | | | -9.76% | |
S&P 500® Total Return Index | | | | 2.75% | | | | | 10.77% | |
Total Expense Ratio (per the current prospectus) 0.65%.
Performance data quoted represents past performance. Past performance does not guarantee future results. Investment return and principal value of an investment will fluctuate so that an investor’s shares, when sold or redeemed, may be worth more or less than the original cost. Current performance data may be higher or lower than actual data quoted. For most current month-end performance data please visit www.alpsfunds.com or call 1.866.675.2639.
NAV is an exchange-traded fund’s per-share value. The per-share dollar amount of the fund is derived by dividing the total value of all the securities in its portfolio, less any liabilities, by the number of fund shares outstanding. Market Price is the price at which a share can currently be traded in the market. Information detailing the number of days the Market Price of the Fund was greater than the Fund’s NAV and the number of days it was less than the Fund’s NAV can be obtained at www.alpsfunds.com.
| ^ | The Fund commenced Investment Operations on November 1, 2013. |
| * | Market Price is based on the midpoint of the bid-ask spread at 4 p.m. ET and does not represent the returns an investor would receive if shares were traded at other times. |
The Alerian Energy Infrastructure Index is comprised of 30 equity securities of issuers headquartered or incorporated in the United States and Canada that engage in the transportation, storage, and processing of energy commodities.
S&P 500® Total Return Index: the Standard & Poor’s composite index of 500 stocks, a widely recognized, unmanaged index of common stock prices. Total return assumes reinvestment of any dividends and distributions realized during a given time period.
One cannot invest directly in an index. Index performance does not reflect fund performance.
The Alerian Energy Infrastructure ETF is not suitable for all investors. Subject to investment risks, including possible loss of the principal amount invested.
ALPS Portfolio Solutions Distributor, Inc. is the Distributor for the Fund.
5 | November 30, 2015
| | |
Alerian Energy Infrastructure ETF | | |
| Performance Overview | | November 30, 2015 (Unaudited) |
Top 10 Holdings* (as of November 30, 2015)
| | | | |
Dominion Resources, Inc. | | | 5.79% | |
TransCanada Corp. | | | 5.53% | |
Spectra Energy Corp. | | | 5.43% | |
Enterprise Products Partners LP | | | 5.39% | |
Magellan Midstream Partners LP | | | 5.22% | |
Enbridge, Inc. | | | 5.07% | |
ONEOK, Inc. | | | 4.81% | |
Pembina Pipeline Corp. | | | 4.74% | |
Columbia Pipeline Group, Inc. | | | 4.58% | |
The Williams Cos., Inc. | | | 4.55% | |
Total % of Top 10 Holdings | | | 51.11% | |
Future holdings are subject to change.
Growth of $10,000 (as of November 30, 2015)
Comparison of change in value of a $10,000 investment in the Fund and the Indexes
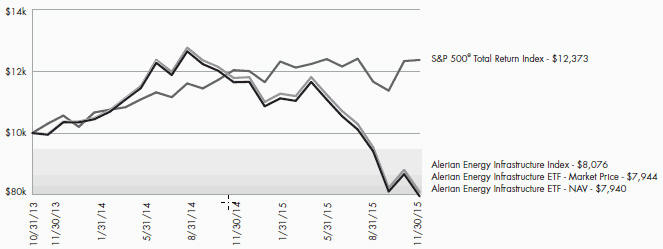
The chart above represents historical performance of a hypothetical investment of $10,000 in the Fund over the life of the Fund. Performance calculations are as of the end of each month. Past performance does not guarantee future results. This chart does not reflect the deduction of taxes that a shareholder would pay on Fund distributions or the redemption of Fund shares.
6 | November 30, 2015
| | |
Alerian Exchange Traded Funds | | |
| Disclosure of Fund Expenses | | November 30, 2015 (Unaudited) |
Shareholder Expense Example: As a shareholder of the Funds, you incur two types of costs: (1) transaction costs which may include creation and redemption fees or brokerage charges, and (2) ongoing costs, including management fees and other Fund expenses. These examples are intended to help you understand your ongoing costs (in dollars) of investing in the Fund and to compare these costs with the ongoing costs of investing in other funds. It is based on an investment of $1,000 invested at the beginning of the (six month) period and held though November 30, 2015.
Actual Return: The first line of the table provides information about actual account values and actual expenses. You may use the information in this table, together with the amount you invested, to estimate the expenses that you incurred over the period. Simply divide your account value by $1,000 (for example, an $8,600 account value divided by $1,000 = 8.6), then multiply the result by the number in the first line under the heading entitled “Expenses Paid During the Period” to estimate the expenses attributable to your investment during this period.
Hypothetical 5% Return: The second line of the table provides information about hypothetical account values and hypothetical expenses based on the Fund’s actual expense ratio and an assumed rate of return of 5% per year before expenses, which is not the Fund’s actual return. The hypothetical account values and expenses may not be used to estimate the actual ending account balance or expenses you paid for the period. You may use this information to compare ongoing costs of investing in the Fund and other funds. To do so, compare this 5% hypothetical example with the 5% hypothetical examples that appear in the shareholder reports of the other funds.
The expenses shown in the table are meant to highlight ongoing Fund costs only and do not reflect any transaction costs, such as creation and redemption fees, or brokerage charges. Therefore, the second line is useful in comparing ongoing costs only, and will not help you determine the relative total costs of owning different funds. In addition, if these costs were included, your costs would have been higher.
| | | | | | | | |
| | | Beginning Account
Value 6/1/15 | | Ending Account Value
11/30/15 | | Expense
Ratio(a) | | Expenses Paid
During Period
6/1/15 - 11/30/15(b) |
|
Alerian MLP ETF | | | | | | | | |
Actual | | $1,000.00 | | $772.10 | | 0.85% | | $3.78 |
Hypothetical (5% return before expenses) | | $1,000.00 | | $1,020.81 | | 0.85% | | $4.31 |
|
| | | | |
Alerian Energy Infrastructure ETF | | | | | | | | |
Actual | | $1,000.00 | | $716.00 | | 0.65% | | $2.80 |
Hypothetical (5% return before expenses) | | $1,000.00 | | $1,021.81 | | 0.65% | | $3.29 |
|
| (a) | Annualized, based on the Fund’s most recent fiscal half-year expenses. |
| (b) | Expenses are equal to the Fund’s annualized expense ratio multiplied by the average account value over the period, multiplied by the number of days in the most recent fiscal half year (183), divided by 365. |
7 | November 30, 2015
| | |
Alerian Exchange Traded Funds | | |
| Report of Independent Registered Public Accounting Firm |
To the Board of Trustees and Shareholders of ALPS ETF Trust:
We have audited the accompanying statements of assets and liabilities, including the schedules of investments, of Alerian MLP ETF and Alerian Energy Infrastructure ETF, two of the portfolios constituting the ALPS ETF Trust (the “Trust”), as of November 30, 2015, and the related statements of operations for the year then ended, the statements of changes in net assets for each of the two years in the period then ended, and the financial highlights for each of the periods presented. These financial statements and financial highlights are the responsibility of the Trust’s management. Our responsibility is to express an opinion on these financial statements and financial highlights based on our audits.
We conducted our audits in accordance with the standards of the Public Company Accounting Oversight Board (United States). Those standards require that we plan and perform the audit to obtain reasonable assurance about whether the financial statements and financial highlights are free of material misstatement. The Trust is not required to have, nor were we engaged to perform, an audit of its internal control over financial reporting. Our audits included consideration of internal control over financial reporting as a basis for designing audit procedures that are appropriate in the circumstances, but not for the purpose of expressing an opinion on the effectiveness of the Trust’s internal control over financial reporting. Accordingly, we express no such opinion. An audit also includes examining, on a test basis, evidence supporting the amounts and disclosures in the financial statements, assessing the accounting principles used and significant estimates made by management, as well as evaluating the overall financial statement presentation. Our procedures included confirmation of securities owned as of November 30, 2015, by correspondence with the custodian. We believe that our audits provide a reasonable basis for our opinion.
In our opinion, the financial statements and financial highlights referred to above present fairly, in all material respects, the financial position of Alerian MLP ETF and Alerian Energy Infrastructure ETF of the ALPS ETF Trust as of November 30, 2015, the results of their operations for the year then ended, the changes in their net assets for each of the two years in the period then ended, and the financial highlights for each of the periods presented, in conformity with accounting principles generally accepted in the United States of America.
DELOITTE & TOUCHE LLP
Denver, Colorado
January 28, 2016
8 | November 30, 2015
| | |
Alerian MLP ETF | | |
| Schedule of Investments | | November 30, 2015 |
| | | | | | | | | | | | |
| Security Description | | | | | Shares | | | Value | |
| |
Master Limited Partnerships (100.01%) | | | | | | | | | | | | |
Gathering & Processing (25.82%) | | | | | | | | | | | | |
DCP Midstream Partners LP | | | | | | | 6,804,719 | | | $ | 172,839,862 | |
EnLink Midstream Partners LP | | | | | | | 10,077,805 | | | | 150,360,851 | |
MarkWest Energy Partners LP | | | | | | | 11,651,016 | | | | 559,248,768 | |
Targa Resources Partners LP | | | | | | | 12,391,685 | | | | 283,026,085 | |
Western Gas Partners LP | | | | | | | 5,739,033 | | | | 275,588,365 | |
Williams Partners LP | | | | | | | 15,278,614 | | | | 418,939,596 | |
| | | | | | | | | | | | |
Total Gathering & Processing | | | | | | | | | | | 1,860,003,527 | |
| | | | | | | | | | | | |
| | | |
Pipeline Transportation I Natural Gas (31.48%) | | | | | | | | | | | | |
Energy Transfer Partners LP | | | | | | | 13,309,155 | | | | 508,542,813 | |
Enterprise Products Partners LP | | | | | | | 31,069,339 | | | | 788,850,517 | |
EQT Midstream Partners LP | | | | | | | 3,598,603 | | | | 243,445,493 | |
ONEOK Partners LP | | | | | | | 12,535,879 | | | | 378,959,622 | |
Spectra Energy Partners LP | | | | | | | 4,170,842 | | | | 176,718,575 | |
TC PipeLines LP | | | | | | | 3,454,123 | | | | 170,840,924 | |
| | | | | | | | | | | | |
Total Pipeline Transportation | Natural Gas | | | | | | | | | | | 2,267,357,944 | |
| | | | | | | | | | | | |
| | | |
Pipeline Transportation / Petroleum (42.71%) | | | | | | | | | | | | |
Buckeye Partners LP | | | | | | | 5,736,893 | | | | 388,330,287 | |
Enbridge Energy Partners LP | | | | | | | 15,050,652 | | | | 374,008,702 | |
Genesis Energy LP | | | | | | | 6,991,534 | | | | 275,116,863 | |
Magellan Midstream Partners LP | | | | | | | 9,171,989 | | | | 573,524,472 | |
NGL Energy Partners LP | | | | | | | 6,872,613 | | | | 120,614,358 | |
NuStar Energy LP | | | | | | | 4,774,949 | | | | 191,093,459 | |
Plains All American Pipeline LP | | | | | | | 18,137,202 | | | | 449,439,866 | |
Shell Midstream Partners LP | | | | | | | 3,952,847 | | | | 137,835,775 | |
Sunoco Logistics Partners LP | | | | | | | 12,423,733 | | | | 346,249,439 | |
Tesoro Logistics LP | | | | | | | 4,408,979 | | | | 220,228,501 | |
| | | | | | | | | | | | |
Total Pipeline Transportation | Petroleum | | | | | | | | | | | 3,076,441,722 | |
| | | | | | | | | | | | |
| | | |
Total Master Limited Partnerships (Cost $7,945,340,430) | | | | | | | | | | | 7,203,803,193 | |
| | | | | | | | | | | | |
| | | |
| | | 7 Day Yield | | | Shares | | | Value | |
| |
Short Term Investments (0.07%) | | | | | | | | | | | | |
Morgan Stanley Institutional Liquidity Funds, Prime Portfolio | | | 0.105% | | | | 5,373,264 | | | | 5,373,264 | |
| | | | | | | | | | | | |
| | | |
Total Short Term Investments (Cost $5,373,264) | | | | | | | | | | | 5,373,264 | |
| | | | | | | | | | | | |
| | | |
Total Investments (100.08%) (Cost $7,950,713,694) | | | | | | | | | | $ | 7,209,176,457 | |
| | | |
Liabilities in Excess of Other Assets (-0.08%) | | | | | | | | | | | (5,422,083) | |
| | | | | | | | | | | | |
| | | |
Net Assets (100.00%) | | | | | | | | | | $ | 7,203,754,374 | |
| | | | | | | | | | | | |
Common Abbreviations:
LP - Limited Partnership.
See Notes to Financial Statements.
9 | November 30, 2015
| | |
Alerian MLP ETF | | |
| Statement of Assets and Liabilities | | November 30, 2015 |
| | | | |
ASSETS: | | | | |
Investments, at value | | $ | 7,209,176,457 | |
Interest receivable | | | 2,345 | |
Deferred tax asset (Note 2) | | | –(a) | |
Income tax receivable | | | 280,281 | |
| |
Total Assets | | | 7,209,459,083 | |
| |
| |
LIABILITIES: | | | | |
Franchise tax payable | | | 558,264 | |
Payable to adviser | | | 5,146,445 | |
| |
Total Liabilities | | | 5,704,709 | |
| |
NET ASSETS | | $ | 7,203,754,374 | |
| |
| |
NET ASSETS CONSIST OF: | | | | |
Paid-in capital | | $ | 8,295,451,741 | |
Accumulated net investment loss, net of deferred income taxes | | | (236,377,273) | |
Accumulated net realized loss on investments, net of deferred income taxes | | | (162,829,582) | |
Net unrealized depreciation on investments, net of deferred income taxes | | | (692,490,512) | |
| |
NET ASSETS | | $ | 7,203,754,374 | |
| |
| |
INVESTMENTS, AT COST | | $ | 7,950,713,694 | |
| |
PRICING OF SHARES | | | | |
Net Assets | | $ | 7,203,754,374 | |
Shares of beneficial interest outstanding (Unlimited number of shares authorized, par value $0.01 per share) | | | 588,062,100 | |
Net Asset Value, offering and redemption price per share | | $ | 12.25 | |
| (a) | Net Deferred Tax Asset of $284,042,840 is offset 100% by Valuation Allowance. |
See Notes to Financial Statements.
10 | November 30, 2015
| | |
Alerian MLP ETF | | |
| Statement of Operations | | For the Year Ended November 30, 2015 |
| | | | |
INVESTMENT INCOME: | | | | |
Distributions from master limited partnerships | | $ | 565,212,652 | |
Less return of capital distributions | | | (565,212,652) | |
| |
Total Investment Income | | | – | |
| |
| |
EXPENSES: | | | | |
Franchise tax expense | | | 697,159 | |
Investment adviser fee | | | 72,060,211 | |
| |
Total Expenses | | | 72,757,370 | |
| |
NET INVESTMENT LOSS, BEFORE INCOME TAXES | | | (72,757,370) | |
| |
Deferred income tax expense | | | (60,131,464) | |
| |
NET INVESTMENT LOSS | | | (132,888,834) | |
| |
| |
REALIZED AND UNREALIZED GAIN/(LOSS): | | | | |
Net realized loss on investments, before income taxes | | | (260,444,408) | |
Deferred income tax benefit | | | 165,771,622 | |
| |
Net realized loss | | | (94,672,786) | |
| |
Net change in unrealized depreciation on investments, before income taxes | | | (3,239,715,193) | |
Deferred income tax benefit | | | 933,675,220 | |
| |
Net change in unrealized depreciation | | | (2,306,039,973) | |
| |
NET REALIZED AND UNREALIZED LOSS | | | (2,400,712,759) | |
| |
NET DECREASE IN NET ASSETS RESULTING FROM OPERATIONS | | | $ (2,533,601,593) | |
| |
See Notes to Financial Statements.
11 | November 30, 2015
| | |
Alerian MLP ETF | | |
| Statements of Changes in Net Assets | | |
| | | | | | | | |
| | | For the Year Ended
November 30, 2015 | | | For the Year Ended
November 30, 2014 | |
| |
OPERATIONS: | | | | | | | | |
Net investment loss | | $ | (132,888,834) | | | $ | (46,718,275) | |
Net realized gain/(loss) on investments | | | (94,672,786) | | | | 267,383,081 | |
Net change in unrealized appreciation/(depreciation) on investments | | | (2,306,039,973) | | | | 473,848,788 | |
| |
Net increase/(decrease) in net assets resulting from operations | | | (2,533,601,593) | | | | 694,513,594 | |
| |
| | |
DISTRIBUTIONS TO SHAREHOLDERS: | | | | | | | | |
From net realized gains | | | – | | | | (343,269,132) | |
From tax return of capital | | | (647,133,076) | | | | (191,041,392) | |
| |
Total distributions | | | (647,133,076) | | | | (534,310,524) | |
| |
| | |
CAPITAL SHARE TRANSACTIONS: | | | | | | | | |
Proceeds from sale of shares | | | 2,547,020,530 | | | | 2,282,699,118 | |
Issued to shareholders in reinvestment distributions | | | – | | | | 4,571,254 | |
Cost of shares redeemed | | | (1,511,532,837) | | | | (483,156,705) | |
| |
Net increase from share transactions | | | 1,035,487,693 | | | | 1,804,113,667 | |
| |
| | |
Net increase/(decrease) in net assets | | | (2,145,246,976) | | | | 1,964,316,737 | |
| | |
NET ASSETS: | | | | | | | | |
Beginning of year | | | 9,349,001,350 | | | | 7,384,684,613 | |
| |
End of year * | | $ | 7,203,754,374 | | | $ | 9,349,001,350 | |
| |
| |
*Including accumulated net investment loss, net of deferred income taxes of: | | $ | (236,377,273) | | | $ | (103,488,439) | |
| | |
OTHER INFORMATION: | | | | | | | | |
SHARE TRANSACTIONS: | | | | | | | | |
Beginning shares | | | 516,512,100 | | | | 417,561,799 | |
Shares sold | | | 172,050,000 | | | | 125,050,000 | |
Distributions reinvested | | | – | | | | 250,301 | |
Shares redeemed | | | (100,500,000) | | | | (26,350,000) | |
| |
Shares outstanding, end of year | | | 588,062,100 | | | | 516,512,100 | |
| |
See Notes to Financial Statements.
12 | November 30, 2015
| | |
Alerian MLP ETF | | |
| Financial Highlights | | For a Share Outstanding Throughout the Periods Presented |
| | | | | | | | | | | | | | | | | | | | | | | | |
| | | For the Year
Ended
November 30,
2015 | | | For the Year
Ended
November 30,
2014 | | | For the Year
Ended
November 30,
2013 | | | For the Year
Ended
November 30,
2012 | | | For the
Period
January 1,
2011 to
November 30,
2011 (a) | | | For the Period
August 25, 2010 (Inception) to December 31, 2010 | |
| |
NET ASSET VALUE, BEGINNING OF PERIOD | | $ | 18.10 | | | $ | 17.69 | | | $ | 16.32 | | | $ | 15.97 | | | $ | 16.05 | | | $ | 15.00 | |
| | | | | | |
INCOME/(LOSS) FROM OPERATIONS: | | | | | | | | | | | | | | | | | | | | | | | | |
Net investment loss(b) | | | (0.13) | | | | (0.16) | | | | (0.09) | | | | (0.09) | | | | (0.08) | | | | (0.03) | |
Net realized and unrealized gain/(loss) on investments | | | (4.53) | | | | 1.70 | | | | 2.53 | | | | 1.44 | | | | 1.00 | | | | 1.33 | |
| |
Total from investment operations | | | (4.66) | | | | 1.54 | | | | 2.44 | | | | 1.35 | | | | 0.92 | | | | 1.30 | |
| |
| | | | | | |
DISTRIBUTIONS: | | | | | | | | | | | | | | | | | | | | | | | | |
From net realized gains | | | – | | | | (0.73) | | | | – | | | | (0.00) | (b)(c) | | | (0.14) | (b) | | | – | |
From tax return of capital | | | (1.19) | | | | (0.40) | | | | (1.07) | | | | (1.00) | | | | (0.86) | | | | (0.25) | |
| |
Total distributions | | | (1.19) | | | | (1.13) | | | | (1.07) | | | | (1.00) | | | | (1.00) | | | | (0.25) | |
| |
| | | | | | |
NET INCREASE/(DECREASE) IN NET ASSET VALUE | | | (5.85) | | | | 0.41 | | | | 1.37 | | | | 0.35 | | | | (0.08) | | | | 1.05 | |
| |
NET ASSET VALUE, END OF PERIOD | | $ | 12.25 | | | $ | 18.10 | | | $ | 17.69 | | | $ | 16.32 | | | $ | 15.97 | | | $ | 16.05 | |
| |
TOTAL RETURN(d) | | | (26.84) | % | | | 8.82 | % | | | 15.16 | % | | | 8.62 | % | | | 5.93 | % | | | 8.66% | |
| | | | | | |
RATIOS/SUPPLEMENTAL DATA: | | | | | | | | | | | | | | | | | | | | | | | | |
Net assets, end of period (000s) | | $ | 7,203,754 | | | $ | 9,349,001 | | | $ | 7,384,685 | | | $ | 4,466,815 | | | $ | 1,713,387 | | | $ | 611,467 | |
| | | | | | |
RATIO TO AVERAGE NET ASSETS: | | | | | | | | | | | | | | | | | | | | | | | | |
Expenses (excluding net current and deferred tax expenses/benefits and franchise tax expense) | | | 0.85 | % | | | 0.85 | % | | | 0.85 | % | | | 0.85 | % | | | 0.85% | (e) | | | 0.85%(e) | |
Expenses (including net current and deferred tax expenses/benefits)(f) | | | (11.40) | % | | | 5.43 | % | | | 8.56 | % | | | 4.85 | % | | | 4.86% | (e) | | | 13.56%(e) | |
Expenses (including current and deferred tax expenses/benefits)(g) | | | 1.57% | | | | 0.55 | % | | | 0.55 | % | | | 0.54 | % | | | 0.53% | (e) | | | 0.52%(e) | |
Net investment loss (excluding deferred tax expenses/benefits and franchise tax expense) | | | (0.85) | % | | | (0.85) | % | | | (0.85) | % | | | (0.85) | % | | | (0.85)% | (e) | | | (0.85)%(e) | |
Net investment loss (including deferred tax expenses/benefits)(g) | | | (1.57)% | | | | (0.55) | % | | | (0.55) | % | | | (0.54) | % | | | (0.53)% | (e) | | | (0.52)%(e) | |
PORTFOLIO TURNOVER RATE(h) | | | 21% | | | | 29 | % | | | 12 | % | | | 12 | % | | | 10 | % | | | 12% | |
| |
| (a) | Effective March 7, 2011, the Board approved changing the fiscal year-end of the Fund from December 31 to November 30. |
| (b) | Based on average shares outstanding during the period. |
| (c) | Less than ($0.005) per share. |
| (d) | Total return is calculated assuming an initial investment made at the net assets value at the beginning of the period and redemption at the net asset value on the last day of the period, and assuming all distributions are reinvested at actual reinvestment prices. Total return calculated for a period of less than one year is not annualized. |
| (f) | Includes amount of current and deferred taxes/benefits for all components of the Statement of Operations. |
| (g) | Includes amount of current and deferred tax benefit associated with net investment loss. |
| (h) | Portfolio turnover is not annualized and does not include securities received or delivered from processing creations or redemptions. |
See Notes to Financial Statements.
13 | November 30, 2015
| | |
| Alerian Energy Infrastructure ETF | | |
| Schedule of Investments | | November 30, 2015 |
| | | | | | | | |
| Security Description | | Shares | | | Value | |
| |
Canadian Energy Infrastructure Companies (26.01%) | | | | | | | | |
Energy (26.01%) | | | | | | | | |
AltaGas, Ltd. | | | 9,869 | | | $ | 231,308 | |
Enbridge, Inc. | | | 17,561 | | | | 623,699 | |
Gibson Energy, Inc. | | | 9,220 | | | | 114,952 | |
Inter Pipeline, Ltd. | | | 24,805 | | | | 431,294 | |
Keyera Corp. | | | 12,485 | | | | 372,367 | |
Pembina Pipeline Corp. | | | 25,420 | | | | 583,416 | |
TransCanada Corp. | | | 21,568 | | | | 680,576 | |
Veresen, Inc. | | | 21,658 | | | | 169,962 | |
| | | | | | | | |
Total Energy | | | | | | | 3,207,574 | |
| | | | | | | | |
| | |
Total Canadian Energy Infrastructure Companies
(Cost $4,902,840) | | | | | | | 3,207,574 | |
| | | | | | | | |
| | |
U.S. Energy Infrastructure Companies (30.47%) | | | | | | | | |
Energy (16.97%) | | | | | | | | |
Columbia Pipeline Group, Inc. | | | 29,355 | | | | 562,735 | |
Kinder Morgan, Inc. | | | 23,106 | | | | 544,609 | |
Macquarie Infrastructure Corp. | | | 5,674 | | | | 425,720 | |
The Williams Cos., Inc. | | | 15,316 | | | | 559,953 | |
| | | | | | | | |
Total Energy | | | | | | | 2,093,017 | |
| | | | | | | | |
| | |
Utilities (13.50%) | | | | | | | | |
CenterPoint Energy, Inc. | | | 32,828 | | | | 556,435 | |
Dominion Resources, Inc. | | | 10,575 | | | | 712,438 | |
OGE Energy Corp. | | | 15,138 | | | | 395,253 | |
| | | | | | | | |
Total Utilities | | | | | | | 1,664,126 | |
| | | | | | | | |
| | |
Total U.S. Energy Infrastructure Companies
(Cost $4,739,405) | | | | | | | 3,757,143 | |
| | | | | | | | |
| | |
U.S. Energy Infrastructure MLPs (25.04%) | | | | | | | | |
Energy (24.57%) | | | | | | | | |
Buckeye Partners LP | | | 6,629 | | | | 448,717 | |
Cheniere Energy Partners LP | | | 2,309 | | | | 59,341 | |
Energy Transfer Equity LP | | | 26,460 | | | | 501,153 | |
Enterprise Products Partners LP | | | 26,091 | | | | 662,451 | |
EQT GP Holdings LP | | | 1,363 | | | | 31,117 | |
Magellan Midstream Partners LP | | | 10,270 | | | | 642,183 | |
MarkWest Energy Partners LP | | | 9,853 | | | | 472,944 | |
NuStar GP Holdings LLC | | | 1,786 | | | | 44,400 | |
Phillips 66 Partners LP | | | 1,229 | | | | 71,282 | |
Shell Midstream Partners LP | | | 2,762 | | | | 96,311 | |
| | | | | | | | |
Total Energy | | | | | | | 3,029,899 | |
| | | | | | | | |
| | |
Utilities (0.47%) | | | | | | | | |
Western Gas Equity Partners LP | | | 1,399 | | | | 58,366 | |
| | | | | | | | |
| | |
Total U.S. Energy Infrastructure MLPs
(Cost $4,262,884) | | | | | | | 3,088,265 | |
| | | | | | | | |
14 | November 30, 2015
| | |
| Alerian Energy Infrastructure ETF | | |
| Schedule of Investments | | November 30, 2015 |
| | | | | | | | | | | | |
| Security Description | | | | | Shares | | | Value | |
| |
Utilities (continued) | | | | | | | | | |
U.S. General Partners (18.11%) | | | | | | | | | |
Energy (18.11%) | | | | | | | | | |
Archrock, Inc. | | | | 6,764 | | | $ | 71,496 | |
EnLink Midstream LLC | | | | 4,666 | | | | 78,716 | |
Exterran Corp. | | | | 3,382 | | | | 55,363 | |
ONEOK, Inc. | | | | 20,084 | | | | 592,076 | |
Plains GP Holdings LP, Class A | | | | 24,649 | | | | 302,197 | |
SemGroup Corp., Class A | | | | 4,454 | | | | 154,687 | |
Spectra Energy Corp. | | | | 25,511 | | | | 668,388 | |
Tallgrass Energy GP LP | | | | 4,747 | | | | 104,244 | |
Targa Resources Corp. | | | | 5,233 | | | | 205,657 | |
| | | | | | | | | | | | |
Total Energy | | | | | | | | 2,232,824 | |
| | | | | | | | | | | | |
| | |
Total U.S. General Partners
(Cost $4,249,841) | | | | | | | | 2,232,824 | |
| | | | | | | | | | | | |
| | | |
| | | 7 Day Yield | | | Shares | | | Value | |
| |
Short Term Investments (0.12%) | | | | | | | | | | | | |
Morgan Stanley Institutional Liquidity Funds, Prime Portfolio | | | 0.105% | | | | 14,510 | | | | 14,510 | |
| | | | | | | | | | | | |
| | | |
Total Short Term Investments
(Cost $14,510) | | | | | | | | | | | 14,510 | |
| | | | | | | | | | | | |
| | | |
Total Investments (99.75%)
(Cost $18,169,480) | | | | | | | | | | $ | 12,300,316 | |
| | |
Net Other Assets and Liabilities (0.25%) | | | | | | | | 30,577 | |
| | | | | | | | | | | | |
| | |
Net Assets (100.00%) | | | | | | | $ | 12,330,893 | |
| | | | | | | | | | | | |
Common Abbreviations:
LLC - Limited Liability Company.
LP - Limited Partnerships.
Ltd. - Limited.
See Notes to Financial Statements.
15 | November 30, 2015
| | |
| Alerian Energy Infrastructure ETF | | |
| Statement of Assets and Liabilities | | November 30, 2015 |
| | | | |
ASSETS: | | | | |
Investments, at value | | $ | 12,300,316 | |
Dividends receivable | | | 37,362 | |
| |
Total Assets | | | 12,337,678 | |
| |
| |
LIABILITIES: | | | | |
Payable to adviser | | | 6,785 | |
| |
Total Liabilities | | | 6,785 | |
| |
NET ASSETS | | $ | 12,330,893 | |
| |
| |
NET ASSETS CONSIST OF: | | | | |
Paid-in capital | | $ | 18,540,712 | |
Accumulated net investment loss | | | (96,943) | |
Accumulated net realized loss on investments and foreign currency transactions | | | (243,607) | |
Net unrealized depreciation on investments and translation of assets and liabilities denominated in foreign currencies | | | (5,869,269) | |
| |
NET ASSETS | | $ | 12,330,893 | |
| |
| |
INVESTMENTS, AT COST | | $ | 18,169,480 | |
| |
PRICING OF SHARES | | | | |
Net Assets | | $ | 12,330,893 | |
Shares of beneficial interest outstanding (Unlimited number of shares authorized, par value $0.01 per share) | | | 650,000 | |
Net Asset Value, offering and redemption price per share | | $ | 18.97 | |
See Notes to Financial Statements.
16 | November 30, 2015
| | |
| Alerian Energy Infrastructure ETF | | |
| Statement of Operations | | For the Year Ended November 30, 2015 |
| | | | |
INVESTMENT INCOME: | | | | |
Dividends | | $ | 699,938 | |
Foreign taxes withheld | | | (30,802) | |
| |
Total Investment Income | | | 669,136 | |
| |
| |
EXPENSES: | | | | |
Investment adviser fees | | | 109,860 | |
| |
Total Expenses | | | 109,860 | |
| |
NET INVESTMENT INCOME | | | 559,276 | |
| |
| |
REALIZED AND UNREALIZED GAIN/(LOSS): | | | | |
Net realized loss on investments | | | (426,530) | |
Net realized loss on foreign currency transactions | | | (1,629) | |
| |
Net realized loss | | | (428,159) | |
| |
Net change in unrealized depreciation on investments | | | (5,827,945) | |
Net change in unrealized appreciation on translation of assets and liabilities denominated in foreign currencies | | | 59 | |
| |
Net change in unrealized depreciation | | | (5,827,886) | |
| |
NET REALIZED AND UNREALIZED LOSS ON INVESTMENTS AND FOREIGN CURRENCIES | | | (6,256,045) | |
| |
NET DECREASE IN NET ASSETS RESULTING FROM OPERATIONS | | $ | (5,696,769) | |
| |
See Notes to Financial Statements.
17 | November 30, 2015
| | |
| Alerian Energy Infrastructure ETF | | |
| Statements of Changes in Net Assets |
| | | | | | | | |
| | | For the Year Ended
November 30, 2015 | | | For the Year Ended
November 30, 2014 | |
| |
OPERATIONS: | | | | | | | | |
Net investment income | | $ | 559,276 | | | $ | 290,233 | |
Net realized gain/(loss) on investments and foreign currency transactions | | | (428,159) | | | | 320,592 | |
Net change in unrealized depreciation on investments and translation of assets and liabilities denominated in foreign currencies | | | (5,827,886) | | | | (19,576) | |
| |
Net increase/(decrease) in net assets resulting from operations | | | (5,696,769) | | | | 591,249 | |
| |
| | |
DISTRIBUTIONS: | | | | | | | | |
From net investment income | | | (327,210) | | | | (191,603) | |
Dividends to shareholders from tax return of capital | | | (103,622) | | | | – | |
| |
Total distributions | | | (430,832) | | | | (191,603) | |
| |
| | |
CAPITAL SHARE TRANSACTIONS: | | | | | | | | |
Proceeds from sale of shares | | | 4,130,424 | | | | 18,346,104 | |
Cost of shares redeemed | | | (2,802,773) | | | | (5,344,237) | |
| |
Net increase from share transactions | | | 1,327,651 | | | | 13,001,867 | |
| |
Net increase/(decrease) in net assets | | | (4,799,950) | | | | 13,401,513 | |
| | |
NET ASSETS: | | | | | | | | |
Beginning of period | | | 17,130,843 | | | | 3,729,330 | |
| |
End of period * | | $ | 12,330,893 | | | $ | 17,130,843 | |
| |
| | |
*Including accumulated net investment income/(loss) of: | | $ | (96,943) | | | $ | 35,972 | |
| | |
OTHER INFORMATION: | | | | | | | | |
CAPITAL SHARE TRANSACTIONS: | | | | | | | | |
Beginning shares | | | 600,002 | | | | 150,002 | |
Shares sold | | | 150,000 | | | | 650,000 | |
Shares redeemed | | | (100,002) | | | | (200,000) | |
| |
Shares outstanding, end of period | | | 650,000 | | | | 600,002 | |
| |
See Notes to Financial Statements.
18 | November 30, 2015
| | |
| Alerian Energy Infrastructure ETF | | |
| Financial Highlights | | For a Share Outstanding Throughout the Periods Presented |
| | | | | | | | | | | | |
| | | | | | | | | For the Period | |
| | | | | | | | | November 1, | |
| | | | | | | | | 2013 | |
| | | For the Year | | | For the Year | | | (Commencement | |
| | | Ended | | | Ended | | | of Operations) to | |
| | | November 30, | | | November 30, | | | November 30, | |
| | | 2015 | | | 2014 | | | 2013 | |
| |
| NET ASSET VALUE, BEGINNING OF PERIOD | | $ | 28.55 | | | $ | 24.86 | | | $ | 25.00 | |
| | | |
| INCOME/(LOSS) FROM INVESTMENT OPERATIONS: | | | | | | | | | | | | |
Net investment income(a) | | | 0.83 | | | | 0.85 | | | | 0.06 | |
Net realized and unrealized gain/(loss) | | | (9.78) | | | | 3.40 | | | | (0.20) | |
| |
Total from investment operations | | | (8.95) | | | | 4.25 | | | | (0.14) | |
| |
| | | |
| DISTRIBUTIONS: | | | | | | | | | | | | |
From net investment income | | | (0.48) | | | | (0.56) | | | | – | |
Tax return of capital | | | (0.15) | | | | – | | | | – | |
| |
Total distributions | | | (0.63) | | | | (0.56) | | | | – | |
| |
| | | |
| NET INCREASE/(DECREASE) IN NET ASSET VALUE | | | (9.58) | | | | 3.69 | | | | (0.14) | |
| |
| NET ASSET VALUE, END OF PERIOD | | $ | 18.97 | | | $ | 28.55 | | | $ | 24.86 | |
| |
| TOTAL RETURN(b) | | | (31.83) | % | | | 17.12 | % | | | (0.56)% | |
| | | |
| RATIOS/SUPPLEMENTAL DATA: | | | | | | | | | | | | |
Net assets, end of period (000s) | | $ | 12,331 | | | $ | 17,131 | | | $ | 3,729 | |
| | | |
Ratio of expenses to average net assets | | | 0.65 | % | | | 0.65 | % | | | 0.65%(c) | |
Ratio of net investment income to average net assets | | | 3.31 | % | | | 2.98 | % | | | 3.21%(c) | |
Portfolio turnover rate(d) | | | 47 | % | | | 27 | % | | | 0% | |
| |
| (a) | Based on average shares outstanding during the period. |
| (b) | Total return is calculated assuming an initial investment made at the net assets value at the beginning of the period and redemption at the net asset value on the last day of the period, and assuming all distributions are reinvested at actual reinvestment prices. Total return calculated for a period of less than one year is not annualized. |
| (d) | Portfolio turnover is not annualized and does not include securities received or delivered from processing creations or redemptions. |
See Notes to Financial Statements.
19 | November 30, 2015
| | |
| Alerian Exchange Traded Funds | | |
| Notes to Financial Statements | | November 30, 2015 |
1. ORGANIZATION
The ALPS ETF Trust (the “Trust”), a Delaware statutory trust, is an open-end management investment company registered under the Investment Company Act of 1940, as amended (the “1940 Act”). As of November 30, 2015, the Trust consisted of twenty-one separate portfolios. Each portfolio represents a separate series of the Trust. This report pertains to the Alerian MLP ETF and the Alerian Energy Infrastructure ETF (each a “Fund” and collectively, the “Funds”).
The investment objective of the Alerian MLP ETF is to seek investment results that correspond (before fees and expenses) generally to the price and yield performance of its underlying index, the Alerian MLP Infrastructure Index. The investment objective of the Alerian Energy Infrastructure ETF is to seek investment results that correspond (before fees and expenses) generally to the price and yield performance of its underlying index, the Alerian Energy Infrastructure Index. The investment advisor uses a “passive” or indexing approach to try to achieve each Fund’s investment objective. Each Fund is considered non-diversified and may invest a greater portion of assets in securities of individual issuers than a diversified fund. As a result, changes in the market value of a single investment could cause greater fluctuations in share price than would occur in a diversified fund.
Each Fund’s Shares (“Shares”) are listed on the New York Stock Exchange (“NYSE”) Arca. Each Fund issues and redeems Shares at net asset value (“NAV”), in blocks of 50,000 Shares, each of which is called a “Creation Unit”. Creation Units are issued and redeemed principally in-kind for securities included in a specified index. Except when aggregated in Creation Units, Shares are not redeemable securities of the Fund.
Pursuant to the Trust’s organizational documents, its Officers and Trustees are indemnified against certain liability arising out of the performance of their duties to the Trust. Additionally, in the normal course of business, the Trust enters into contracts with service providers that contain general indemnification clauses. The Trust’s maximum exposure under these arrangements is unknown, as this would involve future claims that may be made against the Trust that have not yet occurred.
2. SIGNIFICANT ACCOUNTING POLICIES
The following is a summary of significant accounting policies consistently followed by the Funds in the preparation of the financial statements. The accompanying financial statements were prepared in accordance with accounting principles generally accepted in the United States of America (“U.S. GAAP”). The preparation of financial statements in conformity with U.S. GAAP requires management to make certain estimates and assumptions that affect the reported amounts of assets and liabilities and disclosures of contingent assets and liabilities at the date of the financial statements and the reported amounts of revenue and expenses during the period. Actual results could differ from those estimates. Each Fund is considered an investment company under U.S. GAAP and follows the accounting and reporting guidance applicable to investment companies in the Financial Accounting Standards Board Accounting Standards Codification Topic 946.
A. Portfolio Valuation
Each Fund’s NAV is determined daily, as of the close of regular trading on the NYSE, normally 4:00 p.m. Eastern Time, on each day the NYSE is open for trading. The NAV is computed by dividing the value of all assets of the Fund (including accrued interest and dividends), less all liabilities (including accrued expenses and dividends declared but unpaid), by the total number of shares outstanding.
Portfolio securities listed on any exchange other than the NASDAQ Stock Market LLC (“NASDAQ”) are valued at the last sale price on the business day as of which such value is being determined. If there has been no sale on such day, the securities are valued at the mean of the most recent bid and ask prices on such day. Securities traded on the NASDAQ are valued at the NASDAQ Official Closing Price as determined by NASDAQ. Portfolio securities traded on more than one securities exchange are valued at the last sale price on the business day as of which such value is being determined at the close of the exchange representing the principal market for such securities. Portfolio securities traded in the over-the-counter market, but excluding securities traded on the NASDAQ, are valued at the latest quoted sale price in such market.
The Funds’ investments are valued at market value or, in the absence of market value with respect to any portfolio securities, at fair value according to procedures adopted by the Trust’s Board of Trustees (the “Board”). When market quotations are not readily available or when events occur that make established valuation methods unreliable, securities of the Funds may be valued in good faith by or under the direction of the Board. These securities generally include, but are not limited to, restricted securities (securities which may not be publicly sold without registration under the Securities Act of 1933) for which a pricing service is unable to provide a market price; securities whose trading has been formally suspended; a security whose market price is not available from a pre-established primary pricing source or the pricing source is not willing to provide a price; a security with respect to which an event has occurred that is most likely to materially affect the value of the security after the market has closed but before the calculation of the Funds’ NAV or make it difficult or impossible to obtain a reliable market quotation; or a security whose price, as provided by the pricing service, does not reflect the security’s “fair value” due to the security being de-listed from a national exchange or the security’s primary trading market is temporarily closed at a time when, under normal conditions, it would be open. As a general
20 | November 30, 2015
| | |
| Alerian Exchange Traded Funds | | |
| Notes to Financial Statements | | November 30, 2015 |
principle, the current “fair value” of a security would be the amount which the owner might reasonably expect to receive from the closing sale prices on the applicable exchange and fair value prices may not reflect the actual value of a security. A variety of factors may be considered in determining the fair value of such securities.
B. Fair Value Measurements
Each Fund discloses the classification of its fair value measurements following a three-tier hierarchy based on the inputs used to measure fair value. Inputs refer broadly to the assumptions that market participants would use in pricing the asset or liability, including assumptions about risk. Inputs may be observable or unobservable. Observable inputs reflect the assumptions market participants would use in pricing the asset or liability that are developed based on market data obtained from sources independent of the reporting entity. Unobservable inputs reflect the reporting entity’s own assumptions about the assumptions market participants would use in pricing the asset or liability that are developed based on the best information available.
Valuation techniques used to value the Funds’ investments by major category are as follows:
Equity securities, including restricted securities, and Limited Partnerships for which market quotations are readily available, are valued at the last reported sale price or official closing price as reported by a third party pricing vendor on the primary market or exchange on which they are traded and are categorized as Level 1 in the hierarchy. In the event there were no sales during the day or closing prices are not available, securities are valued at the mean of the most recent quoted bid and ask prices on such day and are generally categorized as Level 2 in the hierarchy. Investments in open-end mutual funds are valued at their closing NAV each business day and are categorized as Level 1 in the hierarchy.
Changes in valuation techniques may result in transfers in or out of an assigned level within the disclosure hierarchy.
Various inputs are used in determining the value of the Funds’ investments as of the end of the reporting period. When inputs used fall into different levels of the fair value hierarchy, the level in the hierarchy within which the fair value measurement falls is determined based on the lowest level input that is significant to the fair value measurement in its entirety. The designated input levels are not necessarily an indication of the risk or liquidity associated with these investments.
These inputs are categorized in the following hierarchy under applicable financial accounting standards:
| | |
Level 1 – | | Unadjusted quoted prices in active markets for identical investments, unrestricted assets or liabilities that a Fund has the ability to access at the measurement date; |
Level 2 – | | Quoted prices which are not active, quoted prices for similar assets or liabilities in active markets or inputs other than quoted prices that are observable (either directly or indirectly) for substantially the full term of the asset or liability; and |
Level 3 – | | Significant unobservable prices or inputs (including the Fund’s own assumptions in determining the fair value of investments) where there is little or no market activity for the asset or liability at the measurement date. |
The following is a summary of the inputs used to value each Fund’s investments at November 30, 2015:
Alerian MLP ETF
| | | | | | | | | | | | | | | | |
| | | | | | Level 2- Other | | | Level 3- Significant | | | | |
| | | Level 1- Unadjusted | | | Significant | | | Unobservable | | | | |
| Investments in Securities at Value* | | Quoted Prices | | | Observable Inputs | | | Inputs | | | Total | |
| |
Master Limited Partnerships | | $ | 7,203,803,193 | | | $ | – | | | $ | – | | | $ | 7,203,803,193 | |
Short Term Investments | | | 5,373,264 | | | | – | | | | – | | | | 5,373,264 | |
| |
TOTAL | | $ | 7,209,176,457 | | | $ | – | | | $ | – | | | $ | 7,209,176,457 | |
| |
21 | November 30, 2015
| | |
| Alerian Exchange Traded Funds | | |
| Notes to Financial Statements | | November 30, 2015 |
Alerian Energy Infrastructure ETF
| | | | | | | | | | | | | | | | |
| | | | | | Level 2- Other | | | Level 3- Significant | | | | |
| | | Level 1- Unadjusted | | | Significant | | | Unobservable | | | | |
| Investments in Securities at Value* | | Quoted Prices | | | Observable Inputs | | | Inputs | | | Total | |
| |
Canadian Energy Infrastructure Companies | | $ | 3,207,574 | | | $ | – | | | $ | – | | | $ | 3,207,574 | |
U.S. Energy Infrastructure Companies | | | 3,757,143 | | | | – | | | | – | | | | 3,757,143 | |
U.S. Energy Infrastructure MLPs | | | 3,088,265 | | | | – | | | | – | | | | 3,088,265 | |
U.S. General Partners | | | 2,232,824 | | | | – | | | | – | | | | 2,232,824 | |
Short-Term Investments | | | 14,510 | | | | – | | | | – | | | | 14,510 | |
| |
TOTAL | | $ | 12,300,316 | | | $ | – | | | $ | – | | | $ | 12,300,316 | |
| |
| * | For a detailed breakdown of sectors, see the accompanying Schedule of Investments. |
Each Fund recognizes transfers between levels as of the end of the period. For the year ended November 30, 2015, the Funds did not have any transfers between Level 1 and Level 2 securities. The Funds did not have any securities which used significant unobservable inputs (Level 3) in determining fair value.
C. Foreign Currency Translation
The books and records of the Fund are maintained in U.S. dollars. Investment valuations and other assets and liabilities initially expressed in foreign currencies are converted each business day into U.S. dollars based upon current exchange rates. The portion of realized and unrealized gains or losses on investments due to fluctuations in foreign currency exchange rates is not separately disclosed and is included in realized and unrealized gains or losses on investments, when applicable.
D. Securities Transactions and Investment Income
Securities transactions are recorded as of the trade date. Realized gains and losses from securities transactions are recorded on the last in, first out (“LIFO”) cost basis. Dividend income and capital gains distributions, if any, are recorded on the ex-dividend date, net of any foreign taxes withheld. Interest income, if any, is recorded on the accrual basis, including amortization of premiums and accretion of discounts.
E. Dividends and Distributions to Shareholders
Each Fund intends to declare and make quarterly distributions, or as the Board may determine from time to time. Distributions of net realized capital gains earned by the Alerian Energy Infrastructure ETF, if any, are distributed at least annually. Distributions from net investment income and capital gains are determined in accordance with income tax regulations, which may differ from U.S. GAAP. These differences are primarily due to differing treatments of income and gains on various investment securities held by the Funds, timing differences and differing characterization of distributions made by the Funds.
Distributions received from each Fund’s investments in Master Limited Partnerships (“MLPs”) may be comprised of both income and return of capital. Each Fund records investment income and return of capital based on estimates made at the time such distributions are received. Such estimates are based on historical information available from each MLP and other industry sources. These estimates may subsequently be revised based on information received from MLPs after their tax reporting periods are concluded. For the year ended November 30, 2015, the Alerian MLP ETF distributed $647,133,076 of which 100% is anticipated to be characterized as return of capital from MLP distributions received.
The Alerian MLP ETF also expects a portion of the distributions it receives from MLPs to be treated as a tax deferred return of capital, thus reducing the Alerian MLP ETF’s current tax liability. Return of capital distributions are not taxable income to the shareholder, but reduce the investor’s tax basis in the investor’s Fund Shares. Such a reduction in tax basis will result in larger taxable gains and/or lower tax losses on a subsequent sale of Fund Shares. Shareholders who periodically receive the payment of dividends or other distributions consisting of a return of capital may be under the impression that they are receiving net profits from the Funds when, in fact, they are not. Shareholders should not assume that the source of the distributions is from the net profits of the Funds.
22 | November 30, 2015
| | |
| Alerian Exchange Traded Funds | | |
| Notes to Financial Statements | | November 30, 2015 |
F. Federal Income Taxation and Tax Basis Information
Alerian MLP ETF
The Alerian MLP ETF is taxed as a regular C-corporation for federal income tax purposes. Currently, the maximum marginal regular federal income tax rate for a corporation is 35 percent. The Fund may be subject to a 20 percent federal alternative minimum tax on its federal alternative taxable income to the extent that its alternative minimum tax exceeds its regular federal income tax. This differs from most investment companies, which elect to be treated as “regulated investment companies” under the Code in order to avoid paying entity level income taxes. Under current law, the Fund is not eligible to elect treatment as a regulated investment company due to its investments primarily in MLPs invested in energy assets. As a result, the Fund will be obligated to pay applicable federal and state corporate income taxes on its taxable income as opposed to most other investment companies which are not so obligated. The Fund expects that a portion of the distributions it receives from MLPs may be treated as a tax-deferred return of capital, thus reducing the Fund’s current tax liability. However, the amount of taxes currently paid by the Fund will vary depending on the amount of income and gains derived from investments and/or sales of MLP interests and such taxes will reduce an investor’s return from an investment in the Fund.
Cash distributions from MLPs to the Fund that exceed such Fund’s allocable share of such MLP’s net taxable income are considered a tax-deferred return of capital that will reduce the Fund’s adjusted tax basis in the equity securities of the MLP. These reductions in such Fund’s adjusted tax basis in the MLP equity securities will increase the amount of gain (or decrease the amount of loss) recognized by the Fund on a subsequent sale of the securities. The Fund will accrue deferred income taxes for any future tax liability associated with (i) that portion of MLP distributions considered to be a tax-deferred return of capital as well as (ii) capital appreciation of its investments. Upon the sale of an MLP security, the Fund may be liable for previously deferred taxes. The Fund’s accrued deferred tax liability will be reflected each day in the Fund’s NAV. Increases in deferred tax liability will decrease NAV. Conversely, decreases in deferred liability will increase NAV. The Fund will rely to a large extent on information provided by the MLPs, which is not necessarily timely, to estimate deferred tax liability for purposes of financial statement reporting and determining the NAV. From time to time, ALPS Advisors, Inc. will modify the estimates or assumptions related to the Fund’s deferred tax liability as new information becomes available. The Fund’s estimates regarding its deferred tax liability are made in good faith, however, the daily estimate of the Fund’s deferred tax liability used to calculate the Fund’s NAV could vary significantly from the Fund’s actual tax liability. The Fund will generally compute deferred income taxes based on the federal income tax rate applicable to corporations currently 35% and an assumed rate attributable to state taxes.
The Fund recognizes interest and penalties related to unrecognized tax benefits within the income tax expense line in the accompanying statement of operations. Accrued interest and penalties are included within the related tax liability line in the balance sheet.
Since the Fund will be subject to taxation on its taxable income, the NAV of Fund shares will also be reduced by the accrual of any deferred tax liabilities. The Underlying Index however is calculated without any deductions for taxes. As a result, the Fund’s after tax performance could differ significantly from the Underlying Index even if the pretax performance of the Fund and the performance of the Underlying Index are closely correlated.
The Fund’s income tax expense/(benefit) consists of the following:
| | | | | | | | | | | | |
| Alerian MLP ETF | | Year ended November 30, 2015 | |
| |
| | | Current | | | Deferred | | | Total | |
| |
Federal | | $ | – | | | $ | (1,253,310,484) | | | $ | (1,253,310,484) | |
State | | | – | | | | (70,047,734) | | | | (70,047,734) | |
Valuation Allowance | | | – | | | | 284,042,840 | | | | 284,042,840 | |
| |
Total tax benefit | | $ | – | | | $ | (1,039,315,378) | | | $ | (1,039,315,378) | |
| |
Deferred income taxes reflect the net tax effect of temporary differences between the carrying amount of assets and liabilities for financial reporting and tax purposes.
Components of the Fund’s deferred tax assets and liabilities are as follows:
| | | | | | | | |
| Alerian MLP ETF | | As of November 30, 2015 | |
| |
Deferred tax assets: | | | | | | | | |
Accrued franchise taxes | | $ | | | | | 197,673 | |
Charitable contribution carryforward | | | | | | | 290,890 | |
Income recognized from MLP investments | | | 196,528,392 | |
23 | November 30, 2015
| | |
| Alerian Exchange Traded Funds | | |
| Notes to Financial Statements | | November 30, 2015 |
| | | | |
| Alerian MLP ETF | | As of November 30, 2015 | |
| |
Credit for prior year minimum tax | | | 331,761 | |
Federal net operating loss carryforward | | | 411,891,327 | |
Federal capital loss carryforward | | | 8,260,490 | |
State Taxes Net of Federal benefit | | | 20,093,436 | |
Valuation Allowance | | | (284,042,840) | |
Less Deferred tax liabilities: | | | | |
Net unrealized gain on investment securities | | | (353,551,129) | |
| |
Net Deferred tax asset | | $ | – | |
| |
The net operating loss carryforward is available to offset future taxable income. The net operating loss can be carried forward for 20 years and, accordingly, would begin to expire as of November 30, 2032. The Fund has net operating loss carryforwards for federal income tax purposes as follows:
| | | | | | | | |
| Alerian MLP ETF | | Period-Ended | | Amount | | | Expiration |
|
Federal | | 11/30/2012 | | $ | 92,112,756 | | | 11/30/2032 |
Federal | | 11/30/2013 | | | 349,770,934 | | | 11/30/2033 |
Federal | | 11/30/2014 | | | 64,228,395 | | | 11/30/2034 |
Federal | | 11/30/2015 | | | 670,720,279 | | | 11/30/2035 |
|
Total tax expense | | | | $ | 1,176,832,364 | | | |
|
The Fund also has state tax net operating loss carryforwards of various amounts per state. The Deferred Tax Assets associated with these state tax net operating losses are as follows: |
| Alerian MLP ETF | | Period-Ended | | Amount | | | Expiration |
|
State | | 11/30/2012 | | $ | 2,950,477 | | | Varies by State (5-20 years) |
State | | 11/30/2013 | | | 10,853,441 | | | Varies by State (5-20 years) |
State | | 11/30/2014 | | | 1,931,661 | | | Varies by State (5-20 years) |
State | | 11/30/2015 | | | 13,079,045 | | | Varies by State (5-20 years) |
|
Total tax expense | | | | $ | 28,814,624 | | | |
|
The capital loss carryforward is available to offset future taxable income. The capital loss can be carried forward for 5 years and, accordingly, would begin to expire as of November 30, 2020. The Fund has net capital loss carryforwards for federal income tax purposes as follows: |
| Alerian MLP ETF | | Year-Ended | | Amount | | | Expiration |
|
Federal | | 11/30/2015 | | $ | 23,601,401 | | | 11/30/2020 |
|
Total tax expense | | | | $ | 23,601,401 | | | |
|
The Fund reviews the recoverability of its deferred tax assets based upon the weight of available evidence. When assessing the recoverability of its deferred tax assets, significant weight was given to the effects of potential future realized and unrealized gains on investments and the period over which these deferred tax assets can be realized. Currently, any capital losses that may be generated by the Fund in the future are eligible to be carried back up to three years and can be carried forward for five years to offset capital gains recognized by the fund in those years. Net operating losses that may be generated by the Fund in the future are eligible to be carried back up to two years and can be carried forward for 20 years to offset income generated by the Fund in those years.
Based upon the Fund’s assessment, it has determined that it is not more likely than not that its deferred tax assets will be realized through future taxable income of the appropriate character. Accordingly, a valuation allowance has been established for the Fund’s deferred tax assets. The Fund will continue to assess the need for a valuation allowance in the future. Significant increases in the fair value of its portfolio of investments may change the Fund’s assessment of the recoverability of these assets and may result in a reduction of the valuation allowance against all or a portion of the Fund’s gross deferred tax assets.
24 | November 30, 2015
| | |
| Alerian Exchange Traded Funds | | |
| Notes to Financial Statements | | November 30, 2015 |
Total income tax benefit (current and deferred) differs from the amount computed by applying the federal statutory income tax rate of 35% to net investment and realized and unrealized gain/(losses) on investment before taxes as follows:
| | | | |
| Alerian MLP ETF | | As of November 30, 2015 | |
| |
Income tax expense at statutory rate | | $ | (1,250,520,940) | |
State income tax benefit (net of federal benefit) | | | (69,671,881) | |
Permanent differences, net | | | (2,340,280) | |
Change in estimated state deferral rate | | | – | |
Other | | | (825,117) | |
Valuation Allowance | | | 284,042,840 | |
| |
Net income tax benefit | | $ | (1,039,315,378) | |
| |
The following is a tabular reconciliation of the total amounts of unrecognized tax benefits: | |
| Alerian MLP ETF | | Inception to November 30, 2015 | |
| |
Unrecognized tax benefit - Beginning | | $ | – | |
Gross increases - tax positions in prior period | | | – | |
Gross decreases - tax positions in prior period | | | – | |
Gross increases - tax positions in current period | | | – | |
Settlement | | | – | |
Lapse of statute of limitations | | | – | |
| |
Unrecognized tax benefit - Ending | | $ | – | |
| |
The Fund recognizes interest accrued related to unrecognized tax benefits and penalties as income tax expense. For the period from inception to November 30, 2015, the Fund had no accrued penalties or interest.
The Fund recognizes the tax benefits of uncertain tax positions only where the position is “more likely than not” to be sustained assuming examination by tax authorities. Management has analyzed the Fund’s tax positions, and has concluded that no liability for unrecognized tax benefits should be recorded related to uncertain tax positions taken on U.S. tax returns and state tax returns filed since inception of the fund. Tax periods ended November 30, 2012 through November 30, 2015 remain subject to examination by tax authorities in the United States. Due to the nature of the Fund’s investments, the Fund may be required to file income tax returns in several states. The Fund is not aware of any tax positions for which it is reasonably possible that the total amounts of unrecognized tax benefits will change materially in the next 12 months.
Alerian Energy Infrastructure ETF
The timing and character of income and capital gain distributions are determined in accordance with income tax regulations, which may differ from U.S. GAAP. Reclassifications are made to the Fund’s capital accounts for permanent tax differences to reflect income and gains available for distribution (or available capital loss carryforwards) under income tax regulations.
No provision for income taxes is included in the accompanying financial statements, as the Alerian Energy Infrastructure ETF intends to distribute to shareholders all taxable investment income and realized gains and otherwise comply with Subchapter M of the Internal Revenue Code of 1986, as amended, applicable to regulated investment companies. The Alerian Energy Infrastructure ETF evaluates tax positions taken (or expected to be taken) in the course of preparing the Fund’s tax returns to determine whether these positions meet a “more-likely-than-not” standard that, based on the technical merits, have a more than fifty percent likelihood of being sustained by a taxing authority upon examination. A tax position that meets the “more-likely-than-not” recognition threshold is measured to determine the amount of benefit to recognize in the financial statements.
As of and during the year ended November 30, 2015, the Alerian Energy Infrastructure ETF did not have a liability for any unrecognized tax benefits. The Alerian Energy Infrastructure ETF files U.S. federal, state, and local tax returns as required. The Fund’s tax returns are subject to examination by the relevant tax authorities until expiration of the applicable statute of limitations which is generally three years after the filing of the tax return, but may extend to four years in certain jurisdictions. Tax returns for open years have incorporated no uncertain tax positions that require a provision for income taxes.
25 | November 30, 2015
| | |
| Alerian Exchange Traded Funds | | |
| Notes to Financial Statements | | November 30, 2015 |
For the year ended November 30, 2015, permanent book and tax differences resulting primarily from differing treatment of investments in partnerships were identified and reclassified among components of the Fund’s net assets as follows:
| | | | | | | | | | | | |
| Fund | | Accumulated Net
Investment Loss | | | Accumulated Net Realized
Loss on Investments | | | Paid-in Capital | |
| |
Alerian Energy Infrastructure ETF | | $ | (364,981 | ) | | $ | 129,552 | | | $ | 235,429 | |
At November 30, 2015, the Fund had available for tax purposes unused capital loss carryforwards as follows: | |
| | | | | | Short-Term | | | Long-Term | |
| |
Alerian Energy Infrastructure ETF | | | | | | $ | 555,969 | | | $ | – | |
The tax character of the distributions paid during the years ended November 30, 2015 and November 30, 2014 were as follows: | |
| | | Ordinary Income | | | Long-Term Capital Gain | | | Return of Capital | |
| |
November 30, 2015 | | | | | | | | | | | | |
Alerian Energy Infrastructure ETF | | $ | 327,210 | | | $ | – | | | $ | 103,622 | |
| | | |
| | | Ordinary Income | | | Long-Term Capital Gain | | | Return of Capital | |
| |
November 30, 2014 | | | | | | | | | | | | |
Alerian Energy Infrastructure ETF | | $ | 191,603 | | | $ | – | | | $ | – | |
As of November 30, 2015, the components of distributable earnings on a tax basis were as follows:
| | | | |
| | | Alerian Energy
Infrastructure ETF | |
Accumulated net realized loss on investments | | $ | (555,969) | |
Net unrealized depreciation on investments | | | (5,543,128) | |
Other accumulated losses | | | (110,722) | |
| |
Total | | $ | (6,209,819) | |
| |
As of November 30, 2015, the costs of investments for federal income tax purposes and accumulated net unrealized appreciation/(depreciation) on investments were as follows:
| | | | | | | | |
| | | Alerian MLP ETF | | | Alerian Energy
Infrastructure ETF | |
| |
Cost of investments for income tax purposes | | $ | 6,637,637,303 | | | $ | 17,843,339 | |
| |
Gross appreciation (excess of value over tax cost) | | $ | 1,900,550,749 | | | $ | 44,638 | |
Gross depreciation (excess of tax cost over value) | | | (1,329,011,595 | ) | | | (5,587,661) | |
Net depreciation of foreign currency | | | – | | | | (105) | |
| |
Net unrealized appreciation/(depreciation) | | $ | 571,539,154 | | | $ | (5,543,128) | |
| |
The difference between cost amounts for financial statement purposes is due primarily to the recognition of pass-through income from a Fund’s investments in master limited partnership and wash sales.
26 | November 30, 2015
| | |
| Alerian Exchange Traded Funds | | |
| Notes to Financial Statements | | November 30, 2015 |
3. INVESTMENT ADVISORY FEE AND OTHER AFFILIATED TRANSACTIONS
ALPS Advisors, Inc. (the “Adviser”) acts as each Fund’s investment adviser pursuant to advisory agreements with the Trust on behalf of each Fund (the “Advisory Agreements”). Pursuant to the Advisory Agreements, each Fund pays the Adviser a unitary fee for the services and facilities it provides payable on a monthly basis as a percentage of the relevant Fund’s average daily net assets as set out below.
| | | | |
| Fund | | | | Advisory Fee |
|
Alerian MLP ETF | | 0.85% | | up to an including $10 billion |
| | 0.80% | | greater than $10 billion up to an including $15 billion |
| | 0.755% | | greater than $15 billion up to and including $20 billion |
| | 0.715% | | greater than $20 billion |
| | |
Alerian Energy Infrastructure ETF | | 0.65% | | |
Out of the unitary management fees, the Adviser pays substantially all expenses of the Funds, including the cost of transfer agency, custody, fund administration, legal, audit, independent trustees and other services, except for taxes, interest expenses, distribution fees or expenses, brokerage expenses, and extraordinary expenses such as litigation, and other expenses not incurred in the ordinary course of the each Fund’s business. The Adviser’s unitary management fee is designed to pay substantially all the Funds’ expenses and to compensate the Adviser for providing services for each Fund.
ALPS Fund Services, Inc., an affiliate of the Adviser, is the administrator of the Funds.
Each Trustee who is not an officer or employee of the Adviser, any sub-adviser or any of their affiliates (“Independent Trustees”) receives (1) a quarterly retainer of $5,000, (2) a per meeting fee for regularly scheduled meetings of $3,750, (3) $1,500 for any special meeting held outside of a regularly scheduled board meeting, and (4) reimbursement for all reasonable out-of-pocket expenses relating to attendance at meetings.
4. PURCHASES AND SALES OF SECURITIES
For the year ended November 30, 2015, the cost of purchases and proceeds from sales of investment securities, excluding short-term investments and in-kind transactions, were as follows:
| | | | | | | | |
| Fund | | Purchases | | | Sales | |
| |
Alerian MLP ETF | | $ | 1,882,533,655 | | | $ | 2,713,505,425 | |
Alerian Energy Infrastructure ETF | | | 7,923,108 | | | | 7,750,094 | |
For the year ended November 30, 2015, the cost of in-kind purchases and proceeds from in-kind sales were as follows: | |
| Fund | | Purchases | | | Sales | |
| |
Alerian MLP ETF | | $ | 2,395,095,475 | | | $ | 664,650,938 | |
Alerian Energy Infrastructure ETF | | | 4,130,876 | | | | 2,801,258 | |
The Alerian MLP ETF and the Alerian Energy Infrastructure ETF had in-kind net realized gain/(loss) of $15,713,055 and $257,473, respectively.
Gains on in-kind transactions are not considered taxable for federal income tax purposes.
5. MASTER LIMITED PARTNERSHIPS
MLPs are publicly traded partnerships engaged in, among other things, the transportation, storage and processing of minerals and natural resources, and are treated as partnerships for U.S. federal income tax purposes. By confining their operations to these specific activities, their interests, or units, are able to trade on public securities exchanges exactly like the shares of a corporation, without entity level taxation. To qualify as a MLP and to not be taxed as a corporation, a partnership must receive at least 90% of its income from qualifying sources as set forth in Section 7704(d) of the Internal Revenue Code of 1986, as amended (the “Code”). These qualifying sources include, among other things, natural resource-based activities such as the processing, transportation and storage of mineral or natural resources. MLPs generally have two classes of owners, the general partner and limited partners. The general partner of an MLP is typically owned by a major energy company, an investment fund, the direct management of the MLP, or is an entity owned by one or more of such parties. The general partner may be structured as a private or publicly traded corporation or other entity. The general partner typically controls the operations and management of the MLP through an up to 2% equity
27 | November 30, 2015
| | |
| Alerian Exchange Traded Funds | | |
| Notes to Financial Statements | | November 30, 2015 |
interest in the MLP plus, in many cases, ownership of common units and subordinated units. Limited partners typically own the remainder of the partnership, through ownership of common units, and have a limited role in the partnership’s operations and management.
MLPs are typically structured such that common units and general partner interests have first priority to receive quarterly cash distributions up to an established minimum amount (“minimum quarterly distributions” or “MQD”). Common and general partner interests also accrue arrearages in distributions to the extent the MQD is not paid. Once common and general partner interests have been paid, subordinated units receive distributions of up to the MQD; however, subordinated units do not accrue arrearages. Distributable cash in excess of the MQD is distributed to both common and subordinated units and generally on a pro rata basis. The general partner is also eligible to receive incentive distributions if the general partner operates the business in a manner which results in distributions paid per common unit surpassing specified target levels. As the general partner increases cash distributions to the limited partners, the general partner receives an increasingly higher percentage of the incremental cash distributions.
6. CAPITAL SHARE TRANSACTIONS
Shares are created and redeemed by each Fund only in Creation Unit size aggregations of 50,000. Only broker-dealers or large institutional investors with creation and redemption agreements called Authorized Participants (“AP”) are permitted to purchase or redeem Creation Units from the Funds. Such transactions are generally permitted on an in-kind basis, with a balancing cash component to equate the transaction to the NAV per unit of each Fund on the transaction date. Cash may be substituted equivalent to the value of certain securities generally when they are not available in sufficient quantity for delivery, not eligible for trading by the AP or as a result of other market circumstances.
28 | November 30, 2015
| | |
| Alerian Exchange Traded Funds | | |
| Additional Information | | November 30, 2015 (Unaudited) |
PROXY VOTING RECORDS, POLICIES AND PROCEDURES
Information regarding how the Fund voted proxies relating to portfolio securities during the most recent 12-month period ended June 30 and a description of the Fund’s proxy voting policies and procedures used in determining how to vote for proxies are available without charge on the Securities and Exchange Commission’s (“SEC”) website at www.sec.gov and upon request, by calling (toll-free) 1-866-675-2639.
PORTFOLIO HOLDINGS
The Trust is required to disclose, after its first and third fiscal quarters, the complete schedule of each Fund’s portfolio holdings with the SEC on Form N-Q. Form N-Q for each Fund will be available on the SEC’s website at www.sec.gov. Each Fund’s Form N-Q may also be reviewed and copied at the SEC’s Public Reference Room in Washington, D.C. and information on the operation of the Public Reference Room may be obtained by calling 1-800-SEC-0330. Each Fund’s Form N-Q will be available without charge, upon request, by calling (toll-free) 1-866-675-2639 or by writing to ALPS ETF Trust at 1290 Broadway, Suite 1100, Denver, Colorado 80203.
TAX INFORMATION (Unaudited)
The Fund designates the following for federal income tax purposes for distributions made during the calendar year ended December 31, 2014:
| | | | |
| | | Qualified Dividend Income | | Dividend Received Deduction |
|
Alerian Energy Infrastructure ETF | | 100.00% | | 58.77% |
In early 2015, if applicable, shareholders of record received this information for the distributions paid to them by the Fund during the calendar year 2014 via Form 1099. The Fund will notify shareholders in early 2016 of amounts paid to them by the Fund, if any, during the calendar year 2015.
LICENSING AGREEMENTS
Alerian (the “Licensor”) has entered into an index licensing agreement with ALPS Advisors Inc. (the “Advisor”) with respect to each of the Alerian MLP ETF and the Alerian Energy Infrastructure ETF, to allow the Adviser’s use of AMZI and AMEI. The following disclosure relates to the Licensor:
Alerian is the designer of the construction and methodology for the underlying index (each an “Underlying Index”) for each of the Alerian MLP ETF and the Alerian Energy Infrastructure ETF (each a “Fund” and collectively, the “Funds”). “Alerian,” “Alerian MLP Infrastructure Index,” “Alerian Energy Infrastructure Index,” “Alerian Index Series” and “AMZI” are service marks or trademarks of Alerian. Alerian acts as brand licensor for each Underlying Index. Alerian is not responsible for the descriptions of either Underlying Index or the Funds that appear herein. Alerian is not affiliated with the Trust, the Adviser or the Distributor.
Neither Fund is issued, sponsored, endorsed, sold or promoted by Alerian (“Licensor”) or its affiliates. Licensor makes no representation or warranty, express or implied, to the owners of the Fund or any member of the public regarding the advisability of investing in securities generally or in the Fund particularly or the ability of the Alerian MLP Infrastructure Index (“Index”) to track general market performance. Licensor’s only relationship to the Licensee is the licensing of the Index which is determined, composed and calculated by Licensor without regard to the Licensee or the Fund. Licensor has no obligation to take the needs of the Licensee or the owners of the Fund into consideration in determining, composing or calculating the Index. Licensor is not responsible for and has not participated in the determination of the timing of, prices at, or quantities of the Fund to be issued or in the determination or calculation of the equation by which the Fund is to be converted into cash. Licensor has no obligation or liability in connection with the issuance, administration, marketing or trading of either Fund and is not responsible for and has not participated in the determination of pricing or the timing of the issuance or sale of the Shares of either Fund or in the determination or calculation of the NAV of the relevant Fund. Alerian MLP Infrastructure Index, Alerian MLP Infrastructure Total Return Index, AMZI and AMZIX are trademarks of GKD Index Partners, LLC and their general use is granted under a license from GKD Index Partners, LLC.
LICENSOR DOES NOT GUARANTEE THE QUALITY, ACCURACY AND/OR THE COMPLETENESS OF THE INDEX OR ANY DATA INCLUDED THEREIN AND SHALL HAVE NO LIABILITY FOR ERRORS OR OMISSIONS OF ANY KIND RELATED TO THE INDEX OR DATA. LICENSOR MAKES NO WARRANTY, EXPRESS OR IMPLIED, AS TO RESULTS TO BE OBTAINED BY LICENSEE, OWNERS OF THE FUND, OR ANY OTHER PERSON OR ENTITY FROM THE USE OF THE INDEX OR ANY DATA INCLUDED THEREIN IN CONNECTION WITH THE RIGHTS LICENSED TO LICENSEE OR FOR ANY OTHER USE. LICENSOR MAKES NO EXPRESS OR IMPLIED WARRANTIES, AND HEREBY EXPRESSLY DISCLAIMS ALL WARRANTIES OF MERCHANTABILITY OR FITNESS FOR A PARTICULAR PURPOSE OR USE WITH RESPECT TO THE INDEX OR ANY DATA INCLUDED THEREIN. WITHOUT LIMITING ANY OF THE FOREGOING, IN NO EVENT SHALL LICENSOR HAVE ANY LIABILITY FOR ANY SPECIAL, PUNITIVE, INDIRECT, OR CONSEQUENTIAL DAMAGES (INCLUDING LOST PROFITS), EVEN IF NOTIFIED OF THE POSSIBILITY OF SUCH DAMAGES.
29 | November 30, 2015
| | |
Alerian Exchange Traded Funds | | |
| Additional Information | | November 30, 2015 (Unaudited) |
The Adviser does not guarantee the accuracy and/or the completeness of either Underlying Index or any data included therein, and the Adviser shall have no liability for any errors, omissions or interruptions therein. The Adviser makes no warranty, express or implied, as to results to be obtained by either Fund, owners of the Shares of the relevant Fund or any other person or entity from the use of either Underlying Index or any data included therein. The Adviser makes no express or implied warranties, and expressly disclaims all warranties of merchantability or fitness for a particular purpose or use with respect to either Underlying Index or any data included therein. Without limiting any of the foregoing, in no event shall the Adviser have any liability for any special, punitive, direct, indirect, or consequential damages (including lost profits) arising out of matters relating to the use of either Underlying Index, even if notified of the possibility of such damages.
(Applicable to the Alerian Energy Infrastructure ETF only)
The Underlying Index is the exclusive property of GKD Index Partners LLC d/b/a Alerian, which has contracted with S&P Opco, LLC (a subsidiary of S&P Dow Jones Indices LLC) (“S&P Dow Jones Indices”) to calculate and maintain the Underlying Index. S&P® is a registered trademark of Standard & Poor’s Financial Services LLC (“SPFS”); Dow Jones® is a registered trademark of Dow Jones Trademark Holdings LLC (“Dow Jones”); and these trademarks have been licensed to S&P Dow Jones Indices. “Calculated by S&P Dow Jones Indices” and its related stylized mark(s) have been licensed for use by Alerian.
The Fund is not sponsored, endorsed, sold or promoted by S&P Dow Jones Indices, SPFS, Dow Jones or any of their affiliates (collectively, “S&P Dow Jones Indices Entities”). S&P Dow Jones Indices Entities do not make any representation or warranty, express or implied, to the owners of the Fund or any member of the public regarding the advisability of investing in securities generally or in the Fund particularly or the ability of the Underlying Index to track general market performance. S&P Dow Jones Indices Entities only relationship to Alerian with respect to the Underlying Index is the licensing of certain trademarks, service marks and trade names of S&P Dow Jones Indices Entities and for the providing of calculation and maintenance services related to the Underlying Index. S&P Dow Jones Indices Entities are not responsible for and have not participated in the determination of the prices and amount of the Fund or the timing of the issuance or sale of the Fund or in the determination or calculation of the equation by which the Fund is to be converted into cash. S&P Dow Jones Indices Entities have no obligation or liability in connection with the administration, marketing or trading of the Fund. S&P Dow Jones Indices LLC is not an investment advisor. Inclusion of a security within the Underlying Index is not a recommendation by S&P Dow Jones Indices Entities to buy, sell, or hold such security, nor is it considered to be investment advice.
S&P DOW JONES INDICES ENTITIES DO NOT GUARANTEE THE ADEQUACY, ACCURACY, TIMELINESS AND/OR THE COMPLETENESS OF THE UNDERLYING INDEX OR ANY DATA RELATED THERETO OR ANY COMMUNICATION, INCLUDING BUT NOT LIMITED TO, ORAL OR WRITTEN COMMUNICATION (INCLUDING ELECTRONIC COMMUNICATIONS) WITH RESPECT THERETO. S&P DOW JONES INDICES ENTITIES SHALL NOT BE SUBJECT TO ANY DAMAGES OR LIABILITY FOR ANY ERRORS, OMISSIONS, OR DELAYS THEREIN. S&P DOW JONES INDICES ENTITIES MAKE NO EXPRESS OR IMPLIED WARRANTIES, AND EXPRESSLY DISCLAIMS ALL WARRANTIES, OF MERCHANTABILITY OR FITNESS FOR A PARTICULAR PURPOSE OR USE OR AS TO RESULTS TO BE OBTAINED BY ALERIAN, OWNERS OF THE FUND, OR ANY OTHER PERSON OR ENTITY FROM THE USE OF THE UNDERLYING INDEX OR WITH RESPECT TO ANY DATA RELATED THERETO. WITHOUT LIMITING ANY OF THE FOREGOING, IN NO EVENT WHATSOEVER SHALL S&P DOW JONES INDICES ENTITIES BE LIABLE FOR ANY INDIRECT, SPECIAL, INCIDENTAL, PUNITIVE, OR CONSEQUENTIAL DAMAGES INCLUDING BUT NOT LIMITED TO, LOSS OF PROFITS, TRADING LOSSES, LOST TIME OR GOODWILL, EVEN IF THEY HAVE BEEN ADVISED OF THE POSSIBILITY OF SUCH DAMAGES, WHETHER IN CONTRACT, TORT, STRICT LIABILITY, OR OTHERWISE.
30 | November 30, 2015
| | |
Alerian Exchange Traded Funds | | |
| Board Considerations Regarding Approval of | | November 30, 2015 (Unaudited) |
Investment Advisory Agreements
Alerian MLP ETF
At in-person meetings held on June 8, 2015 and June 10, 2015, the Board of Trustees of the Trust (the “Board” or the “Trustees”), including the Trustees who are not “interested persons” of the Trust within the meaning of the 1940 Act, as amended (the “Independent Trustees”), evaluated a proposal to approve the continuance of the Advisory Agreement between the Trust and ALPS Advisors, Inc. (the “Adviser”) with respect to the Alerian MLP ETF (“AMLP” or the “Fund”). The Independent Trustees also met separately to consider the Advisory Agreement.
In evaluating the Investment Advisory Agreement with respect to AMLP, the Trustees considered various factors, including (i) the nature, extent and quality of the services to be provided by the Adviser with respect to the Fund under the Investment Advisory Agreement; (ii) the advisory fees and other expenses to be paid by the Fund compared to those of similar funds managed by other investment advisers; (iii) the costs of the services provided to the Fund by the Adviser and the profits realized by the Adviser and its affiliates from its relationship to the Fund; (iv) the extent which economies of scale would be realized if and as the assets of the Fund grows and whether fees reflect the economies of scale for the benefit of shareholders and (v) any additional benefits and other considerations.
With respect to the nature, extent and quality of the services to be provided by the Adviser under the Investment Advisory Agreement, the Trustees considered and reviewed information concerning the services to be provided under the Investment Advisory Agreement, the investment parameters of the index of the Fund, financial information regarding the Adviser and its parent company, information describing the Adviser’s current organization and the background and experience of the persons who would be responsible for the day-to-day management of the Fund.
The Trustees reviewed information on the performance of the Fund and its benchmark. The Trustees also evaluated the correlation and tracking error of the Fund. Based on their review, the Trustees found that the nature and extent of services provided to the Fund under the Investment Advisory Agreement was appropriate and that the quality was satisfactory.
The Trustees noted that the advisory fees for the Fund were unitary fees pursuant to which the Adviser assumes all expenses of the Fund (including the cost of transfer agency, custody, fund administration, legal, audit and other services) other than the payments under the Advisory Agreement, brokerage expenses, taxes, interest, litigation expenses and other extraordinary expenses.
With respect to advisory fee rate for the Fund, the Trustees noted that the advisory fee rate and net total expenses for AMLP are higher than the median advisory fee rate and net total expenses of its Strategic Insight peer group. The Trustees also considered the additional information provided by the Adviser showing AMLP’s total expenses were in line with the total expenses of peer groups determined to be more comparable, including peer groups comprised of (i) the master limited partnership (“MLP”) asset class as a whole and (ii) exchange-traded products focused solely on MLP investments. The Trustees also considered that AMLP’s investment advisory fee schedule included breakpoints.
Based on the foregoing, and the other information available to them, the Trustees concluded that the advisory fee rate for the Fund was reasonable under the circumstances and in light of the quality of the services provided. The Trustees considered other benefits available to the Adviser because of its relationship with the Fund and concluded that the advisory fees were reasonable taking into account any such benefits.
The Trustees also considered the information provided by the Adviser about the costs and profitability of the Adviser with respect to the Fund. The Trustees considered, among other things, the additional costs incurred by the Adviser in managing and administering the Fund. They also considered the brand recognition of AMLP’s index provider as well as the trading volumes of the Fund. The Trustees considered the breakpoint schedule adopted the previous year and whether the breakpoints would benefit shareholders and appropriately reflect economies of scale achieved by the Adviser with respect to AMLP as AMLP’s assets increase. Based on the foregoing, the Trustees determined that the advisory fee rate for the Fund reflects an appropriate sharing of any economies of scale which may exist currently and as the Fund’s assets increase.
In voting to renew the Investment Advisory Agreement, the Trustees concluded that the terms of the Investment Advisory Agreement are reasonable and fair in light of the services to be performed, the fees paid by certain other funds, expenses to be incurred and such other matters as the Trustees considered relevant in the exercise of their reasonable business judgment. The Trustees did not identify any single factor or group of factors as all important or controlling and considered all factors together.
31 | November 30, 2015
| | |
Alerian Exchange Traded Funds | | |
| Board Considerations Regarding Approval of | | November 30, 2015 (Unaudited) |
Investment Advisory Agreements
Alerian Energy Infrastructure ETF
At an in-person meeting held on June 8, 2015, the Board of Trustees of the Trust (the “Board” or the “Trustees”), including the Trustees who are not “interested persons” of the Trust within the meaning of the 1940 Act, as amended (the “Independent Trustees”), evaluated a proposal to approve the continuance of the Advisory Agreement between the Trust and ALPS Advisors, Inc. (the “Adviser”) with respect to the Alerian Energy Infrastructure ETF (“ENFR” or “the Fund”). The Independent Trustees also met separately to consider the Advisory Agreement.
In evaluating the Investment Advisory Agreement with respect to ENFR, the Trustees considered various factors, including (i) the nature, extent and quality of the services to be provided by the Adviser with respect to the Fund under the Investment Advisory Agreement; (ii) the advisory fees and other expenses to be paid by the Fund compared to those of similar funds managed by other investment advisers; (iii) the costs of the services provided to the Fund by the Adviser and the profits realized by the Adviser and its affiliates from its relationship to the Fund; (iv) the extent which economies of scale would be realized if and as the assets of the Fund grow and whether fees reflect the economies of scale for the benefit of shareholders and (v) any additional benefits and other considerations.
With respect to the nature, extent and quality of the services to be provided by the Adviser under the Investment Advisory Agreement, the Trustees considered and reviewed information concerning the services to be provided under the Investment Advisory Agreement, the investment parameters of the index of the Fund, financial information regarding the Adviser and its parent company, information describing the Adviser’s current organization and the background and experience of the persons who would be responsible for the day-to-day management of the Fund.
The Trustees reviewed information on the performance of the Fund and its applicable benchmark. The Trustees also evaluated the correlation and tracking error between the underlying index and the Fund’s performance. Based on their review, the Trustees found that the nature and extent of services provided to the Fund under the Investment Advisory Agreement was appropriate and that the quality was satisfactory.
The Trustees noted that the advisory fee for the Fund was a unitary fee pursuant to which the Adviser assumes all expenses of the Fund (including the cost of transfer agency, custody, fund administration, legal, audit and other services) other than the payments under the Advisory Agreement, brokerage expenses, taxes, interest, litigation expenses and other extraordinary expenses.
With respect to advisory fee rates, the Trustees noted the advisory fee rate for the Fund is higher than the median of its Strategic Insight expense group and its expense ratio is higher than the median of its respective Strategic Insight expense group.
The Trustees took into account, among other things, the index provider’s general reputation in the master limited partnership space, the growth in assets of the Alerian MLP ETF which is also based on an index from the same index provider to ENFR and the fees charged by the index provider for licensing its index.
Based on the foregoing, and the other information available to them, the Trustees concluded that the advisory fee rate for the Fund was reasonable under the circumstances and in light of the quality of the services provided.
The Trustees considered other benefits available to the Adviser because of its relationship with the Fund and concluded that the advisory fees were reasonable taking into account any such benefits.
The Trustees also considered the information provided by the Adviser about the costs and profitability of the Adviser with respect to the Fund. The Trustees reviewed and noted the relatively small size of the Fund and concluded that the Adviser was not realizing any economies of scale. The Trustees determined that they would continue to evaluate whether further economies of scale have been achieved on an ongoing basis.
In voting to renew the Advisory Agreement, the Trustees concluded that the terms of the Advisory Agreement are reasonable and fair in light of the services to be performed, the fees paid by certain other funds, expenses to be incurred and such other matters as the Trustees considered relevant in the exercise of their reasonable business judgment. The Trustees did not identify any single factor or group of factors as all important or controlling and considered all factors together.
32 | November 30, 2015
| | |
Alerian Exchange Traded Funds | | |
| Trustees & Officers | | November 30, 2015 (Unaudited) |
| | | | | | | | | | |
INDEPENDENT TRUSTEES |
Name, Address
& Year of Birth* | | Position(s) Held with Trust | | Term of Office
and Length of
Time Served** | | Principal Occupation(s)
During Past 5 Years | | Number of
Portfolios in Fund
Complex Overseen
by Trustees*** | | Other Directorships
Held by Trustees |
Mary K. Anstine, 1940 | | Trustee | | Since March 2008 | | Ms. Anstine was formerly an Executive Vice President of First Interstate Bank of Denver until 1994, President/Chief Executive Officer of HealthONE Alliance, Denver, Colorado, from 1994 to 2004, and has been retired since 2004. Ms. Anstine is also Trustee/Director of the following: AV Hunter Trust and Colorado Uplift Board. Ms. Anstine was formerly a Director of the Trust Bank of Colorado (later purchased and now known as Northern Trust Bank), HealthONE and Denver Area Council of the Boy Scouts of America and a member of the American Bankers Association Trust Executive Committee. | | 46 | | Ms. Anstine is a Trustee of ALPS Variable Investment Trust (9 funds); Financial Investors Trust (31 funds); Reaves Utility Income Fund; and Westcore Trust (12 funds). |
Jeremy W. Deems, 1976 | | Trustee | | Since March 2008 | | Mr. Deems is the Co-Founder, Chief Financial Officer of Green Alpha Advisors, LLC. Mr. Deems is Co-Portfolio Manager of the Shelton Green Alpha Fund. Prior to joining Green Alpha Advisors, Mr. Deems was CFO and Treasurer of Forward Management, LLC, ReFlow Management Co., LLC, ReFlow Fund, LLC, a private investment fund, and Sutton Place Management, LLC, an administrative services company. | | 46 | | Mr. Deems is a Trustee of ALPS Variable Investment Trust (9 funds); Financial Investors Trust (31 funds); Clough Funds Trust (1 fund); and Reaves Utility Income Fund. |
Rick A. Pederson, 1952 | | Trustee | | Since March 2008 | | Mr. Pederson is President, Foundation Properties, Inc. (a real estate investment management company), 1994 - present; Advisory Board Member, Bow River Capital Partners (private equity management), 2003 - present; Advisor, Pauls Corporation (real estate investment management and development), 2008 - present; Chairman, Ross Consulting Group (real estate consulting services) 1983-2013; Advisory Board, Neenan Company (construction services) 2002- present; Board Member, Prosci, Inc. (private business services), 2013-present; Board Member, Citywide Banks (Colorado community bank) 2014-present; Board member, Professional Pediatric Health Care (a Denver-based home nursing firm) 2014 – present; Director, National Western Stock Show (not-for-profit organization); Director, Biennial of the Americas (not-for- profit organization). | | 24 | | Mr. Pederson is Trustee of Westcore Trust (12 funds) and Principal Real Estate Income Fund (1 fund). |
| * | The business address of the Trustee is c/o ALPS Advisors, Inc., 1290 Broadway, Suite 1100, Denver, Colorado 80203. |
| ** | This is the period for which the Trustee began serving the Trust. Each Trustee serves an indefinite term, until his successor is elected. |
| *** | The Fund Complex includes all series of the Trust and any other investment companies for which ALPS Advisors, Inc. provides investment advisory services. |
The Statement of Additional Information includes additional information about the Fund’s Trustees and is available, without charge, upon request by calling (toll-free) 1-866-675-2639.
33 | November 30, 2015
| | |
Alerian Exchange Traded Funds | | |
| Trustees & Officers | | November 30, 2015 (Unaudited) |
| | | | | | | | | | |
INTERESTED TRUSTEE |
Name, Address
and Year of
Birth of
Interested
Trustee* | | Position(s) Held with Trust | | Term of Office
and Length of
Time Served** | | Principal Occupation(s)
During Past 5 Years | | Number of
Portfolios in Fund
Complex Overseen
by Trustees*** | | Other Directorships
Held by Trustees |
Thomas A. Carter, 1966 | | Trustee and President | | Since March 2008 | | Mr. Carter joined ALPS Fund Services, Inc. (“ALPS”) in 1994 and is currently President and Director of ALPS Advisors, Inc. (“AAI”), and ALPS Portfolio Solutions Distributor, Inc. (“APSD”) and Executive Vice President and Director of ALPS and ALPS Holdings, Inc. (“AHI”), and ALPS Distributors, Inc. (“ADI”). Because of his position with AHI, ALPS, ADI, APSD and AAI, Mr. Carter is deemed an affiliate of the Fund as defined under the 1940 Act. Before joining ALPS, Mr. Carter was with Deloitte & Touche LLP, where he worked with a diverse group of clients, primarily within the financial services industry. Mr. Carter is a Certified Public Accountant and received his Bachelor of Science in Accounting from the University of Colorado at Boulder. | | 34 | | Mr. Carter is a Trustee of ALPS Variable Investment Trust (9 funds) and Principal Real Estate Income Fund (1 fund) |
| * | The business address of the Trustee is c/o ALPS Advisors, Inc., 1290 Broadway, Suite 1100, Denver, Colorado 80203. |
| ** | This is the period for which the Trustee began serving the Trust. Each Trustee serves an indefinite term, until his successor is elected. |
| *** | The Fund Complex includes all series of the Trust and any other investment companies for which ALPS Advisors, Inc. provides investment advisory services. |
The Statement of Additional Information includes additional information about the Fund’s Trustees and is available, without charge, upon request by calling (toll-free) 1-866-675-2639.
34 | November 30, 2015
| | |
Alerian Exchange Traded Funds | | |
| Trustees & Officers | | November 30, 2015 (Unaudited) |
| | | | | | |
OFFICERS |
Name, Address
and Year of
Birth of Officer* | | Position(s) Held with Trust | | Length of Time Served** | | Principal Occupation(s) During Past 5 Years |
| Erin D. Nelson, 1977 | | Chief Compliance Officer (“CCO”) | | Since December 2015 | | Erin Nelson became Senior Vice-President and Chief Compliance Officer of ALPS Advisors, Inc. (“AAI”) on July 1, 2015 and prior to that served as Vice President and Deputy Chief Compliance Officer of AAI since January 1, 2015. Prior to January 1, 2015, Ms. Nelson was Vice-President and Assistant General Counsel of ALPS of Fund Services, Inc. Ms. Nelson joined AAI’s parent company, ALPS Holdings, Inc. in January 2003. Ms. Nelson currently is also the Chief Compliance Officer of Principal Real Estate Income Fund, and as of December 2015, the Chief Compliance Officer of Liberty All-Star Equity Fund, Liberty All-Star Growth Fund, Inc., RiverNorth Opportunities Fund, Inc. |
Patrick D. Buchanan, 1972 | | Treasurer | | Since June 2012 | | Mr. Buchanan is Vice President of AAI. Mr. Buchanan joined ALPS in 2007 and because of his position with AAI, he is deemed an affiliate of the Trust as defined under the 1940 Act. Mr. Buchanan is also Treasurer of the ALPS Variable Insurance Trust, Clough Funds Trust and Principal Real Estate Income Fund. |
| William Parmentier, 1952 | | Vice President | | Since March 2008 | | Mr. Parmentier is Chief Investment Officer, AAI (since 2006); President and Chief Executive Officer of the Liberty All-Star Funds (since April 1999); Senior Vice President (2005-2006), Banc of America Investment Advisors, Inc. Because of his position with AAI, Mr. Parmentier is deemed an affiliate of the Trust as defined under the 1940 Act. |
Abigail J. Murray, 1975 | | Secretary | | Since June 2015 | | Ms. Murray joined ALPS in April 2015. She is currently Vice President and Senior Counsel of ALPS. Prior to joining ALPS, Ms. Murray was an Attorney and Managing Member at Murray & Rouvina PLC from 2014 to 2015 and an Associate with Vedder Price P.C. from 2007 to 2014. Because of her position with ALPS, Ms. Murray is deemed an affiliate of the Trust as defined under the 1940 Act. Ms. Murray is also the Secretary of The Caldwell & Orkin Funds, Inc., Clough Global Opportunities Fund, Clough Global Allocation Fund, Clough Global Equity Fund and Clough Funds Trust. |
Jennifer A. Craig, 1973 | | Assistant Secretary | | Since October 2013 | | Ms. Craig joined ALPS in 2007 and is currently Assistant Vice President and Paralegal Manager. Prior to joining ALPS, Ms. Craig was Legal Manager at Janus Capital Management LLC and served as Assistant Secretary of Janus Investment Fund, Janus Adviser Series and Janus Aspen Series. Because of her position with ALPS, Ms. Craig is deemed an affiliate of the Trust as defined under the 1940 Act. |
| * | The business address of the Officer is c/o ALPS Advisors, Inc., 1290 Broadway, Suite 1100, Denver, Colorado 80203. |
| ** | This is the period for which the Officer began serving the Trust. Each Officer serves an indefinite term, until his successor is elected. |
35 | November 30, 2015
table of
CONTENTS
www.alpsfunds.com
| | |
ALPS Equal Sector Weight ETF | | |
| |
| Performance Overview | | November 30, 2015 (Unaudited) |
| | |
Investment Objective
The Fund seeks investment results that replicate as closely as possible, before fees and expenses, the performance of the Banc of America Securities – Merrill Lynch Equal Sector Weight Index (the “Underlying Index”). The Fund’s investment objective is not fundamental and may be changed by the Board of Trustees without shareholder approval.
The Adviser will seek to replicate as closely as possible the performance of the Underlying Index. The Underlying Index is an index of indexes comprised in equal proportions of the nine Select Sector SPDR Indexes (“The Underlying Sector Indexes”). These are the Consumer Discretionary Select Sector Index, Consumer Staples Select Sector Index, Materials Select Sector Index, Energy Select Sector Index, Technology Select Sector Index, Utilities Select Sector Index, Financial Select Sector Index, Industrial Select Sector Index and Health Care Select Sector Index. In order to track the securities in the Underlying Index, the Fund will use a “fund of funds” approach, and seek to achieve its investment objective by investing at least 90% if its total assets in the shares of Select Sector SPDR exchange-traded funds (each, an “Underlying Sector ETF” and collectively, the “Underlying Sector ETFs”) that track the Underlying Sector Indexes of which the Underlying Index is comprised.
The Underlying Index is designed to track the equally weighted performance of the Underlying Sector Indexes. Accordingly, each Underlying Index is rebalanced quarterly so that each rebalance will result in each Underlying Sector Index having an Index weight of 11.1% and the Underlying Sector Indexes in aggregate total to 100.0%.
Performance Overview
The ALPS Equal Sector Weight ETF (EQL), for the twelve month period ended November 30, 2015, generated a total return of 0.48%, outperforming the Fund’s Underlying Index, which returned -1.52%. The fund underperformed the S&P 500®, which returned 2.75% for the same period.
From a macro perspective drivers influencing U.S. equities for the one year period ended 11/30/15 included the impact of speculation on a potential U.S. Fed rate hike, global concerns over slowing growth and weak manufacturing figures in China. Additionally, falling oil and commodity prices put downward pressure on prices, which were slightly offset by an improvement in consumer confidence in the U.S. For the fourth consecutive year sector performance was clustered around the mean, as five of the nine sectors of the S&P 500® generated returns that were within 4% of the broader market. This phenomenon was a continuation of a trend that has persisted in the U.S. since the bull market that began in earnest in the 4th quarter of 2011. Consumer Discretionary and Energy stocks were notable exceptions to the relatively narrow dispersion in returns, with Consumer Discretionary significantly outperforming the broader market after gaining 13.80% and Energy an outlier to the downside, falling 12.05%.
Compared to the S&P 500®, the Fund experienced a moderately negative impact (-1.86%) from its sector allocation during the period. This impact was largely driven by underperformance related to its over-weights in the Materials (11.01% vs. 3.09% in SPX) and Energy (10.86% vs. 7.76% in SPX) sectors. The Fund’s relative underweight allocation to Financials (11.12% vs. 16.37% in SPX) helped buoy the fund’s performance.
The best performing fund holdings for the period were the Consumer Discretionary Select Sector SPDR (XLY), which increased 14.13% and the Technology Select Sector SPDR (XLK), which saw a gain of 5.38%. The Health Care Select Sector SPDR (XLV), which rose 3.58%, and the Consumer Staples Select Sector SPDR (XLP), which climbed 2.87%, were other top performers. The largest detractors were the Energy Select Sector SPDR (XLE), which decreased 12.46%, the Materials Select Sector SPDR (XLB), which fell 5.08%, and the Utilities Select Sector SPDR (XLU), which lost 3.58%.
Looking forward we believe the Fund’s strategy of holding each of the nine sectors (with Information Technology and Telecommunication Service combined) in the S&P 500® via the Select SPDRs can result in a diversified core holding, and potential for market participation in all economic cycles through equal sector weighting.
Performance (as of November 30, 2015)
| | | | | | | | |
| | | 1 Year | | 3 Year | | 5 Year | | Since Inception^ |
ALPS Equal Sector Weight ETF - NAV | | 0.48% | | 14.29% | | 13.10% | | 15.54% |
ALPS Equal Sector Weight ETF - Market Price* | | 0.43% | | 14.26% | | 13.08% | | 15.56% |
Banc of America Securities Merrill Lynch Equal Sector Weight Index | | -1.52% | | 12.26% | | 11.09% | | 13.51% |
S&P 500® Total Return Index | | 2.75% | | 16.09% | | 14.40% | | 16.44% |
1 | November 30, 2015
| | |
ALPS Equal Sector Weight ETF | | |
| |
| Performance Overview | | November 30, 2015 (Unaudited) |
| | |
Total Expense Ratio (per the current Prospectus) 0.52%. Net Expense Ratio (per the current prospectus) 0.30%.
Performance data quoted represents past performance. Past performance does not guarantee future results. Investment return and principal value of an investment will fluctuate so that an investor’s shares, when sold or redeemed, may be worth more or less than the original cost. Current performance data may be higher or lower than actual data quoted. For the most current month-end performance data please visit www.alpsfunds.com or call 1.866.675.2639.
NAV is an exchange-traded fund’s per-share value. The per-share dollar amount of the fund is derived by dividing the total value of all the securities in its portfolio, less any liabilities, by the number of fund shares outstanding. Market Price is the price at which a share can currently be traded in the market. Information detailing the number of days the Market Price of the Fund was greater than the Fund’s NAV and the number of days it was less than the Fund’s NAV can be obtained at www.alpsfunds.com.
| ^ | The Fund commenced Investment Operations on July 6, 2009 with an Inception Date, the first day of trading on the Exchange, of July 7, 2009. |
| * | Market Price is based on the midpoint of the bid/ask spread at 4 p.m. ET and does not represent the returns an investor would receive if shares were traded at other times. |
Banc of America Securities Merrill Lynch Equal Sector Weight Index: a U.S. equity index comprised, in equal weights, of nine sub-indices, and is a price-return index.
S&P 500® Total Return Index: the Standard & Poor’s composite index of 500 stocks, a widely recognized, unmanaged index of common stock prices. Total return assumes reinvestment of any dividends and distributions realized during a given time period.
One cannot invest directly in an index. Index performance does not reflect fund performance.
The ALPS Equal Sector Weight ETF is not suitable for all investors. Investments in the Fund are subject to investment risks, including possible loss of the principal amount invested.
ALPS Portfolio Solutions Distributor, Inc. is the Distributor for the Fund.
2 | November 30, 2015
| | |
ALPS Equal Sector Weight ETF | | |
| |
| Performance Overview | | November 30, 2015 (Unaudited) |
| | |
The following table shows the sector weights of both the Fund and the S&P 500® as of November 30, 2015:
Sector Weighting Comparison (as of November 30, 2015)
| | | | | | |
| | | EQL* | | S&P 500® | | +/- |
Technology (XLK) | | 11.48% | | 23.28% | | -11.80% |
Materials (XLB) | | 11.42% | | 2.86% | | 8.56% |
Financials (XLF) | | 11.34% | | 16.58% | | -5.24% |
Energy (XLE) | | 11.27% | | 7.05% | | 4.22% |
Industrials (XLI) | | 11.26% | | 10.12% | | 1.14% |
Consumer Discretionary (XLY) | | 11.19% | | 13.08% | | -1.89% |
Consumer Staples (XLP) | | 10.95% | | 9.56% | | 1.39% |
Utilities (XLU) | | 10.60% | | 2.86% | | 7.74% |
Healthcare (XLV) | | 10.49% | | 14.61% | | -4.12% |
Total | | 100.00% | | 100.00% | | 0.00% |
Source: S&P 500®
Future holdings are subject to change.
Growth of $10,000 (as of November 30, 2015)
Comparison of Change in Value of $10,000 Investment in the Fund and the Indexes
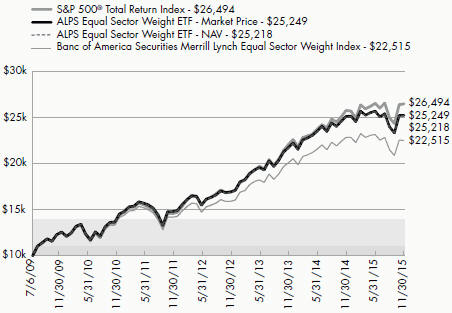
The chart above represents historical performance of a hypothetical investment of $10,000 in the Fund over the life of the Fund. Performance calculations are as of the end of each month. Past performance does not guarantee future results. This chart does not reflect the deduction of taxes that a shareholder would pay on Fund distributions or the redemption of Fund shares.
3 | November 30, 2015
| | |
ALPS Equal Sector Weight ETF | | |
| |
| Disclosure of Fund Expenses | | November 30, 2015 (Unaudited) |
| | |
Shareholder Expense Example: As a shareholder of the Fund, you incur two types of costs: (1) transaction costs which may include creation and redemption fees or brokerage charges, and (2) ongoing costs, including management fees and other Fund expenses. These examples are intended to help you understand your ongoing costs (in dollars) of investing in the Fund and to compare these costs with the ongoing costs of investing in other funds. The example is based on an investment of $1,000 invested at the beginning of the (six month) period and held through November 30, 2015.
Actual Return: The first line of the table provides information about actual account values and actual expenses. You may use the information in this table, together with the amount you invested, to estimate the expenses that you incurred over the period. Simply divide your account value by $1,000 (for example, an $8,600 account value divided by $1,000 = 8.6), then multiply the result by the number in the first line under the heading entitled “Expenses Paid During the Period” to estimate the expenses attributable to your investment during this period.
Hypothetical 5% Return: The second line of the table provides information about hypothetical account values and hypothetical expenses based on the Fund’s actual expense ratio and an assumed rate of return of 5% per year before expenses, which is not the Fund’s actual return. The hypothetical account values and expenses may not be used to estimate the actual ending account balance or expenses you paid for the period. You may use this information to compare ongoing costs of investing in the Fund and other funds. To do so, compare this 5% hypothetical example with the 5% hypothetical examples that appear in the shareholder reports of the other funds.
The expenses shown in the table are meant to highlight ongoing Fund costs only and do not reflect any transaction costs, such as creation and redemption fees, or brokerage charges. Therefore, the second line of the table is useful in comparing ongoing costs only, and will not help you determine the relative total costs of owning different funds. In addition, if these costs were included, your costs would have been higher.
| | | | | | | | |
| | | Beginning Account | | Ending Account | | | | Expenses Paid |
| | | Value | | Value | | Expense | | During Period |
| | | 6/1/15 | | 11/30/15 | | Ratio(a) | | 6/1/15 - 11/30/15(b) |
ALPS Equal Sector Weight ETF | | | | | | | | |
Actual | | $ 1,000.00 | | $ 982.40 | | 0.15% | | $ 0.75 |
Hypothetical (5% return before expenses) | | $ 1,000.00 | | $ 1,024.32 | | 0.15% | | $ 0.76 |
| (a) | Annualized based on the Fund’s most recent half-year expenses. |
| (b) | Expenses are equal to the Fund’s annualized expense ratio multiplied by the average account value over the period, multiplied by the number of days in the most recent fiscal half year (183), divided by 365. |
4 | November 30, 2015
| | |
ALPS Equal Sector Weight ETF | | |
|
| Report of Independent Registered Public Accounting Firm |
| | |
To the Board of Trustees and Shareholders of ALPS ETF Trust:
We have audited the accompanying statement of assets and liabilities, including the schedule of investments, of ALPS Equal Sector Weight ETF, one of the portfolios constituting the ALPS ETF Trust (the “Trust”), as of November 30, 2015, and the related statement of operations for the year then ended, the statements of changes in net assets for each of the two years in the period then ended, and the financial highlights for each of the periods presented. These financial statements and financial highlights are the responsibility of the Trust’s management. Our responsibility is to express an opinion on these financial statements and financial highlights based on our audits.
We conducted our audits in accordance with the standards of the Public Company Accounting Oversight Board (United States). Those standards require that we plan and perform the audit to obtain reasonable assurance about whether the financial statements and financial highlights are free of material misstatement. The Trust is not required to have, nor were we engaged to perform, an audit of its internal control over financial reporting. Our audits included consideration of internal control over financial reporting as a basis for designing audit procedures that are appropriate in the circumstances, but not for the purpose of expressing an opinion on the effectiveness of the Trust’s internal control over financial reporting. Accordingly, we express no such opinion. An audit also includes examining, on a test basis, evidence supporting the amounts and disclosures in the financial statements, assessing the accounting principles used and significant estimates made by management, as well as evaluating the overall financial statement presentation. Our procedures included confirmation of securities owned as of November 30, 2015, by correspondence with the custodian. We believe that our audits provide a reasonable basis for our opinion.
In our opinion, the financial statements and financial highlights referred to above present fairly, in all material respects, the financial position of ALPS Equal Sector Weight ETF of the ALPS ETF Trust as of November 30, 2015, the results of its operations for the year then ended, the changes in its net assets for each of the two years in the period then ended, and the financial highlights for each of the periods presented, in conformity with accounting principles generally accepted in the United States of America.
DELOITTE & TOUCHE LLP
Denver, Colorado
January 28, 2016
5 | November 30, 2015
| | |
ALPS Equal Sector Weight ETF | | |
| |
| Schedule of Investments | | November 30, 2015 |
| | |
| | | | | | | | | | | | |
| SECURITY DESCRIPTION | | | | | SHARES | | | VALUE | |
| |
EXCHANGE TRADED FUNDS (99.93%) | | | | | | | | | | | | |
Consumer Discretionary (11.19%) | | | | | | | | | | | | |
Consumer Discretionary Select Sector SPDR® Fund | | | | | | | 194,454 | | | $ | 15,707,994 | |
| | | | | | | | | | | | |
| | | |
Consumer Staples (10.94%) | | | | | | | | | | | | |
Consumer Staples Select Sector SPDR® Fund | | | | | | | 310,946 | | | | 15,366,951 | |
| | | | | | | | | | | | |
| | | |
Energy (11.26%) | | | | | | | | | | | | |
Energy Select Sector SPDR® Fund | | | | | | | 232,544 | | | | 15,817,643 | |
| | | | | | | | | | | | |
| | | |
Financials (11.33%) | | | | | | | | | | | | |
Financial Select Sector SPDR® Fund | | | | | | | 647,552 | | | | 15,903,877 | |
| | | | | | | | | | | | |
| | | |
Healthcare (10.48%) | | | | | | | | | | | | |
Health Care Select Sector SPDR® Fund | | | | | | | 206,932 | | | | 14,714,935 | |
| | | | | | | | | | | | |
| | | |
Industrials (11.25%) | | | | | | | | | | | | |
Industrial Select Sector SPDR® Fund | | | | | | | 288,508 | | | | 15,792,928 | |
| | | | | | | | | | | | |
| | | |
Materials (11.41%) | | | | | | | | | | | | |
Materials Select Sector SPDR® Fund | | | | | | | 350,371 | | | | 16,022,466 | |
| | | | | | | | | | | | |
| | | |
Technology (11.47%) | | | | | | | | | | | | |
Technology Select Sector SPDR® Fund | | | | | | | 366,289 | | | | 16,102,064 | |
| | | | | | | | | | | | |
| | | |
Utilities (10.60%) | | | | | | | | | | | | |
Utilities Select Sector SPDR® Fund | | | | | | | 347,467 | | | | 14,878,537 | |
| | | | | | | | | | | | |
| | | |
TOTAL EXCHANGE TRADED FUNDS (Cost $118,216,171) | | | | | | | | | | | 140,307,395 | |
| | | | | | | | | | | | |
| | | |
| | | 7 DAY YIELD | | | SHARES | | | VALUE | |
| |
SHORT TERM INVESTMENTS (0.08%) | | | | | | | | | | | | |
Morgan Stanley Institutional Liquidity Fund- Prime Portfolio | | | 0.105% | | | | 117,303 | | | | 117,303 | |
| | | | | | | | | | | | |
| | | |
TOTAL SHORT TERM INVESTMENTS (Cost $117,303) | | | | | | | | | | | 117,303 | |
| | | | | | | | | | | | |
| | | |
TOTAL INVESTMENTS (100.01%) (Cost $118,333,474) | | | | | | | | | | $ | 140,424,698 | |
| | | |
NET LIABILITIES LESS OTHER ASSETS (-0.01%) | | | | | | | | | | | (17,278) | |
| | | | | | | | | | | | |
| | | |
NET ASSETS (100.00%) | | | | | | | | | | $ | 140,407,420 | |
| | | | | | | | | | | | |
Common Abbreviations:
SPDR® - Standard & Poor’s Depositary Receipts
See Notes to Financial Statements.
6 | November 30, 2015
| | |
ALPS Equal Sector Weight ETF | | |
| |
| Statement of Assets and Liabilities | | November 30, 2015 |
| | |
| | | | |
ASSETS: | | | | |
Investments, at value | | $ | 140,424,698 | |
Dividends receivable | | | 11 | |
| |
Total Assets | | | 140,424,709 | |
| |
| |
LIABILITIES: | | | | |
Payable to adviser | | | 17,289 | |
| |
Total Liabilities | | | 17,289 | |
| |
NET ASSETS | | $ | 140,407,420 | |
| |
| |
NET ASSETS CONSIST OF: | | | | |
Paid-in capital | | $ | 118,573,316 | |
Accumulated net investment income | | | 12,644 | |
Accumulated net realized loss on investments | | | (269,764) | |
Net unrealized appreciation on investments | | | 22,091,224 | |
| |
NET ASSETS | | $ | 140,407,420 | |
| |
| |
INVESTMENTS, AT COST | | $ | 118,333,474 | |
| |
PRICING OF SHARES | | | | |
Net Assets | | $ | 140,407,420 | |
Shares of beneficial interest outstanding (Unlimited number of shares authorized, par value $0.01 per share) | | | 2,500,000 | |
Net Asset Value, offering and redemption price per share | | $ | 56.16 | |
See Notes to Financial Statements.
7 | November 30, 2015
| | |
ALPS Equal Sector Weight ETF | | |
| |
| Statement of Operations | | For the Year Ended November 30, 2015 |
| | |
| | | | |
INVESTMENT INCOME: | | | | |
Dividends | | $ | 3,065,816 | |
| |
Total investment income | | | 3,065,816 | |
| |
| |
EXPENSES: | | | | |
Investment adviser fees | | | 526,502 | |
| |
Total expenses before waiver/reimbursement | | | 526,502 | |
| |
Less fees waiver/reimbursement by investment adviser | | | (221,861) | |
| |
Net Expenses | | | 304,641 | |
| |
NET INVESTMENT INCOME | | | 2,761,175 | |
| |
REALIZED AND UNREALIZED GAIN/(LOSS) | | | | |
Net realized gain on investments | | | 7,217,464 | |
Net change in unrealized depreciation on investments | | | (9,245,175) | |
| |
NET REALIZED AND UNREALIZED LOSS ON INVESTMENTS | | | (2,027,711) | |
| |
NET INCREASE IN NET ASSETS RESULTING FROM OPERATIONS | | $ | 733,464 | |
| |
See Notes to Financial Statements.
8 | November 30, 2015
| | |
ALPS Equal Sector Weight ETF | | |
| |
| Statements of Changes in Net Assets | | |
| | |
| | | | | | | | |
| | | For the Year Ended
November 30,
2015 | | | For the Year Ended
November 30,
2014 | |
| |
OPERATIONS: | | | | | | | | |
Net investment income | | $ | 2,761,175 | | | $ | 2,203,303 | |
Net realized gain on investments | | | 7,217,464 | | | | 10,360,476 | |
Net change in unrealized appreciation/(depreciation) on investments | | | (9,245,175) | | | | 6,636,619 | |
| |
Net increase in net assets resulting from operations | | | 733,464 | | | | 19,200,398 | |
| |
| | |
DISTRIBUTIONS TO SHAREHOLDERS: | | | | | | | | |
From net investment income | | | (2,761,711) | | | | (2,197,152) | |
| |
Total distributions | | | (2,761,711) | | | | (2,197,152) | |
| |
| | |
CAPITAL SHARE TRANSACTIONS: | | | | | | | | |
Proceeds from sale of shares | | | 22,873,159 | | | | 46,558,747 | |
Cost of shares redeemed | | | (20,123,962) | | | | (34,120,471) | |
| |
Net increase from share transactions | | | 2,749,197 | | | | 12,438,276 | |
| |
Net increase in net assets | | | 720,950 | | | | 29,441,522 | |
| | |
NET ASSETS: | | | | | | | | |
Beginning of year | | | 139,686,470 | | | | 110,244,948 | |
| |
End of year * | | $ | 140,407,420 | | | $ | 139,686,470 | |
| |
| | |
*Including accumulated net investment income of: | | $ | 12,644 | | | $ | 13,180 | |
| | |
OTHER INFORMATION: | | | | | | | | |
CAPITAL SHARE TRANSACTIONS: | | | | | | | | |
Beginning shares | | | 2,450,000 | | | | 2,200,000 | |
Shares sold | | | 400,000 | | | | 900,000 | |
Shares redeemed | | | (350,000) | | | | (650,000) | |
| |
Shares outstanding, end of year | | | 2,500,000 | | | | 2,450,000 | |
| |
See Notes to Financial Statements.
9 | November 30, 2015
| | |
ALPS Equal Sector Weight ETF | | |
| |
| Financial Highlights | | For a Share Outstanding Throughout the Years Presented |
| | |
| | | | | | | | | | | | | | | | | | | | | | | | |
| | | For the Year
Ended
November
30, 2015 | | | For the Year
Ended
November
30, 2014 | | | For the Year
Ended
November
30, 2013 | | | For the Year
Ended
November
30, 2012 | | | For the
Period
January 1,
2011 to
November
30, 2011(a) | | | For the Year
Ended
December
31, 2010 | |
| |
NET ASSET VALUE, BEGINNING OF PERIOD | | $ | 57.01 | | | $ | 50.11 | | | $ | 39.79 | | | $ | 35.48 | | | $ | 35.34 | | | $ | 31.13 | |
| | | | | | |
INCOME FROM OPERATIONS: | | | | | | | | | | | | | | | | | | | | | | | | |
Net investment income(b) | | | 1.09 | | | | 0.90 | | | | 0.81 | | | | 0.69 | | | | 0.41 | | | | 0.68 | |
Net realized and unrealized gain/(loss) | | | (0.84) | | | | 6.90 | | | | 10.35 | | | | 4.35 | | | | 0.18 | | | | 4.14 | |
| |
Total from investment operations | | | 0.25 | | | | 7.80 | | | | 11.16 | | | | 5.04 | | | | 0.59 | | | | 4.82 | |
| |
| | | | | | |
DISTRIBUTIONS: | | | | | | | | | | | | | | | | | | | | | | | | |
From net investment income | | | (1.10) | | | | (0.90) | | | | (0.84) | | | | (0.71) | | | | (0.45) | | | | (0.61) | |
From tax return of capital | | | – | | | | – | | | | – | | | | (0.02) | | | | – | | | | – | |
| |
Total distributions | | | (1.10) | | | | (0.90) | | | | (0.84) | | | | (0.73) | | | | (0.45) | | | | (0.61) | |
| |
| | | | | | |
NET INCREASE/(DECREASE) IN NET ASSET VALUE | | | (0.85) | | | | 6.90 | | | | 10.32 | | | | 4.31 | | | | 0.14 | | | | 4.21 | |
| |
NET ASSET VALUE, END OF PERIOD | | $ | 56.16 | | | $ | 57.01 | | | $ | 50.11 | | | $ | 39.79 | | | $ | 35.48 | | | $ | 35.34 | |
| |
TOTAL RETURN(c) | | | 0.48% | | | | 15.71% | | | | 28.41% | | | | 14.35% | | | | 1.67% | | | | 15.67% | |
| | | | | | |
RATIOS/SUPPLEMENTAL DATA: | | | | | | | | | | | | | | | | | | | | | | | | |
Net assets, end of period (in 000s) | | $ | 140,407 | | | $ | 139,686 | | | $ | 110,245 | | | $ | 75,592 | | | $ | 62,091 | | | $ | 53,012 | |
| | | | | | |
Ratio of expenses excluding waiver/reimbursement to average net assets | | | 0.37% | | | | 0.37% | | | | 0.37% | | | | 0.37% | | | | 0.37% | (d) | | | 0.37% | |
Ratio of expenses including waiver/reimbursement to average net assets | | | 0.21%(e) | | | | 0.34% | | | | 0.34% | | | | 0.34% | | | | 0.34% | (d) | | | 0.34% | |
Ratio of net investment income excluding waiver/reimbursement to average net assets | | | 1.78% | | | | 1.67% | | | | 1.77% | | | | 1.76% | | | | 1.22% | (d) | | | 2.11% | |
Ratio of net investment income including waiver/reimbursement to average net assets | | | 1. 94%(e) | | | | 1.70% | | | | 1.80% | | | | 1.79% | | | | 1.25% | (d) | | | 2.14% | |
Portfolio turnover rate(f) | | | 6% | | | | 3% | | | | 2% | | | | 4% | | | | 4 | % | | | 7% | |
| (a) | Effective March 7, 2011, the Board approved changing the fiscal year end of the Fund from December 31 to November 30. |
| (b) | Based on average shares outstanding during the period. |
| (c) | Total return is calculated assuming an initial investment made at the net asset value at the beginning of the period and redemption at the net asset value on the last day of the period and assuming all distributions are reinvested at reinvestment prices. Total return calculated for a period of less than one year is not annualized. |
| (e) | The effective expense ratio including waivers changed from 0.34% to 0.15% effective April 1, 2015 through March 31, 2016. |
| (f) | Portfolio turnover is not annualized and does not include securities received or delivered from processing creations or redemptions. |
See Notes to Financial Statements.
10 | November 30, 2015
| | |
ALPS Equal Sector Weight ETF | | |
| |
| Notes to Financial Statements | | November 30, 2015 |
| | |
1. ORGANIZATION
The ALPS ETF Trust (the “Trust”), a Delaware statutory trust, is an open-end management investment company registered under the Investment Company Act of 1940, as amended (the “1940 Act”). As of November 30, 2015, the Trust consists of twenty-one separate portfolios. Each portfolio represents a separate series of the Trust. This report pertains solely to the ALPS Equal Sector Weight ETF (the “Fund”). The investment objective of the Fund is to seek investment results that replicate as closely as possible, before fees and expenses, the performance of the Banc of America Securities Merrill Lynch Equal Sector Weight Index. The Fund is considered non-diversified and may invest a greater portion of assets in securities of individual issuers than a diversified fund. As a result, changes in the market value of a single investment could cause greater fluctuations in share price than would occur in a diversified fund.
The Fund’s Shares (“Shares”) are listed on the New York Stock Exchange (“NYSE”) Arca. The Fund issues and redeems Shares at net asset value (“NAV”) in blocks of 50,000 Shares each of which is called a “Creation Unit”. Creation Units are issued and redeemed principally in-kind for securities included in a specified index. Except when aggregated in Creation Units, Shares are not redeemable securities of the Fund.
Pursuant to the Trust’s organizational documents, its Officers and Trustees are indemnified against certain liability arising out of the performance of their duties to the Trust. Additionally, in the normal course of business, the Trust enters into contracts with service providers that contain general indemnification clauses. The Trust’s maximum exposure under these arrangements is unknown, as this would involve future claims that may be made against the Trust that have not yet occurred.
2. SIGNIFICANT ACCOUNTING POLICIES
The following is a summary of significant accounting policies consistently followed by the Fund in the preparation of the financial statements. The accompanying financial statements were prepared in accordance with accounting principles generally accepted in the United States of America (“U.S. GAAP”). The preparation of financial statements in conformity with U.S. GAAP requires management to make certain estimates and assumptions that affect the reported amounts of assets and liabilities and disclosures of contingent assets and liabilities at the date of the financial statements and the reported amounts of revenue and expenses during the period. Actual results could differ from those estimates. The Fund is considered an investment company under U.S. GAAP and follows the accounting and reporting guidance applicable to investment companies in the Financial Accounting Standards Board Accounting Standards Codification Topic 946.
A. Portfolio Valuation
The Fund’s NAV is determined daily, as of the close of regular trading on the NYSE, normally 4:00 p.m. Eastern time, on each day the NYSE is open for trading. The NAV is computed by dividing the value of all assets of the Fund (including accrued interest and dividends), less all liabilities (including accrued expenses and dividends declared but unpaid), by the total number of shares outstanding.
Portfolio securities listed on any exchange other than the NASDAQ Stock Market LLC (“NASDAQ”) are valued at the last sale price on the business day as of which such value is being determined. If there has been no sale on such day, the securities are valued at the mean of the most recent bid and ask prices on such day. Securities traded on the NASDAQ are valued at the NASDAQ Official Closing Price as determined by NASDAQ. Portfolio securities traded on more than one securities exchange are valued at the last sale price on the business day as of which such value is being determined at the close of the exchange representing the principal market for such securities. Portfolio securities traded in the over-the-counter market, but excluding securities traded on the NASDAQ, are valued at the last quoted sale price in such market.
The Fund’s investments are valued at market value or, in the absence of market value with respect to any portfolio securities, at fair value according to procedures adopted by the Trust’s Board of Trustees (the “Board”). When market quotations are not readily available or when events occur that make established valuation methods unreliable, securities of the Fund may be valued in good faith by or under the direction of the Board. These securities generally include, but are not limited to, restricted securities (securities which may not be publicly sold without registration under the Securities Act of 1933) for which a pricing service is unable to provide a market price; securities whose trading has been formally suspended; a security whose market price is not available from a pre-established primary pricing source or the pricing source is not willing to provide a price; a security with respect to which an event has occurred that is most likely to materially affect the value of the security after the market has closed but before the calculation of the Fund’s NAV or make it difficult or impossible to obtain a reliable market quotation; or a security whose price, as provided by the pricing service, does not reflect the security’s “fair value” due to the security being de-listed from a national exchange or the security’s primary trading market is temporarily closed at a time when, under normal conditions, it would be open. As a general principle, the current “fair value” of a security would be the amount which the owner might reasonably expect to receive from the sale on the applicable exchange or principal market. A variety of factors may be considered in determining the fair value of such securities.
11 | November 30, 2015
| | |
ALPS Equal Sector Weight ETF | | |
| |
| Notes to Financial Statements | | November 30, 2015 |
| | |
B. Fair Value Measurements
The Fund discloses the classification of its fair value measurements following a three-tier hierarchy based on the inputs used to measure fair value. Inputs refer broadly to the assumptions that market participants would use in pricing the asset or liability, including assumptions about risk. Inputs may be observable or unobservable. Observable inputs reflect the assumptions market participants would use in pricing the asset or liability that are developed based on market data obtained from sources independent of the reporting entity. Unobservable inputs reflect the reporting entity’s own assumptions about the assumptions market participants would use in pricing the asset or liability that are developed based on the best information available.
Valuation techniques used to value the Fund’s investments by major category are as follows:
Exchange Traded Funds, for which market quotations are readily available, are valued at the last reported sale price or official closing price as reported by a third party pricing vendor on the primary market or exchange on which they are traded and are categorized as Level 1 in the hierarchy. In the event there were no sales during the day or closing prices are not available, securities are valued at the mean of the most recent quoted bid and ask prices on such day and are generally categorized as Level 2 in the hierarchy. Investments in open-end mutual funds are valued at their closing NAV each business day and are categorized as Level 1 in the hierarchy.
Changes in valuation techniques may result in transfers in or out of an assigned level within the disclosure hierarchy.
Various inputs are used in determining the value of the Fund’s investments as of the end of the reporting period. When inputs used fall into different levels of the fair value hierarchy, the level in the hierarchy within which the fair value measurement falls is determined based on the lowest level input that is significant to the fair value measurement in its entirety. The designated input levels are not necessarily an indication of the risk or liquidity associated with these investments.
These inputs are categorized in the following hierarchy under applicable financial accounting standards:
| | | | |
Level 1 | | – | | Unadjusted quoted prices in active markets for identical investments, unrestricted assets or liabilities that a Fund has the ability to access at the measurement date; |
Level 2 | | – | | Quoted prices which are not active, quoted prices for similar assets or liabilities in active markets or inputs other than quoted prices that are observable (either directly or indirectly) for substantially the full term of the asset or liability; and |
Level 3 | | – | | Significant unobservable prices or inputs (including the Fund’s own assumptions in determining the fair value of investments) where there is little or no market activity for the asset or liability at the measurement date. |
The following is a summary of inputs used to value the Fund’s investments at November 30, 2015:
| | | | | | | | | | | | | | | | |
| Investments in Securities at Value * | | Level 1 - Unadjusted
Quoted Prices | | | Level 2 - Significant
Observable Inputs | | | Level 3 - Significant
Unobservable Inputs | | | Total | |
| |
Exchange Traded Funds | | $ | 140,307,395 | | | $ | – | | | $ | – | | | $ | 140,307,395 | |
Short Term Investments | | | 117,303 | | | | – | | | | – | | | | 117,303 | |
| |
TOTAL | | $ | 140,424,698 | | | $ | – | | | $ | – | | | $ | 140,424,698 | |
| |
| * | For a detailed sector breakdown, see the accompanying Schedule of Investments. |
The Fund recognizes transfers between levels as of the end of the period. For the year ended November 30, 2015, the Fund did not have any transfers between Level 1 and Level 2 securities. The Fund did not have any securities which used significant unobservable inputs (Level 3) in determining fair value.
C. Securities Transactions and Investment Income
Securities transactions are recorded as of the trade date. Realized gains and losses from securities transactions are recorded on the highest cost basis. Dividend income and capital gains distributions, if any, are recorded on the ex-dividend date. Interest income, if any, is recorded on the accrual basis.
D. Dividends and Distributions to Shareholders
Dividends from net investment income of the Fund, if any, are declared and paid quarterly or as the Board may determine from time to time. Distributions of net realized capital gains earned by the Fund, if any, are distributed at least annually.
12 | November 30, 2015
| | |
ALPS Equal Sector Weight ETF | | |
| |
| Notes to Financial Statements | | November 30, 2015 |
| | |
E. Federal Tax and Tax Basis Information
The timing and character of income and capital gain distributions are determined in accordance with income tax regulations, which may differ from U.S. GAAP. Reclassifications are made to the Fund’s capital accounts for permanent tax differences to reflect income and gains available for distribution (or available capital loss carryforwards) under income tax regulations.
For the year ended November 30, 2015, the following reclassifications, which had no impact on results of operations or net assets, were recorded to reflect permanent tax differences resulting primarily from in-kind transactions:
| | | | | | | | | | | | |
| Fund | | Accumulated Net Investment
Income | | | Accumulated Net Realized Loss on
Investments | | | Paid-in Capital | |
| |
ALPS Equal Sector Weight ETF | | $ | – | | | $ | (7,351,770 | ) | | $ | 7,351,770 | |
The tax character of the distributions paid during the years ended November 30, 2015 and November 30, 2014 were as follows: | |
| | | | | | | | | Ordinary Income | |
| |
November 30, 2015 | | | | | | | | | | | | |
ALPS Equal Sector Weight ETF | | | | | | | | | | $ | 2,761,711 | |
| | | |
| | | | | | | | | Ordinary Income | |
| |
November 30, 2014 | | | | | | | | | | | | |
ALPS Equal Sector Weight ETF | | | | | | | | | | $ | 2,197,152 | |
As of November 30, 2015, the components of distributable earnings on a tax basis for the Fund were as follows: | |
Undistributed net investment income | | | | | | | | | | $ | 12,644 | |
Accumulated net realized loss on investments | | | | | | | | | | | (175,937) | |
Net unrealized appreciation on investments | | | | | | | | | | | 21,997,397 | |
| |
Total | | | | | | | | | | $ | 21,834,104 | |
| |
At November 30, 2015, the Fund had available for tax purposes unused post-enactment capital loss carryforwards as follows: | |
| Fund | | | | | Short-Term | | | Long-Term | |
| |
ALPS Equal Sector Weight ETF | | | | | | $ | 166,823 | | | $ | 9,114 | |
As of November 30, 2015, the cost of investments for federal income tax purposes and accumulated net unrealized appreciation/(depreciation) on investments were as follows: | |
Gross appreciation (excess of value over tax cost) | | | | | | | | | | $ | 25,289,819 | |
Gross depreciation (excess of tax cost over value) | | | | | | | | | | | (3,292,422) | |
| |
Net unrealized appreciation (depreciation) | | | | | | | | | | | 21,997,397 | |
| |
Cost of investments for income tax purposes | | | | | | | | | | $ | 118,427,301 | |
| |
The differences between book-basis and tax-basis are primarily due to the deferral of losses from wash sales.
F. Income Taxes
No provision for income taxes is included in the accompanying financial statements, as the Fund intends to distribute to shareholders all taxable investment income and realized gains and otherwise comply with Subchapter M of the Internal Revenue Code of 1986, as amended, applicable to regulated investment companies. The Fund evaluates tax positions taken (or expected to be taken) in the course of preparing the Fund’s tax returns to determine whether these positions meet a “more-likely-than-not” standard that, based on the technical merits, have a more than fifty percent likelihood of being sustained by a taxing authority upon examination. A tax position that meets the “more-likely-than-not” recognition threshold is measured to determine the amount of benefit to recognize in the financial statements.
As of and during the year ended November 30, 2015, the Fund did not have a liability for any unrecognized tax benefits. The Fund files U.S. federal, state, and local tax returns as required. The Fund’s tax returns are subject to examination by the relevant tax authorities until expiration of the
13 | November 30, 2015
| | |
ALPS Equal Sector Weight ETF | | |
| |
| Notes to Financial Statements | | November 30, 2015 |
| | |
applicable statute of limitations which is generally three years after the filing of the tax return, but may extend to four years in certain jurisdictions. Tax returns for open years have incorporated no uncertain tax positions that require a provision for income taxes.
3. INVESTMENT ADVISORY FEE AND OTHER AFFILIATED TRANSACTIONS
ALPS Advisors, Inc. (the “Adviser”) acts as the Fund’s investment adviser pursuant to an Advisory Agreement with the Trust on behalf of the Fund (the “Advisory Agreement”). Pursuant to the Advisory Agreement, the Fund pays the Adviser a unitary fee for the services and facilities it provides payable on a monthly basis at the annual rate of 0.37% of the Fund’s average daily net assets.
Effective April 1, 2015 the Adviser has agreed to waive 0.19% of its annual unitary fee payable by the Fund until at least March 31, 2016. This waiver may only be terminated by the Fund’s Board of Trustees prior to such date.
ALPS Portfolio Solutions Distributor, Inc. (“APSD”) is both the distributor for the Fund as well as the Select Sector SPDR exchange traded funds (“Underlying Sector ETFs”) that the Fund invests in. As required by exemptive relief obtained by the Underlying Sector ETFs, the Adviser will reimburse the Fund an amount equal to the distribution fee received by APSD from the Underlying Sector ETFs attributable to the Fund’s investment in the Underlying Sector ETFs, for so long as APSD acts as the distributor to the Fund and the Underlying Sector ETFs. Such reimbursement is generally expected to equal 0.03% annually.
Out of the unitary management fee, the Adviser pays substantially all expenses of the Fund, including the cost of transfer agency, custody, fund administration, legal, audit, independent trustees and other services, except for acquired fund fees and expenses, interest expenses, distribution fees or expenses, brokerage expenses, taxes and extraordinary expenses not incurred in the ordinary course of the Fund’s business. The Adviser’s unitary management fee is designed to pay substantially all of the Fund’s expenses and to compensate the Adviser for providing services for the Fund.
ALPS Fund Services, Inc., an affiliate of the Adviser, is the administrator of the Fund.
Each Trustee who is not an officer or employee of the Adviser, any sub-adviser or any of their affiliates (“Independent Trustees”) receives (1) a quarterly retainer of $5,000, (2) a per meeting fee for regularly scheduled meetings of $3,750, (3) $1,500 for any special meeting held outside of a regularly scheduled board meeting, and (4) reimbursement for all reasonable out-of-pocket expenses relating to attendance at meetings.
4. PURCHASES AND SALES OF SECURITIES
For the year ended November 30, 2015, the cost of purchases and proceeds from sales of investment securities, excluding short-term investments and in-kind transactions, were as follows:
| | | | | | | | |
| Fund | | Purchases | | | Sales | |
| |
ALPS Equal Sector Weight ETF | | $ | 8,454,463 | | | $ | 8,798,139 | |
|
For the year ended November 30, 2015 , the cost in-kind purchases and proceeds from in-kind sales were as follows: | |
| Fund | | Purchases | | | Sales | |
| |
ALPS Equal Sector Weight ETF | | $ | 22,873,343 | | | $ | 19,775,003 | |
The ALPS Equal Sector Weight ETF had in-kind net realized gain/(loss) of $7,400,937.
Gains on in-kind transactions are generally not considered taxable gains for federal income tax purposes.
5. CAPITAL SHARE TRANSACTIONS
Shares are created and redeemed by the Fund only in Creation Unit size aggregations of 50,000. Only broker-dealers or large institutional investors with creation and redemption agreements called Authorized Participants (“AP”) are permitted to purchase or redeem Creation Units from the Fund. Such transactions are generally permitted on an in-kind basis, with a balancing cash component to equate the transaction to the NAV per unit of the Fund on the transaction date. Cash may be substituted equivalent to the value of certain securities generally when they are not available in sufficient quantity for delivery, not eligible for trading by the AP or as a result of other market circumstances.
14 | November 30, 2015
| | |
ALPS Equal Sector Weight ETF | | |
| |
| Additional Information | | November 30, 2015 (Unaudited) |
| | |
PROXY VOTING RECORDS, POLICIES AND PROCEDURES
Information regarding how the Fund voted proxies relating to portfolio securities during the most recent 12-month period ended June 30 and a description of the Fund’s proxy voting policies and procedures used in determining how to vote for proxies are available without charge on the Securities and Exchange Commission’s (“SEC”) website at www.sec.gov and upon request, by calling (toll-free) 1-866-675-2639.
PORTFOLIO HOLDINGS
The Trust is required to disclose, after its first and third fiscal quarters, the complete schedule of each Fund’s portfolio holdings with the SEC on Form N-Q. Form N-Q for each Fund will be available on the SEC’s website at www.sec.gov. Each Fund’s Form N-Q may also be reviewed and copied at the SEC’s Public Reference Room in Washington, D.C. and information on the operation of the Public Reference Room may be obtained by calling 1-800-SEC-0330. Each Fund’s Form N-Q will be available without charge, upon request, by calling (toll-free) 1-866-675-2639 or by writing to ALPS ETF Trust at 1290 Broadway, Suite 1100, Denver, Colorado 80203.
TAX INFORMATION
The Fund designates the following for federal income tax purposes for distributions made during the calendar year ended December 31, 2014:
| | | | |
| | | Qualified Dividend Income | | Dividend Received Deduction |
|
ALPS Equal Sector Weight ETF | | 100.00% | | 100.00% |
In early 2015, if applicable, shareholders of record received this information for the distributions paid to them by the Fund during the calendar year 2014 via Form 1099. The Fund will notify shareholders in early 2016 of amounts paid to them by the Fund, if any, during the calendar year 2015.
LICENSING AGREEMENT
Merrill Lynch, Pierce, Fenner & Smith Incorporated (“Merrill Lynch” or the “Licensor”) has entered into an index licensing agreement with ALPS Advisors Inc. (the “Advisor”) to allow the Advisor’s use of the underlying index of the ALPS Equal Sector Weight ETF (the “Fund”). The following disclosure relates to the Licensor:
The Fund is not issued, sponsored, endorsed, sold or promoted by Merrill Lynch or its affiliates (“Licensor”). Licensor makes no representation or warranty, express or implied, to the owners of the Fund or any member of the public regarding the advisability of investing in securities generally or in the Fund particularly or the ability of the Bank of America Securities Merrill Lynch Equal Sector Weight Index (“Index”) to track general market performance. Licensor’s only relationship to the Licensee is the licensing of the Index which is determined, composed and calculated by Licensor without regard to the Licensee or the Fund. Licensor has no obligation to take the needs of the Licensee or the owners of the Fund into consideration in determining, composing or calculating the Index. Licensor is not responsible for and has not participated in the determination of the timing of, prices at, or quantities of the Fund to be issued or in the determination or calculation of the equation by which the Fund is to be converted into cash. Licensor has no obligation or liability in connection with the issuance, administration, marketing or trading of the Fund.
LICENSOR DOES NOT GUARANTEE THE QUALITY, ACCURACY AND/OR THE COMPLETENESS OF THE INDEX OR ANY DATA INCLUDED THEREIN AND SHALL HAVE NO LIABILITY FOR ERRORS OR OMISSIONS OF ANY KIND RELATED TO THE INDEX OR DATA. LICENSOR MAKES NO WARRANTY, EXPRESS OR IMPLIED, AS TO RESULTS TO BE OBTAINED BY LICENSEE, OWNERS OF THE FUND, OR ANY OTHER PERSON OR ENTITY FROM THE USE OF THE INDEX OR ANY DATA INCLUDED THEREIN IN CONNECTION WITH THE RIGHTS LICENSED TO LICENSEE OR FOR ANY OTHER USE. LICENSOR MAKES NO EXPRESS OR IMPLIED WARRANTIES, AND HEREBY EXPRESSLY DISCLAIMS ALL WARRANTIES OF MERCHANTABILITY OR FITNESS FOR A PARTICULAR PURPOSE OR USE WITH RESPECT TO THE INDEX OR ANY DATA INCLUDED THEREIN. WITHOUT LIMITING ANY OF THE FOREGOING, IN NO EVENT SHALL LICENSOR HAVE ANY LIABILITY FOR ANY SPECIAL, PUNITIVE, INDIRECT, OR CONSEQUENTIAL DAMAGES (INCLUDING LOST PROFITS), EVEN IF NOTIFIED OF THE POSSIBILITY OF SUCH DAMAGES.
The Advisor does not guarantee the accuracy and/or the completeness of the Underlying Index or any data included therein, and the Advisor shall have no liability for any errors, omissions or interruptions therein. The Advisor makes no warranty, express or implied, as to results to be obtained by the Fund, owners of the Shares of the Fund or any other person or entity from the use of the Underlying Index or any data included therein. The Advisor makes no express or implied warranties, and expressly disclaims all warranties of merchantability or fitness for a particular purpose or use with respect to the Underlying Index or any data included therein. Without limiting any of the foregoing, in no event shall the Advisor have any liability for any special, punitive, direct, indirect or consequential damages (including lost profits) arising out of matters relating to the use of the Underlying Index even if notified of the possibility of such damages.
15 | November 30, 2015
| | |
ALPS Equal Sector Weight ETF | | |
| |
| Board Considerations Regarding Approval of Investment Advisory Agreement | | November 30, 2015 (Unaudited) |
| | |
At an in-person meeting held on June 8, 2015, the Board of Trustees of the Trust (the “Board” or the “Trustees”), including the Trustees who are not “interested persons” of the Trust within the meaning of the 1940 Act, as amended (the “Independent Trustees”), evaluated a proposal to approve the continuance of the Advisory Agreement between the Trust and ALPS Advisors, Inc. (the “Adviser”) with respect to the ALPS Equal Sector Weight ETF (“EQL”). The Independent Trustees also met separately to consider the Advisory Agreement.
In evaluating the Investment Advisory Agreement with respect to EQL, the Trustees considered various factors, including (i) the nature, extent and quality of the services to be provided by the Adviser with respect to EQL under the Investment Advisory Agreement; (ii) the advisory fees and other expenses to be paid by EQL compared to those of similar funds managed by other investment advisers; (iii) the costs of the services provided to EQL by the Adviser and the profits realized by the Adviser and its affiliates from its relationship to EQL; (iv) the extent which economies of scale would be realized if and as the assets of EQL grow and whether fees reflect the economies of scale for the benefit of shareholders and (v) any additional benefits and other considerations.
With respect to the nature, extent and quality of the services to be provided by the Adviser under the Investment Advisory Agreement, the Trustees considered and reviewed information concerning the services to be provided under the Investment Advisory Agreement, the investment parameters of the index of EQL, financial information regarding the Adviser and its parent company, information describing the Adviser’s current organization and the background and experience of the persons who would be responsible for the day-to-day management of EQL.
The Trustees reviewed information on the performance of EQL and its benchmark. The Trustees also evaluated the correlation and tracking error between the underlying index and its corresponding Fund’s performance. Based on their review, the Trustees found that the nature and extent of services provided to EQL under the Investment Advisory Agreement was appropriate and that the quality was satisfactory.
The Trustees noted that the advisory fee for EQL was a unitary fee pursuant to which the Adviser assumes all expenses of the EQL (including the cost of transfer agency, custody, fund administration, legal, audit and other services) other than the payments under the Advisory Agreement, brokerage expenses, taxes, interest, litigation expenses and other extraordinary expenses.
The Trustees noted that the advisory fee rates and expense ratios of EQL are lower than the medians of its Strategic Insight expense group.
Based on the foregoing, and the other information available to them, the Trustees concluded that the advisory fee rate for EQL was reasonable under the circumstances and in light of the quality of the services provided.
The Trustees considered other benefits available to the Adviser because of its relationship with EQL and concluded that the advisory fees were reasonable taking into account any such benefits.
The Trustees also considered the information provided by the Adviser about the costs and profitability of the Adviser with respect to EQL. The Trustees reviewed and noted the relatively small size of EQL and concluded that the Adviser was not realizing any economies of scale. The Trustees determined that they would continue to evaluate whether further economies of scale have been achieved on an ongoing basis.
In voting to renew the Advisory Agreement, the Trustees concluded that the terms of the Advisory Agreement are reasonable and fair in light of the services to be performed, the fees paid by certain other funds, expenses to be incurred and such other matters as the Trustees considered relevant in the exercise of their reasonable business judgment. The Trustees did not identify any single factor or group of factors as all important or controlling and considered all factors together.
16 | November 30, 2015
| | |
ALPS Equal Sector Weight ETF | | |
| |
| Trustees & Officers | | November 30, 2015 (Unaudited) |
| | |
| | | | | | | | | | |
INDEPENDENT TRUSTEES |
Name, Address
& Year of Birth* | | Position(s) Held with Trust | | Term of Office
and Length of
Time Served** | | Principal Occupation(s)
During Past 5 Years | | Number of
Portfolios in Fund
Complex Overseen
by Trustees*** | | Other Directorships
Held by Trustees |
Mary K. Anstine, 1940 | | Trustee | | Since March 2008 | | Ms. Anstine was formerly an Executive Vice President of First Interstate Bank of Denver until 1994, President/Chief Executive Officer of HealthONE Alliance, Denver, Colorado, from 1994 to 2004, and has been retired since 2004. Ms. Anstine is also Trustee/Director of the following: AV Hunter Trust and Colorado Uplift Board. Ms. Anstine was formerly a Director of the Trust Bank of Colorado (later purchased and now known as Northern Trust Bank), HealthONE and Denver Area Council of the Boy Scouts of America and a member of the American Bankers Association Trust Executive Committee. | | 46 | | Ms. Anstine is a Trustee of ALPS Variable Investment Trust (9 funds); Financial Investors Trust (31 funds); Reaves Utility Income Fund; and Westcore Trust (12 funds). |
Jeremy W. Deems, 1976 | | Trustee | | Since March 2008 | | Mr. Deems is the Co-Founder, Chief Financial Officer of Green Alpha Advisors, LLC. Mr. Deems is Co-Portfolio Manager of the Shelton Green Alpha Fund. Prior to joining Green Alpha Advisors, Mr. Deems was CFO and Treasurer of Forward Management, LLC, ReFlow Management Co., LLC, ReFlow Fund, LLC, a private investment fund, and Sutton Place Management, LLC, an administrative services company. | | 46 | | Mr. Deems is a Trustee of ALPS Variable Investment Trust (9 funds); Financial Investors Trust (31 funds); Clough Funds Trust (1 fund); and Reaves Utility Income Fund. |
Rick A. Pederson, 1952 | | Trustee | | Since March 2008 | | Mr. Pederson is President, Foundation Properties, Inc. (a real estate investment management company), 1994 - present; Advisory Board Member, Bow River Capital Partners (private equity management), 2003 - present; Advisor, Pauls Corporation (real estate investment management and development), 2008 - present; Chairman, Ross Consulting Group (real estate consulting services) 1983-2013; Advisory Board, Neenan Company (construction services) 2002- present; Board Member, Prosci, Inc. (private business services), 2013-present; Board Member, Citywide Banks (Colorado community bank) 2014-present; Board member, Professional Pediatric Health Care (a Denver-based home nursing firm) 2014 – present; Director, National Western Stock Show (not-for-profit organization); Director, Biennial of the Americas (not-for- profit organization). | | 24 | | Mr. Pederson is Trustee of Westcore Trust (12 funds) and Principal Real Estate Income Fund (1 fund). |
| * | The business address of the Trustee is c/o ALPS Advisors, Inc., 1290 Broadway, Suite 1100, Denver, Colorado 80203. |
| ** | This is the period for which the Trustee began serving the Trust. Each Trustee serves an indefinite term, until his successor is elected. |
| *** | The Fund Complex includes all series of the Trust and any other investment companies for which ALPS Advisors, Inc. provides investment advisory services. |
The Statement of Additional Information includes additional information about the Fund’s Trustees and is available, without charge, upon request by calling (toll-free) 1-866-675-2639.
17 | November 30, 2015
| | |
ALPS Equal Sector Weight ETF | | |
| |
| Trustees & Officers | | November 30, 2015 (Unaudited) |
| | |
| | | | | | | | | | |
INTERESTED TRUSTEE |
Name, Address
and Year of Birth of
Interested
Trustee* | | Position(s) Held with Trust | | Term of Office
and Length of
Time Served** | | Principal Occupation(s)
During Past 5 Years | | Number of
Portfolios in Fund
Complex Overseen
by Trustees*** | | Other Directorships
Held by Trustees |
Thomas A. Carter, 1966 | | Trustee and President | | Since March 2008 | | Mr. Carter joined ALPS Fund Services, Inc. (“ALPS”) in 1994 and is currently President and Director of ALPS Advisors, Inc. (“AAI”), and ALPS Portfolio Solutions Distributor, Inc. (“APSD”) and Executive Vice President and Director of ALPS and ALPS Holdings, Inc. (“AHI”), and ALPS Distributors, Inc. (“ADI”). Because of his position with AHI, ALPS, ADI, APSD and AAI, Mr. Carter is deemed an affiliate of the Fund as defined under the 1940 Act. Before joining ALPS, Mr. Carter was with Deloitte & Touche LLP, where he worked with a diverse group of clients, primarily within the financial services industry. Mr. Carter is a Certified Public Accountant and received his Bachelor of Science in Accounting from the University of Colorado at Boulder. | | 34 | | Mr. Carter is a Trustee of ALPS Variable Investment Trust (9 funds) and Principal Real Estate Income Fund (1 fund) |
| * | The business address of the Trustee is c/o ALPS Advisors, Inc., 1290 Broadway, Suite 1100, Denver, Colorado 80203. |
| ** | This is the period for which the Trustee began serving the Trust. Each Trustee serves an indefinite term, until his successor is elected. |
| *** | The Fund Complex includes all series of the Trust and any other investment companies for which ALPS Advisors, Inc. provides investment advisory services. |
The Statement of Additional Information includes additional information about the Fund’s Trustees and is available, without charge, upon request by calling (toll-free) 1-866-675-2639.
18 | November 30, 2015
| | |
ALPS Equal Sector Weight ETF | | |
| |
| Trustees & Officers | | November 30, 2015 (Unaudited) |
| | |
| | | | | | |
OFFICERS |
Name, Address
and Year of
Birth of Officer* | | Position(s) Held with Trust | | Length of Time Served** | | Principal Occupation(s) During Past 5 Years |
Erin D. Nelson, 1977 | | Chief Compliance Officer (“CCO”) | | Since December 2015 | | Erin Nelson became Senior Vice-President and Chief Compliance Officer of ALPS Advisors, Inc. (“AAI”) on July 1, 2015 and prior to that served as Vice President and Deputy Chief Compliance Officer of AAI since January 1, 2015. Prior to January 1, 2015, Ms. Nelson was Vice-President and Assistant General Counsel of ALPS of Fund Services, Inc. Ms. Nelson joined AAI’s parent company, ALPS Holdings, Inc. in January 2003. Ms. Nelson currently is also the Chief Compliance Officer of Principal Real Estate Income Fund, and as of December 2015, the Chief Compliance Officer of Liberty All-Star Equity Fund, Liberty All-Star Growth Fund, Inc., RiverNorth Opportunities Fund, Inc. |
Patrick D. Buchanan, 1972 | | Treasurer | | Since June 2012 | | Mr. Buchanan is Vice President of AAI. Mr. Buchanan joined ALPS in 2007 and because of his position with AAI, he is deemed an affiliate of the Trust as defined under the 1940 Act. Mr. Buchanan is also Treasurer of the ALPS Variable Insurance Trust, Clough Funds Trust and Principal Real Estate Income Fund. |
William Parmentier, 1952 | | Vice President | | Since March 2008 | | Mr. Parmentier is Chief Investment Officer, AAI (since 2006); President and Chief Executive Officer of the Liberty All-Star Funds (since April 1999); Senior Vice President (2005-2006), Banc of America Investment Advisors, Inc. Because of his position with AAI, Mr. Parmentier is deemed an affiliate of the Trust as defined under the 1940 Act. |
Abigail J. Murray, 1975 | | Secretary | | Since June 2015 | | Ms. Murray joined ALPS in April 2015. She is currently Vice President and Senior Counsel of ALPS. Prior to joining ALPS, Ms. Murray was an Attorney and Managing Member at Murray & Rouvina PLC from 2014 to 2015 and an Associate with Vedder Price P.C. from 2007 to 2014. Because of her position with ALPS, Ms. Murray is deemed an affiliate of the Trust as defined under the 1940 Act. Ms. Murray is also the Secretary of The Caldwell & Orkin Funds, Inc., Clough Global Opportunities Fund, Clough Global Allocation Fund, Clough Global Equity Fund and Clough Funds Trust. |
Jennifer A. Craig, 1973 | | Assistant Secretary | | Since October 2013 | | Ms. Craig joined ALPS in 2007 and is currently Assistant Vice President and Paralegal Manager. Prior to joining ALPS, Ms. Craig was Legal Manager at Janus Capital Management LLC and served as Assistant Secretary of Janus Investment Fund, Janus Adviser Series and Janus Aspen Series. Because of her position with ALPS, Ms. Craig is deemed an affiliate of the Trust as defined under the 1940 Act. |
| * | The business address of the Officer is c/o ALPS Advisors, Inc., 1290 Broadway, Suite 1100, Denver, Colorado 80203. |
| ** | This is the period for which the Officer began serving the Trust. Each Officer serves an indefinite term, until his successor is elected. |
19 | November 30, 2015
Intentionally Left Blank
table of
CONTENTS
www.alpsfunds.com
| | |
ALPS Medical Breakthroughs ETF | | |
| Performance Overview | | November 30, 2015 (Unaudited) |
Investment Objective
ALPS Medical Breakthroughs ETF (the “Fund”) employs a “passive management” – or indexing – investment approach designed to seek investment results that correspond (before fees and expenses) generally to the performance of the Poliwogg Medical Breakthroughs IndexSM (the “Underlying Index”).
The Underlying Index is comprised of small- and mid-cap stocks of biotechnology and pharmaceutical companies that have one or more drugs in either Phase II or Phase III U.S. Food and Drug Administration (“FDA”) clinical trials. In a Phase II trial, the drug is administered to a group of 100-300 people to see if it is effective and to evaluate its safety. In a Phase III trial, the drug is given to a larger group, between 500-3,000 people, to confirm its effectiveness, monitor side effects, compare it to commonly used treatments and collect information that will allow the drug or treatment to be used safely. Stocks selected for inclusion in the Underlying Index must be listed on a U.S. stock exchange. Underlying Index constituents must have a market capitalization of no less than $200 million and no more than $5 billion. Stocks included in the Underlying Index must also sustain an average daily trading volume in excess of $1 million for the 90-day period preceding an Underlying Index reconstitution. Constituents must be able to sustain the monthly rates at which they use shareholder capital (“cash burn rates”) for at least 24 months. The Underlying Index is reconstituted semi-annually on the third Fridays of June and December.
Performance Overview
ALPS Medical Breakthroughs ETF (SBIO), for the eleven month period since the fund’s December 31, 2014 inception through November 30, 2015, generated a total return of 30.80%, in-line with the Fund’s Underlying Index, which returned 31.44%. The fund significantly outperformed the broad market, as the S&P 500® returned 3.01%, and also moderately outpaced the Nasdaq Biotechnology Index, which gained 10.14% for the same period.
Looking at the macro environment of the biotechnology and pharmaceutical space, returns were spurred on through the former half of the year by strong M&A activity and continued advancements in drug research, development, and technology. The latter half of the year saw the space pull back on concerns over alleged pricing abuses in a small number of drugs, concerns over the greater impact of political policy and heightened regulation within the space, and collective macro concerns for the healthcare sector.
For the period, the fund had a significantly positive impact from security selection, as the fund’s names in biotechnology outperformed, adding 18.61% in alpha to the fund over the benchmark, Nasdaq Biotechnology Index. This helped to illustrate the potential benefits of the fund’s methodology, as the liquidity (average daily trading volume) and sustainability (cash burn rate) screens can help to enhance the exposure to innovative biotechnology firms. The fund’s outperformance was also bolstered by its relative overweight to mid- cap names (37.30% vs. 9.34% in NBI), which helped to add 5.93% to the fund’s performance over its peer benchmark. The fund saw a slight negative impact (-4.45%) from its overweight exposure to small-cap names, but security selection across all sizes negated this and helped the fund outpace its peer benchmark.
The best performing stocks in the fund for the period were Anacor Pharmaceuticals Inc. (ANAC), which increased 274.74% and Synageva Biopharma Corp. (GEVA), which saw a gain of 163.35%. Neurocrine Biosciences Inc. (NBIX), which rose 144.36%, and Dyax Corp. (DYAX), which climbed 139.23%, were other top performers. The largest detractors were Verastem Inc. (VSTM), which decreased 74.38%, XBiotech Inc. (XBIT), which fell 62.85%, and Mannkind Corp. (MNKD), which lost 62.62%.
Due to the high failure rate of companies within the space, the non-traditional metrics used to evaluate biotech companies, volatility, and specialized knowledge required to succeed in the space, biotechnology is a difficult industry for stock pickers. This environment makes a passive strategy more attractive, as it provides a diversified, rules- based access vehicle for those looking to gain exposure to the biotechnology space, while eliminating single name risk. SBIO and its underlying index focus on innovation, seeking to capture research and development opportunities in the biotechnology and pharmaceutical industries. Looking forward we believe the Fund’s strategy of providing exposure to small- and mid-cap stocks of biotechnology and pharmaceutical companies that have one or more drugs in either Phase II or Phase III FDA clinical trials can provide potential alpha and pure-play exposure to the biotech space.
1 | November 30, 2015
| | |
ALPS Medical Breakthroughs ETF | | |
| Performance Overview | | November 30, 2015 (Unaudited) |
Growth Of $10,000 (as of November 30, 2015)
Comparison of change in value of a $10,000 investment in the Fund and the Index
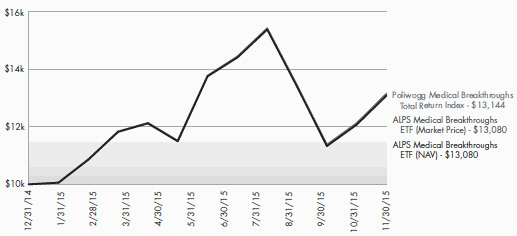
The chart above represents historical performance of a hypothetical investment of $10,000 in the Fund over the life of the Fund. Performance calculations are as of the end of each month. Past performance does not guarantee future results. This chart does not reflect the deduction of taxes that a shareholder would pay on Fund distributions or the redemption of Fund shares.
Fund Performance (as of November 30, 2015)
| | |
| | | Since Inception^ |
ALPS Medical Breakthroughs ETF - NAV | | 30.80% |
ALPS Medical Breakthroughs ETF - Market Price* | | 30.80% |
Poliwogg Medical Breakthroughs Total Return Index | | 31.44% |
Total Expense Ratio (per the current prospectus) 0.50%
Performance data quoted represents past performance. Past performance does not guarantee future results. Investment return and principal value of an investment will fluctuate so that an investor’s shares, when sold or redeemed, may be worth more or less than the original cost. Current performance data may be higher or lower than actual data quoted. For most current month-end performance data please visit www.alpsfunds.com or call 1.844.234.5852.
NAV is an exchange-traded fund’s per-share value. The per-share dollar amount of the fund is derived by dividing the total value of all the securities in its portfolio, less any liabilities, by the number of fund shares outstanding. Market Price is the price at which a share can currently be traded in the market. Information detailing the number of days the Market Price of the Fund was greater than the Fund’s NAV and the number of days it was less than the Fund’s NAV can be obtained at www.alpsfunds.com.
| ^ | The Fund commenced Investment Operations on December 31, 2014. Total return for a period of less than one year is not annualized. |
| * | Market Price is based on the midpoint of the bid-ask spread at 4 p.m. ET and does not represent the returns an investor would receive if shares were traded at other times. |
The Fund is new with limited operating history.
Poliwogg Medical Breakthroughs Total Return Index is designed to capture research and development opportunities in the pharmaceutical industry. PMBI consists of small-cap and mid-cap pharmaceutical and biotechnology stocks listed on U.S. stock exchanges that have one or more drugs in either Phase II or Phase III U.S. FDA clinical trials. Total return assumes reinvestment of any dividends and distributions realized during a given time period.
One cannot invest directly in an index. Index performance does not reflect fund performance.
Companies in the pharmaceuticals and biotechnology industry may be subject to extensive litigation based on product liability and similar claims. Legislation introduced or considered by certain governments on such industries or on the healthcare sector cannot be predicted.
Companies in the pharmaceuticals industry are subject to competitive forces that may make it difficult to raise prices and, in fact, may result in price discounting. The profitability of some companies in the pharmaceuticals industry may be dependent on a relatively limited number of products. In
2 | November 30, 2015
| | |
ALPS Medical Breakthroughs ETF | | |
| Performance Overview | | November 30, 2015 (Unaudited) |
addition, their products can become obsolete due to industry innovation, changes in technologies or other market developments. Many new products in the pharmaceuticals industry are subject to government approvals, regulation and reimbursement rates. The process of obtaining government approvals may be long and costly. Many companies in the pharmaceuticals industry are heavily dependent on patents and intellectual property rights. The loss or impairment of these rights may adversely affect the profitability of these companies.
The development of new drugs generally has a high failure rate, and such failures may negatively impact the stock price of the company developing the failed drug. Biotechnology companies may have persistent losses during a new product’s transition from development to production. In order to fund operations, biotechnology companies may require financing from the capital markets, which may not always be available on satisfactory terms or at all.
The Fund’s shares are not individually redeemable. Investors buy and sell shares of the Fund on a secondary market. Only market makers or “authorized participants” may trade directly with the Fund, typically in blocks of 50,000 shares.
The ALPS Medical Breakthroughs ETF is not suitable for all investors. Investments in the Fund are subject to investment risks, including possible loss of the principal amount invested.
ALPS Portfolio Solutions Distributor, Inc. is the Distributor for the ALPS Medical Breakthroughs ETF.
ALPS Portfolio Solutions Distributor, Inc. is not affiliated with S-Network Global Indexes, Inc.
Top Ten Holdings* (as of November 30, 2015)
| | | | |
Dyax Corp. | | | 4.69 | % |
Seattle Genetics, Inc. | | | 4.61 | % |
Neurocrine Biosciences, Inc. | | | 4.44 | % |
Anacor Pharmaceuticals, Inc. | | | 4.08 | % |
ACADIA Pharmaceuticals, Inc. | | | 3.64 | % |
Akorn, Inc. | | | 3.63 | % |
Ultragenyx Pharmaceutical, Inc. | | | 3.57 | % |
Catalent, Inc. | | | 3.30 | % |
Horizon Pharma Plc | | | 3.24 | % |
Impax Laboratories, Inc. | | | 3.03 | % |
Total % of Top 10 Holdings | | | 38.23 | % |
Future holdings are subject to change.
Sector Allocation* (as of November 30, 2015)
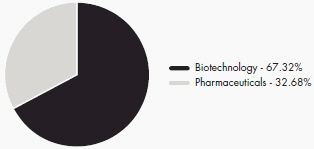
3 | November 30, 2015
| | |
ALPS Medical Breakthroughs ETF | | |
| Disclosure of Fund Expenses | | November 30, 2015 (Unaudited) |
Shareholder Expense Example: As a shareholder of the Fund, you incur two types of costs: (1) transaction costs which may include creation and redemption fees or brokerage charges, and (2) ongoing costs, including management fees and other Fund expenses. These examples are intended to help you understand your ongoing costs (in dollars) of investing in the Fund and to compare these costs with the ongoing costs of investing in other funds. It is based on an investment of $1,000 invested at the beginning of the (six month) period and held through November 30, 2015.
Actual Return: The first line of the table provides information about actual account values and actual expenses. You may use the information in this table, together with the amount you invested, to estimate the expenses that you incurred over the period. Simply divide your account value by $1,000 (for example, an $8,600 account value divided by $1,000 = 8.6), then multiply the result by the number in the first line under the heading entitled “Expenses Paid During the Period” to estimate the expenses attributable to your investment during this period.
Hypothetical 5% Return: The second line of the table provides information about hypothetical account values and hypothetical expenses based on the Fund’s actual expense ratio and an assumed rate of return of 5% per year before expenses, which is not the Fund’s actual return. The hypothetical account values and expenses may not be used to estimate the actual ending account balance or expenses you paid for the period. You may use this information to compare ongoing costs of investing in the Fund and other funds. To do so, compare this 5% hypothetical example with the 5% hypothetical examples that appear in the shareholder reports of the other funds.
The expenses shown in the table are meant to highlight ongoing Fund costs only and do not reflect any transaction costs, such as creation and redemption fees, or brokerage charges. Therefore, the second line is useful in comparing ongoing costs only, and will not help you determine the relative total costs of owning different funds. In addition, if these costs were included, your costs would have been higher.
| | | | | | | | | | | | | | | | |
| | | Beginning Account
Value 6/1/15 | | | Ending Account
Value 11/30/15 | | | Expense
Ratio(a) | | | Expenses Paid
During Period
6/1/15 - 11/30/15(b) | |
ALPS Medical Breakthroughs ETF | | | | | | | | | | | | | | | | |
Actual | | | $1,000.00 | | | | $951.60 | | | | 0.50% | | | | $2.45 | |
Hypothetical (5% return before expenses) | | | $1,000.00 | | | | $1,022.56 | | | | 0.50% | | | | $2.54 | |
| (a) | Annualized, based on the Fund’s most recent fiscal half year expenses. |
| (b) | Expenses are equal to the Fund’s annualized expense ratio multiplied by the average account value over the period, multiplied by the number of days in the most recent fiscal half year (183), divided by 365. |
4 | November 30, 2015
| | |
ALPS Medical Breakthroughs ETF | | |
| Report of Independent Registered Public Accounting Firm |
To the Board of Trustees and Shareholders of ALPS ETF Trust:
We have audited the accompanying statement of assets and liabilities, including the schedule of investments, of ALPS Medical Breakthroughs ETF, one of the portfolios constituting the ALPS ETF Trust (the “Trust”), as of November 30, 2015, and the related statements of operations, changes in net assets, and the financial highlights for the period December 31, 2014 (commencement of operations) to November 30, 2015. These financial statements and financial highlights are the responsibility of the Trust’s management. Our responsibility is to express an opinion on these financial statements and financial highlights based on our audit.
We conducted our audit in accordance with the standards of the Public Company Accounting Oversight Board (United States). Those standards require that we plan and perform the audit to obtain reasonable assurance about whether the financial statements and financial highlights are free of material misstatement. The Trust is not required to have, nor were we engaged to perform, an audit of its internal control over financial reporting. Our audit included consideration of internal control over financial reporting as a basis for designing audit procedures that are appropriate in the circumstances, but not for the purpose of expressing an opinion on the effectiveness of the Trust’s internal control over financial reporting. Accordingly, we express no such opinion. An audit also includes examining, on a test basis, evidence supporting the amounts and disclosures in the financial statements, assessing the accounting principles used and significant estimates made by management, as well as evaluating the overall financial statement presentation. Our procedures included confirmation of securities owned as of November 30, 2015, by correspondence with the custodian. We believe that our audit provides a reasonable basis for our opinion.
In our opinion, the financial statements and financial highlights referred to above present fairly, in all material respects, the financial position of ALPS Medical Breakthroughs ETF of the ALPS ETF Trust as of November 30, 2015, and the results of its operations, the changes in its net assets, and the financial highlights for the period December 31, 2014 (commencement of operations) to November 30, 2015, in conformity with accounting principles generally accepted in the United States of America.
DELOITTE & TOUCHE LLP
Denver, Colorado
January 28, 2016
5 | November 30, 2015
| | |
ALPS Medical Breakthroughs ETF | | |
| Schedule of Investments | | November 30, 2015 |
| | | | | | | | | | | | |
| Security Description | | Shares | | | | | | Value | |
| |
COMMON STOCKS (99.93%) | | | | | | | | | | | | |
Biotechnology (67.27%) | | | | | | | | | | | | |
ACADIA Pharmaceuticals, Inc.(a) | | | 163,832 | | | | | | | $ | 6,217,424 | |
Acceleron Pharma, Inc.(a) | | | 53,779 | | | | | | | | 2,305,506 | |
Achillion Pharmaceuticals, Inc.(a) | | | 191,231 | | | | | | | | 1,946,731 | |
Acorda Therapeutics, Inc.(a) | | | 69,697 | | | | | | | | 2,661,728 | |
Adamas Pharmaceuticals, Inc.(a) | | | 28,992 | | | | | | | | 463,002 | |
Aduro Biotech, Inc.(a) | | | 101,238 | | | | | | | | 3,137,366 | |
Affimed NV(a) | | | 48,367 | | | | | | | | 360,818 | |
Akebia Therapeutics, Inc.(a) | | | 46,909 | | | | | | | | 503,333 | |
Alder Biopharmaceuticals, Inc.(a) | | | 70,777 | | | | | | | | 2,637,151 | |
Anacor Pharmaceuticals, Inc.(a) | | | 59,800 | | | | | | | | 6,980,454 | |
Applied Genetic Technologies Corp.(a) | | | 26,823 | | | | | | | | 457,064 | |
Ardelyx, Inc.(a) | | | 42,150 | | | | | | | | 824,454 | |
Arena Pharmaceuticals, Inc.(a) | | | 393,721 | | | | | | | | 940,993 | |
Atara Biotherapeutics, Inc.(a) | | | 46,101 | | | | | | | | 1,811,769 | |
Cara Therapeutics, Inc.(a) | | | 43,247 | | | | | | | | 715,738 | |
Celldex Therapeutics, Inc.(a) | | | 160,198 | | | | | | | | 2,885,166 | |
Chimerix, Inc.(a) | | | 74,940 | | | | | | | | 3,027,576 | |
Clovis Oncology, Inc.(a) | | | 61,142 | | | | | | | | 1,922,916 | |
Coherus Biosciences, Inc.(a) | | | 61,551 | | | | | | | | 1,869,304 | |
Dyax Corp.(a) | | | 238,079 | | | | | | | | 8,013,739 | |
Emergent BioSolutions, Inc.(a) | | | 63,116 | | | | | | | | 2,377,580 | |
Enanta Pharmaceuticals, Inc.(a) | | | 30,440 | | | | | | | | 958,860 | |
Genocea Biosciences, Inc.(a) | | | 45,643 | | | | | | | | 292,115 | |
Halozyme Therapeutics, Inc.(a) | | | 207,011 | | | | | | | | 3,684,796 | |
ImmunoGen, Inc.(a) | | | 140,196 | | | | | | | | 1,902,460 | |
Karyopharm Therapeutics, Inc.(a) | | | 58,061 | | | | | | | | 1,085,741 | |
Ligand Pharmaceuticals, Inc.(a) | | | 32,298 | | | | | | | | 3,458,470 | |
MacroGenics, Inc.(a) | | | 55,625 | | | | | | | | 1,923,512 | |
MannKind Corp.(a) | | | 666,255 | | | | | | | | 1,332,510 | |
Merrimack Pharmaceuticals, Inc.(a) | | | 178,974 | | | | | | | | 1,684,145 | |
Neurocrine Biosciences, Inc.(a) | | | 139,686 | | | | | | | | 7,594,728 | |
OncoMed Pharmaceuticals, Inc.(a) | | | 48,830 | | | | | | | | 1,115,765 | |
Ophthotech Corp.(a) | | | 55,792 | | | | | | | | 3,546,697 | |
Osiris Therapeutics, Inc. | | | 55,942 | | | | | | | | 573,965 | |
Otonomy, Inc.(a) | | | 39,258 | | | | | | | | 1,036,019 | |
PDL BioPharma, Inc. | | | 267,067 | | | | | | | | 1,010,848 | |
Portola Pharmaceuticals, Inc.(a) | | | 85,503 | | | | | | | | 4,241,804 | |
Progenics Pharmaceuticals, Inc.(a) | | | 113,355 | | | | | | | | 761,746 | |
PTC Therapeutics, Inc.(a) | | | 55,746 | | | | | | | | 1,674,610 | |
Rigel Pharmaceuticals, Inc.(a) | | | 143,971 | | | | | | | | 472,225 | |
Sage Therapeutics, Inc.(a) | | | 46,145 | | | | | | | | 2,211,268 | |
Seattle Genetics, Inc.(a) | | | 187,520 | | | | | | | | 7,872,090 | |
Spark Therapeutics, Inc.(a) | | | 39,923 | | | | | | | | 2,307,150 | |
TESARO, Inc.(a) | | | 65,067 | | | | | | | | 3,321,020 | |
Threshold Pharmaceuticals, Inc.(a) | | | 116,040 | | | | | | | | 404,980 | |
Tokai Pharmaceuticals, Inc.(a) | | | 36,458 | | | | | | | | 419,267 | |
Ultragenyx Pharmaceutical, Inc.(a) | | | 61,977 | | | | | | | | 6,093,579 | |
Verastem, Inc.(a) | | | 59,434 | | | | | | | | 134,915 | |
Versartis, Inc.(a) | | | 47,748 | | | | | | | | 604,012 | |
XBiotech, Inc.(a) | | | 52,025 | | | | | | | | 388,627 | |
6 | November 30, 2015
| | |
ALPS Medical Breakthroughs ETF | | |
| Schedule of Investments | | November 30, 2015 |
| | | | | | | | | | |
| Security Description | | Shares | | | | | Value | |
| |
Biotechnology (67.27%) (continued) | | | | | | | | | | |
Zafgen, Inc.(a) | | | 44,082 | | | | | $ | 745,427 | |
| | | | | | | | | | |
Total Biotechnology | | | | | | | | | 114,913,163 | |
| | | | | | | | | | |
| | | |
Pharmaceuticals (32.66%) | | | | | | | | | | |
Aerie Pharmaceuticals, Inc.(a) | | | 41,795 | | | | | | 1,146,855 | |
Akorn, Inc.(a) | | | 186,146 | | | | | | 6,198,662 | |
Ascendis Pharma A/S, ADR(a) | | | 38,774 | | | | | | 691,340 | |
BioDelivery Sciences International, Inc.(a) | | | 85,245 | | | | | | 522,552 | |
Catalent, Inc.(a) | | | 202,554 | | | | | | 5,641,129 | |
Depomed, Inc.(a) | | | 98,109 | | | | | | 1,907,239 | |
Endocyte, Inc.(a) | | | 68,206 | | | | | | 315,794 | |
FibroGen, Inc.(a) | | | 96,409 | | | | | | 2,867,204 | |
Flexion Therapeutics, Inc.(a) | | | 34,976 | | | | | | 679,933 | |
Foamix Pharmaceuticals, Ltd.(a) | | | 48,937 | | | | | | 391,007 | |
Forward Pharma A/S, ADR(a) | | | 75,665 | | | | | | 1,648,740 | |
Horizon Pharma Plc(a) | | | 257,582 | | | | | | 5,545,741 | |
Impax Laboratories, Inc.(a) | | | 117,618 | | | | | | 5,182,249 | |
The Medicines Co.(a) | | | 108,613 | | | | | | 4,562,832 | |
Neuroderm, Ltd.(a) | | | 35,011 | | | | | | 704,421 | |
Ocular Therapeutix, Inc.(a) | | | 40,180 | | | | | | 380,906 | |
Pacira Pharmaceuticals, Inc.(a) | | | 59,612 | | | | | | 3,859,877 | |
POZEN, Inc.(a) | | | 52,657 | | | | | | 399,667 | |
Radius Health, Inc.(a) | | | 69,598 | | | | | | 4,232,254 | |
Revance Therapeutics, Inc.(a) | | | 38,953 | | | | | | 1,511,766 | |
SciClone Pharmaceuticals, Inc.(a) | | | 80,685 | | | | | | 739,881 | |
Sucampo Pharmaceuticals, Inc., Class A(a) | | | 73,598 | | | | | | 1,262,206 | |
Supernus Pharmaceuticals, Inc.(a) | | | 78,805 | | | | | | 1,273,489 | |
Theravance, Inc. | | | 190,532 | | | | | | 1,762,421 | |
Trevena, Inc.(a) | | | 80,620 | | | | | | 1,015,006 | |
Vitae Pharmaceuticals, Inc.(a) | | | 35,548 | | | | | | 510,469 | |
VIVUS, Inc.(a) | | | 169,207 | | | | | | 211,509 | |
XenoPort, Inc.(a) | | | 102,606 | | | | | | 619,740 | |
| | | | | | | | | | |
Total Pharmaceuticals | | | | | | | | | 55,784,889 | |
| | | | | | | | | | |
| | | |
TOTAL COMMON STOCKS (Cost $191,548,989) | | | | | | | | | 170,698,052 | |
| | | | | | | | | | |
| | | |
RIGHTS (0.00%)(b) | | | | | | | | | | |
Biotechnology (0.00%)(b) | | | | | | | | | | |
Prosensa Holding NV - CVR(a) | | | 3,423 | | | | | | 3,081 | |
| | | | | | | | | | |
Total Biotechnology | | | | | | | | | 3,081 | |
| | | | | | | | | | |
| | | |
TOTAL RIGHTS (Cost $3,697) | | | | | | | | | 3,081 | |
| | | | | | | | | | |
7 | November 30, 2015
| | |
ALPS Medical Breakthroughs ETF | | |
| Schedule of Investments | | November 30, 2015 |
| | | | | | | | | | | | | | |
| | | 7 Day Yield | | | Shares | | | | | Value | |
| |
SHORT TERM INVESTMENTS (0.11%) | | | | | | | | | | | | | | |
Morgan Stanley Institutional Liquidity Funds, Prime Portfolio | | | 0.105% | | | | 190,021 | | | | | | 190,021 | |
| | | | | | | | | | | | | | |
| | | | |
TOTAL SHORT TERM INVESTMENTS (Cost $190,021) | | | | | | | | | | | | | 190,021 | |
| | | | | | | | | | | | | | |
| | | | |
TOTAL INVESTMENTS (100.04%) (Cost $191,742,707) | | | | | | | | | | | | $ | 170,891,154 | |
| | | | |
NET LIABILITIES LESS OTHER ASSETS (-0.04%) | | | | | | | | | | | | | (67,379) | |
| | | | | | | | | | | | | | |
| | | | |
NET ASSETS (100.00%) | | | | | | | | | | | | $ | 170,823,775 | |
| | | | | | | | | | | | | | |
| (a) | Non-income producing security. |
| (b) | Less than 0.005% of Net Assets. |
Common Abbreviations:
ADR - American Depositary Receipt.
CVR - Contingent Value Rights.
NV - Naamloze Vennootschap is the Dutch term for a public limited liability corporation.
Plc - Public Limited Company.
See Notes to Financial Statements.
8 | November 30, 2015
| | |
ALPS Medical Breakthroughs ETF | | |
| Statement of Assets and Liabilities | | November 30, 2015 |
| | | | |
| |
ASSETS: | | | | |
Investments, at value | | $ | 170,891,154 | |
Dividends receivable | | | 17 | |
| |
Total Assets | | | 170,891,171 | |
| |
| |
LIABILITIES: | | | | |
Payable to adviser | | | 67,396 | |
| |
Total Liabilities | | | 67,396 | |
| |
NET ASSETS | | $ | 170,823,775 | |
| |
| |
NET ASSETS CONSIST OF: | | | | |
Paid-in capital | | $ | 193,598,556 | |
Accumulated net investment loss | | | (392,292) | |
Accumulated net realized loss on investments | | | (1,530,936) | |
Net unrealized depreciation on investments | | | (20,851,553) | |
| |
NET ASSETS | | $ | 170,823,775 | |
| |
| |
INVESTMENTS, AT COST | | $ | 191,742,707 | |
| |
PRICING OF SHARES | | | | |
Net Assets | | $ | 170,823,775 | |
Shares of beneficial interest outstanding (Unlimited number of shares authorized, par value $0.01 per share) | | | 5,300,000 | |
Net Asset Value, offering and redemption price per share | | $ | 32.23 | |
See Notes to Financial Statements.
9 | November 30, 2015
| | |
ALPS Medical Breakthroughs ETF |
| Statement of Operations | | For the Period December 31, 2014 (Commencement of Operations) to November 30, 2015 |
| | | | |
| |
INVESTMENT INCOME: | | | | |
Dividends | | $ | 73,719 | |
| |
Total Investment Income | | | 73,719 | |
| |
| |
EXPENSES: | | | | |
Investment adviser fees | | | 466,011 | |
| |
Total Expense | | | 466,011 | |
| |
NET INVESTMENT LOSS | | | (392,292) | |
| |
| |
REALIZED AND UNREALIZED GAIN/(LOSS) | | | | |
Net realized gain on investments | | | 11,016,697 | |
Net change in unrealized depreciation on investments | | | (20,851,553) | |
| |
NET REALIZED AND UNREALIZED LOSS ON INVESTMENTS | | | (9,834,856) | |
| |
NET DECREASE IN NET ASSETS RESULTING FROM OPERATIONS | | $ | (10,227,148) | |
| |
See Notes to Financial Statements.
10 | November 30, 2015
| | |
ALPS Medical Breakthroughs ETF | | |
| Statement of Changes in Net Assets | | |
| | | | |
| | | For the Period | |
| | | December 31, 2014 | |
| | | (Commencement of | |
| | | Operations) | |
| | | to November 30, 2015 | |
| |
OPERATIONS: | | | | |
Net investment loss | | $ | (392,292) | |
Net realized gain on investments | | | 11,016,697 | |
Net change in unrealized depreciation on investments | | | (20,851,553) | |
| |
Net decrease in net assets resulting from operations | | | (10,227,148) | |
| |
| |
CAPITAL SHARE TRANSACTIONS: | | | | |
Proceeds from sale of shares | | | 233,745,688 | |
Cost of shares redeemed | | | (52,694,765) | |
| |
Net increase from capital share transactions | | | 181,050,923 | |
| |
Net increase in net assets | | | 170,823,775 | |
| |
NET ASSETS: | | | | |
Beginning of period | | | – | |
| |
End of period * | | $ | 170,823,775 | |
| |
| |
*Including accumulated net investment loss of: | | $ | (392,292) | |
| |
OTHER INFORMATION: | | | | |
CAPITAL SHARE TRANSACTIONS: | | | | |
Beginning shares | | | – | |
Shares sold | | | 6,900,002 | |
Shares redeemed | | | (1,600,002) | |
| |
Shares outstanding, end of period | | | 5,300,000 | |
| |
See Notes to Financial Statements.
11 | November 30, 2015
| | |
ALPS Medical Breakthroughs ETF |
| Financial Highlights | | For a Share Outstanding Throughout the Period Presented |
| | | | |
| | | For the Period | |
| | | December 31, 2014 | |
| | | (Commencement of | |
| | | Operations) | |
| | | to November 30, 2015 | |
| |
NET ASSET VALUE, BEGINNING OF PERIOD | | $ | 24.64 | |
| |
INCOME/(LOSS) FROM INVESTMENT OPERATIONS: | | | | |
Net investment loss (a) | | | (0.13) | |
Net realized and unrealized gain | | | 7.72 | |
| |
Total from investment operations | | | 7.59 | |
| |
| |
Net increase in net asset value | | | 7.59 | |
| |
NET ASSET VALUE, END OF PERIOD | | $ | 32.23 | |
| |
TOTAL RETURN(b) | | | 30.80% | |
| |
RATIOS/SUPPLEMENTAL DATA: | | | | |
Net assets, end of period (000s) | | $ | 170,824 | |
| |
Ratio of expenses to average net assets | | | 0.50%(c) | |
Ratio of net investment loss to average net assets | | | (0.42)%(c) | |
Portfolio turnover rate(d) | | | 25% | |
| (a) | Based on average shares outstanding during the period. |
| (b) | Total return is calculated assuming an initial investment made at the net asset value at the beginning of the period and redemption at the net asset value on the last day of the period and assuming all distributions are reinvested at reinvestment prices. Total return calculated for a period of less than one year is not annualized. |
| (d) | Portfolio turnover for periods less than one year are not annualized and does not include securities received or delivered from processing creations or redemptions. |
See Notes to Financial Statements.
12 | November 30, 2015
| | |
ALPS Medical Breakthroughs ETF | | |
| Notes to Financial Statements | | November 30, 2015 |
1. ORGANIZATION
The ALPS ETF Trust (the “Trust”), a Delaware statutory trust, is an open-end management investment company registered under the Investment Company Act of 1940, as amended (the “1940 Act”). As of November 30, 2015, the Trust consisted of twenty-one separate portfolios. Each portfolio represents a separate series of the Trust. This report pertains solely to the ALPS Medical Breakthroughs ETF (the “Fund”). The investment objective of the Fund is to seek investment results that correspond generally, before fees and expenses, to the Poliwogg Medical Breakthroughs IndexSM (the “Underlying Index”). The Fund is considered non-diversified and may invest a greater portion of assets in securities of individual issuers than a diversified fund. As a result, changes in the market value of a single investment could cause greater fluctuations in share price than would occur in a diversified fund. The Fund commenced operations on December 31, 2014.
The Fund’s Shares (“Shares”) are listed on the New York Stock Exchange (“NYSE”) Arca. The Fund issues and redeems Shares at net asset value (“NAV”) in blocks of 50,000 Shares, each of which is called a “Creation Unit”. Creation Units are issued and redeemed principally in-kind for securities included in a specified index. Except when aggregated in Creation Units, Shares are not redeemable securities of the Fund.
Pursuant to the Trust’s organizational documents, its Officers and Trustees are indemnified against certain liability arising out of the performance of their duties to the Trust. Additionally, in the normal course of business, the Trust enters into contracts with service providers that contain general indemnification clauses. The Trust’s maximum exposure under these arrangements is unknown, as this would involve future claims that may be made against the Trust that have not yet occurred.
2. SIGNIFICANT ACCOUNTING POLICIES
The following is a summary of significant accounting policies consistently followed by the Fund in the preparation of the financial statements. The accompanying financial statements were prepared in accordance with accounting principles generally accepted in the United States of America (“U.S. GAAP”). The preparation of financial statements in conformity with U.S. GAAP requires management to make certain estimates and assumptions that affect the reported amounts of assets and liabilities and disclosures of contingent assets and liabilities at the date of the financial statements and the reported amounts of revenue and expenses during the period. Actual results could differ from those estimates. The Fund is considered an investment company under U.S. GAAP and follows the accounting and reporting guidance applicable to investment companies in the Financial Accounting Standards Board Accounting Standards Codification Topic 946.
A. Portfolio Valuation
The Fund’s NAV is determined daily, as of the close of regular trading on the NYSE, normally 4:00 p.m. Eastern time, on each day the NYSE is open for trading. The NAV is computed by dividing the value of all assets of the Fund (including accrued interest and dividends), less all liabilities (including accrued expenses and dividends declared but unpaid), by the total number of shares outstanding.
Portfolio securities listed on any exchange other than the NASDAQ Stock Market LLC (“NASDAQ”) are valued at the last sale price on the business day as of which such value is being determined. If there has been no sale on such day, the securities are valued at the mean of the most recent bid and ask prices on such day. Securities traded on the NASDAQ are valued at the NASDAQ Official Closing Price as determined by NASDAQ. Portfolio securities traded on more than one securities exchange are valued at the last sale price on the business day as of which such value is being determined at the close of the exchange representing the principal market for such securities. Portfolio securities traded in the over-the-counter market, but excluding securities traded on the NASDAQ, are valued at the last quoted sale price in such market.
The Fund’s investments are valued at market value or, in the absence of market value with respect to any portfolio securities, at fair value according to procedures adopted by the Trust’s Board of Trustees (the “Board”). When market quotations are not readily available or when events occur that make established valuation methods unreliable, securities of the Fund may be valued in good faith by or under the direction of the Board. These securities generally include, but are not limited to, restricted securities (securities which may not be publicly sold without registration under the Securities Act of 1933) for which a pricing service is unable to provide a market price; securities whose trading has been formally suspended; a security whose market price is not available from a pre-established primary pricing source or the pricing source is not willing to provide a price; a security with respect to which an event has occurred that is most likely to materially affect the value of the security after the market has closed but before the calculation of the Fund’s NAV or make it difficult or impossible to obtain a reliable market quotation; or a security whose price, as provided by the pricing service, does not reflect the security’s “fair value” due to the security being de-listed from a national exchange or the security’s primary trading market is temporarily closed at a time when, under normal conditions, it would be open. As a general principle, the current “fair value” of a security would be the amount which the owner might reasonably expect to receive from the sale on the applicable exchange or principal market. A variety of factors may be considered in determining the fair value of such securities.
13 | November 30, 2015
| | |
ALPS Medical Breakthroughs ETF | | |
| Notes to Financial Statements | | November 30, 2015 |
B. Fair Value Measurements
The Fund discloses the classification of its fair value measurements following a three-tier hierarchy based on the inputs used to measure fair value. Inputs refer broadly to the assumptions that market participants would use in pricing the asset or liability; including assumptions about risk. Inputs may be observable or unobservable. Observable inputs reflect the assumptions market participants would use in pricing the asset or liability that are developed based on market data obtained from sources independent of the reporting entity. Unobservable inputs reflect the reporting entity’s own assumptions about the assumptions market participants would use in pricing the asset or liability that are developed based on the best information available.
Valuation techniques used to value the Fund’s investments by major category are as follows:
Equity securities, including restricted securities, for which market quotations are readily available, are valued at the last reported sale price or official closing price as reported by a third party pricing vendor on the primary market or exchange on which they are traded and are categorized as Level 1 in the hierarchy. In the event there were no sales during the day or closing prices are not available, securities are valued at the mean of the most recent quoted bid and ask prices on such day and are generally categorized as Level 2 in the hierarchy. Investments in open-end mutual funds are valued at their closing NAV each business day and are categorized as Level 1 in the hierarchy.
Changes in valuation techniques may result in transfers in or out of an assigned level within the disclosure hierarchy.
Various inputs are used in determining the value of the Fund’s investments as of the end of the reporting period. When inputs used fall into different levels of the fair value hierarchy, the level in the hierarchy within which the fair value measurement falls is determined based on the lowest level input that is significant to the fair value measurement in its entirety. The designated input levels are not necessarily an indication of the risk or liquidity associated with these investments.
These inputs are categorized in the following hierarchy under applicable financial accounting standards:
| | |
Level 1 – | | Unadjusted quoted prices in active markets for identical investments, unrestricted assets or liabilities that a Fund has the ability to access at the measurement date; |
Level 2 – | | Quoted prices which are not active, quoted prices for similar assets or liabilities in active markets or inputs other than quoted prices that are observable (either directly or indirectly) for substantially the full term of the asset or liability; and |
Level 3 – | | Significant unobservable prices or inputs (including the Fund’s own assumptions in determining the fair value of investments) where there is little or no market activity for the asset or liability at the measurement date. |
|
The following is a summary of the inputs used to value the Fund’s investments as of November 30, 2015: |
| | | | | | | | | | | | | | | | |
| | | | | | Level 2 - Other | | | | | | | |
| | | Level 1 - Unadjusted | | | Significant Observable | | | Level 3 - Significant | | | | |
| Investments in Securities at Value | | Quoted Prices | | | Inputs | | | Unobservable Inputs | | | Total | |
| |
Common Stocks* | | $ | 170,698,052 | | | $ | – | | | $ | – | | | $ | 170,698,052 | |
Rights | | | – | | | | 3,081 | | | | – | | | | 3,081 | |
Short Term Investments | | | 190,021 | | | | – | | | | – | | | | 190,021 | |
| |
TOTAL | | $ | 170,888,073 | | | $ | 3,081 | | | $ | – | | | $ | 170,891,154 | |
| |
* For a detailed sector breakdown, see the accompanying Schedule of Investments.
The Fund recognizes transfers between levels as of the end of the period. For the period ending November 30, 2015, the Fund did not have any transfers between Level 1 and Level 2 securities. The Fund did not have any securities which used significant unobservable inputs (Level 3) in determining fair value.
C. Other Risks
Equity Risk: A principal risk of investing in the Fund is equity risk, which is the risk that the value of the securities held by the Fund will fall due to general market and economic conditions, perceptions regarding the industries in which the issuers of securities held by the Fund participate or factors relating to specific companies in which the Fund invests. For example, an adverse event, such as an unfavorable earnings report, may depress the value of equity securities of an issuer held by the Fund; the price of common stock of an issuer may be particularly sensitive to general movements in the stock market; or a drop in the stock market may depress the price of most or all of the common stocks and other equity securities held by the Fund. In addition, common stock of an issuer in the Fund’s portfolio may decline in price if the issuer fails to make anticipated dividend payments because, among other reasons, the issuer of the security experiences a decline in its financial condition.
14 | November 30, 2015
| | |
ALPS Medical Breakthroughs ETF | | |
| Notes to Financial Statements | | November 30, 2015 |
Small- and Mid- Capitalization Company Risk: Investments in securities of small and mid-capitalization companies are subject to the risks of common stocks. Investments in smaller companies may involve greater risks because these companies generally have a limited track record. Smaller companies often have narrower markets, more limited managerial and financial resources and a less diversified product offering than larger, more established companies. As a result, their performance can be more volatile, which may increase the volatility of the Fund’s portfolio.
Concentration Risk: The Fund seeks to track the Underlying Index, which itself currently is concentrated in the pharmaceuticals and biotechnology industries and may have concentration in certain other industries or sectors, as well as regions, economies or markets. Underperformance or increased risk in such other concentrated areas may result in underperformance or increased risk in the Fund.
Non-Correlation Risk: The Fund’s return may not match the return of the Underlying Index for a number of reasons. For example, the Fund incurs a number of operating expenses not applicable to the Underlying Index, and incurs costs in buying and selling securities, especially when rebalancing the Fund’s securities holdings to reflect changes in the composition of the Underlying Index. In addition, the performance of the Fund and the Underlying Index may vary due to asset valuation differences and differences between the Fund’s portfolio and the Underlying Index resulting from legal restrictions. Due to legal and regulatory rules and limitations, the Fund may not be able to invest in all securities included in the Underlying Index. For tax efficiency purposes, the Fund may sell certain securities to realize losses, causing it to deviate from the Underlying Index. The Fund may not be fully invested at times, either as a result of cash flows into the Fund or reserves of cash held by the Fund to meet redemptions and expenses. If the Fund utilizes a sampling approach or otherwise does not hold all of the securities in the Underlying Index, its return may not correlate as well with the return on the Underlying Index, as would be the case if it purchased all of the securities in the Underlying Index with the same weightings as the Underlying Index.
D. Securities Transactions and Investment Income
Securities transactions are recorded as of the trade date. Realized gains and losses from securities transactions are recorded on the highest cost basis. Dividend income and capital gains distributions, if any, are recorded on the ex-dividend date. Interest income, if any, is recorded on the accrual basis.
E. Dividends and Distributions to Shareholders
Dividends from net investment income of the Fund, if any, are declared and paid annually or as the Board may determine from time to time. Distributions of net realized capital gains earned by the Fund, if any, are distributed at least annually.
F. Federal Tax and Tax Basis Information
The timing and character of income and capital gain distributions are determined in accordance with income tax regulations, which may differ from U.S. GAAP. Reclassifications are made to the Fund’s capital accounts for permanent tax differences to reflect income and gains available for distribution (or available capital loss carryforwards) under income tax regulations.
For the year ended November 30, 2015, the following reclassifications, which had no impact on results of operations or net assets, were recorded to reflect permanent tax differences resulting primarily from in-kind transactions:
| | | | | | | | | | | | |
| Fund | | Paid-in Capital | | | Accumulated Net
Investment Income | | | Accumulated Net Realized Loss on
Investments | |
| |
ALPS Medical Breakthroughs ETF | | $ | 12,547,633 | | | $ | – | | | $ | (12,547,633) | |
As of November 30, 2015, the components of distributable earnings on a tax basis for the Fund were as follows:
| | | | |
| | | ALPS Medical
Breakthroughs ETF | |
| |
Accumulated net realized loss on investments | | $ | (1,303,159) | |
Net unrealized depreciation on investments | | | (21,165,041) | |
Other accumulated losses | | | (306,581) | |
| |
Total | | $ | (22,774,781) | |
| |
15 | November 30, 2015
| | |
ALPS Medical Breakthroughs ETF | | |
| Notes to Financial Statements | | November 30, 2015 |
As of November 30, 2015, the cost of investments for federal income tax purposes and accumulated net unrealized appreciation/(depreciation) on investments were as follows:
| | | | |
| | | ALPS Medical | |
| | | Breakthroughs ETF | |
| |
Gross appreciation (excess of value over tax cost) | | $ | 12,905,641 | |
Gross depreciation (excess of tax cost over value) | | | (34,070,682) | |
| |
Net unrealized appreciation (depreciation) | | $ | (21,165,041) | |
| |
Cost of investments for income tax purposes | | $ | 192,056,195 | |
| |
The differences between book-basis and tax-basis are primarily due to Passive Foreign Investment Company (“PFIC”) adjustments and the deferral of losses due to wash sales.
At November 30, 2015, the Fund’s post-enactment capital losses deferred to the next tax year were as follows:
| | | | |
| Fund | | Short-Term | |
| |
ALPS Medical Breakthroughs ETF | | $ | 1,303,159 | |
The Fund elects to defer to the period ending November 30, 2016, late year ordinary losses in the amount of $306,581.
G. Income Taxes
No provision for income taxes is included in the accompanying financial statements, as the Fund intends to distribute to shareholders all taxable investment income and realized gains and otherwise comply with Subchapter M of the Internal Revenue Code of 1986, as amended, applicable to regulated investment companies. The Fund evaluates tax positions taken (or expected to be taken) in the course of preparing the Fund’s tax returns to determine whether these positions meet a “more-likely-than-not” standard that, based on the technical merits, have a more than fifty percent likelihood of being sustained by a taxing authority upon examination. A tax position that meets the “more-likely-than-not” recognition threshold is measured to determine the amount of benefit to recognize in the financial statements.
As of and during the period ended November 30, 2015, the Fund did not have a liability for any unrecognized tax benefits. The Fund files U.S. federal, state, and local tax returns as required. The Fund’s tax returns are subject to examination by the relevant tax authorities until expiration of the applicable statute of limitations which is generally three years after the filing of the tax return, but may extend to four years in certain jurisdictions. Being that the Fund commenced operations on December 31, 2014, no tax returns have been filed as of the date of this report.
3. INVESTMENT ADVISORY FEE AND OTHER AFFILIATED TRANSACTIONS
ALPS Advisors, Inc. (the “Adviser”) acts as the Fund’s investment adviser pursuant to an Advisory Agreement with the Trust on behalf of the Fund (the “Advisory Agreement”). Pursuant to the Advisory Agreement, the Fund pays the Adviser a unitary fee for the services and facilities it provides, payable on a monthly basis at the annual rate of 0.50% of the Fund’s average daily net assets. From time to time, the Adviser may waive all or a portion of its fee.
Out of the unitary management fee, the Adviser pays substantially all expenses of the Fund, including the licensing fees to the Index provider, the cost of transfer agency, custody, fund administration, legal, audit, independent trustees and other services, except for interest expenses, distribution fees or expenses, brokerage expenses, taxes and extraordinary expenses not incurred in the ordinary course of the Fund’s business. The Adviser’s unitary management fee is designed to pay substantially all the Fund’s expenses and to compensate the Adviser for providing services for the Fund.
ALPS Fund Services, Inc., an affiliate of the Adviser, is the administrator of the Fund.
Each Trustee who is not an officer or employee of the Adviser, any sub-adviser or any of their affiliates (“Independent Trustees”) receives (1) a quarterly retainer of $5,000, (2) a per meeting fee for regularly scheduled meetings of $3,750, (3) $1,500 for any special meeting held outside of a regularly scheduled board meeting, and (4) reimbursement for all reasonable out-of-pocket expenses relating to attendance at meetings.
16 | November 30, 2015
| | |
ALPS Medical Breakthroughs ETF | | |
| Notes to Financial Statements | | November 30, 2015 |
4. PURCHASES AND SALES OF SECURITIES
For the period ended November 30, 2015, the cost of purchases and proceeds from sales of investment securities, excluding in-kind transactions and short-term investments, were as follows:
| | | | | | | | |
| Fund | | Purchases | | | Sales | |
| |
ALPS Medical Breakthroughs ETF | | $ | 25,541,032 | | | $ | 24,391,431 | |
For the period ended November 30, 2015, the cost of in-kind purchases and proceeds from in-kind sales were as follows:
| | | | | | | | |
| Fund | | Purchases | | | Sales | |
| |
ALPS Medical Breakthroughs ETF | | $ | 233,711,169 | | | $ | 54,244,766 | |
The ALPS Medical Breakthroughs ETF had in-kind net realized gain/(loss) of $12,702,256.
Gains on in-kind transactions are not considered taxable for federal income tax purposes.
5. CAPITAL SHARE TRANSACTIONS
Shares are created and redeemed by the Fund only in Creation Unit size aggregations of 50,000 shares. Only broker-dealers or large institutional investors with creation and redemption agreements called Authorized Participants (“AP”) are permitted to purchase or redeem Creation Units from the Fund. Such transactions are generally permitted on an in-kind basis, with a balancing cash component to equate the transaction to the NAV per unit of the Fund on the transaction date. Cash may be substituted equivalent to the value of certain securities generally when they are not available in sufficient quantity for delivery, not eligible for trading by the AP or as a result of other market circumstances.
17 | November 30, 2015
| | |
ALPS Medical Breakthroughs ETF | | |
| Additional Information | | November 30, 2015 (Unaudited) |
PROXY VOTING RECORDS, POLICIES AND PROCEDURES
Information regarding how the Fund voted proxies relating to portfolio securities during the most recent 12-month period ended June 30 and a description of the Fund’s proxy voting policies and procedures used in determining how to vote for proxies are available without charge on the Securities and Exchange Commission’s (“SEC”) website at www.sec.gov and upon request, by calling (toll-free) 1-866-675-2639.
PORTFOLIO HOLDINGS
The Trust is required to disclose, after its first and third fiscal quarters, the complete schedule of each Fund’s portfolio holdings with the SEC on Form N-Q. Form N-Q for each Fund will be available on the SEC’s website at www.sec.gov. Each Fund’s Form N-Q may also be reviewed and copied at the SEC’s Public Reference Room in Washington, D.C. and information on the operation of the Public Reference Room may be obtained by calling 1-800-SEC-0330. Each Fund’s Form N-Q will be available without charge, upon request, by calling (toll-free) 1-866-675-2639 or by writing to ALPS ETF Trust at 1290 Broadway, Suite 1100, Denver, Colorado 80203.
LICENSING AGREEMENT
The Poliwogg Medical Breakthroughs IndexSM is a service mark of S-Network Global Indexes, Inc. and has been licensed for use by ALPS Advisors, Inc. The ALPS Medical Breakthroughs ETF is not sponsored, endorsed, sold or promoted by S-Network Global Indexes, Inc. and S-Network Global Indexes, Inc. makes no representation regarding the advisability of investing in the ALPS Medical Breakthroughs ETF.
The ALPS Medical Breakthroughs ETF is not sponsored, endorsed, sold or promoted by Standard & Poor’s, a division of The McGraw-Hill Companies, Inc. (“S&P”) or its third party licensors. Neither S&P nor its third party licensors make any representation or warranty, express or implied, to the owners of the ALPS Medical Breakthroughs ETF or any member of the public regarding the advisability of investing in securities generally or in the ALPS Medical Breakthroughs ETF particularly or the ability of the Poliwogg Medical Breakthroughs IndexSM to track general stock market performance. S&P’s and its third party licensor’s only relationship to S-Network Global Indexes, LLC is the licensing of certain trademarks, service marks and trade names of S&P and/or its third party licensors and for the providing of calculation and maintenance services related to the Poliwogg Medical Breakthroughs IndexSM. Neither S&P nor its third party licensors is responsible for and has not participated in the determination of the prices and amount of the ALPS Medical Breakthroughs ETF or the timing of the issuance or sale of the ALPS Medical Breakthroughs ETF or in the determination or calculation of the equation by which the ALPS Medical Breakthroughs ETF is to be converted into cash. S&P has no obligation or liability in connection with the administration, marketing or trading of the ALPS Medical Breakthroughs ETF.
NEITHER S&P, ITS AFFILIATES NOR THEIR THIRD PARTY LICENSORS GUARANTEE THE ADEQUACY, ACCURACY, TIMELINESS OR COMPLETENESS OF THE POLIWOGG MEDICAL BREAKTHROUGHS INDEXSM OR ANY DATA INCLUDED THEREIN OR ANY COMMUNICATIONS, INCLUDING BUT NOT LIMITED TO, ORAL OR WRITTEN COMMUNICATIONS (INCLUDING ELECTRONIC COMMUNICATIONS) WITH RESPECT THERETO. S&P, ITS AFFILIATES AND THEIR THIRD PARTY LICENSORS SHALL NOT BE SUBJECT TO ANY DAMAGES OR LIABILITY FOR ANY ERRORS, OMISSIONS OR DELAYS THEREIN. S&P MAKES NO EXPRESS OR IMPLIED WARRANTIES, AND EXPRESSLY DISCLAIMS ALL WARRANTIES OF MERCHANTABILITY OR FITNESS FOR A PARTICULAR PURPOSE OR USE WITH RESPECT TO ITS TRADEMARKS, THE INDEX OR ANY DATA INCLUDED THEREIN. WITHOUT LIMITING ANY OF THE FOREGOING, IN NO EVENT WHATSOEVER SHALL S&P, ITS AFFILIATES OR THEIR THIRD PARTY LICENSORS BE LIABLE FOR ANY INDIRECT, SPECIAL, INCIDENTAL, PUNITIVE OR CONSEQUENTIAL DAMAGES, INCLUDING BUT NOT LIMITED TO, LOSS OF PROFITS, TRADING LOSSES, LOST TIME OR GOODWILL, EVEN IF THEY HAVE BEEN ADVISED OF THE POSSIBILITY OF SUCH DAMAGES, WHETHER IN CONTRACT, TORT, STRICT LIABILITY OR OTHERWISE.
Standard & Poor’s®, and S&P® are registered trademarks of The McGraw-Hill Companies, Inc.; “Calculated by S&P Custom Indices” and its related stylized mark are service marks of The McGraw-Hill Companies, Inc. These marks have been licensed for use by S-Network Global Indexes, LLC.
18 | November 30, 2015
| | |
ALPS Medical Breakthroughs ETF | | |
| Trustees & Officers | | November 30, 2015 (Unaudited) |
INDEPENDENT TRUSTEES
| | | | | | | | | | |
Name, Address
& Year of Birth* | | Position(s) Held
with Trust | | Term of Office
and Length of Time Served** | | Principal Occupation(s) During Past 5 Years | | Number of
Portfolios in Fund
Complex Overseen
by Trustees*** | | Other Directorships
Held by Trustees |
Mary K. Anstine, 1940 | | Trustee | | Since March 2008 | | Ms. Anstine was formerly an Executive Vice President of First Interstate Bank of Denver until 1994, President/Chief Executive Officer of HealthONE Alliance, Denver, Colorado, from 1994 to 2004, and has been retired since 2004. Ms. Anstine is also Trustee/Director of the following: AV Hunter Trust and Colorado Uplift Board. Ms. Anstine was formerly a Director of the Trust Bank of Colorado (later purchased and now known as Northern Trust Bank), HealthONE and Denver Area Council of the Boy Scouts of America and a member of the American Bankers Association Trust Executive Committee. | | 46 | | Ms. Anstine is a Trustee of ALPS Variable Investment Trust (9 funds); Financial Investors Trust (31 funds); Reaves Utility Income Fund; and Westcore Trust (12 funds). |
Jeremy W. Deems, 1976 | | Trustee | | Since March 2008 | | Mr. Deems is the Co-Founder, Chief Financial Officer of Green Alpha Advisors, LLC. Mr. Deems is Co-Portfolio Manager of the Shelton Green Alpha Fund. Prior to joining Green Alpha Advisors, Mr. Deems was CFO and Treasurer of Forward Management, LLC, ReFlow Management Co., LLC, ReFlow Fund, LLC, a private investment fund, and Sutton Place Management, LLC, an administrative services company. | | 46 | | Mr. Deems is a Trustee of ALPS Variable Investment Trust (9 funds); Financial Investors Trust (31 funds); Clough Funds Trust (1 fund); and Reaves Utility Income Fund. |
Rick A. Pederson, 1952 | | Trustee | | Since March 2008 | | Mr. Pederson is President, Foundation Properties, Inc. (a real estate investment management company), 1994 - present; Advisory Board Member, Bow River Capital Partners (private equity management), 2003 - present; Advisor, Pauls Corporation (real estate investment management and development), 2008 - present; Chairman, Ross Consulting Group (real estate consulting services) 1983-2013; Advisory Board, Neenan Company (construction services) 2002- present; Board Member, Prosci, Inc. (private business services), 2013-present; Board Member, Citywide Banks (Colorado community bank) 2014-present; Board member, Professional Pediatric Health Care (a Denver-based home nursing firm) 2014 – present; Director, National Western Stock Show (not-for-profit organization); Director, Biennial of the Americas (not-for- profit organization). | | 24 | | Mr. Pederson is Trustee of Westcore Trust (12 funds) and Principal Real Estate Income Fund (1 fund). |
| * | The business address of the Trustee is c/o ALPS Advisors, Inc., 1290 Broadway, Suite 1100, Denver, Colorado 80203. |
| ** | This is the period for which the Trustee began serving the Trust. Each Trustee serves an indefinite term, until his successor is elected. |
| *** | The Fund Complex includes all series of the Trust and any other investment companies for which ALPS Advisors, Inc. provides investment advisory services. |
The Statement of Additional Information includes additional information about the Fund’s Trustees and is available, without charge, upon request by calling (toll-free) 1-866-675-2639.
19 | November 30, 2015
| | |
ALPS Medical Breakthroughs ETF | | |
| Trustees & Officers | | November 30, 2015 (Unaudited) |
INTERESTED TRUSTEE
| | | | | | | | | | |
Name, Address and Year of Birth of Interested Trustee* | | Position(s) Held with Trust | | Term of Office
and Length of
Time Served** | | Principal Occupation(s) During Past 5 Years | | Number of
Portfolios in Fund
Complex Overseen
by Trustees*** | | Other Directorships
Held by Trustees |
Thomas A. Carter, 1966 | | Trustee and President | | Since March 2008 | | Mr. Carter joined ALPS Fund Services, Inc. (“ALPS”) in 1994 and is currently President and Director of ALPS Advisors, Inc. (“AAI”), and ALPS Portfolio Solutions Distributor, Inc. (“APSD”) and Executive Vice President and Director of ALPS and ALPS Holdings, Inc. (“AHI”), and ALPS Distributors, Inc. (“ADI”). Because of his position with AHI, ALPS, ADI, APSD and AAI, Mr. Carter is deemed an affiliate of the Fund as defined under the 1940 Act. Before joining ALPS, Mr. Carter was with Deloitte & Touche LLP, where he worked with a diverse group of clients, primarily within the financial services industry. Mr. Carter is a Certified Public Accountant and received his Bachelor of Science in Accounting from the University of Colorado at Boulder. | | 34 | | Mr. Carter is a Trustee of ALPS Variable Investment Trust (9 funds) and Principal Real Estate Income Fund (1 fund) |
| * | The business address of the Trustee is c/o ALPS Advisors, Inc., 1290 Broadway, Suite 1100, Denver, Colorado 80203. |
| ** | This is the period for which the Trustee began serving the Trust. Each Trustee serves an indefinite term, until his successor is elected. |
| *** | The Fund Complex includes all series of the Trust and any other investment companies for which ALPS Advisors, Inc. provides investment advisory services. |
The Statement of Additional Information includes additional information about the Fund’s Trustees and is available, without charge, upon request by calling (toll-free) 1-866-675-2639.
20 | November 30, 2015
| | |
ALPS Medical Breakthroughs ETF | | |
| Trustees & Officers | | November 30, 2015 (Unaudited) |
OFFICERS
| | | | | | |
Name, Address
and Year of
Birth of Officer* | | Position(s) Held
with Trust | | Length of Time
Served** | | Principal Occupation(s) During Past 5 Years |
Erin D. Nelson, 1977 | | Chief Compliance Officer (“CCO”) | | Since December 2015 | | Erin Nelson became Senior Vice-President and Chief Compliance Officer of ALPS Advisors, Inc. (“AAI”) on July 1, 2015 and prior to that served as Vice President and Deputy Chief Compliance Officer of AAI since January 1, 2015. Prior to January 1, 2015, Ms. Nelson was Vice-President and Assistant General Counsel of ALPS of Fund Services, Inc. Ms. Nelson joined AAI’s parent company, ALPS Holdings, Inc. in January 2003. Ms. Nelson currently is also the Chief Compliance Officer of Principal Real Estate Income Fund, and as of December 2015, the Chief Compliance Officer of Liberty All-Star Equity Fund, Liberty All-Star Growth Fund, Inc., RiverNorth Opportunities Fund, Inc. |
Patrick D. Buchanan, 1972 | | Treasurer | | Since June 2012 | | Mr. Buchanan is Vice President of AAI. Mr. Buchanan joined ALPS in 2007 and because of his position with AAI, he is deemed an affiliate of the Trust as defined under the 1940 Act. Mr. Buchanan is also Treasurer of the ALPS Variable Insurance Trust, Clough Funds Trust and Principal Real Estate Income Fund. |
William Parmentier, 1952 | | Vice President | | Since March 2008 | | Mr. Parmentier is Chief Investment Officer, AAI (since 2006); President and Chief Executive Officer of the Liberty All-Star Funds (since April 1999); Senior Vice President (2005-2006), Banc of America Investment Advisors, Inc. Because of his position with AAI, Mr. Parmentier is deemed an affiliate of the Trust as defined under the 1940 Act. |
Abigail J. Murray, 1975 | | Secretary | | Since June 2015 | | Ms. Murray joined ALPS in April 2015. She is currently Vice President and Senior Counsel of ALPS. Prior to joining ALPS, Ms. Murray was an Attorney and Managing Member at Murray & Rouvina PLC from 2014 to 2015 and an Associate with Vedder Price P.C. from 2007 to 2014. Because of her position with ALPS, Ms. Murray is deemed an affiliate of the Trust as defined under the 1940 Act. Ms. Murray is also the Secretary of The Caldwell & Orkin Funds, Inc., Clough Global Opportunities Fund, Clough Global Allocation Fund, Clough Global Equity Fund and Clough Funds Trust. |
Jennifer A. Craig, 1973 | | Assistant Secretary | | Since October 2013 | | Ms. Craig joined ALPS in 2007 and is currently Assistant Vice President and Paralegal Manager. Prior to joining ALPS, Ms. Craig was Legal Manager at Janus Capital Management LLC and served as Assistant Secretary of Janus Investment Fund, Janus Adviser Series and Janus Aspen Series. Because of her position with ALPS, Ms. Craig is deemed an affiliate of the Trust as defined under the 1940 Act. |
| * | The business address of the Officer is c/o ALPS Advisors, Inc., 1290 Broadway, Suite 1100, Denver, Colorado 80203. |
| ** | This is the period for which the Officer began serving the Trust. Each Officer serves an indefinite term, until his successor is elected. |
21 | November 30, 2015

table of
CONTENTS
www.alpsfunds.com
| | |
ALPS Sector Series | | |
| |
| Disclosure of Fund Expenses | | November 30, 2015 (Unaudited) |
Shareholder Expense Example: As a shareholder of the Fund, you incur two types of costs: (1) transaction costs which may include creation and redemption fees or brokerage charges, and (2) ongoing costs, including management fees and other Fund expenses. These examples are intended to help you understand your ongoing costs (in dollars) of investing in the Fund and to compare these costs with the ongoing costs of investing in other funds. It is based on an investment of $1,000 invested at the beginning of the (six month) period and held through November 30, 2015.
Actual Return: The first line of the table provides information about actual account values and actual expenses. You may use the information in this table, together with the amount you invested, to estimate the expenses that you incurred over the period. Simply divide your account value by $1,000 (for example, an $8,600 account value divided by $1,000 = 8.6), then multiply the result by the number in the first line under the heading entitled “Expenses Paid During the Period” to estimate the expenses attributable to your investment during this period.
Hypothetical 5% Return: The second line of the table provides information about hypothetical account values and hypothetical expenses based on the Fund’s actual expense ratio and an assumed rate of return of 5% per year before expenses, which is not the Fund’s actual return. The hypothetical account values and expenses may not be used to estimate the actual ending account balance or expenses you paid for the period. You may use this information to compare ongoing costs of investing in the Fund and other funds. To do so, compare this 5% hypothetical example with the 5% hypothetical examples that appear in the shareholder reports of the other funds.
The expenses shown in the table are meant to highlight ongoing Fund costs only and do not reflect any transaction costs, such as creation and redemption fees, or brokerage charges. Therefore, the second line is useful in comparing ongoing costs only, and will not help you determine the relative total costs of owning different funds. In addition, if these costs were included, your costs would have been higher.
| | | | | | | | | | | | | | |
| | | Beginning Account | | | Ending Account | | | | | Expenses Paid | |
| | | Value | | | Value | | | Expense | | During Period | |
| | | 6/1/15 | | | 11/30/15 | | | Ratio(a) | | 6/1/15 - 11/30/15(b) | |
ALPS Sector Dividend Dogs ETF | | | | | | | | | | | | | | |
Actual | | $ | 1,000.00 | | | $ | 963.80 | | | 0.40% | | $ | 1.97 | |
Hypothetical (5% return before expenses) | | $ | 1,000.00 | | | $ | 1,023.06 | | | 0.40% | | $ | 2.03 | |
| | | | |
ALPS International Sector Dividend Dogs ETF | | | | | | | | | | | | | | |
Actual | | $ | 1,000.00 | | | $ | 907.60 | | | 0.50% | | $ | 2.39 | |
Hypothetical (5% return before expenses) | | $ | 1,000.00 | | | $ | 1,022.56 | | | 0.50% | | $ | 2.54 | |
| | | | |
ALPS Emerging Sector Dividend Dogs ETF | | | | | | | | | | | | | | |
Actual | | $ | 1,000.00 | | | $ | 878.10 | | | 0.60% | | $ | 2.82 | |
Hypothetical (5% return before expenses) | | $ | 1,000.00 | | | $ | 1,022.06 | | | 0.60% | | $ | 3.04 | |
| | | | |
ALPS Sector Leaders ETF | | | | | | | | | | | | | | |
Actual(c) | | $ | 1,000.00 | | | $ | 976.80 | | | 0.40% | | $ | 1.66 | |
Hypothetical (5% return before expenses) | | $ | 1,000.00 | | | $ | 1,023.06 | | | 0.40% | | $ | 2.03 | |
| | | | |
ALPS Sector Low Volatility ETF | | | | | | | | | | | | | | |
Actual(c) | | $ | 1,000.00 | | | $ | 1,035.10 | | | 0.40% | | $ | 1.71 | |
Hypothetical (5% return before expenses) | | $ | 1,000.00 | | | $ | 1,023.06 | | | 0.40% | | $ | 2.03 | |
| (a) | Annualized based on the Fund’s most recent half-year expenses. |
| (b) | Expenses are equal to the Fund’s annualized expense ratio multiplied by the average account value over the period, multiplied by the number of days in the most recent fiscal half year (183), divided by 365. |
| (c) | The ALPS Sector Leaders ETF’s and the ALPS Sector Low Volatility ETF’s inception date is July 1, 2015. Actual expenses on these Funds are equal to the Funds’ annualized expense ratio multiplied by the average account value of the period, multiplied by the number of days since the Funds launched (153), divided by 365. |
1 | November 30, 2015
| | |
ALPS Sector Series | | |
Report of Independent Registered Public Accounting Firm |
To the Board of Trustees and Shareholders of ALPS ETF Trust:
We have audited the accompanying statements of assets and liabilities, including the schedules of investments, of ALPS Sector Dividend Dogs ETF, ALPS International Sector Dividend Dogs ETF, ALPS Emerging Sector Dividend Dogs ETF, ALPS Sector Leaders ETF and ALPS Sector Low Volatility ETF, five of the portfolios constituting the ALPS ETF Trust (the “Trust”), as of November 30, 2015, and the related statements of operations, changes in net assets, and the financial highlights for each of the periods presented. These financial statements and financial highlights are the responsibility of the Trust’s management. Our responsibility is to express an opinion on these financial statements and financial highlights based on our audits.
We conducted our audits in accordance with the standards of the Public Company Accounting Oversight Board (United States). Those standards require that we plan and perform the audit to obtain reasonable assurance about whether the financial statements and financial highlights are free of material misstatement. The Trust is not required to have, nor were we engaged to perform, an audit of its internal control over financial reporting. Our audits included consideration of internal control over financial reporting as a basis for designing audit procedures that are appropriate in the circumstances, but not for the purpose of expressing an opinion on the effectiveness of the Trust’s internal control over financial reporting. Accordingly, we express no such opinion. An audit also includes examining, on a test basis, evidence supporting the amounts and disclosures in the financial statements, assessing the accounting principles used and significant estimates made by management, as well as evaluating the overall financial statement presentation. Our procedures included confirmation of securities owned as of November 30, 2015, by correspondence with the custodian. We believe that our audits provide a reasonable basis for our opinion.
In our opinion, the financial statements and financial highlights referred to above present fairly, in all material respects, the financial position of ALPS Sector Dividend Dogs ETF, ALPS International Sector Dividend Dogs ETF, ALPS Emerging Sector Dividend Dogs ETF, ALPS Sector Leaders ETF and ALPS Sector Low Volatility ETF of the ALPS ETF Trust as of November 30, 2015, and the results of their operations, the changes in their net assets, and the financial highlights for each of the periods presented, in conformity with accounting principles generally accepted in the United States of America.
DELOITTE & TOUCHE LLP
Denver, Colorado
January 28, 2016
2 | November 30, 2015
| | |
ALPS Sector Dividend Dogs ETF | | |
| |
| Performance Overview | | November 30, 2015 (Unaudited) |
Investment Objective
The ALPS Sector Dividend Dogs ETF (the “Fund”) seeks investment results that replicate as closely as possible, before fees and expenses, the performance of the S-Network® Sector Dividend Dogs Index (the “Index”). The Shares of the Fund are listed and trade on the New York Stock Exchange (“NYSE”) Arca under the ticker symbol SDOG. The Fund generally will invest in all of the securities that comprise the Index in proportion to their weightings in the Index.
The Index is a rules based index intended to give investors a means of tracking the overall performance of the highest dividend paying stocks (i.e. “Dividend Dogs”) in the S&P 500® (“SPX”) on a sector-by-sector basis. “Dividend Dogs” refers to the five stocks in each of the ten Global Industry Classification Standard (“GICS”) sectors that make up the S&P 500® which offer the highest dividend yields.
Performance Overview
ALPS Sector Dividend Dogs ETF (SDOG), for the twelve month period ended November 30, 2015, generated a total return of -3.21%, in-line with the Fund’s Underlying Index, which returned -2.83%. The fund underperformed the S&P 500®, which returned 2.75% for the same period.
The trailing twelve month yield for the fund’s underlying constituents as of 11/30/2015 was 4.08% vs. 2.10% on the S&P 500®.
From a macro perspective, drivers influencing U.S. equities for the one year period ended 11/30/15 included the impact of speculation on a potential U.S. Fed rate hike, global concerns over slowing growth and weak manufacturing figures in China, falling oil prices, and improved consumer confidence in the U.S.
Compared to the S&P 500®, the Fund saw a moderate negative impact (-2.00%) from sector allocation for the period. This was largely driven by relative over-weights resulting from the equal sector weight strategy in Materials (9.84% vs. 3.06% in SPX) and Telecommunication Services (8.76% vs. 2.32% in SPX). The Fund’s relative underweight allocation to Financials (10.21% vs. 16.43% in SPX) helped buoy the fund’s performance. The fund also was negatively impacted by security selection, as the names in Energy and Consumer Discretionary underperformed. The fund’s underlying constituents, specifically Kraft Foods Group (KRFT) and Reynolds American (RAI) in Consumer Staples and Teco Energy (TE) in Utilities, helped support fund performance for the period.
The best performing stocks in the fund for the period were Kraft Foods Group (KRFT), which increased 48.75% and Reynolds American (RAI), which saw a gain of 45.70%. Teco Energy (TE), which rose 38.40%, and Cincinnati Financial Corp (CINF), which climbed 24.22%, were other top performers. The largest detractors were Freeport- Mcmoran (FCX), which decreased 68.58%, Ensco PLC (ESV), which fell 46.61%, and Seagate Technology (STX), which lost 43.12%.
Looking forward we believe the Fund’s strategy of annually selecting the five highest yielding securities in each of the ten sectors in the S&P 500® will provide meaningfully higher yield relative to the S&P 500®, potential for market participation in all economic cycles through equal sector weighting, and a deep value portfolio of securities as identified through high yield relative to their sector peers.
Performance (as of November 30, 2015)
| | | | | | |
| | | 1 Year | | 3 Year | | Since Inception^ |
ALPS Sector Dividend Dogs ETF – NAV | | -3.21% | | 14.88% | | 15.49% |
ALPS Sector Dividend Dogs ETF – Market Price* | | -3.21% | | 14.85% | | 15.51% |
S-Network® Sector Dividend Dogs TR Index | | -2.83% | | 15.43% | | 16.03% |
S&P 500® Total Return Index | | 2.75% | | 16.09% | | 15.61% |
Total Expense Ratio (per the current prospectus) 0.40% .
Performance data quoted represents past performance. Past performance does not guarantee future results. Investment return and principal value of an investment will fluctuate so that an investor’s shares, when sold or redeemed, may be worth more or less than the original cost. Current performance data may be higher or lower than actual data quoted. For the most current month-end performance data please visit www.alpsfunds.com or call 1.866.675.2639.
3 | November 30, 2015
| | |
ALPS Sector Dividend Dogs ETF | | |
| |
| Performance Overview | | November 30, 2015 (Unaudited) |
NAV is an exchange-traded fund’s per-share value. The per-share dollar amount of the fund is derived by dividing the total value of all the securities in its portfolio, less any liabilities, by the number of fund shares outstanding. Market Price is the price at which a share can currently be traded in the market. Information detailing the number of days the Market Price of the Fund was greater than the Fund’s NAV and the number of days it was less than the Fund’s NAV can be obtained at www.alpsfunds.com.
| ^ | The Fund Commencement Date was June 29, 2012. |
| * | Market Price is based on the midpoint of the bid-ask spread at 4 p.m. ET and does not represent the returns an investor would receive if shares were traded at other times. |
The S-Network® Sector Dividend Dogs Index is designed to serve as a fair, impartial and transparent measure of the performance of US large cap equities with above average dividend yields. The Index is a portfolio of fifty stocks derived from the S&P 500® Index. Total Return (TR) is obtained by reinvesting in the index the ordinary gross dividends declared by the index constituents.
The S&P 500® Total Return Index is an index of 500 stocks chosen for market size, liquidity and industry grouping among other factors.
One cannot invest directly in an index. Index performance does not reflect fund performance.
The ALPS Sector Dividend Dogs ETF is not suitable for all investors. Investments in the Fund are subject to investment risks, including possible loss of the principal amount invested.
ALPS Portfolio Solutions Distributor, Inc. is the Distributor for the ETF.
4 | November 30, 2015
| | |
ALPS Sector Dividend Dogs ETF | | |
| |
| Performance Overview | | November 30, 2015 (Unaudited) |
Top 10 Holdings* (as of November 30, 2015)
| | | | |
KLA-Tencor Corp. | | | 2.55 | % |
General Electric Co. | | | 2.36 | % |
The Dow Chemical Co. | | | 2.34 | % |
Paychex, Inc. | | | 2.34 | % |
PPL Corp. | | | 2.26 | % |
Cincinnati Financial Corp. | | | 2.25 | % |
LyondellBasell Industries NV, Class A | | | 2.25 | % |
ConocoPhillips | | | 2.25 | % |
Ensco Plc, Class A | | | 2.17 | % |
Mattel, Inc. | | | 2.17 | % |
Total % of Top 10 Holdings | | | 22.94 | % |
Future holdings are subject to change.
Sector Allocation* (as of November 30, 2015)
| | | | |
Information Technology | | | 14.48 | % |
Financials | | | 10.70 | % |
Industrials | | | 10.70 | % |
Consumer Staples | | | 10.60 | % |
Utilities | | | 10.17 | % |
Health Care | | | 10.14 | % |
Materials | | | 9.90 | % |
Energy | | | 9.63 | % |
Consumer Discretionary | | | 9.38 | % |
Telecommunication Services | | | 3.85 | % |
Money Market Fund | | | 0.45 | % |
Total | | | 100.00 | % |
Growth of $10,000 (as of November 30, 2015)
Comparison of Change in Value of $10,000 Investment in the Fund and the Indexes
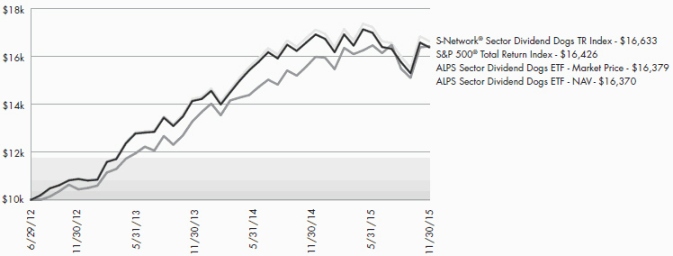
The chart above represents historical performance of a hypothetical investment of $10,000 in the Fund over the life of the Fund. Performance calculations are as of the end of each month. Past performance does not guarantee future results. This chart does not reflect the deduction of taxes that a shareholder would pay on Fund distributions or the redemption of Fund shares.
5 | November 30, 2015
| | |
ALPS International Sector Dividend Dogs ETF | | |
| |
| Performance Overview | | November 30, 2015 (Unaudited) |
Investment Objective
The ALPS International Sector Dividend Dogs ETF (the “Fund”) seeks investment results that replicate as closely as possible, before fees and expenses, the performance of the S-Network® International Sector Dividend Dogs Index (the “Index”). The Shares of the Fund are listed and trade on the New York Stock Exchange (“NYSE”) Arca under the ticker symbol IDOG. The Fund generally will invest in all of the securities that comprise the index in proportion to their weightings in the index.
The Index is a rules-based index intended to give investors a means of tracking the overall performance of the highest dividend paying stocks (i.e. “Dividend Dogs”) in the S-Net International Developed Markets (ex-Americas) Index, a universe of mainly large capitalization stocks in international developed markets not located in the Americas (the “S-Net Developed Markets”) on a sector-by-sector basis. “Dividend Dogs” refers to the five stocks in each of the ten Global Industry Classification Standard (“GICS”) sectors that make up the S-Net Developed Markets which offer the highest dividend yields.
Performance Overview
ALPS International Sector Dividend Dogs ETF (IDOG), for the twelve month period ended November 30, 2015, generated a total return of -8.01%, in-line with the Fund’s Net Total Return Index, net of fees, which returned -7.35%. The fund underperformed the MSCI EAFE® Index (MXEA) which returned -2.94% for the same period.
The trailing twelve month yield for the fund’s constituents as of 11/30/2015 was 4.79% vs. 3.14% on the MSCI EAFE®.
From a macro perspective, drivers influencing developed market equities for the one year period ended 11/30/15 included the impact of speculation on a potential U.S. Fed rate hike, global concerns over slowing growth and weak manufacturing figures in China, falling oil prices, and the ECB’s accommodative monetary policy.
Compared to the MSCI EAFE®, the fund saw a slight negative impact (-0.58%) from sector allocation which was largely driven by the modest overweight resulting from the equal sector weight strategy in Energy (9.89% vs. 5.23% in MXEA) and Utilities (10.11% vs. 3.71% in MXEA). Positively affecting the Fund’s performance was a modest underweight in Financials relative to the MSCI EAFE (9.90% vs. 25.81%), as well as an overweight to Information Technology (9.89% vs. 4.72%). The fund also saw relative underperformance (-1.46%) attributed to security selection, with names in Consumer Discretionary and Telecommunication Services the primary detractors.
From a geographical perspective, performance was supported by security selection in Japan and Norway, as well as average relative underweights for the period in Switzerland and the Netherlands. The fund’s performance was adversely impacted by security selection in Hong Kong and Australia, in addition to average relative overweights to Australia and Chile. The fund saw the impact of a strong dollar, as currency effect hurt detracted 2.05% from the fund’s returns.
The best performing stocks for the period were Eisai Co Ltd. (4523 JP), which increased 84.91%, Cap Gemini (CAP FP), which rose 27.37%, and Prosiebensat.1 Media SE (PSM GR), which climbed 27.00%. The worst performing stocks were SJM Holdings Ltd. (880 HK), which decreased 49.39%, BHP Billiton Limited (BHP AU), which fell 36.21%, and Banco Santander SA (SAN SM), which lost 35.42%.
Looking forward we believe the Fund’s strategy of annually selecting the five highest yielding securities in each of the ten sectors in the S-Net Developed Markets (Ex NAS) Index will provide high yield relative to the MSCI EAFE®, potential for market participation in all economic cycles through equal sector weighting, and a deep value portfolio of securities as identified through high yield relative to their sector peers.
Performance (as of November 30, 2015)
| | | | |
| | | 1 Year | | Since Inception^ |
ALPS International Sector Dividend Dogs ETF – NAV | | -7.76% | | 2.36% |
ALPS International Sector Dividend Dogs ETF – Market Price* | | -8.01% | | 2.29% |
S-Network® International Sector Dividend Dogs TR Index | | -6.86% | | 3.55% |
S-Network® International Sector Dividend Dogs NTR Index | | -7.35% | | 2.76% |
MSCI EAFE Index | | -2.94% | | 5.12% |
Total Expense Ratio (per the current prospectus) 0.50% .
Performance data quoted represents past performance. Past performance does not guarantee future results. Investment return and principal value of an investment will fluctuate so that an investor’s shares, when sold or redeemed, may be worth more or less than the original cost. Current performance data may be higher or lower than actual data quoted. For the most current month-end performance data please visit www.alpsfunds.com or call 1.866.675.2639.
6 | November 30, 2015
| | |
ALPS International Sector Dividend Dogs ETF | | |
| |
| Performance Overview | | November 30, 2015 (Unaudited) |
NAV is an exchange-traded fund’s per-share value. The per-share dollar amount of the fund is derived by dividing the total value of all the securities in its portfolio, less any liabilities, by the number of fund shares outstanding. Market Price is the price at which a share can currently be traded in the market. Information detailing the number of days the Market Price of the Fund was greater than the Fund’s NAV and the number of days it was less than the Fund’s NAV can be obtained at www.alpsfunds.com.
| ^ | The Fund Commencement Date was June 28, 2013. |
| * | Market Price is based on the midpoint of the bid-ask spread at 4 p.m. ET and does not represent the returns an investor would receive if shares were traded at other times. |
The S-Network® International Sector Dividend Dogs Index is designed to serve as a fair, impartial and transparent measure of the performance of international large cap equities with above average dividend yields. The Index is a portfolio of fifty stocks derived from the S-Net International Developed Markets Index (ex-Americas) Index. Total Return (TR) is obtained by reinvesting in the index the ordinary gross dividends declared by the index constituents. Net Total Return (NTR) is obtained by reinvesting the net dividend, which is equal to the ordinary gross dividend minus the amount of withholding tax.
MSCI EAFE Index is a stock market index that is designed to measure the equity market performance of developed markets outside of the U.S. & Canada.
One cannot invest directly in an index. Index performance does not reflect fund performance.
The ALPS International Sector Dividend Dogs ETF is not suitable for all investors. Investments in the Fund are subject to investment risks, including possible loss of the principal amount invested.
ALPS Portfolio Solutions Distributor, Inc. is the Distributor for the ETF.
7 | November 30, 2015
| | |
ALPS International Sector Dividend Dogs ETF | | |
| |
| Performance Overview | | November 30, 2015 (Unaudited) |
Top 10 Holdings* (as of November 30, 2015)
| | | | |
OMV AG | | | 2.32 | % |
Insurance Australia Group, Ltd. | | | 2.29 | % |
UPM-Kymmene OYJ | | | 2.28 | % |
BP Plc | | | 2.24 | % |
Westpac Banking Corp. | | | 2.24 | % |
Sandvik AB | | | 2.22 | % |
Gjensidige Forsikring ASA | | | 2.22 | % |
BAE Systems Plc | | | 2.21 | % |
British American Tobacco Plc | | | 2.19 | % |
Orange SA | | | 2.19 | % |
Total % of Top 10 Holdings | | | 22.40 | % |
Future holdings are subject to change.
Sector Allocation* (as of November 30, 2015)
| | | | |
Energy | | | 10.71 | % |
Financials | | | 10.62 | % |
Consumer Staples | | | 10.40 | % |
Industrials | | | 10.22 | % |
Utilities | | | 9.96 | % |
Information Technology | | | 9.90 | % |
Health Care | | | 9.76 | % |
Telecommunication Services | | | 9.55 | % |
Consumer Discretionary | | | 9.28 | % |
Materials | | | 9.20 | % |
Money Market Fund | | | 0.40 | % |
Total | | | 100.00 | % |
Growth of $10,000 (as of November 30, 2015)
Comparison of Change in Value of $10,000 Investment in the Fund and the Indexes
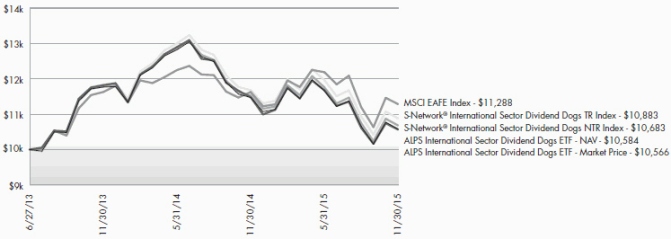
The chart above represents historical performance of a hypothetical investment of $10,000 in the Fund over the life of the Fund. Performance calculations are as of the end of each month. Past performance does not guarantee future results. This chart does not reflect the deduction of taxes that a shareholder would pay on Fund distributions or the redemption of Fund shares.
8 | November 30, 2015
| | |
ALPS Emerging Sector Dividend Dogs ETF | | |
| |
| Performance Overview | | November 30, 2015 (Unaudited) |
Investment Objective
The ALPS Emerging Sector Dividend Dogs ETF (the “Fund”) seeks investment results that replicate as closely as possible, before fees and expenses, the performance of the S-Network® Emerging Sector Dividend Dogs Index (the “Index”). The Shares of the Fund are listed and trade on the New York Stock Exchange (“NYSE”) Arca under the ticker symbol EDOG. The Fund generally will invest in all of the securities that comprise the Index in proportion to their weightings in the Index.
The Index is a rules-based index intended to give investors a means of tracking the overall performance of the highest dividend paying stocks (i.e. “Dividend Dogs”) in the S-Network® Emerging Markets Index, a universe of mainly large capitalization stocks domiciled in emerging markets (the “S-Network Emerging Markets”) on a sector-by-sector basis. “Dividend Dogs” refers to the five stocks in each of the ten Global Industry Classification Standard (“GICS”) sectors that make up the S-Network® Emerging Markets which offer the highest dividend yields. Emerging market countries are countries that major international financial institutions, such as the World Bank, generally consider to be less economically mature than developed nations.
Performance Overview
ALPS Emerging Sector Dividend Dogs ETF (EDOG), for the one year period ended November 30, 2015, generated a total return of -18.80%, in-line with the Fund’s Net Total Return Index, net of fees, which returned -17.71%. The fund trailed the MSCI Emerging Markets Net TR Index®, which returned -16.99% for the same period.
The trailing twelve month yield for the fund’s constituents as of 11/30/2015 was 5.19% vs. 2.93% on the MSCI EM®.
From a macro perspective, drivers influencing emerging market equities for the one year period ended 11/30/15 included the impact of speculation on a potential U.S. Fed rate hike, concerns over slowing growth and weak manufacturing figures in China, and U.S. dollar strength over emerging market currencies. Emerging market equities were heavily influenced by weak prices for oil and other commodities, as the asset class has historically been sensitive to natural resource markets.
Compared to the MSCI EM®, the fund saw a modest positive impact (0.38%) from sector allocation which was largely driven by the moderate over-weight resulting from the equal sector weight strategy in Health Care (10.08% vs. 2.51% in MSCI EM) and a relative underweight to Financials over the one year period (10.22% vs. 28.99% in MSCI EM). Conversely, the fund’s performance was hurt by the underweight in Information Technology relative to the MSCI EM Index (10.09% vs. 18.29% respectively). The fund also saw strong relative outperformance (2.28%) due to security selection, as the names in Telecommunication Services and Financials propped up fund performance.
From a geographical perspective, the fund’s returns were bolstered by security selection in China and the Czech Republic, as well as relative overweights to Russia and Hungary. Fund performance for the period was negatively impacted by relative overweights to Thailand and Poland, as well as security selection in South Africa and Columbia. The fund saw the impact of a strong dollar, as currency effect hurt detracted 3.52% from the fund’s returns, the primary driver of the fund’s relative underperformance.
The best performing stocks for the period were O2 Czech Republic AS (TELEC CP), which increased 229.41%, Evergrande Real Estate Group (3333 HK), which returned 124.11%, and Sistema JSFC- Reg S Sponsored GDR (SSA LI), which rose 64.30%. The worst performing stocks were Ecorodovias Infra E Log SA (ECOR3 BZ), which lost 68.47%, Indo Tambangraya Megah TBK (ITMG IJ), which fell 64.85%; and Exxaro Resources Ltd. (EXX SJ), which decreased 62.60%.
Looking forward we believe the Fund’s strategy of annually selecting the five highest yielding securities in each of the ten sectors in the S-Net Emerging Markets Index will provide high yield relative to the MSCI Emerging Markets Index®, potential for market participation in all economic cycles through equal sector weighting, and a deep value portfolio of securities as identified through high yield relative to their sector peers.
Performance (as of November 30, 2015)
| | | | |
| | | 1 Year | | Since Inception^ |
ALPS Emerging Sector Dividend Dogs ETF – NAV | | -18.66% | | -6.95% |
ALPS Emerging Sector Dividend Dogs ETF – Market Price* | | -18.80% | | -7.01% |
S-Network® Emerging Sector Dividend Dogs TR Index | | -17.28% | | -5.48% |
S-Network® Emerging Sector Dividend Dogs NTR Index | | -17.71% | | -6.04% |
MSCI Emerging Markets Index | | -16.99% | | -7.83% |
9 | November 30, 2015
| | |
ALPS Emerging Sector Dividend Dogs ETF | | |
| |
| Performance Overview | | November 30, 2015 (Unaudited) |
Total Expense Ratio (per the current prospectus) 0.60% .
Performance data quoted represents past performance. Past performance does not guarantee future results. Investment return and principal value of an investment will fluctuate so that an investor’s shares, when sold or redeemed, may be worth more or less than the original cost. Current performance data may be higher or lower than actual data quoted. For the most current month-end performance data please visit www.alpsfunds.com or call 1.866.675.2639.
NAV is an exchange-traded fund’s per-share value. The per-share dollar amount of the fund is derived by dividing the total value of all the securities in its portfolio, less any liabilities, by the number of fund shares outstanding. Market Price is the price at which a share can currently be traded in the market. Information detailing the number of days the Market Price of the Fund was greater than the Fund’s NAV and the number of days it was less than the Fund’s NAV can be obtained at www.alpsfunds.com.
| ^ | The Fund Commencement Date was March 28, 2014. |
| * | Market Price is based on the midpoint of the bid-ask spread at 4 p.m. ET and does not represent the returns an investor would receive if shares were traded at other times. |
The S-Network® Emerging Sector Dividend Dogs Index is a portfolio of stocks derived from a universe of mainly large capitalization stocks domiciled in emerging markets (the “S-Network Emerging Markets Index” “SNEMX”). The index methodology selects the five stocks in each of the ten GICS sectors that make up the universe which offer the highest dividend yields as of the last trading day of November. The fifty stocks that are selected for inclusion in the portfolio are equally weighted. The universe includes stocks whose domicile and primary exchange listings are in countries identified by the World Bank as Upper Middle Income (certain lower middle income countries are also included, as well as stocks traded on the Taiwan Stock Exchange despite non-recognition by the World Bank). The selection criteria for the universe, in addition to the aforementioned country qualifications, also include requirements for sector inclusion, primary exchange listing, minimum market capitalization, share price, average daily trading volume and other factors. Total Return (TR) is obtained by reinvesting in the index the ordinary gross dividends declared by the index constituents. Net Total Return (NTR) is obtained by reinvesting the net dividend, which is equal to the ordinary gross dividend minus the amount of withholding tax.
The MSCI Emerging Markets Index is a free float-adjusted market capitalization index that is designed to measure equity market performance in the global emerging markets.
One cannot invest directly in an index. Index performance does not reflect fund performance.
The ALPS Emerging Sector Dividend Dogs ETF is not suitable for all investors. Investments in the Fund are subject to investment risks, including possible loss of the principal amount invested.
ALPS Portfolio Solutions Distributor, Inc. is the Distributor for the ETF.
10 | November 30, 2015
| | |
ALPS Emerging Sector Dividend Dogs ETF | | |
| |
| Performance Overview | | November 30, 2015 (Unaudited) |
Top 10 Holdings* (as of November 30, 2015)
| | | | |
Felda Global Ventures Holdings Bhd | | | 2.91 | % |
Grupo Financiero Santander Mexico SAB de CV, Class B | | | 2.69 | % |
Evergrande Real Estate Group, Ltd. | | | 2.68 | % |
MegaFon PJSC, GDR | | | 2.60 | % |
Richter Gedeon Nyrt | | | 2.59 | % |
Tofas Turk Otomobil Fabrikasi AS | | | 2.42 | % |
AAC Technologies Holdings, Inc. | | | 2.34 | % |
Rosneft OAO, GDR | | | 2.31 | % |
Turk Traktor ve Ziraat Makineleri AS | | | 2.30 | % |
SONDA SA | | | 2.24 | % |
Total % of Top 10 Holdings | | | 25.08 | % |
Future holdings are subject to change.
Sector Allocation* (as of November 30, 2015)
| | | | |
Consumer Discretionary | | | 10.90 | % |
Telecommunication Services | | | 10.66 | % |
Financials | | | 10.65 | % |
Health Care | | | 10.52 | % |
Information Technology | | | 10.48 | % |
Industrials | | | 10.42 | % |
Utilities | | | 9.53 | % |
Energy | | | 9.10 | % |
Consumer Staples | | | 9.07 | % |
Materials | | | 8.60 | % |
Money Market Fund | | | 0.07 | % |
Total | | | 100.00 | % |
Growth of $10,000 (as of November 30, 2015)
Comparison of Change in Value of $10,000 Investment in the Fund and the Indexes
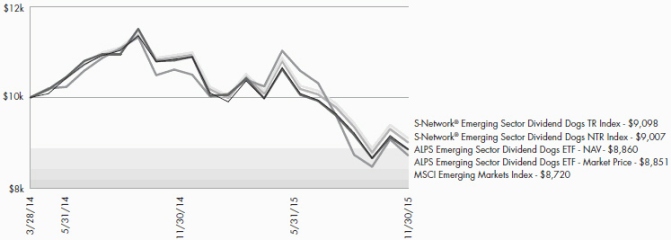
The chart above represents historical performance of a hypothetical investment of $10,000 in the Fund over the life of the Fund. Performance calculations are as of the end of each month. Past performance does not guarantee future results. This chart does not reflect the deduction of taxes that a shareholder would pay on Fund distributions or the redemption of Fund shares.
11 | November 30, 2015
| | |
ALPS Sector Dividend Dogs ETF | | |
| |
| Schedule of Investments | | November 30, 2015 |
| | | | | | | | |
| Security Description | | Shares | | | Value | |
| |
COMMON STOCKS (99.21%) | | | | | |
Consumer Discretionary (9.35%) | | | | | | | | |
Coach, Inc. | | | 676,272 | | | $ | 21,485,162 | |
Darden Restaurants, Inc. | | | 318,611 | | | | 17,896,380 | |
GameStop Corp., Class A | | | 465,348 | | | | 16,301,140 | |
Mattel, Inc. | | | 880,948 | | | | 21,900,367 | |
Staples, Inc. | | | 1,433,043 | | | | 17,296,829 | |
| | | | | | | | |
Total Consumer Discretionary | | | | | | | 94,879,878 | |
| | | | | | | | |
| | |
Consumer Staples (10.56%) | | | | | | | | |
Altria Group, Inc. | | | 378,624 | | | | 21,808,742 | |
The Kraft Heinz Co. | | | 269,945 | | | | 19,892,247 | |
Philip Morris International, Inc. | | | 250,526 | | | | 21,893,467 | |
The Procter & Gamble Co. | | | 291,018 | | | | 21,779,787 | |
Reynolds American, Inc. | | | 471,890 | | | | 21,824,913 | |
| | | | | | | | |
Total Consumer Staples | | | | | | | 107,199,156 | |
| | | | | | | | |
| | |
Energy (9.60%) | | | | | | | | |
ConocoPhillips | | | 420,377 | | | | 22,721,377 | |
Diamond Offshore Drilling, Inc. | | | 903,135 | | | | 20,437,945 | |
Ensco Plc, Class A | | | 1,283,136 | | | | 21,967,288 | |
Kinder Morgan, Inc. | | | 661,443 | | | | 15,590,212 | |
ONEOK, Inc. | | | 565,739 | | | | 16,677,986 | |
| | | | | | | | |
Total Energy | | | | | | | 97,394,808 | |
| | | | | | | | |
| | |
Financials (10.67%) | | | | | | | | |
BB&T Corp. | | | 545,041 | | | | 21,049,483 | |
Cincinnati Financial Corp. | | | 372,674 | | | | 22,774,108 | |
JPMorgan Chase & Co. | | | 317,484 | | | | 21,169,833 | |
People’s United Financial, Inc. | | | 1,285,326 | | | | 21,529,211 | |
Prudential Financial, Inc. | | | 251,502 | | | | 21,767,498 | |
| | | | | | | | |
Total Financials | | | | | | | 108,290,133 | |
| | | | | | | | |
| | |
Health Care (10.10%) | | | | | | | | |
Baxter International, Inc. | | | 552,764 | | | | 20,811,565 | |
Eli Lilly & Co. | | | 243,407 | | | | 19,969,111 | |
Johnson & Johnson | | | 214,234 | | | | 21,689,050 | |
Merck & Co., Inc. | | | 382,228 | | | | 20,261,906 | |
Pfizer, Inc. | | | 603,882 | | | | 19,789,213 | |
| | | | | | | | |
Total Health Care | | | | | | | 102,520,845 | |
| | | | | | | | |
| | |
Industrials (10.66%) | | | | | | | | |
Eaton Corp. Plc | | | 356,496 | | | | 20,733,807 | |
General Electric Co. | | | 798,026 | | | | 23,892,899 | |
Lockheed Martin Corp. | | | 96,294 | | | | 21,103,793 | |
Pitney Bowes, Inc. | | | 974,505 | | | | 21,049,308 | |
Waste Management, Inc. | | | 398,235 | | | | 21,413,096 | |
| | | | | | | | |
Total Industrials | | | | | | | 108,192,903 | |
| | | | | | | | |
| |
Information Technology (14.42%) | | | | | |
AT&T, Inc. | | | 608,468 | | | | 20,487,117 | |
CA, Inc. | | | 718,220 | | | | 20,189,164 | |
KLA-Tencor Corp. | | | 387,842 | | | | 25,779,858 | |
| | | | | | | | |
| Security Description | | Shares | | | Value | |
| |
Information Technology (continued) | | | | | |
Microchip Technology, Inc. | | | 452,553 | | | $ | 21,849,259 | |
Paychex, Inc. | | | 435,599 | | | | 23,631,246 | |
Seagate Technology Plc | | | 405,815 | | | | 14,584,991 | |
Verizon Communications, Inc. | | | 435,400 | | | | 19,788,930 | |
| | | | | | | | |
Total Information Technology | | | | 146,310,565 | |
| | | | | | | | |
| | |
Materials (9.88%) | | | | | | | | |
The Dow Chemical Co. | | | 454,815 | | | | 23,709,506 | |
Freeport-McMoRan, Inc. | | | 1,741,986 | | | | 14,249,446 | |
International Paper Co. | | | 476,983 | | | | 19,952,199 | |
LyondellBasell Industries NV, Class A | | | 237,648 | | | | 22,771,431 | |
Nucor Corp. | | | 471,565 | | | | 19,546,369 | |
| | | | | | | | |
Total Materials | | | | | | | 100,228,951 | |
| | | | | | | | |
| |
Telecommunication Services (3.84%) | | | | | |
CenturyLink, Inc. | | | 755,836 | | | | 20,354,663 | |
Frontier Communications Corp. | | | 3,733,112 | | | | 18,628,229 | |
| | | | | | | | |
Total Telecommunication Services | | | | 38,982,892 | |
| | | | | | | | |
| | |
Utilities (10.13%) | | | | | | | | |
Consolidated Edison, Inc. | | | 319,108 | | | | 19,832,562 | |
Dominion Resources, Inc. | | | 293,848 | | | | 19,796,540 | |
PPL Corp. | | | 671,003 | | | | 22,840,942 | |
The Southern Co. | | | 466,131 | | | | 20,761,475 | |
TECO Energy, Inc. | | | 745,732 | | | | 19,627,666 | |
| | | | | | | | |
Total Utilities | | | | | | | 102,859,185 | |
| | | | | | | | |
| | |
TOTAL COMMON STOCKS (Cost $1,046,391,591) | | | | | | | 1,006,859,316 | |
| | | | | | | | |
| | | | | | | | | | | | |
| | | 7 Day Yield | | | Shares | | | Value | |
| |
SHORT TERM INVESTMENTS (0.44%) | |
Morgan Stanley Institutional Liquidity Funds, Prime Portfolio | | | 0.105 | % | | | 4,497,980 | | | | 4,497,980 | |
| | | | | | | | | | | | |
| |
TOTAL SHORT TERM INVESTMENTS (Cost $4,497,980) | | | | 4,497,980 | |
| | | | | | | | | | | | |
| |
TOTAL INVESTMENTS (99.65%) (Cost $1,050,889,571) | | | $ | 1,011,357,296 | |
| |
NET OTHER ASSETS AND LIABILITIES (0.35%) | | | | 3,541,382 | |
| | | | | | | | | | | | |
| |
NET ASSETS (100.00%) | | | $ | 1,014,898,678 | |
| | | | | | | | | | | | |
12 | November 30, 2015
| | |
ALPS Sector Dividend Dogs ETF | | |
| |
| Schedule of Investments | | November 30, 2015 |
Common Abbreviations:
| NV- | Naamloze Vennootschap is the Dutch term for a public limited liability corporation. |
Plc- Public Limited Company.
See Notes to Financial Statements.
13 | November 30, 2015
| | |
ALPS International Sector Dividend Dogs ETF | | |
| |
| Schedule of Investments | | November 30, 2015 |
| | | | | | | | |
| Security Description | | Shares | | | Value | |
| |
COMMON STOCKS (98.87%) | | | | | | | | |
Australia (19.95%) | | | | | | | | |
AGL Energy, Ltd. | | | 234,493 | | | $ | 2,806,638 | |
BHP Billiton, Ltd. | | | 159,201 | | | | 2,082,777 | |
Fortescue Metals Group, Ltd. | | | 1,859,373 | | | | 2,635,610 | |
Insurance Australia Group, Ltd. | | | 770,372 | | | | 3,086,518 | |
National Australia Bank, Ltd. | | | 125,041 | | | | 2,657,728 | |
Telstra Corp., Ltd. | | | 680,090 | | | | 2,636,269 | |
Wesfarmers, Ltd. | | | 96,289 | | | | 2,652,444 | |
Westpac Banking Corp. | | | 129,635 | | | | 3,014,129 | |
Woodside Petroleum, Ltd. | | | 132,851 | | | | 2,892,904 | |
Woolworths, Ltd. | | | 152,604 | | | | 2,612,298 | |
| | | | | | | | |
Total Australia | | | | | | | 27,077,315 | |
| | | | | | | | |
| | |
Austria (2.31%) | | | | | | | | |
OMV AG | | | 109,671 | | | | 3,130,305 | |
| | | | | | | | |
| | |
Belgium (1.80%) | | | | | | | | |
Proximus | | | 74,126 | | | | 2,448,606 | |
| | | | | | | | |
| | |
Finland (2.27%) | | | | | | | | |
UPM-Kymmene OYJ | | | 161,143 | | | | 3,076,519 | |
| | | | | | | | |
| | |
France (9.90%) | | | | | | | | |
Bouygues SA | | | 69,617 | | | | 2,620,723 | |
Cap Gemini SA | | | 30,239 | | | | 2,789,787 | |
Engie SA | | | 154,357 | | | | 2,689,286 | |
Orange SA | | | 170,936 | | | | 2,954,655 | |
Sanofi | | | 26,770 | | | | 2,386,590 | |
| | | | | | | | |
Total France | | | | | | | 13,441,041 | |
| | | | | | | | |
| | |
Germany (2.06%) | | | | | | | | |
ProSiebenSat.1 Media SE | | | 53,281 | | | | 2,797,813 | |
| | | | | | | | |
| | |
Hong Kong (3.83%) | | | | | | | | |
Li & Fung, Ltd. | | | 4,175,813 | | | | 2,875,990 | |
SJM Holdings, Ltd. | | | 3,170,548 | | | | 2,326,760 | |
| | | | | | | | |
Total Hong Kong | | | | | | | 5,202,750 | |
| | | | | | | | |
| | |
Italy (3.87%) | | | | | | | | |
Atlantia SpA | | | 99,164 | | | | 2,619,292 | |
Eni SpA | | | 162,043 | | | | 2,640,004 | |
| | | | | | | | |
Total Italy | | | | | | | 5,259,296 | |
| | | | | | | | |
| | |
Japan (7.82%) | | | | | | | | |
Canon, Inc. | | | 88,663 | | | | 2,676,456 | |
Eisai Co., Ltd. | | | 39,672 | | | | 2,577,230 | |
Ricoh Co., Ltd. | | | 256,800 | | | | 2,632,669 | |
| | | | | | | | |
| Security Description | | Shares | | | Value | |
| |
Japan (continued) | | | | | | | | |
Takeda Pharmaceutical Co., Ltd. | | | 56,089 | | | $ | 2,726,080 | |
| | | | | | | | |
Total Japan | | | | | | | 10,612,435 | |
| | | | | | | | |
| | |
Norway (4.35%) | | | | | | | | |
Gjensidige Forsikring ASA | | | 185,368 | | | | 2,992,576 | |
Orkla ASA | | | 358,906 | | | | 2,915,669 | |
| | | | | | | | |
Total Norway | | | | | | | 5,908,245 | |
| | | | | | | | |
| | |
Spain (9.60%) | | | | | | | | |
Amadeus IT Holding SA, Class A | | | 65,537 | | | | 2,628,814 | |
Banco Santander SA | | | 468,680 | | | | 2,559,109 | |
Ferrovial SA | | | 108,762 | | | | 2,576,337 | |
Repsol SA | | | 211,146 | | | | 2,754,000 | |
Telefonica SA | | | 204,078 | | | | 2,517,347 | |
| | | | | | | | |
Total Spain | | | | | | | 13,035,607 | |
| | | | | | | | |
| | |
Sweden (5.84%) | | | | | | | | |
Sandvik AB | | | 289,400 | | | | 2,997,924 | |
Telefonaktiebolaget LM Ericsson, | | | | | | | | |
Class B | | | 269,070 | | | | 2,620,731 | |
TeliaSonera AB | | | 470,451 | | | | 2,309,157 | |
| | | | | | | | |
Total Sweden | | | | | | | 7,927,812 | |
| | | | | | | | |
| | |
United Kingdom (25.27%) | | | | | | | | |
Antofagasta Plc | | | 285,322 | | | | 2,180,848 | |
AstraZeneca Plc | | | 40,418 | | | | 2,740,834 | |
BAE Systems Plc | | | 383,656 | | | | 2,984,465 | |
BP Plc | | | 519,699 | | | | 3,015,426 | |
British American Tobacco Plc | | | 50,723 | | | | 2,954,919 | |
Centrica Plc | | | 756,799 | | | | 2,485,939 | |
GlaxoSmithKline Plc | | | 133,824 | | | | 2,732,044 | |
Imperial Tobacco Group Plc | | | 53,490 | | | | 2,890,541 | |
Marks & Spencer Group Plc | | | 343,171 | | | | 2,597,173 | |
National Grid Plc | | | 203,791 | | | | 2,841,557 | |
Pearson Plc | | | 152,420 | | | | 1,896,165 | |
Rio Tinto, Ltd. | | | 72,557 | | | | 2,409,046 | |
SSE Plc | | | 119,801 | | | | 2,587,401 | |
| | | | | | | | |
Total United Kingdom | | | | | | | 34,316,358 | |
| | | | | | | | |
| | |
TOTAL COMMON STOCKS (Cost $154,320,016) | | | | | | | 134,234,102 | |
| | | | | | | | |
| | | | | | | | | | | | |
| | | 7 Day Yield | | | Shares | | | Value | |
| |
SHORT TERM INVESTMENTS (0.39%) | | | | | |
Morgan Stanley Institutional Liquidity Funds, Prime Portfolio | | | 0.105 | % | | | 535,116 | | | | 535,116 | |
| | | | | | | | | | | | |
| |
TOTAL SHORT TERM INVESTMENTS (Cost $535,116) | | | | 535,116 | |
| | | | | | | | | | | | |
14 | November 30, 2015
| | |
ALPS International Sector Dividend Dogs ETF | | |
| |
| Schedule of Investments | | November 30, 2015 |
| | | | |
| |
TOTAL INVESTMENTS (99.26%) (Cost $154,855,132) | | $ | 134,769,218 | |
| |
NET OTHER ASSETS AND LIABILITIES (0.74%) | | | 1,009,240 | |
| | | | |
| |
NET ASSETS (100.00%) | | $ | 135,778,458 | |
| | | | |
Common Abbreviations:
|
AB - Aktiebolag is the Swedish term for corporation. |
AG - Aktiengesellschaft is a German term that refers to a corporation that is limited b shares, i.e., owned by shareholders. |
ASA - Allmennaksjeselskap is the Norwegian term for public limited company. |
Ltd. - Limited. |
OYJ - Osakeyhtio is the Finnish term for public limited company. Plc - Public Limited Company. |
SA - Generally designated corporations in various countries, mostly those employing civil law. |
SE - SE Regulation. A European Company which can operate on a Europe-wide basis and be governed by Community law directly applicable in all Member States. |
SpA - Societa per Azioni is an Italian shared company. |
|
See Notes to Financial Statements. |
15 | November 30, 2015
| | |
ALPS Emerging Sector Dividend Dogs ETF | | |
| |
| Schedule of Investments | | November 30, 2015 |
| | | | | | | | |
| Security Description | | Shares | | | Value | |
| |
COMMON STOCKS (99.94%) | | | | | | | | |
Brazil (7.89%) | | | | | | | | |
Cielo SA, Sponsored ADR | | | 20,170 | | | $ | 180,723 | |
CPFL Energia SA(a) | | | 47,595 | | | | 193,628 | |
EcoRodovias Infraestrutura e Logistica SA | | | 122,718 | | | | 165,886 | |
Natura Cosmeticos SA | | | 36,115 | | | | 197,704 | |
| | | | | | | | |
Total Brazil | | | | | | | 737,941 | |
| | | | | | | | |
| | |
Chile (2.24%) | | | | | | | | |
SONDA SA | | | 124,575 | | | | 209,743 | |
| | | | | | | | |
| | |
China (11.43%) | | | | | | | | |
AAC Technologies Holdings, Inc. | | | 31,280 | | | | 219,266 | |
Agricultural Bank of China, Ltd.,
Class H | | | 493,000 | | | | 188,846 | |
Evergrande Real Estate Group, Ltd. | | | 317,582 | | | | 250,266 | |
Jiangsu Expressway Co., Ltd.,
Class H | | | 158,472 | | | | 205,207 | |
Shanghai Pharmaceuticals Holding Co. Ltd., Class H | | | 93,348 | | | | 204,913 | |
| | | | | | | | |
Total China | | | | | | | 1,068,498 | |
| | | | | | | | |
| | |
Colombia (1.86%) | | | | | | | | |
Ecopetrol SA, Sponsored ADR | | | 20,716 | | | | 173,807 | |
| | | | | | | | |
| | |
Czech Republic (3.92%) | | | | | | | | |
CEZ A.S. | | | 8,719 | | | | 158,441 | |
O2 Czech Republic A.S. | | | 20,679 | | | | 208,091 | |
| | | | | | | | |
Total Czech Republic | | | | | | | 366,532 | |
| | | | | | | | |
| | |
Hungary (2.59%) | | | | | | | | |
Richter Gedeon Nyrt | | | 12,723 | | | | 241,712 | |
| | | | | | | | |
| | |
India (1.95%) | | | | | | | | |
Infosys, Ltd., Sponsored ADR | | | 10,942 | | | | 182,513 | |
| | | | | | | | |
| | |
Indonesia (3.41%) | | | | | | | | |
Indo Tambangraya Megah Tbk PT | | | 301,361 | | | | 147,032 | |
Kalbe Farma Tbk PT | | | 1,783,900 | | | | 172,136 | |
| | | | | | | | |
Total Indonesia | | | | | | | 319,168 | |
| | | | | | | | |
| | |
Malaysia (11.01%) | | | | | | | | |
Berjaya Sports Toto Bhd | | | 266,337 | | | | 193,007 | |
British American Tobacco Malaysia Bhd | | | 13,027 | | | | 176,769 | |
Felda Global Ventures Holdings Bhd | | | 655,800 | | | | 272,225 | |
YTL Corp. Bhd | | | 530,500 | | | | 196,573 | |
YTL Power International Bhd | | | 523,818 | | | | 190,412 | |
| | | | | | | | |
Total Malaysia | | | | | | | 1,028,986 | |
| | | | | | | | |
| | | | | | | | |
| Security Description | | Shares | | | Value | |
| |
Mexico (7.01%) | | | | | | | | |
Grupo Aeroportuario del Pacifico SAB de CV, Class B | | | 22,228 | | | $ | 202,058 | |
Grupo Financiero Santander Mexico SAB de CV, Class B | | | 129,220 | | | | 251,764 | |
Kimberly-Clark de Mexico SAB de CV, Class A | | | 85,265 | | | | 201,510 | |
| | | | | | | | |
Total Mexico | | | | | | | 655,332 | |
| | | | | | | | |
| | |
Poland (8.23%) | | | | | | | | |
Bank Handlowy w Warszawie SA | | | 8,403 | | | | 149,260 | |
KGHM Polska Miedz SA | | | 8,483 | | | | 151,773 | |
PGE Polska Grupa Energetyczna SA | | | 46,369 | | | | 152,152 | |
Powszechny Zaklad Ubezpieczen SA | | | 16,220 | | | | 154,933 | |
Synthos SA | | | 179,943 | | | | 161,639 | |
| | | | | | | | |
Total Poland | | | | | | | 769,757 | |
| | | | | | | | |
| | |
Russia (11.04%) | | | | | | | | |
Gazprom PAO, Sponsored ADR | | | 46,668 | | | | 192,786 | |
MegaFon PJSC, GDR(b) | | | 16,016 | | | | 242,642 | |
Mobile Telesystems PJSC, Sponsored ADR | | | 26,297 | | | | 185,394 | |
Rosneft OAO, GDR(b) | | | 53,637 | | | | 215,621 | |
Sistema JSFC, GDR(b) | | | 29,183 | | | | 195,526 | |
| | | | | | | | |
Total Russia | | | | | | | 1,031,969 | |
| | | | | | | | |
| | |
South Africa (8.39%) | | | | | | | | |
Assore, Ltd. | | | 30,194 | | | | 138,375 | |
Exxaro Resources, Ltd. | | | 38,987 | | | | 121,363 | |
Life Healthcare Group Holdings, Ltd. | | | 73,203 | | | | 180,779 | |
PPC, Ltd. | | | 126,440 | | | | 146,417 | |
Truworths International, Ltd. | | | 30,255 | | | | 197,800 | |
| | | | | | | | |
Total South Africa | | | | | | | 784,734 | |
| | | | | | | | |
| | |
Thailand (9.82%) | | | | | | | | |
BEC World Pcl | | | 210,670 | | | | 193,976 | |
BTS Group Holdings Pcl | | | 702,220 | | | | 187,115 | |
Bumrungrad Hospital Pcl | | | 29,800 | | | | 183,756 | |
Delta Electronics Thailand Pcl | | | 79,624 | | | | 188,841 | |
Intouch Holdings Pcl(a) | | | 89,182 | | | | 164,230 | |
| | | | | | | | |
Total Thailand | | | | | | | 917,918 | |
| | | | | | | | |
| | |
Turkey (9.15%) | | | | | | | | |
Brisa Bridgestone Sabanci Sanayi ve Ticaret AS | | | 74,247 | | | | 208,730 | |
Eregli Demir ve Celik Fabrikalari TAS | | | 159,117 | | | | 205,365 | |
Tofas Turk Otomobil Fabrikasi AS | | | 34,260 | | | | 226,146 | |
Turk Traktor ve Ziraat Makineleri AS | | | 8,574 | | | | 214,847 | |
| | | | | | | | |
Total Turkey | | | | | | | 855,088 | |
| | | | | | | | |
| | |
TOTAL COMMON STOCKS (Cost $11,632,118) | | | | | | | 9,343,698 | |
| | | | | | | | |
16 | November 30, 2015
| | |
ALPS Emerging Sector Dividend Dogs ETF | | |
| |
| Schedule of Investments | | November 30, 2015 |
| | | | | | | | | | | | |
| | | 7 Day Yield | | | Shares | | | Value | |
| |
SHORT TERM INVESTMENTS (0.07%) | | | | | |
Morgan Stanley Institutional Liquidity Funds, Prime Portfolio | | | 0.105 | % | | | 6,674 | | | $ | 6,674 | |
| | | | | | | | | | | | |
| |
TOTAL SHORT TERM INVESTMENTS (Cost $ 6,674) | | | | 6,674 | |
| | | | | | | | | | | | |
| |
TOTAL INVESTMENTS (100.01%) (Cost $ 11,638,792) | | | $ | 9,350,372 | |
| |
| LIABILITIES IN EXCESS OF OTHER ASSETS (-0.01%) | | | | (992) | |
| | | | | | | | | | | | |
| | |
NET ASSETS (100.00%) | | | | | | | $ | 9,349,380 | |
| | | | | | | | | | | | |
| (a) | Non-income producing security. |
| (b) | These securities initially sold to other parties pursuant to Regulation S under the 1933 Act and subsequently resold to the Fund. As of November 30, 2015, the aggregate market values of these securities were $653,789, representing 6.99% of the Fund’s net assets. |
Common Abbreviations:
| ADR - | American Depositary Receipt. |
| AS - | Andonim Sirketi is a joint stock company in Turkey. |
| A.S. - | Akciova Spolecnost is a joint stock company in the Czech Republic. |
| Bhd - | Berhad is a public limited company in Malaysia. |
| GDR - | Global Depositary Receipt. |
| JSFC - | Joint Stock Financial Corporation. |
| Nyrt - | Hungarian for Public Limited Company. |
| OAO - | Otkrytoe Aktsionernoe Obschestvo is the Russian Term for Open Joint Stock Company. |
| PAO - | Publichnoye Aktsionernoye Obschestvo is the Russian Term for Public Stock Company. |
| Pcl - | A rearrangement of the letters for public limited company, used in Thailand. |
| PJSC - | Private Joint Stock Company. |
| SA - | Generally designated corporations in various countries, mostly those employing civil law. |
| SAB | de CV - A variable capital company. |
TAS - Turk Anonin Sirketi is the Turkish term for Joint Stock Company.
Tbk PT - Terbuka is the Indonesian term for limited liability company.
See Notes to Financial Statements.
17 | November 30, 2015
| | |
ALPS Sector Dividend Dogs Series | | |
| |
| Statements of Assets and Liabilities | | November 30, 2015 |
| | | | | | | | | | | | |
| | | | | | ALPS | | | | |
| | | ALPS Sector | | | International | | | ALPS Emerging | |
| | | Dividend Dogs | | | Sector Dividend | | | Sector Dividend | |
| | | ETF | | | Dogs ETF | | | Dogs ETF | |
| |
ASSETS: | | | | | | | | | | | | |
Investments, at value | | $ | 1,011,357,296 | | | $ | 134,769,218 | | | $ | 9,350,372 | |
Cash | | | 5 | | | | – | | | | – | |
Foreign currency, at value (Cost $–, $196,470 and $–) | | | – | | | | 195,651 | | | | – | |
Foreign tax reclaims | | | – | | | | 408,443 | | | | 2,059 | |
Dividends receivable | | | 3,876,226 | | | | 461,587 | | | | 1,714 | |
| |
Total Assets | | | 1,015,233,527 | | | | 135,834,899 | | | | 9,354,145 | |
| |
| | | |
LIABILITIES: | | | | | | | | | | | | |
Payable for investments purchased | | | – | | | | 275 | | | | – | |
Payable to adviser | | | 334,849 | | | | 56,166 | | | | 4,765 | |
| |
Total Liabilities | | | 334,849 | | | | 56,441 | | | | 4,765 | |
| |
NET ASSETS | | $ | 1,014,898,678 | | | $ | 135,778,458 | | | $ | 9,349,380 | |
| |
| | | |
NET ASSETS CONSIST OF: | | | | | | | | | | | | |
Paid-in capital | | $ | 1,070,897,973 | | | $ | 168,871,099 | | | $ | 11,889,066 | |
Accumulated net investment income | | | 714,281 | | | | – | | | | 134,699 | |
Accumulated net realized loss on investments and foreign currency transactions | | | (17,181,301) | | | | (12,940,516) | | | | (385,820) | |
Net unrealized depreciation on investments and translation of assets and liabilities denominated in foreign currencies | | | (39,532,275) | | | | (20,152,125) | | | | (2,288,565) | |
| |
NET ASSETS | | $ | 1,014,898,678 | | | $ | 135,778,458 | | | $ | 9,349,380 | |
| |
| | | |
INVESTMENTS, AT COST | | $ | 1,050,889,571 | | | $ | 154,855,132 | | | $ | 11,638,792 | |
| | | |
PRICING OF SHARES: | | | | | | | | | | | | |
Net Assets | | $ | 1,014,898,678 | | | $ | 135,778,458 | | | $ | 9,349,380 | |
Shares of beneficial interest outstanding (Unlimited number of shares authorized, par value $0.01 per share) | | | 28,009,141 | | | | 5,600,000 | | | | 450,000 | |
Net Asset Value, offering and redemption price per share | | $ | 36.23 | | | $ | 24.25 | | | $ | 20.78 | |
See Notes to Financial Statements.
18 | November 30, 2015
| | |
ALPS Sector Dividend Dogs Series | | |
| |
| Statements of Operations | | For the Year Ended November 30, 2015 |
| | | | | | | | | | | | |
| | | | | | ALPS | | | | |
| | | ALPS Sector | | | International | | | ALPS Emerging | |
| | | Dividend Dogs | | | Sector Dividend | | | Sector Dividend | |
| | | ETF | | | Dogs ETF | | | Dogs ETF | |
| |
INVESTMENT INCOME: | | | | | | | | | | | | |
Dividends* | | $ | 41,603,457 | | | $ | 7,249,296 | | | $ | 657,136 | |
Interest and other income | | | – | | | | 27 | | | | 20 | |
| |
Total Investment Income | | | 41,603,457 | | | | 7,249,323 | | | | 657,156 | |
| |
| | | |
EXPENSES: | | | | | | | | | | | | |
Investment adviser fees | | | 4,563,136 | | | | 797,496 | | | | 66,328 | |
| |
Total Expense | | | 4,563,136 | | | | 797,496 | | | | 66,328 | |
| |
NET INVESTMENT INCOME | | | 37,040,321 | | | | 6,451,827 | | | | 590,828 | |
| |
| | | |
REALIZED AND UNREALIZED GAIN/(LOSS) | | | | | | | | | | | | |
Net realized gain/(loss) on investments | | | 70,582,949 | | | | (12,191,549) | | | | (411,131) | |
Net realized loss on foreign currency transactions | | | – | | | | (247,870) | | | | (22,897) | |
Net change in unrealized depreciation on investments | | | (146,635,118) | | | | (8,530,991) | | | | (2,340,383) | |
Net change in unrealized appreciation/(depreciation) on translation of assets and liabilities denominated in foreign currencies | | | – | | | | (29,635) | | | | 357 | |
| |
NET REALIZED AND UNREALIZED LOSS ON INVESTMENTS | | | (76,052,169) | | | | (21,000,045) | | | | (2,774,054) | |
| |
NET DECREASE IN NET ASSETS RESULTING FROM OPERATIONS | | $ | (39,011,848) | | | $ | (14,548,218) | | | $ | (2,183,226) | |
| |
*Net of foreign tax withholding. | | $ | – | | | $ | 501,681 | | | $ | 52,241 | |
See Notes to Financial Statements.
19 | November 30, 2015
| | |
ALPS Sector Dividend Dogs ETF | | |
| |
| Statements of Changes in Net Assets | | |
| | | | | | | | |
| | | For the | | | For the | |
| | | Year Ended | | | Year Ended | |
| | | November 30, 2015 | | | November 30, 2014 | |
| |
OPERATIONS: | | | | | | | | |
Net investment income | | $ | 37,040,321 | | | $ | 25,671,802 | |
Net realized gain on investments | | | 70,582,949 | | | | 30,591,250 | |
Net change in unrealized appreciation/(depreciation) on investments | | | (146,635,118) | | | | 65,547,456 | |
| |
Net increase/(decrease) in net assets resulting from operations | | | (39,011,848) | | | | 121,810,508 | |
| |
| | |
Net Equalization Credits | | | 1,811,687 | | | | 1,695,015 | |
| | |
DISTRIBUTIONS TO SHAREHOLDERS: | | | | | | | | |
From net investment income | | | (39,961,342) | | | | (22,702,657) | |
| |
Total distributions | | | (39,961,342) | | | | (22,702,657) | |
| |
| | |
CAPITAL SHARE TRANSACTIONS: | | | | | | | | |
Proceeds from sale of shares | | | 597,479,846 | | | | 633,539,564 | |
Dividends reinvested | | | 148,008 | | | | 177,537 | |
Cost of shares redeemed | | | (528,228,637) | | | | (172,629,123) | |
Net income equalization (Note 2) | | | (1,811,687) | | | | (1,695,015) | |
| |
Net Increase from Share Transactions | | | 67,587,530 | | | | 459,392,963 | |
| |
Net increase/(decrease) in net assets | | | (9,573,973) | | | | 560,195,829 | |
| | |
NET ASSETS: | | | | | | | | |
Beginning of period | | | 1,024,472,651 | | | | 464,276,822 | |
| |
End of period * | | $ | 1,014,898,678 | | | $ | 1,024,472,651 | |
| |
| | |
* Including accumulated net investment income of: | | $ | 714,281 | | | $ | 3,635,302 | |
| | |
OTHER INFORMATION: | | | | | | | | |
CAPITAL SHARE TRANSACTIONS: | | | | | | | | |
Beginning shares | | | 26,405,255 | | | | 13,750,361 | |
Shares sold | | | 15,750,000 | | | | 17,650,000 | |
Shares reinvested | | | 3,888 | | | | 4,894 | |
Shares redeemed | | | (14,150,002) | | | | (5,000,000) | |
| |
Shares outstanding, end of period | | | 28,009,141 | | | | 26,405,255 | |
| |
See Notes to Financial Statements.
20 | November 30, 2015
| | |
ALPS International Sector Dividend Dogs ETF | | |
|
| Statements of Changes in Net Assets |
| | | | | | | | |
| | | For the | | | For the | |
| | | Year Ended | | | Year Ended | |
| | | November 30, 2015 | | | November 30, 2014 | |
| |
OPERATIONS: | | | | | | | | |
Net investment income | | $ | 6,451,827 | | | $ | 5,144,079 | |
Net realized gain/(loss) on investments and foreign currency transactions | | | (12,439,419) | | | | 1,822,190 | |
Net change in unrealized depreciation on investments and translation of assets and liabilities denominated in foreign currencies | | | (8,560,626) | | | | (14,445,513) | |
| |
Net decrease in net assets resulting from operations | | | (14,548,218) | | | | (7,479,244) | |
| |
| | |
Net Equalization Credits | | | 313,588 | | | | 406,964 | |
| | |
DISTRIBUTIONS TO SHAREHOLDERS: | | | | | | | | |
From net investment income | | | (6,203,669) | | | | (5,101,215) | |
From tax return of capital | | | (115,516) | | | | (311,911) | |
| |
Total distributions | | | (6,319,185) | | | | (5,413,126) | |
| |
| | |
CAPITAL SHARE TRANSACTIONS: | | | | | | | | |
Proceeds from sale of shares | | | 45,672,933 | | | | 111,986,285 | |
Cost of shares redeemed | | | (32,488,456) | | | | (33,043,796) | |
Net income equalization (Note 2) | | | (313,588) | | | | (406,964) | |
| |
Net Increase from Share Transactions | | | 12,906,215 | | | | 78,535,525 | |
| |
Net increase/(decrease) in net assets | | | (7,682,926) | | | | 66,050,119 | |
| | |
NET ASSETS: | | | | | | | | |
Beginning of period | | | 143,461,384 | | | | 77,411,265 | |
| |
End of period * | | $ | 135,778,458 | | | $ | 143,461,384 | |
| |
| | |
* Including accumulated net investment loss of: | | $ | – | | | $ | (288) | |
| | |
OTHER INFORMATION: | | | | | | | | |
CAPITAL SHARE TRANSACTIONS: | | | | | | | | |
Beginning shares | | | 5,250,002 | | | | 2,650,002 | |
Shares sold | | | 1,650,000 | | | | 3,750,000 | |
Shares redeemed | | | (1,300,002) | | | | (1,150,000) | |
| |
Shares outstanding, end of period | | | 5,600,000 | | | | 5,250,002 | |
| |
See Notes to Financial Statements.
21 | November 30, 2015
| | |
ALPS Emerging Sector Dividend Dogs ETF | | |
|
| Statements of Changes in Net Assets |
| | | | | | | | |
| | | | | | For the Period | |
| | | For the | | | March 28, 2014 | |
| | | Year Ended | | | (Commencement) to | |
| | | November 30, 2015 | | | November 30, 2014 | |
| |
OPERATIONS: | | | | | | | | |
Net investment income | | $ | 590,828 | | | $ | 143,025 | |
Net realized loss on investments and foreign currency transactions | | | (434,028) | | | | (35,715) | |
Net change in unrealized appreciation/(depreciation) on investments and translation of assets and liabilities denominated in foreign currencies | | | (2,340,026) | | | | 51,461 | |
| |
Net increase/(decrease) in net assets resulting from operations | | | (2,183,226) | | | | 158,771 | |
| |
| | |
Net Equalization Credits | | | 14,209 | | | | 36,260 | |
| | |
DISTRIBUTIONS TO SHAREHOLDERS: | | | | | | | | |
From net investment income | | | (433,154) | | | | (121,633) | |
From tax return of capital | | | – | | | | (27,627) | |
| |
Total distributions | | | (433,154) | | | | (149,260) | |
| |
| | |
CAPITAL SHARE TRANSACTIONS: | | | | | | | | |
Proceeds from sale of shares | | | 2,419,051 | | | | 10,619,149 | |
Cost of shares redeemed | | | (1,081,951) | | | | – | |
Net income equalization (Note 2) | | | (14,209) | | | | (36,260) | |
| |
Net Increase from Share Transactions | | | 1,322,891 | | | | 10,582,889 | |
| |
Net increase/(decrease) in net assets | | | (1,279,280) | | | | 10,628,660 | |
| | |
NET ASSETS: | | | | | | | | |
Beginning of period | | | 10,628,660 | | | | – | |
| |
End of period * | | $ | 9,349,380 | | | $ | 10,628,660 | |
| |
| | |
* Including accumulated net investment income/(loss) of: | | $ | 134,699 | | | $ | (78) | |
| | |
OTHER INFORMATION: | | | | | | | | |
CAPITAL SHARE TRANSACTIONS: | | | | | | | | |
Beginning shares | | | 400,002 | | | | – | |
Shares sold | | | 100,000 | | | | 400,002 | |
Shares redeemed | | | (50,002) | | | | – | |
| |
Shares outstanding, end of period | | | 450,000 | | | | 400,002 | |
| |
See Notes to Financial Statements.
22 | November 30, 2015
| | |
ALPS Sector Dividend Dogs ETF | | |
| |
| Financial Highlights | | For a Share Outstanding Throughout the Periods Presented |
| | | | | | | | | | | | | | | | |
| | | | | | | | | | | | For the Period | |
| | | | | | | | | | | | June 29, 2012 | |
| | | For the Year | | | For the Year | | | For the Year | | | (Commencement) | |
| | | Ended | | | Ended | | | Ended | | | to | |
| | | November 30, | | | November 30, | | | November 30, | | | November 30, | |
| | | 2015 | | | 2014 | | | 2013 | | | 2012 | |
| |
NET ASSET VALUE, BEGINNING OF PERIOD | | $ | 38.80 | | | $ | 33.76 | | | $ | 26.71 | | | $ | 25.00 | |
| | | | |
INCOME/(LOSS) FROM INVESTMENT OPERATIONS: | | | | | | | | | | | | | | | | |
Net investment income (a) | | | 1.21 | | | | 1.35 | | | | 1.12 | | | | 0.59 | |
Net realized and unrealized gain/(loss) | | | (2.47) | | | | 4.94 | | | | 7.14 | | | | 1.41 | |
| |
Total from investment operations | | | (1.26) | | | | 6.29 | | | | 8.26 | | | | 2.00 | |
| |
| | | | |
DISTRIBUTIONS: | | | | | | | | | | | | | | | | |
From net investment income | | | (1.31) | | | | (1.25) | | | | (1.21) | | | | (0.29) | |
| |
Total distributions | | | (1.31) | | | | (1.25) | | | | (1.21) | | | | (0.29) | |
| |
| | | | |
Net increase/(decrease) in net asset value | | | (2.57) | | | | 5.04 | | | | 7.05 | | | | 1.71 | |
| |
NET ASSET VALUE, END OF PERIOD | | $ | 36.23 | | | $ | 38.80 | | | $ | 33.76 | | | $ | 26.71 | |
| |
| TOTAL RETURN(b) | | | (3.21)% | | | | 18.96% | | | | 31.66% | | | | 7.99% | |
| | | | |
RATIOS/SUPPLEMENTAL DATA: | | | | | | | | | | | | | | | | |
Net assets, end of period (000s) | | $ | 1,014,899 | | | $ | 1,024,473 | | | $ | 464,277 | | | $ | 62,768 | |
| | | | |
Ratio of expenses to average net assets | | | 0.40% | | | | 0.40% | | | | 0.40% | | | | 0.40%(c) | |
Ratio of net investment income to average net assets | | | 3.25% | | | | 3.74% | | | | 3.58% | | | | 5.31%(c) | |
Portfolio turnover rate(d) | | | 55% | | | | 12% | | | | 8% | | | | 0% | |
Undistributed net investment income included in price of units issued and redeemed(a)(e) | | $ | 0.06 | | | $ | 0.09 | | | $ | 0.13 | | | $ | 0.19 | |
| (a) | Based on average shares outstanding during the period. |
| (b) | Total return is calculated assuming an initial investment made at the net asset value at the beginning of the period and redemption at the net asset value on the last day of the period and assuming all distributions are reinvested at reinvestment prices. Total return calculated for a period of less than one year is not annualized. |
| (d) | Portfolio turnover is not annualized and does not include securities received or delivered from processing creations or redemptions. |
| (e) | The per share amount of equalization is presented to show the impact of equalization on distributable earnings per share. |
See Notes to Financial Statements.
23 | November 30, 2015
| | |
ALPS International Sector Dividend Dogs ETF |
| |
| Financial Highlights | | For a Share Outstanding Throughout the Periods Presented |
| | | | | | | | | | | | |
| | | | | | | | | For the Period | |
| | | | | | | | | June 28, 2013 | |
| | | For the Year Ended | | | For the Year Ended | | | (Commencement) to | |
| | | November 30, 2015 | | | November 30, 2014 | | | November 30, 2013 | |
| |
NET ASSET VALUE, BEGINNING OF PERIOD | | $ | 27.33 | | | $ | 29.21 | | | $ | 25.00 | |
| | | |
INCOME/(LOSS) FROM INVESTMENT OPERATIONS: | | | | | | | | | | | | |
Net investment income(a) | | | 1.06 | | | | 1.19 | | | | 0.34 | |
Net realized and unrealized gain/(loss) | | | (3.13) | | | | (1.83) | | | | 4.08 | |
| |
Total from investment operations | | | (2.07) | | | | (0.64) | | | | 4.42 | |
| |
| | | |
DISTRIBUTIONS: | | | | | | | | | | | | |
From net investment income | | | (0.99) | | | | (1.17) | | | | (0.21) | |
Tax return of capital | | | (0.02) | | | | (0.07) | | | | – | |
| |
Total distributions | | | (1.01) | | | | (1.24) | | | | (0.21) | |
| |
| | | |
Net increase/(decrease) in net asset value | | | (3.08) | | | | (1.88) | | | | 4.21 | |
| |
NET ASSET VALUE, END OF PERIOD | | $ | 24.25 | | | $ | 27.33 | | | $ | 29.21 | |
| |
| | | |
| TOTAL RETURN(b) | | | (7.76)% | | | | (2.53)% | | | | 17.72% | |
| | | |
RATIOS/SUPPLEMENTAL DATA: | | | | | | | | | | | | |
Net assets, end of period (000s) | | $ | 135,778 | | | $ | 143,461 | | | $ | 77,411 | |
| | | |
Ratio of expenses to average net assets | | | 0.50% | | | | 0.50% | | | | 0.50% | (c) |
Ratio of net investment income to average net assets | | | 4.05% | | | | 4.05% | | | | 2.87% | (c) |
Portfolio turnover rate(d) | | | 67% | | | | 19% | | | | 2% | |
Undistributed net investment income included in price of units issued and redeemed(a)(e) | | $ | 0.05 | | | $ | 0.09 | | | $ | 0.14 | |
| (a) | Based on average shares outstanding during the period. |
| (b) | Total return is calculated assuming an initial investment made at the net asset value at the beginning of the period and redemption at the net asset value on the last day of the period and assuming all distributions are reinvested at reinvestment prices. Total return calculated for a period of less than one year is not annualized. |
| (d) | Portfolio turnover is not annualized and does not include securities received or delivered from processing creations or redemptions. |
| (e) | The per share amount of equalization is presented to show the impact of equalization on distributable earnings per share. |
See Notes to Financial Statements.
24 | November 30, 2015
| | |
ALPS Emerging Sector Dividend Dogs ETF |
| |
| Financial Highlights | | For a Share Outstanding Throughout the Periods Presented |
| | | | | | | | |
| | | | | | For the Period | |
| | | | | | March 28, 2014 | |
| | | For the Year Ended | | | (Commencement) to | |
| | | November 30, 2015 | | | November 30, 2014 | |
| |
NET ASSET VALUE, BEGINNING OF PERIOD | | $ | 26.57 | | | $ | 25.00 | |
| | |
INCOME/(LOSS) FROM INVESTMENT OPERATIONS: | | | | | | | | |
Net investment income(a) | | | 1.26 | | | | 0.64 | |
Net realized and unrealized gain/(loss) | | | (6.15) | | | | 1.59 | |
| |
Total from investment operations | | | (4.89) | | | | 2.23 | |
| |
| | |
DISTRIBUTIONS: | | | | | | | | |
From net investment income | | | (0.90) | | | | (0.54) | |
Tax return of capital | | | – | | | | (0.12) | |
| |
Total distributions | | | (0.90) | | | | (0.66) | |
| |
| | |
Net increase/(decrease) in net asset value | | | (5.79) | | | | 1.57 | |
| |
Net asset value, end of period | | $ | 20.78 | | | $ | 26.57 | |
| |
| | |
| TOTAL RETURN(b) | | | (18.66)% | | | | 8.93% | |
| | |
RATIOS/SUPPLEMENTAL DATA: | | | | | | | | |
Net assets, end of period (000s) | | $ | 9,349 | | | $ | 10,629 | |
Ratio of expenses to average net assets | | | 0.60% | | | | 0.60%(c) | |
Ratio of net investment income to average net assets | | | 5.34% | | | | 3.54%(c) | |
Portfolio turnover rate(d) | | | 96% | | | | 19% | |
Undistributed net investment income included in price of units issued and redeemed(a)(e) | | $ | 0.03 | | | $ | 0.16 | |
| (a) | Based on average shares outstanding during the period. |
| (b) | Total return is calculated assuming an initial investment made at the net asset value at the beginning of the period and redemption at the net asset value on the last day of the period and assuming all distributions are reinvested at reinvestment prices. Total return calculated for a period of less than one year is not annualized. |
| (d) | Portfolio turnover is not annualized and does not include securities received or delivered from processing creations or redemptions. |
| (e) | The per share amount of equalization is presented to show the impact of equalization on distributable earnings per share. |
See Notes to Financial Statements.
25 | November 30, 2015
| | |
ALPS Sector Leaders ETF | | |
| |
| Performance Overview | | November 30, 2015 (Unaudited) |
Investment Objective
The ALPS Sector Leaders ETF (the “Fund”) seeks investment results that replicate as closely as possible, before fees and expenses, the performance of the S-Network® Sector Leaders Index (the “Index”). The Shares of the Fund are listed and trade on the New York Stock Exchange (“NYSE”) Arca under the ticker symbol SLDR. The Fund generally will invest in all of the securities that comprise the Index in proportion to their weightings in the Index.
The Index is a rules-based index intended to give investors a means of tracking the overall performance of the stocks in the S&P 500 that demonstrate key characteristics associated with growth and quality (“Sector Leaders”) on a sector-by-sector basis. “Sector Leaders” refers to the five stocks in each of nine Global Industry Classification Standard (“GICS”) sectors that make up the S&P 500 which offer the best growth potential. The GICS sectors included combine the telecommunications sector with the information technology sector and exclude investments in real estate investment trusts (“REITS”).
Performance Overview
ALPS Sector Leaders ETF (SLDR), for the five month period since the fund’s June 30, 2015 inception through November 30, 2015, generated a total return of -2.32%, in-line with the Fund’s Underlying Index, which returned -2.71%. The fund underperformed the S&P 500®, which returned 1.76% for the same period.
From a macro perspective, drivers influencing U.S. equities for the one year period ended November 30, 2015 included the impact of speculation on a potential U.S. Fed rate hike, global concerns over slowing growth and weak manufacturing figures in China, falling oil prices, and improved consumer confidence in the U.S.
Compared to the S&P 500®, the Fund saw a slightly negative impact (-0.73%) from sector allocation for the period. This was largely driven by underperformance related to the relative over-weights resulting from the equal sector weight strategy in Technology (10.71% vs. 22.68% in SPX) and a relative overweight to Materials (11.26% vs. 2.93% in SPX). The Fund’s relative underweight allocation to Health Care (11.39% vs. 15.04% in SPX) helped buoy the fund’s performance. The fund had a moderately negative impact from security selection, as the names in Consumer Discretionary and Technology underperformed.
The best performing stocks in the fund for the period were AGL Resources Inc. (GAS), which increased 36.57% and Marathon Petroleum Corp. (MPC), which saw a gain of 27.48%. Martin Marietta Materials (MLM), which rose 18.38%, and Dr. Pepper Snapple Group Inc. (DPS), which climbed 16.21%, were other top performers. The largest detractors were Fossil Group Inc. (FOSL), which decreased 45.07%, Biogen Inc. (BIIB), which fell 29.24%, and Whole Foods Market Inc. (WFM), which lost 25.71%.
Looking forward we believe the Fund’s strategy of annually selecting the five securities in each of the nine sectors (with Information Technology and Telecommunication Service combined) in the S&P 500® with the cleanest balance sheets and highest ROE will provide a quality growth portfolio relative to the S&P 500®, and potential for market participation in all economic cycles through equal sector weighting.
Performance (as of November 30, 2015)
| | |
| | | Since Inception^ |
ALPS Sector Leaders ETF - NAV | | -2.32% |
ALPS Sector Leaders ETF - Market Price* | | -2.32% |
S-Network® Sector Leaders Index | | -2.71% |
Total Expense Ratio (per the current prospectus) 0.40%.
Performance data quoted represents past performance. Past performance does not guarantee future results. Investment return and principal value of an investment will fluctuate so that an investor’s shares, when sold or redeemed, may be worth more or less than the original cost. Current performance data may be higher or lower than actual data quoted. For the most current month-end performance data please visit www.alpsfunds.com or call 1.866.675.2639.
26 | November 30, 2015
| | |
ALPS Sector Leaders ETF | | |
| |
| Performance Overview | | November 30, 2015 (Unaudited) |
NAV is an exchange-traded fund’s per-share value. The per-share dollar amount of the fund is derived by dividing the total value of all the securities in its portfolio, less any liabilities, by the number of fund shares outstanding. Market Price is the price at which a share can currently be traded in the market. Information detailing the number of days the Market Price of the Fund was greater than the Fund’s NAV and the number of days it was less than the Fund’s NAV can be obtained at www.alpsfunds.com.
| ^ | The Fund Commencement Date was July 1, 2015. Total return for a period of less than one year is not annualized. |
| * | Market Price is based on the midpoint of the bid-ask spread at 4 p.m. ET and does not represent the returns an investor would receive if shares were traded at other times. |
The ALPS Sector Leaders ETF is new and has limited operating history.
S-Network® Sector Leaders Index: An index that selects the five stocks in each of the nine GICS sectors (information technology and telecommunications are combined) contained in the S&P 500® which statistically demonstrate key characteristics associated with growth and quality.
One cannot invest directly in an index. Index performance does not reflect fund performance.
The ALPS Sector Leaders ETF is not suitable for all investors. Investments in the Fund are subject to investment risks, including possible loss of the principal amount invested.
ALPS Portfolio Solutions Distributor, Inc. is the Distributor for the ETF.
27 | November 30, 2015
| | |
ALPS Sector Leaders ETF | | |
| |
| Performance Overview | | November 30, 2015 (Unaudited) |
Top 10 Holdings* (as of November 30, 2015)
| | | | |
Marathon Petroleum Corp. | | | 2.60% | |
Pioneer Natural Resources Co. | | | 2.60% | |
Helmerich & Payne, Inc. | | | 2.52% | |
Dr Pepper Snapple Group, Inc. | | | 2.51% | |
Edwards Lifesciences Corp. | | | 2.50% | |
Monster Beverage Corp. | | | 2.48% | |
The Travelers Cos, Inc. | | | 2.46% | |
Avery Dennison Corp. | | | 2.39% | |
Visa, Inc., Class A | | | 2.38% | |
International Flavors & Fragrances, Inc. | | | 2.38% | |
Total % of Top 10 Holdings | | | 24.82% | |
Sector Allocation* (as of November 30, 2015)
| | | | |
Energy | | | 12.25% | |
Consumer Staples | | | 11.54% | |
Financials | | | 11.51% | |
Materials | | | 11.20% | |
Information Technology | | | 11.06% | |
Industrials | | | 10.96% | |
Utilities | | | 10.89% | |
Health Care | | | 10.86% | |
Consumer Discretionary | | | 9.70% | |
Money Market Fund | | | 0.03% | |
Total | | | 100.00% | |
Future holdings are subject to change.
Growth of $10,000 (as of November 30, 2015)
Comparison of Change in Value of $10,000 Investment in the Fund and the Index
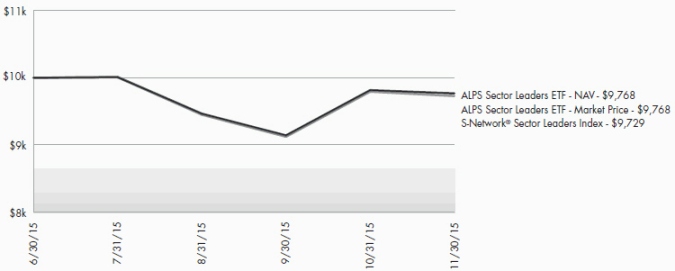
The chart above represents historical performance of a hypothetical investment of $10,000 in the Fund over the life of the Fund. Performance calculations are as of the end of each month. Past performance does not guarantee future results. This chart does not reflect the deduction of taxes that a shareholder would pay on Fund distributions or the redemption of Fund shares.
28 | November 30, 2015
| | |
ALPS Sector Low Volatility ETF | | |
| |
| Performance Overview | | November 30, 2015 (Unaudited) |
Investment Objective
The ALPS Sector Low Volatility ETF (the “Fund”) seeks investment results that replicate as closely as possible, before fees and expenses, the performance of the S-Network® Sector Low Volatility Index (the “Index”). The Shares of the Fund are listed and trade on the New York Stock Exchange (“NYSE”) Arca under the ticker symbol SLOW. The Fund generally will invest in all of the securities that comprise the Index in proportion to their weightings in the Index.
The Index is a rules-based index intended to give investors a means of tracking the overall performance of the lowest volatility stocks (i.e. “SLOW Stocks”) in the S&P 500 on a sector-by-sector basis. “SLOW Stocks” refers to the five stocks in each of nine Global Industry Classification Standard (“GICS”) sectors that make up the S&P 500 which offer the lowest potential volatility as measured by their trailing twelve month volatility. The GICS sectors included combine the telecommunications sector with the information technology sector and exclude investments in real estate investment trusts (“REITS”).
Performance Overview
ALPS Sector Low Volatility ETF (SLOW), for the five month period since the fund’s June 30, 2015 inception through November 30, 2015, generated a total return of 3.51%, in-line with the Fund’s Underlying Index, which returned 2.52%. The fund outperformed the S&P 500®, which returned 1.76% for the same period.
The trailing twelve month volatility for the fund’s constituents as of November 30, 2015 was 20.2, meaningfully lower than that of the S&P 500, which was 25.1 at the end of the period.
From a macro perspective, drivers influencing U.S. equities for the one year period ended November 30, 2015 included the impact of speculation on a potential U.S. Fed rate hike, global concerns over slowing growth and weak manufacturing figures in China, falling oil prices, and improved consumer confidence in the U.S.
Compared to the S&P 500®, the Fund saw a slightly negative impact (-0.67%) from sector allocation for the period. This was largely driven by underperformance related to the relative over-weights resulting from the equal sector weight strategy in Technology (11.33% vs. 22.68% in SPX) and a relative overweight to Materials (10.89% vs. 2.93% in SPX). The Fund’s relative overweight allocation to Utilities (11.45% vs. 2.95% in SPX) helped buoy the fund’s performance. The fund had a moderately positive impact (+2.06%) from security selection, as the names in Materials and Financials outperformed.
The best performing stocks in the fund for the period were Airgas Inc. (ARG), which increased 31.21% and McDonald’s Corp. (MCD), which saw a gain of 21.20%. Paychex Inc. (PAYX), which rose 16.65%, and Waste Management Inc. (WM), which climbed 16.50%, were other top performers. The largest detractors were Kinder Morgan (KMI), which decreased 35.90%, Monsanto Co (MON), which fell 18.17%, and Spectra Energy Corp. (SE), which lost 15.59%.
Looking forward we believe the Fund’s strategy of quarterly selecting the five securities in each of the nine sectors (with Information Technology and Telecommunication Service combined) in the S&P 500® with the lowest volatility has the potential to produce a portfolio with meaningfully lower volatility relative to the S&P 500®. The fund can also provide diversified exposure and potential for market participation in all economic cycles through its equal sector weighting approach.
Performance (as of November 30, 2015)
| | |
| | | Since Inception^ |
ALPS Sector Low Volatility ETF - NAV | | 3.51% |
ALPS Sector Low Volatility ETF - Market Price* | | 3.59% |
S-Network® Sector Low Volatility Index | | 2.52% |
Total Expense Ratio (per the current prospectus) 0.40%.
Performance data quoted represents past performance. Past performance does not guarantee future results. Investment return and principal value of an investment will fluctuate so that an investor’s shares, when sold or redeemed, may be worth more or less than the original cost. Current performance data may be higher or lower than actual data quoted. For the most current month-end performance data please visit www.alpsfunds.com or call 1.866.675.2639.
29 | November 30, 2015
| | |
ALPS Sector Low Volatility ETF | | |
| |
| Performance Overview | | November 30, 2015 (Unaudited) |
NAV is an exchange-traded fund’s per-share value. The per-share dollar amount of the fund is derived by dividing the total value of all the securities in its portfolio, less any liabilities, by the number of fund shares outstanding. Market Price is the price at which a share can currently be traded in the market. Information detailing the number of days the Market Price of the Fund was greater than the Fund’s NAV and the number of days it was less than the Fund’s NAV can be obtained at www.alpsfunds.com.
| ^ | The Fund Commencement Date was July 1, 2015. Total return for a period of less than one year is not annualized. |
| * | Market Price is based on the midpoint of the bid-ask spread at 4 p.m. ET and does not represent the returns an investor would receive if shares were traded at other times. |
The ALPS Sector Low Volatility ETF is new and has limited operating history.
S-Network® Sector Low Volatility Index: An index that selects the five stocks in each of the nine GICS sectors (information technology and telecommunications are combined) contained in the S&P 500® with the lowest annualized trailing tweleve month daily price volatility.
One cannot invest directly in an index. Index performance does not reflect fund performance.
The ALPS Sector Low Volatility ETF is not suitable for all investors. Investments in the Fund are subject to investment risks, including possible loss of the principal amount invested.
ALPS Portfolio Solutions Distributor, Inc. is the Distributor for the ETF.
30 | November 30, 2015
| | |
ALPS Sector Low Volatility ETF | | |
| Performance Overview | | November 30, 2015 (Unaudited) |
Top 10 Holdings* (as of November 30, 2015)
| | | | |
Airgas, Inc. | | | 3.04% | |
Chevron Corp. | | | 2.50% | |
Paychex, Inc. | | | 2.46% | |
McDonald’s Corp. | | | 2.43% | |
Henry Schein, Inc. | | | 2.40% | |
The Travelers Cos, Inc. | | | 2.39% | |
ACE Ltd. | | | 2.37% | |
Occidental Petroleum Corp. | | | 2.35% | |
Avery Dennison Corp. | | | 2.33% | |
Exxon Mobil Corp. | | | 2.33% | |
Total % of Top 10 Holdings | | | 24.60% | |
Sector Allocation* (as of November 30, 2015)
| | | | |
Materials | | | 12.09% | |
Information Technology | | | 11.27% | |
Consumer Staples | | | 11.20% | |
Financials | | | 11.15% | |
Consumer Discretionary | | | 11.04% | |
Energy | | | 10.81% | |
Industrials | | | 10.75% | |
Health Care | | | 10.70% | |
Utilities | | | 10.66% | |
Money Market Fund | | | 0.33% | |
Total | | | 100.00% | |
Future holdings are subject to change.
Growth of $10,000 (as of November 30, 2015)
Comparison of Change in Value of $10,000 Investment in the Fund and the Index
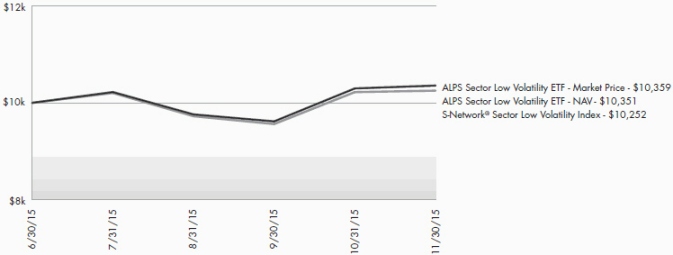
The chart above represents historical performance of a hypothetical investment of $10,000 in the Fund over the life of the Fund. Performance calculations are as of the end of each month. Past performance does not guarantee future results. This chart does not reflect the deduction of taxes that a shareholder would pay on Fund distributions or the redemption of Fund shares.
31 | November 30, 2015
| | |
ALPS Sector Leaders ETF | | |
| Schedule of Investments | | November 30, 2015 |
| | | | | | | | |
| Security Description | | Shares | | | Value | |
| |
COMMON STOCKS (99.81%) | | | | | | | | |
Consumer Discretionary (9.68%) | | | | | |
Chipotle Mexican Grill,
Inc.(a) | | | 35 | | | $ | 20,284 | |
Fossil Group, Inc.(a) | | | 444 | | | | 17,081 | |
O’Reilly Automotive, Inc.(a) | | | 105 | | | | 27,706 | |
The Priceline Group, Inc.(a) | | | 20 | | | | 24,977 | |
Starbucks Corp. | | | 461 | | | | 28,301 | |
| | | | | | | | |
Total Consumer Discretionary | | | | | | | 118,349 | |
| | | | | | | | |
| | |
| Consumer Staples (11.52%) | | | | | | | | |
Brown-Forman Corp., Class B | | | 271 | | | | 27,788 | |
Dr Pepper Snapple Group, Inc. | | | 341 | | | | 30,605 | |
The Estee Lauder Company, Inc., Class A | | | 341 | | | | 28,685 | |
Monster Beverage Corp.(a) | | | 196 | | | | 30,304 | |
Whole Foods Market, Inc. | | | 806 | | | | 23,495 | |
| | | | | | | | |
Total Consumer Staples | | | | | | | 140,877 | |
| | | | | | | | |
| | |
| Energy (12.23%) | | | | | | | | |
EOG Resources, Inc. | | | 337 | | | | 28,116 | |
Helmerich & Payne, Inc. | | | 528 | | | | 30,756 | |
Marathon Petroleum Corp. | | | 544 | | | | 31,775 | |
Pioneer Natural Resources Co. | | | 219 | | | | 31,700 | |
Schlumberger Ltd. | | | 353 | | | | 27,234 | |
| | | | | | | | |
Total Energy | | | | | | | 149,581 | |
| | | | | | | | |
| | |
| Financials (11.48%) | | | | | | | | |
Affiliated Managers Group, Inc.(a) | | | 147 | | | | 26,053 | |
Lincoln National Corp. | | | 521 | | | | 28,650 | |
Principal Financial Group, Inc. | | | 540 | | | | 27,789 | |
T. Rowe Price Group, Inc. | | | 367 | | | | 27,947 | |
The Travelers Cos., Inc. | | | 262 | | | | 30,017 | |
| | | | | | | | |
Total Financials | | | | | | | 140,456 | |
| | | | | | | | |
| | |
| Health Care (10.83%) | | | | | | | | |
Alexion Pharmaceuticals, Inc.(a) | | | 151 | | | | 26,945 | |
Biogen, Inc.(a) | | | 83 | | | | 23,809 | |
Cigna Corp. | | | 186 | | | | 25,106 | |
Edwards Lifesciences Corp.(a) | | | 187 | | | | 30,481 | |
Regeneron Pharmaceuticals, Inc.(a) | | | 48 | | | | 26,136 | |
| | | | | | | | |
Total Health Care | | | | | | | 132,477 | |
| | | | | | | | |
| | |
| Industrials (10.95%) | | | | | | | | |
Fastenal Co. | | | 674 | | | | 27,351 | |
Robert Half International, Inc. | | | 506 | | | | 25,897 | |
Snap-On, Inc. | | | 164 | | | | 28,234 | |
Union Pacific Corp. | | | 302 | | | | 25,353 | |
United Technologies Corp. | | | 281 | | | | 26,990 | |
| | | | | | | | |
Total Industrials | | | | | | | 133,825 | |
| | | | | | | | |
| |
| Information Technology (11.06%) | | | | | |
Apple, Inc. | | | 227 | | | | 26,854 | |
| | | | | | | | | | | | |
| Security Description | | | | | Shares | | | Value | |
| |
Information Technology (11.06%) (continued) | | | | | | | | | |
Cognizant Technology Solutions Corp., Class A(a) | | | | 415 | | | $ | 26,801 | |
Skyworks Solutions, Inc. | | | | 295 | | | | 24,491 | |
Visa, Inc., Class A | | | | 368 | | | | 29,076 | |
Yahoo!, Inc.(a) | | | | | | | 829 | | | | 28,028 | |
| | | | | | | | | | | | |
Total Information Technology | | | | | | | | 135,250 | |
| | | | | | | | | | | | |
| | | |
Materials (11.19%) | | | | | | | | | | | | |
Avery Dennison Corp. | | | | | | | 443 | | | | 29,220 | |
Ecolab, Inc. | | | | | | | 237 | | | | 28,241 | |
International Flavors & Fragrances, Inc. | | | | | | | 242 | | | | 29,042 | |
The Sherwin-Williams Co. | | | | 101 | | | | 27,883 | |
WestRock Co. | | | | | | | 444 | | | | 22,480 | |
| | | | | | | | | | | | |
Total Materials | | | | | | | | 136,866 | |
| | | | | | | | | | | | |
| | | |
Utilities (10.87%) | | | | | | | | | | | | |
AGL Resources, Inc. | | | | | | | 427 | | | | 26,717 | |
DTE Energy Co. | | | | | | | 343 | | | | 27,608 | |
Eversource Energy | | | | | | | 565 | | | | 28,787 | |
Exelon Corp. | | | | | | | 878 | | | | 23,978 | |
Public Service Enterprise Group, Inc. | | | | 663 | | | | 25,923 | |
| | | | | | | | | | | | |
Total Utilities | | | | | | | | 133,013 | |
| | | | | | | | | | | | |
| | |
TOTAL COMMON STOCKS (Cost $1,241,503) | | | | | | | | 1,220,694 | |
| | | | | | | | | | | | |
| | | |
| | | 7 Day Yield | | | Shares | | | Value | |
| |
SHORT TERM INVESTMENTS (0.03%) | | | | | | | | | |
Morgan Stanley Institutional Liquidity Funds, Prime Portfolio | | | 0.105 | % | | | 369 | | | | 369 | |
| | | | | | | | | | | | |
| | |
TOTAL SHORT TERM INVESTMENTS (Cost $369) | | | | | | | | 369 | |
| | | | | | | | | | | | |
| | |
TOTAL INVESTMENTS (99.84%) (Cost $1,241,872) | | | | | | | $ | 1,221,063 | |
| | |
NET OTHER ASSETS AND LIABILITIES (0.16%) | | | | | | | | 1,977 | |
| | | | | | | | | | | | |
| | |
NET ASSETS (100.00%) | | | | | | | $ | 1,223,040 | |
| | | | | | | | | | | | |
| (a) | Non-income producing security. |
Common Abbreviations:
Ltd. – Limited.
See Notes to Financial Statements.
32 | November 30, 2015
| | |
ALPS Sector Low Volatility ETF | | |
| Schedule of Investments | | November 30, 2015 |
| | | | | | | | |
| Security Description | | Shares | | | Value | |
| |
COMMON STOCKS (99.40%) | | | | | | | | |
Consumer Discretionary (11.01%) | | | | | |
Autozone, Inc.(a) | | | 36 | | | $ | 28,216 | |
Genuine Parts Co. | | | 320 | | | | 29,002 | |
McDonald’s Corp. | | | 274 | | | | 31,280 | |
Omnicom Group, Inc. | | | 395 | | | | 29,198 | |
VF Corp. | | | 376 | | | | 24,327 | |
| | | | | | | | |
Total Consumer Discretionary | | | | | | | 142,023 | |
| | | | | | | | |
| | |
| Consumer Staples (11.16%) | | | | | | | | |
The Coca-Cola Co. | | | 701 | | | | 29,877 | |
General Mills, Inc. | | | 473 | | | | 27,320 | |
McCormick & Co., Inc. | | | 330 | | | | 28,354 | |
PepsiCo, Inc. | | | 291 | | | | 29,146 | |
The Procter & Gamble Co. | | | 390 | | | | 29,188 | |
| | | | | | | | |
Total Consumer Staples | | | | | | | 143,885 | |
| | | | | | | | |
| | |
| Energy (10.78%) | | | | | | | | |
Chevron Corp. | | | 352 | | | | 32,145 | |
Exxon Mobil Corp. | | | 367 | | | | 29,969 | |
Kinder Morgan, Inc. | | | 888 | | | | 20,930 | |
Occidental Petroleum Corp. | | | 399 | | | | 30,160 | |
Spectra Energy Corp. | | | 980 | | | | 25,676 | |
| | | | | | | | |
Total Energy | | | | | | | 138,880 | |
| | | | | | | | |
| | |
| Financials (11.11%) | | | | | | | | |
ACE Ltd. | | | 265 | | | | 30,435 | |
Berkshire Hathaway, Inc., Class B(a) | | | 203 | | | | 27,220 | |
Marsh & McLennan Cos., Inc. | | | 494 | | | | 27,318 | |
The Travelers Cos., Inc. | | | 268 | | | | 30,705 | |
XL Group PLC | | | 722 | | | | 27,566 | |
| | | | | | | | |
Total Financials | | | | | | | 143,244 | |
| | | | | | | | |
| | |
| Health Care (10.68%) | | | | | | | | |
AmerisourceBergen Corp. | | | 256 | | | | 25,252 | |
DaVita HealthCare Partners, Inc.(a) | | | 356 | | | | 26,002 | |
Henry Schein, Inc.(a) | | | 197 | | | | 30,827 | |
Johnson & Johnson | | | 287 | | | | 29,056 | |
Pfizer, Inc. | | | 810 | | | | 26,543 | |
| | | | | | | | |
Total Health Care | | | | | | | 137,680 | |
| | | | | | | | |
| | |
| Industrials (10.72%) | | | | | | | | |
Lockheed Martin Corp. | | | 129 | | | | 28,272 | |
Republic Services, Inc. | | | 660 | | | | 28,994 | |
Rockwell Collins, Inc. | | | 316 | | | | 29,287 | |
Stericycle, Inc.(a) | | | 190 | | | | 22,937 | |
Waste Management, Inc. | | | 534 | | | | 28,713 | |
| | | | | | | | |
Total Industrials | | | | | | | 138,203 | |
| | | | | | | | |
| |
| Information Technology (11.24%) | | | | | |
AT&T, Inc. | | | 817 | | | | 27,508 | |
Automatic Data Processing, Inc. | | | 341 | | | | 29,415 | |
Fiserv, Inc.(a) | | | 310 | | | | 29,834 | |
| | | | | | | | | | | | |
| Security Description | | | Shares | | | Value | |
| |
Information Technology (11.24%) (continued) | |
Paychex, Inc. | | | | 584 | | | $ | 31,682 | |
Verizon Communications, Inc. | | | | 584 | | | | 26,543 | |
| | | | | | | | | | | | |
Total Information Technology | | | | 144,982 | |
| | | | | | | | | | | | |
| | |
| Materials (12.07%) | | | | | | | | | |
Airgas, Inc. | | | | | | | 283 | | | | 39,111 | |
Avery Dennison Corp. | | | | 455 | | | | 30,012 | |
Ecolab, Inc. | | | | 243 | | | | 28,956 | |
Praxair, Inc. | | | | 255 | | | | 28,764 | |
The Sherwin-Williams Co. | | | | 104 | | | | 28,711 | |
| | | | | | | | | | | | |
Total Materials | | | | 155,554 | |
| | | | | | | | | | | | |
| | |
| Utilities (10.63%) | | | | | | | | | |
Consolidated Edison, Inc. | | | | 428 | | | | 26,600 | |
Dominion Resources, Inc. | | | | 394 | | | | 26,544 | |
NextEra Energy, Inc. | | | | 278 | | | | 27,761 | |
Pinnacle West Capital Corp. | | | | 447 | | | | 28,322 | |
The Southern Co. | | | | 625 | | | | 27,837 | |
| | | | | | | | | | | | |
Total Utilities | | | | | | | | 137,064 | |
| | | | | | | | | | | | |
| | |
TOTAL COMMON STOCKS (Cost $1,247,985) | | | | | | | | 1,281,515 | |
| | | | | | | | | | | | |
| | | |
| | | 7 Day Yield | | | Shares | | | Value | |
| |
SHORT TERM INVESTMENTS (0.33%) | | | | | |
Morgan Stanley Institutional Liquidity Funds, Prime Portfolio | | | 0.105 | % | | | 4,258 | | | | 4,258 | |
| | | | | | | | | | | | |
| |
TOTAL SHORT TERM INVESTMENTS
(Cost $4,258) | | | | 4,258 | |
| | | | | | | | | | | | |
| |
TOTAL INVESTMENTS (99.73%)
(Cost $1,252,243) | | | $ | 1,285,773 | |
| |
NET OTHER ASSETS AND LIABILITIES (0.27%) | | | | 3,511 | |
| | | | | | | | | | | | |
| |
NET ASSETS (100.00%) | | | $ | 1,289,284 | |
| | | | | | | | | | | | |
| (a) | Non-income producing security. |
Common Abbreviations:
Ltd. - Limited.
PLC - Public Limited Company.
See Notes to Financial Statements.
33 | November 30, 2015
| | |
ALPS Sector ETF Series | | |
| Statements of Assets and Liabilities | | November 30, 2015 |
| | | | | | | | |
| | | | | | ALPS Sector | |
| | | ALPS Sector | | | Low Volatility | |
| | | Leaders ETF | | | ETF | |
| |
| ASSETS: | | | | | | | | |
Investments, at value | | $ | 1,221,063 | | | $ | 1,285,773 | |
Dividends receivable | | | 2,379 | | | | 3,932 | |
| |
Total Assets | | | 1,223,442 | | | | 1,289,705 | |
| |
| | |
LIABILITIES: | | | | | | | | |
Payable to adviser | | | 402 | | | | 421 | |
| |
Total Liabilities | | | 402 | | | | 421 | |
| |
NET ASSETS | | $ | 1,223,040 | | | $ | 1,289,284 | |
| |
| | |
NET ASSETS CONSIST OF: | | | | | | | | |
Paid-in capital | | $ | 1,289,241 | | | $ | 1,262,242 | |
Accumulated net investment income | | | 1,098 | | | | 6,188 | |
Accumulated net realized loss on investments | | | (46,490) | | | | (12,676) | |
Net unrealized appreciation/(depreciation) on investments | | | (20,809) | | | | 33,530 | |
| |
NET ASSETS | | $ | 1,223,040 | | | $ | 1,289,284 | |
| |
| | |
INVESTMENTS, AT COST | | $ | 1,241,872 | | | $ | 1,252,243 | |
| | |
PRICING OF SHARES: | | | | | | | | |
Net Assets | | $ | 1,223,040 | | | $ | 1,289,284 | |
Shares of beneficial interest outstanding (Unlimited number of shares authorized, par value $0.01 per share) | | | 50,002 | | | | 50,002 | |
Net Asset Value, offering and redemption price per share | | $ | 24.46 | | | $ | 25.78 | |
See Notes to Financial Statements.
34 | November 30, 2015
| | |
ALPS Sector ETF Series | | |
| Statements of Operations | | For the Period Ended November 30, 2015 |
| | | | | | | | |
| | | | | | ALPS Sector | |
| | | ALPS Sector | | | Low Volatility | |
| | | Leaders ETF(a) | | | ETF(a) | |
| |
INVESTMENT INCOME: | | | | | | | | |
Dividends | | $ | 10,792 | | | $ | 22,559 | |
| |
Total Investment Income | | | 10,792 | | | | 22,559 | |
| |
| | |
EXPENSES: | | | | | | | | |
Investment adviser fees | | | 3,342 | | | | 3,447 | |
| |
Total Expense | | | 3,342 | | | | 3,447 | |
| |
NET INVESTMENT INCOME | | | 7,450 | | | | 19,112 | |
| |
| | |
REALIZED AND UNREALIZED GAIN/(LOSS) | | | | | | | | |
Net realized loss on investments | | | (82,929) | | | | (20,037) | |
Net change in unrealized appreciation/(depreciation) on investments | | | (20,809) | | | | 33,530 | |
| |
NET REALIZED AND UNREALIZED GAIN/(LOSS) ON INVESTMENTS | | | (103,738) | | | | 13,493 | |
| |
NET INCREASE/(DECREASE) IN NET ASSETS RESULTING FROM OPERATIONS | | $ | (96,288) | | | $ | 32,605 | |
| |
| (a) | The ALPS Sector Leaders ETF and ALPS Sector Low Volatility ETF commenced operations on July 1, 2015. |
See Notes to Financial Statements.
35 | November 30, 2015
| | |
ALPS Sector Leaders ETF | | |
| Statement of Changes in Net Assets | | |
| | | | |
| | | For the Period | |
| | | July 1, 2015 | |
| | | (Commencement) to | |
| | | November 30, 2015 | |
| |
OPERATIONS: | | | | |
Net investment income | | $ | 7,450 | |
Net realized loss on investments | | | (82,929) | |
Net change in unrealized depreciation on investments | | | (20,809) | |
| |
Net Decrease in net assets resulting from operations | | | (96,288) | |
| |
| |
DISTRIBUTIONS TO SHAREHOLDERS: | | | | |
From net investment income | | | (6,352) | |
| |
Total distributions | | | (6,352) | |
| |
| |
CAPITAL SHARE TRANSACTIONS: | | | | |
Proceeds from sale of Shares | | | 2,510,643 | |
Cost of shares redeemed | | | (1,184,963) | |
| |
Net Increase from Share Transactions | | | 1,325,680 | |
| |
Net Increase in Net Assets | | | 1,223,040 | |
| |
NET ASSETS: | | | | |
Beginning of period | | | – | |
| |
End of period * | | $ | 1,223,040 | |
| |
| |
* Including accumulated net investment income of: | | $ | 1,098 | |
| |
OTHER INFORMATION: | | | | |
CAPITAL SHARE TRANSACTIONS: | | | | |
Beginning shares | | | – | |
Shares sold | | | 100,002 | |
Shares redeemed | | | (50,000) | |
| |
Shares outstanding, end of period | | | 50,002 | |
| |
See Notes to Financial Statements.
36 | November 30, 2015
| | |
ALPS Sector Low Volatility ETF | | |
| Statement of Changes in Net Assets | | |
| | | | |
| | | For the Period | |
| | | July 1, 2015 | |
| | | (Commencement) to | |
| | | November 30, 2015 | |
OPERATIONS: | | | | |
Net investment income | | $ | 19,112 | |
Net realized loss on investments | | | (20,037) | |
Net change in unrealized appreciation on investments | | | 33,530 | |
Net Increase in net assets resulting from operations | | | 32,605 | |
| |
DISTRIBUTIONS TO SHAREHOLDERS: | | | | |
From net investment income | | | (12,924) | |
Total distributions | | | (12,924) | |
| |
CAPITAL SHARE TRANSACTIONS: | | | | |
Proceeds from sale of Shares | | | 2,503,881 | |
Cost of shares redeemed | | | (1,234,278) | |
Net Increase from Share Transactions | | | 1,269,603 | |
Net Increase in Net Assets | | | 1,289,284 | |
| |
NET ASSETS: | | | | |
Beginning of period | | | – | |
End of period * | | $ | 1,289,284 | |
| | | | | |
| |
* Including accumulated net investment income of: | | $ | 6,188 | |
| |
OTHER INFORMATION: | | | | |
CAPITAL SHARE TRANSACTIONS: | | | | |
Beginning shares | | | – | |
Shares sold | | | 100,002 | |
Shares redeemed | | | (50,000) | |
Shares outstanding, end of period | | | 50,002 | |
| | | | | |
See Notes to Financial Statements.
37 | November 30, 2015
| | |
ALPS Sector Leaders ETF | | |
| Financial Highlights | | For a Share Outstanding Throughout the Period Presented |
| | | | |
| | | For the Period | |
| | | July 1, 2015 | |
| | | (Commencement) to | |
| | | November 30, 2015 | |
NET ASSET VALUE, BEGINNING OF PERIOD | | $ | 25.11 | |
| |
INCOME/(LOSS) FROM INVESTMENT OPERATIONS: | | | | |
Net investment income (a) | | | 0.09 | |
Net realized and unrealized loss | | | (0.68) | |
Total from investment operations | | | (0.59) | |
| |
DISTRIBUTIONS: | | | | |
From net investment income | | | (0.06) | |
Total distributions | | | (0.06) | |
| |
Net (decrease) in net asset value | | | (0.65) | |
NET ASSET VALUE, END OF PERIOD | | $ | 24.46 | |
| | | | | |
TOTAL RETURN(b) | | | (2.32)% | |
| |
RATIOS/SUPPLEMENTAL DATA: | | | | |
Net assets, end of period (000s) | | $ | 1,223 | |
| |
Ratio of expenses to average net assets | | | 0.40% | (c) |
Ratio of net investment income to average net assets | | | 0.89% | (c) |
Portfolio turnover rate(d) | | | 30% | |
| (a) | Based on average shares outstanding during the period. |
| (b) | Total return is calculated assuming an initial investment made at the net asset value at the beginning of the period and redemption at the net asset value on the last day of the period and assuming all distributions are reinvested at reinvestment prices. Total return calculated for a period of less than one year is not annualized. |
| (d) | Portfolio turnover is not annualized and does not include securities received or delivered from processing creations or redemptions. |
See Notes to Financial Statements.
38 | November 30, 2015
| | |
ALPS Sector Low Volatility ETF | | |
| Financial Highlights | | For a Share Outstanding Throughout the Period Presented |
| | | | |
| | | For the Period | |
| | | July 1, 2015 | |
| | | (Commencement) to | |
| | | November 30, 2015 | |
| |
NET ASSET VALUE, BEGINNING OF PERIOD | | $ | 25.04 | |
| |
INCOME/(LOSS) FROM INVESTMENT OPERATIONS: | | | | |
Net investment income (a) | | | 0.23 | |
Net realized and unrealized gain | | | 0.64 | |
| |
Total from investment operations | | | 0.87 | |
| |
| |
DISTRIBUTIONS: | | | | |
From net investment income | | | (0.13) | |
| |
Total distributions | | | (0.13) | |
| |
| |
Net increase in net asset value | | | 0.74 | |
| |
NET ASSET VALUE, END OF PERIOD | | $ | 25.78 | |
| |
TOTAL RETURN(b) | | | 3.51% | |
| |
RATIOS/SUPPLEMENTAL DATA: | | | | |
Net assets, end of period (000s) | | $ | 1,289 | |
| |
Ratio of expenses to average net assets | | | 0.40% | (c) |
Ratio of net investment income to average net assets | | | 2.22% | (c) |
Portfolio turnover rate(d) | | | 33% | |
| (a) | Based on average shares outstanding during the period. |
| (b) | Total return is calculated assuming an initial investment made at the net asset value at the beginning of the period and redemption at the net asset value on the last day of the period and assuming all distributions are reinvested at reinvestment prices. Total return calculated for a period of less than one year is not annualized. |
| (d) | Portfolio turnover is not annualized and does not include securities received or delivered from processing creations or redemptions. |
See Notes to Financial Statements.
39 | November 30, 2015
| | |
ALPS Sector Series | | |
| Notes to Financial Statements | | November 30, 2015 |
1. ORGANIZATION
The ALPS ETF Trust (the “Trust”), a Delaware statutory trust, is an open-end management investment company under the Investment Company Act of 1940, as amended (the “1940 Act”). As of November 30, 2015, the Trust consists of twenty-one separate portfolios. Each portfolio represents a separate series of the Trust. This report pertains to the ALPS Sector Dividend Dogs ETF, the ALPS International Sector Dividend Dogs ETF, the ALPS Emerging Sector Dividend Dogs ETF, the ALPS Sector Leaders ETF, and the ALPS Sector Low Volatility ETF (each a “Fund” and collectively, the “Funds”). Each Fund has elected to qualify as a diversified series of the Trust under the 1940 Act. The ALPS Sector Leaders ETF and the ALPS Sector Low Volatility ETF commenced operations on July 1, 2015.
The investment objective of the ALPS Sector Dividend Dogs ETF is to seek investment results that replicate as closely as possible, before fees and expenses, the performance of the S-Network® Sector Dividend Dogs Index. The investment objective of the ALPS International Sector Dividend Dogs ETF is to seek investment results that replicate as closely as possible, before fees and expenses, the performance of the S-Network® International Sector Dividend Dogs Index. The investment objective of the ALPS Emerging Sector Dividend Dogs ETF is to seek investment results that replicate as closely as possible, before fees and expenses, the performance of the S-Network® Emerging Sector Dividend Dogs Index. The investment objective of the ALPS Sector Leaders ETF is to seek investment results that correspond generally to, before fees and expenses, the performance of the S-Network® Sector Leaders Index. The investment objective of the ALPS Sector Low Volatility ETF is to seek investment results that correspond generally to, before fees and expenses, the performance of the S-Network® Sector Low Volatility Index.
Each Fund’s Shares (“Shares”) are listed on the New York Stock Exchange (“NYSE”) Arca. Each Fund issues and redeems Shares, at net asset value (“NAV”) in blocks of 50,000 Shares, each of which is called a “Creation Unit”. Creation Units are issued and redeemed principally in-kind for securities included in a specified index. Except when aggregated in Creation Units, Shares are not redeemable securities of the Fund.
Pursuant to the Trust’s organizational documents, its Officers and Trustees are indemnified against certain liability arising out of the performance of their duties to the Trust. Additionally, in the normal course of business, the Trust enters into contracts with service providers that contain general indemnification clauses. The Trust’s maximum exposure under these arrangements is unknown, as this would involve future claims that may be made against the Trust that have not yet occurred.
2. SIGNIFICANT ACCOUNTING POLICIES
The following is a summary of significant accounting policies consistently followed by the Funds in the preparation of the financial statements. The accompanying financial statements were prepared in accordance with accounting principles generally accepted in the United States of America (“U.S. GAAP”). The preparation of financial statements in conformity with U.S. GAAP requires management to make certain estimates and assumptions that affect the reported amounts of assets and liabilities and disclosures of contingent assets and liabilities at the date of the financial statements and the reported amounts of revenue and expenses during the period. Actual results could differ from those estimates. Each Fund is considered an investment company under U.S. GAAP and follows the accounting and reporting guidance applicable to investment companies in the Financial Accounting Standards Board Accounting Standards Codification Topic 946.
A. Portfolio Valuation
Each Fund’s NAV is determined daily, as of the close of regular trading on the NYSE, normally 4:00 p.m. Eastern time, on each day the NYSE is open for trading. The NAV is computed by dividing the value of all assets of the Fund (including accrued interest and dividends), less all liabilities (including accrued expenses and dividends declared but unpaid), by the total number of shares outstanding.
Portfolio securities listed on any exchange other than the NASDAQ Stock Exchange LLC (“NASDAQ”) are valued at the last sale price on the business day as of which such value is being determined. If there has been no sale on such day, the securities are valued at the mean of the most recent bid and ask prices on such day. Securities traded on the NASDAQ are valued at the NASDAQ Official Closing Price as determined by NASDAQ. Portfolio securities traded on more than one securities exchange are valued at the last sale price on the business day as of which such value is being determined at the close of the exchange representing the principal market for such securities. Portfolio securities traded in the over-the-counter market, but excluding securities traded on the NASDAQ, are valued at the latest quoted sales price in such market.
The Funds’ investments are valued at market value or, in the absence of market value with respect to any portfolio securities, at fair value according to procedures adopted by the Trust’s Board of Trustees (the “Board”). When market quotations are not readily available or when events occur that make established valuation methods unreliable, securities of the Funds may be valued in good faith by or under the direction of the Board. These securities generally include, but are not limited to, restricted securities (securities which may not be publicly sold without registration under the Securities Act of 1933) for which a pricing service is unable to provide a market price; securities whose trading has been formally suspended; a security whose market price is not available from a pre-established primary pricing source or the pricing source is not willing to
40 | November 30, 2015
| | |
ALPS Sector Series | | |
| Notes to Financial Statements | | November 30, 2015 |
provide a price; a security with respect to which an event has occurred that is most likely to materially affect the value of the security after the market has closed but before the calculation of the Fund’s NAV or make it difficult or impossible to obtain a reliable market quotation; or a security whose price, as provided by the pricing service, does not reflect the security’s “fair value” due to the security being de-listed from a national exchange or the security’s primary trading market is temporarily closed at a time when, under normal conditions, it would be open. As a general principle, the current “fair value” of a security would be the amount which the owner might reasonably expect to receive from the sale on the applicable exchange or principal market. A variety of factors may be considered in determining the fair value of such securities.
B. Fair Value Measurements
Each Fund discloses the classification of its fair value measurements following a three-tier hierarchy based on the inputs used to measure fair value. Inputs refer broadly to the assumptions that market participants would use in pricing the asset or liability, including assumptions about risk. Inputs may be observable or unobservable. Observable inputs reflect the assumptions market participants would use in pricing the asset or liability that are developed based on market data obtained from sources independent of the reporting entity. Unobservable inputs reflect the reporting entity’s own assumptions about the assumptions market participants would use in pricing the asset or liability that are developed based on the best information available.
Valuation techniques used to value the Funds’ investments by major category are as follows:
Equity securities, including restricted securities, for which market quotations are readily available, are valued at the last reported sale price or official closing price as reported by a third party pricing vendor on the primary market or exchange on which they are traded and are categorized as Level 1 in the hierarchy. In the event there were no sales during the day or closing prices are not available, securities are valued at the mean of the most recent quoted bid and ask prices on such day and are generally categorized as Level 2 in the hierarchy. Investments in open-end mutual funds are valued at their closing NAV each business day and are categorized as Level 1 in the hierarchy.
Changes in valuation techniques may result in transfers in or out of an assigned level within the disclosure hierarchy.
Various inputs are used in determining the value of each Fund’s investments as of the end of the reporting period. When inputs used fall into different levels of the fair value hierarchy, the level in the hierarchy within which the fair value measurement falls is determined based on the lowest level input that is significant to the fair value measurement in its entirety. The designated input levels are not necessarily an indication of the risk or liquidity associated with these investments.
These inputs are categorized in the following hierarchy under applicable financial accounting standards:
| | |
| Level 1 – | | Unadjusted quoted prices in active markets for identical investments, unrestricted assets or liabilities that a Fund has the ability to access at the measurement date; |
| Level 2 – | | Quoted prices which are not active, quoted prices for similar assets or liabilities in active markets or inputs other than quoted prices that are observable (either directly or indirectly) for substantially the full term of the asset or liability; and |
| Level 3 – | | Significant unobservable prices or inputs (including the Fund’s own assumptions in determining the fair value of investments) where there is little or no market activity for the asset or liability at the measurement date. |
The following is a summary of the inputs used to value the Funds’ investments at November 30, 2015:
ALPS Sector Dividend Dogs ETF
| | | | | | | | | | | | | | | | |
| | | | | | Level 2 - Other | | | Level 3 - Significant | | | | |
| | | Level 1 - Unadjusted | | | Significant | | | Unobservable | | | | |
| Investments in Securities at Value* | | Quoted Prices | | | Observable Inputs | | | Inputs | | | Total | |
Common Stocks | | $ | 1,006,859,316 | | | $ | – | | | $ | – | | | $ | 1,006,859,316 | |
Short Term Investments | | | 4,497,980 | | | | – | | | | – | | | | 4,497,980 | |
TOTAL | | $ | 1,011,357,296 | | | $ | – | | | $ | – | | | $ | 1,011,357,296 | |
| | | | | | | | | | | | | | | | | |
41 | November 30, 2015
| | |
ALPS Sector Series | | |
| Notes to Financial Statements | | November 30, 2015 |
ALPS International Sector Dividend Dogs ETF
| | | | | | | | | | | | | | | | |
| | | Level 1 - | | | Level 2 - Other | | | Level 3 - Significant | | | | |
| | | Unadjusted Quoted | | | Significant | | | Unobservable | | | | |
| Investments in Securities at Value* | | Prices | | | Observable Inputs | | | Inputs | | | Total | |
Common Stocks | | $ | 134,234,102 | | | $ | – | | | $ | – | | | $ | 134,234,102 | |
Short Term Investments | | | 535,116 | | | | – | | | | – | | | | 535,116 | |
TOTAL | | $ | 134,769,218 | | | $ | – | | | $ | – | | | $ | 134,769,218 | |
| | | | | | | | | | | | | | | | | |
ALPS Emerging Sector Dividend Dogs ETF
| | | | | | | | | | | | | | | | |
| | | Level 1 - | | | Level 2 - Other | | | Level 3 - Significant | | | | |
| | | Unadjusted Quoted | | | Significant | | | Unobservable | | | | |
| Investments in Securities at Value* | | Prices | | | Observable Inputs | | | Inputs | | | Total | |
Common Stocks | | $ | 9,343,698 | | | $ | – | | | $ | – | | | $ | 9,343,698 | |
Short Term Investments | | | 6,674 | | | | – | | | | – | | | | 6,674 | |
TOTAL | | $ | 9,350,372 | | | $ | – | | | $ | – | | | $ | 9,350,372 | |
| | | | | | | | | | | | | | | | | |
ALPS Sector Leaders ETF
| | | | | | | | | | | | | | | | |
| | | Level 1 - | | | Level 2 - Other | | | Level 3 - Significant | | | | |
| | | Unadjusted Quoted | | | Significant | | | Unobservable | | | | |
| Investments in Securities at Value* | | Prices | | | Observable Inputs | | | Inputs | | | Total | |
Common Stocks | | $ | 1,220,694 | | | $ | – | | | $ | – | | | $ | 1,220,694 | |
Short Term Investments | | | 369 | | | | – | | | | – | | | | 369 | |
TOTAL | | $ | 1,221,063 | | | $ | – | | | $ | – | | | $ | 1,221,063 | |
| | | | | | | | | | | | | | | | | |
ALPS Sector Low Volatility ETF
| | | | | | | | | | | | | | | | |
| | | Level 1 - | | | Level 2 - Other | | | Level 3 - Significant | | | | |
| | | Unadjusted Quoted | | | Significant | | | Unobservable | | | | |
| Investments in Securities at Value* | | Prices | | | Observable Inputs | | | Inputs | | | Total | |
Common Stocks | | $ | 1,281,515 | | | $ | – | | | $ | – | | | $ | 1,281,515 | |
Short Term Investments | | | 4,258 | | | | – | | | | – | | | | 4,258 | |
TOTAL | | $ | 1,285,773 | | | $ | – | | | $ | – | | | $ | 1,285,773 | |
| | | | | | | | | | | | | | | | | |
| * | For a detailed sector/country breakdown, see the accompanying Schedule of Investments. |
The Funds recognize transfers between levels as of the end of the period. For the year or period ended November 30, 2015, the Funds did not have any transfers between Level 1 and Level 2 securities. The Funds did not have any securities which used significant unobservable inputs (Level 3) in determining fair value.
C. Foreign Securities
The ALPS International Sector Dividend Dogs ETF and the ALPS Emerging Sector Dividend Dogs ETF may directly purchase securities of foreign issuers. Investments in non- U.S. issuers may involve unique risks compared to investing in securities of U.S. issuers, including, among others, greater market volatility than U.S. securities and less complete financial information than for U.S. issuers. In addition, adverse political, economic or social developments could undermine the value of the Fund’s investments or prevent the Fund from realizing the full value of its investments. Financial reporting standards for companies based in foreign markets differ from those in the United States. Finally, the value of the currency of the country in which the Fund has invested could decline relative to the value of the U.S. dollar, which may affect the value of the investment to U.S. investors.
Because foreign markets may be open on different days than the days during which investors may purchase the shares of each Fund, the value of each Fund’s securities may change on the days when investors are not able to purchase the shares of the Funds. The value of securities
42 | November 30, 2015
| | |
ALPS Sector Series | | |
| Notes to Financial Statements | | November 30, 2015 |
denominated in foreign currencies is converted into U.S. dollars using exchange rates determined daily as of the close of regular trading on the NYSE or NASDAQ. Any use of a different rate from the rates used by the Index may adversely affect a Fund’s ability to track their Index.
D. Foreign Currency Translation
The books and records of the Funds are maintained in U.S. dollars. Investment valuations and other assets and liabilities initially expressed in foreign currencies are converted each business day into U.S. dollars based upon current exchange rates. The portion of realized and unrealized gains or losses on investments due to fluctuations in foreign currency exchange rates is not separately disclosed and is included in realized and unrealized gains or losses on investments, when applicable.
E. Securities Transactions and Investment Income
Securities transactions are recorded as of the trade date. Realized gains and losses from securities transactions are recorded on the highest cost basis. Dividend income and capital gains distributions, if any, are recorded on the ex-dividend date, net of any foreign taxes withheld. Interest income, if any, is recorded on the accrual basis, including any amortization of premiums and accretion of discounts.
F. Dividends and Distributions to Shareholders
Dividends from net investment income for each Fund, if any, are declared and paid quarterly or as the Board may determine from time to time. Distributions of net realized capital gains earned by the Funds, if any, are distributed at least annually.
G. Equalization
The ALPS Sector Dividend Dogs ETF, the ALPS International Sector Dividend Dogs ETF and the ALPS Emerging Sector Dividend Dogs ETF utilize the accounting practice known as “Equalization” by which a portion of the proceeds from sales and costs of reacquiring the Funds’ shares, equivalent on a per share basis to the amount of distributable net investment income on the date of the transaction, is credited or charged to undistributed net investment income. As a result, undistributed net investment income per share is unaffected by sales or reacquisitions of the Funds’ shares. Amounts related to Equalization can be found on the Statement of Changes in Net Assets.
H. Federal Tax and Tax Basis Information
The timing and character of income and capital gain distributions are determined in accordance with income tax regulations, which may differ from U.S. GAAP. Reclassifications are made to the Fund’s capital accounts for permanent tax differences to reflect income and gains available for distribution (or available capital loss carryforwards) under income tax regulations.
For the year or period ended November 30, 2015, the following reclassifications, which had no impact on results of operations or net assets, were recorded to reflect permanent tax differences resulting primarily from in-kind transactions:
| | | | | | | | | | | | |
| | | | | | Accumulated Net | | | Accumulated Net Realized | |
| Fund | | Paid-in Capital | | | Investment Loss | | | Gain/(Loss) on Investments | |
ALPS Sector Dividend Dogs ETF | | $ | 80,938,953 | | | $ | – | | | $ | (80,938,953) | |
ALPS International Sector Dividend Dogs ETF | | | (135,467) | | | | (247,870) | | | | 383,337 | |
ALPS Emerging Sector Dividend Dogs ETF | | | (39,556) | | | | (22,897) | | | | 62,453 | |
ALPS Sector Leaders ETF | | | (36,439) | | | | – | | | | 36,439 | |
ALPS Sector Low Volatility ETF | | | (7,361) | | | | – | | | | 7,361 | |
The tax character of the distributions paid during the years or periods ended November 30, 2015 and November 30, 2014 was as follows:
| | | | | | | | |
| | | Ordinary Income | | | Return of Capital | |
November 30, 2015 | | | | | | | | |
ALPS Sector Dividend Dogs ETF | | $ | 39,961,342 | | | $ | – | |
ALPS International Sector Dividend Dogs ETF | | | 6,203,669 | | | | 115,516 | |
ALPS Emerging Sector Dividend Dogs ETF | | | 433,154 | | | | – | |
ALPS Sector Leaders ETF | | | 6,352 | | | | – | |
ALPS Sector Low Volatility ETF | | | 12,924 | | | | – | |
November 30, 2014 | | | | | | | | |
ALPS Sector Dividend Dogs ETF | | | 22,702,657 | | | | – | |
ALPS International Sector Dividend Dogs ETF | | | 5,101,215 | | | | 311,911 | |
ALPS Emerging Sector Dividend Dogs ETF | | | 121,633 | | | | 27,627 | |
43 | November 30, 2015
| | |
ALPS Sector Series | | |
| Notes to Financial Statements | | November 30, 2015 |
At November 30, 2015, capital losses deferred to the next tax year were as follows:
| | | | | | | | |
| | | Short-Term | | | Long-Term | |
ALPS Sector Dividend Dogs ETF | | $ | 5,118,833 | | | $ | 1,849,067 | |
ALPS International Sector Dividend Dogs ETF | | | 10,191,620 | | | | 2,294,109 | |
ALPS Emerging Sector Dividend Dogs ETF | | | 125,102 | | | | 70,778 | |
ALPS Sector Leaders ETF | | | 46,490 | | | | – | |
ALPS Sector Low Volatility ETF | | | 12,281 | | | | – | |
As of the year ended November 30, 2015, the ALPS Sector Dividend Dogs ETF utilized capital loss carryovers of $1,826,323.
As of November 30, 2015, the components of distributable earnings on a tax basis for the Funds were as follows:
| | | | | | | | | | | | | | | | |
| | | | | | | | | Net unrealized | | | | |
| | | | | | Accumulated net | | | appreciation/ | | | | |
| | | Undistributed net | | | realized loss on | | | (depreciation) on | | | | |
| | | investment income | | | investments | | | investments | | | Total | |
ALPS Sector Dividend Dogs ETF | | $ | 714,281 | | | $ | (6,967,900) | | | $ | (49,745,676) | | | $ | (55,999,295) | |
ALPS International Sector Dividend Dogs ETF | | | – | | | | (12,485,729) | | | | (20,606,912) | | | | (33,092,641) | |
ALPS Emerging Sector Dividend Dogs ETF | | | 134,699 | | | | (195,880) | | | | (2,478,505) | | | | (2,539,686) | |
ALPS Sector Leaders ETF | | | 1,098 | | | | (46,490) | | | | (20,809) | | | | (66,201) | |
ALPS Sector Low Volatility ETF | | | 6,188 | | | | (12,281) | | | | 33,135 | | | | 27,042 | |
As of November 30, 2015, the costs of investments for federal income tax purposes and accumulated net unrealized appreciation/(depreciation) on investments were as follows:
| | | | | | | | | | | | | | | | | | | | |
| | | Gross
Appreciation
(excess of value
over tax cost) | | | Gross Depreciation
(excess of tax cost
over value) | | | Net
Appreciation/
(Depreciation)
of Foreign
Currency | | | Net
Unrealized
Appreciation/
(Depreciation) | | | Cost of
Investments for
Income Tax
Purposes | |
ALPS Sector Dividend Dogs ETF | | $ | 74,285,246 | | | $ | (124,030,922) | | | $ | – | | | $ | (49,745,676) | | | $ | 1,061,102,972 | |
ALPS International Sector Dividend Dogs ETF | | | 5,441,141 | | | | (25,981,842) | | | | (66,211) | | | | (20,606,912) | | | | 155,309,919 | |
ALPS Emerging Sector Dividend Dogs ETF | | | 720,847 | | | | (3,199,207) | | | | (145) | | | | (2,478,505) | | | | 11,828,732 | |
ALPS Sector Leaders ETF | | | 62,559 | | | | (83,368) | | | | – | | | | (20,809) | | | | 1,241,872 | |
ALPS Sector Low Volatility ETF | | | 72,163 | | | | (39,028) | | | | – | | | | 33,135 | | | | 1,252,638 | |
The differences between book-basis and tax-basis are primarily due to the deferral of losses from wash sales.
I. Income Taxes
No provision for income taxes is included in the accompanying financial statements, as each Fund intends to distribute to shareholders all taxable investment income and realized gains and otherwise comply with Subchapter M of the Internal Revenue Code of 1986, as amended, applicable to regulated investment companies. Each Fund evaluates tax positions taken (or expected to be taken) in the course of preparing the Fund’s tax returns to determine whether these positions meet a “more-likely-than-not” standard that, based on the technical merits, have a more than fifty percent likelihood of being sustained by a taxing authority upon examination. A tax position that meets the “more-likely-than-not” recognition threshold is measured to determine the amount of benefit to recognize in the financial statements.
As of and during the year or period ended November 30, 2015, each Fund did not have a liability for any unrecognized tax benefits. Each Fund files U.S. federal, state, and local tax returns as required. Each Fund’s tax returns are subject to examination by the relevant tax authorities until expiration of the applicable statute of limitations which is generally three years after the filing of the tax return, but may extend to four years in certain jurisdictions. Each Fund’s tax returns for open years have incorporated no uncertain tax positions that require a provision for income taxes. Being that the ALPS Sector Leaders ETF and the ALPS Sector Low Volatility ETF commenced operations on July 1, 2015, no tax returns have been filed as of the date of this report.
44 | November 30, 2015
| | |
ALPS Sector Series | | |
| Notes to Financial Statements | | November 30, 2015 |
3. INVESTMENT ADVISORY FEE AND OTHER AFFILIATED TRANSACTIONS
ALPS Advisors, Inc. (the “Adviser”) acts as the Funds’ investment adviser pursuant to advisory agreements with the Trust on behalf of each Fund (the “Advisory Agreement”). Pursuant to the Advisory Agreement, each Fund pays the Adviser a unitary fee for the services and facilities it provides, payable on a monthly basis as a percentage of each Fund’s average daily net assets as set out below. From time to time, the Adviser may waive all or a portion of its fee.
| | |
| Fund | | Advisory Fee |
ALPS Sector Dividend Dogs ETF | | 0.40% |
ALPS International Sector Dividend Dogs ETF | | 0.50% |
ALPS Emerging Sector Dividend Dogs ETF | | 0.60% |
ALPS Sector Leaders ETF | | 0.40% |
ALPS Sector Low Volatility ETF | | 0.40% |
Out of the unitary management fee, the Adviser pays substantially all expenses of each Fund, including the cost of transfer agency, custody, fund administration, legal, audit, independent trustees and other services, except for interest expenses, distribution fees or expenses, brokerage expenses, taxes and extraordinary expenses not incurred in the ordinary course of each Fund’s business. The Adviser’s unitary management fee is designed to pay substantially all of each Fund’s expenses and to compensate the Adviser for providing services for each Fund.
ALPS Fund Services, Inc., an affiliate of the Adviser, is the administrator for the Funds.
Each Trustee who is not an officer or employee of the Adviser, any sub-adviser or any of their affiliates (“Independent Trustees”) receives (1) a quarterly retainer of $5,000, (2) a per meeting fee for regularly scheduled meetings of $3,750, (3) $1,500 for any special meeting held outside of a regularly scheduled board meeting, and (4) reimbursement for all reasonable out-of-pocket expenses relating to attendance at meetings.
4. PURCHASES AND SALES OF SECURITIES
For the year or period ended November 30, 2015, the cost of purchases and proceeds from sales of investment securities, excluding short-term investments and in-kind transactions, were as follows:
| | | | | | | | |
| Fund | | Purchases | | | Sales | |
ALPS Sector Dividend Dogs ETF | | $ | 641,107,590 | | | $ | 613,006,363 | |
ALPS International Sector Dividend Dogs ETF | | | 105,172,638 | | | | 105,905,233 | |
ALPS Emerging Sector Dividend Dogs ETF | | | 10,992,476 | | | | 10,462,567 | |
ALPS Sector Leaders ETF | | | 3,112,463 | | | | 602,297 | |
ALPS Sector Low Volatility ETF | | | 3,185,477 | | | | 682,884 | |
For the year or period ended November 30, 2015, the cost of in-kind purchases and proceeds from in-kind sales were as follows:
| | | | | | | | |
| Fund | | Purchases | | | Sales | |
ALPS Sector Dividend Dogs ETF | | $ | 593,519,507 | | | $ | 547,763,976 | |
ALPS International Sector Dividend Dogs ETF | | | 45,367,266 | | | | 32,447,722 | |
ALPS Emerging Sector Dividend Dogs ETF | | | 1,908,195 | | | | 877,506 | |
ALPS Sector Leaders ETF | | | – | | | | 1,185,311 | |
ALPS Sector Low Volatility ETF | | | – | | | | 1,234,571 | |
For the year or period ended November 30, 2015, the in-kind net realized gains/(losses) were as follows:
| | | | |
| Fund | | Net Realized Gain/Loss | |
ALPS Sector Dividend Dogs ETF | | $ | 81,842,818 | |
ALPS International Sector Dividend Dogs ETF | | | 158,367 | |
ALPS Emerging Sector Dividend Dogs ETF | | | 17,633 | |
ALPS Sector Leaders ETF | | | (36,439) | |
ALPS Sector Low Volatility ETF | | | (6,380) | |
Gains on in-kind transactions are not considered taxable for federal income tax purposes.
45 | November 30, 2015
| | |
ALPS Sector Series | | |
| Notes to Financial Statements | | November 30, 2015 |
5. CAPITAL SHARE TRANSACTIONS
Shares are created and redeemed by each Fund only in Creation Unit size aggregations of 50,000. Only broker-dealers or large institutional investors with creation and redemption agreements called Authorized Participants (“AP”) are permitted to purchase or redeem Creation Units from the Funds. Such transactions are generally permitted on an in-kind basis, with a balancing cash component to equate the transaction to the NAV per unit of each Fund on the transaction date. Cash may be substituted equivalent to the value of certain securities generally when they are not available in sufficient quantity for delivery, not eligible for trading by the AP or as a result of other market circumstances.
46 | November 30, 2015
| | |
ALPS Sector Series | | |
| Additional Information | | November 30, 2015 (Unaudited) |
PROXY VOTING POLICIES AND PROCEDURES
Information regarding how the Fund voted proxies relating to portfolio securities during the most recent 12-month period ended June 30 and a description of the Fund’s proxy voting policies and procedures used in determining how to vote for proxies are available without charge on the Securities and Exchange Commission’s (“SEC”) website at www.sec.gov and upon request, by calling (toll-free) 1-866-675-2639.
PORTFOLIO HOLDINGS
The Trust is required to disclose, after its first and third fiscal quarters, the complete schedule of each Fund’s portfolio holdings with the SEC on Form N-Q. Form N-Q for each Fund will be available on the SEC’s website at www.sec.gov. Each Fund’s Form N-Q may also be reviewed and copied at the SEC’s Public Reference Room in Washington, D.C. and information on the operation of the Public Reference Room may be obtained by calling 1-800-SEC-0330. Each Fund’s Form N-Q will be available without charge, upon request, by calling (toll-free) 1-866-675-2639 or by writing to ALPS ETF Trust at 1290 Broadway, Suite 1100, Denver, Colorado 80203.
TAX INFORMATION (UNAUDITED)
The Funds designate the following for federal income tax purposes for distributions made during the calendar year ended December 31, 2014:
| | | | |
| | | | | Dividend Received |
| | | Qualified Dividend Income | | Deduction |
|
ALPS International Sector Dividend Dogs ETF | | 99.03% | | 0.00% |
ALPS Sector Dividend Dogs ETF | | 100.00% | | 98.21% |
ALPS Emerging Sector Dividend Dog ETF | | 70.84% | | 0.00% |
In early 2015, if applicable, shareholders of record received this information for the distributions paid to them by the Funds during the calendar year 2014 via Form 1099. The Funds will notify shareholders in early 2016 of amounts paid to them by the Funds, if any, during the calendar year 2015.
Pursuant to Section 853(c) of the Internal Revenue Code, the following Fund designated the following:
| | | | | | | | |
| | | Foreign Taxes Paid | | | Foreign Source Income | |
| |
ALPS Emerging Sector Dividend Dog ET | | $ | 47,075 | | | $ | 669,120 | |
ALPS International Sector Dividend Dogs ET | | $ | 429,022 | | | $ | 7,012,171 | |
LICENSING AGREEMENTS
ALPS Sector Leaders ETF and ALPS Sector Low Volatility ETF
The Funds are not sponsored, endorsed, sold or promoted by the Index Provider. The Index Provider makes no representation or warranty, express or implied, to the owners of each Fund or any member of the public regarding the advisability of investing in securities generally or in each Fund particularly or the ability of each Fund to track the performance of the physical commodities market. The Index Provider’s only relationship to the Adviser or each Fund is the licensing of certain service marks and trade names of the Index Provider and of each Underlying Index that is determined, composed and calculated by the Index Provider without regard to the Adviser or the Funds. The Index Provider has no obligation to take the needs of the Adviser or the Funds or the owners of each Fund into consideration in determining, composing or calculating each Underlying Index. The Index Provider is not responsible for and has not participated in the determination of the timing of, prices at, or quantities of each Fund to be issued or in the determination or calculation of the equation by which each Fund is to be converted into cash. The Index Provider has no obligation or liability in connection with the administration, marketing or trading of each Fund.
THE INDEX PROVIDER DOES NOT GUARANTEE THE ACCURACY AND/OR THE COMPLETENESS OF EACH UNDERLYING INDEX OR ANY DATA INCLUDED THEREIN AND THE INDEX PROVIDER SHALL HAVE NO LIABILITY FOR ANY ERRORS, OMISSIONS, OR INTERRUPTIONS THEREIN. THE INDEX PROVIDER MAKES NO WARRANTY, EXPRESS OR IMPLIED, AS TO RESULTS TO BE OBTAINED BY THE ADVISER, EACH FUND, OWNERS OF EACH FUND, OR ANY OTHER PERSON OR ENTITY FROM THE USE OF THE UNDERLYING INDEX OR ANY DATA INCLUDED THEREIN. THE INDEX PROVIDER MAKES NO EXPRESS OR IMPLIED WARRANTIES, AND EXPRESSLY DISCLAIMS ALL WARRANTIES OF MERCHANTABILITY OR FITNESS FOR A PARTICULAR PURPOSE OR USE WITH RESPECT TO EACH UNDERLYING INDEX OR ANY DATA INCLUDED THEREIN. WITHOUT LIMITING ANY OF THE FOREGOING, IN NO EVENT SHALL THE INDEX PROVIDER HAVE ANY LIABILITY FOR ANY SPECIAL, PUNITIVE, INDIRECT, OR CONSEQUENTIAL DAMAGES (INCLUDING LOST PROFITS), EVEN IF NOTIFIED OF THE POSSIBILITY OF SUCH DAMAGES.
47 | November 30, 2015
| | |
ALPS Sector Series | | |
| Additional Information | | November 30, 2015 (Unaudited) |
The Funds are not sponsored, endorsed, sold or promoted by Standard & Poor’s, a division of The McGraw-Hill Companies, Inc. (“S&P”) or its third party licensors. Neither S&P nor its third party licensors make any representation or warranty, express or implied, to the owners of each Fund or any member of the public regarding the advisability of investing in securities generally or in each Fund particularly or the ability of each Underlying Index to track general stock market performance. S&P’s and its third party licensor’s only relationship to the Index Provider is the licensing of certain trademarks, service marks and trade names of S&P and/or its third party licensors and for the providing of calculation and maintenance services related to the Underlying Index. Neither S&P nor its third party licensors is responsible for and has not participated in the determination of the prices and amount of each Fund or the timing of the issuance or sale of each Fund or in the determination or calculation of the equation by which each Fund is to be converted into cash. S&P has no obligation or liability in connection with the administration, marketing or trading of each Fund.
NEITHER S&P, ITS AFFILIATES NOR THEIR THIRD PARTY LICENSORS GUARANTEE THE ADEQUACY, ACCURACY, TIMELINESS OR COMPLETENESS OF EACH UNDERLYING INDEX OR ANY DATA INCLUDED THEREIN OR ANY COMMUNICATIONS, INCLUDING BUT NOT LIMITED TO, ORAL OR WRITTEN COMMUNICATIONS (INCLUDING ELECTRONIC COMMUNICATIONS) WITH RESPECT THERETO. S&P, ITS AFFILIATES AND THEIR THIRD PARTY LICENSORS SHALL NOT BE SUBJECT TO ANY DAMAGES OR LIABILITY FOR ANY ERRORS, OMISSIONS OR DELAYS THEREIN. S&P MAKES NO EXPRESS OR IMPLIED WARRANTIES, AND EXPRESSLY DISCLAIMS ALL WARRANTIES OF MERCHANTABILITY OR FITNESS FOR A PARTICULAR PURPOSE OR USE WITH RESPECT TO ITS TRADEMARKS, EACH UNDERLYING INDEX OR ANY DATA INCLUDED THEREIN. WITHOUT LIMITING ANY OF THE FOREGOING, IN NO EVENT WHATSOEVER SHALL S&P, ITS AFFILIATES OR THEIR THIRD PARTY LICENSORS BE LIABLE FOR ANY INDIRECT, SPECIAL, INCIDENTAL, PUNITIVE OR CONSEQUENTIAL DAMAGES, INCLUDING BUT NOT LIMITED TO, LOSS OF PROFITS, TRADING LOSSES, LOST TIME OR GOODWILL, EVEN IF THEY HAVE BEEN ADVISED OF THE POSSIBILITY OF SUCH DAMAGES, WHETHER IN CONTRACT, TORT, STRICT LIABILITY OR OTHERWISE.
Standard & Poor’s® and S&P® are registered trademarks of The McGraw-Hill Companies, Inc.; “Calculated by S&P Custom Indices” and its related stylized mark are service marks of The McGraw-Hill Companies, Inc. These marks have been licensed for use by the Index Provider.
The S&P 500® is the property of Standard and Poor’s Financial Services LLC (“S&P”) and has been licensed by S&P for use by S-Network® Global Indexes, Inc. in connection with the S-Network® Sector Leaders Index (Ticker: SLDRX) and the S-Network®Sector Low Volatility Index (Ticker: SLOWX).
The Adviser does not guarantee the accuracy and/or the completeness of each Underlying Index or any data included therein, and the Adviser shall have no liability for any errors, omissions or interruptions therein. The Adviser makes no warranty, express or implied, as to results to be obtained by each Fund, owners of the Shares of each Fund or any other person or entity from the use of each Underlying Index or any data included therein. The Adviser makes no express or implied warranties, and expressly disclaims all warranties of merchantability or fitness for a particular purpose or use with respect to each Underlying Index or any data included therein. Without limiting any of the foregoing, in no event shall the Adviser have any liability for any special, punitive, direct, indirect or consequential damages (including lost profits) arising out of matters relating to the use of each Underlying Index, even if notified of the possibility of such damages.
ALPS Sector Dividend Dogs ETF, ALPS International Sector Dividend Dogs ETF, and ALPS Emerging Sector Dividend Dogs ETF
The Funds are not sponsored, endorsed, sold or promoted by the Index Provider. The Index Provider makes no representation or warranty, express or implied, to the owners of each Fund or any member of the public regarding the advisability of investing in securities generally or in each Fund particularly or the ability of each Fund to track the performance of the physical commodities market. The Index Provider’s only relationship to the Adviser or each Fund is the licensing of certain service marks and trade names of the Index Provider and of each Underlying Index that is determined, composed and calculated by the Index Provider without regard to the Adviser or the Funds. The Index Provider has no obligation to take the needs of the Adviser or the Funds or the owners of each Fund into consideration in determining, composing or calculating each Underlying Index. The Index Provider is not responsible for and has not participated in the determination of the timing of, prices at, or quantities of each Fund to be issued or in the determination or calculation of the equation by which each Fund is to be converted into cash. The Index Provider has no obligation or liability in connection with the administration, marketing or trading of each Fund.
THE INDEX PROVIDER DOES NOT GUARANTEE THE ACCURACY AND/OR THE COMPLETENESS OF EACH UNDERLYING INDEX OR ANY DATA INCLUDED THEREIN AND THE INDEX PROVIDER SHALL HAVE NO LIABILITY FOR ANY ERRORS, OMISSIONS, OR INTERRUPTIONS THEREIN. THE INDEX PROVIDER MAKES NO WARRANTY, EXPRESS OR IMPLIED, AS TO RESULTS TO BE OBTAINED BY THE ADVISER, EACH FUND, OWNERS OF EACH FUND, OR ANY OTHER PERSON OR ENTITY FROM THE USE OF THE UNDERLYING INDEX OR ANY DATA INCLUDED THEREIN. THE INDEX PROVIDER MAKES NO EXPRESS OR IMPLIED WARRANTIES, AND EXPRESSLY DISCLAIMS ALL WARRANTIES OF MERCHANTABILITY OR FITNESS FOR A PARTICULAR PURPOSE OR USE WITH RESPECT TO EACH UNDERLYING INDEX OR ANY DATA INCLUDED THEREIN. WITHOUT LIMITING ANY OF THE FOREGOING, IN NO EVENT SHALL THE INDEX PROVIDER HAVE ANY LIABILITY FOR ANY SPECIAL, PUNITIVE, INDIRECT, OR CONSEQUENTIAL DAMAGES (INCLUDING LOST PROFITS), EVEN IF NOTIFIED OF THE POSSIBILITY OF SUCH DAMAGES.
48 | November 30, 2015
| | |
ALPS Sector Series | | |
| Additional Information | | November 30, 2015 (Unaudited) |
The Funds are not sponsored, endorsed, sold or promoted by Standard & Poor’s, a division of The McGraw-Hill Companies, Inc. (“S&P”) or its third party licensors. Neither S&P nor its third party licensors make any representation or warranty, express or implied, to the owners of each Fund or any member of the public regarding the advisability of investing in securities generally or in each Fund particularly or the ability of each Underlying Index to track general stock market performance. S&P’s and its third party licensor’s only relationship to the Index Provider is the licensing of certain trademarks, service marks and trade names of S&P and/or its third party licensors and for the providing of calculation and maintenance services related to the Underlying Index. Neither S&P nor its third party licensors is responsible for and has not participated in the determination of the prices and amount of each Fund or the timing of the issuance or sale of each Fund or in the determination or calculation of the equation by which each Fund is to be converted into cash. S&P has no obligation or liability in connection with the administration, marketing or trading of each Fund.
NEITHER S&P, ITS AFFILIATES NOR THEIR THIRD PARTY LICENSORS GUARANTEE THE ADEQUACY, ACCURACY, TIMELINESS OR COMPLETENESS OF EACH UNDERLYING INDEX OR ANY DATA INCLUDED THEREIN OR ANY COMMUNICATIONS, INCLUDING BUT NOT LIMITED TO, ORAL OR WRITTEN COMMUNICATIONS (INCLUDING ELECTRONIC COMMUNICATIONS) WITH RESPECT THERETO. S&P, ITS AFFILIATES AND THEIR THIRD PARTY LICENSORS SHALL NOT BE SUBJECT TO ANY DAMAGES OR LIABILITY FOR ANY ERRORS, OMISSIONS OR DELAYS THEREIN. S&P MAKES NO EXPRESS OR IMPLIED WARRANTIES, AND EXPRESSLY DISCLAIMS ALL WARRANTIES OF MERCHANTABILITY OR FITNESS FOR A PARTICULAR PURPOSE OR USE WITH RESPECT TO ITS TRADEMARKS, EACH UNDERLYING INDEX OR ANY DATA INCLUDED THEREIN. WITHOUT LIMITING ANY OF THE FOREGOING, IN NO EVENT WHATSOEVER SHALL S&P, ITS AFFILIATES OR THEIR THIRD PARTY LICENSORS BE LIABLE FOR ANY INDIRECT, SPECIAL, INCIDENTAL, PUNITIVE OR CONSEQUENTIAL DAMAGES, INCLUDING BUT NOT LIMITED TO, LOSS OF PROFITS, TRADING LOSSES, LOST TIME OR GOODWILL, EVEN IF THEY HAVE BEEN ADVISED OF THE POSSIBILITY OF SUCH DAMAGES, WHETHER IN CONTRACT, TORT, STRICT LIABILITY OR OTHERWISE.
Standard & Poor’s® and S&P® are registered trademarks of The McGraw-Hill Companies, Inc.; “Calculated by S&P Custom Indices” and its related stylized mark are service marks of The McGraw-Hill Companies, Inc. These marks have been licensed for use by the Index Provider.
The S&P 500® is the property of Standard and Poor’s Financial Services LLC (“S&P”) and has been licensed by S&P for use by S-Network® Global Indexes, Inc. in connection with the S-Network® Sector Dividend Dogs Index (Ticker: SDOGX), the S-Network® Emerging Sector Dividend Dogs Index (Ticker: EDOGX), and the S-Network® International Sector Dividend Dogs Index (Ticker: IDOGX).
The Adviser does not guarantee the accuracy and/or the completeness of each Underlying Index or any data included therein, and the Adviser shall have no liability for any errors, omissions or interruptions therein. The Adviser makes no warranty, express or implied, as to results to be obtained by each Fund, owners of the Shares of each Fund or any other person or entity from the use of each Underlying Index or any data included therein. The Adviser makes no express or implied warranties, and expressly disclaims all warranties of merchantability or fitness for a particular purpose or use with respect to each Underlying Index or any data included therein. Without limiting any of the foregoing, in no event shall the Adviser have any liability for any special, punitive, direct, indirect or consequential damages (including lost profits) arising out of matters relating to the use of each Underlying Index, even if notified of the possibility of such damages.
49 | November 30, 2015
| | |
ALPS Sector Series | | |
| Board Considerations Regarding Approval of Investment Advisory Agreements | | November 30, 2015 (Unaudited) |
ALPS Sector Dividend Dogs ETF, ALPS International Sector Dividend Dogs ETF, and ALPS Emerging Sector Dividend Dogs ETF
At an in-person meeting held on June 8, 2015, the Board of Trustees of the Trust (the “Board” or the “Trustees”), including the Trustees who are not “interested persons” of the Trust within the meaning of the 1940 Act, as amended (the “Independent Trustees”), evaluated a proposal to approve the continuance of the Advisory Agreements between the Trust and ALPS Advisors, Inc. (the “Adviser”) with respect to each of the following funds, ALPS Sector Dividend Dogs ETF (“SDOG”), ALPS International Sector Dividend Dogs ETF (“IDOG”), and ALPS Emerging Sector Dividend Dogs ETF (“EDOG”) (each a “Fund” and collectively “the Funds”). The Independent Trustees also met separately to consider the Advisory Agreements.
In evaluating the Investment Advisory Agreements with respect to the Funds, the Trustees considered various factors, including (i) the nature, extent and quality of the services to be provided by the Adviser with respect to the applicable Fund under the Investment Advisory Agreements; (ii) the advisory fees and other expenses to be paid by the Fund compared to those of similar funds managed by other investment advisers; (iii) the costs of the services provided to the Fund by the Adviser and the profits realized by the Adviser and its affiliates from its relationship to the Fund; (iv) the extent which economies of scale would be realized if and as the assets of the Fund grow and whether fees reflect the economies of scale for the benefit of shareholders and (v) any additional benefits and other considerations.
With respect to the nature, extent and quality of the services to be provided by the Adviser under the Investment Advisory Agreements, the Trustees considered and reviewed information concerning the services to be provided under the Investment Advisory Agreements, the investment parameters of the index of each Fund, financial information regarding the Adviser and its parent company, information describing the Adviser’s current organization and the background and experience of the persons who would be responsible for the day-to-day management of the Funds.
The Trustees reviewed information on the performance of each Fund and its applicable benchmark. The Trustees also evaluated the correlation and tracking error between the underlying index and its corresponding Fund’s performance. Based on their review, the Trustees found that the nature and extent of services provided to each Fund under the Investment Advisory Agreements was appropriate and that the quality was satisfactory.
The Trustees noted that the advisory fees for each Fund were unitary fees pursuant to which the Adviser assumes all expenses of the Funds (including the cost of transfer agency, custody, fund administration, legal, audit and other services) other than the payments under the Advisory Agreement, brokerage expenses, taxes, interest, litigation expenses and other extraordinary expenses.
With respect to advisory fee rates, the Trustees noted that the advisory fee rate for each of the Funds is higher than the median of its Strategic Insight expense group. For EDOG, the advisory fee rate was slightly above the median of its Strategic Insight expense group. The Funds’ respective expense ratios, however, are (i) in the case of IDOG, at the median of its Strategic Insight expense group, (ii) in the case of SDOG and EDOG, slightly above the median.
Based on the foregoing, and the other information available to them, the Trustees concluded that the advisory fee rate for each of the Funds was reasonable under the circumstances and in light of the quality of the services provided.
The Trustees considered other benefits available to the Adviser because of its relationship with the Funds and concluded that the advisory fees were reasonable taking into account any such benefits.
The Trustees also considered with respect to each Fund the information provided by the Adviser about the costs and profitability of the Adviser with respect to each of the Funds. The Trustees reviewed and noted the relatively small sizes of the Funds (other than SDOG) and concluded that the Adviser was not realizing any economies of scale other than SDOG. With respect to SDOG, the Trustees considered the growth in assets and that the Fund may be achieving some economies of scale. They also noted that SDOG is still a relatively new product, which makes it difficult to quantify the potential variability in net assets and thus determine the sustainability of any potential economies of scale which may exist. The Trustees determined that they would continue to evaluate whether further economies of scale have been achieved on an ongoing basis.
In voting to renew each Investment Advisory Agreement, the Trustees concluded that the terms of each Investment Advisory Agreement are reasonable and fair in light of the services to be performed, the fees paid by certain other funds, expenses to be incurred and such other matters as the Trustees considered relevant in the exercise of their reasonable business judgment. The Trustees did not identify any single factor or group of factors as all important or controlling and considered all factors together.
50 | November 30, 2015
| | |
ALPS Sector Series | | |
| Board Considerations Regarding Approval of Investment Advisory Agreements | | November 30, 2015 (Unaudited) |
ALPS Sector Leaders ETF and ALPS Sector Low Volatility ETF
At an in-person meeting held on June 8, 2015, the Board of Trustees of the Trust (the “Board” or the “Trustees”), including the Trustees who are not “interested persons” of the Trust within the meaning of the 1940 Act, as amended (the “Independent Trustees”), evaluated a proposal to approve the Advisory Agreement between the Trust and ALPS Advisors, Inc. (the “Adviser”) with respect to the ALPS Sector Leaders ETF and the ALPS Sector Low Volatility ETF (the “New Series”). The Independent Trustees also met separately to consider the Advisory Agreement.
The Trustees discussed the Advisory Agreement with respect to each New Series. In evaluating the Advisory Agreement, the Trustees considered various factors, including (i) the nature, extent and quality of the services expected to be provided by the Adviser with respect to each New Series under the Advisory Agreement; (ii) the advisory fees and other expenses proposed to be paid by each New Series compared to those of similar funds managed by other investment advisers; (iii) the expected profitability to the Investment Adviser of its proposed advisory relationship with each New Series and reasonableness of compensation to the Adviser; (iv) the extent to which economies of scale would be realized if and as each New Series’ assets increase and whether the fee level in the New Series Advisory Agreement reflects these economies of scale; and (v) any additional benefits and other considerations.
With respect to the nature, extent and quality of the services to be provided by the Adviser under the Advisory Agreement, the Trustees considered and reviewed information concerning the services proposed to be provided under the Advisory Agreement, the proposed investment parameters of the index for each New Series, financial information regarding the Adviser, its parent company, information describing the Adviser’s current organizations and the background and experience of the persons who would be responsible for the day-to-day management of the New Series, the anticipated financial support of the New Series, and the nature and quality of services provided to other ETFS, open-end and closed-end funds by the Adviser. Based upon their review, the Trustees concluded that the Adviser was qualified to oversee the services to be provided by other service providers and that the services to be provided by the Adviser to each New Series are expected to be satisfactory.
For each New Series, with respect to the costs of services to be provided and profits to be realized by the Adviser, the Trustees considered the resources involved in managing the New Series as well as the fact that the Adviser agreed to pay all of the New Series’ expenses (except for interest expenses, distribution fees or expenses, brokerage expenses, taxes and extraordinary expenses such as litigation and other expenses not incurred in the ordinary course of the New Series’ business) out of the unitary advisory fee. Based on its review, the Trustees concluded that the expected profitability of each New Series to the Adviser was not unreasonable.
The Trustees also reviewed comparative fee and expense data provided by Strategic Insight regarding each New Series. With respect to each New Series, the Trustees noted the proposed advisory fee for services to be provided to the New Series by the Adviser was 0.40% of the New Series’ average daily net assets. The Trustees also considered that the advisory fee was a unitary one and that, as set forth above, the Adviser had agreed to pay all of the New Series’ expenses (except for interest expenses, marketing fees, distribution fees or expenses, brokerage expenses, taxes and extraordinary expenses such as litigation and other expenses not incurred in the ordinary course of the New Series’ business) out of the unitary fee. The Trustees considered that, taking into account the impact of the New Series’ unitary advisory fee, ALPS Sector Leaders ETF’s expense ratio was equal to the median of its Strategic Insight expense group and ALPS Sector Low Volatility ETF’s expense ratio was below the median of its Strategic Insight expense group. Based on the foregoing and the other information available to them, the Trustees concluded that the advisory fees for each New Series were reasonable under the circumstances and in light of the quality of services provided.
The Trustees also considered other benefits that may be realized by the Adviser from its relationships with the New Series and concluded that the advisory fees were reasonable taking into account such benefits.
The Trustees considered the extent to which economies of scale would be realized as a New Series grows and whether fee levels reflect a reasonable sharing of such economies of scale for the benefit of New Series investors. Because each New Series is newly organized, the Trustees reviewed each New Series’ proposed unitary advisory fee and anticipated expenses and determined to review economies of scale in the future when each New Series had attracted assets.
In voting to approve the Advisory Agreement for each New Series, the Trustees, concluded that the terms of each Advisory Agreement are reasonable and fair in light of the services to be performed, the fees paid by certain other funds, expenses to be incurred and such other matters as the Trustees considered relevant in the exercise of their reasonable business judgment. The Trustees did not identify any single factor or group of factors as all important or controlling and considered all factors together.
51 | November 30, 2015
| | |
ALPS Sector Series | | |
| Trustees & Officers | | November 30, 2015 (Unaudited) |
INDEPENDENT TRUSTEES
| | | | | | | | | | |
Name, Address
& Year of Birth* | | Position(s) Held with Trust | | Term of Office
and Length of
Time Served** | | Principal Occupation(s) During Past 5 Years | | Number of
Portfolios in Fund
Complex Overseen
by Trustees*** | | Other Directorships Held by Trustees |
| Mary K. Anstine, 1940 | | Trustee | | Since March 2008 | | Ms. Anstine was formerly an Executive Vice President of First Interstate Bank of Denver until 1994, President/Chief Executive Officer of HealthONE Alliance, Denver, Colorado, from 1994 to 2004, and has been retired since 2004. Ms. Anstine is also Trustee/Director of the following: AV Hunter Trust and Colorado Uplift Board. Ms. Anstine was formerly a Director of the Trust Bank of Colorado (later purchased and now known as Northern Trust Bank), HealthONE and Denver Area Council of the Boy Scouts of America and a member of the American Bankers Association Trust Executive Committee. | | 46 | | Ms. Anstine is a Trustee of ALPS Variable Investment Trust (9 funds); Financial Investors Trust (31 funds); Reaves Utility Income Fund; and Westcore Trust (12 funds). |
Jeremy W. Deems, 1976 | | Trustee | | Since March 2008 | | Mr. Deems is the Co-Founder, Chief Financial Officer of Green Alpha Advisors, LLC. Mr. Deems is Co-Portfolio Manager of the Shelton Green Alpha Fund. Prior to joining Green Alpha Advisors, Mr. Deems was CFO and Treasurer of Forward Management, LLC, ReFlow Management Co., LLC, ReFlow Fund, LLC, a private investment fund, and Sutton Place Management, LLC, an administrative services company. | | 46 | | Mr. Deems is a Trustee of ALPS Variable Investment Trust (9 funds); Financial Investors Trust (31 funds); Clough Funds Trust (1 fund);and Reaves Utility Income Fund. |
Rick A. Pederson, 1952 | | Trustee | | Since March 2008 | | Mr. Pederson is President, Foundation Properties, Inc. (a real estate investment management company), 1994 - present; Advisory Board Member, Bow River Capital Partners (private equity management), 2003 - present; Advisor, Pauls Corporation (real estate investment management and development), 2008 - present; Chairman, Ross Consulting Group (real estate consulting services) 1983-2013; Advisory Board, Neenan Company (construction services) 2002- present; Board Member, Prosci, Inc. (private business services), 2013-present; Board Member, Citywide Banks (Colorado community bank) 2014–present; Board member, Professional Pediatric Health Care (a Denver-based home nursing firm) 2014 – present; Director, National Western Stock Show (not-for-profit organization); Director, Biennial of the Americas (not-for- profit organization). | | 24 | | Mr. Pederson is Trustee of Westcore Trust (12 funds) and Principal Real Estate Income Fund (1 fund). |
| * | The business address of the Trustee is c/o ALPS Advisors, Inc., 1290 Broadway, Suite 1100, Denver, Colorado 80203. |
| ** | This is the period for which the Trustee began serving the Trust. Each Trustee serves an indefinite term, until his successor is elected. |
| *** | The Fund Complex includes all series of the Trust and any other investment companies for which ALPS Advisors, Inc. provides investment advisory services. |
The Statement of Additional Information includes additional information about the Fund’s Trustees and is available, without charge, upon request by calling (toll-free) 1-866-675-2639.
52 | November 30, 2015
| | |
ALPS Sector Series | | |
| Trustees & Officers | | November 30, 2015 (Unaudited) |
INTERESTED TRUSTEE
| | | | | | | | | | |
Name, Address and Year of
Birth of
Interested
Trustee* | | Position(s) Held
with Trust | | Term of Office
and Length of
Time Served** | | Principal Occupation(s) During Past 5 Years | | Number of
Portfolios in Fund
Complex Overseen
by Trustees*** | | Other Directorships Held by Trustees |
Thomas A. Carter, 1966 | | Trustee and President | | Since March 2008 | | Mr. Carter joined ALPS Fund Services, Inc. (“ALPS”) in 1994 and is currently President and Director of ALPS Advisors, Inc. (“AAI”), and ALPS Portfolio Solutions Distributor, Inc. (“APSD”) and Executive Vice President and Director of ALPS and ALPS Holdings, Inc. (“AHI”), and ALPS Distributors, Inc. (“ADI”). Because of his position with AHI, ALPS, ADI, APSD and AAI, Mr. Carter is deemed an affiliate of the Fund as defined under the 1940 Act. Before joining ALPS, Mr. Carter was with Deloitte & Touche LLP, where he worked with a diverse group of clients, primarily within the financial services industry. Mr. Carter is a Certified Public Accountant and received his Bachelor of Science in Accounting from the University of Colorado at Boulder. | | 34 | | Mr. Carter is a Trustee of ALPS Variable Investment Trust (9 funds) and Principal Real Estate Income Fund (1 fund) |
| * | The business address of the Trustee is c/o ALPS Advisors, Inc., 1290 Broadway, Suite 1100, Denver, Colorado 80203. |
| ** | This is the period for which the Trustee began serving the Trust. Each Trustee serves an indefinite term, until his successor is elected. |
| *** | The Fund Complex includes all series of the Trust and any other investment companies for which ALPS Advisors, Inc. provides investment advisory services. |
The Statement of Additional Information includes additional information about the Fund’s Trustees and is available, without charge, upon request by calling (toll-free) 1-866-675-2639.
53 | November 30, 2015
| | |
ALPS Sector Series | | |
| Trustees & Officers | | November 30, 2015 (Unaudited) |
OFFICERS
| | | | | | |
Name, Address
and Year of Birth of Officer* | | Position(s) Held
with Trust | | Length of Time
Served** | | Principal Occupation(s) During Past 5 Years |
| Erin D. Nelson, 1977 | | Chief Compliance Officer (“CCO”) | | Since
December 2015 | | Erin Nelson became Senior Vice-President and Chief Compliance Officer of ALPS Advisors, Inc. (“AAI”) on July 1, 2015 and prior to that served as Vice President and Deputy Chief Compliance Officer of AAI since January 1, 2015. Prior to January 1, 2015, Ms. Nelson was Vice-President and Assistant General Counsel of ALPS of Fund Services, Inc. Ms. Nelson joined AAI’s parent company, ALPS Holdings, Inc. in January 2003. Ms. Nelson currently is also the Chief Compliance Officer of Principal Real Estate Income Fund, and as of December 2015, the Chief Compliance Officer of Liberty All-Star Equity Fund, Liberty All-Star Growth Fund, Inc., RiverNorth Opportunities Fund, Inc. |
Patrick D. Buchanan, 1972 | | Treasurer | | Since
June 2012 | | Mr. Buchanan is Vice President of AAI. Mr. Buchanan joined ALPS in 2007 and because of his position with AAI, he is deemed an affiliate of the Trust as defined under the 1940 Act. Mr. Buchanan is also Treasurer of the ALPS Variable Insurance Trust, Clough Funds Trust and Principal Real Estate Income Fund. |
William Parmentier, 1952 | | Vice President | | Since
March 2008 | | Mr. Parmentier is Chief Investment Officer, AAI (since 2006); President and Chief Executive Officer of the Liberty All-Star Funds (since April 1999); Senior Vice President (2005-2006), Banc of America Investment Advisors, Inc. Because of his position with AAI, Mr. Parmentier is deemed an affiliate of the Trust as defined under the 1940 Act. |
| Abigail J. Murray, 1975 | | Secretary | | Since
June 2015 | | Ms. Murray joined ALPS in April 2015. She is currently Vice President and Senior Counsel of ALPS. Prior to joining ALPS, Ms. Murray was an Attorney and Managing Member at Murray & Rouvina PLC from 2014 to 2015 and an Associate with Vedder Price P.C. from 2007 to 2014. Because of her position with ALPS, Ms. Murray is deemed an affiliate of the Trust as defined under the 1940 Act. Ms. Murray is also the Secretary of The Caldwell & Orkin Funds, Inc., Clough Global Opportunities Fund, Clough Global Allocation Fund, Clough Global Equity Fund and Clough Funds Trust. |
| Jennifer A. Craig, 1973 | | Assistant Secretary | | Since
October 2013 | | Ms. Craig joined ALPS in 2007 and is currently Assistant Vice President and Paralegal Manager. Prior to joining ALPS, Ms. Craig was Legal Manager at Janus Capital Management LLC and served as Assistant Secretary of Janus Investment Fund, Janus Adviser Series and Janus Aspen Series. Because of her position with ALPS, Ms. Craig is deemed an affiliate of the Trust as defined under the 1940 Act. |
| * | The business address of the Officer is c/o ALPS Advisors, Inc., 1290 Broadway, Suite 1100, Denver, Colorado 80203. |
| ** | This is the period for which the Officer began serving the Trust. Each Officer serves an indefinite term, until his successor is elected. |
54 | November 30, 2015
Intentionally Left Blank

table of
CONTENTS
www.alpsfunds.com
| | |
Cohen & Steers Global Realty Majors ETF |
| |
| Performance Overview | | November 30, 2015 (Unaudited) |
Investment Objective
The Cohen & Steers Global Realty Majors ETF (the “Fund”) seeks investment results that correspond generally to the performance, before the Fund’s fees and expenses, of an index called the Cohen & Steers Global Realty Majors Index (the “Underlying Index”). The Fund will normally invest at least 90% of its total assets in common stocks and other equity securities (which may include American Depositary Receipts (“ADRs”), American Depositary Shares (“ADSs”) and Global Depositary Receipts (“GDRs”)) that comprise the Underlying Index. The Shares of the Fund are listed and trade on the NYSE Arca under the ticker symbol “GRI”.
The Underlying Index consists of the largest and most liquid securities within the global real estate universe that Cohen & Steers Capital Management, Inc. (“Cohen & Steers” or the “Index Provider”) believes are likely to lead the global securitization of real estate. The Underlying Index is free float and modified market-capitalization weighted, with a limit of 4.0% on any security’s weighting. Underlying Index constituents must have a free float adjusted market capitalization of $750 million or greater for initial inclusion in the Underlying Index. Cohen & Steers considers country weights relative to each country’s GDP share representing the real estate securities universe and share of the private market for real estate, with up to 10% being allocated to securities of emerging markets. The Underlying Index is rebalanced quarterly.
Performance Overview
For the year ended November 30, 2015, the Fund’s market price decreased -0.11% and the Fund’s net asset value (NAV) decreased -0.38%.
Global real estate stocks had an overall modestly positive total return for the 12-month period ended November 30, 2015. However, the group encountered turmoil in the middle of the period, along with stocks broadly, as investors reacted to anticipated rate hikes in the U.S., signs of decelerating economies, including slowing growth in China, and falling commodity prices. Uncertainty about China’s growth path had a disproportionate impact on Asia Pacific real estate markets, which underperformed the U.S. and Europe.
In the U.S. (3.1% total return), REITs outperformed the broader U.S. market, aided by continued strength in real estate fundamentals. Throughout the year, REITs generally exceeded or met the market’s high earnings expectations, and many raised their guidance. Meanwhile, acquisition activity continued to confirm high property valuation levels, also helping REIT shares to recover from their mid-year lows.
Returns varied widely by property type. Self storage REITs, which have a strong domestic focus, were a positive standout. Demand for self storage has continued to outstrip very limited new supply, driving strong same-store sales growth for these companies. Apartment owners also fared well, overcoming concerns about rising supply as household formation continued to support demand. Hotels were the poorest-performing sector. The group struggled amid moderating economic growth in the U.S. and abroad, with a strong dollar also dampening demand due to slowing tourism.
Health care property REITs also underperformed. As health care companies have generally transitioned toward more economically sensitive business models over the past few years—no longer pure net-lease plays—their growth prospects have faced increased scrutiny. Office landlords had a flat return; some investors were concerned that property values in cities such as New York could be adversely affected by less investment demand from non-U.S. sources.
Europe Broadly Advanced
European real estate securities had sizable returns for the year in local currencies, overcoming periodic market turmoil. The group was lifted early on by improving economic data and the European Central Bank’s (ECB) decision to launch quantitative easing (QE). Other central banks, within Europe and elsewhere, announced new easing measures of their own. Following a difficult August, when China worries spiked to rattle stocks around the world, European markets regained their footing as the ECB reiterated its desire to lift regional economic growth and inflation, suggesting yet more QE.
France (18.0%) and the Netherlands (11.5%) mostly held on to gains generated early in the period. With weak economies, these countries’ real estate companies stand to benefit from increases in occupancies and rents from relatively low bases as their recoveries take hold longer term.
Germany (30.9%) also saw generally improving economic data. The market saw takeover activity in the apartment sector, where fundamentals have benefited from healthy employment and rent growth. Residential landlord Deutsche Wohnen, which is being targeted for acquisition by its larger competitor, Vonovia, had a sizable gain.
The U.K. (14.0%), while not a direct beneficiary of the ECB’s actions, continued to exhibit healthy economic growth that drove rents and capital
values higher, with London office companies experiencing the strongest growth in decades. Mid-cap companies generally were the best performers, including self storage landlords Big Yellow and Safestore Holdings and student housing company Unite.
China Worries Weighed on Hong Kong
Hong Kong (–11.9%) performed poorly amid concerns about slower growth, rate hikes in the U.S., and currency depreciation in China. However, fundamentals in the office sector were generally healthy, reflected in a vacancy rate that fell to 2.8%, its lowest level since 2011. Office landlord Hongkong Land Holdings was one of the market’s few positive performers for the year.
1 | November 30, 2015
| | |
Cohen & Steers Global Realty Majors ETF |
| |
| Performance Overview | | November 30, 2015 (Unaudited) |
Hong Kong retail companies were hindered as tourist spending lost some momentum, with the slowdown most apparent among mainland Chinese visitors. Residential prices rose in the first half of the year, but dropped in late 2015 on concerns related to a weakening economy and rising interest rates. China property stocks performed better than their Hong Kong peers, reflecting the Chinese government’s support of the housing market.
Performance in Singapore (–7.9%) likewise reflected vulnerability to slowing growth in China as well as other regional emerging markets with which Singapore trades. Weakness in regional currencies, including Singapore’s dollar, was another concern. Among landlords, office and hospitality-exposed names struggled as fundamentals continued to soften in Singapore.
Although Australia (15.0%) also has meaningful economic ties to China, its real estate stocks fared much better than export-oriented companies such as miners. The market was initially aided by interest-rate cuts by the country’s central bank, which brought rates down to a record low of 2.0% in May, and then maintained a soft easing bias through the rest of the year.
In Japan (–2.0%) a mix of economic data pointed to slower growth, while consumer inflation turned negative, largely due to lower energy prices. Developers struggled in this environment, despite vacancy in Tokyo’s office market falling to its lowest level in seven years. J-REITs held up relatively well, aided by lower Japanese sovereign yields and their defensive nature in a period of elevated risk.
Performance (as of November 30, 2015)
| | | | | | | | |
| | | 1 Year | | 3 Year | | 5 Year | | Since Inception^ |
Cohen & Steers Global Realty Majors ETF - NAV | | -0.38% | | 6.52% | | 8.59% | | 1.92% |
Cohen & Steers Global Realty Majors ETF - Market Price* | | -0.11% | | 6.56% | | 8.52% | | 1.93% |
Cohen & Steers Global Realty Majors Index | | 0.28% | | 7.30% | | 9.40% | | 2.74% |
FTSE EPRA/ NAREIT Developed Real Estate Index | | -0.42% | | 7.59% | | 9.09% | | 2.80% |
S&P 500® Total Return Index | | 2.75% | | 16.09% | | 14.40% | | 7.78% |
Total Expense Ratio (per the current Prospectus) 0.55%
Performance data quoted represents past performance. Past performance does not guarantee future results. Investment return and principal value of an investment will fluctuate so that an investor’s shares, when sold or redeemed, may be worth more or less than the original cost. Current performance data may be higher or lower than actual data quoted. For the most current month-end performance data please visit www.alpsfunds.com or call 1.866.513.5856.
NAV is an exchange-traded fund’s per-share value. The per-share dollar amount of the fund is derived by dividing the total value of all the securities in its portfolio, less any liabilities, by the number of fund shares outstanding. Market Price is the price at which a share can currently be traded in the market. Information detailing the number of days the Market Price of the Fund was greater than the Fund’s NAV and the number of days it was less than the Fund’s NAV can be obtained at www.alpsfunds.com.
| ^ | Fund Inception May 7, 2008. |
| * | Market Price is based on the midpoint of the bid/ask spread at 4p.m. ET and does not represent the returns an investor would receive if shares were traded at other times. |
Cohen & Steers Global Realty Majors® Index: A free-float adjusted, modified market capitalization-weighted index of global real estate equities. The modified market capitalization weighting approach and qualitative screening process emphasize those companies that, in the opinion of the Cohen & Steers investment committee, are leading the securitization of real estate globally.
FTSE EPRA/NAREIT Developed Real Estate Index: An unmanaged market-weighted total return index that consists of many companies from developed markets whose floats are larger than $100 million and which derive more than half of their revenue from property-related activities.
S&P 500® Total Return Index: The Standard & Poor’s composite index of 500 stocks, a widely recognized, unmanaged index of common stock prices.
Total return assumes reinvestment of any dividends and distributions realized during a given time period.
One cannot invest directly in an index. Index performance does not reflect fund performance.
The Cohen & Steers Global Realty Majors ETF is not suitable for all investors. Subject to investment risks, including possible loss of the principal amount invested.
ALPS Portfolio Solutions Distributor, Inc. is the Distributor for the Cohen & Steers Global Realty Majors ETF.
ALPS Portfolio Solutions Distributor, Inc. is not affiliated with Cohen & Steers.
2 | November 30, 2015
| | |
Cohen & Steers Global Realty Majors ETF |
| |
| Performance Overview | | November 30, 2015 (Unaudited) |
Top 10 Holdings* (as of November 30, 2015)
| | | | |
Public Storage | | | 4.20 | % |
Simon Property Group, Inc. | | | 3.79 | % |
Mitsubishi Estate Co., Ltd. | | | 3.69 | % |
Equity Residential | | | 3.68 | % |
Unibail-Rodamco SE | | | 3.19 | % |
Mitsui Fudosan Co., Ltd. | | | 3.15 | % |
AvalonBay Communities, Inc. | | | 3.06 | % |
ProLogis, Inc. | | | 2.84 | % |
Health Care REIT, Inc. | | | 2.83 | % |
Sun Hung Kai Properties, Ltd. | | | 2.46 | % |
Total % of Top 10 Holdings | | | 32.89 | % |
Future holdings are subject to change.
Country Allocation* (as of November 30, 2015)
| | | | |
United States | | | 52.61 | % |
Japan | | | 11.21 | % |
Hong Kong | | | 9.07 | % |
Australia | | | 7.43 | % |
United Kingdom | | | 6.94 | % |
France | | | 4.83 | % |
Germany | | | 3.32 | % |
Singapore | | | 2.42 | % |
Canada | | | 0.95 | % |
Switzerland | | | 0.42 | % |
Sweden | | | 0.31 | % |
Netherlands | | | 0.29 | % |
Brazil | | | 0.20 | % |
Total | | | 100.00 | % |
Growth of $10,000 (as of November 30, 2015)
Comparison of Change in Value of $10,000 Investment in the Fund and the Indexes
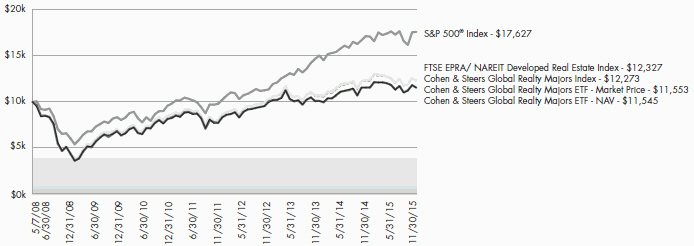
The chart above represents historical performance of a hypothetical investment of $10,000 in the Fund over the life of the Fund. Performance calculations are as of the end of each month. Past performance does not guarantee future results. This chart does not reflect the deduction of taxes that a shareholder would pay on Fund distributions or the redemption of Fund shares.
3 | November 30, 2015
| | |
Cohen & Steers Global Realty Majors ETF |
| |
| Disclosure of Fund Expenses | | November 30, 2015 (Unaudited) |
Shareholder Expense Example: As a shareholder of the Fund, you incur two types of costs: (1) transaction costs which may include creation and redemption fees or brokerage charges, and (2) ongoing costs, including management fees and other Fund expenses. These examples are intended to help you understand your ongoing costs (in dollars) of investing in the Fund and to compare these costs with the ongoing costs of investing in other funds. It is based on an investment of $1,000 invested at the beginning of the (six month) period and held through November 30, 2015.
Actual Return: The first line of the table provides information about actual account values and actual expenses. You may use the information in this table, together with the amount you invested, to estimate the expenses that you incurred over the period. Simply divide your account value by $1,000 (for example, an $8,600 account value divided by $1,000 = 8.6), then multiply the result by the number in the first line under the heading entitled “Expenses Paid During the Period” to estimate the expenses attributable to your investment during this period.
Hypothetical 5% Return: The second line of the table provides information about hypothetical account values and hypothetical expenses based on the Fund’s actual expense ratio and an assumed rate of return of 5% per year before expenses, which is not the Fund’s actual return. The hypothetical account values and expenses may not be used to estimate the actual ending account balance or expenses you paid for the period. You may use this information to compare ongoing costs of investing in the Fund and other funds. To do so, compare this 5% hypothetical example with the 5% hypothetical examples that appear in the shareholder reports of the other funds.
The expenses shown in the table are meant to highlight ongoing Fund costs only and do not reflect any transaction costs, such as creation and redemption fees, or brokerage charges. Therefore, the second line is useful in comparing ongoing costs only, and will not help you determine the relative total costs of owning different funds. In addition, if these costs were included, your costs would have been higher.
| | | | | | | | | | | | | | | | |
| | | Beginning Account Value 6/1/15 | | | Ending Account Value 11/30/15 | | | Expense Ratio(a) | | | Expenses Paid During Period 6/1/15 - 11/30/15(b) | |
Cohen & Steers Global Realty Majors ETF | | | | | | | | | | | | | | | | |
Actual | | $ | 1,000.00 | | | $ | 975.90 | | | | 0.55 | % | | $ | 2.72 | |
Hypothetical (5% return before expenses) | | $ | 1,000.00 | | | $ | 1,022.31 | | | | 0.55 | % | | $ | 2.79 | |
| (a) | Annualized, based on the Fund’s most recent fiscal half-year expenses. |
| (b) | Expenses are equal to the Fund’s annualized expense ratio multiplied by the average account value over the period, multiplied by the number of days in the most recent fiscal half year (183), divided by 365. |
4 | November 30, 2015
| | |
Cohen & Steers Global Realty Majors ETF |
|
| Report of Independent Registered Public Accounting Firm |
To the Board of Trustees and Shareholders of ALPS ETF Trust:
We have audited the accompanying statement of assets and liabilities, including the schedule of investments, of Cohen & Steers Global Realty Majors ETF, one of the portfolios constituting the ALPS ETF Trust (the “Trust”), as of November 30, 2015, and the related statement of operations for the year then ended, the statements of changes in net assets statements for each of the two years in the period then ended, and the financial highlights for each of the periods presented. These financial statements and financial highlights are the responsibility of the Trust’s management. Our responsibility is to express an opinion on these financial statements and financial highlights based on our audits.
We conducted our audits in accordance with the standards of the Public Company Accounting Oversight Board (United States). Those standards require that we plan and perform the audit to obtain reasonable assurance about whether the financial statements and financial highlights are free of material misstatement. The Trust is not required to have, nor were we engaged to perform, an audit of its internal control over financial reporting. Our audits included consideration of internal control over financial reporting as a basis for designing audit procedures that are appropriate in the circumstances, but not for the purpose of expressing an opinion on the effectiveness of the Trust’s internal control over financial reporting. Accordingly, we express no such opinion. An audit also includes examining, on a test basis, evidence supporting the amounts and disclosures in the financial statements, assessing the accounting principles used and significant estimates made by management, as well as evaluating the overall financial statement presentation. Our procedures included confirmation of securities owned as of November 30, 2015, by correspondence with the custodian. We believe that our audits provide a reasonable basis for our opinion.
In our opinion, the financial statements and financial highlights referred to above present fairly, in all material respects, the financial position of Cohen & Steers Global Realty Majors ETF of the ALPS ETF Trust as of November 30, 2015, the results of its operations for the year then ended, the changes in its net assets for each of the two years in the period then ended, and the financial highlights for each of the periods presented, in conformity with accounting principles generally accepted in the United States of America.
DELOITTE & TOUCHE LLP
Denver, Colorado
January 28, 2016
5 | November 30, 2015
| | |
Cohen & Steers Global Realty Majors ETF |
| |
| Schedule of Investments | | November 30, 2015 |
| | | | | | | | |
| Security Description | | Shares | | | Value | |
| |
| | |
COMMON STOCKS (99.63%) | | | | | | | | |
Australia (7.41%) | | | | | | | | |
Dexus Property Group | | | 120,913 | | | $ | 671,572 | |
Goodman Group | | | 196,010 | | | | 867,538 | |
The GPT Group | | | 223,519 | | | | 746,818 | |
Mirvac Group | | | 462,542 | | | | 623,862 | |
Scentre Group, Ltd. | | | 668,903 | | | | 1,935,003 | |
Stockland | | | 293,926 | | | | 850,270 | |
Westfield Corp. | | | 240,105 | | | | 1,666,982 | |
| | | | | | | | |
Total Australia | | | | | | | 7,362,045 | |
| | | | | | | | |
| | |
Brazil (0.20%) | | | | | | | | |
BR Malls Participacoes SA | | | 59,600 | | | | 197,486 | |
| | | | | | | | |
| | |
Canada (0.95%) | | | | | | | | |
Boardwalk Real Estate Investment Trust | | | 4,947 | | | | 175,624 | |
RioCan Real Estate Investment Trust | | | 40,078 | | | | 766,778 | |
| | | | | | | | |
Total Canada | | | | | | | 942,402 | |
| | | | | | | | |
| | |
France (4.82%) | | | | | | | | |
Gecina SA | | | 4,494 | | | | 542,712 | |
Klepierre | | | 23,847 | | | | 1,082,400 | |
Unibail-Rodamco SE | | | 12,306 | | | | 3,160,762 | |
| | | | | | | | |
Total France | | | | | | | 4,785,874 | |
| | | | | | | | |
| | |
Germany (3.32%) | | | | | | | | |
alstria office REIT-AG | | | 13,000 | | | | 171,895 | |
Deutsche EuroShop AG | | | 5,685 | | | | 241,190 | |
Deutsche Wohnen AG | | | 42,179 | | | | 1,160,675 | |
Vonovia SE | | | 55,660 | | | | 1,725,120 | |
| | | | | | | | |
Total Germany | | | | | | | 3,298,880 | |
| | | | | | | | |
| | |
Hong Kong (9.04%) | | | | | | | | |
China Overseas Land & Investment, Ltd. | | | 545,000 | | | | 1,806,486 | |
Hang Lung Properties, Ltd. | | | 267,000 | | | | 625,363 | |
Hongkong Land Holdings, Ltd. | | | 148,200 | | | | 1,035,918 | |
Link REIT | | | 288,164 | | | | 1,752,372 | |
Sun Hung Kai Properties, Ltd. | | | 198,000 | | | | 2,433,678 | |
Swire Properties, Ltd. | | | 132,200 | | | | 383,636 | |
The Wharf Holdings, Ltd. | | | 164,700 | | | | 945,276 | |
| | | | | | | | |
Total Hong Kong | | | | | | | 8,982,729 | |
| | | | | | | | |
| | |
Japan (11.19%) | | | | | | | | |
Japan Real Estate Investment Corp. | | | 164 | | | | 780,698 | |
Japan Retail Fund Investment Corp. | | | 305 | | | | 583,489 | |
Mitsubishi Estate Co., Ltd. | | | 174,000 | | | | 3,660,219 | |
Mitsui Fudosan Co., Ltd. | | | 124,000 | | | | 3,126,694 | |
Nippon Building Fund, Inc. | | | 178 | | | | 840,114 | |
Nomura Real Estate Holdings, Inc. | | | 15,400 | | | | 301,620 | |
Sumitomo Realty & Development Co., Ltd. | | | 60,000 | | | | 1,823,883 | |
| | | | | | | | |
Total Japan | | | | | | | 11,116,717 | |
| | | | | | | | |
6 | November 30, 2015
| | |
Cohen & Steers Global Realty Majors ETF | | |
| |
| Schedule of Investments | | November 30, 2015 |
| | | | | | | | |
| Security Description | | Shares | | | Value | |
| |
Netherlands (0.29%) | | | | | | | | |
Wereldhave N.V. | | | 5,083 | | | $ | 284,258 | |
| | | | | | | | |
| | |
Singapore (2.43%) | | | | | | | | |
Ascendas Real Estate Investment Trust | | | 257,066 | | | | 435,566 | |
CapitaLand Mall Trust | | | 326,047 | | | | 440,339 | |
CapitaLand, Ltd. | | | 315,700 | | | | 675,916 | |
City Developments, Ltd. | | | 60,000 | | | | 312,219 | |
Global Logistic Properties, Ltd. | | | 392,300 | | | | 547,893 | |
| | | | | | | | |
Total Singapore | | | | | | | 2,411,933 | |
| | | | | | | | |
| | |
Sweden (0.31%) | | | | | | | | |
Castellum AB | | | 21,642 | | | | 304,464 | |
| | | | | | | | |
| | |
Switzerland (0.42%) | | | | | | | | |
PSP Swiss Property AG | | | 5,009 | | | | 415,530 | |
| | | | | | | | |
| | |
United Kingdom (6.93%) | | | | | | | | |
The British Land Co. PLC | | | 128,512 | | | | 1,614,224 | |
Derwent London PLC | | | 13,977 | | | | 793,614 | |
Great Portland Estates PLC | | | 43,573 | | | | 575,206 | |
Hammerson PLC | | | 98,909 | | | | 909,443 | |
Intu Properties PLC | | | 103,439 | | | | 503,980 | |
Land Securities Group PLC | | | 100,594 | | | | 1,865,024 | |
Segro PLC | | | 92,874 | | | | 617,140 | |
| | | | | | | | |
Total United Kingdom | | | | | | | 6,878,631 | |
| | | | | | | | |
| | |
United States (52.32%) | | | | | | | | |
Alexandria Real Estate Equities, Inc. | | | 9,156 | | | | 843,176 | |
American Campus Communities, Inc. | | | 14,255 | | | | 575,902 | |
AvalonBay Communities, Inc. | | | 16,656 | | | | 3,027,894 | |
Boston Properties, Inc. | | | 19,251 | | | | 2,406,182 | |
Digital Realty Trust, Inc. | | | 18,391 | | | | 1,326,175 | |
Douglas Emmett, Inc. | | | 17,411 | | | | 539,393 | |
Equinix, Inc. | | | 7,400 | | | | 2,194,100 | |
Equity Residential | | | 45,743 | | | | 3,651,206 | |
Essex Property Trust, Inc. | | | 8,271 | | | | 1,908,864 | |
Extra Space Storage, Inc. | | | 15,450 | | | | 1,293,937 | |
Federal Realty Investment Trust | | | 8,715 | | | | 1,276,922 | |
General Growth Properties, Inc. | | | 73,445 | | | | 1,870,644 | |
HCP, Inc. | | | 58,107 | | | | 2,064,542 | |
Health Care REIT, Inc. | | | 44,319 | | | | 2,800,518 | |
Highwoods Properties, Inc. | | | 11,884 | | | | 517,667 | |
Host Hotels & Resorts, Inc. | | | 94,343 | | | | 1,566,094 | |
Kilroy Realty Corp. | | | 11,572 | | | | 772,200 | |
Kimco Realty Corp. | | | 51,833 | | | | 1,352,323 | |
The Macerich Co. | | | 16,869 | | | | 1,318,312 | |
ProLogis, Inc. | | | 65,813 | | | | 2,813,506 | |
Public Storage | | | 17,331 | | | | 4,160,480 | |
Realty Income Corp. | | | 31,403 | | | | 1,558,217 | |
Regency Centers Corp. | | | 11,791 | | | | 794,478 | |
Simon Property Group, Inc. | | | 20,158 | | | | 3,754,226 | |
SL Green Realty Corp. | | | 12,463 | | | | 1,471,631 | |
UDR, Inc. | | | 32,772 | | | | 1,209,614 | |
7 | November 30, 2015
| | |
Cohen & Steers Global Realty Majors ETF | | |
| |
| Schedule of Investments | | November 30, 2015 |
| | | | | | | | | | | | |
| Security Description | | | | | Shares | | | Value | |
| |
United States (52.32%) (continued) | | | | | | | | | | | | |
Ventas, Inc. | | | | | | | 41,753 | | | $ | 2,227,105 | |
Vornado Realty Trust | | | | | | | 22,252 | | | | 2,153,103 | |
Weingarten Realty Investors | | | | | | | 14,453 | | | | 505,277 | |
| | | | | | | | | | | | |
Total United States | | | | | | | | | | | 51,953,688 | |
| | | | | | | | | | | | |
| | | |
TOTAL COMMON STOCKS
(Cost $87,117,844) | | | | | | | | | | | 98,934,637 | |
| | | | | | | | | | | | |
| | | |
| | | 7 Day Yield | | | Shares | | | Value | |
| |
| | | |
SHORT TERM INVESTMENTS (0.19%) | | | | | | | | | | | | |
Morgan Stanley Institutional Liquidity Funds, Prime Portfolio | | | 0.105% | | | | 189,249 | | | | 189,249 | |
| | | | | | | | | | | | |
| | | |
TOTAL SHORT TERM INVESTMENTS
(Cost $ 189,249) | | | | | | | | | | | 189,249 | |
| | | | | | | | | | | | |
| | | |
TOTAL INVESTMENTS (99.82%)
(Cost $ 87,307,093) | | | | | | | | | | $ | 99,123,886 | |
| | | |
NET OTHER ASSETS AND LIABILITIES (0.18%) | | | | | | | | | | | 174,244 | |
| | | | | | | | | | | | |
| | | |
NET ASSETS (100.00%) | | | | | | | | | | $ | 99,298,130 | |
| | | | | | | | | | | | |
Common Abbreviations:
| AB - | Aktiebolag is the Swedish equivalent of the term corporation. |
| AG - | Aktiengesellschaft is a German term that refers to a corporation that is limited by shares, i.e., owned by shareholders. |
| N.V. - | Naamloze Vennootschap is the Dutch term for a public limited liability corporation. |
| REIT - | Real Estate Investment Trust. |
| SA - | Generally designated corporations in various countries, mostly those employing the civil law. |
| SE - | SE Regulation is a European Company which can operate on a Europe-wide basis and be governed by Community law directly applicable in all Member States. |
See Notes to Financial Statements.
8 | November 30, 2015
| | |
Cohen & Steers Global Realty Majors ETF | | |
| |
| Statement of Assets and Liabilities | | November 30, 2015 |
| | | | |
ASSETS: | | | | |
Investments, at value | | $ | 99,123,886 | |
Foreign tax reclaims | | | 33,851 | |
Dividends receivable | | | 185,387 | |
| |
Total Assets | | | 99,343,124 | |
| |
| |
LIABILITIES: | | | | |
Payable to adviser | | | 44,994 | |
| |
Total Liabilities | | | 44,994 | |
| |
NET ASSETS | | $ | 99,298,130 | |
| |
| |
NET ASSETS CONSIST OF: | | | | |
Paid-in capital | | $ | 94,367,715 | |
Accumulated net investment loss | | | (1,907,379) | |
Accumulated net realized loss on investments and foreign currency transactions | | | (4,974,821) | |
Net unrealized appreciation on investments and translation of assets and liabilities denominated in foreign currencies | | | 11,812,615 | |
| |
NET ASSETS | | $ | 99,298,130 | |
| |
| |
INVESTMENTS, AT COST | | $ | 87,307,093 | |
| |
PRICING OF SHARES | | | | |
Net Assets | | $ | 99,298,130 | |
Shares of beneficial interest outstanding (Unlimited number of shares authorized, par value $0.01 per share) | | | 2,350,000 | |
Net Asset Value, offering and redemption price per share | | $ | 42.25 | |
See Notes to Financial Statements.
9 | November 30, 2015
| | |
Cohen & Steers Global Realty Majors ETF | | |
| |
| Statement of Operations | | For the Year Ended November 30, 2015 |
| | | | |
INVESTMENT INCOME: | | | | |
Dividends(a) | | $ | 3,808,645 | |
| |
Total Investment Income | | | 3,808,645 | |
| |
| |
EXPENSES: | | | | |
Investment adviser fees | | | 552,997 | |
| |
Total Expenses | | | 552,997 | |
| |
NET INVESTMENT INCOME | | | 3,255,648 | |
| |
| |
REALIZED AND UNREALIZED GAIN/(LOSS) | | | | |
Net realized loss on investments | | | (812,118) | |
Net realized gain on foreign currency transactions | | | 95,156 | |
Net change in unrealized depreciation on investments | | | (3,397,499) | |
Net change in unrealized appreciation on translation of assets and liabilities denominated in foreign currencies | | | 1,459 | |
| |
NET REALIZED AND UNREALIZED LOSS ON INVESTMENTS | | | (4,113,002) | |
| |
NET DECREASE IN NET ASSETS RESULTING FROM OPERATIONS | | $ | (857,354) | |
| |
| (a) | Net of foreign tax withholding $136,192. |
See Notes to Financial Statements.
10 | November 30, 2015
| | |
Cohen & Steers Global Realty Majors ETF | | |
|
| Statements of Changes in Net Assets |
| | | | | | | | |
| | | For the | | | For the | |
| | | Year Ended | | | Year Ended | |
| | | November 30, | | | November 30, | |
| | | 2015 | | | 2014 | |
| |
OPERATIONS: | | | | | | | | |
Net investment income | | $ | 3,255,648 | | | $ | 2,242,990 | |
Net realized gain/(loss) on investments and foreign currency transactions | | | (716,962) | | | | 6,253,313 | |
Net change in unrealized appreciation/(depreciation) on investments and translation of assets and liabilities denominated in foreign currencies | | | (3,396,040) | | | | 5,320,437 | |
| |
Net increase/(decrease) in net assets resulting from operations | | | (857,354) | | | | 13,816,740 | |
| |
| | |
DISTRIBUTIONS TO SHAREHOLDERS: | | | | | | | | |
From net investment income | | | (3,785,555) | | | | (2,519,676) | |
| |
Total distributions | | | (3,785,555) | | | | (2,519,676) | |
| |
| | |
CAPITAL SHARE TRANSACTIONS: | | | | | | | | |
Proceeds from sale of shares | | | 9,186,084 | | | | – | |
Cost of shares redeemed | | | (2,197,905) | | | | (22,480,811) | |
| |
Net increase/(decrease) from share transactions | | | 6,988,179 | | | | (22,480,811) | |
| |
Net increase/(decrease) in net assets | | | 2,345,270 | | | | (11,183,747) | |
| | |
NET ASSETS: | | | | | | | | |
Beginning of year | | | 96,952,860 | | | | 108,136,607 | |
| |
End of year * | | $ | 99,298,130 | | | $ | 96,952,860 | |
| |
| | |
*Including accumulated net investment loss of: | | $ | (1,907,379) | | | $ | (1,550,915) | |
| | |
OTHER INFORMATION: | | | | | | | | |
CAPITAL SHARE TRANSACTIONS: | | | | | | | | |
Beginning shares | | | 2,200,000 | | | | 2,750,000 | |
Shares sold | | | 200,000 | | | | – | |
Shares redeemed | | | (50,000) | | | | (550,000) | |
| |
Shares outstanding, end of year | | | 2,350,000 | | | | 2,200,000 | |
| |
See Notes to Financial Statements.
11 | November 30, 2015
| | |
Cohen & Steers Global Realty Majors ETF |
| |
| Financial Highlights | | For a Share Outstanding Throughout the Periods Presented |
| | | | | | | | | | | | | | | | | | | | | | | | |
| | | | | | | | | | | | | | | For the | | | | |
| | | | | | | | | | | | | | | Period | | | | |
| | | For the Year | | | For the Year | | | For the Year | | | For the Year | | | January 1, | | | For the Year | |
| | | Ended | | | Ended | | | Ended | | | Ended | | | 2011 to | | | Ended | |
| | | November | | | November | | | November | | | November | | | November | | | December | |
| | | 30, 2015 | | | 30, 2014 | | | 30, 2013 | | | 30, 2012 | | | 30, 2011(a) | | | 31, 2010 | |
| |
NET ASSET VALUE, BEGINNING OF PERIOD | | $ | 44.07 | | | $ | 39.32 | | | $ | 39.59 | | | $ | 32.53 | | | $ | 35.52 | | | $ | 31.35 | |
| | | | | | |
INCOME/(LOSS) FROM INVESTMENT OPERATIONS: | | | | | | | | | | | | | | | | | | | | | | | | |
Net investment income(b) | | | 1.41 | | | | 0.92 | | | | 0.94 | | | | 0.91 | | | | 0.97 | | | | 1.43 | |
Net realized and unrealized gain/(loss) | | | (1.57) | | | | 4.85 | | | | 1.25 | | | | 6.97 | | | | (2.87) | | | | 4.68 | |
| |
Total from investment operations | | | (0.16) | | | | 5.77 | | | | 2.19 | | | | 7.88 | | | | (1.90) | | | | 6.11 | |
| |
| | | | | | |
DISTRIBUTIONS: | | | | | | | | | | | | | | | | | | | | | | | | |
From net investment income | | | (1.66) | �� | | | (1.02) | | | | (2.27) | | | | (0.82) | | | | (1.09) | | | | (1.94) | |
From tax return of capital | | | – | | | | – | | | | (0.19) | | | | – | | | | – | | | | – | |
| |
Total distributions | | | (1.66) | | | | (1.02) | | | | (2.46) | | | | (0.82) | | | | (1.09) | | | | (1.94) | |
| |
| | | | | | |
NET INCREASE/(DECREASE) IN NET ASSET VALUE | | | (1.82) | | | | 4.75 | | | | (0.27) | | | | 7.06 | | | | (2.99) | | | | 4.17 | |
| |
NET ASSET VALUE, END OF PERIOD | | $ | 42.25 | | | $ | 44.07 | | | $ | 39.32 | | | $ | 39.59 | | | $ | 32.53 | | | $ | 35.52 | |
| |
TOTAL RETURN(c) | | | (0.38)% | | | | 14.90% | | | | 5.60% | | | | 24.50% | | | | (5.53)% | | | | 19.91% | |
| | | | | | |
RATIOS/SUPPLEMENTAL DATA: | | | | | | | | | | | | | | | | | | | | | | | | |
Net assets, end of period (000s) | | $ | 99,298 | | | $ | 96,953 | | | $ | 108,137 | | | $ | 71,258 | | | $ | 50,418 | | | $ | 42,626 | |
| | | | | | |
Ratio of expenses to average net assets | | | 0.55% | | | | 0.55% | | | | 0.55% | | | | 0.55% | | | | 0.55%(d) | | | | 0.55% | |
Ratio of net investment income to average net assets | | | 3.24% | | | | 2.21% | | | | 2.31% | | | | 2.47% | | | | 3.02%(d) | | | | 4.33% | |
Portfolio turnover rate(e) | | | 7% | | | | 11% | | | | 10% | | | | 4% | | | | 15% | | | | 14% | |
| (a) | Effective March 7, 2011, the Board approved changing the fiscal year end of the Fund from December 31 to November 30. |
| (b) | Based on average shares outstanding during the period. |
| (c) | Total return is calculated assuming an initial investment made at the net asset value at the beginning of the period and redemption at the net asset value on the last day of the period and assuming all distributions are reinvested at reinvestment prices.Total return calculated for a period of less than one year is not annualized. |
| (e) | Portfolio turnover is not annualized and does not include securities received or delivered from processing creations or redemptions. |
See Notes to Financial Statements.
12 | November 30, 2015
| | |
Cohen & Steers Global Realty Majors ETF | | |
| |
| Notes to Financial Statements | | November 30, 2015 |
1. ORGANIZATION
The ALPS ETF Trust (the “Trust”), a Delaware statutory trust, is an open-end management investment company registered under the Investment Company Act of 1940, as amended (the “1940 Act”). As of November 30, 2015, the Trust consists of twenty-one separate portfolios. Each portfolio represents a separate series of the Trust. This report pertains solely to the Cohen & Steers Global Realty Majors ETF (the “Fund”). The investment objective of the Fund is to seek investment results that correspond generally to the performance, before the Fund’s fees and expenses, of an index called the Cohen & Steers Global Realty Majors Index. The investment advisor uses a “passive“ or indexing approach to try to achieve the Fund’s investment objective. The Fund is considered non-diversified and may invest a greater portion of assets in securities of individual issuers than a diversified fund. As a result, changes in the market value of a single investment could cause greater fluctuations in share price than would occur in a diversified fund.
The Fund’s Shares (“Shares”) are listed on the New York Stock Exchange (“NYSE”) Arca. The Fund issues and redeems Shares at net asset value (“NAV”) in blocks of 50,000 Shares, each of which is called a “Creation Unit”. Creation Units are issued and redeemed principally in-kind for securities included in a specified index. Except when aggregated in Creation Units, Shares are not redeemable securities of the Fund.
Pursuant to the Trust’s organizational documents, its Officers and Trustees are indemnified against certain liability arising out of the performance of their duties to the Trust. Additionally, in the normal course of business, the Trust enters into contracts with service providers that contain general indemnification clauses. The Trust’s maximum exposure under these arrangements is unknown, as this would involve future claims that may be made against the Trust that have not yet occurred.
2. SIGNIFICANT ACCOUNTING POLICIES
The following is a summary of significant accounting policies consistently followed by the Fund in the preparation of the financial statements. The accompanying financial statements were prepared in accordance with accounting principles generally accepted in the United States of America (“U.S. GAAP”). The preparation of financial statements in conformity with U.S. GAAP requires management to make certain estimates and assumptions that affect the reported amounts of assets and liabilities and disclosures of contingent assets and liabilities at the date of the financial statements and the reported amounts of revenue and expenses during the period. Actual results could differ from those estimates. The Fund is considered an investment company under U.S. GAAP and follows the accounting and reporting guidance applicable to investment companies in the Financial Accounting Standards Board Accounting Standards Codification Topic 946.
A. Portfolio Valuation
The Fund’s NAV is determined daily, as of the close of regular trading on the NYSE, normally 4:00 p.m. Eastern time, on each day the NYSE is open for trading. The NAV is computed by dividing the value of all assets of the Fund (including accrued interest and dividends), less all liabilities (including accrued expenses and dividends declared but unpaid), by the total number of shares outstanding.
Portfolio securities listed on any exchange other than the NASDAQ Stock Market LLC (“NASDAQ”) are valued at the last sale price on the business day as of which such value is being determined. If there has been no sale on such day, the securities are valued at the mean of the most recent bid and asked prices on such day. Securities traded on the NASDAQ are valued at the NASDAQ Official Closing Price as determined by NASDAQ. Portfolio securities traded on more than one securities exchange are valued at the last sale price on the business day as of which such value is being determined at the close of the exchange representing the principal market for such securities. Portfolio securities traded in the over-the-counter market, but excluding securities traded on the NASDAQ, are valued at the latest quoted sale price in such market.
The Fund’s investments are valued at market value or, in the absence of market value with respect to any portfolio securities, at fair value according to procedures adopted by the Trust’s Board of Trustees (the “Board”). When market quotations are not readily available or when events occur that make established valuation methods unreliable, securities of the Fund may be valued in good faith by or under the direction of the Board. These securities generally include, but are not limited to, restricted securities (securities which may not be publicly sold without registration under the Securities Act of 1933) for which a pricing service is unable to provide a market price; securities whose trading has been formally suspended; a security whose market price is not available from a pre-established primary pricing source or the pricing source is not willing to provide a price; a security with respect to which an event has occurred that is most likely to materially affect the value of the security after the market has closed but before the calculation of the Fund’s NAV or make it difficult or impossible to obtain a reliable market quotation; or a security whose price, as provided by the pricing service, does not reflect the security’s “fair value“ due to the security being de-listed from a national exchange or the security’s primary trading market is temporarily closed at a time when, under normal conditions, it would be open. As a general principle, the current “fair value” of a security would be the amount which the owner might reasonably expect to receive from the sale on the applicable exchange or principal market. A variety of factors may be considered in determining the fair value of such securities.
13 | November 30, 2015
| | |
Cohen & Steers Global Realty Majors ETF | | |
| |
| Notes to Financial Statements | | November 30, 2015 |
B. Fair Value Measurements
The Fund discloses the classification of its fair value measurements following a three-tier hierarchy based on the inputs used to measure fair value. Inputs refer broadly to the assumptions that market participants would use in pricing the asset or liability, including assumptions about risk. Inputs may be observable or unobservable. Observable inputs reflect the assumptions market participants would use in pricing the asset or liability that are developed based on market data obtained from sources independent of the reporting entity. Unobservable inputs reflect the reporting entity’s own assumptions about the assumptions market participants would use in pricing the asset or liability that are developed based on the best information available.
Valuation techniques used to value the Fund’s investments by major category are as follows:
Equity securities, including restricted securities, for which market quotations are readily available, are valued at the last reported sale price or official closing price as reported by a third party pricing vendor on the primary market or exchange on which they are traded and are categorized as Level 1 in the hierarchy. In the event there were no sales during the day or closing prices are not available, securities are valued at the mean of the most recent quoted bid and ask prices on such day and are generally categorized as Level 2 in the hierarchy. Investments in open-end mutual funds are valued at their NAV each business day and are categorized as Level 1 in the hierarchy.
Changes in valuation techniques may result in transfers in or out of an assigned level within the disclosure hierarchy.
Various inputs are used in determining the value of the Fund’s investments as of the end of the reporting period. When inputs used fall into different levels of the fair value hierarchy, the level in the hierarchy within which the fair value measurement falls is determined based on the lowest level input that is significant to the fair value measurement in its entirety. The designated input levels are not necessarily an indication of the risk or liquidity associated with these investments.
These inputs are categorized in the following hierarchy under applicable financial accounting standards:
| | |
Level 1 – | | Unadjusted quoted prices in active markets for identical investments, unrestricted assets or liabilities that a Fund has the ability to access at the measurement date; |
Level 2 – | | Quoted prices which are not active, quoted prices for similar assets or liabilities in active markets or inputs other than quoted prices that are observable (either directly or indirectly) for substantially the full term of the asset or liability; and |
Level 3 – | | Significant unobservable prices or inputs (including the Fund’s own assumptions in determining the fair value of investments) where there is little or no market activity for the asset or liability at the measurement date. |
The following is a summary of the inputs used to value the Fund’s investments at November 30, 2015:
| | | | | | | | | | | | | | | | |
| | | | | | Level 2- Other | | | | | | | |
| | | Level 1- Unadjusted | | | Significant Observable | | | Level 3- Significant | | | | |
| Investments in Securities at Value* | | Quoted Prices | | | Inputs | | | Unobservable Inputs | | | Total | |
Common Stocks | | $ | 98,934,637 | | | $ | – | | | $ | – | | | $ | 98,934,637 | |
Short Term Investments | | | 189,249 | | | | – | | | | – | | | | 189,249 | |
| |
TOTAL | | $ | 99,123,886 | | | $ | – | | | $ | – | | | $ | 99,123,886 | |
| |
| * | For a detailed geographical breakdown, see the accompanying Schedule of Investments. |
The Fund recognizes transfers between levels as of the end of the period. For the year ended November 30, 2015, the Fund did not have any transfers between Level 1 and Level 2 securities. The Fund did not have any securities which used significant unobservable inputs (Level 3) in determining fair value.
C. Foreign Securities
The Fund may directly purchase securities of foreign issuers. Investing in securities of foreign issuers involves special risks not typically associated with investing in securities of U.S. issuers. The risks include possible revaluation of currencies, the inability to repatriate foreign currency, less complete financial information about companies and possible future adverse political and economic developments. Moreover, securities of many foreign issuers and their markets may be less liquid and their prices more volatile than those of securities of comparable U.S. issuers.
14 | November 30, 2015
| | |
Cohen & Steers Global Realty Majors ETF | | |
| |
| Notes to Financial Statements | | November 30, 2015 |
D. Foreign Currency Translation
The books and records of the Fund are maintained in U.S. dollars. Investment valuations and other assets and liabilities initially expressed in foreign currencies are converted each business day into U.S. dollars based upon current exchange rates. The portion of realized and unrealized gains or losses on investments due to fluctuations in foreign currency exchange rates is not separately disclosed and is included in realized and unrealized gains or losses on investments, when applicable.
E. Securities Transactions and Investment Income
Securities transactions are recorded as of the trade date. Realized gains and losses from securities transactions are recorded on the highest cost basis. Dividend income and capital gains distributions, if any, are recorded on the ex-dividend date, net of any foreign taxes withheld. Interest income, if any, is recorded on the accrual basis.
F. Dividends and Distributions to Shareholders
Dividends from net investment income of the Fund, if any, are declared and paid quarterly or as the Board may determine from time to time. Distributions of net realized capital gains earned by the Fund, if any, are distributed at least annually.
G. Federal Tax and Tax Basis Information
The timing and character of income and capital gain distributions are determined in accordance with income tax regulations, which may differ from U.S. GAAP. Reclassifications are made to the Fund’s capital accounts for permanent tax differences to reflect income and gains available for distribution (or available capital loss carryforwards) under income tax regulations.
For the year ended November 30, 2015, the following reclassifications, which had no impact on results of operations or net assets, were recorded to reflect permanent tax differences resulting primarily from in-kind transactions:
| | | | | | | | | | | | |
| | | | | | | | | Accumulated Net | |
| | | | | | Accumulated Net | | | Realized Loss on | |
| Fund | | Paid-in Capital | | | Investment Loss | | | Investments | |
Cohen & Steers Global Realty Majors ETF | | $ | 599,790 | | | $ | 173,443 | | | $ | (773,233) | |
| | | |
The tax character of the distributions paid were as follows: | | | | | | | | | | | | |
| | | |
| | | | | | | | | Ordinary Income | |
November 30, 2015 | | | | | | | | | | | | |
Cohen & Steers Global Realty Majors ETF | | | | | | | | | | $ | 3,785,555 | |
November 30, 2014 | | | | | | | | | | | | |
Cohen & Steers Global Realty Majors ETF | | | | | | | | | | $ | 2,519,676 | |
Under the Regulated Investment Company Modernization Act of 2010 (“the Modernization Act”), net capital losses recognized in tax years beginning after December 22, 2010 may be carried forward indefinitely, and the character of the losses is retained as short-term and/or long-term. Under the law in effect prior to the Modernization Act, net capital losses were carried forward for eight years and treated as short-term. As a transition rule, the Modernization Act requires that post-enactment net capital losses be used before pre-enactment net capital losses. Additionally, post-enactment capital losses that are carried forward will retain their character as either short-term or long-term losses rather than being considered all short-term as under previous law.
At November 30, 2015, the Fund had available for tax purposes unused pre-enactment capital loss carryforwards as follows:
| | | | | | | | | | | | |
| Fund | | Expiring in 2016 | | | Expiring in 2017 | | | Expiring in 2018 | |
Cohen & Steers Global Realty Majors ETF | | $ | 176,692 | | | $ | 809,982 | | | $ | 187,815 | |
Capital loss carryovers used during the period ended November 30, 2015, were $131,989. At November 30, 2015, the Fund had available for tax purposes unused post-enactment capital loss carryforwards as follows: | |
| Fund | | | | | Short-Term | | | Long-Term | |
Cohen & Steers Global Realty Majors ETF | | | | | | $ | 1,014,479 | | | $ | 1,860,188 | |
15 | November 30, 2015
| | |
Cohen & Steers Global Realty Majors ETF | | |
| |
| Notes to Financial Statements | | November 30, 2015 |
As of November 30, 2015, the components of distributable earnings on a tax basis for the Fund were as follows:
| | | | | | | | | | | | | | | | |
| | | | | | Accumulated net | | | Net unrealized | | | | |
| | | Accumulated net | | | realized loss on | | | appreciation on | | | | |
| Fund | | investment loss | | | investments | | | investments | | | Total | |
Cohen & Steers Global Realty Majors ETF | | | 71,122 | | | $ | (4,049,156 | ) | | $ | 8,908,449 | | | $ | 4,930,415 | |
As of November 30, 2015, the cost of investments for federal income tax purposes and accumulated net unrealized appreciation/(depreciation) on investments were as follows:
| | | | |
Gross Appreciation (excess of value over tax cost) | | $ | 15,127,584 | |
Gross Depreciation (excess of tax cost over value) | | | (6,214,957) | |
Net Depreciation on Foreign Currency Transactions | | | (4,178) | |
| |
Net unrealized appreciation (depreciation) | | | 8,908,449 | |
| |
Cost of investments for income tax purposes | | $ | 90,211,259 | |
| |
The differences between book-basis and tax-basis are primarily due to Passive Foreign Investment Company (“PFIC”) adjustments and the deferral of losses due to wash sales.
H. Income Taxes
No provision for income taxes is included in the accompanying financial statements, as the Fund intends to distribute to shareholders all taxable investment income and realized gains and otherwise comply with Subchapter M of the Internal Revenue Code of 1986, as amended, applicable to regulated investment companies. The Fund evaluates tax positions taken (or expected to be taken) in the course of preparing the Fund’s tax returns to determine whether these positions meet a “more-likely-than-not” standard that, based on the technical merits, have a more than fifty percent likelihood of being sustained by a taxing authority upon examination. A tax position that meets the “more-likely-than-not” recognition threshold is measured to determine the amount of benefit to recognize in the financial statements.
As of and during the year ended November 30, 2015, the Fund did not have a liability for any unrecognized tax benefits. The Fund files U.S. federal, state, and local tax returns as required. The Fund’s tax returns are subject to examination by the relevant tax authorities until expiration of the applicable statute of limitations which is generally three years after the filing of the tax return, but may extend to four years in certain jurisdictions. Tax returns for open years have incorporated no uncertain tax positions that require a provision for income taxes.
3. INVESTMENT ADVISORY FEE AND OTHER AFFILIATED TRANSACTIONS
ALPS Advisors, Inc. (the “Adviser”) acts as the Fund’s investment adviser pursuant to an Advisory Agreement with the Trust on behalf of the Fund (the “Advisory Agreement”). Pursuant to the Advisory Agreement, the Fund pays the Adviser a unitary fee for the services and facilities it provides payable on a monthly basis at the annual rate of 0.55% of the Fund’s average daily net assets. From time to time, the Adviser may waive all or a portion of its fee.
Out of the unitary management fee, the Adviser pays substantially all expenses of the Fund, including the cost of transfer agency, custody, fund administration, legal, audit, independent trustees and other services, except for interest expenses, distribution fees or expenses, brokerage expenses, taxes and extraordinary expenses such as litigation and other expenses not incurred in the ordinary course of the Fund’s business. The Adviser’s unitary management fee is designed to pay substantially all the Fund’s expenses and to compensate the Adviser for providing services for the Fund.
ALPS Fund Services, Inc., an affiliate of the Adviser, is the administrator of the Fund.
Each Trustee who is not an officer or employee of the Adviser, any sub-adviser or any of their affiliates (“Independent Trustees”) receives (1) a quarterly retainer of $5,000, (2) a per meeting fee for regularly scheduled meetings of $3,750, (3) $1,500 for any special meeting held outside of a regularly scheduled board meeting, and (4) reimbursement for all reasonable out-of-pocket expenses relating to attendance at meetings.
16 | November 30, 2015
| | |
Cohen & Steers Global Realty Majors ETF | | |
| |
| Notes to Financial Statements | | November 30, 2015 |
4. PURCHASES AND SALES OF SECURITIES
For the year ended November 30, 2015, the cost of purchases and proceeds from sales of investment securities, excluding in-kind transactions and short-term investments, were as follows:
| | | | | | |
| Purchases | | Sales | | | |
$ 7,010,003 | | $ | 7,188,539 | | | |
For the year ended November 30, 2015, the cost of in-kind purchases and proceeds from in-kind sales were as follows: |
| Purchases | | Sales | | | |
$ 9,127,349 | | $ | 2,181,375 | | | |
The Cohen and Steers Global Realty Majors ETF had in-kind net realized gain/(loss) of $648,696.
Gains on in-kind transactions are not considered taxable for federal income tax purposes.
5. CAPITAL SHARE TRANSACTIONS
Shares are created and redeemed by the Fund only in Creation Unit size aggregations of 50,000 shares. Only broker-dealers or large institutional investors with creation and redemption agreements called Authorized Participants (“AP”) are permitted to purchase or redeem Creation Units from the Fund. Such transactions are generally permitted on an in-kind basis, with a balancing cash component to equate the transaction to the NAV per unit of the Fund on the transaction date. Cash may be substituted equivalent to the value of certain securities generally when they are not available in sufficient quantity for delivery, not eligible for trading by the AP or as a result of other market circumstances.
17 | November 30, 2015
| | |
Cohen & Steers Global Realty Majors ETF | | |
| |
| Additional Information | | November 30, 2015 (Unaudited) |
PROXY VOTING POLICIES AND PROCEDURES
Information regarding how the Fund voted proxies relating to portfolio securities during the most recent 12-month period ended June 30 and a description of the Fund’s proxy voting policies and procedures used in determining how to vote for proxies are available without charge on the Securities and Exchange Commission’s (“SEC”) website at www.sec.gov and upon request, by calling (toll-free) 1-866-675-2639.
PORTFOLIO HOLDINGS
The Trust is required to disclose, after its first and third fiscal quarters, the complete schedule of each Fund’s portfolio holdings with the SEC on Form N-Q. Form N-Q for each Fund will be available on the SEC’s website at www.sec.gov. Each Fund’s Form N-Q may also be reviewed and copied at the SEC’s Public Reference Room in Washington, D.C. and information on the operation of the Public Reference Room may be obtained by calling 1-800-SEC-0330. Each Fund’s Form N-Q will be available without charge, upon request, by calling (toll-free) 1-866-675-2639 or by writing to ALPS ETF Trust at 1290 Broadway, Suite 1100, Denver, Colorado 80203.
TAX INFORMATION
The Fund designated the following for federal income tax purposes for distributions made during the calendar year ended December 31, 2014:
| | | | |
| | | Qualified Dividend Income | | Dividend Received Deduction |
Cohen and Steers Global Realty Majors ETF | | 20.94 % | | 0.00 % |
In early 2015, if applicable, shareholders of record received this information for the distribution paid to them by the Fund during the calendar year 2014 via Form 1099. The Fund will notify shareholders in early 2016 of amounts paid to them by the Funds, if any, during the calendar year 2015.
LICENSING AGREEMENT
Cohen & Steers is the Index Provider for the Cohen & Steers Global Realty Majors ETF. Cohen & Steers is not affiliated with the Trust, the Adviser or the Distributor. ALPS, an affiliate of the Adviser, and the Trust have entered into a license agreement with Cohen & Steers to use the Index.
THE FUND IS NOT SPONSORED, MANAGED OR ADVISED BY COHEN & STEERS CAPTIAL MANAGEMENT, INC. (“C&S”). C&S MAKES NO REPRESENTATION OR WARRANTY, EXPRESS OR IMPLIED, TO THE SHAREHOLDERS OF THE FUND OR ANY MEMBER OF THE PUBLIC REGARDING THE ADVISABILITY OF INVESTING IN SECURITIES GENERALLY OR IN THE FUND PARTICULARLY OR THE ABILITY OF THE COHEN & STEERS GLOBAL REALTY MAJORS INDEX TO TRACK PERFORMANCE OF A MARKET OR SECTOR. C&S’S ONLY RELATIONSHIP TO ALPS IS IN RELATION TO THE LICENSING OF CERTAIN TRADEMARKS AND TRADE NAMES OF C&S AND OF ONE OR MORE C&S INDEXES, INCLUDING THE COHEN & STEERS GLOBAL REALTY MAJORS INDEX WHICH IS DETERMINED, COMPOSED AND CALCULATED BY C&S WITHOUT REGARD TO ALPS OR THE FUND. C&S HAS NO OBLIGATION TO TAKE THE NEEDS OF ALPS, THE FUND OR THE FUND SHAREHOLDERS INTO CONSIDERATION IN DETERMINING, COMPOSING OR CALCULATING THE COHEN & STEERS GLOBAL REALTY MAJORS INDEX. C&S IS NOT RESPONSIBLE FOR AND HAS NOT PARTICIPATED IN THE TIMING OF THE ISSUANCE OR SALE OF FUND SHARES OR IN THE DETERMINATION OR CALCULATION OF THE VALUATION OF THE FUND’S ASSETS. C&S HAS NO OBLIGATION OR LIABILITY IN CONNECTION WITH THE ADMINISTRATION, MARKETING OR PORTFOLIO MANAGEMENT OF THE FUND. C&S DOES NOT GUARANTEE THE ACCURACY AND/OR THE COMPLETENESS OF THE COHEN & STEERS GLOBAL REALTY MAJORS INDEX OR ANY DATA INCLUDED THEREIN AND C&S SHALL HAVE NO LIABILITY FOR ANY ERRORS, OMISSIONS, OR INTERRUPTIONS THEREIN. C&S MAKES NO WARRANTY, EXPRESS OR IMPLIED, AS TO RESULTS TO BE OBTAINED BY ALPS, THE FUND, FUND SHAREHOLDERS, OR ANY OTHER PERSON OR ENTITY FROM THE USE OF THE COHEN & STEERS GLOBAL REALTY MAJORS INDEX OR ANY DATA INCLUDED THEREIN. C&S MAKES NO EXPRESS OR IMPLIED WARRANTIES, AND EXPRESSLY DISCLAIMS ALL WARRANTIES OF MERCHANTABILITY OR FITNESS FOR A PARTICULAR PURPOSE OF USE WITH RESPECT TO THE COHEN & STEERS GLOBAL REALTY MAJORS INDEX OR ANY DATA INCLUDED THEREIN. WITHOUT LIMITING ANY OF THE FOREGOING, IN NO EVENT SHALL C&S HAVE ANY LIABILITY FOR ANY SPECIAL, PUNITIVE, INDIRECT OR CONSEQUENTIAL DAMAGES (INCLUDING LOST PROFITS) RESULTING FROM THE USE OF THE COHEN & STEERS GLOBAL REALTY MAJORS INDEX OR ANY DATA INCLUDED THEREIN, EVEN IF NOTIFIED OF THE POSSIBILITY OF SUCH DAMAGES.
The Advisor does not guarantee the accuracy and/or the completeness of the Index or any data included therein, and the Advisor shall have no liability for any errors, omissions or interruptions therein. The Advisor makes no warranty, express or implied, as to results to be obtained by the Fund, owners of the Shares of the Fund or any other person or entity from the use of the Index or any data included therein. The Advisor makes no express or implied warranties, and expressly disclaims all warranties of merchantability or fitness for a particular purpose or use with respect to the Index or any data included therein. Without limiting any of the foregoing, in no event shall the Advisor have any liability for any special, punitive, direct, indirect or consequential damages (including lost profits) arising out of matters relating to the use of the Index even if notified of the possibility of such damages.
18 | November 30, 2015
| | |
Cohen & Steers Global Realty Majors ETF | | |
Board Considerations Regarding Approval of Investment Advisory Agreement | | November 30, 2015 (Unaudited) |
At an in-person meeting held on June 8, 2015, the Board of Trustees of the Trust (the “Board” or the “Trustees”), including the Trustees who are not “interested persons“ of the Trust within the meaning of the 1940 Act, as amended (the “Independent Trustees”), evaluated a proposal to approve the continuance of the Advisory Agreement between the Trust and ALPS Advisors, Inc. (the “Adviser”) with respect to the Cohen & Steers Global Realty Majors ETF (“GRI”). The Independent Trustees also met separately to consider the Advisory Agreement.
In evaluating the Investment Advisory Agreement with respect to GRI, the Trustees considered various factors, including (i) the nature, extent and quality of the services to be provided by the Adviser with respect to GRI under the Investment Advisory Agreement; (ii) the advisory fees and other expenses to be paid by GRI compared to those of similar funds managed by other investment advisers; (iii) the costs of the services provided to GRI by the Adviser and the profits realized by the Adviser and its affiliates from its relationship to GRI; (iv) the extent which economies of scale would be realized if and as the assets of GRI grow and whether fees reflect the economies of scale for the benefit of shareholders and (v) any additional benefits and other considerations.
With respect to the nature, extent and quality of the services to be provided by the Adviser under the Investment Advisory Agreement, the Trustees considered and reviewed information concerning the services to be provided under the Investment Advisory Agreement, the investment parameters of the index of GRI, financial information regarding the Adviser and its parent company, information describing the Adviser’s current organization and the background and experience of the persons who would be responsible for the day-to-day management of GRI.
The Trustees reviewed information on the performance of GRI and its benchmark. The Trustees also evaluated the correlation and tracking error between the underlying index and its corresponding Fund’s performance. Based on their review, the Trustees found that the nature and extent of services provided to GRI under the Investment Advisory Agreement was appropriate and that the quality was satisfactory.
The Trustees noted that the advisory fee for GRI was a unitary fee pursuant to which the Adviser assumes all expenses of the GRI (including the cost of transfer agency, custody, fund administration, legal, audit and other services) other than the payments under the Advisory Agreement, brokerage expenses, taxes, interest, litigation expenses and other extraordinary expenses.
The Trustees noted that the advisory fee rate for GRI is slightly higher than the median of its Strategic Insight expense group. The Trustees noted, however, that GRI’s expense ratio is at the median of its Strategic Insight expense group.
Based on the foregoing, and the other information available to them, the Trustees concluded that the advisory fee rate for GRI was reasonable under the circumstances and in light of the quality of the services provided.
The Trustees considered other benefits available to the Adviser because of its relationship with GRI and concluded that the advisory fees were reasonable taking into account any such benefits.
The Trustees also considered with respect to GRI the information provided by the Adviser about the costs and profitability of the Adviser with respect to GRI. The Trustees reviewed and noted the relatively small sizes of GRI and concluded that the Adviser was not realizing any economies of scale.The Independent Trustees determined that they would continue to evaluate whether further economies of scale have been achieved on an ongoing basis.
In voting to renew the Advisory Agreement, the Trustees concluded that the terms of the Advisory Agreement are reasonable and fair in light of the services to be performed, the fees paid by certain other funds, expenses to be incurred and such other matters as the Independent Trustees considered relevant in the exercise of their reasonable business judgment. The Trustees did not identify any single factor or group of factors as all important or controlling and considered all factors together.
19 | November 30, 2015
| | |
Cohen & Steers Global Realty Majors ETF |
| |
| Trustees & Officers | | November 30, 2015 (Unaudited) |
| | | | | | | | | | |
INDEPENDENT TRUSTEES |
Name, Address
& Year of Birth* | | Position(s) Held
with Trust | | Term of Office
and Length of
Time Served** | | Principal Occupation(s) During Past 5 Years | | Number of
Portfolios in Fund
Complex Overseen
by Trustees*** | | Other Directorships Held by Trustees |
Mary K. Anstine, 1940 | | Trustee | | Since March 2008 | | Ms. Anstine was formerly an Executive Vice President of First Interstate Bank of Denver until 1994, President/Chief Executive Officer of HealthONE Alliance, Denver, Colorado, from 1994 to 2004, and has been retired since 2004. Ms. Anstine is also Trustee/Director of the following: AV Hunter Trust and Colorado Uplift Board. Ms. Anstine was formerly a Director of the Trust Bank of Colorado (later purchased and now known as Northern Trust Bank), HealthONE and Denver Area Council of the Boy Scouts of America and a member of the American Bankers Association Trust Executive Committee. | | 46 | | Ms. Anstine is a Trustee of ALPS Variable Investment Trust (9 funds); Financial Investors Trust (31 funds); Reaves Utility Income Fund; and Westcore Trust (12 funds). |
Jeremy W. Deems, 1976 | | Trustee | | Since March 2008 | | Mr. Deems is the Co-Founder, Chief Financial Officer of Green Alpha Advisors, LLC. Mr. Deems is Co-Portfolio Manager of the Shelton Green Alpha Fund. Prior to joining Green Alpha Advisors, Mr. Deems was CFO and Treasurer of Forward Management, LLC, ReFlow Management Co., LLC, ReFlow Fund, LLC, a private investment fund, and Sutton Place Management, LLC, an administrative services company. | | 46 | | Mr. Deems is a Trustee of ALPS Variable Investment Trust (9 funds); Financial Investors Trust (31 funds); Clough Funds Trust (1 fund); and Reaves Utility Income Fund. |
Rick A. Pederson, 1952 | | Trustee | | Since March 2008 | | Mr. Pederson is President, Foundation Properties, Inc. (a real estate investment management company), 1994 - present; Advisory Board Member, Bow River Capital Partners (private equity management), 2003 - present; Advisor, Pauls Corporation (real estate investment management and development), 2008 - present; Chairman, Ross Consulting Group (real estate consulting services) 1983-2013; Advisory Board, Neenan Company (construction services) 2002- present; Board Member, Prosci, Inc. (private business services), 2013-present; Board Member, Citywide Banks (Colorado community bank) 2014-present; Board member, Professional Pediatric Health Care (a Denver-based home nursing firm) 2014 – present; Director, National Western Stock Show (not-for-profit organization); Director, Biennial of the Americas (not-for profit organization). | | 24 | | Mr. Pederson is Trustee of Westcore Trust (12 funds) and Principal Real Estate Income Fund (1 fund). |
| * | The business address of the Trustee is c/o ALPS Advisors, Inc., 1290 Broadway, Suite 1100, Denver, Colorado 80203. |
| ** | This is the period for which the Trustee began serving the Trust.Each Trustee serves an indefinite term, until his successor is elected. |
| *** | The Fund Complex includes all series of the Trust and any other investment companies for which ALPS Advisors, Inc. provides investment advisory services. |
The Statement of Additional Information includes additional information about the Fund’s Trustees and is available, without charge, upon request by calling (toll-free) 1-866-675-2639.
20 | November 30, 2015
| | |
Cohen & Steers Global Realty Majors ETF |
| Trustees & Officers | | November 30, 2015 (Unaudited) |
| | | | | | | | | | |
INTERESTED TRUSTEE |
Name,
Address and Year of
Birth of
Interested
Trustee* | | Position(s) Held
with Trust | | Term of Office
and Length of
Time Served** | | Principal Occupation(s)
During Past 5 Years | | Number of
Portfolios in Fund
Complex Overseen
by Trustees*** | | Other Directorships Held by Trustees |
Thomas A. Carter, 1966 | | Trustee and President | | Since March 2008 | | Mr. Carter Joined ALPS Fund Services, Inc. (“ALPS”) in 1994 and is currently President and Director of ALPS Advisors, Inc. (“AAI”), and ALPS Portfolio Solutions Distributor, Inc. (“APSD”) and Executive Vice President and Director of ALPS and ALPS Holdings, Inc. (“AHI”), and ALPS Distributors, Inc. (“ADI”). Because of his position with AHI, ALPS, ADI, APSD and AAI, Mr. Carter is deemed an affiliate of the Fund as defined under the 1940 Act. Before joining ALPS, Mr. Carter was with Deloitte & Touche LLP, where he worked with a diverse group of clients, primarily within the financial services industry. Mr. Carter is a Certified Public Accountant and received his Bachelor of Science in Accounting from the University of Colorado at Boulder. | | 34 | | Mr. Carter is a Trustee of ALPS Variable Investment Trust (9 funds) and Principal Real Estate Income Fund (1 fund) |
| * | The business address of the Trustee is c/o ALPS Advisors, Inc., 1290 Broadway, Suite 1100, Denver, Colorado 80203. |
| ** | This is the period for which the Trustee began serving the Trust.Each Trustee serves an indefinite term, until his successor is elected. |
| *** | The Fund Complex includes all series of the Trust and any other investment companies for which ALPS Advisors, Inc. provides investment advisory services. |
The Statement of Additional Information includes additional information about the Fund’s Trustees and is available, without charge, upon request by calling (toll-free) 1-866-675-2639.
21 | November 30, 2015
| | |
Cohen & Steers Global Realty Majors ETF |
| |
| Trustees & Officers | | November 30, 2015 (Unaudited) |
| | | | | | |
OFFICERS |
Name, Address
and Year of
Birth of Officer* | | Position(s) Held
with Trust | | Length of Time
Served** | | Principal Occupation(s) During Past 5 Years |
| Erin D. Nelson, 1977 | | Chief Compliance Officer (“CCO”) | | Since December 2009 | | Erin Nelson became Senior Vice-President and Chief Compliance Officer of ALPS Advisors, Inc. (“AAI”) on July 1, 2015 and prior to that served as Vice President and Deputy Chief Compliance Officer of AAI since January 1, 2015. Prior to January 1, 2015, Ms. Nelson was Vice-President and Assistant General Counsel of ALPS of Fund Services, Inc. Ms. Nelson joined AAI’s parent company, ALPS Holdings, Inc. in January 2003. Ms. Nelson currently is also the Chief Compliance Officer of Principal Real Estate Income Fund, and as of December 2015, the Chief Compliance Officer of Liberty All-Star Equity Fund, Liberty All-Star Growth Fund, Inc., RiverNorth Opportunities Fund, Inc. |
Patrick D. Buchanan, 1972 | | Treasurer | | Since June 2012 | | Mr. Buchanan is Vice President of AAI. Mr. Buchanan joined ALPS in 2007 and because of his position with AAI, he is deemed an affiliate of the Trust as defined under the 1940 Act. Mr. Buchanan is also Treasurer of the ALPS Variable Insurance Trust, Clough Funds Trust and Principal Real Estate Income Fund. |
| William Parmentier, 1952 | | Vice President | | Since March 2008 | | Mr. Parmentier is Chief Investment Officer, AAI (since 2006); President and Chief Executive Officer of the Liberty All-Star Funds (since April 1999); Senior Vice President (2005-2006), Banc of America Investment Advisors, Inc. Because of his position with AAI, Mr. Parmentier is deemed an affiliate of the Trust as defined under the 1940 Act. |
Abigail J. Murray, 1975 | | Secretary | | Since June 2015 | | Ms. Murray joined ALPS in April 2015. She is currently Vice President and Senior Counsel of ALPS. Prior to joining ALPS, Ms. Murray was an Attorney and Managing Member at Murray & Rouvina PLC from 2014 to 2015 and an Associate with Vedder Price P.C. from 2007 to 2014. Because of her position with ALPS, Ms. Murray is deemed an affiliate of the Trust as defined under the 1940 Act. Ms. Murray is also the Secretary of The Caldwell & Orkin Funds, Inc., Clough Global Opportunities Fund, Clough Global Allocation Fund, Clough Global Equity Fund and Clough Funds Trust. |
Jennifer A. Craig, 1973 | | Assistant Secretary | | Since October 2013 | | Ms. Craig joined ALPS in 2007 and is currently Assistant Vice President and Paralegal Manager. Prior to joining ALPS, Ms. Craig was Legal Manager at Janus Capital Management LLC and served as Assistant Secretary of Janus Investment Fund, Janus Adviser Series and Janus Aspen Series. Because of her position with ALPS, Ms. Craig is deemed an affiliate of the Trust as defined under the 1940 Act. |
| * | The business address of the Officer is c/o ALPS Advisors, Inc., 1290 Broadway, Suite 1100, Denver, Colorado 80203. |
| ** | This is the period for which the Officer began serving the Trust. Each Officer serves an indefinite term, until his successor is elected. |
22 | November 30, 2015
Intentionally Left Blank
table of
CONTENTS
www.alpsfunds.com
| | |
Global Commodity Equity ETF | | |
| |
| Performance Overview | | November 30, 2015 (Unaudited) |
Investment Objective
The Global Commodity Equity ETF (the “Fund”) seeks investment results that replicate as closely as possible, before fees and expenses, the price and yield performance of the Thomson Reuters CRB Commodity Producers Index (the “Underlying Index”). The Fund will invest at least 80% of its total assets in the equity securities that comprise the Underlying Index and depositary receipts based on the securities in the Underlying Index.
The Underlying Index is a modified capitalization-weighted, float-adjusted, rules-based index designed to track the overall performance of a global universe of listed companies engaged in the production and distribution of commodities and commodity-related products and services in the following sectors: agriculture, base/industrial metals, energy and precious metals.
Performance Overview
The Global Commodity Equity ETF (CRBQ), for the one-year period ended November 30, 2015, generated a total return of -19.75%, in-line with the Fund’s Underlying Index, which returned -19.13%. The fund outperformed the S&P GSCI Commodity Index®, which returned -36.53% for the same period.
From a macro perspective, commodities saw a continuation of the poor performance seen in 2014, as the dollar continued to strengthen throughout the one year period ended November 30, 2015. The inverse correlation between the dollar and commodity prices was clearly highlighted throughout the period, as the dollar appreciated 11.83% and commodities collectively slumped -36.53%.
The best performing stocks for the period were Valero Energy Group (VLO), which increased 51.91%, Detour Gold Corp (DGC CN), which returned 40.73%, and Cameron International Corp (CAM), which rose 33.17%. The worst performing stocks were Lonmin PLC (LMI LN), which lost 94.34%, Kumba Iron Ore Ltd (KIO SJ), which fell 86.00%; and First Quantum Minerals Ltd (FM CN), which decreased 77.39%.
Performance (as of November 30, 2015)
| | | | | | | | |
| | | 1 Year | | 3 Year | | 5 Year | | Since Inception^ |
Global Commodity Equity ETF - NAV+ | | -19.75% | | -9.02% | | -5.33% | | -2.21% |
Global Commodity Equity ETF - Market Price+* | | -19.93% | | -9.07% | | -5.41% | | -2.38% |
Thomson Reuters CRB Commodity Producers Index | | -19.13% | | -8.25% | | -4.62% | | -1.45% |
S&P GSCI Commodity Index | | -36.53% | | -21.55% | | -12.07% | | -8.91% |
S&P 500® Total Return Index | | 2.75% | | 16.09% | | 14.40% | | 13.71% |
Total Expense Ratio (per the current prospectus) 0.65%.
Performance data quoted represents past performance. Past performance does not guarantee future results. Investment return and principal value of an investment will fluctuate so that an investor’s shares, when sold or redeemed, may be worth more or less than the original cost. Current performance data may be higher or lower than actual data quoted. For the most current month-end performance data please visit www.alpsfunds.com or call 1.866.675.2639.
NAV is an exchange-traded fund’s per-share value. The per-share dollar amount of the fund is derived by dividing the total value of all the securities in its portfolio, less any liabilities, by the number of fund shares outstanding. Market Price is the price at which a share can currently be traded in the market. Information detailing the number of days the Market Price of the Fund was greater than the Fund’s NAV and the number of days it was less than the Fund’s NAV can be obtained at www.alpsfunds.com.
| ^ | The Fund commenced Investment Operations on September 18, 2009 with an Inception Date, the first day of trading on the Exchange, of September 21, 2009. |
| + | Prior to March 31, 2014 the Global Commodity Equity ETF was known as the Jefferies | TR/J CRB Global Commodity Equity Index Fund. |
| * | Market Price is based on the midpoint of the bid/ask spread at 4 p.m. ET and does not represent the returns an investor would receive if shares were traded at other times. |
Thomson Reuters CRB Commodity Producers Index: A modified capitalization-weighted, float-adjusted, rules-based index designed to track the overall performance of a global universe of listed companies engaged in the production and distribution of commodities and commodity-related products and services in the following sectors: agriculture, base/industrial metals, energy and precious metals.
S&P GSCI Commodity Index: A composite index of commodity sector returns which represents a broadly diversified, unleveraged, long-only position in commodity futures.
1 | November 30, 2015
| | |
Global Commodity Equity ETF | | |
| |
| Performance Overview | | November 30, 2015 (Unaudited) |
S&P 500® Total Return Index: The Standard & Poor’s composite index of 500 stocks, a widely recognized, unmanaged index of common stock prices. Total return assumes reinvestment of any dividends and distributions realized during a given time period.
One cannot invest directly in an index. Index performance does not reflect fund performance.
The Global Commodity Equity ETF is not suitable for all investors. Investments in the Fund are subject to investment risks, including possible loss of the principal amount invested.
ALPS Portfolio Solutions Distributor, Inc. is the Distributor of the Fund.
S-Network® Global Indexes, Inc. is the Index Provider. The Index Provider is not affiliated with the Trust, the Investment Adviser or the Distributor. The Investment Adviser has entered into a license agreement with the Index Provider to use the Fund’s underlying index.
Thomson Reuters is not affiliated with the Index Provider, the Trust, the Investment Adviser or the Distributor.
2 | November 30, 2015
| | |
Global Commodity Equity ETF | | |
| |
| Performance Overview | | November 30, 2015 (Unaudited) |
Top 10 Holdings* (as of November 30, 2015)
| | | | |
Exxon Mobil Corp. | | | 7.14% | |
Monsanto Co. | | | 6.97% | |
Syngenta AG | | | 5.35% | |
Deere & Co. | | | 3.87% | |
Chevron Corp. | | | 3.61% | |
Archer-Daniels-Midland Co. | | | 3.41% | |
Potash Corp. of Saskatchewan, Inc. | | | 2.64% | |
TOTAL SA | | | 2.33% | |
BP PLC | | | 2.22% | |
Agrium, Inc. | | | 2.21% | |
Total % of Top 10 Holdings | | | 39.75% | |
Country Allocation* (as of November 30, 2015)
| | | | |
United States | | | 48.82% | |
Canada | | | 11.75% | |
United Kingdom | | | 6.46% | |
Switzerland | | | 5.74% | |
Russia | | | 5.35% | |
Australia | | | 3.00% | |
France | | | 2.33% | |
Netherlands | | | 1.95% | |
Japan | | | 1.75% | |
China | | | 1.48% | |
Other | | | 11.37% | |
Total | | | 100.00% | |
Future holdings are subject to change.
Growth of $10,000 (as of November 30, 2015)
Comparison of Change in Value of $10,000 Investment in the Fund and the Indexes
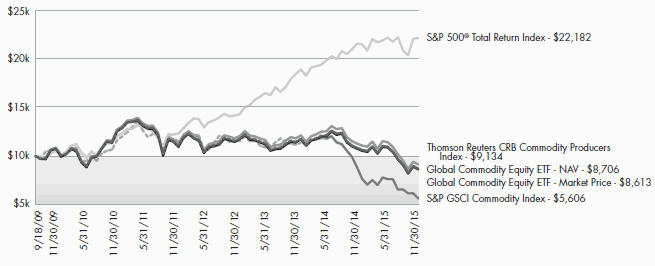
The chart represents historical performance of a hypothetical investment of $10,000 in the Fund over the life of the Fund. Performance calculations are as of the end of each month. Past performance does not guarantee future results. This chart does not reflect the deduction of taxes that a shareholder would pay on Fund distributions or the redemption of Fund shares.
3 | November 30, 2015
| | |
Global Commodity Equity ETF | | |
| |
| Disclosure of Fund Expenses | | November 30, 2015 (Unaudited) |
Shareholder Expense Example: As a shareholder of the Fund, you incur two types of costs: (1) transaction costs which may include creation and redemption fees or brokerage charges, and (2) ongoing costs, including management fees and other Fund expenses. These examples are intended to help you understand your ongoing costs (in dollars) of investing in the Fund and to compare these costs with the ongoing costs of investing in other funds. The example is based on an investment of $1,000 invested at the beginning of the (six month) period and held through November 30, 2015.
Actual Return: The first line of the table provides information about actual account values and actual expenses. You may use the information in this table, together with the amount you invested, to estimate the expenses that you incurred over the period. Simply divide your account value by $1,000 (for example, an $8,600 account value divided by $1,000 = 8.6), then multiply the result by the number in the first table under the heading entitled “Expenses Paid During the Period” to estimate the expenses attributable to your investment during this period.
Hypothetical 5% Return: The second line of the table provides information about hypothetical account values and hypothetical expenses based on the Fund’s actual expense ratio and an assumed rate of return of 5% per year before expenses, which is not the Fund’s actual return. The hypothetical account values and expenses may not be used to estimate the actual ending account balance or expenses you paid for the period. You may use this information to compare ongoing costs of investing in the Fund and other funds. To do so, compare this 5% hypothetical example with the 5% hypothetical examples that appear in the shareholder reports of the other funds.
The expenses shown in the table are meant to highlight ongoing Fund costs only and do not reflect any transaction costs, such as creation and redemption fees, or brokerage charges. Therefore, the second table is useful in comparing ongoing costs only, and will not help you determine the relative total costs of owning different funds. In addition, if these costs were included, your costs would have been higher.
| | | | | | | | | | |
| | | Beginning Account | | Ending Account | | | | | Expenses Paid |
| | | Value | | Value | | | Expense | | During Period |
| | | 6/1/15 | | 11/30/15 | | | Ratio(a) | | 6/1/15 - 11/30/15(b) |
|
Global Commodity Equity ETF | | | | | | | | | | |
Actual | | $1,000.00 | | $ | 794.60 | | | 0.65% | | $2.92 |
Hypothetical (5% return before expenses) | | $1,000.00 | | $ | 1,021.81 | | | 0.65% | | $3.29 |
|
| (a) | The expense ratio has been based on the Fund’s most recent fiscal half year expenses. |
| (b) | The example in the table above is equal to the Fund’s annualized expense ratio multiplied by the average account value over the period, multiplied by the number of days in the most recent fiscal half year (183), divided by 365. |
4 | November 30, 2015
| | |
Global Commodity Equity ETF | | |
|
| Report of Independent Registered Public Accounting Firm |
To the Board of Trustees and Shareholders of ALPS ETF Trust:
We have audited the accompanying statement of assets and liabilities, including the schedule of investments, of Global Commodity Equity ETF (formerly known as Jefferies | TR/J CRB Global Commodity Equity Index Fund), one of the portfolios constituting the ALPS ETF Trust (the “Trust”), as of November 30, 2015, and the related statement of operations for the year then ended, the statements of changes in net assets for each of the two years in the period then ended, and the financial highlights for each of the periods presented. These financial statements and financial highlights are the responsibility of the Trust’s management. Our responsibility is to express an opinion on these financial statements and financial highlights based on our audits.
We conducted our audits in accordance with the standards of the Public Company Accounting Oversight Board (United States). Those standards require that we plan and perform the audit to obtain reasonable assurance about whether the financial statements and financial highlights are free of material misstatement. The Trust is not required to have, nor were we engaged to perform, an audit of its internal control over financial reporting. Our audits included consideration of internal control over financial reporting as a basis for designing audit procedures that are appropriate in the circumstances, but not for the purpose of expressing an opinion on the effectiveness of the Trust’s internal control over financial reporting. Accordingly, we express no such opinion. An audit also includes examining, on a test basis, evidence supporting the amounts and disclosures in the financial statements, assessing the accounting principles used and significant estimates made by management, as well as evaluating the overall financial statement presentation. Our procedures included confirmation of securities owned as of November 30, 2015, by correspondence with the custodian. We believe that our audits provide a reasonable basis for our opinion.
In our opinion, the financial statements and financial highlights referred to above present fairly, in all material respects, the financial position of Global Commodity Equity ETF of the ALPS ETF Trust as of November 30, 2015, the results of its operations for the year then ended, the changes in its net assets for each of the two years in the period then ended, and the financial highlights for each of the periods presented, in conformity with accounting principles generally accepted in the United States of America.
DELOITTE & TOUCHE LLP
Denver, Colorado
January 28, 2016
5 | November 30, 2015
| | |
Global Commodity Equity ETF | | |
| |
| Schedule of Investments | | November 30, 2015 |
| | | | | | | | |
| Security Description | | Shares | | | Value | |
| |
COMMON STOCKS (99.41%) | | | | | | | | |
Australia (2.99%) | | | | | | | | |
BHP Billiton PLC | | | 19,691 | | | $ | 236,334 | |
Fortescue Metals Group, Ltd. | | | 14,238 | | | | 20,182 | |
GrainCorp, Ltd., Class A | | | 5,802 | | | | 34,407 | |
Incitec Pivot, Ltd. | | | 56,853 | | | | 155,419 | |
Newcrest Mining, Ltd.* | | | 16,804 | | | | 132,586 | |
Woodside Petroleum, Ltd. | | | 3,238 | | | | 70,509 | |
| | | | | | | | |
Total Australia | | | | | | | 649,437 | |
| | | | | | | | |
| | |
Brazil (0.86%) | | | | | | | | |
Petroleo Brasileiro SA, Sponsored ADR* | | | 17,207 | | | | 82,077 | |
Vale SA, Sponsored ADR | | | 31,004 | | | | 104,484 | |
| | | | | | | | |
Total Brazil | | | | | | | 186,561 | |
| | | | | | | | |
| | |
Canada (11.71%) | | | | | | | | |
Agnico-Eagle Mines, Ltd. | | | 4,766 | | | | 126,622 | |
Agrium, Inc. | | | 4,848 | | | | 478,610 | |
Alamos Gold, Inc., Class A | | | 5,532 | | | | 16,818 | |
B2Gold Corp.* | | | 19,652 | | | | 21,485 | |
Barrick Gold Corp. | | | 25,630 | | | | 188,658 | |
Cameco Corp. | | | 3,901 | | | | 47,673 | |
Canadian Natural Resources, Ltd. | | | 4,889 | | | | 118,395 | |
Detour Gold Corp.* | | | 3,743 | | | | 38,987 | |
Eldorado Gold Corp. | | | 15,711 | | | | 48,117 | |
EnCana Corp. | | | 3,739 | | | | 31,134 | |
First Quantum Minerals, Ltd. | | | 6,074 | | | | 22,105 | |
Goldcorp, Inc. | | | 18,364 | | | | 217,131 | |
IAMGOLD Corp.* | | | 8,493 | | | | 12,974 | |
Kinross Gold Corp.* | | | 25,232 | | | | 49,313 | |
New Gold, Inc.* | | | 10,825 | | | | 23,831 | |
Pan American Silver Corp. | | | 3,214 | | | | 22,358 | |
Potash Corp. of Saskatchewan, Inc. | | | 28,234 | | | | 571,467 | |
Silver Wheaton Corp. | | | 8,841 | | | | 116,185 | |
Suncor Energy, Inc. | | | 6,461 | | | | 178,525 | |
Teck Resources, Ltd., Class B | | | 4,269 | | | | 18,157 | |
TransCanada Corp. | | | 3,201 | | | | 101,007 | |
Turquoise Hill Resources, Ltd.* | | | 20,248 | | | | 53,370 | |
Yamana Gold, Inc. | | | 20,763 | | | | 43,844 | |
| | | | | | | | |
Total Canada | | | | | | | 2,546,766 | |
| | | | | | | | |
| | |
Chile (0.22%) | | | | | | | | |
Sociedad Quimica y Minera de Chile SA, | | | | | | | | |
Sponsored ADR | | | 2,853 | | | | 47,902 | |
| | | | | | | | |
Total Chile | | | | | | | 47,902 | |
| | | | | | | | |
| | |
China (1.48%) | | | | | | | | |
China BlueChemical, Ltd., Class H | | | 64,000 | | | | 17,417 | |
China Modern Dairy Holdings, Ltd. | | | 65,288 | | | | 18,104 | |
China Petroleum & Chemical Corp., Class H | | | 106,137 | | | | 65,023 | |
China Shenhua Energy Co., Ltd., Class H | | | 15,216 | | | | 23,746 | |
CNOOC, Ltd. | | | 72,987 | | | | 80,768 | |
Jiangxi Copper Co., Ltd., Class H | | | 12,000 | | | | 14,347 | |
PetroChina Co., Ltd., Class H | | | 100,119 | | | | 71,149 | |
| | | | | | | | |
| Security Description | | Shares | | | Value | |
| |
China (continued) | | | | | | | | |
Zijin Mining Group Co., Ltd., Class H | | | 123,000 | | | $ | 30,776 | |
| | | | | | | | |
Total China | | | | | | | 321,330 | |
| | | | | | | | |
| | |
France (2.32%) | | | | | | | | |
TOTAL SA | | | 10,149 | | | | 503,977 | |
| | | | | | | | |
Total France | | | | | | | 503,977 | |
| | | | | | | | |
| | |
Germany (1.20%) | | | | | | | | |
K+S AG | | | 6,016 | | | | 171,236 | |
ThyssenKrupp AG | | | 4,203 | | | | 89,458 | |
| | | | | | | | |
Total Germany | | | | | | | 260,694 | |
| | | | | | | | |
| | |
Hong Kong (0.11%) | | | | | | | | |
China Agri-Industries Holdings, Ltd.* | | | 68,000 | | | | 23,767 | |
| | | | | | | | |
Total Hong Kong | | | | | | | 23,767 | |
| | | | | | | | |
| | |
Israel (0.57%) | | | | | | | | |
Israel Chemicals, Ltd. | | | 18,059 | | | | 90,819 | |
The Israel Corp., Ltd. | | | 150 | | | | 33,316 | |
| | | | | | | | |
Total Israel | | | | | | | 124,135 | |
| | | | | | | | |
| | |
Italy (0.83%) | | | | | | | | |
Eni SpA | | | 11,046 | | | | 179,961 | |
| | | | | | | | |
Total Italy | | | | | | | 179,961 | |
| | | | | | | | |
| | |
Japan (1.75%) | | | | | | | | |
Hitachi Metals, Ltd. | | | 2,100 | | | | 27,227 | |
JFE Holdings, Inc. | | | 5,100 | | | | 80,456 | |
Kobe Steel, Ltd. | | | 31,000 | | | | 36,263 | |
Nippon Steel & Sumitomo Metal Corp. | | | 7,800 | | | | 156,665 | |
Sumitomo Metal Mining Co., Ltd. | | | 7,000 | | | | 78,928 | |
| | | | | | | | |
Total Japan | | | | | | | 379,539 | |
| | | | | | | | |
| | |
Jersey (0.57%) | | | | | | | | |
Randgold Resources, Ltd. | | | 2,021 | | | | 123,032 | |
| | | | | | | | |
Total Jersey | | | | | | | 123,032 | |
| | | | | | | | |
| | |
Luxembourg (0.21%) | | | | | | | | |
ArcelorMittal | | | 9,255 | | | | 45,391 | |
| | | | | | | | |
Total Luxembourg | | | | | | | 45,391 | |
| | | | | | | | |
| | |
Malaysia (0.70%) | | | | | | | | |
IOI Corp. BHD | | | 66,675 | | | | 68,020 | |
Kuala Lumpur Kepong BHD | | | 7,445 | | | | 40,053 | |
PPB Group BHD | | | 12,053 | | | | 44,662 | |
| | | | | | | | |
Total Malaysia | | | | | | | 152,735 | |
| | | | | | | | |
| | |
Mexico (1.32%) | | | | | | | | |
Gruma SAB de CV, Class B | | | 9,257 | | | | 134,704 | |
Grupo Mexico SAB de CV, Series B | | | 41,234 | | | | 90,013 | |
Industrias Penoles SAB de CV | | | 2,699 | | | | 33,855 | |
Southern Copper Corp. | | | 1,070 | | | | 27,531 | |
| | | | | | | | |
Total Mexico | | | | | | | 286,103 | |
| | | | | | | | |
6 | November 30, 2015
| | |
Global Commodity Equity ETF | | |
| |
| Schedule of Investments | | November 30, 2015 |
| | | | | | | | |
| Security Description | | Shares | | | Value | |
| |
Netherlands (1.95%) | | | | | | | | |
Royal Dutch Shell PLC, Class A | | | 16,967 | | | $ | 423,065 | |
| | | | | | | | |
Total Netherlands | | | | | | | 423,065 | |
| | | | | | | | |
| | |
Norway (1.34%) | | | | | | | | |
Norsk Hydro ASA | | | 10,591 | | | | 40,948 | |
Yara International ASA | | | 5,421 | | | | 250,947 | |
| | | | | | | | |
Total Norway | | | | | | | 291,895 | |
| | | | | | | | |
| | |
Peru (0.09%) | | | | | | | | |
Companhia de Minas Buenaventura SA, ADR | | | 4,266 | | | | 20,221 | |
| | | | | | | | |
Total Peru | | | | | | | 20,221 | |
| | | | | | | | |
| | |
Poland (0.11%) | | | | | | | | |
KGHM Polska Miedz SA | | | 1,350 | | | | 24,153 | |
| | | | | | | | |
Total Poland | | | | | | | 24,153 | |
| | | | | | | | |
| | |
Russia (5.35%) | | | | | | | | |
Gazprom PAO, Sponsored ADR | | | 53,668 | | | | 221,703 | |
LUKOIL OAO PJSC, Sponsored ADR | | | 3,678 | | | | 141,713 | |
MMC Norilsk Nickel PJSC, ADR | | | 15,271 | | | | 206,540 | |
NovaTek OAO, Sponsored GDR(a) | | | 1,397 | | | | 130,759 | |
Phosagro OAO, GDR(a) | | | 13,191 | | | | 172,143 | |
Polymetal International PLC | | | 2,262 | | | | 18,295 | |
Severstal PAO, GDR(a) | | | 1,623 | | | | 17,366 | |
Uralkali PJSC, Sponsored GDR*(a) | | | 19,939 | | | | 255,817 | |
| | | | | | | | |
Total Russia | | | | | | | 1,164,336 | |
| | | | | | | | |
| | |
Singapore (0.99%) | | | | | | | | |
Golden Agri-Resources, Ltd. | | | 214,518 | | | | 54,749 | |
Olam International, Ltd. | | | 17,300 | | | | 22,015 | |
Wilmar International, Ltd. | | | 68,400 | | | | 138,687 | |
| | | | | | | | |
Total Singapore | | | | | | | 215,451 | |
| | | | | | | | |
| | |
South Africa (0.95%) | | | | | | | | |
Anglo American Platinum, Ltd.* | | | 1,078 | | | | 14,914 | |
AngloGold Ashanti, Ltd., Sponsored ADR* | | | 7,050 | | | | 45,120 | |
Gold Fields, Ltd. | | | 14,606 | | | | 37,162 | |
Impala Platinum Holdings, Ltd.* | | | 11,221 | | | | 24,544 | |
Kumba Iron Ore, Ltd. | | | 178 | | | | 554 | |
Lonmin PLC* | | | 9,177 | | | | 170 | |
Sasol, Ltd. | | | 2,292 | | | | 63,826 | |
Sibayne Gold, Ltd. | | | 15,226 | | | | 19,928 | |
| | | | | | | | |
Total South Africa | | | | | | | 206,218 | |
| | | | | | | | |
| | |
South Korea (0.55%) | | | | | | | | |
Hyundai Steel Co. | | | 610 | | | | 26,759 | |
POSCO | | | 642 | | | | 93,690 | |
| | | | | | | | |
Total South Korea | | | | | | | 120,449 | |
| | | | | | | | |
| | | | | | | | |
| Security Description | | Shares | | | Value | |
| |
Spain (0.32%) | | | | | | | | |
Repsol YPF SA | | | 5,402 | | | $ | 70,459 | |
| | | | | | | | |
Total Spain | | | | | | | 70,459 | |
| | | | | | | | |
| | |
Switzerland (5.72%) | | | | | | | | |
Glencore International PLC | | | 41,864 | | | | 60,977 | |
Syngenta AG | | | 3,146 | | | | 1,159,817 | |
Transocean, Ltd. | | | 1,632 | | | | 23,436 | |
| | | | | | | | |
Total Switzerland | | | | | | | 1,244,230 | |
| | | | | | | | |
| | |
Taiwan (0.40%) | | | | | | | | |
China Steel Corp. | | | 108,790 | | | | 60,491 | |
Taiwan Fertilizer Co., Ltd. | | | 22,400 | | | | 27,586 | |
| | | | | | | | |
Total Taiwan | | | | | | | 88,077 | |
| | | | | | | | |
| | |
United Kingdom (6.44%) | | | | | | | | |
Anglo American PLC | | | 11,509 | | | | 70,834 | |
Antofagasta PLC | | | 3,337 | | | | 25,506 | |
BG Group PLC | | | 14,139 | | | | 219,656 | |
BP PLC | | | 82,976 | | | | 481,448 | |
CNH Industrial NV | | | 32,217 | | | | 235,506 | |
Ensco PLC, Class A | | | 1,062 | | | | 18,181 | |
Rio Tinto PLC | | | 10,505 | | | | 349,420 | |
| | | | | | | | |
Total United Kingdom | | | | | | | 1,400,551 | |
| | | | | | | | |
| | |
United States (48.36%) | | | | | | | | |
AGCO Corp. | | | 2,529 | | | | 127,108 | |
Alcoa, Inc. | | | 12,603 | | | | 117,964 | |
Allegheny Technologies, Inc. | | | 1,034 | | | | 13,101 | |
Anadarko Petroleum Corp. | | | 2,302 | | | | 137,890 | |
The Andersons, Inc. | | | 884 | | | | 30,471 | |
Apache Corp. | | | 1,713 | | | | 84,245 | |
Archer-Daniels-Midland Co. | | | 20,248 | | | | 738,850 | |
Baker Hughes, Inc. | | | 2,006 | | | | 108,464 | |
Bunge, Ltd. | | | 4,737 | | | | 315,532 | |
Cabot Oil & Gas Corp. | | | 1,790 | | | | 33,706 | |
Cameron International Corp.* | | | 865 | | | | 59,071 | |
CF Industries Holdings, Inc. | | | 7,871 | | | | 363,168 | |
Cheniere Energy, Inc.* | | | 941 | | | | 44,745 | |
Chesapeake Energy Corp. | | | 2,650 | | | | 13,965 | |
Chevron Corp. | | | 8,565 | | | | 782,156 | |
Cliffs Natural Resources, Inc. | | | 1,276 | | | | 2,858 | |
ConocoPhillips | | | 5,602 | | | | 302,788 | |
Continental Resources, Inc.* | | | 402 | | | | 14,593 | |
Deere & Co. | | | 10,555 | | | | 839,861 | |
Devon Energy Corp. | | | 1,728 | | | | 79,505 | |
EOG Resources, Inc. | | | 2,472 | | | | 206,239 | |
EQT Corp. | | | 674 | | | | 38,566 | |
Exxon Mobil Corp. | | | 18,947 | | | | 1,547,212 | |
Freeport-McMoRan, Inc. | | | 9,837 | | | | 80,467 | |
Halliburton Co. | | | 3,674 | | | | 146,409 | |
Hecla Mining Co. | | | 8,152 | | | | 15,733 | |
Hess Corp. | | | 1,149 | | | | 67,791 | |
Ingredion, Inc. | | | 2,392 | | | | 235,779 | |
Intrepid Potash, Inc.* | | | 1,908 | | | | 6,850 | |
7 | November 30, 2015
| | |
Global Commodity Equity ETF | | |
| |
| Schedule of Investments | | November 30, 2015 |
| | | | | | | | | | | | |
| Security Description | | | Shares | | | Value | |
| |
United States (continued) | | | | | |
Kinder Morgan, Inc. | | | | | | | 8,227 | | | $ | 193,910 | |
Marathon Oil Corp. | | | | | | | 3,111 | | | | 54,474 | |
Monsanto Co. | | | | | | | 15,885 | | | | 1,511,617 | |
The Mosaic Co. | | | | | | | 10,833 | | | | 342,756 | |
National Oilwell Varco, Inc. | | | | 1,734 | | | | 64,748 | |
Newmont Mining Corp. | | | | 11,635 | | | | 214,200 | |
Noble Energy, Inc. | | | | | | | 1,912 | | | | 70,113 | |
Nucor Corp. | | | | | | | 3,067 | | | | 127,127 | |
Occidental Petroleum Corp. | | | | 3,455 | | | | 261,163 | |
Pioneer Natural Resources Co. | | | | 668 | | | | 96,693 | |
Reliance Steel & Aluminum Co. | | | | 699 | | | | 41,108 | |
Royal Gold, Inc. | | | | | | | 1,425 | | | | 51,229 | |
Schlumberger, Ltd. | | | | | | | 5,745 | | | | 443,227 | |
Seaboard Corp.* | | | | | | | 13 | | | | 42,900 | |
Southwestern Energy Co.* | | | | 1,728 | | | | 15,569 | |
Spectra Energy Corp. | | | | | | | 3,027 | | | | 79,307 | |
Steel Dynamics, Inc. | | | | | | | 2,233 | | | | 38,832 | |
Stillwater Mining Co.* | | | | 2,535 | | | | 23,728 | |
United States Steel Corp. | | | | 1,393 | | | | 11,241 | |
Valero Energy Corp. | | | | | | | 2,280 | | | | 163,841 | |
The Williams Co., Inc. | | | | 3,123 | | | | 114,177 | |
| | | | | | | | | | | | |
Total United States | | | | | | | | | | | 10,517,047 | |
| | | | | | | | | | | | |
| | |
TOTAL COMMON STOCKS (Cost $35,287,119) | | | | | | | | 21,617,482 | |
| | | | | | | | | | | | |
| | | |
RIGHTS (0.00%)(b) | | | | | | | | | | | | |
South Africa (0.00%)(b) | | | | | | | | | |
Lonmin PLC, strike price 0.01 GBP, expires 12/10/15* | | | | 543,168 | | | | 276 | |
| | | | | | | | | | | | |
| | | |
TOTAL RIGHTS (Cost $0) | | | | | | | | | | | 276 | |
| | | | | | | | | | | | |
| | | |
| | | 7 Day Yield | | | Shares | | | Value | |
| |
| |
SHORT TERM INVESTMENTS (0.28%) | | | | | |
Morgan Stanley Institutional Liquidity Funds, Prime Portfolio | | | 0.105 | % | | | 61,004 | | | | 61,004 | |
| | | | | | | | | | | | |
| |
TOTAL SHORT TERM INVESTMENTS (Cost $61,004) | | | | 61,004 | |
| | | | | | | | | | | | |
| |
TOTAL INVESTMENTS (99.69%)
(Cost $35,348,123) | | | $ | 21,678,762 | |
| |
NET OTHER ASSETS AND LIABILITIES (0.31%) | | | | 68,478 | |
| | | | | | | | | | | | |
| |
NET ASSETS (100.00%) | | | $ | 21,747,240 | |
| | | | | | | | | | | | |
| * | Non-income producing security. |
| (a) | These securities initially sold to other parties pursuant to Regulation S under the 1933 Act and subsequently resold to the Fund. As of November 30, 2015, the aggregate market values of these securities were $576,085, representing 2.65% of the Fund’s net assets. |
| (b) | Less than 0.005% of Net Assets. |
Common Abbreviations:
| | | | |
ADR | | - | | American Depositary Receipt. |
AG | | - | | Aktiengesellschaft is a German term that refers to a |
| | | | corporation that is limited by shares, i.e., owned by |
| | | | shareholders. |
ASA | | - | | Allmennaksjeselskap is the Norwegian term for public |
| | | | limited company. |
BHD | | - | | Berhad (equivalent to Public Limited Company in |
| | | | Malaysia). |
GDR | | - | | Global Depository Receipt. |
Ltd. | | - | | Limited. |
NV | | - | | Naamloze Vennootschap is the Dutch term for a public |
| | | | limited liability corporation. |
OAO | | - | | Otkytoe Aktsionernoe Obshchestvo (open Joint Stock |
| | | | Corporation) is a Russian term for a stock-based |
| | | | corporation. |
PAO | | - | | Publichnoye Aktsionernoe Obshchestvo (public Stock |
| | | | Corporation) is a Russian term for a public stock company. |
PJSC | | - | | Public Joint Stock Company. |
PLC | | - | | Public Limited Company. |
SA | | - | | Generally designated corporations in various countries, |
| | | | mostly those employing the civil law. |
SAB de CV - A variable capital company. |
SpA | | - | | Societa Per Azioni is an Italian shared company. |
|
Currency Abbreviations: |
GBP | | - | | Great British Pound |
|
See Notes to Financial Statements. |
8 | November 30, 2015
| | |
Global Commodity Equity ETF | | |
| |
| Statement of Assets and Liabilities | | November 30, 2015 |
| | | | |
ASSETS: | | | | |
Investments, at value | | $ | 21,678,762 | |
Foreign currency, at value (Cost 3,643) | | | 3,637 | |
Foreign tax reclaims | | | 64,829 | |
Dividends receivable | | | 85,867 | |
| |
Total Assets | | | 21,833,095 | |
| |
| |
LIABILITIES: | | | | |
Payable for shares redeemed | | | 70,074 | |
Payable to adviser | | | 15,781 | |
| |
Total Liabilities | | | 85,855 | |
| |
NET ASSETS | | $ | 21,747,240 | |
| |
| |
NET ASSETS CONSIST OF: | | | | |
Paid-in capital | | $ | 49,609,644 | |
Accumulated net investment income | | | 93,755 | |
Accumulated net realized loss on investments and foreign currency transactions | | | (14,265,749) | |
Net unrealized depreciation on investments and translation of assets and liabilities denominated in foreign currencies | | | (13,690,410) | |
| |
NET ASSETS | | $ | 21,747,240 | |
| |
| |
INVESTMENTS, AT COST | | $ | 35,348,123 | |
| |
PRICING OF SHARES | | | | |
Net Assets | | $ | 21,747,240 | |
Shares of beneficial interest outstanding (Unlimited number of shares authorized, par value $0.01 per share) | | | 700,020 | |
Net Asset Value, offering and redemption price per share | | $ | 31.07 | |
See Notes to Financial Statements.
9 | November 30, 2015
| | |
Global Commodity Equity ETF | | |
| |
| Statement of Operations | | For the Year Ended November 30, 2015 |
| | | | |
INVESTMENT INCOME: | | | | |
Dividends(a) | | $ | 1,291,095 | |
| |
Total Investment Income | | | 1,291,095 | |
| |
| |
EXPENSES: | | | | |
Investment adviser fee | | | 263,275 | |
| |
Total Expenses | | | 263,275 | |
| |
NET INVESTMENT INCOME | | | 1,027,820 | |
| |
| |
REALIZED AND UNREALIZED GAIN/(LOSS) | | | | |
Net realized loss on investments | | | (6,506,881) | |
Net realized loss on foreign currency transactions | | | (6,704) | |
Net change in unrealized depreciation on investments | | | (2,793,537) | |
Net change in unrealized depreciation on translation of assets and liabilities denominated in foreign currencies | | | (15,793) | |
| |
NET REALIZED AND UNREALIZED LOSS ON INVESTMENTS | | | (9,322,915) | |
| |
NET DECREASE IN NET ASSETS RESULTING FROM OPERATIONS | | $ | (8,295,095) | |
| |
| (a) | Net of foreign tax withholding of $91,810. |
See Notes to Financial Statements.
10 | November 30, 2015
| | |
Global Commodity Equity ETF | | |
| |
| Statements of Changes in Net Assets | | |
| | | | | | | | | | | | |
| | | For the | | | For the | |
| | | Year Ended | | | Year Ended | |
| | | November 30, | | | November 30, | |
| | | 2015 | | | 2014 | |
| |
OPERATIONS: | | | | | | | | | | | | |
Net investment income | | $ | | | | | 1,027,820 | | | $ | 1,293,725 | |
Net realized loss on investments and foreign currency transactions | | | | | | | (6,513,585) | | | | (2,536,808) | |
Net change in unrealized depreciation on investments and translation of assets and liabilities denominated in foreign currencies | | | | | | | (2,809,330) | | | | (1,747,903) | |
| |
Net decrease in net assets resulting from operations | | | | | | | (8,295,095) | | | | (2,990,986) | |
| |
| | | |
DISTRIBUTIONS TO SHAREHOLDERS: | | | | | | | | | | | | |
From net investment income | | | | | | | (1,080,790) | | | | (1,308,650) | |
| |
Total distributions | | | | | | | (1,080,790) | | | | (1,308,650) | |
| |
| | | |
CAPITAL SHARE TRANSACTIONS: | | | | | | | | | | | | |
Proceeds from sale of shares | | | | | | | – | | | | 4,383,293 | |
Cost of shares redeemed | | | | | | | (26,564,208) | | | | (4,612,954) | |
| |
Net decrease from share transactions | | | | | | | (26,564,208) | | | | (229,661) | |
| |
Net decrease in net assets | | | | | | | (35,940,093) | | | | (4,529,297) | |
| | | |
NET ASSETS: | | | | | | | | | | | | |
Beginning of year | | | | | | | 57,687,333 | | �� | | 62,216,630 | |
| |
End of year * | | $ | | | | | 21,747,240 | | | $ | 57,687,333 | |
| |
| | | |
*Including accumulated net investment income of: | | $ | | | | | 93,755 | | | $ | 153,398 | |
| | | |
OTHER INFORMATION: | | | | | | | | | | | | |
CAPITAL SHARE TRANSACTIONS: | | | | | | | | | | | | |
Beginning shares | | | | | | | 1,450,020 | | | | 1,450,020 | |
Shares sold | | | | | | | – | | | | 100,000 | |
Shares redeemed | | | | | | | (750,000) | | | | (100,000) | |
| |
Shares outstanding, end of year | | | | | | | 700,020 | | | | 1,450,020 | |
| |
See Notes to Financial Statements.
11 | November 30, 2015
| | |
Global Commodity Equity ETF | | |
| |
| Financial Highlights | | For a Share Outstanding Throughout the Periods Presented |
| | | | | | | | | | | | | | | | | | | | | | | | |
| | | | | | | | | | | | | | | For the Period | | | | |
| | | For the Year | | | For the Year | | | For the Year | | | For the Year | | | January 1, | | | For the Year | |
| | | Ended | | | Ended | | | Ended | | | Ended | | | 2011 to | | | Ended | |
| | | November 30, | | | November 30, | | | November 30, | | | November 30, | | | November 30, | | | December 31, | |
| | | 2015 | | | 2014(a)(a) | | | 2013 | | | 2012 | | | 2011(b) | | | 2010 | |
| |
NET ASSET VALUE, BEGINNING OF PERIOD | | $ | 39.78 | | | $ | 42.91 | | | $ | 44.11 | | | $ | 44.65 | | | $ | 49.33 | | | $ | 42.82 | |
| | | | | | |
INCOME/(LOSS) FROM INVESTMENT OPERATIONS: | | | | | | | | | | | | | | | | | | | | | | | | |
Net investment income (c) | | | 0.94 | | | | 0.86 | | | | 0.81 | | | | 0.71 | | | | 0.58 | | | | 0.46 | |
Net realized and unrealized gain/(loss) | | | (8.69 | ) | | | (3.11 | ) | | | (1.17 | ) | | | (0.57 | ) | | | (4.78 | ) | | | 6.54 | |
| |
Total from investment operations | | | (7.75 | ) | | | (2.25 | ) | | | (0.36 | ) | | | 0.14 | | | | (4.20 | ) | | | 7.00 | |
| |
| | | | | | |
DISTRIBUTIONS: | | | | | | | | | | | | | | | | | | | | | | | | |
From net investment income | | | (0.96 | ) | | | (0.88 | ) | | | (0.84 | ) | | | (0.68 | ) | | | (0.48 | ) | | | (0.49 | ) |
| |
Total distributions | | | (0.96 | ) | | | (0.88 | ) | | | (0.84 | ) | | | (0.68 | ) | | | (0.48 | ) | | | (0.49 | ) |
| |
| | | | | | |
NET INCREASE/(DECREASE) IN NET ASSET VALUE | | | (8.71) | | | | (3.13) | | | | (1.20) | | | | (0.54) | | | | (4.68) | | | | 6.51 | |
| |
NET ASSET VALUE, END OF PERIOD | | $ | 31.07 | | | $ | 39.78 | | | $ | 42.91 | | | $ | 44.11 | | | $ | 44.65 | | | $ | 49.33 | |
| |
TOTAL RETURN(d) | | | (19.75)% | | | | (5.43)% | | | | (0.78)% | | | | 0.35% | | | | (8.56)% | | | | 16.60% | |
| | | | | | |
RATIOS/SUPPLEMENTAL DATA: | | | | | | | | | | | | | | | | | | | | | | | | |
Net assets, end of period (000s) | | $ | 21,747 | | | $ | 57,687 | | | $ | 62,217 | | | $ | 77,199 | | | $ | 91,539 | | | $ | 111,001 | |
Ratio of expenses to average net assets | | | 0.65% | | | | 0.65% | | | | 0.65% | | | | 0.65% | | | | 0.65%(e) | | | | 0.65% | |
Ratio of net investment – to average net assets | | | 2.54% | | | | 1.97% | | | | 1.86% | | | | 1.61% | | | | 1.29%(e) | | | | 1.09% | |
Portfolio turnover rate(f) | | | 17% | | | | 12% | | | | 20% | | | | 13% | | | | 10% | | | | 18% | |
| (a) | Prior to March 31, 2014 the Global Commodity Equity ETF was known as the Jefferies | TR/J CRB Global Commodity Equity Index Fund. |
| (b) | Effective March 7, 2011, the Board approved changing the fiscal year end of the Fund from December 31 to November 30. |
| (c) | Based on average shares outstanding during the period. |
| (d) | Total return is calculated assuming an initial investment made at the net asset value at the beginning of the period and redemption at the net asset value on the last day of the period and assuming all distributions are reinvested at reinvestment prices. Total return calculated for a period of less than one year is not annualized. |
| (f) | Portfolio turnover is not annualized and does not include securities received or delivered from processing creations or redemptions. |
See Notes to Financial Statements.
12 | November 30, 2015
| | |
Global Commodity Equity ETF | | |
| |
| Notes to Financial Statements | | November 30, 2015 |
1. ORGANIZATION
The ALPS ETF Trust (the “Trust”), a Delaware statutory trust, is an open-end management investment company under the Investment Company Act of 1940, as amended (the “1940 Act”). As of November 30, 2015, the Trust consists of twenty-one separate portfolios. Each portfolio represents a separate series of the Trust. This report pertains to the Global Commodity Equity ETF (the “Fund”) (prior to March 31, 2014, known as the Jefferies | TR/J CRB Global Commodity Equity Index Fund). The investment objective of the Fund is to seek investment results that replicate as closely as possible, before fees and expenses, the price and yield performance of the Thomson Reuters CRB Commodity Producers Index. The investment advisor uses a “passive” or indexing approach to try to achieve the Fund’s investment objective. The Fund is considered non-diversified and may invest a greater portion of assets in securities of individual issuers than a diversified fund. As a result, changes in the market value of a single investment could cause greater fluctuations in share price than would occur in a diversified fund.
The Fund’s Shares (“Shares”) are listed on the New York Stock Exchange (“NYSE”) Arca. The Fund issues and redeems Shares, at net asset value (“NAV”) in blocks of 50,000 Shares, each of which is called a “Creation Unit”. Creation Units are issued and redeemed principally in-kind for securities included in a specified index. Except when aggregated in Creation Units, Shares are not redeemable securities of the Fund.
Pursuant to the Trust’s organizational documents, its Officers and Trustees are indemnified against certain liability arising out of the performance of their duties to the Trust. Additionally, in the normal course of business, the Trust enters into contracts with service providers that contain general indemnification clauses. The Trust’s maximum exposure under these arrangements is unknown, as this would involve future claims that may be made against the Trust that have not yet occurred.
2. SIGNIFICANT ACCOUNTING POLICIES
The following is a summary of significant accounting policies consistently followed by the Fund in the preparation of the financial statements. The accompanying financial statements were prepared in accordance with accounting principles generally accepted in the United States of America (“U.S. GAAP”). The preparation of financial statements in conformity with U.S. GAAP requires management to make certain estimates and assumptions that affect the reported amounts of assets and liabilities and disclosures of contingent assets and liabilities at the date of the financial statements and the reported amounts of revenue and expenses during the period. Actual results could differ from those estimates. The Fund is considered an investment company under U.S. GAAP and follows the accounting and reporting guidance applicable to investment companies in the Financial Accounting Standards Board Accounting Standards Codification Topic 946.
A. Portfolio Valuation
The Fund’s NAV is determined daily, as of the close of regular trading on the NYSE, normally 4:00 p.m. Eastern time, on each day the NYSE is open for trading. The NAV is computed by dividing the value of all assets of the Fund (including accrued interest and dividends), less all liabilities (including accrued expenses and dividends declared but unpaid), by the total number of shares outstanding.
Portfolio securities listed on any exchange other than the NASDAQ Stock Market LLC (“NASDAQ”) are valued at the last sale price on the business day as of which such value is being determined. If there has been no sale on such day, the securities are valued at the mean of the most recent bid and ask prices on such day. Securities traded on the NASDAQ are valued at the NASDAQ Official Closing Price as determined by NASDAQ. Portfolio securities traded on more than one securities exchange are valued at the last sale price on the business day as of which such value is being determined at the close of the exchange representing the principal market for such securities. Portfolio securities traded in the over-the-counter market, but excluding securities traded on the NASDAQ, are valued at the latest quoted sale price in such market.
The Fund’s investments are valued at market value or, in the absence of market value with respect to any portfolio securities, at fair value according to procedures adopted by the Trust’s Board of Trustees (the “Board”). When market quotations are not readily available or when events occur that make established valuation methods unreliable, securities of the Fund may be valued in good faith by or under the direction of the Board. These securities generally include, but are not limited to, restricted securities (securities which may not be publicly sold without registration under the Securities Act of 1933) for which a pricing service is unable to provide a market price; securities whose trading has been formally suspended; a security whose market price is not available from a pre-established primary pricing source or the pricing source is not willing to provide a price; a security with respect to which an event has occurred that is most likely to materially affect the value of the security after the market has closed but before the calculation of the Fund’s NAV or make it difficult or impossible to obtain a reliable market quotation; or a security whose price, as provided by the pricing service, does not reflect the security’s “fair value” due to the security being de-listed from a national exchange or the security’s primary trading market is temporarily closed at a time when, under normal conditions, it would be open. As a general principle, the current “fair value” of a security would be the amount which the owner might reasonably expect to receive from the sale on the applicable exchange or principal market. A variety of factors may be considered in determining the fair value of such securities.
13 | November 30, 2015
| | |
Global Commodity Equity ETF | | |
| |
| Notes to Financial Statements | | November 30, 2015 |
B. Fair Value Measurements
The Fund discloses the classification of its fair value measurements following a three-tier hierarchy based on the inputs used to measure fair value. Inputs refer broadly to the assumptions that market participants would use in pricing the asset or liability, including assumptions about risk. Inputs may be observable or unobservable. Observable inputs reflect the assumptions market participants would use in pricing the asset or liability that are developed based on market data obtained from sources independent of the reporting entity. Unobservable inputs reflect the reporting entity’s own assumptions about the assumptions market participants would use in pricing the asset or liability that are developed based on the best information available.
Valuation techniques used to value the Fund’s investments by major category are as follows:
Equity securities, including restricted securities, for which market quotations are readily available, are valued at the last reported sale price or official closing price as reported by a third party pricing vendor on the primary market or exchange on which they are traded and are categorized as Level 1 in the hierarchy. In the event there were no sales during the day or closing prices are not available, securities are valued at the mean of the most recent quoted bid and ask prices on such day and are generally categorized as Level 2 in the hierarchy. Investments in open-end mutual funds are valued at their closing NAV each business day and are categorized as Level 1 in the hierarchy.
Changes in valuation techniques may result in transfers in or out of an assigned level within the disclosure hierarchy.
Various inputs are used in determining the value of the Fund’s investments as of the end of the reporting period. When inputs used fall into different levels of the fair value hierarchy, the level in the hierarchy within which the fair value measurement falls is determined based on the lowest level input that is significant to the fair value measurement in its entirety. The designated input levels are not necessarily an indication of the risk or liquidity associated with these investments.
These inputs are categorized in the following hierarchy under applicable financial accounting standards:
| | | | |
Level 1 | | – | | Unadjusted quoted prices in active markets for identical investments, unrestricted assets or liabilities that a Fund has the ability to access at the measurement date; |
Level 2 | | – | | Quoted prices which are not active, quoted prices for similar assets or liabilities in active markets or inputs other than quoted prices that are observable (either directly or indirectly) for substantially the full term of the asset or liability; and |
Level 3 | | – | | Significant unobservable prices or inputs (including the Fund’s own assumptions in determining the fair value of investments) where there is little or no market activity for the asset or liability at the measurement date. |
The following is a summary of the inputs used to value the Fund’s investments at November 30, 2015:
Global Commodity Equity ETF
| | | | | | | | | | | | | | | | |
| | | Level 1 - | | | Level 2 - | | | Level 3 - | | | | |
| | | Unadjusted Quoted | | | Other Significant | | | Significant | | | | |
| Investments in Securities at Value* | | Prices | | | Observable Inputs | | | Unobservable Inputs | | | Total | |
| |
Common Stocks | | | 21,617,482 | | | | – | | | | – | | | | 21,617,482 | |
Rights | | | 276 | | | | – | | | | – | | | | 276 | |
Short Term Investments | | | 61,004 | | | | – | | | | – | | | | 61,004 | |
| |
TOTAL | | $ | 21,678,762 | | | $ | – | | | $ | – | | | $ | 21,678,762 | |
| |
| * | For a detailed country breakdown, see the accompanying Schedule of Investments. |
The Fund recognizes transfers between levels as of the end of the period. For the year ended November 30, 2015, the Fund did not have any transfers between Level 1 and Level 2 securities. The Fund did not have any securities which used significant unobservable inputs (Level 3) in determining fair value.
C. Foreign Securities
The Fund may directly purchase securities of foreign issuers. Investing in securities of foreign issuers involves special risks not typically associated with investing in securities of U.S. issuers. The risks include possible reevaluation of currencies, the inability to repatriate foreign currency, less complete financial information about companies and possible future adverse political and economic developments.
Moreover, securities of many foreign issuers and their markets may be less liquid and their prices more volatile than those of securities of comparable U.S. issuers.
14 | November 30, 2015
| | |
Global Commodity Equity ETF | | |
| |
| Notes to Financial Statements | | November 30, 2015 |
D. Foreign Currency Translation
The books and records of the Fund are maintained in U.S. dollars. Investment valuations and other assets and liabilities initially expressed in foreign currencies are converted each business day into U.S. dollars based upon current exchange rates. The portion of realized and unrealized gains or losses on investments due to fluctuations in foreign currency exchange rates is not separately disclosed and is included in realized and unrealized gains or losses on investments, when applicable.
E. Securities Transactions and Investment Income
Securities transactions are recorded as of the trade date. Realized gains and losses from securities transactions are recorded on the highest cost basis. Dividend income and capital gains distributions, if any, are recorded on the ex-dividend date, net of any foreign taxes withheld. Interest income, if any, is recorded on the accrual basis.
F. Dividends and Distributions to Shareholders
Dividends from net investment income of the Fund, if any, are declared and paid quarterly or as the Board may determine from time to time. Distributions of net realized capital gains earned by the Fund, if any, are distributed at least annually.
G. Federal Tax and Tax Basis Information
The timing and character of income and capital gain distributions are determined in accordance with income tax regulations, which may differ from U.S. GAAP. Reclassifications are made to the Fund’s capital accounts for permanent tax differences to reflect income and gains available for distribution (or available capital loss carryforwards) under income tax regulations.
For the year ended November 30, 2015, the following reclassifications, which had no impact on results of operations or net assets, were recorded to reflect permanent tax differences resulting primarily from in-kind transactions:
| | | | | | | | | | | | |
| | | Undistributed Net | | | Accumulated Net | | | | |
| Fund | | Investment Loss | | | Realized Gain | | | Paid-in Capital | |
| |
Global Commodity Equity ETF | | $ | (6,673) | | | $ | 2,727,432 | | | $ | (2,720,759) | |
The tax character of the distributions paid was as follows:
| | | | |
| | | Ordinary Income | |
| |
November 30, 2015 | | | | |
Global Commodity Equity ETF | | $ | 1,080,790 | |
November 30, 2014 | | | | |
Global Commodity Equity ETF | | $ | 1,308,650 | |
As of November 30, 2015, the components of distributable earnings on a tax basis for the Fund were as follows: | |
| | | Global Commodity Equity ETF | |
| |
Undistributed net investment income | | $ | 93,755 | |
Accumulated net realized loss on investments | | | (13,950,892) | |
Net unrealized depreciation on investments | | | (14,005,267) | |
| |
Total | | $ | (27,862,404) | |
| |
Under the Regulated Investment Company Modernization Act of 2010 (“the Modernization Act”), net capital losses recognized in tax years beginning after December 22, 2010 may be carried forward indefinitely, and the character of the losses is retained as short-term and/or long-term. Under the law in effect prior to the Modernization Act, net capital losses were carried forward for eight years and treated as short-term. As a transition rule, the Modernization Act requires that post-enactment net capital losses be used before pre-enactment net capital losses. Additionally, post-enactment capital losses that are carried forward will retain their character as either short-term or long-term losses rather than being considered all short-term as under previous law.
15 | November 30, 2015
| | |
Global Commodity Equity ETF | | |
| |
| Notes to Financial Statements | | November 30, 2015 |
At November 30, 2015, the Fund had available for tax purposes unused pre-enactment capital loss carryforwards as follows:
| | | | |
| | | Expiring in 2018 | |
| |
Global Commodity Equity ETF | | $ | 679,396 | |
At November 30, 2015, the Fund had available for tax purposes unused post-enactment capital loss carryforwards as follows:
| | | | | | | | |
| Fund | | Short-Term | | | Long-Term | |
| |
Global Commodity Equity ETF | | $ | 1,642,571 | | | $ | 11,628,925 | |
As of November 30, 2015, the cost of investments for federal income tax purposes and accumulated net unrealized appreciation/(depreciation) on investments were as follows:
| | | | |
| | | Global Commodity Equity ETF | |
| |
Gross appreciation (excess of value over tax cost) | | $ | 1,019,206 | |
Gross depreciation (excess of tax cost over value) | | | (15,003,424) | |
Net unrealized depreciation of foreign currency | | | (21,049) | |
| |
Net unrealized appreciation/(depreciation) | | | (14,005,267) | |
| |
Cost of investments for income tax purposes | | $ | 35,662,980 | |
| |
The differences between book-basis and tax-basis are due to the deferral of losses from wash sales.
H. Income Taxes
No provision for income taxes is included in the accompanying financial statements, as the Fund intends to distribute to shareholders all taxable investment income and realized gains and otherwise comply with Subchapter M of the Internal Revenue Code of 1986, as amended, applicable to regulated investment companies. The Fund evaluates tax positions taken (or expected to be taken) in the course of preparing the Fund’s tax returns to determine whether these positions meet a “more-likely-than-not” standard that, based on the technical merits, have a more than fifty percent likelihood of being sustained by a taxing authority upon examination. A tax position that meets the “more-likely-than-not” recognition threshold is measured to determine the amount of benefit to recognize in the financial statements.
As of and during the year ended November 30, 2015, the Fund did not have a liability for any unrecognized tax benefits. The Fund files U.S. federal, state, and local tax returns as required. The Fund’s tax returns are subject to examination by the relevant tax authorities until expiration of the applicable statute of limitations which is generally three years after the filing of the tax return, but may extend to four years in certain jurisdictions. Tax returns for open years have incorporated no uncertain tax positions that require a provision for income taxes.
3. INVESTMENT ADVISORY FEE AND OTHER AFFILIATED TRANSACTIONS
ALPS Advisors, Inc. (the “Adviser”) acts as the Fund’s investment adviser pursuant to an advisory agreement with the Trust on behalf of the Fund (the “Advisory Agreement”). Pursuant to the Advisory Agreement, the Fund pays the Adviser a unitary fee for the services and facilities it provides payable on a monthly basis at the annual rate of 0.65% of the Fund’s average daily net assets. From time to time, the Adviser may waive all or a portion of its fee.
Out of the unitary management fee, the Adviser pays substantially all expenses of the Fund, including the cost of transfer agency, custody, fund administration, legal, audit, independent trustees and other services, except for interest expenses, distribution fees or expenses, brokerage expenses, taxes and extraordinary expenses, such as litigation, not incurred in the ordinary course of the Fund’s business. The Adviser’s unitary management fee is designed to pay substantially all of the Fund’s expenses and to compensate the Adviser for providing services for the Fund.
ALPS Fund Services, Inc., an affiliate of the Adviser, is the administrator of the Fund.
Each Trustee who is not an officer or employee of the Adviser, any sub-adviser or any of their affiliates (“Independent Trustees”) receives (1) a quarterly retainer of $5,000, (2) a per meeting fee for regularly scheduled meetings of $3,750, (3) $1,500 for any special meeting held outside of a regularly scheduled board meeting, and (4) reimbursement for all reasonable out-of-pocket expenses relating to attendance at meetings.
16 | November 30, 2015
| | |
Global Commodity Equity ETF | | |
| |
| Notes to Financial Statements | | November 30, 2015 |
4. PURCHASES AND SALES OF SECURITIES
For the year ended November 30, 2015, the cost of purchases and proceeds from sales of investment securities, excluding short-term investments and in-kind transactions, were as follows:
| | | | | | | | |
| Fund | | Purchases | | | Sales | |
| |
Global Commodity Equity ETF | | $ | 6,829,956 | | | $ | 7,385,396 | |
For the year ended November 30, 2015, the cost of in-kind purchases and proceeds from in-kind sales were as follows:
| | | | | | | | |
| Fund | | Purchases | | | Sales | |
| |
Global Commodity Equity ETF | | $ | – | | | $ | 25,936,440 | |
The Global Commodity Equity ETF had in-kind net realized gain/(loss) of $(2,578,222).
Gains on in-kind transactions are not considered taxable for federal income tax purposes.
5. CAPITAL SHARE TRANSACTIONS
Shares are created and redeemed by the Fund only in Creation Unit size aggregations of 50,000. Only broker-dealers or large institutional investors with creation and redemption agreements called Authorized Participants (“AP”) are permitted to purchase or redeem Creation Units from the Fund. Such transactions are generally permitted on an in-kind basis, with a balancing cash component to equate the transaction to the NAV per unit of the Fund on the transaction date. Cash may be substituted equivalent to the value of certain securities generally when they are not available in sufficient quantity for delivery, not eligible for trading by the AP or as a result of other market circumstances.
17 | November 30, 2015
| | |
Global Commodity Equity ETF | | |
| |
| Additional Information | | November 30, 2015 (Unaudited) |
PROXY VOTING RECORDS, POLICIES AND PROCEDURES
Information regarding how the Fund voted proxies relating to portfolio securities during the most recent 12-month period ended June 30 and a description of the Fund’s proxy voting policies and procedures used in determining how to vote for proxies are available without charge on the Securities and Exchange Commission’s (“SEC”) website at www.sec.gov and upon request, by calling (toll-free) 1-866-675-2639.
PORTFOLIO HOLDINGS
The Trust is required to disclose, after its first and third fiscal quarters, the complete schedule of each Fund’s portfolio holdings with the SEC on Form N-Q. Form N-Q for each Fund will be available on the SEC’s website at www.sec.gov. Each Fund’s Form N-Q may also be reviewed and copied at the SEC’s Public Reference Room in Washington, D.C. and information on the operation of the Public Reference Room may be obtained by calling 1-800-SEC-0330. Each Fund’s Form N-Q will be available without charge, upon request, by calling (toll-free) 1-866-675-2639 or by writing to ALPS ETF Trust at 1290 Broadway, Suite 1100, Denver, Colorado 80203.
TAX INFORMATION
The Fund designates the following for federal income tax purposes for distributions made during the calendar year ended December 31, 2014:
| | | | |
| | | Qualified Dividend Income | | Dividend Received Deduction |
|
Global Commodity Equity ETF | | 97.35% | | 44.92% |
In early 2015, if applicable, shareholders of record received this information for the distributions paid to them by the Fund during the calendar year 2014 via Form 1099. The Fund will notify shareholders in early 2016 of amounts paid to them by the Fund, if any, during the calendar year 2015.
LISCENSING AGREEMENT
S-Network® Global Indexes, Inc. (the “Index Provider”) is not affiliated with the Trust, the Adviser or the Distributor. The Adviser has entered into a license agreement with the Index Provider to use the Fund’s Index.
The Index Provider is the designer of the construction and methodology for the Index. “Thomson,” “Thomson Reuters,” “Reuters” and “CRB” are service marks or trademarks of Reuters America LLC, a Thomson Reuters company, or its affiliates (“Thomson Reuters”). Thomson Reuters acts as brand licensor for the Underlying Index. Thomson Reuters is not responsible for the descriptions of the Underlying Index or the Fund that appear herein. Thomson Reuters is not affiliated with the Index Provider, the Trust, the Adviser or the Distributor.
The Index Provider, Thomson Reuters and their affiliates and their respective directors, officers and employees (collectively the “Index Parties”) may buy or sell securities contemplated herein as agent or as principal for their own account and may have positions or engage in transactions based on or indexed to the Index. It is possible that such trading activity will affect the value of the Index and the Fund.
THE FUND IS NOT SPONSORED, ENDORSED, SOLD OR PROMOTED BY REUTERS AMERICA LLC (“THOMSON REUTERS”), S-NETWORK GLOBAL INDEXES, INC. (“SNGI”) OR ANY OF THEIR SUBSIDIARIES OR AFFILIATES (COLLECTIVELY THE “INDEX PARTIES”). THE INDEX PARTIES MAKE NO REPRESENTATION OR WARRANTY, EXPRESS OR IMPLIED, TO THE OWNERS OF THE FUND OR ANY MEMBER OF THE PUBLIC REGARDING THE ADVISABILITY OF INVESTING IN SECURITIES OR COMMODITIES GENERALLY OR IN THE FUND PARTICULARLY. THE INDEX PARTIES’ ONLY RELATIONSHIP TO THE FUND AND THE FUND (THE “LICENSEE”) IS THE LICENSING OF THE THOMSON REUTERS CRB COMMODITY PRODUCERS INDEX NAME TO WHICH THE PRODUCT REFERS. THE INDEX IS DETERMINED AND COMPOSED WITHOUT REGARD TO THE LICENSEE OR THE FUND. THE INDEX PARTIES HAVE NO OBLIGATION TO TAKE THE NEEDS OF THE LICENSEE OR THE OWNERS OF THE FUND INTO CON SID ERA TION IN CONNECTION WITH THE FOREGOING. THE INDEX PARTIES ARE NOT RESPONSIBLE FOR AND HAVE NOT PARTICIPATED IN THE DETERMINATION OF THE TIMING OF, PRICES AT, OR QUANTITIES OF THE FUND TO BE ISSUED OR IN THE DETERMINATION OR CALCULATION OF THE EQUATION BY WHICH THE FUND IS TO BE CONVERTED INTO CASH. THE INDEX PARTIES HAVE NO OBLIGATION OR LIABILITY IN CONNECTION WITH THE ADMINISTRATION, MARKETING OR TRADING OF THE FUND.
THE INDEX PARTIES DO NOT GUARANTEE THE ACCURACY AND/OR THE COMPLETENESS OF THE THOMSON REUTERS CRB COMMODITY PRODUCERS INDEX OR ANY DATA INCLUDED THEREIN AND THE INDEX PARTIES SHALL HAVE NO LIABILITY FOR ANY ERRORS, OMISSIONS, OR INTERRUPTIONS THEREIN. THE INDEX PARTIES MAKE NO WARRANTY, EXPRESS OR IMPLIED, AS TO RESULTS TO BE OBTAINED BY LICENSEE, OWNERS OF THE FUND, OR ANY OTHER PERSON OR ENTITY FROM THE USE OF THE THOMSON REUTERS CRB COMMODITY PRODUCERS INDEX OR ANY DATA INCLUDED THEREIN. THE INDEX PARTIES MAKE NO EXPRESS OR IMPLIED WARRANTIES, AND EXPRESSLY DISCLAIM ALL WARRANTIES OF MERCHANTABILITY OR
18 | November 30, 2015
| | |
Global Commodity Equity ETF | | |
| |
| Additional Information | | November 30, 2015 (Unaudited) |
FITNESS FOR A PARTICULAR PURPOSE OR USE WITH RESPECT TO THE THOMSON REUTERS CRB COMMODITY PRODUCERS INDEX OR ANY DATA INCLUDED THEREIN. WITHOUT LIMITING ANY OF THE FOREGOING, IN NO EVENT SHALL THE INDEX PARTIES HAVE ANY LIABILITY FOR ANY SPECIAL, PUNITIVE, INDIRECT, OR CONSEQUENTIAL DAMAGES (INCLUDING LOST PROFITS), EVEN IF NOTIFIED OF THE POSSIBILITY OF SUCH DAMAGES.
The Adviser does not guarantee the accuracy and/or the completeness of the Index or any data included therein, and the Adviser shall have no liability for any errors, omissions or interruptions therein. The Adviser makes no warranty, express or implied, as to results to be obtained by the Fund, owners of the Shares of the Fund or any other person or entity from the use of the Index or any data included therein. The Adviser makes no express or implied warranties, and expressly disclaims all warranties of merchantability or fitness for a particular purpose or use with respect to the Index or any data included therein. Without limiting any of the foregoing, in no event shall the Adviser have any liability for any special, punitive, direct, indirect or consequential damages (including lost profits) arising out of matters relating to the use of the Underlying Index, even if notified of the possibility of such damages.
19 | November 30, 2015
| | |
Global Commodity Equity ETF | | |
| |
Board Considerations Regarding Approval of Investment Advisory Agreement | | November 30, 2015 (Unaudited) |
At an in-person meeting held on June 8, 2015, the Board of Trustees of the Trust (the “Board” or “Trustees”), including the Trustees who are not “interested persons” of the Trust within the meaning of the 1940 Act, as amended (the “Independent Trustees”), evaluated a proposal to approve the continuance of the Advisory Agreement between the Trust and ALPS Advisors, Inc. (the “Adviser”) with respect to the Global Commodity Equity Trust ETF (“CRBQ” or “the Fund”). The Independent Trustees also met separately to consider the Advisory Agreement.
In evaluating the Investment Advisory Agreement with respect to CRBQ, the Trustees considered various factors, including (i) the nature, extent and quality of the services to be provided by the Adviser with respect to the Fund under the Investment Advisory Agreement; (ii) the advisory fees and other expenses to be paid by the Fund compared to those of similar funds managed by other investment advisers; (iii) the costs of the services provided to the Fund by the Adviser and the profits realized by the Adviser and its affiliates from its relationship to the Fund; (iv) the extent which economies of scale would be realized if and as the assets of the Fund grow and whether fees reflect the economies of scale for the benefit of shareholders and (v) any additional benefits and other considerations.
With respect to the nature, extent and quality of the services to be provided by the Adviser under the Investment Advisory Agreement, the Trustees considered and reviewed information concerning the services to be provided under the Investment Advisory Agreement, the investment parameters of the index of the Fund, financial information regarding the Adviser and its parent company, information describing the Adviser’s current organization and the background and experience of the persons who would be responsible for the day-to-day management of the Fund.
The Trustees reviewed information on the performance of each Fund and its applicable benchmark. The Trustees also evaluated the correlation and tracking error between the underlying index and the Fund’s performance. Based on their review, the Trustees found that the nature and extent of services provided to the Fund under the Investment Advisory Agreements was appropriate and that the quality was satisfactory.
The Trustees noted that the advisory fee for the Fund was a unitary fee pursuant to which the Adviser assumes all expenses of the Fund (including the cost of transfer agency, custody, fund administration, legal, audit and other services) other than the payments under the Advisory Agreement, brokerage expenses, taxes, interest, litigation expenses and other extraordinary expenses.
The Trustees noted that the advisory fee rate for the Fund is higher than the median of its Strategic Insight expense group. The Fund’s expense ratio, however, is at the median of its Strategic Insight expense group.
Based on the foregoing, and the other information available to them, the Trustees concluded that the advisory fee rate for the Fund was reasonable under the circumstances and in light of the quality of the services provided.
The Trustees considered other benefits available to the Adviser because of its relationship with the Fund and concluded that the advisory fees were reasonable taking into account any such benefits.
The Trustees also considered with respect to the Fund the information provided by the Adviser about the costs and profitability of the Adviser with respect to the Fund. The Trustees reviewed and noted the relatively small sizes of the Fund and concluded that the Adviser was not realizing any economies of scale. The Trustees determined that they would continue to evaluate whether further economies of scale have been achieved on an ongoing basis.
In voting to renew the Investment Advisory Agreement, the Trustees concluded that the terms of the Investment Advisory Agreement are reasonable and fair in light of the services to be performed, the fees paid by certain other funds, expenses to be incurred and such other matters as the Trustees considered relevant in the exercise of their reasonable business judgment. The Trustees did not identify any single factor or group of factors as all important or controlling and considered all factors together.
20 | November 30, 2015
| | |
Global Commodity Equity ETF | | |
| |
| Trustees & Officers | | November 30, 2015 (Unaudited) |
INDEPENDENT TRUSTEES
| | | | | | | | | | |
Name, Address
& Year of Birth* | | Position(s) Held
with Trust | | Term of Office and Length of
Time Served** | | Principal Occupation(s)
During Past 5 Years | | Number of
Portfolios in Fund
Complex Overseen
by Trustees*** | | Other Directorships
Held by Trustees |
|
Mary K. Anstine, 1940 | | Trustee | | Since March 2008 | | Ms. Anstine was formerly an Executive Vice President of First Interstate Bank of Denver until 1994, President/Chief Executive Officer of HealthONE Alliance, Denver, Colorado, from 1994 to 2004, and has been retired since 2004. Ms. Anstine is also Trustee/Director of the following: AV Hunter Trust and Colorado Uplift Board. Ms. Anstine was formerly a Director of the Trust Bank of Colorado (later purchased and now known as Northern Trust Bank), HealthONE and Denver Area Council of the Boy Scouts of America and a member of the American Bankers Association Trust Executive Committee. | | 46 | | Ms. Anstine is a Trustee of ALPS Variable Investment Trust (9 funds); Financial Investors Trust (31 funds); Reaves Utility Income Fund; and Westcore Trust (12 funds). |
|
Jeremy W. Deems, 1976 | | Trustee | | Since March 2008 | | Mr. Deems is the Co-Founder, Chief Financial Officer of Green Alpha Advisors, LLC. Mr. Deems is Co-Portfolio Manager of the Shelton Green Alpha Fund. Prior to joining Green Alpha Advisors, Mr. Deems was CFO and Treasurer of Forward Management, LLC, ReFlow Management Co., LLC, ReFlow Fund, LLC, a private investment fund, and Sutton Place Management, LLC, an administrative services company. | | 46 | | Mr. Deems is a Trustee of ALPS Variable Investment Trust (9 funds); Financial Investors Trust (31 funds); Clough Funds Trust (1 fund); and Reaves Utility Income Fund. |
|
Rick A. Pederson, 1952 | | Trustee | | Since March 2008 | | Mr. Pederson is President, Foundation Properties, Inc. (a real estate investment management company), 1994 - present; Advisory Board Member, Bow River Capital Partners (private equity management), 2003 - present; Advisor, Pauls Corporation (real estate investment management and development), 2008 - present; Chairman, Ross Consulting Group (real estate consulting services) 1983-2013; Advisory Board, Neenan Company (construction services) 2002- present; Board Member, Prosci, Inc. (private business services), 2013-present; Board Member, Citywide Banks (Colorado community bank) 2014-present; Board member, Professional Pediatric Health Care (a Denver-based home nursing firm) 2014 – present; Director, National Western Stock Show (not-for-profit organization); Director, Biennial of the Americas (not-for-profit organization). | | 24 | | Mr. Pederson is Trustee of Westcore Trust (12 funds) and Principal Real Estate Income Fund (1 fund). |
|
| * | The business address of the Trustee is c/o ALPS Advisors, Inc., 1290 Broadway, Suite 1100, Denver, Colorado 80203. |
| ** | This is the period for which the Trustee began serving the Trust. Each Trustee serves an indefinite term, until his successor is elected. |
| *** | The Fund Complex includes all series of the Trust and any other investment companies for which ALPS Advisors, Inc. provides investment advisory services. |
The Statement of Additional Information includes additional information about the Fund’s Trustees and is available, without charge, upon request by calling (toll-free) 1-866-675-2639.
21 | November 30, 2015
| | |
Global Commodity Equity ETF | | |
| |
Trustees & Officers | | November 30, 2015 (Unaudited) |
INTERESTED TRUSTEE
| | | | | | | | | | |
Name, Address
and Year of
Birth of
Interested
Trustee* | | Position(s) Held
with Trust | | Term of Office
and Length of
Time Served** | | Principal Occupation(s) During Past 5 Years | | Number of
Portfolios in Fund
Complex Overseen
by Trustees*** | | Other Directorships
Held by Trustees |
|
| Thomas A. Carter, 1966 | | Trustee and President | | Since March 2008 | | Mr. Carter joined ALPS Fund Services, Inc. (“ALPS”) in 1994 and is currently President and Director of ALPS Advisors, Inc. (“AAI”), and ALPS Portfolio Solutions Distributor, Inc. (“APSD”) and Executive Vice President and Director of ALPS and ALPS Holdings, Inc. (“AHI”), and ALPS Distributors, Inc. (“ADI”). Because of his position with AHI, ALPS, ADI, APSD and AAI, Mr. Carter is deemed an affiliate of the Fund as defined under the 1940 Act. Before joining ALPS, Mr. Carter was with Deloitte & Touche LLP, where he worked with a diverse group of clients, primarily within the financial services industry. Mr. Carter is a Certified Public Accountant and received his Bachelor of Science in Accounting from the University of Colorado at Boulder. | | 34 | | Mr. Carter is a Trustee of ALPS Variable Investment Trust (9 funds) and Principal Real Estate Income Fund (1 fund) |
|
| * | The business address of the Trustee is c/o ALPS Advisors, Inc., 1290 Broadway, Suite 1100, Denver, Colorado 80203. |
| ** | This is the period for which the Trustee began serving the Trust. Each Trustee serves an indefinite term, until his successor is elected. |
| *** | The Fund Complex includes all series of the Trust and any other investment companies for which ALPS Advisors, Inc. provides investment advisory services. |
The Statement of Additional Information includes additional information about the Fund’s Trustees and is available, without charge, upon request by calling (toll-free) 1-866-675-2639.
22 | November 30, 2015
| | |
Global Commodity Equity ETF | | |
| |
| Trustees & Officers | | November 30, 2015 |
OFFICERS
| | | | | | |
Name, Address
and Year of
Birth of Officer* | | Position(s) Held with Trust | | Length of Time
Served** | | Principal Occupation(s) During Past 5 Years |
|
| Erin D. Nelson, 1977 | | Chief Compliance Officer (“CCO”) | | Since
December 2015 | | Erin Nelson became Senior Vice-President and Chief Compliance Officer of ALPS Advisors, Inc. (“AAI”) on July 1, 2015 and prior to that served as Vice President and Deputy Chief Compliance Officer of AAI since January 1, 2015. Prior to January 1, 2015, Ms. Nelson was Vice-President and Assistant General Counsel of ALPS of Fund Services, Inc. Ms. Nelson joined AAI’s parent company, ALPS Holdings, Inc. in January 2003. Ms. Nelson currently is also the Chief Compliance Officer of Principal Real Estate Income Fund, and as of December 2015, the Chief Compliance Officer of Liberty All-Star Equity Fund, Liberty All-Star Growth Fund, Inc., RiverNorth Opportunities Fund, Inc. |
|
| Patrick D. Buchanan, 1972 | | Treasurer | | Since
June 2012 | | Mr. Buchanan is Vice President of AAI. Mr. Buchanan joined ALPS in 2007 and because of his position with AAI, he is deemed an affiliate of the Trust as defined under the 1940 Act. Mr. Buchanan is also Treasurer of the ALPS Variable Insurance Trust, Clough Funds Trust and Principal Real Estate Income Fund. |
|
| William Parmentier, 1952 | | Vice President | | Since
March 2008 | | Mr. Parmentier is Chief Investment Officer, AAI (since 2006); President and Chief Executive Officer of the Liberty All-Star Funds (since April 1999); Senior Vice President (2005-2006), Banc of America Investment Advisors, Inc. Because of his position with AAI, Mr. Parmentier is deemed an affiliate of the Trust as defined under the 1940 Act. |
|
Abigail J. Murray, 1975 | | Secretary | | Since
June 2015 | | Ms. Murray joined ALPS in April 2015. She is currently Vice President and Senior Counsel of ALPS. Prior to joining ALPS, Ms. Murray was an Attorney and Managing Member at Murray & Rouvina PLC from 2014 to 2015 and an Associate with Vedder Price P.C. from 2007 to 2014. Because of her position with ALPS, Ms. Murray is deemed an affiliate of the Trust as defined under the 1940 Act. Ms. Murray is also the Secretary of The Caldwell & Orkin Funds, Inc., Clough Global Opportunities Fund, Clough Global Allocation Fund, Clough Global Equity Fund and Clough Funds Trust. |
|
Jennifer A. Craig, 1973 | | Assistant Secretary | | Since
October 2013 | | Ms. Craig joined ALPS in 2007 and is currently Assistant Vice President and Paralegal Manager. Prior to joining ALPS, Ms. Craig was Legal Manager at Janus Capital Management LLC and served as Assistant Secretary of Janus Investment Fund, Janus Adviser Series and Janus Aspen Series. Because of her position with ALPS, Ms. Craig is deemed an affiliate of the Trust as defined under the 1940 Act. |
|
| * | The business address of the Officer is c/o ALPS Advisors, Inc., 1290 Broadway, Suite 1100, Denver, Colorado 80203. |
| ** | This is the period for which the Officer began serving the Trust. Each Officer serves an indefinite term, until his successor is elected. |
23 | November 30, 2015

ANNUAL REPORT | November 30, 2015 This report has been prepared for shareholders of the ETF described herein and may be distributed to others only if preceded or accompanied by a prospectus. ALPS Portfolio Solutions Distributor, Inc., distributor for the ETF.
table of
CONTENTS
www.alpsfunds.com
| | |
U.S. Equity High Volatility Put Write Index Fund |
Performance Overview | | November 30, 2015 (Unaudited) |
Investment Objective
The U.S. Equity High Volatility Put Write Index Fund (the “Fund”) seeks investment results that correspond generally to the performance, before the Fund’s fees and expenses, of the NYSE Arca U.S. Equity High Volatility Put Write IndexSM (the “Index”). The Index reflects the performance of a portfolio of exchange-traded put options on highly volatile stocks.
The Index measures the return of a hypothetical portfolio consisting of exchange traded put options which have been sold on each of 40 stocks and a cash position. The 40 stocks on which options are sold (“written”) are those 40 stocks from a selection of the largest capitalized (over $5 billion in market capitalization) stocks which also have listed options and which have the highest volatility, as determined by the NYSE Arca, Inc. (the “NYSE Arca”), the Fund’s index provider (the “Index Provider”).
Performance Overview
The twelve month period ended November 30, 2015 marked the second full year for the U.S. Equity High Volatility Put Write Index Fund (HVPW), which listed on the NYSE Arca Exchange on Feb 28, 2013. The Fund was down 1.70% on a total return basis from December 1, 2014 through November 30, 2015, while distributing approximately 9% or $2.07 per share in each of the Fund’s six bi-monthly distributions during this same period.
The Fund’s return was consistent with the Fund’s Underlying Index, which was down 0.34%, after considering the Fund’s fees, the cost of rolling its options every two months, the compounding effect of reinvested distributions in the Index.
Of the 120 two-month options sold by the Fund which expired prior to November 30, 2015, the average premium generated was approximately 3%. Of those 120 options, 21 expired “in-the-money”, and were subsequently closed, while 99 options expired worthless.
Because the Fund collateralizes its short put position by purchasing 3-month T-bills, part of the Fund’s return is generated by interest income. During the 12-month period ending November 30, 2015 interest rates remained very low. Should interest rates increase the Fund’s return due to interest income will also increase.
While not an “apples-to-apples” comparison, over the same time period (from Dec 1, 2014 through Nov 30, 2015), the S&P 500® TR index had a return of 2.75%. The Fund had an annualized historical volatility of 5.92% over this period versus the S&P 500® TR’s annualized historical volatility of 15.31%. The Fund’s correlation and beta for the period were 60.77% and 0.24 respectively as compared to the S&P 500® TR index.
Looking forward we believe the Fund’s strategy of selling high implied volatility put options on a diversified selection of large-capitalization stocks with strike prices that are 15% out-of-the money will continue to provide income potential to investors while at the same time allowing the Fund to experience lower volatility than the broad market.
In October of 2015 the NYSE (the index provider) implemented important changes to the selection process of the underlying names in the index that HVPW tracks, with the objective of lowering exposure to single names and industry sectors.
Increasing the number of underlying names from twenty to forty and ensuring no single economic sector consists of more than 17.5% of the names (a move lower from the previous 50% sector limit), will help potentially mitigate downside movements in single names and/or single sectors.
Ensuring selected underlying names have a price of at least $20 per share versus the previous minimum of $10 per share allows the selection of underlying options with strikes closer to the target of 15% out of the money, a key objective of the index strategy. It may also avoid selecting stocks which may be under duress approaching single-digit share prices.
As far as maintaining yield, we believe the depth of high volatility names in the selection pool is more than adequate to support the index income stream and the changes as a whole should help increase overall total performance.
1 | November 30, 2015
| | |
U.S. Equity High Volatility Put Write Index Fund |
Performance Overview | | November 30, 2015 (Unaudited) |
Definitions:
Beta: A measure of the volatility, or systematic risk, of a security or a portfolio in comparison to the market as a whole. A beta of 1 indicates that the security’s price will move with the market. A beta of less than 1 means that the security will be less volatile than the market. A beta of greater than 1 indicates that the security’s price will be more volatile than the market.
Correlation: measures the extent of linear association between the investment performance and the benchmark performance. A high correlation (positive or negative) means that some of the investment’s performance can be explained by the performance of the benchmark. Positive correlation means that the investment is generally up when the market is up and down when the market is down. It measures only direction of movement over time and not whether the returns are similar. Negative correlation means the investment performance is generally opposite the performance of the benchmark.
“in-the-money”: this occurs if the option’s underlying stock declines below the strike price, the Fund will be required to buy the underlying stock at the strike price, effectively paying the buyer the difference between the strike price and the closing price.
“out-of-the money”: a call option with a strike price that is higher than the market price of the underlying asset, or a put option with a strike price that is lower than the market price of the underlying asset.
Premium: the total cost of an option.
Put Options: are financial instruments that give the owner/buyer the right, but not the obligation, to sell a specified quantity of a security at a set price called the “strike” price on or before an agreed upon expiration date.
Short put: also known as writing a put option, is generally considered more risky than going long since the Fund is obligated to honor its side of the contract should the holder decide to exercise its rights. Typically this strategy is used because the Fund believes the stock’s price will rise above the strike price, leaving the option without any value at expiration and you with the premium.
Strike Price: the specified price at which an option contract may be exercised.
Volatility: is a measure for variation of price of a financial instrument over time.. A higher volatility means that a security’s value can potentially be spread out over a larger range of values. This means that the price of the security can change dramatically over a short time period in either direction. A lower volatility means that a security’s value does not fluctuate dramatically, but changes in value at a steady pace over a period of time.
Growth Of $10,000 (as of November 30, 2015)
Comparison of change in value of a $10,000 investment in the Fund and the Index
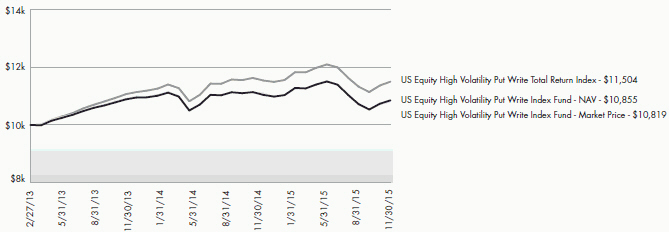
The chart above represents historical performance of a hypothetical investment of $10,000 in the Fund over the life of the Fund. Performance calculations are as of the end of each month. Past performance does not guarantee future results. This chart does not reflect the deduction of taxes that a shareholder would pay on Fund distributions or the redemption of Fund shares.
2 | November 30, 2015
| | |
U.S. Equity High Volatility Put Write Index Fund |
Performance Overview | | November 30, 2015 (Unaudited) |
Fund Performance (as of November 30, 2015)
| | | | |
| | | 1 Year | | Since Inception^ |
US Equity High Volatility Put Write Index Fund - NAV | | -1.70% | | 3.02% |
US Equity High Volatility Put Write Index Fund - Market Price* | | -2.52% | | 2.90% |
US Equity High Volatility Put Write Total Return Index | | -0.34% | | 5.22% |
Total Expense Ratio (per the current prospectus) 0.95%.
Performance data quoted represents past performance. Past performance does not guarantee future results. Investment return and principal value of an investment will fluctuate so that an investor’s shares, when sold or redeemed, may be worth more or less than the original cost. Current performance data may be higher or lower than actual data quoted. For most current month-end performance data please visit www.alpsfunds.com or call 1.855.325.8020.
NAV is an exchange-traded fund’s per-share value. The per-share dollar amount of the fund is derived by dividing the total value of all the securities in its portfolio, less any liabilities, by the number of fund shares outstanding. Market Price is the price at which a share can currently be traded in the market. Information detailing the number of days the Market Price of the Fund was greater than the Fund’s NAV and the number of days it was less than the Fund’s NAV can be obtained at www.alpsfunds.com.
| ^ | The Fund commenced Investment Operations on February 28, 2013. |
| * | Market Price is based on the midpoint of the bid/ask spread at 4 p.m. ET and does not represent the returns an investor would receive if shares were traded at other times. |
NYSE Arca U.S. Equity High Volatility Put Write IndexSM - Total Return: measures the return of a hypothetical portfolio of listed put options on each of 40 stocks and a cash (U.S. T-Bill) position. The 40 underlying stocks on which options are written are a selection of the largest capitalized (over $5 billion in market cap) U.S. listed stocks which also have listed options and which have the highest volatility, as determined by the NYSE Arca, Inc., the Fund’s Index provider. No more than 17.5% of the Index positions will be from the same sector. Total return assumes reinvestment of any dividends and distributions realized during a given time period.
The NYSE Arca U.S. Equity High Volatility Put Write Total Return IndexSM : is a service mark of NYSE Euronext or its affiliates and has been licensed for use by Rich Investment Solutions, LLC in connection with the U.S. Equity High Volatility Put Write Index Fund. Neither the Trust nor the Fund is sponsored, endorsed, sold or promoted by NYSE Euronext. NYSE Euronext makes no representations or warranties regarding the Trust or the Fund or the ability of the NYSE Arca U.S. Equity HighVolatility Put Write IndexSM to track general stock market performance.
S&P 500® Total Return Index: The Standard & Poor’s composite index of 500 stocks, a widely recognized, unmanaged index of common stock prices.
One cannot invest directly in an index. Index performance does not reflect fund performance.
The U.S. Equity High Volatility Put Write Index Fund is not suitable for all investors. Investments in the Fund are subject to investment risks, including possible loss of the principal amount invested.
ALPS Portfolio Solutions Distributor, Inc. is the Distributor for the U.S. Equity High Volatility Put Write Index Fund.
3 | November 30, 2015
| | |
ALPS Enhanced Put Write Strategy ETF |
Performance Overview | | November 30, 2015 (Unaudited) |
Investment Objective
The ALPS Enhanced Put Write Strategy ETF (the “Fund”) total return, with an emphasis on income as the source of that total return.
Performance Overview
The ALPS Enhanced Put Write Strategy ETF (PUTX) listed July 7, 2015 on the NYSE Arca Exchange. With less than 5 months of performance history through November 30, 2015, PUTX was up 0.08% on a total return basis. While not an “apples-to-apples” comparison, over the same time period, the S&P 500® TR index had a return of 0.84%. PUTX had an annualized historical volatility of 11.99% over this period versus the S&P 500® TR’s annualized historical volatility of 17.84%, and the Fund’s correlation and beta for the period were 85.05% and 0.57 respectively as compared to the S&P 500® TR index.
PUTX was designed to be a broad based defensive equity Exchange Traded Fund (ETF), and provides the beneficial features of put writing with the transparency and liquidity of the ETF structure.
PUTX sells 30-day, at-the-money puts on the S&P 500 every month. When the SPDR S&P 500 ETF Trust (SPY) is flat or rising in value, PUTX will provide income. When SPY declines in value, PUTX may lose value because of the put options sold by PUTX. However, the option premium PUTX receives from selling options will offset some portion of the losses from the decline in SPY’s value.
PUTX has similarities to the industry benchmarks CBOE S&P 500 Put Write Index (ticker symbol PUT) and to CBOE S&P 500 BuyWrite Indexes (BXM), which both sell monthly at-the-money options on the S&P500. PUTX was designed to potentially outperform these indices. PUTX is not a passive index tracking fund, so it will not explicitly replicate the PUT index or strategy. PUTX should be able to pick up additional premium over the benchmark index by expanding the underlying options it uses. PUTX will look to sell options on a monthly basis not only on the SPX pm settled options that the PUT index uses, but PUTX but will also be able to sell options on the SPX pm settled options or on the American style options on the ETF SPY. Additionally, PUTX will not simply invest in short term US T-bills like the PUT index; rather PUTX will invest its cash in short-term, investment grade fixed income securities.
Definitions:
Beta: A measure of the volatility, or systematic risk, of a security or a portfolio in comparison to the market as a whole. A beta of 1 indicates that the security’s price will move with the market. A beta of less than 1 means that the security will be less volatile than the market. A beta of greater than 1 indicates that the security’s price will be more volatile than the market.
Correlation: measures the extent of linear association between the investment performance and the benchmark performance. A high correlation (positive or negative) means that some of the investment’s performance can be explained by the performance of the benchmark. Positive correlation means that the investment is generally up when the market is up and down when the market is down. It measures only direction of movement over time and not whether the returns are similar. Negative correlation means the investment performance is generally opposite the performance of the benchmark.
“at-the-money”: this occurs if the option’s strike price is identical to the underlying security’s price.
Premium: the total cost of an option.
Put Options: are financial instruments that give the owner/buyer the right, but not the obligation, to sell a specified quantity of a security at a set price called the “strike” price on or before an agreed upon expiration date.
Strike Price: the specified price at which an option contract may be exercised.
Volatility: is a measure for variation of price of a financial instrument over time.. A higher volatility means that a security’s value can potentially be spread out over a larger range of values. This means that the price of the security can change dramatically over a short time period in either direction. A lower volatility means that a security’s value does not fluctuate dramatically, but changes in value at a steady pace over a period of time.
4 | November 30, 2015
| | |
ALPS Enhanced Put Write Strategy ETF |
Performance Overview | | November 30, 2015 (Unaudited) |
Growth Of $10,000 (as of November 30, 2015)
Comparison of change in value of a $10,000 investment in the Fund and the Index
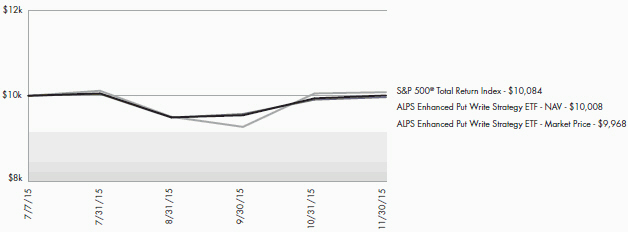
The chart above represents historical performance of a hypothetical investment of $10,000 in the Fund over the life of the Fund. Performance calculations are as of the end of each month. Past performance does not guarantee future results. This chart does not reflect the deduction of taxes that a shareholder would pay on Fund distributions or the redemption of Fund shares.
Fund Performance (as of November 30, 2015)
| | |
| | | Since Inception^ |
ALPS Enhanced Put Write Strategy ETF - NAV | | 0.08% |
ALPS Enhanced Put Write Strategy ETF - Market Price* | | -0.32% |
S&P 500® Total Return Index | | 0.84% |
Total Expense Ratio (per the current prospectus) 0.75%.
Performance data quoted represents past performance. Past performance does not guarantee future results. Investment return and principal value of an investment will fluctuate so that an investor’s shares, when sold or redeemed, may be worth more or less than the original cost. Current performance data may be higher or lower than actual data quoted. For most current month-end performance data please visit www.alpsfunds.com or call 1.866.759.5679.
NAV is an exchange-traded fund’s per-share value. The per-share dollar amount of the fund is derived by dividing the total value of all the securities in its portfolio, less any liabilities, by the number of fund shares outstanding. Market Price is the price at which a share can currently be traded in the market. Information detailing the number of days the Market Price of the Fund was greater than the Fund’s NAV and the number of days it was less than the Fund’s NAV can be obtained at www.alpsfunds.com.
| ^ | The Fund commenced Investment Operations on July 8, 2013. |
| * | Market Price is based on the midpoint of the bid/ask spread at 4 p.m. ET and does not represent the returns an investor would receive if shares were traded at other times. |
S&P 500® Total Return Index: The Standard & Poor’s composite index of 500 stocks, a widely recognized, unmanaged index of common stock prices.
One cannot invest directly in an index. Index performance does not reflect fund performance.
The ALPS Enhanced Put Write Strategy ETF is not suitable for all investors. Investments in the Fund are subject to investment risks, including possible loss of the principal amount invested.
The ALPS Enhanced Put Write Strategy ETF is a new product with a limited operating history.
ALPS Portfolio Solutions Distributor, Inc. is the Distributor for the ALPS Enhanced Put Write Strategy ETF.
5 | November 30, 2015
| | |
ALPS Enhanced Put Write Strategy ETF |
Performance Overview | | November 30, 2015 (Unaudited) |
Top 10 Holdings* (as of November 30, 2015)
| | | | |
U.S. Treasury Bill Discount Notes | | | 12.98% | |
Beam Suntory, Inc., Sr. Unsec | | | 4.42% | |
Mondelez International, Inc., Sr. Unsec. | | | 4.34% | |
Omnicom Group, Inc., Sr. Unsec. | | | 4.07% | |
Quest Diagnostics, Inc., Sr. Unsec. | | | 4.02% | |
Mohawk Industries, Inc., Sr. Unsec. | | | 4.02% | |
Lloyds Bank PLC, Sr. Unsec. | | | 4.02% | |
Pitney Bowes, Inc., Sr. Unsec. | | | 4.01% | |
The Goldman Sachs Group, Inc., Sr. Unsec. | | | 4.01% | |
Brown-Forman Corp., Sr. Unsec. | | | 4.00% | |
Total % of Top 10 Holdings | | | 49.89% | |
Future holdings are subject to change
6 | November 30, 2015
| | |
Put Write Funds |
Disclosure of Fund Expenses | | November 30, 2015 (Unaudited) |
Shareholder Expense Example: As a shareholder of the Fund, you incur two types of costs: (1) transaction costs which may include creation and redemption fees or brokerage charges, and (2) ongoing costs, including management fees and other Fund expenses. These examples are intended to help you understand your ongoing costs (in dollars) of investing in the Fund and to compare these costs with the ongoing costs of investing in other funds. It is based on an investment of $1,000 invested at the beginning of the (six month) period and held through November 30, 2015.
Actual Return: The first line of the table provides information about actual account values and actual expenses. You may use the information in this table, together with the amount you invested, to estimate the expenses that you incurred over the period. Simply divide your account value by $1,000 (for example, an $8,600 account value divided by $1,000 = 8.6), then multiply the result by the number in the first line under the heading entitled “Expenses Paid During the Period” to estimate the expenses attributable to your investment during this period.
Hypothetical 5% Return: The second line of the table provides information about hypothetical account values and hypothetical expenses based on the Fund’s actual expense ratio and an assumed rate of return of 5% per year before expenses, which is not the Fund’s actual return. The hypothetical account values and expenses may not be used to estimate the actual ending account balance or expenses you paid for the period. You may use this information to compare ongoing costs of investing in the Fund and other funds. To do so, compare this 5% hypothetical example with the 5% hypothetical examples that appear in the shareholder reports of the other funds.
The expenses shown in the table are meant to highlight ongoing Fund costs only and do not reflect any transaction costs, such as creation and redemption fees, or brokerage charges. Therefore, the second line is useful in comparing ongoing costs only, and will not help you determine the relative total costs of owning different funds. In addition, if these costs were included, your costs would have been higher.
| | | | | | | | | | | | | | | | |
| | | Beginning Account
Value 6/1/15 | | | Ending Account
Value 11/30/15 | | | Expense
Ratio(a) | | | Expenses Paid During Period 6/1/15 -11/30/15(b) | |
U.S. Equity High Volatility Put Write Index Fund | | | | | | | | | | | | | | | | |
Actual | | | $1,000.00 | | | | $943.30 | | | | 0.95% | | | | $4.63 | |
Hypothetical (5% return before expenses) | | | $1,000.00 | | | | $1,020.31 | | | | 0.95% | | | | $4.81 | |
ALPS Enhanced Put Write Strategy ETF | | | | | | | | | | | | | | | | |
Actual(c) | | | $1,000.00 | | | | $1,000.80 | | | | 0.75% | | | | $3.00 | |
Hypothetical (5% return before expenses) | | | $1,000.00 | | | | $1,021.31 | | | | 0.75% | | | | $3.80 | |
| (a) | Annualized, based on the Fund’s most recent fiscal half year expenses. |
| (b) | Expenses are equal to the Fund’s annualized expense ratio multiplied by the average account value over the period, multiplied by the number of days in the most recent fiscal half year (183), divided by 365. |
| (c) | ALPS Enhanced Put Write Strategy ETF commenced operations on July 8, 2015. Actual expenses are equal to the Fund’s annualized expense ratio multiplied by the average account value of the period, multiplied by the number of days since the Fund launched (146), divided by 365. |
7 | November 30, 2015
| | |
Put Write Funds | | |
Report of Independent Registered Public Accounting Firm |
To the Board of Trustees and Shareholders of ALPS ETF Trust:
We have audited the accompanying statements of assets and liabilities, including the schedules of investments, of U.S. Equity High Volatility Put Write Index Fund and ALPS Enhanced Put Write Strategy ETF, two of the portfolios constituting the ALPS ETF Trust (the “Trust”), as of November 30, 2015, and as to the U.S. Equity High Volatility Put Write Index Fund, the related statement of operations for the year then ended, the statements of changes in net assets for each of the two years in the period then ended, and the financial highlights for each of the periods presented, and as to the ALPS Enhanced Put Write Strategy ETF, the related statement of operations, changes in net assets, and the financial highlights for the period July 8, 2015 (commencement of operations) to November 30, 2015. These financial statements and financial highlights are the responsibility of the Trust’s management. Our responsibility is to express an opinion on these financial statements and financial highlights based on our audits.
We conducted our audits in accordance with the standards of the Public Company Accounting Oversight Board (United States). Those standards require that we plan and perform the audit to obtain reasonable assurance about whether the financial statements and financial highlights are free of material misstatement. The Trust is not required to have, nor were we engaged to perform, an audit of its internal control over financial reporting. Our audits included consideration of internal control over financial reporting as a basis for designing audit procedures that are appropriate in the circumstances, but not for the purpose of expressing an opinion on the effectiveness of the Trust’s internal control over financial reporting. Accordingly, we express no such opinion. An audit also includes examining, on a test basis, evidence supporting the amounts and disclosures in the financial statements, assessing the accounting principles used and significant estimates made by management, as well as evaluating the overall financial statement presentation. Our procedures included confirmation of securities owned as of November 30, 2015, by correspondence with the custodian and brokers; where replies were not received from brokers, we performed other auditing procedures. We believe that our audits provide a reasonable basis for our opinion.
In our opinion, the financial statements and financial highlights referred to above present fairly, in all material respects, the financial position of U.S. Equity High Volatility Put Write Index Fund and ALPS Enhanced Put Write Strategy ETF of the ALPS ETF Trust as of November 30, 2015, the results of their operations, the changes in their net assets, and the financials highlights for each of the periods presented, in conformity with accounting principles generally accepted in the United States of America.
DELOITTE & TOUCHE LLP
Denver, Colorado
January 28, 2016
8 | November 30, 2015
| | |
U.S. Equity High Volatility Put Write Index Fund |
Schedule of Investments | | November 30, 2015 |
| | | | | | | | |
| Security Description | | | | Shares | | Value | |
| |
COMMON STOCK (0.25%) | | | | | | | | |
Consumer Discretionary (0.25%) | | | | | | | | |
Skechers U.S.A. Inc., Class A(a)(b) | | | | 4,200 | | $ | 126,840 | |
| | | |
TOTAL COMMON STOCK (Cost $163,758) | | | | | | | 126,840 | |
| | | | | | | | |
| | | |
| Security Description | | | | Principal Amount | | Value | |
| |
GOVERNMENT BOND (9.77%) | | | | | | | | |
U.S. Treasury Note | | | | | | | | |
0.375%, 03/15/2016 | | $ | | 5,000,000 | | $ | 5,001,660 | |
| | | |
TOTAL GOVERNMENT BOND (Cost $5,004,283) | | | | | | | 5,001,660 | |
| | | | | | | | |
| | | |
SHORT TERM INVESTMENTS (86.92%) | | | | | | | | |
U.S. Treasury Bill Discount Notes | | | | | | | | |
0.073%, 12/03/2015(b)(c) | | | | 7,000,000 | | | 6,999,979 | |
0.052%, 12/17/2015(b)(c) | | | | 20,000,000 | | | 19,999,560 | |
0.115%, 12/24/2015(c) | | | | 2,500,000 | | | 2,499,845 | |
0.024%, 12/31/2015(c) | | | | 5,000,000 | | | 4,999,460 | |
0.098%, 02/11/2016(c) | | | | 10,000,000 | | | 9,997,270 | |
| | | | | | | | |
| | | |
TOTAL SHORT TERM INVESTMENTS (Cost $44,497,213) | | | | | | | 44,496,114 | |
| | | | | | | | |
| | | |
TOTAL INVESTMENTS (96.94%) (Cost $49,665,254) | | | | | | $ | 49,624,614 | |
| | | |
NET OTHER ASSETS AND LIABILITIES (3.06%)(d) | | | | | | | 1,566,301 | |
| | | | | | | | |
| | | |
NET ASSETS (100.00%) | | | | | | $ | 51,190,915 | |
| | | | | | | | |
| (a) | Non-income producing security. |
| (b) | All or a portion of this security is being held as collateral for written options. |
| (c) | Rate shown represents the bond equivalent yield to maturity at date of purchase. |
| (d) | Includes cash, in the amount of $419,641, which is being held as collateral for written options. |
9 | November 30, 2015
| | |
U.S. Equity High Volatility Put Write Index Fund |
Schedule of Investments | | November 30, 2015 |
SCHEDULE OF WRITTEN OPTIONS
| | | | | | | | | | | | | | |
| | | Expiration Date | | | | Exercise Price | | Contracts | | | Value | |
| |
WRITTEN PUT OPTIONS | | | | | | | | | | | | | | |
Antero Resources Corp. | | 12/18/2015 | | $ | | 20.00 | | | (635) | | | $ | (63,500) | |
Axalta Coating Systems Ltd. | | 12/18/2015 | | | | 25.00 | | | (508) | | | | (6,350) | |
Baker Hughes, Inc. | | 12/18/2015 | | | | 45.00 | | | (282) | | | | (12,690) | |
BioMarin Pharmaceutical, Inc. | | 12/18/2015 | | | | 90.00 | | | (141) | | | | (25,028) | |
CF Industries Holdings, Inc. | | 12/18/2015 | | | | 45.00 | | | (282) | | | | (31,302) | |
Cheniere Energy, Inc. | | 12/18/2015 | | | | 40.00 | | | (317) | | | | (9,985) | |
Continental Resource | | 12/18/2015 | | | | 29.00 | | | (438) | | | | (8,760) | |
Expedia, Inc. | | 12/18/2015 | | | | 110.00 | | | (115) | | | | (5,750) | |
First Solar, Inc. | | 12/18/2015 | | | | 42.50 | | | (299) | | | | (1,495) | |
FMC Corp. | | 12/18/2015 | | | | 30.00 | | | (423) | | | | (10,575) | |
Helmerich & Payne, Inc. | | 12/18/2015 | | | | 45.00 | | | (282) | | | | (2,115) | |
Herbalife Ltd. | | 12/18/2015 | | | | 47.50 | | | (267) | | | | (6,808) | |
Incyte Corp. | | 12/18/2015 | | | | 92.50 | | | (137) | | | | (10,960) | |
Isis Pharmaceuticals, Inc. | | 12/18/2015 | | | | 37.00 | | | (343) | | | | (12,005) | |
JetBlue Airways Corp. | | 12/18/2015 | | | | 21.00 | | | (605) | | | | (6,050) | |
Juno Therapeutics, Inc. | | 12/18/2015 | | | | 40.00 | | | (317) | | | | (10,303) | |
Keurig Green Mountain, Inc. | | 12/18/2015 | | | | 45.00 | | | (282) | | | | (12,972) | |
LinkedIn Corp. | | 12/18/2015 | | | | 165.00 | | | (77) | | | | (539) | |
Mattel, Inc. | | 12/18/2015 | | | | 20.00 | | | (635) | | | | (3,175) | |
Mead Johnson Nutrition Co. | | 12/18/2015 | | | | 65.00 | | | (195) | | | | (2,827) | |
Medivation, Inc. | | 12/18/2015 | | | | 37.50 | | | (338) | | | | (44,447) | |
Netflix, Inc. | | 12/18/2015 | | | | 85.71 | | | (148) | | | | (888) | |
Qorvo, Inc. | | 12/18/2015 | | | | 40.00 | | | (317) | | | | (2,378) | |
Range Resources Corp. | | 12/18/2015 | | | | 30.00 | | | (423) | | | | (103,635) | |
SanDisk Corp. | | 12/18/2015 | | | | 60.00 | | | (211) | | | | (24,054) | |
Seattle Genetics, Inc. | | 12/18/2015 | | | | 33.00 | | | (385) | | | | (6,738) | |
Skechers U.S.A., Inc. | | 12/18/2015 | | | | 40.00 | | | (275) | | | | (266,750) | |
Skyworks Solutions, Inc. | | 12/18/2015 | | | | 65.00 | | | (195) | | | | (1,462) | |
Splunk, Inc. | | 12/18/2015 | | | | 50.00 | | | (254) | | | | (4,445) | |
Tableau Software, Inc. | | 12/18/2015 | | | | 75.00 | | | (169) | | | | (2,535) | |
Tesla Motors, Inc. | | 12/18/2015 | | | | 195.00 | | | (65) | | | | (3,835) | |
The WhiteWave Foods Co. | | 12/18/2015 | | | | 37.50 | | | (338) | | | | (8,450) | |
TripAdvisor, Inc. | | 12/18/2015 | | | | 72.50 | | | (175) | | | | (3,500) | |
Twitter, Inc. | | 12/18/2015 | | | | 26.00 | | | (488) | | | | (65,392) | |
United Rentals, Inc. | | 12/18/2015 | | | | 55.00 | | | (231) | | | | (577) | |
Vertex Pharmaceuticals, Inc. | | 12/18/2015 | | | | 95.00 | | | (133) | | | | (6,983) | |
Whole Foods Market, Inc. | | 12/18/2015 | | | | 29.00 | | | (438) | | | | (30,441) | |
Wynn Resorts Ltd. | | 12/18/2015 | | | | 55.00 | | | (231) | | | | (14,091) | |
Zillow Group, Inc. | | 12/18/2015 | | | | 30.00 | | | (423) | | | | (177,660) | |
TOTAL WRITTEN PUT OPTIONS (Premiums received $1,451,726) | | | | | | | | | | | | | | |
| | | | | | | | | | | | | | |
| | | | | | | | | | | | $ | (1,011,450) | |
| | | | | | | | | | | | | | |
See Notes to Financial Statements.
10 | November 30, 2015
| | |
ALPS Enhanced Put Write Strategy ETF |
Schedule of Investments | | November 30, 2015 |
| | | | | | | | |
| Security Description | | | | Principal Amount | | Value | |
| |
CORPORATE BONDS (86.80%) | | | | | | | | |
Consumer Discretionary (8.06%) | | | | | | | | |
Mohawk Industries, Inc., Sr. Unsec. | | | | | | | | |
6.125%, 01/15/2016(a) | | $ | | 100,000 | | $ | 100,573 | |
Omnicom Group, Inc., Sr. Unsec. | | | | | | | | |
5.900%, 04/15/2016(a) | | | | 100,000 | | | 101,834 | |
| | | | | | | | |
Total Consumer Discretionary | | | | | | | 202,407 | |
| | | | | | | | |
| | | |
Consumer Staples (12.72%) | | | | | | | | |
Brown-Forman Corp., Sr. Unsec. | | | | | | | | |
2.500%, 01/15/2016(a) | | | | 100,000 | | | 100,199 | |
Beam Suntory, Inc., Sr. Unsec | | | | | | | | |
5.375%, 01/15/2016(a) | | | | 110,000 | | | 110,557 | |
Mondelez International, Inc., Sr. Unsec. | | | | | | | | |
4.125%, 02/09/2016(a) | | | | 108,000 | | | 108,646 | |
| | | | | | | | |
Total Consumer Staples | | | | | | | 319,402 | �� |
| | | | | | | | |
Energy (2.80%) | | | | | | | | |
Enterprise Products Operating LLC, Sr. Unsec. | | | | | | | | |
3.200%, 02/01/2016(a) | | | | 40,000 | | | 40,147 | |
Occidental Petroleum, Sr. Unsec. | | | | | | | | |
2.500%, 02/01/2016 | | | | 30,000 | | | 30,096 | |
| | | | | | | | |
Total Energy | | | | | | | 70,243 | |
| | | | | | | | |
| | | |
Financials (22.46%) | | | | | | | | |
Citigroup, Inc., Sr. Unsec. | | | | | | | | |
1.250%, 01/15/2016(a) | | | | 50,000 | | | 50,039 | |
National Retail Properties, Inc., Sr. Unsec. | | | | | | | | |
6.150%, 12/15/2015(a) | | | | 50,000 | | | 50,077 | |
Morgan Stanley, Sr. Unsec. | | | | | | | | |
6.750%, 01/01/2016(a) | | | | 91,000 | | | 91,425 | |
The Goldman Sachs Group, Inc., Sr. Unsec. | | | | | | | | |
3.500%, 02/15/2016(a) | | | | 100,000 | | | 100,400 | |
HCP, Inc., Sr. Unsec. | | | | | | | | |
3.750%, 02/01/2016 | | | | 33,000 | | | 33,157 | |
Lloyds Bank PLC, Sr. Unsec. | | | | | | | | |
4.875%, 01/21/2016(a) | | | | 100,000 | | | 100,555 | |
Prudential Financial, Inc., Sr. Unsec. | | | | | | | | |
5.500%, 03/15/2016 | | | | 25,000 | | | 25,356 | |
The Royal Bank of Scotland PLC, Sr. Unsec. | | | | | | | | |
4.375%, 03/16/2016 | | | | 60,000 | | | 60,628 | |
Deutsche Bank AG/London, Sr. Unsec. | | | | | | | | |
3.250%, 01/11/2016(a) | | | | 52,000 | | | 52,126 | |
| | | | | | | | |
Total Financials | | | | | | | 563,763 | |
| | | | | | | | |
| | | |
Health Care (4.01%) | | | | | | | | |
Quest Diagnostics, Inc., Sr. Unsec. | | | | | | | | |
3.200%, 04/01/2016 | | | | 100,000 | | | 100,733 | |
| | | | | | | | |
| | | |
Industrials (17.87%) | | | | | | | | |
Eaton Electric Holdings LLC, Sr. Unsec. | | | | | | | | |
2.375%, 01/15/2016 | | | | 25,000 | | | 25,050 | |
Lockheed Martin Corp., Sr. Unsec. | | | | | | | | |
7.650%, 05/01/2016 | | | | 50,000 | | | 51,391 | |
11 | November 30, 2015
| | |
ALPS Enhanced Put Write Strategy ETF |
Schedule of Investments | | November 30, 2015 |
| | | | | | | | |
| Security Description | | Principal Amount | | | Value | |
| |
Industrials (continued) | | | | | | | | |
Northrop Grumman Systems Corp., Sr. Unsec. | | | | | | | | |
7.750%, 03/01/2016 | | $ | 50,000 | | | $ | 50,735 | |
Pitney Bowes, Inc., Sr. Unsec. | | | | | | | | |
4.750%, 01/15/2016(a) | | | 100,000 | | | | 100,454 | |
Precision Castparts Corp., Sr. Unsec. | | | | | | | | |
0.700%, 12/20/2015 | | | 75,000 | | | | 74,999 | |
Ryder System, Inc., Sr. Unsec. | | | | | | | | |
3.600%, 03/01/2016 | | | 75,000 | | | | 75,429 | |
Union Pacific Corp., Sr. Unsec. | | | | | | | | |
7.000%, 02/01/2016 | | | 70,000 | | | | 70,670 | |
| | | | | | | | |
Total Industrials | | | | | | | 448,728 | |
| | | | | | | | |
| | |
Information Technology (3.41%) | | | | | | | | |
Juniper Networks, Inc., Sr. Unsec. | | | | | | | | |
3.100%, 03/15/2016 | | | 40,000 | | | | 40,229 | |
The Western Union Co., Sr. Unsec. | | | | | | | | |
2.375%, 12/10/2015 | | | 25,000 | | | | 25,009 | |
Xerox Corp., Sr. Unsec. | | | | | | | | |
6.400%, 03/15/2016 | | | 20,000 | | | | 20,285 | |
| | | | | | | | |
Total Information Technology | | | | | | | 85,523 | |
| | | | | | | | |
| | |
Materials (7.97%) | | | | | | | | |
Eastman Chemical Co., Sr. Unsec. | | | | | | | | |
3.000%, 12/15/2015 | | | 100,000 | | | | 100,072 | |
PPG Industries, Inc., Sr. Unsec. | | | | | | | | |
1.900%, 01/15/2016(a) | | | 100,000 | | | | 100,136 | |
| | | | | | | | |
Total Materials | | | | | | | 200,208 | |
| | | | | | | | |
| | |
Utilities (7.50%) | | | | | | | | |
Alabama Power Co., Sr. Unsec. | | | | | | | | |
5.200%, 01/15/2016(a) | | | 13,000 | | | | 13,064 | |
Georgia Power Co., Sr. Unsec. | | | | | | | | |
5.250%, 12/15/2015 | | | 100,000 | | | | 100,171 | |
Xcel Energy, Inc., Sr. Unsec. | | | | | | | | |
0.750%, 05/09/2016 | | | 75,000 | | | | 74,990 | |
| | | | | | | | |
Total Utilities | | | | | | | 188,225 | |
| | | | | | | | |
| | |
TOTAL CORPORATE BONDS (Cost $2,180,455) | | | | | | | 2,179,232 | |
| | | | | | | | |
| | |
SHORT TERM INVESTMENTS (12.94%) | | | | | | | | |
U.S. Treasury Bill Discount Notes | | | | | | | | |
0.115%, 12/24/2015(b) | | | 325,000 | | | | 324,980 | |
| | | | | | | | |
| | |
TOTAL SHORT TERM INVESTMENTS (Cost $324,975) | | | | | | | 324,980 | |
| | | | | | | | |
| | |
TOTAL INVESTMENTS (99.74%) (Cost $2,505,430) | | | | | | $ | 2,504,212 | |
| | |
NET OTHER ASSETS AND LIABILITIES (0.26%) | | | | | | | 6,529 | |
| | | | | | | | |
| | |
NET ASSETS (100.00%) | | | | | | $ | 2,510,741 | |
| | | | | | | | |
12 | November 30, 2015
| | |
ALPS Enhanced Put Write Strategy ETF |
Schedule of Investments | | November 30, 2015 |
| (a) | All or a portion of this security is being held as collateral for written options. |
| (b) | Rate shown represents the bond equivalent yield to maturity at date of purchase. |
SCHEDULE OF WRITTEN OPTIONS
| | | | | | | | | | | | | | |
| | | Expiration Date | | Exercise Price | | | Contracts | | | Value | |
| |
WRITTEN PUT OPTIONS | | | | | | | | | | | | | | |
S&P 500® PM Settled Index | | 12/19/2015 | | $ | 2,090.00 | | | | (11 | ) | | $ | (33,275) | |
SPDR® S&P 500® ETF Trust | | 12/19/2015 | | | 208.00 | | | | (11 | ) | | | (3,102) | |
TOTAL WRITTEN PUT OPTIONS (Premiums received $38,126) | | | | | | | | | | | | | | |
| | | | | | | | | | | | | | |
| | | | | | | | | | | | $ | (36,377) | |
| | | | | | | | | | | | | | |
Common Abbreviations:
S&P - Standard and Poor’s.
SPDR - Standard & Poor’s Depositary Receipt.
See Notes to Financial Statements.
13 | November 30, 2015
| | |
Put Write Funds |
Statements of Assets and Liabilities | | November 30, 2015 |
| | | | | | | | |
| | | U.S. Equity High
Volatility Put
Write Index Fund | | | ALPS Enhanced
Put Write Strategy
ETF | |
| |
ASSETS: | | | | | | | | |
Investments, at value | | $ | 49,624,614 | | | $ | 2,504,212 | |
Cash | | | 2,193,879 | | | | 16,096 | |
Deposits with brokers for written options | | | 419,641 | | | | – | |
Dividends receivable | | | 3,966 | | | | 28,353 | |
| |
Total Assets | | | 52,242,100 | | | | 2,548,661 | |
| |
| | |
LIABILITIES: | | | | | | | | |
Written options, at value (Proceeds $1,451,726 and $38,126, respectively) | | | 1,011,450 | | | | 36,377 | |
Payable to adviser | | | 39,735 | | | | 1,543 | |
| |
Total Liabilities | | | 1,051,185 | | | | 37,920 | |
| |
NET ASSETS | | $ | 51,190,915 | | | $ | 2,510,741 | |
| |
| | |
NET ASSETS CONSIST OF: | | | | | | | | |
Paid-in capital | | $ | 51,810,004 | | | $ | 2,500,049 | |
Accumulated net investment loss | | | – | | | | (138) | |
Accumulated net realized gain/(loss) on investments and written option contracts | | | (1,018,725) | | | | 10,299 | |
Net unrealized appreciation on investments and written option contracts | | | 399,636 | | | | 531 | |
| |
NET ASSETS | | $ | 51,190,915 | | | $ | 2,510,741 | |
| |
| | |
INVESTMENTS, AT COST | | $ | 49,665,254 | | | $ | 2,505,430 | |
| | |
PRICING OF SHARES | | | | | | | | |
Net Assets | | $ | 51,190,915 | | | $ | 2,510,741 | |
Shares of beneficial interest outstanding (Unlimited number of shares authorized, par value $0.01 per share) | | | 2,400,000 | | | | 100,002 | |
Net Asset Value, offering and redemption price per share | | $ | 21.33 | | | $ | 25.11 | |
See Notes to Financial Statements.
14 | November 30, 2015
| | |
Put Write Funds |
Statements of Operations | | For the Year or Period Ended November 30, 2015 |
| | | | | | | | |
| | | U.S. Equity High
Volatility Put Write Index Fund | | | ALPS Enhanced
Put Write Strategy ETF(a) | |
| |
INVESTMENT INCOME: | | | | | | | | |
Interest | | $ | 24,297 | | | $ | 7,262 | |
| |
Total investment income | | | 24,297 | | | | 7,262 | |
| |
| | |
EXPENSES: | | | | | | | | |
Investment adviser fees | | | 502,736 | | | | 7,400 | |
| |
Total Expenses | | | 502,736 | | | | 7,400 | |
| |
NET INVESTMENT LOSS | | | (478,439) | | | | (138) | |
| |
| | |
REALIZED AND UNREALIZED GAIN/(LOSS) | | | | | | | | |
Net realized loss on investments | | | (8,402,846) | | | | (37,023) | |
Net realized gain on written option contracts | | | 7,195,327 | | | | 47,322 | |
Net change in unrealized depreciation on investments | | | (40,206) | | | | (1,218) | |
Net change in unrealized appreciation on written option contracts | | | 70,043 | | | | 1,749 | |
| |
NET REALIZED AND UNREALIZED GAIN/LOSS ON INVESTMENTS AND WRITTEN OPTION CONTRACTS | | | (1,177,682) | | | | 10,830 | |
| |
NET INCREASE/(DECREASE) IN NET ASSETS RESULTING FROM OPERATIONS | | $ | (1,656,121) | | | $ | 10,692 | |
| |
| (a) | The ALPS Enhanced Put Write Strategy ETF commenced operations on July 8, 2015. |
See Notes to Financial Statements.
15 | November 30, 2015
|
U.S. Equity High Volatility Put Write Index Fund |
Statements of Changes in Net Assets |
| | | | | | | | |
| | | For the
Year Ended
November 30,
2015 | | | For the
Year Ended November 30,
2014 | |
| |
OPERATIONS: | | | | | | | | |
Net investment loss | | $ | (478,439 | ) | | $ | (513,141) | |
Net realized gain/(loss) on investments and written option contracts | | | (1,207,519 | ) | | | 25,634 | |
Net change in unrealized appreciation on investments and written option contracts | | | 29,837 | | | | 88,672 | |
| |
Net decrease in net assets resulting from operations | | | (1,656,121 | ) | | | (398,835) | |
| |
| | |
DISTRIBUTIONS TO SHAREHOLDERS: | | | | | | | | |
Tax return of capital | | | (4,785,224 | ) | | | (5,111,591) | |
| |
Total distributions | | | (4,785,224 | ) | | | (5,111,591) | |
| |
| | |
CAPTIAL SHARE TRANSACTIONS: | | | | | | | | |
Proceeds from sale of shares | | | 14,107,670 | | | | 70,217,237 | |
Cost of shares redeemed | | | (8,756,528 | ) | | | (40,804,701) | |
| |
Net increase from share transactions | | | 5,351,142 | | | | 29,412,536 | |
| |
Net increase/(decrease) in net assets | | | (1,090,203 | ) | | | 23,902,110 | |
| | |
NET ASSETS: | | | | | | | | |
Beginning of period | | | 52,281,118 | | | | 28,379,008 | |
| |
End of period* | | $ | 51,190,915 | | | $ | 52,281,118 | |
| |
| | |
*Including accumulated net investment loss of: | | $ | – | | | $ | (488,795) | |
| | |
OTHER INFORMATION: | | | | | | | | |
CAPTIAL SHARE TRANSACTIONS: | | | | | | | | |
Beginning shares | | | 2,200,002 | | | | 1,100,002 | |
Shares sold | | | 600,000 | | | | 2,800,000 | |
Shares redeemed | | | (400,002) | | | | (1,700,000) | |
| |
Shares outstanding, end of period | | | 2,400,000 | | | | 2,200,002 | |
| |
See Notes to Financial Statements.
16 | November 30, 2015
| | |
ALPS Enhanced Put Write Strategy ETF | | |
Statement of Changes in Net Assets |
| | | | |
| | | For the Period
July 8, 2015 (Commencement of Operations)
to November 30,
2015 | |
| |
OPERATIONS: | | | | |
Net investment loss | | $ | (138) | |
Net realized gain on investments and written option contracts | | | 10,299 | |
Net change in unrealized appreciation on investments and written option contracts | | | 531 | |
| |
Net increase in net assets resulting from operations | | | 10,692 | |
| |
| |
CAPTIAL SHARE TRANSACTIONS: | | | | |
Proceeds from sale of shares | | | 2,500,049 | |
| |
Net increase from share transactions | | | 2,500,049 | |
| |
Net increase in net assets | | | 2,510,741 | |
| |
NET ASSETS: | | | | |
Beginning of period | | | – | |
| |
End of period* | | $ | 2,510,741 | |
| |
| |
*Including accumulated net investment loss of: | | $ | (138) | |
| |
OTHER INFORMATION: | | | | |
CAPTIAL SHARE TRANSACTIONS: | | | | |
Beginning shares | | | – | |
Shares sold | | | 100,002 | |
| |
Shares outstanding, end of period | | | 100,002 | |
| |
See Notes to Financial Statements.
17 | November 30, 2015
| | |
U.S. Equity High Volatility Put Write Index Fund |
Financial Highlights | | For a Share Outstanding Throughout the Periods Presented |
| | | | | | | | | | | | |
| | | For the Year
Ended November 30, 2015 | | | For the Year
Ended November 30, 2014 | | | For the Period
February 28, 2013
(Commencement of Operations)
to November 30,
2013 | |
| |
NET ASSET VALUE, BEGINNING OF PERIOD | | $ | 23.76 | | | $ | 25.80 | | | $ | 25.00 | |
| | | |
INCOME/(LOSS) FROM INVESTMENT OPERATIONS: | | | | | | | | | | | | |
Net investment loss(a) | | | (0.21) | | | | (0.22) | | | | (0.18) | |
Net realized and unrealized gain/(loss) | | | (0.15) | | | | 0.42 | | | | 2.50 | |
| |
Total from investment operations | | | (0.36) | | | | 0.20 | | | | 2.32 | |
| |
| | | |
DISTRIBUTIONS: | | | | | | | | | | | | |
From net investment income | | | – | | | | – | | | | (1.52) | |
Tax return of capital | | | (2.07) | | | | (2.24) | | | | – | |
| |
Total distributions | | | (2.07) | | | | (2.24) | | | | (1.52) | |
| |
| | | |
NET INCREASE/(DECREASE) IN NET ASSET VALUE | | | (2.43) | | | | (2.04) | | | | 0.80 | |
| |
NET ASSET VALUE, END OF PERIOD | | $ | 21.33 | | | $ | 23.76 | | | $ | 25.80 | |
| |
TOTAL RETURN(b) | | | (1.70%) | | | | 0.84% | | | | 9.51% | |
| | | |
RATIOS/SUPPLEMENTAL DATA: | | | | | | | | | | | | |
Net assets, end of period (000s) | | $ | 51,191 | | | $ | 52,281 | | | $ | 28,379 | |
| | | |
Ratio of expenses to average net assets | | | 0.95% | | | | 0.95% | | | | 0.95%(c) | |
Ratio of net investment loss to average net assets | | | (0.90%) | | | | (0.92%) | | | | (0.92%)(c) | |
Portfolio turnover rate(d) | | | 0%(e) | | | | 0% | | | | 0% | |
| (a) | Based on average shares outstanding during the period. |
| (b) | Total return is calculated assuming an initial investment made at the net asset value at the beginning of the period and redemption at the net asset value on the last day of the period and assuming all distributions are reinvested at reinvestment prices. Total return calculated for a period of less than one year is not annualized. |
| (d) | Portfolio turnover is not annualized and does not include securities received or delivered from processing creations or redemptions. |
| (e) | The Fund did not hold long positions at the end of the first 11 months of the fiscal year as part of carrying out the Fund’s principal investment strategy. At November 30, 2015, the Fund held one long position which was sold within 60 days of purchase and excluded from the portfolio turnover calculation. |
See Notes to Financial Statements.
18 | November 30, 2015
| | |
ALPS Enhanced Put Write Strategy ETF |
Financial Highlights | | For a Share Outstanding Throughout the Period Presented |
| | | | |
| | | For the Period | |
| | | July 8, 2015 | |
| | | (Commencement | |
| | | of Operations) | |
| | | to November 30, | |
| | | 2015 | |
| |
NET ASSET VALUE, BEGINNING OF PERIOD | | $ | 25.09 | |
| |
INCOME/(LOSS) FROM INVESTMENT OPERATIONS: | | | | |
Net investment loss(a) | | | (0.00)(b) | |
Net realized and unrealized gain | | | 0.02 | |
| |
Total from investment operations | | | 0.02 | |
| |
| |
NET INCREASE IN NET ASSET VALUE | | | 0.02 | |
| |
NET ASSET VALUE, END OF PERIOD | | $ | 25.11 | |
| |
TOTAL RETURN(c) | | | 0.08% | |
| |
RATIOS/SUPPLEMENTAL DATA: | | | | |
Net assets, end of period (000s) | | $ | 2,511 | |
| |
Ratio of expenses to average net assets | | | 0.75%(d) | |
Ratio of net investment loss to average net assets | | | (0.01%)(d) | |
Portfolio turnover rate(e) | | | 185% | |
| (a) | Based on average shares outstanding during the period. |
| (c) | Total return is calculated assuming an initial investment made at the net asset value at the beginning of the period and redemption at the net asset value on the last day of the period and assuming all distributions are reinvested at reinvestment prices. Total return calculated for a period of less than one year is not annualized. |
| (e) | Portfolio turnover is not annualized and does not include securities received or delivered from processing creations or redemptions. |
See Notes to Financial Statements.
19 | November 30, 2015
| | |
Put Write Funds |
Notes to Financial Statements | | November 30, 2015 |
1. ORGANIZATION
The ALPS ETF Trust (the “Trust”), a Delaware statutory trust, is an open-end management investment company under the Investment Company Act of 1940, as amended (the “1940 Act”). As of November 30, 2015, the Trust consists of twenty-one separate portfolios. Each portfolio represents a separate series of the Trust. This report pertains to the U.S. Equity High Volatility Put Write Index Fund and the ALPS Enhanced Put Write Strategy ETF (each a “Fund” and collectively, the “Funds”).
The investment objective of the U.S. Equity High Volatility Put Write Index Fund is to seek investment results that correspond generally to the performance, before the Fund’s fees and expenses, of the NYSE Arca U.S. Equity High Volatility Put Write IndexSM (the “Underlying Index”). The Underlying Index reflects the performance of a portfolio of exchange-traded put options on highly volatile stocks. The investment objective of the ALPS Enhanced Put Write Strategy ETF is to seek total return, with an emphasis on income as the source of that total return. Each Fund is considered non-diversified and may invest a greater portion of assets in securities of individual issuers than a diversified fund. As a result, changes in the market value of a single investment could cause greater fluctuations in share price than would occur in a diversified fund.
Shares of the Funds (“Shares”) are listed on the New York Stock Exchange (“NYSE”) Arca. Each Fund issues and redeems Shares, at net asset value (“NAV”), in blocks of 100,000 Shares for the U.S. Equity High Volatility Put Write Index Fund and 50,000 shares for the ALPS Enhanced Put Write Strategy ETF, each of which is called a “Creation Unit.” Creation Units of each Fund are issued and redeemed for cash. Except when aggregated in Creation Units, Shares are not redeemable securities of either Fund.
Pursuant to the Trust’s organizational documents, its Officers and Trustees are indemnified against certain liability arising out of the performance of their duties to the Trust. Additionally, in the normal course of business, the Trust enters into contracts with service providers that contain general indemnification clauses. The Trust’s maximum exposure under these arrangements is unknown, as this would involve future claims that may be made against the Trust that have not yet occurred.
2. SIGNIFICANT ACCOUNTING POLICIES
The following is a summary of significant accounting policies consistently followed by the Funds in the preparation of the financial statements. The accompanying financial statements were prepared in accordance with accounting principles generally accepted in the United States of America (“U.S. GAAP”). The preparation of financial statements in conformity with U.S. GAAP requires management to make certain estimates and assumptions that affect the reported amounts of assets and liabilities and disclosures of contingent assets and liabilities at the date of the financial statements and the reported amounts of revenue and expenses during the period. Actual results could differ from those estimates. Each Fund is considered an investment company under U.S. GAAP and follows the accounting and reporting guidance applicable to investment companies in the Financial Accounting Standards Board Accounting Standards Codification Topic 946.
A. Portfolio Valuation
Each Fund’s NAV is determined daily, as of the close of the NYSE, usually 4:00 p.m. Eastern time, each day the NYSE is open for trading. The NAV is computed by dividing the value of the Funds’ portfolio securities, cash and other assets (including accrued interest), less all liabilities (including accrued expenses), by the total number of shares outstanding.
Portfolio securities listed on any exchange other than the NASDAQ Stock Market LLC (“NASDAQ”) are valued at the last sale price on the business day as of which such value is being determined. If there has been no sale on such day, the securities are valued at the mean of the most recent bid and ask prices on such day. Securities traded on the NASDAQ are valued at the NASDAQ Official Closing Price as determined by NASDAQ. Portfolio securities traded on more than one securities exchange are valued at the last sale price on the business day as of which such value is being determined at the close of the exchange representing the principal market for such securities. Portfolio securities traded in the over-the-counter market, but excluding securities traded on the NASDAQ, are valued at the last quoted sale price in such market. Treasury Bills are typically valued at the mean between the evaluated bid and ask prices formulated by an independent pricing service.
Each Fund’s listed put options are valued at the mean of the most recent bid and ask prices.
Fixed-income obligations are typically valued at the mean between the evaluated bid and ask prices formulated by an independent pricing service.
Each Fund’s investments are valued at market value or, in the absence of market value with respect to any portfolio securities, at fair value according to procedures adopted by the Trust’s Board of Trustees (the “Board”). When market quotations are not readily available or when events occur that make established valuation methods unreliable, securities of the Fund may be valued in good faith by or under the direction of the Board. These securities generally include, but are not limited to, restricted securities (securities which may not be publicly sold without registration under the Securities Act of 1933) for which a pricing service is unable to provide a market price; securities whose trading has been formally
20 | November 30, 2015
| | |
Put Write Funds |
Notes to Financial Statements | | November 30, 2015 |
suspended; a security whose market price is not available from a pre-established primary pricing source or the pricing source is not willing to provide a price; a security with respect to which an event has occurred that is most likely to materially affect the value of the security after the market has closed but before the calculation of the Fund’s NAV or make it difficult or impossible to obtain a reliable market quotation; or a security whose price, as provided by the pricing service, does not reflect the security’s “fair value” due to the security being de-listed from a national exchange or the security’s primary trading market is temporarily closed at a time when, under normal conditions, it would be open. As a general principle, the current “fair value” of a security would be the amount which the owner might reasonably expect to receive from the sale on the applicable exchange or principal market. A variety of factors may be considered in determining the fair value of such securities.
B. Fair Value Measurements
Each Fund discloses the classification of its fair value measurements following a three-tier hierarchy based on the inputs used to measure fair value. Inputs refer broadly to the assumptions that market participants would use in pricing the asset or liability, including assumptions about risk. Inputs may be observable or unobservable. Observable inputs reflect the assumptions market participants would use in pricing the asset or liability that are developed based on market data obtained from sources independent of the reporting entity. Unobservable inputs reflect the reporting entity’s own assumptions about the assumptions market participants would use in pricing the asset or liability that are developed based on the best information available.
Valuation techniques used to value each Fund’s investments by major category are as follows:
Equity securities, including restricted securities, for which market quotations are readily available, are valued at the last reported sale price or official closing price as reported by a third party pricing vendor on the primary market or exchange on which they are traded and are categorized as Level 1 in the hierarchy. In the event there were no sales during the day or closing prices are not available, securities are valued at the mean of the most recent quoted bid and ask prices on such day and are generally categorized as Level 2 in the hierarchy. Investments in open-end mutual funds are valued at their closing NAV each business day and are categorized as Level 1 in the hierarchy. Treasury Bills and Treasury Notes are typically valued at the mean between the evaluated bid and ask prices formulated by an independent pricing service and are categorized as Level 2 in the hierarchy, due to their active trading, short-term maturity and liquidity. Listed put options are valued at the mean between the evaluated bid and ask prices formulated by an independent pricing service and are categorized as Level 1 in the hierarchy, due to their active trading and short-term expiration.
Debt securities, including restricted securities, are valued based on evaluated prices received from third party pricing vendors or from brokers who make markets in such securities. For corporate bonds, pricing vendors utilize matrix pricing which considers yield or price of bonds of comparable quality, coupon, maturity and type as well as broker-supplied prices. When independent prices are unavailable or unreliable, debt securities may be valued utilizing pricing methodologies which consider similar factors that would be used by third party pricing vendors. Debt securities are generally categorized as Level 2 in the hierarchy but may be Level 3 depending on the circumstances.
Changes in valuation techniques may result in transfers in or out of an assigned level within the disclosure hierarchy.
Various inputs are used in determining the value of each Fund’s investments as of the end of the reporting period. When inputs used fall into different levels of the fair value hierarchy, the level in the hierarchy within which the fair value measurement falls is determined based on the lowest level input that is significant to the fair value measurement in its entirety. The designated input levels are not necessarily an indication of the risk or liquidity associated with these investments.
These inputs are categorized in the following hierarchy under applicable financial accounting standards:
| | |
Level 1 – | | Unadjusted quoted prices in active markets for identical investments, unrestricted assets or liabilities that a Fund has the ability to access at the measurement date; |
Level 2 – | | Quoted prices which are not active, quoted prices for similar assets or liabilities in active markets or inputs other than quoted prices that are observable (either directly or indirectly) for substantially the full term of the asset or liability; and |
Level 3 – | | Significant unobservable prices or inputs (including the Fund’s own assumptions in determining the fair value of investments) where there is little or no market activity for the asset or liability at the measurement date. |
21 | November 30, 2015
| | |
Put Write Funds |
Notes to Financial Statements | | November 30, 2015 |
The following is a summary of the inputs used to value each Fund’s investments at November 30, 2015:
U.S. Equity High Volatility Put Write Index Fund
| | | | | | | | | | | | | | | | |
| | | Level 1 - | | | Level 2 - Other | | | Level 3 - Significant | | | | |
| | | Unadjusted Quoted | | | Significant | | | Unobservable | | | | |
| Investments in Securities at Value | | Prices | | | Observable Inputs | | | Inputs | | | Total | |
| |
Common Stocks | | $ | 126,840 | | | $ | – | | | $ | – | | | $ | 126,840 | |
Government Bond | | | – | | | | 5,001,660 | | | | – | | | | 5,001,660 | |
Short Term Investments | | | – | | | | 44,496,114 | | | | – | | | | 44,496,114 | |
| |
Total | | $ | 126,840 | | | $ | 49,497,774 | | | $ | – | | | $ | 49,624,614 | |
| |
| | | | |
| | | | | | | | | | | | | | | | |
Other Financial Instruments* | | | | | | | | | | | | | | | | |
| |
Liabilities | | | | | | | | | | | | | | | | |
Written Option Contracts | | $ | (421,817) | | | $ | (589,633) | | | $ | – | | | $ | (1,011,450) | |
| |
Total | | $ | (421,817) | | | $ | (589,633) | | | $ | – | | | $ | (1,011,450) | |
| |
ALPS Enhanced Put Write Strategy ETF
| | | | | | | | | | | | | | | | |
| | | Level 1 - | | | Level 2 - Other | | | Level 3 -Significant | | | | |
| | | Unadjusted Quoted | | | Significant | | | Unobservable | | | | |
| Investments in Securities at Value | | Prices | | | Observable Inputs | | | Inputs | | | Total | |
Corporate Bonds** | | $ | – | | | $ | 2,179,232 | | | $ | – | | | $ | 2,179,232 | |
Short Term Investments | | | – | | | | 324,980 | | | | – | | | | 324,980 | |
| |
Total | | $ | – | | | $ | 2,504,212 | | | $ | – | | | $ | 2,504,212 | |
| |
| | | | |
| | | | | | | | | | | | | | | | |
| |
Other Financial Instruments* | | | | | | | | | | | | | | | | |
| |
Liabilities | | | | | | | | | | | | | | | | |
Written Option Contracts | | $ | (3,102) | | | $ | (33,275) | | | $ | – | | | $ | (36,377) | |
| |
Total | | $ | (3,102) | | | $ | (33,275) | | | $ | – | | | $ | (36,377) | |
| |
| * | Other financial instruments are instruments not reflected in the Schedule of Investments, such as written options. |
| ** | For a detailed breakdown of sectors, see the accompanying Schedule of Investments. |
The Funds recognize transfers between levels as of the end of the period. For the year or period ended November 30, 2015, none of the Funds had any transfers between Level 1 and Level 2 securities. The Funds did not have any securities which used significant unobservable inputs (Level 3) in determining fair value.
C. Securities Transactions and Investment Income
Securities transactions are recorded as of the trade date. Realized gains and losses from securities transactions are recorded on the highest cost basis. Dividend income and capital gains distributions, if any, are recorded on the ex-dividend date. Interest income, if any, is recorded on the accrual basis.
D. Dividends and Distributions to Shareholders
For the U.S. Equity High Volatility Put Write Index Fund, dividends from net investment income, if any, and any net short-term capital gains are distributed to shareholders following each 60 day period. Any other net income or capital gains will be distributed at least annually. Dividends may be declared and paid more frequently to improve Index tracking or to comply with the distribution requirements of the Internal Revenue Code. In addition, the Fund intends to distribute, at the end of each 60-day period out of net investment income and/or net short-term capital gains, an amount of cash equal to 1.5% of the Fund’s net assets at the end of such 60-day period. If the Fund’s net investment income and net short-term
22 | November 30, 2015
| | |
Put Write Funds |
Notes to Financial Statements | | November 30, 2015 |
capital gains are insufficient to support a 1.5% distribution in any 60-day period, the distribution will be reduced by the amount of the shortfall. As a result of the Fund’s investment strategy, it is not expected that the Fund will have income from long-term capital gains.
For the ALPS Enhanced Put Write Strategy ETF, dividends from net investment income, if any, and any net short-term capital gains are distributed to shareholders quarterly. Any other net income or gains are distributed at least annually. Dividends may be declared and paid more frequently to comply with the distribution requirements of the Internal Revenue Code. Some portion of each distribution may result in a return of capital (which is a return of the shareholder’s investment in a fund). Fund shareholders will be notified regarding the portion of the distribution that represents a return of capital.
E. Federal Tax and Tax Basis Information
The timing and character of income and capital gain distributions are determined in accordance with income tax regulations, which may differ from U.S. GAAP. Reclassifications are made to the each Fund’s capital accounts for permanent tax differences to reflect income and gains available for distribution (or available capital loss carryforwards) under income tax regulations.
For the year or period ended November 30, 2015, the Funds made the following reclassifications, which had no impact on results of operations or net assets, were recorded to reflect permanent tax differences resulting primarily from in-kind transactions:
| | | | | | |
| | | | | Accumulated Net | | Accumulated Net Realized |
| Fund | | Paid-in Capital | | Investment Loss | | Gain/(Loss) on Investments |
|
U.S. Equity High Volatility Put Write Index Fund | | $(1,156,028) | | $967,234 | | $188,794 |
ALPS Enhanced Put Write Strategy ETF | | – | | – | | – |
Included with amounts reclassified was a net operating loss offset to paid-in capital of $478,439 for the U.S. Equity High Volatility Put Write Index Fund.
The tax character of the distributions paid during the years ended November 30, 2015 and November 30, 2014 were as follows:
| | | | |
| | | Tax Return of Capital | |
November 30, 2015 | | | | |
U.S. Equity High Volatility Put Write Index Fund | | $ | 4,785,224 | |
November 30, 2014 | | | | |
U.S. Equity High Volatility Put Write Index Fund | | $ | 5,111,591 | |
As of the period ended November 30, 2015 the ALPS Enhanced Put Write Strategy ETF paid no distributions.
As of November 30, 2015, the components of distributable earnings on a tax basis for the Funds were as follows:
| | | | | | | | |
| | | U.S. Equity High | | | ALPS Enhanced | |
| | | Volatility Put Write | | | Put Write Strategy | |
| | | Index Fund | | | ETF | |
| |
Accumulated net realized gain/(loss) on investments | | $ | (1,018,725) | | | $ | 11,861 | |
Net unrealized appreciation on investments | | | 399,636 | | | | 531 | |
Other accumulated losses | | | – | | | | (1,700) | |
| |
Total | | $ | (619,089) | | | $ | 10,692 | |
| |
At November 30, 2015 the U.S. Equity High Volatility Put Write Index Fund post-enactment capital losses deferred to the next tax year were as follows:
| | | | |
| Fund | | Short-Term | |
U.S. Equity High Volatility Put Write Index Fund | | $ | 1,018,725 | |
The ALPS Enhanced Put Write Strategy ETF elects to defer to the period ending November 30, 2016, late year ordinary losses in the amount of $138.
23 | November 30, 2015
| | |
Put Write Funds |
Notes to Financial Statements | | November 30, 2015 |
As of November 30, 2015, the cost of investments for federal income tax purposes and accumulated net unrealized appreciation/(depreciation) on investments were as follows:
| | | | | | | | |
| | | U.S. Equity High | | | | |
| | | Volatility Put Write | | | ALPS Enhanced Put | |
| | | Index Fund | | | Write Strategy ETF | |
| |
Gross appreciation (excess of value over tax cost) | | $ | 81 | | | $ | 99 | |
Gross depreciation (excess of tax cost over value) | | | (40,721) | | | | (1,317) | |
Net appreciation of derivatives | | | 440,276 | | | | 1,749 | |
| |
Net unrealized appreciation/ (depreciation) | | | 399,636 | | | | 531 | |
| |
Cost of investments for income tax purposes | | $ | 49,665,254 | | | $ | 2,505,430 | |
| |
F. Income Taxes
No provision for income taxes are included in the accompanying financial statements, as the Funds intend to distribute to shareholders all taxable investment income and realized gains and otherwise comply with Subchapter M of the Internal Revenue Code of 1986, as amended, applicable to regulated investment companies. The Funds evaluate tax positions taken (or expected to be taken) in the course of preparing the Funds’ tax returns to determine whether these positions meet a “more-likely-than-not” standard that, based on the technical merits, have a more than fifty percent likelihood of being sustained by a taxing authority upon examination. A tax position that meets the “more-likely-than-not” recognition threshold is measured to determine the amount of benefit to recognize in the financial statements.
As of and during the year or period ended November 30, 2015, none of the Funds had a liability for any unrecognized tax benefits. Each Fund files U.S. federal, state, and local tax returns as required. Each Fund’s tax returns are subject to examination by the relevant tax authorities until expiration of the applicable statute of limitations which is generally three years after the filing of the tax return, but may extend to four years in certain jurisdictions. Tax returns for open years for the U.S. Equity High Volatility Put Write Index Fund have incorporated no uncertain tax positions that require a provision for income taxes. Being that the ALPS Enhanced Put Write Strategy ETF commenced operations on July 8, 2015, no tax returns have been filed as of the date of this report.
G. Derivative Instruments and Hedging Activities
The following discloses the Funds’ use of derivative instruments and hedging activities.
Each Fund’s investment objective permits the Funds to purchase derivative contracts including written options. In doing so, the Funds will employ strategies in differing combinations to permit them to increase, decrease, or change the level or types of exposure to market factors. Central to those strategies are features inherent to derivatives that make them more attractive for this purpose than equity or debt securities; they require little or no initial cash investment, they can focus exposure on only certain selected risk factors, and they may not require the ultimate receipt or delivery of the underlying security (or securities) to the contract. This may allow the Funds to pursue their objectives more quickly and efficiently than if they were to make direct purchases or sales of securities capable of affecting a similar response to market factors.
Cash collateral that has been pledged to cover derivative obligations of each Fund and cash collateral received from the counterparty and non-cash collateral pledged by each Fund, if any, is noted in each Fund’s Schedule of Investments.
A written put option on an asset by a Fund obligates the Fund to buy the specified asset from the purchaser at the exercise price if the option is exercised before the expiration date. Premiums received when writing options are recorded as liabilities and are subsequently adjusted to the current value of the options written. Premiums received from writing options that expire are treated as realized gains. Premiums received from writing options, which are either exercised or closed, are offset against the proceeds received or amount paid on the transaction to determine realized gains or losses which are recorded on the Statement of Operations.
Market Risk Factors: In pursuit of each Fund’s investment objectives, the Funds will use derivatives to increase or decrease their exposure to the following market risk factors:
Equity Risk: The value of the options sold by each Fund is based on the value of the instruments directly or indirectly underlying such options. Accordingly, the Funds are exposed to equity risk, which is the risk that the value of the underlying stocks or ETFs underlying options written by each Fund will fall due to general market and economic conditions, perceptions regarding the industries in which the issuers of such stocks or ETFs participate, or factors relating to specific companies. In such event, the value of the options sold by each Fund will likely decline. Additionally, if the value of the stocks or ETFs underlying the options sold by each Fund increases, a Fund’s returns will not increase accordingly.
24 | November 30, 2015
| | |
Put Write Funds |
Notes to Financial Statements | | November 30, 2015 |
Put Option Risk: Options are generally subject to volatile swings in price based on changes in value of the underlying instrument, and the options written by the U.S. Equity High Volatility Put Write Index Fund may be particularly subject to this risk because the underlying stocks are selected by the Index Provider to have high volatility. The Funds will incur a form of economic leverage through their use of options, which will increase the volatility of the Funds’ returns and may increase the risk of loss to the Funds. While the Funds will collect premiums on the options they write, each Fund’s risk of loss if one or more of their options is exercised and expires in-the-money may substantially outweigh the gains to each Fund from the receipt of such option premiums. The Funds will either earmark or segregate sufficient liquid assets to cover their obligations under each option on an ongoing basis. Moreover, the options sold by each Fund may have imperfect correlation to the returns of their underlying stocks or ETFs.
Implied Volatility Risk: When each Fund sells a listed put option, it gains the amount of the premium it receives, but also incurs a corresponding liability representing the value of the option it has sold (until the option is exercised and finishes in the money or expires worthless). The value of the options in which the Funds invest is partly based on the volatility used by market participants to price such options (i.e., implied volatility). Accordingly, increases in the implied volatility of such options will cause the value of such options to increase (even if the prices of the options’ underlying stocks or ETFs do not change), which will result in a corresponding increase in the liabilities of the each Fund under such options and thus decrease the Fund’s NAV. The Funds are therefore exposed to implied volatility risk before the options expire or are exercised. This is the risk that the value of the implied volatility of the options sold by a Fund will increase due to general market and economic conditions, perceptions regarding the industries in which the issuers of such stock participate, or factors relating to specific companies.
U.S. Equity High Volatility Put Write Index Fund:
Transactions in written option contracts during the year ended November 30, 2015, were as follows:
| | | | | | | | | | |
| | | Written Put Options |
| | | Number of Contracts | | | Premiums | | | |
|
Options outstanding at November 30, 2014 | | | (13,222) | | | $ | 1,557,8555 | | | |
Options written | | | (94,800) | | | | 9,256,176 | | | |
Options exercised | | | 20,757 | | | | (1,621,430) | | | |
Options expired | | | 71,810 | | | | (7,384,076) | | | |
Options closed | | | 3,638 | | | | (356,799) | | | |
| | | |
Options outstanding at November 30, 2015 | | | (11,817) | | | | 1,451,725 | | | |
| | | |
Market Value at November 30, 2015 | | | | | | $ | (1,011,450) | | | |
| | | |
ALPS Enhanced Put Write Strategy ETF:
Transactions in written option contracts during the period ended November 30, 2015, were as follows:
| | | | | | | | | | |
| | | Written Put Options |
| | | Number of Contracts | | | Premiums | | | |
|
Options outstanding at July 8, 2015 | | | 0 | | | $ | 0 | | | |
Options written | | | (177) | | | | 257,936 | | | |
Options exercised | | | 30 | | | | (7,440) | | | |
Options expired | | | 92 | | | | (121,062) | | | |
Options closed | | | 33 | | | | (91,308) | | | |
| | | |
Options outstanding at November 30, 2015 | | | (22) | | | | 38,126 | | | |
| | | |
Market Value at November 30, 2015 | | | | | | $ | (36,377) | | | |
| | | |
25 | November 30, 2015
| | |
Put Write Funds |
Notes to Financial Statements | | November 30, 2015 |
The effect of derivatives instruments on the Statement of Assets and Liabilities as of November 30, 2015:
| | | | | | |
| | | Liability Derivatives | |
| Risk Exposure | | Statement of Assets and Liabilities Location | | Fair Value | |
| |
U.S. Equity High Volatility Put Write Index Fund | | | | | | |
Equity Contracts (Written Options) | | Options written, at value | | $ | 1,011,450 | |
| |
| | | | $ | 1,011,450 | |
| |
| | |
ALPS Enhanced Put Write Strategy ETF | | | | | | |
Equity Contracts (Written Options) | | Options written, at value | | $ | 36,377 | |
| |
| | | | $ | 36,377 | |
| |
The effect of derivatives instruments on the Statement of Operations for the year or period ended November 30, 2015:
| | | | | | | | | | |
| Risk Exposure | | Statement of Operations Location | | Realized
Gain/(Loss)
on Derivatives
Recognized
in Income | | | Change in Unrealized Gain/(Loss) on Derivatives
Recognized in Income | |
| |
U.S. Equity High Volatility Put Write Index Fund | | | | | | | | | | |
Equity Contracts (Written Options) | | Net realized gain on written option contracts/Net change in unrealized depreciation on written option contracts | | $ | 7,195,327 | | | $ | 70,043 | |
| |
Total | | | | $ | 7,195,327 | | | $ | 70,043 | |
| |
| | | |
ALPS Enhanced Put Write Strategy ETF | | | | | | | | | | |
Equity Contracts (Written Options) | | Net realized gain on written option contracts/Net change in unrealized depreciation on written option contracts | | $ | 47,322 | | | $ | 1,749 | |
| |
Total | | | | $ | 47,322 | | | $ | 1,749 | |
| |
The average written option contracts volume for the U.S. High Volatility Put Write Index Fund and ALPS Enhanced Put Write Strategy Fund were 15,356 and 27, respectively, during the year or period ended November 30, 2015.
3. INVESTMENT ADVISORY FEE AND OTHER AFFILIATED TRANSACTIONS
ALPS Advisors, Inc. (the “Adviser”) acts as each Fund’s investment adviser pursuant to an advisory agreement with the Trust on behalf of each Fund (the “Advisory Agreement”). Pursuant to the Advisory Agreement, each Fund pays the Adviser a unitary fee for the services and facilities it provides payable on a monthly as a percentage of each Fund’s average daily net assets at the annual rate set forth below. From time to time, the Investment Adviser may waive all or a portion of its fee.
| | |
| Fund | | Advisory Fee |
U.S. Equity High Volatility Put Write Index | | 0.95% |
ALPS Enhanced Put Write Strategy ETF | | 0.75% |
Out of the unitary management fee, the Investment Adviser pays substantially all expenses of each Fund, including the fees of the Sub-Adviser and the cost of transfer agency, custody, fund administration, legal, audit, independent trustees and other services, except for interest expenses, distribution fees or expenses, brokerage expenses, taxes and extraordinary expenses such as litigation and other expenses not incurred in the ordinary course of each Fund’s business. The Adviser’s unitary management fee is designed pay substantially all each Fund’s expenses and to compensate the Adviser for providing services for each Fund.
26 | November 30, 2015
| | |
Put Write Funds |
Notes to Financial Statements | | November 30, 2015 |
Rich Investment Solutions, LLC acts as each Fund’s sub-adviser (“Sub-Adviser”) pursuant to a sub-advisory agreement with the Adviser (the ‘‘Sub-Advisory Agreement’’). Pursuant to the Sub-Advisory Agreement, the Adviser pays the Sub-Adviser, on a monthly basis, a portion of the advisory fees it receives from the Fund, as a percentage of each Fund’s average daily net assets at the annual rate set forth below.
| | |
| Fund | | Advisory Fee |
U.S. Equity High Volatility Put Write Index | | 0.80% |
ALPS Enhanced Put Write Strategy ETF | | 0.60% |
ALPS Fund Services, Inc., an affiliate of the Adviser, is the administrator of the Funds.
Each Trustee who is not an officer or employee of the Adviser, any sub-adviser or any of their affiliates (“Independent Trustees”) receives (1) a quarterly retainer of $5,000, (2) a per meeting fee for regularly scheduled meetings of $3,750, (3) $1,500 for any special meeting held outside of a regularly scheduled board meeting, and (4) reimbursement for all reasonable out-of-pocket expenses relating to attendance at meetings.
4. PURCHASES AND SALES OF SECURITIES
For the year or period ended November 30, 2015, the cost of purchases and proceeds from sales of common stock related to exercised written put options were as follows:
| | | | | | | | | | |
| Fund | | Purchases | | | | | Sales | |
U.S. Equity High Volatility Put Write Index Fund | | $ | 62,447,870 | | | | | $ | 53,880,044 | |
ALPS Enhanced Put Write Strategy ETF | | | 6,030,148 | | | | | | 3,791,791 | |
5. CAPITAL SHARE TRANSACTIONS
Shares are created and redeemed by the Fund on a cash basis only in Creation Unit size aggregations of 100,000 Shares for the U.S. Equity High Volatility Put Write Index Fund and 50,000 shares for the ALPS Enhanced Put Write Strategy ETF. Only broker-dealers or large institutional investors with creation and redemption agreements called Authorized Participants (“AP”) are permitted to purchase or redeem Creation Units from the Fund.
27 | November 30, 2015
| | |
Put Write Funds |
Additional Information | | November 30, 2015 (Unaudited) |
PROXY VOTING RECORDS, POLICIES AND PROCEDURES
Information regarding how the Fund voted proxies relating to portfolio securities during the most recent 12-month period ended June 30 and a description of the Fund’s proxy voting policies and procedures used in determining how to vote for proxies are available without charge on the Securities and Exchange Commission’s (“SEC”) website at www.sec.gov and upon request, by calling (toll-free) 1-866-675-2639.
PORTFOLIO HOLDINGS
The Trust is required to disclose, after its first and third fiscal quarters, the complete schedule of each Fund’s portfolio holdings with the SEC on Form N-Q. Form N-Q for each Fund will be available on the SEC’s website at www.sec.gov. Each Fund’s Form N-Q may also be reviewed and copied at the SEC’s Public Reference Room in Washington, D.C. and information on the operation of the Public Reference Room may be obtained by calling 1-800-SEC-0330. Each Fund’s Form N-Q will be available without charge, upon request, by calling (toll-free) 1-866-675-2639 or by writing to ALPS ETF Trust at 1290 Broadway, Suite 1100, Denver, Colorado 80203.
LICENSING AGREEMENT
The U.S. Equity High Volatility Put Write Index Fund is not sponsored, endorsed, sold or promoted by NYSE Euronext or its affiliates (“NYSE Euronext”). NYSE Euronext makes no representation or warranty regarding the advisability of investing in securities generally, in The U.S. Equity High Volatility Put Write Index Fund particularly, or the ability of the NYSE Arca U.S. Equity High Volatility Put Write IndexSM to track general stock market performance.
NYSE EURONEXT MAKES NO EXPRESS OR IMPLIED WARRANTIES, AND HEREBY EXPRESSLY DISCLAIMS ALL WARRANTIES OF MERCHANTABILITY OR FITNESS FOR A PARTICULAR PURPOSE WITH RESPECT TO THE NYSE ARCA U.S. EQUITY HIGH VOLATILITY PUT WRITE INDEXSM OR ANY DATA INCLUDED THEREIN. IN NO EVENT SHALL NYSE EURONEXT HAVE ANY LIABILITY FOR ANY SPECIAL, PUNITIVE, INDIRECT, OR CONSEQUENTIAL DAMAGES (INCLUDING LOSS OF PROFITS), EVEN IF NOTIFIED OF THE POSSIBLIITY OF SUCH DAMAGES.
28 | November 30, 2015
| | |
Put Write Funds |
Board Considerations Regarding Approval of Investment Advisory Agreements and Investment Sub-Advisory Agreements | | November 30, 2015 (Unaudited) |
U.S. High Volatility Put Write Index Fund
At an in-person meeting held on June 8, 2015, the Board of Trustees of the Trust (the “Board” or the “Trustees”), including the Trustees who are not “interested persons” of the Trust within the meaning of the 1940 Act, as amended (the “Independent Trustees”), evaluated a proposal to approve the continuance of the Advisory Agreement between the Trust and ALPS Advisors, Inc. (the “Adviser”) and the Sub-Advisory Agreement with Rich Investment Solutions, LLC (the “Sub-Adviser”) with respect to the U.S. High Volatility Put Write Index Fund (“HVPW” or “the Fund”). The Independent Trustees also met separately to consider the Advisory and Sub-Advisory Agreements.
In evaluating the Investment Advisory Agreements with respect to the Fund, the Trustees considered various factors, including (i) the nature, extent and quality of the services to be provided by the Adviser with respect to the applicable Fund under the Investment Advisory Agreements; (ii) the advisory fees and other expenses to be paid by the Fund compared to those of similar funds managed by other investment advisers; (iii) the costs of the services provided to the Fund by the Adviser and the profits realized by the Adviser and its affiliates from its relationship to the Fund; (iv) the extent which economies of scale would be realized if and as the assets of the Fund grow and whether fees reflect the economies of scale for the benefit of shareholders and (v) any additional benefits and other considerations.
The Trustees reviewed information on the performance of the Fund and its benchmark. The Trustees also evaluated the correlation and tracking error between the underlying index and the Fund’s performance. Based on their review, the Trustees found that the nature and extent of services provided to the Fund under the Investment Advisory Agreement was appropriate and that the quality was satisfactory.
The Trustees noted that the advisory fee for the Fund was a unitary fee pursuant to which the Adviser assumes all expenses of the Fund (including the cost of transfer agency, custody, fund administration, legal, audit and other services) other than the payments under the Advisory Agreement, brokerage expenses, taxes, interest, litigation expenses and other extraordinary expenses.
With respect to advisory fee rates, the Trustees noted that the advisory fee rate for HPVW is higher than the median of its Strategic Insight expense group. With respect to HVPW, the Trustees took into account, among other things, HVPW’s unique strategy relative to the peer group and other supplemental information provided by the sub-adviser.
Based on the foregoing, and the other information available to them, the Trustees concluded that the advisory fee rate for the Fund was reasonable under the circumstances and in light of the quality of the services provided.
The Trustees considered other benefits available to the Adviser because of its relationship with the Fund and concluded that the advisory fees were reasonable taking into account any such benefits.
The Trustees also considered with respect to the Fund the information provided by the Adviser about the costs and profitability of the Adviser with respect to the Fund. The Trustees reviewed and noted the relatively small sizes of the Fund and concluded that the Adviser was not realizing any economies of scale. The Trustees determined that they would continue to evaluate whether further economies of scale have been achieved on an ongoing basis.
In voting to renew the Advisory Agreement, the Trustees concluded that the terms of the Investment Advisory Agreement are reasonable and fair in light of the services to be performed, the fees paid by certain other funds, expenses to be incurred and such other matters as the Trustees considered relevant in the exercise of their reasonable business judgment. The Trustees did not identify any single factor or group of factors as all important or controlling and considered all factors together.
The Trustees discussed the Sub-Advisory Agreement with respect to HVPW.
In evaluating the Sub-Advisory Agreement, the Trustees considered various factors, including (i) the nature, extent and quality of the services provided by the Sub-Adviser with respect to HVPW under the Sub-Advisory Agreement; (ii) the advisory fees and other expenses paid by HVPW compared to those of similar funds managed by other investment advisers; (iii) the profitability to the Sub-Adviser of its sub-advisory relationship with HVPW and reasonableness of compensation to the Sub-Adviser; (iv) the extent to which economies of scale would be realized if, and as HVPW’s assets increase, and whether the fee level in the Sub-Advisory Agreement reflects these economies of scale; and (v) any additional benefits and other considerations.
With respect to the nature, extent and quality of the services provided by the Sub-Adviser under the Sub-Advisory Agreement, the Trustees considered and reviewed information concerning the services to be provided under the Sub-Advisory Agreement, the investment parameters of the index for HVPW, financial information regarding the Sub-Adviser, information describing the Sub-Adviser’ current organizations and the background
29 | November 30, 2015
| | |
Put Write Funds |
Board Considerations Regarding Approval of Investment Advisory Agreements and Investment Sub-Advisory Agreements | | November 30, 2015 (Unaudited) |
and experience of the persons responsible for the day-to-day management of the HVPW, and the anticipated financial support of HVPW. Based upon their review, the Trustees concluded that the Sub-Adviser was qualified to oversee the portfolio management of HVPW and that the services provided by the Sub-Adviser to HVPW are satisfactory.
With respect to the costs of services to be provided and profits to be realized by the Sub-Adviser, the Trustees considered the resources involved in managing HVPW. Based on their review, the Trustees concluded that the profitability of HVPW to the Sub-Adviser was not unreasonable.
The Trustees noted that the advisory fee for services provided to HVPW was 0.95% of HVPW’s average daily net assets. The Trustees noted that out of the Adviser’s unitary fee, the Adviser pays the Sub-Adviser a sub-advisory fee for services provided to HVPW by the Sub-Adviser of 0.80% of HVPW’s average daily net assets. The Trustees considered the reasonableness of the fee split between the Adviser and the Sub-Adviser, taking into account the services provided and expenses assumed by the Sub-Adviser. Based on consideration of all factors deemed relevant by them, the Trustees concluded that the sub-advisory fee for the Sub-Advisory Agreement was reasonable under the circumstances and in light of the quality of services provided.
The Trustees also considered other benefits that may be realized by the Sub-Adviser from its relationship with HVPW and concluded that the sub-advisory fees were reasonable taking into account such benefits.
The Trustees considered the extent to which economies of scale would be realized as HVPW grows in size and whether fee levels reflect a reasonable sharing of such economies of scale for the benefit of the Funds’ investors. The Trustees concluded that economies of scale were not being achieved for HVPW.
In voting to approve the Sub-Advisory Agreement, the Trustees concluded that the terms of the Sub-Advisory Agreement are reasonable and fair in light of the services to be performed, expenses to be incurred and such other matters as the Trustees considered relevant in the exercise of their reasonable business judgment. The Trustees did not identify any single factor or group of factors as all important or controlling and considered all factors together.
ALPS Enhanced Put Write Strategy ETF
At an in-person meeting held on March 9, 2015, the Board of Trustees of the Trust (the “Board” or the “Trustees”), including the Trustees who are not “interested persons” of the Trust within the meaning of the 1940 Act, as amended (the “Independent Trustees”), evaluated a proposal to approve the Advisory Agreement between the Trust and ALPS Advisors, Inc. (the “Adviser”) and the Sub-Advisory Agreement with Rich Investment Solutions, LLC (the “Sub-Adviser”) with respect to the ALPS Enhanced Put Write Strategy ETF (“PUTX” or “the Fund”). The Independent Trustees also met separately to consider the Advisory and Sub-Advisory Agreements (together, “the New Series Agreements.
In evaluating the New Series Agreements, the Trustees considered various factors, including (i) the nature, extent and quality of the services expected to be provided by the Adviser and the Sub-Adviser with respect to PUTX under the New Series Agreements, as applicable, (ii) the advisory fees and other expenses proposed to be paid by the PUTX compared to those of similar funds managed by other investment advisers (ii) the expected profitability to the Adviser of its proposed advisory relationships with the PUTX and reasonableness of compensation to the Adviser; (iii) the extent to which economies of scale would be realized if and as the Fund’s assets increase and whether the fee level in the New Series Agreements reflects these economies of scale; and (iv) any additional benefits and other considerations.
With respect to the nature, extent and quality of the services to be provided by the Adviser and the Sub-Adviser under the New Series Agreements, as applicable, the Trustees considered and reviewed information concerning the services proposed to be provided under the New Series Agreements, the strategy for PUTX, financial information regarding the Adviser, its parent company, information describing the Adviser’s current organizations and the background and experience of the persons who would be responsible for the day-to-day management of PUTX, the anticipated financial support of PUTX, and the nature and quality of services provided to other ETFs, open-end and closed-end funds by the Adviser. Based upon their review, the Trustees concluded that the Adviser was qualified to oversee the services to be provided by other service providers and that the services to be provided by the Adviser and the Sub-Adviser to PUTX, as applicable, are expected to be satisfactory.
With respect to the costs of services to be provided and profits to be realized by the Adviser and the Sub-Adviser, the Trustees considered the resources involved in managing PUTX as well as the fact that the Adviser agreed to pay all of PUTX’s’ expenses (except for interest expenses, distribution fees or expenses, brokerage expenses, taxes and extraordinary expenses such as litigation and other expenses not incurred in the ordinary course of the PUTX’s business) out of the unitary advisory fee. Based on its review, the Trustees concluded that the expected profitability of PUTX to the Adviser and Sub-Adviser was not unreasonable.
30 | November 30, 2015
| | |
Put Write Funds |
Board Considerations Regarding Approval of Investment Advisory Agreements and Investment Sub-Advisory Agreements | | November 30, 2015 (Unaudited) |
The Trustees also reviewed comparative fee and expense data provided by Strategic Insight regarding PUTX. The Trustees noted the services to be provided by the Adviser for the annual advisory fee of 0.75% of the Fund’s average daily net assets. The Trustees also considered that the advisory fee was a unitary one and that, as set forth above, the Adviser had agreed to pay all of PUTX’s expenses (except for interest expenses, marketing fees, distribution fees or expenses, brokerage expenses, taxes and extraordinary expenses such as litigation and other expenses not incurred in the ordinary course of PUTX’s business) out of the unitary fee. The Trustees considered that, taking into account the impact of the PUTX’s unitary advisory fee, PUTX’s expense ratio was lower than the median of its Strategic Insight peer group. Based on the foregoing and the other information available to them, the Trustees concluded that the advisory fee for PUTX was reasonable under the circumstances and in light of the quality of services provided.
The Trustees also considered other benefits that may be realized by the Adviser and Sub-Adviser from their relationships with PUTX and concluded that the advisory and sub-advisory fees were reasonable taking into account such benefits.
The Trustees considered the extent to which economies of scale would be realized as PUTX grows and whether the advisory fee levels reflect a reasonable sharing of such economies of scale for the benefit of PUTX’s investors. Because PUTX is newly organized, the Trustees reviewed PUTX’s proposed unitary advisory fee and anticipated expenses and determined to review economies of scale in the future when PUTX had attracted assets.
In voting to approve the New Series Agreements, the Trustees, concluded that the terms of the New Series Agreements are reasonable and fair in light of the services to be performed, the fees paid by certain other funds, expenses to be incurred and such other matters as the Trustees considered relevant in the exercise of their reasonable business judgment, The Trustees did not identify any single factor or group of factors as all important or controlling and considered all factors together.
31 | November 30, 2015
| | |
Put Write Funds |
Trustees & Officers | | November 30, 2015 (Unaudited) |
| | | | | | | | | | |
INDEPENDENT TRUSTEES |
Name, Address
& Year of Birth* | | Position(s) Held with Trust | | Term of Office
and Length of
Time Served** | | Principal Occupation(s)
During Past 5 Years | | Number of
Portfolios in Fund
Complex Overseen
by Trustees*** | | Other Directorships
Held by Trustees |
Mary K. Anstine, 1940 | | Trustee | | Since March 2008 | | Ms. Anstine was formerly an Executive Vice President of First Interstate Bank of Denver until 1994, President/Chief Executive Officer of HealthONE Alliance, Denver, Colorado, from 1994 to 2004, and has been retired since 2004. Ms. Anstine is also Trustee/Director of the following: AV Hunter Trust and Colorado Uplift Board. Ms. Anstine was formerly a Director of the Trust Bank of Colorado (later purchased and now known as Northern Trust Bank), HealthONE and Denver Area Council of the Boy Scouts of America and a member of the American Bankers Association Trust Executive Committee. | | 46 | | Ms. Anstine is a Trustee of ALPS Variable Investment Trust (9 funds); Financial Investors Trust (31 funds); Reaves Utility Income Fund; and Westcore Trust (12 funds). |
Jeremy W. Deems, 1976 | | Trustee | | Since March 2008 | | Mr. Deems is the Co-Founder, Chief Financial Officer of Green Alpha Advisors, LLC. Mr. Deems is Co-Portfolio Manager of the Shelton Green Alpha Fund. Prior to joining Green Alpha Advisors, Mr. Deems was CFO and Treasurer of Forward Management, LLC, ReFlow Management Co., LLC, ReFlow Fund, LLC, a private investment fund, and Sutton Place Management, LLC, an administrative services company. | | 46 | | Mr. Deems is a Trustee of ALPS Variable Investment Trust (9 funds); Financial Investors Trust (31 funds); Clough Funds Trust (1 fund); and Reaves Utility Income Fund. |
Rick A. Pederson, 1952 | | Trustee | | Since March 2008 | | Mr. Pederson is President, Foundation Properties, Inc. (a real estate investment management company), 1994 - present; Advisory Board Member, Bow River Capital Partners (private equity management), 2003 - present; Advisor, Pauls Corporation (real estate investment management and development), 2008 - present; Chairman, Ross Consulting Group (real estate consulting services) 1983-2013; Advisory Board, Neenan Company (construction services) 2002- present; Board Member, Prosci, Inc. (private business services), 2013-present; Board Member, Citywide Banks (Colorado community bank) 2014-present; Board member, Professional Pediatric Health Care (a Denver-based home nursing firm) 2014 – present; Director, National Western Stock Show (not-for-profit organization); Director, Biennial of the Americas (not-for- profit organization). | | 24 | | Mr. Pederson is Trustee of Westcore Trust (12 funds) and Principal Real Estate Income Fund (1 fund). |
| * | The business address of the Trustee is c/o ALPS Advisors, Inc., 1290 Broadway, Suite 1100, Denver, Colorado 80203. |
| ** | This is the period for which the Trustee began serving the Trust. Each Trustee serves an indefinite term, until his successor is elected. |
| *** | The Fund Complex includes all series of the Trust and any other investment companies for which ALPS Advisors, Inc. provides investment advisory services. |
The Statement of Additional Information includes additional information about the Fund’s Trustees and is available, without charge, upon request by calling (toll-free) 1-866-675-2639.
32 | November 30, 2015
| | |
Put Write Funds |
Trustees & Officers | | November 30, 2015 (Unaudited) |
| | | | | | | | | | |
INTERESTED TRUSTEE |
Name, Address and Year of Birth of Interested Trustee* | | Position(s) Held with Trust | | Term of Office
and Length of
Time Served** | | Principal Occupation(s) During Past 5 Years | | Number of
Portfolios in Fund
Complex Overseen
by Trustees*** | | Other Directorships
Held by Trustees |
Thomas A. Carter, 1966 | | Trustee and President | | Since
March 2008 | | Mr. Carter joined ALPS Fund Services, Inc. (“ALPS”) in 1994 and is currently President and Director of ALPS Advisors, Inc. (“AAI”), and ALPS Portfolio Solutions Distributor, Inc. (“APSD”) and Executive Vice President and Director of ALPS and ALPS Holdings, Inc. (“AHI”), and ALPS Distributors, Inc. (“ADI”). Because of his position with AHI, ALPS, ADI, APSD and AAI, Mr. Carter is deemed an affiliate of the Fund as defined under the 1940 Act. Before joining ALPS, Mr. Carter was with Deloitte & Touche LLP, where he worked with a diverse group of clients, primarily within the financial services industry. Mr. Carter is a Certified Public Accountant and received his Bachelor of Science in Accounting from the University of Colorado at Boulder. | | 34 | | Mr. Carter is a Trustee of ALPS Variable Investment Trust (9 funds) and Principal Real Estate Income Fund (1 fund) |
| * | The business address of the Trustee is c/o ALPS Advisors, Inc., 1290 Broadway, Suite 1100, Denver, Colorado 80203. |
| ** | This is the period for which the Trustee began serving the Trust. Each Trustee serves an indefinite term, until his successor is elected. |
| *** | The Fund Complex includes all series of the Trust and any other investment companies for which ALPS Advisors, Inc. provides investment advisory services. |
The Statement of Additional Information includes additional information about the Fund’s Trustees and is available, without charge, upon request by calling (toll-free) 1-866-675-2639.
33 | November 30, 2015
| | |
Put Write Funds |
Trustees & Officers | | November 30, 2015 (Unaudited) |
| | | | | | |
OFFICERS |
Name, Address
and Year of
Birth of Officer* | | Position(s) Held
with Trust | | Length of Time
Served** | | Principal Occupation(s) During Past 5 Years |
Erin D. Nelson, 1977 | | Chief Compliance Officer (“CCO”) | | Since December 2015 | | Erin Nelson became Senior Vice-President and Chief Compliance Officer of ALPS Advisors, Inc. (“AAI”) on July 1, 2015 and prior to that served as Vice President and Deputy Chief Compliance Officer of AAI since January 1, 2015. Prior to January 1, 2015, Ms. Nelson was Vice-President and Assistant General Counsel of ALPS of Fund Services, Inc. Ms. Nelson joined AAI’s parent company, ALPS Holdings, Inc. in January 2003. Ms. Nelson currently is also the Chief Compliance Officer of Principal Real Estate Income Fund, and as of December 2015, the Chief Compliance Officer of Liberty All-Star Equity Fund, Liberty All-Star Growth Fund, Inc., RiverNorth Opportunities Fund, Inc. |
Patrick D. Buchanan, 1972 | | Treasurer | | Since June 2012 | | Mr. Buchanan is Vice President of AAI. Mr. Buchanan joined ALPS in 2007 and because of his position with AAI, he is deemed an affiliate of the Trust as defined under the 1940 Act. Mr. Buchanan is also Treasurer of the ALPS Variable Insurance Trust, Clough Funds Trust and Principal Real Estate Income Fund. |
William Parmentier, 1952 | | Vice President | | Since March 2008 | | Mr. Parmentier is Chief Investment Officer, AAI (since 2006); President and Chief Executive Officer of the Liberty All-Star Funds (since April 1999); Senior Vice President (2005-2006), Banc of America Investment Advisors, Inc. Because of his position with AAI, Mr. Parmentier is deemed an affiliate of the Trust as defined under the 1940 Act. |
Abigail J. Murray, 1975 | | Secretary | | Since June 2015 | | Ms. Murray joined ALPS in April 2015. She is currently Vice President and Senior Counsel of ALPS. Prior to joining ALPS, Ms. Murray was an Attorney and Managing Member at Murray & Rouvina PLC from 2014 to 2015 and an Associate with Vedder Price P.C. from 2007 to 2014. Because of her position with ALPS, Ms. Murray is deemed an affiliate of the Trust as defined under the 1940 Act. Ms. Murray is also the Secretary of The Caldwell & Orkin Funds, Inc., Clough Global Opportunities Fund, Clough Global Allocation Fund, Clough Global Equity Fund and Clough Funds Trust. |
Jennifer A. Craig, 1973 | | Assistant Secretary | | Since October 2013 | | Ms. Craig joined ALPS in 2007 and is currently Assistant Vice President and Paralegal Manager. Prior to joining ALPS, Ms. Craig was Legal Manager at Janus Capital Management LLC and served as Assistant Secretary of Janus Investment Fund, Janus Adviser Series and Janus Aspen Series. Because of her position with ALPS, Ms. Craig is deemed an affiliate of the Trust as defined under the 1940 Act. |
| * | The business address of the Officer is c/o ALPS Advisors, Inc., 1290 Broadway, Suite 1100, Denver, Colorado 80203. |
| ** | This is the period for which the Officer began serving the Trust. Each Officer serves an indefinite term, until his successor is elected. |
34 | November 30, 2015
Intentionally Left Blank
table of
CONTENTS
www.alpsfunds.com
| | |
Sprott Gold Miners ETF | | |
| |
| Performance Overview | | November 30, 2015 (Unaudited) |
Investment Objective
Sprott Gold Miners ETF (the “Fund”) employs a “passive management”—or indexing—investment approach designed to seek investment results that correspond (before fees and expenses) generally to the performance of the Sprott Zacks Gold Miners Index (the “Underlying Index”).
The Underlying Index was created by Zacks Index Services to provide a means of generally tracking the performance of gold and silver mining companies whose stocks are traded on major U.S. exchanges. The Underlying Index uses a transparent, rules-based methodology that is designed to identify 25 gold stocks with the highest beta† to the spot price of gold, with each stock’s weighting in the index adjusted based on its quarterly revenue growth on a year-over-year basis and the quality of its balance sheet, as measured by long-term debt to equity. The Underlying Index is rebalanced on a quarterly basis to incorporate the latest financial data into the screening process. The Underlying Index may also invest to a lesser degree in silver companies that meet the above criteria.
Performance Overview
Sprott Gold Miners ETF (SGDM) (the “Fund”) for the one-year period ended November 30, 2015 generated a total return of -25.44%, in-line with the Sprott Zacks Gold Miners Index (the “Fund’s Underlying Index”), which returned -24.88%. The Fund’s Underlying Index emphasizes companies with the highest historical sensitivity to the price of gold, the highest relative revenue growth and the lowest relative long-term debt to equity. We believe these are important factors in determining the long-run success of senior gold miners.
Gold stocks were negatively impacted by a lower price for gold which weighed on company revenue and profitability. The price for gold fell approximately 10% over the year hurt by a stronger U.S. dollar versus a number of other currencies and ongoing concerns about the Federal Reserve raising interest rates for the first time since 2006. Strength in equity markets during most of the period also dampened investor interest in gold and gold stocks as a portfolio diversifier. While interest and demand for gold declined among investors in Western markets, interest from investors in Eastern markets and central banks remained buoyant over the period. Investors and institutions in countries such as China and India continue to accumulate significant amounts of gold. For example, withdrawals of gold from the Shanghai Gold Exchange—a barometer of Chinese investment and retail demand—totaled 2,210 tonnes year to date to November 6, 2015 which has already exceeded the full year record of 2,197 tonnes recorded in 2013.1
In response to the lower gold price, we continue to see gold mining companies restructure their businesses to reduce costs. Mining projects with marginal economic forecasts are being shelved and many are reducing their debt loads by selling non-core assets and entering into streaming financing deals whereby they pre-sell a portion of their future gold production in exchange for a lump sum of capital. Franco-Nevada Corp., a leading royalty and streaming company, and one of the top holdings in the Fund since its inception, has been very active with new financings. Many analysts believe they are negotiating these streaming deals on very favorable terms because of their relative position of strength. This optimism has helped Franco-Nevada outperform traditional gold mining stocks by a wide margin during the period.
Looking forward, we continue to believe the Index’s methodology of emphasizing companies with the highest relative revenue growth and lowest relative long-term debt to equity will provide exposure to higher-quality gold companies with stronger production results and the financial strength to take advantage of opportunities in the sector.
| 1 | Bullionstar.com - November 16, 2015 |
Performance (as of November 30, 2015)
| | | | |
| | | 1 Year | | Since Inception^ |
Sprott Gold Miners ETF - NAV | | -25.44% | | -37.71% |
Sprott Gold Miners ETF - Market Price* | | -25.59% | | -37.67% |
Sprott Zacks Gold Miners Total Return Index | | -24.88% | | -37.28% |
Total Expense Ratio (per the current prospectus) 0.57%
Performance data quoted represents past performance. Past performance does not guarantee future results. Investment return and principal value of an investment will fluctuate so that an investor’s shares, when sold or redeemed, may be worth more or less than the original cost. Current performance data may be higher or lower than actual data quoted. For the most current month-end performance data please visit www.alpsfunds.com or call 1.855.215.1425.
1 | November 30, 2015
| | |
Sprott Gold Miners ETF | | |
| |
| Performance Overview | | November 30, 2015 (Unaudited) |
NAV is an exchange-traded fund’s per-share value. The per-share dollar amount of the fund is derived by dividing the total value of all the securities in its portfolio, less any liabilities, by the number of fund shares outstanding. Market Price is the price at which a share can currently be traded in the market. Information detailing the number of days the Market Price of the Fund was greater than the Fund’s NAV and the number of days it was less than the Fund’s NAV can be obtained at www.alpsfunds.com.
| † | Beta is defined as a sensitivity measure based on regression against the spot gold price movement during the trailing 36 months. |
| ^ | The Fund Commencement date is July 15, 2014. |
| * | Market Price is based on the midpoint of the bid-ask spread at 4 p.m. ET and does not represent the returns an investor would receive if shares were traded at other times. |
Sprott Zacks Gold Miners Total Return Index is comprised of approximately 25 stocks selected, based on investment and other criteria, from a universe of gold and silver mining companies whose stock is listed on a major U.S. exchange. The stocks are selected using a proprietary, quantitative rules-based methodology developed by Zacks Index Services. Total return assumes reinvestment of any dividends and distributions realized during a given time period.
One cannot invest directly in an index. Index performance does not reflect fund performance.
The Fund is concentrated in the gold and silver mining industry. As a result, the Fund will be sensitive to changes in, and its performance will depend to a greater extent on, the overall condition of the gold and silver mining industry. Also, gold and silver mining companies are highly dependent on the price of gold and silver bullion. These prices may fluctuate substantially over short periods of time so the Fund’s Share price may be more volatile than other types of investments.
Funds that emphasize investments in small-cap and mid-cap companies will generally experience greater price volatility.
Fund investing in foreign and emerging markets will also generally experience greater price volatility.
The Fund’s shares are not individually redeemable. Investors buy and sell shares of the Fund on a secondary market. Only market makers or “authorized participants” may trade directly with the Fund, typically in blocks of 50,000 shares.
The Sprott Gold Miners ETF is not suitable for all investors. Investments in the Fund are subject to investment risks, including possible loss of the principal amount invested.
ALPS Portfolio Solutions Distributor, Inc. is the Distributor for the Sprott Gold Miners ETF.
ALPS Portfolio Solutions Distributor, Inc. is not affiliated with Sprott or Zacks Index Services, a division of Zacks Investment Management.
2 | November 30, 2015
| | |
Sprott Gold Miners ETF | | |
| |
| Performance Overview | | November 30, 2015 (Unaudited) |
Top 10 Holdings* (as of November 30, 2015)
| | | | |
Agnico Eagle Mines Ltd. | | | 14.85 | % |
Franco-Nevada Corp. | | | 14.80 | % |
Goldcorp, Inc. | | | 14.72 | % |
Royal Gold, Inc. | | | 4.78 | % |
Newmont Mining Corp. | | | 4.64 | % |
Barrick Gold Corp. | | | 4.47 | % |
Randgold Resources Ltd., ADR | | | 4.34 | % |
Yamana Gold, Inc. | | | 4.31 | % |
Eldorado Gold Corp. | | | 3.63 | % |
AngloGold Ashanti Ltd., Sponsored ADR | | | 2.65 | % |
Total % of Top 10 Holdings | | | 73.19 | % |
Future holdings are subject to change.
Growth of $10,000 (as of November 30, 2015)
Comparison of Change in Value of $10,000 Investment in the Fund and the Index
Country Allocation* (as of November 30, 2015)
| | | | |
Canada | | | 78.07 | % |
United States | | | 10.31 | % |
South Africa | | | 7.28 | % |
Jersey | | | 4.34 | % |
Total | | | 100.00 | % |
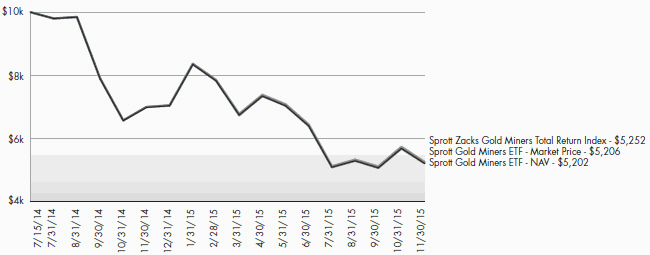
The chart above represents historical performance of a hypothetical investment of $10,000 in the Fund over the life of the Fund. Performance calculations are as of the end of each month. Past performance does not guarantee future results. This chart does not reflect the deduction of taxes that a shareholder would pay on Fund distributions or the redemption of Fund shares.
3 | November 30, 2015
| | |
Sprott Junior Gold Miners ETF | | |
| |
| Performance Overview | | November 30, 2015 (Unaudited) |
Investment Objective
Sprott Junior Gold Miners ETF (the “Fund”) employs a “passive management”—or indexing—investment approach designed to seek investment results that correspond (before fees and expenses) generally to the performance of the Sprott Zacks Junior Gold Miners Index (the “Underlying Index”).
The Underlying Index was created by Zacks Index Services to provide a means of generally tracking the performance of “junior” gold and silver mining companies whose stocks are traded on major U.S. or Canadian exchanges. Junior companies include early stage mining companies that are in the exploration stage only or that hold properties that might not ultimately produce gold or silver. The Underlying Index uses a transparent, rules-based methodology that is designed to identify between 30 to 40 junior gold stocks with market capitalization between $250 million and $2 billion. Excluding companies with market capitalization below $250 million aims to exclude very early stage exploration companies whose historical success rate is low. Each stock’s weighting in the Index is adjusted based on 2 company factors: 1) Revenue Growth and 2) Price Momentum. The Index is reconstituted on a semi-annual basis, in November and May, to incorporate the latest factor scores into the selection and weighting process. The Index can also invest to a lesser degree in junior silver companies that meet the above criteria.
Performance Overview
Sprott Junior Gold Miners ETF (SGDJ) (the “Fund”) for the period from March 31 to November 30, 2015 generated a total return of -18.73%, in-line with the Sprott Zacks Junior Gold Miners Index (the “Fund’s Underlying Index”), which returned -18.27%. The Fund’s Underlying Index emphasizes companies with the highest historical revenue growth and the strongest relative stock price momentum. We believe these are important factors in determining the long-run success of junior gold miners.
Gold stocks were negatively impacted by a lower price for gold. The price for gold fell approximately 10% over the period hurt by a stronger U.S. dollar versus a number of other currencies and ongoing concerns about the Federal Reserve raising interest rates for the first time since 2006. Strength in equity markets during most of the period also dampened investor interest in gold and gold stocks as a portfolio diversifier. While interest and demand for gold declined among investors in Western markets, interest from investors in Eastern markets and central banks remained buoyant over the period. Investors and institutions in countries such as China and India continue to accumulate significant amounts of gold. For example, withdrawals of gold from the Shanghai Gold Exchange—a barometer of Chinese investment and retail demand—totaled 2,210 tonnes year to date to November 6, 2015 which has already exceeded the full year record of 2,197 tonnes recorded in 2013.1
Despite the lower gold price and negative sentiment in the sector, junior gold stocks outperformed their larger counterparts for the period, driven primarily by company specific factors. Companies such as Centerra Gold Inc. - the Fund’s top holding for the period -, Silver Standard Resources Inc., Novagold Resources Inc., Pretium Resources Inc., Mag Silver Corp. and Seabridge Gold Inc. all bucked the downtrend and experienced higher share prices during the period. We find this development encouraging as investors looked beyond the lower gold price and focused on the prospects for individual companies as they develop their exploration and mining projects.
| 1 | Bullionstar.com - November 16, 2015 |
Performance (as of November 30, 2015)
| | |
| | | Since Inception^ |
Sprott Junior Gold Miners ETF - NAV | | -18.73% |
Sprott Junior Gold Miners ETF - Market Price* | | -18.78% |
Sprott Zacks Junior Gold Miners Total Return Index | | -18.27% |
Total Expense Ratio (per the current prospectus) 0.57%
Performance data quoted represents past performance. Past performance does not guarantee future results. Investment return and principal value of an investment will fluctuate so that an investor’s shares, when sold or redeemed, may be worth more or less than the original cost. Current performance data may be higher or lower than actual data quoted. For the most current month-end performance data please visit www.alpsfunds.com or call 1.855.215.1425.
NAV is an exchange-traded fund’s per-share value. The per-share dollar amount of the fund is derived by dividing the total value of all the securities in its portfolio, less any liabilities, by the number of fund shares outstanding. Market Price is the price at which a share can currently be traded in the market. Information detailing the number of days the Market Price of the Fund was greater than the Fund’s NAV and the number of days it was less than the Fund’s NAV can be obtained at www.alpsfunds.com.
| ^ | The Fund Commencement date is March 31, 2015. Total return for a period of less than one year is not annualized. |
| * | Market Price is based on the midpoint of the bid-ask spread at 4 p.m. ET and does not represent the returns an investor would receive if shares were traded at other times. |
4 | November 30, 2015
| | |
Sprott Junior Gold Miners ETF | | |
| |
| Performance Overview | | November 30, 2015 (Unaudited) |
The Fund is new with limited operating history.
Sprott Zacks Junior Gold Miners Total Return Index is comprised of between 30 to 40 stocks selected, based on investment and other criteria, from a universe of gold and silver mining companies whose stocks are listed on a major U.S. or Canadian exchange. The stocks are selected using a proprietary, quantitative rules-based methodology developed by Zacks Index Services. Total return assumes reinvestment of any dividends and distributions realized during a given time period.
One cannot invest directly in an index. Index performance does not reflect fund performance.
The Fund is concentrated in the gold and silver mining industry. As a result, the Fund will be sensitive to changes in, and its performance will depend to a greater extent on, the overall condition of the gold and silver mining industry. Also, gold and silver mining companies are highly dependent on the price of gold and silver bullion. These prices may fluctuate substantially over short periods of time so the Fund’s Share price may be more volatile than other types of investments.
Funds that emphasize investments in small-cap and mid-cap companies will generally experience greater price volatility. Micro-cap stocks involve substantially greater risks of loss and price fluctuations because their earnings and revenues tend to be less predictable. These companies may be newly formed or in the early stages of development, with limited product lines, markets or financial resources and may lack management depth.
Funds investing in foreign and emerging markets will also generally experience greater price volatility.
The Fund’s shares are not individually redeemable. Investors buy and sell shares of the Fund on a secondary market. Only market makers or “authorized participants” may trade directly with the Fund, typically in blocks of 50,000 shares.
The Sprott Junior Gold Miners ETF is not suitable for all investors. Investments in the Fund are subject to investment risks, including possible loss of the principal amount invested.
ALPS Portfolio Solutions Distributor, Inc. is the Distributor for the Sprott Junior Gold Miners ETF.
ALPS Portfolio Solutions Distributor, Inc. is not affiliated with Sprott or Zacks Index Services, a division of Zacks Investment Management.
5 | November 30, 2015
| | |
Sprott Junior Gold Miners ETF | | |
| |
| Performance Overview | | November 30, 2015 (Unaudited) |
Top 10 Holdings* (as of November 30, 2015)
| | | | |
Detour Gold Corp. | | | 8.86 | % |
Tahoe Resources, Inc. | | | 8.26 | % |
Yamana Gold, Inc. | | | 6.94 | % |
Centerra Gold, Inc. | | | 6.87 | % |
Sibanye Gold Ltd., Sponsored ADR | | | 6.46 | % |
OceanaGold Corp. | | | 6.12 | % |
B2Gold Corp. | | | 4.50 | % |
Osisko Gold Royalties Ltd. | | | 4.39 | % |
New Gold, Inc. | | | 3.97 | % |
Pan American Silver Corp. | | | 3.70 | % |
Total % of Top 10 Holdings | | | 60.07 | % |
Future holdings are subject to change.
Growth of $10,000 (as of November 30, 2015)
Comparison of Change in Value of $10,000 Investment in the Fund and the Index
Country Allocation* (as of November 30, 2015)
| | | | |
Canada | | | 75.70 | % |
United States | | | 12.14 | % |
South Africa | | | 9.92 | % |
Peru | | | 2.24 | % |
Total | | | 100.00 | % |
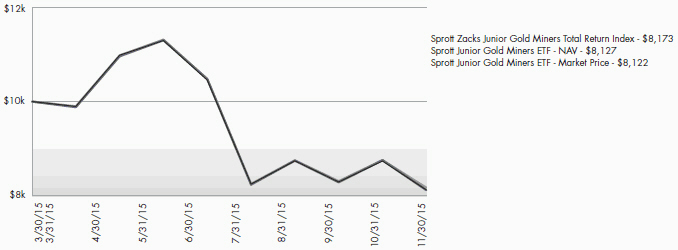
The chart above represents historical performance of a hypothetical investment of $10,000 in the Fund over the life of the Fund. Performance calculations are as of the end of each month. Past performance does not guarantee future results. This chart does not reflect the deduction of taxes that a shareholder would pay on Fund distributions or the redemption of Fund shares.
6 | November 30, 2015
| | |
Sprott ETFs | | |
| |
| Disclosure of Fund Expenses | | November 30, 2015 (Unaudited) |
Shareholder Expense Example: As a shareholder of a Fund, you incur two types of costs: (1) transaction costs which may include creation and redemption fees or brokerage charges, and (2) ongoing costs, including management fees and other Fund expenses. These examples are intended to help you understand your ongoing costs (in dollars) of investing in a Fund and to compare these costs with the ongoing costs of investing in other funds. It is based on an investment of $1,000 invested at the beginning of the (six month) period and held through November 30, 2015.
Actual Return: The first line of the table provides information about actual account values and actual expenses. You may use the information in this table, together with the amount you invested, to estimate the expenses that you incurred over the period. Simply divide your account value by $1,000 (for example, an $8,600 account value divided by $1,000 = 8.6), then multiply the result by the number in the first line under the heading entitled “Expenses Paid During the Period” to estimate the expenses attributable to your investment during this period.
Hypothetical 5% Return: The second line of the table provides information about hypothetical account values and hypothetical expenses based on each Fund’s actual expense ratio and an assumed rate of return of 5% per year before expenses, which is not the Fund’s actual return. The hypothetical account values and expenses may not be used to estimate the actual ending account balance or expenses you paid for the period. You may use this information to compare ongoing costs of investing in each Fund and other funds. To do so, compare this 5% hypothetical example with the 5% hypothetical examples that appear in the shareholder reports of the other funds.
The expenses shown in the table are meant to highlight ongoing Fund costs only and do not reflect any transaction costs, such as creation and redemption fees, or brokerage charges. Therefore, the second line is useful in comparing ongoing costs only, and will not help you determine the relative total costs of owning different funds. In addition, if these costs were included, your costs would have been higher.
| | | | | | | | | | |
| | | Beginning Account | | Ending Account | | | | | Expenses Paid |
| | | Value | | Value | | | Expense | | During Period |
| | | 6/1/15 | | 11/30/15 | | | Ratio(a) | | 6/1/15 - 11/30/15(b) |
Sprott Gold Miners ETF | | | | | | | | | | |
Actual | | $1,000.00 | | | $739.90 | | | 0.57% | | $2.49 |
Hypothetical (5% return before expenses) | | $1,000.00 | | | $1,022.21 | | | 0.57% | | $2.89 |
Sprott Junior Gold Miners ETF | | | | | | | | | | |
Actual | | $1,000.00 | | | $719.50 | | | 0.57% | | $2.46 |
Hypothetical (5% return before expenses) | | $1,000.00 | | | $1,022.21 | | | 0.57% | | $2.89 |
| (a) | Annualized, based on the Fund’s most recent fiscal half year expenses. |
| (b) | Expenses are equal to the Fund’s annualized expense ratio multiplied by the average account value over the period, multiplied by the number of days in the most recent fiscal half year (183), divided by 365. |
7 | November 30, 2015
| | |
Sprott ETFs | | |
|
| Report of Independent Registered Public Accounting Firm |
To the Board of Trustees and Shareholders of ALPS ETF Trust:
We have audited the accompanying statements of assets and liabilities, including the schedules of investments, of Sprott Gold Miners ETF and Sprott Junior Gold Miners ETF, two of the portfolios constituting the ALPS ETF Trust (the “Trust”), as of November 30, 2015, and as to the Sprott Gold Miners ETF, the related statement of operations for the year then ended and the statements of changes in net assets and the financial highlights for the year then ended and for the period July 15, 2014 (commencement of operations) to November 30, 2014, and as to the Sprott Junior Gold Miners ETF, the related statements of operations and changes in net assets and the financial highlights for the period March 31, 2015 (commencement of operations) to November 30, 2015. These financial statements and financial highlights are the responsibility of the Trust’s management. Our responsibility is to express an opinion on these financial statements and financial highlights based on our audits.
We conducted our audits in accordance with the standards of the Public Company Accounting Oversight Board (United States). Those standards require that we plan and perform the audit to obtain reasonable assurance about whether the financial statements and financial highlights are free of material misstatement. The Trust is not required to have, nor were we engaged to perform, an audit of its internal control over financial reporting. Our audits included consideration of internal control over financial reporting as a basis for designing audit procedures that are appropriate in the circumstances, but not for the purpose of expressing an opinion on the effectiveness of the Trust’s internal control over financial reporting. Accordingly, we express no such opinion. An audit also includes examining, on a test basis, evidence supporting the amounts and disclosures in the financial statements, assessing the accounting principles used and significant estimates made by management, as well as evaluating the overall financial statement presentation. Our procedures included confirmation of securities owned as of November 30, 2015, by correspondence with the custodian and brokers; when replies were not received from brokers, we performed other auditing procedures. We believe that our audits provide a reasonable basis for our opinion.
In our opinion, the financial statements and financial highlights referred to above present fairly, in all material respects, the financial position of Sprott Gold Miners ETF and Sprott Junior Gold Miners ETF of the ALPS ETF Trust as of November 30, 2015, and the results of their operations, the changes in their net assets, and the financial highlights for the periods presented, in conformity with accounting principles generally accepted in the United States of America.
DELOITTE & TOUCHE LLP
Denver, Colorado
January 28, 2016
8 | November 30, 2015
| | |
Sprott Gold Miners ETF | | |
| |
| Schedule of Investments | | November 30, 2015 |
| | | | | | | | |
| Security Description | | Shares | | | Value | |
| |
COMMON STOCKS (99.73%) | | | | | | | | |
Gold Mining (94.97%) | | | | | | | | |
Agnico Eagle Mines Ltd. | | | 629,267 | | | $ | 16,644,112 | |
Alamos Gold, Inc., Class A | | | 886,709 | | | | 2,660,127 | |
AngloGold Ashanti Ltd., Sponsored ADR(a) | | | 463,074 | | | | 2,963,674 | |
Barrick Gold Corp. | | | 682,444 | | | | 5,009,139 | |
Eldorado Gold Corp. | | | 1,327,572 | | | | 4,062,370 | |
Franco-Nevada Corp. | | | 346,270 | | | | 16,589,796 | |
Gold Fields Ltd., Sponsored ADR | | | 1,163,618 | | | | 2,943,953 | |
Goldcorp, Inc. | | | 1,397,201 | | | | 16,500,944 | |
Kinross Gold Corp.(a) | | | 1,485,331 | | | | 2,851,835 | |
New Gold, Inc.(a) | | | 1,239,194 | | | | 2,738,619 | |
Newmont Mining Corp. | | | 282,600 | | | | 5,202,666 | |
NOVAGOLD RESOURCES, Inc.(a) | | | 593,065 | | | | 2,218,063 | |
Pretium Resources, Inc.(a) | | | 348,858 | | | | 1,880,345 | |
Primero Mining Corp.(a) | | | 1,136,786 | | | | 2,580,504 | |
Randgold Resources Ltd., ADR | | | 80,308 | | | | 4,866,665 | |
Royal Gold, Inc. | | | 149,089 | | | | 5,359,750 | |
Sandstorm Gold Ltd.(a) | | | 943,578 | | | | 2,491,046 | |
Seabridge Gold, Inc.(a) | | | 237,529 | | | | 1,876,479 | |
Sibanye Gold Ltd., Sponsored ADR | | | 425,949 | | | | 2,244,751 | |
Yamana Gold, Inc. | | | 2,298,673 | | | | 4,827,213 | |
| | | | | | | | |
Total Gold Mining | | | | | | | 106,512,051 | |
| | | | | | | | |
| | |
Silver Mining (4.76%) | | | | | | | | |
Coeur Mining, Inc.(a) | | | 299,880 | | | | 767,693 | |
First Majestic Silver Corp.(a) | | | 315,809 | | | | 1,054,802 | |
Fortuna Silver Mines, Inc.(a) | | | 357,254 | | | | 878,845 | |
Silver Standard Resources, Inc.(a) | | | 184,817 | | | | 970,289 | |
Silver Wheaton Corp. | | | 127,259 | | | | 1,669,638 | |
| | | | | | | | |
Total Silver Mining | | | | | | | 5,341,267 | |
| | | | | | | | |
| | |
TOTAL COMMON STOCKS (Cost $154,281,080) | | | | | | | 111,853,318 | |
| | | | | | | | |
| | | | | | | | | | | | |
| | | 7 Day Yield | | | Shares | | | Value | |
| |
SHORT TERM INVESTMENTS (0.20%) | | | | | |
Morgan Stanley Institutional Liquidity Fund, Prime Portfolio | | | 0.105% | | | | 227,501 | | | | 227,501 | |
| | | | | | | | | | | | |
| |
TOTAL SHORT TERM INVESTMENTS (Cost $227,501) | | | | 227,501 | |
| | | | | | | | | | | | |
| |
TOTAL INVESTMENTS (99.93%) (Cost $154,508,581) | | | $ | 112,080,819 | |
| |
NET OTHER ASSETS AND LIABILITIES (0.07%) | | | | 76,784 | |
| | | | | | | | | | | | |
| |
NET ASSETS (100.00%) | | | $ | 112,157,603 | |
| | | | | | | | | | | | |
| (a) | Non-income producing security. |
Common Abbreviations:
Ltd. - Limited.
ADR - American Depositary Receipt.
See Notes to Financial Statements.
9 | November 30, 2015
| | |
Sprott Junior Gold Miners ETF | | |
| |
| Schedule of Investments | | November 30, 2015 |
| | | | | | | | |
| Security Description | | Shares | | | Value | |
| |
COMMON STOCKS (99.77%) | | | | | | | | |
Gold Mining (79.56%) | | | | | | | | |
Alacer Gold Corp.(a) | | | 238,894 | | | $ | 459,738 | |
Alamos Gold, Inc., Class A | | | 220,410 | | | | 661,230 | |
Asanko Gold, Inc.(a) | | | 85,273 | | | | 128,345 | |
B2Gold Corp.(a) | | | 970,947 | | | | 1,061,502 | |
Centerra Gold, Inc. | | | 297,999 | | | | 1,620,033 | |
China Gold International Resources Corp., Ltd.(a) | | | 509,308 | | | | 713,172 | |
Cia de Minas Buenaventura SAA, ADR | | | 111,331 | | | | 527,709 | |
Detour Gold Corp.(a) | | | 200,553 | | | | 2,088,953 | |
Gold Fields Ltd., Sponsored ADR | | | 322,608 | | | | 816,198 | |
Guyana Goldfields, Inc.(a) | | | 68,567 | | | | 151,464 | |
IAMGOLD Corp.(a) | | | 167,976 | | | | 255,323 | |
Kirkland Lake Gold, Inc.(a) | | | 104,695 | | | | 371,601 | |
Klondex Mines Ltd.(a) | | | 122,204 | | | | 237,005 | |
Lake Shore Gold Corp.(a) | | | 381,915 | | | | 274,543 | |
New Gold, Inc.(a) | | | 423,095 | | | | 935,040 | |
NOVAGOLD RESOURCES, Inc.(a) | | | 135,812 | | | | 507,937 | |
OceanaGold Corp. | | | 747,064 | | | | 1,443,278 | |
Osisko Gold Royalties Ltd. | | | 97,661 | | | | 1,035,516 | |
Premier Gold Mines Ltd.(a) | | | 73,545 | | | | 122,809 | |
Pretium Resources, Inc.(a) | | | 60,814 | | | | 327,787 | |
Primero Mining Corp.(a) | | | 139,515 | | | | 316,699 | |
Sandstorm Gold Ltd.(a) | | | 110,648 | | | | 292,111 | |
Seabridge Gold, Inc.(a) | | | 22,373 | | | | 176,747 | |
SEMAFO, Inc.(a) | | | 334,481 | | | | 788,959 | |
Sibanye Gold Ltd., Sponsored ADR | | | 288,878 | | | | 1,522,387 | |
Torex Gold Resources, Inc.(a) | | | 325,122 | | | | 287,277 | |
Yamana Gold, Inc. | | | 778,798 | | | | 1,635,476 | |
| | | | | | | | |
Total Gold Mining | | | | | | | 18,758,839 | |
| | | | | | | | |
| | |
Precious Metals & Minerals (8.25%) | | | | | | | | |
Tahoe Resources, Inc. | | | 221,243 | | | | 1,946,614 | |
| | | | | | | | |
Total Precious Metals & Minerals | | | | | | | 1,946,614 | |
| | | | | | | | |
| | |
Silver Mining (11.96%) | | | | | | | | |
Coeur Mining, Inc.(a) | | | 56,501 | | | | 144,643 | |
First Majestic Silver Corp.(a) | | | 125,075 | | | | 417,751 | |
Fortuna Silver Mines, Inc.(a) | | | 105,955 | | | | 260,649 | |
Hecla Mining Co. | | | 302,379 | | | | 583,591 | |
MAG Silver Corp.(a) | | | 28,040 | | | | 194,849 | |
Pan American Silver Corp. | | | 125,438 | | | | 873,048 | |
Silver Standard Resources, Inc.(a) | | | 65,740 | | | | 345,135 | |
| | | | | | | | |
Total Silver Mining | | | | | | | 2,819,666 | |
| | | | | | | | |
| | |
TOTAL COMMON STOCKS (Cost $25,108,006) | | | | | | | 23,525,119 | |
| | | | | | | | |
| | | | | | | | | | | | |
| | | 7 Day Yield | | | Shares | | | Value | |
| |
SHORT TERM INVESTMENTS (0.19%) | | | | | |
Morgan Stanley Institutional Liquidity Fund, Prime Portfolio | | | 0.105% | | | | 43,785 | | | | 43,785 | |
| | | | | | | | | | | | |
| |
TOTAL SHORT TERM INVESTMENTS (Cost $43,785) | | | | 43,785 | |
| | | | | | | | | | | | |
| |
TOTAL INVESTMENTS (99.96%) (Cost $25,151,791) | | | $ | 23,568,904 | |
| |
NET OTHER ASSETS AND LIABILITIES (0.04%) | | | | 10,024 | |
| | | | | | | | | | | | |
| |
NET ASSETS (100.00%) | | | $ | 23,578,928 | |
| | | | | | | | | | | | |
| (a) | Non-income producing security. |
|
Common Abbreviations: |
Ltd. - Limited. |
ADR - American Depositary Receipt. |
SAA - Sociedad Anonima Abierta is the Peruvian term used for companies with 20 or more shareholders. |
See Notes to Financial Statements.
10 | November 30, 2015
| | |
Sprott ETFs | | |
| |
| Statements of Assets and Liabilities | | November 30, 2015 |
| | | | | | | | |
| | | Sprott Gold Miners | | | Sprott Junior Gold | |
| | | ETF | | | Miners ETF | |
| |
ASSETS: | | | | | | | | |
Investments, at value | | $ | 112,080,819 | | | $ | 23,568,904 | |
Receivable for shares sold | | | – | | | | 2,269 | |
Foreign tax reclaims | | | 70,277 | | | | 1,342 | |
Dividends receivable | | | 59,808 | | | | 17,080 | |
| |
Total Assets | | | 112,210,904 | | | | 23,589,595 | |
| |
| | |
LIABILITIES: | | | | | | | | |
Payable to adviser | | | 53,301 | | | | 10,667 | |
| |
Total Liabilities | | | 53,301 | | | | 10,667 | |
| |
NET ASSETS | | $ | 112,157,603 | | | $ | 23,578,928 | |
| |
| | |
NET ASSETS CONSIST OF: | | | | | | | | |
Paid-in capital | | $ | 185,676,984 | | | $ | 29,782,950 | |
Accumulated net investment income | | | 996,661 | | | | 50,828 | |
Accumulated net realized loss on investments and foreign currency transactions | | | (32,088,280) | | | | (4,674,328) | |
Net unrealized depreciation on investments and translation of assets and liabilities denominated in foreign currencies | | | (42,427,762) | | | | (1,580,522) | |
| |
NET ASSETS | | $ | 112,157,603 | | | $ | 23,578,928 | |
| |
| | |
INVESTMENTS, AT COST | | $ | 154,508,581 | | | $ | 25,151,791 | |
| | |
PRICING OF SHARES | | | | | | | | |
Net Assets | | $ | 112,157,603 | | | $ | 23,578,928 | |
Shares of beneficial interest outstanding (Unlimited number of shares authorized, par value $0.01 per share) | | | 8,650,000 | | | | 1,200,000 | |
Net Asset Value, offering and redemption price per share | | $ | 12.97 | | | $ | 19.65 | |
See Notes to Financial Statements.
11 | November 30, 2015
| | |
Sprott ETFs | | |
| |
| Statements of Operations | | For the Year Ended November 30, 2015 |
| | | | | | | | |
| | | Sprott Gold Miners | | | Sprott Junior Gold | |
| | | ETF | | | Miners ETF(a) | |
| |
INVESTMENT INCOME: | | | | | | | | |
Dividends(b) | | $ | 1,768,806 | | | $ | 111,166 | |
| |
Total Investment Income | | | 1,768,806 | | | | 111,166 | |
| |
| | |
EXPENSES: | | | | | | | | |
Investment adviser fees | | | 857,406 | | | | 73,434 | |
| |
Total Expense | | | 857,406 | | | | 73,434 | |
| |
NET INVESTMENT INCOME | | | 911,400 | | | | 37,732 | |
| |
| | |
REALIZED AND UNREALIZED GAIN/(LOSS) | | | | | | | | |
Net realized loss on investments | | | (30,478,711) | | | | (4,015,308) | |
Net realized loss on foreign currency transactions | | | (1,862) | | | | (3,961) | |
Net change in unrealized depreciation on investments | | | (28,677,091) | | | | (1,582,887) | |
Net change in unrealized appreciation on translation of assets and liabilities denominated in foreign currencies | | | – | | | | 2,365 | |
| |
NET REALIZED AND UNREALIZED LOSS ON INVESTMENTS | | | (59,157,664) | | | | (5,599,791) | |
| |
NET DECREASE IN NET ASSETS RESULTING FROM OPERATIONS | | $ | (58,246,264) | | | $ | (5,562,059) | |
| |
| (a) | The Sprott Junior Gold Miners ETF commenced operations on March 31, 2015. |
| (b) | Net of foreign tax withholding in the amounts of $244,192 and $10,010 respectively. |
See Notes to Financial Statements.
12 | November 30, 2015
| | |
Sprott Gold Miners ETF | | |
| |
| Statements of Changes in Net Assets | | |
| | | | | | | | |
| | | | | | For the Period | |
| | | | | | July 15, 2014 | |
| | | For the | | | (Commencement | |
| | | Year Ended | | | of Operations) to | |
| | | November 30, | | | November 30, | |
| | | 2015 | | | 2014 | |
| |
OPERATIONS: | | | | | | | | |
Net investment income | | $ | 911,400 | | | $ | 51,960 | |
Net realized loss on investments and foreign currency transactions | | | (30,480,573) | | | | (3,825,706) | |
Net change in unrealized depreciation on investments | | | (28,677,091) | | | | (13,750,671) | |
| |
Net decrease in net assets resulting from operations | | | (58,246,264) | | | | (17,524,417) | |
| |
| | |
DISTRIBUTIONS TO SHAREHOLDERS: | | | | | | | | |
From net investment income | | | (277,011) | | | | – | |
| |
Total distributions | | | (277,011) | | | | – | |
| |
| | |
CAPITAL SHARE TRANSACTIONS: | | | | | | | | |
Proceeds from sale of shares | | | 151,779,023 | | | | 108,978,762 | |
Cost of shares redeemed | | | (70,053,767) | | | | (2,498,723) | |
| |
Net increase from capital share transactions | | | 81,725,256 | | | | 106,480,039 | |
| |
Net increase in net assets | | | 23,201,981 | | | | 88,955,622 | |
| | |
NET ASSETS: | | | | | | | | |
Beginning of year | | | 88,955,622 | | | | – | |
| |
End of year * | | $ | 112,157,603 | | | $ | 88,955,622 | |
| |
| | |
*Including accumulated net investment income of: | | $ | 996,661 | | | $ | 52,007 | |
| | |
OTHER INFORMATION: | | | | | | | | |
CAPITAL SHARE TRANSACTIONS: | | | | | | | | |
Beginning shares | | | 5,100,002 | | | | – | |
Shares sold | | | 7,800,000 | | | | 5,200,002 | |
Shares redeemed | | | (4,250,002) | | | | (100,000) | |
| |
Shares outstanding, end of period | | | 8,650,000 | | | | 5,100,002 | |
| |
See Notes to Financial Statements.
13 | November 30, 2015
| | |
Sprott Junior Gold Miners ETF | | |
| |
| Statements of Changes in Net Assets | | |
| | | | |
| | | For the Period | |
| | | March 31, 2015 | |
| | | (Commencement | |
| | | of Operations) to | |
| | | November 30, | |
| | | 2015 | |
| |
OPERATIONS: | | | | |
Net investment income | | $ | 37,732 | |
Net realized loss on investments and foreign currency transactions | | | (4,019,269) | |
Net change in unrealized depreciation on investments and translation of assets and liabilities denominated in foreign currencies | | | (1,580,522) | |
| |
Net decrease in net assets resulting from operations | | | (5,562,059) | |
| |
| |
CAPITAL SHARE TRANSACTIONS: | | | | |
Proceeds from sale of shares | | | 33,407,426 | |
Cost of shares redeemed | | | (4,266,439) | |
| |
Net increase from capital share transactions | | | 29,140,987 | |
| |
Net increase in net assets | | | 23,578,928 | |
| |
NET ASSETS: | | | | |
Beginning of period | | | – | |
| |
End of period * | | $ | 23,578,928 | |
| |
| |
*Including accumulated net investment income of: | | $ | 50,828 | |
| |
OTHER INFORMATION: | | | | |
CAPITAL SHARE TRANSACTIONS: | | | | |
Beginning shares | | | – | |
Shares sold | | | 1,350,002 | |
Shares redeemed | | | (150,002) | |
| |
Shares outstanding, end of period | | | 1,200,000 | |
| |
See Notes to Financial Statements.
14 | November 30, 2015
| | |
Sprott Gold Miners ETF | | |
| |
| Financial Highlights | | For a Share Outstanding Throughout the Periods Presented |
| | | | | | | | |
| | | | | | For the Period | |
| | | | | | July 15, 2014 | |
| | | For the Year | | | (Commencement | |
| | | Ended | | | of Operations) to | |
| | | November 30, | | | November 30, | |
| | | 2015 | | | 2014 | |
| |
NET ASSET VALUE, BEGINNING OF PERIOD | | $ | 17.44 | | | $ | 25.00 | |
| | |
INCOME/(LOSS) FROM INVESTMENT OPERATIONS: | | | | | | | | |
Net investment income (a) | | | 0.10 | | | | 0.02 | |
Net realized and unrealized loss | | | (4.52) | | | | (7.58) | |
| |
Total from investment operations | | | (4.42) | | | | (7.56) | |
| |
| | |
DISTRIBUTIONS: | | | | | | | | |
From net investment income | | | (0.05) | | | | – | |
| |
Total distributions | | | (0.05) | | | | – | |
| |
| | |
Net decrease in net asset value | | | (4.47) | | | | (7.56) | |
| |
NET ASSET VALUE, END OF PERIOD | | $ | 12.97 | | | $ | 17.44 | |
| |
TOTAL RETURN(b) | | | (25.44)% | | | | (30.24)% | |
| | |
RATIOS/SUPPLEMENTAL DATA: | | | | | | | | |
Net assets, end of period (000s) | | $ | 112,158 | | | $ | 88,956 | |
| | |
Ratio of expenses to average net assets | | | 0.57% | | | | 0.57%(c) | |
Ratio of net investment income to average net assets | | | 0.61% | | | | 0.31%(c) | |
Portfolio turnover rate(d) | | | 78% | | | | 36% | |
| (a) | Based on average shares outstanding during the period. |
| (b) | Total return is calculated assuming an initial investment made at the net asset value at the beginning of the period and redemption at the net asset value on the last day of the period and assuming all distributions are reinvested at reinvestment prices. Total return calculated for a period of less than one year is not annualized. |
| (d) | Portfolio turnover for periods less than one year are not annualized and does not include securities received or delivered from processing creations or redemptions. |
See Notes to Financial Statements.
15 | November 30, 2015
| | |
Sprott Junior Gold Miners ETF | | |
| |
| Financial Highlights | | For a Share Outstanding Throughout the Periods Presented |
| | | | |
| | | For the Period | |
| | | March 31, 2015 | |
| | | (Commencement | |
| | | of Operations) to | |
| | | November 30, | |
| | | 2015 | |
| |
NET ASSET VALUE, BEGINNING OF PERIOD | | $ | 24.18 | |
| |
INCOME/(LOSS) FROM INVESTMENT OPERATIONS: | | | | |
Net investment income (a) | | | 0.04 | |
Net realized and unrealized loss | | | (4.57) | |
| |
Total from investment operations | | | (4.53) | |
| |
| |
Net decrease in net asset value | | | (4.53) | |
| |
NET ASSET VALUE, END OF PERIOD | | $ | 19.65 | |
| |
TOTAL RETURN(b) | | | (18.73)% | |
| |
RATIOS/SUPPLEMENTAL DATA: | | | | |
Net assets, end of period (000s) | | $ | 23,579 | |
| |
Ratio of expenses to average net assets | | | 0.57%(c) | |
Ratio of net investment income to average net assets | | | 0.29%(c) | |
Portfolio turnover rate(d) | | | 71% | |
| (a) | Based on average shares outstanding during the period. |
| (b) | Total return is calculated assuming an initial investment made at the net asset value at the beginning of the period and redemption at the net asset value on the last day of the period and assuming all distributions are reinvested at reinvestment prices. Total return calculated for a period of less than one year is not annualized. |
| (d) | Portfolio turnover for periods less than one year are not annualized and does not include securities received or delivered from processing creations or redemptions. |
See Notes to Financial Statements.
16 | November 30, 2015
| | |
Sprott ETFs | | |
| |
| Notes to Financial Statements | | November 30, 2015 |
1. ORGANIZATION
The ALPS ETF Trust (the “Trust”), a Delaware statutory trust, is an open-end management investment company under the Investment Company Act of 1940, as amended (the “1940 Act”). As of November 30, 2015, the Trust consists of twenty-one separate portfolios. Each portfolio represents a separate series of the Trust. This report pertains to the Sprott Gold Miners ETF and the Sprott Junior Gold Miners ETF (each a “Fund” and collectively, the “Funds”).
The investment objective of the Sprott Gold Miners ETF is to seek investment results that correspond (before fees and expenses) generally to the performance of its underlying index, the Sprott Zacks Gold Miners Index (the “Underlying Index”). The investment advisor uses a “passive” or indexing approach to try to achieve the Fund’s investment objective. The Sprott Gold Miners ETF is considered non-diversified and may invest a greater portion of assets in securities of individual issuers than a diversified fund. As a result, changes in the market value of a single investment could cause greater fluctuations in share price than would occur in a diversified fund. The Sprott Gold Miners ETF commenced operations on July 15, 2014.
The investment objective of the Sprott Junior Gold Miners ETF is to seek investment results that correspond (before fees and expenses) generally to the performance of its underlying index, the Sprott Zacks Junior Gold Miners Index (the “Underlying Index”). The investment advisor uses a “passive” or indexing approach to try to achieve the Fund’s investment objective. The Sprott Junior Gold Miners ETF is considered non-diversified and may invest a greater portion of assets in securities of individual issuers than a diversified fund. As a result, changes in the market value of a single investment could cause greater fluctuations in share price than would occur in a diversified fund. The Sprott Junior Gold Miners ETF commenced operations on March 31, 2015.
The Funds’ Shares (“Shares”) are listed on the New York Stock Exchange (“NYSE”) Arca. Each Fund issues and redeems Shares, at net asset value (“NAV”) in blocks of 50,000 Shares, each of which is called a “Creation Unit”. Creation Units are issued and redeemed principally in-kind for securities included in a specified index. Except when aggregated in Creation Units, Shares are not redeemable securities of the Fund.
Pursuant to the Trust’s organizational documents, its Officers and Trustees are indemnified against certain liability arising out of the performance of their duties to the Trust. Additionally, in the normal course of business, the Trust enters into contracts with service providers that contain general indemnification clauses. The Trust’s maximum exposure under these arrangements is unknown, as this would involve future claims that may be made against the Trust that have not yet occurred.
2. SIGNIFICANT ACCOUNTING POLICIES
The following is a summary of significant accounting policies consistently followed by the Funds in the preparation of the financial statements. The accompanying financial statements were prepared in accordance with accounting principles generally accepted in the United States of America (“U.S. GAAP”). The preparation of financial statements in conformity with U.S. GAAP requires management to make certain estimates and assumptions that affect the reported amounts of assets and liabilities and disclosures of contingent assets and liabilities at the date of the financial statements and the reported amounts of revenue and expenses during the period. Actual results could differ from those estimates. Each Fund is considered an investment company under U.S. GAAP and follows the accounting and reporting guidance applicable to investment companies in the Financial Accounting Standards Board Accounting Standards Codification Topic 946.
A. Portfolio Valuation
Each Fund’s NAV is determined daily, as of the close of regular trading on the NYSE, normally 4:00 p.m. Eastern time, on each day the NYSE is open for trading. The NAV is computed by dividing the value of all assets of the Fund (including accrued interest and dividends), less all liabilities (including accrued expenses and dividends declared but unpaid), by the total number of shares outstanding.
Portfolio securities listed on any exchange other than the NASDAQ Stock Market LLC (“NASDAQ”) are valued at the last sale price on the business day as of which such value is being determined. If there has been no sale on such day, the securities are valued at the mean of the most recent bid and ask prices on such day. Securities traded on the NASDAQ are valued at the NASDAQ Official Closing Price as determined by NASDAQ. Portfolio securities traded on more than one securities exchange are valued at the last sale price on the business day as of which such value is being determined at the close of the exchange representing the principal market for such securities. Portfolio securities traded in the over-the-counter market, but excluding securities traded on the NASDAQ, are valued at the last quoted sale price in such market.
The Funds’ investments are valued at market value or, in the absence of market value with respect to any portfolio securities, at fair value according to procedures adopted by the Trust’s Board of Trustees (the “Board”). When market quotations are not readily available or when events occur that make established valuation methods unreliable, securities of the Funds may be valued in good faith by or under the direction of the Board. These securities generally include, but are not limited to, restricted securities (securities which may not be publicly sold without registration
17 | November 30, 2015
| | |
Sprott ETFs | | |
| |
| Notes to Financial Statements | | November 30, 2015 |
under the Securities Act of 1933) for which a pricing service is unable to provide a market price; securities whose trading has been formally suspended; a security whose market price is not available from a pre-established primary pricing source or the pricing source is not willing to provide a price; a security with respect to which an event has occurred that is most likely to materially affect the value of the security after the market has closed but before the calculation of the Fund’s NAV or make it difficult or impossible to obtain a reliable market quotation; or a security whose price, as provided by the pricing service, does not reflect the security’s “fair value” due to the security being de-listed from a national exchange or the security’s primary trading market is temporarily closed at a time when, under normal conditions, it would be open. As a general principle, the current “fair value” of a security would be the amount which the owner might reasonably expect to receive from the sale on the applicable exchange or principal market. A variety of factors may be considered in determining the fair value of such securities.
B. Fair Value Measurements
Each Fund discloses the classification of its fair value measurements following a three-tier hierarchy based on the inputs used to measure fair value. Inputs refer broadly to the assumptions that market participants would use in pricing the asset or liability, including assumptions about risk. Inputs may be observable or unobservable. Observable inputs reflect the assumptions market participants would use in pricing the asset or liability that are developed based on market data obtained from sources independent of the reporting entity. Unobservable inputs reflect the reporting entity’s own assumptions about the assumptions market participants would use in pricing the asset or liability that are developed based on the best information available.
Valuation techniques used to value the Funds’ investments by major category are as follows:
Equity securities, including restricted securities, for which market quotations are readily available, are valued at the last reported sale price or official closing price as reported by a third party pricing vendor on the primary market or exchange on which they are traded and are categorized as Level 1 in the hierarchy. In the event there were no sales during the day or closing prices are not available, securities are valued at the mean of the most recent quoted bid and ask prices on such day and are generally categorized as Level 2 in the hierarchy. Investments in open-end mutual funds are valued at their closing NAV each business day and are categorized as Level 1 in the hierarchy.
Changes in valuation techniques may result in transfers in or out of an assigned level within the disclosure hierarchy.
Various inputs are used in determining the value of each Fund’s investments as of the end of the reporting period. When inputs used fall into different levels of the fair value hierarchy, the level in the hierarchy within which the fair value measurement falls is determined based on the lowest level input that is significant to the fair value measurement in its entirety. The designated input levels are not necessarily an indication of the risk or liquidity associated with these investments.
These inputs are categorized in the following hierarchy under applicable financial accounting standards:
| | | | |
Level 1 | | – | | Unadjusted quoted prices in active markets for identical investments, unrestricted assets or liabilities that a Fund has the ability to access at the measurement date; |
Level 2 | | – | | Quoted prices which are not active, quoted prices for similar assets or liabilities in active markets or inputs other than quoted prices that are observable (either directly or indirectly) for substantially the full term of the asset or liability; and |
Level 3 | | – | | Significant unobservable prices or inputs (including the Fund’s own assumptions in determining the fair value of investments) where there is little or no market activity for the asset or liability at the measurement date. |
The following is a summary of the inputs used to value the Funds’ investments at November 30, 2015:
Sprott Gold Miners ETF
| | | | | | | | | | | | | | |
| | | | | | Level 2 - Other | | | | | | |
Investments in Securities at Value | | Level - Unadjusted Quoted Prices | | | Significant Observable Inputs | | | Level 3 - Significant Unobservable Inputs | | | Total |
| | | | |
|
Common Stocks* | | $ | 111,853,318 | | | $ | – | | | $ | – | | | $ 111,853,318 |
Short Term Investments | | | 227,501 | | | | – | | | | – | | | 227,501 |
|
TOTAL | | $ | 112,080,819 | | | $ | – | | | $ | – | | | $ 112,080,819 |
|
18 | November 30, 2015
| | |
Sprott ETFs | | |
| |
| Notes to Financial Statements | | November 30, 2015 |
Sprott Junior Gold Miners ETF
| | | | | | | | | | | | | | |
| | | | | | Level 2 - Other | | | | | | |
| | | Level - Unadjusted | | | Significant Observable | | | Level 3 - Significant | | | |
| Investments in Securities at Value | | Quoted Prices | | | Inputs | | | Unobservable Inputs | | | Total |
|
Common Stocks* | | $ | 23,525,119 | | | $ | – | | | $ | – | | | $ 23,525,119 |
Short Term Investments | | | 43,785 | | | | – | | | | – | | | 43,785 |
|
TOTAL | | $ | 23,568,904 | | | $ | – | | | $ | – | | | $ 23,568,904 |
|
* For a detailed sector breakdown, see the accompanying Schedule of Investments.
The Funds recognize transfers between levels as of the end of the period. For the year or period ending November 30, 2015, the Funds did not have any transfers between Level 1 and Level 2 securities. The Funds did not have any securities which used significant unobservable inputs (Level 3) in determining fair value.
C. Gold and Silver Mining Industry Risk
The Underlying Indexes are concentrated in the gold and silver mining industry. As a result, the Funds will be sensitive to changes in, and their performance will depend to a greater extent on, the overall condition of the gold and silver mining industry. Competitive pressures may have a significant effect on the financial condition of such companies in the gold and silver mining industry. Also, gold and silver mining companies are highly dependent on the price of gold and silver bullion. These prices may fluctuate substantially over short periods of time so a Fund’s Share price may be more volatile than other types of investments. In times of significant inflation or great economic uncertainty, gold, silver and other precious metals may outperform traditional investments such as bonds and stocks. However, in times of stable economic growth, traditional equity and debt investments could offer greater appreciation potential and the value of gold, silver and other precious metals may be adversely affected, which could in turn affect a Fund’s returns. The production and sale of precious metals by governments or central banks or other large holders can be affected by various economic, financial, social and political factors, which may be unpredictable and may have a significant impact on the supply and prices of precious metals. Economic and political conditions in those countries that are the largest producers of gold may have a direct effect on the production and marketing of gold and on sales of central bank gold holdings. Some gold and precious metals mining operation companies may hedge their exposure to falls in gold and precious metals prices by selling forward future production, which may result in lower returns during periods when the price of gold and precious metals increases. The gold and precious metals industry can be significantly affected by events relating to international political developments, the success of exploration projects, commodity prices and tax and government regulations. If a natural disaster or other event with a significant economic impact occurs in a region where the companies in which each Fund invests operate, such disaster or event could negatively affect the profitability of such companies and, in turn, the Funds’ investment in them.
D. Foreign Investment Risk
A Fund’s investment in non-U.S. issuers, may involve unique risks compared to investing in securities of U.S. issuers, including, among others, greater market volatility than U.S. securities and less complete financial information than for U.S. issuers. In addition, adverse political, economic or social developments could undermine the value of a Fund’s investments or prevent a Fund from realizing the full value of its investments. Financial reporting standards for companies based in foreign markets differ from those in the United States. Finally, the value of the currency of the country in which a Fund has invested could decline relative to the value of the U.S. dollar, which may affect the value of the investment to U.S. investors. The Funds will not enter into transactions to hedge against declines in the value of a Fund’s assets that are denominated in a foreign currency.
Countries with emerging markets may have relatively unstable governments, may present the risks of nationalization of businesses, restrictions on foreign ownership and prohibitions on the repatriation of assets. The economies of emerging markets countries also may be based on only a few industries, making them more vulnerable to changes in local or global trade conditions and more sensitive to debt burdens or inflation rates.
E. Foreign Currency Translation
The books and records of the Funds are maintained in U.S. dollars. Investment valuations and other assets and liabilities initially expressed in foreign currencies are converted each business day into U.S. dollars based upon current exchange rates. The portion of realized and unrealized gains or losses on investments due to fluctuations in foreign currency exchange rates is not separately disclosed and is included in realized and unrealized gains or losses on investments, when applicable.
F. Concentration Risk
Each Fund seeks to track its respective Underlying Index, which itself may have concentration in certain regions, economies, countries, markets, industries or sectors. Based on the current composition of the Underlying Indexes, each Fund will be concentrated in the gold and silver mining industry. Underperformance or increased risk in such concentrated areas may result in underperformance or increased risk in each Fund.
19 | November 30, 2015
| | |
Sprott ETFs | | |
| |
| Notes to Financial Statements | | November 30, 2015 |
G. Securities Transactions and Investment Income
Securities transactions are recorded as of the trade date. Realized gains and losses from securities transactions are recorded on the highest cost basis. Dividend income and capital gains distributions, if any, are recorded on the ex-dividend date. Interest income, if any, is recorded on the accrual basis.
H. Dividends and Distributions to Shareholders
Dividends from net investment income for each Fund, if any, are declared and paid annually or as the Board may determine from time to time. Distributions of net realized capital gains earned by the Funds, if any, are distributed at least annually.
I. Federal Tax and Tax Basis Information
The timing and character of income and capital gain distributions are determined in accordance with income tax regulations, which may differ from U.S. GAAP. Reclassifications are made to the Funds’ capital accounts for permanent tax differences to reflect income and gains available for distribution (or available capital loss carryforwards) under income tax regulations.
For the year or period ended November 30, 2015, the following reclassifications, which had no impact on results of operations or net assets, were recorded to reflect permanent tax differences resulting primarily from in-kind transactions:
| | | | | | | | | | | | |
| | | | | | | | | Accumulated Net | |
| | | | | | Accumulated Net | | | Realized Loss on | |
| Fund | | Paid-in Capital | | | Investment Income | | | Investments | |
| |
Sprott Gold Miners ETF | | $ | (2,567,519) | | | $ | 310,265 | | | $ | 2,257,254 | |
Sprott Junior Gold Miners ETF | | | 641,963 | | | | 13,096 | | | | (655,059) | |
The tax character of the distributions paid by the Sprott Gold Miners ETF during the year ended November 30, 2015 was as follows:
| | | | |
| | | Ordinary Income | |
| |
Sprott Gold Miners ETF | | $ | 277,011 | |
As of the period ended November 30, 2014 the Sprott Gold Miners ETF paid no distributions. As of the period ended November 30, 2015 the Sprott Junior Gold Miners ETF paid no distributions.
At November 30, 2015, the Funds had available for tax purposes unused capital loss carryforwards as follows:
| | | | | | | | |
| Fund | | Short-Term | | | Long-Term | |
| |
Sprott Gold Miners ETF | | $ | 28,783,530 | | | $ | 2,705,264 | |
Sprott Junior Gold Miners ETF | | | 4,276,087 | | | | – | |
As of November 30, 2015, the components of distributable earnings on a tax basis for each Fund were as follows:
| | | | | | | | | | | | | | | | |
| | | | | | Accumulated net | | | Net unrealized | | | | |
| | | Accumulated net | | | realized loss on | | | depreciation on | | | | |
| | | investment income | | | investments | | | investments | | | Total | |
| |
Sprott Gold Miners ETF | | | 1,441,715 | | | $ | (31,488,794 | ) | | $ | (43,472,302 | ) | | $ | (73,519,381) | |
Sprott Junior Gold Miners ETF | | | 189,306 | | | | (4,276,087 | ) | | | (2,117,241 | ) | | | (6,204,022) | |
20 | November 30, 2015
| | |
Sprott ETFs | | |
| |
| Notes to Financial Statements | | November 30, 2015 |
As of November 30, 2015, the costs of investments for federal income tax purposes and accumulated net unrealized appreciation/(depreciation) on investments were as follows:
| | | | | | | | |
| | | | | | Sprott Junior Gold Miners | |
| | | Sprott Gold Miners ETF | | | ETF | |
| |
Gross appreciation (excess of value over tax cost) | | $ | 440,477 | | | $ | 765,375 | |
Gross depreciation (excess of tax cost over value) | | | (43,912,779) | | | | (2,884,981) | |
Net appreciation of foreign currency & derivatives | | | – | | | | 2,365 | |
| |
Net unrealized appreciation (depreciation) | | | (43,472,302) | | | | (2,117,241) | |
| |
Cost of investments for income tax purposes | | $ | 155,553,121 | | | $ | 25,688,510 | |
| |
The differences between book-basis and tax-basis are due to the deferral of losses from wash sales and Passive Foreign Investment Company (“PFIC”) adjustments.
J. Income Taxes
No provision for income taxes is included in the accompanying financial statements, as each Fund intends to distribute to shareholders all taxable investment income and realized gains and otherwise comply with Subchapter M of the Internal Revenue Code of 1986, as amended, applicable to regulated investment companies. Each Fund evaluates tax positions taken (or expected to be taken) in the course of preparing the Fund’s tax returns to determine whether these positions meet a “more-likely-than-not” standard that, based on the technical merits, have a more than fifty percent likelihood of being sustained by a taxing authority upon examination. A tax position that meets the “more-likely-than-not” recognition threshold is measured to determine the amount of benefit to recognize in the financial statements.
As of and during the year or period ended November 30, 2015, the Funds did not have a liability for any unrecognized tax benefits. Each Fund files U.S. federal, state, and local tax returns as required. Each Fund’s tax returns are subject to examination by the relevant tax authorities until expiration of the applicable statute of limitations which is generally three years after the filing of the tax return, but may extend to four years in certain jurisdictions. Tax returns for open years for the Sprott Gold Miners ETF have incorporated no uncertain tax positions that require a provision for income taxes. Being that the Sprott Junior Gold Miners ETF commenced operations on March 31, 2015, no tax returns have been filed as of the date of this report.
3. INVESTMENT ADVISORY FEE AND OTHER AFFILIATED TRANSACTIONS
ALPS Advisors, Inc. (the “Adviser”) acts as the Funds’ investment adviser pursuant to an advisory agreement with the Trust on behalf of each Fund (the “Advisory Agreement”). Pursuant to the Advisory Agreement, each Fund pays the Adviser a unitary fee for the services and facilities it provides, payable on a monthly basis as a percentage of each Fund’s average daily net assets as set forth below. From time to time, the Adviser may waive all or a portion of its fee.
| | |
| Fund | | Advisory Fee |
|
Sprott Gold Miners ETF | | 0.57% |
Sprott Junior Gold Miners ETF | | 0.57% |
Out of the unitary management fee, the Adviser pays substantially all expenses for each Fund, including the cost of transfer agency, custody, fund administration, legal, audit, independent trustees and other services, except for interest expenses, distribution fees or expenses, brokerage expenses, taxes and extraordinary expenses, such as litigation, not incurred in the ordinary course of each Fund’s business. The Adviser’s unitary management fee is designed to pay substantially all of the Funds’ expenses and to compensate the Adviser for providing services for the Funds.
ALPS Fund Services, Inc., an affiliate of the Adviser, is the administrator to the Funds.
Each Trustee who is not an officer or employee of the Adviser, any sub-adviser or any of their affiliates (“Independent Trustees”) receives (1) a quarterly retainer of $5,000, (2) a per meeting fee for regularly scheduled meetings of $3,750, (3) $1,500 for any special meeting held outside of a regularly scheduled board meeting, and (4) reimbursement for all reasonable out-of-pocket expenses relating to attendance at meetings.
21 | November 30, 2015
| | |
Sprott ETFs | | |
| |
| Notes to Financial Statements | | November 30, 2015 |
4. PURCHASES AND SALES OF SECURITIES
For the year or period ended November 30, 2015, the cost of purchases and proceeds from sales of investment securities, excluding short-term investments and in-kind transactions, were as follows:
| | | | | | | | |
| Fund | | Purchases | | | Sales | |
| |
Sprott Gold Miners ETF | | $ | 115,582,219 | | | $ | 115,196,923 | |
Sprott Junior Gold Miners ETF | | | 14,356,739 | | | | 13,173,907 | |
For the year or period ended November 30, 2015, the cost of in-kind purchases and proceeds from in-kind sales were as follows:
| | | | | | | | |
| Fund | | | | | Sales | |
| |
Sprott Gold Miners ETF | | $ | 151,790,820 | | | $ | 70,090,278 | |
Sprott Junior Gold Miners ETF | | | 33,404,084 | | | | 5,463,606 | |
The Sprott Gold Miners ETF and the Sprott Junior Gold Miners ETF had in-kind net realized gain/(loss) of $(1,359,470) and $641,963, respectively.
Gains on in-kind transactions are not considered taxable for federal income tax purposes.
5. CAPITAL SHARE TRANSACTIONS
Shares are created and redeemed by each Fund only in Creation Unit size aggregations of 50,000. Only broker-dealers or large institutional investors with creation and redemption agreements called Authorized Participants (“AP”) are permitted to purchase or redeem Creation Units from the Funds. Such transactions are generally permitted on an in-kind basis, with a balancing cash component to equate the transaction to the NAV per unit of each Fund on the transaction date. Cash may be substituted equivalent to the value of certain securities generally when they are not available in sufficient quantity for delivery, not eligible for trading by the AP or as a result of other market circumstances.
22 | November 30, 2015
| | |
Sprott ETFs | | |
| |
| Additional Information | | November 30, 2015 (Unaudited) |
PROXY VOTING RECORDS, POLICIES AND PROCEDURES
Information regarding how the Fund voted proxies relating to portfolio securities during the most recent 12-month period ended June 30 and a description of the Fund’s proxy voting policies and procedures used in determining how to vote for proxies are available without charge on the Securities and Exchange Commission’s (“SEC”) website at www.sec.gov and upon request, by calling (toll-free) 1-866-675-2639.
PORTFOLIO HOLDINGS
The Trust is required to disclose, after its first and third fiscal quarters, the complete schedule of each Fund’s portfolio holdings with the SEC on Form N-Q. Form N-Q for each Fund will be available on the SEC’s website at www.sec.gov. Each Fund’s Form N-Q may also be reviewed and copied at the SEC’s Public Reference Room in Washington, D.C. and information on the operation of the Public Reference Room may be obtained by calling 1-800-SEC-0330. Each Fund’s Form N-Q will be available without charge, upon request, by calling (toll-free) 1-866-675-2639 or by writing to ALPS ETF Trust at 1290 Broadway, Suite 1100, Denver, Colorado 80203.
TAX INFORMATION
Pursuant to Section 853(c) of the Internal Revenue Code, the Funds designated the following:
| | | | | | | | |
| | | Foreign Taxes Paid | | | Foreign Source Income | |
| |
Sprott Gold Miners ETF | | | $ 234,648 | | | | $ 1,930,730 | |
Sprott Junior Gold Miners ETF | | | 7,182 | | | | 100,068 | |
The Funds designated the following for federal income tax purposes for distributions made during the calendar year ended December 31, 2014:
| | | | |
| | | Qualified Dividend Income | | Dividend Received Deduction |
|
Sprott Gold Miners ETF | | 36.84% | | 6.54% |
In early 2015, if applicable, shareholders of record received this information for the distribution paid to them by the Fund during the calendar year 2014 via Form 1099. The Fund will notify shareholders in early 2016 of amounts paid to them by the Fund, if any, during the calendar year 2015.
LICENSING AGREEMENTS
Sprott Gold Miners ETF
Zacks Investment Management, Inc. (the “Licensor”) has entered into a license agreement with Sprott Asset Management LP (“Sprott”) to use the “Sprott” name and certain related intellectual property in connection with the underlying index, the Sprott Zacks Gold Miners Index (the “Underlying Index”) (the “Sprott License Agreement”). Pursuant to the Sprott License Agreement, Sprott in turn has entered into a sublicense agreement with ALPS Advisers, Inc. to use the Underlying Index (the “Sublicense Agreement”) in connection with the Sprott Gold Miners ETF (the “Product”).
The following disclosure relates to the Licensor and Sprott:
The Product(s) is not sponsored, endorsed, sold or promoted by ZACKS INVESTMENT MANAGEMENT, INC. (“Licensor”) Licensor makes no representation or warranty, express or implied, regarding the advisability of investing in securities generally or in the Product(s) particularly or the ability of the Index to track general market performance. Licensor’s only relationship to the Licensee is the licensing of the Index which is determined and composed by Licensor without regard to the Licensee or the owners of the Product(s). Licensor has no obligation to take the needs of the Licensee or the owners of the Product(s) into consideration in determining or composing the Index. Licensor shall not be liable to any person for any error in the Index nor shall it be under any obligation to advise any person of any error therein.
The Fund is not sponsored by Sprott. Sprott makes no representation or warranty, express or implied, to the owners of the Fund or any member of the public regarding the advisability of investing in securities or commodities generally or in the Fund particularly and does not guarantee the quality, accuracy or completeness of the Underlying Index or any Underlying Index data included herein or derived therefrom and assume no liability in connection with their use. The Underlying Index is determined and composed without regard to the Adviser or the Fund. Sprott has no obligation to take the needs of the Adviser, the Fund or the shareholders of the Fund into consideration in connection with the foregoing. Sprott is not responsible for and has not participated in the determination of pricing or the timing of the issuance or sale of the Shares of the Fund or in the determination or calculation of the NAV of the Fund. Sprott has no obligation or liability in connection with the administration or trading of the Fund.
23 | November 30, 2015
| | |
Sprott ETFs | | |
| |
| Additional Information | | November 30, 2015 (Unaudited) |
Sprott does not guarantee the accuracy and/or completeness of the Underlying Index or any data included therein, and Sprott shall have no liability for any errors, omissions, or interruptions therein. Sprott makes no warranty, express or implied, as to results to be obtained by the Adviser, the Fund, Fund shareholders or any other person or entity from the use of the Underlying Index or any data included therein. Sprott makes no express or implied warranties, and expressly disclaims all warranties of merchantability or fitness for a particular purpose or use with respect to the Underlying Index or any data included therein. Without limiting any of the foregoing, in no event shall Sprott have any liability for any special, punitive, indirect, or consequential damages (including lost profits) arising out of matters relating to the use of the Underlying Index, even if notified of the possibility of such damages.
Sprott Junior Gold Miners ETF
Zacks Investment Management, Inc. (the “Licensor”) has entered into a license agreement with Sprott Asset Management LP (“Sprott”) to use the “Sprott” name and certain related intellectual property in connection with the underlying index, the Sprott Zacks Junior Gold Miners Index (the “Underlying Index”) (the “Sprott License Agreement”). Pursuant to the Sprott License Agreement, Sprott in turn has entered into a sublicense agreement with ALPS Advisers, Inc. to use the Underlying Index (the “Sublicense Agreement”) in connection with the Sprott Junior Gold Miners ETF (the “Product”).
The following disclosure relates to the Licensor and Sprott:
The Product(s) is not sponsored, endorsed, sold or promoted by ZACKS INVESTMENT MANAGEMENT, INC. (“Licensor”) Licensor makes no representation or warranty, express or implied, regarding the advisability of investing in securities generally or in the Product(s) particularly or the ability of the Index to track general market performance. Licensor’s only relationship to the Licensee is the licensing of the Index which is determined and composed by Licensor without regard to the Licensee or the owners of the Product(s). Licensor has no obligation to take the needs of the Licensee or the owners of the Product(s) into consideration in determining or composing the Index. Licensor shall not be liable to any person for any error in the Index nor shall it be under any obligation to advise any person of any error therein.
The Fund is not sponsored by Sprott. Sprott makes no representation or warranty, express or implied, to the owners of the Fund or any member of the public regarding the advisability of investing in securities or commodities generally or in the Fund particularly and does not guarantee the quality, accuracy or completeness of the Underlying Index or any Underlying Index data included herein or derived therefrom and assume no liability in connection with their use. The Underlying Index is determined and composed without regard to the Adviser or the Fund. Sprott has no obligation to take the needs of the Adviser, the Fund or the shareholders of the Fund into consideration in connection with the foregoing. Sprott is not responsible for and has not participated in the determination of pricing or the timing of the issuance or sale of the Shares of the Fund or in the determination or calculation of the NAV of the Fund. Sprott has no obligation or liability in connection with the administration or trading of the Fund.
Sprott does not guarantee the accuracy and/or completeness of the Underlying Index or any data included therein, and Sprott shall have no liability for any errors, omissions, or interruptions therein. Sprott makes no warranty, express or implied, as to results to be obtained by the Adviser, the Fund, Fund shareholders or any other person or entity from the use of the Underlying Index or any data included therein. Sprott makes no express or implied warranties, and expressly disclaims all warranties of merchantability or fitness for a particular purpose or use with respect to the Underlying Index or any data included therein. Without limiting any of the foregoing, in no event shall Sprott have any liability for any special, punitive, indirect, or consequential damages (including lost profits) arising out of matters relating to the use of the Underlying Index, even if notified of the possibility of such damages.
24 | November 30, 2015
| | |
Sprott ETFs | | |
| |
| Trustees & Officers | | November 30, 2015 (Unaudited) |
INDEPENDENT TRUSTEES
| | | | | | | | | | |
Name, Address & Year of Birth* | | Position(s) Held
with Trust | | Term of Office and Length of Time Served** | | Principal Occupation(s) During Past 5 Years | | Number of
Portfolios in Fund
Complex Overseen by Trustees*** | | Other Directorships Held by Trustees |
Mary K. Anstine,
1940 | | Trustee | | Since March 2008 | | Ms. Anstine was formerly an Executive Vice President of First Interstate Bank of Denver until 1994, President/Chief Executive Officer of HealthONE Alliance, Denver, Colorado, from 1994 to 2004, and has been retired since 2004. Ms. Anstine is also Trustee/Director of the following: AV Hunter Trust and Colorado Uplift Board. Ms. Anstine was formerly a Director of the Trust Bank of Colorado (later purchased and now known as Northern Trust Bank), HealthONE and Denver Area Council of the Boy Scouts of America and a member of the American Bankers Association Trust Executive Committee. | | 46 | | Ms. Anstine is a Trustee of ALPS Variable Investment Trust (9 funds); Financial Investors Trust (31 funds); Reaves Utility Income Fund; and Westcore Trust (12 funds). |
Jeremy W. Deems, 1976 | | Trustee | | Since March 2008 | | Mr. Deems is the Co-Founder, Chief Financial Officer of Green Alpha Advisors, LLC. Mr. Deems is Co-Portfolio Manager of the Shelton Green Alpha Fund. Prior to joining Green Alpha Advisors, Mr. Deems was CFO and Treasurer of Forward Management, LLC, ReFlow Management Co., LLC, ReFlow Fund, LLC, a private investment fund, and Sutton Place Management, LLC, an administrative services company. | | 46 | | Mr. Deems is a Trustee of ALPS Variable Investment Trust (9 funds); Financial Investors Trust (31 funds); Clough Funds Trust (1 fund);and Reaves Utility Income Fund. |
Rick A. Pederson, 1952 | | Trustee | | Since March 2008 | | Mr. Pederson is President, Foundation Properties, Inc. (a real estate investment management company), 1994 - present; Advisory Board Member, Bow River Capital Partners (private equity management), 2003 - present; Advisor, Pauls Corporation (real estate investment management and development), 2008 - present; Chairman, Ross Consulting Group (real estate consulting services) 1983-2013; Advisory Board, Neenan Company (construction services) 2002 - present; Board Member, Prosci, Inc. (private business services), 2013 - present; Board Member, Citywide Banks (Colorado community bank) 2014 - present; Board member, Professional Pediatric Health Care (a Denver-based home nursing firm) 2014 – present; Director, National Western Stock Show (not-for-profit organization); Director, Biennial of the Americas (not-for- profit organization). | | 24 | | Mr. Pederson is Trustee of Westcore Trust (12 funds) and Principal Real Estate Income Fund (1 fund). |
| * | The business address of the Trustee is c/o ALPS Advisors, Inc., 1290 Broadway, Suite 1100, Denver, Colorado 80203. |
| ** | This is the period for which the Trustee began serving the Trust. Each Trustee serves an indefinite term, until his successor is elected. |
| *** | The Fund Complex includes all series of the Trust and any other investment companies for which ALPS Advisors, Inc. provides investment advisory services. |
The Statement of Additional Information includes additional information about the Fund’s Trustees and is available, without charge, upon request by calling (toll-free) 1-866-675-2639.
25 | November 30, 2015
| | |
Sprott ETFs | | |
| |
| Trustees & Officers | | November 30, 2015 (Unaudited) |
INTERESTED TRUSTEE
| | | | | | | | | | |
Name, Address and Year of Birth of
Interested
Trustee* | | Position(s) Held
with Trust | | Term of Office and Length of Time Served** | | Principal Occupation(s) During Past 5 Years | | Number of
Portfolios in Fund
Complex Overseen by Trustees*** | | Other Directorships Held by Trustees |
Thomas A. Carter, 1966 | | Trustee and President | | Since March 2008 | | Mr. Carter joined ALPS Fund Services, Inc. (“ALPS”) in 1994 and is currently President and Director of ALPS Advisors, Inc. (“AAI”), and ALPS Portfolio Solutions Distributor, Inc. (“APSD”) and Executive Vice President and Director of ALPS and ALPS Holdings, Inc. (“AHI”), and ALPS Distributors, Inc. (“ADI”). Because of his position with AHI, ALPS, ADI, APSD and AAI, Mr. Carter is deemed an affiliate of the Fund as defined under the 1940 Act. Before joining ALPS, Mr. Carter was with Deloitte & Touche LLP, where he worked with a diverse group of clients, primarily within the financial services industry. Mr. Carter is a Certified Public Accountant and received his Bachelor of Science in Accounting from the University of Colorado at Boulder. | | 34 | | Mr. Carter is a Trustee of ALPS Variable Investment Trust (9 funds) and Principal Real Estate Income Fund (1 fund) |
| * | The business address of the Trustee is c/o ALPS Advisors, Inc., 1290 Broadway, Suite 1100, Denver, Colorado 80203. |
| ** | This is the period for which the Trustee began serving the Trust. Each Trustee serves an indefinite term, until his successor is elected. |
| *** | The Fund Complex includes all series of the Trust and any other investment companies for which ALPS Advisors, Inc. provides investment advisory services. |
The Statement of Additional Information includes additional information about the Fund’s Trustees and is available, without charge, upon request by calling (toll-free) 1-866-675-2639.
26 | November 30, 2015
| | |
Sprott ETFs | | |
| |
| Trustees & Officers | | November 30, 2015 (Unaudited) |
OFFICERS
| | | | | | |
Name, Address and Year of Birth of Officer* | | Position(s) Held with Trust | | Length of Time Served** | | Principal Occupation(s) During Past 5 Years |
Erin D. Nelson, 1977 | | Chief Compliance Officer (“CCO”) | | Since December 2015 | | Erin Nelson became Senior Vice-President and Chief Compliance Officer of ALPS Advisors, Inc. (“AAI”) on July 1, 2015 and prior to that served as Vice President and Deputy Chief Compliance Officer of AAI since January 1, 2015. Prior to January 1, 2015, Ms. Nelson was Vice-President and Assistant General Counsel of ALPS of Fund Services, Inc. Ms. Nelson joined AAI’s parent company, ALPS Holdings, Inc. in January 2003. Ms. Nelson currently is also the Chief Compliance Officer of Principal Real Estate Income Fund, and as of December 2015, the Chief Compliance Officer of Liberty All-Star Equity Fund, Liberty All-Star Growth Fund, Inc., RiverNorth Opportunities Fund, Inc. |
Patrick D. Buchanan, 1972 | | Treasurer | | Since June 2012 | | Mr. Buchanan is Vice President of AAI. Mr. Buchanan joined ALPS in 2007 and because of his position with AAI, he is deemed an affiliate of the Trust as defined under the 1940 Act. Mr. Buchanan is also Treasurer of the ALPS Variable Insurance Trust, Clough Funds Trust and Principal Real Estate Income Fund. |
William Parmentier, 1952 | | Vice President | | Since March 2008 | | Mr. Parmentier is Chief Investment Officer, AAI (since 2006); President and Chief Executive Officer of the Liberty All-Star Funds (since April 1999); Senior Vice President (2005-2006), Banc of America Investment Advisors, Inc. Because of his position with AAI, Mr. Parmentier is deemed an affiliate of the Trust as defined under the 1940 Act. |
Abigail J. Murray, 1975 | | Secretary | | Since June 2015 | | Ms. Murray joined ALPS in April 2015. She is currently Vice President and Senior Counsel of ALPS. Prior to joining ALPS, Ms. Murray was an Attorney and Managing Member at Murray & Rouvina PLC from 2014 to 2015 and an Associate with Vedder Price P.C. from 2007 to 2014. Because of her position with ALPS, Ms. Murray is deemed an affiliate of the Trust as defined under the 1940 Act. Ms. Murray is also the Secretary of The Caldwell & Orkin Funds, Inc., Clough Global Opportunities Fund, Clough Global Allocation Fund, Clough Global Equity Fund and Clough Funds Trust. |
Jennifer A. Craig, 1973 | | Assistant Secretary | | Since October 2013 | | Ms. Craig joined ALPS in 2007 and is currently Assistant Vice President and Paralegal Manager. Prior to joining ALPS, Ms. Craig was Legal Manager at Janus Capital Management LLC and served as Assistant Secretary of Janus Investment Fund, Janus Adviser Series and Janus Aspen Series. Because of her position with ALPS, Ms. Craig is deemed an affiliate of the Trust as defined under the 1940 Act. |
| * | The business address of the Officer is c/o ALPS Advisors, Inc., 1290 Broadway, Suite 1100, Denver, Colorado 80203. |
| ** | This is the period for which the Officer began serving the Trust. Each Officer serves an indefinite term, until his successor is elected. |
27 | November 30, 2015
table of
CONTENTS
www.alpsfunds.com
| | |
ALPS STOXX Europe 600 ETF | | |
| Performance Overview | | November 30, 2015 (Unaudited) |
Investment Objective
The Fund employs a “passive management” – or indexing – investment approach designed to seek investment results that correspond (before fees and expenses) generally to the performance of the STOXX® Europe 600 Index (the “Underlying Index”).
The Underlying Index, compiled by STOXX, is a fixed component benchmark index that consists of the 600 largest developed market stocks of the STOXX Europe Total Market Index, which is an aggregate of the STOXX Total Market country indices representing certain developed market countries within Europe. These countries include Austria, Belgium, Czech Republic, Denmark, Finland, France, Germany, Greece, Ireland, Italy, Luxembourg, Netherlands, Norway, Portugal, Spain, Sweden, Switzerland and the United Kingdom. Each country index aims to represent a broad market by covering 95% of the free-float† market capitalization of the applicable country.
Performance Overview
The ALPS STOXX Europe 600 ETF (the “Fund”) seeks investment results that correspond (before fees and expenses) generally to the performance of its underlying index, the STOXX® Europe 600 Index (ticker symbol SXXP) (the “Underlying Index”). The Underlying Index consists of the 600 largest developed market stocks in the STOXX Europe Total Market Index, which is an aggregate of the STOXX Total Market country indices representing certain developed market countries within Europe. These countries include Austria, Belgium, Czech Republic, Denmark, Finland, France, Germany, Greece, Ireland, Italy, Luxembourg, Netherlands, Norway, Portugal, Spain, Sweden, Switzerland and the United Kingdom
For the one year period ended November 30, 2015, the Fund generated a total return of -3.35%, slightly outperforming the Underlying Index, which returned -3.48% over the same period.
From a macro perspective, drivers influencing returns in Europe included the impact of speculation on a potential U.S. Fed rate hike, global concerns over slowing growth and weak manufacturing figures in China, and instability in oil prices and commodities markets. U.S. dollar strength was a large detractor for a large majority of countries. Leading indicators for industrial activity began to show improvement in most Eurozone economies, and returns were buoyed by accommodative ECB monetary policy.
Following were the top five and bottom five performers in the Underlying Index for the one year period ended, November 30, 2015.
| | | | |
| Top 5 Performers* | | Total Return % 1 Year | | |
Altice SA | | 96.25 | | |
Vestas Wind Systems | | 79.56 | | |
Rightmove PLC | | 79.01 | | |
Galenica AG- Reg | | 75.01 | | |
Genmab A/S | | 74.03 | | |
| | |
| Bottom 5 Performers* | | Total Return % 1 Year | | |
National Bank of Greece | | -96.42 | | |
Piraeus Bank S.A. | | -72.06 | | |
Glencore PLC | | -69.06 | | |
Anglo American PLC | | -68.30 | | |
Vallourec SA | | -67.83 | | |
*Bloomberg data as of 11/30/15
1 | November 30, 2015
| | |
ALPS STOXX Europe 600 ETF | | |
| Performance Overview | | November 30, 2015 (Unaudited) |
Fund Performance (as of November 30, 2015)
| | | | |
| | | 1 Year | | Since Inception^ |
ALPS STOXX Europe 600 ETF – NAV | | -3.35% | | 0.26% |
ALPS STOXX Europe 600 ETF – Market Price* | | -5.00% | | 0.14% |
STOXX® Europe 600 Net Index USD | | -3.48% | | 0.24% |
STOXX® Europe 600 Price Index USD | | -5.97% | | -2.28% |
Total Expense Ratio (per the current prospectus) 0.25%
Performance data quoted represents past performance. Past performance does not guarantee future results. Investment return and principal value of an investment will fluctuate so that an investor’s shares, when sold or redeemed, may be worth more or less than the original cost. Current performance data may be higher or lower than actual data quoted. For the most current month-end performance data please visit www.alpsfunds.com or call 1.855.299.4056.
NAV is an exchange-traded fund’s per-share value. The per-share dollar amount of the fund is derived by dividing the total value of all the securities in its portfolio, less any liabilities, by the number of fund shares outstanding. Market Price is the price at which a share can currently be traded in the market. Information detailing the number of days the Market Price of the Fund was greater than the Fund’s NAV and the number of days it was less than the Fund’s NAV can be obtained at www.alpsfunds.com.
| † | Free-float methodology market capitalization is calculated by taking the equity’s price and multiplying it by the number of shares readily available in the market. | |
| ^ | The Fund commenced investment operations on October 31, 2014. |
| * | Market Price is based on the midpoint of the bid/ask spread at 4 p.m. ET and does not represent the returns an investor would receive if shares were traded at other times. | |
STOXX® Europe 600 Index is derived from the STOXX Europe Total Market Index and is a subset of the STOXX Global 1800 Index. With a fixed number of 600 components, the Underlying Index represents large, mid and small capitalization companies across 18 countries of the European region: Austria, Belgium, Czech Republic, Denmark, Finland, France, Germany, Greece, Ireland, Italy, Luxembourg, the Netherlands, Norway, Portugal, Spain, Sweden, Switzerland and the United Kingdom.
One cannot invest directly in an index. Index performance does not reflect fund performance.
The Fund is subject to foreign investing risks including currency fluctuations and political uncertainty. Small-cap and mid-cap companies generally will have greater volatility in price than stocks of large companies. Investments concentrated in certain regions, economies, countries, markets, industries or sectors generally will be more volatile.
The Fund’s shares are not individually redeemable. Investors buy and sell shares of the Fund on a secondary market. Only market makers or “authorized participants” may trade directly with the Fund, typically in blocks of 50,000 shares.
The ALPS STOXX Europe 600 ETF is not suitable for all investors. Subject to investment risks, including possible loss of the principal amount invested.
ALPS Portfolio Solutions Distributor, Inc. is the distributor for the ALPS STOXX Europe 600 ETF.
ALPS Portfolio Solutions Distributor, Inc. is not affiliated with STOXX Limited, Zurich, Switzerland.
2 | November 30, 2015
| | |
ALPS STOXX Europe 600 ETF | | |
| Performance Overview | | November 30, 2015 (Unaudited) |
Top Ten Holdings* (as of November 30, 2015)
| | | | |
Nestle SA | | | 2.73 | % |
Novartis AG | | | 2.51 | % |
Roche Holding AG | | | 2.18 | % |
HSBC Holdings PLC | | | 1.80 | % |
TOTAL SA | | | 1.38 | % |
Bayer AG | | | 1.27 | % |
British American Tobacco PLC | | | 1.24 | % |
Sanofi | | | 1.23 | % |
BP PLC | | | 1.23 | % |
Novo Nordisk A/S, Class B | | | 1.21 | % |
Top Ten Holdings | | | 16.78 | % |
Holdings and sector allocations are subject to change.
Sector Allocation* (as of November 30, 2015)
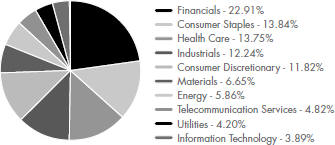
Growth of $10,000 (as of November 30, 2015)
Comparison of change in value of a $10,000 investment in the Fund and the Indexes
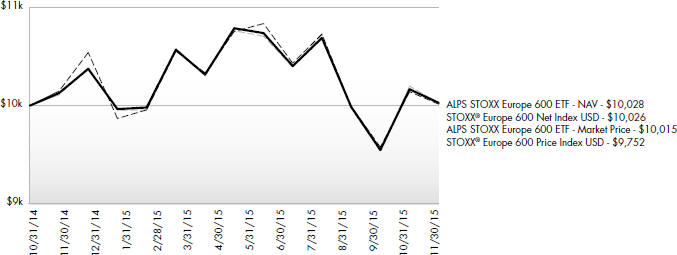
The chart above represents historical performance of a hypothetical investment of $10,000 in the Fund over the life of the Fund. Performance calculations are as of the end of each month. Past performance does not guarantee future results. This chart does not reflect the deduction of taxes that a shareholder would pay on Fund distributions or the redemption of Fund shares.
3 | November 30, 2015
| | |
ALPS STOXX Europe 600 ETF | | |
| Disclosure of Fund Expenses | | November 30, 2015 (Unaudited) |
Shareholder Expense Example: As a shareholder of the Fund, you incur two types of costs: (1) transaction costs which may include creation and redemption fees or brokerage charges, and (2) ongoing costs, including management fees and other Fund expenses. These examples are intended to help you understand your ongoing costs (in dollars) of investing in the Fund and to compare these costs with the ongoing costs of investing in other funds. It is based on an investment of $1,000 invested at the beginning of the (six month) period and held through November 30, 2015.
Actual Return: The first line of the table provides information about actual account values and actual expenses. You may use the information in this table, together with the amount you invested, to estimate the expenses that you incurred over the period. Simply divide your account value by $1,000 (for example, an $8,600 account value divided by $1,000 = 8.6), then multiply the result by the number in the first line under the heading entitled “Expenses Paid During the Period” to estimate the expenses attributable to your investment during this period.
Hypothetical 5% Return: The second line of the table provides information about hypothetical account values and hypothetical expenses based on the Fund’s actual expense ratio and an assumed rate of return of 5% per year before expenses, which is not the Fund’s actual return. The hypothetical account values and expenses may not be used to estimate the actual ending account balance or expenses you paid for the period. You may use this information to compare ongoing costs of investing in the Fund and other funds. To do so, compare this 5% hypothetical example with the 5% hypothetical examples that appear in the shareholder reports of the other funds.
The expenses shown in the table are meant to highlight ongoing Fund costs only and do not reflect any transaction costs, such as creation and redemption fees, or brokerage charges. Therefore, the second line is useful in comparing ongoing costs only, and will not help you determine the relative total costs of owning different funds. In addition, if these costs were included, your costs would have been higher.
| | | | | | | | | | | | | | | | |
| | | Beginning Account
Value 6/1/15 | | | Ending Account
Value 11/30/15 | | | Expense Ratio(a) | | | Expenses Paid During Period 6/1/15 - 11/30/15(b) | |
| |
ALPS STOXX Europe 600 ETF | | | | | | | | | | | | | | | | |
Actual | | | $1,000.00 | | | | $933.60 | | | | 0.25% | | | | $1.21 | |
Hypothetical (5% return before expenses) | | | $1,000.00 | | | | $1,023.82 | | | | 0.25% | | | | $1.27 | |
| (a) | Annualized, based on the Fund’s most recent fiscal half year expenses. |
| (b) | Expenses are equal to the Fund’s annualized expense ratio multiplied by the average account value over the period, multiplied by the number of days in the most recent fiscal half year (183), divided by 365. | |
4 | November 30, 2015
| | |
ALPS STOXX Europe 600 ETF | | |
Report of Independent Registered Public Accounting Firm |
To the Board of Trustees and Shareholders of ALPS ETF Trust:
We have audited the accompanying statement of assets and liabilities, including the schedule of investments, of ALPS STOXX Europe 600 ETF, one of the portfolios constituting the ALPS ETF Trust (the “Trust”), as of November 30, 2015, and the related statement of operations for the year then ended, and the statements of changes in net assets and the financial highlight for the year then ended and for the period October 31, 2014 (commencement of operations) to November 30, 2014. These financial statements and financial highlights are the responsibility of the Trust’s management. Our responsibility is to express an opinion on these financial statements and financial highlights based on our audits.
We conducted our audits in accordance with the standards of the Public Company Accounting Oversight Board (United States). Those standards require that we plan and perform the audit to obtain reasonable assurance about whether the financial statements and financial highlights are free of material misstatement. The Trust is not required to have, nor were we engaged to perform, an audit of its internal control over financial reporting. Our audits included consideration of internal control over financial reporting as a basis for designing audit procedures that are appropriate in the circumstances, but not for the purpose of expressing an opinion on the effectiveness of the Trust’s internal control over financial reporting. Accordingly, we express no such opinion. An audit also includes examining, on a test basis, evidence supporting the amounts and disclosures in the financial statements, assessing the accounting principles used and significant estimates made by management, as well as evaluating the overall financial statement presentation. Our procedures included confirmation of securities owned as of November 30, 2015, by correspondence with the custodian. We believe that our audits provide a reasonable basis for our opinion.
In our opinion, the financial statements and financial highlights referred to above present fairly, in all material respects, the financial position of ALPS STOXX Europe 600 ETF of the ALPS ETF Trust as of November 30, 2015, the results of its operations for the year then ended, and the changes in its net assets and the financial highlights for the year then ended and for the period October 31, 2014 (commencement of operations) to November 30, 2014, in conformity with accounting principles generally accepted in the United States of America.
DELOITTE & TOUCHE LLP
Denver, Colorado
January 28, 2016
5 | November 30, 2015
| | |
ALPS STOXX Europe 600 ETF | | |
| Schedule of Investments | | November 30, 2015 |
| | | | | | | | |
| Security Description | | Shares | | | Value | |
| |
COMMON STOCKS (98.72%) | | | | | |
Australia (0.31%) | | | | | | | | |
BHP Billiton PLC | | | 1,509 | | | $ | 18,111 | |
| | | | | | | | |
Total Australia | | | | | | | 18,111 | |
| | | | | | | | |
| | |
Austria (0.32%) | | | | | | | | |
ams AG | | | 45 | | | | 1,715 | |
ANDRITZ AG | | | 51 | | | | 2,676 | |
Erste Group Bank AG(a) | | | 219 | | | | 6,719 | |
IMMOFINANZ AG(a) | | | 682 | | | | 1,688 | |
OMV AG | | | 104 | | | | 2,968 | |
Raiffeisen Bank International AG(a) | | | 85 | | | | 1,330 | |
voestalpine AG | | | 80 | | | | 2,603 | |
| | | | | | | | |
Total Austria | | | | | | | 19,699 | |
| | | | | | | | |
| | |
Belgium (2.08%) | | | | | | | | |
Ackermans & van Haaren NV | | | 15 | | | | 2,083 | |
Ageas | | | 148 | | | | 6,475 | |
Anheuser-Busch InBev SA | | | 534 | | | | 68,804 | |
bpost SA | | | 70 | | | | 1,701 | |
Cofinimmo SA, REIT | | | 15 | | | | 1,567 | |
Colruyt SA | | | 45 | | | | 2,230 | |
Delhaize Group | | | 75 | | | | 7,514 | |
Groupe Bruxelles Lambert SA | | | 60 | | | | 4,930 | |
KBC Groep NV | | | 181 | | | | 10,805 | |
Proximus SADP | | | 100 | | | | 3,303 | |
Solvay SA | | | 43 | | | | 4,954 | |
Telenet Group Holding NV(a) | | | 35 | | | | 1,912 | |
UCB SA | | | 94 | | | | 8,394 | |
Umicore SA | | | 68 | | | | 2,812 | |
| | | | | | | | |
Total Belgium | | | | | | | 127,484 | |
| | | | | | | | |
| | |
Bermuda (0.08%) | | | | | | | | |
Hiscox, Ltd. | | | 210 | | | | 3,223 | |
Seadrill, Ltd.(a) | | | 257 | | | | 1,523 | |
| | | | | | | | |
Total Bermuda | | | | | | | 4,746 | |
| | | | | | | | |
| | |
Czech Republic (0.07%) | | | | | | | | |
CEZ a.s. | | | 119 | | | | 2,163 | |
Komercni banka a.s. | | | 10 | | | | 2,032 | |
| | | | | | | | |
Total Czech Republic | | | | | | | 4,195 | |
| | | | | | | | |
| | |
Denmark (2.74%) | | | | | | | | |
AP Moller-Maersk A/S, Class B(a) | | | 5 | | | | 7,633 | |
Carlsberg A/S, Class B | | | 75 | | | | 6,378 | |
Chr. Hansen Holding A/S | | | 70 | | | | 4,393 | |
Coloplast A/S, B Shares | | | 85 | | | | 6,898 | |
Danske Bank A/S(a) | | | 494 | | | | 13,258 | |
DSV A/S | | | 129 | | | | 5,017 | |
FLSmidth & Co. A/S | | | 35 | | | | 1,272 | |
Genmab A/S(a) | | | 32 | | | | 4,124 | |
GN Store Nord A/S | | | 119 | | | | 2,182 | |
ISS A/S | | | 69 | | | | 2,407 | |
Jyske Bank A/S(a) | | | 50 | | | | 2,274 | |
Novo Nordisk A/S, Class B | | | 1,337 | | | | 73,657 | |
Novozymes A/S, B Shares | | | 155 | | | | 7,452 | |
Pandora A/S(a) | | | 83 | | | | 9,839 | |
Sydbank A/S | | | 55 | | | | 1,805 | |
| | | | | | | | |
| Security Description | | Shares | | | Value | |
| |
Denmark (continued) | | | | | | | | |
TDC A/S | | | 584 | | | $ | 3,068 | |
Topdanmark A/S(a) | | | 59 | | | | 1,640 | |
Tryg A/S | | | 97 | | | | 1,889 | |
Vestas Wind Systems A/S | | | 160 | | | | 10,439 | |
William Demant Holding A/S(a) | | | 20 | | | | 1,920 | |
| | | | | | | | |
Total Denmark | | | | | | | 167,545 | |
| | | | | | | | |
| | |
Finland (1.47%) | | | | | | | | |
Amer Sports OYJ | | | 85 | | | | 2,476 | |
Elisa OYJ | | | 110 | | | | 4,098 | |
Fortum OYJ | | | 315 | | | | 4,600 | |
Huhtamaki OYJ | | | 66 | | | | 2,392 | |
Kesko OYJ, B Shares | | | 50 | | | | 1,661 | |
Kone OYJ, B Shares | | | 275 | | | | 11,735 | |
Metso OYJ | | | 80 | | | | 1,986 | |
Neste OYJ | | | 94 | | | | 2,709 | |
Nokia OYJ | | | 2,606 | | | | 18,819 | |
Nokian Renkaat OYJ | | | 95 | | | | 3,729 | |
Orion OYJ, Class B | | | 70 | | | | 2,338 | |
Sampo OYJ, A Shares | | | 354 | | | | 17,549 | |
Stora Enso OYJ, R Shares | | | 410 | | | | 4,050 | |
UPM-Kymmene OYJ | | | 374 | | | | 7,140 | |
Wartsila OYJ Abp | | | 110 | | | | 4,944 | |
| | | | | | | | |
Total Finland | | | | | | | 90,226 | |
| | | | | | | | |
| | |
France (14.99%) | | | | | | | | |
Accor SA | | | 150 | | | | 6,330 | |
Aeroports de Paris | | | 25 | | | | 2,832 | |
Air France-KLM(a) | | | 180 | | | | 1,200 | |
Air Liquide SA | | | 239 | | | | 29,166 | |
Airbus Group SE | | | 414 | | | | 29,936 | |
Alcatel-Lucent(a) | | | 2,026 | | | | 7,980 | |
Alstom SA(a) | | | 159 | | | | 4,941 | |
Arkema SA | | | 46 | | | | 3,314 | |
Atos | | | 55 | | | | 4,503 | |
AXA SA | | | 1,490 | | | | 40,317 | |
BNP Paribas SA | | | 789 | | | | 46,774 | |
Bollore SA | | | 500 | | | | 2,302 | |
Bouygues SA | | | 190 | | | | 7,153 | |
Bureau Veritas SA | | | 155 | | | | 3,193 | |
Cap Gemini SA | | | 115 | | | | 10,610 | |
Carrefour SA | | | 389 | | | | 11,993 | |
Casino Guichard Perrachon SA | | | 40 | | | | 2,287 | |
Christian Dior SE | | | 40 | | | | 7,320 | |
Cie de Saint-Gobain | | | 364 | | | | 16,087 | |
Cie Generale des Etablissements Michelin | | | 135 | | | | 13,536 | |
CNP Assurances | | | 109 | | | | 1,518 | |
Credit Agricole SA | | | 808 | | | | 9,749 | |
Danone SA | | | 430 | | | | 30,135 | |
Dassault Aviation SA | | | 1 | | | | 1,114 | |
Dassault Systemes | | | 95 | | | | 7,561 | |
Edenred | | | 145 | | | | 3,005 | |
Eiffage SA | | | 55 | | | | 3,460 | |
Electricite de France SA | | | 209 | | | | 3,115 | |
Engie SA | | | 1,156 | | | | 20,140 | |
6 | November 30, 2015
| | |
ALPS STOXX Europe 600 ETF | | |
| Schedule of Investments | | November 30, 2015 |
| | | | | | | | |
| Security Description | | Shares | | | Value | |
| |
France (continued) | | | | | | | | |
Essilor International SA | | | 155 | | | $ | 20,233 | |
Eurazeo SA | | | 31 | | | | 2,084 | |
Eutelsat Communications SA | | | 106 | | | | 3,164 | |
Faurecia | | | 34 | | | | 1,276 | |
Fonciere Des Regions, REIT | | | 20 | | | | 1,774 | |
Gecina SA, REIT | | | 25 | | | | 3,019 | |
Groupe Eurotunnel SA | | | 334 | | | | 4,268 | |
Hermes International | | | 16 | | | | 5,633 | |
ICADE, REIT | | | 25 | | | | 1,764 | |
Iliad SA | | | 17 | | | | 3,792 | |
Imerys SA | | | 25 | | | | 1,694 | |
Ingenico Group SA | | | 36 | | | | 4,532 | |
JCDecaux SA | | | 50 | | | | 1,854 | |
Kering | | | 50 | | | | 8,640 | |
Klepierre, REIT | | | 114 | | | | 5,174 | |
Lagardere SCA | | | 75 | | | | 2,213 | |
Legrand SA | | | 190 | | | | 11,177 | |
L’Oreal SA | | | 175 | | | | 30,989 | |
LVMH Moet Hennessy Louis Vuitton SE | | | 195 | | | | 32,707 | |
Natixis SA | | | 633 | | | | 3,839 | |
Numericable-SFR SAS(a) | | | 74 | | | | 3,168 | |
Orange SA | | | 1,433 | | | | 24,770 | |
Orpea | | | 26 | | | | 2,047 | |
Pernod Ricard SA | | | 150 | | | | 17,069 | |
Peugeot SA(a) | | | 325 | | | | 5,807 | |
Publicis Groupe SA | | | 141 | | | | 8,897 | |
Remy Cointreau SA | | | 15 | | | | 1,064 | |
Renault SA | | | 150 | | | | 15,137 | |
Rexel SA | | | 198 | | | | 2,712 | |
Rubis SCA | | | 25 | | | | 1,988 | |
Safran SA | | | 234 | | | | 17,277 | |
Sanofi | | | 844 | | | | 75,244 | |
Schneider Electric SE | | | 420 | | | | 26,625 | |
SCOR SE | | | 129 | | | | 5,059 | |
SEB SA | | | 20 | | | | 2,048 | |
Societe BIC SA | | | 20 | | | | 3,290 | |
Societe Generale SA | | | 564 | | | | 26,922 | |
Societe Television Francaise 1 | | | 85 | | | | 1,036 | |
Sodexo SA | | | 70 | | | | 6,920 | |
Suez Environnement Co. | | | 238 | | | | 4,512 | |
Technicolor SA | | | 210 | | | | 1,575 | |
Technip SA | | | 79 | | | | 4,141 | |
Teleperformance | | | 40 | | | | 3,325 | |
Thales SA | | | 70 | | | | 5,212 | |
TOTAL SA | | | 1,692 | | | | 84,021 | |
UBISOFT Entertainment(a) | | | 70 | | | | 1,960 | |
Unibail-Rodamco SE, REIT | | | 70 | | | | 17,979 | |
Valeo SA | | | 55 | | | | 8,516 | |
Vallourec SA | | | 85 | | | | 874 | |
Veolia Environnement SA | | | 324 | | | | 7,767 | |
Vinci SA | | | 372 | | | | 24,195 | |
Vivendi SA | | | 823 | | | | 17,330 | |
Wendel SA | | | 24 | | | | 2,860 | |
| | | | | | | | |
| Security Description | | Shares | | | Value | |
| |
France (continued) | | | | | | | | |
Zodiac Aerospace | | | 163 | | | $ | 4,414 | |
| | | | | | | | |
Total France | | | | | | | 917,158 | |
| | | | | | | | |
| | |
Germany (12.74%) | | | | | | | | |
Aareal Bank AG | | | 39 | | | | 1,314 | |
adidas AG | | | 150 | | | | 14,515 | |
Allianz SE | | | 319 | | | | 56,505 | |
Axel Springer SE | | | 30 | | | | 1,675 | |
BASF SE | | | 640 | | | | 52,973 | |
Bayer AG | | | 579 | | | | 77,263 | |
Bayerische Motoren Werke AG | | | 230 | | | | 25,103 | |
Beiersdorf AG | | | 70 | | | | 6,519 | |
Bilfinger SE | | | 35 | | | | 1,656 | |
Brenntag AG | | | 110 | | | | 6,010 | |
Commerzbank AG(a) | | | 749 | | | | 8,246 | |
Continental AG | | | 77 | | | | 18,606 | |
Daimler AG | | | 708 | | | | 63,381 | |
Deutsche Bank AG | | | 924 | | | | 23,728 | |
Deutsche Boerse AG | | | 140 | | | | 12,009 | |
Deutsche EuroShop AG | | | 35 | | | | 1,485 | |
Deutsche Lufthansa AG(a) | | | 165 | | | | 2,365 | |
Deutsche Post AG | | | 679 | | | | 19,847 | |
Deutsche Telekom AG | | | 2,211 | | | | 40,775 | |
Deutsche Wohnen AG | | | 195 | | | | 5,366 | |
Dialog Semiconductor PLC(a) | | | 51 | | | | 1,904 | |
Duerr AG | | | 14 | | | | 1,210 | |
E.ON SE | | | 1,432 | | | | 13,611 | |
Evonik Industries AG | | | 90 | | | | 3,075 | |
Fraport AG Frankfurt Airport Services Worldwide | | | 25 | | | | 1,529 | |
Freenet AG | | | 94 | | | | 3,164 | |
Fresenius Medical Care AG & Co. KGaA | | | 155 | | | | 12,806 | |
Fresenius SE & Co. KGaA | | | 285 | | | | 20,925 | |
GEA Group AG | | | 129 | | | | 5,354 | |
Gerresheimer AG | | | 24 | | | | 1,874 | |
Hannover Rueck SE | | | 45 | | | | 5,266 | |
HeidelbergCement AG | | | 100 | | | | 7,962 | |
HUGO BOSS AG | | | 48 | | | | 4,158 | |
Infineon Technologies AG | | | 813 | | | | 12,051 | |
K+S AG | | | 131 | | | | 3,729 | |
Kabel Deutschland Holding AG | | | 15 | | | | 1,835 | |
KION Group AG | | | 50 | | | | 2,475 | |
LANXESS AG | | | 65 | | | | 3,310 | |
LEG Immobilien AG | | | 36 | | | | 2,853 | |
Leoni AG | | | 25 | | | | 962 | |
Linde AG | | | 125 | | | | 21,824 | |
MAN SE | | | 25 | | | | 2,481 | |
Merck KGaA | | | 95 | | | | 9,730 | |
METRO AG | | | 105 | | | | 3,501 | |
MorphoSys AG(a) | | | 20 | | | | 1,184 | |
MTU Aero Engines AG | | | 39 | | | | 3,873 | |
Muenchener Rueckversicherungs-Gesellschaft AG in Muenchen | | | 100 | | | | 20,154 | |
OSRAM Licht AG | | | 64 | | | | 2,702 | |
ProSiebenSat.1 Media AG | | | 159 | | | | 8,349 | |
7 | November 30, 2015
| | |
ALPS STOXX Europe 600 ETF | | |
| Schedule of Investments | | November 30, 2015 |
| | | | | | | | |
| Security Description | | Shares | | | Value | |
| |
Germany (continued) | | | | | | | | |
Rheinmetall AG | | | 30 | | | $ | 1,904 | |
RWE AG | | | 349 | | | | 4,015 | |
SAP SE | | | 684 | | | | 53,905 | |
Siemens AG | | | 542 | | | | 56,200 | |
STADA Arzneimittel AG | | | 45 | | | | 1,718 | |
Symrise AG | | | 90 | | | | 6,091 | |
Telefonica Deutschland Holding AG | | | 374 | | | | 2,103 | |
ThyssenKrupp AG | | | 314 | | | | 6,683 | |
TUI AG | | | 342 | | | | 5,676 | |
United Internet AG | | | 82 | | | | 4,371 | |
Vonovia SE | | | 323 | | | | 10,011 | |
Wirecard AG | | | 85 | | | | 4,164 | |
| | | | | | | | |
Total Germany | | | | | | | 780,033 | |
| | | | | | | | |
| | |
Greece (0.05%) | | | | | | | | |
Hellenic Telecommunications Organization SA | | | 175 | | | | 1,694 | |
National Bank of Greece SA(a) | | | 1,088 | | | | 93 | |
OPAP SA | | | 155 | | | | 1,048 | |
| | | | | | | | |
Total Greece | | | | | | | 2,835 | |
| | | | | | | | |
| | |
Ireland (1.88%) | | | | | | | | |
Bank of Ireland(a) | | | 19,284 | | | | 7,192 | |
Beazley PLC | | | 425 | | | | 2,519 | |
CRH PLC | | | 585 | | | | 17,214 | |
DCC PLC | | | 65 | | | | 5,844 | |
Experian PLC | | | 744 | | | | 13,794 | |
Glanbia PLC | | | 125 | | | | 2,294 | |
Grafton Group PLC | | | 171 | | | | 1,758 | |
Kerry Group PLC, Class A | | | 110 | | | | 8,878 | |
Kingspan Group PLC | | | 101 | | | | 2,647 | |
Paddy Power PLC | | | 31 | | | | 3,932 | |
Ryanair Holdings PLC, Sponsored ADR | | | 185 | | | | 14,227 | |
Shire PLC | | | 430 | | | | 30,089 | |
Smurfit Kappa Group PLC | | | 165 | | | | 4,508 | |
| | | | | | | | |
Total Ireland | | | | | | | 114,896 | |
| | | | | | | | |
| | |
Italy (3.55%) | | | | | | | | |
Assicurazioni Generali SpA | | | 963 | | | | 18,314 | |
Atlantia SpA | | | 294 | | | | 7,766 | |
Azimut Holding SpA | | | 75 | | | | 1,915 | |
Banca Monte dei Paschi di Siena SpA(a) | | | 1,883 | | | | 2,956 | |
Banca Popolare dell’Emilia Romagna SC | | | 345 | | | | 2,652 | |
Banca Popolare di Milano Scarl | | | 2,984 | | | | 2,891 | |
Banca Popolare di Sondrio Scarl | | | 325 | | | | 1,480 | |
Banco Popolare SC(a) | | | 260 | | | | 3,750 | |
Davide Campari-Milano SpA | | | 186 | | | | 1,634 | |
Enel Green Power SpA | | | 1,108 | | | | 2,340 | |
Enel SpA | | | 4,996 | | | | 22,033 | |
Eni SpA | | | 1,882 | | | | 30,662 | |
EXOR SpA | | | 70 | | | | 3,137 | |
Finmeccanica SpA(a) | | | 290 | | | | 4,201 | |
Intesa Sanpaolo SpA | | | 10,133 | | | | 34,773 | |
Luxottica Group SpA | | | 135 | | | | 9,029 | |
| | | | | | | | |
| Security Description | | Shares | | | Value | |
| |
Italy (continued) | | | | | | | | |
Mediaset SpA | | | 512 | | | $ | 2,251 | |
Mediobanca SpA | | | 429 | | | | 4,111 | |
Prysmian SpA | | | 145 | | | | 3,171 | |
Recordati SpA | | | 70 | | | | 1,740 | |
Saipem SpA(a) | | | 180 | | | | 1,556 | |
Snam SpA | | | 1,514 | | | | 7,694 | |
Telecom Italia SpA(a) | | | 7,502 | | | | 9,702 | |
Terna Rete Elettrica Nazionale SpA | | | 1,014 | | | | 4,992 | |
UniCredit SpA | | | 4,182 | | | | 24,545 | |
Unione di Banche Italiane SpA | | | 649 | | | | 4,416 | |
Unipol Gruppo Finanziario SpA | | | 400 | | | | 1,994 | |
UnipolSai SpA | | | 599 | | | | 1,545 | |
| | | | | | | | |
Total Italy | | | | | | | 217,250 | |
| | | | | | | | |
| | |
Jersey (0.10%) | | | | | | | | |
Phoenix Group Holdings | | | 160 | | | | 2,205 | |
Randgold Resources, Ltd. | | | 65 | | | | 3,957 | |
| | | | | | | | |
Total Jersey | | | | | | | 6,162 | |
| | | | | | | | |
| | |
Jordan (0.05%) | | | | | | | | |
Hikma Pharmaceuticals PLC | | | 100 | | | | 3,261 | |
| | | | | | | | |
Total Jordan | | | | | | | 3,261 | |
| | | | | | | | |
| | |
Luxembourg (0.40%) | | | | | | | | |
Altice NV, Class A(a) | | | 223 | | | | 3,426 | |
ArcelorMittal | | | 728 | | | | 3,570 | |
B&M European Value Retail SA | | | 450 | | | | 2,147 | |
Eurofins Scientific SE | | | 5 | | | | 1,882 | |
RTL Group SA | | | 30 | | | | 2,624 | |
SES SA | | | 230 | | | | 6,384 | |
Tenaris SA | | | 335 | | | | 4,400 | |
| | | | | | | | |
Total Luxembourg | | | | | | | 24,433 | |
| | | | | | | | |
| | |
Mexico (0.02%) | | | | | | | | |
Fresnillo PLC | | | 134 | | | | 1,443 | |
| | | | | | | | |
Total Mexico | | | | | | | 1,443 | |
| | | | | | | | |
| | |
Netherlands (4.21%) | | | | | | | | |
Aalberts Industries NV | | | 70 | | | | 2,311 | |
Aegon NV | | | 1,333 | | | | 8,163 | |
Akzo Nobel NV | | | 175 | | | | 12,447 | |
ASM International NV | | | 40 | | | | 1,599 | |
ASML Holding NV | | | 260 | | | | 24,028 | |
Boskalis Westminster | | | 60 | | | | 2,670 | |
Delta Lloyd NV | | | 141 | | | | 1,015 | |
Gemalto NV | | | 60 | | | | 3,786 | |
Heineken Holding NV | | | 70 | | | | 5,507 | |
Heineken NV | | | 155 | | | | 13,783 | |
ING Groep NV, CVA | | | 2,759 | | | | 37,881 | |
Koninklijke Ahold NV | | | 512 | | | | 11,138 | |
Koninklijke DSM NV | | | 130 | | | | 6,614 | |
Koninklijke KPN NV | | | 2,332 | | | | 8,872 | |
Koninklijke Philips NV | | | 666 | | | | 18,211 | |
Koninklijke Vopak NV | | | 46 | | | | 1,996 | |
NN Group NV | | | 113 | | | | 3,860 | |
OCI NV(a) | | | 65 | | | | 1,641 | |
PostNL NV(a) | | | 319 | | | | 1,066 | |
8 | November 30, 2015
| | |
ALPS STOXX Europe 600 ETF | | |
| Schedule of Investments | | November 30, 2015 |
| | | | | | | | |
| Security Description | | Shares | | | Value | |
| |
Netherlands (continued) | | | | | | | | |
QIAGEN NV(a) | | | 174 | | | $ | 4,621 | |
Randstad Holding NV | | | 89 | | | | 5,566 | |
Royal Dutch Shell PLC, A Shares | | | 2,714 | | | | 67,672 | |
SBM Offshore NV(a) | | | 134 | | | | 1,883 | |
TNT Express NV | | | 339 | | | | 2,762 | |
Wereldhave NV, REIT | | | 17 | | | | 951 | |
Wolters Kluwer NV | | | 219 | | | | 7,567 | |
| | | | | | | | |
Total Netherlands | | | | | | | 257,610 | |
| | | | | | | | |
| | |
Norway (0.84%) | | | | | | | | |
DNB ASA | | | 659 | | | | 8,675 | |
Gjensidige Forsikring ASA | | | 135 | | | | 2,179 | |
Marine Harvest ASA | | | 219 | | | | 2,961 | |
Norsk Hydro ASA | | | 978 | | | | 3,781 | |
Orkla ASA | | | 554 | | | | 4,501 | |
Schibsted ASA, Class A | | | 59 | | | | 2,142 | |
Statoil ASA | | | 758 | | | | 11,723 | |
Telenor ASA | | | 493 | | | | 8,594 | |
TGS Nopec Geophysical Co. ASA | | | 75 | | | | 1,442 | |
Yara International ASA | | | 113 | | | | 5,231 | |
| | | | | | | | |
Total Norway | | | | | | | 51,229 | |
| | | | | | | | |
| | |
Portugal (0.22%) | | | | | | | | |
Banco Comercial Portugues SA(a) | | | 30,997 | | | | 1,657 | |
EDP-Energias de Portugal SA | | | 1,881 | | | | 6,270 | |
Galp Energia SGPS SA | | | 279 | | | | 2,968 | |
Jeronimo Martins SGPS SA | | | 175 | | | | 2,429 | |
| | | | | | | | |
Total Portugal | | | | | | | 13,324 | |
| | | | | | | | |
| | |
South Africa (0.15%) | | | | | | | | |
Investec PLC | | | 390 | | | | 3,319 | |
Mondi PLC | | | 265 | | | | 6,162 | |
| | | | | | | | |
Total South Africa | | | | | | | 9,481 | |
| | | | | | | | |
| | |
Spain (4.86%) | | | | | | | | |
Abertis Infraestructuras SA | | | 329 | | | | 5,094 | |
ACS Actividades de Construccion y Servicios SA | | | 140 | | | | 4,566 | |
Aena SA(a)(b)(c) | | | 50 | | | | 5,671 | |
Amadeus IT Holding SA, A Shares | | | 308 | | | | 12,354 | |
Banco Bilbao Vizcaya Argentaria SA | | | 4,466 | | | | 37,069 | |
Banco de Sabadell SA | | | 3,509 | | | | 6,477 | |
Banco Popular Espanol SA | | | 1,371 | | | | 4,831 | |
Banco Santander SA | | | 10,079 | | | | 55,034 | |
Bankia SA | | | 3,178 | | | | 3,982 | |
Bankinter SA | | | 464 | | | | 3,359 | |
Bolsas y Mercados Espanoles
SHMSF SA | | | 55 | | | | 1,927 | |
CaixaBank SA | | | 1,681 | | | | 6,158 | |
Cellnex Telecom SAU(b)(c) | | | 100 | | | | 1,817 | |
Distribuidora Internacional de Alimentacion SA | | | 429 | | | | 2,712 | |
Enagas SA | | | 155 | | | | 4,620 | |
Endesa SA | | | 193 | | | | 3,993 | |
Ferrovial SA | | | 314 | | | | 7,438 | |
Gamesa Corp. Tecnologica SA | | | 148 | | | | 2,591 | |
Gas Natural SDG SA | | | 255 | | | | 5,516 | |
| | | | | | | | |
| Security Description | | Shares | | | Value | |
| |
Spain (continued) | | | | | | | | |
Grifols SA | | | 109 | | | $ | 5,173 | |
Iberdrola SA | | | 3,934 | | | | 27,561 | |
Industria de Diseno Textil SA | | | 748 | | | | 26,918 | |
Mapfre SA | | | 714 | | | | 1,959 | |
Mediaset Espana Comunicacion SA | | | 128 | | | | 1,470 | |
Merlin Properties Socimi SA, REIT | | | 220 | | | | 2,740 | |
Red Electrica Corp. SA | | | 80 | | | | 6,863 | |
Repsol SA | | | 712 | | | | 9,287 | |
Telefonica SA | | | 3,021 | | | | 37,265 | |
Viscofan SA | | | 30 | | | | 1,833 | |
Zardoya Otis SA | | | 120 | | | | 1,452 | |
| | | | | | | | |
Total Spain | | | | | | | 297,730 | |
| | | | | | | | |
| | |
Sweden (4.45%) | | | | | | | | |
Alfa Laval AB | | | 224 | | | | 4,143 | |
Assa Abloy AB, B Shares | | | 717 | | | | 15,250 | |
Atlas Copco AB, A Redemption Shares | | | 464 | | | | 12,438 | |
BillerudKorsnas AB | | | 129 | | | | 2,466 | |
Boliden AB | | | 185 | | | | 3,400 | |
Castellum AB | | | 125 | | | | 1,758 | |
Electrolux AB, Series B | | | 170 | | | | 4,990 | |
Elekta AB, B Shares | | | 265 | | | | 2,203 | |
Getinge AB, B Shares | | | 140 | | | | 3,544 | |
Hennes & Mauritz AB, B Shares | | | 669 | | | | 24,814 | |
Hexagon AB, B Shares | | | 175 | | | | 6,350 | |
Hexpol AB | | | 200 | | | | 2,130 | |
Husqvarna AB, B Shares | | | 290 | | | | 1,890 | |
ICA Gruppen AB | | | 55 | | | | 1,937 | |
Industrivarden AB, A Shares | | | 140 | | | | 2,693 | |
Intrum Justitia AB | | | 55 | | | | 1,880 | |
Investment AB Kinnevik, B Shares | | | 170 | | | | 5,230 | |
Investor AB, B Shares | | | 329 | | | | 12,539 | |
JM AB | | | 55 | | | | 1,605 | |
Lundin Petroleum AB(a) | | | 166 | | | | 2,655 | |
Meda AB, A Shares | | | 173 | | | | 2,083 | |
NCC AB, B Shares | | | 60 | | | | 1,853 | |
Nordea Bank AB | | | 2,286 | | | | 25,332 | |
Sandvik AB | | | 799 | | | | 8,277 | |
Securitas AB, B Shares | | | 230 | | | | 3,510 | |
Skandinaviska Enskilda Banken AB,
A Shares | | | 1,133 | | | | 12,049 | |
Skanska AB, B Shares | | | 279 | | | | 5,553 | |
SKF AB, B Shares | | | 274 | | | | 4,778 | |
Svenska Cellulosa AB SCA, Class B | | | 419 | | | | 12,087 | |
Svenska Handelsbanken AB, A Shares | | | 1,047 | | | | 14,093 | |
Swedbank AB, A Shares | | | 663 | | | | 14,686 | |
Swedish Match AB | | | 145 | | | | 5,002 | |
Swedish Orphan Biovitrum AB(a) | | | 100 | | | | 1,581 | |
Tele2 AB, B Shares | | | 224 | | | | 2,281 | |
Telefonaktiebolaget LM Ericsson, B Shares | | | 2,181 | | | | 21,243 | |
TeliaSonera AB | | | 1,856 | | | | 9,110 | |
Trelleborg AB, B Shares | | | 175 | | | | 3,427 | |
9 | November 30, 2015
| | |
ALPS STOXX Europe 600 ETF | | |
| Schedule of Investments | | November 30, 2015 |
| | | | | | | | |
| Security Description | | Shares | | | Value | |
| |
Sweden (continued) | | | | | | | | |
Volvo AB, B Shares | | | 1,094 | | | $ | 11,314 | |
| | | | | | | | |
Total Sweden | | | | | | | 272,174 | |
| | | | | | | | |
| | |
Switzerland (13.93%) | | | | | | | | |
ABB, Ltd. | | | 1,657 | | | | 31,422 | |
Actelion, Ltd. | | | 74 | | | | 10,393 | |
Adecco SA | | | 120 | | | | 8,211 | |
Aryzta AG | | | 65 | | | | 3,053 | |
Baloise Holding AG | | | 35 | | | | 4,252 | |
Barry Callebaut AG | | | 1 | | | | 1,040 | |
Cie Financiere Richemont SA | | | 365 | | | | 27,317 | |
Clariant AG | | | 209 | | | | 3,854 | |
Coca-Cola HBC AG | | | 144 | | | | 3,494 | |
Credit Suisse Group AG | | | 968 | | | | 20,812 | |
DKSH Holding AG | | | 25 | | | | 1,549 | |
dorma+kaba Holding AG | | | 3 | | | | 1,927 | |
Dufry AG(a) | | | 25 | | | | 2,991 | |
EMS-Chemie Holding AG(a) | | | 5 | | | | 2,039 | |
Flughafen Zuerich AG | | | 3 | | | | 2,149 | |
Galenica AG | | | 2 | | | | 2,924 | |
GAM Holding AG(a) | | | 120 | | | | 2,082 | |
Geberit AG | | | 25 | | | | 8,361 | |
Georg Fischer AG | | | 3 | | | | 1,955 | |
Givaudan SA | | | 5 | | | | 9,025 | |
Glencore PLC | | | 7,836 | | | | 11,413 | |
Helvetia Holding AG | | | 5 | | | | 2,661 | |
Julius Baer Group, Ltd. | | | 160 | | | | 7,657 | |
Kuehne + Nagel International AG | | | 40 | | | | 5,408 | |
LafargeHolcim, Ltd. | | | 307 | | | | 16,411 | |
Logitech International SA(a) | | | 110 | | | | 1,652 | |
Lonza Group AG | | | 40 | | | | 6,322 | |
Nestle SA | | | 2,246 | | | | 166,674 | |
Novartis AG | | | 1,791 | | | | 153,101 | |
OC Oerlikon Corp. AG | | | 140 | | | | 1,347 | |
Pargesa Holding SA | | | 20 | | | | 1,257 | |
Partners Group Holding AG | | | 14 | | | | 5,055 | |
PSP Swiss Property AG | | | 30 | | | | 2,489 | |
Roche Holding AG | | | 496 | | | | 132,816 | |
Schindler Holding AG | | | 30 | | | | 4,937 | |
SGS SA | | | 4 | | | | 7,651 | |
Sika AG(a) | | | 2 | | | | 6,775 | |
Sonova Holding AG | | | 40 | | | | 5,046 | |
STMicroelectronics NV | | | 474 | | | | 3,461 | |
Straumann Holding AG | | | 7 | | | | 2,072 | |
Sulzer AG | | | 15 | | | | 1,566 | |
Sunrise Communications Group
AG(a)(b)(c) | | | 25 | | | | 1,482 | |
The Swatch Group AG | | | 22 | | | | 7,736 | |
Swiss Life Holding AG | | | 21 | | | | 5,297 | |
Swiss Prime Site AG | | | 45 | | | | 3,366 | |
Swiss Re AG | | | 239 | | | | 22,777 | |
Swisscom AG | | | 17 | | | | 8,377 | |
Syngenta AG | | | 63 | | | | 23,226 | |
UBS Group AG | | | 2,464 | | | | 47,299 | |
Wolseley PLC | | | 189 | | | | 10,970 | |
| | | | | | | | |
| Security Description | | Shares | | | Value | |
| |
Switzerland (continued) | | | | | | | | |
Zurich Insurance Group AG | | | 105 | | | $ | 27,647 | |
| | | | | | | | |
Total Switzerland | | | | | | | 852,798 | |
| | | | | | | | |
| | |
United Kingdom (29.21%) | | | | | | | | |
3i Group PLC | | | 699 | | | | 5,290 | |
AA PLC | | | 387 | | | | 1,574 | |
Aberdeen Asset Management PLC | | | 703 | | | | 3,382 | |
Admiral Group PLC | | | 155 | | | | 3,784 | |
Aggreko PLC | | | 185 | | | | 2,800 | |
Amec Foster Wheeler PLC | | | 282 | | | | 1,849 | |
Amlin PLC | | | 364 | | | | 3,616 | |
Anglo American PLC | | | 1,003 | | | | 6,173 | |
Antofagasta PLC | | | 279 | | | | 2,133 | |
ARM Holdings PLC | | | 1,014 | | | | 17,166 | |
Ashmore Group PLC | | | 280 | | | | 1,065 | |
Ashtead Group PLC | | | 364 | | | | 6,003 | |
Associated British Foods PLC | | | 260 | | | | 13,886 | |
AstraZeneca PLC | | | 889 | | | | 60,285 | |
Auto Trader Group PLC(a)(b)(c) | | | 520 | | | | 3,182 | |
Aviva PLC | | | 2,877 | | | | 22,164 | |
Babcock International Group PLC | | | 181 | | | | 2,920 | |
BAE Systems PLC | | | 2,271 | | | | 17,666 | |
Balfour Beatty PLC(a) | | | 499 | | | | 1,928 | |
Barclays PLC | | | 11,814 | | | | 39,714 | |
Barratt Developments PLC | | | 710 | | | | 6,427 | |
BBA Aviation PLC | | | 314 | | | | 851 | |
Bellway PLC | | | 90 | | | | 3,546 | |
Berendsen PLC | | | 125 | | | | 1,996 | |
Berkeley Group Holdings PLC | | | 94 | | | | 4,546 | |
Betfair Group PLC | | | 61 | | | | 3,365 | |
BG Group PLC | | | 2,396 | | | | 37,223 | |
Booker Group PLC | | | 1,087 | | | | 2,953 | |
Bovis Homes Group PLC | | | 90 | | | | 1,291 | |
BP PLC | | | 12,921 | | | | 74,971 | |
British American Tobacco PLC | | | 1,302 | | | | 75,849 | |
The British Land Co. PLC, REIT | | | 683 | | | | 8,579 | |
Britvic PLC | | | 179 | | | | 1,934 | |
BT Group PLC | | | 5,828 | | | | 43,576 | |
BTG PLC(a) | | | 263 | | | | 2,442 | |
Bunzl PLC | | | 240 | | | | 6,940 | |
Burberry Group PLC | | | 320 | | | | 6,000 | |
Cable & Wireless Communications PLC | | | 1,878 | | | | 2,143 | |
Capita PLC | | | 484 | | | | 9,272 | |
Capital & Counties Properties PLC | | | 534 | | | | 3,544 | |
Carillion PLC | | | 310 | | | | 1,472 | |
Carnival PLC | | | 135 | | | | 7,045 | |
Centrica PLC | | | 3,651 | | | | 11,993 | |
Close Brothers Group PLC | | | 100 | | | | 2,143 | |
CNH Industrial NV | | | 709 | | | | 5,217 | |
Cobham PLC | | | 819 | | | | 3,742 | |
Compass Group PLC | | | 1,180 | | | | 20,509 | |
Croda International PLC | | | 100 | | | | 4,320 | |
Daily Mail & General Trust PLC, Class A | | | 205 | | | | 2,208 | |
Derwent London PLC, REIT | | | 75 | | | | 4,259 | |
10 | November 30, 2015
| | |
ALPS STOXX Europe 600 ETF | | |
| Schedule of Investments | | November 30, 2015 |
| | | | | | | | |
| Security Description | | Shares | | | Value | |
| |
United Kingdom (continued) | | | | | | | | |
Diageo PLC | | | 1,748 | | | $ | 50,284 | |
Direct Line Insurance Group PLC | | | 988 | | | | 6,128 | |
Dixons Carphone PLC | | | 729 | | | | 5,322 | |
Drax Group PLC | | | 290 | | | | 983 | |
DS Smith PLC | | | 679 | | | | 4,244 | |
easyJet PLC | | | 145 | | | | 3,610 | |
Elementis PLC | | | 334 | | | | 1,278 | |
Essentra PLC | | | 178 | | | | 2,328 | |
Fiat Chrysler Automobiles NV(a) | | | 603 | | | | 8,614 | |
Firstgroup PLC(a) | | | 868 | | | | 1,377 | |
G4S PLC | | | 1,118 | | | | 3,821 | |
GKN PLC | | | 1,197 | | | | 5,417 | |
GlaxoSmithKline PLC | | | 3,419 | | | | 69,800 | |
Great Portland Estates PLC, REIT | | | 249 | | | | 3,287 | |
Greene King PLC | | | 219 | | | | 2,804 | |
Halma PLC | | | 274 | | | | 3,559 | |
Hammerson PLC, REIT | | | 564 | | | | 5,186 | |
Hargreaves Lansdown PLC | | | 179 | | | | 4,033 | |
Hays PLC | | | 974 | | | | 2,161 | |
Henderson Group PLC | | | 811 | | | | 3,772 | |
Home Retail Group PLC | | | 584 | | | | 905 | |
Howden Joinery Group PLC | | | 464 | | | | 3,634 | |
HSBC Holdings PLC | | | 13,795 | | | | 110,012 | |
ICAP PLC | | | 399 | | | | 3,059 | |
IG Group Holdings PLC | | | 264 | | | | 3,078 | |
IMI PLC | | | 205 | | | | 2,946 | |
Imperial Tobacco Group PLC | | | 669 | | | | 36,152 | |
Inchcape PLC | | | 303 | | | | 3,589 | |
Indivior PLC | | | 500 | | | | 1,472 | |
Informa PLC | | | 441 | | | | 4,141 | |
Inmarsat PLC | | | 324 | | | | 5,441 | |
InterContinental Hotels Group PLC | | | 179 | | | | 6,891 | |
Intermediate Capital Group PLC | | | 248 | | | | 2,290 | |
International Consolidated Airlines Group SA(a) | | | 749 | | | | 6,396 | |
Intertek Group PLC | | | 115 | | | | 4,896 | |
Intu Properties PLC, REIT | | | 654 | | | | 3,186 | |
ITV PLC | | | 2,564 | | | | 10,465 | |
J Sainsbury PLC | | | 1,019 | | | | 3,895 | |
John Wood Group PLC | | | 270 | | | | 2,271 | |
Johnson Matthey PLC | | | 150 | | | | 6,393 | |
Jupiter Fund Management PLC | | | 329 | | | | 2,332 | |
Just Eat PLC(a) | | | 300 | | | | 1,991 | |
Kingfisher PLC(a) | | | 1,704 | | | | 9,070 | |
Lancashire Holdings, Ltd. | | | 135 | | | | 1,381 | |
Land Securities Group PLC, REIT | | | 529 | | | | 9,808 | |
Legal & General Group PLC | | | 4,265 | | | | 17,440 | |
Lloyds Banking Group PLC | | | 42,796 | | | | 47,026 | |
London Stock Exchange Group PLC | | | 222 | | | | 8,860 | |
Man Group PLC | | | 1,263 | | | | 3,104 | |
Marks & Spencer Group PLC | | | 1,178 | | | | 8,915 | |
Meggitt PLC | | | 578 | | | | 3,375 | |
Melrose Industries PLC | | | 717 | | | | 3,134 | |
Merlin Entertainments PLC(b)(c) | | | 470 | | | | 2,897 | |
Michael Page International PLC | | | 230 | | | | 1,761 | |
Micro Focus International PLC | | | 94 | | | | 1,816 | |
| | | | | | | | |
| Security Description | | Shares | | | Value | |
| |
United Kingdom (continued) | | | | | | | | |
National Grid PLC | | | 2,780 | | | $ | 38,763 | |
Next PLC | | | 110 | | | | 13,121 | |
Ocado Group PLC(a) | | | 420 | | | | 2,340 | |
Old Mutual PLC | | | 3,533 | | | | 11,121 | |
Pearson PLC | | | 589 | | | | 7,327 | |
Pennon Group PLC | | | 281 | | | | 3,695 | |
Persimmon PLC | | | 220 | | | | 6,345 | |
Petrofac, Ltd. | | | 189 | | | | 2,348 | |
Playtech PLC | | | 120 | | | | 1,461 | |
Provident Financial PLC | | | 101 | | | | 5,434 | |
Prudential PLC | | | 1,827 | | | | 42,362 | |
QinetiQ Group PLC | | | 464 | | | | 1,837 | |
Reckitt Benckiser Group PLC | | | 464 | | | | 43,537 | |
Regus PLC | | | 500 | | | | 2,619 | |
RELX NV | | | 750 | | | | 12,984 | |
RELX PLC | | | 812 | | | | 14,651 | |
Rentokil Initial PLC | | | 1,313 | | | | 3,156 | |
The Restaurant Group PLC | | | 159 | | | | 1,572 | |
Rexam PLC | | | 509 | | | | 4,442 | |
Rightmove PLC | | | 74 | | | | 4,459 | |
Rio Tinto PLC | | | 864 | | | | 28,739 | |
Rolls-Royce Holdings PLC(a) | | | 1,325 | | | | 12,103 | |
Rolls-Royce Holdings PLC - C Shares (Entitlement)(a) | | | 122,827 | | | | 185 | |
Rotork PLC | | | 640 | | | | 1,754 | |
Royal Bank of Scotland Group PLC(a) | | | 2,195 | | | | 9,997 | |
Royal Mail PLC | | | 470 | | | | 3,441 | |
RPC Group PLC | | | 200 | | | | 2,304 | |
RSA Insurance Group PLC | | | 729 | | | | 4,830 | |
SABMiller PLC | | | 704 | | | | 42,746 | |
The Sage Group PLC | | | 804 | | | | 7,102 | |
Schroders PLC | | | 69 | | | | 3,113 | |
Segro PLC, REIT | | | 534 | | | | 3,548 | |
Serco Group PLC(a) | | | 863 | | | | 1,436 | |
Severn Trent PLC | | | 174 | | | | 5,902 | |
Shaftesbury PLC, REIT | | | 200 | | | | 2,810 | |
Sky PLC | | | 753 | | | | 12,543 | |
Smith & Nephew PLC | | | 659 | | | | 11,166 | |
Smiths Group PLC | | | 284 | | | | 4,418 | |
Spectris PLC | | | 90 | | | | 2,411 | |
Spirax-Sarco Engineering PLC | | | 53 | | | | 2,491 | |
Sports Direct International PLC(a) | | | 186 | | | | 2,048 | |
SSE PLC | | | 705 | | | | 15,226 | |
St. James’s Place PLC | | | 374 | | | | 5,723 | |
Stagecoach Group PLC | | | 309 | | | | 1,656 | |
Standard Chartered PLC | | | 1,447 | | | | 12,143 | |
Standard Life PLC | | | 1,409 | | | | 8,839 | |
Subsea 7 SA(a) | | | 187 | | | | 1,488 | |
TalkTalk Telecom Group PLC | | | 394 | | | | 1,424 | |
Tate & Lyle PLC | | | 335 | | | | 2,977 | |
Taylor Wimpey PLC | | | 2,341 | | | | 6,861 | |
Telecity Group PLC | | | 145 | | | | 2,666 | |
Tesco PLC(a) | | | 5,415 | | | | 13,636 | |
Thomas Cook Group PLC(a) | | | 1,053 | | | | 1,902 | |
Travis Perkins PLC | | | 179 | | | | 5,481 | |
Tullow Oil PLC(a) | | | 654 | | | | 1,935 | |
11 | November 30, 2015
| | |
ALPS STOXX Europe 600 ETF | | |
| Schedule of Investments | | November 30, 2015 |
| | | | | | | | |
| Security Description | | Shares | | | Value | |
United Kingdom (continued) | | | | | | | | |
UBM PLC | | | 332 | | | $ | 2,530 | |
Ultra Electronics Holdings PLC | | | 50 | | | | 1,496 | |
Unilever NV, CVA | | | 1,113 | | | | 48,831 | |
Unilever PLC | | | 904 | | | | 38,585 | |
United Utilities Group PLC | | | 490 | | | | 7,133 | |
Victrex PLC | | | 60 | | | | 1,749 | |
Vodafone Group PLC | | | 18,680 | | | | 63,090 | |
The Weir Group PLC | | | 155 | | | | 2,806 | |
WH Smith PLC | | | 77 | | | | 2,012 | |
Whitbread PLC | | | 130 | | | | 8,905 | |
William Hill PLC | | | 629 | | | | 3,388 | |
Wm Morrison Supermarkets PLC | | | 1,682 | | | | 3,863 | |
WPP PLC | | | 952 | | | | 22,009 | |
WS Atkins PLC | | | 75 | | | | 1,785 | |
| | | | | | | | |
Total United Kingdom | | | | | | | 1,787,766 | |
| | | | | | | | |
| | |
TOTAL COMMON STOCKS (Cost $6,302,955) | | | | | | | 6,041,589 | |
| | | | | | | | |
| | |
CLOSED-END FUNDS (0.04%) | | | | | | | | |
Switzerland (0.04%) | | | | | | | | |
BB Biotech AG(a) | | | 9 | | | | 2,587 | |
| | | | | | | | |
Total Switzerland | | | | | | | 2,587 | |
| | | | | | | | |
| | |
TOTAL CLOSED-END FUNDS (Cost $2,314) | | | | | | | 2,587 | |
| | | | | | | | |
| | |
PREFERRED STOCKS (0.62%) | | | | | | | | |
Germany (0.62%) | | | | | | | | |
Fuchs Petrolub AG | | | 50 | | | | 2,368 | |
Henkel AG & Co. KGaA | | | 130 | | | | 14,765 | |
Porsche Automobil Holding SE | | | 110 | | | | 5,774 | |
Volkswagen AG | | | 110 | | | | 15,289 | |
| | | | | | | | |
Total Germany | | | | | | | 38,196 | |
| | | | | | | | |
| | |
TOTAL PREFERRED STOCKS (Cost $48,198) | | | | | | | 38,196 | |
| | | | | | | | |
| | |
RIGHTS (0.01%)(a) | | | | | | | | |
Italy (–%) | | | | | | | | |
Unione di Banche Italiane SpA,
Strike price 7.29 (EUR),
Expires 1/15/16 | | | 649 | | | | – | |
| | | | | | | | |
Total Italy | | | | | | | – | |
| | | | | | | | |
| | |
United Kingdom (0.01%) | | | | | | | | |
Standard Chartered PLC,
Strike price 4.65 (GBP),
Expires 12/10/15 | | | 413 | | | | 566 | |
| | | | | | | | |
Total United Kingdom | | | | | | | 566 | |
| | | | | | | | |
| | |
TOTAL RIGHTS (Cost $0) | | | | | | | 566 | |
| | | | | | | | |
| | | | | | | | | | | | |
| Security Description | | 7 Day Yield | | | Shares | | | Value | |
SHORT TERM INVESTMENTS (0.31%) | | | | | |
Morgan Stanley
Institutional
Liquidity Funds,
Prime Portfolio | | | 0.105% | | | | 18,792 | | | $ | 18,792 | |
| | | | | | | | | | | | |
| | |
TOTAL SHORT TERM INVESTMENTS (Cost $18,792) | | | | | | | | 18,792 | |
| | | | | | | | | | | | |
| | |
TOTAL INVESTMENTS (99.70%) (Cost $6,372,259) | | | | | | | $ | 6,101,730 | |
| |
NET OTHER ASSETS AND LIABILITIES (0.30%) | | | | 18,535 | |
| | | | | | | | | | | | |
| | |
NET ASSETS (100.00%) | | | | | | | $ | 6,120,265 | |
| | | | | | | | | | | | |
| (a) | Non-income producing security. |
| (b) | Securities exempt from registration under Rule 144A of the Securities Act of 1933. These securities may be sold in the ordinary course of business in transactions exempt from registration, normally to qualified institutional buyers. At period end, the aggregate market value of those securities was $15,049, representing 0.25% of net assets. |
| (c) | Securities were purchased pursuant to Regulation S under the Securities Act of 1933, which exempts from registration securities offered and sold outside of the United States. Such securities cannot be sold by the issuer in the United States without either an effective registration statement filed pursuant to the Securities Act of 1933, or pursuant to an exemption from registration. These securities have been deemed liquid under guidelines approved by the Fund’s Board of Trustees. At period end, the aggregate market value of those securities was $15,049 representing 0.25% of net assets. |
Common Abbreviations:
AB - Aktiebolag is the Swedish equivalent of the term corporation.
ADR - American Depositary Receipt.
AG - Aktiengesellschaft is a German term that refers to a corporation that is limited by shares, i.e., owned by shareholders.
a.s - Akciova Spolecnost is a joint stock company in the Czech Republic.
A/S - Aktieselskab is the Danish term for Joint Stock Company.
ASA - Allmennaksjeselskap is the Norwegian term for public limited company.
CVA - Dutch Certification.
KGaA - Kommanditgesellschaft auf Aktien is a German corporate designation standing for partnership limited by shares.
Ltd. - Limited.
NV - Naamloze Vennootschap is the Dutch term for a public limited liability corporation.
OYJ - Osakeyhtio is the Finnish equivalent of a public limited company.
PLC - Public Limited Company.
REIT - Real Estate Investment Trust.
12 | November 30, 2015
| | |
ALPS STOXX Europe 600 ETF | | |
| Schedule of Investments | | November 30, 2015 |
Common Abbreviations: (continued)
SA - Generally designated corporations in various countries, mostly those employing civil law.
SC - Societa cooperativa is the Italian phrase for a private company. SCA - Societe en commandite par actions is the French phrase for a limited partnership.
SE - SE Regulation. A European Company which can operate on a Europe-wide basis and be governed by Community law directly applicable in all Member States.
SGPS - Sociedade gestora de participa coes sociais is the Portuguese phrase for a limited liability company.
SpA - Societa per Azione is the Italian phrase for a shared company. Scarl - Societa cooperativa a responsabilita limitata is the Italian phrase for a limited liability company.
Currency Abbreviations:
EUR - Euro
GBP - Great British Pound
See Notes to Financial Statements.
13 | November 30, 2015
| | |
ALPS STOXX Europe 600 ETF | | |
| Statement of Assets and Liabilities | | November 30, 2015 |
| | | | |
ASSETS: | | | | |
Investments, at value | | $ | 6,101,730 | |
Foreign currency, at value (Cost $5,298) | | | 5,272 | |
Foreign tax reclaims | | | 5,799 | |
Dividends receivable | | | 8,719 | |
| |
Total Assets | | | 6,121,520 | |
| |
| |
LIABILITIES: | | | | |
Payable to adviser | | | 1,255 | |
| |
Total Liabilities | | | 1,255 | |
| |
NET ASSETS | | $ | 6,120,265 | |
| |
| |
NET ASSETS CONSIST OF: | | | | |
Paid-in capital | | $ | 6,388,219 | |
Accumulated net investment income | | | 7,863 | |
Accumulated net realized loss on investments and foreign currency transactions | | | (4,827) | |
Net unrealized depreciation on investments and translation of assets and liabilities denominated in foreign currencies | | | (270,990) | |
| |
NET ASSETS | | $ | 6,120,265 | |
| |
| |
INVESTMENTS, AT COST | | $ | 6,372,259 | |
| |
PRICING OF SHARES | | | | |
Net Assets | | $ | 6,120,265 | |
Shares of beneficial interest outstanding (Unlimited number of shares authorized, par value $0.01 per share) | | | 250,000 | |
Net Asset Value, offering and redemption price per share | | $ | 24.48 | |
See Notes to Financial Statements.
14 | November 30, 2015
| | |
ALPS STOXX Europe 600 ETF | | |
| Statement of Operations | | For the Year Ended November 30, 2015 |
| | | | |
INVESTMENT INCOME: | | | | |
Dividends(a) | | $ | 171,020 | |
| |
Total Investment Income | | | 171,020 | |
| |
| |
EXPENSES: | | | | |
Investment adviser fees | | | 14,448 | |
| |
Total Expense | | | 14,448 | |
| |
NET INVESTMENT INCOME | | | 156,572 | |
| |
| |
REALIZED AND UNREALIZED GAIN/(LOSS) | | | | |
Net realized loss on investments | | | (4,599) | |
Net realized loss on foreign currency transactions | | | (1,698) | |
Net change in unrealized depreciation on investments | | | (450,323) | |
Net change in unrealized depreciation on translation of assets and liabilities denominated in foreign currencies | | | (416) | |
| |
NET REALIZED AND UNREALIZED LOSS ON INVESTMENTS | | | (457,036) | |
| |
NET DECREASE IN NET ASSETS RESULTING FROM OPERATIONS | | $ | (300,464) | |
| |
| (a) | Net of foreign tax withholding $24,764. |
See Notes to Financial Statements.
15 | November 30, 2015
| | |
ALPS STOXX Europe 600 ETF | | |
| Statements of Changes in Net Assets | | |
| | | | | | | | |
| | | For the
Year Ended
November 30,
2015 | | | For the Period
October 31, 2014
(Commencement
of Operations)
to November 30,
2014 | |
| |
OPERATIONS: | | | | | | | | |
Net investment income | | $ | 156,572 | | | $ | 7,522 | |
Net realized gain/(loss) on investments and foreign currency transactions | | | (6,297) | | | | 33 | |
Net change in unrealized appreciation/(depreciation) on investments and translation of assets and liabilities denominated in foreign currencies | | | (450,739) | | | | 179,749 | |
| |
Net increase/(decrease) in net assets resulting from operations | | | (300,464) | | | | 187,304 | |
| |
| | |
DISTRIBUTIONS: | | | | | | | | |
Dividends to shareholders from net investment income | | | (154,794) | | | | – | |
| |
Net decrease in net assets from distributions | | | (154,794) | | | | – | |
| |
| | |
CAPITAL SHARE TRANSACTIONS: | | | | | | | | |
Proceeds from sale of shares | | | 1,373,921 | | | | 5,014,298 | |
| |
Net increase from capital share transactions | | | 1,373,921 | | | | 5,014,298 | |
| |
Net increase in net assets | | | 918,663 | | | | 5,201,602 | |
| | |
NET ASSETS: | | | | | | | | |
Beginning of year | | | 5,201,602 | | | | – | |
| |
End of year * | | $ | 6,120,265 | | | $ | 5,201,602 | |
| |
| |
| | |
*Including accumulated net investment income of: | | $ | 7,863 | | | $ | 7,522 | |
| | |
OTHER INFORMATION: | | | | | | | | |
CAPITAL SHARE TRANSACTIONS: | | | | | | | | |
Beginning shares | | | 200,000 | | | | – | |
Shares sold | | | 50,000 | | | | 200,000 | |
| |
Shares outstanding, end of period | | | 250,000 | | | | 200,000 | |
| |
See Notes to Financial Statements.
16 | November 30, 2015
| | |
ALPS STOXX Europe 600 ETF | | |
| Financial Highlights | | For a Share Outstanding Throughout the Periods Presented |
| | | | | | | | |
| | | For the Year
Ended
November 30,
2015 | | | For the Period October 31, 2014
(Commencement
of Operations) to November 30,
2014 | |
| |
NET ASSET VALUE, BEGINNING OF PERIOD | | $ | 26.01 | | | $ | 25.07 | |
| | |
INCOME/(LOSS) FROM INVESTMENT OPERATIONS: | | | | | | | | |
Net investment income (a) | | | 0.69 | | | | 0.04 | |
Net realized and unrealized gain/(loss) | | | (1.55) | | | | 0.90 | |
| |
Total from investment operations | | | (0.86) | | | | 0.94 | |
| |
| | |
DISTRIBUTIONS: | | | | | | | | |
From net investment income | | | (0.67) | | | | – | |
| |
Total distributions | | | (0.67) | | | | – | |
| |
| | |
Net increase/(decrease) in net asset value | | | (1.53) | | | | 0.94 | |
| |
NET ASSET VALUE, END OF PERIOD | | $ | 24.48 | | | $ | 26.01 | |
| |
TOTAL RETURN(b) | | | (3.35)% | | | | 3.75% | |
| | |
RATIOS/SUPPLEMENTAL DATA: | | | | | | | | |
Net assets, end of period (000s) | | $ | 6,120 | | | $ | 5,202 | |
| | |
Ratio of expenses to average net assets | | | 0.25% | | | | 0.25%(c) | |
Ratio of net investment income to average net assets | | | 2.71% | | | | 1.74%(c) | |
Portfolio turnover rate(d) | | | 4% | | | | 0%(e) | |
| (a) | Based on average shares outstanding during the period. |
| (b) | Total return is calculated assuming an initial investment made at the net asset value at the beginning of the period and redemption at the net asset value on the last day of the period and assuming all distributions are reinvested at reinvestment prices. Total return calculated for a period of less than one year is not annualized. | |
| (d) | Portfolio turnover for periods less than one year are not annualized and does not include securities received or delivered from processing creations or redemptions. | |
See Notes to Financial Statements.
17 | November 30, 2015
| | |
ALPS STOXX Europe 600 ETF | | |
| Notes to Financial Statements | | November 30, 2015 |
1. ORGANIZATION
The ALPS ETF Trust (the “Trust”), a Delaware statutory trust, is an open-end management investment company under the Investment Company Act of 1940, as amended (the “1940 Act”). As of November 30, 2015, the Trust consists of twenty-one separate portfolios. Each portfolio represents a separate series of the Trust. This report pertains to the ALPS STOXX Europe 600 ETF (the “Fund”). The investment objective of the Fund is to seek investment results that correspond (before fees and expenses) generally to the performance of its underlying index, the STOXX® Europe 600 Index (the “Underlying Index”). The investment advisor uses a “passive” or indexing approach to try to achieve the Fund’s investment objective. The Fund is considered non-diversified and may invest a greater portion of assets in securities of individual issuers than a diversified fund. As a result, changes in the market value of a single investment could cause greater fluctuations in share price than would occur in a diversified fund.
The Fund’s Shares (“Shares”) are listed on the New York Stock Exchange (“NYSE”) Arca. The Fund issues and redeems Shares, at net asset value (“NAV”) in blocks of 50,000 Shares, each of which is called a “Creation Unit”. Creation Units are issued and redeemed principally in-kind for securities included in a specified index. Except when aggregated in Creation Units, Shares are not redeemable securities of the Fund.
Pursuant to the Trust’s organizational documents, its Officers and Trustees are indemnified against certain liability arising out of the performance of their duties to the Trust. Additionally, in the normal course of business, the Trust enters into contracts with service providers that contain general indemnification clauses. The Trust’s maximum exposure under these arrangements is unknown, as this would involve future claims that may be made against the Trust that have not yet occurred.
2. SIGNIFICANT ACCOUNTING POLICIES
The following is a summary of significant accounting policies consistently followed by the Fund in the preparation of the financial statements. The accompanying financial statements were prepared in accordance with accounting principles generally accepted in the United States of America (“U.S. GAAP”). The preparation of financial statements in conformity with U.S. GAAP requires management to make certain estimates and assumptions that affect the reported amounts of assets and liabilities and disclosures of contingent assets and liabilities at the date of the financial statements and the reported amounts of revenue and expenses during the period. Actual results could differ from those estimates. The Fund is considered an investment company under U.S. GAAP and follows the accounting and reporting guidance applicable to investment companies in the Financial Accounting Standards Board Accounting Standards Codification Topic 946.
A. Portfolio Valuation
The Fund’s NAV is determined daily, as of the close of regular trading on the NYSE, normally 4:00 p.m. Eastern time, on each day the NYSE is open for trading. The NAV is computed by dividing the value of all assets of the Fund (including accrued interest and dividends), less all liabilities (including accrued expenses and dividends declared but unpaid), by the total number of shares outstanding.
Portfolio securities listed on any exchange other than the NASDAQ Stock Market LLC (“NASDAQ”) are valued at the last sale price on the business day as of which such value is being determined. If there has been no sale on such day, the securities are valued at the mean of the most recent bid and asked prices on such day. Securities traded on the NASDAQ are valued at the NASDAQ Official Closing Price as determined by NASDAQ. Portfolio securities traded on more than one securities exchange are valued at the last sale price on the business day as of which such value is being determined at the close of the exchange representing the principal market for such securities. Portfolio securities traded in the over-the-counter market, but excluding securities traded on the NASDAQ, are valued at the last quoted sale price in such market.
The Fund’s investments are valued at market value or, in the absence of market value with respect to any portfolio securities, at fair value according to procedures adopted by the Trust’s Board of Trustees (the “Board”). When market quotations are not readily available or when events occur that make established valuation methods unreliable, securities of the Fund may be valued in good faith by or under the direction of the Board. These securities generally include, but are not limited to, restricted securities (securities which may not be publicly sold without registration under the Securities Act of 1933) for which a pricing service is unable to provide a market price; securities whose trading has been formally suspended; a security whose market price is not available from a pre-established primary pricing source or the pricing source is not willing to provide a price; a security with respect to which an event has occurred that is most likely to materially affect the value of the security after the market has closed but before the calculation of the Fund’s NAV or make it difficult or impossible to obtain a reliable market quotation; or a security whose price, as provided by the pricing service, does not reflect the security’s “fair value” due to the security being de-listed from a national exchange or the security’s primary trading market is temporarily closed at a time when, under normal conditions, it would be open. As a general principle, the current “fair value” of a security would be the amount which the owner might reasonably expect to receive from the sale on the applicable or principal market. A variety of factors may be considered in determining the fair value of such securities.
18 | November 30, 2015
| | |
ALPS STOXX Europe 600 ETF | | |
| Notes to Financial Statements | | November 30, 2015 |
B. Fair Value Measurements
The Fund discloses the classification of its fair value measurements following a three-tier hierarchy based on the inputs used to measure fair value. Inputs refer broadly to the assumptions that market participants would use in pricing the asset or liability, including assumptions about risk. Inputs may be observable or unobservable. Observable inputs reflect the assumptions market participants would use in pricing the asset or liability that are developed based on market data obtained from sources independent of the reporting entity. Unobservable inputs reflect the reporting entity’s own assumptions about the assumptions market participants would use in pricing the asset or liability that are developed based on the best information available.
Valuation techniques used to value the Fund’s investments by major category are as follows:
Equity securities, including restricted securities, for which market quotations are readily available, are valued at the last reported sale price or official closing price as reported by a third party pricing vendor on the primary market or exchange on which they are traded and are categorized as Level 1 in the hierarchy. In the event there were no sales during the day or closing prices are not available, securities are valued at the mean of the most recent quoted bid and ask prices on such day and are generally categorized as Level 2 in the hierarchy. Investments in open-end mutual funds are valued at their closing NAV each business day and are categorized as Level 1 in the hierarchy.
Changes in valuation techniques may result in transfers in or out of an assigned level within the disclosure hierarchy.
Various inputs are used in determining the value of the Fund’s investments as of the end of the reporting period. When inputs used fall into different levels of the fair value hierarchy, the level in the hierarchy within which the fair value measurement falls is determined based on the lowest level input that is significant to the fair value measurement in its entirety. The designated input levels are not necessarily an indication of the risk or liquidity associated with these investments.
These inputs are categorized in the following hierarchy under applicable financial accounting standards:
| | |
Level 1 – | | Unadjusted quoted prices in active markets for identical investments, unrestricted assets or liabilities that a Fund has the ability to access at the measurement date; |
Level 2 – | | Quoted prices which are not active, quoted prices for similar assets or liabilities in active markets or inputs other than quoted prices that are observable (either directly or indirectly) for substantially the full term of the asset or liability; and |
Level 3 – | | Significant unobservable prices or inputs (including the Fund’s own assumptions in determining the fair value of investments) where there is little or no market activity for the asset or liability at the measurement date. |
The following is a summary of the inputs used to value the Fund’s investments at November 30, 2015:
ALPS STOXX Europe 600 ETF
| | | | | | | | | | | | | | | | |
| Investments in Securities at Value* | | Level 1 - Unadjusted
Quoted Prices | | | Level 2 - Other Significant
Observable Inputs | | | Level 3 - Significant
Unobservable Inputs | | | Total | |
Common Stocks | | | | | | | | | | | | | | | | |
United Kingdom | | $ | 1,787,581 | | | $ | 185 | | | $ | – | | | $ | 1,787,766 | |
Other | | | 4,253,823 | | | | – | | | | – | | | | 4,253,823 | |
Closed-End Funds | | | 2,587 | | | | – | | | | – | | | | 2,587 | |
Preferred Stocks | | | 38,196 | | | | – | | | | – | | | | 38,196 | |
Rights | | | 566 | | | | – | | | | – | | | | 566 | |
Short Term Investments | | | 18,792 | | | | – | | | | – | | | | 18,792 | |
TOTAL | | $ | 6,101,545 | | | $ | 185 | | | $ | – | | | $ | 6,101,730 | |
| | | | | | | | | | | | | | | | | |
| * | For a detailed country breakdown, see the accompanying Schedule of Investments. |
The Fund recognizes transfers between levels as of the end of the period. For the year ended November 30, 2015, the Fund did not have any transfers between Level 1 and Level 2 securities. The Fund did not have any securities which used significant unobservable inputs (Level 3) in determining fair value.
19 | November 30, 2015
| | |
ALPS STOXX Europe 600 ETF | | |
| Notes to Financial Statements | | November 30, 2015 |
C. European Economic Risk
The Economic and Monetary Union (the “EMU”) of the European Union (“EU”) requires compliance with restrictions on inflation rates, deficits, interest rates, debt levels and fiscal and monetary controls, each of which may significantly affect every country in Europe. Decreasing imports or exports, changes in governmental or EU regulations on trade, changes in the exchange rate of the Euro, the default or threat of default by an EU member country on its sovereign debt, and/or an economic recession in an EU member country may have a significant adverse effect on the economies of EU member countries and their trading partners. The European financial markets have recently experienced volatility and adverse trends due to concerns about economic downturns or rising government debt levels in several European countries, including Greece, Ireland, Italy, Portugal and Spain. A default or debt restructuring by any European country would adversely impact holders of that country’s debt, and sellers of credit default swaps linked to that country’s creditworthiness (which may be located in countries other than those listed in the previous sentence). These events have adversely affected the exchange rate of the Euro, the common currency of certain EU countries, and may continue to significantly affect every country in Europe, including countries that do not use the Euro.
D. Foreign Investment Risk
The Fund’s investments in non-U.S. issuers may involve unique risks compared to investing in securities of U.S. issuers, including, among others, greater market volatility than U.S. securities and less complete financial information than for U.S. issuers. In addition, adverse political, economic or social developments could undermine the value of the Fund’s investments or prevent the Fund from realizing the full value of its investments. Financial reporting standards for companies based in foreign markets differ from those in the United States. Finally, the value of the currency of the country in which the Fund has invested could decline relative to the value of the U.S. dollar, which may affect the value of the investment to U.S. investors. The Fund will not enter into transactions to hedge against declines in the value of the Fund’s assets that are denominated in a foreign currency.
E. Foreign Currency Translation
The books and records of the Fund are maintained in U.S. dollars. Investment valuations and other assets and liabilities initially expressed in foreign currencies are converted each business day into U.S. dollars based upon current exchange rates. The portion of realized and unrealized gains or losses on investments due to fluctuations in foreign currency exchange rates is not separately disclosed and is included in realized and unrealized gains or losses on investments, when applicable.
F. Concentration Risk
The Fund seeks to track the Underlying Index, which itself may have concentration in certain regions, economies, countries, markets, industries or sectors. Underperformance or increased risk in such concentrated areas may result in underperformance or increased risk in the Fund.
G. Securities Transactions and Investment Income
Securities transactions are recorded as of the trade date. Realized gains and losses from securities transactions are recorded on the highest cost basis. Dividend income and capital gains distributions, if any, are recorded on the ex-dividend date, net of any foreign taxes withheld. Interest income, if any, is recorded on the accrual basis.
H. Dividends and Distributions to Shareholders
Dividends from net investment income of the Fund, if any, are declared and paid quarterly or as the Board may determine from time to time. Distributions of net realized capital gains earned by the Fund, if any, are distributed at least annually.
I. Federal Tax and Tax Basis Information
The timing and character of income and capital gain distributions are determined in accordance with income tax regulations, which may differ from U.S. GAAP. Reclassifications are made to the Fund’s capital accounts for permanent tax differences to reflect income and gains available for distribution (or available capital loss carryforwards) under income tax regulations.
For the year ended November 30, 2015, the following reclassifications, which had no impact on results of operations or net assets, were recorded to reflect permanent tax differences resulting primarily from in-kind transactions:
| | | | | | | | | | | | |
| Fund | | Paid-in Capital | | | Accumulated Net
Investment Loss | | | Accumulated Net
Realized Gain on
Investments | |
ALPS STOXX Europe 600 ETF | | $ | – | | | $ | (1,437 | ) | | $ | 1,437 | |
20 | November 30, 2015
| | |
ALPS STOXX Europe 600 ETF | | |
| Notes to Financial Statements | | November 30, 2015 |
The tax character of distributions paid for the year ending November 30, 2015 were as follows:
| | | | | | | | | | | | | | |
| Fund | | | | Ordinary Income | | | Long-Term Capital Gain | | | Return of Capital | |
ALPS STOXX Europe 600 ETF | | | | $ | 154,794 | | | $ | – | | | $ | – | |
There were no distributions paid for the year ending November 30, 2014.
As of November 30, 2015, the components of distributable earnings on a tax basis for the Fund were as follows:
| | | | |
| | | ALPS STOXX Europe
600 ETF | |
Undistributed net investment income | | $ | 16,086 | |
Accumulated net realized loss on investments | | | (4,416) | |
Net unrealized depreciation on investments | | | (279,624) | |
Total | | $ | (267,954) | |
| | | | | |
As of November 30, 2015, the cost of investments for federal income tax purposes and accumulated net unrealized appreciation/(depreciation) on investments were as follows:
| | | | |
| | | ALPS STOXX Europe
600 ETF | |
Gross appreciation (excess of value over tax cost) | | $ | 352,567 | |
Gross depreciation (excess of tax cost over value) | | | (631,730) | |
Net depreciation of foreign currency | | | (461) | |
Net unrealized appreciation (depreciation) | | | (279,624) | |
| | | | | |
Cost of investments for income tax purposes | | $ | 6,380,893 | |
| | | | | |
The differences between book-basis and tax-basis are primarily due to the deferral of losses from Passive Foreign Investment Company (“PFIC”) adjustments.
At November 30, 2015, the Fund had available for tax purposes unused post-enactment capital loss carryforwards as follows:
| | | | | | | | | | |
| Fund | | | | Short-Term | | | Long-Term | |
ALPS STOXX Europe 600 ETF | | | | $ | 4,403 | | | $ | 13 | |
J. Income Taxes
No provision for income taxes is included in the accompanying financial statements, as the Fund intends to distribute to shareholders all taxable investment income and realized gains and otherwise comply with Subchapter M of the Internal Revenue Code of 1986, as amended, applicable to regulated investment companies. The Fund evaluates tax positions taken (or expected to be taken) in the course of preparing the Fund’s tax returns to determine whether these positions meet a “more-likely-than-not” standard that, based on the technical merits, have a more than fifty percent likelihood of being sustained by a taxing authority upon examination. A tax position that meets the “more-likely-than-not” recognition threshold is measured to determine the amount of benefit to recognize in the financial statements.
As of and during the year ended November 30, 2015, the Fund did not have a liability for any unrecognized tax benefits. The Fund files U.S. federal, state, and local tax returns as required. The Fund’s tax returns are subject to examination by the relevant tax authorities until expiration of the applicable statute of limitations which is generally three years after the filing of the tax return, but may extend to four years in certain jurisdictions. Tax returns for open years have incorporated no uncertain tax positions that require a provision for income taxes.
3. INVESTMENT ADVISORY FEE AND OTHER AFFILIATED TRANSACTIONS
ALPS Advisors, Inc. (the “Adviser”) acts as the Fund’s investment adviser pursuant to an advisory agreement with the Trust on behalf of the Fund (the “Advisory Agreement”). Pursuant to the Advisory Agreement, the Fund pays the Adviser a unitary fee for the services and facilities it provides payable on a monthly basis at the annual rate of 0.25% of the Fund’s average daily net assets. From time to time, the Adviser may waive all or a portion of its fee.
21 | November 30, 2015
| | |
ALPS STOXX Europe 600 ETF | | |
| Notes to Financial Statements | | November 30, 2015 |
Out of the unitary management fee, the Adviser pays substantially all expenses of the Fund, including the cost of transfer agency, custody, fund administration, legal, audit, independent trustees and other services, except for interest expenses, distribution fees or expenses, brokerage expenses, taxes and extraordinary expenses, such as litigation, not incurred in the ordinary course of the Fund’s business. The Adviser’s unitary management fee is designed to pay substantially all of the Fund’s expenses and to compensate the Adviser for providing services for the Fund.
ALPS Fund Services, Inc., an affiliate of the Adviser, is the administrator of the Fund.
Each Trustee who is not an officer or employee of the Adviser, any sub-adviser or any of their affiliates (“Independent Trustees”) receives (1) a quarterly retainer of $5,000, (2) a per meeting fee for regularly scheduled meetings of $3,750, (3) $1,500 for any special meeting held outside of a regularly scheduled board meeting, and (4) reimbursement for all reasonable out-of-pocket expenses relating to attendance at meetings.
4. PURCHASES AND SALES OF SECURITIES
For the year ended November 30, 2015, the cost of purchases and proceeds from sales of investment securities, excluding short-term investments and in-kind transactions, were as follows:
| | | | | | | | |
| Fund | | Purchases | | | Sales | |
ALPS STOXX Europe 600 ETF | | $ | 249,141 | | | $ | 265,420 | |
For the year ended November 30, 2015, the cost of in-kind purchases and proceeds from in-kind sales were as follows:
| | | | | | | | | | |
| Fund | | | | Purchases | | | Sales | |
ALPS STOXX Europe 600 ETF | | | | $ | 1,362,102 | | | $ | – | |
Gains on in-kind transactions are not considered taxable for federal income tax purposes.
5. CAPITAL SHARE TRANSACTIONS
Shares are created and redeemed by the Fund only in Creation Unit size aggregations of 50,000. Only broker-dealers or large institutional investors with creation and redemption agreements called Authorized Participants (“AP”) are permitted to purchase or redeem Creation Units from the Fund. Such transactions are generally permitted on an in-kind basis, with a balancing cash component to equate the transaction to the NAV per unit of the Fund on the transaction date. Cash may be substituted equivalent to the value of certain securities generally when they are not available in sufficient quantity for delivery, not eligible for trading by the AP or as a result of other market circumstances.
22 | November 30, 2015
| | |
ALPS STOXX Europe 600 ETF | | |
| Additional Information | | November 30, 2015 (Unaudited) |
PROXY VOTING RECORDS, POLICIES AND PROCEDURES
Information regarding how the Fund voted proxies relating to portfolio securities during the most recent 12-month period ended June 30 and a description of the Fund’s proxy voting policies and procedures used in determining how to vote for proxies are available without charge on the Securities and Exchange Commission’s (“SEC”) website at www.sec.gov and upon request, by calling (toll-free) 1-866-675-2639.
PORTFOLIO HOLDINGS
The Trust is required to disclose, after its first and third fiscal quarters, the complete schedule of each Fund’s portfolio holdings with the SEC on Form N-Q. Form N-Q for each Fund will be available on the SEC’s website at www.sec.gov. Each Fund’s Form N-Q may also be reviewed and copied at the SEC’s Public Reference Room in Washington, D.C. and information on the operation of the Public Reference Room may be obtained by calling 1-800-SEC-0330. Each Fund’s Form N-Q will be available without charge, upon request, by calling (toll-free) 1-866-675-2639 or by writing to ALPS ETF Trust at 1290 Broadway, Suite 1100, Denver, Colorado 80203.
TAX INFORMATION
The Fund designates the following for federal income tax purposes for distributions made during the calendar year ended December 31, 2014:
| | | | | | |
| | | Qualified Dividend Income | | Dividend Received Deduction | | |
ALPS STOXX Europe 600 ETF | | 100.00% | | 0.00% | | |
In early 2015, if applicable, shareholders of record received this information for the distribution paid to them by the Fund during the calendar year 2014 via Form 1099. The Fund will notify shareholders in early 2016 of amounts paid to them by the Fund, if any, during the calendar year 2015. | | |
Pursuant to Section 853(c) of the Internal Revenue Code, the following Fund designated the following: | | |
| | | Foreign Taxes Paid | | Foreign Source Income | | |
ALPS STOXX Europe 600 ETF | | $ 16,727 | | $ 166,767 | | |
LICENSING AGREEMENT
The STOXX® Europe 600 is the intellectual property (including registered trademarks) of STOXX Limited, Zurich, Switzerland and/or its licensors (“Licensors”), which is used under license. The securities based on the Index are in no way sponsored, endorsed, sold or promoted by STOXX and its Licensors and neither of the Licensors shall have any liability with respect thereto.
23 | November 30, 2015
| | |
ALPS STOXX Europe 600 ETF | | |
| Trustees & Officers | | November 30, 2015 (Unaudited) |
| | | | | | | | | | |
INDEPENDENT TRUSTEES |
Name, Address
& Year of Birth* | | Position(s) Held
with Trust | | Term of Office
and Length of
Time Served** | | Principal Occupation(s)
During Past 5 Years | | Number of
Portfolios in Fund
Complex Overseen
by Trustees*** | | Other Directorships
Held by Trustees |
Mary K. Anstine, 1940 | | Trustee | | Since March 2008 | | Ms. Anstine was formerly an Executive Vice President of First Interstate Bank of Denver until 1994, President/Chief Executive Officer of HealthONE Alliance, Denver, Colorado, from 1994 to 2004, and has been retired since 2004. Ms. Anstine is also Trustee/Director of the following: AV Hunter Trust and Colorado Uplift Board. Ms. Anstine was formerly a Director of the Trust Bank of Colorado (later purchased and now known as Northern Trust Bank), HealthONE and Denver Area Council of the Boy Scouts of America and a member of the American Bankers Association Trust Executive Committee. | | 46 | | Ms. Anstine is a Trustee of ALPS Variable Investment Trust (9 funds); Financial Investors Trust (31 funds); Reaves Utility Income Fund; and Westcore Trust (12 funds). |
Jeremy W. Deems, 1976 | | Trustee | | Since March 2008 | | Mr. Deems is the Co-Founder, Chief Financial Officer of Green Alpha Advisors, LLC. Mr. Deems is Co-Portfolio Manager of the Shelton Green Alpha Fund. Prior to joining Green Alpha Advisors, Mr. Deems was CFO and Treasurer of Forward Management, LLC, ReFlow Management Co., LLC, ReFlow Fund, LLC, a private investment fund, and Sutton Place Management, LLC, an administrative services company. | | 46 | | Mr. Deems is a Trustee of ALPS Variable Investment Trust (9 funds); Financial Investors Trust (31 funds); Clough Funds Trust (1 fund); and Reaves Utility Income Fund. |
Rick A. Pederson, 1952 | | Trustee | | Since March 2008 | | Mr. Pederson is President, Foundation Properties, Inc. (a real estate investment management company), 1994 - present; Advisory Board Member, Bow River Capital Partners (private equity management), 2003 - present; Advisor, Pauls Corporation (real estate investment management and development), 2008 - present; Chairman, Ross Consulting Group (real estate consulting services) 1983-2013; Advisory Board, Neenan Company (construction services) 2002-present; Board Member, Prosci, Inc. (private business services), 2013-present; Board Member, Citywide Banks (Colorado community bank) 2014-present; Board member, Professional Pediatric Health Care (a Denver-based home nursing firm) 2014 – present; Director, National Western Stock Show (not-for-profit organization); Director, Biennial of the Americas (not-for-profit organization). | | 24 | | Mr. Pederson is Trustee of Westcore Trust (12 funds) and Principal Real Estate Income Fund (1 fund). |
| * | The business address of the Trustee is c/o ALPS Advisors, Inc., 1290 Broadway, Suite 1100, Denver, Colorado 80203. |
| ** | This is the period for which the Trustee began serving the Trust. Each Trustee serves an indefinite term, until his successor is elected. |
| *** | The Fund Complex includes all series of the Trust and any other investment companies for which ALPS Advisors, Inc. provides investment advisory services. |
The Statement of Additional Information includes additional information about the Fund’s Trustees and is available, without charge, upon request by calling (toll-free) 1-866-675-2639.
24 | November 30, 2015
| | |
ALPS STOXX Europe 600 ETF | | |
| Trustees & Officers | | November 30, 2015 (Unaudited) |
| | | | | | | | | | |
INTERESTED TRUSTEE |
Name, Address
and Year of
Birth of
Interested
Trustee* | | Position(s) Held
with Trust | | Term of Office
and Length of
Time Served** | | Principal Occupation(s) During Past 5 Years | | Number of
Portfolios in Fund
Complex Overseen
by Trustees*** | | Other Directorships
Held by Trustees |
Thomas A. Carter, 1966 | | Trustee and President | | Since March 2008 | | Mr. Carter joined ALPS Fund Services, Inc. (“ALPS”) in 1994 and is currently President and Director of ALPS Advisors, Inc. (“AAI”), and ALPS Portfolio Solutions Distributor, Inc. (“APSD”) and Executive Vice President and Director of ALPS and ALPS Holdings, Inc. (“AHI”), and ALPS Distributors, Inc. (“ADI”). Because of his position with AHI, ALPS, ADI, APSD and AAI, Mr. Carter is deemed an affiliate of the Fund as defined under the 1940 Act. Before joining ALPS, Mr. Carter was with Deloitte & Touche LLP, where he worked with a diverse group of clients, primarily within the financial services industry. Mr. Carter is a Certified Public Accountant and received his Bachelor of Science in Accounting from the University of Colorado at Boulder. | | 34 | | Mr. Carter is a Trustee of ALPS Variable Investment Trust (9 funds) and Principal Real Estate Income Fund (1 fund) |
| * | The business address of the Trustee is c/o ALPS Advisors, Inc., 1290 Broadway, Suite 1100, Denver, Colorado 80203. |
| ** | This is the period for which the Trustee began serving the Trust. Each Trustee serves an indefinite term, until his successor is elected. |
| *** | The Fund Complex includes all series of the Trust and any other investment companies for which ALPS Advisors, Inc. provides investment advisory services. |
The Statement of Additional Information includes additional information about the Fund’s Trustees and is available, without charge, upon request by calling (toll-free) 1-866-675-2639.
25 | November 30, 2015
| | |
ALPS STOXX Europe 600 ETF | | |
| Trustees & Officers | | November 30, 2015 (Unaudited) |
| | | | | | |
OFFICERS |
Name, Address
and Year of
Birth of Officer* | | Position(s) Held
with Trust | | Length of Time
Served** | | Principal Occupation(s) During Past 5 Years |
Erin D. Nelson, 1977 | | Chief Compliance Officer (“CCO”) | | Since December 2015 | | Erin Nelson became Senior Vice-President and Chief Compliance Officer of ALPS Advisors, Inc. (“AAI”) on July 1, 2015 and prior to that served as Vice President and Deputy Chief Compliance Officer of AAI since January 1, 2015. Prior to January 1, 2015, Ms. Nelson was Vice-President and Assistant General Counsel of ALPS of Fund Services, Inc. Ms. Nelson joined AAI’s parent company, ALPS Holdings, Inc. in January 2003. Ms. Nelson currently is also the Chief Compliance Officer of Principal Real Estate Income Fund, and as of December 2015, the Chief Compliance Officer of Liberty All-Star Equity Fund, Liberty All-Star Growth Fund, Inc., RiverNorth Opportunities Fund, Inc. |
Patrick D. Buchanan, 1972 | | Treasurer | | Since June 2012 | | Mr. Buchanan is Vice President of AAI. Mr. Buchanan joined ALPS in 2007 and because of his position with AAI, he is deemed an affiliate of the Trust as defined under the 1940 Act. Mr. Buchanan is also Treasurer of the ALPS Variable Insurance Trust, Clough Funds Trust and Principal Real Estate Income Fund. |
| William Parmentier, 1952 | | Vice President | | Since March 2008 | | Mr. Parmentier is Chief Investment Officer, AAI (since 2006); President and Chief Executive Officer of the Liberty All-Star Funds (since April 1999); Senior Vice President (2005-2006), Banc of America Investment Advisors, Inc. Because of his position with AAI, Mr. Parmentier is deemed an affiliate of the Trust as defined under the 1940 Act. |
Abigail J. Murray, 1975 | | Secretary | | Since June 2015 | | Ms. Murray joined ALPS in April 2015. She is currently Vice President and Senior Counsel of ALPS. Prior to joining ALPS, Ms. Murray was an Attorney and Managing Member at Murray & Rouvina PLC from 2014 to 2015 and an Associate with Vedder Price P.C. from 2007 to 2014. Because of her position with ALPS, Ms. Murray is deemed an affiliate of the Trust as defined under the 1940 Act. Ms. Murray is also the Secretary of The Caldwell & Orkin Funds, Inc., Clough Global Opportunities Fund, Clough Global Allocation Fund, Clough Global Equity Fund and Clough Funds Trust. |
Jennifer A. Craig, 1973 | | Assistant Secretary | | Since October 2013 | | Ms. Craig joined ALPS in 2007 and is currently Assistant Vice President and Paralegal Manager. Prior to joining ALPS, Ms. Craig was Legal Manager at Janus Capital Management LLC and served as Assistant Secretary of Janus Investment Fund, Janus Adviser Series and Janus Aspen Series. Because of her position with ALPS, Ms. Craig is deemed an affiliate of the Trust as defined under the 1940 Act. |
| * | The business address of the Officer is c/o ALPS Advisors, Inc., 1290 Broadway, Suite 1100, Denver, Colorado 80203. |
| ** | This is the period for which the Officer began serving the Trust. Each Officer serves an indefinite term, until his successor is elected. |
26 | November 30, 2015
Page Intentionally Left Blank.
Page Intentionally Left Blank.
| | |
Barron’s 400SM ETF | | |
| Performance Overview | | November 30, 2015 (Unaudited) |
Investment Objective
The Barron’s 400SM ETF (the “Fund”) seeks investment results that correspond generally, before fees and expenses, to the performance of the Barron’s 400 IndexSM (the “Underlying Index”). The Underlying Index is a rules-based index intended to give investors a means of tracking the overall performance of high performing equity securities of U.S. companies. The Fund will invest at least 80% of its total assets in the equity securities which comprise the Underlying Index.
The Underlying Index generally consists of 400 stocks. The Underlying Index’s stocks are constituents of the MarketGrader U.S. Coverage Universe. In compiling the Underlying Index, MarketGrader Capital, LLC (the “Index Provider”) selects the 400 stocks from the MarketGrader U.S. Coverage Universe by using a methodology that selects components based on the strength of their fundamentals in growth, value, profitability and cash flow and then screens such potential Underlying Index components for certain criteria regarding concentration, market capitalization and liquidity. The eligible stocks that are selected for inclusion in the Underlying Index’s portfolio are equally weighted. The Underlying Index is rebalanced by the Index Provider semiannually, on the third Friday of March and September each year.
Performance Overview
The Barron’s 400 SM ETF (BFOR) had a mostly flat third fiscal year-ended on November 30, 2015, gaining 1.07%. This trailed the total return of its benchmark, the Barron’s 400 Index SM (B400), which gained 1.76% over the same time period. Since its inception date on June 3, 2013, the Barron’s 400 SM ETF has gained 28.14%, on a cumulative basis.
In what turned out to be a relatively difficult year for equally weighted indexes relative to market capitalization weighted benchmarks, the Barron’s 400 trailed the Dow Jones U.S. Total Stock Market Index (DWCF), the broadest measure of the U.S. equity market, by 74 basis points. The Underlying Index nevertheless still maintains a cumulative advantage of 141 basis points over the aforementioned total stock market index in the three-year period ended on November 30. 1
Below we have included two tables with a list of the top ten and bottom ten performing stocks in the Barron’s 400 Index SM during the last fiscal year. As a matter of summary, it is worth mentioning that within the three selection periods that were part of last fiscal year (September 2014, March 2015, September 2015), Underlying Index held 691 stocks, 351 of which had a net positive return compared to 340 with a net negative return.
| | | | |
Top Ten Performers | | | | |
Name | | Sector | | Return (%) |
Omega Protein Corp. | | Consumer Staples | | 149.04 |
Cambrex Corp. | | Materials | | 133.68 |
INSYS Therapeutics Inc. | | Health Care | | 101.58 |
Manhattan Associates Inc. | | Technology | | 96.11 |
Smith & Wesson Holding Inc. | | Industrials | | 84.60 |
Stamps.com Inc. | | Technology | | 71.89 |
Lithia Motors Inc. | | Consumer Discretionary | | 71.55 |
Hawaiian Holdings Inc. | | Industrials | | 69.87 |
Cray Inc. | | Technology | | 66.52 |
MarketAxess Holdings Inc. | | Financials | | 66.30 |
| | |
Bottom Ten Performers | | | | |
Name | | Sector | | Return (%) |
Home Loan Servicing Solutions | | Financials | | -96.52 |
Abraxas Petroleum | | Energy | | -96.52 |
Hi Crush Partners LP | | Materials | | -65.83 |
Fossil Group Inc. | | Consumer Discretionary | | -65.02 |
Alliance Holdings GP LP | | Energy | | -63.23 |
Keurig Green Mountain Inc. | | Consumer Staples | | -62.30 |
Century Aluminum Co. | | Materials | | -60.63 |
Alliance Resource Partners LP | | Energy | | -60.42 |
Zumiez Inc. | | Consumer Discretionary | | -57.22 |
Vantage Drilling Co. | | Energy | | -55.41 |
| 1 | Based on cumulative 3-year performance of 57.16% for the Barron’s 400 IndexSM (total return) vs. 55.75% for the Dow Jones U.S. Total Stock Market Index (total return). Source: Bloomberg |
1 | November 30, 2015
| | |
Barron’s 400SM ETF | | |
| Performance Overview | | November 30, 2015 (Unaudited) |
Performance (as of November 30, 2015)
| | | | |
| | | 1 Year | | Since Inception^ |
Barron’s 400SM ETF – NAV | | 1.07% | | 10.46% |
Barron’s 400SM ETF – Market Price* | | 0.97% | | 10.43% |
Barron’s 400 IndexSM | | 1.76% | | 11.22% |
Total Expense Ratio (per the current prospectus) 0.65%
Performance data quoted represents past performance. Past performance does not guarantee future results. Investment return and principal value of an investment will fluctuate so that an investor’s shares, when sold or redeemed, may be worth more or less than the original cost. Current performance data may be higher or lower than actual data quoted. For the most current month-end performance data please visit www.alpsfunds.com or call 1.855.724.0450.
NAV is an exchange-traded fund’s per-share value. The per-share dollar amount of the fund is derived by dividing the total value of all the securities in its portfolio, less any liabilities, by the number of fund shares outstanding. Market Price is the price at which a share can currently be traded in the market. Information detailing the number of days the Market Price of the Fund was greater than the Fund’s NAV and the number of days it was less than the Fund’s NAV can be obtained at www.alpsfunds.com.
| ^ | The Fund commenced Investment Operations on June 4, 2013. | |
| * | Market Price is based on the midpoint of the bid/ask spread at 4 p.m. ET and does not represent the returns an investor would receive if shares were traded at other times. | |
The Barron’s 400 IndexSM, calculated by NYSE Euronext or its affiliates, measures the performance of a diversified group of U.S. companies selected in part based on fundamentals-related rules-based criteria. The index includes companies that have scored highest according to fundamentals-related rankings calculated by MarketGrader. Additional rules-based screening provides for sector and market cap diversification. The Index has been licensed by MarketGrader Capital LLC for use with the Barron’s 400SM ETF.
One cannot invest directly in an index. Index performance does not reflect fund performance.
Funds that emphasize investments in small/mid cap companies will generally experience greater price volatility.
Barron’s 400SM ETF shares are not individually redeemable. Investors buy and sell shares of the Barron’s 400SM ETF on a secondary market. Only market makers or “authorized participants” may trade directly with the Fund, typically in blocks of 50,000 shares.
The Barron’s 400 SM ETF is not suitable for all investors. Investments in the Fund are subject to investment risks, including possible loss of the principal amount invested.
ALPS Portfolio Solutions Distributor, Inc. is the Distributor for the Fund.
2 | November 30, 2015
| | |
Barron’s 400SM ETF | | |
| Performance Overview | | November 30, 2015 (Unaudited) |
Top 10 Holdings* (as of November 30, 2015)
| | |
Cray, Inc. | | 0.39% |
Omega Protein Corp. | | 0.38% |
Hawaiian Holdings, Inc. | | 0.35% |
Integrated Device Technology, Inc. | | 0.35% |
Matson, Inc. | | 0.33% |
Nexstar Broadcasting Group, Inc., Class A | | 0.33% |
Federated National Holding Co. | | 0.32% |
John Bean Technologies Corp. | | 0.32% |
Lydall, Inc. | | 0.31% |
Sinclair Broadcast Group, Inc., Class A | | 0.31% |
Total % of Top 10 Holdings | | 3.39% |
Future holdings are subject to change.
Sector Allocation* (as of November 30, 2015)
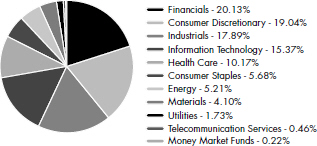
Growth of $10,000 (as of November 30, 2015)
Comparison of change in value of a $10,000 investment in the Fund and the Index
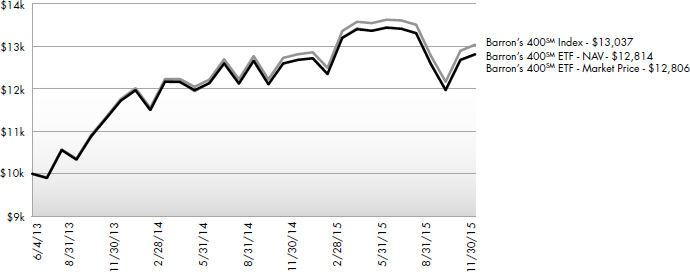
The chart above represents historical performance of a hypothetical investment of $10,000 in the Fund over the life of the Fund. Performance calculations are as of the end of each month. Past performance does not guarantee future results. This chart does not reflect the deduction of taxes that a shareholder would pay on Fund distributions or the redemption of Fund shares.
3 | November 30, 2015
| | |
Barron’s 400SM ETF | | |
| Disclosure of Fund Expenses | | November 30, 2015 (Unaudited) |
Shareholder Expense Example: As a shareholder of the Fund, you incur two types of costs: (1) transaction costs which may include creation and redemption fees or brokerage charges, and (2) ongoing costs, including management fees and other Fund expenses. These examples are intended to help you understand your ongoing costs (in dollars) of investing in the Fund and to compare these costs with the ongoing costs of investing in other funds. It is based on an investment of $1,000 invested at the beginning of the (six month) period and held through November 30, 2015.
Actual Return: The first line of the table provides information about actual account values and actual expenses. You may use the information in this table, together with the amount you invested, to estimate the expenses that you incurred over the period. Simply divide your account value by $1,000 (for example, an $8,600 account value divided by $1,000 = 8.6), then multiply the result by the number in the first line under the heading entitled “Expenses Paid During the Period” to estimate the expenses attributable to your investment during this period.
Hypothetical 5% Return: The second line of the table provides information about hypothetical account values and hypothetical expenses based on the Fund’s actual expense ratio and an assumed rate of return of 5% per year before expenses, which is not the Fund’s actual return. The hypothetical account values and expenses may not be used to estimate the actual ending account balance or expenses you paid for the period. You may use this information to compare ongoing costs of investing in the Fund and other funds. To do so, compare this 5% hypothetical example with the 5% hypothetical examples that appear in the shareholder reports of the other funds.
The expenses shown in the table are meant to highlight ongoing Fund costs only and do not reflect any transaction costs, such as creation and redemption fees, or brokerage charges. Therefore, the second line is useful in comparing ongoing costs only, and will not help you determine the relative total costs of owning different funds. In addition, if these costs were included, your costs would have been higher.
| | | | | | | | |
| | | Beginning Account
Value 6/1/15 | | Ending Account
Value 11/30/15 | | Expense Ratio(a) | | Expenses Paid During Period
6/1/15 - 11/30/15(b) |
Actual | | $ 1,000.00 | | $ 953.70 | | 0.65% | | $ 3.18 |
Hypothetical (5% return before expenses) | | $ 1,000.00 | | $ 1,021.81 | | 0.65% | | $ 3.29 |
| (a) | Annualized, based on the Fund’s most recent fiscal half year expenses. |
| (b) | Expenses are equal to the Fund’s annualized expense ratio multiplied by the average account value over the period, multiplied by the number of days in the most recent fiscal half year (183), divided by 365. | |
4 | November 30, 2015
| | |
Barron’s 400SM ETF | | |
Report of Independent Registered Public Accounting Firm |
To the Board of Trustees and Shareholders of ALPS ETF Trust:
We have audited the accompanying statement of assets and liabilities, including the schedule of investments, of Barron’s 400SM ETF, one of the portfolios constituting the ALPS ETF Trust (the “Trust”), as of November 30, 2015, and the related statement of operations for the year then ended, the statements of changes in net assets for each of the two years in the period then ended, and the financial highlights for each of the periods presented. These financial statements and financial highlights are the responsibility of the Trust’s management. Our responsibility is to express an opinion on these financial statements and financial highlights based on our audits.
We conducted our audits in accordance with the standards of the Public Company Accounting Oversight Board (United States). Those standards require that we plan and perform the audit to obtain reasonable assurance about whether the financial statements and financial highlights are free of material misstatement. The Trust is not required to have, nor were we engaged to perform, an audit of its internal control over financial reporting. Our audits included consideration of internal control over financial reporting as a basis for designing audit procedures that are appropriate in the circumstances, but not for the purpose of expressing an opinion on the effectiveness of the Trust’s internal control over financial reporting. Accordingly, we express no such opinion. An audit also includes examining, on a test basis, evidence supporting the amounts and disclosures in the financial statements, assessing the accounting principles used and significant estimates made by management, as well as evaluating the overall financial statement presentation. Our procedures included confirmation of securities owned as of November 30, 2015, by correspondence with the custodian. We believe that our audits provide a reasonable basis for our opinion.
In our opinion, the financial statements and financial highlights referred to above present fairly, in all material respects, the financial position of Barron’s 400SM ETF of the ALPS ETF Trust as of November 30, 2015, the results of its operations for the year then ended, the changes in its net assets for each of the two years in the period then ended, and the financial highlights for each of the periods presented, in conformity with accounting principles generally accepted in the United States of America.
DELOITTE & TOUCHE LLP
Denver, Colorado
January 28, 2016
5 | November 30, 2015
| | |
Barron’s 400SM ETF | | |
| Schedule of Investments | | November 30, 2015 |
| | | | | | | | |
| Security Description | | Shares | | | Value | |
| |
COMMON STOCKS (97.06%) | | | | | | | | |
Consumer Discretionary (19.02%) | | | | | | | | |
Advance Auto Parts, Inc. | | | 2,827 | | | $ | 460,038 | |
Asbury Automotive Group,
Inc.(a) | | | 6,075 | | | | 456,232 | |
Bed Bath & Beyond, Inc.(a) | | | 8,086 | | | | 440,849 | |
Best Buy Co., Inc. | | | 12,999 | | | | 413,108 | |
Blue Nile, Inc.(a) | | | 15,013 | | | | 547,374 | |
Build-A-Bear Workshop, Inc.(a) | | | 25,925 | | | | 333,395 | |
Capella Education Co. | | | 10,025 | | | | 481,200 | |
Carter’s, Inc. | | | 5,094 | | | | 439,256 | |
Chipotle Mexican Grill, Inc.(a) | | | 683 | | | | 395,833 | |
Chuy’s Holdings, Inc.(a) | | | 16,142 | | | | 536,722 | |
Comcast Corp., Class A | | | 8,683 | | | | 530,010 | |
Cooper Tire & Rubber Co. | | | 12,324 | | | | 517,485 | |
Cracker Barrel Old Country Store, Inc. | | | 3,310 | | | | 416,795 | |
Denny’s Corp.(a) | | | 43,983 | | | | 423,996 | |
Diamond Resorts International, Inc.(a) | | | 19,376 | | | | 544,659 | |
Dick’s Sporting Goods, Inc. | | | 9,842 | | | | 384,133 | |
DISH Network Corp., Class A(a) | | | 8,510 | | | | 533,662 | |
Dollar General Corp. | | | 7,138 | | | | 466,897 | |
Dorman Products, Inc.(a) | | | 9,866 | | | | 470,806 | |
Drew Industries, Inc. | | | 9,093 | | | | 549,490 | |
DSW, Inc., Class A | | | 17,401 | | | | 399,527 | |
Expedia, Inc. | | | 4,208 | | | | 518,047 | |
Express, Inc.(a) | | | 26,389 | | | | 441,752 | |
Fiesta Restaurant Group, Inc.(a) | | | 9,873 | | | | 379,419 | |
Five Below, Inc.(a) | | | 15,810 | | | | 442,838 | |
Foot Locker, Inc. | | | 6,884 | | | | 447,460 | |
Fossil Group, Inc.(a) | | | 8,563 | | | | 329,419 | |
GameStop Corp., Class A | | | 11,630 | | | | 407,399 | |
Gap, Inc. | | | 15,741 | | | | 420,757 | |
Gentex Corp. | | | 31,139 | | | | 521,111 | |
Gentherm, Inc.(a) | | | 10,653 | | | | 541,599 | |
G-III Apparel Group, Ltd.(a) | | | 7,497 | | | | 343,887 | |
GNC Holdings, Inc., Class A | | | 11,163 | | | | 332,769 | |
Goodyear Tire & Rubber Co. | | | 16,872 | | | | 588,495 | |
GoPro, Inc., Class A(a) | | | 14,896 | | | | 303,878 | |
Grand Canyon Education, Inc.(a) | | | 13,407 | | | | 531,185 | |
Gray Television, Inc.(a) | | | 37,600 | | | | 629,800 | |
H&R Block, Inc. | | | 13,957 | | | | 512,082 | |
Harley-Davidson, Inc. | | | 9,094 | | | | 444,878 | |
Helen of Troy, Ltd.(a) | | | 5,549 | | | | 573,822 | |
Home Depot, Inc. | | | 4,304 | | | | 576,220 | |
The Interpublic Group of Cos., Inc. | | | 25,180 | | | | 579,140 | |
Isle of Capri Casinos, Inc.(a) | | | 25,269 | | | | 465,960 | |
Las Vegas Sands Corp. | | | 10,533 | | | | 464,084 | |
Lennar Corp., Class A | | | 9,550 | | | | 489,056 | |
LGI Homes, Inc.(a) | | | 17,212 | | | | 572,471 | |
Lithia Motors, Inc., Class A | | | 4,496 | | | | 558,583 | |
Lowe’s Cos., Inc. | | | 7,201 | | | | 551,597 | |
Macy’s, Inc. | | | 8,747 | | | | 341,833 | |
Nautilus, Inc.(a) | | | 32,326 | | | | 620,982 | |
Nexstar Broadcasting Group, Inc., Class A | | | 11,381 | | | | 666,813 | |
NIKE, Inc., Class B | | | 4,393 | | | | 581,106 | |
| | | | | | | | |
| Security Description | | Shares | | | Value | |
| |
Consumer Discretionary (continued) | | | | | | | | |
Nordstrom, Inc. | | | 6,773 | | | $ | 381,388 | |
Nutrisystem, Inc. | | | 18,060 | | | | 414,296 | |
NVR, Inc.(a) | | | 317 | | | | 533,346 | |
O’Reilly Automotive, Inc.(a) | | | 2,004 | | | | 528,795 | |
Polaris Industries, Inc. | | | 3,872 | | | | 408,225 | |
Pool Corp. | | | 6,926 | | | | 568,209 | |
Popeyes Louisiana Kitchen, Inc.(a) | | | 8,632 | | | | 499,448 | |
Priceline Group, Inc.(a) | | | 379 | | | | 473,314 | |
Ross Stores, Inc. | | | 10,119 | | | | 526,289 | |
Scripps Networks Interactive, Inc., Class A | | | 9,421 | | | | 535,113 | |
Select Comfort Corp.(a) | | | 21,875 | | | | 516,688 | |
Sinclair Broadcast Group, Inc., Class A | | | 18,125 | | | | 636,188 | |
Skechers U.S.A., Inc., Class A(a) | | | 10,722 | | | | 323,804 | |
Smith & Wesson Holding Corp.(a) | | | 27,163 | | | | 498,169 | |
Sonic Corp. | | | 19,758 | | | | 574,167 | |
Starbucks Corp. | | | 8,788 | | | | 539,495 | |
Strayer Education, Inc.(a) | | | 9,272 | | | | 548,810 | |
Thor Industries, Inc. | | | 9,028 | | | | 522,902 | |
TJX Cos., Inc. | | | 7,046 | | | | 497,448 | |
Tractor Supply Co. | | | 5,781 | | | | 516,532 | |
TRI Pointe Group, Inc.(a) | | | 35,094 | | | | 489,561 | |
Tumi Holdings, Inc.(a) | | | 26,072 | | | | 460,432 | |
Ulta Salon Cosmetics & Fragrance, Inc.(a) | | | 3,048 | | | | 509,016 | |
Walt Disney Co. | | | 4,835 | | | | 548,627 | |
Williams-Sonoma, Inc. | | | 6,635 | | | | 420,195 | |
Winnebago Industries, Inc. | | | 24,647 | | | | 554,558 | |
Wyndham Worldwide Corp. | | | 6,375 | | | | 483,990 | |
Zumiez, Inc.(a) | | | 34,946 | | | | 527,335 | |
| | | | | | | | |
Total Consumer Discretionary | | | | | | | 38,956,249 | |
| | | | | | | | |
| | |
Consumer Staples (5.68%) | | | | | | | | |
Altria Group, Inc. | | | 9,242 | | | | 532,339 | |
Boston Beer Co., Inc., Class A(a) | | | 2,252 | | | | 481,072 | |
Cal-Maine Foods, Inc. | | | 8,794 | | | | 479,361 | |
The Clorox Co. | | | 4,481 | | | | 556,988 | |
Coca-Cola Bottling Co. Consolidated | | | 3,038 | | | | 588,370 | |
Coca-Cola Enterprises, Inc. | | | 10,266 | | | | 516,380 | |
CVS Health Corp. | | | 4,921 | | | | 463,017 | |
Dr. Pepper Snapple Group, Inc. | | | 6,511 | | | | 584,362 | |
Estee Lauder Cos., Inc., Class A | | | 6,461 | | | | 543,499 | |
Fresh Market, Inc.(a) | | | 20,629 | | | | 494,683 | |
Hormel Foods Corp. | | | 8,069 | | | | 604,530 | |
Keurig Green Mountain, Inc. | | | 8,603 | | | | 450,797 | |
Kroger Co. | | | 13,457 | | | | 506,791 | |
Mead Johnson Nutrition Co. | | | 6,597 | | | | 531,652 | |
Nu Skin Enterprises, Inc., Class A | | | 11,646 | | | | 406,096 | |
Omega Protein Corp.(a) | | | 31,432 | | | | 772,599 | |
PepsiCo, Inc. | | | 5,432 | | | | 544,069 | |
Pilgrim’s Pride Corp. | | | 23,489 | | | | 505,718 | |
Sanderson Farms, Inc. | | | 7,362 | | | | 550,751 | |
Tyson Foods, Inc., Class A | | | 11,435 | | | | 571,750 | |
USANA Health Sciences, Inc.(a) | | | 3,607 | | | | 483,122 | |
6 | November 30, 2015
| | |
Barron’s 400SM ETF | | |
| Schedule of Investments | | November 30, 2015 |
| | | | | | | | |
| Security Description | | Shares | | | Value | |
| |
Consumer Staples (continued) | | | | | | | | |
Walgreens Boots Alliance, Inc. | | | 5,500 | | | $ | 462,165 | |
| | | | | | | | |
Total Consumer Staples | | | | | | | 11,630,111 | |
| | | | | | | | |
| | |
Energy (2.97%) | | | | | | | | |
Atwood Oceanics, Inc. | | | 30,662 | | | | 486,913 | |
Dril-Quip, Inc.(a) | | | 7,693 | | | | 485,505 | |
Oceaneering International, Inc. | | | 12,111 | | | | 529,735 | |
Phillips 66 | | | 6,313 | | | | 577,829 | |
REX American Resources
Corp.(a) | | | 9,680 | | | | 608,388 | |
Ship Finance International,Ltd. | | | 31,099 | | | | 538,635 | |
Teekay Tankers, Ltd., Class A | | | 77,174 | | | | 543,305 | |
Tesoro Corp. | | | 5,313 | | | | 611,898 | |
US Silica Holdings, Inc. | | | 27,660 | | | | 588,328 | |
Valero Energy Corp. | | | 8,139 | | | | 584,869 | |
Western Refining, Inc. | | | 11,725 | | | | 530,673 | |
| | | | | | | | |
Total Energy | | | | | | | 6,086,078 | |
| | | | | | | | |
| | |
Financials (19.90%) | | | | | | | | |
Affiliated Managers Group, Inc.(a) | | | 2,813 | | | | 498,548 | |
American Equity Investment Life Holding Co. | | | 20,537 | | | | 550,597 | |
American Express Co. | | | 6,537 | | | | 468,311 | |
Ameriprise Financial, Inc. | | | 4,552 | | | | 514,148 | |
AMERISAFE, Inc. | | | 10,458 | | | | 563,059 | |
Apollo Commercial Real Estate Finance, Inc., REIT | | | 30,436 | | | | 534,152 | |
Assured Guaranty, Ltd. | | | 19,719 | | | | 521,370 | |
Banner Corp. | | | 10,628 | | | | 557,970 | |
BBCN Bancorp, Inc. | | | 33,009 | | | | 624,200 | |
Berkshire Hathaway, Inc.,
Class B(a) | | | 3,780 | | | | 506,860 | |
BNC Bancorp | | | 23,055 | | | | 587,903 | |
BofI Holding, Inc.(a) | | | 16,196 | | | | 324,406 | |
Brookline Bancorp, Inc. | | | 47,001 | | | | 551,792 | |
Cardinal Financial Corp. | | | 21,612 | | | | 531,655 | |
Cathay General Bancorp | | | 16,247 | | | | 557,597 | |
CBOE Holdings, Inc. | | | 7,584 | | | | 547,641 | |
CBRE Group, Inc., Class A(a) | | | 15,168 | | | | 568,345 | |
Chemical Financial Corp. | | | 15,307 | | | | 564,063 | |
City Holding Co. | | | 10,260 | | | | 512,179 | |
Cohen & Steers, Inc. | | | 17,185 | | | | 532,048 | |
Columbia Banking System, Inc. | | | 15,971 | | | | 567,609 | |
ConnectOne Bancorp, Inc. | | | 26,321 | | | | 513,523 | |
Cowen Group, Inc.,
Class A(a) | | | 98,441 | | | | 467,595 | |
Credit Acceptance Corp.(a) | | | 2,414 | | | | 483,814 | |
Cullen/Frost Bankers, Inc. | | | 7,912 | | | | 552,178 | |
Customers Bancorp, Inc.(a) | | | 19,248 | | | | 596,688 | |
CVB Financial Corp. | | | 29,381 | | | | 543,549 | |
Diamond Hill Investment Group, Inc. | | | 2,602 | | | | 572,934 | |
Dime Community Bancshares, Inc. | | | 29,261 | | | | 541,621 | |
East West Bancorp, Inc. | | | 12,418 | | | | 538,693 | |
Everest Re Group, Ltd. | | | 2,830 | | | | 521,965 | |
FactSet Research Systems,Inc. | | | 3,006 | | | | 509,607 | |
Federated National Holding Co. | | | 23,045 | | | | 658,857 | |
Fidelity Southern Corp. | | | 24,477 | | | | 553,670 | |
First American Financial Corp. | | | 12,648 | | | | 498,837 | |
| | | | | | | | |
| Security Description | | Shares | | | Value | |
| |
Financials (continued) | | | | | | | | |
First Financial Bankshares, Inc. | | | 16,153 | | | $ | 580,054 | |
First Interstate BancSystem, Inc.,Class A | | | 18,204 | | | | 553,584 | |
First Merchants Corp. | | | 19,066 | | | | 518,595 | |
First Republic Bank | | | 7,876 | | | | 542,341 | |
Franklin Resources, Inc. | | | 12,677 | | | | 531,420 | |
Glacier Bancorp, Inc. | | | 18,440 | | | | 541,767 | |
Hanmi Financial Corp. | | | 19,535 | | | | 509,864 | |
HCI Group, Inc. | | | 13,013 | | | | 509,199 | |
Heritage Insurance Holdings, Inc. | | | 25,606 | | | | 575,111 | |
HFF, Inc., Class A | | | 14,079 | | | | 483,895 | |
Home BancShares, Inc. | | | 12,753 | | | | 575,415 | |
Huntington Bancshares, Inc. | | | 45,713 | | | | 534,385 | |
Jones Lang LaSalle, Inc. | | | 3,348 | | | | 556,170 | |
JPMorgan Chase & Co. | | | 7,865 | | | | 524,438 | |
LegacyTexas Financial Group, Inc. | | | 16,702 | | | | 509,578 | |
LendingTree, Inc.(a) | | | 4,317 | | | | 439,816 | |
Marcus & Millichap, Inc.(a) | | | 11,091 | | | | 363,896 | |
MarketAxess Holdings, Inc. | | | 5,140 | | | | 548,849 | |
MB Financial, Inc. | | | 14,968 | | | | 534,956 | |
Morningstar, Inc. | | | 6,168 | | | | 498,066 | |
National General Holdings Corp. | | | 25,384 | | | | 556,163 | |
NorthStar Asset Management Group, Inc. | | | 29,909 | | | | 406,762 | |
Oritani Financial Corp. | | | 31,853 | | | | 552,331 | |
PacWest Bancorp | | | 11,286 | | | | 530,668 | |
PRA Group, Inc.(a) | | | 9,185 | | | | 379,432 | |
PrivateBancorp, Inc. | | | 12,744 | | | | 562,138 | |
Progressive Corp. | | | 16,353 | | | | 503,999 | |
Provident Financial Services, Inc. | | | 25,606 | | | | 534,653 | |
S&T Bancorp, Inc. | | | 15,770 | | | | 534,918 | |
SEI Investments Co. | | | 9,902 | | | | 538,570 | |
Selective Insurance Group, Inc. | | | 15,760 | | | | 543,878 | |
ServisFirst Bancshares, Inc. | | | 11,964 | | | | 588,868 | |
SunTrust Banks, Inc. | | | 12,464 | | | | 541,187 | |
T Rowe Price Group, Inc. | | | 7,048 | | | | 536,705 | |
TriCo Bancshares | | | 20,255 | | | | 593,472 | |
Umpqua Holdings Corp. | | | 29,696 | | | | 532,152 | |
Union Bankshares Corp. | | | 20,672 | | | | 555,043 | |
Universal Insurance Holdings, Inc. | | | 18,093 | | | | 357,337 | |
US Bancorp | | | 11,907 | | | | 522,598 | |
Waddell & Reed Financial, Inc., Class A | | | 13,205 | | | | 493,867 | |
Walker & Dunlop, Inc.(a) | | | 20,872 | | | | 616,559 | |
WisdomTree Investments, Inc. | | | 27,356 | | | | 594,993 | |
| | | | | | | | |
Total Financials | | | | | | | 40,745,676 | |
| | | | | | | | |
| | |
Health Care (10.16%) | | | | | | | | |
ABIOMED, Inc.(a) | | | 4,986 | | | | 406,708 | |
Aceto Corp. | | | 17,322 | | | | 488,654 | |
Aetna, Inc. | | | 4,253 | | | | 436,996 | |
Air Methods Corp.(a) | | | 13,965 | | | | 610,270 | |
Align Technology, Inc.(a) | | | 8,847 | | | | 590,449 | |
AMAG Pharmaceuticals, Inc.(a) | | | 9,877 | | | | 262,926 | |
Amgen, Inc. | | | 3,287 | | | | 529,536 | |
AMN Healthcare Services, Inc.(a) | | | 14,079 | | | | 415,330 | |
7 | November 30, 2015
| | |
Barron’s 400SM ETF | | |
| Schedule of Investments | | November 30, 2015 |
| | | | | | | | |
| Security Description | | Shares | | | Value | |
| |
Health Care (continued) | | | | | |
ANI Pharmaceuticals, Inc.(a) | | | 9,381 | | | $ | 411,075 | |
Anika Therapeutics, Inc.(a) | | | 14,012 | | | | 587,943 | |
Atrion Corp. | | | 1,298 | | | | 546,328 | |
Biogen, Inc.(a) | | | 1,563 | | | | 448,362 | |
BioSpecifics Technologies Corp.(a) | | | 9,395 | | | | 455,188 | |
Cambrex Corp.(a) | | | 10,635 | | | | 570,355 | |
Centene Corp.(a) | | | 7,897 | | | | 456,052 | |
Charles River Laboratories International, Inc.(a) | | | 7,045 | | | | 539,436 | |
Chemed Corp. | | | 3,544 | | | | 547,513 | |
Cigna Corp. | | | 3,554 | | | | 479,719 | |
Concert Pharmaceuticals, Inc.(a) | | | 25,871 | | | | 593,222 | |
Enanta Pharmaceuticals, Inc.(a) | | | 11,881 | | | | 374,251 | |
Gilead Sciences, Inc. | | | 4,502 | | | | 477,032 | |
Globus Medical, Inc., Class A(a) | | | 20,758 | | | | 563,165 | |
Illumina, Inc.(a) | | | 2,430 | | | | 446,877 | |
Johnson & Johnson | | | 5,297 | | | | 536,268 | |
Lannett Co., Inc.(a) | | | 8,928 | | | | 329,979 | |
Ligand Pharmaceuticals, Inc.(a) | | | 5,144 | | | | 550,820 | |
LivaNova PLC(a) | | | 7,405 | | | | 443,189 | |
Luminex Corp.(a) | | | 26,459 | | | | 569,398 | |
Masimo Corp.(a) | | | 11,981 | | | | 496,972 | |
McKesson Corp. | | | 2,495 | | | | 472,428 | |
MiMedx Group, Inc.(a) | | | 48,365 | | | | 433,350 | |
Molina Healthcare, Inc.(a) | | | 6,185 | | | | 372,708 | |
NewLink Genetics Corp.(a) | | | 9,443 | | | | 345,614 | |
PDL BioPharma, Inc. | | | 92,956 | | | | 351,838 | |
Prestige Brands Holdings,
Inc.(a) | | | 10,729 | | | | 545,999 | |
ResMed, Inc. | | | 9,825 | | | | 585,275 | |
Sucampo Pharmaceuticals, Inc., Class A(a) | | | 18,688 | | | | 320,499 | |
Supernus Pharmaceuticals,
Inc.(a) | | | 24,731 | | | | 399,653 | |
UnitedHealth Group, Inc. | | | 4,166 | | | | 469,550 | |
Universal Health Services, Inc., Class B | | | 3,696 | | | | 449,138 | |
Vanda Pharmaceuticals, Inc.(a) | | | 36,344 | | | | 358,352 | |
Varian Medical Systems, Inc.(a) | | | 6,342 | | | | 512,307 | |
Vascular Solutions, Inc.(a) | | | 14,198 | | | | 504,597 | |
Waters Corp.(a) | | | 4,011 | | | | 532,741 | |
| | | | | | | | |
Total Health Care | | | | | | | 20,818,062 | |
| | | | | | | | |
| |
Industrials (17.87%) | | | | | |
AAON, Inc. | | | 24,609 | | | | 608,088 | |
Alaska Air Group, Inc. | | | 6,272 | | | | 500,066 | |
Allegiant Travel Co. | | | 2,339 | | | | 409,629 | |
AMERCO | | | 1,315 | | | | 533,101 | |
American Woodmark Corp.(a) | | | 7,270 | | | | 596,213 | |
AO Smith Corp. | | | 7,170 | | | | 571,879 | |
Argan, Inc. | | | 12,949 | | | | 509,025 | |
Boeing Co. | | | 3,669 | | | | 533,656 | |
CEB, Inc. | | | 7,043 | | | | 544,213 | |
CLARCOR, Inc. | | | 9,040 | | | | 477,583 | |
Covenant Transportation Group, Inc., Class A(a) | | | 22,475 | | | | 472,200 | |
Cummins, Inc. | | | 4,108 | | | | 412,320 | |
Delta Air Lines, Inc. | | | 10,665 | | | | 495,496 | |
| | | | | | | | |
| Security Description | | Shares | | | Value | |
| |
Industrials (continued) | | | | | |
Deluxe Corp. | | | 8,488 | | | $ | 497,821 | |
Douglas Dynamics, Inc. | | | 23,347 | | | | 543,051 | |
Dycom Industries, Inc.(a) | | | 6,452 | | | | 563,776 | |
Emerson Electric Co. | | | 10,796 | | | | 539,800 | |
Expeditors International of Washington, Inc. | | | 10,144 | | | | 492,390 | |
Fastenal Co. | | | 12,929 | | | | 524,659 | |
General Dynamics Corp. | | | 3,526 | | | | 516,418 | |
Global Brass & Copper Holdings, Inc. | | | 23,995 | | | | 558,124 | |
Graco, Inc. | | | 7,149 | | | | 539,463 | |
Greenbrier Cos., Inc. | | | 12,616 | | | | 427,430 | |
H&E Equipment Services, Inc. | | | 24,682 | | | | 493,887 | |
Hawaiian Holdings, Inc.(a) | | | 19,995 | | | | 723,819 | |
Herman Miller, Inc. | | | 18,171 | | | | 576,202 | |
Hexcel Corp. | | | 10,619 | | | | 500,049 | |
JB Hunt Transport Services, Inc. | | | 6,408 | | | | 501,362 | |
John Bean Technologies Corp. | | | 13,300 | | | | 650,370 | |
Knight Transportation, Inc. | | | 17,931 | | | | 475,530 | |
Knoll, Inc. | | | 21,326 | | | | 475,143 | |
Korn/Ferry International | | | 14,752 | | | | 542,873 | |
Landstar System, Inc. | | | 7,347 | | | | 458,600 | |
Lennox International, Inc. | | | 4,059 | | | | 551,699 | |
Lincoln Electric Holdings, Inc. | | | 8,635 | | | | 487,446 | |
Lockheed Martin Corp. | | | 2,405 | | | | 527,080 | |
Lydall, Inc.(a) | | | 17,671 | | | | 643,578 | |
ManpowerGroup, Inc. | | | 5,647 | | | | 509,811 | |
Matson, Inc. | | | 13,205 | | | | 682,830 | |
MYR Group, Inc.(a) | | | 18,625 | | | | 394,850 | |
Old Dominion Freight Line, Inc.(a) | | | 7,307 | | | | 465,529 | |
PACCAR, Inc. | | | 8,582 | | | | 445,921 | |
Patrick Industries, Inc.(a) | | | 10,905 | | | | 451,794 | |
Pitney Bowes, Inc. | | | 23,985 | | | | 518,076 | |
Proto Labs, Inc.(a) | | | 7,091 | | | | 479,990 | |
Raytheon Co. | | | 4,717 | | | | 585,049 | |
Robert Half International, Inc. | | | 9,572 | | | | 489,895 | |
Rockwell Automation, Inc. | | | 4,693 | | | | 499,523 | |
Rockwell Collins, Inc. | | | 5,878 | | | | 544,773 | |
RR Donnelley & Sons Co. | | | 32,729 | | | | 526,610 | |
Snap-on, Inc. | | | 3,154 | | | | 542,993 | |
Southwest Airlines Co. | | | 12,855 | | | | 589,787 | |
Spirit AeroSystems Holdings, Inc., Class A(a) | | | 9,737 | | | | 510,706 | |
Spirit Airlines, Inc.(a) | | | 10,169 | | | | 373,914 | |
Standex International Corp. | | | 6,505 | | | | 581,352 | |
Swift Transportation Co.(a) | | | 24,967 | | | | 398,723 | |
TASER International, Inc.(a) | | | 20,715 | | | | 387,370 | |
Team, Inc.(a) | | | 11,772 | | | | 449,455 | |
Toro Co. | | | 6,975 | | | | 537,563 | |
Trex Co., Inc.(a) | | | 13,464 | | | | 582,991 | |
Trinity Industries, Inc. | | | 18,611 | | | | 505,289 | |
TrueBlue, Inc.(a) | | | 20,189 | | | | 591,336 | |
UniFirst Corp. | | | 4,546 | | | | 493,605 | |
Union Pacific Corp. | | | 5,684 | | | | 477,172 | |
United Parcel Service, Inc.,
Class B | | | 4,974 | | | | 512,372 | |
United Rentals, Inc.(a) | | | 7,161 | | | | 563,356 | |
8 | November 30, 2015
| | |
Barron’s 400SM ETF | | |
| Schedule of Investments | | November 30, 2015 |
| | | | | | | | |
| Security Description | | Shares | | | Value | |
| |
Industrials (continued) | | | | | | | | |
Verisk Analytics, Inc.(a) | | | 6,774 | | | $ | 507,711 | |
Virgin America, Inc.(a) | | | 14,059 | | | | 511,607 | |
Wabash National Corp.(a) | | | 42,309 | | | | 548,748 | |
Wabtec Corp. | | | 5,224 | | | | 418,547 | |
WW Grainger, Inc. | | | 2,252 | | | | 451,616 | |
| | | | | | | | |
Total Industrials | | | | | | | 36,604,903 | |
| | | | | | | | |
| | |
Information Technology (15.36%) | | | | | | | | |
Alliance Data Systems Corp.(a) | | | 1,950 | | | | 559,358 | |
Alphabet, Inc., Class A(a) | | | 752 | | | | 573,663 | |
Ambarella, Inc.(a) | | | 7,007 | | | | 440,110 | |
Amdocs, Ltd. | | | 8,664 | | | | 490,122 | |
Amphenol Corp., Class A | | | 9,565 | | | | 526,553 | |
Apple, Inc. | | | 4,300 | | | | 508,690 | |
Applied Materials, Inc. | | | 31,411 | | | | 589,584 | |
Arista Networks, Inc.(a) | | | 7,875 | | | | 578,970 | |
Broadcom Corp., Class A | | | 9,295 | | | | 507,786 | |
Broadridge Financial Solutions, Inc. | | | 9,459 | | | | 520,056 | |
Brocade Communications Systems, Inc. | | | 48,317 | | | | 453,455 | |
CDW Corp. | | | 12,032 | | | | 519,421 | |
Cirrus Logic, Inc.(a) | | | 16,374 | | | | 541,324 | |
Cisco Systems, Inc. | | | 19,248 | | | | 524,508 | |
Cognex Corp. | | | 13,254 | | | | 491,723 | |
Cognizant Technology Solutions Corp., Class A(a) | | | 7,967 | | | | 514,509 | |
Cray, Inc.(a) | | | 23,313 | | | | 808,262 | |
DST Systems, Inc. | | | 4,642 | | | | 567,624 | |
Ellie Mae, Inc.(a) | | | 6,702 | | | | 427,856 | |
EVERTEC, Inc. | | | 27,163 | | | | 466,660 | |
F5 Networks, Inc.(a) | | | 4,231 | | | | 435,793 | |
FleetCor Technologies, Inc.(a) | | | 3,258 | | | | 500,787 | |
Global Payments, Inc. | | | 8,740 | | | | 619,229 | |
GrubHub, Inc.(a) | | | 17,969 | | | | 460,725 | |
II-VI, Inc.(a) | | | 29,998 | | | | 558,563 | |
Integrated Device Technology, Inc.(a) | | | 25,476 | | | | 714,347 | |
Intel Corp. | | | 16,821 | | | | 584,866 | |
IPG Photonics Corp.(a) | | | 6,140 | | | | 559,907 | |
Jack Henry & Associates, Inc. | | | 7,186 | | | | 570,425 | |
Lam Research Corp. | | | 6,756 | | | | 528,319 | |
Linear Technology Corp. | | | 12,215 | | | | 558,470 | |
Manhattan Associates, Inc.(a) | | | 8,004 | | | | 613,106 | |
Mastercard, Inc., Class A | | | 5,429 | | | | 531,608 | |
MAXIMUS, Inc. | | | 7,899 | | | | 448,268 | |
Mentor Graphics Corp. | | | 19,845 | | | | 371,697 | |
Methode Electronics, Inc. | | | 15,307 | | | | 552,277 | |
Microchip Technology, Inc. | | | 11,362 | | | | 548,557 | |
Micron Technology, Inc.(a) | | | 30,271 | | | | 482,217 | |
MKS Instruments, Inc. | | | 14,466 | | | | 533,361 | |
NeuStar, Inc., Class A(a) | | | 17,796 | | | | 448,459 | |
NIC, Inc. | | | 27,133 | | | | 553,785 | |
OSI Systems, Inc.(a) | | | 6,576 | | | | 615,711 | |
Paychex, Inc. | | | 10,879 | | | | 590,186 | |
Paycom Software, Inc.(a) | | | 12,318 | | | | 537,065 | |
Qualys, Inc.(a) | | | 15,671 | | | | 602,707 | |
| | | | | | | | |
| Security Description | | Shares | | | Value | |
| |
Information Technology (continued) | |
Skyworks Solutions, Inc. | | | 5,456 | | | $ | 452,957 | |
SS&C Technologies Holdings, Inc. | | | 7,101 | | | | 510,562 | |
Super Micro Computer,
Inc.(a) | | | 17,860 | | | | 438,642 | |
Synaptics, Inc.(a) | | | 6,668 | | | | 598,586 | |
Synchronoss Technologies, Inc.(a) | | | 12,363 | | | | 486,731 | |
Syntel, Inc.(a) | | | 11,337 | | | | 549,051 | |
Tessera Technologies, Inc. | | | 14,500 | | | | 461,825 | |
Texas Instruments, Inc. | | | 10,353 | | | | 601,716 | |
Total System Services, Inc. | | | 10,530 | | | | 589,259 | |
Ubiquiti Networks, Inc.(a) | | | 14,143 | | | | 493,449 | |
Vantiv, Inc., Class A(a) | | | 10,862 | | | | 572,536 | |
VASCO Data Security International, Inc.(a) | | | 28,790 | | | | 537,797 | |
Virtusa Corp.(a) | | | 9,471 | | | | 466,447 | |
Visa, Inc., Class A | | | 7,092 | | | | 560,339 | |
| | | | | | | | |
Total Information Technology | | | | | | | 31,450,566 | |
| | | | | | | | |
| | |
Materials (3.91%) | | | | | | | | |
Alcoa, Inc. | | | 51,930 | | | | 486,065 | |
Avery Dennison Corp. | | | 8,442 | | | | 556,834 | |
Compass Minerals International, Inc. | | | 6,026 | | | | 507,028 | |
Dow Chemical Co. | | | 11,467 | | | | 597,775 | |
Eagle Materials, Inc. | | | 6,162 | | | | 425,671 | |
Eastman Chemical Co. | | | 7,126 | | | | 517,704 | |
Innospec, Inc. | | | 10,304 | | | | 601,754 | |
International Paper Co. | | | 12,167 | | | | 508,946 | |
Martin Marietta Materials, Inc. | | | 2,856 | | | | 449,534 | |
Monsanto Co. | | | 5,503 | | | | 523,665 | |
Neenah Paper, Inc. | | | 8,781 | | | | 583,673 | |
Packaging Corp. of America | | | 7,550 | | | | 513,324 | |
Sherwin-Williams Co. | | | 1,995 | | | | 550,760 | |
U.S. Concrete, Inc.(a) | | | 9,882 | | | | 580,370 | |
Westlake Chemical Corp. | | | 9,898 | | | | 594,375 | |
| | | | | | | | |
Total Materials | | | | | | | 7,997,478 | |
| | | | | | | | |
| |
Telecommunication Services (0.46%) | | | | | |
Inteliquent, Inc. | | | 23,237 | | | | 446,383 | |
Verizon Communications, Inc. | | | 10,785 | | | | 490,178 | |
| | | | | | | | |
Total Telecommunication Services | | | | 936,561 | |
| | | | | | | | |
| | |
Utilities (1.73%) | | | | | | | | |
AES Corp. | | | 44,972 | | | | 449,270 | |
Calpine Corp.(a) | | | 31,671 | | | | 468,098 | |
Edison International | | | 8,452 | | | | 501,711 | |
PPL Corp. | | | 16,625 | | | | 565,915 | |
Public Service Enterprise Group, Inc. | | | 12,632 | | | | 493,911 | |
Questar Corp. | | | 26,557 | | | | 503,255 | |
SCANA Corp. | | | 9,591 | | | | 567,212 | |
| | | | | | | | |
Total Utilities | | | | | | | 3,549,372 | |
| | | | | | | | |
| | |
TOTAL COMMON STOCKS (Cost $191,505,563) | | | | | | | 198,775,056 | |
| | | | | | | | |
9 | November 30, 2015
| | |
Barron’s 400SM ETF | | |
| Schedule of Investments | | November 30, 2015 |
| | | | | | | | | | |
| Security Description | | Shares | | | Value | |
| |
LIMITED PARTNERSHIPS (2.65%) | |
Energy (2.24%) | | | | | | | | |
Alliance Holdings GP LP | | | 14,231 | | | $ | 339,409 | |
Alliance Resource Partners LP | | | 20,271 | | | | 347,648 | |
Alon U.S.A. Partners LP | | | 20,596 | | | | 522,932 | |
EQT Midstream Partners LP | | | 6,912 | | | | 467,597 | |
Golar LNG Partners LP | | | 27,178 | | | | 389,733 | |
Magellan Midstream Partners LP | | | 7,748 | | | | 484,482 | |
Northern Tier Energy LP | | | 20,344 | | | | 551,729 | |
Spectra Energy Partners LP | | | 11,355 | | | | 481,111 | |
Tallgrass Energy Partners LP | | | 11,630 | | | | 500,672 | |
Valero Energy Partners LP | | | 10,544 | | | | 488,504 | |
| | | | | | | | | | |
Total Energy | | | | | | | 4,573,817 | |
| | | | | | | | | | |
| | |
Financials (0.22%) | | | | | | | | |
Blackstone Group LP | | | 14,416 | | | | 450,212 | |
| | | | | | | | | | |
Total Financials | | | | | | | 450,212 | |
| | | | | | | | | | |
| | |
Materials (0.19%) | | | | | | | | |
CVR Partners LP | | | 45,754 | | | | 395,314 | |
| | | | | | | | | | |
Total Materials | | | | | | | 395,314 | |
| | | | | | | | | | |
| |
TOTAL LIMITED PARTNERSHIPS (Cost $6,885,851) | | | | 5,419,343 | |
| | | | | | | | | | |
| | | |
| | | 7 Day Yield | | Shares | | | Value | |
| |
SHORT TERM INVESTMENTS (0.22%) | |
Morgan Stanley Institutional Liquidity Funds, Prime Portfolio | | 0.105% | | | 457,136 | | | | 457,136 | |
| | | | | | | | | | |
| |
TOTAL SHORT TERM INVESTMENTS (Cost $457,136) | | | | 457,136 | |
| | | | | | | | | | |
| |
TOTAL INVESTMENTS (99.93%) (Cost $198,848,550) | | | $ | 204,651,535 | |
| |
NET OTHER ASSETS AND
LIABILITIES (0.07%) | | | | 153,183 | |
| | | | | | | | | | |
| |
NET ASSETS (100.00%) | | | $ | 204,804,718 | |
| | | | | | | | | | |
| (a) | Non-income producing security. |
Common Abbreviations:
LP - Limited Partnership.
Ltd. - Limited.
REIT - Real Estate Investment Trust.
See Notes to Financial Statements.
10 | November 30, 2015
| | |
Barron’s 400SM ETF | | |
| Statement of Assets and Liabilities | | November 30, 2015 |
| | | | |
ASSETS: | | | | |
Investments, at value | | $ | 204,651,535 | |
Foreign tax reclaims | | | 202 | |
Dividends receivable | | | 261,549 | |
| |
Total Assets | | | 204,913,286 | |
| |
| |
LIABILITIES: | | | | |
Payable to adviser | | | 108,568 | |
| |
Total Liabilities | | | 108,568 | |
| |
NET ASSETS | | $ | 204,804,718 | |
| |
| |
NET ASSETS CONSIST OF: | | | | |
Paid-in capital | | $ | 219,038,127 | |
Accumulated net investment income | | | 1,291,721 | |
Accumulated net realized loss on investments | | | (21,328,115) | |
Net unrealized appreciation on investments | | | 5,802,985 | |
| |
NET ASSETS | | $ | 204,804,718 | |
| |
| |
INVESTMENTS, AT COST | | $ | 198,848,550 | |
| |
PRICING OF SHARES | | | | |
Net Assets | | $ | 204,804,718 | |
Shares of beneficial interest outstanding (Unlimited number of shares authorized, par value $0.01 per share) | | | 6,450,000 | |
Net Asset Value, offering and redemption price per share | | $ | 31.75 | |
See Notes to Financial Statements.
11 | November 30, 2015
| | |
Barron’s 400SM ETF | | |
| Statement of Operations | | For the Year Ended November 30, 2015 |
| | | | |
INVESTMENT INCOME: | | | | |
Dividends(a) | | $ | 3,465,852 | |
Total investment income | | | 3,465,852 | |
| |
EXPENSES: | | | | |
Investment adviser fees | | | 1,368,871 | |
Total expenses | | | 1,368,871 | |
NET INVESTMENT INCOME | | | 2,096,981 | |
| |
REALIZED AND UNREALIZED GAIN/(LOSS) | | | | |
Net realized gain on investments | | | 5,240,912 | |
Long-term capital gain distributions from other investment companies | | | 3,315 | |
Net change in unrealized depreciation on investments | | | (4,541,491) | |
NET REALIZED AND UNREALIZED GAIN ON INVESTMENTS | | | 702,736 | |
NET INCREASE IN NET ASSETS RESULTING FROM OPERATIONS | | $ | 2,799,717 | |
| | | | | |
| (a) | Net of foreign tax withholding of $932. |
See Notes to Financial Statements.
12 | November 30, 2015
| | |
Barron’s 400SM ETF | | |
| Statements of Changes in Net Assets | | |
| | | | | | | | |
| | | For the
Year Ended
November 30,
2015 | | | For the
Year Ended
November 30,
2014 | |
OPERATIONS: | | | | | | | | |
Net investment income | | $ | 2,096,981 | | | $ | 1,709,127 | |
Net realized gain on investments | | | 5,240,912 | | | | 17,568,969 | |
Long-term capital gain distributions from other investment companies | | | 3,315 | | | | – | |
Net change in unrealized depreciation on investments | | | (4,541,491) | | | | (2,498,910) | |
Net Increase in Net Assets Resulting from Operations | | | 2,799,717 | | | | 16,779,186 | |
| | |
DISTRIBUTIONS TO SHAREHOLDERS: | | | | | | | | |
From net investment income | | | (1,549,998) | | | | (356,623) | |
Total distributions | | | (1,549,998) | | | | (356,623) | |
| | |
CAPITAL SHARE TRANSACTIONS: | | | | | | | | |
Proceeds from sale of shares | | | 89,473,920 | | | | 186,188,412 | |
Cost of shares redeemed | | | (105,819,769) | | | | (164,362,020) | |
Net Increase/(Decrease) from share transactions | | | (16,345,849) | | | | 21,826,392 | |
| | |
Net increase/(decrease) in net assets | | | (15,096,130) | | | | 38,248,955 | |
| | |
NET ASSETS | | | | | | | | |
Beginning of period | | | 219,900,848 | | | | 181,651,893 | |
End of period * | | $ | 204,804,718 | | | $ | 219,900,848 | |
| | | | | | | | | |
| | |
*Including accumulated net investment income of: | | $ | 1,291,721 | | | $ | 1,213,185 | |
| | |
OTHER INFORMATION: | | | | | | | | |
CAPITAL SHARE TRANSACTIONS: | | | | | | | | |
Beginning shares | | | 6,950,002 | | | | 6,200,002 | |
Shares sold | | | 2,700,000 | | | | 6,100,000 | |
Shares redeemed | | | (3,200,002) | | | | (5,350,000) | |
Shares outstanding, end of period | | | 6,450,000 | | | | 6,950,002 | |
| | | | | | | | | |
See Notes to Financial Statements.
13 | November 30, 2015
| | |
Barron’s 400SM ETF | | |
| Financial Highlights | | For a Share Outstanding Throughout the Periods Presented |
| | | | | | |
| | | For the Year
Ended
November 30,
2015 | | For the Year
Ended
November 30,
2014 | | For the Period
June 4, 2013
(Commencement)
to November 30,
2013 |
NET ASSET VALUE, BEGINNING OF PERIOD | | $31.64 | | $29.30 | | $25.00 |
| | | |
INCOME/(LOSS) FROM INVESTMENT OPERATIONS: | | | | | | |
Net investment income(a) | | 0.32 | | 0.23 | | 0.10 |
Net realized and unrealized gain | | 0.02 | | 2.16 | | 4.20 |
Total from investment operations | | 0.34 | | 2.39 | | 4.30 |
| | | |
DISTRIBUTIONS: | | | | | | |
From net investment income | | (0.23) | | (0.05) | | – |
Total distributions | | (0.23) | | (0.05) | | – |
| | | |
NET INCREASE IN NET ASSET VALUE | | 0.11 | | 2.34 | | 4.30 |
NET ASSET VALUE, END OF PERIOD | | $31.75 | | $31.64 | | $29.30 |
| | | | | | | |
TOTAL RETURN(b) | | 1.07% | | 8.18% | | 17.20% |
| | | |
RATIOS/SUPPLEMENTAL DATA: | | | | | | |
Net assets, end of period (000s) | | $204,805 | | $219,901 | | $181,652 |
| | | |
Ratio of expenses to average net assets | | 0.65% | | 0.65% | | 0.65%(c) |
Ratio of net investment income to average net assets | | 1.00% | | 0.75% | | 0.78%(c) |
Portfolio turnover rate(d) | | 87% | | 55% | | 11% |
| (a) | Based on average shares outstanding during the period. |
| (b) | Total return is calculated assuming an initial investment made at the net asset value at the beginning of the period and redemption at the net asset value on the last day of the period and assuming all distributions are reinvested at actual reinvestment prices. Total return calculated for a period less than one year is not annualized. | |
| (d) | Portfolio turnover is not annualized and does not include securities received or delivered from processing creations or redemptions. | |
See Notes to Financial Statements.
14 | November 30, 2015
| | |
Barron’s 400SM ETF | | |
| Notes to Financial Statements | | November 30, 2015 |
1. ORGANIZATION
The ALPS ETF Trust (the “Trust”), a Delaware statutory trust, is an open-end management investment company registered under the Investment Company Act of 1940, as amended (the “1940 Act”). As of November 30, 2015, the Trust consisted of twenty-one separate portfolios. Each portfolio represents a separate series of the Trust. This report pertains solely to the Barron’s 400SM ETF (the “Fund”). The investment objective of the Fund is to seek investment results that correspond generally, before fees and expenses, to the performance of the Barron’s 400 IndexSM. The Fund has elected to qualify as a diversified series of the Trust under the 1940 Act.
The Fund’s Shares (“Shares”) are listed on the New York Stock Exchange (“NYSE”) Arca. The Fund issues and redeems Shares at net asset value (“NAV”) in blocks of 50,000 Shares, each of which is called a “Creation Unit”. Creation Units are issued and redeemed principally in-kind for securities included in a specified index. Except when aggregated in Creation Units, Shares are not redeemable securities of the Fund.
Pursuant to the Trust’s organizational documents, its Officers and Trustees are indemnified against certain liability arising out of the performance of their duties to the Trust. Additionally, in the normal course of business, the Trust enters into contracts with service providers that contain general indemnification clauses. The Trust’s maximum exposure under these arrangements is unknown, as this would involve future claims that may be made against the Trust that have not yet occurred.
2. SIGNIFICANT ACCOUNTING POLICIES
The following is a summary of significant accounting policies consistently followed by the Fund in the preparation of the financial statements. The accompanying financial statements were prepared in accordance with accounting principles generally accepted in the United States of America (“U.S. GAAP”). The preparation of financial statements in conformity with U.S. GAAP requires management to make certain estimates and assumptions that affect the reported amounts of assets and liabilities and disclosures of contingent assets and liabilities at the date of the financial statements and the reported amounts of revenue and expenses during the period. Actual results could differ from those estimates. The Fund is considered an investment company under U.S. GAAP and follows the accounting and reporting guidance applicable to investment companies in the Financial Accounting Standards Board Accounting Standards Codification Topic 946.
A. Portfolio Valuation
The Fund’s NAV is determined daily, as of the close of regular trading on the NYSE, normally 4:00 p.m. Eastern time, on each day the NYSE is open for trading. The NAV is computed by dividing the value of all assets of the Fund (including accrued interest and dividends), less all liabilities (including accrued expenses and dividends declared but unpaid), by the total number of shares outstanding.
Portfolio securities listed on any exchange other than the NASDAQ Stock Market LLC (“NASDAQ”) are valued at the last sale price on the business day as of which such value is being determined. If there has been no sale on such day, the securities are valued at the mean of the most recent bid and ask prices on such day. Securities traded on the NASDAQ are valued at the NASDAQ Official Closing Price as determined by NASDAQ. Portfolio securities traded on more than one securities exchange are valued at the last sale price on the business day as of which such value is being determined at the close of the exchange representing the principal market for such securities. Portfolio securities traded in the over-the-counter market, but excluding securities traded on the NASDAQ, are valued at the latest quoted sale price in such market.
The Fund’s investments are valued at market value or, in the absence of market value with respect to any portfolio securities, at fair value according to procedures adopted by the Trust’s Board of Trustees (the “Board”). When market quotations are not readily available or when events occur that make established valuation methods unreliable, securities of the Fund may be valued in good faith by or under the direction of the Board. These securities generally include, but are not limited to, restricted securities (securities which may not be publicly sold without registration under the Securities Act of 1933) for which a pricing service is unable to provide a market price; securities whose trading has been formally suspended; a security whose market price is not available from a pre-established primary pricing source or the pricing source is not willing to provide a price; a security with respect to which an event has occurred that is most likely to materially affect the value of the security after the market has closed but before the calculation of the Fund’s NAV or make it difficult or impossible to obtain a reliable market quotation; or a security whose price, as provided by the pricing service, does not reflect the security’s “fair value” due to the security being de-listed from a national exchange or the security’s primary trading market is temporarily closed at a time when, under normal conditions, it would be open. As a general principle, the current “fair value” of a security would be the amount which the owner might reasonably expect to receive from the sale on the applicable exchange or principal market. A variety of factors may be considered in determining the fair value of such securities.
15 | November 30, 2015
| | |
Barron’s 400SM ETF | | |
| Notes to Financial Statements | | November 30, 2015 |
B. Fair Value Measurements
The Fund discloses the classification of its fair value measurements following a three-tier hierarchy based on the inputs used to measure fair value. Inputs refer broadly to the assumptions that market participants would use in pricing the asset or liability; including assumptions about risk. Inputs may be observable or unobservable. Observable inputs reflect the assumptions market participants would use in pricing the asset or liability that are developed based on market data obtained from sources independent of the reporting entity. Unobservable inputs reflect the reporting entity’s own assumptions about the assumptions market participants would use in pricing the asset or liability that are developed based on the best information available.
Valuation techniques used to value the Fund’s investments by major category are as follows:
Equity securities and Limited Partnerships, including restricted securities, for which market quotations are readily available, are valued at the last reported sale price or official closing price as reported by a third party pricing vendor on the primary market or exchange on which they are traded and are categorized as Level 1 in the hierarchy. In the event there were no sales during the day or closing prices are not available, securities are valued at the mean of the most recent quoted bid and ask prices on such day and are generally categorized as Level 2 in the hierarchy. Investments in open-end mutual funds are valued at their closing NAV each business day and are categorized as Level 1 in the hierarchy.
Changes in valuation techniques may result in transfers in or out of an assigned level within the disclosure hierarchy.
Various inputs are used in determining the value of the Fund’s investments as of the end of the reporting period. When inputs used fall into different levels of the fair value hierarchy, the level in the hierarchy within which the fair value measurement falls is determined based on the lowest level input that is significant to the fair value measurement in its entirety. The designated input levels are not necessarily an indication of the risk or liquidity associated with these investments.
These inputs are categorized in the following hierarchy under applicable financial accounting standards:
| Level 1 – | Unadjusted quoted prices in active markets for identical investments, unrestricted assets or liabilities that a Fund has the ability to access at the measurement date; |
| Level 2 – | Quoted prices which are not active, quoted prices for similar assets or liabilities in active markets or inputs other than quoted prices that are observable (either directly or indirectly) for substantially the full term of the asset or liability; and |
| Level 3 – | Significant unobservable prices or inputs (including the Fund’s own assumptions in determining the fair value of investments) where there is little or no market activity for the asset or liability at the measurement date. |
The following is a summary of the inputs used to value the Fund’s investments as of November 30, 2015:
| | | | | | | | | | | | | | | | |
| Investments in Securities at Value* | | Level 1 - Unadjusted
Quoted Prices | | | Level 2 -Other
Significant Observable
Inputs | | | Level 3 - Significant
Unobservable Inputs | | | Total | |
Common Stocks | | $ | 198,775,056 | | | $ | – | | | $ | – | | | $ | 198,775,056 | |
Limited Partnerships | | | 5,419,343 | | | | – | | | | – | | | | 5,419,343 | |
Short Term Investments | | | 457,136 | | | | – | | | | – | | | | 457,136 | |
TOTAL | | $ | 204,651,535 | | | $ | – | | | $ | – | | | $ | 204,651,535 | |
| | | | | | | | | | | | | | | | | |
| * | For a detailed sector breakdown, see the accompanying Schedule of Investments. |
The Fund recognizes transfers between levels as of the end of the period. For the year ended November 30, 2015, the Fund did not have any transfers between Level 1 and Level 2 securities. The Fund did not have any securities which used significant unobservable inputs (Level 3) in determining fair value.
C. Securities Transactions and Investment Income
Securities transactions are recorded as of the trade date. Realized gains and losses from securities transactions are recorded on the highest cost basis. Dividend income and capital gains distributions, if any, are recorded on the ex-dividend date. Interest income, if any, is recorded on the accrual basis.
16 | November 30, 2015
| | |
Barron’s 400SM ETF | | |
| Notes to Financial Statements | | November 30, 2015 |
D. Dividends and Distributions to Shareholders
Dividends from net investment income of the Fund, if any, are declared and paid annually or as the Board may determine from time to time. Distributions of net realized capital gains earned by the Fund, if any, are distributed at least annually.
E. Federal Tax and Tax Basis Information
The timing and character of income and capital gain distributions are determined in accordance with income tax regulations, which may differ from U.S. GAAP. Reclassifications are made to the Fund’s capital accounts for permanent tax differences to reflect income and gains available for distribution (or available capital loss carryforwards) under income tax regulations.
For the year ended November 30, 2015, the following reclassifications, which had no impact on results of operations or net assets, were recorded to reflect permanent tax differences resulting primarily from in-kind transactions:
| | | | | | | | | | | | |
| Fund | | Paid-in Capital | | | Accumulated Net
Investment Loss | | | Accumulated Net Realized
Loss on Investments | |
Barron’s 400SM ETF | | $ | 20,251,008 | | | $ | (468,447 | ) | | $ | (19,782,561 | ) |
At November 30, 2015, the Fund had available for tax purposes unused post-enactment capital loss carryforwards as follows:
| | | | | | | | |
| Fund | | Short-Term | | | Long-Term | |
Barron’s 400SM ETF | | $ | 16,603,961 | | | $ | 4,182,423 | |
The tax character of the distributions paid were as follows:
| | | | |
| | | Ordinary Income | |
November 30, 2015 | | | | |
Barron’s 400SM ETF | | $ | 1,549,998 | |
November 30, 2014 | | | | |
Barron’s 400SM ETF | | $ | 356,623 | |
As of November 30, 2015, the components of distributable earnings on a tax basis for the Fund were as follows:
| | | | |
| | Barron’s 400SM ETF | |
Undistributed net investment income | | $ | 1,335,679 | |
Accumulated net realized loss on investments | | | (20,786,384) | |
Net unrealized appreciation on investments | | | 5,219,297 | |
Other accumulated losses | | | (2,001) | |
Total | | $ | (14,233,409) | |
| | | | | |
As of November 30, 2015, the cost of investments for federal income tax purposes and accumulated net unrealized appreciation/(depreciation) on investments were as follows:
| | | | |
| | Barron’s 400SM ETF | |
Gross appreciation (excess of value over tax cost) | | $ | 21,613,907 | |
Gross depreciation (excess of tax cost over value) | | | (16,350,653) | |
Net unrealized appreciation (depreciation) | | | 5,263,255 | |
| | | | | |
Cost of investments for income tax purposes | | $ | 199,388,280 | |
| | | | | |
The differences between book-basis and tax-basis are primarily due to the deferral of losses from wash sales and investments in partnerships.
17 | November 30, 2015
| | |
Barron’s 400SM ETF | | |
| Notes to Financial Statements | | November 30, 2015 |
F. Income Taxes
No provision for income taxes is included in the accompanying financial statements, as the Fund intends to distribute to shareholders all taxable investment income and realized gains and otherwise comply with Subchapter M of the Internal Revenue Code of 1986, as amended, applicable to regulated investment companies. The Fund evaluates tax positions taken (or expected to be taken) in the course of preparing the Fund’s tax returns to determine whether these positions meet a “more-likely-than-not” standard that, based on the technical merits, have a more than fifty percent likelihood of being sustained by a taxing authority upon examination. A tax position that meets the “more-likely-than-not” recognition threshold is measured to determine the amount of benefit to recognize in the financial statements.
As of and during the year ended November 30, 2015, the Fund did not have a liability for any unrecognized tax benefits. The Fund files U.S. federal, state, and local tax returns as required. The Fund’s tax returns are subject to examination by the relevant tax authorities until expiration of the applicable statute of limitations which is generally three years after the filing of the tax return, but may extend to four years in certain jurisdictions. Tax returns for open years have incorporated no uncertain tax positions that require a provision for income taxes.
3. INVESTMENT ADVISORY FEE AND OTHER AFFILIATED TRANSACTIONS
ALPS Advisors, Inc. (the “Adviser”) acts as the Fund’s investment adviser pursuant to an Advisory Agreement with the Trust on behalf of the Fund (the “Advisory Agreement”). Pursuant to the Advisory Agreement, the Fund pays the Adviser a unitary fee for the services and facilities it provides payable on a monthly basis at the annual rate of 0.65% of the Fund’s average daily net assets. From time to time, the Adviser may waive all or a portion of its fee.
Out of the unitary management fee, the Adviser pays substantially all expenses of the Fund, the cost of transfer agency, custody, fund administration, legal, audit, independent trustees and other services, except for interest expenses, distribution fees or expenses, brokerage expenses, taxes and extraordinary expenses not incurred in the ordinary course of the Fund’s business. The Adviser’s unitary management fee is designed to pay substantially all of the Fund’s expenses and to compensate the Adviser for providing services for the Fund.
ALPS Fund Services, Inc., an affiliate of the Adviser, is the administrator of the Fund.
Each Trustee who is not an officer or employee of the Adviser, any sub-adviser or any of their affiliates (“Independent Trustees”) receives (1) a quarterly retainer of $5,000, (2) a per meeting fee for regularly scheduled meetings of $3,750, (3) $1,500 for any special meeting held outside of a regularly scheduled board meeting, and (4) reimbursement for all reasonable out-of-pocket expenses relating to attendance at meetings.
4. PURCHASES AND SALES OF SECURITIES
For the year ended November 30, 2015, the cost of purchases and proceeds from sales of investment securities, excluding in-kind transactions and short-term investments, were as follows:
| | | | | | | | |
| Fund | | Purchases | | | Sales | |
Barron’s 400SM ETF | | $ | 179,792,695 | | | $ | 179,953,213 | |
For the year ended November 30, 2015, the cost of in-kind purchases and proceeds from in-kind sales were as follows:
| | | | | | | | |
| Fund | | Purchases | | | Sales | |
Barron’s 400SM ETF | | $ | 88,560,986 | | | $ | 104,335,699 | |
The Barron’s 400SM ETF had in-kind net realized gain/(loss) of $20,651,163.
Gains on in-kind transactions are not considered taxable for federal income tax purposes.
5. CAPITAL SHARE TRANSACTIONS
Shares are created and redeemed by the Fund only in Creation Unit size aggregations of 50,000 shares. Only broker-dealers or large institutional investors with creation and redemption agreements called Authorized Participants (“AP”) are permitted to purchase or redeem Creation Units from the Fund. Such transactions are generally permitted on an in-kind basis, with a balancing cash component to equate the transaction to the NAV per unit of the Fund on the transaction date. Cash may be substituted equivalent to the value of certain securities generally when they are not available in sufficient quantity for delivery, not eligible for trading by the AP or as a result of other market circumstances.
18 | November 30, 2015
| | |
Barron’s 400SM ETF | | |
| Additional Information | | November 30, 2015 (Unaudited) |
PROXY VOTING RECORDS, POLICIES AND PROCEDURES
Information regarding how the Fund voted proxies relating to portfolio securities during the most recent 12-month period ended June 30 and a description of the Fund’s proxy voting policies and procedures used in determining how to vote for proxies are available without charge on the Securities and Exchange Commission’s (“SEC”) website at www.sec.gov and upon request, by calling (toll-free) 1-866-675-2639.
PORTFOLIO HOLDINGS
The Trust is required to disclose, after its first and third fiscal quarters, the complete schedule of each Fund’s portfolio holdings with the SEC on Form N-Q. Form N-Q for each Fund will be available on the SEC’s website at www.sec.gov. Each Fund’s Form N-Q may also be reviewed and copied at the SEC’s Public Reference Room in Washington, D.C. and information on the operation of the Public Reference Room may be obtained by calling 1-800-SEC-0330. Each Fund’s Form N-Q will be available without charge, upon request, by calling (toll-free) 1-866-675-2639 or by writing to ALPS ETF Trust at 1290 Broadway, Suite 1100, Denver, Colorado 80203.
TAX INFORMATION
The Fund designates the following for federal income tax purposes for distributions made during the calendar year ended December 31, 2014:
| | | | |
| | | Qualified Dividend Income | | Dividend Received Deduction |
Barron’s 400SM ETF | | 100.00 % | | 100.00 % |
In early 2015, if applicable, shareholders of record received this information for the distribution paid to them by the Fund during the calendar year 2014 via Form 1099. The Fund will notify shareholders in early 2016 of amounts paid to them by the Fund, if any, during the calendar year 2015.
LICENSING AGREEMENT
MarketGrader Capital LLC has entered into a license agreement with Dow Jones & Company to use the “Barron’s” name and certain related intellectual property in connection with the Underlying Index. MarketGrader Capital LLC also has entered into a license and services agreement with its parent company, MarketGrader.com, to use the methodology for constructing the Underlying Index. MarketGrader Capital LLC in turn has entered into the Sublicense Agreement with ALPS Advisers, Inc. to use the underlying index. The following disclosure relates to such licensing agreements:
The Barron’s 400SM ETF (the “Fund”) is not sponsored, endorsed, sold or promoted by the MarketGrader Capital, LLC (the “Index Provider”). The Index Provider makes no representation or warranty, express or implied, to the owners of the Fund or any member of the public regarding the advisability of investing in securities generally or in the Fund particularly or the ability of the Fund to track the performance of the physical commodities market. The Index Provider’s only relationship to the ALPS Advisors, Inc. (the “Adviser”) or the Fund is the licensing of certain service marks and trade names of the Index Provider and of the Underlying Index that is determined, composed and calculated by the Index Provider without regard to the Adviser or the Fund. The Index Provider has no obligation to take the needs of the Adviser or the Fund or the owners of the Fund into consideration in determining, composing or calculating the Underlying Index. The Index Provider is not responsible for and has not participated in the determination of the timing of, prices at, or quantities of the Fund to be issued or in the determination or calculation of the equation by which the Fund is to be converted into cash. The Index Provider has no obligation or liability in connection with the administration, marketing or trading of the Fund.
THE INDEX PROVIDER DOES NOT GUARANTEE THE ACCURACY AND/OR THE COMPLETENESS OF THE UNDERLYING INDEX OR ANY DATA INCLUDED THEREIN AND THE INDEX PROVIDER SHALL HAVE NO LIABILITY FOR ANY ERRORS, OMISSIONS, OR INTERRUPTIONS THEREIN. THE INDEX PROVIDER MAKES NO WARRANTY, EXPRESS OR IMPLIED, AS TO RESULTS TO BE OBTAINED BY THE ADVISER, THE FUND, OWNERS OF THE FUND, OR ANY OTHER PERSON OR ENTITY FROM THE USE OF THE UNDERLYING INDEX OR ANY DATA INCLUDED THEREIN. THE INDEX PROVIDER MAKES NO EXPRESS OR IMPLIED WARRANTIES, AND EXPRESSLY DISCLAIMS ALL WARRANTIES OF MERCHANTABILITY OR FITNESS FOR A PARTICULAR PURPOSE OR USE WITH RESPECT TO THE UNDERLYING INDEX OR ANY DATA INCLUDED THEREIN. WITHOUT LIMITING ANY OF THE FOREGOING, IN NO EVENT SHALL THE INDEX PROVIDER HAVE ANY LIABILITY FOR ANY SPECIAL, PUNITIVE, INDIRECT, OR CONSEQUENTIAL DAMAGES (INCLUDING LOST PROFITS), EVEN IF NOTIFIED OF THE POSSIBILITY OF SUCH DAMAGES.
19 | November 30, 2015
| | |
Barron’s 400SM ETF | | |
| Additional Information | | November 30, 2015 (Unaudited) |
“The Barron’s 400 IndexSM” is calculated and published by MarketGrader Capital LLC (“MarketGrader”). “Barron’s,” “Barron’s 400” and “Barron’s 400 Index” are trademarks or service marks of DJC & Company, Inc. or its affiliates and have been licensed to MarketGrader and sublicensed for certain purposes by Barron’s 400 Exchange Traded Fund, a sub-fund of that certain ALPS ETF Trust, a Delaware Statutory Trust (“Sub-Licensee”).
The Barron’s 400 ETF (the “Product”) is not sponsored, endorsed, sold or promoted by DJC or its affiliates. DJC and its affiliates make no representation or warranty, express or implied, to the owners of the Fund or any member of the public regarding the advisability of trading in the Fund particularly. DJC and its affiliates’ only relationship to the Licensee is the licensing of certain trademarks and trade names of DJC. DJC has no obligation to take the needs of the Licensee or the owners of the Fund into consideration in connection with its licensing of the Barron’s 400 Index to MarketGrader or the sublicense to Licensee. DJC and its affiliates are not responsible for and have not participated in the determination of the timing of, prices at, or quantities of the Fund to be sold or in the determination or calculation of the equation by which the Product are to be converted into cash. DJC and its affiliates have no obligation or liability in connection with the administration, marketing or trading of the Barron’s 400 Index or the Product.
DOW JONES DOES NOT GUARANTEE THE ACCURACY AND/OR THE COMPLETENESS OF THE BARRON’S 400 INDEX OR ANY DATA INCLUDED THEREIN AND DOW JONES AND ITS AFFILIATES SHALL HAVE NO LIABILITY FOR ANY ERRORS, OMISSIONS, OR INTERRUPTIONS THEREIN. DOW JONESAND ITS AFFILIATES MAKE NO WARRANTY, EXPRESS OR IMPLIED, AS TO RESULTS TO BE OBTAINED BY THE LICENSEE, OWNERS OF THE FUND, OR ANY OTHER PERSON OR ENTITY FROM THE USE OF THE BARRON’S 400 INDEX OR ANY DATA INCLUDED THEREIN. DOW JONES AND ITS AFFILIATES MAKE NO EXPRESS OR IMPLIED WARRANTIES. AND EXPRESSLY DISCLAIM ALL WARRANTIES, OF MERCHANTABILITY OR FITNESS FOR A PARTICULAR PURPOSE OR USE WITH RESPECT TO THE BARRON’S 400 INDEX OR ANY DATA INCLUDED THEREIN. WITHOUT LIMITING ANY OF THE FOREGOING, IN NO EVENT SHALL DOW JONES AND ITS AFFILIATES HAVE ANY LIABILITY FOR ANY LOST PROFITS OR INDIRECT, PUNITIVE, SPECIAL OR CONSEQUENTIAL DAMAGES OR LOSSES, EVEN IF NOTIFIED OF THE POSSIBILITY OF SUCH DAMAGES. THERE ARE NO THIRD PARTY BENEFICIARIES OF ANY AGREEMENTS OR ARRANGEMENTS BETWEEN DJC AND THE LICENSEE, OTHER THAN THE LICENSORS OF MARKETGRADER.
The Adviser does not guarantee the accuracy and/or the completeness of the Underlying Index or any data included therein, and the Adviser shall have no liability for any errors, omissions or interruptions therein. The Adviser makes no warranty, express or implied, as to results to be obtained by the Fund, owners of the Shares of the Fund or any other person or entity from the use of the Underlying Index or any data included therein. The Adviser makes no express or implied warranties, and expressly disclaims all warranties of merchantability or fitness for a particular purpose or use with respect to the Underlying Index or any data included therein. Without limiting any of the foregoing, in no event shall the Adviser have any liability for any special, punitive, direct, indirect or consequential damages (including lost profits) arising out of matters relating to the use of the Underlying Index, even if notified of the possibility of such damages.
20 | November 30, 2015
| | |
Barron’s 400SM ETF | | |
Board Considerations Regarding Approval of Investment Advisory Agreement | | November 30, 2015 (Unaudited) |
At an in-person meeting held on June 8, 2015, the Board of Trustees of the Trust (the “Board” or the “Trustees”), including the Trustees who are not “interested persons” of the Trust within the meaning of the 1940 Act, as amended (the “Independent Trustees”), evaluated a proposal to approve the continuance of the Advisory Agreement between the Trust and ALPS Advisors, Inc. (the “Adviser”) with respect to the Barons 400 ETF (“BFOR” or “the Fund”). The Independent Trustees also met separately to consider the Advisory Agreement.
In evaluating the Investment Advisory Agreement with respect to BFOR, the Trustees considered various factors, including (i) the nature, extent and quality of the services to be provided by the Adviser with respect to the Fund under the Investment Advisory Agreement; (ii) the advisory fees and other expenses to be paid by the Fund compared to those of similar funds managed by other investment advisers; (iii) the costs of the services provided to the Fund by the Adviser and the profits realized by the Adviser and its affiliates from its relationship to the Fund; (iv) the extent which economies of scale would be realized if and as the assets of the Fund grow and whether fees reflect the economies of scale for the benefit of shareholders and (v) any additional benefits and other considerations.
With respect to the nature, extent and quality of the services to be provided by the Adviser under the Investment Advisory Agreement, the Trustees considered and reviewed information concerning the services to be provided under the Investment Advisory Agreement, the investment parameters of the index of the Fund, financial information regarding the Adviser and its parent company, information describing the Adviser’s current organization and the background and experience of the persons who would be responsible for the day-to-day management of the Fund.
The Trustees reviewed information on the performance of the Fund and its benchmark. The Trustees also evaluated the correlation and tracking error between the underlying index and the Fund’s performance. Based on their review, the Trustees found that the nature and extent of services provided to the Fund under the Investment Advisory Agreements was appropriate and that the quality was satisfactory.
The Trustees noted that the advisory fee for the Fund was a unitary fee pursuant to which the Adviser assumes all expenses of the Fund (including the cost of transfer agency, custody, fund administration, legal, audit and other services) other than the payments under the Advisory Agreement, brokerage expenses, taxes, interest, litigation expenses and other extraordinary expenses.
The Trustees noted that each of the advisory fee rate and expense ratio for the Fund is higher than the median of its Strategic Insight expense group. The Trustees took into account, among other things, the unique features and performance of BFOR’s underlying index and the costs and benefits of linkage to the Barron’s name.
Based on the foregoing, and the other information available to them, the Trustees concluded that the advisory fee rate for the Fund was reasonable under the circumstances and in light of the quality of the services provided.
The Trustees considered other benefits available to the Adviser because of its relationship with the Fund and concluded that the advisory fees were reasonable taking into account any such benefits.
The Trustees also considered with respect to the Fund the information provided by the Adviser about the costs and profitability of the Adviser with respect to the Fund. The Trustees reviewed and noted the relatively small size of the Fund and concluded that the Adviser was not realizing any economies of scale. The Trustees determined that they would continue to evaluate whether further economies of scale have been achieved on an ongoing basis.
In voting to renew each Investment Advisory Agreement, the Trustees concluded that the terms of the Investment Advisory Agreement are reasonable and fair in light of the services to be performed, the fees paid by certain other funds, expenses to be incurred and such other matters as the Trustees considered relevant in the exercise of their reasonable business judgment. The Trustees did not identify any single factor or group of factors as all important or controlling and considered all factors together.
21 | November 30, 2015
| | |
Barron’s 400SM ETF | | |
| Trustees & Officers | | November 30, 2015 (Unaudited) |
| | | | | | | | | | |
INDEPENDENT TRUSTEES |
Name, Address
& Year of Birth* | | Position(s) Held with Trust | | Term of Office
and Length of
Time Served** | | Principal Occupation(s)
During Past 5 Years | | Number of
Portfolios in Fund
Complex Overseen
by Trustees*** | | Other Directorships Held by Trustees |
Mary K. Anstine, 1940 | | Trustee | | Since March 2008 | | Ms. Anstine was formerly an Executive Vice President of First Interstate Bank of Denver until 1994, President/Chief Executive Officer of HealthONE Alliance, Denver, Colorado, from 1994 to 2004, and has been retired since 2004. Ms. Anstine is also Trustee/Director of the following: AV Hunter Trust and Colorado Uplift Board. Ms. Anstine was formerly a Director of the Trust Bank of Colorado (later purchased and now known as Northern Trust Bank), HealthONE and Denver Area Council of the Boy Scouts of America and a member of the American Bankers Association Trust Executive Committee. | | 46 | | Ms. Anstine is a Trustee of ALPS Variable Investment Trust (9 funds); Financial Investors Trust (31 funds); Reaves Utility Income Fund; and Westcore Trust (12 funds). |
Jeremy W. Deems, 1976 | | Trustee | | Since March 2008 | | Mr. Deems is the Co-Founder, Chief Financial Officer of Green Alpha Advisors, LLC. Mr. Deems is Co-Portfolio Manager of the Shelton Green Alpha Fund. Prior to joining Green Alpha Advisors, Mr. Deems was CFO and Treasurer of Forward Management, LLC, ReFlow Management Co., LLC, ReFlow Fund, LLC, a private investment fund, and Sutton Place Management, LLC, an administrative services company. | | 46 | | Mr. Deems is a Trustee of ALPS Variable Investment Trust (9 funds); Financial Investors Trust (31 funds); Clough Funds Trust (1 fund); and Reaves Utility Income Fund. |
Rick A. Pederson, 1952 | | Trustee | | Since March 2008 | | Mr. Pederson is President, Foundation Properties, Inc. (a real estate investment management company), 1994 - present; Advisory Board Member, Bow River Capital Partners (private equity management), 2003 - present; Advisor, Pauls Corporation (real estate investment management and development), 2008 - present; Chairman, Ross Consulting Group (real estate consulting services) 1983-2013; Advisory Board, Neenan Company (construction services) 2002-present; Board Member, Prosci, Inc. (private business services), 2013-present; Board Member, Citywide Banks (Colorado community bank) 2014-present; Board member, Professional Pediatric Health Care (a Denver-based home nursing firm) 2014 – present; Director, National Western Stock Show (not-for-profit organization); Director, Biennial of the Americas (not-for-profit organization). | | 24 | | Mr. Pederson is Trustee of Westcore Trust (12 funds) and Principal Real Estate Income Fund (1 fund). |
| * | The business address of the Trustee is c/o ALPS Advisors, Inc., 1290 Broadway, Suite 1100, Denver, Colorado 80203. |
| ** | This is the period for which the Trustee began serving the Trust. Each Trustee serves an indefinite term, until his successor is elected. |
| *** | The Fund Complex includes all series of the Trust and any other investment companies for which ALPS Advisors, Inc. provides investment advisory services. |
The Statement of Additional Information includes additional information about the Fund’s Trustees and is available, without charge, upon request by calling (toll-free) 1-866-675-2639.
22 | November 30, 2015
| | |
Barron’s 400SM ETF | | |
| Trustees & Officers | | November 30, 2015 (Unaudited) |
| | | | | | | | | | |
INTERESTED TRUSTEE |
Name, Address
and Year of Birth
of Interested
Trustee* | | Position(s) Held with Trust | | Term of Office
and Length of
Time Served** | | Principal Occupation(s) During Past 5 Years | | Number of
Portfolios in Fund
Complex Overseen
by Trustees*** | | Other Directorships
Held by Trustees |
Thomas A. Carter, 1966 | | Trustee and President | | Since March 2008 | | Mr. Carter joined ALPS Fund Services, Inc. (“ALPS”) in 1994 and is currently President and Director of ALPS Advisors, Inc. (“AAI”), and ALPS Portfolio Solutions Distributor, Inc. (“APSD”) and Executive Vice President and Director of ALPS and ALPS Holdings, Inc. (“AHI”), and ALPS Distributors, Inc. (“ADI”). Because of his position with AHI, ALPS, ADI, APSD and AAI, Mr. Carter is deemed an affiliate of the Fund as defined under the 1940 Act. Before joining ALPS, Mr. Carter was with Deloitte & Touche LLP, where he worked with a diverse group of clients, primarily within the financial services industry. Mr. Carter is a Certified Public Accountant and received his Bachelor of Science in Accounting from the University of Colorado at Boulder. | | 34 | | Mr. Carter is a Trustee of ALPS Variable Investment Trust (9 funds) and Principal Real Estate Income Fund (1 fund) |
| * | The business address of the Trustee is c/o ALPS Advisors, Inc., 1290 Broadway, Suite 1100, Denver, Colorado 80203. |
| ** | This is the period for which the Trustee began serving the Trust. Each Trustee serves an indefinite term, until his successor is elected. |
| *** | The Fund Complex includes all series of the Trust and any other investment companies for which ALPS Advisors, Inc. provides investment advisory services. |
The Statement of Additional Information includes additional information about the Fund’s Trustees and is available, without charge, upon request by calling (toll-free) 1-866-675-2639.
23 | November 30, 2015
| | |
Barron’s 400SM ETF | | |
| Trustees & Officers | | November 30, 2015 (Unaudited) |
| | | | | | |
OFFICERS |
Name, Address and Year of Birth of Officer* | | Position(s) Held with Trust | | Length of Time
Served** | | Principal Occupation(s) During Past 5 Years |
Erin D. Nelson, 1977 | | Chief
Compliance
Officer (“CCO”) | | Since
December 2015 | | Erin Nelson became Senior Vice-President and Chief Compliance Officer of ALPS Advisors, Inc. (“AAI”) on July 1, 2015 and prior to that served as Vice President and Deputy Chief Compliance Officer of AAI since January 1, 2015. Prior to January 1, 2015, Ms. Nelson was Vice-President and Assistant General Counsel of ALPS of Fund Services, Inc. Ms. Nelson joined AAI’s parent company, ALPS Holdings, Inc. in January 2003. |
| | | |
| | | | | | | Ms. Nelson currently is also the Chief Compliance Officer of Principal Real Estate Income Fund, and as of December 2015, the Chief Compliance Officer of Liberty All-Star Equity Fund, Liberty All-Star Growth Fund, Inc., RiverNorth Opportunities Fund, Inc. |
Patrick D. Buchanan, 1972 | | Treasurer | | Since
June 2012 | | Mr. Buchanan is Vice President of AAI. Mr. Buchanan joined ALPS in 2007 and because of his position with AAI, he is deemed an affiliate of the Trust as defined under the 1940 Act. Mr. Buchanan is also Treasurer of the ALPS Variable Insurance Trust, Clough Funds Trust and Principal Real Estate Income Fund. |
William Parmentier, 1952 | | Vice
President | | Since
March 2008 | | Mr. Parmentier is Chief Investment Officer, AAI (since 2006); President and Chief Executive Officer of the Liberty All-Star Funds (since April 1999); Senior Vice President (2005-2006), Banc of America Investment Advisors, Inc. Because of his position with AAI, Mr. Parmentier is deemed an affiliate of the Trust as defined under the 1940 Act. |
Abigail J. Murray, 1975 | | Secretary | | Since
June 2015 | | Ms. Murray joined ALPS in April 2015. She is currently Vice President and Senior Counsel of ALPS. Prior to joining ALPS, Ms. Murray was an Attorney and Managing Member at Murray & Rouvina PLC from 2014 to 2015 and an Associate with Vedder Price P.C. from 2007 to 2014. Because of her position with ALPS, Ms. Murray is deemed an affiliate of the Trust as defined under the 1940 Act. Ms. Murray is also the Secretary of The Caldwell & Orkin Funds, Inc., Clough Global Opportunities Fund, Clough Global Allocation Fund, Clough Global Equity Fund and Clough Funds Trust. |
Jennifer A. Craig, 1973 | | Assistant
Secretary | | Since
October 2013 | | Ms. Craig joined ALPS in 2007 and is currently Assistant Vice President and Paralegal Manager. Prior to joining ALPS, Ms. Craig was Legal Manager at Janus Capital Management LLC and served as Assistant Secretary of Janus Investment Fund, Janus Adviser Series and Janus Aspen Series. Because of her position with ALPS, Ms. Craig is deemed an affiliate of the Trust as defined under the 1940 Act. |
| * | The business address of the Officer is c/o ALPS Advisors, Inc., 1290 Broadway, Suite 1100, Denver, Colorado 80203. |
| ** | This is the period for which the Officer began serving the Trust. Each Officer serves an indefinite term, until his successor is elected. |
24 | November 30, 2015

Must be accompanied or preceded by a prospectus.
ALPS Portfolio Solutions Distributor, Inc. is the Distributor for the Barron’s 400SM ETF.
table of
CONTENTS
www.alpsfunds.com
| | |
Janus Velocity Tail Risk Hedged Large Cap ETF |
| Performance Overview | | November 30, 2015 (Unaudited) |
Investment Objective
The Janus Velocity Tail Risk Hedged Large Cap ETF (“Exchange Traded Fund” or “ETF”) seeks to provide investment results that correspond generally, before fees and expenses, to the performance of the VelocityShares Tail Risk Hedged Large Cap Index (the “Underlying Index”). The Underlying Index is an index comprised of three large capitalization equity ETFs and two volatility related ETFs (“The Underlying Index ETFs”). The ETF will seek to achieve its investment objective by investing at least 80% of its total assets in Underlying Index ETFs. The ETF also intends to invest 15%, but may invest up to 20%, of its assets in swap agreements or other derivatives instead of investing directly in certain Underlying Index ETFs.
Performance Overview
For the fiscal year ended November 30, 2015, the Janus Velocity Tail Risk Hedged Large Cap ETF (TRSK) produced a total return of -2.52% (based on NAV) in-line with the VelocityShares Tail Risk Hedged Large Cap Index, the Fund’s Underlying Index, which returned -1.92%. The Fund underperformed the S&P 500® which returned 2.75% for the same period.
The Fund’s assets invested in the Large Cap ETFs (SPDR S&P 500 ETF (SPY), Vanguard S&P 500 ETF (VOO) and iShares S&P 500 ETF (IVV)) contributed a return of approximately 2.31%, and the assets invested in the Volatility Component detracted -4.77% for the period.
Volatility, as measured by the VIX®, rose from 13.33 at the beginning of the period to 16.13 at the end of the fiscal year. The VIX spiked considerably in August, closing over 40 for the first time since 2011. Going into August the Volatility Component had a net long volatility position of only 3%, but it jumped to over 140% after the VIX spike. Over the course of the next two months, as volatility subsided, the net volatility position return to a more moderate positive bias and closed the fiscal year close to neutral.
Performance (as of November 30, 2015)
| | | | |
| | | 1 Year | | Since Inception^ |
Janus Velocity Tail Risk Hedged Large Cap ETF - NAV | | -2.52% | | 6.02% |
Janus Velocity Tail Risk Hedged Large Cap ETF - Market Price* | | -2.52% | | 6.01% |
VelocityShares Tail Risk Hedged Large Cap Index | | -1.92% | | 6.57% |
Total Expense Ratio (per the current prospectus) 0.71%.
| ^ | The Fund commenced operations on June 21, 2013. |
| * | Market Price is based on the midpoint of the bid/ask spread at 4 p.m. ET and does not represent the returns an investor would receive if shares were traded at other times. | |
Performance data quoted represents past performance. Past performance does not guarantee future results. Investment return and principal value of an investment will fluctuate so that an investor’s shares, when sold or redeemed, may be worth more or less than the original cost. Current performance data may be higher or lower than actual data quoted. For the most current month-end performance data please visit www.alpsfunds.com or call 1.877.583.5624.
NAV is an exchange-traded fund’s per-share value. The per-share dollar amount of the fund is derived by dividing the total value of all the securities in its portfolio, less any liabilities, by the number of fund shares outstanding. Market Price is the price at which a share can currently be traded in the market. Information detailing the number of days the Market Price of the Fund was greater than the Fund’s NAV and the number of days it was less than the Fund’s NAV can be obtained at www.alpsfunds.com.
VelocityShares Tail Risk Hedged Large Cap Index: reflects the performance of a portfolio providing a target exposure of 85% to a large cap equity portfolio and a target exposure of 15% to a volatility strategy designed to hedge tail risk in the S&P 500®.
The CBOE Volatility Index (VIX) is a key measure of market expectations of near-term volatility conveyed by S&P 500® stock index option prices. Since its introduction in 1993, VIX has been considered by many to be the world’s premier barometer of investor sentiment and market volatility.
One cannot invest directly in an index. Index performance does not reflect fund performance.
“VelocityShares” and the VelocityShares logo are trademarks of Janus Index & Calculation Service, LLC.
The Janus Velocity Tail Risk Hedged ETF is not suitable for all investors. Investments in the Fund are subject to investment risks, including possible loss of the principal amount invested.
ALPS Portfolio Solutions Distributor, Inc. is the Distributor for the Janus Velocity Tail Risk Hedged Large Cap ETF.
ALPS Portfolio Solutions Distributor, Inc. is not affiliated with Janus.
1 | November 30, 2015
| | |
Janus Velocity Tail Risk Hedged Large Cap ETF |
| Performance Overview | | November 30, 2015 (Unaudited) |
Top Holdings* (as of November 30, 2015)
| | | | |
iShares® Core S&P 500® ETF | | | 33.34% | |
Vanguard® S&P 500® ETF | | | 33.33% | |
SPDR® S&P 500® ETF | | | 33.33% | |
Total % of Top Holdings | | | 100.00% | |
Future holdings are subject to change.
Growth of $10,000 (as of November 30, 2015)
Comparison of Change in Value of $10,000 Investment in the Fund and the Index
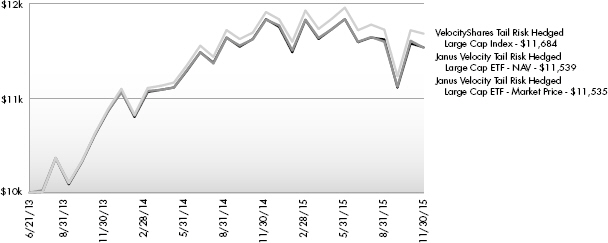
The chart above represents historical performance of a hypothetical investment of $10,000 in the Fund over the life of the Fund. Performance calculations are as of the end of each month. Past performance does not guarantee future results. This chart does not reflect the deduction of taxes that a shareholder would pay on Fund distributions or the redemption of Fund shares.
2 | November 30, 2015
| | |
Janus Velocity Volatility Hedged Large Cap ETF |
| Performance Overview | | November 30, 2015 (Unaudited) |
Investment Objective
The Janus Velocity Volatility Hedged Large Cap ETF (“Exchange Traded Fund” or “ETF”) seeks to provide investment results that correspond generally, before fees and expenses, to the performance of the VelocityShares Volatility Hedged Large Cap Index (the “Underlying Index”). The Underlying Index is an index comprised of three large capitalization equity ETFs and two volatility related ETFs (“The Underlying Index ETFs”). The ETF will seek to achieve its investment objective by investing at least 80 % of its total assets in Underlying Index ETFs. The ETF also intends to invest 15%, but may invest up to 20%, of its assets in swap agreements or other derivatives instead of investing directly in certain Underlying Index ETFs.
Performance Overview
For the fiscal year ended November 30, 2015, the Janus Velocity Volatility Hedged Large Cap ETF (SPXH) produced a total return of -2.44% (based on NAV) in-line with the VelocityShares Volatility Hedged Large Cap Index, the Fund’s Underlying Index, which returned -1.87%. The Fund underperformed the S&P 500® which returned 2.75% for the same period.
The Fund’s assets invested in the Large Cap ETFs (SPDR S&P 500 ETF (SPY), Vanguard S&P 500 ETF (VOO) and iShares S&P 500 ETF (IVV)) contributed a return of approximately 2.51%, and the assets invested in the Volatility Component were down 5.04% for the period.
Volatility, as measured by the VIX®, rose from 13.33 at the beginning of the period to 16.13 at the end of the fiscal year. The VIX spiked considerably in August, closing over 40 for the first time since 2011. Going into August the Volatility Component had a net short volatility position of approximately 27%, but it jumped to a positive 118% after the VIX spike. Over the course of the next two months, as volatility subsided, the net volatility position return to short bias and closed the fiscal year back at the short 27% level it had seen prior to the VIX spike.
Performance (as of November 30, 2015)
| | | | |
| | | 1 Year | | Since Inception^ |
Janus Velocity Volatility Hedged Large Cap ETF - NAV | | -2.44% | | 8.22% |
Janus Velocity Volatility Hedged Large Cap ETF - Market Price* | | -2.45% | | 8.19% |
VelocityShares Volatility Hedged Large Cap Index | | -1.87% | | 8.81% |
Total Expense Ratio (per the current prospectus) 0.71%.
| ^ | The Fund commenced operations on June 21, 2013. |
| * | Market Price is based on the midpoint of the bid/ask spread at 4 p.m. ET and does not represent the returns an investor would receive if shares were traded at other times. | |
Performance data quoted represents past performance. Past performance does not guarantee future results. Investment return and principal value of an investment will fluctuate so that an investor’s shares, when sold or redeemed, may be worth more or less than the original cost. Current performance data may be higher or lower than actual data quoted. For the most current month-end performance data please visit www.alpsfunds.com or call 1.877.583.5624.
NAV is an exchange-traded fund’s per-share value. The per-share dollar amount of the fund is derived by dividing the total value of all the securities in its portfolio, less any liabilities, by the number of fund shares outstanding. Market Price is the price at which a share can currently be traded in the market. Information detailing the number of days the Market Price of the Fund was greater than the Fund’s NAV and the number of days it was less than the Fund’s NAV can be obtained at www.alpsfunds.com.
VelocityShares Volatility Hedged Large Cap Index: reflects the performance of a portfolio providing a target exposure of 85% to a large cap equity portfolio and a target exposure of 15% to a volatility strategy designed to hedge volatility risk in the S&P 500®.
The CBOE Volatility Index (VIX) is a key measure of market expectations of near-term volatility conveyed by S&P 500® stock index option prices. Since its introduction in 1993, VIX has been considered by many to be the world’s premier barometer of investor sentiment and market volatility.
One cannot invest directly in an index. Index performance does not reflect fund performance.
“VelocityShares” and the VelocityShares logo are trademarks of Janus Index & Calculation Services, LLC.
The Janus Velocity Volatility Hedged ETF is not suitable for all investors. Investments in the Fund are subject to investment risks, including possible loss of the principal amount invested.
ALPS Portfolio Solutions Distributor, Inc. is the Distributor for the Janus Velocity Volatility Hedged Large Cap ETF.
ALPS Portfolio Solutions Distributor, Inc. is not affiliated with Janus.
3 | November 30, 2015
| | |
Janus Velocity Volatility Hedged Large Cap ETF |
| Performance Overview | | November 30, 2015 (Unaudited) |
Top Holdings* (as of November 30, 2015)
| | | | |
SPDR® S&P 500® ETF | | | 33.34% | |
iShares® Core S&P 500® ETF | | | 33.33% | |
Vanguard® S&P 500® ETF | | | 33.33% | |
Total % of Top Holdings | | | 100.00% | |
Future holdings are subject to change.
Growth of $10,000 (as of November 30, 2015)
Comparison of Change in Value of $10,000 Investment in the Fund and the Index
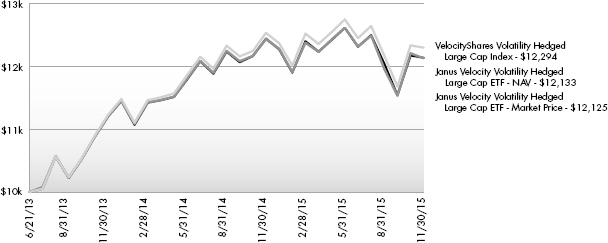
The chart above represents historical performance of a hypothetical investment of $10,000 in the Fund over the life of the Fund. Performance calculations are as of the end of each month. Past performance does not guarantee future results. This chart does not reflect the deduction of taxes that a shareholder would pay on Fund distributions or the redemption of Fund shares.
4 | November 30, 2015
| | |
Janus Velocity ETFs |
| Disclosure of Fund Expenses | | November 30, 2015 (Unaudited) |
Shareholder Expense Example: As a shareholder of the Fund, you incur two types of costs: (1) transaction costs which may include creation and redemption fees or brokerage charges, and (2) ongoing costs, including management fees and other Fund expenses. These examples are intended to help you understand your ongoing costs (in dollars) of investing in the Fund and to compare these costs with the ongoing costs of investing in other funds. The example is based on an investment of $1,000 invested at the beginning of the (six month) period and held through November 30, 2015.
Actual Return: The first line of the table provides information about actual account values and actual expenses. You may use the information in this table, together with the amount you invested, to estimate the expenses that you incurred over the period. Simply divide your account value by $1,000 (for example, an $8,600 account value divided by $1,000 = 8.6), then multiply the result by the number in the first line of the table under the heading entitled “Expenses Paid During the Period” to estimate the expenses attributable to your investment during this period.
Hypothetical 5% Return: The second line of the table provides information about hypothetical account values and hypothetical expenses based on the Fund’s actual expense ratio and an assumed rate of return of 5% per year before expenses, which is not the Fund’s actual return. The hypothetical account values and expenses may not be used to estimate the actual ending account balance or expenses you paid for the period. You may use this information to compare ongoing costs of investing in the Fund and other funds. To do so, compare this 5% hypothetical example with the 5% hypothetical examples that appear in the shareholder reports of the other funds.
The expenses shown in the table are meant to highlight ongoing Fund costs only and do not reflect any transaction costs, such as creation and redemption fees, or brokerage charges. Therefore, the second line of the table is useful in comparing ongoing costs only, and will not help you determine the relative total costs of owning different funds. In addition, if these costs were included, your costs would have been higher.
| | | | | | | | |
| | | Beginning Account
Value 6/1/15 | | Ending Account
Value 11/30/15 | | Expense Ratio(a) | | Expenses Paid During Period 6/1/15 - 11/30/15(b) |
Janus Velocity Tail Risk Hedged Large Cap ETF | | | | | | | | |
Actual | | $ 1,000.00 | | $ 974.70 | | 0.65% | | $ 3.22 |
Hypothetical (5% return before expenses) | | $ 1,000.00 | | $ 1,021.81 | | 0.65% | | $ 3.29 |
Janus Velocity Volatility Hedged Large Cap ETF | | | | | | | | |
Actual | | $ 1,000.00 | | $ 962.20 | | 0.65% | | $ 3.20 |
Hypothetical (5% return before expenses) | | $ 1,000.00 | | $ 1,021.81 | | 0.65% | | $ 3.29 |
| (a) | Annualized, based on the Fund’s most recent fiscal half-year expenses. |
| (b) | Expenses are equal to the Fund’s annualized expense ratio multiplied by the average account value over the period, multiplied by the number of days in the most recent fiscal half year (183), divided by 365. | |
5 | November 30, 2015
| | |
Janus Velocity ETFs |
| Report of Independent Registered Accounting Firm |
To the Board of Trustees and Shareholders of ALPS ETF Trust:
We have audited the accompanying statements of assets and liabilities, including the schedules of investments, of Janus Velocity Tail Risk Hedged Large Cap ETF (formerly known as VelocityShares Tail Risk Hedged Large Cap ETF) and Janus Velocity Volatility Hedged Large Cap ETF (formerly known as VelocityShares Volatility Hedged Large Cap ETF), two of the portfolios constituting the ALPS ETF Trust (the “Trust”), as of November 30, 2015, and the related statements of operations for the year then ended, the statements of changes in net assets for each of the two years in the period then ended, and the financial highlights for each of the periods presented. These financial statements and financial highlights are the responsibility of the Trust’s management. Our responsibility is to express an opinion on these financial statements and financial highlights based on our audits.
We conducted our audits in accordance with the standards of the Public Company Accounting Oversight Board (United States). Those standards require that we plan and perform the audit to obtain reasonable assurance about whether the financial statements and financial highlights are free of material misstatement. The Trust is not required to have, nor were we engaged to perform, an audit of its internal control over financial reporting. Our audits included consideration of internal control over financial reporting as a basis for designing audit procedures that are appropriate in the circumstances, but not for the purpose of expressing an opinion on the effectiveness of the Trust’s internal control over financial reporting. Accordingly, we express no such opinion. An audit also includes examining, on a test basis, evidence supporting the amounts and disclosures in the financial statements, assessing the accounting principles used and significant estimates made by management, as well as evaluating the overall financial statement presentation. Our procedures included confirmation of securities owned as of November 30, 2015, by correspondence with the custodian and brokers; when replies were not received from brokers, we performed other auditing procedures. We believe that our audits provide a reasonable basis for our opinion.
In our opinion, the financial statements and financial highlights referred to above present fairly, in all material respects, the financial position of Janus Velocity Tail Risk Hedged Large Cap ETF and Janus Velocity Volatility Hedged Large Cap ETF of the ALPS ETF Trust as of November 30, 2015, the results of their operations for the year then ended, the changes in their net assets for each of the two years in the period then ended, and the financial highlights for each of the periods presented, in conformity with accounting principles generally accepted in the United States of America.
DELOITTE & TOUCHE LLP
Denver, Colorado
January 28, 2016
6 | November 30, 2015
| | |
Janus Velocity Tail Risk Hedged Large Cap ETF |
| Schedule of Investments | | November 30, 2015 |
| | | | | | | | |
| Security Description | | Shares | | | Value | |
EXCHANGE TRADED FUNDS (85.22%) | | | | | |
Equity Funds (85.22%) | | | | | | | | |
iShares® Core S&P 500® ETF | | | 54,739 | | | $ | 11,488,074 | |
SPDR® S&P 500® ETF Trust | | | 55,048 | | | | 11,487,967 | |
Vanguard® S&P 500® ETF | | | 60,049 | | | | 11,487,974 | |
| | | | | | | | |
| | | | | | | 34,464,015 | |
| | | | | | | | |
| |
TOTAL EXCHANGE TRADED FUNDS (Cost $31,519,277) | | | | 34,464,015 | |
| | | | | | | | |
| |
TOTAL INVESTMENTS (85.22%) (Cost $31,519,277) | | | $ | 34,464,015 | |
| |
NET OTHER ASSETS AND LIABILITIES (14.78%)(a) | | | | 5,979,354 | |
| | | | | | | | |
| | |
NET ASSETS (100.00%) | | | | | | $ | 40,443,369 | |
| | | | | | | | |
| (a) | Includes cash, in the amount of $2,790,000, which is being held as collateral for total return swap contracts. |
| | | | |
Common Abbreviations: |
| | |
ETF | | - | | Exchange Traded Fund. |
S&P | | - | | Standard and Poor’s. |
SPDR | | - | | Standard and Poor’s Depositary Receipt. |
TOTAL RETURN SWAP CONTRACTS*
| | | | | | | | | | | | | | | | | | | | | | |
| Reference Obligation | | Swap
Counterparty | | Rate Paid
by the Fund | | Termination Date | | Notional Amount | | Unrealized
Depreciation |
S&P 500® VIX® Futures Tail Risk Index - Short Term: | | BNP Paribas | | | | 1.970 | % | | | | 12/01/2015 | | | | $ | 19,038 | | | | $ | (7,721) | |
| | BNP Paribas | | | | 1.970 | % | | | | 01/04/2016 | | | | | 938,152 | | | | | (403,695) | |
| | BNP Paribas | | | | 1.970 | % | | | | 05/02/2016 | | | | | 615,045 | | | | | (249,155) | |
| | BNP Paribas | | | | 1.970 | % | | | | 08/01/2016 | | | | | 1,618,589 | | | | | (528,543) | |
| | BNP Paribas | | | | 1.970 | % | | | | 10/13/2016 | | | | | 613,499 | | | | | (184,552) | |
| | BNP Paribas | | | | 1.970 | % | | | | 11/01/2016 | | | | | 933,000 | | | | | (220,752) | |
| | BNP Paribas | | | | 1.970 | % | | | | 01/13/2017 | | | | | 48,000 | | | | | (10,213) | |
| | BNP Paribas | | | | 1.970 | % | | | | 02/01/2017 | | | | | 170,000 | | | | | (37,607) | |
| | BNP Paribas | | | | 1.970 | % | | | | 05/01/2017 | | | | | 627,500 | | | | | (75,838) | |
| | BNP Paribas | | | | 1.970 | % | | | | 06/01/2017 | | | | | 890,283 | | | | | (139,324) | |
| | BNP Paribas | | | | 1.970 | % | | | | 07/03/2017 | | | | | 1,407,000 | | | | | (58,227) | |
| | | | | | | | | | | | | | | | | |
| | | | | | | | | | | | | | | $ | 7,880,106 | | | | $ | (1,915,627) | |
| | | | | | | | | | | | | | | | | |
| * | The Fund receives payments based on any positive return of the Reference Obligation net of the rate paid by the Fund. The Fund makes payments on any negative return of such Reference Obligation in addition to the rate paid by the Fund. |
See Notes to Financial Statements.
7 | November 30, 2015
| | |
Janus Velocity Volatility Hedged Large Cap ETF |
| Schedule of Investments | | November 30, 2015 |
| | | | | | | | |
| Security Description | | Shares | | | Value | |
EXCHANGE TRADED FUNDS (85.27%) | | | | | |
Equity Funds (85.27%) | | | | | | | | |
iShares® Core S&P 500® ETF | | | 90,345 | | | $ | 18,960,705 | |
SPDR® S&P 500® ETF Trust | | | 90,856 | | | | 18,960,739 | |
Vanguard® S&P 500® ETF | | | 99,110 | | | | 18,960,734 | |
| | | | | | | | |
| | | | | | | 56,882,178 | |
| | | | | | | | |
| |
TOTAL EXCHANGE TRADED FUNDS (Cost $53,237,281) | | | | 56,882,178 | |
| | | | | | | | |
| |
TOTAL INVESTMENTS (85.27%) (Cost $53,237,281) | | | $ | 56,882,178 | |
| |
NET OTHER ASSETS AND LIABILITIES (14.73%)(a) | | | | 9,829,383 | |
| | | | | | | | |
| |
NET ASSETS (100.00%) | | | $ | 66,711,561 | |
| | | | | | | | |
| (a) | Includes cash, in the amount of $4,110,000, which is being held as collateral for total return swap contracts. |
| | | | |
Common Abbreviations: |
| | |
ETF | | - | | Exchange Traded Fund. |
S&P | | - | | Standard and Poor’s. |
SPDR | | - | | Standard and Poor’s Depositary Receipt. |
TOTAL RETURN SWAP CONTRACTS*
| | | | | | | | | | | | | | |
| Reference Obligation | | Swap
Counterparty | | Rate Paid by
the Fund | | Termination Date | | Notional Amount | | | Unrealized
Depreciation | |
S&P 500® VIX® Futures Variable Long/Short Index - Short Term: | | BNP Paribas | | 1.970% | | 01/04/2016 | | $ | 728,567 | | | $ | (274,654) | |
| | BNP Paribas | | 1.970% | | 02/01/2016 | | | 77,339 | | | | (27,701) | |
| | BNP Paribas | | 1.970% | | 03/01/2016 | | | 871,311 | | | | (308,667) | |
| | BNP Paribas | | 1.970% | | 05/02/2016 | | | 823,393 | | | | (280,421) | |
| | BNP Paribas | | 1.970% | | 08/01/2016 | | | 5,141,990 | | | | (1,423,397) | |
| | BNP Paribas | | 1.970% | | 11/01/2016 | | | 807,000 | | | | (138,054) | |
| | BNP Paribas | | 1.970% | | 05/01/2017 | | | 1,196,697 | | | | (212,905) | |
| | BNP Paribas | | 1.970% | | 05/03/2017 | | | 206,368 | | | | (40,272) | |
| | BNP Paribas | | 1.970% | | 06/01/2017 | | | 1,208,900 | | | | (128,275) | |
| | BNP Paribas | | 1.970% | | 07/03/2017 | | | 1,673,000 | | | | (64,737) | |
| | | | | | | | | | |
| | | | | | | | $ | 12,734,565 | | | $ | (2,899,083) | |
| | | | | | | | | | |
| * | The Fund receives payments based on any positive return of the Reference Obligation net of the rate paid by the Fund. The Fund makes payments on any negative return of such Reference Obligation in addition to the rate paid by the Fund. |
See Notes to Financial Statements.
8 | November 30, 2015
| | |
Janus Velocity ETFs |
| Statements of Assets and Liabilities | | November 30, 2015 |
| | | | | | | | |
| | | Janus Velocity
Tail Risk
Hedged Large
Cap ETF | | | Janus Velocity
Volatility
Hedged Large
Cap ETF | |
ASSETS: | | | | | | | | |
Investments, at value | | $ | 34,464,015 | | | $ | 56,882,178 | |
Cash | | | 4,892,568 | | | | 8,959,836 | |
Receivable for investments sold | | | 234,061 | | | | 362,643 | |
Deposit with broker for total return swaps | | | 2,790,000 | | | | 4,110,000 | |
Total assets | | | 42,380,644 | | | | 70,314,657 | |
| | |
LIABILITIES: | | | | | | | | |
Payable to adviser | | | 21,648 | | | | 37,254 | |
Payable due to broker for total return swap contracts | | | – | | | | 240,798 | |
Payable for shares redeemed | | | – | | | | 425,961 | |
Unrealized depreciation on total return swap contracts | | | 1,915,627 | | | | 2,899,083 | |
Total liabilities | | | 1,937,275 | | | | 3,603,096 | |
NET ASSETS | | $ | 40,443,369 | | | $ | 66,711,561 | |
| | | | | | | | | |
| | |
NET ASSETS CONSIST OF: | | | | | | | | |
Paid-in capital | | $ | 40,097,796 | | | $ | 66,915,562 | |
Accumulated net investment income | | | 111,444 | | | | 212,771 | |
Accumulated net realized loss on investments | | | (794,982 | ) | | | (1,162,586 | ) |
Net unrealized appreciation on investments | | | 1,029,111 | | | | 745,814 | |
NET ASSETS | | $ | 40,443,369 | | | $ | 66,711,561 | |
| | | | | | | | | |
| | |
INVESTMENTS, AT COST | | $ | 31,519,277 | | | $ | 53,237,281 | |
| | |
PRICING OF SHARES | | | | | | | | |
Net Assets | | $ | 40,443,369 | | | $ | 66,711,561 | |
Shares of beneficial interest outstanding (Unlimited number of shares authorized, par value $0.01 per share) | | | 1,450,000 | | | | 2,250,000 | |
Net Asset Value, offering and redemption price per share | | $ | 27.89 | | | $ | 29.65 | |
See Notes to Financial Statements.
9 | November 30, 2015
| | |
Janus Velocity ETFs |
| Statements of Operations | | For the Year Ended November 30, 2015 |
| | | | | | | | |
| | | Janus Velocity
Tail Risk
Hedged Large
Cap ETF | | | Janus Velocity
Volatility
Hedged Large
Cap ETF | |
INVESTMENT INCOME: | | | | | | | | |
Dividends | | $ | 682,748 | | | $ | 1,287,197 | |
Total Investment Income | | | 682,748 | | | | 1,287,197 | |
| | |
EXPENSES: | | | | | | | | |
Investment adviser fees | | | 264,025 | | | | 463,861 | |
Total Expenses | | | 264,025 | | | | 463,861 | |
NET INVESTMENT INCOME | | | 418,723 | | | | 823,336 | |
| | |
REALIZED AND UNREALIZED GAIN/(LOSS) | | | | | | | | |
Net realized gain on investments | | | 614,704 | | | | 2,383,170 | |
Net realized loss on total return swap contracts | | | (765,768 | ) | | | (1,050,238 | ) |
Net change in unrealized depreciation on investments | | | (282,999 | ) | | | (1,966,073 | ) |
Net change in unrealized depreciation on total return swap contracts | | | (1,046,788 | ) | | | (2,039,451 | ) |
NET REALIZED AND UNREALIZED LOSS ON INVESTMENTS | | | (1,480,851 | ) | | | (2,672,592 | ) |
NET DECREASE IN NET ASSETS RESULTING FROM OPERATIONS | | $ | (1,062,128 | ) | | $ | (1,849,256 | ) |
| | | | | | | | | |
See Notes to Financial Statements.
10 | November 30, 2015
| | |
Janus Velocity ETFs |
| Statements of Changes in Net Assets | | |
| | | | | | | | | | | | | | | | |
| | | Janus Velocity Tail Risk Hedged Large Cap ETF | | | Janus Velocity Volatility Hedged Large Cap ETF | |
| | | For the Year Ended | | | For the Year Ended | | | For the Year Ended | | | For the Year Ended | |
| | | November 30, 2015* | | | November 30, 2014 | | | November 30, 2015** | | | November 30, 2014 | |
OPERATIONS: | | | | | | | | | | | | | | | | |
Net investment income | | $ | 418,723 | | | $ | 205,856 | | | $ | 823,336 | | | $ | 262,430 | |
Net realized gain/(loss) on investments, total return swap contracts | | | (151,064) | | | | (86,740) | | | | 1,332,932 | | | | (109,281) | |
Net change in unrealized appreciation/(depreciation) on investments, total return swap contracts | | | (1,329,787) | | | | 2,260,904 | | | | (4,005,524) | | | | 4,085,876 | |
Net increase/(decrease) in net assets resulting from operations | | | (1,062,128) | | | | 2,380,020 | | | | (1,849,256) | | | | 4,239,025 | |
| | | |
DISTRIBUTIONS TO SHAREHOLDERS: | | | | | | | | | | | | | |
From net investment income | | | (307,279) | | | | (134,087) | | | | (610,565) | | | | (148,685) | |
From net realized gains | | | – | | | | – | | | | – | | | | (6,021) | |
From tax return of capital | | | – | | | | (51,870) | | | | – | | | | (88,105) | |
Total distributions | | | (307,279) | | | | (185,957) | | | | (610,565) | | | | (242,811) | |
| | | |
CAPITAL SHARE TRANSACTIONS: | | | | | | | | | | | | | |
Proceeds from sale of shares | | | 12,811,839 | | | | 31,091,332 | | | | 10,663,752 | | | | 62,717,368 | |
Cost of shares redeemed | | | (5,622,035) | | | | – | | | | (16,562,473) | | | | – | |
Net increase/(decrease) from share transactions | | | 7,189,804 | | | | 31,091,332 | | | | (5,898,721) | | | | 62,717,368 | |
Net increase/(decrease) in net assets | | | 5,820,397 | | | | 33,285,395 | | | | (8,358,542) | | | | 66,713,582 | |
| | | |
NET ASSETS | | | | | | | | | | | | | |
Beginning of period | | | 34,622,972 | | | | 1,337,577 | | | | 75,070,103 | | | | 8,356,521 | |
End of period * | | $ | 40,443,369 | | | $ | 34,622,972 | | | $ | 66,711,561 | | | $ | 75,070,103 | |
| | | | | | | | | | | | | | | | | |
| | | | |
*Including accumulated net investment income of: | | $ | 111,444 | | | $ | – | | | $ | 212,771 | | | $ | – | |
| | | | |
OTHER INFORMATION: | | | | | | | | | | | | | | | | |
CAPITAL SHARE TRANSACTIONS | | | | | | | | | | | | | |
Beginning shares | | | 1,200,002 | | | | 50,002 | | | | 2,450,002 | | | | 300,002 | |
Shares sold | | | 450,000 | | | | 1,150,000 | | | | 350,000 | | | | 2,150,000 | |
Shares redeemed | | | (200,002) | | | | – | | | | (550,002) | | | | – | |
Shares outstanding, end of period | | | 1,450,000 | | | | 1,200,002 | | | | 2,250,000 | | | | 2,450,002 | |
| | | | | | | | | | | | | | | | | |
| * | Effective January 23, 2015, the VelocityShares Tail Risk Hedged Large Cap ETF changed its name to the Janus Velocity Tail Risk Hedged Large Cap ETF. |
| ** | Effective January 23, 2015, the VelocityShares Volatility Hedged Large Cap ETF changed its name to the Janus Velocity Volatility Hedged Large Cap ETF. |
See Notes to Financial Statements.
11 | November 30, 2015
| | |
Janus Velocity Tail Risk Hedged Large Cap ETF |
| Financial Highlights | | For a Share Outstanding Throughout the Years Presented |
| | | | | | | | | | | | | | | |
| | | For the Year Ended November 30, 2015* | | For the Year Ended November 30, 2014 | | For the Period
June 21, 2013
(commencement
of operations) to November 30,
2013 |
NET ASSET VALUE, BEGINNING OF PERIOD | | | $ | 28.85 | | | | $ | 26.75 | | | | $ | 25.00 | |
| | |
INCOME/(LOSS) FROM INVESTMENT OPERATIONS: | | | | | | | | | | | |
Net investment income(a) | | | | 0.29 | | | | | 0.24 | | | | | 0.24 | |
Net realized and unrealized gain/(loss) | | | | (1.02) | | | | | 2.14 | | | | | 1.91 | |
Total from investment operations | | | | (0.73) | | | | | 2.38 | | | | | 2.15 | |
| | | |
DISTRIBUTIONS: | | | | | | | | | | | | | | | |
From net investment income | | | | (0.23) | | | | | (0.23) | | | | | (0.37) | |
From tax return of capital | | | | – | | | | | (0.05) | | | | | (0.03) | |
Total distributions | | | | (0.23) | | | | | (0.28) | | | | | (0.40) | |
| | | |
NET INCREASE/(DECREASE) IN NET ASSET VALUE | | | | (0.96) | | | | | 2.10 | | | | | 1.75 | |
NET ASSET VALUE, END OF PERIOD | | | $ | 27.89 | | | | $ | 28.85 | | | | $ | 26.75 | |
| | | | | | | | | | | | | | | | |
TOTAL RETURN(b) | | | | (2.52)% | | | | | 8.94% | | | | | 8.66% | |
| | | |
RATIOS/SUPPLEMENTAL DATA: | | | | | | | | | | | | | | | |
Net assets, end of period (000s) | | | $ | 40,443 | | | | $ | 34,623 | | | | $ | 1,338 | |
| | | |
Ratio of expenses to average net assets | | | | 0 .65% | | | | | 0.65% | | | | | 0.65%(c) | |
Ratio of net investment income to average net assets | | | | 1.03% | | | | | 0.89% | | | | | 2.21%(c) | |
Portfolio turnover rate(d) | | | | 11% | | | | | 2 % | | | | | 4% | |
| (a) | Based on average shares outstanding during the period. |
| (b) | Total return is calculated assuming an initial investment made at the net asset value at the beginning of the period and redemption at the net asset value on the last day of the period and assuming all distributions are reinvested at reinvestment prices. Total return calculated for a period of less than one year is not annualized. |
| (d) | Portfolio turnover for periods less than one year are not annualized and does not include securities received or delivered from processing creations or redemptions. |
| * | Effective January 23, 2015, the VelocityShares Tail Risk Hedged Large Cap ETF changed its name to the Janus Velocity Tail Risk Hedged Large Cap ETF. |
See Notes to Financial Statements.
12 | November 30, 2015
| | |
Janus Velocity Volatility Hedged Large Cap ETF |
| Financial Highlights | | For a Share Outstanding Throughout the Years Presented |
| | | | | | | | | | | | | | | |
| | | For the Year Ended November 30, 2015* | | For the Year Ended November 30, 2014 | | For the Period
June 21, 2013
(commencement
of operations) to November 30,
2013 |
NET ASSET VALUE, BEGINNING OF PERIOD | | | $ | 30.64 | | | | $ | 27.85 | | | | $ | 25.00 | |
| | |
INCOME/(LOSS) FROM INVESTMENT OPERATIONS: | | | | | | | | | | | |
Net investment income(a) | | | | 0.35 | | | | | 0.21 | | | | | 0.12 | |
Net realized and unrealized gain/(loss) | | | | (1.10) | | | | | 2.84 | | | | | 2.88 | |
Total from investment operations | | | | (0.75) | | | | | 3.05 | | | | | 3.00 | |
| | | |
DISTRIBUTIONS: | | | | | | | | | | | | | | | |
From net investment income | | | | (0.24) | | | | | (0.19) | | | | | (0.10) | |
From net realized gains | | | | – | | | | | (0.00) | (b) | | | | – | |
From tax return of capital | | | | – | | | | | (0.07) | | | | | (0.05) | |
Total distributions | | | | (0.24) | | | | | (0.26) | | | | | (0.15) | |
| | | |
NET INCREASE/(DECREASE) IN NET ASSET VALUE | | | | (0.99) | | | | | 2.79 | | | | | 2.85 | |
NET ASSET VALUE, END OF PERIOD | | | $ | 29.65 | | | | $ | 30.64 | | | | $ | 27.85 | |
| | | | | | | | | | | | | | | | |
TOTAL RETURN(c) | | | | (2.44)% | | | | | 11.00% | | | | | 12.04% | |
| | | |
RATIOS/SUPPLEMENTAL DATA: | | | | | | | | | | | | | | | |
Net assets, end of period (000s) | | | $ | 66,712 | | | | $ | 75,070 | | | | $ | 8,357 | |
| | | |
Ratio of expenses to average net assets | | | | 0.65% | | | | | 0.65% | | | | | 0.65%(d) | |
Ratio of net investment income to average net assets | | | | 1.15% | | | | | 0.71% | | | | | 1.05%(d) | |
Portfolio turnover rate(e) | | | | 4% | | | | | 1 % | | | | | 2% | |
| (a) | Based on average shares outstanding during the period. |
| (b) | Less than $0.005 per share. |
| (c) | Total return is calculated assuming an initial investment made at the net asset value at the beginning of the period and redemption at the net asset value on the last day of the period and assuming all distributions are reinvested at reinvestment prices. Total return calculated for a period of less than one year is not annualized. |
| (e) | Portfolio turnover for periods less than one year are not annualized and does not include securities received or delivered from processing creations or redemptions. |
| * | Effective January 23, 2015, the VelocityShares Volatility Hedged Large Cap ETF changed its name to the Janus Velocity Volatility Hedged Large Cap ETF. |
See Notes to Financial Statements.
13 | November 30, 2015
| | |
Janus Velocity ETFs |
| Notes to Financial Statements 2015 | | November 30, 2015 |
1. ORGANIZATION
The ALPS ETF Trust (the “Trust”), a Delaware statutory trust, is an open-end management investment company registered under the Investment Company Act of 1940, as amended (the “1940 Act”). As of November 30, 2015, the Trust consists of twenty-one separate portfolios. Each portfolio represents a separate series of the Trust. This report pertains to the Janus Velocity Tail Risk Hedged Large Cap ETF and Janus Velocity Volatility Hedged Large Cap ETF (each a “Fund” and collectively, the “Funds”). Effective January 23, 2015, the VelocityShares Tail Risk Hedged Large Cap ETF and the VelocityShares Volatility Hedged Large Cap ETF changed their names to the Janus Velocity Tail Risk Hedged Large Cap ETF and the Janus Velocity Volatility Hedged Large Cap ETF, respectively.
The investment objective of the Janus Velocity Tail Risk Hedged Large Cap ETF is to seek investment results that correspond generally to the performance, before fees and expenses, of its underlying index, the VelocityShares Tail Risk-Hedged Large Cap Index. The investment objective of the Janus Velocity Volatility Hedged Large Cap ETF is to seek investment results that correspond generally to the performance, before fees and expenses, of its underlying index, the VelocityShares Volatility Hedged Large Cap Index (together with the VelocityShares Tail Risk Hedged Large Cap Index, the “Underlying Indexes”). Each Fund is considered non-diversified and may invest a greater portion of assets in securities of individual issuers than a diversified fund. As a result, changes in the market value of a single investment could cause greater fluctuations in share price than would occur in a diversified fund.
Shares of the Funds are listed on the New York Stock Exchange (“NYSE”) Arca. Each Fund issues and redeems Shares on a continuous basis, at net asset value (“NAV”), in blocks of 50,000 Shares, each of which is called a “Creation Unit”. A portion of Creation Units are issued and redeemed in securities and/or derivatives included in a specified index and will be created and redeemed in-kind. Except when aggregated in Creation Units, Shares are not redeemable securities of the Fund.
Pursuant to the Trust’s organizational documents, its Officers and Trustees are indemnified against certain liability arising out of the performance of their duties to the Trust. Additionally, in the normal course of business, the Trust enters into contracts with service providers that contain general indemnification clauses. The Trust’s maximum exposure under these arrangements is unknown, as this would involve future claims that may be made against the Trust that have not yet occurred.
2. SIGNIFICANT ACCOUNTING POLICIES
The following is a summary of significant accounting policies consistently followed by the Funds in the preparation of the financial statements. The accompanying financial statements were prepared in accordance with accounting principles generally accepted in the United States of America (“U.S. GAAP”). The preparation of financial statements in conformity with U.S. GAAP requires management to make certain estimates and assumptions that affect the reported amounts of assets and liabilities and disclosures of contingent assets and liabilities at the date of the financial statements and the reported amounts of revenue and expenses during the period. Actual results could differ from those estimates. Each Fund is considered an investment company under U.S. GAAP and follows the accounting and reporting guidance applicable to investment companies in the Financial Accounting Standards Board Accounting Standards Codification Topic 946.
A. Portfolio Valuation
Each Fund’s NAV is determined daily, as of the close of regular trading on the NYSE, normally 4:00 p.m. Eastern Time, on each day the NYSE is open for trading. The NAV is computed by dividing the value of all assets of the Fund (including accrued interest and dividends), less all liabilities (including accrued expenses and dividends declared but unpaid), by the total number of shares outstanding.
Portfolio securities listed on any exchange other than the NASDAQ Stock Market LLC (“NASDAQ”) are valued at the last sale price on the business day as of which such value is being determined. If there has been no sale on such day, the securities are valued at the mean of the most recent bid and ask prices on such day. Securities traded on the NASDAQ are valued at the NASDAQ Official Closing Price as determined by NASDAQ. Portfolio securities traded on more than one securities exchange are valued at the last sale price on the business day as of which such value is being determined at the close of the exchange representing the principal market for such securities. Portfolio securities traded in the over-the-counter market, but excluding securities traded on the NASDAQ, are valued at the latest quoted sale price in such market. Over-the-counter swap contracts for which market quotations are readily available are valued based on quotes received from independent pricing services or one or more dealers that make markets in such securities.
Each Fund’s investments are valued at market value or, in the absence of market value with respect to any portfolio securities, at fair value according to procedures adopted by the Trust’s Board of Trustees (the “Board”). When market quotations are not readily available or when events occur that make established valuation methods unreliable, securities of the Fund may be valued in good faith by or under the direction of the Board. These securities generally include, but are not limited to, restricted securities (securities which may not be publicly sold without registration under the Securities Act of 1933) for which a pricing service is unable to provide a market price; securities whose trading has been formally suspended; a security whose market price is not available from a pre-established primary pricing source or the pricing source is not willing to
14 | November 30, 2015
| | |
Janus Velocity ETFs | | |
| Notes to Financial Statements | | November 30, 2015 |
provide a price; a security with respect to which an event has occurred that is most likely to materially affect the value of the security after the market has closed but before the calculation of the Fund’s NAV or make it difficult or impossible to obtain a reliable market quotation; or a security whose price, as provided by the pricing service, does not reflect the security’s “fair value” due to the security being de-listed from a national exchange or the security’s primary trading market is temporarily closed at a time when, under normal conditions, it would be open. As a general principle, the current “fair value” of a security would be the amount which the owner might reasonably expect to receive from the closing sale prices on the applicable exchange and fair value prices may not reflect the actual value of a security. A variety of factors may be considered in determining the fair value of such securities.
B. Fair Value Measurements
Each Fund discloses the classification of its fair value measurements following a three-tier hierarchy based on the inputs used to measure fair value. Inputs refer broadly to the assumptions that market participants would use in pricing the asset or liability, including assumptions about risk. Inputs may be observable or unobservable. Observable inputs reflect the assumptions market participants would use in pricing the asset or liability that are developed based on market data obtained from sources independent of the reporting entity. Unobservable inputs reflect the reporting entity’s own assumptions about the assumptions market participants would use in pricing the asset or liability that are developed based on the best information available.
Valuation techniques used to value the Funds’ investments by major category are as follows:
Exchange Traded Funds, for which market quotations are readily available, are valued at the last reported sale price or official closing price as reported by a third party pricing vendor on the primary market or exchange on which they are traded and are categorized as Level 1 in the hierarchy. In the event there were no sales during the day or closing prices are not available, securities are valued at the mean of the most recent quoted bid and ask prices on such day and are generally categorized as Level 2 in the hierarchy. Investments in open-end mutual funds are valued at their closing NAV each business day and are categorized as Level 1 in the hierarchy. Over-the-counter swap contracts are valued based on quotes received from independent pricing services and are categorized as Level 2 in the hierarchy.
Changes in valuation techniques may result in transfers in or out of an assigned level within the disclosure hierarchy.
Various inputs are used in determining the value of each Fund’s investments as of the end of the reporting period. When inputs used fall into different levels of the fair value hierarchy, the level in the hierarchy within which the fair value measurement falls is determined based on the lowest level input that is significant to the fair value measurement in its entirety. The designated input levels are not necessarily an indication of the risk or liquidity associated with these investments.
These inputs are categorized in the following hierarchy under applicable financial accounting standards:
| | Level 1 – | Unadjusted quoted prices in active markets for identical investments, unrestricted assets or liabilities that a Fund has the ability to access at the measurement date; |
| | Level 2 – | Quoted prices which are not active, quoted prices for similar assets or liabilities in active markets or inputs other than quoted prices that are observable (either directly or indirectly) for substantially the full term of the asset or liability; and |
| | Level 3 – | Significant unobservable prices or inputs (including the Fund’s own assumptions in determining the fair value of investments) where there is little or no market activity for the asset or liability at the measurement date. |
The following is a summary of the inputs used to value each Fund’s investments at November 30, 2015:
Janus Velocity Tail Risk Hedged Large Cap ETF
| | | | | | | | | | | | | | | | |
| Investments in Securities at Value | | Level 1 - Unadjusted
Quoted Prices | | | Level 2 - Unadjusted
Quoted Prices | | | Level 3 - Unadjusted
Quoted Prices | | | Total | |
Exchange Traded Funds | | $ | 34,464,015 | | | $ | – | | | $ | – | | | $ | 34,464,015 | |
Total | | $ | 34,464,015 | | | $ | – | | | $ | – | | | $ | 34,464,015 | |
| | | | | | | | | | | | | | | | | |
| | | | |
| | | | | | | | | | | | | | | | |
Other Financial Instruments* | | | | | | | | | | | | | | | | |
Liabilities | | | | | | | | | | | | | | | | |
Total Return Swap Contracts | | $ | – | | | $ | (1,915,627) | | | $ | – | | | $ | (1,915,627) | |
Total | | $ | – | | | $ | (1,915,627) | | | $ | – | | | $ | (1,915,627) | |
| | | | | | | | | | | | | | | | | |
15 | November 30, 2015
| | |
Janus Velocity ETFs | | |
| Notes to Financial Statements | | November 30, 2015 |
Janus Velocity Volatility Hedged Large Cap ETF
| | | | | | | | | | | | | | | | |
| Investments in Securities at Value | | Level 1 - Unadjusted
Quoted Prices | | | Level 2- Unadjusted
Quoted Prices | | | Level 3- Unadjusted
Quoted Prices | | | Total | |
Exchange Traded Funds | | $ | 56,882,178 | | | $ | – | | | $ | – | | | $ | 56,882,178 | |
Total | | $ | 56,882,178 | | | $ | – | | | $ | – | | | $ | 56,882,178 | |
| | | | | | | | | | | | | | | | | |
| | | | |
| | | | | | | | | | | | | | | | |
Other Financial Instruments* | | | | | | | | | | | | | | | | |
Liabilities | | | | | | | | | | | | | | | | |
Total Return Swap Contracts | | $ | – | | | $ | (2,899,083) | | | $ | – | | | $ | (2,899,083) | |
Total | | $ | – | | | $ | (2,899,083) | | | $ | – | | | $ | (2,899,083) | |
| | | | | | | | | | | | | | | | | |
| *Other | financial instruments are instruments not reflected in the Schedule of Investments. |
Each Fund recognizes transfers between levels as of the end of the period. For the year ended November 30, 2015, none of the Funds had any transfers between Level 1 and Level 2 securities. The Funds did not have any securities which used significant unobservable inputs (Level 3) in determining fair value.
C. Concentration of Risk
Each Fund seeks to track its respective Underlying Index, which may have concentrations in certain regions, economies, countries, markets, industries or sectors. Underperformance or increased risk in such concentrated areas may result in underperformance or increased risk in a Fund.
D. Securities Transactions and Investment Income
Securities transactions are recorded as of the trade date. Realized gains and losses from securities transactions are recorded on the highest cost basis. Dividend income and capital gains distributions, if any, are recorded on the ex-dividend date. Interest income, if any, is recorded on the accrual basis.
E. Dividends and Distributions to Shareholders
Dividends from net investment income of each Fund, if any, are declared and paid quarterly or as the Board may determinefrom time to time. Distributions of net realized capital gains earned by each Fund, if any, are distributed at least annually.
F. Federal Tax and Tax Basis Information
The timing and character of income and capital gain distributions are determined in accordance with income tax regulations, which may differ from U.S. GAAP. Reclassifications are made to the Fund’s capital accounts for permanent tax differences to reflect income and gains available for distribution (or available capital loss carryforwards) under income tax regulations.
For the year ended November 30, 2015, permanent book and tax differences resulting primarily from in-kind transactions were identified and reclassified among the components of the Funds’ net assets as follows:
| | | | | | | | | | | | |
| | | | | | Accumulated Net | | | Accumulated Net Realized | |
| Fund | | Paid-in Capital | | | Investment Loss | | | Gain/ (Loss) on Investments | |
Janus Velocity Tail Risk Hedged Large Cap ETF | | $ | 569,380 | | | $ | – | | | $ | (569,380 | ) |
Janus Velocity Volatility Hedged Large Cap ETF | | | 2,493,554 | | | | – | | | | (2,493,554 | ) |
Net investment income and net realized (loss), as disclosed on the Statement of Operations, and net assets were not affected by their reclassifications.
16 | November 30, 2015
| | |
Janus Velocity ETFs |
| Notes to Financial Statements | | November 30, 2015 |
The tax character of the distributions paid by the Funds during the years ended November 30, 2015 and November 30 2014 were as follows:
| | | | | | | | | | | | |
| | | Ordinary Income | | | Long Term Capital Gain | | | Return of Capital | |
November 30, 2015 | | | | | | | | | | | | |
Janus Velocity Tail Risk Hedged Large Cap ETF | | $ | 307,279 | | | $ | – | | | $ | – | |
Janus Velocity Volatility Hedged Large Cap ETF | | | 610,565 | | | | – | | | | – | |
November 30, 2014 | | | | | | | | | | | | |
Janus Velocity Tail Risk Hedged Large Cap ETF | | $ | 134,087 | | | $ | – | | | | 51,870 | |
Janus Velocity Volatility Hedged Large Cap ETF | | | 148,685 | | | | 6,021 | | | | 88,105 | |
As of November 30, 2015, the components of distributable earnings on a tax basis for each Fund were as follows:
| | | | | | | | | | |
| | | Janus Velocity Tail
Risk Hedged Large
Cap ETF | | Janus Velocity
Volatility Hedged Large
Cap ETF |
Undistributed net investment income | | | $ | 111,444 | | | | $ | 212,771 | |
Accumulated net realized gain/(loss) on investments | | | | (733,299) | | | | | (1,083,779) | |
Net unrealized appreciation on investments | | | | 967,428 | | | | | 667,007 | |
Total | | | $ | 345,573 | | | | $ | (204,001) | |
| | | | | | | | | | |
At November 30, 2015, the Funds had available for tax purposes unused capital loss carryforwards as follows:
| | | | | | | | |
| Fund | | Short-Term | | | Long-Term | |
Janus Velocity Tail Risk Hedged Large Cap ETF | | $ | 709,498 | | | $ | 23,801 | |
Janus Velocity Volatility Hedged Large Cap ETF | | | 1,083,779 | | | | – | |
As of November 30, 2015, the costs of investments for federal income tax purposes and accumulated net unrealized appreciation/(depreciation) on investments were as follows:
| | | | | | | | | | | | | | | | | | | | |
| | | Gross Appreciation
(excess of value over tax cost) | | Net
Appreciation/(Depreciation)
of Foreign Currency and Derivatives | | Net Unrealized
Appreciation | | Cost of Investments for
Income Tax Purposes |
Janus Velocity Tail Risk Hedged Large Cap ETF | | | $ | 2,883,055 | | | | $ | (1,915,627 | ) | | | $ | 967,428 | | | | $ | 31,580,960 | |
Janus Velocity Volatility Hedged Large Cap ETF | | | | 3,566,090 | | | | | (2,899,083 | ) | | | | 667,007 | | | | | 53,316,088 | |
The differences between book-basis and tax-basis are primarily due to the deferral of losses from wash sales.
G. Income Taxes
No provision for income taxes is included in the accompanying financial statements, as each Fund intends to distribute to shareholders all taxable investment income and realized gains and otherwise comply with Subchapter M of the Internal Revenue Code of 1986, as amended, applicable to regulated investment companies. Each Fund evaluates tax positions taken (or expected to be taken) in the course of preparing each Fund’s tax returns to determine whether these positions meet a “more-likely-than-not” standard that, based on the technical merits, have a more than fifty percent likelihood of being sustained by a taxing authority upon examination. A tax position that meets the “more-likely-than-not” recognition threshold is measured to determine the amount of benefit to recognize in the financial statements.
As of and during the year ended November 30, 2015, none of the Funds had a liability for any unrecognized tax benefits. Each Fund files U.S. federal, state, and local tax returns as required. Each Fund’s tax returns are subject to examination by the relevant tax authorities until expiration of the applicable statute of limitations which is generally three years after the filing of the tax return, but may extend to four years in certain jurisdictions. Tax returns for open years incorporate no uncertain tax positions that require a provision for income taxes.
17 | November 30, 2015
| | |
Janus Velocity ETFs |
| Notes to Financial Statements | | November 30, 2015 |
3. DERIVATIVE INSTRUMENTS AND HEDGING ACTIVITIES
As a part of their investment strategy, the Funds are permitted to purchase investment securities, and enter into various types of derivatives contracts. In doing so, the Funds employ strategies in differing combinations that permit them to increase, decrease, or change the level or types of exposure to market factors. Central to those strategies are features inherent in derivatives that make them more attractive for this purpose than equity or debt securities; they require little or no initial cash investment, they can focus exposure on only certain selected risk factors, and they may not require the ultimate receipt or delivery of the underlying security (or securities) to the contract. This may allow the Funds to pursue their objectives more quickly and efficiently than if they were to make direct purchases or sales of securities capable of affecting a similar response to market factors.
Cash collateral that has been pledged to cover derivative obligations of the Funds, if any, is reported separately on the Statements of Assets and Liabilities as deposit with broker for total return swaps. Non-cash collateral pledged by the Funds, if any, is noted in the Schedules of Investments.
Swaps are marked to market daily using either pricing vendor quotations, counterparty prices or model prices and the change in value, if any, is recorded as an unrealized gain or loss.
Upfront payments made and/or received by the Funds are recorded as an asset and/or liability. Payments are received or made upon termination of the swap contracts and are recorded as realized gains or losses. These gains or losses realized upon termination of a swap contract are recorded on the Statement of Operations.
A Fund’s use of derivative instruments involves risks different from, or possibly greater than, the risks associated with investing directly in securities and other traditional investments. Derivatives are subject to a number of risks including liquidity risk, market risk, credit risk, default risk, counterparty risk and management risk. They also involve the risk of mispricing or improper valuation and the risk that changes in the value of the derivative may not correlate exactly with the change in the value of the underlying asset, rate or index.
Market Risk Factors: In pursuit of their investment objectives, certain Funds may seek to use derivatives to increase or decrease their exposure to the following market risk factors:
Credit Risk: Credit risk is the risk an issuer will be unable to make principal and interest payments when due, or will default on its obligations.
Equity Risk: Equity risk relates to the change in value of equity securities as they relate to increases or decreases in the general market.
Swaps: Swap agreements are contracts between parties in which one party agrees to make periodic payments to the other party (the “Counterparty”) based on the change in market value or level of a specified rate, index or asset. In return, the Counterparty agrees to make periodic payments to the first party based on the return of a different specified rate, index or asset. Swap agreements will usually be done on a net basis, the Funds receiving or paying only the net amount of the two payments. The net amount of the excess, if any, of the Funds’ obligations over its entitlements with respect to each swap is accrued on a daily basis and an amount of cash or highly liquid securities having an aggregate value at least equal to the accrued excess is maintained in an account at the Trust’s custodian bank. The use of interest rate and index swaps is a highly specialized activity that involves investment techniques and risks different from those associated with ordinary portfolio security transactions. These transactions generally do not involve the delivery of securities or other underlying assets or principal. The use of swap agreements involves certain risks. For example, if the Counterparty under a swap agreement defaults on its obligation to make payments due from it, as a result of its bankruptcy or otherwise, the Funds may lose such payments altogether, or collect only a portion thereof, which collection could involve costs or delays.
Swap Risk: The Funds use swap agreements to obtain exposure to the volatility component of each Fund’s underlying index. Swap agreements provide that when the period payment dates for both parties are the same, the payments are made on a net basis (i.e., the two payment streams are netted out, with only the net amount paid by one party to the other). The Fund’s obligations or rights under a swap contract entered into on a net basis will generally be equal only to the net amount to be paid or received under the agreement, based on the relative values of the positions held by each counterparty and any periodic financing charges. The swap agreements are traded over the counter. The counterparty to swap agreements is generally a single bank or other financial institution, rather than a clearing organization backed by a group of financial institutions.
As a result, the Funds are subject to credit risk with respect to amounts they expect to receive from counterparties to swaps entered into as part of their principal investment strategies. If a counterparty becomes bankrupt or otherwise fails to perform its obligations due to financial difficulties, the Funds could suffer significant losses on these contracts and the value of an investor’s investment in the Funds may decline. The Funds typically enter into swap transactions only with large, well capitalized and well established financial institutions. Swaps are less marketable because they are not traded on an exchange, do not have uniform terms and conditions, and are entered into based upon the creditworthiness of the parties and the availability of credit support, such as collateral, and in general, are not transferable without the consent of the counterparty. Swap agreements may entail breakage costs if terminated prior to the final maturity date.
18 | November 30, 2015
| | |
Janus Velocity ETFs |
| Notes to Financial Statements | | November 30, 2015 |
During the year ended November 30, 2015, the Funds invested in swap agreements consistent with their investment strategies to gain exposure to certain indices. Swap agreements held at November 30, 2015 are disclosed in the Schedules of Investments.
The effect of derivative instruments on the Statements of Assets and Liabilities for the year ended November 30, 2015:
| | | | | | | | | | | | |
Risk Exposure | | Asset Derivatives Statement of Assets and Liabilities Location | | Fair Value | | | Liability Derivatives Statement of Assets and Liabilities Location | | Fair Value | |
Janus Velocity Tail Risk Hedged Large CapETF | | | | | | | | | | | | |
| | | | |
Equity Contracts (Total Return Swap Contracts) | | Unrealized appreciation on total return swap contracts | | $ | – | | | Unrealized depreciation on total return swap contracts | | $ | 1,915,627 | |
Total | | | | $ | – | | | | | $ | 1,915,627 | |
| | | | | | | | | | | | | |
Janus Velocity Volatility Hedged Large Cap ETF | | | | | | | | | | | | |
| | | | |
Equity Contracts (Total Return Swap Contracts) | | Unrealized appreciation on total return swap contracts | | $ | – | | | Unrealized depreciation on total return swap contracts | | $ | 2,899,083 | |
Total | | | | $ | – | | | | | $ | 2,899,083 | |
| | | | | | | | | | | | | |
The gains/(losses) in the table below are included in the “Net realized gain/(loss)” or “Net change in unrealized gain/(loss)” on the Statements of Operations.
The effect of derivative Instruments on the Statements of Operations for the year ended November 30, 2015:
| | | | | | | | | | |
| Risk Exposure | | Location of Loss on
Derivatives Recognized in Income | | Realized
Loss on
Derivatives
Recognized
in Income | | | Change in
Unrealized
Depreciation
on Derivatives
Recognized in
Income | |
Janus Velocity Tail Risk Hedged Large Cap ETF | | | | | | | | | | |
| | | |
Equity Contracts (Total Return Swap Contracts) | | Net realized loss on total return swap contracts/Net change in unrealized depreciation on total return swap contracts | | $ | (765,768 | ) | | $ | (1,046,788 | ) |
Total | | | | $ | (765,768 | ) | | $ | (1,046,788 | ) |
| | | | | | | | | | | |
Janus Velocity Volatility Hedged Large Cap ETF | | | | | | | | | | |
| | | |
Equity Contracts (Total Return Swap Contracts) | | Net realized loss on total return swap contracts/Net change in unrealized depreciation on total return swap contracts | | $ | (1,050,238 | ) | | $ | (2,039,451 | ) |
Total | | | | $ | (1,050,238 | ) | | $ | (2,039,451 | ) |
| | | | | | | | | | | |
Volume of derivative instruments for the Funds for the year ended November 30, 2015 was as follows:
| | | | | | | | |
| Derivative Type | | Unit of Measurement | | Monthly Average | | | |
Janus Velocity Tail Risk Hedged Large Cap ETF | | | | | | | | |
Total Return Swap Contracts | | Notional Amount | | $ | 7,309,245 | | | |
| | | |
Janus Velocity Volatility Hedged Large Cap ETF | | | | | | | | |
Total Return Swap Contracts | | Notional Amount | | $ | 11,904,585 | | | |
U.S. GAAP requires an entity that has financial instruments that are either (1) offset or (2) subject to an enforceable master netting arrangement or similar agreement to disclose information about offsetting and related arrangements to enable users of its financial statements to understand the effect of those arrangements on its financial position.
19 | November 30, 2015
| | |
Janus Velocity ETFs |
| Notes to Financial Statements | | November 30, 2015 |
The following table presents financial instruments that are subject to enforceable netting arrangements or other similar agreements as of November 30, 2015:
| | | | | | | | | | | | | | | | | | | | | | | | |
| Offsetting of Derivatives Liabilities | |
| November 30, 2015 | |
| | | | | | | | | | | | Gross Amounts Not Offset in the Statement of Assets and Liabilities | |
| Description | | Gross Amounts of
Recognized
Liabilities | | | Gross Amounts
Offset in the
Statement of
Assets and
Liabilities | | | Net Amounts
Presented in the
Statement of
Assets and
Liabilities | | | Financial
Instruments | | | Cash Collateral
Pledged | | | Net Amount
Payable | |
Janus Velocity Tail Risk Hedged Large Cap ETF | |
Total Return Swap Contracts | | $ | (1,915,627 | ) | | $ | – | | | $ | (1,915,627 | ) | | $ | – | | | $ | 1,915,627 | | | $ | – | |
| |
Total | | $ | (1,915,627 | ) | | $ | – | | | $ | (1,915,627 | ) | | $ | – | | | $ | 1,915,627 | | | $ | – | |
| |
|
Janus Velocity Volatility Hedged Large Cap ETF | |
Total Return Swap Contracts | | $ | (2,899,083 | ) | | $ | – | | | $ | (2,899,083 | ) | | $ | – | | | $ | 2,899,083 | | | $ | – | |
| |
Total | | $ | (2,899,083 | ) | | $ | – | | | $ | (2,899,083 | ) | | $ | – | | | $ | 2,899,083 | | | $ | – | |
| |
4. INVESTMENT ADVISORY FEE AND OTHER AFFILIATED TRANSACTIONS
ALPS Advisors, Inc. (the “Adviser”) acts as each Fund’s investment adviser pursuant to an advisory agreement with the Trust on behalf of each Fund (the “Advisory Agreement”). Pursuant to the Advisory Agreement, each Fund pays the Adviser a unitary fee for the services and facilities it provides, payable on a monthly basis, at the annual rates listed below. From time to time, the Adviser may waive all or a portion of its fee.
| | | | | | | |
| Fund | | Advisory Fee | | |
Janus Velocity Tail Risk Hedged Large Cap ETF | | 0.65% | | |
Janus Velocity Volatility Hedged Large Cap ETF | | 0.65% | | |
Out of the unitary management fee, the Adviser pays substantially all expenses of each Fund, including the cost of transfer agency, custody, fund administration, legal, audit, independent trustees and other services, except for acquired fund fees and expenses, interest expenses, distribution fees or expenses, brokerage expenses, taxes and extraordinary expenses, such as litigation and other expenses not incurred in the ordinary course of each Fund’s business. The Adviser’s unitary management fee is designed to pay substantially all of each Fund’s expenses and to compensate the Adviser for providing services for the each Fund.
ALPS Fund Services, Inc., an affiliate of the Adviser, is the administrator of the Funds.
Each Trustee who is not an officer or employee of the Adviser, any sub-adviser or any of their affiliates (“Independent Trustees”) receives (1) a quarterly retainer of $5,000, (2) a per meeting fee for regularly scheduled meetings of $3,750, (3) $1,500 for any special meeting held outside of a regularly scheduled board meeting, and (4) reimbursement for all reasonable out-of-pocket expenses relating to attendance at meetings.
5. PURCHASES AND SALES OF SECURITIES
For the year ended November 30, 2015, the cost of purchases and proceeds from sales of investment securities, excluding short-term investments and in-kind transactions, were as follows:
| | | | | | | | | | |
| | | Purchases | | | Sales | | | |
Janus Velocity Tail Risk Hedged Large Cap ETF | | $ | 3,709,657 | | | $ | 4,875,805 | | | |
Janus Velocity Volatility Hedged Large Cap ETF | | | 2,260,860 | | | | 4,785,979 | | | |
20 | November 30, 2015
| | |
Janus Velocity ETFs | | |
| Notes to Financial Statements | | November 30, 2015 |
For the year ended November 30, 2015, the cost of in-kind purchases and proceeds from in-kind sales, were as follows:
| | | | | | | | |
| | | Purchases | | | Sales | |
| |
Janus Velocity Tail Risk Hedged Large Cap ETF | | $ | 9,800,663 | | | $ | 4,028,087 | |
Janus Velocity Volatility Hedged Large Cap ETF | | | 9,098,113 | | | | 14,148,705 | |
The Janus Velocity Tail Risk Hedged Large Cap ETF and the Janus Velocity Volatility Hedged Large Cap ETF had in-kind net realized gain/(loss) of $569,380 and 2,493,961, respectively.
Gains on in-kind transactions are not considered taxable for federal income tax purposes.
6. CAPITAL SHARE TRANSACTIONS
Shares are created and redeemed by each Fund only in Creation Unit size aggregations of 50,000. Only broker-dealers or large institutional investors with creation and redemption agreements called Authorized Participants (“AP”) are permitted to purchase or redeem Creation Units from the Fund. Such transactions are generally permitted on an in-kind basis, with a balancing cash component to equate the transaction to the NAV per unit of each Fund on the transaction date. Cash may be substituted equivalent to the value of certain securities generally when they are not available in sufficient quantity for delivery, not eligible for trading by the AP or as a result of other market circumstances.
21 | November 30, 2015
| | |
Janus Velocity ETFs |
| Additional Information | | November 30, 2015 (Unaudited) |
PROXY VOTING RECORDS, POLICIES AND PROCEDURES
Information regarding how the Fund voted proxies relating to portfolio securities during the most recent 12-month period ended June 30 and a description of the Fund’s proxy voting policies and procedures used in determining how to vote for proxies are available without charge on the Securities and Exchange Commission’s (“SEC”) website at www.sec.gov and upon request, by calling (toll-free) 1-866-675-2639.
PORTFOLIO HOLDINGS
The Trust is required to disclose, after its first and third fiscal quarters, the complete schedule of each Fund’s portfolio holdings with the SEC on Form N-Q. Form N-Q for each Fund will be available on the SEC’s website at www.sec.gov. Each Fund’s Form N-Q may also be reviewed and copied at the SEC’s Public Reference Room in Washington, D.C. and information on the operation of the Public Reference Room may be obtained by calling 1-800-SEC-0330. Each Fund’s Form N-Q will be available without charge, upon request, by calling (toll-free) 1-866-675-2639 or by writing to ALPS ETF Trust at 1290 Broadway, Suite 1100, Denver, Colorado 80203.
TAX INFORMATION (Unaudited)
The Funds designate the following for federal income tax purposes for distributions made during the calendar year ended December 31, 2014:
| | | | |
| | | Qualified Dividend Income | | Dividend Received Deduction |
|
Janus Velocity Tail Risk Hedged Large Cap ETF | | 100.00% | | 100.00% |
Janus Velocity Tail Risk Hedged Large Cap ETF | | 100.00% | | 100.00% |
In early 2015, if applicable, shareholders of record received this information for the distributions paid to them by the Funds during the calendar year 2014 via Form 1099. The Funds will notify shareholders in early 2016 of amounts paid to them by the Funds, if any, during the calendar year 2015.
LISCENSING AGREEMENTS
VelocityShares Tail Risk Hedged Large Cap ETF
The VelocityShares Tail Risk Hedged Large Cap Index is the exclusive property of Janus Index and Calculation Services, a division of VelocityShares LLC.
Neither Janus Index and Calculation Services, VelocityShares LLC (together, “VelocityShares”) nor any other party makes any representation or warranty, express or implied, to the owners of the Funds or any member of the public regarding the advisability of investing in the Funds generally or the similarities or variations between the performance of the index and the performance of the underlying security. VelocityShares is the licensor of certain trademarks, service marks and trade names of VelocityShares and of the index which is determined, composed and calculated by VelocityShares without regard to the issuer of the Funds. Neither VelocityShares nor any other party guarantees the accuracy and/or the completeness of the indices or any date included therein. VelocityShares disclaims all warranties of merchantability or fitness for any particular purpose with respect to the indices or any data included therein.
ALTHOUGH VELOCITYSHARES SHALL OBTAIN INFORMATION FOR INCLUSION IN OR FOR USE IN THE CALCULATION OF THE INDEXES FROM SOURCES WHICH VELOCITYSHARES CONSIDERS RELIABLE, NEITHER VELOCITYSHARES NOR ANY OTHER PARTY GUARANTEES THE ACCURACY AND/OR THE COMPLETENESS OF THE INDEXES OR ANY DATA INCLUDED THEREIN. NEITHER VELOCITYSHARES NOR ANY OTHER PARTY MAKES ANY WARRANTY, EXPRESS OR IMPLIED, AS TO RESULTS TO BE OBTAINED BY LICENSEE, LICENSEE’S CUSTOMERS AND COUNTERPARTIES, HOLDERS OF THE FUNDS, OR ANY OTHER PERSON OR ENTITY FROM THE USE OF THE INDEXES OR ANY OTHER DATA INCLUDED THEREIN IN CONNECTION WITH THE RIGHTS LICENSED HEREUNDER OR FOR ANY OTHER USE. NEITHER VELOCITYSHARES NOR ANY OTHER PARTY MAKES ANY EXPRESS OR IMPLIED WARRANTIES OF MERCHANTABILITY OR FITNESS FOR A PARTICULAR PURPOSE WITH RESPECT TO THE INDEXES OR ANY DATA INCLUDED THEREIN AND VELOCITYSHARES HEREBY EXPRESSLY DISCLAIMS ALL SUCH WARRANTIES. WITHOUT LIMITING ANY OF THE FOREGOING, IN NO EVENT SHALL VELOCITYSHARES OR ANY OTHER PARTY HAVE ANY LIABILITY FOR ANY DIRECT, INDIRECT, SPECIAL, PUNITIVE, CONSEQUENTIAL OR ANY OTHER DAMAGES (INCLUDING LOST PROFITS) EVEN IF NOTIFIED OF THE POSSIBILITY OF SUCH DAMAGES.
22 | November 30, 2015
| | |
Janus Velocity ETFs |
| Additional Information | | November 30, 2015 (Unaudited) |
VelocityShares Volatility Hedged Large Cap ETF
The VelocityShares Volatility Hedged LargeCap Index is the exclusive property of Janus Index and Calculation Services, a division of VelocityShares LLC.
Neither Janus Index and Calculation Services, VelocityShares LLC (together, “VelocityShares”) nor any other party makes any representation or warranty, express or implied, to the owners of the Funds or any member of the public regarding the advisability of investing in the Funds generally or the similarities or variations between the performance of the index and the performance of the underlying security. VelocityShares is the licensor of certain trademarks, service marks and trade names of VelocityShares and of the index which is determined, composed and calculated by VelocityShares without regard to the issuer of the Funds. Neither VelocityShares nor any other party guarantees the accuracy and/or the completeness of the indices or any date included therein. VelocityShares disclaims all warranties of merchantability or fitness for any particular purpose with respect to the indices or any data included therein.
ALTHOUGH VELOCITYSHARES SHALL OBTAIN INFORMATION FOR INCLUSION IN OR FOR USE IN THE CALCULATION OF THE INDEXES FROM SOURCES WHICH VELOCITYSHARES CONSIDERS RELIABLE, NEITHER VELOCITYSHARES NOR ANY OTHER PARTY GUARANTEES THE ACCURACY AND/OR THE COMPLETENESS OF THE INDEXES OR ANY DATA INCLUDED THEREIN. NEITHER VELOCITYSHARES NOR ANY OTHER PARTY MAKES ANY WARRANTY, EXPRESS OR IMPLIED, AS TO RESULTS TO BE OBTAINED BY LICENSEE, LICENSEE’S CUSTOMERS AND COUNTERPARTIES, HOLDERS OF THE FUNDS, OR ANY OTHER PERSON OR ENTITY FROM THE USE OF THE INDEXES OR ANY OTHER DATA INCLUDED THEREIN IN CONNECTION WITH THE RIGHTS LICENSED HEREUNDER OR FOR ANY OTHER USE. NEITHER VELOCITYSHARES NOR ANY OTHER PARTY MAKES ANY EXPRESS OR IMPLIED WARRANTIES OF MERCHANTABILITY OR FITNESS FOR A PARTICULAR PURPOSE WITH RESPECT TO THE INDEXES OR ANY DATA INCLUDED THEREIN AND VELOCITYSHARES HEREBY EXPRESSLY DISCLAIMS ALL SUCH WARRANTIES. WITHOUT LIMITING ANY OF THE FOREGOING, IN NO EVENT SHALL VELOCITYSHARES OR ANY OTHER PARTY HAVE ANY LIABILITY FOR ANY DIRECT, INDIRECT, SPECIAL, PUNITIVE, CONSEQUENTIAL OR ANY OTHER DAMAGES.
23 | November 30, 2015
| | |
Janus Velocity ETFs |
| Board Considerations Regarding Approval of Investment Advisory Agreements | | November 30, 2015 (Unaudited) |
At an in-person meeting held on June 8, 2015, the Board of Trustees of the Trust (the “Board” or the “Trustees”), including the Trustees who are not “interested persons” of the Trust within the meaning of the 1940 Act, as amended (the “Independent Trustees”), evaluated a proposal to approve the continuance of the Advisory Agreements between the Trust and ALPS Advisors, Inc. (the “Adviser”) with respect to each of the following funds, Janus Velocity Tail Risk Hedged Large Cap ETF (“TRSK”), Janus Velocity Volatility Hedged Large Cap ETF (“SPXH”) (each a “Fund” and collectively “the Funds”). The Independent Trustees also met separately to consider the Advisory Agreements.
In evaluating the Investment Advisory Agreements with respect to the Funds, the Trustees considered various factors, including (i) the nature, extent and quality of the services to be provided by the Adviser with respect to the applicable Fund under the Investment Advisory Agreements; (ii) the advisory fees and other expenses to be paid by the Fund compared to those of similar funds managed by other investment advisers; (iii) the costs of the services provided to the Fund by the Adviser and the profits realized by the Adviser and its affiliates from its relationship to the Fund; (iv) the extent which economies of scale would be realized if and as the assets of the Fund grow and whether fees reflect the economies of scale for the benefit of shareholders and (v) any additional benefits and other considerations.
With respect to the nature, extent and quality of the services to be provided by the Adviser under the Investment Advisory Agreements, the Trustees considered and reviewed information concerning the services to be provided under the Investment Advisory Agreements, the investment parameters of the index of each Fund, financial information regarding the Adviser and its parent company, information describing the Adviser’s current organization and the background and experience of the persons who would be responsible for the day-to-day management of the Funds.
The Trustees reviewed information on the performance of each Fund and its applicable benchmark. The Trustees also evaluated the correlation and tracking error between the underlying index and its corresponding Fund’s performance. Based on their review, the Trustees found that the nature and extent of services provided to each Fund under the Investment Advisory Agreements was appropriate and that the quality was satisfactory.
The Trustees noted that the advisory fees for each Fund were unitary fees pursuant to which the Adviser assumes all expenses of the Funds (including the cost of transfer agency, custody, fund administration, legal, audit and other services) other than the payments under the Advisory Agreement, brokerage expenses, taxes, interest, litigation expenses and other extraordinary expenses.
With respect to advisory fee rates, the Trustees noted that the advisory fee rate for each of these Funds is higher than the median of its Strategic Insight expense group and their expense ratios are higher than the medians of their respective Strategic Insight expense group. The Trustees also took into account, among other things, each Fund’s unique and complex volatility hedging strategy.
Based on the foregoing, and the other information available to them, the Trustees concluded that the advisory fee rate for each of the Funds was reasonable under the circumstances and in light of the quality of the services provided.
The Trustees considered other benefits available to the Adviser because of its relationship with the Funds and concluded that the advisory fees were reasonable taking into account any such benefits.
The Trustees also considered with respect to each Fund the information provided by the Adviser about the costs and profitability of the Adviser with respect to each of the Funds. The Trustees reviewed and noted the relatively small sizes of the Funds and concluded that the Adviser was not realizing any economies of scale. The Trustees determined that they would continue to evaluate whether further economies of scale have been achieved on an ongoing basis.
In voting to renew each Investment Advisory Agreement, the Trustees concluded that the terms of each Investment Advisory Agreement are reasonable and fair in light of the services to be performed, the fees paid by certain other funds, expenses to be incurred and such other matters as the Trustees considered relevant in the exercise of their reasonable business judgment. The Trustees did not identify any single factor or group of factors as all important or controlling and considered all factors together.
24 | November 30, 2015
| | |
Janus Velocity ETFs |
| Trustees & Officers | | November 30, 2015 (Unaudited) |
| | | | | | | | | | |
INDEPENDENT TRUSTEES |
Name, Address
& Year of Birth* | | Position(s) Held with Trust | | Term of Office
and Length of
Time Served** | | Principal Occupation(s)
During Past 5 Years | | Number of
Portfolios in Fund
Complex Overseen
by Trustees*** | | Other Directorships
Held by Trustees |
| Mary K. Anstine, 1940 | | Trustee | | Since March 2008 | | Ms. Anstine was formerly an Executive Vice President of First Interstate Bank of Denver until 1994, President/Chief Executive Officer of HealthONE Alliance, Denver, Colorado, from 1994 to 2004, and has been retired since 2004. Ms. Anstine is also Trustee/Director of the following: AV Hunter Trust and Colorado Uplift Board. Ms. Anstine was formerly a Director of the Trust Bank of Colorado (later purchased and now known as Northern Trust Bank), HealthONE and Denver Area Council of the Boy Scouts of America and a member of the American Bankers Association Trust Executive Committee. | | 46 | | Ms. Anstine is a Trustee of ALPS Variable Investment Trust (9 funds); Financial Investors Trust (31 funds); Reaves Utility Income Fund; and Westcore Trust (12 funds). |
Jeremy W. Deems, 1976 | | Trustee | | Since March 2008 | | Mr. Deems is the Co-Founder, Chief Financial Officer of Green Alpha Advisors, LLC. Mr. Deems is Co-Portfolio Manager of the Shelton Green Alpha Fund. Prior to joining Green Alpha Advisors, Mr. Deems was CFO and Treasurer of Forward Management, LLC, ReFlow Management Co., LLC, ReFlow Fund, LLC, a private investment fund, and Sutton Place Management, LLC, an administrative services company. | | 46 | | Mr. Deems is a Trustee of ALPS Variable Investment Trust (9 funds); Financial Investors Trust (31 funds); Clough Funds Trust (1 fund); and Reaves Utility Income Fund. |
Rick A. Pederson, 1952 | | Trustee | | Since March 2008 | | Mr. Pederson is President, Foundation Properties, Inc. (a real estate investment management company), 1994 - present; Advisory Board Member, Bow River Capital Partners (private equity management), 2003 - present; Advisor, Pauls Corporation (real estate investment management and development), 2008 - present; Chairman, Ross Consulting Group (real estate consulting services) 1983-2013; Advisory Board, Neenan Company (construction services) 2002- present; Board Member, Prosci, Inc. (private business services), 2013-present; Board Member, Citywide Banks (Colorado community bank) 2014-present; Board member, Professional Pediatric Health Care (a Denver-based home nursing firm) 2014 – present; Director, National Western Stock Show (not-for-profit organization); Director, Biennial of the Americas (not-for-profit organization). | | 24 | | Mr. Pederson is Trustee of Westcore Trust (12 funds) and Principal Real Estate Income Fund (1 fund). |
| * | The business address of the Trustee is c/o ALPS Advisors, Inc., 1290 Broadway, Suite 1100, Denver, Colorado 80203. |
| ** | This is the period for which the Trustee began serving the Trust. Each Trustee serves an indefinite term, until his successor is elected. |
| *** | The Fund Complex includes all series of the Trust and any other investment companies for which ALPS Advisors, Inc. provides investment advisory services. |
The Statement of Additional Information includes additional information about the Fund’s Trustees and is available, without charge, upon request by calling (toll-free) 1-866-675-2639.
25 | November 30, 2015
| | |
Janus Velocity ETFs |
| Trustees & Officers | | November 30, 2015 (Unaudited) |
| | | | | | | | | | |
INTERESTED TRUSTEE |
Name, Address
and Year of
Birth of
Interested
Trustee* | | Position(s) Held
with Trust | | Term of Office
and Length of
Time Served** | | Principal Occupation(s)
During Past 5 Years | | Number of
Portfolios in Fund
Complex Overseen
by Trustees*** | | Other Directorships
Held by Trustees |
Thomas A. Carter, 1966 | | Trustee and President | | Since March 2008 | | Mr. Carter joined ALPS Fund Services, Inc. (“ALPS”) in 1994 and is currently President and Director of ALPS Advisors, Inc. (“AAI”), and ALPS Portfolio Solutions Distributor, Inc. (“APSD”) and Executive Vice President and Director of ALPS and ALPS Holdings, Inc. (“AHI”), and ALPS Distributors, Inc. (“ADI”). Because of his position with AHI, ALPS, ADI, APSD and AAI, Mr. Carter is deemed an affiliate of the Fund as defined under the 1940 Act. Before joining ALPS, Mr. Carter was with Deloitte & Touche LLP, where he worked with a diverse group of clients, primarily within the financial services industry. Mr. Carter is a Certified Public Accountant and received his Bachelor of Science in Accounting from the University of Colorado at Boulder. | | 34 | | Mr. Carter is a Trustee of ALPS Variable Investment Trust (9 funds) and Principal Real Estate Income Fund (1 fund) |
| * | The business address of the Trustee is c/o ALPS Advisors, Inc., 1290 Broadway, Suite 1100, Denver, Colorado 80203. |
| ** | This is the period for which the Trustee began serving the Trust. Each Trustee serves an indefinite term, until his successor is elected. |
| *** | The Fund Complex includes all series of the Trust and any other investment companies for which ALPS Advisors, Inc. provides investment advisory services. |
The Statement of Additional Information includes additional information about the Fund’s Trustees and is available, without charge, upon request by calling (toll-free) 1-866-675-2639.
26 | November 30, 2015
| | |
Janus Velocity ETFs |
| Trustees & Officers | | November 30, 2015 (Unaudited) |
| | | | | | |
OFFICERS |
Name, Address and Year of Birth of Officer* | | Position(s) Held with Trust | | Length of Time Served** | | Principal Occupation(s) During Past 5 Years |
Erin D. Nelson, 1977 | | Chief Compliance Officer (“CCO”) | | Since December 2015 | | Erin Nelson became Senior Vice-President and Chief Compliance Officer of ALPS Advisors, Inc. (“AAI”) on July 1, 2015 and prior to that served as Vice President and Deputy Chief Compliance Officer of AAI since January 1, 2015. Prior to January 1, 2015, Ms. Nelson was Vice-President and Assistant General Counsel of ALPS of Fund Services, Inc. Ms. Nelson joined AAI’s parent company, ALPS Holdings, Inc. in January 2003. Ms. Nelson currently is also the Chief Compliance Officer of Principal Real Estate Income Fund, and as of December 2015, the Chief Compliance Officer of Liberty All-Star Equity Fund, Liberty All-Star Growth Fund, Inc., RiverNorth Opportunities Fund, Inc. |
Patrick D. Buchanan, 1972 | | Treasurer | | Since June 2012 | | Mr. Buchanan is Vice President of AAI. Mr. Buchanan joined ALPS in 2007 and because of his position with AAI, he is deemed an affiliate of the Trust as defined under the 1940 Act. Mr. Buchanan is also Treasurer of the ALPS Variable Insurance Trust, Clough Funds Trust and Principal Real Estate Income Fund. |
William Parmentier, 1952 | | Vice President | | Since March 2008 | | Mr. Parmentier is Chief Investment Officer, AAI (since 2006); President and Chief Executive Officer of the Liberty All-Star Funds (since April 1999); Senior Vice President (2005-2006), Banc of America Investment Advisors, Inc. Because of his position with AAI, Mr. Parmentier is deemed an affiliate of the Trust as defined under the 1940 Act. |
Abigail J. Murray, 1975 | | Secretary | | Since June 2015 | | Ms. Murray joined ALPS in April 2015. She is currently Vice President and Senior Counsel of ALPS. Prior to joining ALPS, Ms. Murray was an Attorney and Managing Member at Murray & Rouvina PLC from 2014 to 2015 and an Associate with Vedder Price P.C. from 2007 to 2014. Because of her position with ALPS, Ms. Murray is deemed an affiliate of the Trust as defined under the 1940 Act. Ms. Murray is also the Secretary of The Caldwell & Orkin Funds, Inc., Clough Global Opportunities Fund, Clough Global Allocation Fund, Clough Global Equity Fund and Clough Funds Trust. |
Jennifer A. Craig, 1973 | | Assistant Secretary | | Since October 2013 | | Ms. Craig joined ALPS in 2007 and is currently Assistant Vice President and Paralegal Manager. Prior to joining ALPS, Ms. Craig was Legal Manager at Janus Capital Management LLC and served as Assistant Secretary of Janus Investment Fund, Janus Adviser Series and Janus Aspen Series. Because of her position with ALPS, Ms. Craig is deemed an affiliate of the Trust as defined under the 1940 Act. |
| * | The business address of the Officer is c/o ALPS Advisors, Inc., 1290 Broadway, Suite 1100, Denver, Colorado 80203. |
| ** | This is the period for which the Officer began serving the Trust. Each Officer serves an indefinite term, until his successor is elected. |
27 | November 30, 2015
Page Intentionally Left Blank

This report has been prepared for shareholders of the ETFs described herein
and may be distributed to others only if preceded or accompanied by a prospectus.
ALPS Portfolio Solutions Distributor, Inc., distributor for the ETFs.
table of
CONTENTS
www.alpsfunds.com
| | |
RiverFront Strategic Income Fund | | |
| Performance Overview | | November 30, 2015 (Unaudited) |
Investment Objective
The RiverFront Strategic Income Fund (the “Fund”) seeks total return, with an emphasis on income as the source of that total return. The Fund seeks to achieve its investment objective by investing in a global portfolio of fixed income securities of various maturities, ratings and currency denominations. The Fund intends to utilize various investment strategies in a broad array of fixed income sectors.
Performance Overview
The Fund performed relatively well over the 12 months from December 1, 2014 through November 30, 2015. Over this time period,the Fund’s market return was 0.95% (0.91% at NAV) versus 0.97% for the Barclays U.S. Aggregate Bond Index. The Fund was comprised almost entirely of shorter maturity high yield bonds over this period, given RiverFront’s Price Matters® asset allocation framework, which seeks to optimize returns while limiting downside risk over a 3 to 5 year timeframe. The fund significantly outperformed the Bank of America Merrill Lynch 1-5 Year Cash Pay High Yield Index, which was down -4.25% over this 12 month period.
The Fund’s strategy of limiting duration risk and assuming short-term credit risk was reflected in its approximately 3 year average duration (vs. about 5.6 years for the Barclays Aggregate Index) and its BB-rated average credit quality (vs. AA-rated for the Barclays Aggregate Index). The short duration strategy had a minimal impact on portfolio performance as shorter term rates (1-5 years) rose significantly and longer term rates (10+ years) were only up marginally. The credit strategy negatively impacted performance as risk premiums widened significantly over the time frame. The Fund was able to offset the credit headwind by focusing on the highest quality sector of the high yield market and underweighting the worst performing sectors: CCC-rated, energy and metals and mining.
Performance (as of November 30, 2015)
| | | | |
| | | 1 Year | | Since Inception^ |
RiverFront Strategic Income Fund – NAV | | 0.91% | | 3.17% |
RiverFront Strategic Income Fund – Market Price* | | 0.95% | | 3.19% |
Barclays U.S. Aggregate Bond Index | | 0.97% | | 3.08% |
Total Expense Ratio (per the current prospectus) 0.22%.
Performance data quoted represents past performance. Past performance does not guarantee future results. Investment return and principal value of an investment will fluctuate so that an investor’s shares, when sold or redeemed, may be worth more or less than the original cost. Current performance data may be higher or lower than actual data quoted. For most current month-end performance data please visit www.alpsfunds.com or call 1.866.759.5679.
NAV is an exchange-traded fund’s per-share value. The per-share dollar amount of the fund is derived by dividing the total value of all the securities in its portfolio, less any liabilities, by the number of fund shares outstanding. Market Price is the price at which a share can currently be traded in the market. Information detailing the number of days the Market Price of the Fund was greater than the Fund’s NAV and the number of days it was less than the Fund’s NAV can be obtained at www.alpsfunds.com.
| ^ | The Fund commenced Investment Operations on October 8, 2013. |
| * | Price is based on the midpoint of the bid/ask spread at 4 p.m. ET and does not represent the returns an investor would receive if shares were traded at other times | |
Duration is a measure of the sensitivity of the price (the value of principal) of a fixed-income investment to a change in interest rates. Duration is expressed as a number of years. The duration number is a calculation involving present value, yield, coupon, final maturity and call features. The bigger the duration number, the greater the interest-rate risk or reward for bond prices. Rising interest rates mean falling bond prices, while declining interest rates mean rising bond prices.
Barclays U.S. Aggregate Bond Index - An unmanaged index composed of securities from the Barclays Capital Government/Corporate Bond Index, Mortgage-Backed Securities Index and the Asset-Backed Securities Index. Total return comprises price appreciation/depreciation and income as a percentage of the original investment. Indices are rebalanced monthly by market capitalization. The index is not actively managed and does not reflect any deductions for fees, expenses or taxes.
One cannot invest directly in an index. Index performance does not reflect fund performance.
The RiverFront Strategic Income Fund is not suitable for all investors. Investments in the Fund are subject to investment risks, including possible loss of the principal amount invested.
ALPS Portfolio Solutions Distributor, Inc. is the Distributor for the RiverFront Strategic Income Fund.
1 | November 30, 2015
| | |
RiverFront Strategic Income Fund | | |
| Performance Overview | | November 30, 2015 (Unaudited) |
| | | | |
Top 10 Holdings* (as of November 30, 2015) | | | |
DaVita HealthCare Partners, Inc., Sr. Unsec. | | | 3.23 | % |
HCA, Inc., First Lien | | | 3.14 | % |
Access Midstream Partners LP/ACMP Finance Corp., Sr. Unsec. | | | 3.08 | % |
AES Corp., Sr. Unsec. | | | 2.98 | % |
CIT Group, Inc., Sr. Unsec. | | | 2.93 | % |
Flextronics International, Ltd., Sr. Unsec. | | | 2.90 | % |
NRG Energy, Inc., Sr. Unsec. | | | 2.89 | % |
WESCO Distribution, Inc., Sr. Unsec. | | | 2.80 | % |
Fresenius Medical Care US Finance II, Inc., Sr. Unsec. | | | 2.77 | % |
United Rentals North America, Inc., Sr. Unsec. | | | 2.74 | % |
Total % of Top 10 Holdings | | | 29.46 | % |
Asset Allocation* (as of November 30, 2015)
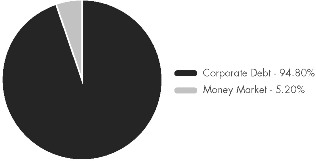
Future holdings are subject to change.
Growth of $10,000 (as of November 30, 2015)
Comparison of Change in Value of $10,000 Investment in the Fund and the Index
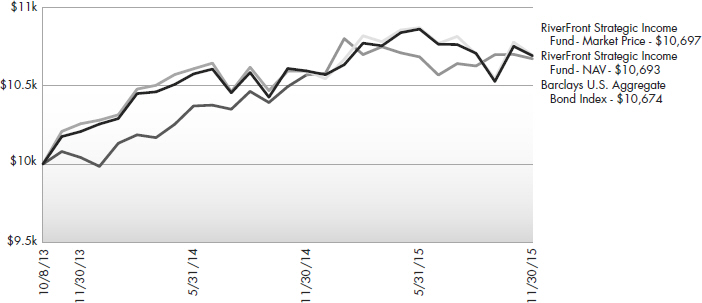
The chart above represents historical performance of a hypothetical investment of $10,000 in the Fund over the life of the Fund. Performance calculations are as of the end of each month. Past performance does not guarantee future results. This chart does not reflect the deduction of taxes that a shareholder would pay on Fund distributions or the redemption of Fund shares.
2 | November 30, 2015
| | |
RiverFront Strategic Income Fund | | |
| Disclosure of Fund Expenses | | November 30, 2015 (Unaudited) |
Shareholder Expense Example: As a shareholder of the Fund, you incur two types of costs:(1) transaction costs which may include creation and redemption fees or brokerage charges, and (2) ongoing costs, including management fees and other Fund expenses. These examples are intended to help you understand your ongoing costs (in dollars) of investing in the Fund and to compare these costs with the ongoing costs of investing in other funds. It is based on an investment of $1,000 invested at the beginning of the (six month) period and held though November 30, 2015.
Actual Return: The first line of the table provides information about actual account values and actual expenses. You may use the information in this table, together with the amount you invested, to estimate the expenses that you incurred over the period. Simply divide your account value by $1,000 (for example, an $8,600 account value divided by $1,000 = 8.6), then multiply the result by the number in the first line under the heading entitled “Expenses Paid During the Period” to estimate the expenses attributable to your investment during this period.
Hypothetical 5% Return: The second line of the table provides information about hypothetical account values and hypothetical expenses based on the Fund’s actual expense ratio and an assumed rate of return of 5% per year before expenses, which is not the Fund’s actual return. The hypothetical account values and expenses may not be used to estimate the actual ending account balance or expenses you paid for the period. You may use this information to compare ongoing costs of investing in the Fund and other funds. To do so, compare this 5% hypothetical example with the 5% hypothetical examples that appear in the shareholder reports of the other funds.
The expenses shown in the table are meant to highlight ongoing Fund costs only and do not reflect any transaction costs, such as creation and redemption fees, or brokerage charges. Therefore, the second line is useful in comparing ongoing costs only, and will not help you determine the relative total costs of owning different funds. In addition, if these costs were included, your costs would have been higher.
| | | | | | | | |
| | | Beginning Account Value 6/1/15 | | Ending Account Value 11/30/15 | | Expense
Ratio(a) | | Expenses Paid
During Period
6/1/15 - 11/30/15(b) |
Actual | | $ 1,000.00 | | $ 984.20 | | 0.22% | | $ 1.09 |
Hypothetical (5% return before expenses) | | $ 1,000.00 | | $ 1,023.97 | | 0.22% | | $ 1.12 |
| (a) | Annualized, based on the Fund’s most recent fiscal half year expenses. |
| (b) | Expenses are equal to the Fund’s annualized expense ratio multiplied by the average account value over the period, multiplied by the number of days in the most recent fiscal half year (183), divided by 365. |
3 | November 30, 2015
| | |
RiverFront Strategic Income Fund | | |
| Report of Independent Registered Public Accounting Firm |
To the Board of Trustees and Shareholders of ALPS ETF Trust:
We have audited the accompanying statement of assets and liabilities, including the schedule of investments, of Riverfront Strategic Income Fund, one of the portfolios constituting the ALPS ETF Trust (the “Trust”), as of November 30, 2015, and the related statement of operations for the year then ended, the statements of changes in net assets for each of the two years in the period then ended, and the financial highlights for each of the periods presented. These financial statements and financial highlights are the responsibility of the Trust’s management. Our responsibility is to express an opinion on these financial statements and financial highlights based on our audits.
We conducted our audits in accordance with the standards of the Public Company Accounting Oversight Board (United States). Those standards require that we plan and perform the audit to obtain reasonable assurance about whether the financial statements and financial highlights are free of material misstatement. The Trust is not required to have, nor were we engaged to perform, an audit of its internal control over financial reporting. Our audits included consideration of internal control over financial reporting as a basis for designing audit procedures that are appropriate in the circumstances, but not for the purpose of expressing an opinion on the effectiveness of the Trust’s internal control over financial reporting. Accordingly, we express no such opinion. An audit also includes examining, on a test basis, evidence supporting the amounts and disclosures in the financial statements, assessing the accounting principles used and significant estimates made by management, as well as evaluating the overall financial statement presentation. Our procedures included confirmation of securities owned as of November 30, 2015, by correspondence with the custodian. We believe that our audits provide a reasonable basis for our opinion.
In our opinion, the financial statements and financial highlights referred to above present fairly, in all material respects, the financial position of Riverfront Strategic Income Fund of the ALPS ETF Trust as of November 30, 2015, the results of its operations for the year then ended, the changes in its net assets for each of the two years in the period then ended, and the financial highlights for each of the periods presented, in conformity with accounting principles generally accepted in the United States of America.
DELOITTE & TOUCHE LLP
Denver, Colorado
January 28, 2016
4 | November 30, 2015
| | |
RiverFront Strategic Income Fund | | |
| Schedule of Investments | | November 30, 2015 |
| | | | | | | | |
| Security Description | | Principal
Amount | | | Value | |
CORPORATE BONDS (93.44%) | | | | | |
Communications (1.96%) | | | | | | | | |
CCO Holdings LLC / CCO Holdings Capital Corp., Sr. Unsec.
6.50%, 04/30/2021 | | $ | 5,000,000 | | | $ | 5,238,525 | |
Sprint Communications, Inc., Sr. Unsec.
6.00%, 12/01/2016 | | | 3,840,000 | | | | 3,837,600 | |
| | | | | | | | |
Total Communications | | | | | | | 9,076,125 | |
| | | | | | | | |
| |
Consumer Discretionary (20.13%) | | | | | |
Autonation, Inc., Sr. Unsec.
6.75%, 04/15/2018 | | | 1,650,000 | | | | 1,815,452 | |
Avis Budget Car Rental LLC/Avis Budget Finance, Inc., Sr. Unsec.
4.88%, 11/15/2017 | | | 8,785,000 | | | | 9,048,550 | |
Cablevision Systems Corp., Sr. Unsec.
8.63%, 09/15/2017 | | | 6,836,000 | | | | 7,229,070 | |
CSC Holdings LLC, Sr. Unsec.
7.88%, 02/15/2018 | | | 4,000,000 | | | | 4,210,000 | |
DISH DBS Corp., Sr. Unsec.
4.25%, 04/01/2018 | | | 9,558,000 | | | | 9,534,104 | |
7.88%, 09/01/2019 | | | 2,000,000 | | | | 2,160,000 | |
Goodyear Tire & Rubber Co., Sr. Unsec.
8.75%, 08/15/2020 | | | 100,000 | | | | 119,250 | |
5.13%, 11/15/2023 | | | 8,487,000 | | | | 8,690,688 | |
L Brands, Inc., Sr. Unsec.
8.50%, 06/15/2019 | | | 5,613,000 | | | | 6,595,275 | |
Lamar Media Corp., Sr. Sub.
5.88%, 02/01/2022 | | | 11,098,000 | | | | 11,680,645 | |
Lear Corp., Sr. Unsec.
4.75%, 01/15/2023 | | | 10,890,000 | | | | 11,135,025 | |
MGM Resorts International, Sr. Unsec.
7.63%, 01/15/2017 | | | 9,228,000 | | | | 9,758,610 | |
Service Corp. International, Sr. Unsec.
5.38%, 01/15/2022 | | | 10,805,000 | | | | 11,358,756 | |
| | | | | | | | |
Total Consumer Discretionary | | | 93,335,425 | |
| | | | | | | | |
| | |
Consumer Staples (3.27%) | | | | | | | | |
Constellation Brands, Inc., Sr. Unsec.
7.25%, 05/15/2017 | | | 4,650,000 | | | | 4,987,125 | |
3.88%, 11/15/2019 | | | 3,750,000 | | | | 3,890,625 | |
Smithfield Foods, Inc., Sr. Unsec.
7.75%, 07/01/2017 | | | 5,850,000 | | | | 6,296,063 | |
| | | | | | | | |
Total Consumer Staples | | | | | | | 15,173,813 | |
| | | | | | | | |
| | | | | | | | |
| Security Description | | Principal
Amount | | | Value | |
Energy (9.48%) | | | | | | | | |
Access Midstream Partners LP/ACMP Finance Corp., Sr. Unsec.
6.13%, 07/15/2022 | | $ | 14,093,000 | | | $ | 14,076,385 | |
Concho Resources, Inc., Sr. Unsec.
6.50%, 01/15/2022 | | | 5,434,000 | | | | 5,569,850 | |
Continental Resources, Inc.,Sr. Unsec.
5.00%, 09/15/2022 | | | 10,127,000 | | | | 8,899,101 | |
Newfield Exploration Co., Sr. Unsec.
5.75%, 01/30/2022 | | | 3,850,000 | | | | 3,792,635 | |
Tesoro Corp., Sr. Unsec.
5.38%, 10/01/2022 | | | 8,800,000 | | | | 8,965,000 | |
Tesoro Logistics LP / Tesoro Logistics Finance Corp., Sr. Unsec.
5.88%, 10/01/2020 | | | 2,600,000 | | | | 2,684,500 | |
| | | | | | | | |
Total Energy | | | | | | | 43,987,471 | |
| | | | | | | | |
| | |
Financials (6.21%) | | | | | | | | |
Ally Financial, Inc., Sr. Unsec.
5.50%, 02/15/2017 | | | 4,200,000 | | | | 4,331,250 | |
4.75%, 09/10/2018 | | | 1,450,000 | | | | 1,499,837 | |
CIT Group, Inc.,Sr. Unsec.
5.00%, 05/15/2017 | | | 150,000 | | | | 154,875 | |
4.25%, 08/15/2017 | | | 12,975,000 | | | | 13,250,718 | |
Corrections Corp., Sr. Unsec.
4.13%, 04/01/2020 | | | 9,802,000 | | | | 9,581,455 | |
| | | | | | | | |
Total Financials | | | | | | | 28,818,135 | |
| | | | | | | | |
| | |
Health Care (15.88%) | | | | | | | | |
CHS/Community Health Systems, Inc., First Lien
5.13%, 08/15/2018 | | | 9,565,000 | | | | 9,804,125 | |
DaVita HealthCare Partners, Inc., Sr. Unsec.
5.75%, 08/15/2022 | | | 14,200,000 | | | | 14,768,000 | |
Fresenius Medical Care US Finance II, Inc., Sr. Unsec.
5.63%, 07/31/2019(a) | | | 11,685,000 | | | | 12,678,225 | |
HCA, Inc., First Lien
6.50%, 02/15/2020 | | | 12,953,000 | | | | 14,361,639 | |
Hologic, Inc., Sr. Unsec.
5.25%, 07/15/2022(a) | | | 9,905,000 | | | | 10,338,344 | |
Tenet Healthcare Corp., First Lien
6.25%, 11/01/2018 | | | 8,467,000 | | | | 8,975,020 | |
3.84%, 06/15/2020(a)(b) | | | 2,765,000 | | | | 2,740,806 | |
| | | | | | | | |
Total Health Care | | | | | | | 73,666,159 | |
| | | | | | | | |
| | |
Industrials (12.90%) | | | | | | | | |
ADT Corp., Sr. Unsec.
2.25%, 07/15/2017 | | | 1,550,000 | | | | 1,534,500 | |
See Notes to Financial Statements.
5 | November 30, 2015
| | |
RiverFront Strategic Income Fund | | |
| Schedule of Investments | | November 30, 2015 |
| | | | | | | | |
| Security Description | | Principal
Amount | | | Value | |
Industrials (continued) | | | | | | | | |
Aircastle, Ltd., Sr. Unsec.
6.75%, 04/15/2017 | | $ | 10,387,000 | | | $ | 10,906,350 | |
Case New Holland Industrial, Inc., Sr. Unsec.
7.88%, 12/01/2017 | | | 9,705,000 | | | | 10,431,419 | |
Silgan Holdings, Inc.,
Sr. Unsec.
5.00%, 04/01/2020 | | | 8,750,000 | | | | 8,979,688 | |
Spectrum Brands, Inc.,
Sr. Unsec.
6.38%, 11/15/2020 | | | 2,500,000 | | | | 2,687,500 | |
United Rentals North America, Inc., Sr. Unsec.
7.38%, 05/15/2020 | | | 11,800,000 | | | | 12,522,750 | |
WESCO Distribution, Inc.,
Sr. Unsec.
5.38%, 12/15/2021 | | | 13,350,000 | | | | 12,816,000 | |
| | | | | | | | |
Total Industrials | | | | | | | 59,878,207 | |
| | | | | | | | |
| |
Information Technology (2.86%) | | | | | |
Flextronics International, Ltd., Sr. Unsec.
4.63%, 02/15/2020 | | | 12,821,000 | | | | 13,285,761 | |
| | | | | | | | |
Total Information Technology | | | | 13,285,761 | |
| | | | | | | | |
| | |
Materials (8.33%) | | | | | | | | |
ArcelorMittal, Sr. Unsec.
6.13%, 06/01/2018 | | | 2,700,000 | | | | 2,632,500 | |
Ball Corp., Sr. Unsec.
5.00%, 03/15/2022 | | | 10,141,000 | | | | 10,328,609 | |
Celanese US Holdings LLC,
Sr. Unsec.
5.88%, 06/15/2021 | | | 6,220,000 | | | | 6,624,300 | |
Graphic Packaging International, Inc.,
Sr. Unsec.
4.75%, 04/15/2021 | | | 5,671,000 | | | | 5,826,952 | |
4.88%, 11/15/2022 | | | 4,615,000 | | | | 4,718,838 | |
Huntsman Intl LLC, Sr. Unsec.
4.88%, 11/15/2020 | | | 7,638,000 | | | | 7,217,910 | |
United States Steel Corp.,
Sr. Unsec.
6.05%, 06/01/2017 | | | 1,850,000 | | | | 1,322,750 | |
| | | | | | | | |
Total Materials | | | | | | | 38,671,859 | |
| | | | | | | | |
| |
Telecommunication Services (6.64%) | | | | | |
CenturyLink, Inc., Sr. Unsec., Series V
5.63%, 04/01/2020 | | | 9,500,000 | | | | 9,452,500 | |
Frontier Communications Corp., Sr. Unsec.
8.25%, 04/15/2017 | | | 11,725,000 | | | | 12,501,781 | |
Windstream Corp., Sr. Unsec.
7.88%, 11/01/2017 | | | 8,484,000 | | | | 8,876,385 | |
| | | | | | | | |
Total Telecommunication Services | | | | 30,830,666 | |
| | | | | | | | |
| | | | | | | | |
| Security Description | | Principal
Amount | | Value | |
Utilities (5.78%) | | | | | | | | |
AES Corp., Sr. Unsec.
8.00%, 06/01/2020 | | $ 12,240,000 | | $ | 13,617,000 | |
NRG Energy, Inc., Sr. Unsec.
7.63%, 01/15/2018 | | 12,650,000 | | | 13,219,250 | |
| | | | | | | | |
Total Utilities | | | | | | | 26,836,250 | |
| | | | | | | | |
| |
TOTAL CORPORATE BONDS (Cost $439,369,791) | | | 433,559,871 | |
| | | | | | | | |
| | | |
| Security Description | | 7 Day Yield | | Shares | | Value | |
SHORT TERM INVESTMENTS (5.13%) | | | | |
Morgan Stanley Institutional Liquidity Funds, Prime Portfolio | | 0.105% | | 23,780,493 | | | 23,780,493 | |
| | | | | | | | |
| |
TOTAL SHORT TERM INVESTMENTS (Cost $23,780,493) | | | 23,780,493 | |
| | | | | | | | |
| |
TOTAL INVESTMENTS (98.57%) (Cost $463,150,284) | | $ | 457,340,364 | |
| |
NET OTHER ASSETS AND LIABILITIES (1.43%) | | | 6,666,710 | |
| | | | | | | | |
| |
NET ASSETS (100.00%) | | $ | 464,007,074 | |
| | | | | | | | |
| (a) | Securities exempt from registration under Rule 144A of the Securities Act of 1933. These securities may be sold in the ordinary course of business in transactions exempt from registration, normally to qualified institutional buyers. At period end, the aggregate market value of those securities was $25,757,375, representing 5.55% of net assets. |
| (b) | Interest rate will change at a future date. Interest rate shown reflects the rate in effect at November 30, 2015. |
Common Abbreviations:
LLC - Limited Liability Company.
LP - Limited Partnership.
Ltd. - Limited.
Sr. - Senior.
Sub. - Subordinated.
Unsec. - Unsecured.
|
See Notes to Financial Statements. 6 | November 30, 2015 |
| | |
RiverFront Strategic Income Fund | | |
| Statement of Assets and Liabilities | | November 30, 2015 |
| | | | |
ASSETS: | | | | |
Investments, at value | | $ | 457,340,364 | |
Interest receivable | | | 6,750,723 | |
Total Assets | | | 464,091,087 | |
| |
LIABILITIES: | | | | |
Payable to adviser | | | 84,013 | |
Total Liabilities | | | 84,013 | |
NET ASSETS | | $ | 464,007,074 | |
| | | | | |
| |
NET ASSETS CONSIST OF: | | | | |
Paid-in capital | | $ | 476,795,862 | |
Accumulated net investment income | | | 24,903 | |
Accumulated net realized loss on investments | | | (7,003,771) | |
Net unrealized depreciation on investments | | | (5,809,920) | |
NET ASSETS | | $ | 464,007,074 | |
| | | | | |
| |
INVESTMENTS, AT COST | | $ | 463,150,284 | |
| |
PRICING OF SHARES | | | | |
Net Assets | | $ | 464,007,074 | |
Shares of beneficial interest outstanding (Unlimited number of shares authorized, par value $0.01 per share) | | | 19,050,000 | |
Net Asset Value, offering and redemption price per share | | $ | 24.36 | |
See Notes to Financial Statements.
7 | November 30, 2015
| | |
RiverFront Strategic Income Fund | | |
| Statement of Operations | | For the Year Ended November 30, 2015 |
| | | | |
INVESTMENT INCOME: | | | | |
Interest | | $ | 17,106,282 | |
Total Investment Income | | | 17,106,282 | |
| |
EXPENSES: | | | | |
Investment adviser and sub-adviser fees (note 3) | | | 2,092,218 | |
Total Expenses | | | 2,092,218 | |
Less fees waived/reimbursed by sub-adviser (note 3) | | | (1,091,592) | |
Net Expenses | | | 1,000,626 | |
NET INVESTMENT INCOME | | | 16,105,656 | |
| |
REALIZED AND UNREALIZED GAIN/(LOSS) | | | | |
Net realized loss on investments | | | (7,547,910) | |
Net change in unrealized depreciation on investments | | | (5,832,347) | |
NET REALIZED AND UNREALIZED LOSS ON INVESTMENTS | | | (13,380,257) | |
NET INCREASE IN NET ASSETS RESULTING FROM OPERATIONS | | $ | 2,725,399 | |
| | | | | |
See Notes to Financial Statements.
8 | November 30, 2015
| | |
RiverFront Strategic Income Fund | | |
| Statements of Changes in Net Assets | | |
| | | | | | | | |
| | | For the Year Ended
November 30,
2015 | | | For the Year Ended
November 30,
2014 | |
OPERATIONS: | | | | | | | | |
Net investment income | | $ | 16,105,656 | | | $ | 9,041,406 | |
Net realized gain/(loss) on investments | | | (7,547,910) | | | | 396,073 | |
Net change in unrealized depreciation on investments | | | (5,832,347) | | | | (454,991) | |
Net increase in net assets resulting from operations | | | 2,725,399 | | | | 8,982,488 | |
| | |
DISTRIBUTIONS TO SHAREHOLDERS: | | | | | | | | |
From net investment income | | | (16,112,017) | | | | (9,145,080) | |
From net realized gains | | | (228,129) | | | | – | |
Total distributions | | | (16,340,146) | | | | (9,145,080) | |
| | |
CAPITAL SHARE TRANSACTIONS: | | | | | | | | |
Proceeds from sale of shares | | | 160,403,465 | | | | 294,599,065 | |
Shares redeemed | | | (51,846,799) | | | | (22,473,663) | |
Net increase from share transactions | | | 108,556,666 | | | | 272,125,402 | |
| | |
Net increase in net assets | | | 94,941,919 | | | | 271,962,810 | |
| | |
NET ASSETS: | | | | | | | | |
Beginning of period | | | 369,065,155 | | | | 97,102,345 | |
End of period* | | $ | 464,007,074 | | | $ | 369,065,155 | |
| | | | | | | | | |
| | |
*Including accumulated net investment income of: | | $ | 24,903 | | | $ | 31,264 | |
| | |
OTHER INFORMATION: | | | | | | | | |
CAPITAL SHARE TRANSACTIONS: | | | | | | | | |
Beginning shares | | | 14,750,002 | | | | 3,900,002 | |
Shares sold | | | 6,400,000 | | | | 11,750,000 | |
Shares redeemed | | | (2,100,002) | | | | (900,000) | |
Shares outstanding, end of period | | | 19,050,000 | | | | 14,750,002 | |
| | | | | | | | | |
See Notes to Financial Statements.
9 | November 30, 2015
| | |
RiverFront Strategic Income Fund | | |
| Financial Highlights | | For a share outstanding throughout the periods presented |
| | | | | | | | | | | | | | | | | | | | | | | | | |
| | | | | | | | | | | For the Period |
| | | | | | | | | | | October 8, 2013 |
| | | For the Year | | | | For the Year | | | | (Commencement) |
| | | Ended | | | | Ended | | | | to |
| | | November 30, | | | | November 30, | | | | November 30, |
| | | 2015 | | | | 2014 | | | | 2013 |
|
| NET ASSET VALUE, BEGINNING OF PERIOD | | $25.02 | | | | $24.90 | | | | $24.42 |
| | | | | |
| INCOME/(LOSS) FROM INVESTMENT OPERATIONS: | | | | | | | | | | |
Net investment income(a) | | 0.88 | | | | 0.83 | | | | 0.11 |
Net realized and unrealized 0.00 | | (0.65) | | | | 0.11 | | | | 0.40 |
|
Total from investment operations | | 0.23 | | | | 0.94 | | | | 0.51 |
|
| | | | | |
| DISTRIBUTIONS: | | | | | | | | | | |
From net investment income | | (0.87) | | | | (0.82) | | | | (0.03) |
From net realized gains | | (0.02) | | | | – | | | | – |
|
Total distributions | | (0.89) | | | | (0.82) | | | | (0.03) |
|
| | | | | |
| NET INCREASE/(DECREASE) IN NET ASSET VALUE | | (0.66) | | | | 0.12 | | | | 0.48 |
|
| NET ASSET VALUE, END OF PERIOD | | $24.36 | | | | $25.02 | | | | $24.90 |
| | | | | | | | | | | | | | | | |
| TOTAL RETURN(b) | | 0.91% | | | | 3.80% | | | | 2.08% |
| | | | | |
| RATIOS/SUPPLEMENTAL DATA: | | | | | | | | | | |
Net assets, end of period (000s) | | $464,007 | | | | $369,065 | | | | $97,102 |
| | | | | |
Ratio of expenses excluding waiver/reimbursement to average net assets | | 0.46% | | | | 0.46% | | | | 0.46%(c) |
Ratio of expenses including waiver/reimbursement to average net assets | | 0.22% | | | | 0.22% | | | | 0.22%(c) |
Ratio of net investment income including expenses waiver/reimbursement to average net assets | | 3.54% | | | | 3.30% | | | | 3.28%(c) |
Portfolio turnover rate(d) | | 36% | | | | 27% | | | | 0% |
|
| (a) | Based on average shares outstanding during the period. |
| (b) | Total return is calculated assuming an initial investment made at the net asset value at the beginning of the period and the redemption at the net asset value on the last day of the period and assuming all distributions are reinvested at the actual reinvestment prices. Total return calculated for a period of less than one year is not annualized. |
| (d) | Portfolio turnover rate is not annualized. |
See Notes to Financial Statements.
10 | November 30, 2015
| | |
RiverFront Strategic Income Fund | | |
| Notes to Financial Statements | | November 30, 2015 |
1. ORGANIZATION
The ALPS ETF Trust (the “Trust”), a Delaware statutory trust, is an open-end management investment company registered under the Investment Company Act of 1940, as amended (the “1940 Act”). As of November 30, 2015, the Trust consists of twenty-one separate portfolios. Each portfolio represents a separate series of the Trust. This report pertains solely to the RiverFront Strategic Income Fund (the “Fund”). The investment objective of the Fund is to seek total return, with an emphasis on income as the source of that total return. The Fund is considered non-diversified and may invest a greater portion of assets in securities of individual issuers than a diversified fund.
The Fund’s Shares (“Shares”) are listed on the New York Stock Exchange (“NYSE”) Arca. The Fund issues and redeems Shares at net asset value (“NAV”) in blocks of 50,000 Shares, each of which is called a “Creation Unit”. Creation Units are issued and redeemed principally in-kind for securities and/or cash. Except when aggregated in Creation Units, Shares are not redeemable securities of the Fund.
Pursuant to the Trust’s organizational documents, its Officers and Trustees are indemnified against certain liability arising out of the performance of their duties to the Trust. Additionally, in the normal course of business, the Trust enters into contracts with service providers that contain general indemnification clauses. The Trust’s maximum exposure under these arrangements is unknown, as this would involve future claims that may be made against the Trust that have not yet occurred.
2. SIGNIFICANT ACCOUNTING POLICIES
The following is a summary of significant accounting policies consistently followed by the Fund in the preparation of the financial statements. The accompanying financial statements were prepared in accordance with accounting principles generally accepted in the United States of America (“U.S. GAAP”). The preparation of financial statements in conformity with U.S. GAAP requires management to make certain estimates and assumptions that affect the reported amounts of assets and liabilities and disclosures of contingent assets and liabilities at the date of the financial statements and the reported amounts of revenue and expenses during the period. Actual results could differ from those estimates. The Fund is considered an investment company under U.S. GAAP and follows the accounting and reporting guidance applicable to investment companies in the Financial Accounting Standards Board Accounting Standards Codification Topic 946.
A. Portfolio Valuation
The Fund’s NAV is determined daily, as of the close of regular trading on the NYSE, normally 4:00 p.m. Eastern time, on each day the NYSE is open for trading. The NAV is computed by dividing the value of all assets of the Fund (including accrued interest and dividends), less all liabilities (including accrued expenses and dividends declared but unpaid), by the total number of shares outstanding.
Portfolio securities listed on any exchange other than the NASDAQ Stock Market LLC (“NASDAQ”) are valued at the last sale price on the business day as of which such value is being determined. If there has been no sale on such day, the securities are valued at the mean of the most recent bid and ask prices on such day. Securities traded on the NASDAQ are valued at the NASDAQ Official Closing Price as determined by NASDAQ. Portfolio securities traded on more than one securities exchange are valued at the last sale price on the business day as of which such value is being determined at the close of the exchange representing the principal market for such securities. Portfolio securities traded in the over-the-counter market, but excluding securities traded on the NASDAQ, are valued at the last quoted sale price in such market.
Fixed-income obligations are typically valued at the mean between the evaluated bid and ask prices formulated by an independent pricing service.
The Fund’s investments are valued at market value or, in the absence of market value with respect to any portfolio securities, at fair value according to procedures adopted by the Trust’s Board of Trustees (the “Board”). When market quotations are not readily available or when events occur that make established valuation methods unreliable, securities of the Fund may be valued in good faith by or under the direction of the Board. These securities generally include, but are not limited to, restricted securities (securities which may not be publicly sold without registration under the Securities Act of 1933) for which a pricing service is unable to provide a market price; securities whose trading has been formally suspended; a security whose market price is not available from a pre-established primary pricing source or the pricing source is not willing to provide a price; a security with respect to which an event has occurred that is most likely to materially affect the value of the security after the market has closed but before the calculation of the Fund’s NAV or make it difficult or impossible to obtain a reliable market quotation; or a security whose price, as provided by the pricing service, does not reflect the security’s “fair value” due to the security being de-listed from a national exchange or the security’s primary trading market is temporarily closed at a time when, under normal conditions, it would be open. As a general principle, the current “fair value” of a security would be the amount which the owner might reasonably expect to receive from the sale on the applicable exchange or principal market. A variety of factors may be considered in determining the fair value of such securities.
11 | November 30, 2015
| | |
RiverFront Strategic Income Fund | | |
| Notes to Financial Statements | | November 30, 2015 |
B. Fair Value Measurements
The Fund discloses the classification of its fair value measurements following a three-tier hierarchy based on the inputs used to measure fair value. Inputs refer broadly to the assumptions that market participants would use in pricing the asset or liability, including assumptions about risk. Inputs may be observable or unobservable. Observable inputs reflect the assumptions market participants would use in pricing the asset or liability that are developed based on market data obtained from sources independent of the reporting entity. Unobservable inputs reflect the reporting entity’s own assumptions about the assumptions market participants would use in pricing the asset or liability that are developed based on the best information available.
Valuation techniques used to value the Fund’s investments by major category are as follows:
Debt securities, including restricted securities, are valued based on evaluated prices received from third party pricing vendors or from brokers who make markets in such securities. For corporate bonds, pricing vendors utilize matrix pricing which considers yield or price of bonds of comparable quality, coupon, maturity and type as well as broker-supplied prices. When independent prices are unavailable or unreliable, debt securities may be valued utilizing pricing methodologies which consider similar factors that would be used by third party pricing vendors. Debt securities are generally categorized as Level 2 in the hierarchy but may be Level 3 depending on the circumstances. The Fund invests a significant portion of its assets in below investment grade securities. The value of these securities can be more volatile due to changes in the credit quality of the issuer and is sensitive to changes in economic, market and regulatory conditions. Investments in open-end mutual funds are valued at their closing NAV each business day and are categorized as Level 1 in the hierarchy.
Changes in valuation techniques may result in transfers in or out of an assigned level within the disclosure hierarchy.
Various inputs are used in determining the value of the Fund’s investments as of the end of the reporting period. When inputs used fall into different levels of the fair value hierarchy, the level in the hierarchy within which the fair value measurement falls is determined based on the lowest level input that is significant to the fair value measurement in its entirety. The designated input levels are not necessarily an indication of the risk or liquidity associated with these investments.
These inputs are categorized in the following hierarchy under applicable financial accounting standards:
| | |
Level 1 – | | Unadjusted quoted prices in active markets for identical investments, unrestricted assets or liabilities that a Fund has the ability to access at the measurement date; |
Level 2 – | | Quoted prices which are not active, quoted prices for similar assets or liabilities in active markets or inputs other than quoted prices that are observable (either directly or indirectly) for substantially the full term of the asset or liability; and |
Level 3 – | | Significant unobservable prices or inputs (including the Fund’s own assumptions in determining the fair value of investments) where there is little or no market activity for the asset or liability at the measurement date. |
The following is a summary of the inputs used to value the Fund’s investments as of November 30, 2015:
| | | | | | | | | | | | | | | | |
| | | | | | Level 2 - Other | | | Level 3 - Significant | | | | |
| | | Level 1 - Unadjusted | | | Significant | | | Unobservable | | | | |
| Investments in Securities at Value* | | Quoted Prices | | | Observable Inputs | | | Inputs | | | Total | |
Corporate Bonds | | $ | – | | | $ | 433,559,871 | | | $ | – | | | $ | 433,559,871 | |
Short Term Investments | | | 23,780,493 | | | | – | | | | – | | | | 23,780,493 | |
TOTAL | | $ | 23,780,493 | | | $ | 433,559,871 | | | $ | – | | | $ | 457,340,364 | |
| | | | | | | | | | | | | | | | | |
| * | For a detailed sector breakdown, see the accompanying Schedule of Investments. |
The Fund recognizes transfers between levels as of the end of the period. For the year ended November 30, 2015, the Fund did not have any transfers between Level 1 and Level 2 securities. The Fund did not have any securities which used significant unobservable inputs (Level 3) in determining fair value.
C. Securities Transactions and Investment Income
Securities transactions are recorded as of the trade date. Realized gains and losses from securities transactions are recorded on the highest cost basis. Dividend income and capital gains distributions, if any, are recorded on the ex-dividend date. Interest income, if any, is recorded on the accrual basis, including amortization of premiums and accretion of discounts.
12 | November 30, 2015
| | |
RiverFront Strategic Income Fund | | |
| Notes to Financial Statements | | November 30, 2015 |
D. Dividends and Distributions to Shareholders
Dividends from net investment income of the Fund, if any, are declared and paid monthly or as the Board may determine from time to time. Distributions of net realized capital gains earned by the Fund, if any, are distributed at least annually.
E. Federal Tax and Tax Basis Information
The timing and character of income and capital gain distributions are determined in accordance with income tax regulations, which may differ from U.S. GAAP. Reclassifications are made to the Fund’s capital accounts for permanent tax differences to reflect income and gains available for distribution (or available capital loss carryforwards) under income tax regulations.
For the year ended November 30, 2015, the following reclassifications, which had no impact on results of operations or net assets, were recorded to reflect permanent tax differences resulting primarily from in-kind transactions:
| | | | | | | | |
| | | | | | Accumulated Net Realized | |
| Fund | | Paid-in Capital | | | Loss on Investments | |
RiverFront Strategic Income Fund | | $ | (544,139 | ) | | $ | 544,139 | |
| | |
| The tax character of the distributions paid was as follows: | | | | | | | | |
| | |
| | | Ordinary Income | | | Long-Term Capital Gain | |
November 30, 2015 | | | | | | | | |
RiverFront Strategic Income Fund | | $ | 16,315,420 | | | $ | 24,726 | |
November 30, 2014 | | | | | | | | |
RiverFront Strategic Income Fund | | $ | 9,145,080 | | | | – | |
As of November 30, 2015, the components of distributable earnings on a tax basis were as follows:
| | | | |
| | | RiverFront Strategic Income
Fund | |
Accumulated net investment income | | $ | 24,903 | |
Accumulated net realized loss on investments | | | (7,003,771 | ) |
Net unrealized depreciation on investments | | | (5,809,920 | ) |
Total | | $ | (12,788,788 | ) |
| | | | | |
As of November 30, 2015, the cost of investments for federal income tax purposes and accumulated net unrealized appreciation/(depreciation) on investments were as follows:
| | | | |
| | | RiverFront Strategic Income
Fund | |
Gross appreciation (excess of value over tax cost) | | $ | 1,979,959 | |
Gross depreciation (excess of tax cost over value) | | | (7,789,879 | ) |
Net unrealized appreciation (depreciation) | | | (5,809,920 | ) |
| | | | | |
Cost of investments for income tax purposes | | $ | 463,150,284 | |
| | | | | |
At November 30, 2015, the Fund’s post-enactment capital losses deferred to the next tax year were as follows:
| | | | | | | | |
| Fund | | Short-Term | | | Long-Term | |
RiverFront Strategic Income Fund | | $ | 4,701,450 | | | $ | 2,302,321 | |
13 | November 30, 2015
| | |
RiverFront Strategic Income Fund | | |
| Notes to Financial Statements | | November 30, 2015 |
F. Income Taxes
No provision for income taxes is included in the accompanying financial statements, as the Fund intends to distribute to shareholders all taxable investment income and realized gains and otherwise comply with Subchapter M of the Internal Revenue Code of 1986, as amended, applicable to regulated investment companies. The Fund evaluates tax positions taken (or expected to be taken) in the course of preparing the Fund’s tax returns to determine whether these positions meet a “more-likely-than-not” standard that, based on the technical merits, have a more than fifty percent likelihood of being sustained by a taxing authority upon examination. A tax position that meets the “more-likely-than-not” recognition threshold is measured to determine the amount of benefit to recognize in the financial statements.
As of and during the year ended November 30, 2015, the Fund did not have a liability for any unrecognized tax benefits. The Fund files U.S. federal, state, and local tax returns as required. The Fund’s tax returns are subject to examination by the relevant tax authorities until expiration of the applicable statute of limitations which is generally three years after the filing of the tax return, but may extend to four years in certain jurisdictions. Tax returns for open years have incorporated no uncertain tax positions that require a provision for income taxes.
3. INVESTMENT ADVISORY FEE AND OTHER AFFILIATED TRANSACTIONS
ALPS Advisors, Inc. (the “Adviser”) acts as the Fund’s investment adviser pursuant to an Advisory Agreement with the Trust on behalf of the Fund (the “Advisory Agreement”). Pursuant to the Advisory Agreement, the Fund pays the Adviser an annual management fee for the services and facilities it provides equal to 0.22% of the Fund’s average daily net assets.
Out of the advisory fee, the Adviser pays substantially all expenses of the Fund, including the cost of transfer agency, custody, fund administration, legal, audit, independent trustees and other services, except for interest expenses, distribution fees or expenses, brokerage expenses, taxes and extraordinary expenses such as litigation and other expenses not incurred in the ordinary course of the Fund’s business. The Adviser’s unitary management fee is designed to pay substantially all of the Fund’s expenses and to compensate the Adviser for providing services for the Fund.
RiverFront Investment Group, LLC acts as the Fund’s sub-adviser (“Sub-Adviser”) pursuant to a sub-advisory agreement with the Trust (the ‘‘Sub-Advisory Agreement’’). Pursuant to the Sub-Advisory Agreement, the Fund pays the Sub-Adviser a sub-advisory fee for the services it provides, payable on a monthly basis at the annual rate of 0.24% of the Fund’s average daily net assets. However, the Sub-Adviser has agreed to waive all of its sub-advisory fee until at least March 31, 2016. This waiver may only be terminated by the Fund’s Board (and not by the Fund’s Sub-Adviser) prior to such date.
The Fund’s total annual management fees of 0.46% consists of 0.22% paid to the Fund’s adviser and a fee of 0.24% paid to the Fund’s sub-adviser.
ALPS Fund Services, Inc., an affiliate of the Adviser, is the administrator of the Fund.
Each Trustee who is not an officer or employee of the Adviser, any sub-adviser or any of their affiliates (“Independent Trustees”) receives (1) a quarterly retainer of $5,000, (2) a per meeting fee for regularly scheduled meetings of $3,750, (3) $1,500 for any special meeting held outside of a regularly scheduled board meeting, and (4) reimbursement for all reasonable out-of-pocket expenses relating to attendance at meetings.
4. PURCHASES AND SALES OF SECURITIES
For the year ended November 30, 2015, the cost of purchases and proceeds from sales of investment securities, excluding in-kind transactions and short-term investments, were as follows:
| | | | | | | | |
| Fund | | Purchases | | | Sales | |
RiverFront Strategic Income Fund | | $ | 183,154,033 | | | $ | 156,854,724 | |
For the year ended November 30, 2015, the cost of in kind purchases and proceeds from in kind sales were as follows:
| | | | | | | | |
| Fund | | Purchases | | | Sales | |
RiverFront Strategic Income Fund | | $ | 116,759,122 | | | $ | 41,902,165 | |
The RiverFront Strategic Income Fund had in-kind net realized gain/(loss) of -$544,139.
Gains on in-kind transactions are not considered taxable for federal income tax purposes.
14 | November 30, 2015
| | |
RiverFront Strategic Income Fund | | |
| Notes to Financial Statements | | November 30, 2015 |
5. CAPITAL SHARE TRANSACTIONS
Shares are created and redeemed by the Fund only in Creation Unit size aggregations of 50,000 shares. Only broker-dealers or large institutional investors with creation and redemption agreements called Authorized Participants (“AP”) are permitted to purchase or redeem Creation Units from the Fund. Such transactions are generally permitted on an in-kind basis, with a balancing cash component to equate the transaction to the NAV per unit of the Fund on the transaction date. Cash may be substituted equivalent to the value of certain securities generally when they are not available in sufficient quantity for delivery, not eligible for trading by the AP or as a result of other market circumstances.
15 | November 30, 2015
| | |
RiverFront Strategic Income Fund | | |
| Additional Information | | November 30, 2015 (Unaudited) |
PROXY VOTING RECORDS, POLICIES AND PROCEDURES
Information regarding how the Fund voted proxies relating to portfolio securities during the most recent 12-month period ended June 30 and a description of the Fund’s proxy voting policies and procedures used in determining how to vote for proxies are available without charge on the Securities and Exchange Commission’s (“SEC”) website at www.sec.gov and upon request, by calling (toll-free) 1-866-675-2639.
PORTFOLIO HOLDINGS
The Trust is required to disclose, after its first and third fiscal quarters, the complete schedule of each Fund’s portfolio holdings with the SEC on Form N-Q. Form N-Q for each Fund will be available on the SEC’s website at www.sec.gov. Each Fund’s Form N-Q may also be reviewed and copied at the SEC’s Public Reference Room in Washington, D.C. and information on the operation of the Public Reference Room may be obtained by calling 1-800-SEC-0330. Each Fund’s Form N-Q will be available without charge, upon request, by calling (toll-free) 1-866-675-2639 or by writing to ALPS ETF Trust at 1290 Broadway, Suite 1100, Denver, Colorado 80203.
TAX INFORMATION
Pursuant to Section 852(b)(3) of the Internal Revenue Code, the RiverFront Strategic Income Fund will designate $24,726 as long-term capital gain distributions for the year ending November 30, 2015.
16 | November 30, 2015
| | |
RiverFront Strategic Income Fund | | |
Board Considerations Regarding Approval of Investment Advisory Agreement and Investment Sub-Advisory Agreement | | November 30, 2015 (Unaudited) |
At an in-person meeting held on June 8, 2015, the Board of Trustees of the Trust (the “Board” or the “Trustees”), including the Trustees who are not “interested persons” of the Trust within the meaning of the 1940 Act, as amended (the “Independent Trustees”), evaluated a proposal to approve the continuance of the Advisory Agreement between the Trust and ALPS Advisors, Inc. (the “Adviser”) with respect to the RiverFront Strategic Income Fund (“RIGS” or “the Fund”) and the Sub-Advisory Agreement with RiverFront Investment Group, LLC (the “Sub-Adviser”) with respect to the Fund. The Independent Trustees also met separately to consider the Advisory Agreement and Sub-Advisory Agreement.
In evaluating the Investment Advisory Agreement with respect to RIGS, the Trustees considered various factors, including (i) the nature, extent and quality of the services to be provided by the Adviser with respect to the Fund under the Investment Advisory Agreement; (ii) the advisory fees and other expenses to be paid by the Fund compared to those of similar funds managed by other investment advisers; (iii) the costs of the services provided to the Fund by the Adviser and the profits realized by the Adviser and its affiliates from its relationship to the Fund; (iv) the extent which economies of scale would be realized if and as the assets of the Fund grow and whether fees reflect the economies of scale for the benefit of shareholders and (v) any additional benefits and other considerations.
With respect to the nature, extent and quality of the services to be provided by the Adviser under the Investment Advisory Agreement, the Trustees considered and reviewed information concerning the services to be provided under the Investment Advisory Agreement, financial information regarding the Adviser and its parent company, information describing the Adviser’s current organization and the background and experience of the persons who would be responsible for the day-to-day management of the Fund.
The Trustees reviewed information on the performance of the Fund and its benchmark, and Fund’s the Morningstar performance group. Based on their review, the Trustees found that the nature and extent of services provided to each Fund under the Investment Advisory Agreements was appropriate and that the quality was satisfactory.
The Trustees noted that the advisory fee for the Fund was a unitary fee pursuant to which the Adviser assumes all expenses of the Fund (including the cost of transfer agency, custody, fund administration, legal, audit and other services) other than the payments under the Advisory Agreement, brokerage expenses, taxes, interest, litigation expenses and other extraordinary expenses.
The Trustees noted that the advisory fee rate and expense ratio of RIGS are lower than the median of its Strategic Insight expense group.
Based on the foregoing, and the other information available to them, the Trustees concluded that the advisory fee rate for each of the Funds was reasonable under the circumstances and in light of the quality of the services provided.
The Trustees considered other benefits available to the Adviser because of its relationship with the Fund and concluded that the advisory fees were reasonable taking into account any such benefits.
The Trustees also considered the information provided by the Adviser about the costs and profitability of the Adviser with respect to the Fund. The Trustees considered the growth in the Fund’s assets and that the Fund may be achieving some economies of scale. They also noted that RIGS is still relatively a new product, which makes it difficult to quantify the potential variability in net assets and thus determine the sustainability of any potential economies of scale which may exist. The Trustees determined that they would continue to evaluate whether further economies of scale have been achieved on an ongoing basis.
In voting to renew the Investment Advisory Agreement, the Trustees concluded that the terms of the Investment Advisory Agreement are reasonable and fair in light of the services to be performed, the fees paid by certain other funds, expenses to be incurred and such other matters as the Trustees considered relevant in the exercise of their reasonable business judgment. The Trustees did not identify any single factor or group of factors as all important or controlling and considered all factors together.
The Trustees also discussed the RIGS Sub-Advisory Agreement.
In evaluating the RIGS Sub-Advisory Agreement, the Trustees considered various factors, including (i) the nature, extent and quality of the services provided by RiverFront with respect to RIGS under the RIGS Sub-Advisory Agreement; (ii) the advisory fees and other expenses paid by RIGS compared to those of similar funds managed by other investment advisers; (iii) the profitability to RiverFront of its sub-advisory relationship with RIGS and reasonableness of compensation to RiverFront; (iv) the extent to which economies of scale would be realized if, and as RIGS’ assets increase, and whether the fee level in the RIGS Sub-Advisory Agreement reflects these economies of scale; and (v) any additional benefits and other considerations.
17 | November 30, 2015
| | |
RiverFront Strategic Income Fund | | |
Board Considerations Regarding Approval of Investment Advisory Agreement and Investment Sub-Advisory Agreement | | November 30, 2015 (Unaudited) |
With respect to the nature, extent and quality of the services provided by RiverFront under the RIGS Sub-Advisory Agreement, the Trustees considered and reviewed information concerning the services to be provided under the RIGS Sub-Advisory Agreement, RIGS’ performance, financial information regarding RiverFront, information describing RiverFront’s current organizations and the background and experience of the persons responsible for the day-to-day management of the RIGS. Based upon their review, the Trustees concluded that RiverFront was qualified to oversee the portfolio management of RIGS and that the services provided by RiverFront to RIGS are satisfactory.
The Trustees considered that the sub-advisory fee to be paid to RiverFront from RIGS was 0.24% of RIGS’ average daily net assets. The Trustees considered that RiverFront has waived its fee through March 31, 2016. Based on consideration of all factors deemed relevant by them, the Trustees concluded that the sub-advisory fee for the RIGS Sub-Advisory Agreement was reasonable under the circumstances and in light of the quality of services provided.
With respect to the costs of services to be provided and profits to be realized by RiverFront, the Trustees considered the resources involved in managing RIGS as well as the fact that RiverFront has waived its fee through March 31, 2016. Based on its review, the Trustees concluded that the profitability of RIGS to RiverFront was not unreasonable.
The Trustees also considered other benefits that may be realized by RiverFront from its relationships with RIGS and concluded that the sub-advisory fees were reasonable taking into account such benefits.
The Trustees considered the extent to which economies of scale would be realized as RIGS grows in size and whether fee levels reflect a reasonable sharing of such economies of scale for the benefit of the Fund’s investors. Given that RiverFront is currently waiving its entire fee through March 31, 2016, the Trustees concluded that economies of scale were not being achieved by RiverFront with respect to RIGS. The Trustees considered the growth in assets and that the Fund may be achieving some economies of scale. They also noted that RIGS is still a relatively new product which makes it difficult to quantify the potential variability in net assets and thus determine the sustainability of any potential economies of scale which may exist. The Trustees determined that they would continue to evaluate whether further economies of scale have been achieved on an ongoing basis.
In voting to approve the RIGS Sub-Advisory Agreement, the Trustees concluded that the terms of the RIGS Sub-Advisory Agreement are reasonable and fair in light of the services to be performed, expenses to be incurred and such other matters as the Trustees considered relevant in the exercise of their reasonable business judgment. The Trustees did not identify any single factor or group of factors as all important or controlling and considered all factors together.
18 | November 30, 2015
| | |
RiverFront Strategic Income Fund | | |
| Trustees & Officers | | November 30, 2015 (Unaudited) |
| | | | | | | | | | |
INDEPENDENT TRUSTEES |
Name, Address
& Year of Birth* | | Position(s) Held with Trust | | Term of Office
and Length of
Time Served** | | Principal Occupation(s)
During Past 5 Years | | Number of
Portfolios in Fund
Complex Overseen
by Trustees*** | | Other Directorships
Held by Trustees |
Mary K. Anstine, 1940 | | Trustee | | Since March 2008 | | Ms. Anstine was formerly an Executive Vice President of First Interstate Bank of Denver until 1994, President/Chief Executive Officer of HealthONE Alliance, Denver, Colorado, from 1994 to 2004, and has been retired since 2004. Ms. Anstine is also Trustee/Director of the following: AV Hunter Trust and Colorado Uplift Board. Ms. Anstine was formerly a Director of the Trust Bank of Colorado (later purchased and now known as Northern Trust Bank), HealthONE and Denver Area Council of the Boy Scouts of America and a member of the American Bankers Association Trust Executive Committee. | | 46 | | Ms. Anstine is a Trustee of ALPS Variable Investment Trust (9 funds); Financial Investors Trust (31 funds); Reaves Utility Income Fund; and Westcore Trust (12 funds). |
Jeremy W. Deems, 1976 | | Trustee | | Since March 2008 | | Mr. Deems is the Co-Founder, Chief Financial Officer of Green Alpha Advisors, LLC. Mr. Deems is Co-Portfolio Manager of the Shelton Green Alpha Fund. Prior to joining Green Alpha Advisors, Mr. Deems was CFO and Treasurer of Forward Management, LLC, ReFlow Management Co., LLC, ReFlow Fund, LLC, a private investment fund, and Sutton Place Management, LLC, an administrative services company. | | 46 | | Mr. Deems is a Trustee of ALPS Variable Investment Trust (9 funds); Financial Investors Trust (31 funds); Clough Funds Trust (1 fund); and Reaves Utility Income Fund. |
Rick A. Pederson, 1952 | | Trustee | | Since March 2008 | | Mr. Pederson is President, Foundation Properties, Inc. (a real estate investment management company), 1994 - present; Advisory Board Member, Bow River Capital Partners (private equity management), 2003 - present; Advisor, Pauls Corporation (real estate investment management and development), 2008 - present; Chairman, Ross Consulting Group (real estate consulting services) 1983-2013; Advisory Board, Neenan Company (construction services) 2002- present; Board Member, Prosci, Inc. (private business services), 2013-present; Board Member, Citywide Banks (Colorado community bank) 2014-present; Board member, Professional Pediatric Health Care (a Denver-based home nursing firm) 2014 – present; Director, National Western Stock Show (not-for-profit organization); Director, Biennial of the Americas (not-for- profit organization). | | 24 | | Mr. Pederson is Trustee of Westcore Trust (12 funds) and Principal Real Estate Income Fund (1 fund). |
| * | The business address of the Trustee is c/o ALPS Advisors, Inc., 1290 Broadway, Suite 1100, Denver, Colorado 80203. |
| ** | This is the period for which the Trustee began serving the Trust. Each Trustee serves an indefinite term, until his successor is elected. |
| *** | The Fund Complex includes all series of the Trust and any other investment companies for which ALPS Advisors, Inc. provides investment advisory services. |
The Statement of Additional Information includes additional information about the Fund’s Trustees and is available, without charge, upon request by calling (toll-free) 1-866-675-2639.
19 | November 30, 2015
| | |
RiverFront Strategic Income Fund | | |
| Trustees & Officers | | November 30, 2015 (Unaudited) |
| | | | | | | | | | |
INTERESTED TRUSTEE |
Name, Address and Year of Birth of Interested Trustee* | | Position(s) Held with Trust | | Term of Office
and Length of
Time Served** | | Principal Occupation(s)
During Past 5 Years | | Number of
Portfolios in Fund
Complex Overseen
by Trustees*** | | Other Directorships
Held by Trustees |
Thomas A. Carter, 1966 | | Trustee and President | | Since March 2008 | | Mr. Carter joined ALPS Fund Services, Inc. (“ALPS”) in 1994 and is currently President and Director of ALPS Advisors, Inc. (“AAI”), and ALPS Portfolio Solutions Distributor, Inc. (“APSD”) and Executive Vice President and Director of ALPS and ALPS Holdings, Inc. (“AHI”), and ALPS Distributors, Inc. (“ADI”). Because of his position with AHI, ALPS, ADI, APSD and AAI, Mr. Carter is deemed an affiliate of the Fund as defined under the 1940 Act. Before joining ALPS, Mr. Carter was with Deloitte & Touche LLP, where he worked with a diverse group of clients, primarily within the financial services industry. Mr. Carter is a Certified Public Accountant and received his Bachelor of Science in Accounting from the University of Colorado at Boulder. | | 34 | | Mr. Carter is a Trustee of ALPS Variable Investment Trust (9 funds) and Principal Real Estate Income Fund (1 fund) |
| * | The business address of the Trustee is c/o ALPS Advisors, Inc., 1290 Broadway, Suite 1100, Denver, Colorado 80203. |
| ** | This is the period for which the Trustee began serving the Trust. Each Trustee serves an indefinite term, until his successor is elected. |
| *** | The Fund Complex includes all series of the Trust and any other investment companies for which ALPS Advisors, Inc. provides investment advisory services. |
The Statement of Additional Information includes additional information about the Fund’s Trustees and is available, without charge, upon request by calling (toll-free) 1-866-675-2639.
20 | November 30, 2015
| | |
RiverFront Strategic Income Fund | | |
| Trustees & Officers | | November 30, 2015 (Unaudited) |
| | | | | | |
OFFICERS |
Name, Address and Year of Birth of Officer* | | Position(s) Held
with Trust | | Length of Time
Served** | | Principal Occupation(s) During Past 5 Years |
Erin D. Nelson, 1977 | | Chief Compliance Officer (“CCO”) | | Since December 2015 | | Erin Nelson became Senior Vice-President and Chief Compliance Officer of ALPS Advisors, Inc. (“AAI”) on July 1, 2015 and prior to that served as Vice President and Deputy Chief Compliance Officer of AAI since January 1, 2015. Prior to January 1, 2015, Ms. Nelson was Vice-President and Assistant General Counsel of ALPS of Fund Services, Inc. Ms. Nelson joined AAI’s parent company, ALPS Holdings, Inc. in January 2003. Ms. Nelson currently is also the Chief Compliance Officer of Principal Real Estate Income Fund, and as of December 2015, the Chief Compliance Officer of Liberty All-Star Equity Fund, Liberty All-Star Growth Fund, Inc., RiverNorth Opportunities Fund, Inc. |
Patrick D. Buchanan, 1972 | | Treasurer | | Since June 2012 | | Mr. Buchanan is Vice President of AAI. Mr. Buchanan joined ALPS in 2007 and because of his position with AAI, he is deemed an affiliate of the Trust as defined under the 1940 Act. Mr. Buchanan is also Treasurer of the ALPS Variable Insurance Trust, Clough Funds Trust and Principal Real Estate Income Fund. |
William Parmentier, 1952 | | Vice President | | Since March 2008 | | Mr. Parmentier is Chief Investment Officer, AAI (since 2006); President and Chief Executive Officer of the Liberty All-Star Funds (since April 1999); Senior Vice President (2005-2006), Banc of America Investment Advisors, Inc. Because of his position with AAI, Mr. Parmentier is deemed an affiliate of the Trust as defined under the 1940 Act. |
Abigail J. Murray, 1975 | | Secretary | | Since June 2015 | | Ms. Murray joined ALPS in April 2015. She is currently Vice President and Senior Counsel of ALPS. Prior to joining ALPS, Ms. Murray was an Attorney and Managing Member at Murray & Rouvina PLC from 2014 to 2015 and an Associate with Vedder Price P.C. from 2007 to 2014. Because of her position with ALPS, Ms. Murray is deemed an affiliate of the Trust as defined under the 1940 Act. Ms. Murray is also the Secretary of The Caldwell & Orkin Funds, Inc., Clough Global Opportunities Fund, Clough Global Allocation Fund, Clough Global Equity Fund and Clough Funds Trust. |
| Jennifer A. Craig, 1973 | | Assistant Secretary | | Since October 2013 | | Ms. Craig joined ALPS in 2007 and is currently Assistant Vice President and Paralegal Manager. Prior to joining ALPS, Ms. Craig was Legal Manager at Janus Capital Management LLC and served as Assistant Secretary of Janus Investment Fund, Janus Adviser Series and Janus Aspen Series. Because of her position with ALPS, Ms. Craig is deemed an affiliate of the Trust as defined under the 1940 Act. |
| * | The business address of the Officer is c/o ALPS Advisors, Inc., 1290 Broadway, Suite 1100, Denver, Colorado 80203. |
| ** | This is the period for which the Officer began serving the Trust. Each Officer serves an indefinite term, until his successor is elected. |
21 | November 30, 2015
table of
CONTENTS
www.alpsfunds.com
| | |
Workplace Equality Portfolio |
| Performance Overview | | November 30, 2015 (Unaudited) |
Investment Objective
The Workplace Equality Portfolio (the “Fund”) seeks investment results that correspond (before fees and expenses) generally to the price and yield performance of its underlying index, the Workplace Equality Index™ (ticker symbol LGBTEQLT) (the “Index”).
The Index is designed to provide a means of tracking the performance of companies which support workplace equality for lesbian, gay, bisexual and transgender (“LGBT”) employees. The Index consists of approximately 200 publicly traded stocks of U.S. and foreign companies which support equality for LGBT employees through their workplace practices, including non-discrimination policies regarding sexual orientation and gender identity and providing full benefits to for same-sex spouses, domestic partners and transgender individuals. The Index is compiled by Denver Investment Advisors LLC (“Denver Investments” or the “Index Provider”). The Index Provider uses publicly available lists and screening sources such as the National Gay & Lesbian Chamber of Commerce® Diversity Inc. Top 50®, Stonewall® or other screening sources, to identify companies with workplace policies that meet the Index’s criteria for equality for LGBT employees as described above (as well as market capitalization and liquidity requirements). The Index Provider also utilizes its own proprietary database for LGBT screening. The criteria are subject to change in response to changes in law.
Performance Overview
From December 1, 2014 to November 30, 2015, the Workplace Equality Index® returned 3.39%, handily outperforming the S&P 500 Index return of 2.75% during the same time period. The underperformance came primarily from sector allocation with our underweighting in energy, industrials and materials all contributing to return.
The Workplace Equality Index has historically been underweight the energy, materials and industrial sectors, which continued to have a positive impact on performance this year as commodity prices collapsed and capital spending remained depressed. The commodity markets still seem to be in a free-fall, which bodes well for our sector positioning going forward. At some point, we believe the commodity cycle will reverse. The silver lining is that as more and more companies adopt LGBT-inclusive workplace policies that qualify them for the index, we expect that our underweighting in “old economy” sectors will, over time, naturally diminish.
Our equal-weight structure detracted somewhat from returns as larger companies in capitalization weighted indices such as Apple and Microsoft had more of a positive performance impact due to their large weightings in those indices compared to in an equal-weight index.
Our approach to give all companies an equal weight can have positive effects, as we saw in the case of Electronic Arts. With an average weight during the year of 0.55% in the Workplace Equality Index (compared to 0.11% in the S&P 500 Index), Electronic Arts positive contribution to our return on its 57% total return was substantially higher than in a cap-weighted index.
The best contribution to return came from Jet Blue (up 56%), Orbitz (up 45%), Kraft Heinz (up 47%), Starbucks (up 52%) and Electronic Arts (up 44%). Jet Blue and Alaska Airlines were standouts in the consumer discretionary sector, where the stocks in Underlying Index underperformed their peers in the S&P 500 Index. Orbitz was a case of good news/bad news, as the company was acquired by Expedia, which does not qualify for the Workplace Equality Index. Starbucks and Electronic Arts both benefitted from robust consumer spending as much as their category leading positions. Kraft Heinz is the resulting entity of a merger of privately held Heinz and our Kraft Foods holding – another beneficiary (like Orbitz) of robust M&A activity this year.
The five largest detractors from return this year were Groupon (down 65%), Avon Products (down 61%), Wynn Resorts (down 57%), Alcoa (down 40%) and Macy’s (down 40%). Two of those stocks were victims of a slowing Chinese economy (Wynn and Alcoa) and the other three failed to keep up with rapid changes in consumer behavior (Avon, Groupon and Macy’s).
Identifying companies that treat their LGBT employees equally with all others has been our mission since we started screening for LGBT-inclusive workplace policies. We believe that companies that value all of their employees benefit from a “Return on Equality™” and that trend will continue in the foreseeable future.
1 | November 30, 2015
| | |
Workplace Equality Portfolio |
| Performance Overview | | November 30, 2015 (Unaudited) |
Performance (as of November 30, 2015)
| | | | |
| | | 1 Year | | Since Inception^ |
Workplace Equality Portfolio – NAV | | 0.59% | | 6.82% |
Workplace Equality Portfolio – Market Price* | | 0.59% | | 6.84% |
Workplace Equality IndexTM | | 1.34% | | 8.44% |
S&P 500® Total Return Index | | 2.75% | | 9.19% |
Total Expense Ratio (per the current prospectus) 0.75%
Performance data quoted represents past performance. Past performance does not guarantee future results. Investment return and principal value of an investment will fluctuate so that an investor’s shares, when sold or redeemed, may be worth more or less than the original cost. Current performance data may be higher or lower than actual data quoted. For the most current month-end performance data please visit www.alpsfunds.com or call 1.844.375.8383.
NAV is an exchange-traded fund’s per-share value. The per-share dollar amount of the fund is derived by dividing the total value of all the securities in its portfolio, less any liabilities, by the number of fund shares outstanding. Market Price is the price at which a share can currently be traded in the market. Information detailing the number of days the Market Price of the Fund was greater than the Fund’s NAV and the number of days it was less than the Fund’s NAV can be obtained at www.alpsfunds.com.
| ^ | The Fund Commencement date was February 25, 2014. | |
| * | Market Price is based on the midpoint of the bid-ask spread at 4 p.m. ET and does not represent the returns an investor would receive if shares were traded at other times. | |
The Workplace Equality IndexTM: an equal weighted index of companies that support lesbian, gay, bisexual and transgender (LGBT) equality in their workplace. For inclusion, a company must score 100% on the Human Rights Campaign Equality Index or, if not found in the Corporate Equality Index, have the verifiable characteristics that would earn them such a score.
The S&P 500® Total Return Index: the Standard & Poor’s composite index of 500 stocks, a widely recognized, unmanaged index of common stock prices. Total Return is obtained by reinvesting in the index the ordinary gross dividends declared by the index constituents.
One cannot invest directly in an index. Index performance does not reflect fund performance.
The Fund invests in stocks of companies which meet the Index’s criteria for supporting workplace equality for LGBT employees. The trend of companies supporting workplace equality in this fashion is relatively recent, and there may be a limited number of companies which meet the Index’s criteria.
The Workplace Equality Portfolio is not suitable for all investors. Investments in the Fund are subject to investment risks, including possible loss of the principal amount invested.
ALPS Portfolio Solutions Distributor, Inc. is the Distributor for the Workplace Equality Portfolio.
ALPS Portfolio Solutions Distributor, Inc. is not affiliated with Denver Investments.
2 | November 30, 2015
| | |
Workplace Equality Portfolio |
| Performance Overview | | November 30, 2015 (Unaudited) |
| | |
Top 10 Holdings* (as of November 30, 2015) | | |
EI du Pont de Nemours & Co. | | 0.69% |
Microsoft Corp. | | 0.61% |
Dow Chemical Co. | | 0.60% |
General Electric Co. | | 0.59% |
Yelp, Inc. | | 0.59% |
LinkedIn Corp., Class A | | 0.59% |
Abercrombie & Fitch Co., Class A | | 0.59% |
Intel Corp. | | 0.58% |
Raytheon Co. | | 0.58% |
Alphabet, Inc., Class C | | 0.58% |
Total % of Top 10 Holdings | | 6.00% |
| | |
Sector Allocation* (as of November 30, 2015) | | |
Consumer Discretionary | | 22.99% |
Financials | | 21.33% |
Information Technology | | 18.97% |
Industrials | | 11.16% |
Consumer Staples | | 8.84% |
Health Care | | 8.09% |
Materials | | 3.13% |
Utilities | | 2.44% |
Telecommunication Services | | 2.40% |
Energy | | 0.57% |
Money Market Fund | | 0.08% |
Total | | 100.00% |
Future holdings are subject to change.
Growth of $10,000 (as of November 30, 2015)
Comparison of Change in Value of $10,000 Investment in the Fund and the Indexes
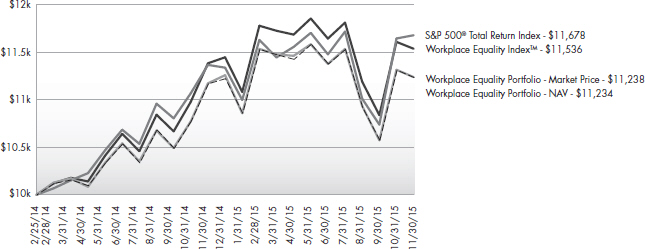
The chart above represents historical performance of a hypothetical investment of $10,000 in the Fund over the life of the Fund. Performance calculations are as of the end of each month. Past performance does not guarantee future results. This chart does not reflect the deduction of taxes that a shareholder would pay on Fund distributions or the redemption of Fund shares.
3 | November 30, 2015
| | |
Workplace Equality Portfolio |
| Disclosure of Fund Expenses | | November 30, 2015 (Unaudited) |
Shareholder Expense Example: As a shareholder of the Fund, you incur two types of costs: (1) transaction costs which may include creation and redemption fees or brokerage charges, and (2) ongoing costs, including management fees and other Fund expenses. These examples are intended to help you understand your ongoing costs (in dollars) of investing in the Fund and to compare these costs with the ongoing costs of investing in other funds. It is based on an investment of $1,000 invested at the beginning of the (six month) period and held through November 30, 2015.
Actual Return: The first line of the table provides information about actual account values and actual expenses. You may use the information in this table, together with the amount you invested, to estimate the expenses that you incurred over the period. Simply divide your account value by $1,000 (for example, an $8,600 account value divided by $1,000 = 8.6), then multiply the result by the number in the first line under the heading entitled “Expenses Paid During the Period” to estimate the expenses attributable to your investment during this period.
Hypothetical 5% Return: The second line of the table provides information about hypothetical account values and hypothetical expenses based on the Fund’s actual expense ratio and an assumed rate of return of 5% per year before expenses, which is not the Fund’s actual return. The hypothetical account values and expenses may not be used to estimate the actual ending account balance or expenses you paid for the period. You may use this information to compare ongoing costs of investing in the Fund and other funds. To do so, compare this 5% hypothetical example with the 5% hypothetical examples that appear in the shareholder reports of the other funds.
The expenses shown in the table are meant to highlight ongoing Fund costs only and do not reflect any transaction costs, such as creation and redemption fees, or brokerage charges. Therefore, the second line is useful in comparing ongoing costs only, and will not help you determine the relative total costs of owning different funds. In addition, if these costs were included, your costs would have been higher.
| | | | | | | | | | | | | | | | | | | | |
| | | Beginning Account
Value 6/1/15 | | Ending Account
Value 11/30/15 | | Expense
Ratio(a) | | Expenses Paid
During Period
6/1/15 - 11/30/15(b) |
Workplace Equality Portfolio Fund | | | | | | | | | | | | | | | | | | | | |
Actual | | | $ | 1,000.00 | | | | $ | 969.90 | | | | | 0.75 | % | | | $ | 3.70 | |
Hypothetical (5% return before expenses) | | | $ | 1,000.00 | | | | $ | 1,021.31 | | | | | 0.75 | % | | | $ | 3.80 | |
| (a) | Annualized, based on the Fund’s most recent fiscal half year expenses. |
| (b) | Expenses are equal to the Fund’s annualized expense ratio multiplied by the average account value over the period, multiplied by the number of days in the most recent fiscal half year (183), divided by 365. |
4 | November 30, 2015
|
Workplace Equality Portfolio |
| Report of Independent Registered Public Accounting Firm |
To the Board of Trustees and Shareholders of ALPS ETF Trust:
We have audited the accompanying statement of assets and liabilities, including the schedule of investments, of Workplace Equality Portfolio, one of the portfolios constituting the ALPS ETF Trust (the “Trust”), as of November 30, 2015, and the related statement of operations for the year then ended, and the statements of changes in net assets and the financial highlights for the year then ended and for the period February 25, 2014 (commencement of operations) to November 30, 2014. These financial statements and financial highlights are the responsibility of the Trust’s management. Our responsibility is to express an opinion on these financial statements and financial highlights based on our audits.
We conducted our audits in accordance with the standards of the Public Company Accounting Oversight Board (United States). Those standards require that we plan and perform the audit to obtain reasonable assurance about whether the financial statements and financial highlights are free of material misstatement. The Trust is not required to have, nor were we engaged to perform, an audit of its internal control over financial reporting. Our audits included consideration of internal control over financial reporting as a basis for designing audit procedures that are appropriate in the circumstances, but not for the purpose of expressing an opinion on the effectiveness of the Trust’s internal control over financial reporting. Accordingly, we express no such opinion. An audit also includes examining, on a test basis, evidence supporting the amounts and disclosures in the financial statements, assessing the accounting principles used and significant estimates made by management, as well as evaluating the overall financial statement presentation. Our procedures included confirmation of securities owned as of November 30, 2015, by correspondence with the custodian. We believe that our audits provide a reasonable basis for our opinion.
In our opinion, the financial statements and financial highlights referred to above present fairly, in all material respects, the financial position of Workplace Equality Portfolio of the ALPS ETF Trust as of November 30, 2015, the results of its operations for the year then ended, and the changes in its net assets and the financial highlights for the year then ended and for the period February 25, 2014 (commencement of operations) to November 30, 2014, in conformity with accounting principles generally accepted in the United States of America.
DELOITTE & TOUCHE LLP
Denver, Colorado
January 28, 2016
5 | November 30, 2015
| | |
Workplace Equality Portfolio |
| Schedule of Investments | | November 30, 2015 |
| | | | | | | | |
| Security Description | | Shares | | | Value | |
COMMON STOCKS (99.77%) | | | | | | | | |
Consumer Discretionary (22.95%) | | | | | | | | |
Abercrombie & Fitch Co., Class A | | | 2,221 | | | $ | 56,791 | |
American Eagle Outfitters, Inc. | | | 2,939 | | | | 45,760 | |
Aramark | | | 1,495 | | | | 48,767 | |
Barnes & Noble Education, Inc.(a) | | | 3,729 | | | | 53,884 | |
Barnes & Noble, Inc. | | | 3,609 | | | | 46,195 | |
Best Buy Co., Inc. | | | 1,258 | | | | 39,979 | |
Caesars Entertainment Corp.(a) | | | 5,110 | | | | 43,282 | |
CBS Corp., Class B | | | 1,099 | | | | 55,478 | |
Choice Hotels International, Inc. | | | 940 | | | | 48,015 | |
Coach, Inc. | | | 1,611 | | | | 51,181 | |
Comcast Corp., Class A | | | 833 | | | | 50,696 | |
Darden Restaurants, Inc. | | | 679 | | | | 38,139 | |
Ford Motor Co. | | | 3,370 | | | | 48,292 | |
GameStop Corp., Class A | | | 1,108 | | | | 38,813 | |
Gap, Inc. | | | 1,489 | | | | 39,801 | |
General Motors Co. | | | 1,536 | | | | 55,603 | |
Groupon, Inc.(a) | | | 11,029 | | | | 31,874 | |
Hilton Worldwide Holdings, Inc. | | | 1,953 | | | | 45,349 | |
Hyatt Hotels Corp., Class A(a) | | | 961 | | | | 47,368 | |
InterContinental Hotels Group PLC, Sponsored ADR | | | 1,298 | | | | 49,662 | |
Interpublic Group of Cos., Inc. | | | 2,326 | | | | 53,498 | |
L Brands, Inc. | | | 515 | | | | 49,136 | |
Macy’s, Inc. | | | 868 | | | | 33,921 | |
Marriott International, Inc., Class A | | | 676 | | | | 47,935 | |
MGM Resorts International(a) | | | 2,291 | | | | 52,097 | |
Newell Rubbermaid, Inc. | | | 1,116 | | | | 49,841 | |
NIKE, Inc., Class B | | | 412 | | | | 54,499 | |
Nordstrom, Inc. | | | 688 | | | | 38,741 | |
Office Depot, Inc.(a) | | | 6,349 | | | | 41,840 | |
Pearson PLC, Sponsored ADR | | | 2,699 | | | | 33,279 | |
Sears Holdings Corp.(a) | | | 1,849 | | | | 40,918 | |
Sirius XM Holdings, Inc.(a) | | | 12,288 | | | | 50,504 | |
Sony Corp., Sponsored ADR | | | 1,848 | | | | 47,900 | |
Staples, Inc. | | | 3,542 | | | | 42,752 | |
Starbucks Corp. | | | 828 | | | | 50,831 | |
Starwood Hotels & Resorts Worldwide, Inc. | | | 660 | | | | 47,414 | |
Target Corp. | | | 613 | | | | 44,443 | |
Tesla Motors, Inc.(a) | | | 180 | | | | 41,447 | |
Thomson Reuters Corp. | | | 1,181 | | | | 47,642 | |
Time Warner Cable, Inc. | | | 249 | | | | 46,008 | |
Time Warner, Inc. | | | 677 | | | | 47,376 | |
Time, Inc. | | | 2,379 | | | | 39,587 | |
TJX Cos., Inc. | | | 662 | | | | 46,737 | |
Viacom, Inc., Class B | | | 1,039 | | | | 51,732 | |
Walt Disney Co. | | | 456 | | | | 51,742 | |
Whirlpool Corp. | | | 290 | | | | 47,131 | |
Wyndham Worldwide Corp. | | | 618 | | | | 46,919 | |
Wynn Resorts Ltd. | | | 696 | | | | 43,688 | |
| | | | | | | | |
Total Consumer Discretionary | | | | | | | 2,224,487 | |
| | | | | | | | |
| | |
Consumer Staples (8.82%) | | | | | | | | |
Avon Products, Inc. | | | 12,008 | | | | 41,428 | |
Brown-Forman Corp., Class B | | | 486 | | | | 49,835 | |
Campbell Soup Co. | | | 922 | | | | 48,165 | |
Clorox Co. | | | 416 | | | | 51,709 | |
| | | | | | | | |
| Security Description | | Shares | | | Value | |
Consumer Staples (continued) | | | | | | | | |
Coca-Cola Co. | | | 1,211 | | | $ | 51,613 | |
ConAgra Foods, Inc. | | | 1,112 | | | | 45,514 | |
CVS Health Corp. | | | 475 | | | | 44,693 | |
Diageo PLC, Sponsored ADR | | | 431 | | | | 49,375 | |
General Mills, Inc. | | | 833 | | | | 48,114 | |
Hershey Co. | | | 512 | | | | 44,191 | |
Kellogg Co. | | | 694 | | | | 47,727 | |
The Kraft Heinz Co. | | | 625 | | | | 46,056 | |
Mondelez International, Inc., Class A | | | 1,097 | | | | 47,895 | |
Pepsi Co., Inc. | | | 508 | | | | 50,881 | |
Procter & Gamble Co. | | | 674 | | | | 50,442 | |
SUPERVALU, Inc.(a) | | | 6,038 | | | | 40,575 | |
Unilever NV, NY Shares | | | 1,177 | | | | 51,482 | |
Walgreens Boots Alliance, Inc. | | | 540 | | | | 45,376 | |
| | | | | | | | |
Total Consumer Staples | | | | | | | 855,071 | |
| | | | | | | | |
| | |
Energy (0.57%) | | | | | | | | |
Chevron Corp. | | | 607 | | | | 55,431 | |
| | | | | | | | |
Total Energy | | | | | | | 55,431 | |
| | | | | | | | |
| | |
Financials (21.30%) | | | | | | | | |
American Express Co. | | | 620 | | | | 44,417 | |
American International Group, Inc. | | | 820 | | | | 52,136 | |
Ameriprise Financial, Inc. | | | 446 | | | | 50,376 | |
Aon PLC | | | 533 | | | | 50,496 | |
Bank of America Corp. | | | 3,050 | | | | 53,162 | |
Bank of Montreal | | | 904 | | | | 52,107 | |
Bank of New York Mellon Corp. | | | 1,217 | | | | 53,353 | |
Barclays PLC, Sponsored ADR | | | 3,014 | | | | 40,538 | |
BlackRock, Inc. | | | 152 | | | | 55,286 | |
Capital One Financial Corp. | | | 642 | | | | 50,403 | |
CBRE Group, Inc., Class A(a) | | | 1,430 | | | | 53,582 | |
Charles Schwab Corp. | | | 1,647 | | | | 55,520 | |
Chubb Corp. | | | 394 | | | | 51,429 | |
Citigroup, Inc. | | | 938 | | | | 50,736 | |
Comerica, Inc. | | | 1,169 | | | | 54,183 | |
Credit Suisse Group AG, Sponsored ADR | | | 1,820 | | | | 40,131 | |
Deutsche Bank AG | | | 1,658 | | | | 42,594 | |
Discover Financial Services | | | 903 | | | | 51,254 | |
Four Corners Property Trust, Inc.(a) | | | 226 | | | | 4,475 | |
Goldman Sachs Group, Inc. | | | 260 | | | | 49,405 | |
Hartford Financial Services Group, Inc. | | | 1,059 | | | | 48,333 | |
HSBC Holdings PLC, Sponsored ADR | | | 1,264 | | | | 50,434 | |
Huntington Bancshares, Inc. | | | 4,566 | | | | 53,377 | |
JPMorgan Chase & Co. | | | 775 | | | | 51,677 | |
KeyCorp | | | 3,658 | | | | 47,956 | |
Marsh & McLennan Cos., Inc. | | | 889 | | | | 49,162 | |
MetLife, Inc. | | | 1,014 | | | | 51,805 | |
Moody’s Corp. | | | 466 | | | | 48,054 | |
Morgan Stanley | | | 1,429 | | | | 49,015 | |
Northern Trust Corp. | | | 700 | | | | 52,458 | |
PNC Financial Services Group, Inc. | | | 539 | | | | 51,480 | |
Progressive Corp. | | | 1,539 | | | | 47,432 | |
Prudential Financial, Inc. | | | 620 | | | | 53,661 | |
Royal Bank of Canada | | | 878 | | | | 49,914 | |
6 | November 30, 2015
| | |
Workplace Equality Portfolio |
| Schedule of Investments | | November 30, 2015 |
| | | | | | | | |
| Security Description | | Shares | | | Value | |
Financials (continued) | | | | | | | | |
State Street Corp. | | | 680 | | | $ | 49,354 | |
Sun Life Financial, Inc. | | | 1,504 | | | | 49,632 | |
SunTrust Banks, Inc. | | | 1,252 | | | | 54,362 | |
T Rowe Price Group, Inc. | | | 675 | | | | 51,401 | |
Toronto-Dominion Bank | | | 1,226 | | | | 50,045 | |
UBS Group AG | | | 2,443 | | | | 46,808 | |
US Bancorp | | | 1,156 | | | | 50,737 | |
Wells Fargo & Co. | | | 929 | | | | 51,188 | |
| | | | | | | | |
Total Financials | | | | | | | 2,063,868 | |
| | | | | | | | |
| | |
Health Care (8.09%) | | | | | | | | |
Aetna, Inc. | | | 405 | | | | 41,614 | |
Biogen, Inc.(a) | | | 149 | | | | 42,742 | |
Boston Scientific Corp.(a) | | | 2,807 | | | | 51,312 | |
Bristol-Myers Squibb Co. | | | 742 | | | | 49,722 | |
Cardinal Health, Inc. | | | 564 | | | | 48,983 | |
Cigna Corp. | | | 334 | | | | 45,083 | |
Eli Lilly & Co. | | | 534 | | | | 43,809 | |
GlaxoSmithKline PLC, Sponsored ADR | | | 1,181 | | | | 47,842 | |
Humana, Inc. | | | 252 | | | | 42,502 | |
Johnson & Johnson | | | 504 | | | | 51,025 | |
McKesson Corp. | | | 231 | | | | 43,740 | |
Medtronic PLC | | | 675 | | | | 50,855 | |
Merck & Co., Inc. | | | 904 | | | | 47,921 | |
Novartis AG, Sponsored ADR | | | 487 | | | | 41,512 | |
Pfizer, Inc. | | | 1,428 | | | | 46,796 | |
St Jude Medical, Inc. | | | 700 | | | | 44,170 | |
UnitedHealth Group, Inc. | | | 385 | | | | 43,393 | |
| | | | | | | | |
Total Health Care | | | | | | | 783,021 | |
| | | | | | | | |
| | |
Industrials (11.14%) | | | | | | | | |
3M Co. | | | 338 | | | | 52,924 | |
Alaska Air Group, Inc. | | | 598 | | | | 47,679 | |
American Airlines Group, Inc. | | | 1,082 | | | | 44,643 | |
Boeing Co. | | | 345 | | | | 50,180 | |
Cummins, Inc. | | | 409 | | | | 41,051 | |
Danaher Corp. | | | 547 | | | | 52,725 | |
General Electric Co. | | | 1,906 | | | | 57,066 | |
Herman Miller, Inc. | | | 1,647 | | | | 52,226 | |
Huron Consulting Group, Inc.(a) | | | 681 | | | | 39,505 | |
JetBlue Airways Corp.(a) | | | 1,758 | | | | 43,493 | |
Lockheed Martin Corp. | | | 232 | | | | 50,845 | |
Navigant Consulting, Inc.(a) | | | 3,061 | | | | 53,567 | |
Northrop Grumman Corp. | | | 279 | | | | 51,994 | |
Owens Corning | | | 1,019 | | | | 47,730 | |
Raytheon Co. | | | 450 | | | | 55,814 | |
Rockwell Automation, Inc. | | | 455 | | | | 48,430 | |
Steelcase, Inc., Class A | | | 2,577 | | | | 51,540 | |
Towers Watson & Co., Class A | | | 411 | | | | 55,284 | |
United Continental Holdings, Inc.(a) | | | 783 | | | | 43,637 | |
United Technologies Corp. | | | 516 | | | | 49,562 | |
Virgin America, Inc.(a) | | | 1,259 | | | | 45,815 | |
WW Grainger, Inc. | | | 220 | | | | 44,119 | |
| | | | | | | | |
Total Industrials | | | | | | | 1,079,829 | |
| | | | | | | | |
| | |
Information Technology (18.94%) | | | | | | | | |
Accenture PLC, Class A | | | 493 | | | | 52,859 | |
| | | | | | | | |
| Security Description | | Shares | | | Value | |
Information Technology (continued) | | | | | | | | |
Adobe Systems, Inc.(a) | | | 581 | | | $ | 53,138 | |
Alcatel-Lucent, Sponsored ADR(a) | | | 13,390 | | | | 52,623 | |
Alphabet, Inc., Class C(a) | | | 75 | | | | 55,695 | |
Apple, Inc. | | | 416 | | | | 49,213 | |
Automatic Data Processing, Inc. | | | 596 | | | | 51,411 | |
Booz Allen Hamilton Holding Corp. | | | 1,715 | | | | 52,222 | |
Broadridge Financial Solutions, Inc. | | | 869 | | | | 47,778 | |
CA, Inc. | | | 1,712 | | | | 48,124 | |
Cisco Systems, Inc. | | | 1,850 | | | | 50,413 | |
Corning, Inc. | | | 2,664 | | | | 49,897 | |
eBay, Inc.(a) | | | 1,822 | | | | 53,913 | |
Electronic Arts, Inc.(a) | | | 672 | | | | 45,555 | |
EMC Corp. | | | 1,954 | | | | 49,514 | |
Facebook, Inc., Class A(a) | | | 501 | | | | 52,224 | |
Hewlett Packard Enterprise Co.(a) | | | 1,760 | | | | 26,154 | |
HP, Inc. | | | 1,760 | | | | 22,070 | |
Intel Corp. | | | 1,621 | | | | 56,362 | |
International Business Machines Corp. | | | 327 | | | | 45,590 | |
Intuit, Inc. | | | 553 | | | | 55,411 | |
Lexmark International, Inc., Class A | | | 1,610 | | | | 55,287 | |
LinkedIn Corp., Class A(a) | | | 234 | | | | 56,888 | |
MasterCard, Inc., Class A | | | 511 | | | | 50,037 | |
Microsoft Corp. | | | 1,084 | | | | 58,915 | |
NCR Corp.(a) | | | 1,748 | | | | 47,388 | |
NetApp, Inc. | | | 1,527 | | | | 46,818 | |
Nokia OYJ, Sponsored ADR | | | 7,139 | | | | 51,472 | |
Oracle Corp. | | | 1,294 | | | | 50,427 | |
PayPal Holdings, Inc.(a) | | | 1,445 | | | | 50,951 | |
QUALCOMM, Inc. | | | 866 | | | | 42,252 | |
Salesforce.com, Inc.(a) | | | 661 | | | | 52,675 | |
Symantec Corp. | | | 2,340 | | | | 45,817 | |
Tech Data Corp.(a) | | | 679 | | | | 45,934 | |
Visa, Inc., Class A | | | 674 | | | | 53,253 | |
Xerox Corp. | | | 4,550 | | | | 48,003 | |
Yahoo!, Inc.(a) | | | 1,546 | | | | 52,270 | |
Yelp, Inc.(a) | | | 1,889 | | | | 56,916 | |
| | | | | | | | |
Total Information Technology | | | | | | | 1,835,469 | |
| | | | | | | | |
| | |
Materials (3.13%) | | | | | | | | |
Alcoa, Inc. | | | 4,750 | | | | 44,460 | |
The Chemours Company | | | 5,323 | | | | 33,269 | |
Dow Chemical Co. | | | 1,108 | | | | 57,760 | |
Ecolab, Inc. | | | 420 | | | | 50,047 | |
EI du Pont de Nemours & Co. | | | 989 | | | | 66,599 | |
Monsanto Co. | | | 534 | | | | 50,816 | |
| | | | | | | | |
Total Materials | | | | | | | 302,951 | |
| | | | | | | | |
| | |
Telecommunication Services (2.39%) | | | | | | | | |
AT&T, Inc. | | | 1,457 | | | | 49,057 | |
BT Group PLC, Sponsored ADR | | | 730 | | | | 54,604 | |
Sprint Corp.(a) | | | 10,674 | | | | 38,960 | |
T-Mobile US, Inc.(a) | | | 1,129 | | | | 40,080 | |
Verizon Communications, Inc. | | | 1,082 | | | | 49,177 | |
| | | | | | | | |
Total Telecommunication Services | | | | | | | 231,878 | |
| | | | | | | | |
| | |
Utilities (2.44%) | | | | | | | | |
Edison International | | | 769 | | | | 45,648 | |
7 | November 30, 2015
| | |
Workplace Equality Portfolio |
| Schedule of Investments | | November 30, 2015 |
| | | | | | | | |
| Security Description | | | | Shares | | Value | |
Utilities (continued) | | | | | | | | |
Exelon Corp. | | 1,514 | | $ | 41,347 | |
PG&E Corp. | | 937 | | | 49,408 | |
Portland General Electric Co. | | 1,330 | | | 49,103 | |
Sempra Energy | | | | 512 | | | 50,806 | |
| | | | | | | | |
Total Utilities | | | | | | | 236,312 | |
| | | | | | | | |
| | |
TOTAL COMMON STOCKS (Cost $9,522,493) | | | | | 9,668,317 | |
| | | | | | | | |
| | | |
| | | 7 Day Yield | | Shares | | Value | |
SHORT TERM INVESTMENTS (0.08%) | | | | |
Morgan Stanley Institutional Liquidity Fund, Prime Portfolio | | 0.105% | | 8,114 | | | 8,114 | |
| | | | | | | | |
| | |
TOTAL SHORT TERM INVESTMENTS (Cost $8,114) | | | | | 8,114 | |
| | | | | | | | |
| | |
TOTAL INVESTMENTS (99.85%) (Cost $9,530,607) | | | | $ | 9,676,431 | |
| |
NET OTHER ASSETS AND LIABILITIES (0.15%) | | | 14,674 | |
| | | | | | | | |
| | | |
NET ASSETS (100.00%) | | | | | | $ | 9,691,105 | |
| | | | | | | | |
| (a) | Non-income producing security. |
Common Abbreviations:
| ADR - | American Depositary Receipt. |
| AG - | Aktiengesellschaft is a German term that refers to a corporation that is limited by shares, i.e., owned by shareholders. |
| NV - | Naamloze Vennootschap is the Dutch term for a public limited liability corporation. |
| OYJ - | Osakeyhtio is the Finnish equivalent of a public limited company. |
| PLC - | Public Limited Company. |
See Notes to Financial Statements.
| | |
Workplace Equality Portfolio |
| Statement of Assets and Liabilities | | November 30, 2015 |
| | | | |
ASSETS: | | | | |
Investments, at value | | $ | 9,676,431 | |
Cash | | | 5 | |
Foreign tax reclaims | | | 214 | |
Dividends receivable | | | 20,446 | |
Total Assets | | | 9,697,096 | |
| |
LIABILITIES: | | | | |
Payable to adviser | | | 5,991 | |
Total Liabilities | | | 5,991 | |
NET ASSETS | | $ | 9,691,105 | |
| | | | |
| |
NET ASSETS CONSIST OF: | | | | |
Paid-in capital | | $ | 9,443,024 | |
Accumulated net investment income | | | 103,087 | |
Accumulated net realized loss on investments | | | (830) | |
Net unrealized appreciation on investments | | | 145,824 | |
NET ASSETS | | $ | 9,691,105 | |
| | | | |
| |
INVESTMENTS, AT COST | | $ | 9,530,607 | |
| |
PRICING OF SHARES | | | | |
Net Assets | | $ | 9,691,105 | |
Shares of beneficial interest outstanding (Unlimited number of shares authorized, par value $0.01 per share) | | | 350,000 | |
Net Asset Value, offering and redemption price per share | | $ | 27.69 | |
See Notes to Financial Statements.
9 | November 30, 2015
| | |
Workplace Equality Portfolio |
| Statement of Operations | | For the Year Ended November 30, 2015 |
| | | | |
INVESTMENT INCOME: | | | | |
Dividends(a) | | $ | 170,699 | |
Total Investment Income | | | 170,699 | |
| |
EXPENSES: | | | | |
Investment adviser fees | | | 62,186 | |
Total Expense | | | 62,186 | |
NET INVESTMENT INCOME | | | 108,513 | |
| |
REALIZED AND UNREALIZED GAIN/(LOSS) | | | | |
Net realized gain on investments | | | 318,475 | |
Net change in unrealized depreciation on investments | | | (377,592) | |
NET REALIZED AND UNREALIZED LOSS ON INVESTMENTS | | | (59,117) | |
NET INCREASE IN NET ASSETS RESULTING FROM OPERATIONS | | $ | 49,396 | |
| | | | |
| (a) | Net of foreign tax withholding $2,467. |
See Notes to Financial Statements.
10 | November 30, 2015
| | |
Workplace Equality Portfolio |
| Statements of Changes in Net Assets | | |
| | | | | | | | |
| | | For the
Year Ended
November 30,
2015 | | | For the Period
February 25, 2014
(Commencement
of Operations) to
November 30,
2014 | |
OPERATIONS: | | | | | | | | |
Net investment income | | $ | 108,513 | | | $ | 61,988 | |
Net realized gain on investments | | | 318,475 | | | | 113,674 | |
Net change in unrealized appreciation/(depreciation) on investments | | | (377,592) | | | | 523,416 | |
Net increase in net assets resulting from operations | | | 49,396 | | | | 699,078 | |
| | |
DISTRIBUTIONS: | | | | | | | | |
Dividends to shareholders from net investment income | | | (98,693) | | | | – | |
Net decrease in net assets from distributions | | | (98,693) | | | | – | |
| | |
CAPITAL SHARE TRANSACTIONS: | | | | | | | | |
Proceeds from sale of shares | | | 5,633,317 | | | | 7,626,269 | |
Cost of shares redeemed | | | (2,872,224) | | | | (1,346,038) | |
Net increase from capital share transactions | | | 2,761,093 | | | | 6,280,231 | |
Net increase in net assets | | | 2,711,796 | | | | 6,979,309 | |
| | |
NET ASSETS: | | | | | | | | |
Beginning of year | | | 6,979,309 | | | | – | |
End of year * | | $ | 9,691,105 | | | $ | 6,979,309 | |
| | | | | | | | | |
| | |
*Including accumulated net investment income of: | | $ | 103,087 | | | $ | 61,988 | |
| | |
OTHER INFORMATION: | | | | | | | | |
CAPITAL SHARE TRANSACTIONS: | | | | | | | | |
Beginning shares | | | 250,002 | | | | – | |
Shares sold | | | 200,000 | | | | 300,002 | |
Shares redeemed | | | (100,002) | | | | (50,000) | |
Shares outstanding, end of period | | | 350,000 | | | | 250,002 | |
| | | | | | | | |
See Notes to Financial Statements.
11 | November 30, 2015
| | |
Workplace Equality Portfolio |
| Financial Highlights | | For a Share Outstanding Throughout the Periods Presented |
| | | | | | | | |
| | | | | | For the Period | |
| | | | | | February 25, 2014 | |
| | | For the Year | | | (Commencement | |
| | | Ended | | | of Operations) to | |
| | | November 30, | | | November 30, | |
| | | 2015 | | | 2014 | |
| NET ASSET VALUE, BEGINNING OF PERIOD | | $ | 27.92 | | | $ | 25.00 | |
| | |
| INCOME/(LOSS) FROM INVESTMENT OPERATIONS: | | | | | | | | |
Net investment income (a) | | | 0.36 | | | | 0.28 | |
Net realized and unrealized gain/(loss) | | | (0.20) | | | | 2.64 | |
Total from investment operations | | | 0.16 | | | | 2.92 | |
| | |
| DISTRIBUTIONS: | | | | | | | | |
From net investment income | | | (0.39) | | | | – | |
Total distributions | | | (0.39) | | | | – | |
| | |
Net increase/(decrease) in net asset value | | | (0.23) | | | | 2.92 | |
NET ASSET VALUE, END OF PERIOD | | $ | 27.69 | | | $ | 27.92 | |
| | | | | | | | | |
| TOTAL RETURN(b) | | | 0.59% | | | | 11.68% | |
| | |
| RATIOS/SUPPLEMENTAL DATA: | | | | | | | | |
Net assets, end of period (000s) | | $ | 9,691 | | | $ | 6,979 | |
| | |
Ratio of expenses to average net assets | | | 0.75% | | | | 0.75%(c) | |
Ratio of net investment – to average net assets | | | 1.31% | | | | 1.42%(c) | |
Portfolio turnover rate(d) | | | 26% | | | | 8% | |
| (a) | Based on average shares outstanding during the period. |
| (b) | Total return is calculated assuming an initial investment made at the net asset value at the beginning of the period and redemption at the net asset value on the last day of the period and assuming all distributions are reinvested at reinvestment prices. Total return calculated for a period of less than one year is not annualized. |
| (d) | Portfolio turnover for periods less than one year are not annualized and does not include securities received or delivered from processing creations or redemptions. |
See Notes to Financial Statements.
12 | November 30, 2015
| | |
Workplace Equality Portfolio |
| Notes to Financial Statements | | November 30, 2015 |
1. ORGANIZATION
The ALPS ETF Trust (the “Trust”), a Delaware statutory trust, is an open-end management investment company registered under the Investment Company Act of 1940, as amended (the “1940 Act”). As of November 30, 2015, the Trust consisted of twenty-one separate portfolios. Each portfolio represents a separate series of the Trust. This report pertains solely to the Workplace Equality Portfolio (the “Fund”). The investment objective of the Fund is to seek investment results that correspond generally, before fees and expenses, to the price and yield of the Workplace Equality IndexTM. The investment advisor uses a “passive” or indexing approach to try to achieve the Fund’s investment objective. The Fund is considered non-diversified and may invest a greater portion of assets in securities of individual issuers than a diversified fund. As a result, changes in the market value of a single investment could cause greater fluctuations in share price than would occur in a diversified fund.
The Fund’s Shares (“Shares”) are listed on the New York Stock Exchange (“NYSE”) Arca. The Fund issues and redeems Shares at net asset value (“NAV”) in blocks of 50,000 Shares, each of which is called a “Creation Unit”. Creation Units are issued and redeemed principally in-kind for securities included in a specified index. Except when aggregated in Creation Units, Shares are not redeemable securities of the Fund.
Pursuant to the Trust’s organizational documents, its Officers and Trustees are indemnified against certain liability arising out of the performance of their duties to the Trust. Additionally, in the normal course of business, the Trust enters into contracts with service providers that contain general indemnification clauses. The Trust’s maximum exposure under these arrangements is unknown, as this would involve future claims that may be made against the Trust that have not yet occurred.
2. SIGNIFICANT ACCOUNTING POLICIES
The following is a summary of significant accounting policies consistently followed by the Fund in the preparation of the financial statements. The accompanying financial statements were prepared in accordance with accounting principles generally accepted in the United States of America (“U.S. GAAP”). The preparation of financial statements in conformity with U.S. GAAP requires management to make certain estimates and assumptions that affect the reported amounts of assets and liabilities and disclosures of contingent assets and liabilities at the date of the financial statements and the reported amounts of revenue and expenses during the period. Actual results could differ from those estimates. The Fund is considered an investment company under U.S. GAAP and follows the accounting and reporting guidance applicable to investment companies in the Financial Accounting Standards Board Accounting Standards Codification Topic 946.
A. Portfolio Valuation
The Fund’s NAV is determined daily, as of the close of regular trading on the NYSE, normally 4:00 p.m. Eastern time, on each day the NYSE is open for trading. The NAV is computed by dividing the value of all assets of the Fund (including accrued interest and dividends), less all liabilities (including accrued expenses and dividends declared but unpaid), by the total number of shares outstanding.
Portfolio securities listed on any exchange other than the NASDAQ Stock Market LLC (“NASDAQ”) are valued at the last sale price on the business day as of which such value is being determined. If there has been no sale on such day, the securities are valued at the mean of the most recent bid and ask prices on such day. Securities traded on the NASDAQ are valued at the NASDAQ Official Closing Price as determined by NASDAQ. Portfolio securities traded on more than one securities exchange are valued at the last sale price on the business day as of which such value is being determined at the close of the exchange representing the principal market for such securities. Portfolio securities traded in the over-the-counter market, but excluding securities traded on the NASDAQ, are valued at the latest quoted sale price in such market.
The Fund’s investments are valued at market value or, in the absence of market value with respect to any portfolio securities, at fair value according to procedures adopted by the Trust’s Board of Trustees (the “Board”). When market quotations are not readily available or when events occur that make established valuation methods unreliable, securities of the Fund may be valued in good faith by or under the direction of the Board. These securities generally include, but are not limited to, restricted securities (securities which may not be publicly sold without registration under the Securities Act of 1933) for which a pricing service is unable to provide a market price; securities whose trading has been formally suspended; a security whose market price is not available from a pre-established primary pricing source or the pricing source is not willing to provide a price; a security with respect to which an event has occurred that is most likely to materially affect the value of the security after the market has closed but before the calculation of the Fund’s NAV or make it difficult or impossible to obtain a reliable market quotation; or a security whose price, as provided by the pricing service, does not reflect the security’s “fair value” due to the security being de-listed from a national exchange or the security’s primary trading market is temporarily closed at a time when, under normal conditions, it would be open. As a general principle, the current “fair value” of a security would be the amount which the owner might reasonably expect to receive from the sale on the applicable exchange or principal market. A variety of factors may be considered in determining the fair value of such securities.
13 | November 30, 2015
| | |
Workplace Equality Portfolio | | |
| Notes to Financial Statements | | November 30, 2015 |
B. Fair Value Measurements
The Fund discloses the classification of its fair value measurements following a three-tier hierarchy based on the inputs used to measure fair value. Inputs refer broadly to the assumptions that market participants would use in pricing the asset or liability; including assumptions about risk. Inputs may be observable or unobservable. Observable inputs reflect the assumptions market participants would use in pricing the asset or liability that are developed based on market data obtained from sources independent of the reporting entity. Unobservable inputs reflect the reporting entity’s own assumptions about the assumptions market participants would use in pricing the asset or liability that are developed based on the best information available.
Valuation techniques used to value the Fund’s investments by major category are as follows:
Equity securities, including restricted securities, for which market quotations are readily available, are valued at the last reported sale price or official closing price as reported by a third party pricing vendor on the primary market or exchange on which they are traded and are categorized as Level 1 in the hierarchy. In the event there were no sales during the day or closing prices are not available, securities are valued at the mean of the most recent quoted bid and ask prices on such day and are generally categorized as Level 2 in the hierarchy. Investments in open-end mutual funds are valued at their closing NAV each business day and are categorized as Level 1 in the hierarchy.
Changes in valuation techniques may result in transfers in or out of an assigned level within the disclosure hierarchy.
Various inputs are used in determining the value of the Fund’s investments as of the end of the reporting period. When inputs used fall into different levels of the fair value hierarchy, the level in the hierarchy within which the fair value measurement falls is determined based on the lowest level input that is significant to the fair value measurement in its entirety. The designated input levels are not necessarily an indication of the risk or liquidity associated with these investments.
These inputs are categorized in the following hierarchy under applicable financial accounting standards:
| | |
Level 1 – | | Unadjusted quoted prices in active markets for identical investments, unrestricted assets or liabilities that a Fund has the ability to access at the measurement date; |
Level 2 – | | Quoted prices which are not active, quoted prices for similar assets or liabilities in active markets or inputs other than quoted prices that are observable (either directly or indirectly) for substantially the full term of the asset or liability; and |
Level 3 – | | Significant unobservable prices or inputs (including the Fund’s own assumptions in determining the fair value of investments) where there is little or no market activity for the asset or liability at the measurement date. |
The following is a summary of the inputs used to value the Fund’s investments as of November 30, 2015:
| | | | | | | | | | | | | | | | |
| Investments in Securities at Value | | Level 1 - Unadjusted
Quoted Prices | | | Level 2 - Other
Significant Observable
Inputs | | | Level 3 - Significant
Unobservable Inputs | | | Total | |
Common Stocks* | | $ | 9,668,317 | | | $ | – | | | $ | – | | | $ | 9,668,317 | |
Short Term Investments | | | 8,114 | | | | – | | | | – | | | | 8,114 | |
TOTAL | | $ | 9,676,431 | | | $ | – | | | $ | – | | | $ | 9,676,431 | |
| | | | | | | | | | | | | | | | | |
* For a detailed sector breakdown, see the accompanying Schedule of Investments.
The Fund recognizes transfers between levels as of the end of the period. For the year ended November 30, 2015, the Fund did not have any transfers between Level 1 and Level 2 securities. The Fund did not have any securities which used significant unobservable inputs (Level 3) in determining fair value.
C. Securities Transactions and Investment Income
Securities transactions are recorded as of the trade date. Realized gains and losses from securities transactions are recorded on the highest cost basis. Dividend income and capital gains distributions, if any, are recorded on the ex-dividend date. Interest income, if any, is recorded on the accrual basis.
D. Dividends and Distributions to Shareholders
Dividends from net investment income of the Fund, if any, are declared and paid annually or as the Board may determine from time to time. Distributions of net realized capital gains earned by the Fund, if any, are distributed at least annually.
14 | November 30, 2015
| | |
Workplace Equality Portfolio |
| Notes to Financial Statements | | November 30, 2015 |
E. Federal Tax and Tax Basis Information
The timing and character of income and capital gain distributions are determined in accordance with income tax regulations, which may differ from U.S. GAAP. Reclassifications are made to the Fund’s capital accounts for permanent tax differences to reflect income and gains available for distribution (or available capital loss carryforwards) under income tax regulations.
For the year ended November 30, 2015, the following reclassifications, which had no impact on results of operations or net assets, were recorded to reflect permanent tax differences resulting primarily from in-kind transactions:
| | | | | | | | | | | | |
| Fund | | Paid-in Capital | | | Accumulated Net
Investment
Income | | | Accumulated Net
Realized Loss on
Investments | |
Workplace Equality Portfolio Fund | | $ | 296,447 | | | $ | 31,279 | | | $ | (327,726 | ) |
The tax character of the distributions paid during the year ended November 30, 2015 was as follows:
| | | | | | | | | | | | |
| | | Ordinary Income | | | Long-Term Capital Gain | | | Return of Capital | |
Workplace Equality Portfolio Fund | | $ | 98,693 | | | $ | – | | | $ | – | |
There were no distributions paid for the year ending November 30, 2014.
As of November 30, 2015, the components of distributable earnings on a tax basis for the Fund were as follows:
| | | | |
| | | Workplace Equality Portfolio
Fund | |
Undistributed net investment income | | $ | 125,366 | |
Net unrealized appreciation on investments | | | 122,715 | |
Total | | $ | 248,081 | |
| | | | | |
As of November 30, 2015, the cost of investments for federal income tax purposes and accumulated net unrealized appreciation/(depreciation) on investments were as follows:
| | | | |
| | | Workplace Equality Portfolio
Fund | |
Gross appreciation (excess of value over tax cost) | | $ | 811,926 | |
Gross depreciation (excess of tax cost over value) | | | (689,211 | ) |
Net unrealized appreciation (depreciation) | | $ | 122,715 | |
| | | | | |
Cost of investments for income tax purposes | | $ | 9,553,716 | |
| | | | | |
The differences between book-basis and tax-basis are primarily due to the deferral of losses from wash sales.
F. Income Taxes
No provision for income taxes is included in the accompanying financial statements, as the Fund intends to distribute to shareholders all taxable investment income and realized gains and otherwise comply with Subchapter M of the Internal Revenue Code of 1986, as amended, applicable to regulated investment companies. The Fund evaluates tax positions taken (or expected to be taken) in the course of preparing the Fund’s tax returns to determine whether these positions meet a “more-likely-than-not” standard that, based on the technical merits, have a more than fifty percent likelihood of being sustained by a taxing authority upon examination. A tax position that meets the “more-likely-than-not” recognition threshold is measured to determine the amount of benefit to recognize in the financial statements.
As of and during the year ended November 30, 2015, the Fund did not have a liability for any unrecognized tax benefits. The Fund files U.S. federal, state, and local tax returns as required. The Fund’s tax returns are subject to examination by the relevant tax authorities until expiration of the applicable statute of limitations which is generally three years after the filing of the tax return, but may extend to four years in certain jurisdictions. Tax returns for open years have incorporated no uncertain tax positions that require a provision for income taxes.
15 | November 30, 2015
| | |
Workplace Equality Portfolio |
| Notes to Financial Statements | | November 30, 2015 |
3. INVESTMENT ADVISORY FEE AND OTHER AFFILIATED TRANSACTIONS
ALPS Advisors, Inc. (the “Adviser”) acts as the Fund’s investment adviser pursuant to an Advisory Agreement with the Trust on behalf of the Fund (the “Advisory Agreement”). Pursuant to the Advisory Agreement, the Fund pays the Adviser a unitary fee for the services and facilities it provides payable on a monthly basis at the annual rate of 0.75% of the Fund’s average daily net assets. From time to time, the Adviser may waive all or a portion of its fee.
Out of the unitary management fee, the Adviser pays substantially all expenses of the Fund, including the licensing fees to the Index provider, the cost of transfer agency, custody, fund administration, legal, audit, independent trustees and other services, except for interest expenses, distribution fees or expenses, brokerage expenses, taxes and extraordinary expenses not incurred in the ordinary course of the Fund’s business. The Adviser’s unitary management fee is designed to pay substantially all the Fund’s expenses and to compensate the Adviser for providing services for the Fund.
ALPS Fund Services, Inc., an affiliate of the Adviser, is the administrator of the Fund.
Each Trustee who is not an officer or employee of the Adviser, any sub-adviser or any of their affiliates (“Independent Trustees”) receives (1) a quarterly retainer of $5,000, (2) a per meeting fee for regularly scheduled meetings of $3,750, (3) $1,500 for any special meeting held outside of a regularly scheduled board meeting, and (4) reimbursement for all reasonable out-of-pocket expenses relating to attendance at meetings.
4. PURCHASES AND SALES OF SECURITIES
For the year ended November 30, 2015, the cost of purchases and proceeds from sales of investment securities, excluding in-kind transactions and short-term investments, were as follows:
| | | | | | | | |
| Fund | | Purchases | | | Sales | |
Workplace Equality Portfolio Fund | | $ | 2,120,933 | | | $ | 3,606,360 | |
|
For the year ended November 30, 2015, the cost of in-kind purchases and proceeds from in-kind sales were as follows: | |
| | |
| Fund | | Purchases | | | Sales | |
Workplace Equality Portfolio Fund | | $ | 5,626,964 | | | $ | 1,370,695 | |
The Workplace Equality Portfolio had in-kind net realized gain/(loss) of $299,288.
Gains on in-kind transactions are not considered taxable for federal income tax purposes.
5. CAPITAL SHARE TRANSACTIONS
Shares are created and redeemed by the Fund only in Creation Unit size aggregations of 50,000 shares. Only broker-dealers or large institutional investors with creation and redemption agreements called Authorized Participants (“AP”) are permitted to purchase or redeem Creation Units from the Fund. Such transactions are generally permitted on an in-kind basis, with a balancing cash component to equate the transaction to the NAV per unit of the Fund on the transaction date. Cash may be substituted equivalent to the value of certain securities generally when they are not available in sufficient quantity for delivery, not eligible for trading by the AP or as a result of other market circumstances.
16 | November 30, 2015
| | |
Workplace Equality Portfolio |
| Additional Information | | November 30, 2015 (Unaudited) |
PROXY VOTING RECORDS, POLICIES AND PROCEDURES
Information regarding how the Fund voted proxies relating to portfolio securities during the most recent 12-month period ended June 30 and a description of the Fund’s proxy voting policies and procedures used in determining how to vote for proxies are available without charge on the Securities and Exchange Commission’s (“SEC”) website at www.sec.gov and upon request, by calling (toll-free) 1-866-675-2639.
PORTFOLIO HOLDINGS
The Trust is required to disclose, after its first and third fiscal quarters, the complete schedule of each Fund’s portfolio holdings with the SEC on Form N-Q. Form N-Q for each Fund will be available on the SEC’s website at www.sec.gov. Each Fund’s Form N-Q may also be reviewed and copied at the SEC’s Public Reference Room in Washington, D.C. and information on the operation of the Public Reference Room may be obtained by calling 1-800-SEC-0330. Each Fund’s Form N-Q will be available without charge, upon request, by calling (toll-free) 1-866-675-2639 or by writing to ALPS ETF Trust at 1290 Broadway, Suite 1100, Denver, Colorado 80203.
TAX INFORMATION
The Fund designates the following for federal income tax purposes for distributions made during the calendar year ended December 31, 2014:
| | | | |
| | | Qualified Dividend Income | | Dividend Received Deduction |
Workplace Equality Portfolio | | 100.00% | | 89.02% |
In early 2015, if applicable, shareholders of record received this information for the distributions paid to them by the Fund during the calendar year 2014 via Form 1099. The Fund will notify shareholders in early 2016 of amounts paid to them by the Fund, if any, during the calendar year 2015.
LICENSING AGREEMENT
Denver Investments has entered into an index licensing agreement with ALPS Advisors Inc. (the “Adviser”) to allow the Adviser’s use of the Workplace Equality Index™, the underlying index of the Workplace Equality Portfolio (the “Fund”). The following disclosure relates to such licensing agreement:
Denver Investments is the designer of the construction and methodology for the Index. “Denver Investments” and “Workplace Equality Index™” are service marks or trademarks of Denver Investments. Denver Investments acts as brand licensor for the Index. Denver Investments is not responsible for the descriptions of the Index or the Fund that appear herein. Denver Investments is not affiliated with the Trust, the Adviser or the Distributor.
The Fund is not sponsored, endorsed or promoted by Denver Investments. Denver Investments makes no representation or warranty, express or implied, to the owners of the Fund or any member of the public regarding the advisability of investing in securities or commodities generally or in the Fund particularly and does not guarantee the quality, accuracy or completeness of the Index or any Index data included herein or derived there from and assume no liability in connection with their use. The Index is determined and composed without regard to the Adviser or the Fund. Denver Investments has no obligation to take the needs of the Adviser, the Fund or the shareholders of the Fund into consideration in connection with the foregoing. Denver Investments is not responsible for and has not participated in the determination of pricing or the timing of the issuance or sale of the Shares of the Fund or in the determination or calculation of the NAV of the Fund. Denver Investments has no obligation or liability in connection with the administration or trading of the Fund.
Denver Investments does not guarantee the accuracy and/or completeness of the Index or any data included therein, and Denver Investments shall have no liability for any errors, omissions, or interruptions therein. Denver Investments makes no warranty, express or implied, as to results to be obtained by the Adviser, the Fund, Fund shareholders or any other person or entity from the use of the Index or any data included therein. Denver Investments makes no express or implied warranties, and expressly disclaims all warranties of merchantability or fitness for a particular purpose or use with respect to the Index or any data included therein. Without limiting any of the foregoing, in no event shall Denver Investments have any liability for any special, punitive, indirect, or consequential damages (including lost profits) arising out of matters relating to the use of the Index, even if notified of the possibility of such damages.
The Adviser does not guarantee the accuracy and/or the completeness of the Index or any data included therein, and the Adviser shall have no liability for any errors, omissions or interruptions therein. The Adviser makes no warranty, express or implied, as to results to be obtained by the Fund, owners of the Shares of the Fund or any other person or entity from the use of the Index or any data included therein. The Adviser makes no express or implied warranties, and expressly disclaims all warranties of merchantability or fitness for a particular purpose or use with respect to the Index or any data included therein. Without limiting any of the foregoing, in no event shall the Adviser have any liability for any special, punitive, direct, indirect, or consequential damages (including lost profits) arising out of matters relating to the use of the Index, even if notified of the possibility of such damages.
17 | November 30, 2015
| | |
Workplace Equality Portfolio |
Board Considerations Regarding Approval of Investment Advisory Agreements | | November 30, 2015 (Unaudited) |
At an in-person meeting held on June 8, 2015, the Board of Trustees of the Trust (the “Board” or the “Trustees”), including the Trustees who are not “interested persons” of the Trust within the meaning of the 1940 Act, as amended (the “Independent Trustees”), evaluated a proposal to approve the continuance of the Advisory Agreement between the Trust and ALPS Advisors, Inc. (the “Adviser”) with respect to the Workplace Equality Portfolio (“EQLT” or “the Fund”). The Independent Trustees also met separately to consider the Advisory Agreement.
In evaluating the Investment Advisory Agreement with respect to EQLT, the Trustees considered various factors, including (i) the nature, extent and quality of the services to be provided by the Adviser with respect to the Fund under the Investment Advisory Agreement; (ii) the advisory fees and other expenses to be paid by the Fund compared to those of similar funds managed by other investment advisers; (iii) the costs of the services provided to the Fund by the Adviser and the profits realized by the Adviser and its affiliates from its relationship to the Fund; (iv) the extent which economies of scale would be realized if and as the assets of the Fund grow and whether fees reflect the economies of scale for the benefit of shareholders and (v) any additional benefits and other considerations.
With respect to the nature, extent and quality of the services to be provided by the Adviser under the Investment Advisory Agreement, the Trustees considered and reviewed information concerning the services to be provided under the Investment Advisory Agreement, the investment parameters of the index of the Fund, financial information regarding the Adviser and its parent company, information describing the Adviser’s current organization and the background and experience of the persons who would be responsible for the day-to-day management of the Fund.
The Trustees reviewed information on the performance of the Fund and its benchmark. The Trustees also evaluated the correlation and tracking error between the underlying index and the Fund’s performance. Based on their review, the Trustees found that the nature and extent of services provided to the Fund under the Investment Advisory Agreements was appropriate and that the quality was satisfactory.
The Trustees noted that the advisory fee for the Fund was a unitary fee pursuant to which the Adviser assumes all expenses of the Fund (including the cost of transfer agency, custody, fund administration, legal, audit and other services) other than the payments under the Advisory Agreement, brokerage expenses, taxes, interest, litigation expenses and other extraordinary expenses.
The Trustees noted that the advisory fee rate for the Fund is higher than the median of its Strategic Insight expense group. The Trustees took into account, among other things, the uniqueness of EQLT’s underlying index (and the fees charged by the index provider for licensing its index) and the Adviser’s view that “socially responsible” funds (which the Strategic Insight peer group did not include) would be EQLT’s closest competitors in the marketplace.
Based on the foregoing, and the other information available to them, the Trustees concluded that the advisory fee rate for the Fund was reasonable under the circumstances and in light of the quality of the services provided.
The Trustees considered other benefits available to the Adviser because of its relationship with the Fund and concluded that the advisory fees were reasonable taking into account any such benefits.
The Trustees also considered with respect to the Fund the information provided by the Adviser about the costs and profitability of the Adviser with respect to the Fund. The Trustees reviewed and noted the relatively small sizes of the Fund and concluded that the Adviser was not realizing any economies of scale. The Trustees determined that they would continue to evaluate whether further economies of scale have been achieved on an ongoing basis.
In voting to renew the Investment Advisory Agreement, the Trustees concluded that the terms of the Investment Advisory Agreement are reasonable and fair in light of the services to be performed, the fees paid by certain other funds, expenses to be incurred and such other matters as the Trustees considered relevant in the exercise of their reasonable business judgment. The Trustees did not identify any single factor or group of factors as all important or controlling and considered all factors together.
18 | November 30, 2015
| | |
Workplace Equality Portfolio |
| Trustees & Officers | | November 30, 2015 (Unaudited) |
INDEPENDENT TRUSTEES
| | | | | | | | | | |
Name, Address & Year of Birth* | | Position(s) Held
with Trust | | Term of Office
and Length of
Time Served** | | Principal Occupation(s) During Past 5 Years | | Number of
Portfolios in Fund
Complex Overseen
by Trustees*** | | Other Directorships Held by Trustees |
Mary K. Anstine, 1940 | | Trustee | | Since March 2008 | | Ms. Anstine was formerly an Executive Vice President of First Interstate Bank of Denver until 1994, President/Chief Executive Officer of HealthONE Alliance, Denver, Colorado, from 1994 to 2004, and has been retired since 2004. Ms. Anstine is also Trustee/Director of the following: AV Hunter Trust and Colorado Uplift Board. Ms. Anstine was formerly a Director of the Trust Bank of Colorado (later purchased and now known as Northern Trust Bank), HealthONE and Denver Area Council of the Boy Scouts of America and a member of the American Bankers Association Trust Executive Committee. | | 46 | | Ms. Anstine is a Trustee of ALPS Variable Investment Trust (9 funds); Financial Investors Trust (31 funds); Reaves Utility Income Fund; and Westcore Trust (12 funds). |
Jeremy W. Deems, 1976 | | Trustee | | Since March 2008 | | Mr. Deems is the Co-Founder, Chief Financial Officer of Green Alpha Advisors, LLC. Mr. Deems is Co-Portfolio Manager of the Shelton Green Alpha Fund. Prior to joining Green Alpha Advisors, Mr. Deems was CFO and Treasurer of Forward Management, LLC, ReFlow Management Co., LLC, ReFlow Fund, LLC, a private investment fund, and Sutton Place Management, LLC, an administrative services company. | | 46 | | Mr. Deems is a Trustee of ALPS Variable Investment Trust (9 funds); Financial Investors Trust (31 funds); Clough Funds Trust (1 fund); and Reaves Utility Income Fund. |
| Rick A. Pederson, 1952 | | Trustee | | Since March 2008 | | Mr. Pederson is President, Foundation Properties, Inc. (a real estate investment management company), 1994 - present; Advisory Board Member, Bow River Capital Partners (private equity management), 2003 - present; Advisor, Pauls Corporation (real estate investment management and development), 2008 - present; Chairman, Ross Consulting Group (real estate consulting services) 1983-2013; Advisory Board, Neenan Company (construction services) 2002- present; Board Member, Prosci, Inc. (private business services), 2013-present; Board Member, Citywide Banks (Colorado community bank) 2014-present; Board member, Professional Pediatric Health Care (a Denver-based home nursing firm) 2014 – present; Director, National Western Stock Show (not-for-profit organization); Director, Biennial of the Americas (not-for-profit organization). | | 24 | | Mr. Pederson is Trustee of Westcore Trust (12 funds) and Principal Real Estate Income Fund (1 fund). |
| * | The business address of the Trustee is c/o ALPS Advisors, Inc., 1290 Broadway, Suite 1100, Denver, Colorado 80203. |
| ** | This is the period for which the Trustee began serving the Trust. Each Trustee serves an indefinite term, until his successor is elected. |
| *** | The Fund Complex includes all series of the Trust and any other investment companies for which ALPS Advisors, Inc. provides investment advisory services. |
The Statement of Additional Information includes additional information about the Fund’s Trustees and is available, without charge, upon request by calling (toll-free) 1-866-675-2639.
19 | November 30, 2015
| | |
Workplace Equality Portfolio |
| Trustees & Officers | | November 30, 2015 (Unaudited) |
INTERESTED TRUSTEE
| | | | | | | | | | |
Name, Address and Year of Birth of
Interested
Trustee* | | Position(s) Held
with Trust | | Term of Office
and Length of
Time Served** | | Principal Occupation(s) During Past 5 Years | | Number of
Portfolios in Fund
Complex Overseen
by Trustees*** | | Other Directorships Held by Trustees |
Thomas A. Carter, 1966 | | Trustee and President | | Since March 2008 | | Mr. Carter joined ALPS Fund Services, Inc. (“ALPS”) in 1994 and is currently President and Director of ALPS Advisors, Inc. (“AAI”), and ALPS Portfolio Solutions Distributor, Inc. (“APSD”) and Executive Vice President and Director of ALPS and ALPS Holdings, Inc. (“AHI”), and ALPS Distributors, Inc. (“ADI”). Because of his position with AHI, ALPS, ADI, APSD and AAI, Mr. Carter is deemed an affiliate of the Fund as defined under the 1940 Act. Before joining ALPS, Mr. Carter was with Deloitte & Touche LLP, where he worked with a diverse group of clients, primarily within the financial services industry. Mr. Carter is a Certified Public Accountant and received his Bachelor of Science in Accounting from the University of Colorado at Boulder. | | 34 | | Mr. Carter is a Trustee of ALPS Variable Investment Trust (9 funds) and Principal Real Estate Income Fund (1 fund) |
| * | The business address of the Trustee is c/o ALPS Advisors, Inc., 1290 Broadway, Suite 1100, Denver, Colorado 80203. |
| ** | This is the period for which the Trustee began serving the Trust. Each Trustee serves an indefinite term, until his successor is elected. |
| *** | The Fund Complex includes all series of the Trust and any other investment companies for which ALPS Advisors, Inc. provides investment advisory services. |
The Statement of Additional Information includes additional information about the Fund’s Trustees and is available, without charge, upon request by calling (toll-free) 1-866-675-2639.
20 | November 30, 2015
| | |
Workplace Equality Portfolio |
| Trustees & Officers | | November 30, 2015 (Unaudited) |
OFFICERS
| | | | | | |
Name, Address
and Year of
Birth of Officer* | | Position(s) Held
with Trust | | Length of Time
Served** | | Principal Occupation(s) During Past 5 Years |
Erin D. Nelson, 1977 | | Chief Compliance Officer (“CCO”) | | Since December 2015 | | Erin Nelson became Senior Vice-President and Chief Compliance Officer of ALPS Advisors, Inc. (“AAI”) on July 1, 2015 and prior to that served as Vice President and Deputy Chief Compliance Officer of AAI since January 1, 2015. Prior to January 1, 2015, Ms. Nelson was Vice-President and Assistant General Counsel of ALPS of Fund Services, Inc. Ms. Nelson joined AAI’s parent company, ALPS Holdings, Inc. in January 2003. Ms. Nelson currently is also the Chief Compliance Officer of Principal Real Estate Income Fund, and as of December 2015, the Chief Compliance Officer of Liberty All-Star Equity Fund, Liberty All-Star Growth Fund, Inc., RiverNorth Opportunities Fund, Inc. |
Patrick D. Buchanan, 1972 | | Treasurer | | Since June 2012 | | Mr. Buchanan is Vice President of AAI. Mr. Buchanan joined ALPS in 2007 and because of his position with AAI, he is deemed an affiliate of the Trust as defined under the 1940 Act. Mr. Buchanan is also Treasurer of the ALPS Variable Insurance Trust, Clough Funds Trust and Principal Real Estate Income Fund. |
William Parmentier, 1952 | | Vice President | | Since March 2008 | | Mr. Parmentier is Chief Investment Officer, AAI (since 2006); President and Chief Executive Officer of the Liberty All-Star Funds (since April 1999); Senior Vice President (2005-2006), Banc of America Investment Advisors, Inc. Because of his position with AAI, Mr. Parmentier is deemed an affiliate of the Trust as defined under the 1940 Act. |
Abigail J. Murray,
1975 | | Secretary | | Since June 2015 | | Ms. Murray joined ALPS in April 2015. She is currently Vice President and Senior Counsel of ALPS. Prior to joining ALPS, Ms. Murray was an Attorney and Managing Member at Murray & Rouvina PLC from 2014 to 2015 and an Associate with Vedder Price P.C. from 2007 to 2014. Because of her position with ALPS, Ms. Murray is deemed an affiliate of the Trust as defined under the 1940 Act. Ms. Murray is also the Secretary of The Caldwell & Orkin Funds, Inc., Clough Global Opportunities Fund, Clough Global Allocation Fund, Clough Global Equity Fund and Clough Funds Trust. |
Jennifer A. Craig, 1973 | | Assistant Secretary | | Since October 2013 | | Ms. Craig joined ALPS in 2007 and is currently Assistant Vice President and Paralegal Manager. Prior to joining ALPS, Ms. Craig was Legal Manager at Janus Capital Management LLC and served as Assistant Secretary of Janus Investment Fund, Janus Adviser Series and Janus Aspen Series. Because of her position with ALPS, Ms. Craig is deemed an affiliate of the Trust as defined under the 1940 Act. |
| * | The business address of the Officer is c/o ALPS Advisors, Inc., 1290 Broadway, Suite 1100, Denver, Colorado 80203. |
| ** | This is the period for which the Officer began serving the Trust. Each Officer serves an indefinite term, until his successor is elected. |
21 | November 30, 2015
(a) The Registrant, as of the end of the period covered by this report, has adopted a code of ethics that applies to the Registrant’s principal executive officer, principal financial officer, principal accounting officer or controller or any persons performing similar functions on behalf of the Registrant.
(b) Not applicable.
(c) During the period covered by this report, no amendments to the provisions of the code of ethics adopted in 2(a) above were made.
| | (d) | During the period covered by this report, no implicit or explicit waivers to the provisions of the code of ethics adopted in 2(a) above were granted. |
(e) Not applicable.
(f) The Registrant’s Code of Ethics is attached as an Exhibit hereto.
| Item 3. | Audit Committee Financial Expert. |
The Board of Trustees of the Registrant has determined that the Registrant has at least one Audit Committee Financial Expert serving on its audit committee. The Board of Trustees of the Registrant has designated Jeremy W. Deems as the Registrant’s “Audit Committee Financial Expert”. Mr. Deems is “independent” as defined in paragraph (a)(2) of Item 3 to Form N-CSR.
| Item 4. | Principal Accountant Fees and Services. |
| | (a) | Audit Fees: For the Registrant’s fiscal year ended November 30, 2015 and November 30, 2014, the aggregate fees billed for professional services rendered by the principal accountant for the audit of the Registrant’s annual financial statements were $353,300 and $258,900, respectively. |
| | (b) | Audit-Related Fees: For the Registrant’s fiscal year ended November 30, 2015 and November 30, 2014, the aggregate fees billed for professional services rendered by the principal accountant for the verification of the Registrant’s securities and similar investments in accordance with Rule 17f-2 under the Investment Company Act of 1940 were $0 and $0, respectively. |
-2-
| | (c) | Tax Fees: For the Registrant’s fiscal year ended November 30, 2015 and November 30, 2014, the aggregate fees billed for professional services rendered by the principal accountant for tax compliance, tax advice and tax planning were $110,160 and $99,380, respectively. The fiscal year 2015 and 2014 tax fees were for services pertaining to federal and state income tax return review, review of year end dividend distributions and excise tax preparation. |
| | (d) | All Other Fees: For the Registrant’s fiscal year ended November 30, 2015 and November 30, 2014, aggregate fees billed to the Registrant by the principal accountant for services provided by the principal accountant other than the services reported in paragraphs (a) through (c) of this Item 4 were $0 and $0, respectively. |
| | (e)(1) | Audit Committee Pre-Approval Policies and Procedures: All services to be performed by the Registrant’s principal accountant must be pre-approved by the Registrant’s audit committee. |
| | (e)(2) | No services described in paragraphs (b) through (d) of this Item were approved by the Registrant’s audit committee pursuant to paragraph (c)(7)(i)(C) of Rule 2-01 of Regulation S-X. |
| | (g) | The aggregate non-audit fees billed by the Registrant’s accountant for the fiscal year ended November 30, 2015 and November 30, 2014 of the Registrant were $417,560 and $399,000, respectively. These fees consisted of non-audit fees billed to (i) the Registrant of $110,160 and $99,380 as described in response to paragraph (c) above and (ii) to ALPS Fund Services, Inc. (“AFS”), an entity under common control with ALPS Advisors, Inc., the Registrant’s investment adviser, of $307,400 and $299,620, respectively. The non-audit fees billed to AFS related to SSAE 16 services and other compliance-related matters. |
| | (h) | The Registrant’s audit committee has considered whether the provision of non-audit services that were rendered to the Registrant’s investment adviser (not including any sub-adviser whose role is primarily portfolio management and is subcontracted with or overseen by another investment adviser), and any entity controlling, controlled by, or under common control with the investment adviser that provides ongoing services to the Registrant that were not pre-approved pursuant to paragraph (c)(7)(ii) of Rule 2-01 of Regulation S-X, is compatible with maintaining the principal accountant’s independence. The Registrant’s audit committee determined that the provision of such non-audit services is compatible with maintaining the principal accountant’s independence. |
| Item 5. | Audit Committee of Listed Registrants. |
Not applicable.
-3-
| | (a) | Schedule of Investments is included as part of the Report to Stockholders filed under Item 1 of this Form N-CSR. |
| Item 7. | Disclosure of Proxy Voting Policies and Procedures for Closed-End Management Investment Companies. |
Not applicable.
| Item 8. | Portfolio Managers of Closed-End Management Investment Companies. |
Not applicable.
| Item 9. | Purchases of Equity Securities by Closed-End Management Investment Company and Affiliated Purchasers. |
Not applicable.
| Item 10. | Submission of Matters to Vote of Security Holders. |
There have been no material changes to the procedures by which shareholders may recommend nominees to the Registrant’s Board of Trustees, where those changes were implemented after the Registrant last provided disclosure in response to the requirements of Item 407(c)(2) of Regulation S-K, or this Item.
| Item 11. | Controls and Procedures. |
| | (a) | The Registrant’s principal executive officer and principal financial officer have concluded that the Registrant’s disclosure controls and procedures (as defined in Rule 30a-3(c) under the Investment Company Act of 1940, as amended) are effective based on their evaluation of these controls and procedures as of a date within 90 days of the filing date of this report. |
| | (b) | There was no change in the Registrant’s internal control over financial reporting (as defined in Rule 30a-3(d) under the Investment Company Act of 1940, as amended) during the second fiscal quarter of the period covered by this report that has materially affected, or is reasonably likely to materially affect, the Registrant’s internal control over financial reporting. |
| | (a)(1) | Registrant’s Code of Ethics for Senior Financial Officers, which is the subject of the disclosure required by Item 2 of Form N-CSR, was filed as Exhibit 12(a)(1) to the Registrant’s Certified Shareholder Report on Form N-CSR, File No. 811-22175, on February 6, 2015. |
-4-
| | (a)(2) | The certifications required by Rule 30a-2(a) of the Investment Company Act of 1940, as amended, and Section 302 of the Sarbanes-Oxley Act of 2002 are attached hereto as Exhibit 99.Cert. |
| | (b) | The certifications by the Registrant’s principal executive officer and principal financial officer, as required by Rule 30a-2(b) of the Investment Company Act of 1940, as amended, and Section 906 of the Sarbanes-Oxley Act of 2002 are attached hereto as Exhibit 99.906Cert. |
-5-
SIGNATURES
Pursuant to the requirements of the Securities Exchange Act of 1934 and the Investment Company Act of 1940, the registrant has duly caused this report to be signed on its behalf by the undersigned, thereunto duly authorized.
| | |
| ALPS ETF TRUST |
| |
| By: | | /s/ Thomas A. Carter |
| | Thomas A. Carter |
| | President (Principal Executive Officer) |
| |
| Date: | | February 5, 2016 |
Pursuant to the requirements of the Securities Exchange Act of 1934 and the Investment Company Act of 1940, this report has been signed below by the following persons on behalf of the registrant and in the capacities and on the dates indicated.
| | |
| By: | | /s/ Thomas A. Carter |
| | Thomas A. Carter |
| | President (Principal Executive Officer) |
| |
| Date: | | February 5, 2016 |
| |
| By: | | /s/ Patrick D. Buchanan |
| | Patrick D. Buchanan |
| | Treasurer (Principal Financial Officer) |
| |
| Date: | | February 5, 2016 |
-6-