UNITED STATES
SECURITIES AND EXCHANGE COMMISSION
Washington, D.C. 20549
FORM N-CSR
CERTIFIED SHAREHOLDER REPORT OF REGISTERED
MANAGEMENT INVESTMENT COMPANIES
Investment Company Act file number:
811-22175
ALPS ETF TRUST
(Exact name of registrant as specified in charter)
1290 Broadway, Suite 1100, Denver, Colorado 80203
(Address of principal executive offices) (Zip code)
Andrea E. Kuchli, Esq., Secretary
ALPS ETF Trust
1290 Broadway, Suite 1100
Denver, Colorado 80203
(Name and address of agent for service)
Registrant’s Telephone Number, including Area Code: (303) 623-2577
Date of fiscal year end: November 30
Date of reporting period: December 1, 2016 – November 30, 2017
Item 1. Reports to Stockholders.
| Performance Overview | |
| Alerian MLP ETF | 1 |
| Alerian Energy Infrastructure ETF | 4 |
| Disclosure of Fund Expenses | 7 |
| Report of Independent Registered Public Accounting Firm | 8 |
| Financial Statements | |
| Alerian MLP ETF | |
| Schedule of Investments | 9 |
| Statement of Assets and Liabilities | 10 |
| Statement of Operations | 11 |
| Statements of Changes in Net Assets | 12 |
| Financial Highlights | 13 |
| Alerian Energy Infrastructure ETF | |
| Schedule of Investments | 14 |
| Statement of Assets and Liabilities | 16 |
| Statement of Operations | 17 |
| Statements of Changes in Net Assets | 18 |
| Financial Highlights | 19 |
| Notes to Financial Statements | 20 |
| Additional Information | 32 |
| Board Considerations Regarding Approval of Investment Advisory Agreements | 34 |
| Trustees & Officers | 36 |
alpsfunds.com
| Performance Overview | November 30, 2017 (Unaudited) |
INVESTMENT OBJECTIVE
The Alerian MLP ETF (the “Fund” or “AMLP”) seeks investment results that correspond (before fees and expenses) generally to the price and yield performance of its underlying index, the Alerian MLP Infrastructure Index (the “Underlying Index” or “AMZI”). The Shares of the Fund are listed and trade on the New York Stock Exchange (“NYSE”) Arca under the ticker symbol AMLP. The Fund generally will invest in all of the securities that comprise the Index in proportion to their weightings in the Underlying Index.
The Underlying Index is a rules based, modified capitalization weighted, float-adjusted index intended to give investors a means of tracking the overall performance of the United States energy infrastructure Master Limited Partnership (“MLP”) asset class. The Underlying Index is comprised of energy infrastructure MLPs that earn a majority of their cash flow from the transportation, storage, and processing of energy commodities.
PERFORMANCE OVERVIEW
During the twelve-month period of December 1, 2016 to November 30, 2017 the Alerian MLP ETF (AMLP) delivered a total return of -9.27%. This compares to the Fund’s index, the Alerian MLP Infrastructure Index (“AMZI” or “index”), which was down 15.2% on a price-return and 9.0% on a total-return basis. The difference in performance between the AMZI and AMLP is primarily attributable to the Fund’s operating expenses and the tax impact of the Fund’s C Corporation structure.
During the period, the Fund paid four distributions:
| ● | $0.225 on February 15, 2017 |
| ● | $0.215 on August 16, 2017 |
| ● | $0.20152 on November 15, 2017 |
A strong parent dropping down over $10 billion in assets led MPLX (MPLX) to outperform. It ended the period up 9.2%. Two companies were down more than 40%: Plains All American Pipeline (PAA) and Enbridge Energy Partners (EEP) were both impacted by distribution cuts.
For distributions reflecting the third calendar quarter of 2017, 15 of 25 constituents in the AMZI increased their distributions, eight MLPs maintained their distributions, and two MLPs lowered their distributions.
During the period, Dominion Energy Midstream Partners (DM), Holly Energy Partners (HEP), and Rice Midstream Partners (RMP) were added to the index. NGL Energy Partners (NGL) was removed from the index. ONEOK Partners (OKS) was removed from the index in a special rebalancing due to its merger with parent company ONEOK Inc (OKE). Energy Transfer Partners (ETP) merged with Sunoco Logistics Partners (SXL), and ETP was removed from the index. However, immediately following the merger, SXL changed its name and ticker to Energy Transfer Partners (ETP). Additionally, Tesoro Logistics (TLLP) changed its name and ticker to Andeavor Logistics (ANDX).
The methodology was updated in September to, among other things, better capture the investable universe, reflect established guidelines for diversified portfolios, mirror industry trends, and minimize future index turnover.
Energy MLPs rallied from November through January, largely as a function of the new administration and its pro-energy stance. Expedited regulatory approvals, including those for the Dakota Access Pipeline and Keystone XL, resulted in energy infrastructure MLPs rallying further. However, as the price of oil fell below $50 per barrel in March, midstream companies sold off along with the broader energy sector. While oil prices stabilized and recovered through the summer and fall, MLPs did not recover in tandem.
New energy infrastructure project announcements continued throughout the year, especially in the Permian and SCOOP/STACK regions, but investor interest largely centered on balance sheets. Announcements of slowed distribution growth, self-funding measures, or even distribution cuts were greeted positively—or at least with acceptance—by the market. Buybacks, once anomalies in the sector, have started to gain interest among management teams as they believe the market has failed to reward the traditional uses of cash. Tax reform concerns drove further volatility towards the end of the period, but recent amendments have quieted fears.
MLPs may continue to experience volatility in the coming months if commodity prices do the same. MLP investors will likely further scrutinize balance sheets for appropriate uses of cash and analyze distribution policies for long-term sustainability before they are willing to recognize that current discounted valuations are unjustified. Beyond the short term, in our view fundamentals remain intact for MLPs to build out US energy infrastructure over the next several decades.
| Performance Overview | November 30, 2017 (Unaudited) |
Performance (as of November 30, 2017)
| | 1 Year | 3 Year | 5 Year | Since Inception^ |
| Alerian MLP ETF – NAV | -9.27% | -10.02% | -1.80% | 1.84% |
| Alerian MLP ETF – Market Price* | -9.42% | -10.02% | -1.81% | 1.84% |
| Alerian MLP Infrastructure Index | -9.00% | -12.33% | -0.94% | 4.36% |
| S&P 500® Total Return Index | 22.87% | 10.91% | 15.74% | 15.97% |
Total Expense Ratio (per the current prospectus) 1.42%.
Performance data quoted represents past performance. Past performance does not guarantee future results. The table does not reflect the deduction of taxes that a shareholder would pay on Fund distributions or the redemption of Fund shares. Investment return and principal value of an investment will fluctuate so that an investor’s shares, when sold or redeemed, may be worth more or less than the original cost. Current performance data may be higher or lower than actual data quoted. For the most current month-end performance data please visit www.alpsfunds.com or call 1.877.398.8461. The Fund accrues deferred income taxes for future tax liabilities associated with the portion of MLP distributions considered to be a tax-deferred return of capital and for any net operating gains as well as capital appreciation of its investment. This deferred tax liability is reflected in the daily NAV and as a result the fund's after-tax performance could differ significantly from the underlying assets even if the pre-tax performance is closely tracked.
NAV is an exchange-traded fund’s per-share value. The per-share dollar amount of the Fund is derived by dividing the total value of all the securities in its portfolio, less any liabilities, by the number of Fund shares outstanding. Market Price is the price at which a share can currently be traded in the market. Information detailing the number of days the Market Price of the Fund was greater than the Fund’s NAV and the number of days it was less than the Fund’s NAV can be obtained at www.alpsfunds.com.
| ^ | The Fund commenced Investment Operations on August 24, 2010 with an Inception Date, the first day of trading on the NYSE ARCA, of August 25, 2010. |
| * | Market Price is based on the midpoint of the bid-ask spread at 4 p.m. ET and does not represent the returns an investor would receive if shares were traded at other times. |
The Alerian MLP Infrastructure Index is comprised of 25 midstream energy Master Limited Partnerships and provides investors with an unbiased benchmark for the infrastructure component of this emerging asset class.
S&P 500® Total Return Index is the Standard & Poor’s composite index of 500 stocks, a widely recognized, unmanaged index of common stock prices. Total return assumes reinvestment of any dividends and distributions realized during a given time period.
The index is not actively managed and does not reflect any deductions for fees, expenses or taxes. One cannot invest directly in an index. Index performance does not reflect fund performance.
The Fund’s shares are not individually redeemable. Investors buy and sell shares of the Fund on a secondary market. Only market makers or “authorized participants” may trade directly with the Fund, typically in blocks of 50,000 shares.
The Alerian MLP ETF is not suitable for all investors. Investments in the Fund are subject to investment risks, including possible loss of the principal amount invested.
ALPS Portfolio Solutions Distributor, Inc., a FINRA member, is the distributor for the Fund.
| Performance Overview | November 30, 2017 (Unaudited) |
Top 10 Holdings* (as of November 30, 2017)
| Magellan Midstream Partners LP | 10.70% |
| Enterprise Products Partners LP | 10.20% |
| Energy Transfer Partners LP | 9.40% |
| MPLX LP | 8.90% |
| Williams Partners LP | 8.10% |
| Plains All American Pipeline LP | 7.10% |
| Buckeye Partners LP | 5.60% |
| Western Gas Partners LP | 3.90% |
| EQT Midstream Partners LP | 3.50% |
| Andeavor Logistics LP | 2.90% |
| Total% of Top 10 Holdings | 70.30% |
Future holdings are subject to change.
Growth of $10,000 (as of November 30, 2017)
Comparison of change in value of a $10,000 investment in the Fund and the Indexes
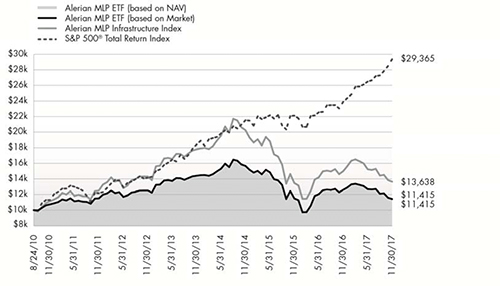
The chart above represents historical performance of a hypothetical investment of $10,000 in the Fund over the life of the Fund. Past performance does not guarantee future results. This chart does not reflect the deduction of taxes that a shareholder would pay on Fund distributions or the redemption of Fund shares.
| Alerian Energy Infrastructure ETF | |
| Performance Overview | November 30, 2017 (Unaudited) |
INVESTMENT OBJECTIVE
The Alerian Energy Infrastructure ETF (the “Fund” or “ENFR”) seeks investment results that correspond (before fees and expenses) generally to the price and yield performance of its underlying index, the Alerian Energy Infrastructure Index (the “Underlying Index” or “AMEI”). As a secondary objective, the Fund seeks to provide total return through income and capital appreciation.
The Underlying Index is a composite of North American energy infrastructure companies engaged in the pipeline transportation, storage, and processing of energy commodities (also known as “midstream energy businesses”). Currently, each constituent is assigned to one of four categories: (i) U.S. Energy Infrastructure Master Limited Partnerships (“MLPs”) (ii) U.S. General Partners, (iii) U.S. Energy Infrastructure Companies, and (iv) Canadian Energy Infrastructure Companies. Each category is assigned an index weight of 25%.
PERFORMANCE OVERVIEW
During the twelve-month period of December 1, 2016 to November 30, 2017, the Alerian Energy Infrastructure ETF (ENFR) delivered a total return of 0.21%. This compares to the Fund’s index, the Alerian Energy Infrastructure Index (“AMEI” or “index”), which fell 4.0% on a price return basis and rose 1.11% on a total return basis.
During the period, the Fund paid four distributions:
| ● | $0.08421 on December 29, 2016 |
| ● | $0.15615 on March 29, 2017 |
| ● | $0.2405 on June 28, 2017 |
| ● | $0.24268 on September 27, 2017 |
Top contributors during the period include CenterPoint Energy (CNP), Dominion Resources (D), OGE Energy (OGE), and Pembina Pipeline (PPL)—all returning over 10%. Underperformers include NuStar GP Holdings (NSH), Plains GP Holdings (PAGP), and SemGroup Corp (SEMG).
During the period, Antero Midstream Partners (AM) and Andeavor Logistics (ANDX) were added to the index. Spectra Energy (SE) was removed from the index during a special rebalancing due to its merger with Enbridge (ENB). Veresen (VSN) was also removed in a special rebalancing due to its merger with Pembina Pipeline (PPL).
The methodology was updated in September to, among other things, better capture the investable universe, reflect established guidelines for diversified portfolios, mirror industry trends, and minimize future index turnover.
Energy infrastructure companies rallied from November through January, largely as a function of the new US administration and its pro-energy stance. Expedited regulatory approvals, including those for the Dakota Access Pipeline and Keystone XL, resulted in energy infrastructure companies rallying further. However, as the price of oil fell below $50 per barrel in March, midstream companies sold off along with the broader energy sector. While oil prices stabilized and recovered through the summer and fall, energy infrastructure companies largely did not recover in tandem.
New energy infrastructure project announcements continued throughout the year, especially in the Permian and SCOOP/STACK regions. But investor interest largely centered on balance sheets. Announcements of slowed distribution growth, self-funding measures, or even distribution cuts were greeted positively—or at least with acceptance—by the market.
Those companies with Utility assets outperformed during the year as that sector largely kept pace with the growth of the broader economy and remained insulated from the fluctuations in oil prices.
Energy infrastructure companies may continue to experience volatility in the coming months if commodity prices do the same. Investors will likely further scrutinize balance sheets for appropriate uses of cash and analyze distribution and dividend policies for long-term sustainability before they are willing to recognize that current discounted valuations are unjustified. Beyond the short term, in our view fundamentals remain intact for energy infrastructure companies over the next several decades.
| Alerian Energy Infrastructure ETF | |
| Performance Overview | November 30, 2017 (Unaudited) |
Performance (as of November 30, 2017)
| | 1 Year | 3 Year | Since Inception^ |
| Alerian Energy Infrastructure ETF - NAV | 0.21% | -4.97% | -0.01% |
| Alerian Energy Infrastructure ETF - Market Price* | -0.05% | -5.07% | -0.02% |
| Alerian Energy Infrastructure Index | 1.11% | -4.27% | 0.83% |
| S&P 500® Total Return Index | 22.87% | 10.91% | 12.93% |
Total Expense Ratio (per the current prospectus) 0.65%.
Performance data quoted represents past performance. Past performance does not guarantee future results. The table does not reflect the deduction of taxes that a shareholder would pay on Fund distributions or the redemption of Fund shares. Investment return and principal value of an investment will fluctuate so that an investor’s shares, when sold or redeemed, may be worth more or less than the original cost. Current performance data may be higher or lower than actual data quoted. For most current month-end performance data please visit www.alpsfunds.com or call 1.866.675.2639.
NAV is an exchange-traded fund’s per-share value. The per-share dollar amount of the Fund is derived by dividing the total value of all the securities in its portfolio, less any liabilities, by the number of Fund shares outstanding. Market Price is the price at which a share can currently be traded in the market. Information detailing the number of days the Market Price of the Fund was greater than the Fund’s NAV and the number of days it was less than the Fund’s NAV can be obtained at www.alpsfunds.com.
| ^ | The Fund commenced Investment Operations on November 1, 2013. |
| * | Market Price is based on the midpoint of the bid-ask spread at 4 p.m. ET and does not represent the returns an investor would receive if shares were traded at other times. |
The Alerian Energy Infrastructure Index is comprised of 30 equity securities of issuers headquartered or incorporated in the United States and Canada that engage in the transportation, storage, and processing of energy commodities.
S&P 500® Total Return Index: the Standard & Poor’s composite index of 500 stocks, a widely recognized, unmanaged index of common stock prices. Total return assumes reinvestment of any dividends and distributions realized during a given time period.
The index is not actively managed and does not reflect any deductions for fees, expenses or taxes. One cannot invest directly in an index. Index performance does not reflect fund performance.
The Fund’s shares are not individually redeemable. Investors buy and sell shares of the Fund on a secondary market. Only market makers or “authorized participants” may trade directly with the Fund, typically in blocks of 50,000 shares.
The Alerian Energy Infrastructure ETF is not suitable for all investors. Investments in the Fund are subject to investment risks, including possible loss of the principal amount invested.
ALPS Portfolio Solutions Distributor, Inc., a FINRA member, is the distributor for the Fund.
| Alerian Energy Infrastructure ETF | |
| Performance Overview | November 30, 2017 (Unaudited) |
Top 10 Holdings* (as of November 30, 2017)
| Dominion Energy, Inc. | 5.80% |
| CenterPoint Energy, Inc. | 5.40% |
| Pembina Pipeline Corp. | 5.20% |
| OGE Energy Corp. | 5.20% |
| TransCanada Corp. | 5.10% |
| The Williams Cos., Inc. | 5.10% |
| Enterprise Products Partners LP | 5.00% |
| Magellan Midstream Partners LP | 5.00% |
| ONEOK, Inc. | 4.90% |
| Macquarie Infrastructure Corp. | 4.90% |
| Total % of Top 10 Holdings | 51.60% |
Future holdings are subject to change.
Growth of $10,000 (as of November 30, 2017)
Comparison of change in value of a $10,000 investment in the Fund and the Indexes
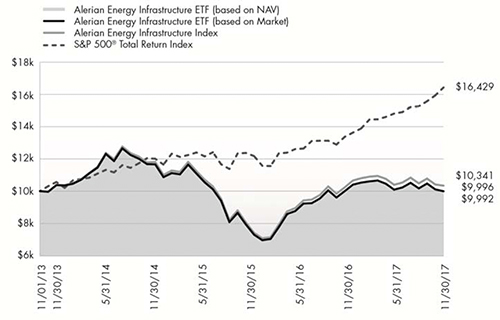
The chart above represents historical performance of a hypothetical investment of $10,000 in the Fund over the life of the Fund. Past performance does not guarantee future results. This chart does not reflect the deduction of taxes that a shareholder would pay on Fund distributions or the redemption of Fund shares.
| Alerian Exchange Traded Funds | |
| Disclosure of Fund Expenses | November 30, 2017 (Unaudited) |
Shareholder Expense Example: As a shareholder of a Fund, you incur two types of costs: (1) transaction costs which may include creation and redemption fees or brokerage charges, and (2) ongoing costs, including management fees and other Fund expenses. These examples are intended to help you understand your ongoing costs (in dollars) of investing in the Fund and to compare these costs with the ongoing costs of investing in other funds. It is based on an investment of $1,000 invested at the beginning of the (six month) period and held through November 30, 2017.
Actual Return: The first line of the table provides information about actual account values and actual expenses. You may use the information in this line, together with the amount you invested, to estimate the expenses that you incurred over the period. Simply divide your account value by $1,000 (for example, an $8,600 account value divided by $1,000 = 8.6), then multiply the result by the number in the first line under the heading entitled “Expenses Paid During Period” to estimate the expenses attributable to your investment during this period.
Hypothetical 5% Return: The second line of the table provides information about hypothetical account values and hypothetical expenses based on the Fund’s actual expense ratio and an assumed rate of return of 5% per year before expenses, which is not the Fund’s actual return. The hypothetical account values and expenses may not be used to estimate the actual ending account balance or expenses you paid for the period. You may use this information to compare ongoing costs of investing in the Fund and other funds. To do so, compare this 5% hypothetical example with the 5% hypothetical examples that appear in the shareholder reports of other funds.
The expenses shown in the table are meant to highlight ongoing Fund costs only and do not reflect any transaction costs, such as creation and redemption fees or brokerage charges. Therefore, the second line is useful in comparing ongoing costs only, and will not help you deter-mine the relative total costs of owning different funds. In addition, if these costs were included, your costs would have been higher.
| | Beginning Account Value 6/1/17 | Ending Account Value 11/30/17 | Expense Ratio(a) | Expenses Paid During Period 6/1/17 - 11/30/17(b) |
| Alerian MLP ETF | | | | |
| Actual | $1,000.00 | $899.80 | 0.86% | $4.10 |
| Hypothetical (5% return before expenses) | $1,000.00 | $1,020.76 | 0.86% | $4.36 |
| Alerian Energy Infrastructure ETF | | | | |
| Actual | $1,000.00 | $990.90 | 0.65% | $3.24 |
| Hypothetical (5% return before expenses) | $1,000.00 | $1,021.81 | 0.65% | $3.29 |
| (a) | Annualized, based on the Fund's most recent fiscal half-year expenses. |
| (b) | Expenses are equal to the Fund's annualized expense ratio multiplied by the average account value over the period, multiplied by the number of days in the most recent fiscal half year (183), divided by 365. |
| Alerian Exchange Traded Funds |
| Report of Independent Registered Public Accounting Firm |
To the Board of Trustees and Shareholders of ALPS ETF Trust:
We have audited the accompanying statements of assets and liabilities, including the schedules of investments, of Alerian MLP ETF and Alerian Energy Infrastructure ETF, two of the portfolios constituting the ALPS ETF Trust (the “Trust”), as of November 30, 2017, and the related statements of operations for the year then ended, the statements of changes in net assets for each of the two years in the period then ended, and the financial highlights for each of the periods presented. These financial statements and financial highlights are the responsibility of the Trust’s management. Our responsibility is to express an opinion on these financial statements and financial highlights based on our audits.
We conducted our audits in accordance with the standards of the Public Company Accounting Oversight Board (United States). Those standards require that we plan and perform the audit to obtain reasonable assurance about whether the financial statements and financial highlights are free of material misstatement. The Trust is not required to have, nor were we engaged to perform, an audit of its internal control over financial reporting. Our audits included consideration of internal control over financial reporting as a basis for designing audit procedures that are appropriate in the circumstances, but not for the purpose of expressing an opinion on the effectiveness of the Trust’s internal control over financial reporting. Accordingly, we express no such opinion. An audit also includes examining, on a test basis, evidence supporting the amounts and disclosures in the financial statements, assessing the accounting principles used and significant estimates made by management, as well as evaluating the overall financial statement presentation. Our procedures included confirmation of securities owned as of November 30, 2017, by correspondence with the custodian and brokers. We believe that our audits provide a reasonable basis for our opinion.
In our opinion, the financial statements and financial highlights referred to above present fairly, in all material respects, the financial position of Alerian MLP ETF and Alerian Energy Infrastructure ETF of the ALPS ETF Trust as of November 30, 2017, the results of their operations for the year then ended, the changes in their net assets for each of the two years in the period then ended, and the financial highlights for each of the periods presented, in conformity with accounting principles generally accepted in the United States of America.
DELOITTE & TOUCHE LLP
Denver, Colorado
January 26, 2018
Alerian MLP ETF
| Schedule of Investments | November 30, 2017 |
| Security Description | | Shares | | | Value | |
| Master Limited Partnerships (100.04%) | | | | | | | | |
| Gathering & Processing (29.10%) | | | | | | | | |
| Antero Midstream Partners LP | | | 6,308,291 | | | $ | 173,793,417 | |
| DCP Midstream LP(a) | | | 7,380,879 | | | | 259,364,088 | |
| EnLink Midstream Partners LP | | | 13,325,614 | | | | 213,076,568 | |
| MPLX LP(a) | | | 23,433,562 | | | | 840,327,534 | |
| Rice Midstream Partners LP(a) | | | 5,981,093 | | | | 124,586,167 | |
| Western Gas Partners LP(a) | | | 8,181,076 | | | | 366,675,826 | |
| Williams Partners LP | | | 20,669,820 | | | | 758,582,394 | |
| Total Gathering & Processing | | | | | | | 2,736,405,994 | |
| | | | | | | | | |
| Pipeline Transportation | Natural Gas (31.02%) | | | | | | | | |
| Boardwalk Pipeline Partners LP | | | 10,144,224 | | | | 136,338,371 | |
| Dominion Midstream Partners LP(a) | | | 3,944,909 | | | | 126,828,824 | |
| Energy Transfer Partners LP | | | 53,338,938 | | | | 885,959,760 | |
| Enterprise Products Partners LP | | | 38,904,334 | | | | 958,213,746 | |
| EQT Midstream Partners LP(a) | | | 4,781,272 | | | | 328,090,885 | |
| Spectra Energy Partners LP | | | 6,490,123 | | | | 265,575,833 | |
| TC PipeLines LP(a) | | | 4,253,931 | | | | 216,142,234 | |
| Total Pipeline Transportation | Natural Gas | | | | | | | 2,917,149,653 | |
| | | | | | | | | |
| Pipeline Transportation | Petroleum (39.92%) | | | | | | | | |
| Andeavor Logistics LP | | | 6,017,361 | | | | 269,337,078 | |
| Buckeye Partners LP(a) | | | 11,471,355 | | | | 526,879,335 | |
| Enbridge Energy Partners LP(a) | | | 17,579,625 | | | | 257,014,118 | |
| Genesis Energy LP(a) | | | 8,762,589 | | | | 188,132,786 | |
| Holly Energy Partners LP | | | 3,381,491 | | | | 111,961,167 | |
| Magellan Midstream Partners LP(a) | | | 15,052,756 | | | | 1,008,534,652 | |
| NuStar Energy LP(a) | | | 6,453,764 | | | | 187,546,382 | |
| Phillips 66 Partners LP | | | 3,763,106 | | | | 176,339,147 | |
| Plains All American Pipeline LP | | | 34,141,368 | | | | 665,756,676 | |
| Shell Midstream Partners LP | | | 7,199,143 | | | | 194,736,818 | |
| Tallgrass Energy Partners LP(a) | | | 3,835,924 | | | | 168,473,782 | |
| Total Pipeline Transportation | Petroleum | | | | | | | 3,754,711,941 | |
| | | | | | | | | |
| Total Master Limited Partnerships | | | | | | | | |
| (Cost $9,610,475,445) | | | | | | | 9,408,267,588 | |
| | | 7 Day Yield | | | Shares | | | Value | |
| Short Term Investments (0.04%) | | | | | | | | | | | | |
| State Street Institutional Treasury Plus Money Market Fund | | | 0.970 | % | | | 4,201,152 | | | | 4,201,152 | |
| | | | | | | | | | | | | |
| Total Short Term Investments | | | | | | | | | | | | |
| (Cost $4,201,152) | | | | | | | | | | | 4,201,152 | |
| | | | | | | | | | | | | |
| Total Investments (100.08%) | | | | | | | | | | | | |
| (Cost $9,614,676,597) | | | | | | | | | | $ | 9,412,468,740 | |
| | | | | | | | | | | | | |
| Liabilities in Excess of Other Assets (-0.08%) | | | | | | | | | | | (7,184,964 | ) |
| | | | | | | | | | | | | |
| Net Assets (100.00%) | | | | | | | | | | $ | 9,405,283,777 | |
| (a) | Affiliated Company. See Note 8 in Notes to Financial Statements. |
See Notes to Financial Statements.
Alerian MLP ETF
| Statement of Assets and Liabilities | November 30, 2017 |
| ASSETS: | | | |
| Investments, at value | | $ | 4,813,872,127 | |
| Investments in affiliates, at value | | | 4,598,596,613 | |
| Interest receivable | | | 15,504 | |
| Deferred tax asset (Note 2) | | | – | (a) |
| Income tax receivable | | | 9,482 | |
| Total Assets | | | 9,412,493,726 | |
| | | | | |
| LIABILITIES: | | | | |
| Payable for investments purchased | | | 3,845 | |
| Payable for shares redeemed | | | 1,382 | |
| Franchise tax payable | | | 580,887 | |
| Payable to adviser | | | 6,623,835 | |
| Total Liabilities | | | 7,209,949 | |
| NET ASSETS | | $ | 9,405,283,777 | |
| | | | | |
| NET ASSETS CONSIST OF: | | | | |
| Paid-in capital | | $ | 10,681,729,891 | |
| Accumulated net investment loss, net of deferred income taxes | | | (390,629,039 | ) |
| Accumulated net realized loss on investments, net of deferred income taxes | | | (683,582,500 | ) |
| Net unrealized depreciation on investments, net of deferred income taxes | | | (202,234,575 | ) |
| NET ASSETS | | $ | 9,405,283,777 | |
| | | | | |
| INVESTMENTS, AT COST | | $ | 5,121,464,446 | |
| INVESTMENTS IN AFFILIATES, AT COST | | | 4,493,212,151 | |
| | | | | |
| PRICING OF SHARES | | | | |
| Net Assets | | $ | 9,405,283,777 | |
| Shares of beneficial interest outstanding (Unlimited number of shares authorized, par value $0.01 per share) | | | 907,362,100 | |
| Net Asset Value, offering and redemption price per share | | $ | 10.37 | |
| (a) | Net Deferred Tax Asset of $343,528,650 is offset 100% by Valuation Allowance. |
See Notes to Financial Statements.
Alerian MLP ETF
| Statement of Operations | For the Year Ended November 30, 2017 |
| INVESTMENT INCOME: | | | |
| Distributions from master limited partnerships | | $ | 726,282,299 | |
| Less return of capital distributions | | | (726,282,299 | ) |
| Total Investment Income | | | – | |
| | | | | |
| EXPENSES: | | | | |
| Franchise tax expense | | | 748,955 | |
| Investment adviser fee | | | 85,739,653 | |
| Total Expenses | | | 86,488,608 | |
| NET INVESTMENT LOSS, BEFORE INCOME TAXES | | | (86,488,608 | ) |
| Deferred income tax expense | | | (96,145,707 | ) |
| NET INVESTMENT LOSS | | | (182,634,315 | ) |
| | | | | |
| REALIZED AND UNREALIZED GAIN/(LOSS): | | | | |
| Net realized gain on investments, before income taxes | | | 35,277,752 | |
| Net realized gain on affiliated investments, before income taxes | | | 25,389,633 | |
| Deferred income tax expense | | | (123,314,817 | ) |
| Net realized loss | | | (62,647,432 | ) |
| Net change in unrealized appreciation on investments, before income taxes | | | 17,478,667 | |
| Net change in unrealized depreciation on affiliated investments, before income taxes | | | (1,056,304,577 | ) |
| Deferred income tax benefit | | | 264,451,203 | |
| Net change in unrealized depreciation | | | (774,374,707 | ) |
| NET REALIZED AND UNREALIZED LOSS ON INVESTMENTS | | | (837,022,139 | ) |
| NET DECREASE IN NET ASSETS RESULTING FROM OPERATIONS | | $ | (1,019,656,454 | ) |
See Notes to Financial Statements.
Alerian MLP ETF
| Statements of Changes in Net Assets | |
| | | For the Year Ended November 30, 2017 | | | For the Year Ended November 30, 2016 | |
| OPERATIONS: | | | | | | | | |
| Net investment income/(loss) | | $ | (182,634,315 | ) | | $ | 28,382,549 | |
| Net realized loss | | | (62,647,432 | ) | | | (458,105,486 | ) |
| Net change in unrealized appreciation/(depreciation) | | | (774,374,707 | ) | | | 1,264,630,644 | |
| Net increase/(decrease) in net assets resulting from operations | | | (1,019,656,454 | ) | | | 834,907,707 | |
| | | | | | | | | |
| DISTRIBUTIONS TO SHAREHOLDERS: | | | | | | | | |
| From tax return of capital | | | (738,470,998 | ) | | | (689,407,280 | ) |
| Total distributions | | | (738,470,998 | ) | | | (689,407,280 | ) |
| | | | | | | | | |
| CAPITAL SHARE TRANSACTIONS: | | | | | | | | |
| Proceeds from sale of shares | | | 2,858,164,282 | | | | 3,159,977,900 | |
| Cost of shares redeemed | | | (1,072,772,241 | ) | | | (1,131,213,513 | ) |
| Net increase from share transactions | | | 1,785,392,041 | | | | 2,028,764,387 | |
| | | | | | | | | |
| Net increase in net assets | | | 27,264,589 | | | | 2,174,264,814 | |
| | | | | | | | | |
| NET ASSETS: | | | | | | | | |
| Beginning of year | | | 9,378,019,188 | | | | 7,203,754,374 | |
| End of year * | | $ | 9,405,283,777 | | | $ | 9,378,019,188 | |
| *Including accumulated net investment loss, net of deferred income taxes of: | | $ | (390,629,039 | ) | | $ | (207,994,724 | ) |
| | | | | | | | | |
| OTHER INFORMATION: | | | | | | | | |
| SHARE TRANSACTIONS: | | | | | | | | |
| Beginning shares | | | 761,612,100 | | | | 588,062,100 | |
| Shares sold | | | 238,500,000 | | | | 271,600,000 | |
| Shares redeemed | | | (92,750,000 | ) | | | (98,050,000 | ) |
| Shares outstanding, end of year | | | 907,362,100 | | | | 761,612,100 | |
See Notes to Financial Statements.
Alerian MLP ETF
| Financial Highlights | For a Share Outstanding Throughout the Periods Presented |
| | | For the Year Ended November 30, 2017 | | | For the Year Ended November 30, 2016 | | | For the Year Ended November 30, 2015 | | | For the Year Ended November 30, 2014 | | | For the Year Ended November 30, 2013 | |
| NET ASSET VALUE, BEGINNING OF PERIOD | | $ | 12.31 | | | $ | 12.25 | | | $ | 18.10 | | | $ | 17.69 | | | $ | 16.32 | |
| | | | | | | | | | | | | | | | | | | | | |
| INCOME/(LOSS) FROM OPERATIONS: | | | | | | | | | | | | | | | | | | | | |
| Net investment income/(loss)(a) | | | (0.22 | ) | | | 0.04 | | | | (0.13 | ) | | | (0.16 | ) | | | (0.09 | ) |
| Net realized and unrealized gain/(loss) on investments | | | (0.86 | ) | | | 1.04 | | | | (4.53 | ) | | | 1.70 | | | | 2.53 | |
| Total from investment operations | | | (1.08 | ) | | | 1.08 | | | | (4.66 | ) | | | 1.54 | | | | 2.44 | |
| | | | | | | | | | | | | | | | | | | | | |
| DISTRIBUTIONS: | | | | | | | | | | | | | | | | | | | | |
| From net realized gains | | | – | | | | – | | | | – | | | | (0.73 | ) | | | – | |
| From tax return of capital | | | (0.86 | ) | | | (1.02 | ) | | | (1.19 | ) | | | (0.40 | ) | | | (1.07 | ) |
| Total distributions | | | (0.86 | ) | | | (1.02 | ) | | | (1.19 | ) | | | (1.13 | ) | | | (1.07 | ) |
| | | | | | | | | | | | | | | | | | | | | |
| NET INCREASE/(DECREASE) IN NET ASSET VALUE | | | (1.94 | ) | | | 0.06 | | | | (5.85 | ) | | | 0.41 | | | | 1.37 | |
| NET ASSET VALUE, END OF PERIOD | | $ | 10.37 | | | $ | 12.31 | | | $ | 12.25 | | | $ | 18.10 | | | $ | 17.69 | |
| TOTAL RETURN(b) | | | (9.27 | )% | | | 9.76 | % | | | (26.84 | )% | | | 8.82 | % | | | 15.16 | % |
| | | | | | | | | | | | | | | | | | | | | |
| RATIOS/SUPPLEMENTAL DATA: | | | | | | | | | | | | | | | | | | | | |
| Net assets, end of period (000s) | | $ | 9,405,284 | | | $ | 9,378,019 | | | $ | 7,203,754 | | | $ | 9,349,001 | | | $ | 7,384,685 | |
| | | | | | | | | | | | | | | | | | | | | |
| RATIO TO AVERAGE NET ASSETS: | | | | | | | | | | | | | | | | | | | | |
| Expenses (excluding net current and deferred tax expenses/benefits and franchise tax expense) | | | 0.85 | % | | | 0.85 | % | | | 0.85 | % | | | 0.85 | % | | | 0.85 | % |
| Expenses (including net current and deferred tax expenses/benefits)(c) | | | 0.41 | % | | | 1.42 | % | | | (11.40 | )% | | | 5.43 | % | | | 8.56 | % |
| Expenses (including current and deferred tax expenses/benefits)(d) | | | 1.81 | % | | | (0.36 | )% | | | 1.57 | % | | | 0.55 | % | | | 0.55 | % |
| Net investment loss (excluding deferred tax expenses/benefits and franchise tax expense) | | | (0.85 | )% | | | (0.85 | )% | | | (0.85 | )% | | | (0.85 | )% | | | (0.85 | )% |
| Net investment income/(loss)(including deferred tax expenses/benefits)(d) | | | (1.81 | )% | | | 0.36 | % | | | (1.57 | )% | | | (0.55 | )% | | | (0.55 | )% |
| PORTFOLIO TURNOVER RATE(e) | | | 23 | % | | | 31 | % | | | 21 | % | | | 29 | % | | | 12 | % |
| (a) | Based on average shares outstanding during the period. |
| (b) | Total return is calculated assuming an initial investment made at the net assets value at the beginning of the period and redemption at the net asset value on the last day of the period and assuming all distributions are reinvested at actual reinvestment prices. Total return calculated for a period of less than one year is not annualized. |
| (c) | Includes amount of current and deferred taxes/benefits for all components of the Statement of Operations. |
| (d) | Includes amount of current and deferred tax benefit associated with net investment income/(loss). |
| (e) | Portfolio turnover for periods less than one year is not annualized and does not include securities received or delivered from processing creations or redemptions in-kind. |
See Notes to Financial Statements.
Alerian Energy Infrastructure ETF
| Schedule of Investments | November 30, 2017 |
| Security Description | | Shares | | | Value | |
| Canadian Energy Infrastructure Companies (25.42%) | | | | | | | | |
| Energy (25.42%) | | | | | | | | |
| AltaGas, Ltd. | | | 38,920 | | | $ | 884,799 | |
| Enbridge, Inc. | | | 53,619 | | | | 2,021,908 | |
| Gibson Energy, Inc. | | | 32,967 | | | | 441,553 | |
| Inter Pipeline, Ltd. | | | 86,350 | | | | 1,813,808 | |
| Keyera Corp. | | | 43,245 | | | | 1,218,764 | |
| Pembina Pipeline Corp. | | | 63,818 | | | | 2,222,488 | |
| TransCanada Corp. | | | 45,207 | | | | 2,168,282 | |
| Total Energy | | | | | | | 10,771,602 | |
| | | | | | | | | |
| Total Canadian Energy Infrastructure Companies | | | | | | | | |
| (Cost $11,476,088) | | | | | | | 10,771,602 | |
| | | | | | | | | |
| U.S. Energy Infrastructure Companies (23.80%) | | | | | | | | |
| Energy (18.92%) | | | | | | | | |
| Kinder Morgan, Inc. | | | 116,500 | | | | 2,007,295 | |
| ONEOK, Inc. | | | 40,324 | | | | 2,092,815 | |
| SemGroup Corp., Class A | | | 77,703 | | | | 1,864,872 | |
| Targa Resources Corp. | | | 47,214 | | | | 2,049,088 | |
| Total Energy | | | | | | | 8,014,070 | |
| | | | | | | | | |
| Industrials (4.88%) | | | | | | | | |
| Macquarie Infrastructure Corp. | | | 30,961 | | | | 2,067,576 | |
| | | | | | | | | |
| Total U.S. Energy Infrastructure Companies | | | | | | | | |
| (Cost $12,133,406) | | | | | | | 10,081,646 | |
| | | | | | | | | |
| U.S. Energy Infrastructure MLPs (23.73%) | | | | | | | | |
| Energy (23.73%) | | | | | | | | |
| Andeavor Logistics LP | | | 10,206 | | | | 456,821 | |
| Buckeye Partners LP | | | 19,481 | | | | 894,762 | |
| Cheniere Energy Partners LP | | | 5,689 | | | | 153,091 | |
| Energy Transfer Equity LP | | | 118,544 | | | | 1,920,413 | |
| Enterprise Products Partners LP | | | 85,714 | | | | 2,111,136 | |
| EQT GP Holdings LP | | | 3,605 | | | | 92,180 | |
| Magellan Midstream Partners LP | | | 31,443 | | | | 2,106,681 | |
| MPLX LP | | | 39,744 | | | | 1,425,220 | |
| NuStar GP Holdings LLC | | | 4,634 | | | | 67,425 | |
| Phillips 66 Partners LP | | | 6,447 | | | | 302,106 | |
| Shell Midstream Partners LP | | | 12,227 | | | | 330,740 | |
| Western Gas Equity Partners LP | | | 5,476 | | | | 195,493 | |
| Total Energy | | | | | | | 10,056,068 | |
| | | | | | | | | |
| Total U.S. Energy Infrastructure MLPs | | | | | | | | |
| (Cost $12,041,807) | | | | | | | 10,056,068 | |
| | | | | | | | | |
| U.S. General Partners (26.89%) | | | | | | | | |
| Energy (10.47%) | | | | | | | | |
| Antero Midstream Partners LP | | | 10,686 | | | | 294,399 | |
| Archrock, Inc. | | | 21,687 | | | | 206,027 | |
| EnLink Midstream LLC | | | 19,723 | | | | 329,374 | |
| Plains GP Holdings LP, Class A | | | 50,229 | | | | 1,034,215 | |
| Tallgrass Energy GP LP | | | 18,198 | | | | 411,275 | |
See Notes to Financial Statements.
Alerian Energy Infrastructure ETF
| Schedule of Investments | November 30, 2017 |
| Security Description | | Shares | | | Value | |
| Energy (continued) | | | | | | | | |
| The Williams Cos., Inc. | | | 74,426 | | | $ | 2,162,075 | |
| Total Energy | | | | | | | 4,437,365 | |
| | | | | | | | | |
| Utilities (16.42%) | | | | | | | | |
| CenterPoint Energy, Inc. | | | 76,503 | | | | 2,295,855 | |
| Dominion Energy, Inc. | | | 29,011 | | | | 2,440,696 | |
| OGE Energy Corp. | | | 62,025 | | | | 2,218,014 | |
| Total Utilities | | | | | | | 6,954,565 | |
| | | | | | | | | |
| Total U.S. General Partners | | | | | | | | |
| (Cost $11,947,682) | | | | | | | 11,391,930 | |
| | | 7 Day Yield | | | Shares | | | Value | |
| Short Term Investments (0.19%) | | | | | | | | | | | | |
| State Street Institutional Treasury Plus Money Market Fund | | | 0.970 | % | | | 81,416 | | | | 81,416 | |
| | | | | | | | | | | | | |
| Total Short Term Investments | | | | | | | | | | | | |
| (Cost $81,416) | | | | | | | | | | | 81,416 | |
| | | | | | | | | | | | | |
| Total Investments (100.03%) | | | | | | | | | | | | |
| (Cost $47,680,399) | | | | | | | | | | $ | 42,382,662 | |
| | | | | | | | | | | | | |
| Liabilities in Excess of Other Assets (-0.03%) | | | | | | | | | | | (12,322 | ) |
| | | | | | | | | | | | | |
| Net Assets (100.00%) | | | | | | | | | | $ | 42,370,340 | |
See Notes to Financial Statements.
Alerian Energy Infrastructure ETF
| Statement of Assets and Liabilities | November 30, 2017 |
| ASSETS: | | | |
| Investments, at value | | $ | 42,382,662 | |
| Dividends receivable | | | 122,932 | |
| Total Assets | | | 42,505,594 | |
| | | | | |
| LIABILITIES: | | | | |
| Payable for investments purchased | | | 112,716 | |
| Payable to adviser | | | 22,538 | |
| Total Liabilities | | | 135,254 | |
| NET ASSETS | | $ | 42,370,340 | |
| | | | | |
| NET ASSETS CONSIST OF: | | | | |
| Paid-in capital | | $ | 47,463,753 | |
| Accumulated net investment loss | | | (551,359 | ) |
| Accumulated net realized gain | | | 756,250 | |
| Net unrealized depreciation | | | (5,298,304 | ) |
| NET ASSETS | | $ | 42,370,340 | |
| | | | | |
| INVESTMENTS, AT COST | | $ | 47,680,399 | |
| | | | | |
| PRICING OF SHARES | | | | |
| Net Assets | | $ | 42,370,340 | |
| Shares of beneficial interest outstanding (Unlimited number of shares authorized, par value $0.01 per share) | | | 1,900,000 | |
| Net Asset Value, offering and redemption price per share | | $ | 22.30 | |
See Notes to Financial Statements.
Alerian Energy Infrastructure ETF
| Statement of Operations | For the Year Ended November 30, 2017 |
| INVESTMENT INCOME: | | | |
| Dividends | | $ | 1,407,755 | |
| Foreign taxes withheld | | | (64,288 | ) |
| Total Investment Income | | | 1,343,467 | |
| | | | | |
| EXPENSES: | | | | |
| Investment adviser fees | | | 216,038 | |
| Total Expenses | | | 216,038 | |
| NET INVESTMENT INCOME | | | 1,127,429 | |
| | | | | |
| REALIZED AND UNREALIZED GAIN/(LOSS): | | | | |
| Net realized gain on investments | | | 278,367 | |
| Net realized loss on foreign currency transactions | | | (148 | ) |
| Net realized gain | | | 278,219 | |
| Net change in unrealized depreciation on investments | | | (2,283,494 | ) |
| Net change in unrealized depreciation on translation of assets and liabilities denominated in foreign currencies | | | (555 | ) |
| Net change in unrealized depreciation | | | (2,284,049 | ) |
| NET REALIZED AND UNREALIZED LOSS ON INVESTMENTS AND FOREIGN CURRENCIES | | | (2,005,830 | ) |
| NET DECREASE IN NET ASSETS RESULTING FROM OPERATIONS | | $ | (878,401 | ) |
See Notes to Financial Statements.
Alerian Energy Infrastructure ETF
| Statements of Changes in Net Assets | |
| | | For the Year Ended November 30, 2017 | | | For the Year Ended November 30, 2016 | |
| OPERATIONS: | | | | | | | | |
| Net investment income | | $ | 1,127,429 | | | $ | 536,608 | |
| Net realized gain/(loss) | | | 278,219 | | | | (813,397 | ) |
| Net change in unrealized appreciation/(depreciation) | | | (2,284,049 | ) | | | 2,855,014 | |
| Net increase/(decrease) in net assets resulting from operations | | | (878,401 | ) | | | 2,578,225 | |
| | | | | | | | | |
| DISTRIBUTIONS: | | | | | | | | |
| From net investment income | | | (671,029 | ) | | | (405,322 | ) |
| Dividends to shareholders from tax return of capital | | | (376,837 | ) | | | (88,512 | ) |
| Total distributions | | | (1,047,866 | ) | | | (493,834 | ) |
| | | | | | | | | |
| CAPITAL SHARE TRANSACTIONS: | | | | | | | | |
| Proceeds from sale of shares | | | 28,328,448 | | | | 9,559,448 | |
| Cost of shares redeemed | | | (2,388,525 | ) | | | (5,618,048 | ) |
| Net increase from share transactions | | | 25,939,923 | | | | 3,941,400 | |
| Net increase in net assets | | | 24,013,656 | | | | 6,025,791 | |
| | | | | | | | | |
| NET ASSETS: | | | | | | | | |
| Beginning of year | | | 18,356,684 | | | | 12,330,893 | |
| End of year * | | $ | 42,370,340 | | | $ | 18,356,684 | |
| | | | | | | | | |
| *Including accumulated net investment loss of: | | $ | (551,359 | ) | | $ | (360,739 | ) |
| | | | | | | | | |
| OTHER INFORMATION: | | | | | | | | |
| CAPITAL SHARE TRANSACTIONS: | | | | | | | | |
| Beginning shares | | | 800,000 | | | | 650,000 | |
| Shares sold | | | 1,200,000 | | | | 500,000 | |
| Shares redeemed | | | (100,000 | ) | | | (350,000 | ) |
| Shares outstanding, end of period | | | 1,900,000 | | | | 800,000 | |
See Notes to Financial Statements.
Alerian Energy Infrastructure ETF
| Financial Highlights | For a Share Outstanding Throughout the Periods Presented |
| | | For the Year Ended November 30, 2017 | | | For the Year Ended November 30, 2016 | | | For the Year Ended November 30, 2015 | | | For the Year Ended November 30, 2014 | | | For the Period November 1, 2013 (Commencement of Operations) to November 30, 2013 | |
| NET ASSET VALUE, BEGINNING OF PERIOD | | $ | 22.95 | | | $ | 18.97 | | | $ | 28.55 | | | $ | 24.86 | | | $ | 25.00 | |
| | | | | | | | | | | | | | | | | | | | | |
| INCOME/(LOSS) FROM INVESTMENT OPERATIONS: | | | | | | | | | | | | | | | | | | | | |
| Net investment income(a) | | | 0.79 | | | | 0.80 | | | | 0.83 | | | | 0.85 | | | | 0.06 | |
| Net realized and unrealized gain/(loss) on investments | | | (0.72 | ) | | | 3.95 | | | | (9.78 | ) | | | 3.40 | | | | (0.20 | ) |
| Total from investment operations | | | 0.07 | | | | 4.75 | | | | (8.95 | ) | | | 4.25 | | | | (0.14 | ) |
| | | | | | | | | | | | | | | | | | | | | |
| DISTRIBUTIONS: | | | | | | | | | | | | | | | | | | | | |
| From net investment income | | | (0.47 | ) | | | (0.63 | ) | | | (0.48 | ) | | | (0.56 | ) | | | – | |
| Tax return of capital | | | (0.25 | ) | | | (0.14 | ) | | | (0.15 | ) | | | – | | | | – | |
| Total distributions | | | (0.72 | ) | | | (0.77 | ) | | | (0.63 | ) | | | (0.56 | ) | | | – | |
| | | | | | | | | | | | | | | | | | | | | |
| NET INCREASE/(DECREASE) IN NET ASSET VALUE | | | (0.65 | ) | | | 3.98 | | | | (9.58 | ) | | | 3.69 | | | | (0.14 | ) |
| NET ASSET VALUE, END OF PERIOD | | $ | 22.30 | | | $ | 22.95 | | | $ | 18.97 | | | $ | 28.55 | | | $ | 24.86 | |
| TOTAL RETURN(b) | | | 0.21 | % | | | 25.63 | % | | | (31.83 | )% | | | 17.12 | % | | | (0.56 | )% |
| | | | | | | | | | | | | | | | | | | | | |
| RATIOS/SUPPLEMENTAL DATA: | | | | | | | | | | | | | | | | | | | | |
| Net assets, end of period (000s) | | $ | 42,370 | | | $ | 18,357 | | | $ | 12,331 | | | $ | 17,131 | | | $ | 3,729 | |
| | | | | | | | | | | | | | | | | | | | | |
| Ratio of expenses to average net assets | | | 0.65 | % | | | 0.65 | % | | | 0.65 | % | | | 0.65 | % | | | 0.65 | %(c) |
| Ratio of net investment income to average net assets | | | 3.39 | % | | | 4.04 | % | | | 3.31 | % | | | 2.98 | % | | | 3.21 | %(c) |
| PORTFOLIO TURNOVER RATE(d) | | | 37 | % | | | 38 | % | | | 47 | % | | | 27 | % | | | 0 | % |
| (a) | Based on average shares outstanding during the period. |
| (b) | Total return is calculated assuming an initial investment made at the net assets value at the beginning of the period and redemption at the net asset value on the last day of the period and assuming all distributions are reinvested at actual reinvestment prices. Total return calculated for a period of less than one year is not annualized. |
| (c) | Annualized. |
| (d) | Portfolio turnover for periods less than one year is not annualized and does not include securities received or delivered from processing creations or redemptions in-kind. |
See Notes to Financial Statements.
Alerian Exchange Traded Funds
| Notes to Financial Statements | November 30, 2017 |
1. ORGANIZATION
ALPS ETF Trust (the “Trust”), a Delaware statutory trust, is an open-end management investment company registered under the Investment Company Act of 1940, as amended (the “1940 Act”). As of November 30, 2017, the Trust consisted of nineteen separate portfolios. Each portfolio represents a separate series of the Trust. This report pertains to the Alerian MLP ETF and the Alerian Energy Infrastructure ETF (each a “Fund” and collectively, the “Funds”).
The investment objective of the Alerian MLP ETF is to seek investment results that correspond (before fees and expenses) generally to the price and yield performance of its underlying index, the Alerian MLP Infrastructure Index. The investment objective of the Alerian Energy Infrastructure ETF is to seek investment results that correspond (before fees and expenses) generally to the price and yield performance of its underlying index, the Alerian Energy Infrastructure Index. The investment advisor uses a “passive management” or indexing investment approach to try to achieve each Fund’s investment objective. Each Fund is considered non-diversified and may invest a greater portion of assets in securities of individual issuers than a diversified fund. As a result, changes in the market value of a single investment could cause greater fluctuations in share price than would occur in a diversified fund.
Each Fund’s Shares (“Shares”) are listed on the NYSE Arca, Inc. (“the NYSE Arca”). Each Fund issues and redeems Shares at net asset value (“NAV”), in blocks of 50,000 Shares, each of which is called a “Creation Unit”. Creation Units are issued and redeemed principally in-kind for securities included in the Underlying Index. Except when aggregated in Creation Units, Shares are not redeemable securities of the Fund.
Pursuant to the Trust’s organizational documents, its Officers and Trustees are indemnified against certain liability arising out of the performance of their duties to the Trust. Additionally, in the normal course of business, the Trust enters into contracts with service providers that contain general indemnification clauses. The Trust’s maximum exposure under these arrangements is unknown, as this would involve future claims that may be made against the Trust that have not yet occurred.
2. SIGNIFICANT ACCOUNTING POLICIES
The following is a summary of significant accounting policies consistently followed by the Funds in the preparation of the financial statements. The accompanying financial statements were prepared in accordance with accounting principles generally accepted in the United States of America (“U.S. GAAP”). The preparation of financial statements in conformity with U.S. GAAP requires management to make certain estimates and assumptions that affect the reported amounts of assets and liabilities and disclosures of contingent assets and liabilities at the date of the financial statements and the reported amounts of revenue and expenses during the period. Actual results could differ from those estimates. Each Fund is considered an investment company under U.S. GAAP and follows the accounting and reporting guidance applicable to investment companies in the Financial Accounting Standards Board Accounting Standards Codification Topic 946.
A. Portfolio Valuation
Each Fund’s NAV is determined daily, as of the close of regular trading on the New York Stock Exchange (“NYSE”), normally 4:00 p.m. Eastern Time, on each day the NYSE is open for trading. The NAV is computed by dividing the value of all assets of the Fund (including accrued interest and dividends), less all liabilities (including accrued expenses and dividends declared but unpaid), by the total number of shares outstanding.
Portfolio securities listed on any exchange other than the NASDAQ Stock Market LLC (“NASDAQ”) are valued at the last sale price on the business day as of which such value is being determined. If there has been no sale on such day, the securities are valued at the mean of the most recent bid and ask prices on such day. Securities traded on the NASDAQ are valued at the NASDAQ Official Closing Price as determined by NASDAQ. Portfolio securities traded on more than one securities exchange are valued at the last sale price on the business day as of which such value is being determined at the close of the exchange representing the principal market for such securities. Portfolio securities traded in the over-the-counter market, but excluding securities traded on the NASDAQ, are valued at the latest quoted sale price in such market.
The Funds’ investments are valued at market value or, in the absence of market value with respect to any portfolio securities, at fair value according to procedures adopted by the Trust’s Board of Trustees (the “Board”). When market quotations are not readily available or when events occur that make established valuation methods unreliable, securities of the Funds may be valued in good faith by or under the direction of the Board. These securities generally include, but are not limited to, restricted securities (securities which may not be publicly sold without registration under the Securities Act of 1933) for which a pricing service is unable to provide a market price; securities whose trading has been formally suspended; a security whose market price is not available from a pre-established primary pricing source or the pricing source is not willing to provide a price; a security with respect to which an event has occurred that is most likely to materially affect the value of the security after the market has closed but before the calculation of the Funds’ NAV or make it difficult or impossible to obtain a reliable market quotation; or a security whose price, as provided by the pricing service, does not reflect the security’s “fair value” due to the security being de-listed from a national exchange or the security’s primary trading market is temporarily closed at a time when, under normal conditions, it would be open. As a general principle, the current “fair value” of a security would be the amount which the owner might reasonably expect to receive from the sale on the applicable exchange or principal market. A variety of factors may be considered in determining the fair value of such securities.
Alerian Exchange Traded Funds
| Notes to Financial Statements | November 30, 2017 |
B. Fair Value Measurements
Each Fund discloses the classification of its fair value measurements following a three-tier hierarchy based on the inputs used to measure fair value. Inputs refer broadly to the assumptions that market participants would use in pricing the asset or liability, including assumptions about risk. Inputs may be observable or unobservable. Observable inputs reflect the assumptions market participants would use in pricing the asset or liability that are developed based on market data obtained from sources independent of the reporting entity. Unobservable inputs reflect the reporting entity’s own assumptions about the assumptions market participants would use in pricing the asset or liability that are developed based on the best information available.
Valuation techniques used to value the Funds’ investments by major category are as follows:
Equity securities, including restricted securities, and Limited Partnerships for which market quotations are readily available, are valued at the last reported sale price or official closing price as reported by a third party pricing vendor on the primary market or exchange on which they are traded and are categorized as Level 1 in the hierarchy. In the event there were no sales during the day or closing prices are not available, securities are valued at the mean of the most recent quoted bid and ask prices on such day and are generally categorized as Level 2 in the hierarchy. Investments in open-end mutual funds are valued at their closing NAV each business day and are categorized as Level 1 in the hierarchy.
Changes in valuation techniques may result in transfers in or out of an assigned level within the disclosure hierarchy.
Various inputs are used in determining the value of the Funds’ investments as of the end of the reporting period. When inputs used fall into different levels of the fair value hierarchy, the level in the hierarchy within which the fair value measurement falls is determined based on the lowest level input that is significant to the fair value measurement in its entirety. The designated input levels are not necessarily an indication of the risk or liquidity associated with these investments.
These inputs are categorized in the following hierarchy under applicable financial accounting standards:
| Level 1 – | Unadjusted quoted prices in active markets for identical investments, unrestricted assets or liabilities that a Fund has the ability to access at the measurement date; |
| Level 2 – | Quoted prices which are not active, quoted prices for similar assets or liabilities in active markets or inputs other than quoted prices that are observable (either directly or indirectly) for substantially the full term of the asset or liability; and |
| Level 3 – | Significant unobservable prices or inputs (including the Fund’s own assumptions in determining the fair value of investments) where there is little or no market activity for the asset or liability at the measurement date. |
The following is a summary of the inputs used to value each Fund’s investments at November 30, 2017:
Alerian MLP ETF
| Investments in Securities at Value* | | Level 1- Unadjusted Quoted Prices | | | Level 2- Other Significant Observable Inputs | | | Level 3- Significant Unobservable Inputs | | | Total | |
| Master Limited Partnerships | | $ | 9,408,267,588 | | | $ | – | | | $ | – | | | $ | 9,408,267,588 | |
| Short Term Investments | | | 4,201,152 | | | | – | | | | – | | | | 4,201,152 | |
| TOTAL | | $ | 9,412,468,740 | | | $ | – | | | $ | – | | | $ | 9,412,468,740 | |
| Alerian Exchange Traded Funds | |
| Notes to Financial Statements | November 30, 2017 |
Alerian Energy Infrastructure ETF
| Investments in Securities at Value* | | Level 1- Unadjusted Quoted Prices | | Level 2- Other Significant Observable Inputs | | Level 3- Significant Unobservable Inputs | | Total |
| Canadian Energy Infrastructure Companies | | $ | 10,771,602 | | | $ | – | | | $ | – | | | $ | 10,771,602 | |
| U.S. Energy Infrastructure Companies | | | 10,081,646 | | | | – | | | | – | | | | 10,081,646 | |
| U.S. Energy Infrastructure MLPs | | | 10,056,068 | | | | – | | | | – | | | | 10,056,068 | |
| U.S. General Partners | | | 11,391,930 | | | | – | | | | – | | | | 11,391,930 | |
| Short Term Investments | | | 81,416 | | | | – | | | | – | | | | 81,416 | |
| TOTAL | | $ | 42,382,662 | | | $ | – | | | $ | – | | | $ | 42,382,662 | |
| * | For a detailed breakdown of sectors, see the accompanying Schedule of Investments. |
Each Fund recognizes transfers between levels as of the end of the period. For the year ended November 30, 2017, the Funds did not have any transfers between Level 1 and Level 2 securities. The Funds did not have any securities that used significant unobservable inputs (Level 3) in determining fair value.
C. Foreign Currency Translation
The books and records of the Funds are maintained in U.S. dollars. Investment valuations and other assets and liabilities initially expressed in foreign currencies are converted each business day into U.S. dollars based upon current exchange rates. The portion of realized and unrealized gains or losses on investments due to fluctuations in foreign currency exchange rates is not separately disclosed and is included in realized and unrealized gains or losses on investments, when applicable.
D. Securities Transactions and Investment Income
Securities transactions are recorded as of the trade date. Realized gains and losses from securities transactions are recorded on the last in, first out (“LIFO”) cost basis. Dividend income and capital gains distributions, if any, are recorded on the ex-dividend date, net of any foreign taxes withheld. Interest income, if any, is recorded on the accrual basis, including amortization of premiums and accretion of discounts.
E. Dividends and Distributions to Shareholders
Each Fund intends to declare and make quarterly distributions, or as the Board may determine from time to time. Distributions of net realized capital gains earned by the Alerian Energy Infrastructure ETF, if any, are distributed at least annually. Distributions from net investment income and capital gains are determined in accordance with income tax regulations, which may differ from U.S. GAAP. These differences are primarily due to differing treatments of income and gains on various investment securities held by the Funds, timing differences and differing characterization of distributions made by the Funds.
Distributions received from each Fund’s investments in Master Limited Partnerships (“MLPs”) may be comprised of both income and return of capital. Each Fund records investment income and return of capital based on estimates made at the time such distributions are received. Such estimates are based on historical information available from each MLP and other industry sources. These estimates may subsequently be revised based on information received from MLPs after their tax reporting periods are concluded. For the year ended November 30, 2017, the Alerian MLP ETF distributed $738,470,998 of which 100% is anticipated to be characterized as return of capital from MLP distributions received.
The Alerian MLP ETF also expects a portion of the distributions it receives from MLPs to be treated as a tax deferred return of capital, thus reducing the Alerian MLP ETF’s current tax liability. Return of capital distributions are not taxable income to the shareholder, but reduce the investor’s tax basis in the investor’s Fund Shares. Such a reduction in tax basis will result in larger taxable gains and/or lower tax losses on a subsequent sale of Fund Shares. Shareholders who periodically receive the payment of dividends or other distributions consisting of a return of capital may be under the impression that they are receiving net profits from the Funds when, in fact, they are not. Shareholders should not assume that the source of the distributions is from the net profits of the Funds.
| Alerian Exchange Traded Funds | |
| Notes to Financial Statements | November 30, 2017 |
F. Federal Income Taxation and Tax Basis Information
Alerian MLP ETF
The Alerian MLP ETF is taxed as a regular C-corporation for federal income tax purposes. Currently, the maximum marginal regular federal income tax rate for a corporation is 35 percent. The Fund may be subject to a 20 percent federal alternative minimum tax on its federal alternative taxable income to the extent that its alternative minimum tax exceeds its regular federal income tax. This differs from most investment companies, which elect to be treated as “regulated investment companies” under the Code in order to avoid paying entity level income taxes. Under current law, the Fund is not eligible to elect treatment as a regulated investment company due to its investments primarily in MLPs invested in energy assets. As a result, the Fund will be obligated to pay applicable federal and state corporate income taxes on its taxable income as opposed to most other investment companies, which are not so obligated. The Fund expects that a portion of the distributions it receives from MLPs may be treated as a tax-deferred return of capital, thus reducing the Fund’s current tax liability. However, the amount of taxes currently paid by the Fund will vary depending on the amount of income and gains derived from investments and/or sales of MLP interests and such taxes will reduce an investor’s return from an investment in the Fund.
Cash distributions from MLPs to the Fund that exceed such Fund’s allocable share of such MLP’s net taxable income are considered a tax-deferred return of capital that will reduce the Fund’s adjusted tax basis in the equity securities of the MLP. These reductions in such Fund’s adjusted tax basis in the MLP equity securities will increase the amount of gain (or decrease the amount of loss) recognized by the Fund on a subsequent sale of the securities. The Fund will accrue deferred income taxes for any future tax liability associated with (i) that portion of MLP distributions considered to be a tax-deferred return of capital as well as (ii) capital appreciation of its investments. Upon the sale of an MLP security, the Fund may be liable for previously deferred taxes. The Fund’s accrued deferred tax liability will be reflected each day in the Fund’s NAV. Increases in deferred tax liability will decrease NAV. Conversely, decreases in deferred liability will increase NAV, but only to the extent of previously accrued deferred tax liability, i.e., no deferred tax asset will be accrued. The Fund will rely to a large extent on information provided by the MLPs, which is not necessarily timely, to estimate deferred tax liability for purposes of financial statement reporting and determining the NAV. From time to time, ALPS Advisors, Inc. will modify the estimates or assumptions related to the Fund’s deferred tax liability as new information becomes available. The Fund’s estimates regarding its deferred tax liability are made in good faith, however, the daily estimate of the Fund’s deferred tax liability used to calculate the Fund’s NAV could vary significantly from the Fund’s actual tax liability. The Fund will generally compute deferred income taxes based on the federal income tax rate applicable to corporations, currently 35%, and an assumed rate attributable to state taxes.
The Fund recognizes interest and penalties related to unrecognized tax benefits within the income tax expense line in the accompanying statement of operations. Accrued interest and penalties are included within the related tax liability line in the balance sheet. There was no such interest or penalties during the year ended November 30, 2017.
Since the Fund will be subject to taxation on its taxable income, the NAV of Fund shares will also be reduced by the accrual of any deferred tax liabilities. The Underlying Index however is calculated without any deductions for taxes. As a result, the Fund’s after tax performance could differ significantly from the Underlying Index even if the pretax performance of the Fund and the performance of the Underlying Index are closely correlated.
The Fund’s income tax expense/(benefit) consists of the following:
| Alerian MLP ETF | | Period ended November 30, 2017 |
| | | Current | | Deferred | | Total |
| Federal | | $ | – | | | $ | (373,567,028 | ) | | $ | (373,567,028 | ) |
| State | | | – | | | | (14,952,301 | ) | | | (14,952,301 | ) |
| Valuation Allowance | | | – | | | | 343,528,650 | | | | 343,528,650 | |
| Total tax expense/(benefit) | | $ | – | | | $ | (44,990,679 | ) | | $ | (44,990,679 | ) |
Deferred income taxes reflect the net tax effect of temporary differences between the carrying amount of assets and liabilities for financial reporting and tax purposes.
| Alerian Exchange Traded Funds | |
| Notes to Financial Statements | November 30, 2017 |
Components of the Fund’s deferred tax assets and liabilities are as follows:
| Alerian MLP ETF | | As of November 30, 2017 |
| Deferred tax assets: | | | | |
| Federal capital loss carryforward | | $ | 490,273,922 | |
| Federal net operating loss carryforward | | | 518,523,501 | |
| Income recognized from MLP investments | | | 403,894,784 | |
| Charitable contribution carryforward | | | 643,044 | |
| Credit for prior year minimum tax | | | 331,761 | |
| Accrued franchise taxes | | | 219,355 | |
| Valuation allowance | | | (343,528,650 | ) |
| Less Deferred tax liabilities: | | | | |
| Net unrealized gain on investment securities | | | (1,070,349,524 | ) |
| Other | | | (8,194 | ) |
| Net Deferred tax liability | | $ | – | |
Due to the activities of the MLPs that the fund is invested in, the Fund is required to pay franchise tax in certain states. Generally speaking, franchise tax expense is a tax on equity of a corporation, or base minimum fees, imposed by various jurisdictions. The amounts of the tax are estimated throughout the year based upon the Fund’s estimate of underlying activities conducted in the states and reconciled to actual amounts paid upon the filing of the tax returns for the states. These taxes are paid as either estimated tax payments, extension payments, or with the tax return filings of the various states.
The net operating loss carryforward is available to offset future taxable income. The net operating loss can be carried forward for 20 years and, accordingly, would begin to expire as of November 30, 2032. The Fund has net operating loss carryforwards for federal income tax purposes as follows:
| Alerian MLP ETF | | Period-Ended | | Amount | | Expiration |
| Federal | | 11/30/2012 | | $ | 92,112,756 | | | 11/30/2032 |
| Federal | | 11/30/2013 | | | 349,770,934 | | | 11/30/2033 |
| Federal | | 11/30/2014 | | | 64,228,395 | | | 11/30/2034 |
| Federal | | 11/30/2015 | | | 270,791,678 | | | 11/30/2035 |
| Federal | | 11/30/2016 | | | 481,506,187 | | | 11/30/2036 |
| Federal | | 11/30/2017 | | | 127,736,774 | | | 11/30/2037 |
| Total | | | | $ | 1,386,146,724 | | | |
| Alerian Exchange Traded Funds | |
| Notes to Financial Statements | November 30, 2017 |
The Fund also has state tax net operating loss carryforwards of various amounts per state. The Deferred Tax Assets associated with these state tax net operating losses are as follows:
| Alerian MLP ETF | | Period-Ended | | Amount | | Expiration |
| State | | 11/30/2012 | | $ | 2,950,477 | | | Varies by State (5-20 years) |
| State | | 11/30/2013 | | | 10,853,441 | | | Varies by State (5-20 years) |
| State | | 11/30/2014 | | | 1,931,661 | | | Varies by State (5-20 years) |
| State | | 11/30/2015 | | | 9,260,851 | | | Varies by State (5-20 years) |
| State | | 11/30/2016 | | | 14,765,924 | | | Varies by State (5-20 years) |
| State | | 11/30/2017 | | | 2,695,246 | | | Varies by State (5-20 years) |
| Total | | | | $ | 39,762,354 | | | |
The capital loss carryforward is available to offset future taxable income. The capital loss can be carried forward for 5 years and, accordingly, would begin to expire as of November 30, 2020. The Fund has net capital loss carryforwards for federal income tax purposes as follows:
| Alerian MLP ETF | | Year-Ended | | Amount | | Expiration |
| Federal | | 11/30/2015 | | $ | 504,879,549 | | | 11/30/2020 |
| Federal | | 11/30/2016 | | | 651,931,137 | | | 11/30/2021 |
| Federal | | 11/30/2017 | | | 195,667,832 | | | 11/30/2022 |
| Total | | | | $ | 1,352,478,518 | | | |
The Fund reviews the recoverability of its deferred tax assets based upon the weight of available evidence. When assessing the recoverability of its deferred tax assets, significant weight was given to the effects of potential future realized and unrealized gains on investments and the period over which these deferred tax assets can be realized. Currently, any capital losses that may be generated by the Fund in the future are eligible to be carried back up to three years and can be carried forward for five years to offset capital gains recognized by the fund in those years. Net operating losses that may be generated by the Fund in the future are eligible to be carried back up to two years and can be carried forward for 20 years to offset income generated by the Fund in those years.
Based upon the Fund’s assessment, it has determined that it is not more likely than not that its deferred tax assets will be realized through future taxable income of the appropriate character. Accordingly, a valuation allowance has been established against the Fund’s entire net deferred tax assets. The Fund will continue to assess the need for a valuation allowance in the future. Significant increases in the fair value of its portfolio of investments may change the Fund’s assessment of the recoverability of these assets and may result in a reduction of the valuation allowance against all or a portion of the Fund’s gross deferred tax assets.
Total income tax expense/(benefit) (current and deferred) differs from the amount computed by applying the federal statutory income tax rate of 35% to net investment and realized and unrealized gain/(losses) on investment before taxes as follows:
| Alerian MLP ETF | | As of November 30, 2017 |
| Income tax expense at statutory rate | | $ | (372,626,497 | ) |
| State income tax benefit (net of federal benefit) | | | (22,464,055 | ) |
| Permanent differences, net | | | (773,176 | ) |
| Change in estimated state deferral rate | | | 3,805,343 | |
| Other | | | 3,539,056 | |
| Valuation allowance | | | 343,528,650 | |
| Net income tax expense | | $ | (44,990,679 | ) |
| Alerian Exchange Traded Funds | |
| Notes to Financial Statements | November 30, 2017 |
The following is a tabular reconciliation of the total amounts of unrecognized tax benefits:
| Alerian MLP ETF | | | Inception to November 30, 2017 | |
| Unrecognized tax benefit - Beginning | | $ | – | |
| Gross increases - tax positions in prior period | | | – | |
| Gross decreases - tax positions in prior period | | | – | |
| Gross increases - tax positions in current period | | | – | |
| Settlement | | | – | |
| Lapse of statute of limitations | | | – | |
| Unrecognized tax benefit - Ending | | $ | – | |
The Fund recognizes interest accrued related to unrecognized tax benefits and penalties as income tax expense. For the period from inception to November 30, 2017, the Fund had no accrued penalties or interest.
The Fund recognizes the tax benefits of uncertain tax positions only where the position is “more likely than not" to be sustained assuming examination by tax authorities. Management has analyzed the Fund's tax positions and has concluded that no liability for unrecognized tax benefits should be recorded related to uncertain tax positions taken on U.S. tax returns and state tax returns filed since inception of the fund. Tax periods ended November 30, 2014 through November 30, 2017 remain subject to examination by tax authorities in the United States. Due to the nature of the Fund's investments, the Fund may be required to file income tax returns in several states. The Fund is not aware of any tax positions for which it is reasonably possible that the total amounts of unrecognized tax benefits will change materially in the next 12 months.
Alerian Energy Infrastructure ETF
The timing and character of income and capital gain distributions are determined in accordance with income tax regulations, which may differ from U.S. GAAP. Reclassifications are made to the Fund’s capital accounts for permanent tax differences to reflect income and gains available for distribution (or available capital loss carryforwards) under income tax regulations. The amounts and characteristics of tax basis distributions and composition of distributable earnings/(accumulated losses) are finalized at fiscal year-end; accordingly, tax basis balances have not been determined as of November 30, 2017.
No provision for income taxes is included in the accompanying financial statements, as the Alerian Energy Infrastructure ETF intends to distribute to shareholders all taxable investment income and realized gains and otherwise comply with Subchapter M of the Internal Revenue Code of 1986, as amended, applicable to regulated investment companies. The Alerian Energy Infrastructure ETF evaluates tax positions taken (or expected to be taken) in the course of preparing the Fund’s tax returns to determine whether these positions meet a “more-likely-than-not” standard that, based on the technical merits, have a more than fifty percent likelihood of being sustained by a taxing authority upon examination. A tax position that meets the “more-likely-than-not” recognition threshold is measured to determine the amount of benefit to recognize in the financial statements.
As of and during the year ended November 30, 2017, the Alerian Energy Infrastructure ETF did not have a liability for any unrecognized tax benefits. The Alerian Energy Infrastructure ETF files U.S. federal, state, and local tax returns as required. The Fund’s tax returns are subject to examination by the relevant tax authorities until expiration of the applicable statute of limitations, which is generally three years after the filing of the tax return, but may extend to four years in certain jurisdictions. Tax returns for open years have incorporated no uncertain tax positions that require a provision for income taxes.
For the year ended November 30, 2017, permanent book and tax differences resulting primarily from differing treatment of investments in partnerships were identified and reclassified among components of the Fund’s net assets as follows:
| Fund | | Accumulated Net Investment Gain/(Loss) | | Accumulated Net Realized Gain/(Loss) on Investments | | Paid-in Capital |
| Alerian Energy Infrastructure ETF | | $ | (647,020 | ) | | $ | 281,603 | | | $ | 365,417 | |
At November 30, 2017, the Fund had available for tax purposes unused capital loss carryforwards as follows:
| | | Short-Term | | Long-Term |
| Alerian Energy Infrastructure ETF | | $ | 618,957 | | | $ | 172,110 | |
Capital loss carryovers used during the year ended November 30, 2017 were $153,434.
| Alerian Exchange Traded Funds | |
| Notes to Financial Statements | November 30, 2017 |
The tax character of the distributions paid during the fiscal years ended November 30, 2017 and November 30, 2016 were as follows:
| | | Ordinary Income | | Long-Term Capital Gain | | Return of Capital |
| November 30, 2017 | | | | | | |
| Alerian Energy Infrastructure ETF | | $ | 671,029 | | | $ | – | | | $ | 376,837 | |
| November 30, 2016 | | | | | | | | | | | | |
| Alerian Energy Infrastructure ETF | | $ | 405,322 | | | | – | | | $ | 88,512 | |
As of November 30, 2017, the components of distributable earnings on a tax basis were as follows:
| | | Alerian Energy Infrastructure ETF |
| Accumulated net realized loss on investments | | $ | (791,067 | ) |
| Net unrealized depreciation on investments | | | (3,629,426 | ) |
| Other accumulated losses | | | (672,920 | ) |
| Total | | $ | (5,093,413 | ) |
As of November 30, 2017, the costs of investments for federal income tax purposes and accumulated net unrealized appreciation/(depreciation) on investments were as follows:
| | | Alerian MLP ETF | | Alerian Energy Infrastructure ETF |
| Cost of investments for income tax purposes | | $ | 7,548,902,738 | | | $ | 46,011,521 | |
| Gross appreciation (excess of value over tax cost) | | $ | 2,779,677,351 | | | $ | 1,786,397 | |
| Gross depreciation (excess of tax cost over value) | | | (916,111,349 | ) | | | (5,415,256 | ) |
| Net depreciation of foreign currency | | | – | | | | (567 | ) |
| Net unrealized appreciation/(depreciation) | | $ | 1,863,566,002 | | | $ | (3,629,426 | ) |
The difference between cost amounts for financial statement purposes is due primarily to the recognition of pass-through income from a Fund’s investments in master limited partnerships and wash sales.
G. Lending of Portfolio Securities
The Alerian Energy Infrastructure ETF (the “Fund”) has entered into a securities lending agreement with State Street Bank & Trust Co. (“SSB”), the Fund’s lending agent. The Fund may lend its portfolio securities only to borrowers that are approved by SSB. The Fund will limit such lending to not more than 33 1/3% of the value of its total assets. The Fund’s securities held at SSB as custodian shall be available to be lent except those securities the Fund or ALPS Advisors, Inc. specifically identifies in writing as not being available for lending. The borrower pledges and maintains with the Fund collateral consisting of cash (U.S. Dollars only), securities issued or guaranteed by the U.S. government or its agencies or instrumentalities, and cash equivalents (including irrevocable bank letters of credit) issued by a person other than the borrower or an affiliate of the borrower. The initial collateral received by the Fund is required to have a value of no less than 102% of the market value of the loaned securities for U.S equity securities and a value of no less than 105% of the market value for non-U.S. equity securities. The collateral is maintained thereafter, at a market value equal to not less than 102% of the current value of the U.S. equity securities on loan and not less than 105% of the current value of the non- U.S. equity securities on loan. The market value of the loaned securities is determined at the close of each business day and any additional required collateral is delivered to the Fund on the next business day. During the term of the loan, the Fund is entitled to all distributions made on or in respect of the loaned securities. Loans of securities are terminable at any time and the borrower, after notice, is required to return borrowed securities within the customary time period for settlement of securities transactions. As of November 30, 2017, the Fund had no securities on loan.
Any cash collateral received is reinvested in a money market fund managed by SSB as disclosed in the Fund’s Schedule of Investments and is reflected in the Statements of Assets and Liabilities as a payable for collateral upon return of securities loaned. Non-cash collateral, in the form of securities issued or guaranteed by the U.S. government or its agencies or instrumentalities, is not disclosed in the Fund’s Statements of Assets and Liabilities as it is held by the lending agent on behalf of the Fund, and the Fund does not have the ability to re-hypothecate these securities. Income earned by the Fund from securities lending activity is disclosed in the Statement of Operations.
| Alerian Exchange Traded Funds | |
| Notes to Financial Statements | November 30, 2017 |
The risks of securities lending include the risk that the borrower may not provide additional collateral when required or may not return the securities when due. To mitigate these risks, the Fund benefits from a borrower default indemnity provided by SSB. SSB’s indemnity allows for full replacement of securities lent wherein SSB will purchase the unreturned loaned securities on the open market by applying the proceeds of the collateral, or to the extent such proceeds are insufficient or the collateral is unavailable, SSB will purchase the unreturned loan securities at SSB’s expense. However, the Fund could suffer a loss if the value of the investments purchased with cash collateral falls below the value of the cash collateral received.
3. INVESTMENT ADVISORY FEE AND OTHER AFFILIATED TRANSACTIONS
ALPS Advisors, Inc. (the “Adviser”) acts as each Fund's investment adviser pursuant to advisory agreements with the Trust on behalf of each Fund (the “Advisory Agreements”). Pursuant to the Advisory Agreements, each Fund pays the Adviser a unitary fee for the services and facilities it provides payable on a monthly basis as a percentage of the relevant Fund's average daily net assets as set out below.
| Fund | | Advisory Fee |
| Alerian MLP ETF | 0.85% | up to and including $10 billion |
| | 0.80% | greater than $10 billion up to and including $15 billion |
| | 0.755% | greater than $15 billion up to and including $20 billion |
| | 0.715% | greater than $20 billion |
| | | |
| Alerian Energy Infrastructure ETF | 0.65% | |
Out of the unitary management fees, the Adviser pays substantially all expenses of the Funds, including the cost of transfer agency, custody, fund administration, legal, audit, independent trustees and other services, except for taxes, interest expenses, distribution fees or expenses, brokerage expenses, and extraordinary expenses such as litigation, and other expenses not incurred in the ordinary course of the each Fund's business. The Adviser’s unitary management fee is designed to pay substantially all the Funds’ expenses and to compensate the Adviser for providing services for each Fund.
ALPS Fund Services, Inc., an affiliate of the Adviser, is the administrator of the Funds.
Each Trustee who is not an officer or employee of the Adviser, any sub-adviser or any of their affiliates (“Independent Trustees”) receives (1) a quarterly retainer of $5,000, (2) a per meeting fee for regularly scheduled meetings of $3,750, (3) $1,500 for any special meeting held outside of a regularly scheduled board meeting, and (4) reimbursement for all reasonable out-of-pocket expenses relating to attendance at meetings.
4. PURCHASES AND SALES OF SECURITIES
For the year ended November 30, 2017, the cost of purchases and proceeds from sales of investment securities, excluding short-term investments and in-kind transactions, were as follows:
| Fund | | Purchases | | Sales |
| Alerian MLP ETF | | $ | 2,334,558,507 | | | $ | 3,497,052,235 | |
| Alerian Energy Infrastructure ETF | | | 12,395,585 | | | | 12,262,040 | |
For the year ended November 30, 2017, the cost of in-kind purchases and proceeds from in-kind sales were as follows:
| Fund | | Purchases | | Sales |
| Alerian MLP ETF | | $ | 2,857,496,930 | | | $ | – | |
| Alerian Energy Infrastructure ETF | | | 28,321,766 | | | | 2,097,260 | |
For the year ended November 30, 2017, the Alerian Energy Infrastructure ETF had in-kind net realized gain of $97,772.
Gains on in-kind transactions are not considered taxable for federal income tax purposes and losses on in kind transactions are also not deductible for tax purposes.
| Alerian Exchange Traded Funds | |
| Notes to Financial Statements | November 30, 2017 |
5. MASTER LIMITED PARTNERSHIPS
MLPs are publicly traded partnerships engaged in, among other things, the transportation, storage and processing of minerals and natural resources, and are treated as partnerships for U.S. federal income tax purposes. By confining their operations to these specific activities, their interests, or units, are able to trade on public securities exchanges exactly like the shares of a corporation, without entity level taxation. To qualify as a MLP and to not be taxed as a corporation, a partnership must receive at least 90% of its income from qualifying sources as set forth in Section 7704(d) of the Internal Revenue Code of 1986, as amended (the “Code”). These qualifying sources include, among other things, natural resource-based activities such as the processing, transportation and storage of mineral or natural resources. MLPs generally have two classes of owners, the general partner and limited partners. The general partner of an MLP is typically owned by a major energy company, an investment fund, the direct management of the MLP, or is an entity owned by one or more of such parties. The general partner may be structured as a private or publicly traded corporation or other entity. The general partner typically controls the operations and management of the MLP through an up to 2% equity interest in the MLP plus, in many cases, ownership of common units and subordinated units. Limited partners typically own the remainder of the partnership, through ownership of common units, and have a limited role in the partnership’s operations and management.
MLPs are typically structured such that common units and general partner interests have first priority to receive quarterly cash distributions up to an established minimum amount (“minimum quarterly distributions” or “MQD”). Common and general partner interests also accrue arrearages in distributions to the extent the MQD is not paid. Once common and general partner interests have been paid, subordinated units receive distributions of up to the MQD; however, subordinated units do not accrue arrearages. Distributable cash in excess of the MQD is distributed to both common and subordinated units and generally on a pro rata basis. The general partner is also eligible to receive incentive distributions if the general partner operates the business in a manner which results in distributions paid per common unit surpassing specified target levels. As the general partner increases cash distributions to the limited partners, the general partner receives an increasingly higher percentage of the incremental cash distributions.
6. CAPITAL SHARE TRANSACTIONS
Shares are created and redeemed by each Fund only in Creation Unit size aggregations of 50,000 Shares. Only broker-dealers or large institutional investors with creation and redemption agreements called Authorized Participants (“AP”) are permitted to purchase or redeem Creation Units from the Funds. Such transactions are generally permitted on an in-kind basis, with a balancing cash component to equate the transaction to the NAV per unit of each Fund on the transaction date. Cash may be substituted equivalent to the value of certain securities generally when they are not available in sufficient quantity for delivery, not eligible for trading by the AP or as a result of other market circumstances.
7. RELATED PARTY TRANSACTIONS
The Fund engaged in cross trades between other funds in the Trust during the year ended November 30, 2017 pursuant to Rule 17a-7 under the 1940 Act. Cross trading is the buying or selling of portfolio securities between funds to which the Adviser serves as the investment adviser. The Board previously adopted procedures that apply to transactions between the Funds of the Trust pursuant to Rule 17a-7. These transactions related to cross trades during the period complied with the requirements set forth by Rule 17a-7 and the Trust’s procedures.
Transactions related to cross trades during the year ended November 30, 2017, were as follows:
| Fund | | Purchase cost paid | | Sale proceeds received | | Realized gain/ (loss) on sales |
| Alerian MLP ETF | | $ | 500,144 | | | $ | 1,391,769 | | | $ | 20,029 | |
| Alerian Energy Infrastructure ETF | | | 429,596 | | | | 155,993 | | | | 5,964 | |
| Alerian Exchange Traded Funds | |
| Notes to Financial Statements | November 30, 2017 |
8. AFFILIATED COMPANIES
As defined by the Investment Company Act of 1940, an affiliated person, including an affiliated company, is one in which a Fund owns 5% or more of the outstanding voting securities, or a company which is under common ownership or control with the Fund.
For the year ended November 30, 2017, the Alerian MLP ETF held shares in the following affiliates, as defined by the Investment Company Act of 1940.
| Security Name | | Share Balance Balance as of November 30, 2016 | | Purchases | | Purchases In-Kind | | Sales | | Corporate Actions | | Share Balance as of November 30, 2017 | | Market Value as of November 30, 2017 | | Dividends* | | Change in Unrealized Gain (Loss) | | Realized Gain/(Loss) |
| Master Limited Partnerships | | | | | | | | | | | | | | | | | | | | | | | | | | | | | | | | | | |
| Buckeye Partners LP | | | 8,925,623 | | | | 1,553,807 | | | | 2,907,568 | | | | (1,915,643 | ) | | | – | | | | 11,471,355 | | | $ | 526,879,335 | | | $ | – | | | $ | (157,465,362 | ) | | $ | (4,123,543 | ) |
| DCP Midstream Partners LP | | | 6,171,411 | | | | 848,060 | | | | 1,885,065 | | | | (1,523,657 | ) | | | – | | | | 7,380,879 | | | | 259,364,088 | | | | – | | | | 23,700,688 | | | | (1,309,654 | ) |
| Dominion Midstream Partners LP | | | – | | | | 3,865,411 | | | | 217,148 | | | | (137,650 | ) | | | – | | | | 3,944,909 | | | | 126,828,824 | | | | – | | | | 9,070,121 | | | | (121,902 | ) |
| Enbridge Energy Partners LP | | | 14,705,996 | | | | 2,020,830 | | | | 4,491,689 | | | | (3,638,890 | ) | | | – | | | | 17,579,625 | | | | 257,014,118 | | | | – | | | | (128,280,461 | ) | | | (1,745,110 | ) |
| EQT Midstream Partners LP | | | 4,001,906 | | | | 549,375 | | | | 1,221,653 | | | | (991,662 | ) | | | – | | | | 4,781,272 | | | | 328,090,885 | | | | – | | | | (8,174,313 | ) | | | (1,888,217 | ) |
| Genesis Energy LP | | | 7,014,426 | | | | 1,164,391 | | | | 2,190,865 | | | | (1,607,093 | ) | | | – | | | | 8,762,589 | | | | 188,132,786 | | | | – | | | | (90,149,737 | ) | | | (1,300,094 | ) |
| Magellan Midstream Partners LP | | | 13,629,760 | | | | 12,532 | | | | 4,038,553 | | | | (2,628,089 | ) | | | – | | | | 15,052,756 | | | | 1,008,534,652 | | | | – | | | | 16,013,517 | | | | (5,962,987 | ) |
| MPLX LP | | | 17,376,799 | | | | 3,167,693 | | | | 5,686,125 | | | | (2,797,055 | ) | | | – | | | | 23,433,562 | | | | 840,327,534 | | | | – | | | | 105,352,210 | | | | (2,296,455 | ) |
| NuStar Energy LP | | | 4,392,697 | | | | 1,601,199 | | | | 1,504,282 | | | | (1,044,414 | ) | | | – | | | | 6,453,764 | | | | 187,546,382 | | | | – | | | | (92,985,668 | ) | | | (1,030,896 | ) |
| Rice Midstream Partners LP | | | – | | | | 5,782,755 | | | | 949,180 | | | | (750,842 | ) | | | – | | | | 5,981,093 | | | | 124,586,167 | | | | – | | | | (19,377,954 | ) | | | (48,850 | ) |
| TC PipeLines LP | | | 3,329,485 | | | | 483,521 | | | | 1,064,273 | | | | (623,348 | ) | | | – | | | | 4,253,931 | | | | 216,142,234 | | | | – | | | | 1,008,709 | | | | (638,116 | ) |
| Tallgrass Energy Partners LP | | | 2,880,750 | | | | 571,168 | | | | 934,201 | | | | (550,195 | ) | | | – | | | | 3,835,924 | | | | 168,473,782 | | | | – | | | | (2,522,512 | ) | | | (616,549 | ) |
| Western Gas Partners LP | | | 5,309,295 | | | | 2,133,067 | | | | 1,886,787 | | | | (1,148,073 | ) | | | – | | | | 8,181,076 | | | | 366,675,826 | | | | – | | | | (76,475,129 | ) | | | (608,553 | ) |
| | | | | | | | | | | | | | | | | | | | | | | | | | | $ | 4,598,596,613 | | | $ | – | | | $ | (420,285,891 | ) | | $ | (21,690,926 | ) |
Investments no longer affiliated as of November 30, 2017
| Energy Transfer Partners LP(1) | | | 39,694,657 | | | | 7,098,439 | | | | 13,481,762 | | | | (16,470,687 | ) | | | 9,534,767 | | | | 53,338,938 | | | $ | 885,959,760 | | | $ | – | | | | (257,733,927 | ) | | $ | (5,402,865 | ) |
| NGL Energy Partners LP | | | 6,573,790 | | | | 1,559,411 | | | | 1,715,048 | | | | (9,848,249 | ) | | | – | | | | – | | | | – | | | | – | | | | (893,481 | ) | | | (64,511,862 | ) |
| ONEOK Partners LP(2) | | | 10,785,060 | | | | 1,273,033 | | | | 1,766,484 | | | | (13,638,146 | ) | | | (186,431 | ) | | | – | | | | – | | | | – | | | | (18,837,033 | ) | | | 122,511,623 | |
| Plains All American Pipeline LP | | | 25,976,325 | | | | 4,153,141 | | | | 8,522,308 | | | | (4,510,406 | ) | | | – | | | | 34,141,368 | | | | 665,756,676 | | | | – | | | | (359,303,751 | ) | | | (4,170,479 | ) |
| Shell Midstream Partners LP | | | 6,019,969 | | | | 827,235 | | | | 1,838,961 | | | | (1,487,022 | ) | | | – | | | | 7,199,143 | | | | 194,736,818 | | | | – | | | | 749,506 | | | | (1,345,858 | ) |
| | | | | | | | | | | | | | | | | | | | | | | | | | | $ | 1,746,453,254 | | | $ | – | | | $ | (636,018,686 | ) | | $ | 47,080,559 | |
| | | | | | | | | | | | | | | | | | | | | | | | | | | | | | | | | | | | | | | | | |
| GRAND TOTAL | | | | | | | | | | | | | | | | | | | | | | | $ | 6,345,049,867 | | | $ | – | | | $ | (1,056,304,577 | ) | | $ | 25,389,633 | |
| * | 100% of the Income received was estimated as Return of Capital. |
| (1) | On 05/01/2017, Sunoco Logistics Partners LP (SXL) merged with Energy Transfer Partners LP (ETP). Sunoco Logistics was the surviving entity and changed its name to Energy Transfer Partners LP as part of the completion of the merger. At the effective time of the merger, each ETP common unit converted into the right to receive 1.5 SXL common units. The December 1, 2016 share balances represent the combined SXL and ETP shares held as of that date. |
| (2) | Name changed to ONEOK, Inc. |
| Alerian Exchange Traded Funds | |
| Notes to Financial Statements | November 30, 2017 |
9. SUBSEQUENT EVENTS
On December 22, 2017, President Trump signed the Tax Cut and Jobs Act into law. Management is evaluating the impact this tax reform will have on the Funds, including any impact to the financial statements and accompanying notes to financial statements. As the law was enacted subsequent to the year ended November 30, 2017, the law will not impact the amounts recorded in these financial statements. It is expected that the new law will have an impact on the deferred tax position of Alerian MLP ETF during the period immediately following enactment; however, management continues to believe that any revised amounts to deferred tax assets will be offset by a valuation allowance.
| Alerian Exchange Traded Funds | |
| Additional Information | November 30, 2017 (Unaudited) |
PROXY VOTING RECORDS, POLICIES AND PROCEDURES
Information regarding how each Fund voted proxies relating to portfolio securities during the most recent 12-month period ended June 30 and a description of the Funds’ proxy voting policies and procedures used in determining how to vote for proxies are available without charge on the SEC’s website at www.sec.gov and upon request, by calling (toll-free) 1-866-675-2639.
PORTFOLIO HOLDINGS
The Trust is required to disclose, after its first and third fiscal quarters, the complete schedule of each Fund’s portfolio holdings with the SEC on Form N-Q. Form N-Q for each Fund will be available on the SEC’s website at www.sec.gov. Each Fund’s Form N-Q may also be reviewed and copied at the SEC’s Public Reference Room in Washington, D.C. and information on the operation of the Public Reference Room may be obtained by calling 1-800-SEC-0330. Each Fund’s Form N-Q will be available without charge, upon request, by calling (toll-free) 1-866-675-2639 or by writing to ALPS ETF Trust at 1290 Broadway, Suite 1100, Denver, Colorado 80203.
TAX INFORMATION
The Fund designates the following for federal income tax purposes for distributions made during the calendar year ended December 31, 2016:
| | Qualified Dividend Income | Dividend Received Deduction |
| Alerian Energy Infrastructure ETF | 100.00% | 64.82% |
In early 2017, if applicable, shareholders of record received this information for the distribution paid to them by the Fund during the calendar year 2016 via Form 1099. The Fund will notify shareholders in early 2018 of amounts paid to them by the Fund, if any, during the calendar year 2017.
LICENSING AGREEMENTS
Alerian (the “Licensor”) has entered into an index licensing agreement with ALPS Advisors Inc. (the “Advisor”) with respect to each of the Alerian MLP ETF and the Alerian Energy Infrastructure ETF, to allow the Adviser’s use of AMZI and AMEI. The following disclosure relates to the Licensor:
Alerian is the designer of the construction and methodology for the underlying index (each an “Underlying Index”) for each of the Alerian MLP ETF and the Alerian Energy Infrastructure ETF (each a “Fund” and collectively, the “Funds”). “Alerian,” “Alerian MLP Infrastructure Index,” “Alerian Energy Infrastructure Index,” “Alerian Index Series” and “AMZI” are service marks or trademarks of Alerian. Alerian acts as brand licensor for each Underlying Index. Alerian is not responsible for the descriptions of either Underlying Index or the Funds that appear herein. Alerian is not affiliated with the Trust, the Adviser or the Distributor.
Neither Fund is issued, sponsored, endorsed, sold or promoted by Alerian (“Licensor”) or its affiliates. Licensor makes no representation or warranty, express or implied, to the owners of the Fund or any member of the public regarding the advisability of investing in securities generally or in the Fund particularly or the ability of the Alerian MLP Infrastructure Index (“Index”) to track general market performance. Licensor’s only relationship to the Licensee is the licensing of the Index which is determined, composed and calculated by Licensor without regard to the Licensee or the Fund. Licensor has no obligation to take the needs of the Licensee or the owners of the Fund into consideration in determining, composing or calculating the Index. Licensor is not responsible for and has not participated in the determination of the timing of, prices at, or quantities of the Fund to be issued or in the determination or calculation of the equation by which the Fund is to be converted into cash. Licensor has no obligation or liability in connection with the issuance, administration, marketing or trading of either Fund and is not responsible for and has not participated in the determination of pricing or the timing of the issuance or sale of the Shares of either Fund or in the determination or calculation of the NAV of the relevant Fund. Alerian MLP Infrastructure Index, Alerian MLP Infrastructure Total Return Index, AMZI and AMZIX are trademarks of GKD Index Partners, LLC and their general use is granted under a license from GKD Index Partners, LLC.
LICENSOR DOES NOT GUARANTEE THE QUALITY, ACCURACY AND/OR THE COMPLETENESS OF THE INDEX OR ANY DATA INCLUDED THEREIN AND SHALL HAVE NO LIABILITY FOR ERRORS OR OMISSIONS OF ANY KIND RELATED TO THE INDEX OR DATA. LICENSOR MAKES NO WARRANTY, EXPRESS OR IMPLIED, AS TO RESULTS TO BE OBTAINED BY LICENSEE, OWNERS OF THE FUND, OR ANY OTHER PERSON OR ENTITY FROM THE USE OF THE INDEX OR ANY DATA INCLUDED THEREIN IN CONNECTION WITH THE RIGHTS LICENSED TO LICENSEE OR FOR ANY OTHER USE. LICENSOR MAKES NO EXPRESS OR IMPLIED WARRANTIES, AND HEREBY EXPRESSLY DISCLAIMS ALL WARRANTIES OF MERCHANTABILITY OR FITNESS FOR A PARTICULAR PURPOSE OR USE WITH RESPECT TO THE INDEX OR ANY DATA INCLUDED THEREIN. WITHOUT LIMITING ANY OF THE FOREGOING, IN NO EVENT SHALL LICENSOR HAVE ANY LIABILITY FOR ANY SPECIAL, PUNITIVE, INDIRECT, OR CONSEQUENTIAL DAMAGES (INCLUDING LOST PROFITS), EVEN IF NOTIFIED OF THE POSSIBILITY OF SUCH DAMAGES.
| Alerian Exchange Traded Funds | |
| Additional Information | November 30, 2017 (Unaudited) |
The Adviser does not guarantee the accuracy and/or the completeness of either Underlying Index or any data included therein, and the Adviser shall have no liability for any errors, omissions or interruptions therein. The Adviser makes no warranty, express or implied, as to results to be obtained by either Fund, owners of the Shares of the relevant Fund or any other person or entity from the use of either Underlying Index or any data included therein. The Adviser makes no express or implied warranties, and expressly disclaims all warranties of merchantability or fitness for a particular purpose or use with respect to either Underlying Index or any data included therein. Without limiting any of the foregoing, in no event shall the Adviser have any liability for any special, punitive, direct, indirect, or consequential damages (including lost profits) arising out of matters relating to the use of either Underlying Index, even if notified of the possibility of such damages.
(Applicable to the Alerian Energy Infrastructure ETF only)
The Underlying Index is the exclusive property of GKD Index Partners LLC d/b/a Alerian, which has contracted with S&P Opco, LLC (a subsidiary of S&P Dow Jones Indices LLC) (“S&P Dow Jones Indices”) to calculate and maintain the Underlying Index. S&P® is a registered trademark of Standard & Poor’s Financial Services LLC (“SPFS”); Dow Jones® is a registered trademark of Dow Jones Trademark Holdings LLC (“Dow Jones”); and these trademarks have been licensed to S&P Dow Jones Indices. “Calculated by S&P Dow Jones Indices” and its related stylized mark(s) have been licensed for use by Alerian.
The Fund is not sponsored, endorsed, sold or promoted by S&P Dow Jones Indices, SPFS, Dow Jones or any of their affiliates (collectively, “S&P Dow Jones Indices Entities”). S&P Dow Jones Indices Entities do not make any representation or warranty, express or implied, to the owners of the Fund or any member of the public regarding the advisability of investing in securities generally or in the Fund particularly or the ability of the Underlying Index to track general market performance. S&P Dow Jones Indices Entities only relationship to Alerian with respect to the Underlying Index is the licensing of certain trademarks, service marks and trade names of S&P Dow Jones Indices Entities and for the providing of calculation and maintenance services related to the Underlying Index. S&P Dow Jones Indices Entities are not responsible for and have not participated in the determination of the prices and amount of the Fund or the timing of the issuance or sale of the Fund or in the determination or calculation of the equation by which the Fund is to be converted into cash. S&P Dow Jones Indices Entities have no obligation or liability in connection with the administration, marketing or trading of the Fund. S&P Dow Jones Indices LLC is not an investment advisor. Inclusion of a security within the Underlying Index is not a recommendation by S&P Dow Jones Indices Entities to buy, sell, or hold such security, nor is it considered to be investment advice.
S&P DOW JONES INDICES ENTITIES DO NOT GUARANTEE THE ADEQUACY, ACCURACY, TIMELINESS AND/OR THE COMPLETENESS OF THE UNDERLYING INDEX OR ANY DATA RELATED THERETO OR ANY COMMUNICATION, INCLUDING BUT NOT LIMITED TO, ORAL OR WRITTEN COMMUNICATION (INCLUDING ELECTRONIC COMMUNICATIONS) WITH RESPECT THERETO. S&P DOW JONES INDICES ENTITIES SHALL NOT BE SUBJECT TO ANY DAMAGES OR LIABILITY FOR ANY ERRORS, OMISSIONS, OR DELAYS THEREIN. S&P DOW JONES INDICES ENTITIES MAKE NO EXPRESS OR IMPLIED WARRANTIES, AND EXPRESSLY DISCLAIMS ALL WARRANTIES, OF MERCHANTABILITY OR FITNESS FOR A PARTICULAR PURPOSE OR USE OR AS TO RESULTS TO BE OBTAINED BY ALERIAN, OWNERS OF THE FUND, OR ANY OTHER PERSON OR ENTITY FROM THE USE OF THE UNDERLYING INDEX OR WITH RESPECT TO ANY DATA RELATED THERETO. WITHOUT LIMITING ANY OF THE FOREGOING, IN NO EVENT WHATSOEVER SHALL S&P DOW JONES INDICES ENTITIES BE LIABLE FOR ANY INDIRECT, SPECIAL, INCIDENTAL, PUNITIVE, OR CONSEQUENTIAL DAMAGES INCLUDING BUT NOT LIMITED TO, LOSS OF PROFITS, TRADING LOSSES, LOST TIME OR GOODWILL, EVEN IF THEY HAVE BEEN ADVISED OF THE POSSIBILITY OF SUCH DAMAGES, WHETHER IN CONTRACT, TORT, STRICT LIABILITY, OR OTHERWISE.
| Alerian Exchange Traded Funds | |
| Board Considerations Regarding Approval of Investment Advisory Agreements | November 30, 2017 (Unaudited) |
At an in-person meeting held on June 8, 2017, the Board of Trustees of the Trust (the “Board” or the “Trustees”), including the Trustees who are not “interested persons” of the Trust within the meaning of the 1940 Act, as amended (the “Independent Trustees”), evaluated a proposal to approve the continuance of the Investment Advisory Agreements between the Trust and ALPS Advisors, Inc. (the “Adviser” or “AAI”) with respect to the Alerian MLP ETF (“AMLP”) and the Alerian Energy Infrastructure ETF (“ENFR”) (each “a Fund” and collectively the “Funds”). The Independent Trustees also met separately to consider the Investment Advisory Agreement.
In evaluating the Investment Advisory Agreements with respect to each Fund, the Independent Trustees considered various factors, including (i) the nature, extent and quality of the services provided by AAI with respect to the applicable Fund under the Investment Advisory Agreements; (ii) the advisory fees and other expenses paid by the Fund compared to those of similar funds managed by other investment advisers; (iii) the costs of the services provided to the Fund by AAI and the profits realized by AAI and its affiliates from its relationship to the Fund; (iv) the extent to which economies of scale have been or would be realized if and as the assets of the Fund grow and whether fees reflect the economies of scale for the benefit of shareholders; and (v) any additional benefits and other considerations.
With respect to the nature, extent and quality of the services provided by AAI under the Investment Advisory Agreements, the Independent Trustees considered and reviewed information concerning the services provided under the Investment Advisory Agreements, the investment parameters of the index of each Fund, financial information regarding AAI and its parent company, information describing AAI’s current organization and the background and experience of the persons responsible for the day-to-day management of the Funds.
The Independent Trustees reviewed information on the performance of each Fund and its applicable benchmark. The Independent Trustees also evaluated the correlation and tracking error between each underlying index and its corresponding Fund’s performance. Based on their review, the Independent Trustees found that the nature and extent of services provided to each Fund under the Investment Advisory Agreements was appropriate and that the quality was satisfactory.
The Independent Trustees noted that the advisory fees for each Fund were unitary fees pursuant to which AAI assumes all expenses of the Funds (including the cost of transfer agency, custody, fund administration, legal, audit and other services) other than the payments under the Investment Advisory Agreement, brokerage expenses, taxes, interest, litigation expenses and other extraordinary expenses.
With respect to advisory fee rates, the Independent Trustees noted the following:
The net advisory fee rate for each Fund is higher than the median of its Broadridge expense group. The Funds’ respective expense ratios, however, are (i) in the case of ENFR, slightly above the median of its Broadridge expense group and (ii) in the case of AMLP, higher than the median of its Broadridge expense group.
With respect to AMLP, the Independent Trustees took into account, among other things, supplemental information provided by the Adviser showing AMLP’s total expenses were in line with the total expenses of peer groups deemed by the Adviser to be more comparable, including peer groups comprised of (i) the master limited partnership (“MLP”) asset class as a whole and (ii) exchange-traded products focused solely on MLP investments. The Independent Trustees also considered the brand recognition of AMLP’s index provider, the additional costs and expenses incurred by AAI in managing and administering the Fund and that AMLP’s investment advisory fee schedule included breakpoints.
Based on the foregoing, and the other information available to them, the Independent Trustees concluded that the advisory fee rate for each of the Funds was reasonable under the circumstances and in light of the quality of the services provided.
The Independent Trustees considered other benefits available to AAI because of its relationship with the Funds and concluded that the advisory fees were reasonable taking into account any such benefits.
The Independent Trustees also considered with respect to each Fund the information provided by AAI about the costs and profitability of AAI with respect to each of the Funds. The Independent Trustees reviewed and noted the relatively small size of ENFR and concluded that AAI was not realizing any economies of scale. They noted, however, that with respect to AMLP, AAI has realized some economies of scale. With respect to AMLP, the Independent Trustees noted that while the Fund has experienced growth over the prior year, the Fund’s asset levels have not yet recovered to its historic highs. The Independent Trustees determined that they would continue to evaluate whether further economies of scale have been achieved on an ongoing basis.
With respect to AMLP, the Independent Trustees considered, among other things the brand recognition of AMLP’s index provider as well as the trading volumes of the Fund and the narrow trading spreads. The Independent Trustees considered the breakpoint schedule adopted previously and whether the breakpoints would benefit shareholders and appropriately reflect economies of scale achieved by AAI with respect to AMLP should AMLP’s assets increase, noting that AMLP’s assets were still below historical highs. Upon discussion, the Independent Trustees determined that the advisory fee rate for the Fund reflects an appropriate sharing of economies of scale.
| Alerian Exchange Traded Funds | |
| Board Considerations Regarding Approval of Investment Advisory Agreements | November 30, 2017 (Unaudited) |
In voting to renew each Investment Advisory Agreement, the Independent Trustees concluded that the terms of each Investment Advisory Agreement are reasonable and fair in light of the services to be performed, the fees paid by certain other funds, expenses to be incurred and such other matters as the Independent Trustees considered relevant in the exercise of their reasonable business judgment. The Independent Trustees did not identify any single factor or group of factors as all important or controlling and considered all factors together.
Alerian Exchange Traded Funds
| Trustees & Officers | November 30, 2017 (Unaudited) |
The general supervision of the duties performed by the Adviser for the Fund under the Investment Advisory Agreement is the responsibility of the Board of Trustees. The Trust currently has four Trustees. Three Trustees have no affiliation or business connection with the Adviser or any of its affiliated persons and do not own any stock or other securities issued by the Adviser. These are the non interested or independent Trustees ( Independent Trustees ). The other Trustee (the Interested Trustee ) is affiliated with the Adviser.
The Independent Trustees of the Trust, their term of office and length of time served, their principal business occupations during the past five years, the number of portfolios in the Fund Complex overseen by each Independent Trustee, and other directorships, if any, held by the Trustee are shown below.
INDEPENDENT TRUSTEES
| Name, Address & Year of Birth* | Position(s) Held with Trust | Term of Office and Length of Time Served** | Principal Occupation(s) During Past 5 Years | Number of Portfolios in Fund Complex Overseen by Trustees*** | Other Directorships Held by Trustees |
| Mary K. Anstine, 1940 | Trustee | Since March 2008 | Ms. Anstine was President/Chief Executive Officer of HealthONE Alliance, Denver, Colorado, and former Executive Vice President of First Interstate Bank of Denver. Ms. Anstine is also Trustee/Director of AV Hunter Trust and Colorado Uplift Board. Ms. Anstine was formerly a Director of the Trust Bank of Colorado (later purchased and now known as Northern Trust Bank), HealthONE and Denver Area Council of the Boy Scouts of America and a member of the American Bankers Association Trust Executive Committee. | 42 | Ms. Anstine is a Trustee of ALPS Variable Investment Trust (10 funds); Financial Investors Trust (33 funds); Reaves Utility Income Fund (1 fund); and Westcore Trust (14 funds). |
| Jeremy W. Deems, 1976 | Trustee | Since March 2008 | Mr. Deems is the Co-Founder, Chief Compliance Officer and Chief Financial Officer of Green Alpha Advisors, LLC. Mr. Deems is Co-Portfolio Manager of the Shelton Green Alpha Fund. Prior to joining Green Alpha Advisors, Mr. Deems was CFO and Treasurer of Forward Management, LLC, ReFlow Management Co., LLC, ReFlow Fund, LLC, a private investment fund, and Sutton Place Management, LLC, an administrative services company. | 44 | Mr. Deems is a Trustee of ALPS Variable Investment Trust (10 funds); Financial Investors Trust (33 funds); and Reaves Utility Income Fund (1 fund); Clough Funds Trust (1 fund) and Elevation ETF Trust (1 fund). |
| Rick A. Pederson, 1952 | Trustee and Chairman | Has served as Trustee since March 2008. Has served as Chairman since July 2017. | Mr. Pederson is President, Foundation Properties, Inc. (a real estate investment management company), 1994 - present; Advisory Board Member, Bow River Capital Partners (private equity management), 2003 - present; Advisor, The Pauls Corporation (real estate investment management and development), 2008 - present; Chairman, Ross Consulting Group (real estate consulting services) 1983-2013; Advisory Board, Neenan Company (construction services) 2002-present; Board Member, Prosci Inc. (private business services) 2013-2016; Board Member, Citywide Banks (Colorado community bank) 2014-present; Board member, Professional Pediatric Health Care (a Denver-based home nursing firm) 2014 – present; Board Member, Strong-Bridge Consulting (management consulting) 2015-present; Director, National Western Stock Show (not-for-profit organization); Director, Biennial of the Americas (not-for-profit-organization), 2012-2015; Board Member, History Colorado, 2015 -present. | 21 | Mr. Pederson is Trustee of Westcore Trust (14 funds) and Principal Real Estate Income Fund (1 fund). |
| * | The business address of the Trustee is c/o ALPS Advisors, Inc., 1290 Broadway, Suite 1100, Denver, Colorado 80203. |
| ** | This is the period for which the Trustee began serving the Trust. Each Trustee serves an indefinite term, until his successor is elected. |
| *** | The Fund Complex includes all series of the Trust and any other investment companies for which ALPS Advisors, Inc. provides investment advisory services. |
Alerian Exchange Traded Funds
| Trustees & Officers | November 30, 2017 (Unaudited) |
The Trustee who is affiliated with the Adviser or affiliates of the Adviser and executive officers of the Trust, his term of office and length of time served, his principal business occupations during the past five years, the number of portfolios in the Fund Complex overseen by the Interested Trustee and the other directorships, if any, held by the Trustee, are shown below.
INTERESTED TRUSTEE
| Name, Address and Year of Birth of Interested Trustee* | Position(s) Held with Trust | Term of Office and Length of Time Served** | Principal Occupation(s) During Past 5 Years | Number of Portfolios in Fund Complex Overseen by Trustees*** | Other Directorships Held by Trustee |
| Edmund J. Burke, 1961 | Trustee and President | Mr. Burke was elected as Trustee of the Trust and President of the Trust at the December 11, 2017 meeting of the Board of Trustees. | Mr. Burke is President and a Director of ALPS Holdings, Inc. (“AHI”) (since 2005) and Director of Boston Financial Data Services, Inc. (“BFDS”), ALPS Advisors, Inc. (“AAI”), ALPS Distributors, Inc. (“ADI”), ALPS Fund Services, Inc. (“AFS”) and ALPS Portfolio Solutions Distributor, Inc. (“APSD”) and from 2001-2008, was President of AAI, ADI, AFS and APSD. Because of his positions with AHI, BFDS, AAI, ADI, AFS and APSD, Mr. Burke is deemed an affiliate of the Trust as defined under the 1940 Act. Mr. Burke is Trustee and President of the Clough Global Allocation Fund (Trustee since 2006; President since 2004); Trustee and President of the Clough Global Equity Fund (Trustee since 2006; President since 2005); Trustee and President of the Clough Global Opportunities Fund (since 2006); Trustee of the Liberty All-Star Equity Fund; Director of the Liberty All-Star Growth Fund, Inc. and Trustee and President of Financial Investors Trust (Trustee since 2009; President since 2002). | 36 | Mr. Burke is a Trustee of Clough Global Dividend and Income Fund (1 fund); Clough Global Equity Fund (1 fund); Clough Global Opportunities Fund (1 fund); Clough Funds Trust (1 fund); Liberty All -Star Equity Fund (1 fund); Director of the Liberty All-Star Growth Fund, Inc. (1 fund) and Financial Investors Trust (33 funds). |
| * | The business address of the Trustee is c/o ALPS Advisors, Inc., 1290 Broadway, Suite 1100, Denver, Colorado 80203. |
| ** | This is the period for which the Trustee began serving the Trust. Each Trustee serves an indefinite term, until his successor is elected. |
| *** | The Fund Complex includes all series of the Trust and any other investment companies for which ALPS Advisors, Inc. provides investment advisory services. |
Alerian Exchange Traded Funds
| Trustees & Officers | November 30, 2017 (Unaudited) |
OFFICERS
| Name, Address and Year of Birth of Officer | Position(s) Held with Trust | Length of Time Served* | Principal Occupation(s) During Past 5 Years |
| Erin D. Nelson, 1977 | Chief Compliance Officer (“CCO”) | Since December 2015 | Erin Nelson became Senior Vice-President and Chief Compliance Officer of ALPS Advisors, Inc. (“AAI”) on July 1, 2015 and prior to that served as Vice President and Deputy Chief Compliance Officer of AAI since January 1, 2015. Prior to January 1, 2015, Ms. Nelson was Vice-President and Assistant General Counsel of ALPS Fund Services, Inc. Because of her position with AAI, Ms. Nelson is deemed an affiliate of the Trust as defined under the 1940 Act. Ms. Nelson is also the CCO of ALPS Variable Investment Trust, Liberty All-Star Growth Fund, Inc., Liberty All- Star Equity Fund, Principal Real Estate Income Fund, RiverNorth Opportunities Fund, Inc. and Red Rocks Capital, LLC. |
| Patrick D. Buchanan, 1972 | Treasurer | Since June 2012 | Mr. Buchanan is Vice President of AAI. Mr. Buchanan joined ALPS in 2007 and because of his position with AAI, he is deemed an affiliate of the Trust as defined under the 1940 Act. Mr. Buchanan is also Treasurer of the ALPS Variable Insurance Trust, Principal Real Estate Income Fund, Clough Funds Trust and RiverNorth Opportunities Fund, Inc. |
| Andrea E. Kuchli, 1985 | Secretary | Since December 2017 | Ms. Kuchli joined ALPS in 2015 and is currently Vice President and Senior Counsel of ALPS. Prior to joining ALPS, Ms. Kuchli was an Associate with Davis Graham & Stubbs LLP from April 2014 to February 2015, and an Associate with Dechert LLP from 2011 to April 2014. Because of her position with ALPS, Ms. Kuchli is deemed an affiliate of the Trust as defined under the 1940 Act. Ms. Kuchli is also Secretary of ALPS Variable Investment Trust, Elevation ETF Trust and Principal Real Estate Income Fund as well as Assistant Secretary of the James Advantage Funds. |
| Sharon Akselrod, 1974 | Assistant Secretary | Since December 2016 | Ms. Akselrod joined ALPS in August 2014 and is currently Senior Investment Company Act Paralegal of ALPS Fund Services, Inc. Prior to joining ALPS, Ms. Akselrod served as Corporate Governance and Regulatory Associate for Nordstrom fsb (2013-2014) and Senior Legal Assistant – Legal Manager for AXA Equitable Life Insurance Company (2008-2013). Because of her position with ALPS, Ms. Akselrod is deemed an affiliate of the Trust as defined under the 1940 Act. Ms. Akselrod is also Assistant Secretary of Financial Investors Trust and Principal Real Estate Income Fund. |
| Stephanie G. Danner, 1992 | Assistant Secretary | Since December 2017 | Ms. Danner joined ALPS in September of 2017 and is currently Vice President and Associate Senior Counsel of ALPS. Because of her position with ALPS, Ms. Danner is deemed an affiliate of the Trust as defined under the 1940 Act. |
| * | The business address of each Officer is c/o ALPS Advisors, Inc., 1290 Broadway, Suite 1100, Denver, Colorado 80203. |
| ** | This is the period for which the Officer began serving the Trust. Each Officer serves an indefinite term, until his/her successor is elected. |
The Statement of Additional Information includes additional information about the Fund's Trustees and is available, without charge, upon request by calling (toll-free) 1-877-398-8461.
Intentionally Left Blank

| Performance Overview | 1 |
| Disclosure of Fund Expenses | 4 |
| Report of Independent Registered Public Accounting Firm | 5 |
| Schedule of Investments | 6 |
| Statement of Assets & Liabilities | 7 |
| Statement of Operations | 8 |
| Statements of Changes In Net Assets | 9 |
| Financial Highlights | 10 |
| Notes to Financial Statements | 11 |
| Additional Information | 16 |
| Board Considerations Regarding Approval of Investment Advisory Agreement | 17 |
| Trustees & Officers | 18 |
alpsfunds.com
ALPS Equal Sector Weight ETF
| Performance Overview | November 30, 2017 (Unaudited) |
Investment Objective
The ALPS Equal Sector Weight ETF (the “Fund”) seeks investment results that replicate as closely as possible, before fees and expenses, the performance of the NYSE Select Sector Equal Weight IndexSM (the “Underlying Index”).
The Underlying Index is an index of ETFs comprised of all active Select Sector SPDR® ETFs in an equal weighted portfolio. These are the Consumer Discretionary Select Sector SPDR® Fund, Consumer Staples Select Sector SPDR® Fund, Materials Select Sector SPDR® Fund, Energy Select Sector SPDR® Fund, Technology Select Sector SPDR® Fund, Utilities Select Sector SPDR® Fund, Financial Select Sector SPDR® Fund, Industrial Select Sector SPDR® Fund, Health Care Select Sector SPDR® Fund and Real Estate Select Sector SPDR® Fund (each, an “Underlying Sector ETF” and collectively, the “Underlying Sector ETFs”). In order to track the Underlying Index, the Fund will use a “fund of funds” approach, and seek to achieve its investment objective by investing at least 90% of its total assets in the shares of the Underlying Sector ETFs.
The Underlying Index is designed to track performance of the equally weighted Underlying Sector ETFs. Accordingly, the Underlying Index is rebalanced to an equal weighting quarterly during the months of March, June, September, and December.
Each Underlying Sector ETF is an “index fund” that invests in the equity securities of companies in a particular sector or group of industries. The objective of each Underlying Sector ETF is to track its respective underlying sector index by replicating the securities in the underlying sector index. Together, the ten Underlying Sector ETFs represent the Underlying Index as a whole.
Performance Overview
The ALPS Equal Sector Weight ETF (EQL), for the twelve month period ended November 30, 2017, generated a total return of 19.46%, compared with the Fund’s Underlying Index, net of fees, which returned 19.64%. The fund underperformed the S&P 500®, which returned 22.87% for the same period.
The election of President Trump in November 2016 fueled optimism in the marketplace on hopes that tax and healthcare reform would pass in a Republican controlled Congress. With that backdrop of positive sentiment, the S&P 500® returned 9.34% in the first half of 2017. Oil saw moderate volatility during the year, exhibiting a low of $42.53 per barrel on June 21st with a high of $58.95 on November 24th. Monetary policy remained unsurprising due to the continued assurance from the Federal Reserve that a slow and anticipated rise in short term interest rates will continue. During the third calendar quarter of 2017, the S&P 500® returned 4.41% and subsequently 5.49% in the first two months of Q4. Although pro-growth policies and reform had yet to surface in the first half of the year, optimism remained in the market. The belief that the Republican Party had enough votes to pass tax reforms in the House and Senate spurred the strong rally in the U.S in the second half of 2017. In addition, companies in the S&P 500®, on average, reported strong Q3 earnings.
Compared to the S&P 500®, the Fund experienced a negative impact (-3.20%) from allocation effect during the period. This impact was largely driven by relative underweight to Information Technology (average weight for the period of 9.33% vs. 22.53% in the S&P 500®).
The best performing fund holdings for the period were the Technology Select Sector SPDR® (XLK), which increased 36.55% and the Utilities Select Sector SPDR® (XLU), which saw a gain of 25.09%. The only detractor was the Energy Select Sector SPDR® (XLE), which decreased 4.23%.
Looking forward we believe the Fund’s strategy of holding each of the ten sectors (with Information Technology and Telecommunication Service combined) in the S&P 500® via the Select SPDR® Funds can result in a diversified core holding, and potential for market participation in all economic cycles through equal sector weighting.
ALPS Equal Sector Weight ETF
| Performance Overview | November 30, 2017 (Unaudited) |
Performance (as of November 30, 2017)
| 1 Year | 3 Year | 5 Year | Since Inception^ |
| ALPS Equal Sector Weight ETF - NAV | 19.46% | 9.25% | 14.14% | 15.15% |
| ALPS Equal Sector Weight ETF - Market Price* | 19.51% | 9.27% | 14.15% | 15.18% |
| NYSE® Select Sector Equal Weight Index** | 16.92% | 7.01% | 11.93% | 13.03% |
| S&P 500® Total Return Index | 22.87% | 10.91% | 15.74% | 16.15% |
Total Expense Ratio (per the current Prospectus) 0.51%. Net Expense Ratio (per the current Prospectus) 0.48%. Net expense ratio reflects the reimbursement of distribution fees for underlying sector ETFs. Please see the prospectus for additional information.
Performance data quoted represents past performance. Past performance does not guarantee future results. The table does not reflect the deduction of taxes that a shareholder would pay on Fund distributions or the redemption of Fund shares. Investment return and principal value of an investment will fluctuate so that an investor’s shares, when sold or redeemed, may be worth more or less than the original cost. Current performance data may be higher or lower than actual data quoted. For the most current month-end performance data please visit www.alpsfunds.com or call 1.866.675.2639.
NAV is an exchange-traded fund’s per-share value. The per-share dollar amount of the Fund is derived by dividing the total value of all the securities in its portfolio, less any liabilities, by the number of Fund shares outstanding. Market Price is the price at which a share can currently be traded in the market. Information detailing the number of days the Market Price of the Fund was greater than the Fund’s NAV and the number of days it was less than the Fund’s NAV can be obtained at www.alpsfunds.com.
| ^ | The Fund commenced Investment Operations on July 6, 2009 with an Inception Date, the first day of trading on the Exchange, of July 7, 2009. |
| * | Market Price is based on the midpoint of the bid/ask spread at 4 p.m. ET and does not represent the returns an investor would receive if shares were traded at other times. |
| ** | The Fund’s underlying index changed on October 2, 2017 from Bank of America Securities – Merrill Lyn Equal Sector Weigh Index to NYSE® Select Sector Equal Weigh Index due to the former index closing on October 4, 2017. |
The NYSE® Select Sector Equal Weight Index consists of a strategy that holds all active Select Sector SPDR® ETFs in an equal-weighted portfolio.
S&P 500® Total Return Index: the Standard & Poor’s composite index of 500 stocks, a widely recognized, unmanaged index of common stock prices. Total return assumes reinvestment of any dividends and distributions realized during a given time period.
The indexes are not actively managed and do not reflect any deductions for fees, expenses or taxes. The indexes are reported on a total return basis, which assumes reinvestment of any dividends and distributions realized during a given time period. One cannot invest directly in an index. Index performance does not reflect fund performance.
The Fund’s shares are not individually redeemable. Investors buy and sell shares of the Fund on a secondary market. Only market makers or “authorized participants” may trade directly with the Fund, typically in blocks of 50,000 shares.
The ALPS Equal Sector Weight ETF is not suitable for all investors. Investments in the Fund are subject to investment risks, including possible loss of the principal amount invested.
ALPS Portfolio Solutions Distributor, Inc., a FINRA member, is the distributor for the Fund.
ALPS Equal Sector Weight ETF
| Performance Overview | November 30, 2017 (Unaudited) |
The following table shows the sector weights of both the Fund and the S&P 500® as of November 30, 2017:
Sector Weighting Comparison (as of November 30, 2017)
| | EQL* | S&P 500® | +/- |
| Financials | 10.60% | 14.75% | -3.46% |
| Technology | 10.30% | 25.99% | -15.69% |
| Consumer Discretionary | 10.20% | 12.11% | -1.91% |
| Industrials | 10.20% | 10.09% | 0.11% |
| Materials | 10.10% | 2.96% | 7.17% |
| Energy | 10.00% | 5.85% | 4.15% |
| Utilities | 9.80% | 3.15% | 6.65% |
| Consumer Staples | 9.60% | 8.11% | 1.49% |
| Real Estate | 9.60% | 2.93% | 6.64% |
| Healthcare | 9.60% | 14.06% | -5.15% |
| Total | 100.00% | 100.00% | |
Source: S&P 500®
Future holdings are subject to change.
Growth of $10,000 (as of November 30, 2017)
Comparison of Change in Value of $10,000 Investment in the Fund and the Indexes
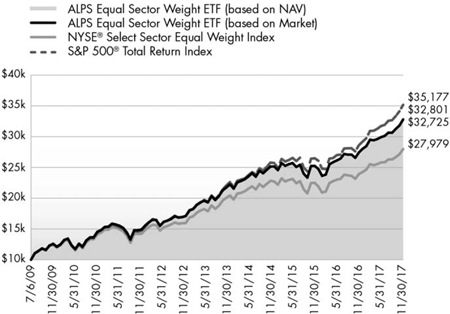
The chart above represents historical performance of a hypothetical investment of $10,000 in the Fund over the life of the Fund. Past performance does not guarantee future results. This chart does not reflect the deduction of taxes that a shareholder would pay on Fund distributions or the redemption of Fund shares.
ALPS Equal Sector Weight ETF
| Disclosure of Fund Expenses | November 30, 2017 (Unaudited) |
Shareholder Expense Example: As a shareholder of the Fund, you incur two types of costs: (1) transaction costs which may include creation and redemption fees or brokerage charges, and (2) ongoing costs, including management fees and other Fund expenses. These examples are intended to help you understand your ongoing costs (in dollars) of investing in the Fund and to compare these costs with the ongoing costs of investing in other funds. The example is based on an investment of $1,000 invested at the beginning of the (six month) period and held through November 30, 2017.
Actual Return: The first line of the table provides information about actual account values and actual expenses. You may use the information in this line, together with the amount you invested, to estimate the expenses that you incurred over the period. Simply divide your account value by $1,000 (for example, an $8,600 account value divided by $1,000 = 8.6), then multiply the result by the number in the first line under the heading entitled “Expenses Paid During Period” to estimate the expenses attributable to your investment during this period.
Hypothetical 5% Return: The second line of the table provides information about hypothetical account values and hypothetical expenses based on the Fund’s actual expense ratio and an assumed rate of return of 5% per year before expenses, which is not the Fund’s actual return. The hypothetical account values and expenses may not be used to estimate the actual ending account balance or expenses you paid for the period. You may use this information to compare ongoing costs of investing in the Fund and other funds. To do so, compare this 5% hypothetical example with the 5% hypothetical examples that appear in the shareholder reports of other funds.
The expenses shown in the table are meant to highlight ongoing Fund costs only and do not reflect any transaction costs, such as creation and redemption fees or brokerage charges. Therefore, the second line of the table is useful in comparing ongoing costs only, and will not help you determine the relative total costs of owning different funds. In addition, if these costs were included, your costs would have been higher.
| | Beginning Account Value 6/1/17 | Ending Account Value 11/30/17 | Expense Ratio(a) | Expenses Paid During Period 6/1/17 - 11/30/17(b) |
| ALPS Equal Sector Weight ETF | | | | |
| Actual | $1,000.00 | $1,095.30 | 0.15% | $0.79 |
| Hypothetical (5% return before expenses) | $1,000.00 | $1,024.32 | 0.15% | $0.76 |
| (a) | Annualized based on the Fund's most recent half-year expenses. |
| (b) | Expenses are equal to the Fund's annualized expense ratio multiplied by the average account value over the period, multiplied by the number of days in the most recent fiscal half year (183), divided by 365. |
ALPS Equal Sector Weight ETF
Report of Independent Registered Public Accounting Firm
To the Board of Trustees and Shareholders of ALPS ETF Trust:
We have audited the accompanying statement of assets and liabilities, including the schedule of investments, of ALPS Equal Sector Weight ETF, one of the portfolios constituting the ALPS ETF Trust (the “Trust”), as of November 30, 2017, and the related statement of operations for the year then ended, the statements of changes in net assets for each of the two years in the period then ended, and the financial highlights for each of the five years in the period then ended. These financial statements and financial highlights are the responsibility of the Trust’s management. Our responsibility is to express an opinion on these financial statements and financial highlights based on our audits.
We conducted our audits in accordance with the standards of the Public Company Accounting Oversight Board (United States). Those standards require that we plan and perform the audit to obtain reasonable assurance about whether the financial statements and financial highlights are free of material misstatement. The Trust is not required to have, nor were we engaged to perform, an audit of its internal control over financial reporting. Our audits included consideration of internal control over financial reporting as a basis for designing audit procedures that are appropriate in the circumstances, but not for the purpose of expressing an opinion on the effectiveness of the Trust’s internal control over financial reporting. Accordingly, we express no such opinion. An audit also includes examining, on a test basis, evidence supporting the amounts and disclosures in the financial statements, assessing the accounting principles used and significant estimates made by management, as well as evaluating the overall financial statement presentation. Our procedures included confirmation of securities owned as of November 30, 2017, by correspondence with the custodian. We believe that our audits provide a reasonable basis for our opinion.
In our opinion, the financial statements and financial highlights referred to above present fairly, in all material respects, the financial position of ALPS Equal Sector Weight ETF of the ALPS ETF Trust as of November 30, 2017, the results of its operations for the year then ended, the changes in its net assets for each of the two years in the period then ended, and the financial highlights for each of the five years in the period then ended, in conformity with accounting principles generally accepted in the United States of America.
DELOITTE & TOUCHE LLP
Denver, Colorado
January 26, 2018
ALPS Equal Sector Weight ETF
| Schedule of Investments | November 30, 2017 |
| SECURITY DESCRIPTION | | SHARES | | | VALUE | |
| EXCHANGE TRADED FUNDS (99.96%) | | | | | | | | |
| Consumer Discretionary (10.23%) | | | | | | | | |
| Consumer Discretionary Select Sector SPDR® Fund | | | 176,067 | | | $ | 17,016,876 | |
| | | | | | | | | |
| Consumer Staples (9.63%) | | | | | | | | |
| Consumer Staples Select Sector SPDR® Fund | | | 285,781 | | | | 16,018,025 | |
| | | | | | | | | |
| Energy (9.96%) | | | | | | | | |
| Energy Select Sector SPDR® Fund | | | 239,685 | | | | 16,562,234 | |
| | | | | | | | | |
| Financials (10.54%) | | | | | | | | |
| Financial Select Sector SPDR® Fund | | | 637,095 | | | | 17,532,854 | |
| | | | | | | | | |
| Healthcare (9.59%) | | | | | | | | |
| Health Care Select Sector SPDR® Fund | | | 191,074 | | | | 15,948,947 | |
| | | | | | | | | |
| Industrials (10.19%) | | | | | | | | |
| Industrial Select Sector SPDR® Fund | | | 227,422 | | | | 16,945,213 | |
| | | | | | | | | |
| Materials (10.08%) | | | | | | | | |
| Materials Select Sector SPDR® Fund | | | 281,449 | | | | 16,763,102 | |
| | | | | | | | | |
| Real Estate (9.61%) | | | | | | | | |
| Real Estate Select Sector SPDR® Fund | | | 477,484 | | | | 15,971,840 | |
| | | | | | | | | |
| Technology (10.32%) | | | | | | | | |
| Technology Select Sector SPDR® Fund | | | 268,656 | | | | 17,150,999 | |
| | | | | | | | | |
| Utilities (9.81%) | | | | | | | | |
| Utilities Select Sector SPDR® Fund | | | 288,235 | | | | 16,314,101 | |
| | | | | | | | | |
| TOTAL EXCHANGE TRADED FUNDS | | | | | | | | |
| (Cost $121,073,987) | | | | | | | 166,224,191 | |
| | | 7 DAY YIELD | | | SHARES | | | VALUE | |
| SHORT TERM INVESTMENTS (0.05%) | | | | | | | | | | | | |
| State Street Institutional Treasury Plus Money Market Fund | | | 0.970 | % | | | 77,231 | | | | 77,231 | |
| | | | | | | | | | | | | |
| TOTAL SHORT TERM INVESTMENTS | | | | | | | | | | | | |
| (COST OF $77,231) | | | | | | | | | | | 77,231 | |
| | | | | | | | | | | | | |
| TOTAL INVESTMENTS (100.01%) | | | | | | | | | | | | |
| (Cost $121,151,218) | | | | | | | | | | $ | 166,301,422 | |
| | | | | | | | | | | | | |
| NET LIABILITIES LESS OTHER ASSETS (-0.01%) | | | (17,871 | ) |
| | | | | | | | | | | | | |
| NET ASSETS (100.00%) | | | | | | | | | | $ | 166,283,551 | |
Common Abbreviations:
SPDR® - Standard & Poor's Depositary Receipts
See Notes to Financial Statements.
ALPS Equal Sector Weight ETF
| Statement of Assets and Liabilities | November 30, 2017 |
| ASSETS: | | | |
| Investments, at value | | $ | 166,301,422 | |
| Dividends receivable | | | 2,174 | |
| Total Assets | | | 166,303,596 | |
| | | | | |
| LIABILITIES: | | | | |
| Payable to adviser | | | 20,045 | |
| Total Liabilities | | | 20,045 | |
| NET ASSETS | | $ | 166,283,551 | |
| | | | | |
| NET ASSETS CONSIST OF: | | | | |
| Paid-in capital | | $ | 121,539,498 | |
| Accumulated net investment income | | | 21,136 | |
| Accumulated net realized loss | | | (427,287 | ) |
| Net unrealized appreciation | | | 45,150,204 | |
| NET ASSETS | | $ | 166,283,551 | |
| | | | | |
| INVESTMENTS, AT COST | | $ | 121,151,218 | |
| | | | | |
| PRICING OF SHARES | | | | |
| Net Assets | | $ | 166,283,551 | |
| Shares of beneficial interest outstanding (Unlimited number of shares authorized, par value $0.01 per share) | | | 2,400,000 | |
| Net Asset Value, offering and redemption price per share | | $ | 69.28 | |
See Notes to Financial Statements.
ALPS Equal Sector Weight ETF
| Statement of Operations | For the Year Ended November 30, 2017 |
| INVESTMENT INCOME: | | | |
| Dividends | | $ | 3,611,756 | |
| Securities lending income | | | 15,846 | |
| Total investment income | | | 3,627,602 | |
| | | | | |
| EXPENSES: | | | | |
| Investment adviser fees | | | 585,726 | |
| Total expenses before waiver/reimbursement | | | 585,726 | |
| Less fees waiver/reimbursement by investment adviser | | | (348,269 | ) |
| Net Expenses | | | 237,457 | |
| NET INVESTMENT INCOME | | | 3,390,145 | |
| REALIZED AND UNREALIZED GAIN/(LOSS) | | | | |
| Net realized gain on investments | | | 6,257,769 | |
| Net change in unrealized appreciation on investments | | | 18,185,874 | |
| NET REALIZED AND UNREALIZED GAIN ON INVESTMENTS | | | 24,443,643 | |
| NET INCREASE IN NET ASSETS RESULTING FROM OPERATIONS | | $ | 27,833,788 | |
See Notes to Financial Statements.
ALPS Equal Sector Weight ETF
Statements of Changes in Net Assets
| | | For the Year Ended November 30, 2017 | | | For the Year Ended November 30, 2016 | |
| OPERATIONS: | | | | | | |
| Net investment income | | $ | 3,390,145 | | | $ | 4,001,215 | |
| Net realized gain | | | 6,257,769 | | | | 2,016,943 | |
| Net change in unrealized appreciation | | | 18,185,874 | | | | 4,873,106 | |
| Net increase in net assets resulting from operations | | | 27,833,788 | | | | 10,891,264 | |
| | | | | | | | | |
| DISTRIBUTIONS TO SHAREHOLDERS: | | | | | | | | |
| From net investment income | | | (4,499,673 | ) | | | (2,883,195 | ) |
| Total distributions | | | (4,499,673 | ) | | | (2,883,195 | ) |
| | | | | | | | | |
| CAPITAL SHARE TRANSACTIONS: | | | | | | | | |
| Proceeds from sale of shares | | | 18,897,952 | | | | – | |
| Cost of shares redeemed | | | (16,339,186 | ) | | | (8,024,819 | ) |
| Net increase/(decrease) from share transactions | | | 2,558,766 | | | | (8,024,819 | ) |
| Net increase/(decrease) in net assets | | | 25,892,881 | | | | (16,750 | ) |
| | | | | | | | | |
| NET ASSETS: | | | | | | | | |
| Beginning of year | | | 140,390,670 | | | | 140,407,420 | |
| End of year * | | $ | 166,283,551 | | | $ | 140,390,670 | |
| | | | | | | | | |
| *Including accumulated net investment income of: | | $ | 21,136 | | | $ | 1,130,664 | |
| | | | | | | | | |
| OTHER INFORMATION: | | | | | | | | |
| CAPITAL SHARE TRANSACTIONS: | | | | | | | | |
| Beginning shares | | | 2,350,000 | | | | 2,500,000 | |
| Shares sold | | | 300,000 | | | | – | |
| Shares redeemed | | | (250,000 | ) | | | (150,000 | ) |
| Shares outstanding, end of year | | | 2,400,000 | | | | 2,350,000 | |
See Notes to Financial Statements.
ALPS Equal Sector Weight ETF
| Financial Highlights | For a Share Outstanding Throughout the Years Presented |
| | | For the Year Ended November 30, 2017 | | | For the Year Ended November 30, 2016 | | | For the Year Ended November 30, 2015 | | | For the Year Ended November 30, 2014 | | | For the Year Ended November 30, 2013 | |
| NET ASSET VALUE, BEGINNING OF PERIOD | | $ | 59.74 | | | $ | 56.16 | | | $ | 57.01 | | | $ | 50.11 | | | $ | 39.79 | |
| | | | | | | | | | | | | �� | | | | | | | | |
| INCOME FROM OPERATIONS: | | | | | | | | | | | | | | | | | | | | |
| Net investment income(a) | | | 1.37 | | | | 1.66 | | | | 1.09 | | | | 0.90 | | | | 0.81 | |
| Net realized and unrealized gain/(loss) | | | 10.03 | | | | 3.11 | | | | (0.84 | ) | | | 6.90 | | | | 10.35 | |
| Total from investment operations | | | 11.40 | | | | 4.77 | | | | 0.25 | | | | 7.80 | | | | 11.16 | |
| | | | | | | | | | | | | | | | | | | | | |
| DISTRIBUTIONS: | | | | | | | | | | | | | | | | | | | | |
| From net investment income | | | (1.86 | ) | | | (1.19 | ) | | | (1.10 | ) | | | (0.90 | ) | | | (0.84 | ) |
| Total distributions | | | (1.86 | ) | | | (1.19 | ) | | | (1.10 | ) | | | (0.90 | ) | | | (0.84 | ) |
| | | | | | | | | | | | | | | | | | | | | |
| NET INCREASE/(DECREASE) IN NET ASSET VALUE | | | 9.54 | | | | 3.58 | | | | (0.85 | ) | | | 6.90 | | | | 10.32 | |
| NET ASSET VALUE, END OF PERIOD | | $ | 69.28 | | | $ | 59.74 | | | $ | 56.16 | | | $ | 57.01 | | | $ | 50.11 | |
| TOTAL RETURN(b) | | | 19.46 | % | | | 8.62 | % | | | 0.48 | % | | | 15.71 | % | | | 28.41 | % |
| | | | | | | | | | | | | | | | | | | | | |
| RATIOS/SUPPLEMENTAL DATA: | | | | | | | | | | | | | | | | | | | | |
| Net assets, end of period (in 000s) | | $ | 166,284 | | | $ | 140,391 | | | $ | 140,407 | | | $ | 139,686 | | | $ | 110,245 | |
| Ratio of expenses excluding waiver/reimbursement to average net assets | | | 0.37 | % | | | 0.37 | % | | | 0.37 | % | | | 0.37 | % | | | 0.37 | % |
| Ratio of expenses including waiver/reimbursement to average net assets | | | 0.15 | % | | | 0.15 | % | | | 0.21 | %(c) | | | 0.34 | % | | | 0.34 | % |
| Ratio of net investment income excluding waiver/reimbursement to average net assets | | | 1.92 | % | | | 2.71 | % | | | 1.78 | % | | | 1.67 | % | | | 1.77 | % |
| Ratio of net investment income including waiver/reimbursement to average net assets | | | 2.14 | % | | | 2.93 | % | | | 1.94 | %(c) | | | 1.70 | % | | | 1.80 | % |
| Portfolio turnover rate(d) | | | 5 | % | | | 13 | % | | | 6 | % | | | 3 | % | | | 2 | % |
| (a) | Based on average shares outstanding during the period. |
| (b) | Total return is calculated assuming an initial investment made at the net asset value at the beginning of the period and redemption at the net asset value on the last day of the period and assuming all distributions are reinvested at reinvestment prices. |
| (c) | The effective expense ratio including waivers changed from 0.34% to 0.15% effective April 1, 2015 through March 31, 2016. |
| (d) | Portfolio turnover for periods less than one year are not annualized and does not include securities received or delivered from processing creations or redemptions in-kind. |
See Notes to Financial Statements.
ALPS Equal Sector Weight ETF
| Notes to Financial Statements | November 30, 2017 |
1. ORGANIZATION
ALPS ETF Trust (the “Trust”), a Delaware statutory trust, is an open-end management investment company registered under the Investment Company Act of 1940, as amended (the “1940 Act”). As of November 30, 2017, the Trust consists of nineteen separate portfolios. Each portfolio represents a separate series of the Trust. This report pertains solely to the ALPS Equal Sector Weight ETF (the “Fund”). The investment objective of the Fund is to seek investment results that replicate as closely as possible, before fees and expenses, the performance of the NYSE® Select Sector Equal Weight Index (the “Underlying Index”). The Fund is considered non-diversified and may invest a greater portion of assets in securities of individual issuers than a diversified fund. As a result, changes in the market value of a single investment could cause greater fluctuations in share price than would occur in a diversified fund.
The Fund’s Shares (“Shares”) are listed on the NYSE Arca, Inc. The Fund issues and redeems Shares at net asset value (“NAV”) in blocks of 50,000 Shares each of which is called a “Creation Unit”. Creation Units are issued and redeemed principally in-kind for securities included in the Underlying Index. Except when aggregated in Creation Units, Shares are not redeemable securities of the Fund.
Pursuant to the Trust’s organizational documents, its Officers and Trustees are indemnified against certain liability arising out of the performance of their duties to the Trust. Additionally, in the normal course of business, the Trust enters into contracts with service providers that contain general indemnification clauses. The Trust’s maximum exposure under these arrangements is unknown, as this would involve future claims that may be made against the Trust that have not yet occurred.
2. SIGNIFICANT ACCOUNTING POLICIES
The following is a summary of significant accounting policies consistently followed by the Fund in the preparation of the financial statements. The accompanying financial statements were prepared in accordance with accounting principles generally accepted in the United States of America (“U.S. GAAP”). The preparation of financial statements in conformity with U.S. GAAP requires management to make certain estimates and assumptions that affect the reported amounts of assets and liabilities and disclosures of contingent assets and liabilities at the date of the financial statements and the reported amounts of revenue and expenses during the period. Actual results could differ from those estimates. The Fund is considered an investment company under U.S. GAAP and follows the accounting and reporting guidance applicable to investment companies in the Financial Accounting Standards Board Accounting Standards Codification Topic 946.
A. Portfolio Valuation
The Fund’s NAV is determined daily, as of the close of regular trading on the New York Stock Exchange (the “NYSE”), normally 4:00 p.m. Eastern time, on each day the NYSE is open for trading. The NAV is computed by dividing the value of all assets of the Fund (including accrued interest and dividends), less all liabilities (including accrued expenses and dividends declared but unpaid), by the total number of shares outstanding.
Portfolio securities listed on any exchange other than the NASDAQ Stock Market LLC (“NASDAQ”) are valued at the last sale price on the business day as of which such value is being determined. If there has been no sale on such day, the securities are valued at the mean of the most recent bid and ask prices on such day. Securities traded on the NASDAQ are valued at the NASDAQ Official Closing Price as determined by NASDAQ. Portfolio securities traded on more than one securities exchange are valued at the last sale price on the business day as of which such value is being determined at the close of the exchange representing the principal market for such securities. Portfolio securities traded in the over-the-counter market, but excluding securities traded on the NASDAQ, are valued at the last quoted sale price in such market.
The Fund’s investments are valued at market value or, in the absence of market value with respect to any portfolio securities, at fair value according to procedures adopted by the Trust’s Board of Trustees (the “Board”). When market quotations are not readily available or when events occur that make established valuation methods unreliable, securities of the Fund may be valued in good faith by or under the direction of the Board. These securities generally include, but are not limited to, restricted securities (securities which may not be publicly sold without registration under the Securities Act of 1933) for which a pricing service is unable to provide a market price; securities whose trading has been formally suspended; a security whose market price is not available from a pre-established primary pricing source or the pricing source is not willing to provide a price; a security with respect to which an event has occurred that is most likely to materially affect the value of the security after the market has closed but before the calculation of the Fund’s NAV or make it difficult or impossible to obtain a reliable market quotation; or a security whose price, as provided by the pricing service, does not reflect the security’s “fair value” due to the security being de-listed from a national exchange or the security’s primary trading market is temporarily closed at a time when, under normal conditions, it would be open. As a general principle, the current “fair value” of a security would be the amount which the owner might reasonably expect to receive from the sale on the applicable exchange or principal market. A variety of factors may be considered in determining the fair value of such securities.
ALPS Equal Sector Weight ETF
| Notes to Financial Statements | November 30, 2017 |
B. Fair Value Measurements
The Fund discloses the classification of its fair value measurements following a three-tier hierarchy based on the inputs used to measure fair value. Inputs refer broadly to the assumptions that market participants would use in pricing the asset or liability, including assumptions about risk. Inputs may be observable or unobservable. Observable inputs reflect the assumptions market participants would use in pricing the asset or liability that are developed based on market data obtained from sources independent of the reporting entity. Unobservable inputs reflect the reporting entity’s own assumptions about the assumptions market participants would use in pricing the asset or liability that are developed based on the best information available.
Valuation techniques used to value the Fund’s investments by major category are as follows:
Exchange Traded Funds, for which market quotations are readily available, are valued at the last reported sale price or official closing price as reported by a third party pricing vendor on the primary market or exchange on which they are traded and are categorized as Level 1 in the hierarchy. In the event there were no sales during the day or closing prices are not available, securities are valued at the mean of the most recent quoted bid and ask prices on such day and are generally categorized as Level 2 in the hierarchy. Investments in open-end mutual funds are valued at their closing NAV each business day and are categorized as Level 1 in the hierarchy.
Changes in valuation techniques may result in transfers in or out of an assigned level within the disclosure hierarchy.
Various inputs are used in determining the value of the Fund’s investments as of the end of the reporting period. When inputs used fall into different levels of the fair value hierarchy, the level in the hierarchy within which the fair value measurement falls is determined based on the lowest level input that is significant to the fair value measurement in its entirety. The designated input levels are not necessarily an indication of the risk or liquidity associated with these investments.
These inputs are categorized in the following hierarchy under applicable financial accounting standards:
| Level 1 – | Unadjusted quoted prices in active markets for identical investments, unrestricted assets or liabilities that a Fund has the ability to access at the measurement date; |
| Level 2 – | Quoted prices which are not active, quoted prices for similar assets or liabilities in active markets or inputs other than quoted prices that are observable (either directly or indirectly) for substantially the full term of the asset or liability; and |
| Level 3 – | Significant unobservable prices or inputs (including the Fund’s own assumptions in determining the fair value of investments) where there is little or no market activity for the asset or liability at the measurement date. |
The following is a summary of inputs used to value the Fund’s investments at November 30, 2017:
| Investments in Securities at Value* | | Level 1 - Unadjusted Quoted Prices | | | Level 2 - Significant Observable Inputs | | | Level 3 - Significant Unobservable Inputs | | | Total | |
| Exchange Traded Funds | | $ | 166,224,191 | | | $ | – | | | $ | – | | | $ | 166,224,191 | |
| Short Term Investments | | | 77,231 | | | | – | | | | – | | | | 77,231 | |
| TOTAL | | $ | 166,301,422 | | | $ | – | | | $ | – | | | $ | 166,301,422 | |
| * | For a detailed sector breakdown, see the accompanying Schedule of Investments. |
The Fund recognizes transfers between levels as of the end of the period. For the year ended November 30, 2017, the Fund did not have any transfers between Level 1 and Level 2 securities. The Fund did not have any securities that used significant unobservable inputs (Level 3) in determining fair value.
C. Securities Transactions and Investment Income
Securities transactions are recorded as of the trade date. Realized gains and losses from securities transactions are recorded on the highest cost basis. Dividend income and capital gains distributions, if any, are recorded on the ex-dividend date. Interest income, if any, is recorded on the accrual basis.
ALPS Equal Sector Weight ETF
| Notes to Financial Statements | November 30, 2017 |
D. Dividends and Distributions to Shareholders
Dividends from net investment income of the Fund, if any, are declared and paid quarterly or as the Board may determine from time to time. Distributions of net realized capital gains earned by the Fund, if any, are distributed at least annually.
E. Federal Tax and Tax Basis Information
The timing and character of income and capital gain distributions are determined in accordance with income tax regulations, which may differ from U.S. GAAP. Reclassifications are made to the Fund’s capital accounts for permanent tax differences to reflect income and gains available for distribution (or available capital loss carryforwards) under income tax regulations.
For the year ended November 30, 2017, the following reclassifications, which had no impact on results of operations or net assets, were recorded to reflect permanent tax differences resulting primarily from in-kind transactions:
| Fund | | Accumulated Net Investment Income/(Loss) | | | Accumulated Net Realized Gain/ (Loss) on Investments | | | Paid-in Capital | |
| ALPS Equal Sector Weight ETF | | $ | – | | | $ | (6,129,057 | ) | | $ | 6,129,057 | |
The tax character of the distributions paid during the fiscal year ended November 30, 2017 and November 30, 2016 were as follows:
| | Ordinary Income | |
| November 30, 2017 | | | | |
| ALPS Equal Sector Weight ETF | | $ | 4,499,673 | |
| November 30, 2016 | | | | |
| ALPS Equal Sector Weight ETF | | $ | 2,883,195 | |
At November 30, 2017, the Fund had available for tax purposes unused post-enactment capital loss carryforwards as follows:
| Fund | | Short-Term | | | Long-Term | |
| ALPS Equal Sector Weight ETF | | $ | – | | | $ | 356,705 | |
Capital loss carryovers used during the period ended November 30, 2017 were $214,539
As of November 30, 2017, the components of distributable earnings on a tax basis for the Fund were as follows:
| Undistributed net investment income | | $ | 21,136 | |
| Accumulated net realized loss on investments | | | (356,704 | ) |
| Net unrealized appreciation on investments | | | 45,079,621 | |
| Total | | $ | 44,744,053 | |
As of November 30, 2017, the cost of investments for federal income tax purposes and accumulated net unrealized appreciation/(depreciation) on investments were as follows:
| Gross appreciation (excess of value over tax cost) | | $ | 46,618,240 | |
| Gross depreciation (excess of tax cost over value) | | | (1,538,619 | ) |
| Net unrealized appreciation (depreciation) | | | 45,079,621 | |
| Cost of investments for income tax purposes | | $ | 121,221,801 | |
The differences between book-basis and tax-basis are primarily due to the deferral of losses from wash sales.
ALPS Equal Sector Weight ETF
| Notes to Financial Statements | November 30, 2017 |
F. Income Taxes
No provision for income taxes is included in the accompanying financial statements, as the Fund intends to distribute to shareholders all taxable investment income and realized gains and otherwise comply with Subchapter M of the Internal Revenue Code of 1986, as amended, applicable to regulated investment companies. The Fund evaluates tax positions taken (or expected to be taken) in the course of preparing the Fund’s tax returns to determine whether these positions meet a “more-likely-than-not” standard that, based on the technical merits, have a more than fifty percent likelihood of being sustained by a taxing authority upon examination. A tax position that meets the “more-likely-than-not” recognition threshold is measured to determine the amount of benefit to recognize in the financial statements.
As of and during the year ended November 30, 2017, the Fund did not have a liability for any unrecognized tax benefits. The Fund files U.S. federal, state, and local tax returns as required. The Fund’s tax returns are subject to examination by the relevant tax authorities until expiration of the applicable statute of limitations, which is generally three years after the filing of the tax return, but may extend to four years in certain jurisdictions. Tax returns for open years have incorporated no uncertain tax positions that require a provision for income taxes.
G. Lending of Portfolio Securities
The Fund has entered into a securities lending agreement with State Street Bank & Trust Co. (“SSB”), the Fund’s lending agent. The Fund may lend its portfolio securities only to borrowers that are approved by SSB. The Fund will limit such lending to not more than 33 1/3% of the value of its total assets. The Fund’s securities held at SSB as custodian shall be available to be lent except those securities the Fund or ALPS Advisors, Inc. specifically identifies in writing as not being available for lending. The borrower pledges and maintains with the Fund collateral consisting of cash (U.S. Dollars only), securities issued or guaranteed by the U.S. government or its agencies or instrumentalities, and cash equivalents (including irrevocable bank letters of credit) issued by a person other than the borrower or an affiliate of the borrower. The initial collateral received by the Fund is required to have a value of no less than 102% of the market value of the loaned securities for U.S equity securities and a value of no less than 105% of the market value for non-U.S. equity securities. The collateral is maintained thereafter, at a market value equal to not less than 102% of the current value of the U.S. equity securities on loan and not less than 105% of the current value of the non-U.S. equity securities on loan. The market value of the loaned securities is determined at the close of each business day and any additional required collateral is delivered to the Fund on the next business day. During the term of the loan, the Fund is entitled to all distributions made on or in respect of the loaned securities. Loans of securities are terminable at any time and the borrower, after notice, is required to return borrowed securities within the customary time period for settlement of securities transactions.
Any cash collateral received is reinvested in a money market fund managed by SSB as disclosed in the Fund’s Schedule of Investments and is reflected in the Statements of Assets and Liabilities as a payable for collateral upon return of securities loaned. Non-cash collateral, in the form of securities issued or guaranteed by the U.S. government or its agencies or instrumentalities, is not disclosed in the Fund’s Statements of Assets and Liabilities as it is held by the lending agent on behalf of the Fund, and the Fund does not have the ability to re-hypothecate these securities. Income earned by the Fund from securities lending activity is disclosed in the Statement of Operations. As of November 30, 2017, the Fund had no securities on loan.
The risks of securities lending include the risk that the borrower may not provide additional collateral when required or may not return the securities when due. To mitigate these risks, the Fund benefits from a borrower default indemnity provided by SSB. SSB’s indemnity allows for full replacement of securities lent wherein SSB will purchase the unreturned loaned securities on the open market by applying the proceeds of the collateral, or to the extent such proceeds are insufficient or the collateral is unavailable, SSB will purchase the unreturned loan securities at SSB’s expense. However, the Fund could suffer a loss if the value of the investments purchased with cash collateral falls below the value of the cash collateral received.
3. INVESTMENT ADVISORY FEE AND OTHER AFFILIATED TRANSACTIONS
ALPS Advisors, Inc. (the “Adviser”) acts as the Fund’s investment adviser pursuant to an Advisory Agreement with the Trust on behalf of the Fund (the “Advisory Agreement”). Pursuant to the Advisory Agreement, the Fund pays the Adviser a unitary fee for the services and facilities it provides payable on a monthly basis at the annual rate of 0.37% of the Fund’s average daily net assets.
The Adviser has agreed to waive 0.19% of its annual unitary fee payable by the Fund on a voluntary basis.
ALPS Portfolio Solutions Distributor, Inc. (“APSD”) is both the distributor for the Fund as well as the Select Sector SPDR exchange traded funds (“Underlying Sector ETFs”) that the Fund invests in. As required by exemptive relief obtained by the Underlying Sector ETFs, the Adviser will reimburse the Fund an amount equal to the distribution fee received by APSD from the Underlying Sector ETFs attributable to the Fund’s investment in the Underlying Sector ETFs, for so long as APSD acts as the distributor to the Fund and the Underlying Sector ETFs. Such reimbursement is generally expected to equal 0.03% annually.
ALPS Equal Sector Weight ETF
| Notes to Financial Statements | November 30, 2017 |
Out of the unitary management fee, the Adviser pays substantially all expenses of the Fund, including the cost of transfer agency, custody, fund administration, legal, audit, independent trustees and other services, except for acquired fund fees and expenses, interest expenses, distribution fees or expenses, brokerage expenses, taxes and extraordinary expenses not incurred in the ordinary course of the Fund’s business. The Adviser’s unitary management fee is designed to pay substantially all of the Fund’s expenses and to compensate the Adviser for providing services for the Fund.
ALPS Fund Services, Inc., an affiliate of the Adviser, is the administrator of the Fund.
Each Trustee who is not an officer or employee of the Adviser, any sub-adviser or any of their affiliates (“Independent Trustees”) receives (1) a quarterly retainer of $5,000, (2) a per meeting fee for regularly scheduled meetings of $3,750, (3) $1,500 for any special meeting held outside of a regularly scheduled board meeting, and (4) reimbursement for all reasonable out-of-pocket expenses relating to attendance at meetings.
4. PURCHASES AND SALES OF SECURITIES
For the year ended November 30, 2017, the cost of purchases and proceeds from sales of investment securities, excluding short-term investments and in-kind transactions, were as follows:
| Fund | | Purchases | | | Sales | |
| ALPS Equal Sector Weight ETF | | $ | 8,585,556 | | | $ | 11,421,033 | |
For the year ended November 30, 2017 , the cost in-kind purchases and proceeds from in-kind sales were as follows:
| Fund | | Purchases | | | Sales | |
| ALPS Equal Sector Weight ETF | | $ | 18,898,359 | | | $ | 14,577,948 | |
For the year ended November 30, 2017, the ALPS Equal Sector Weight ETF had in-kind net realized gain of $5,873,207.
Gains on in-kind transactions are generally not considered taxable gains for federal income tax purposes and losses on in kind transactions are also not deductible for tax purposes.
5. CAPITAL SHARE TRANSACTIONS
Shares are created and redeemed by the Fund only in Creation Unit size aggregations of 50,000 Shares. Only broker-dealers or large institutional investors with creation and redemption agreements called Authorized Participants (“AP”) are permitted to purchase or redeem Creation Units from the Fund. Such transactions are generally permitted on an in-kind basis, with a balancing cash component to equate the transaction to the NAV per unit of the Fund on the transaction date. Cash may be substituted equivalent to the value of certain securities generally when they are not available in sufficient quantity for delivery, not eligible for trading by the AP or as a result of other market circumstances.
ALPS Equal Sector Weight ETF
| Notes to Financial Statements | November 30, 2017 |
PROXY VOTING RECORDS, POLICIES AND PROCEDURES
Information regarding how the Fund voted proxies relating to portfolio securities during the most recent 12-month period ended June 30 and a description of the Fund’s proxy voting policies and procedures used in determining how to vote for proxies are available without charge on the SEC’s website at www.sec.gov and upon request, by calling (toll-free) 1-866-675-2639.
PORTFOLIO HOLDINGS
The Trust is required to disclose, after its first and third fiscal quarters, the complete schedule of the Fund’s portfolio holdings with the SEC on Form N-Q. Forms N-Q for the Fund are available on the SEC’s website at www.sec.gov. The Fund’s Forms N-Q may also be reviewed and copied at the SEC’s Public Reference Room in Washington, D.C. and information on the operation of the Public Reference Room may be obtained by calling 1-800-SEC-0330. The Fund’s Forms N-Q are available without charge, upon request, by calling (toll-free) 1-866-675-2639 or by writing to ALPS ETF Trust at 1290 Broadway, Suite 1100, Denver, Colorado 80203.
TAX INFORMATION
The Fund designated the following for federal income tax purposes for distributions made during the calendar year ended December 31, 2016:
| | Qualified Dividend Income | Dividend Received Deduction |
| ALPS Equal Sector Weight ETF | 71.63% | 88.88% |
In early 2017, if applicable, shareholders of record received this information for the distributions paid to them by the Fund during the calendar year 2016 via Form 1099. The Fund will notify shareholders in early 2018 of amounts paid to them by the Fund, if any, during the calendar year 2017.
LICENSING AGREEMENT
Merrill Lynch, Pierce, Fenner & Smith Incorporated (“Merrill Lynch” or the “Licensor”) has entered into an index licensing agreement with ALPS Advisors Inc. (the “Advisor”) to allow the Advisor’s use of the Underlying Index of the ALPS Equal Sector Weight ETF (the “Fund”). The following disclosure relates to the Licensor:
The Fund is not issued, sponsored, endorsed, sold or promoted by Merrill Lynch or its affiliates (“Licensor”). Licensor makes no representation or warranty, express or implied, to the owners of the Fund or any member of the public regarding the advisability of investing in securities generally or in the Fund particularly or the ability of the Bank of America Securities Merrill Lynch Equal Sector Weight Index (“Index”) to track general market performance. Licensor’s only relationship to the Licensee is the licensing of the Index which is determined, composed and calculated by Licensor without regard to the Licensee or the Fund. Licensor has no obligation to take the needs of the Licensee or the owners of the Fund into consideration in determining, composing or calculating the Index. Licensor is not responsible for and has not participated in the determination of the timing of, prices at, or quantities of the Fund to be issued or in the determination or calculation of the equation by which the Fund is to be converted into cash. Licensor has no obligation or liability in connection with the issuance, administration, marketing or trading of the Fund.
LICENSOR DOES NOT GUARANTEE THE QUALITY, ACCURACY AND/OR THE COMPLETENESS OF THE INDEX OR ANY DATA INCLUDED THEREIN AND SHALL HAVE NO LIABILITY FOR ERRORS OR OMISSIONS OF ANY KIND RELATED TO THE INDEX OR DATA. LICENSOR MAKES NO WARRANTY, EXPRESS OR IMPLIED, AS TO RESULTS TO BE OBTAINED BY LICENSEE, OWNERS OF THE FUND, OR ANY OTHER PERSON OR ENTITY FROM THE USE OF THE INDEX OR ANY DATA INCLUDED THEREIN IN CONNECTION WITH THE RIGHTS LICENSED TO LICENSEE OR FOR ANY OTHER USE. LICENSOR MAKES NO EXPRESS OR IMPLIED WARRANTIES, AND HEREBY EXPRESSLY DISCLAIMS ALL WARRANTIES OF MERCHANTABILITY OR FITNESS FOR A PARTICULAR PURPOSE OR USE WITH RESPECT TO THE INDEX OR ANY DATA INCLUDED THEREIN. WITHOUT LIMITING ANY OF THE FOREGOING, IN NO EVENT SHALL LICENSOR HAVE ANY LIABILITY FOR ANY SPECIAL, PUNITIVE, INDIRECT, OR CONSEQUENTIAL DAMAGES (INCLUDING LOST PROFITS), EVEN IF NOTIFIED OF THE POSSIBILITY OF SUCH DAMAGES.
The Advisor does not guarantee the accuracy and/or the completeness of the Underlying Index or any data included therein, and the Advisor shall have no liability for any errors, omissions or interruptions therein. The Advisor makes no warranty, express or implied, as to results to be obtained by the Fund, owners of the Shares of the Fund or any other person or entity from the use of the Underlying Index or any data included therein. The Advisor makes no express or implied warranties, and expressly disclaims all warranties of merchantability or fitness for a particular purpose or use with respect to the Underlying Index or any data included therein. Without limiting any of the foregoing, in no event shall the Advisor have any liability for any special, punitive, direct, indirect or consequential damages (including lost profits) arising out of matters relating to the use of the Underlying Index even if notified of the possibility of such damages.
ALPS Equal Sector Weight ETF
| Board Considerations Regarding Approval of Investment Advisory Agreement | November 30, 2017 (Unaudited) |
At an in-person meeting held on June 8, 2017, the Board of Trustees of the Trust (the “Board” or the “Trustees”), including the Trustees who are not “interested persons” of the Trust within the meaning of the 1940 Act, as amended (the “Independent Trustees”), evaluated a proposal to approve the continuance of the Investment Advisory Agreement between the Trust and ALPS Advisors, Inc. (the “Adviser” or “AAI”) with respect to the ALPS Equal Sector Weight ETF (“EQL” or “the Fund”). The Independent Trustees also met separately to consider the Investment Advisory Agreement.
In evaluating the Investment Advisory Agreement with respect to the Fund, the Independent Trustees considered various factors, including (i) the nature, extent and quality of the services provided by AAI with respect to the Fund under the Investment Advisory Agreements; (ii) the advisory fees and other expenses paid by the Fund compared to those of similar funds managed by other investment advisers; (iii) the costs of the services provided to the Fund by AAI and the profits realized by AAI and its affiliates from its relationship to the Fund; (iv) the extent to which economies of scale have been or would be realized if and as the assets of the Fund grow and whether fees reflect the economies of scale for the benefit of shareholders; and (v) any additional benefits and other considerations.
With respect to the nature, extent and quality of the services provided by AAI under the Investment Advisory Agreement, the Independent Trustees considered and reviewed information concerning the services provided under the Investment Advisory Agreement, the investment parameters of the index of the Fund, financial information regarding AAI and its parent company, information describing AAI’s current organization and the background and experience of the persons responsible for the day-to-day management of the Fund.
The Independent Trustees reviewed information on the performance of the Fund and its benchmark. The Independent Trustees also evaluated the correlation and tracking error between the underlying index and the Fund’s performance. Based on their review, the Independent Trustees found that the nature and extent of services provided to each Fund under the Investment Advisory Agreements was appropriate and that the quality was satisfactory.
The Independent Trustees noted that the advisory fee for the Fund was a unitary fee pursuant to which AAI assumes all expenses of the Fund (including the cost of transfer agency, custody, fund administration, legal, audit and other services) other than the payments under the Investment Advisory Agreement, brokerage expenses, taxes, interest, litigation expenses and other extraordinary expenses.
With respect to the advisory fee rate, the Independent Trustees noted the following:
The net advisory fee rate for the Fund is lower than the median of its Broadridge expense group and the Fund’s expense ratio is slightly higher than the median of its Broadridge expense group.
Based on the foregoing, and the other information available to them, the Independent Trustees concluded that the advisory fee rate for the Fund was reasonable under the circumstances and in light of the quality of the services provided.
The Independent Trustees considered other benefits available to AAI because of its relationship with the Fund and concluded that the advisory fees were reasonable taking into account any such benefits.
The Independent Trustees also considered with respect to the Fund the information provided by AAI about the costs and profitability of AAI with respect to the Fund. The Independent Trustees reviewed and noted the relatively small size of the Fund and concluded that AAI was not realizing any economies of scale. The Independent Trustees determined that they would continue to evaluate whether further economies of scale have been achieved on an ongoing basis.
In voting to renew the Investment Advisory Agreement, the Independent Trustees concluded that the terms of the Investment Advisory Agreement are reasonable and fair in light of the services to be performed, the fees paid by certain other funds, expenses to be incurred and such other matters as the Independent Trustees considered relevant in the exercise of their reasonable business judgment. The Independent Trustees did not identify any single factor or group of factors as all important or controlling and considered all factors together.
ALPS Equal Sector Weight ETF
| Trustees & Officers | November 30, 2017 (Unaudited) |
The general supervision of the duties performed by the Adviser for the Fund under the Investment Advisory Agreement is the responsibility of the Board of Trustees. The Trust currently has four Trustees. Three Trustees have no affiliation or business connection with the Adviser or any of its affiliated persons and do not own any stock or other securities issued by the Adviser. These are the “non-interested” or “independent” Trustees (“Independent Trustees”). The other Trustee (the “Interested Trustee”) is affiliated with the Adviser.
The Independent Trustees of the Trust, their term of office and length of time served, their principal business occupations during the past five years, the number of portfolios in the Fund Complex overseen by each Independent Trustee, and other directorships, if any, held by the Trustee are shown below.
| INDEPENDENT TRUSTEES |
Name, Address & Year of Birth* | Position(s) Held with Trust | Term of Office and Length of Time Served** | Principal Occupation(s) During Past 5 Years | Number of Portfolios in Fund Complex Overseen by Trustees*** | Other Directorships Held by Trustees |
Mary K. Anstine,
1940 | Trustee | Since March 2008 | Ms. Anstine was President/Chief Executive Officer of HealthONE Alliance, Denver, Colorado, and former Executive Vice President of First Interstate Bank of Denver. Ms. Anstine is also Trustee/Director of AV Hunter Trust and Colorado Uplift Board. Ms. Anstine was formerly a Director of the Trust Bank of Colorado (later purchased and now known as Northern Trust Bank), HealthONE and Denver Area Council of the Boy Scouts of America and a member of the American Bankers Association Trust Executive Committee. | 42 | Ms. Anstine is a Trustee of ALPS Variable Investment Trust (10 funds); Financial Investors Trust (33 funds); Reaves Utility Income Fund (1 fund); and Westcore Trust (14 funds). |
Jeremy W. Deems, 1976 | Trustee | Since March 2008 | Mr. Deems is the Co-Founder, Chief Compliance Officer and Chief Financial Officer of Green Alpha Advisors, LLC. Mr. Deems is Co-Portfolio Manager of the Shelton Green Alpha Fund. Prior to joining Green Alpha Advisors, Mr. Deems was CFO and Treasurer of Forward Management, LLC, ReFlow Management Co., LLC, ReFlow Fund, LLC, a private investment fund, and Sutton Place Management, LLC, an administrative services company. | 44 | Mr. Deems is a Trustee of ALPS Variable Investment Trust (10 funds); Financial Investors Trust (33 funds); and Reaves Utility Income Fund (1 fund); Clough Funds Trust (1 fund) and Elevation ETF Trust (1 fund). |
Rick A. Pederson, 1952 | Trustee and Chairman | Has served as Trustee since March 2008. Has served as Chairman since July 2017. | Mr. Pederson is President, Foundation Properties, Inc. (a real estate investment management company), 1994 - present; Advisory Board Member, Bow River Capital Partners (private equity management), 2003 - present; Advisor, The Pauls Corporation (real estate investment management and development), 2008 - present; Chairman, Ross Consulting Group (real estate consulting services) 1983-2013; Advisory Board, Neenan Company (construction services) 2002-present; Board Member, Prosci Inc. (private business services) 2013-2016; Board Member, Citywide Banks (Colorado community bank) 2014-present; Board member, Professional Pediatric Health Care (a Denver-based home nursing firm) 2014 – present; Board Member, Strong-Bridge Consulting (management consulting) 2015-present; Director, National Western Stock Show (not-for-profit organization); Director, Biennial of the Americas (not-for-profit-organization), 2012- 2015; Board Member, History Colorado, 2015 -present. | 21 | Mr. Pederson is Trustee of Westcore Trust (14 funds) and Principal Real Estate Income Fund (1 fund). |
| * | The business address of the Trustee is c/o ALPS Advisors, Inc., 1290 Broadway, Suite 1100, Denver, Colorado 80203. |
| ** | This is the period for which the Trustee began serving the Trust. Each Trustee serves an indefinite term, until his successor is elected. |
| *** | The Fund Complex includes all series of the Trust and any other investment companies for which ALPS Advisors, Inc. provides investment advisory services. |
ALPS Equal Sector Weight ETF
| Trustees & Officers | November 30, 2017 (Unaudited) |
The Trustee who is affiliated with the Adviser or affiliates of the Adviser and executive officers of the Trust, his term of office and length of time served, his principal business occupations during the past five years, the number of portfolios in the Fund Complex overseen by the Interested Trustee and the other directorships, if any, held by the Trustee, are shown below.
| INTERESTED TRUSTEE |
| Name, Address and Year of Birth of Interested Trustee* | Position(s) Held with Trust | Term of Office and Length of Time Served** | Principal Occupation(s) During Past 5 Years | Number of Portfolios in Fund Complex Overseen by Trustees*** | Other Directorships Held by Trustee |
Edmund J. Burke,
1961 | Trustee and President | Mr. Burke was elected as Trustee of the Trust and President of the Trust at the December 11, 2017 meeting of the Board of Trustees. | Mr. Burke is President and a Director of ALPS Holdings, Inc. (“AHI”) (since 2005) and Director of Boston Financial Data Services, Inc. (“BFDS”), ALPS Advisors, Inc. (“AAI”), ALPS Distributors, Inc. (“ADI”), ALPS Fund Services, Inc. (“AFS”) and ALPS Portfolio Solutions Distributor, Inc. (“APSD”) and from 2001-2008, was President of AAI, ADI, AFS and APSD. Because of his positions with AHI, BFDS, AAI, ADI, AFS and APSD, Mr. Burke is deemed an affiliate of the Trust as defined under the 1940 Act. Mr. Burke is Trustee and President of the Clough Global Allocation Fund (Trustee since 2006; President since 2004); Trustee and President of the Clough Global Equity Fund (Trustee since 2006; President since 2005); Trustee and President of the Clough Global Opportunities Fund (since 2006); Trustee of the Liberty All-Star Equity Fund; Director of the Liberty All-Star Growth Fund, Inc. and Trustee and President of Financial Investors Trust (Trustee since 2009; President since 2002). | 36 | Mr. Burke is a Trustee of Clough Global Dividend and Income Fund (1 fund); Clough Global Equity Fund (1 fund); Clough Global Opportunities Fund (1 fund); Clough Funds Trust (1 fund); Liberty All -Star Equity Fund (1 fund); Director of the Liberty All-Star Growth Fund, Inc. (1 fund) and Financial Investors Trust (33 funds). |
| * | The business address of the Trustee is c/o ALPS Advisors, Inc., 1290 Broadway, Suite 1100, Denver, Colorado 80203. |
| ** | This is the period for which the Trustee began serving the Trust. Each Trustee serves an indefinite term, until his successor is elected. |
| *** | The Fund Complex includes all series of the Trust and any other investment companies for which ALPS Advisors, Inc. provides investment advisory services. |
ALPS Equal Sector Weight ETF
| Trustees & Officers | November 30, 2017 (Unaudited) |
| OFFICERS |
| Name, Address and Year of Birth of Officer | Position(s) Held with Trust | Length of Time Served* | Principal Occupation(s) During Past 5 Years |
Erin D. Nelson, 1977 | Chief Compliance Officer (“CCO”) | Since December 2015 | Erin Nelson became Senior Vice-President and Chief Compliance Officer of ALPS Advisors, Inc. (“AAI”) on July 1, 2015 and prior to that served as Vice President and Deputy Chief Compliance Officer of AAI since January 1, 2015. Prior to January 1, 2015, Ms. Nelson was Vice-President and Assistant General Counsel of ALPS Fund Services, Inc. Because of her position with AAI, Ms. Nelson is deemed an affiliate of the Trust as defined under the 1940 Act. Ms. Nelson is also the CCO of ALPS Variable Investment Trust, Liberty All-Star Growth Fund, Inc., Liberty All-Star Equity Fund, Principal Real Estate Income Fund, RiverNorth Opportunities Fund, Inc. and Red Rocks Capital, LLC. |
Patrick D. Buchanan, 1972 | Treasurer | Since June 2012 | Mr. Buchanan is Vice President of AAI. Mr. Buchanan joined ALPS in 2007 and because of his position with AAI, he is deemed an affiliate of the Trust as defined under the 1940 Act. Mr. Buchanan is also Treasurer of the ALPS Variable Insurance Trust, Principal Real Estate Income Fund, Clough Funds Trust and RiverNorth Opportunities Fund, Inc. |
Andrea E. Kuchli, 1985 | Secretary | Since December 2017 | Ms. Kuchli joined ALPS in 2015 and is currently Vice President and Senior Counsel of ALPS. Prior to joining ALPS, Ms. Kuchli was an Associate with Davis Graham & Stubbs LLP from April 2014 to February 2015, and an Associate with Dechert LLP from 2011 to April 2014. Because of her position with ALPS, Ms. Kuchli is deemed an affiliate of the Trust as defined under the 1940 Act. Ms. Kuchli is also Secretary of ALPS Variable Investment Trust, Elevation ETF Trust and Principal Real Estate Income Fund as well as Assistant Secretary of the James Advantage Funds. |
Sharon Akselrod, 1974 | Assistant Secretary | Since December 2016 | Ms. Akselrod joined ALPS in August 2014 and is currently Senior Investment Company Act Paralegal of ALPS Fund Services, Inc. Prior to joining ALPS, Ms. Akselrod served as Corporate Governance and Regulatory Associate for Nordstrom fsb (2013-2014) and Senior Legal Assistant – Legal Manager for AXA Equitable Life Insurance Company (2008-2013). Because of her position with ALPS, Ms. Akselrod is deemed an affiliate of the Trust as defined under the 1940 Act. Ms. Akselrod is also Assistant Secretary of Financial Investors Trust and Principal Real Estate Income Fund. |
Stephanie G. Danner, 1992 | Assistant Secretary | Since December 2017 | Ms. Danner joined ALPS in September of 2017 and is currently Vice President and Associate Senior Counsel of ALPS. Because of her position with ALPS, Ms. Danner is deemed an affiliate of the Trust as defined under the 1940 Act. |
| * | The business address of each Officer is c/o ALPS Advisors, Inc., 1290 Broadway, Suite 1100, Denver, Colorado 80203. |
| ** | This is the period for which the Officer began serving the Trust. Each Officer serves an indefinite term, until his/her successor is elected. |
The Statement of Additional Information includes additional information about the Fund's Trustees and is available, without charge, upon request by calling (toll-free) 1-866-675-2639.
| Performance Overview | 1 |
| Disclosure of Fund Expenses | 4 |
| Report of Independent Registered Public Accounting Firm | 5 |
| Schedule of Investments | 6 |
| Statement of Assets & Liabilities | 9 |
| Statement of Operations | 10 |
| Statements of Changes In Net Assets | 11 |
| Financial Highlights | 12 |
| Notes to Financial Statements | 13 |
| Additional Information | 19 |
| Board Considerations Regarding Approval of Investment Advisory Agreement | 20 |
| Trustees & Officers | 21 |
alpsfunds.com
ALPS Medical Breakthroughs ETF
| Performance Overview | November 30, 2017 (Unaudited) |
Investment Objective
ALPS Medical Breakthroughs ETF (the “Fund”) employs a “passive management” – or indexing – investment approach designed to seek investment results that correspond (before fees and expenses) generally to the performance of the Poliwogg Medical Breakthroughs IndexSM (the “Underlying Index”).
The Underlying Index is comprised of small- and mid-cap stocks of biotechnology and pharmaceutical companies that have one or more drugs in either Phase II or Phase III U.S. Food and Drug Administration (“FDA”) clinical trials. In a Phase II trial, the drug is administered to a group of 100-300 people to see if it is effective and to evaluate its safety. In a Phase III trial, the drug is given to a larger group, between 500-3,000 people, to confirm its effectiveness, monitor side effects, compare it to commonly used treatments and collect information that will allow the drug or treatment to be used safely. Stocks selected for inclusion in the Underlying Index must be listed on a U.S. stock exchange. Underlying Index constituents must have a market capitalization of no less than $200 million and no more than $5 billion. Stocks included in the Underlying Index must also sustain an average daily trading volume in excess of $1 million for the 90-day period preceding an Underlying Index reconstitution. Constituents must be able to sustain the monthly rates at which they use shareholder capital (“cash burn rates”) for at least 24 months. The Underlying Index is reconstituted semi-annually on the third Fridays of June and December.
Performance Overview
ALPS Medical Breakthroughs ETF (SBIO), for the one year period ended November 30, 2017, generated a total return of 31.21%, in-line with the Fund’s Underlying Index, net of fees, which returned 31.50%. The Fund outperformed the broad market’s return of 22.87% as represented by the S&P 500® while almost doubling the NASDAQ Biotechnology Total Return Index’s return of 16.02% as the small and mid-cap developmental space outperformed.
After a rough 2016 for the biotech space, pulled down by perceived pricing abuse as well as overall speculation on the regulatory environment, 2017 provided a much needed rise with the small/mid-cap space being a clear benefactor. The sub-sector returned to fundamentals with positive drug data and possible mergers and acquisition fueling the recovery. Favorable tax reform including a one-time repatriation at a lower tax rate for companies holding cash overseas helped to bring home a stellar year.
Small and mid-cap names added 4.4% and 6.85% in alpha, respectively, to the Fund over the Nasdaq Biotechnology Total Return Index. The Fund’s 0% allocation to large cap contributed to the outperformance as well. Security selection was strongest in the small cap space showcasing the Fund’s ability to enhance the exposure to innovative biotechnology firms through its selection criteria.
The best performing stocks in the Fund for the period were Anaptysbio Inc (ANAB), Kite Pharma Inc (KITE), and Nektar Therapeutics (NKTR) up 254.34%, 250.70%, and 196.65% while the bottom performers, Novan Inc (NOVN), Versartis Inc (VSAR) and Ophthotech Corp (OPTH) were down 85.58%, 86.87%, and 91.45% respectively.
Due to the high failure rate of companies within the space, the non-traditional metrics used to evaluate biotech companies, volatility, and specialized knowledge required to succeed in the space, biotechnology is a difficult industry for stock pickers. This environment makes a passive strategy attractive, as it provides a diversified, rules- based access vehicle for those looking to gain exposure to the biotechnology space, while eliminating single name risk. The Fund and its Underlying Index focus on innovation, seeking to capture research and development opportunities in the biotechnology and pharmaceutical industries. Looking forward we believe the Fund’s strategy of providing exposure to small- and mid-cap biotechnology and pharmaceutical companies that have one or more drugs in either Phase II or Phase III FDA clinical trials can provide potential alpha and pure-play exposure to the biotech space.
ALPS Medical Breakthroughs ETF
| Performance Overview | November 30, 2017 (Unaudited) |
Growth Of $10,000 (as of November 30, 2017)
Comparison of change in value of a $10,000 investment in the Fund and the Index
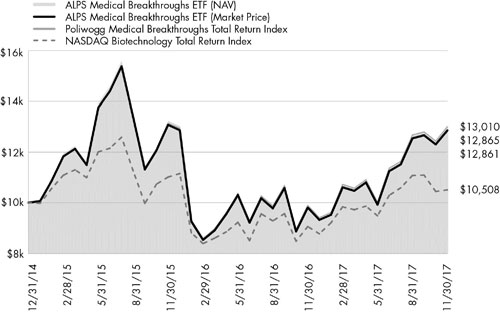
The chart above represents historical performance of a hypothetical investment of $10,000 in the Fund over the life of the Fund. Performance calculations are as of the end of each month. Past performance does not guarantee future results. This chart does not reflect the deduction of taxes that a shareholder would pay on Fund distributions or the redemption of Fund shares.
Fund Performance (as of November 30, 2017)
| | 1 Year | Since Inception^ |
| ALPS Medical Breakthroughs ETF - NAV | 31.21% | 9.02% |
| ALPS Medical Breakthroughs ETF - Market Price* | 31.17% | 9.01% |
| Poliwogg Medical Breakthroughs Total Return Index | 31.50% | 9.44% |
| NASDAQ Biotechnology Total Return Index | 16.02% | 1.71% |
Total Expense Ratio (per the current prospectus) 0.50%
Performance data quoted represents past performance. Past performance does not guarantee future results. Investment return and principal value of an investment will fluctuate so that an investor’s shares, when sold or redeemed, may be worth more or less than the original cost. Current performance data may be higher or lower than actual data quoted. For most current month-end performance data please visit www.alpsfunds.com or call 1.844.234.5852.
NAV is an exchange-traded fund’s per-share value. The per-share dollar amount of the fund is derived by dividing the total value of all the securities in its portfolio, less any liabilities, by the number of fund shares outstanding. Market Price is the price at which a share can currently be traded in the market. Information detailing the number of days the Market Price of the Fund was greater than the Fund’s NAV and the number of days it was less than the Fund’s NAV can be obtained at www.alpsfunds.com.
| ^ | The Fund commenced investment operations on December 31, 2014. |
| * | Market Price is based on the midpoint of the bid-ask spread at 4 p.m. ET and does not represent the returns an investor would receive if shares were traded at other times. |
ALPS Medical Breakthroughs ETF
| Performance Overview | November 30, 2017 (Unaudited) |
NASDAQ Biotechnology Total Return Index (Ticker: NBI) is a modified market capitalization-weighted index designed to measure the performance of the all NASDAQ stocks in the biotechnology sector. Total return assumes reinvestment of any dividends and distributions realized during a given time period.
Poliwogg Medical Breakthroughs Total Return Index is designed to capture research and development opportunities in the pharmaceutical industry. PMBI consists of small-cap and mid-cap pharmaceutical and biotechnology stocks listed on U.S. stock exchanges that have one or more drugs in either Phase II or Phase III U.S. FDA clinical trials. Total return assumes reinvestment of any dividends and distributions realized during a given time period.
One cannot invest directly in an index. Index performance does not reflect fund performance.
Companies in the pharmaceuticals and biotechnology industry may be subject to extensive litigation based on product liability and similar claims. Legislation introduced or considered by certain governments on such industries or on the healthcare sector cannot be predicted.
Companies in the pharmaceuticals industry are subject to competitive forces that may make it difficult to raise prices and, in fact, may result in price discounting. The profitability of some companies in the pharmaceuticals industry may be dependent on a relatively limited number of products. In addition, their products can become obsolete due to industry innovation, changes in technologies or other market developments. Many new products in the pharmaceuticals industry are subject to government approvals, regulation and reimbursement rates. The process of obtaining government approvals may be long and costly. Many companies in the pharmaceuticals industry are heavily dependent on patents and intellectual property rights. The loss or impairment of these rights may adversely affect the profitability of these companies.
The development of new drugs generally has a high failure rate, and such failures may negatively impact the stock price of the company developing the failed drug. Biotechnology companies may have persistent losses during a new product’s transition from development to production. In order to fund operations, biotechnology companies may require financing from the capital markets, which may not always be available on satisfactory terms or at all.
The Fund’s shares are not individually redeemable. Investors buy and sell shares of the Fund on a secondary market. Only market makers or “authorized participants” may trade directly with the Fund, typically in blocks of 50,000 shares.
The ALPS Medical Breakthroughs ETF is not suitable for all investors. Investments in the Fund are subject to investment risks, including possible loss of the principal amount invested.
ALPS Portfolio Solutions Distributor, Inc., a FINRA member, is the Distributor for the ALPS Medical Breakthroughs ETF.
ALPS Portfolio Solutions Distributor, Inc. is not affiliated with S-Network Global Indexes, Inc.
Top Ten Holdings* (as of November 30, 2017)
| Nektar Therapeutics | 6.33% |
| Bluebird Bio, Inc. | 5.91% |
| Exelixis, Inc. | 4.69% |
| Galapagos NV | 3.36% |
| Taro Pharmaceutical Industries, Ltd. | 3.26% |
| Akorn, Inc. | 3.05% |
| FibroGen, Inc. | 2.82% |
| ACADIA Pharmaceuticals, Inc. | 2.77% |
| Advanced Accelerator Applications SA | 2.68% |
| Sage Therapeutics, Inc. | 2.59% |
| Total % of Top 10 Holdings | 37.46% |
| * | % of Total Investments (excluding investments purchased with collateral from securities loaned) |
Future holdings are subject to change.
Sector Allocation* (as of November 30, 2017)
ALPS Medical Breakthroughs ETF
| Disclosure of Fund Expenses | November 30, 2017 (Unaudited) |
Shareholder Expense Example: As a shareholder of the Fund, you incur two types of costs: (1) transaction costs which may include creation and redemption fees or brokerage charges, and (2) ongoing costs, including management fees and other Fund expenses. These examples are intended to help you understand your ongoing costs (in dollars) of investing in the Fund and to compare these costs with the ongoing costs of investing in other funds. It is based on an investment of $1,000 invested at the beginning of the (six month) period and held through November 30, 2017.
Actual Return: The first line of the table provides information about actual account values and actual expenses. You may use the information in this line, together with the amount you invested, to estimate the expenses that you incurred over the period. Simply divide your account value by $1,000 (for example, an $8,600 account value divided by $1,000 = 8.6), then multiply the result by the number in the first line under the heading entitled “Expenses Paid During Period” to estimate the expenses attributable to your investment during this period.
Hypothetical 5% Return: The second line of the table provides information about hypothetical account values and hypothetical expenses based on the Fund’s actual expense ratio and an assumed rate of return of 5% per year before expenses, which is not the Fund’s actual return. The hypothetical account values and expenses may not be used to estimate the actual ending account balance or expenses you paid for the period. You may use this information to compare ongoing costs of investing in the Fund and other funds. To do so, compare this 5% hypothetical example with the 5% hypothetical examples that appear in the shareholder reports of the other funds.
The expenses shown in the table are meant to highlight ongoing Fund costs only and do not reflect any transaction costs, such as creation and redemption fees, or brokerage charges. Therefore, the second line is useful in comparing ongoing costs only, and will not help you determine the relative total costs of owning different funds. In addition, if these costs were included, your costs would have been higher.
| | Beginning Account Value 6/1/17 | Ending Account Value 11/30/17 | Expense Ratio(a) | Expenses Paid During Period 6/1/17 - 11/30/17(b) |
| ALPS Medical Breakthroughs ETF | | | | |
| Actual | $1,000.00 | $1,296.00 | 0.50% | $2.88 |
| Hypothetical (5% return before expenses) | $1,000.00 | $1,022.56 | 0.50% | $2.54 |
| (a) | Annualized, based on the Fund's most recent fiscal half year expenses. |
| (b) | Expenses are equal to the Fund's annualized expense ratio multiplied by the average account value over the period, multiplied by the number of days in the most recent fiscal half year (183), divided by 365. |
ALPS Medical Breakthroughs ETF
Report of Independent Registered Public Accounting Firm
To the Board of Trustees and Shareholders of ALPS ETF Trust:
We have audited the accompanying statement of assets and liabilities, including the schedule of investments, of ALPS Medical Breakthroughs ETF, one of the portfolios constituting the ALPS ETF Trust (the “Trust”), as of November 30, 2017, and the related statement of operations for the year then ended, the statements of changes in net assets for each of the two years in the period then ended, and the financial highlights for each of the periods presented. These financial statements and financial highlights are the responsibility of the Trust’s management. Our responsibility is to express an opinion on these financial statements and financial highlights based on our audits.
We conducted our audits in accordance with the standards of the Public Company Accounting Oversight Board (United States). Those standards require that we plan and perform the audit to obtain reasonable assurance about whether the financial statements and financial highlights are free of material misstatement. The Trust is not required to have, nor were we engaged to perform, an audit of its internal control over financial reporting. Our audits included consideration of internal control over financial reporting as a basis for designing audit procedures that are appropriate in the circumstances, but not for the purpose of expressing an opinion on the effectiveness of the Trust’s internal control over financial reporting. Accordingly, we express no such opinion. An audit also includes examining, on a test basis, evidence supporting the amounts and disclosures in the financial statements, assessing the accounting principles used and significant estimates made by management, as well as evaluating the overall financial statement presentation. Our procedures included confirmation of securities owned as of November 30, 2017, by correspondence with the custodian. We believe that our audits provide a reasonable basis for our opinion.
In our opinion, the financial statements and financial highlights referred to above present fairly, in all material respects, the financial position of ALPS Medical Breakthroughs ETF of the ALPS ETF Trust as of November 30, 2017, the results of its operations for the year then ended, the changes in its net assets for each of the two years in the period then ended, and the financial highlights for each of the periods presented, in conformity with accounting principles generally accepted in the United States of America.
DELOITTE & TOUCHE LLP
Denver, Colorado
January 26, 2018
ALPS Medical Breakthroughs ETF
| Schedule of Investments | November 30, 2017 |
| Security Description | | Shares | | | Value | |
| COMMON STOCKS (99.99%) | | | | | | | | |
| Biotechnology (70.46%) | | | | | | | | |
| ACADIA Pharmaceuticals, Inc.(a) | | | 117,720 | | | $ | 3,561,030 | |
| Acceleron Pharma, Inc.(a) | | | 37,118 | | | | 1,354,436 | |
| Achaogen, Inc.(a)(b) | | | 40,450 | | | | 483,782 | |
| Achillion Pharmaceuticals, Inc.(a) | | | 131,936 | | | | 411,640 | |
| Acorda Therapeutics, Inc.(a) | | | 44,796 | | | | 909,359 | |
| Adamas Pharmaceuticals, Inc.(a)(b) | | | 21,695 | | | | 805,969 | |
| Adaptimmune Therapeutics PLC, ADR(a) | | | 90,046 | | | | 745,581 | |
| Aduro Biotech, Inc.(a)(b) | | | 71,840 | | | | 682,480 | |
| Advanced Accelerator Applications SA, ADR(a) | | | 42,337 | | | | 3,444,115 | |
| Agios Pharmaceuticals, Inc.(a) | | | 46,426 | | | | 2,857,520 | |
| Aimmune Therapeutics, Inc.(a) | | | 48,650 | | | | 1,858,430 | |
| Akebia Therapeutics, Inc.(a) | | | 45,318 | | | | 705,148 | |
| AMAG Pharmaceuticals, Inc.(a) | | | 33,965 | | | | 473,812 | |
| AnaptysBio, Inc.(a) | | | 19,573 | | | | 1,645,111 | |
| Aquinox Pharmaceuticals, Inc.(a) | | | 22,585 | | | | 238,498 | |
| Array BioPharma, Inc.(a) | | | 165,018 | | | | 1,856,453 | |
| Ascendis Pharma A/S, ADR(a) | | | 31,208 | | | | 1,157,817 | |
| Atara Biotherapeutics, Inc.(a) | | | 29,409 | | | | 424,960 | |
| Aurinia Pharmaceuticals, Inc.(a)(b) | | | 80,300 | | | | 423,984 | |
| Axovant Sciences, Ltd.(a) | | | 103,499 | | | | 571,314 | |
| BeiGene, Ltd., ADR(a) | | | 40,786 | | | | 3,262,880 | |
| BioCryst Pharmaceuticals, Inc.(a) | | | 77,408 | | | | 393,233 | |
| Biohaven Pharmaceutical Holding Co., Ltd.(a) | | | 34,403 | | | | 795,741 | |
| Bluebird Bio, Inc.(a)(b) | | | 43,879 | | | | 7,582,291 | |
| Chimerix, Inc.(a) | | | 45,280 | | | | 202,402 | |
| Concert Pharmaceuticals, Inc.(a) | | | 21,830 | | | | 492,485 | |
| Corbus Pharmaceuticals Holdings, Inc.(a) | | | 48,329 | | | | 372,133 | |
| DBV Technologies SA, Sponsored ADR(a) | | | 46,400 | | | | 1,059,776 | |
| Emergent BioSolutions, Inc.(a) | | | 39,659 | | | | 1,742,220 | |
| Enanta Pharmaceuticals, Inc.(a) | | | 18,317 | | | | 909,622 | |
| Epizyme, Inc.(a) | | | 56,171 | | | | 674,052 | |
| Exelixis, Inc.(a) | | | 222,359 | | | | 6,021,482 | |
| FibroGen, Inc.(a) | | | 76,228 | | | | 3,620,830 | |
| Five Prime Therapeutics, Inc.(a) | | | 27,687 | | | | 729,552 | |
| Flexion Therapeutics, Inc.(a)(b) | | | 30,706 | | | | 795,592 | |
| Forward Pharma A/S, ADR | | | 45,411 | | | | 186,639 | |
| G1 Therapeutics, Inc.(a) | | | 27,131 | | | | 557,542 | |
| Galapagos NV, Sponsored ADR(a) | | | 48,910 | | | | 4,312,884 | |
| Global Blood Therapeutics, Inc.(a) | | | 42,035 | | | | 1,658,281 | |
| Halozyme Therapeutics, Inc.(a) | | | 136,604 | | | | 2,550,397 | |
| Idera Pharmaceuticals, Inc.(a) | | | 144,034 | | | | 318,315 | |
| Intercept Pharmaceuticals, Inc.(a)(b) | | | 24,158 | | | | 1,483,543 | |
| Ironwood Pharmaceuticals, Inc.(a) | | | 130,008 | | | | 2,245,238 | |
| Jounce Therapeutics, Inc.(a)(b) | | | 30,952 | | | | 487,804 | |
| Ligand Pharmaceuticals, Inc.(a) | | | 20,134 | | | | 2,654,668 | |
| Loxo Oncology, Inc.(a) | | | 28,734 | | | | 2,205,335 | |
| MacroGenics, Inc.(a) | | | 35,416 | | | | 684,237 | |
| Matinas BioPharma Holdings, Inc.(a) | | | 88,527 | | | | 124,823 | |
| Minerva Neurosciences, Inc.(a) | | | 40,919 | | | | 235,284 | |
| NantKwest, Inc.(a)(b) | | | 76,463 | | | | 374,669 | |
| OPKO Health, Inc.(a)(b) | | | 538,304 | | | | 2,826,096 | |
| Otonomy, Inc.(a) | | | 29,165 | | | | 156,033 | |
| Ovid therapeutics, Inc.(a) | | | 23,682 | | | | 291,525 | |
ALPS Medical Breakthroughs ETF
| Schedule of Investments | November 30, 2017 |
| Security Description | | Shares | | | Value | |
| Biotechnology (70.46%) (continued) | | | | | | | | |
| PDL BioPharma, Inc.(a) | | | 148,312 | | | $ | 431,588 | |
| Portola Pharmaceuticals, Inc.(a) | | | 55,499 | | | | 2,816,574 | |
| Progenics Pharmaceuticals, Inc.(a) | | | 67,636 | | | | 390,936 | |
| PTC Therapeutics, Inc.(a)(b) | | | 39,839 | | | | 635,432 | |
| Ra Pharmaceuticals, Inc.(a) | | | 21,756 | | | | 310,241 | |
| Sage Therapeutics, Inc.(a) | | | 36,040 | | | | 3,330,456 | |
| Seres Therapeutics, Inc.(a)(b) | | | 38,994 | | | | 409,437 | |
| Spark Therapeutics, Inc.(a) | | | 34,475 | | | | 2,524,604 | |
| Syndax Pharmaceutic(a) | | | 21,387 | | | | 187,350 | |
| Tocagen, Inc.(a) | | | 19,065 | | | | 227,636 | |
| Ultragenyx Pharmaceutical, Inc.(a) | | | 40,858 | | | | 2,062,920 | |
| UroGen Pharma, Ltd.(a)(b) | | | 11,522 | | | | 465,143 | |
| Versartis, Inc.(a) | | | 34,240 | | | | 66,768 | |
| Total Biotechnology | | | | | | | 90,478,128 | |
| | | | | | | | | |
| Pharmaceuticals (29.53%) | | | | | | | | |
| Aclaris Therapeutics, Inc.(a) | | | 28,691 | | | | 680,264 | |
| Aerie Pharmaceuticals, Inc.(a) | | | 34,999 | | | | 2,248,686 | |
| Akorn, Inc.(a) | | | 120,235 | | | | 3,913,649 | |
| Avadel Pharmaceuticals PLC, ADR(a) | | | 38,585 | | | | 349,194 | |
| Depomed, Inc.(a) | | | 60,599 | | | | 415,709 | |
| Endo International PLC(a) | | | 214,387 | | | | 1,573,601 | |
| GW Pharmaceuticals PLC, ADR(a)(b) | | | 24,350 | | | | 3,031,331 | |
| Horizon Pharma PLC(a) | | | 157,237 | | | | 2,261,068 | |
| Impax Laboratories, Inc.(a) | | | 71,527 | | | | 1,190,925 | |
| Lannett Co., Inc.(a)(b) | | | 35,880 | | | | 949,026 | |
| MyoKardia, Inc.(a) | | | 33,647 | | | | 1,236,527 | |
| Nektar Therapeutics(a) | | | 150,477 | | | | 8,124,253 | |
| Ocular Therapeutix, Inc.(a) | | | 27,936 | | | | 115,096 | |
| Pacira Pharmaceuticals, Inc.(a) | | | 38,832 | | | | 1,794,038 | |
| Paratek Pharmaceuticals, Inc.(a) | | | 26,716 | | | | 503,597 | |
| Reata Pharmaceuticals, Inc., Class A(a)(b) | | | 17,896 | | | | 454,558 | |
| Revance Therapeutics, Inc.(a)(b) | | | 29,657 | | | | 822,982 | |
| Sucampo Pharmaceuticals, Inc., Class A(a) | | | 44,811 | | | | 569,100 | |
| Supernus Pharmaceuticals, Inc.(a) | | | 48,798 | | | | 1,844,564 | |
| Taro Pharmaceutical Industries, Ltd.(a)(b) | | | 38,994 | | | | 4,184,056 | |
| Theravance Biopharma, Inc.(a)(b) | | | 51,806 | | | | 1,473,881 | |
| Zynerba Pharmaceuticals, Inc.(a)(b) | | | 12,754 | | | | 175,623 | |
| Total Pharmaceuticals | | | | | | | 37,911,728 | |
| | | | | | | | | |
| TOTAL COMMON STOCKS | | | | | | | | |
| (Cost $127,087,114) | | | | | | | 128,389,856 | |
| | | | | | | | | |
| RIGHTS (0.00%)(c) | | | | | | | | |
| Biotechnology (0.00%)(c) | | | | | | | | |
| Dyax Corp. - CVR (Expiring 12/31/2019)(a) | | | 170,016 | | | | 1,700 | |
| Total Biotechnology | | | | | | | 1,700 | |
| | | | | | | | | |
| TOTAL RIGHTS | | | | | | | | |
| (Cost $–) | | | | | | | 1,700 | |
ALPS Medical Breakthroughs ETF
| Schedule of Investments | November 30, 2017 |
| | | 7 Day Yield | | | Shares | | | Value | |
| SHORT TERM INVESTMENTS (5.89%) | | | | | | | | | | | | |
| Money Market Fund (0.03%) | | | | | | | | | | | | |
| State Street Institutional Treasury Plus Money Market Fund | | | | | | | | | | | | |
| (Cost $35,320) | | | 0.970 | % | | | 35,320 | | | $ | 35,320 | |
| | | | | | | | | | | | | |
| Investments Purchased with Collateral from Securities Loaned (5.86%) | | | | | | | | | | | | |
| State Street Navigator Securities Lending Prime Portfolio, 1.04% | | | | | | | | | | | | |
| (Cost $7,521,665) | | | | | | | 7,521,665 | | | | 7,521,665 | |
| | | | | | | | | | | | | |
| TOTAL SHORT TERM INVESTMENTS | | | | | | | | | | | | |
| (Cost $7,556,985) | | | | | | | | | | | 7,556,985 | |
| | | | | | | | | | | | | |
| TOTAL INVESTMENTS (105.88%) | | | | | | | | | | | | |
| (Cost $134,644,099) | | | | | | | | | | $ | 135,948,541 | |
| | | | | | | | | | | | | |
| NET LIABILITIES LESS OTHER ASSETS (-5.88%) | | | | | | | | | | | (7,546,363 | ) |
| | | | | | | | | | | | | |
| NET ASSETS (100.00%) | | | | | | | | | | $ | 128,402,178 | |
| (a) | Non-income producing security. |
| (b) | Security, or a portion of the security position, is currently on loan. The total market value of securities on loan is $15,081,434. |
| (c) | Less than 0.005% of Net Assets. |
See Notes to Financial Statements.
ALPS Medical Breakthroughs ETF
| Statement of Assets and Liabilities | November 30, 2017 |
| ASSETS: | | | |
| Investments, at value | | $ | 135,948,541 | |
| Dividends receivable | | | 27,048 | |
| Total Assets | | | 135,975,589 | |
| | | | | |
| LIABILITIES: | | | | |
| Payable to adviser | | | 51,746 | |
| Payable for collateral upon return of securities loaned | | | 7,521,665 | |
| Total Liabilities | | | 7,573,411 | |
| NET ASSETS | | $ | 128,402,178 | |
| | | | | |
| NET ASSETS CONSIST OF: | | | | |
| Paid-in capital | | $ | 168,206,431 | |
| Accumulated net investment income | | | 721,564 | |
| Accumulated net realized loss | | | (41,830,259 | ) |
| Net unrealized appreciation | | | 1,304,442 | |
| NET ASSETS | | $ | 128,402,178 | |
| | | | | |
| INVESTMENTS, AT COST | | $ | 134,644,099 | |
| | | | | |
| PRICING OF SHARES | | | | |
| Net Assets | | $ | 128,402,178 | |
| Shares of beneficial interest outstanding (Unlimited number of shares authorized, par value $0.01 per share) | | | 4,050,000 | |
| Net Asset Value, offering and redemption price per share | | $ | 31.70 | |
See Notes to Financial Statements.
ALPS Medical Breakthroughs ETF
| Statement of Operations | For the Year Ended November 30, 2017 |
| INVESTMENT INCOME: | | | |
| Dividends(a) | | $ | 943,868 | |
| Securities Lending Income | | | 367,094 | |
| Total Investment Income | | | 1,310,962 | |
| | | | | |
| EXPENSES: | | | | |
| Investment adviser fees | | | 565,171 | |
| Total Expenses | | | 565,171 | |
| NET INVESTMENT INCOME | | | 745,791 | |
| | | | | |
| REALIZED AND UNREALIZED GAIN/LOSS | | | | |
| Net realized loss on investments | | | (4,937,819 | ) |
| Net change in unrealized appreciation on investments | | | 34,206,761 | |
| NET REALIZED AND UNREALIZED GAIN ON INVESTMENTS | | | 29,268,942 | |
| NET INCREASE IN NET ASSETS RESULTING FROM OPERATIONS | | $ | 30,014,733 | |
| (a) | Net of foreign tax withholding $2,129. |
See Notes to Financial Statements.
ALPS Medical Breakthroughs ETF
Statements of Changes in Net Assets
| | | For the Year Ended November 30, 2017 | | | For the Year Ended November 30, 2016 | |
| OPERATIONS: | | | | | | |
| Net investment income/(loss) | | $ | 745,791 | | | $ | (480,047 | ) |
| Net realized loss | | | (4,937,819 | ) | | | (30,798,551 | ) |
| Net change in unrealized appreciation/(depreciation) | | | 34,206,761 | | | | (12,050,766 | ) |
| Net increase/(decrease) in net assets resulting from operations | | | 30,014,733 | | | | (43,329,364 | ) |
| | | | | | | | | |
| CAPITAL SHARE TRANSACTIONS: | | | | | | | | |
| Proceeds from sale of shares | | | 27,695,734 | | | | 38,083,584 | |
| Cost of shares redeemed | | | (47,678,198 | ) | | | (47,208,086 | ) |
| Net decrease from capital share transactions | | | (19,982,464 | ) | | | (9,124,502 | ) |
| Net increase/(decrease) in net assets | | | 10,032,269 | | | | (52,453,866 | ) |
| | | | | | | | | |
| NET ASSETS: | | | | | | | | |
| Beginning of year | | | 118,369,909 | | | | 170,823,775 | |
| End of year * | | $ | 128,402,178 | | | $ | 118,369,909 | |
| | | | | | | | | |
| *Including accumulated net investment income/(loss) of: | | $ | 721,564 | | | $ | (510,556 | ) |
| | | | | | | | | |
| OTHER INFORMATION: | | | | | | | | |
| CAPITAL SHARE TRANSACTIONS: | | | | | | | | |
| Beginning shares | | | 4,900,000 | | | | 5,300,000 | |
| Shares sold | | | 950,000 | | | | 1,550,000 | |
| Shares redeemed | | | (1,800,000 | ) | | | (1,950,000 | ) |
| Shares outstanding, end of period | | | 4,050,000 | | | | 4,900,000 | |
See Notes to Financial Statements.
ALPS Medical Breakthroughs ETF
| Financial Highlights | For a Share Outstanding Throughout the Periods Presented |
| | | For the Year Ended November 30, 2017 | | | For the Year Ended November 30, 2016 | | | For the Period December 31, 2014 (Commencement of Operations) to November 30, 2015 | |
| NET ASSET VALUE, BEGINNING OF PERIOD | | $ | 24.16 | | | $ | 32.23 | | | $ | 24.64 | |
| | | | | | | | | | | | | |
| INCOME/(LOSS) FROM INVESTMENT OPERATIONS: | | | | | | | | | | | | |
| Net investment income/(loss) (a) | | | 0.18 | | | | (0.09 | ) | | | (0.13 | ) |
| Net realized and unrealized gain/(loss) | | | 7.36 | | | | (7.98 | ) | | | 7.72 | |
| Total from investment operations | | | 7.54 | | | | (8.07 | ) | | | 7.59 | |
| | | | | | | | | | | | | |
| Net increase/(decrease) in net asset value | | | 7.54 | | | | (8.07 | ) | | | 7.59 | |
| NET ASSET VALUE, END OF PERIOD | | $ | 31.70 | | | $ | 24.16 | | | $ | 32.23 | |
| TOTAL RETURN(b) | | | 31.21 | % | | | (25.04 | )% | | | 30.80 | % |
| | | | | | | | | | | | | |
| RATIOS/SUPPLEMENTAL DATA: | | | | | | | | | | | | |
| Net assets, end of period (000s) | | $ | 128,402 | | | $ | 118,370 | | | $ | 170,824 | |
| | | | | | | | | | | | | |
| Ratio of expenses to average net assets | | | 0.50 | % | | | 0.50 | % | | | 0.50 | %(c) |
| Ratio of net investment income/(loss) to average net assets | | | 0.66 | % | | | (0.38 | )% | | | (0.42 | )%(c) |
| Portfolio turnover rate(d) | | | 43 | % | | | 62 | % | | | 25 | % |
| (a) | Based on average shares outstanding during the period. |
| (b) | Total return is calculated assuming an initial investment made at the net asset value at the beginning of the period and redemption at the net asset value on the last day of the period and assuming all distributions are reinvested at reinvestment prices. Total return calculated for a period of less than one year is not annualized. |
| (d) | Portfolio turnover for periods less than one year are not annualized and does not include securities received or delivered from processing creations or redemptions in-kind. |
See Notes to Financial Statements.
ALPS Medical Breakthroughs ETF
| Notes to Financial Statements | November 30, 2017 |
1. ORGANIZATION
ALPS ETF Trust (the “Trust”), a Delaware statutory trust, is an open-end management investment company registered under the Investment Company Act of 1940, as amended (the “1940 Act”). As of November 30, 2017, the Trust consisted of nineteen separate portfolios. Each portfolio represents a separate series of the Trust. This report pertains solely to the ALPS Medical Breakthroughs ETF (the “Fund”). The investment objective of the Fund is to seek investment results that correspond generally, before fees and expenses, to the performance of the Poliwogg Medical Breakthroughs IndexSM (the “Underlying Index”). The Fund is considered non-diversified and may invest a greater portion of assets in securities of individual issuers than a diversified fund. As a result, changes in the market value of a single investment could cause greater fluctuations in share price than would occur in a diversified fund.
The Fund’s Shares (“Shares”) are listed on the NYSE Arca, Inc. The Fund issues and redeems Shares at net asset value (“NAV”) in blocks of 50,000 Shares, each of which is called a “Creation Unit”. Creation Units are issued and redeemed principally in-kind for securities included in the Underlying Index. Except when aggregated in Creation Units, Shares are not redeemable securities of the Fund.
Pursuant to the Trust’s organizational documents, its Officers and Trustees are indemnified against certain liability arising out of the performance of their duties to the Trust. Additionally, in the normal course of business, the Trust enters into contracts with service providers that contain general indemnification clauses. The Trust’s maximum exposure under these arrangements is unknown, as this would involve future claims that may be made against the Trust that have not yet occurred.
2. SIGNIFICANT ACCOUNTING POLICIES
The following is a summary of significant accounting policies consistently followed by the Fund in the preparation of the financial statements. The accompanying financial statements were prepared in accordance with accounting principles generally accepted in the United States of America (“U.S. GAAP”). The preparation of financial statements in conformity with U.S. GAAP requires management to make certain estimates and assumptions that affect the reported amounts of assets and liabilities and disclosures of contingent assets and liabilities at the date of the financial statements and the reported amounts of revenue and expenses during the period. Actual results could differ from those estimates. The Fund is considered an investment company under U.S. GAAP and follows the accounting and reporting guidance applicable to investment companies in the Financial Accounting Standards Board Accounting Standards Codification Topic 946.
A. Portfolio Valuation
The Fund’s NAV is determined daily, as of the close of regular trading on the New York Stock Exchange (the “NYSE”), normally 4:00 p.m. Eastern time, on each day the NYSE is open for trading. The NAV is computed by dividing the value of all assets of the Fund (including accrued interest and dividends), less all liabilities (including accrued expenses and dividends declared but unpaid), by the total number of shares outstanding.
Portfolio securities listed on any exchange other than the NASDAQ Stock Market LLC (“NASDAQ”) are valued at the last sale price on the business day as of which such value is being determined. If there has been no sale on such day, the securities are valued at the mean of the most recent bid and ask prices on such day. Securities traded on the NASDAQ are valued at the NASDAQ Official Closing Price as determined by NASDAQ. Portfolio securities traded on more than one securities exchange are valued at the last sale price on the business day as of which such value is being determined at the close of the exchange representing the principal market for such securities. Portfolio securities traded in the over-the-counter market, but excluding securities traded on the NASDAQ, are valued at the last quoted sale price in such market.
The Fund’s investments are valued at market value or, in the absence of market value with respect to any portfolio securities, at fair value according to procedures adopted by the Trust’s Board of Trustees (the “Board”). When market quotations are not readily available or when events occur that make established valuation methods unreliable, securities of the Fund may be valued in good faith by or under the direction of the Board. These securities generally include, but are not limited to, restricted securities (securities which may not be publicly sold without registration under the Securities Act of 1933) for which a pricing service is unable to provide a market price; securities whose trading has been formally suspended; a security whose market price is not available from a pre-established primary pricing source or the pricing source is not willing to provide a price; a security with respect to which an event has occurred that is most likely to materially affect the value of the security after the market has closed but before the calculation of the Fund’s NAV or make it difficult or impossible to obtain a reliable market quotation; or a security whose price, as provided by the pricing service, does not reflect the security’s “fair value” due to the security being de-listed from a national exchange or the security’s primary trading market is temporarily closed at a time when, under normal conditions, it would be open. As a general principle, the current “fair value” of a security would be the amount which the owner might reasonably expect to receive from the sale on the applicable exchange or principal market. A variety of factors may be considered in determining the fair value of such securities.
ALPS Medical Breakthroughs ETF
| Notes to Financial Statements | November 30, 2017 |
B. Fair Value Measurements
The Fund discloses the classification of its fair value measurements following a three-tier hierarchy based on the inputs used to measure fair value. Inputs refer broadly to the assumptions that market participants would use in pricing the asset or liability; including assumptions about risk. Inputs may be observable or unobservable. Observable inputs reflect the assumptions market participants would use in pricing the asset or liability that are developed based on market data obtained from sources independent of the reporting entity. Unobservable inputs reflect the reporting entity’s own assumptions about the assumptions market participants would use in pricing the asset or liability that are developed based on the best information available.
Valuation techniques used to value the Fund's investments by major category are as follows:
Equity securities, including restricted securities, for which market quotations are readily available, are valued at the last reported sale price or official closing price as reported by a third party pricing vendor on the primary market or exchange on which they are traded and are categorized as Level 1 in the hierarchy. In the event there were no sales during the day or closing prices are not available, securities are valued at the mean of the most recent quoted bid and ask prices on such day and are generally categorized as Level 2 in the hierarchy. Investments in open-end mutual funds are valued at their closing NAV each business day and are categorized as Level 1 in the hierarchy.
Changes in valuation techniques may result in transfers in or out of an assigned level within the disclosure hierarchy.
Various inputs are used in determining the value of the Fund’s investments as of the end of the reporting period. When inputs used fall into different levels of the fair value hierarchy, the level in the hierarchy within which the fair value measurement falls is determined based on the lowest level input that is significant to the fair value measurement in its entirety. The designated input levels are not necessarily an indication of the risk or liquidity associated with these investments.
These inputs are categorized in the following hierarchy under applicable financial accounting standards:
| Level 1 – | Unadjusted quoted prices in active markets for identical investments, unrestricted assets or liabilities that a Fund has the ability to access at the measurement date; |
| Level 2 – | Quoted prices which are not active, quoted prices for similar assets or liabilities in active markets or inputs other than quoted prices that are observable (either directly or indirectly) for substantially the full term of the asset or liability; and |
| Level 3 – | Significant unobservable prices or inputs (including the Fund’s own assumptions in determining the fair value of investments) where there is little or no market activity for the asset or liability at the measurement date. |
The following is a summary of the inputs used to value the Fund’s investments as of November 30, 2017:
| Investments in Securities at Value | | Level 1 - Unadjusted Quoted Prices | | | Level 2 - Other Significant Observable Inputs | | | Level 3 - Significant Unobservable Inputs | | | Total | |
| Common Stocks* | | $ | 128,389,856 | | | $ | – | | | $ | – | | | $ | 128,389,856 | |
| Rights* | | | – | | | | 1,700 | | | | – | | | | 1,700 | |
| Short Term Investments | | | | | | | | | | | | | | | | |
| Money Market Fund | | | 35,320 | | | | – | | | | – | | | | 35,320 | |
| Investments Purchased with Collateral from | | | | | | | | | | | | | | | | |
| Securities Loaned | | | 7,521,665 | | | | – | | | | – | | | | 7,521,665 | |
| TOTAL | | $ | 135,946,841 | | | $ | 1,700 | | | $ | – | | | $ | 135,948,541 | |
| * | For a detailed sector breakdown, see the accompanying Schedule of Investments. |
The Fund recognizes transfers between levels as of the end of the period. For the year ended November 30, 2017, the Fund did not have any transfers between Level 1 and Level 2 securities. The Fund did not have any securities that used significant unobservable inputs (Level 3) in determining fair value.
ALPS Medical Breakthroughs ETF
| Notes to Financial Statements | November 30, 2017 |
C. Other Risks
Equity Risk: A principal risk of investing in the Fund is equity risk, which is the risk that the value of the securities held by the Fund will fall due to general market and economic conditions, perceptions regarding the industries in which the issuers of securities held by the Fund participate or factors relating to specific companies in which the Fund invests. For example, an adverse event, such as an unfavorable earnings report, may depress the value of equity securities of an issuer held by the Fund; the price of common stock of an issuer may be particularly sensitive to general movements in the stock market; or a drop in the stock market may depress the price of most or all of the common stocks and other equity securities held by the Fund. In addition, common stock of an issuer in the Fund’s portfolio may decline in price if the issuer fails to make anticipated dividend payments because, among other reasons, the issuer of the security experiences a decline in its financial condition.
Small- and Mid- Capitalization Company Risk: Investments in securities of small and mid-capitalization companies are subject to the risks of common stocks. Investments in smaller companies may involve greater risks because these companies generally have a limited track record. Smaller companies often have narrower markets, more limited managerial and financial resources and a less diversified product offering than larger, more established companies. As a result, their performance can be more volatile, which may increase the volatility of the Fund’s portfolio.
Concentration Risk: The Fund seeks to track the Underlying Index, which itself currently is concentrated in the pharmaceuticals and biotechnology industries and may have concentration in certain other industries or sectors, as well as regions, economies or markets. Underperformance or increased risk in such other concentrated areas may result in underperformance or increased risk in the Fund.
Non-Correlation Risk: The Fund’s return may not match the return of the Underlying Index for a number of reasons. For example, the Fund incurs a number of operating expenses not applicable to the Underlying Index, and incurs costs in buying and selling securities, especially when rebalancing the Fund’s securities holdings to reflect changes in the composition of the Underlying Index. In addition, the performance of the Fund and the Underlying Index may vary due to asset valuation differences and differences between the Fund’s portfolio and the Underlying Index resulting from legal restrictions. Due to legal and regulatory rules and limitations, the Fund may not be able to invest in all securities included in the Underlying Index. For tax efficiency purposes, the Fund may sell certain securities to realize losses, causing it to deviate from the Underlying Index. The Fund may not be fully invested at times, either as a result of cash flows into the Fund or reserves of cash held by the Fund to meet redemptions and expenses. If the Fund utilizes a sampling approach or otherwise does not hold all of the securities in the Underlying Index, its return may not correlate as well with the return on the Underlying Index, as would be the case if it purchased all of the securities in the Underlying Index with the same weightings as the Underlying Index.
D. Securities Transactions and Investment Income
Securities transactions are recorded as of the trade date. Realized gains and losses from securities transactions are recorded on the highest cost basis. Dividend income and capital gains distributions, if any, are recorded on the ex-dividend date. Interest income, if any, is recorded on the accrual basis.
E. Dividends and Distributions to Shareholders
Dividends from net investment income of the Fund, if any, are declared and paid annually or as the Board may determine from time to time. Distributions of net realized capital gains earned by the Fund, if any, are distributed at least annually.
F. Federal Tax and Tax Basis Information
The timing and character of income and capital gain distributions are determined in accordance with income tax regulations, which may differ from U.S. GAAP. Reclassifications are made to the Fund’s capital accounts for permanent tax differences to reflect income and gains available for distribution (or available capital loss carryforwards) under income tax regulations.
For the year ended November 30, 2017, the following reclassifications, which had no impact on results of operations or net assets, were recorded to reflect permanent tax differences resulting primarily from in-kind transactions:
| Fund | | Paid-in Capital | | | Accumulated Net Investment Income/(Loss) | | | Accumulated Net Realized Gain/ (Loss) on Investments | |
| ALPS Medical Breakthroughs ETF | | $ | 7,595,306 | | | $ | 486,329 | | | $ | (8,081,635 | ) |
There were no distributions paid for the years ended November 30, 2017 and November 30, 2016.
ALPS Medical Breakthroughs ETF
| Notes to Financial Statements | November 30, 2017 |
As of November 30, 2017, the components of distributable earnings on a tax basis for the Fund were as follows:
| | | ALPS Medical Breakthroughs ETF | |
| Undistributed net investment income | | $ | 1,992,376 | |
| Accumulated net realized loss on investments | | | (41,483,352 | ) |
| Net unrealized depreciation on investments | | | (313,277 | ) |
| Total | | $ | (39,804,253 | ) |
At November 30, 2017, the Fund’s post-enactment capital losses deferred to the next tax year were as follows:
| Fund | | Short-Term | | | Long-Term | |
| ALPS Medical Breakthroughs ETF | | $ | 26,185,173 | | | $ | 15,298,179 | |
As of November 30, 2017, the cost of investments for federal income tax purposes and accumulated net unrealized appreciation/(depreciation) on investments were as follows:
| | | ALPS Medical Breakthroughs ETF | |
| Gross appreciation (excess of value over tax cost) | | $ | 30,047,116 | |
| Gross depreciation (excess of tax cost over value) | | | (30,360,393 | ) |
| Net unrealized appreciation (depreciation) | | $ | (313,277 | ) |
| Cost of investments for income tax purposes | | $ | 136,261,818 | |
The differences between book-basis and tax-basis are primarily due to Passive Foreign Investment Company (“PFIC”) adjustments and the deferral of losses due to wash sales.
G. Income Taxes
No provision for income taxes is included in the accompanying financial statements, as the Fund intends to distribute to shareholders all taxable investment income and realized gains and otherwise comply with Subchapter M of the Internal Revenue Code of 1986, as amended, applicable to regulated investment companies. The Fund evaluates tax positions taken (or expected to be taken) in the course of preparing the Fund’s tax returns to determine whether these positions meet a “more-likely-than-not” standard that, based on the technical merits, have a more than fifty percent likelihood of being sustained by a taxing authority upon examination. A tax position that meets the “more-likely-than-not” recognition threshold is measured to determine the amount of benefit to recognize in the financial statements.
As of and during the year ended November 30, 2017, the Fund did not have a liability for any unrecognized tax benefits. The Fund files U.S. federal, state, and local tax returns as required. The Fund’s tax returns are subject to examination by the relevant tax authorities until expiration of the applicable statute of limitations, which is generally three years after the filing of the tax return, but may extend to four years in certain jurisdictions. Tax returns for open years have incorporated no uncertain tax positions that require a provision for income taxes.
H. Lending of Portfolio Securities
The Fund has entered into a securities lending agreement with State Street Bank & Trust Co. (“SSB”), the Fund’s lending agent. The Fund may lend its portfolio securities only to borrowers that are approved by SSB. The Fund will limit such lending to not more than 33 1/3% of the value of its total assets. The Fund’s securities held at SSB as custodian shall be available to be lent except those securities the Fund or ALPS Advisors, Inc. specifically identifies in writing as not being available for lending. The borrower pledges and maintains with the Fund collateral consisting of cash (U.S. Dollars only), securities issued or guaranteed by the U.S. government or its agencies or instrumentalities, and cash equivalents (including irrevocable bank letters of credit) issued by a person other than the borrower or an affiliate of the borrower. The initial collateral received by the Fund is required to have a value of no less than 102% of the market value of the loaned securities for U.S equity securities and a value of no less than 105% of the market value for non-U.S. equity securities. The collateral is maintained thereafter, at a market value equal to not less than 102% of the current value of the U.S. equity securities on loan and not less than 105% of the current value of the non-U.S. equity securities on loan. The market value of the loaned securities is determined at the close of each business day and any additional required collateral is delivered to the Fund on the next business day. During the term of the loan, the Fund is entitled to all distributions made on or in respect of the loaned securities. Loans of securities are terminable at any time and the borrower, after notice, is required to return borrowed securities within the customary time period for settlement of securities transactions.
ALPS Medical Breakthroughs ETF
| Notes to Financial Statements | November 30, 2017 |
Any cash collateral received is reinvested in a money market fund managed by SSB as disclosed in the Fund’s Schedule of Investments and is reflected in the Statements of Assets and Liabilities as a payable for collateral upon return of securities loaned. Non-cash collateral, in the form of securities issued or guaranteed by the U.S. government or its agencies or instrumentalities, is not disclosed in the Fund’s Statements of Assets and Liabilities as it is held by the lending agent on behalf of the Fund, and the Fund does not have the ability to re-hypothecate these securities. Income earned by the Fund from securities lending activity is disclosed in the Statement of Operations.
The following is a summary of the Fund's securities lending agreement and related cash and non-cash collateral received as of November 30, 2017:
| | | Market Value of Securities on Loan | | | Cash Collateral Received | | | Non-Cash Collateral Received | | | Total Collateral Received | |
| ALPS Medical Breakthroughs ETF | | $ | 15,081,434 | | | $ | 7,521,665 | | | $ | 7,703,824 | | | $ | 15,225,489 | |
The risks of securities lending include the risk that the borrower may not provide additional collateral when required or may not return the securities when due. To mitigate these risks, the Fund benefits from a borrower default indemnity provided by SSB. SSB’s indemnity allows for full replacement of securities lent wherein SSB will purchase the unreturned loaned securities on the open market by applying the proceeds of the collateral, or to the extent such proceeds are insufficient or the collateral is unavailable, SSB will purchase the unreturned loan securities at SSB’s expense. However, the Fund could suffer a loss if the value of the investments purchased with cash collateral falls below the value of the cash collateral received.
The following table reflects a breakdown of transactions accounted for as secured borrowings, the gross obligation by the type of collateral pledged or securities loaned, and the remaining contractual maturity of those transactions as of November 30, 2017:
| ALPS Medical Breakthroughs ETF | | | Remaining contractual maturity of the lending agreement | | | |
| Securities Lending Transactions | | Overnight & Continuous | | | Up to 30 days | | | 30-90 days | | | Greater than 90 days | | | Total | |
| Common Stocks | | $ | 7,521,665 | | | $ | – | | | $ | – | | | $ | – | | | $ | 7,521,665 | |
| Total Borrowings | | | | | | | | | | | | | | | | | | | 7,521,665 | |
| Gross amount of recognized liabilities for securities lending (collateral received) | | | $ | 7,521,665 | |
3. INVESTMENT ADVISORY FEE AND OTHER AFFILIATED TRANSACTIONS
ALPS Advisors, Inc. (the “Adviser”) acts as the Fund’s investment adviser pursuant to an Advisory Agreement with the Trust on behalf of the Fund (the “Advisory Agreement”). Pursuant to the Advisory Agreement, the Fund pays the Adviser a unitary fee for the services and facilities it provides, payable on a monthly basis at the annual rate of 0.50% of the Fund’s average daily net assets. From time to time, the Adviser may waive all or a portion of its fee.
Out of the unitary management fee, the Adviser pays substantially all expenses of the Fund, including the licensing fees to the Index provider, the cost of transfer agency, custody, fund administration, legal, audit, independent trustees and other services, except for interest expenses, distribution fees or expenses, brokerage expenses, taxes and extraordinary expenses not incurred in the ordinary course of the Fund’s business. The Adviser’s unitary management fee is designed to pay substantially all the Fund’s expenses and to compensate the Adviser for providing services for the Fund.
ALPS Fund Services, Inc., an affiliate of the Adviser, is the administrator of the Fund.
Each Trustee who is not an officer or employee of the Adviser, any sub-adviser or any of their affiliates (“Independent Trustees”) receives (1) a quarterly retainer of $5,000, (2) a per meeting fee for regularly scheduled meetings of $3,750, (3) $1,500 for any special meeting held outside of a regularly scheduled board meeting, and (4) reimbursement for all reasonable out-of-pocket expenses relating to attendance at meetings.
ALPS Medical Breakthroughs ETF
| Notes to Financial Statements | November 30, 2017 |
4. PURCHASES AND SALES OF SECURITIES
For the year ended November 30, 2017, the cost of purchases and proceeds from sales of investment securities, excluding in-kind transactions and short-term investments, were as follows:
| Fund | | Purchases | | | Sales | |
| ALPS Medical Breakthroughs ETF | | $ | 48,960,104 | | | $ | 48,374,959 | |
For the year ended November 30, 2017, the cost of in-kind purchases and proceeds from in-kind sales were as follows:
| Fund | | Purchases | | | Sales | |
| ALPS Medical Breakthroughs ETF | | $ | 27,695,329 | | | $ | 47,458,822 | |
For the year ended November 30, 2017, the ALPS Medical Breakthroughs ETF has in-kind net realized gain of $8,656,294.
Gains on in-kind transactions are not considered taxable for federal income tax purposes and losses on in kind transactions are also not deductible for tax purposes.
5. CAPITAL SHARE TRANSACTIONS
Shares are created and redeemed by the Fund only in Creation Unit size aggregations of 50,000 Shares. Only broker-dealers or large institutional investors with creation and redemption agreements called Authorized Participants (“AP”) are permitted to purchase or redeem Creation Units from the Fund. Such transactions are generally permitted on an in-kind basis, with a balancing cash component to equate the transaction to the NAV per unit of the Fund on the transaction date. Cash may be substituted equivalent to the value of certain securities generally when they are not available in sufficient quantity for delivery, not eligible for trading by the AP or as a result of other market circumstances.
6. RELATED PARTY TRANSACTIONS
The Fund engaged in cross trades between other funds in the Trust during the year ended November 30, 2017 pursuant to Rule 17a-7 under the 1940 Act. Cross trading is the buying or selling of portfolio securities between funds to which the Adviser serves as the investment adviser. The Board previously adopted procedures that apply to transactions between the Funds of the Trust pursuant to Rule 17a-7. These transactions related to cross trades during the period complied with the requirements set forth by Rule 17a-7 and the Trust’s procedures.
Transactions related to cross trades during the year ended November 30, 2017, were as follows:
| Fund | | Purchase cost paid | | | Sale proceeds received | | | Realized gain/ (loss) on sales | |
| ALPS Medical Breakthroughs ETF | | $ | – | | | $ | 742,175 | | | $ | 5,588 | |
ALPS Medical Breakthroughs ETF
| Additional Information | November 30, 2017 (Unaudited) |
PROXY VOTING RECORDS, POLICIES AND PROCEDURES
Information regarding how the Fund voted proxies relating to portfolio securities during the most recent 12-month period ended June 30 and a description of the Fund’s proxy voting policies and procedures used in determining how to vote for proxies are available without charge on the SEC’s website at www.sec.gov and upon request, by calling (toll-free) 1-866-675-2639.
PORTFOLIO HOLDINGS
The Trust is required to disclose, after its first and third fiscal quarters, the complete schedule of the Fund’s portfolio holdings with the SEC on Form N-Q. Forms N-Q for the Fund are available on the SEC’s website at www.sec.gov. The Fund’s Forms N-Q may also be reviewed and copied at the SEC’s Public Reference Room in Washington, D.C. and information on the operation of the Public Reference Room may be obtained by calling 1-800-SEC-0330. The Fund’s Forms N-Q are available without charge, upon request, by calling (toll-free) 1-866-675-2639 or by writing to ALPS ETF Trust at 1290 Broadway, Suite 1100, Denver, Colorado 80203.
LICENSING AGREEMENT
The Poliwogg Medical Breakthroughs IndexSM is a service mark of S-Network Global Indexes, Inc. and has been licensed for use by ALPS Advisors, Inc. The ALPS Medical Breakthroughs ETF is not sponsored, endorsed, sold or promoted by S-Network Global Indexes, Inc. and S-Network Global Indexes, Inc. makes no representation regarding the advisability of investing in the ALPS Medical Breakthroughs ETF.
The ALPS Medical Breakthroughs ETF is not sponsored, endorsed, sold or promoted by Standard & Poor’s, a division of The McGraw-Hill Companies, Inc. (“S&P”) or its third party licensors. Neither S&P nor its third party licensors make any representation or warranty, express or implied, to the owners of the ALPS Medical Breakthroughs ETF or any member of the public regarding the advisability of investing in securities generally or in the ALPS Medical Breakthroughs ETF particularly or the ability of the Poliwogg Medical Breakthroughs IndexSM to track general stock market performance. S&P’s and its third party licensor’s only relationship to S-Network Global Indexes, LLC is the licensing of certain trademarks, service marks and trade names of S&P and/or its third party licensors and for the providing of calculation and maintenance services related to the Poliwogg Medical Breakthroughs IndexSM. Neither S&P nor its third party licensors is responsible for and has not participated in the determination of the prices and amount of the ALPS Medical Breakthroughs ETF or the timing of the issuance or sale of the ALPS Medical Breakthroughs ETF or in the determination or calculation of the equation by which the ALPS Medical Breakthroughs ETF is to be converted into cash. S&P has no obligation or liability in connection with the administration, marketing or trading of the ALPS Medical Breakthroughs ETF.
NEITHER S&P, ITS AFFILIATES NOR THEIR THIRD PARTY LICENSORS GUARANTEE THE ADEQUACY, ACCURACY, TIMELINESS OR COMPLETENESS OF THE POLIWOGG MEDICAL BREAKTHROUGHS INDEXSM OR ANY DATA INCLUDED THEREIN OR ANY COMMUNICATIONS, INCLUDING BUT NOT LIMITED TO, ORAL OR WRITTEN COMMUNICATIONS (INCLUDING ELECTRONIC COMMUNICATIONS) WITH RESPECT THERETO. S&P, ITS AFFILIATES AND THEIR THIRD PARTY LICENSORS SHALL NOT BE SUBJECT TO ANY DAMAGES OR LIABILITY FOR ANY ERRORS, OMISSIONS OR DELAYS THEREIN. S&P MAKES NO EXPRESS OR IMPLIED WARRANTIES, AND EXPRESSLY DISCLAIMS ALL WARRANTIES OF MERCHANTABILITY OR FITNESS FOR A PARTICULAR PURPOSE OR USE WITH RESPECT TO ITS TRADEMARKS, THE INDEX OR ANY DATA INCLUDED THEREIN. WITHOUT LIMITING ANY OF THE FOREGOING, IN NO EVENT WHATSOEVER SHALL S&P, ITS AFFILIATES OR THEIR THIRD PARTY LICENSORS BE LIABLE FOR ANY INDIRECT, SPECIAL, INCIDENTAL, PUNITIVE OR CONSEQUENTIAL DAMAGES, INCLUDING BUT NOT LIMITED TO, LOSS OF PROFITS, TRADING LOSSES, LOST TIME OR GOODWILL, EVEN IF THEY HAVE BEEN ADVISED OF THE POSSIBILITY OF SUCH DAMAGES, WHETHER IN CONTRACT, TORT, STRICT LIABILITY OR OTHERWISE.
Standard & Poor’s®, and S&P® are registered trademarks of The McGraw-Hill Companies, Inc.; “Calculated by S&P Custom Indices” and its related stylized mark are service marks of The McGraw-Hill Companies, Inc. These marks have been licensed for use by S-Network Global Indexes, LLC. The Adviser does not guarantee the accuracy and/or the completeness of either Underlying Index or any data included therein, and the Adviser shall have no liability for any errors, omissions or interruptions therein. The Adviser makes no warranty, express or implied, as to results to be obtained by the Funds, owners of the Shares of the Funds or any other person or entity from the use of either Underlying Index or any data included therein. The Adviser makes no express or implied warranties, and expressly disclaims all warranties of merchantability or fitness for a particular purpose or use with respect to either Underlying Index or any data included therein. Without limiting any of the foregoing, in no event shall the Adviser have any liability for any special, punitive, direct, indirect or consequential damages (including lost profits) arising out of matters relating to the use of either Underlying Index even if notified of the possibility of such damages.
ALPS Medical Breakthroughs ETF
| Board Considerations Regarding Approval of Investments Advisory Agreement | November 30, 2017 (Unaudited) |
At an in-person meeting held on June 8, 2017, the Board of Trustees of the Trust (the “Board” or the “Trustees”), including the Trustees who are not “interested persons” of the Trust within the meaning of the 1940 Act, as amended (the “Independent Trustees”), evaluated a proposal to approve the continuance of the Investment Advisory Agreement between the Trust and ALPS Advisors, Inc. (the “Adviser” or “AAI”) with respect to the ALPS Medical Breakthroughs ETF (“SBIO” or “the Fund”). The Independent Trustees also met separately to consider the Investment Advisory Agreement.
In evaluating the Investment Advisory Agreement with respect to the Fund, the Independent Trustees considered various factors, including (i) the nature, extent and quality of the services provided by AAI with respect to the Fund under the Investment Advisory Agreements; (ii) the advisory fees and other expenses paid by the Fund compared to those of similar funds managed by other investment advisers; (iii) the costs of the services provided to the Fund by AAI and the profits realized by AAI and its affiliates from its relationship to the Fund; (iv) the extent to which economies of scale have been or would be realized if and as the assets of the Fund grow and whether fees reflect the economies of scale for the benefit of shareholders; and (v) any additional benefits and other considerations.
With respect to the nature, extent and quality of the services provided by AAI under the Investment Advisory Agreement, the Independent Trustees considered and reviewed information concerning the services provided under the Investment Advisory Agreement, the investment parameters of the index of the Fund, financial information regarding AAI and its parent company, information describing AAI’s current organization and the background and experience of the persons responsible for the day-to-day management of the Fund.
The Independent Trustees reviewed information on the performance of the Fund and its benchmark. The Independent Trustees also evaluated the correlation and tracking error between the underlying index and the Fund’s performance. Based on their review, the Independent Trustees found that the nature and extent of services provided to each Fund under the Investment Advisory Agreements was appropriate and that the quality was satisfactory.
The Independent Trustees noted that the advisory fee for the Fund was a unitary fee pursuant to which AAI assumes all expenses of the Fund (including the cost of transfer agency, custody, fund administration, legal, audit and other services) other than the payments under the Investment Advisory Agreement, brokerage expenses, taxes, interest, litigation expenses and other extraordinary expenses.
With respect to the advisory fee rate, the Independent Trustees noted the following:
The net advisory fee rate for the Fund is equal to the median of its Broadridge expense group and the Fund’s expense ratio is slightly lower than the median of its Broadridge expense group.
Based on the foregoing, and the other information available to them, the Independent Trustees concluded that the advisory fee rate for the Fund was reasonable under the circumstances and in light of the quality of the services provided.
The Independent Trustees considered other benefits available to AAI because of its relationship with the Fund and concluded that the advisory fees were reasonable taking into account any such benefits.
The Independent Trustees also considered with respect to the Fund the information provided by AAI about the costs and profitability of AAI with respect to the Fund. The Independent Trustees reviewed and noted the relatively small size of the Fund and concluded that AAI was not realizing any economies of scale. The Independent Trustees determined that they would continue to evaluate whether further economies of scale have been achieved on an ongoing basis.
In voting to renew the Investment Advisory Agreement, the Independent Trustees concluded that the terms of the Investment Advisory Agreement are reasonable and fair in light of the services to be performed, the fees paid by certain other funds, expenses to be incurred and such other matters as the Independent Trustees considered relevant in the exercise of their reasonable business judgment. The Independent Trustees did not identify any single factor or group of factors as all important or controlling and considered all factors together.
ALPS Medical Breakthroughs ETF
| Trustees & Officers | November 30, 2017 (Unaudited) |
The general supervision of the duties performed by the Adviser for the Fund under the Investment Advisory Agreement is the responsibility of the Board of Trustees. The Trust currently has four Trustees. Three Trustees have no affiliation or business connection with the Adviser or any of its affiliated persons and do not own any stock or other securities issued by the Adviser. These are the “non-interested” or “independent” Trustees (“Independent Trustees”). The other Trustee (the “Interested Trustee”) is affiliated with the Adviser.
The Independent Trustees of the Trust, their term of office and length of time served, their principal business occupations during the past five years, the number of portfolios in the Fund Complex overseen by each Independent Trustee, and other directorships, if any, held by the Trustee are shown below.
| INDEPENDENT TRUSTEES |
| Name, Address & Year of Birth* | Position(s) Held with Trust | Term of Office and Length of Time Served** | Principal Occupation(s) During Past 5 Years | Number of Portfolios in Fund Complex Overseen by Trustees*** | Other Directorships Held by Trustees |
| Mary K. Anstine, 1940 | Trustee | Since March 2008 | Ms. Anstine was President/Chief Executive Officer of HealthONE Alliance, Denver, Colorado, and former Executive Vice President of First Interstate Bank of Denver. Ms. Anstine is also Trustee/Director of AV Hunter Trust and Colorado Uplift Board. Ms. Anstine was formerly a Director of the Trust Bank of Colorado (later purchased and now known as Northern Trust Bank), HealthONE and Denver Area Council of the Boy Scouts of America and a member of the American Bankers Association Trust Executive Committee. | 42 | Ms. Anstine is a Trustee of ALPS Variable Investment Trust (10 funds); Financial Investors Trust (33 funds); Reaves Utility Income Fund (1 fund); and Westcore Trust (14 funds). |
| Jeremy W. Deems, 1976 | Trustee | Since March 2008 | Mr. Deems is the Co-Founder, Chief Compliance Officer and Chief Financial Officer of Green Alpha Advisors, LLC. Mr. Deems is Co-Portfolio Manager of the Shelton Green Alpha Fund. Prior to joining Green Alpha Advisors, Mr. Deems was CFO and Treasurer of Forward Management, LLC, ReFlow Management Co., LLC, ReFlow Fund, LLC, a private investment fund, and Sutton Place Management, LLC, an administrative services company. | 44 | Mr. Deems is a Trustee of ALPS Variable Investment Trust (10 funds); Financial Investors Trust (33 funds); and Reaves Utility Income Fund (1 fund); Clough Funds Trust (1 fund) and Elevation ETF Trust (1 fund). |
| Rick A. Pederson, 1952 | Trustee and Chairman | Has served as Trustee since March 2008. Has served as Chairman since July 2017 | Mr. Pederson is President, Foundation Properties, Inc. (a real estate investment management company), 1994 - present; Advisory Board Member, Bow River Capital Partners (private equity management), 2003 - present; Advisor, The Pauls Corporation (real estate investment management and development), 2008 - present; Chairman, Ross Consulting Group (real estate consulting services) 1983-2013; Advisory Board, Neenan Company (construction services) 2002-present; Board Member, Prosci Inc. (private business services) 2013-2016; Board Member, Citywide Banks (Colorado community bank) 2014–present; Board member, Professional Pediatric Health Care (a Denver-based home nursing firm) 2014 – present; Board Member, Strong-Bridge Consulting (management consulting) 2015-present; Director, National Western Stock Show (not-for-profit organization); Director, Biennial of the Americas (not-for-profit-organization), 2012-2015; Board Member, History Colorado, 2015 - present. | 21 | Mr. Pederson is Trustee of Westcore Trust (14 funds) and Principal Real Estate Income Fund (1 fund). |
| * | The business address of the Trustee is c/o ALPS Advisors, Inc., 1290 Broadway, Suite 1100, Denver, Colorado 80203. |
| ** | This is the period for which the Trustee began serving the Trust. Each Trustee serves an indefinite term, until his successor is elected. |
| *** | The Fund Complex includes all series of the Trust and any other investment companies for which ALPS Advisors, Inc. provides investment advisory services. |
ALPS Medical Breakthroughs ETF
| Trustees & Officers | November 30, 2017 (Unaudited) |
The Trustee who is affiliated with the Adviser or affiliates of the Adviser and executive officers of the Trust, his term of office and length of time served, his principal business occupations during the past five years, the number of portfolios in the Fund Complex overseen by the Interested Trustee and the other directorships, if any, held by the Trustee, are shown below.
| INTERESTED TRUSTEE |
| Name, Address and Year of Birth of Interested Trustee* | Position(s) Held with Trust | Term of Office and Length of Time Served** | Principal Occupation(s) During Past 5 Years | Number of Portfolios in Fund Complex Overseen by Trustees*** | Other Directorships Held by Trustee |
| Edmund J. Burke, 1961 | Trustee and President | Mr. Burke was elected as Trustee of the Trust and President of the Trust at the December 11, 2017 meeting of the Board of Trustees. | Mr. Burke is President and a Director of ALPS Holdings, Inc. (“AHI”) (since 2005) and Director of Boston Financial Data Services, Inc. (“BFDS”), ALPS Advisors, Inc. (“AAI”), ALPS Distributors, Inc. (“ADI”), ALPS Fund Services, Inc. (“AFS”) and ALPS Portfolio Solutions Distributor, Inc. (“APSD”) and from 2001-2008, was President of AAI, ADI, AFS and APSD. Because of his positions with AHI, BFDS, AAI, ADI, AFS and APSD, Mr. Burke is deemed an affiliate of the Trust as defined under the 1940 Act. Mr. Burke is Trustee and President of the Clough Global Allocation Fund (Trustee since 2006; President since 2004); Trustee and President of the Clough Global Equity Fund (Trustee since 2006; President since 2005); Trustee and President of the Clough Global Opportunities Fund (since 2006); Trustee of the Liberty All-Star Equity Fund; Director of the Liberty All-Star Growth Fund, Inc. and Trustee and President of Financial Investors Trust (Trustee since 2009; President since 2002). | 36 | Mr. Burke is a Trustee of Clough Global Dividend and Income Fund (1 fund); Clough Global Equity Fund (1 fund); Clough Global Opportunities Fund (1 fund); Clough Funds Trust (1 fund); Liberty All-Star Equity Fund (1 fund); Director of the Liberty All-Star Growth Fund, Inc. (1 fund) and Financial Investors Trust (33 funds). |
| * | The business address of the Trustee is c/o ALPS Advisors, Inc., 1290 Broadway, Suite 1100, Denver, Colorado 80203. |
| ** | This is the period for which the Trustee began serving the Trust. Each Trustee serves an indefinite term, until his successor is elected. |
| *** | The Fund Complex includes all series of the Trust and any other investment companies for which ALPS Advisors, Inc. provides investment advisory services. |
ALPS Medical Breakthroughs ETF
| Trustees & Officers | November 30, 2017 (Unaudited) |
| OFFICERS |
| Name, Address and Year of Birth of Officer | Position(s) Held with Trust | Length of Time Served* | Principal Occupation(s) During Past 5 Years |
| Erin D. Nelson, 1977 | Chief Compliance Officer (“CCO”) | Since December 2015 | Erin Nelson became Senior Vice-President and Chief Compliance Officer of ALPS Advisors, Inc. (“AAI”) on July 1, 2015 and prior to that served as Vice President and Deputy Chief Compliance Officer of AAI since January 1, 2015. Prior to January 1, 2015, Ms. Nelson was Vice-President and Assistant General Counsel of ALPS Fund Services, Inc. Because of her position with AAI, Ms. Nelson is deemed an affiliate of the Trust as defined under the 1940 Act. Ms. Nelson is also the CCO of ALPS Variable Investment Trust, Liberty All-Star Growth Fund, Inc., Liberty All-Star Equity Fund, Principal Real Estate Income Fund, RiverNorth Opportunities Fund, Inc. and Red Rocks Capital, LLC. |
| Patrick D. Buchanan, 1972 | Treasurer | Since June 2012 | Mr. Buchanan is Vice President of AAI. Mr. Buchanan joined ALPS in 2007 and because of his position with AAI, he is deemed an affiliate of the Trust as defined under the 1940 Act. Mr. Buchanan is also Treasurer of the ALPS Variable Insurance Trust, Principal Real Estate Income Fund, Clough Funds Trust and RiverNorth Opportunities Fund, Inc. |
| Andrea E. Kuchli, 1985 | Secretary | Since December 2017 | Ms. Kuchli joined ALPS in 2015 and is currently Vice President and Senior Counsel of ALPS. Prior to joining ALPS, Ms. Kuchli was an Associate with Davis Graham & Stubbs LLP from April 2014 to February 2015, and an Associate with Dechert LLP from 2011 to April 2014. Because of her position with ALPS, Ms. Kuchli is deemed an affiliate of the Trust as defined under the 1940 Act. Ms. Kuchli is also Secretary of ALPS Variable Investment Trust, Elevation ETF Trust and Principal Real Estate Income Fund as well as Assistant Secretary of the James Advantage Funds. |
| Sharon Akselrod, 1974 | Assistant Secretary | Since December 2016 | Ms. Akselrod joined ALPS in August 2014 and is currently Senior Investment Company Act Paralegal of ALPS Fund Services, Inc. Prior to joining ALPS, Ms. Akselrod served as Corporate Governance and Regulatory Associate for Nordstrom fsb (2013-2014) and Senior Legal Assistant – Legal Manager for AXA Equitable Life Insurance Company (2008-2013). Because of her position with ALPS, Ms. Akselrod is deemed an affiliate of the Trust as defined under the 1940 Act. Ms. Akselrod is also Assistant Secretary of Financial Investors Trust and Principal Real Estate Income Fund. |
Stephanie G. Danner,
1992 | Assistant Secretary | Since December 2017 | Ms. Danner joined ALPS in September of 2017 and is currently Vice President and Associate Senior Counsel of ALPS. Because of her position with ALPS, Ms. Danner is deemed an affiliate of the Trust as defined under the 1940 Act. |
| * | The business address of each Officer is c/o ALPS Advisors, Inc., 1290 Broadway, Suite 1100, Denver, Colorado 80203. |
| ** | This is the period for which the Officer began serving the Trust. Each Officer serves an indefinite term, until his/her successor is elected. |
The Statement of Additional Information includes additional information about the Fund's Trustees and is available, without charge, upon request by calling (toll-free) 1-844-234-5852.
| Performance Overview | 1 |
| Disclosure of Fund Expenses | 13 |
| Report of Independent Registered Public Accounting Firm | 14 |
| Schedules of Investments | 15 |
| Statements of Assets and Liabilities | 22 |
| Statements of Operations | 23 |
| Statements of Changes in Net Assets | 24 |
| Financial Highlights | 28 |
| Notes to Financial Statements | 32 |
| Additional Information | 41 |
| Board Considerations Regarding Approval of Investment Advisory Agreement | 44 |
| Trustees & Officers | 45 |
alpsfunds.com
ALPS Sector Dividend Dogs ETF
| Performance Overview | November 30, 2017 (Unaudited) |
Investment Objective
The ALPS Sector Dividend Dogs ETF (the “Fund”) seeks investment results that replicate as closely as possible, before fees and expenses, the performance of the S-Network® Sector Dividend Dogs Index (the “Underlying Index”). The Shares of the Fund are listed and trade on the NYSE Arca under the ticker symbol SDOG. The Fund generally will invest in all of the securities that comprise the Underlying Index in proportion to their weightings in the Underlying Index.
The Underlying Index is a rules based index intended to give investors a means of tracking the overall performance of the highest dividend paying stocks (i.e. “Dividend Dogs”) in the S&P 500® (“SPX”) on a sector-by-sector basis. “Dividend Dogs” refers to the five stocks in each of the ten Global Industry Classification Standard (“GICS”) sectors that make up the S&P 500® which offer the highest dividend yields.
Performance Overview
ALPS Sector Dividend Dogs ETF (SDOG), for the twelve month period ended November 30, 2017, generated a total return of 11.59%, in-line with the Fund’s Underlying Index, net of fees, which returned 12.12%. The Fund underperformed the S&P 500®, which returned 22.87% for the same period.
The trailing twelve month yield for the Fund’s underlying constituents as of 11/30/2017 was 3.85% vs.1.80% for the S&P 500®.
The S&P 500 rallied from 11/30/16 through the end of the first calendar quarter in 2017. The election of President Trump fueled optimism in the marketplace on hopes that tax and healthcare reform would pass in a Republican controlled congress. Oil saw moderate volatility during the year, exhibiting a low of $42.53 per barrel on June 21st and reached a high of $58.95 on November 24th. During the year, oil exhibited an average price of $50.40. The S&P 500 returned 3.07% in Q2 2017. Relative to the previous quarter, the U.S. market saw modest positive returns. Monetary policy remained unsurprising due to the continued assurance from the Federal Reserve that a slow and anticipated rise in short term interest rates will continue. During the third calendar quarter of 2017, the S&P 500 returned 4.41%. Although pro-growth policies and reform had yet to surface in the first half of the year, optimism remained in the market. The majority of U.S. equities’ gains came in the first two months of Q4, which returned 5.49%. The announcement that the Republican Party had enough votes to pass tax reforms in the House and Senate spurred a strong rally in the U.S. Market. In addition, companies in the S&P 500, on average, reported strong Q3 earnings.
Compared to the S&P 500®, the Fund saw a negative impact (-3.66%) from sector allocation effect for the period. This was largely driven by relative under-weighting in Information Technology (average weight for the period of 10.52% vs. 22.53% in SPX) and relative overweighting in Telecommunication Services (average weight for the period of 6.57% vs. 2.25% in SPX); a result of the equal sector weight strategy. The Fund also saw a negative impact (-6.94%) from selection effect, as the constituents in Information Technology, Consumer Discretionary, and Industrials underperformed. The Fund’s Energy names exhibited the strongest positive contribution to overall selection effect for the period.
The best performing stocks in the Fund for the period were Abbvie, Inc. (ABBV), which increased 65.28% and Caterpillar, Inc. (CAT), which saw a gain of 52.13%. HP, Inc. (HPQ), which rose 43.56%, and T Rowe Price Group, Inc. (TROW), which climbed 37.13%, were other top performers. The largest detractors were General Electric Co. (GE), which decreased 40.42%, Mattel, Inc. (MAT), which fell 39.79%, and CenturyLink, Inc. (CTL), which lost 30.88%.
Looking forward we believe the Fund’s strategy of annually selecting the five highest yielding securities in each of the ten sectors (excluding Real Estate) in the S&P 500® will provide meaningfully higher yield relative to the S&P 500®, potential for market participation in all economic cycles through equal sector weighting, and a deep value portfolio of securities as identified through high yield relative to their sector peers.
Performance (as of November 30, 2017)
| | 1 Year | 3 Year | 5 Year | Since Inception* |
| ALPS Sector Dividend Dogs ETF – NAV | 11.59% | 9.29% | 15.38% | 15.73% |
| ALPS Sector Dividend Dogs ETF – Market Price* | 11.53% | 9.27% | 15.35% | 15.73% |
| S-Network® Sector Dividend Dogs TR Index | 12.12% | 9.80% | 15.94% | 16.29% |
| S&P 500® Total Return Index | 22.87% | 10.91% | 15.74% | 15.47% |
Total Expense Ratio (per the current prospectus) 0.40%.
Performance data quoted represents past performance. Past performance does not guarantee future results. The table does not reflect the deduction of taxes that a shareholder would pay on Fund distributions or the redemption of Fund shares. Investment return and principal value of an investment will fluctuate so that an investor’s shares, when sold or redeemed, may be worth more or less than the original cost. Current performance data may be higher or lower than actual data quoted. For the most current month-end performance data please visit www.alpsfunds.com or call 1.866.675.2639.
ALPS Sector Dividend Dogs ETF
| Performance Overview | November 30, 2017 (Unaudited) |
NAV is an exchange-traded fund’s per-share value. The per-share dollar amount of the Fund is derived by dividing the total value of all the securities in its portfolio, less any liabilities, by the number of Fund shares outstanding. Market Price is the price at which a share can currently be traded in the market. Information detailing the number of days the Market Price of the Fund was greater than the Fund’s NAV and the number of days it was less than the Fund’s NAV can be obtained at www.alpsfunds.com.
| ^ | The Fund Commencement Date was June 29, 2012. |
| * | Market Price is based on the midpoint of the bid-ask spread at 4 p.m. ET and does not represent the returns an investor would receive if shares were traded at other times. |
The S-Network® Sector Dividend Dogs Index is designed to serve as a fair, impartial and transparent measure of the performance of US large cap equities with above average dividend yields. The Underlying Index is a portfolio of fifty stocks derived from the S&P 500® Index. The index is reported on a total return basis, which assumes reinvestment of any dividends and distributions realized during a given time period.
The S&P 500® Total Return Index is an index of 500 stocks chosen for market size, liquidity and industry grouping among other factors.
The indexes are not actively managed and do not reflect any deductions for fees, expenses or taxes. One cannot invest directly in an index. Index performance does not reflect fund performance.
The Fund’s shares are not individually redeemable. Investors buy and sell shares of the Fund on a secondary market. Only market makers or “authorized participants” may trade directly with the Fund, typically in blocks of 50,000 shares.
The ALPS Sector Dividend Dogs ETF is not suitable for all investors. Investments in the Fund are subject to investment risks, including possible loss of the principal amount invested.
ALPS Portfolio Solutions Distributor, Inc., a FINRA member, is the distributor for the ETF.
ALPS Sector Dividend Dogs ETF
Performance Overview | November 30, 2017 (Unaudited) |
Top 10 Holdings* (as of November 30, 2017)
| T Rowe Price Group, Inc. | 2.40% |
| The Mosaic Co. | 2.40% |
| Valero Energy Corp. | 2.40% |
| Seagate Technology Plc | 2.30% |
| Caterpillar, Inc. | 2.30% |
| Mattel, Inc. | 2.30% |
| Garmin, Ltd. | 2.30% |
| Cisco Systems, Inc. | 2.30% |
| People's United Financial, Inc. | 2.30% |
| Occidental Petroleum Corp. | 2.30% |
| Total % of Top 10 Holdings | 23.30% |
| * | % of Total Investments (excluding investments purchased with collateral from securities loaned). |
Sector Allocation* (as of November 30, 2017)
| Consumer Discretionary | 11.23% |
| Materials | 11.13% |
| Financials | 10.94% |
| Information Technology | 10.78% |
| Energy | 10.47% |
| Industrials | 10.07% |
| Health Care | 10.02% |
| Utilities | 9.95% |
| Consumer Staples | 9.64% |
| Telecommunication Services | 5.68% |
| Money Market Fund | 0.10% |
| Total | 100.00% |
Future holdings are subject to change.
Growth of $10,000 (as of November 30, 2017)
Comparison of Change in Value of $10,000 Investment in the Fund and the Indexes
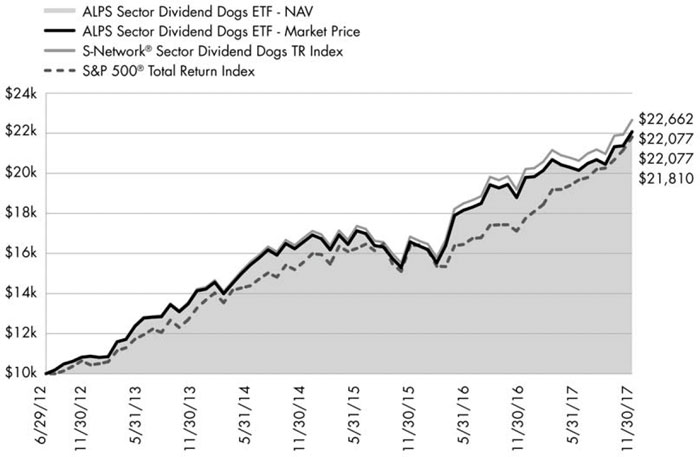
The chart above represents historical performance of a hypothetical investment of $10,000 in the Fund over the life of the Fund. Past performance does not guarantee future results. This chart does not reflect the deduction of taxes that a shareholder would pay on Fund distributions or the redemption of Fund shares.
ALPS International Sector Dividend Dogs ETF
| Performance Overview | November 30, 2017 (Unaudited) |
Investment Objective
The ALPS International Sector Dividend Dogs ETF (the “Fund”) seeks investment results that replicate as closely as possible, before fees and expenses, the performance of the S-Network® International Sector Dividend Dogs Index (the “Underlying Index”). The Shares of the Fund are listed and trade on the NYSE Arca under the ticker symbol IDOG. The Fund generally will invest in all of the securities that comprise the Underlying Index in proportion to their weightings in the Underlying Index.
The Underlying Index is a rules-based index intended to give investors a means of tracking the overall performance of the highest dividend paying stocks (i.e. “Dividend Dogs”) in the S-Net International Developed Markets (ex-Americas) Index, a universe of mainly large capitalization stocks in international developed markets not located in the Americas (the “S-Net Developed Markets”) on a sector-by-sector basis. “Dividend Dogs” refers to the five stocks in each of the ten Global Industry Classification Standard (“GICS”) sectors that make up the S-Net Developed Markets which offer the highest dividend yields.
Performance Overview
The ALPS International Sector Dividend Dogs ETF (IDOG), for the one year period ended November 30, 2017, generated a total return of 28.10%, relatively in-line with the Fund’s Net Total Return Index, net of fees, which returned 28.83%. The fund outperformed the MSCI EAFE® Index (MXEA) which returned 27.27% for the same period.
The trailing twelve month yield for the Fund’s constituents as of 11/30/2017 was 4.41% vs. 3.13% on the MSCI EAFE®.
From a macroeconomic perspective, developed markets (ex-U.S.) had a strong year. Corporate earnings across the European Union were generally positive. Most notably was the fact that the Euro zone has seen an uncommon synchronized economic growth across most countries. The European region saw positive up trending macroeconomic releases throughout the year. Inflation, however, was mixed as headline inflation seemed to periodically trend higher but core inflation remaining muted. Given the generally positive macroeconomic data, the ECB announced that they will slowly and steadily cease the bond buyback program in 2018.
Compared to the MSCI EAFE®, the Fund saw a moderately positive impact (+0.54%) from sector allocation which was largely driven by the relative overweight allocation in Information Technology (average weight for the period of 10.04% vs. 5.94% in MXEA), a result of the equal sector weighting strategy. The Fund’s relative overweight to the Telecommunication Services sector (average weight for the period of 9.81% vs. 4.29% in MXEA) detracted from performance. The Fund also saw relative underperformance (+0.64%) attributed to selection effect.
From a geographical perspective, performance was supported by selection effect in Switzerland and France. The Fund’s performance was adversely impacted by selection effect in Australia and Germany. The Fund saw the impact of a weakening US dollar, as currency effect improved performance of the fund by 2.15%.
The best performing stocks for the period were STMicroelectronics NV (STM IM), which increased 112.81% and E.ON SE (EOAN GR), which rose 75.68%. The worst performing stocks were Telstra Corp., Ltd. (TLS AU), which decreased 24.78% and ProSiebenSat.1 Media SE (PSM GR), which fell 11.46%.
Looking forward, we believe the Fund’s strategy of annually selecting the five highest yielding securities in each of the ten sectors in the S-Net Developed Markets (Ex N.A.) Index will provide high yield relative to the MSCI EAFE®, potential for market participation in all economic cycles through equal sector weighting, and a deep value portfolio of securities as identified through high yield relative to their sector peers.
Performance (as of November 30, 2017)
| | 1 Year | 3 Year | Since Inception* |
| ALPS International Sector Dividend Dogs ETF – NAV | 28.10% | 5.07% | 6.67% |
| ALPS International Sector Dividend Dogs ETF – Market Price* | 28.79% | 5.21% | 6.79% |
| S-Network® International Sector Dividend Dogs NTR Index | 28.83% | 5.53% | 7.10% |
| MSCI EAFE Index | 27.27% | 5.97% | 7.62% |
Total Expense Ratio (per the current prospectus) 0.50%.
Performance data quoted represents past performance. Past performance does not guarantee future results. The table does not reflect the deduction of taxes that a shareholder would pay on Fund distributions or the redemption of Fund shares. Investment return and principal value of an investment will fluctuate so that an investor’s shares, when sold or redeemed, may be worth more or less than the original cost. Current performance data may be higher or lower than actual data quoted. For the most current month-end performance data please visit www.alpsfunds.com or call 1.866.675.2639.
ALPS International Sector Dividend Dogs ETF
| Performance Overview | November 30, 2017 (Unaudited) |
NAV is an exchange-traded fund’s per-share value. The per-share dollar amount of the Fund is derived by dividing the total value of all the securities in its portfolio, less any liabilities, by the number of Fund shares outstanding. Market Price is the price at which a share can currently be traded in the market. Information detailing the number of days the Market Price of the Fund was greater than the Fund’s NAV and the number of days it was less than the Fund’s NAV can be obtained at www.alpsfunds.com.
| ^ | The Fund Commencement Date was June 28, 2013. |
| * | Market Price is based on the midpoint of the bid-ask spread at 4 p.m. ET and does not represent the returns an investor would receive if shares were traded at other times. |
The S-Network® International Sector Dividend Dogs Index is designed to serve as a fair, impartial and transparent measure of the performance of international large cap equities with above average dividend yields. The Underlying Index is a portfolio of fifty stocks derived from the S-Net International Developed Markets Index (ex-Americas) Index. Total Return assumes reinvestment of any dividends and distributions realized during a given time period. Net Total Return (NTR) is obtained by reinvesting the net dividend, which is equal to the ordinary gross dividend minus the amount of withholding tax.
MSCI EAFE® Index is a stock market index that is designed to measure the equity market performance of developed markets outside of the U.S. & Canada.
The indexes are not actively managed and do not reflect any deductions for fees, expenses or taxes. One cannot invest directly in an index. Index performance does not reflect fund performance.
The Fund’s shares are not individually redeemable. Investors buy and sell shares of the Fund on a secondary market. Only market makers or “authorized participants” may trade directly with the Fund, typically in blocks of 50,000 shares.
The ALPS International Sector Dividend Dogs ETF is not suitable for all investors. Investments in the Fund are subject to investment risks, including possible loss of the principal amount invested.
ALPS Portfolio Solutions Distributor, Inc., a FINRA member, is the distributor for the ETF.
ALPS International Sector Dividend Dogs ETF
| Performance Overview | November 30, 2017 (Unaudited) |
Top 10 Holdings* (as of November 30, 2017)
| Pearson Plc | 2.40% |
| STMicroelectronics NV | 2.40% |
| Stora Enso OYJ | 2.30% |
| BP Plc | 2.20% |
| Royal Dutch Shell Plc | 2.20% |
| Bouygues SA | 2.20% |
| Fortum OYJ | 2.20% |
| Vivendi SA | 2.20% |
| Canon, Inc. | 2.20% |
| Evonik Industries AG | 2.20% |
| Total % of Top 10 Holdings | 22.50% |
Sector Allocation* (as of November 30, 2017)
| Industrials | 12.26% |
| Consumer Discretionary | 10.55% |
| Materials | 10.45% |
| Energy | 10.42% |
| Utilities | 10.07% |
| Health Care | 9.57% |
| Consumer Staples | 9.50% |
| Information Technology | 8.07% |
| Financials | 7.60% |
| Telecommunication Services | 7.40% |
| Communications | 3.92% |
| Money Market Fund | 0.19% |
| Total | 100.00% |
Future holdings are subject to change.
Growth of $10,000 (as of November 30, 2017)
Comparison of Change in Value of $10,000 Investment in the Fund and the Indexes
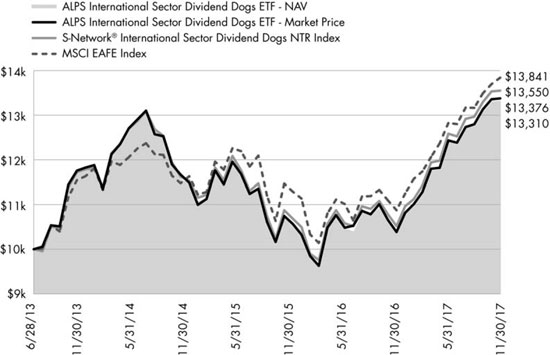
The chart above represents historical performance of a hypothetical investment of $10,000 in the Fund over the life of the Fund. Past performance does not guarantee future results. This chart does not reflect the deduction of taxes that a shareholder would pay on Fund distributions or the redemption of Fund shares.
ALPS Emerging Sector Dividend Dogs ETF
| Performance Overview | November 30, 2017 (Unaudited) |
Investment Objective
The ALPS Emerging Sector Dividend Dogs ETF (the “Fund”) seeks investment results that replicate as closely as possible, before fees and expenses, the performance of the S-Network® Emerging Sector Dividend Dogs Index (the “Underlying Index”). The Shares of the Fund are listed and trade on the NYSE Arca under the ticker symbol EDOG. The Fund generally will invest in all of the securities that comprise the Underlying Index in proportion to their weightings in the Underlying Index.
The Underlying Index is a rules-based index intended to give investors a means of tracking the overall performance of the highest dividend paying stocks (i.e. “Dividend Dogs”) in the S-Network® Emerging Markets Index, a universe of mainly large capitalization stocks domiciled in emerging markets (the “S-Network Emerging Markets”) on a sector-by-sector basis. “Dividend Dogs” refers to the five stocks in each of the ten Global Industry Classification Standard (“GICS”) sectors that make up the S-Network® Emerging Markets which offer the highest dividend yields. Emerging market countries are countries that major international financial institutions, such as the World Bank, generally consider to be less economically mature than developed nations.
Performance Overview
ALPS Emerging Sector Dividend Dogs ETF (EDOG), for the one year period ended November 30, 2017, generated a total return of 18.37%, relatively in-line with the Fund’s Net Total Return Index, net of fees, which returned 19.23%. The Fund trailed the MSCI Emerging Markets Net TR Index®, which returned 32.82% for the same period.
The trailing twelve month yield for the Fund’s constituents as of 11/30/2017 was 4.28% vs. 2.55% on the MSCI EM®.
From a macro perspective, Emerging markets exhibited strong performance returns year-to-date, as of 11/30/2017. The MSCI Emerging Markets Net TR Index has outperformed both the S&P 500 Index as well as the MSCI EAFE Net TR Index. The asset class has historically been sensitive to natural resource markets, and it benefited from the rebound in the commodity price of oil. China’s economy continued its move towards a more service-oriented system, as the Services segment continued to comprise an increasing amount of national GDP. The move by the government to also start the process of stabilizing the government’s balance sheet increased investor sentiment. Positive economic growth across most emerging markets continued to be favorable throughout the year.
Compared to the MSCI EM®, the Fund saw a moderately negative impact (-7.78%) from sector allocation effect which was largely driven by the relative underweight in Information Technology (average weight for the period of 9.98% vs. 25.78% in MSCI EM) and a relative overweight to Utilities over the one year period (average weight for the period of 9.76% vs. 2.69% in MSCI EM), a result of the equal sector weighting strategy Conversely, the Fund’s performance was helped by the relative underweight allocations to Financials (average weight for the period of 10.06% vs. 23.84% in MSCI EM). The Fund also saw a moderately negative impact (-5.57%) due to selection effect, as the names in Information Technology and Health Care were leading detractors, while constituents in Energy and Telecommunication Services propped up fund performance.
From a geographical perspective, the Fund’s returns were bolstered by selection effect in Russia and Turkey. Fund performance for the period was negatively impacted by security selection in South Africa and China. Currency effect had minimal impact on the Fund’s performance, hurting performance by 0.05%.
The best performing stocks for the period were Yangzijiang Shipbuilding Holdings, Ltd. (YZJSGD SP), which increased 107.56%, Powszechny Zaklad Ubezpieczen SA (PZU PW), which returned 84.39%, and Eregli Demir Ve Celik Fabrikalari TAS (EREGL TI), which rose 72.26%. The worst performing stocks were CP Pokphand Co., Ltd. (43 HK), which lost 35.89%, Dr Reddy’s Laboratories, Ltd., ADR (RDY), which fell 24.49%; and Netcare, Ltd. (NTC SJ), which decreased 23.48%.
Looking forward we believe the Fund’s strategy of annually selecting the five highest yielding securities in each of the ten sectors in the S-Net Emerging Markets Index will provide high yield relative to the MSCI Emerging Markets Index®, potential for market participation in all economic cycles through equal sector weighting, and a deep value portfolio of securities as identified through high yield relative to their sector peers.
Performance (as of November 30, 2017)
| | 1 Year | 3 Year | Since Inception* |
| ALPS Emerging Sector Dividend Dogs ETF – NAV | 18.37% | 0.40% | 2.68% |
| ALPS Emerging Sector Dividend Dogs ETF – Market Price* | 18.30% | 0.51% | 2.80% |
| S-Network® Emerging Sector Dividend Dogs NTR Index | 19.23% | 1.34% | 3.60% |
| MSCI Emerging Markets Net TR Index® | 32.82% | 6.15% | 6.40% |
ALPS Emerging Sector Dividend Dogs ETF
| Performance Overview | November 30, 2017 (Unaudited) |
Total Expense Ratio (per the current prospectus) 0.60%.
Performance data quoted represents past performance. Past performance does not guarantee future results. The table does not reflect the deduction of taxes that a shareholder would pay on Fund distributions or the redemption of Fund shares. Investment return and principal value of an investment will fluctuate so that an investor’s shares, when sold or redeemed, may be worth more or less than the original cost. Current performance data may be higher or lower than actual data quoted. For the most current month-end performance data please visit www.alpsfunds.com or call 1.866.675.2639.
NAV is an exchange-traded fund’s per-share value. The per-share dollar amount of the Fund is derived by dividing the total value of all the securities in its portfolio, less any liabilities, by the number of Fund shares outstanding. Market Price is the price at which a share can currently be traded in the market. Information detailing the number of days the Market Price of the Fund was greater than the Fund’s NAV and the number of days it was less than the Fund’s NAV can be obtained at www.alpsfunds.com.
| ^ | The Fund Commencement Date was March 28, 2014. |
| * | Market Price is based on the midpoint of the bid-ask spread at 4 p.m. ET and does not represent the returns an investor would receive if shares were traded at other times. |
The S-Network® Emerging Sector Dividend Dogs Index is a portfolio of stocks derived from a universe of mainly large capitalization stocks domiciled in emerging markets (the “S-Network Emerging Markets Index” “SNEMX”). The index methodology selects the five stocks in each of the ten GICS sectors that make up the universe which offer the highest dividend yields as of the last trading day of November. The fifty stocks that are selected for inclusion in the portfolio are equally weighted. The universe includes stocks whose domicile and primary exchange listings are in countries identified by the World Bank as Upper Middle Income (certain lower middle income countries are also included, as well as stocks traded on the Taiwan Stock Exchange despite non-recognition by the World Bank). The selection criteria for the universe, in addition to the aforementioned country qualifications, also include requirements for sector inclusion, primary exchange listing, minimum market capitalization, share price, average daily trading volume and other factors. Total Return assumes reinvestment of any dividends and distributions realized during a given time period. Net Total Return (NTR) is obtained by reinvesting the net dividend, which is equal to the ordinary gross dividend minus the amount of withholding tax.
The MSCI Emerging Markets Index® is a free float-adjusted market capitalization index that is designed to measure equity market performance in the global emerging markets.
The indexes are not actively managed and do not reflect any deductions for fees, expenses or taxes. One cannot invest directly in an index. Index performance does not reflect fund performance.
The Fund’s shares are not individually redeemable. Investors buy and sell shares of the Fund on a secondary market. Only market makers or “authorized participants” may trade directly with the Fund, typically in blocks of 50,000 shares.
The ALPS Emerging Sector Dividend Dogs ETF is not suitable for all investors. Investments in the Fund are subject to investment risks, including possible loss of the principal amount invested.
ALPS Portfolio Solutions Distributor, Inc., a FINRA member, is the distributor for the ETF.
ALPS Emerging Sector Dividend Dogs ETF
| Performance Overview | November 30, 2017 (Unaudited) |
Top 10 Holdings* (as of November 30, 2017)
| CEZ A.S. | 2.44% |
| Gudang Garam Tbk PT | 2.32% |
| Yangzijiang Shipbuilding Holdings, Ltd. | 2.30% |
| Imperial Holdings, Ltd. | 2.26% |
| Lukoil PJSC | 2.25% |
| PhosAgro PJSC | 2.24% |
| Astro Malaysia Holdings Bhd | 2.23% |
| Gazprom PAO | 2.23% |
| Infosys, Ltd. | 2.21% |
| Lenovo Group, Ltd. | 2.18% |
| Total% of Top 10 Holdings | 22.66% |
| * | % of Total Investments (excluding investments purchased with collateral from securities loaned). |
Sector Allocation* (as of November 30, 2017)
| Consumer Discretionary | 10.22% |
| Energy | 10.19% |
| Financials | 10.03% |
| Utilities | 10.03% |
| Consumer Staples | 9.99% |
| Materials | 9.94% |
| Health Care | 9.85% |
| Industrials | 8.30% |
| Information Technology | 8.06% |
| Telecommunication Services | 7.95% |
| Technology | 2.18% |
| Communications | 1.89% |
| Consumer, Non-Cyclical | 1.16% |
| Money Market Fund | 0.21% |
| Total | 100.00% |
Future holdings are subject to change.
Growth of $10,000 (as of November 30, 2017)
Comparison of Change in Value of $10,000 Investment in the Fund and the Indexes
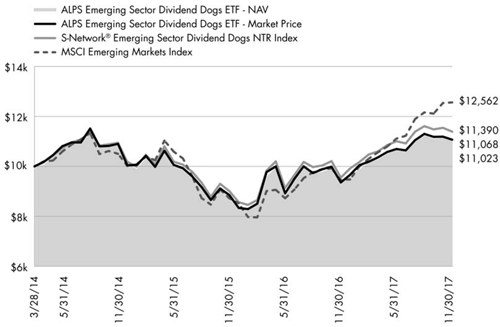
The chart above represents historical performance of a hypothetical investment of $10,000 in the Fund over the life of the Fund. Past performance does not guarantee future results. This chart does not reflect the deduction of taxes that a shareholder would pay on Fund distributions or the redemption of Fund shares.
ALPS | Dorsey Wright Sector Momentum ETF
| Performance Overview | November 30, 2017 (Unaudited) |
Investment Objective
The ALPS | Dorsey Wright Sector Momentum ETF (the “Fund”) employs a “passive management” – or indexing – investment approach designed to seek investment results that correspond (before fees and expenses) generally to the performance of the Dorsey Wright US Sector Momentum Index (the “Underlying Index”). The shares of the Fund are listed and trade on the NASDAQ under the ticker symbol SWIN.
The Underlying Index is a rules-based index intended to track the overall performance of the stocks with the highest relative strength or “momentum” within the NASDAQ US Large Mid Cap Index on a sector-by-sector basis.
Performance Overview
The ALPS Dorsey Wright Sector Momentum ETF (SWIN) for the period beginning January 10, 2017 (commencement date) and ending November 30, 2017, generated a total return of 19.63%, in line with the Fund’s Underlying Index, net of fees, which returned 19.02%. The Fund outperformed the S&P 500, which returned 18.83% for the same period.
The S&P 500 rallied through the end of the first calendar quarter in 2017. The election of President Trump fueled optimism in the marketplace on hopes that tax and healthcare reform would pass in a Republican controlled congress. Oil saw moderate volatility during the year, exhibiting a low of $42.53 per barrel on June 21 and reached a high of $58.95 on November 24th. During the year, oil exhibited an average price of $50.40. The S&P 500 returned 3.07% in Q2 2017. Relative to the previous quarter, the U.S. market saw modest positive returns. Monetary policy remained unsurprising due to the continued assurance from the Federal Reserve that a slow and anticipated rise in short term interest rates will continue. During the third calendar quarter of 2017, the S&P 500 returned 4.41%. Although pro-growth policies and reform had yet to surface in the first half of the year, optimism remained in the market. The majority of U.S. equities’ gains came in the first two months of Q4, which returned 5.49%. The announcement that the Republican Party had enough votes to pass tax reforms in the House and Senate spurred a strong rally in the U.S. Market. In addition, companies in the S&P 500, on average, reported strong Q3 earnings.
Relative to the S&P 500, the Fund added 1.26% in alpha from inception through the end of November. Outperformance was largely driven by the Health Care sector with names selected providing the relative boost. With both funds averaging about 14% allocated to the sector over the period, the names selected and how they were weighted assisted to the outperformance against the S&P. For instance, both SWIN and the S&P held Align Technology, Inc. (ALGN), however, SWIN had a 1.54% average weighting while the S&P had an average 0.03% weighting. Allocation effect was positive and showcased SWIN’s use of the Dorsey Wright point and figure charting methodology to select the sectors with the highest positive momentum. SWIN did not have an allocation to Consumer Staples or Telecommunication Services during the period which added a large portion of the positive allocation effect.
Align Technology, Inc. (ALGN) and NVIDIA Corp. (NVDA) were the two top contributors to return adding 1.8% and 1.58% to the Fund while each returned 111.92% and 87.81% for the period, respectively. The two largest detractors were Equifax INC (EFX) and Targa Resources Corp (TRGP) losing 0.74% and 0.52%, respectively.
Looking forward we believe the Fund’s strategy in identifying momentum at the sector level can result in potential outperformance to the overall market and increased diversification by gaining access to the momentum factor.
Performance (as of November 30, 2017)
| | Since Inception^ |
| ALPS | Dorsey Wright Sector Momentum ETF - NAV | 19.63% |
| ALPS | Dorsey Wright Sector Momentum ETF - Market Price* | 19.67% |
| Dorsey Wright US Sector Momentum Index | 19.02% |
| S&P 500® Total Return Index | 18.83% |
ALPS | Dorsey Wright Sector Momentum ETF
| Performance Overview | November 30, 2017 (Unaudited) |
Total Expense Ratio (per the current prospectus) 0.40%
Performance data quoted represents past performance. Past performance does not guarantee future results. Investment return and principal value of an investment will fluctuate so that an investor’s shares, when redeemed, may be worth more or less than their original cost. Current performance may be higher or lower than actual data quoted. For the most current month-end performance data please visit www.alpsfunds.com or call 1.855.759.5679.
NAV is an exchange-traded fund’s per-share value. The per-share dollar amount of the Fund is derived by dividing the total value of all the securities in its portfolio, less any liabilities, by the number of Fund shares outstanding. Market Price is the price at which a share can currently be traded in the market. Information detailing the number of days the Market Price of the Fund was greater than the Fund’s NAV and the number of days it was less than the Fund’s NAV can be obtained at www.alpsfunds.com.
| ^ | The Fund Commencement date was January 10, 2017. Total return for a period of less than one year is not annualized. |
| * | Market Price is based on the midpoint of the bid-ask spread at 4 p.m. ET and does not represent the returns an investor would receive if shares were traded at other times. |
The Fund is new with limited operating history.
The Dorsey Wright US Sector Momentum Index is a rules-based index intended to track the overall performance of the stocks with the highest relative strength or “momentum” within the NASDAQ US Large Mid Cap Index on a sector-by-sector basis.
The S&P 500® Index is the Standard & Poor’s composite index of 500 stocks, a widely recognized, unmanaged index of common stock prices
The indexes are reported on a total return basis, which assumes reinvestment of any dividends and distributions realized during a given time period. The indexes are not actively managed and do not reflect any deductions for fees, expenses or taxes. One cannot invest directly in an index. Index performance does not reflect fund performance.
The NASDAQ US Large Mid Cap Index is designed to track the performance of securities assigned to United States and comprised of the Large Mid Cap segment.
The Fund’s shares are not individually redeemable. Investors buy and sell shares of the Fund on a secondary market. Only market makers or “authorized participants” may trade directly with the Fund, typically in blocks of 50,000 shares.
The ALPS | Dorsey Wright Sector Momentum ETF is not suitable for all investors. Investments in the Fund are subject to investment risks, including possible loss of the principal amount invested.
ALPS Portfolio Solutions Distributor, Inc., a FINRA member, is the distributor for the ALPS | Dorsey Wright Sector Momentum ETF.
ALPS Portfolio Solutions Distributor, Inc. is not affiliated with Nasdaq, Inc.
ALPS | Dorsey Wright Sector Momentum ETF
| Performance Overview | November 30, 2017 (Unaudited) |
Top 10 Holdings* (as of November 30, 2017)
| Align Technology, Inc. | 2.66% |
| Western Alliance Bancorp | 2.32% |
| ABIOMED, Inc. | 2.31% |
| ANSYS, Inc. | 2.29% |
| Amazon.com, Inc. | 2.25% |
| The Sherwin-Williams Co. | 2.21% |
| United States Steel Corp. | 2.17% |
| Northrop Grumman Corp. | 2.17% |
| Cadence Design Systems, Inc. | 2.16% |
| Roper Technologies, Inc. | 2.11% |
| Total % of Top 10 Holdings | 22.65% |
| * | % of Total Investments (excluding investments purchased with collateral from securities loaned). |
Sector Allocation* (as of November 30, 2017)
| Information Technology | 21.81% |
| Consumer Discretionary | 15.35% |
| Industrials | 14.57% |
| Materials | 14.04% |
| Health Care | 12.54% |
| Utilities | 9.63% |
| Financials | 8.21% |
| Real Estate | 3.79% |
| Money Market Fund | 0.06% |
| Total | 100.00% |
Future holdings are subject to change.
Growth of $10,000 (as of November 30, 2017)
Comparison of Change in Value of $10,000 Investment in the Fund and the Indexes
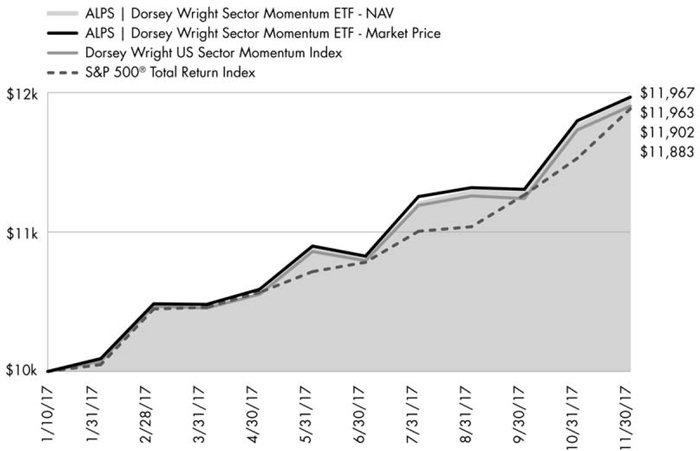
The chart above represents historical performance of a hypothetical investment of $10,000 in the Fund over the life of the Fund. Past performance does not guarantee future results. This chart does not reflect the deduction of taxes that a shareholder would pay on Fund distributions or the redemption of Fund shares.
ALPS ETF Trust
| Disclosure of Fund Expenses | November 30, 2017 (Unaudited) |
Shareholder Expense Example: As a shareholder of a Fund, you incur two types of costs: (1) transaction costs which may include creation and redemption fees or brokerage charges, and (2) ongoing costs, including management fees and other Fund expenses. These examples are intended to help you understand your ongoing costs (in dollars) of investing in the Fund and to compare these costs with the ongoing costs of investing in other funds. It is based on an investment of $1,000 invested at the beginning of the (six month) period and held through November 30, 2017.
Actual Return: The first line of the table provides information about actual account values and actual expenses. You may use the information in this line, together with the amount you invested, to estimate the expenses that you incurred over the period. Simply divide your account value by $1,000 (for example, an $8,600 account value divided by $1,000 = 8.6), then multiply the result by the number in the first line under the heading entitled “Expenses Paid During Period” to estimate the expenses attributable to your investment during this period.
Hypothetical 5% Return: The second line of the table provides information about hypothetical account values and hypothetical expenses based on the Fund’s actual expense ratio and an assumed rate of return of 5% per year before expenses, which is not the Fund’s actual return. The hypothetical account values and expenses may not be used to estimate the actual ending account balance or expenses you paid for the period. You may use this information to compare ongoing costs of investing in the Fund and other funds. To do so, compare this 5% hypothetical example with the 5% hypothetical examples that appear in the shareholder reports of other funds.
The expenses shown in the table are meant to highlight ongoing Fund costs only and do not reflect any transaction costs, such as creation and redemption fees or brokerage charges. Therefore, the second line is useful in comparing ongoing costs only, and will not help you determine the relative total costs of owning different funds. In addition, if these costs were included, your costs would have been higher.
| | Beginning Account Value 6/1/17 | Ending Account Value 11/30/17 | Expense Ratio(a) | Expenses Paid During Period 6/1/17 - 11/30/17(b) |
| ALPS Sector Dividend Dogs ETF | | | | |
| Actual | $1,000.00 | $1,095.60 | 0.40% | $2.10 |
| Hypothetical (5% return before expenses) | $1,000.00 | $1,023.06 | 0.40% | $2.03 |
| ALPS International Sector Dividend Dogs ETF | | | | |
| Actual | $1,000.00 | $1,074.20 | 0.50% | $2.60 |
| Hypothetical (5% return before expenses) | $1,000.00 | $1,022.56 | 0.50% | $2.54 |
| ALPS Emerging Sector Dividend Dogs ETF | | | | |
| Actual | $1,000.00 | $1,031.70 | 0.60% | $3.06 |
| Hypothetical (5% return before expenses) | $1,000.00 | $1,022.06 | 0.60% | $3.04 |
| ALPS | Dorsey Wright Sector Momentum ETF | | | | |
| Actual | $1,000.00 | $1,098.50 | 0.40% | $2.10 |
| Hypothetical (5% return before expenses) | $1,000.00 | $1,023.06 | 0.40% | $2.03 |
| (a) | Annualized based on the Fund's most recent half-year expenses. |
| (b) | Expenses are equal to the Fund's annualized expense ratio multiplied by the average account value over the period, multiplied by the number of days in the most recent fiscal half year (183), divided by 365. |
ALPS ETF Trust
Report of Independent Registered Public Accounting Firm
To the Board of Trustees and Shareholders of ALPS ETF Trust:
We have audited the accompanying statements of assets and liabilities, including the schedules of investments, of ALPS Sector Dividend Dogs ETF, ALPS International Sector Dividend Dogs ETF, ALPS Emerging Sector Dividend Dogs ETF, and ALPS | Dorsey Wright Sector Momentum ETF, four of the portfolios constituting the ALPS ETF Trust (the “Trust”), as of November 30, 2017, and the related statements of operations for the year then ended (as to ALPS | Dorsey Wright Sector Momentum ETF, for the period January 10, 2017 (commencement of operations) to November 30, 2017), the statements of changes in net assets for each of the two years in the period then ended (as to ALPS | Dorsey Wright Sector Momentum ETF, for the period January 10, 2017 (commencement of operations) to November 30, 2017, and the financial highlights for each of the periods presented. These financial statements and financial highlights are the responsibility of the Trust’s management. Our responsibility is to express an opinion on these financial statements and financial highlights based on our audits.
We conducted our audits in accordance with the standards of the Public Company Accounting Oversight Board (United States). Those standards require that we plan and perform the audit to obtain reasonable assurance about whether the financial statements and financial highlights are free of material misstatement. The Trust is not required to have, nor were we engaged to perform, an audit of its internal control over financial reporting. Our audits included consideration of internal control over financial reporting as a basis for designing audit procedures that are appropriate in the circumstances, but not for the purpose of expressing an opinion on the effectiveness of the Trust’s internal control over financial reporting. Accordingly, we express no such opinion. An audit also includes examining, on a test basis, evidence supporting the amounts and disclosures in the financial statements, assessing the accounting principles used and significant estimates made by management, as well as evaluating the overall financial statement presentation. Our procedures included confirmation of securities owned as of November 30, 2017, by correspondence with the custodian and brokers. We believe that our audits provide a reasonable basis for our opinion.
In our opinion, the financial statements and financial highlights referred to above present fairly, in all material respects, the financial position of ALPS Sector Dividend Dogs ETF, ALPS International Sector Dividend Dogs ETF, ALPS Emerging Sector Dividend Dogs ETF, and ALPS | Dorsey Wright Sector Momentum ETF of the ALPS ETF Trust as of November 30, 2017, and the results of their operations, the changes in their net assets, and the financial highlights for each of the periods presented, in conformity with accounting principles generally accepted in the United States of America.
DELOITTE & TOUCHE LLP
Denver, Colorado
January 26, 2018
| ALPS Sector Dividend Dogs ETF | |
| Schedule of Investments | November 30, 2017 |
| Security Description | | Shares | | | Value | |
| COMMON STOCKS (99.67%) | | | | | | | | |
| Consumer Discretionary (11.20%) | | | | | | | | |
| Ford Motor Co. | | | 3,971,393 | | | $ | 49,721,840 | |
| Garmin, Ltd. | | | 863,194 | | | | 53,587,084 | |
| General Motors Co. | | | 1,219,301 | | | | 52,539,680 | |
| Macy's, Inc. | | | 2,119,176 | | | | 50,436,389 | |
| Mattel, Inc.(a) | | | 2,952,580 | | | | 53,884,585 | |
| Total Consumer Discretionary | | | | | | | 260,169,578 | |
| | | | | | | | | |
| Consumer Staples (9.61%) | | | | | | | | |
| Altria Group, Inc. | | | 724,961 | | | | 49,174,104 | |
| The Coca-Cola Co. | | | 983,240 | | | | 45,002,895 | |
| Kimberly-Clark Corp. | | | 381,864 | | | | 45,732,033 | |
| Philip Morris International, Inc. | | | 385,363 | | | | 39,596,048 | |
| The Procter & Gamble Co. | | | 485,910 | | | | 43,727,041 | |
| Total Consumer Staples | | | | | | | 223,232,121 | |
| | | | | | | | | |
| Energy (10.45%) | | | | | | | | |
| Chevron Corp. | | | 407,177 | | | | 48,449,991 | |
| Occidental Petroleum Corp. | | | 748,886 | | | | 52,796,463 | |
| ONEOK, Inc. | | | 802,400 | | | | 41,644,560 | |
| Valero Energy Corp. | | | 650,127 | | | | 55,663,874 | |
| The Williams Cos., Inc. | | | 1,516,835 | | | | 44,064,057 | |
| Total Energy | | | | | | | 242,618,945 | |
| | | | | | | | | |
| Financials (10.92%) | | | | | | | | |
| Arthur J Gallagher & Co. | | | 761,717 | | | | 50,143,830 | |
| Invesco, Ltd. | | | 1,423,537 | | | | 51,489,333 | |
| Navient Corp. | | | 3,367,975 | | | | 42,470,165 | |
| People's United Financial, Inc. | | | 2,776,394 | | | | 52,807,014 | |
| T Rowe Price Group, Inc. | | | 550,266 | | | | 56,633,377 | |
| Total Financials | | | | | | | 253,543,719 | |
| | | | | | | | | |
| Health Care (9.99%) | | | | | | | | |
| AbbVie, Inc. | | | 528,743 | | | | 51,245,772 | |
| Eli Lilly & Co. | | | 543,932 | | | | 46,038,404 | |
| Johnson & Johnson | | | 344,287 | | | | 47,969,508 | |
| Merck & Co., Inc. | | | 703,275 | | | | 38,870,009 | |
| Pfizer, Inc. | | | 1,323,023 | | | | 47,972,814 | |
| Total Health Care | | | | | | | 232,096,507 | |
| | | | | | | | | |
| Industrials (10.05%) | | | | | | | | |
| Caterpillar, Inc. | | | 382,763 | | | | 54,026,998 | |
| Eaton Corp. Plc | | | 626,072 | | | | 48,695,880 | |
| Emerson Electric Co. | | | 748,188 | | | | 48,497,546 | |
| General Electric Co. | | | 1,889,932 | | | | 34,566,856 | |
| United Parcel Service, Inc., Class B | | | 392,015 | | | | 47,610,222 | |
| Total Industrials | | | | | | | 233,397,502 | |
| | | | | | | | | |
| Information Technology (10.75%) | | | | | | | | |
| Cisco Systems, Inc. | | | 1,433,171 | | | | 53,457,278 | |
| HP, Inc. | | | 2,359,605 | | | | 50,613,527 | |
| International Business Machines Corp. | | | 316,664 | | | | 48,756,756 | |
| Seagate Technology Plc | | | 1,410,258 | | | | 54,379,549 | |
| Security Description | | Shares | | | Value | |
| Information Technology (continued) | | | | | | | | |
| Xerox Corp. | | | 1,432,124 | | | $ | 42,476,798 | |
| Total Information Technology | | | | | | | 249,683,908 | |
| | | | | | | | | |
| Materials (11.11%) | | | | | | | | |
| CF Industries Holdings, Inc. | | | 1,408,041 | | | | 52,759,296 | |
| DowDuPont, Inc. | | | 695,675 | | | | 50,060,773 | |
| International Paper Co. | | | 823,460 | | | | 46,616,071 | |
| LyondellBasell Industries NV, Class A | | | 496,115 | | | | 51,943,240 | |
| The Mosaic Co. | | | 2,326,651 | | | | 56,514,353 | |
| Total Materials | | | | | | | 257,893,733 | |
| | | | | | | | | |
| Telecommunication Services (5.67%) | | | | | | | | |
| AT&T, Inc. | | | 1,267,960 | | | | 46,128,385 | |
| CenturyLink, Inc. | | | 2,440,748 | | | | 35,610,513 | |
| Verizon Communications, Inc. | | | 978,781 | | | | 49,810,165 | |
| Total Telecommunication Services | | | | | | | 131,549,063 | |
| | | | | | | | | |
| Utilities (9.92%) | | | | | | | | |
| Duke Energy Corp. | | | 513,915 | | | | 45,830,940 | |
| Entergy Corp. | | | 565,295 | | | | 48,886,711 | |
| FirstEnergy Corp. | | | 1,401,390 | | | | 47,843,455 | |
| PPL Corp. | | | 1,138,455 | | | | 41,747,145 | |
| The Southern Co. | | | 900,727 | | | | 46,117,222 | |
| Total Utilities | | | | | | | 230,425,473 | |
| | | | | | | | | |
| TOTAL COMMON STOCKS | | | | | | | | |
| (Cost $2,053,763,692) | | | | | | | 2,314,610,549 | |
| | | 7 Day Yield | | | Shares | | | Value | |
| SHORT TERM INVESTMENTS (1.88%) | | | | | | | | | | | | |
| Money Market Fund (0.09%) | | | | | | | | | | | | |
| State Street Institutional | | | | | | | | | | | | |
| Treasury Plus Money | | | | | | | | | | | | |
| Market Fund | | | | | | | | | | | | |
| (Cost $2,205,596) | | | 0.970 | % | | | 2,205,596 | | | | 2,205,596 | |
| | | | | | | | | | | | | |
| Investments Purchased with Collateral from Securities Loaned (1.79%) | | | | | | | | | | | | |
| State Street Navigator Securities | | | | | | | | | | | | |
| Lending Prime Portfolio, 1.04% | | | | | | | | | | | | |
| (Cost $41,488,538) | | | | | | | 41,488,538 | | | | 41,488,538 | |
| | | | | | | | | | | | | |
| TOTAL SHORT TERM INVESTMENTS | | | | | | | | | | | | |
| (Cost $43,694,134) | | | | | | | | | | | 43,694,134 | |
| | | | | | | | | | | | | |
| TOTAL INVESTMENTS (101.55%) | | | | | | | | | | | | |
| (Cost $2,097,457,826) | | | | | | | | | | $ | 2,358,304,683 | |
| | | | | | | | | | | | | |
| NET LIABILITIES LESS OTHER ASSETS (-1.55%) | | | | | | | | | | | (36,100,133 | ) |
| | | | | | | | | | | | | |
| NET ASSETS (100.00%) | | | | | | | | | | $ | 2,322,204,550 | |
| ALPS Sector Dividend Dogs ETF | |
| Schedule of Investments | November 30, 2017 |
| (a) | Security, or a portion of the security position is currently on loan. The total market value of securities on loan is $40,413,439. |
See Notes to Financial Statements.
ALPS International Sector Dividend Dogs ETF
| Schedule of Investments | November 30, 2017 |
| Security Description | | Shares | | | Value | |
| COMMON STOCKS (99.47%) | | | | | | | | |
| Australia (16.98%) | | | | | | | | |
| AMP, Ltd. | | | 1,725,831 | | | $ | 6,670,691 | |
| Aurizon Holdings, Ltd. | | | 1,704,704 | | | | 6,795,340 | |
| Australia & New Zealand Banking Group, Ltd. | | | 293,472 | | | | 6,317,616 | |
| National Australia Bank, Ltd. | | | 281,622 | | | | 6,303,230 | |
| Suncorp Group, Ltd. | | | 673,672 | | | | 7,302,075 | |
| Telstra Corp., Ltd. | | | 2,285,181 | | | | 5,928,794 | |
| Wesfarmers, Ltd. | | | 200,636 | | | | 6,665,348 | |
| Westpac Banking Corp. | | | 274,379 | | | | 6,531,294 | |
| Woolworths, Ltd. | | | 333,726 | | | | 6,792,902 | |
| Total Australia | | | | | | | 59,307,290 | |
| | | | | | | | | |
| Belgium (1.85%) | | | | | | | | |
| Anheuser-Busch InBev SA | | | 56,046 | | | | 6,450,741 | |
| | | | | | | | | |
| Denmark (2.10%) | | | | | | | | |
| Novo Nordisk A/S, Class B | | | 141,833 | | | | 7,321,759 | |
| | | | | | | | | |
| Finland (6.07%) | | | | | | | | |
| Fortum OYJ | | | 361,333 | | | | 7,603,760 | |
| Nokia OYJ | | | 1,133,178 | | | | 5,686,398 | |
| Stora Enso OYJ, Class R | | | 516,945 | | | | 7,912,684 | |
| Total Finland | | | | | | | 21,202,842 | |
| | | | | | | | | |
| France (10.25%) | | | | | | | | |
| Bouygues SA | | | 147,363 | | | | 7,622,838 | |
| Electricite de France SA | | | 576,570 | | | | 7,555,755 | |
| Engie SA | | | 383,776 | | | | 6,717,093 | |
| Sanofi | | | 69,119 | | | | 6,301,802 | |
| Vivendi SA | | | 284,914 | | | | 7,584,400 | |
| Total France | | | | | | | 35,781,888 | |
| | | | | | | | | |
| Germany (11.95%) | | | | | | | | |
| BASF SE | | | 67,376 | | | | 7,538,268 | |
| Daimler AG, Registered Shares | | | 87,674 | | | | 7,254,694 | |
| E.ON SE | | | 590,855 | | | | 6,833,633 | |
| Evonik Industries AG | | | 202,805 | | | | 7,565,126 | |
| ProSiebenSat.1 Media SE | | | 204,279 | | | | 6,496,788 | |
| Telefonica Deutschland Holding AG | | | 1,265,992 | | | | 6,021,365 | |
| Total Germany | | | | | | | 41,709,874 | |
| | | | | | | | | |
| Hong Kong (1.98%) | | | | | | | | |
| Sands China, Ltd. | | | 1,423,000 | | | | 6,914,445 | |
| | | | | | | | | |
| Italy (5.93%) | | | | | | | | |
| Atlantia SpA | | | 208,804 | | | | 6,936,449 | |
| Eni SpA | | | 420,611 | | | | 6,913,736 | |
| Security Description | | Shares | | | Value | |
| Italy (continued) | | | | | | | | |
| Snam SpA | | | 1,357,650 | | | $ | 6,845,139 | |
| Total Italy | | | | | | | 20,695,324 | |
| | | | | | | | | |
| Japan (5.96%) | | | | | | | | |
| Canon, Inc. | | | 198,263 | | | | 7,571,499 | |
| Seiko Epson Corp. | | | 270,200 | | | | 6,530,224 | |
| Takeda Pharmaceutical Co., Ltd. | | | 122,089 | | | | 6,708,413 | |
| Total Japan | | | | | | | 20,810,136 | |
| | | | | | | | | |
| Netherlands (4.57%) | | | | | | | | |
| Royal Dutch Shell Plc, Class A | | | 240,498 | | | | 7,674,442 | |
| STMicroelectronics NV | | | 364,940 | | | | 8,279,095 | |
| Total Netherlands | | | | | | | 15,953,537 | |
| | | | | | | | | |
| Norway (1.93%) | | | | | | | | |
| Yara International ASA | | | 151,669 | | | | 6,743,518 | |
| | | | | | | | | |
| Singapore (2.04%) | | | | | | | | |
| Singapore Airlines, Ltd. | | | 896,600 | | | | 7,140,356 | |
| | | | | | | | | |
| Spain (7.85%) | | | | | | | | |
| Abertis Infraestructuras SA | | | 334,748 | | | | 7,474,624 | |
| Gas Natural SDG SA | | | 283,316 | | | | 6,332,937 | |
| Repsol SA | | | 389,347 | | | | 7,145,946 | |
| Telefonica SA | | | 631,987 | | | | 6,472,880 | |
| Total Spain | | | | | | | 27,426,387 | |
| | | | | | | | | |
| Sweden (3.91%) | | | | | | | | |
| Telefonaktiebolaget LM Ericsson, Class B | | | 1,177,010 | | | | 7,402,932 | |
| Telia Co. AB | | | 1,421,487 | | | | 6,237,192 | |
| Total Sweden | | | | | | | 13,640,124 | |
| | | | | | | | | |
| United Kingdom (16.10%) | | | | | | | | |
| AstraZeneca Plc | | | 108,151 | | | | 6,987,010 | |
| BP Plc | | | 1,161,137 | | | | 7,680,451 | |
| British American Tobacco Plc | | | 105,350 | | | | 6,680,675 | |
| GlaxoSmithKline Plc | | | 345,189 | | | | 5,973,142 | |
| Imperial Brands Plc | | | 156,348 | | | | 6,479,739 | |
| Pearson Plc | | | 883,558 | | | | 8,460,069 | |
| Rio Tinto, Ltd. | | | 123,406 | | | | 6,622,779 | |
| Vodafone Group Plc | | | 2,420,831 | | | | 7,343,436 | |
| Total United Kingdom | | | | | | | 56,227,301 | |
| | | | | | | | | |
| TOTAL COMMON STOCKS | | | | | | | | |
| (Cost $319,270,579) | | | | | | | 347,325,522 | |
ALPS International Sector Dividend Dogs ETF
| Schedule of Investments | November 30, 2017 |
| | | 7 Day Yield | | | Shares | | | Value | |
| SHORT TERM INVESTMENTS (0.19%) | | | | | | | | | | | | |
| Money Market Fund (0.19%) | | | | | | | | | | | | |
| State Street Institutional Treasury Plus Money Market Fund | | | 0.970 | % | | | 671,421 | | | | 671,421 | |
| TOTAL SHORT TERM INVESTMENTS | | | |
| (Cost $671,421) | | | 671,421 | |
| | | | | |
| TOTAL INVESTMENTS (99.66%) | | | | |
| (Cost $319,942,000) | | $ | 347,996,943 | |
| | | | | |
| NET OTHER ASSETS AND LIABILITIES (0.34%) | | | 1,186,739 | |
| | | | | |
| NET ASSETS (100.00%) | | $ | 349,183,682 | |
See Notes to Financial Statements.
ALPS Emerging Sector Dividend Dogs ETF
| Schedule of Investments | November 30, 2017 |
| Security Description | | Shares | | | Value | |
| COMMON STOCKS (99.81%) | | | | | | | | |
| Brazil (7.59%) | | | | | | | | |
| BB Seguridade Participacoes SA | | | 104,043 | | | $ | 854,351 | |
| CCR SA | | | 166,667 | | | | 805,981 | |
| Cielo SA | | | 136,309 | | | | 953,574 | |
| Fibria Celulose SA, Sponsored ADR | | | 70,634 | | | | 981,106 | |
| Total Brazil | | | | | | | 3,595,012 | |
| | | | | | | | | |
| Chile (1.82%) | | | | | | | | |
| Aguas Andinas SA, Class A | | | 1,497,164 | | | | 861,155 | |
| | | | | | | | | |
| China (8.50%) | | | | | | | | |
| Huadian Power International Corp., Ltd., Class H | | | 2,412,000 | | | | 941,928 | |
| Huaneng Power International, Inc., Sponsored ADR(a) | | | 37,549 | | | | 963,132 | |
| Lenovo Group, Ltd. | | | 1,818,000 | | | | 1,033,517 | |
| Yangzijiang Shipbuilding Holdings, Ltd. | | | 934,300 | | | | 1,087,684 | |
| Total China | | | | | | | 4,026,261 | |
| | | | | | | | | |
| Colombia (2.11%) | | | | | | | | |
| Almacenes Exito SA | | | 184,379 | | | | 1,001,203 | |
| | | | | | | | | |
| Czech Republic (4.37%) | | | | | | | | |
| CEZ A.S. | | | 50,567 | | | | 1,156,856 | |
| Komercni banka A.S. | | | 21,781 | | | | 912,921 | |
| Total Czech Republic | | | | | | | 2,069,777 | |
| | | | | | | | | |
| Hong Kong (1.93%) | | | | | | | | |
| CP Pokphand Co., Ltd. | | | 11,690,000 | | | | 913,030 | |
| | | | | | | | | |
| Hungary (2.04%) | | | | | | | | |
| Richter Gedeon Nyrt | | | 37,349 | | | | 965,118 | |
| | | | | | | | | |
| India (6.24%) | | | | | | | | |
| Dr Reddy's Laboratories, Ltd., ADR | | | 29,326 | | | | 1,026,996 | |
| Infosys, Ltd., Sponsored ADR | | | 67,309 | | | | 1,047,328 | |
| Wipro, Ltd., ADR(a) | | | 163,620 | | | | 881,912 | |
| Total India | | | | | | | 2,956,236 | |
| | | | | | | | | |
| Indonesia (8.17%) | | | | | | | | |
| Gudang Garam Tbk PT | | | 194,600 | | | | 1,100,973 | |
| Kalbe Farma Tbk PT | | | 7,441,800 | | | | 880,296 | |
| Semen Indonesia Persero Tbk PT | | | 1,247,500 | | | | 866,960 | |
| Surya Citra Media Tbk PT | | | 6,275,300 | | | | 1,020,676 | |
| Total Indonesia | | | | | | | 3,868,905 | |
| Security Description | | Shares | | | Value | |
| Luxembourg (1.89%) | | | | | | |
| Ternium SA, Sponsored ADR | | | 31,257 | | | $ | 892,700 | |
| | | | | | | | | |
| Malaysia (9.79%) | | | | | | | | |
| Astro Malaysia Holdings Bhd | | | 1,521,600 | | | | 1,056,693 | |
| British American Tobacco Malay Bhd | | | 92,527 | | | | 845,741 | |
| Malayan Banking Bhd | | | 424,700 | | | | 960,625 | |
| Sime Darby Bhd | | | 449,800 | | | | 258,474 | |
| Sime Darby Plantation Bhd(b) | | | 449,800 | | | | 551,045 | |
| Sime Darby Property Bhd(b) | | | 449,800 | | | | 131,987 | |
| YTL Power International Bhd | | | 2,948,940 | | | | 829,265 | |
| Total Malaysia | | | | | | | 4,633,830 | |
| | | | | | | | | |
| Mexico (1.83%) | | | | | | | | |
| Kimberly-Clark de Mexico SAB de CV, Class A | | | 485,700 | | | | 868,441 | |
| | | | | | | | | |
| Poland (5.82%) | | | | | | | | |
| Bank Pekao SA | | | 27,210 | | | | 986,777 | |
| Polskie Gornictwo Naftowe i Gazownictwo SA | | | 506,338 | | | | 865,045 | |
| Powszechny Zaklad Ubezpieczen SA | | | 71,946 | | | | 905,861 | |
| Total Poland | | | | | | | 2,757,683 | |
| | | | | | | | | |
| Russia (10.71%) | | | | | | | | |
| Gazprom PAO, Sponsored ADR | | | 236,277 | | | | 1,056,040 | |
| Lukoil PJSC, Sponsored ADR | | | 19,192 | | | | 1,066,116 | |
| MegaFon PJSC, GDR(c) | | | 96,772 | | | | 933,850 | |
| Mobile TeleSystems PJSC, Sponsored ADR | | | 92,036 | | | | 954,413 | |
| PhosAgro PJSC, GDR(c) | | | 70,633 | | | | 1,059,495 | |
| Total Russia | | | | | | | 5,069,914 | |
| | | | | | | | | |
| South Africa (9.97%) | | | | | | | | |
| Imperial Holdings, Ltd. | | | 64,463 | | | | 1,068,257 | |
| Life Healthcare Group Holdings, Ltd. | | | 496,758 | | | | 945,706 | |
| MTN Group, Ltd. | | | 102,933 | | | | 970,190 | |
| Netcare, Ltd. | | | 517,142 | | | | 848,392 | |
| Truworths International, Ltd. | | | 152,125 | | | | 887,571 | |
| Total South Africa | | | | | | | 4,720,116 | |
| | | | | | | | | |
| Thailand (9.91%) | | | | | | | | |
| Advanced Info Service Pcl | | | 167,800 | | | | 896,543 | |
| BTS Group Holdings Pcl | | | 3,729,020 | | | | 941,960 | |
| Delta Electronics Thailand Pcl | | | 362,824 | | | | 935,944 | |
| Intouch Holdings Pcl, NVDR | | | 545,900 | | | | 906,769 | |
| IRPC Pcl | | | 5,325,100 | | | | 1,010,888 | |
| Total Thailand | | | | | | | 4,692,104 | |
| | | | | | | | | |
| Turkey (7.12%) | | | | | | | | |
| Eregli Demir ve Celik Fabrikalari TAS | | | 412,567 | | | | 907,123 | |
| Tofas Turk Otomobil Fabrikasi A.S. | | | 100,831 | | | | 803,373 | |
ALPS Emerging Sector Dividend Dogs ETF
| Schedule of Investments | November 30, 2017 |
| Security Description | | Shares | | | Value | |
| Turkey (continued) | | | | | | | | |
| Tupras Turkiye Petrol Rafinerileri A.S. | | | 26,637 | | | $ | 824,435 | |
| Turkiye Sise ve Cam Fabrikalari A.S. | | | 782,912 | | | | 837,713 | |
| Total Turkey | | | | | | | 3,372,644 | |
| | | | | | | | | |
| TOTAL COMMON STOCKS | | | | | | | | |
| (Cost $44,660,621) | | | | | | | 47,264,129 | |
| | | 7 Day Yield | | | Shares | | | Value | |
| SHORT TERM INVESTMENTS (2.89%) | |
| Money Market Fund (0.21%) | | | | | | | | | |
| State Street Institutional Treasury Plus Money Market Fund | | | | | | | | | | | | |
| (Cost $98,157) | | | 0.970 | % | | | 98,157 | | | | 98,157 | |
| | | | | | | | | | | | | |
| Investments Purchased with Collateral From Securities Loaned (2.68%) | | | | | | | | | |
| State Street Navigator Securities Lending Prime Portfolio, 1.04% | | | | | | | | | | | | |
| (Cost $1,268,183) | | | | 1,268,183 | | | | 1,268,183 | |
| | | | | | | | | | | | | |
| TOTAL SHORT TERM INVESTMENTS | |
| (Cost $1,366,340) | | | | | | | | | | | 1,366,340 | |
| | | | | | | | | | | | | |
| TOTAL INVESTMENTS (102.70%) | |
| (Cost $46,026,961) | | | | | | | | | | $ | 48,630,469 | |
| | | | | | | | | | | | | |
| | | | | | | | | | | | | |
| NET LIABILITIES LESS OTHER ASSETS (-2.70%) | | | (1,274,276 | ) |
| NET ASSETS (100.00%) | | | $ | 47,356,193 | |
| (a) | Security, or a portion of the security position is currently on loan. The total market value of securities on loan is $1,241,124. |
| (b) | Non-income producing security. |
| (c) | These securities initially sold to other parties pursuant to Regulation S under the 1933 Act and subsequently resold to the Fund. As of November 30, 2017, the aggregate market values of these securities were $1,993,345, representing 4.21% of the Fund’s net assets. |
See Notes to Financial Statements.
ALPS | Dorsey Wright Sector Momentum ETF
| Schedule of Investments | November 30, 2017 |
| Security Description | | Shares | | | Value | |
| COMMON STOCKS (99.84%) | | | | | | | | |
| Basic Materials (14.03%) | | | | | | | | |
| Air Products & Chemicals, Inc. | | | 1,302 | | | $ | 212,278 | |
| Ball Corp. | | | 4,822 | | | | 192,446 | |
| Chemours Co. | | | 3,881 | | | | 199,483 | |
| Ecolab, Inc. | | | 1,491 | | | | 202,657 | |
| Freeport-McMoRan, Inc.(a) | | | 14,081 | | | | 196,007 | |
| The Sherwin-Williams Co. | | | 573 | | | | 228,868 | |
| United States Steel Corp. | | | 7,789 | | | | 225,258 | |
| Total Basic Materials | | | | | | | 1,456,997 | |
| | | | | | | | | |
| Consumer, Cyclical (15.34%) | | | | | | | | |
| Amazon.com, Inc.(a) | | | 198 | | | | 232,997 | |
| CBS Corp., Class B | | | 3,357 | | | | 188,193 | |
| Charter Communications, Inc., Class A(a) | | | 529 | | | | 172,565 | |
| Domino's Pizza, Inc. | | | 1,003 | | | | 186,718 | |
| Priceline Group, Inc.(a) | | | 106 | | | | 184,409 | |
| Sirius XM Holdings, Inc.(b) | | | 35,470 | | | | 195,085 | |
| Wyndham Worldwide Corp. | | | 1,926 | | | | 216,463 | |
| Yum! Brands, Inc. | | | 2,597 | | | | 216,772 | |
| Total Consumer, Cyclical | | | | | | | 1,593,202 | |
| | | | | | | | | |
| Financials (8.20%) | | | | | | | | |
| Arch Capital Group, Ltd.(a) | | | 2,027 | | | | 191,937 | |
| MarketAxess Holdings, Inc. | | | 1,091 | | | | 213,039 | |
| Western Alliance Bancorp(a) | | | 4,133 | | | | 240,458 | |
| WR Berkley Corp. | | | 2,983 | | | | 206,185 | |
| Total Financials | | | | | | | 851,619 | |
| | | | | | | | | |
| Health Care (12.52%) | | | | | | | | |
| ABIOMED, Inc.(a) | | | 1,232 | | | | 240,043 | |
| Align Technology, Inc.(a) | | | 1,059 | | | | 276,272 | |
| Cooper Cos., Inc. | | | 797 | | | | 192,221 | |
| Exelixis, Inc.(a) | | | 7,089 | | | | 191,970 | |
| Mettler-Toledo International, Inc.(a) | | | 313 | | | | 196,943 | |
| West Pharmaceutical Services, Inc. | | | 2,037 | | | | 203,557 | |
| Total Health Care | | | | | | | 1,301,006 | |
| | | | | | | | | |
| Industrials (14.55%) | | | | | | | | |
| HEICO Corp. | | | 2,311 | | | | 208,822 | |
| IDEX Corp. | | | 1,608 | | | | 217,997 | |
| Lockheed Martin Corp. | | | 646 | | | | 206,152 | |
| Northrop Grumman Corp. | | | 732 | | | | 225,017 | |
| Roper Technologies, Inc. | | | 821 | | | | 219,379 | |
| TransDigm Group, Inc. | | | 763 | | | | 216,532 | |
| Union Pacific Corp. | | | 1,723 | | | | 217,959 | |
| Total Industrials | | | | | | | 1,511,858 | |
| | | | | | | | | |
| Information Technology (21.79%) | | | | |
| Advanced Micro Devices, Inc.(a)(b) | | | 15,610 | | | | 169,993 | |
| Amphenol Corp., Class A | | | 2,366 | | | | 214,336 | |
| ANSYS, Inc.(a) | | | 1,604 | | | | 237,697 | |
| Apple, Inc. | | | 1,223 | | | | 210,173 | |
| Cadence Design Systems, Inc.(a) | | | 5,107 | | | | 224,248 | |
| Security Description | | Shares | | | Value | |
| Information Technology (continued) | | |
| Electronic Arts, Inc.(a) | | | 1,637 | | | $ | 174,095 | |
| Facebook, Inc., Class A(a) | | | 1,139 | | | | 201,808 | |
| LogMeIn, Inc. | | | 1,757 | | | | 209,083 | |
| NVIDIA Corp. | | | 1,085 | | | | 217,770 | |
| Skyworks Solutions, Inc. | | | 1,784 | | | | 186,856 | |
| Take-Two Interactive Software, Inc.(a) | | | 1,947 | | | | 217,188 | |
| Total Information Technology | | | | | | | 2,263,247 | |
| | | | | | | | | |
| Real Estate (3.79%) | | | | | | | | |
| American Tower Corp. | | | 1,348 | | | | 194,018 | |
| Equinix, Inc. | | | 429 | | | | 199,266 | |
| Total Real Estate | | | | | | | 393,284 | |
| | | | | | | | | |
| Utilities (9.62%) | | | | | | | | |
| Duke Energy Corp. | | | 2,239 | | | | 199,674 | |
| NextEra Energy, Inc. | | | 1,302 | | | | 205,768 | |
| OGE Energy Corp. | | | 5,382 | | | | 192,460 | |
| UGI Corp. | | | 4,049 | | | | 198,441 | |
| Vectren Corp. | | | 2,923 | | | | 203,149 | |
| Total Utilities | | | | | | | 999,492 | |
| | | | | | | | | |
| TOTAL COMMON STOCKS | | | | | |
| (Cost $9,230,393) | | | | | | | 10,370,705 | |
| | | 7 Day Yield | | | Shares | | | Value | |
| SHORT TERM INVESTMENTS (2.80%) | |
| Money Market Fund (0.06%) | | | | | | | | | |
| State Street Institutional Treasury Plus Money Market Fund | | | | | | | | | | | | |
| (Cost $6,124) | | | 0.970 | % | | | 6,124 | | | | 6,124 | |
| | | | | | | | | | | | | |
| Investments Purchased with Collateral From Securities Loaned (2.74%) | |
| State Street Navigator Securities Lending Prime Portfolio, 1.04% | | | | | | | | | | | | |
| (Cost $284,665) | | | | | | | 284,665 | | | | 284,665 | |
| | | | | | | | | | | | | |
| TOTAL SHORT TERM INVESTMENTS | | |
| (Cost $290,789) | | | | | | | | | | | 290,789 | |
| | | | | | | | | | | | | |
| TOTAL INVESTMENTS (102.64%) |
| (Cost $9,521,182) | | | | | | | | | | $ | 10,661,494 | |
| | | | | | | | | | | | | |
| NET LIABILITIES LESS OTHER ASSETS (-2.64%) | | | | (274,051 | ) |
| | | | | | | | | | | | | |
| NET ASSETS (100.00%) | | | | | | | $ | 10,387,443 | |
| (a) | Non-income producing security. |
| (b) | Security, or a portion of the security position is currently on loan. The total market value of securities on loan is $273,800. |
See Notes to Financial Statements.
ALPS ETF Trust
| Statements of Assets and Liabilities | November 30, 2017 |
| | | ALPS Sector Dividend Dogs ETF | | | ALPS International Sector Dividend Dogs ETF | | | ALPS Emerging Sector Dividend Dogs ETF | | | ALPS | Dorsey Wright Sector Momentum ETF | |
| ASSETS: | | | | | | | | | | | | |
| Investments, at value | | $ | 2,358,304,683 | | | $ | 347,996,943 | | | $ | 48,630,469 | | | $ | 10,661,494 | |
| Foreign currency, at value (Cost $–, $61,391, $13,966 and $–) | | | – | | | | 61,391 | | | | 13,966 | | | | – | |
| Foreign tax reclaims | | | – | | | | 465,948 | | | | 1,656 | | | | – | |
| Dividends receivable | | | 8,918,630 | | | | 1,373,540 | | | | 1,895 | | | | 13,992 | |
| Receivable for investments sold | | | 316 | | | | – | | | | – | | | | – | |
| Total Assets | | | 2,367,223,629 | | | | 349,897,822 | | | | 48,647,986 | | | | 10,675,486 | |
| | | | | | | | | | | | | | | | | |
| LIABILITIES: | | | | | | | | | | | | | | | | |
| Payable for investments purchased | | | 2,787,766 | | | | 572,356 | | | | – | | | | – | |
| Payable to adviser | | | 742,775 | | | | 141,784 | | | | 23,610 | | | | 3,378 | |
| Payable for collateral upon return of securities loaned | | | 41,488,538 | | | | – | | | | 1,268,183 | | | | 284,665 | |
| Total Liabilities | | | 45,019,079 | | | | 714,140 | | | | 1,291,793 | | | | 288,043 | |
| NET ASSETS | | $ | 2,322,204,550 | | | $ | 349,183,682 | | | $ | 47,356,193 | | | $ | 10,387,443 | |
| | | | | | | | | | | | | | | | | |
| NET ASSETS CONSIST OF: | | | | | | | | | | | | | | | | |
| Paid-in capital | | $ | 2,213,186,339 | | | $ | 346,728,820 | | | $ | 47,276,307 | | | $ | 9,425,159 | |
| Accumulated net investment income | | | – | | | | 830,175 | | | | 135,674 | | | | 8,231 | |
| Accumulated net realized loss | | | (151,828,646 | ) | | | (26,447,317 | ) | | | (2,659,403 | ) | | | (186,259 | ) |
| Net unrealized appreciation | | | 260,846,857 | | | | 28,072,004 | | | | 2,603,615 | | | | 1,140,312 | |
| NET ASSETS | | $ | 2,322,204,550 | | | $ | 349,183,682 | | | $ | 47,356,193 | | | $ | 10,387,443 | |
| | | | | | | | | | | | | | | | | |
| INVESTMENTS, AT COST | | $ | 2,097,457,826 | | | $ | 319,942,000 | | | $ | 46,026,961 | | | $ | 9,521,182 | |
| | | | | | | | | | | | | | | | | |
| PRICING OF SHARES: | | | | | | | | | | | | | | | | |
| Net Assets | | $ | 2,322,204,550 | | | $ | 349,183,682 | | | $ | 47,356,193 | | | $ | 10,387,443 | |
| Shares of beneficial interest outstanding (Unlimited number of shares authorized, par value $0.01 per share) | | | 50,909,141 | | | | 12,350,000 | | | | 1,950,000 | | | | 350,002 | |
| Net Asset Value, offering and redemption price per share | | $ | 45.61 | | | $ | 28.27 | | | $ | 24.29 | | | $ | 29.68 | |
See Notes to Financial Statements.
ALPS ETF Trust
| Statements of Operations | For the Year Ended November 30, 2017 |
| | | ALPS Sector Dividend Dogs ETF | | | ALPS International Sector Dividend Dogs ETF | | | ALPS Emerging Sector Dividend Dogs ETF | | | ALPS | Dorsey Wright Sector Momentum ETF(a) | |
| INVESTMENT INCOME: | | | | | | | | | | | | |
| Dividends* | | $ | 79,375,636 | | | $ | 10,114,503 | | | $ | 1,438,015 | | | $ | 64,357 | |
| Securities Lending Income | | | 50,005 | | | | 94,210 | | | | 3,710 | | | | 1,058 | |
| Total Investment Income | | | 79,425,641 | | | | 10,208,713 | | | | 1,441,725 | | | | 65,415 | |
| | | | | | | | | | | | | | | | | |
| EXPENSES: | | | | | | | | | | | | | | | | |
| Investment adviser fees | | | 8,733,082 | | | | 1,259,846 | | | | 219,867 | | | | 23,340 | |
| Total Expenses | | | 8,733,082 | | | | 1,259,846 | | | | 219,867 | | | | 23,340 | |
| NET INVESTMENT INCOME | | | 70,692,559 | | | | 8,948,867 | | | | 1,221,858 | | | | 42,075 | |
| | | | | | | | | | | | | | | | | |
| REALIZED AND UNREALIZED GAIN/(LOSS) | | | | | | | | | | | | | | | | |
| Net realized gain/(loss) on investments | | | 79,876,828 | | | | (2,035,713 | ) | | | 156,163 | | | | (19,217 | ) |
| Net realized loss on foreign currency transactions | | | – | | | | (120,638 | ) | | | (12,827 | ) | | | – | |
| Total net realized gain/(loss) | | | 79,876,828 | | | | (2,156,351 | ) | | | 143,336 | | | | (19,217 | ) |
| Net change in unrealized appreciation on investments | | | 84,019,526 | | | | 49,648,463 | | | | 3,453,233 | | | | 1,140,312 | |
| Net change in unrealized appreciation on translation of assets and liabilities denominated in foreign currencies | | | – | | | | 106,948 | | | | 699 | | | | – | |
| Total net change in unrealized appreciation | | | 84,019,526 | | | | 49,755,411 | | | | 3,453,932 | | | | 1,140,312 | |
| NET REALIZED AND UNREALIZED GAIN ON INVESTMENTS | | | 163,896,354 | | | | 47,599,060 | | | | 3,597,268 | | | | 1,121,095 | |
| NET INCREASE IN NET ASSETS RESULTING FROM OPERATIONS | | $ | 234,588,913 | | | $ | 56,547,927 | | | $ | 4,819,126 | | | $ | 1,163,170 | |
| *Net of foreign tax withholding: | | $ | – | | | $ | 986,331 | | | $ | 165,218 | | | $ | – | |
| (a) | The ALPS/Dorsey Wright Sector Momentum ETF commenced operations on January 10, 2017. |
See Notes to Financial Statements.
ALPS Sector Dividend Dogs ETF
Statements of Changes in Net Assets
| | | For the Year Ended November 30, 2017 | | | For the Year Ended November 30, 2016 | |
| OPERATIONS: | | | | | | |
| Net investment income | | $ | 70,692,559 | | | $ | 39,846,529 | |
| Net realized gain/(loss) | | | 79,876,828 | | | | (43,300,773 | ) |
| Net change in unrealized appreciation | | | 84,019,526 | | | | 216,359,606 | |
| Net increase in net assets resulting from operations | | | 234,588,913 | | | | 212,905,362 | |
| | | | | | | | | |
| Net Equalization Credits | | | 1,506,585 | | | | 1,934,769 | |
| | | | | | | | | |
| DISTRIBUTIONS TO SHAREHOLDERS: | | | | | | | | |
| From net investment income | | | (70,756,115 | ) | | | (41,467,278 | ) |
| From tax return of capital | | | (2,592,040 | ) | | | (366,916 | ) |
| Total distributions | | | (73,348,155 | ) | | | (41,834,194 | ) |
| | | | | | | | | |
| CAPITAL SHARE TRANSACTIONS: | | | | | | | | |
| Proceeds from sale of shares | | | 1,098,967,514 | | | | 874,355,784 | |
| Cost of shares redeemed | | | (640,408,820 | ) | | | (357,920,532 | ) |
| Net income equalization (Note 2) | | | (1,506,585 | ) | | | (1,934,769 | ) |
| Net increase from share transactions | | | 457,052,109 | | | | 514,500,483 | |
| Net increase in net assets | | | 619,799,452 | | | | 687,506,420 | |
| | | | | | | | | |
| NET ASSETS: | | | | | | | | |
| Beginning of period | | | 1,702,405,098 | | | | 1,014,898,678 | |
| End of period * | | $ | 2,322,204,550 | | | $ | 1,702,405,098 | |
| | | | | | | | | |
| * Including accumulated net investment income of: | | $ | – | | | $ | – | |
| | | | | | | | | |
| OTHER INFORMATION: | | | | | | | | |
| CAPITAL SHARE TRANSACTIONS: | | | | | | | | |
| Beginning shares | | | 40,259,141 | | | | 28,009,141 | |
| Shares sold | | | 25,600,000 | | | | 22,550,000 | |
| Shares redeemed | | | (14,950,000 | ) | | | (10,300,000 | ) |
| Shares outstanding, end of period | | | 50,909,141 | | | | 40,259,141 | |
See Notes to Financial Statements.
ALPS International Sector Dividend Dogs ETF
Statements of Changes in Net Assets
| | | For the Year Ended November 30, 2017 | | | For the Year Ended November 30, 2016 | |
| OPERATIONS: | | | | | | |
| Net investment income | | $ | 8,948,867 | | | $ | 5,904,476 | |
| Net realized loss | | | (2,156,351 | ) | | | (8,681,501 | ) |
| Net change in unrealized appreciation/(depreciation) | | | 49,755,411 | | | | (1,531,282 | ) |
| Net increase/(decrease) in net assets resulting from operations | | | 56,547,927 | | | | (4,308,307 | ) |
| | | | | | | | | |
| Net Equalization Credits | | | 1,103,408 | | | | 528,824 | |
| | | | | | | | | |
| DISTRIBUTIONS TO SHAREHOLDERS: | | | | | | | | |
| From net investment income | | | (8,514,874 | ) | | | (5,356,978 | ) |
| Total distributions | | | (8,514,874 | ) | | | (5,356,978 | ) |
| | | | | | | | | |
| CAPITAL SHARE TRANSACTIONS: | | | | | | | | |
| Proceeds from sale of shares | | | 167,824,202 | | | | 45,086,015 | |
| Cost of shares redeemed | | | (27,715,964 | ) | | | (10,156,797 | ) |
| Net income equalization (Note 2) | | | (1,103,408 | ) | | | (528,824 | ) |
| Net increase from share transactions | | | 139,004,830 | | | | 34,400,394 | |
| Net increase in net assets | | | 188,141,291 | | | | 25,263,933 | |
| | | | | | | | | |
| NET ASSETS: | | | | | | | | |
| Beginning of period | | | 161,042,391 | | | | 135,778,458 | |
| End of period * | | $ | 349,183,682 | | | $ | 161,042,391 | |
| | | | | | | | | |
| * Including accumulated net investment income of: | | $ | 830,175 | | | $ | 512,514 | |
| | | | | | | | | |
| OTHER INFORMATION: | | | | | | | | |
| CAPITAL SHARE TRANSACTIONS: | | | | | | | | |
| Beginning shares | | | 7,050,000 | | | | 5,600,000 | |
| Shares sold | | | 6,400,000 | | | | 1,900,000 | |
| Shares redeemed | | | (1,100,000 | ) | | | (450,000 | ) |
| Shares outstanding, end of period | | | 12,350,000 | | | | 7,050,000 | |
See Notes to Financial Statements.
ALPS Emerging Sector Dividend Dogs ETF
Statements of Changes in Net Assets
| | | For the Year Ended November 30, 2017 | | | For the Year Ended November 30, 2016 | |
| OPERATIONS: | | | | | | |
| Net investment income | | $ | 1,221,858 | | | $ | 441,428 | |
| Net realized gain/(loss) | | | 143,336 | | | | (2,116,664 | ) |
| Net change in unrealized appreciation | | | 3,453,932 | | | | 1,438,248 | |
| Net increase/(decrease) in net assets resulting from operations | | | 4,819,126 | | | | (236,988 | ) |
| | | | | | | | | |
| Net Equalization Credits | | | 80,789 | | | | 239,304 | |
| | | | | | | | | |
| DISTRIBUTIONS TO SHAREHOLDERS: | | | | | | | | |
| From net investment income | | | (1,225,826 | ) | | | (434,572 | ) |
| Total distributions | | | (1,225,826 | ) | | | (434,572 | ) |
| | | | | | | | | |
| CAPITAL SHARE TRANSACTIONS: | | | | | | | | |
| Proceeds from sale of shares | | | 26,866,382 | | | | 15,512,093 | |
| Cost of shares redeemed | | | (2,160,243 | ) | | | (5,133,159 | ) |
| Net income equalization (Note 2) | | | (80,789 | ) | | | (239,304 | ) |
| Net increase from share transactions | | | 24,625,350 | | | | 10,139,630 | |
| Net increase in net assets | | | 28,299,439 | | | | 9,707,374 | |
| | | | | | | | | |
| NET ASSETS: | | | | | | | | |
| Beginning of period | | | 19,056,754 | | | | 9,349,380 | |
| End of period * | | $ | 47,356,193 | | | $ | 19,056,754 | |
| | | | | | | | | |
| * Including accumulated net investment income of: | | $ | 135,674 | | | $ | 107,255 | |
| | | | | | | | | |
| OTHER INFORMATION: | | | | | | | | |
| CAPITAL SHARE TRANSACTIONS: | | | | | | | | |
| Beginning shares | | | 900,000 | | | | 450,000 | |
| Shares sold | | | 1,150,000 | | | | 700,000 | |
| Shares redeemed | | | (100,000 | ) | | | (250,000 | ) |
| Shares outstanding, end of period | | | 1,950,000 | | | | 900,000 | |
See Notes to Financial Statements.
ALPS | Dorsey Wright Sector Momentum ETF
Statement of Changes in Net Assets
| | | For the Period January 10, 2017 (Commencement) to November 30, 2017 | |
| OPERATIONS: | | | |
| Net investment income | | $ | 42,075 | |
| Net realized loss | | | (19,217 | ) |
| Net change in unrealized appreciation | | | 1,140,312 | |
| Net Increase in net assets resulting from operations | | | 1,163,170 | |
| | | | | |
| DISTRIBUTIONS TO SHAREHOLDERS: | | | | |
| From net investment income | | | (33,844 | ) |
| Total distributions | | | (33,844 | ) |
| | | | | |
| CAPITAL SHARE TRANSACTIONS: | | | | |
| Proceeds from sale of shares | | | 10,615,997 | |
| Cost of shares redeemed | | | (1,357,880 | ) |
| Net increase from share transactions | | | 9,258,117 | |
| Net Increase in Net Assets | | | 10,387,443 | |
| | | | | |
| NET ASSETS: | | | | |
| Beginning of year | | | – | |
| End of year * | | $ | 10,387,443 | |
| | | | | |
| * Including accumulated net investment income of: | | $ | 8,231 | |
| | | | | |
| OTHER INFORMATION: | | | | |
| CAPITAL SHARE TRANSACTIONS: | | | | |
| Beginning shares | | | – | |
| Shares sold | | | 400,002 | |
| Shares redeemed | | | (50,000 | ) |
| Shares outstanding, end of period | | | 350,002 | |
See Notes to Financial Statements.
ALPS Sector Dividend Dogs ETF
| Financial Highlights | For a Share Outstanding Throughout the Periods Presented |
| | | For the Year Ended November 30, 2017 | | | For the Year Ended November 30, 2016 | | | For the Year Ended November 30, 2015 | | | For the Year Ended November 30, 2014 | | | For the Year Ended November 30, 2013 | |
| NET ASSET VALUE, BEGINNING OF PERIOD | | $ | 42.29 | | | $ | 36.23 | | | $ | 38.80 | | | $ | 33.76 | | | $ | 26.71 | |
| | | | | | | | | | | | | | | | | | | | | |
| INCOME/(LOSS) FROM INVESTMENT OPERATIONS: | | | | | | | | | | | | | | | | | | | | |
| Net investment income (a) | | | 1.40 | | | | 1.26 | | | | 1.21 | | | | 1.35 | | | | 1.12 | |
| Net realized and unrealized gain/(loss) | | | 3.39 | | | | 6.15 | | | | (2.47 | ) | | | 4.94 | | | | 7.14 | |
| Total from investment operations | | | 4.79 | | | | 7.41 | | | | (1.26 | ) | | | 6.29 | | | | 8.26 | |
| | | | | | | | | | | | | | | | | | | | | |
| DISTRIBUTIONS: | | | | | | | | | | | | | | | | | | | | |
| From net investment income | | | (1.42 | ) | | | (1.34 | ) | | | (1.31 | ) | | | (1.25 | ) | | | (1.21 | ) |
| Tax return of capital | | | (0.05 | ) | | | (0.01 | ) | | | – | | | | – | | | | – | |
| Total distributions | | | (1.47 | ) | | | (1.35 | ) | | | (1.31 | ) | | | (1.25 | ) | | | (1.21 | ) |
| | | | | | | | | | | | | | | | | | | | | |
| Net increase/(decrease) in net asset value | | | 3.32 | | | | 6.06 | | | | (2.57 | ) | | | 5.04 | | | | 7.05 | |
| NET ASSET VALUE, END OF PERIOD | | $ | 45.61 | | | $ | 42.29 | | | $ | 36.23 | | | $ | 38.80 | | | $ | 33.76 | |
| TOTAL RETURN(b) | | | 11.59 | % | | | 20.86 | % | | | (3.21 | )% | | | 18.96 | % | | | 31.66 | % |
| | | | | | | | | | | | | | | | | | | | | |
| RATIOS/SUPPLEMENTAL DATA: | | | | | | | | | | | | | | | | | | | | |
| Net assets, end of period (000s) | | $ | 2,322,205 | | | $ | 1,702,405 | | | $ | 1,014,899 | | | $ | 1,024,473 | | | $ | 464,277 | |
| | | | | | | | | | | | | | | | | | | | | |
| Ratio of expenses to average net assets | | | 0.40 | % | | | 0.40 | % | | | 0.40 | % | | | 0.40 | % | | | 0.40 | % |
| Ratio of net investment income to average net assets | | | 3.24 | % | | | 3.23 | % | | | 3.25 | % | | | 3.74 | % | | | 3.58 | % |
| Portfolio turnover rate(c) | | | 48 | % | | | 49 | % | | | 55 | % | | | 12 | % | | | 8 | % |
| Undistributed net investment income included in price of units issued and redeemed(a)(d) | | $ | 0.03 | | | $ | 0.06 | | | $ | 0.06 | | | $ | 0.09 | | | $ | 0.13 | |
| (a) | Based on average shares outstanding during the period. |
| (b) | Total return is calculated assuming an initial investment made at the net asset value at the beginning of the period and redemption at the net asset value on the last day of the period and assuming all distributions are reinvested at reinvestment prices. Total return calculated for a period of less than one year is not annualized. |
| (c) | Portfolio turnover for periods less than one year is not annualized and does not include securities received or delivered from processing creations or redemptions in-kind. |
| (d) | The per share amount of equalization is presented to show the impact of equalization on distributable earnings per share. |
See Notes to Financial Statements.
ALPS International Sector Dividend Dogs ETF
| Financial Highlights | For a Share Outstanding Throughout the Periods Presented |
| | | For the Year Ended November 30, 2017 | | | For the Year Ended November 30, 2016 | | | For the Year Ended November 30, 2015 | | | For the Year Ended November 30, 2014 | | | For the Period June 28, 2013 (Commencement) to November 30, 2013 | |
| NET ASSET VALUE, BEGINNING OF PERIOD | | $ | 22.84 | | | $ | 24.25 | | | $ | 27.33 | | | $ | 29.21 | | | $ | 25.00 | |
| | | | | | | | | | | | | | | | | | | | | |
| INCOME/(LOSS) FROM INVESTMENT OPERATIONS: | | | | | | | | | | | | | | | | | |
| Net investment income(a) | | | 0.94 | | | | 1.00 | | | | 1.06 | | | | 1.19 | | | | 0.34 | |
| Net realized and unrealized gain/(loss) | | | 5.41 | | | | (1.47 | ) | | | (3.13 | ) | | | (1.83 | ) | | | 4.08 | |
| Total from investment operations | | | 6.35 | | | | (0.47 | ) | | | (2.07 | ) | | | (0.64 | ) | | | 4.42 | |
| | | | | | | | | | | | | | | | | | | | | |
| DISTRIBUTIONS: | | | | | | | | | | | | | | | | | | | | |
| From net investment income | | | (0.92 | ) | | | (0.94 | ) | | | (0.99 | ) | | | (1.17 | ) | | | (0.21 | ) |
| Tax return of capital | | | – | | | | – | | | | (0.02 | ) | | | (0.07 | ) | | | – | |
| Total distributions | | | (0.92 | ) | | | (0.94 | ) | | | (1.01 | ) | | | (1.24 | ) | | | (0.21 | ) |
| | | | | | | | | | | | | | | | | | | | | |
| Net increase/(decrease) in net asset value | | | 5.43 | | | | (1.41 | ) | | | (3.08 | ) | | | (1.88 | ) | | | 4.21 | |
| NET ASSET VALUE, END OF PERIOD | | $ | 28.27 | | | $ | 22.84 | | | $ | 24.25 | | | $ | 27.33 | | | $ | 29.21 | |
| TOTAL RETURN(b) | | | 28.21 | % | | | (1.95 | )% | | | (7.76 | )% | | | (2.53 | )% | | | 17.72 | % |
| | | | | | | | | | | | | | | | | | | | | |
| RATIOS/SUPPLEMENTAL DATA: | | | | | | | | | | | | | | | | | | | | |
| Net assets, end of period (000s) | | $ | 349,184 | | | $ | 161,042 | | | $ | 135,778 | | | $ | 143,461 | | | $ | 77,411 | |
| | | | | | | | | | | | | | | | | | | | | |
| Ratio of expenses to average net assets | | | 0.50 | % | | | 0.50 | % | | | 0.50 | % | | | 0.50 | % | | | 0.50 | %(c) |
| Ratio of net investment income to average net assets | | | 3.55 | % | | | 4.28 | % | | | 4.05 | % | | | 4.05 | % | | | 2.87 | %(c) |
| Portfolio turnover rate(d) | | | 37 | % | | | 47 | % | | | 67 | % | | | 19 | % | | | 2 | % |
| Undistributed net investment income included in price of units issued and redeemed(a)(e) | | $ | 0.12 | | | $ | 0.09 | | | $ | 0.05 | | | $ | 0.09 | | | $ | 0.14 | |
| (a) | Based on average shares outstanding during the period. |
| (b) | Total return is calculated assuming an initial investment made at the net asset value at the beginning of the period and redemption at the net asset value on the last day of the period and assuming all distributions are reinvested at reinvestment prices. Total return calculated for a period of less than one year is not annualized. |
| (d) | Portfolio turnover for periods less than one year is not annualized and does not include securities received or delivered from processing creations or redemptions in-kind. |
| (e) | The per share amount of equalization is presented to show the impact of equalization on distributable earnings per share. |
See Notes to Financial Statements.
ALPS Emerging Sector Dividend Dogs ETF
| Financial Highlights | For a Share Outstanding Throughout the Periods Presented |
| | | For the Year Ended November 30, 2017 | | | For the Year Ended November 30, 2016 | | | For the Year Ended November 30, 2015 | | | For the Period March 28, 2014 (Commencement) to November 30, 2014 | |
| NET ASSET VALUE, BEGINNING OF PERIOD | | $ | 21.17 | | | $ | 20.78 | | | $ | 26.57 | | | $ | 25.00 | |
| | | | | | | | | | | | | | | | | |
| INCOME/(LOSS) FROM INVESTMENT OPERATIONS: | | | | | | | | | | | | | |
| Net investment income(a) | | | 0.80 | | | | 0.67 | | | | 1.26 | | | | 0.64 | |
| Net realized and unrealized gain/(loss) | | | 3.06 | | | | 0.39 | | | | (6.15 | ) | | | 1.59 | |
| Total from investment operations | | | 3.86 | | | | 1.06 | | | | (4.89 | ) | | | 2.23 | |
| | | | | | | | | | | | | | | | | |
| DISTRIBUTIONS: | | | | | | | | | | | | | | | | |
| From net investment income | | | (0.74 | ) | | | (0.67 | ) | | | (0.90 | ) | | | (0.54 | ) |
| Tax return of capital | | | – | | | | – | | | | – | | | | (0.12 | ) |
| Total distributions | | | (0.74 | ) | | | (0.67 | ) | | | (0.90 | ) | | | (0.66 | ) |
| | | | | | | | | | | | | | | | | |
| Net increase/(decrease) in net asset value | | | 3.12 | | | | 0.39 | | | | (5.79 | ) | | | 1.57 | |
| NET ASSET VALUE, END OF PERIOD | | $ | 24.29 | | | $ | 21.17 | | | $ | 20.78 | | | $ | 26.57 | |
| TOTAL RETURN(b) | | | 18.37 | % | | | 5.10 | % | | | (18.66 | )% | | | 8.93 | % |
| | | | | | | | | | | | | | | | | |
| RATIOS/SUPPLEMENTAL DATA: | | | | | | | | | | | | | | | | |
| Net assets, end of period (000s) | | $ | 47,356 | | | $ | 19,057 | | | $ | 9,349 | | | $ | 10,629 | |
| | | | | | | | | | | | | | | | | |
| Ratio of expenses to average net assets | | | 0.60 | % | | | 0.60 | % | | | 0.60 | % | | | 0.60 | %(c) |
| Ratio of net investment income to average net assets | | | 3.33 | % | | | 3.11 | % | | | 5.34 | % | | | 3.54 | %(c) |
| Portfolio turnover rate(d) | | | 42 | % | | | 68 | % | | | 96 | % | | | 19 | % |
| Undistributed net investment income included in price of units issued and redeemed(a)(e) | | $ | 0.05 | | | $ | 0.36 | | | $ | 0.03 | | | $ | 0.16 | |
| (a) | Based on average shares outstanding during the period. |
| (b) | Total return is calculated assuming an initial investment made at the net asset value at the beginning of the period and redemption at the net asset value on the last day of the period and assuming all distributions are reinvested at reinvestment prices. Total return calculated for a period of less than one year is not annualized. |
| (d) | Portfolio turnover for periods less than one year is not annualized and does not include securities received or delivered from processing creations or redemptions in-kind. |
| (e) | The per share amount of equalization is presented to show the impact of equalization on distributable earnings per share. |
See Notes to Financial Statements.
ALPS | Dorsey Wright Sector Momentum ETF
| Financial Highlights | For a Share Outstanding Throughout the Period Presented |
| | | For the Period January 10, 2017 (Commencement) to November 30, 2017 | |
| NET ASSET VALUE, BEGINNING OF PERIOD | | $ | 24.94 | |
| | | | | |
| INCOME/(LOSS) FROM INVESTMENT OPERATIONS: | | | | |
| Net investment income (a) | | | 0.18 | |
| Net realized and unrealized gain | | | 4.70 | |
| Total from investment operations | | | 4.88 | |
| | | | | |
| DISTRIBUTIONS: | | | | |
| From net investment income | | | (0.14 | ) |
| Total distributions | | | (0.14 | ) |
| | | | | |
| Net increase in net asset value | | | 4.74 | |
| NET ASSET VALUE, END OF PERIOD | | $ | 29.68 | |
| TOTAL RETURN(b) | | | 19.63 | % |
| | | | | |
| RATIOS/SUPPLEMENTAL DATA: | | | | |
| Net assets, end of period (000s) | | $ | 10,387 | |
| | | | | |
| Ratio of expenses to average net assets | | | 0.40 | %(c) |
| Ratio of net investment income to average net assets | | | 0.72 | %(c) |
| Portfolio turnover rate(d) | | | 88 | % |
| (a) | Based on average shares outstanding during the period. |
| (b) | Total return is calculated assuming an initial investment made at the net asset value at the beginning of the period and redemption at the net asset value on the last day of the period and assuming all distributions are reinvested at reinvestment prices. Total return calculated for a period of less than one year is not annualized. |
| (d) | Portfolio turnover for periods less than one year is not annualized and does not include securities received or delivered from processing creations or redemptions in-kind. |
See Notes to Financial Statements.
ALPS ETF Trust
| Notes to Financial Statements | November 30, 2017 |
1. ORGANIZATION
ALPS ETF Trust (the “Trust”), a Delaware statutory trust, is an open-end management investment company under the Investment Company Act of 1940, as amended (the “1940 Act”). As of November 30, 2017, the Trust consisted of nineteen separate portfolios. Each portfolio represents a separate series of the Trust. This report pertains to the ALPS Sector Dividend Dogs ETF, the ALPS International Sector Dividend Dogs ETF, the ALPS Emerging Sector Dividend Dogs ETF, and the ALPS | Dorsey Wright Sector Momentum ETF (each a “Fund” and collectively, the “Funds”). Each Fund has elected to qualify as a diversified series of the Trust under the 1940 Act, except for the ALPS | Dorsey Wright Sector Momentum ETF ALPS, which is a non-diversified series of the Trust under the 1940 Act. As a result, changes in the market value of a single investment could cause greater fluctuations in share price than would occur in a diversified fund.
The ALPS | Dorsey Wright Sector Momentum ETF commenced operations on January 10, 2017.
The investment objective of the ALPS Sector Dividend Dogs ETF is to seek investment results that replicate as closely as possible, before fees and expenses, the performance of the S-Network® Sector Dividend Dogs Index. The investment objective of the ALPS International Sector Dividend Dogs ETF is to seek investment results that replicate as closely as possible, before fees and expenses, the performance of the S-Network® International Sector Dividend Dogs Index. The investment objective of the ALPS Emerging Sector Dividend Dogs ETF is to seek investment results that replicate as closely as possible, before fees and expenses, the performance of the S-Network® Emerging Sector Dividend Dogs Index. The investment objective of the ALPS | Dorsey Wright Sector Momentum ETF is to seek investment results that correspond (before fees and expenses) generally to the performance of the Dorsey Wright US Sector Momentum Index.
The shares of the ALPS Sector Dividend Dogs ETF, the ALPS International Sector Dividend Dogs ETF, and the ALPS Emerging Sector Dividend Dogs ETF (“Shares”) are listed on the NYSE Arca, Inc.. The shares of the ALPS | Dorsey Wright Sector Momentum ETF (“Shares”) are listed on the NASDAQ Stock Market LLC (“NASDAQ”). Each Fund issues and redeems Shares, at net asset value (“NAV”) in blocks of 50,000 Shares, each of which is called a “Creation Unit”. Creation Units are issued and redeemed principally in-kind for securities included in the Underlying Index. Except when aggregated in Creation Units, Shares are not redeemable securities of the Fund.
Pursuant to the Trust’s organizational documents, its Officers and Trustees are indemnified against certain liability arising out of the performance of their duties to the Trust. Additionally, in the normal course of business, the Trust enters into contracts with service providers that contain general indemnification clauses. The Trust’s maximum exposure under these arrangements is unknown, as this would involve future claims that may be made against the Trust that have not yet occurred.
2. SIGNIFICANT ACCOUNTING POLICIES
The following is a summary of significant accounting policies consistently followed by the Funds in the preparation of the financial statements. The accompanying financial statements were prepared in accordance with accounting principles generally accepted in the United States of America (“U.S. GAAP”). The preparation of financial statements in conformity with U.S. GAAP requires management to make certain estimates and assumptions that affect the reported amounts of assets and liabilities and disclosures of contingent assets and liabilities at the date of the financial statements and the reported amounts of revenue and expenses during the period. Actual results could differ from those estimates. Each Fund is considered an investment company under U.S. GAAP and follows the accounting and reporting guidance applicable to investment companies in the Financial Accounting Standards Board Accounting Standards Codification Topic 946.
A. Portfolio Valuation
Each Fund’s NAV is determined daily, as of the close of regular trading on the New York Stock Exchange (“NYSE”), normally 4:00 p.m. Eastern time, on each day the NYSE is open for trading. The NAV is computed by dividing the value of all assets of the Fund (including accrued interest and dividends), less all liabilities (including accrued expenses and dividends declared but unpaid), by the total number of shares outstanding.
Portfolio securities listed on any exchange other than the NASDAQ are valued at the last sale price on the business day as of which such value is being determined. If there has been no sale on such day, the securities are valued at the mean of the most recent bid and ask prices on such day. Securities traded on the NASDAQ are valued at the NASDAQ Official Closing Price as determined by NASDAQ. Portfolio securities traded on more than one securities exchange are valued at the last sale price on the business day as of which such value is being determined at the close of the exchange representing the principal market for such securities. Portfolio securities traded in the over-the-counter market, but excluding securities traded on the NASDAQ, are valued at the latest quoted sale price in such market.
ALPS ETF Trust
| Notes to Financial Statements | November 30, 2017 |
The Funds’ investments are valued at market value or, in the absence of market value with respect to any portfolio securities, at fair value according to procedures adopted by the Trust’s Board of Trustees (the “Board”). When market quotations are not readily available or when events occur that make established valuation methods unreliable, securities of the Funds may be valued in good faith by or under the direction of the Board. These securities generally include, but are not limited to, restricted securities (securities which may not be publicly sold without registration under the Securities Act of 1933) for which a pricing service is unable to provide a market price; securities whose trading has been formally suspended; a security whose market price is not available from a pre-established primary pricing source or the pricing source is not willing to provide a price; a security with respect to which an event has occurred that is most likely to materially affect the value of the security after the market has closed but before the calculation of the Fund’s NAV or make it difficult or impossible to obtain a reliable market quotation; or a security whose price, as provided by the pricing service, does not reflect the security’s “fair value” due to the security being de-listed from a national exchange or the security’s primary trading market is temporarily closed at a time when, under normal conditions, it would be open. As a general principle, the current “fair value” of a security would be the amount which the owner might reasonably expect to receive from the sale on the applicable exchange or principal market. A variety of factors may be considered in determining the fair value of such securities.
B. Fair Value Measurements
Each Fund discloses the classification of its fair value measurements following a three-tier hierarchy based on the inputs used to measure fair value. Inputs refer broadly to the assumptions that market participants would use in pricing the asset or liability, including assumptions about risk. Inputs may be observable or unobservable. Observable inputs reflect the assumptions market participants would use in pricing the asset or liability that are developed based on market data obtained from sources independent of the reporting entity. Unobservable inputs reflect the reporting entity’s own assumptions about the assumptions market participants would use in pricing the asset or liability that are developed based on the best information available.
Valuation techniques used to value the Funds’ investments by major category are as follows:
Equity securities, including restricted securities, for which market quotations are readily available, are valued at the last reported sale price or official closing price as reported by a third party pricing vendor on the primary market or exchange on which they are traded and are categorized as Level 1 in the hierarchy. In the event there were no sales during the day or closing prices are not available, securities are valued at the mean of the most recent quoted bid and ask prices on such day and are generally categorized as Level 2 in the hierarchy. Investments in open-end mutual funds are valued at their closing NAV each business day and are categorized as Level 1 in the hierarchy.
Changes in valuation techniques may result in transfers in or out of an assigned level within the disclosure hierarchy.
Various inputs are used in determining the value of each Fund’s investments as of the end of the reporting period. When inputs used fall into different levels of the fair value hierarchy, the level in the hierarchy within which the fair value measurement falls is determined based on the lowest level input that is significant to the fair value measurement in its entirety. The designated input levels are not necessarily an indication of the risk or liquidity associated with these investments.
These inputs are categorized in the following hierarchy under applicable financial accounting standards:
| Level 1 – | Unadjusted quoted prices in active markets for identical investments, unrestricted assets or liabilities that a Fund has the ability to access at the measurement date; |
| Level 2 – | Quoted prices which are not active, quoted prices for similar assets or liabilities in active markets or inputs other than quoted prices that are observable (either directly or indirectly) for substantially the full term of the asset or liability; and |
| Level 3 – | Significant unobservable prices or inputs (including the Fund’s own assumptions in determining the fair value of investments) where there is little or no market activity for the asset or liability at the measurement date. |
ALPS ETF Trust
| Notes to Financial Statements | November 30, 2017 |
The following is a summary of the inputs used to value the Funds’ investments at November 30, 2017:
ALPS Sector Dividend Dogs ETF
| Investments in Securities at Value | | Level 1 - Unadjusted Quoted Prices | | | Level 2 - Other Significant Observable Inputs | | | Level 3 - Significant Unobservable Inputs | | | Total | |
| Common Stocks* | | $ | 2,314,610,549 | | | $ | – | | | $ | – | | | $ | 2,314,610,549 | |
| Short Term Investments | | | | | | | | | | | | | | | | |
| Money Market Fund | | | 2,205,596 | | | | – | | | | – | | | | 2,205,596 | |
| Investments Purchased with Collateral from Securities Loaned | | | 41,488,538 | | | | – | | | | – | | | | 41,488,538 | |
| TOTAL | | $ | 2,358,304,683 | | | $ | – | | | $ | – | | | $ | 2,358,304,683 | |
ALPS International Sector Dividend Dogs ETF
| Investments in Securities at Value | | Level 1 - Unadjusted Quoted Prices | | | Level 2 - Other Significant Observable Inputs | | | Level 3 - Significant Unobservable Inputs | | | Total | |
| Common Stocks* | | $ | 347,325,522 | | | $ | – | | | $ | – | | | $ | 347,325,522 | |
| Short Term Investments | | | 671,421 | | | | – | | | | – | | | | 671,421 | |
| TOTAL | | $ | 347,996,943 | | | $ | – | | | $ | – | | | $ | 347,996,943 | |
ALPS Emerging Sector Dividend Dogs ETF
| Investments in Securities at Value | | Level 1 - Unadjusted Quoted Prices | | | Level 2 - Other Significant Observable Inputs | | | Level 3 - Significant Unobservable Inputs | | | Total | |
| Common Stocks* | | $ | 47,264,129 | | | $ | – | | | $ | – | | | $ | 47,264,129 | |
| Short Term Investments | | | | | | | | | | | | | | | | |
| Money Market Fund | | | 98,157 | | | | – | | | | – | | | | 98,157 | |
| Investments Purchased with Collateral from Securities Loaned | | | 1,268,183 | | | | – | | | | – | | | | 1,268,183 | |
| TOTAL | | $ | 48,630,469 | | | $ | – | | | $ | – | | | $ | 48,630,469 | |
ALPS ETF Trust
| Notes to Financial Statements | November 30, 2017 |
ALPS | Dorsey Wright Sector Momentum ETF
| Investments in Securities at Value | | Level 1 - Unadjusted Quoted Prices | | | Level 2 - Other Significant Observable Inputs | | | Level 3 - Significant Unobservable Inputs | | | Total | |
| Common Stocks* | | $ | 10,370,705 | | | $ | – | | | $ | – | | | $ | 10,370,705 | |
| Short Term Investments | | | | | | | | | | | | | | | | |
| Money Market Fund | | | 6,124 | | | | – | | | | – | | | | 6,124 | |
| Investments Purchased with Collateral from Securities Loaned | | | 284,665 | | | | – | | | | – | | | | 284,665 | |
| TOTAL | | $ | 10,661,494 | | | $ | – | | | $ | – | | | $ | 10,661,494 | |
| * | For a detailed sector/country breakdown, see the accompanying Schedule of Investments. |
The Funds recognize transfers between levels as of the end of the period. For the year or period ended November 30, 2017, the Funds did not have any transfers between Level 1 and Level 2 securities. The Funds did not have any securities that used significant unobservable inputs (Level 3) in determining fair value.
C. Foreign Securities
The ALPS International Sector Dividend Dogs ETF and the ALPS Emerging Sector Dividend Dogs ETF may directly purchase securities of foreign issuers. Investments in non-U.S. issuers may involve unique risks compared to investing in securities of U.S. issuers, including, among others, less liquidity generally, greater market volatility than U.S. securities and less complete financial information than for U.S. issuers. In addition, adverse political, economic or social developments could undermine the value of the Fund’s investments or prevent the Fund from realizing the full value of its investments. Financial reporting standards for companies based in foreign markets differ from those in the United States. Finally, the value of the currency of the country in which the Fund has invested could decline relative to the value of the U.S. dollar, which may affect the value of the investment to U.S. investors.
Because foreign markets may be open on different days than the days during which investors may purchase the shares of each Fund, the value of each Fund's securities may change on the days when investors are not able to purchase the shares of the Funds. The value of securities denominated in foreign currencies is converted into U.S. dollars using exchange rates determined daily as of the close of regular trading on the NYSE or NASDAQ. Any use of a different rate from the rates used by the Index may adversely affect a Fund's ability to track its Index.
D. Foreign Currency Translation
The books and records of the Funds are maintained in U.S. dollars. Investment valuations and other assets and liabilities initially expressed in foreign currencies are converted each business day into U.S. dollars based upon current exchange rates. The portion of realized and unrealized gains or losses on investments due to fluctuations in foreign currency exchange rates is not separately disclosed and is included in realized and unrealized gains or losses on investments, when applicable.
E. Securities Transactions and Investment Income
Securities transactions are recorded as of the trade date. Realized gains and losses from securities transactions are recorded on the highest cost basis. Dividend income and capital gains distributions, if any, are recorded on the ex-dividend date, net of any foreign taxes withheld. Interest income, if any, is recorded on the accrual basis, including any amortization of premiums and accretion of discounts.
F. Dividends and Distributions to Shareholders
Dividends from net investment income for each Fund, if any, are declared and paid quarterly or as the Board may determine from time to time. Distributions of net realized capital gains earned by the Funds, if any, are distributed at least annually.
G. Equalization
The ALPS Sector Dividend Dogs ETF, the ALPS International Sector Dividend Dogs ETF, and the ALPS Emerging Sector Dividend Dogs ETF utilize the accounting practice known as “Equalization” by which a portion of the proceeds from sales and costs of reacquiring the Funds’ shares, equivalent on a per share basis to the amount of distributable net investment income on the date of the transaction, is credited or charged to undistributed net investment income. As a result, undistributed net investment income per share is unaffected by sales or reacquisitions of the Funds’ shares. Amounts related to Equalization can be found on the Statement of Changes in Net Assets.
ALPS ETF Trust
| Notes to Financial Statements | November 30, 2017 |
H. Federal Tax and Tax Basis Information
The timing and character of income and capital gain distributions are determined in accordance with income tax regulations, which may differ from U.S. GAAP. Reclassifications are made to the Fund’s capital accounts for permanent tax differences to reflect income and gains available for distribution (or available capital loss carryforwards) under income tax regulations.
For the year ended November 30, 2017, the following reclassifications, which had no impact on results of operations or net assets, were recorded to reflect permanent tax differences resulting primarily from in-kind transactions:
| Fund | | Paid-in Capital | | | Accumulated Net Investment Income/(Loss) | | | Accumulated Net Realized Gain/(Loss) on Investments | |
| ALPS Sector Dividend Dogs ETF | | $ | 118,936,647 | | | $ | 63,556 | | | $ | (119,000,203 | ) |
| ALPS International Sector Dividend Dogs ETF | | | 3,408,826 | | | | (116,332 | ) | | | (3,292,494 | ) |
| ALPS Emerging Sector Dividend Dogs ETF | | | 190,690 | | | | 32,387 | | | | (223,077 | ) |
| ALPS | Dorsey Wright Sector Momentum ETF | | | 167,042 | | | | – | | | | (167,042 | ) |
The tax character of the distributions paid during the fiscal years ended November 30, 2017 and November 30, 2016 were as follows:
| Fund | | Ordinary Income | | | Return of Capital | |
| November 30, 2017 | | | | | | |
| ALPS Sector Dividend Dogs ETF | | $ | 70,756,115 | | | $ | 2,592,040 | |
| ALPS International Sector Dividend Dogs ETF | | | 8,514,874 | | | | – | |
| ALPS Emerging Sector Dividend Dogs ETF | | | 1,225,826 | | | | – | |
| ALPS | Dorsey Wright Sector Momentum ETF | | | 33,844 | | | | – | |
| November 30, 2016 | | | | | | | | |
| ALPS Sector Dividend Dogs ETF | | | 41,467,278 | | | | 366,916 | |
| ALPS International Sector Dividend Dogs ETF | | | 5,356,978 | | | | – | |
| ALPS Emerging Sector Dividend Dogs ETF | | | 434,572 | | | | – | |
At November 30, 2017, capital losses deferred to the next tax year were as follows:
| Fund | | Short-Term | | | Long-Term | |
| ALPS Sector Dividend Dogs ETF | | $ | 48,757,731 | | | $ | 96,833,402 | |
| ALPS International Sector Dividend Dogs ETF | | | 13,407,043 | | | | 11,887,371 | |
| ALPS Emerging Sector Dividend Dogs ETF | | | 583,245 | | | | 1,781,400 | |
| ALPS | Dorsey Wright Sector Momentum ETF | | | 186,127 | | | | – | |
As of November 30, 2017, the components of distributable earnings on a tax basis for the Funds were as follows:
| | | Undistributed net investment income | | | Accumulated net realized loss on investments | | | Net unrealized appreciation/ (depreciation) on investments | | | Total | |
| ALPS Sector Dividend Dogs ETF | | $ | – | | | $ | (145,591,133 | ) | | $ | 254,609,344 | | | $ | 109,018,211 | |
| ALPS International Sector Dividend Dogs ETF | | | 830,054 | | | | (25,294,414 | ) | | | 26,919,222 | | | | 2,454,862 | |
| ALPS Emerging Sector Dividend Dogs ETF | | | 605,306 | | | | (2,364,645 | ) | | | 1,839,225 | | | | 79,886 | |
| ALPS | Dorsey Wright Sector Momentum ETF | | | 8,231 | | | | (186,127 | ) | | | 1,140,180 | | | | 962,284 | |
ALPS ETF Trust
| Notes to Financial Statements | November 30, 2017 |
As of November 30, 2017, the costs of investments for federal income tax purposes and accumulated net unrealized appreciation/(depreciation) on investments were as follows:
| | | Gross Appreciation (excess of value over tax cost) | | | Gross Depreciation (excess of tax cost over value) | | | Net Appreciation/ (Depreciation) of Foreign Currency | | | Net Unrealized Appreciation/ (Depreciation) | | Cost of Investments for Income Tax Purposes | |
| ALPS Sector Dividend Dogs ETF | | $ | 340,275,541 | | | $ | (85,666,197 | ) | | $ | - | | | $ | 254,609,344 | | | $ | 2,103,695,339 | |
| ALPS International Sector Dividend Dogs ETF | | | 43,608,344 | | | | (16,706,183 | ) | | | 17,061 | | | | 26,919,222 | | | | 321,094,903 | |
| ALPS Emerging Sector Dividend Dogs ETF | | | 4,028,661 | | | | (2,189,543 | ) | | | 107 | | | | 1,839,225 | | | | 46,791,351 | |
| ALPS | Dorsey Wright Sector Momentum ETF | | | 1,262,984 | | | | (122,804 | ) | | | - | | | | 1,140,180 | | | | 9,521,314 | |
The differences between book-basis and tax-basis are primarily due to the deferral of losses from wash sales.
I. Income Taxes
No provision for income taxes is included in the accompanying financial statements, as each Fund intends to distribute to shareholders all taxable investment income and realized gains and otherwise comply with Subchapter M of the Internal Revenue Code of 1986, as amended, applicable to regulated investment companies. Each Fund evaluates tax positions taken (or expected to be taken) in the course of preparing the Fund’s tax returns to determine whether these positions meet a “more-likely-than-not” standard that, based on the technical merits, have a more than fifty percent likelihood of being sustained by a taxing authority upon examination. A tax position that meets the “more-likely-than-not” recognition threshold is measured to determine the amount of benefit to recognize in the financial statements.
As of and during year ended November 30, 2017, each Fund did not have a liability for any unrecognized tax benefits. Each Fund files U.S. federal, state, and local tax returns as required. Each Fund’s tax returns are subject to examination by the relevant tax authorities until expiration of the applicable statute of limitations, which is generally three years after the filing of the tax return, but may extend to four years in certain jurisdictions. Each Fund’s tax returns for open years have incorporated no uncertain tax positions that require a provision for income taxes. Being that the ALPS | Dorsey Wright Sector Momentum ETF commenced operations on January 10, 2017, no tax returns have been filed as of the date of this report.
J. Lending of Portfolio Securities
The Funds have entered into a securities lending agreement with State Street Bank & Trust Co. (“SSB”), the Funds’ lending agent. Each Fund may lend its portfolio securities only to borrowers that are approved by SSB. Each Fund will limit such lending to not more than 33 1/3% of the value of its total assets. The Fund’s securities held at SSB as custodian shall be available to be lent except those securities the Fund or ALPS Advisors, Inc. specifically identifies in writing as not being available for lending. The borrower pledges and maintains with the Fund collateral consisting of cash (U.S. Dollars only), securities issued or guaranteed by the U.S. government or its agencies or instrumentalities, and cash equivalents (including irrevocable bank letters of credit) issued by a person other than the borrower or an affiliate of the borrower. The initial collateral received by the Fund is required to have a value of no less than 102% of the market value of the loaned securities for U.S equity securities and a value of no less than 105% of the market value for non-U.S. equity securities. The collateral is maintained thereafter, at a market value equal to not less than 102% of the current value of the U.S. equity securities on loan and not less than 105% of the current value of the non-U.S. equity securities on loan. The market value of the loaned securities is determined at the close of each business day and any additional required collateral is delivered to the Fund on the next business day. During the term of the loan, each Fund is entitled to all distributions made on or in respect of the loaned securities. Loans of securities are terminable at any time and the borrower, after notice, is required to return borrowed securities within the customary time period for settlement of securities transactions.
Any cash collateral received is reinvested in a money market fund managed by SSB as disclosed in the Fund’s Schedule of Investments and is reflected in the Statements of Assets and Liabilities as a payable for collateral upon return of securities loaned. Non-cash collateral, in the form of securities issued or guaranteed by the U.S. government or its agencies or instrumentalities, is not disclosed in the Fund’s Statements of Assets and Liabilities as it is held by the lending agent on behalf of the Fund, and the Fund does not have the ability to re-hypothecate these securities. Income earned by the Fund from securities lending activity is disclosed in the Statement of Operations.
ALPS ETF Trust
| Notes to Financial Statements | November 30, 2017 |
| | | Market Value of Securities on Loan | | | Cash Collateral Received | | | Non-Cash Collateral Received | | | Total Collateral Received | |
| ALPS Sector Dividend Dogs ETF | | $ | 40,413,439 | | | $ | 41,488,538 | | | $ | 32,119 | | | $ | 41,520,657 | |
| ALPS Emerging Sector Dividend Dogs ETF | | $ | 1,241,124 | | | $ | 1,268,183 | | | | - | | | $ | 1,268,183 | |
| ALPS/Dorsey Wright Sector Momentum ETF | | $ | 273,800 | | | $ | 284,665 | | | | - | | | $ | 284,665 | |
The risks of securities lending include the risk that the borrower may not provide additional collateral when required or may not return the securities when due. To mitigate these risks, the Funds benefit from a borrower default indemnity provided by SSB. SSB’s indemnity allows for full replacement of securities lent wherein SSB will purchase the unreturned loaned securities on the open market by applying the proceeds of the collateral, or to the extent such proceeds are insufficient or the collateral is unavailable, SSB will purchase the unreturned loan securities at SSB’s expense. However, the Funds could suffer a loss if the value of the investments purchased with cash collateral falls below the value of the cash collateral received.
The following table reflects a breakdown of transactions accounted for as secured borrowings, the gross obligation by the type of collateral pledged or securities loaned, and the remaining contractual maturity of those transactions as of November 30, 2017:
| ALPS | Sector Dividend Dogs ETF | | | | Remaining contractual maturity of the agreements | |
| | | | | | |
| Securities Lending Transactions | | Overnight & Continuous | | | Up to 30 days | | | 30-90 days | | | Greater than 90 days | | | Total | |
| Common Stocks | | $ | 41,488,538 | | | $ | - | | | $ | - | | | $ | - | | | $ | 41,488,538 | |
| Total Borrowings | | | | | | | | | | | | | | | | | | | 41,488,538 | |
| Gross amount of recognized liabilities for securities lending (collateral received) | | | | | | | | | | | $ | 41,488,538 | |
| ALPS | Emerging Sector Dividend Dogs ETF | | | | Remaining contractual maturity of the agreements | |
| | | | | | |
| Securities Lending Transactions | Overnight & Continuous | | | Up to 30 days | | | 30-90 days | | | Greater than 90 days | | | Total | |
| Common Stocks | | $ | 1,268,183 | | | $ | - | | | $ | - | | | $ | - | | | $ | 1,268,183 | |
| Total Borrowings | | | | | | | | | | | | | | | | | | | 1,268,183 | |
| Gross amount of recognized liabilities for securities lending (collateral received) | | | | | | | | | | $ | 1,268,183 | |
| ALPS | Dorsey Wright Sector Momentum ETF | | | | Remaining contractual maturity of the agreements | |
| | | | | | |
| Securities Lending Transactions | Overnight & Continuous | | | Up to 30 days | | | 30-90 days | | | Greater than 90 days | | | Total | |
| Common Stocks | | $ | 284,665 | | | $ | - | | | $ | - | | | $ | - | | | $ | 284,665 | |
| Total Borrowings | | | | | | | | | | | | | | | | | | | 284,665 | |
| Gross amount of recognized liabilities for securities lending (collateral received) | | | | | | | | | | | $ | 284,665 | |
3. INVESTMENT ADVISORY FEE AND OTHER AFFILIATED TRANSACTIONS
ALPS Advisors, Inc. (the “Adviser”) acts as the Funds’ investment adviser pursuant to advisory agreements with the Trust on behalf of each Fund (the “Advisory Agreement”). Pursuant to the Advisory Agreement, each Fund pays the Adviser a unitary fee for the services and facilities it provides, payable on a monthly basis as a percentage of each Fund’s average daily net assets as set out below. From time to time, the Adviser may waive all or a portion of its fee.
ALPS ETF Trust
| Notes to Financial Statements | November 30, 2017 |
| Fund | Advisory Fee |
| ALPS Sector Dividend Dogs ETF | 0.40% |
| ALPS International Sector Dividend Dogs ETF | 0.50% |
| ALPS Emerging Sector Dividend Dogs ETF | 0.60% |
| ALPS/Dorsey Wright Sector Momentum ETF | 0.40% |
Out of the unitary management fee, the Adviser pays substantially all expenses of each Fund, including the cost of transfer agency, custody, fund administration, legal, audit, independent trustees and other services, except for interest expenses, distribution fees or expenses, brokerage expenses, taxes and extraordinary expenses not incurred in the ordinary course of each Fund's business. The Adviser’s unitary management fee is designed to pay substantially all of each Fund's expenses and to compensate the Adviser for providing services for each Fund.
ALPS Fund Services, Inc., an affiliate of the Adviser, is the administrator for the Funds.
Each Trustee who is not an officer or employee of the Adviser, any sub-adviser or any of their affiliates (“Independent Trustees”) receives (1) a quarterly retainer of $5,000, (2) a per meeting fee for regularly scheduled meetings of $3,750, (3) $1,500 for any special meeting held outside of a regularly scheduled board meeting, and (4) reimbursement for all reasonable out-of-pocket expenses relating to attendance at meetings.
4. PURCHASES AND SALES OF SECURITIES
For the year or period ended November 30, 2017, the cost of purchases and proceeds from sales of investment securities, excluding short-term investments and in-kind transactions, were as follows:
| Fund | | Purchases | | | Sales | |
| ALPS Sector Dividend Dogs ETF | | $ | 1,051,809,466 | | | $ | 1,042,280,293 | |
| ALPS International Sector Dividend Dogs ETF | | | 92,494,501 | | | | 92,367,948 | |
| ALPS Emerging Sector Dividend Dogs ETF | | | 20,033,444 | | | | 15,175,221 | |
| ALPS | Dorsey Wright Sector Momentum ETF | | | 8,460,519 | | | | 5,970,396 | |
For the year or period ended November 30, 2017, the cost of in-kind purchases and proceeds from in-kind sales were as follows:
| Fund | | Purchases | | | Sales | |
| ALPS Sector Dividend Dogs ETF | | $ | 1,098,477,131 | | | $ | 648,164,190 | |
| ALPS International Sector Dividend Dogs ETF | | | 167,587,961 | | | | 27,722,948 | |
| ALPS Emerging Sector Dividend Dogs ETF | | | 21,492,150 | | | | 1,715,599 | |
| ALPS | Dorsey Wright Sector Momentum ETF | | | 8,120,486 | | | | 1,355,646 | |
For the year or period ended November 30, 2017, the in-kind net realized gains/(losses) were as follows:
| Fund | | Net Realized Gain/(Loss) | |
| ALPS Sector Dividend Dogs ETF | | $ | 110,462,947 | |
| ALPS International Sector Dividend Dogs ETF | | | 3,373,004 | |
| ALPS Emerging Sector Dividend Dogs ETF | | | 196,142 | |
| ALPS/Dorsey Wright Sector Momentum ETF | | | 167,062 | |
Gains on in-kind transactions are not considered taxable for federal income tax purposes and losses on in kind transactions are also not deductible for tax purposes.
ALPS ETF Trust
| Notes to Financial Statements | November 30, 2017 |
5. CAPITAL SHARE TRANSACTIONS
Shares are created and redeemed by each Fund only in Creation Unit size aggregations of 50,000 shares. Only broker-dealers or large institutional investors with creation and redemption agreements called Authorized Participants (“AP”) are permitted to purchase or redeem Creation Units from the Funds. Such transactions are generally permitted on an in-kind basis, with a balancing cash component to equate the transaction to the NAV per unit of each Fund on the transaction date. Cash may be substituted equivalent to the value of certain securities generally when they are not available in sufficient quantity for delivery, not eligible for trading by the AP or as a result of other market circumstances.
6. RELATED PARTY TRANSACTIONS
The Fund engaged in cross trades between other funds in the Trust during the year ended November 30, 2017 pursuant to Rule 17a-7 under the 1940 Act. Cross trading is the buying or selling of portfolio securities between funds to which the Adviser serves as the investment adviser. The Board previously adopted procedures that apply to transactions between the Funds of the Trust pursuant to Rule 17a-7. These transactions related to cross trades during the period complied with the requirements set forth by Rule 17a-7 and the Trust’s procedures.
Transactions related to cross trades during the year ended November 30, 2017, were as follows:
| Fund | | Purchase cost paid | | | Sale proceeds received | | | Realized gain/ (loss) on sales | |
| ALPS Sector Dividend Dogs ETF | | $ | 793,576 | | | $ | 1,967,755 | | | $ | 282,723 | |
| ALPS | Dorsey Wright Sector Momentum ETF | | | 167,705 | | | | – | | | | – | |
ALPS ETF Trust
| Additional Information | November 30, 2017 (Unaudited) |
PROXY VOTING POLICIES AND PROCEDURES
Information regarding how the Fund voted proxies relating to portfolio securities during the most recent 12-month period ended June 30 and a description of the Fund’s proxy voting policies and procedures used in determining how to vote for proxies are available without charge on the SEC’s website at www.sec.gov and upon request, by calling (toll-free) 1-866-675-2639.
PORTFOLIO HOLDINGS
The Trust is required to disclose, after its first and third fiscal quarters, the complete schedule of each Fund’s portfolio holdings with the SEC on Form N-Q. Form N-Q for each Fund will be available on the SEC’s website at www.sec.gov. Each Fund’s Form N-Q may also be reviewed and copied at the SEC’s Public Reference Room in Washington, D.C. and information on the operation of the Public Reference Room may be obtained by calling 1-800-SEC-0330. Each Fund’s Form N-Q will be available without charge, upon request, by calling (toll-free) 1-866-675-2639 or by writing to ALPS ETF Trust at 1290 Broadway, Suite 1100, Denver, Colorado 80203.
TAX INFORMATION
The Funds designate the following for federal income tax purposes for distributions made during the calendar year ended December 31, 2016:
| | | Qualified Dividend Income | | Dividend Received Deduction |
| ALPS International Sector Dividend Dogs ETF | | 100.00% | | 0.00% |
| ALPS Sector Dividend Dogs ETF | | 96.35% | | 82.83% |
| ALPS Emerging Sector Dividend Dogs ETF | | 100.00% | | 0.00% |
| Alps/Dorsey Wright Sector Momentum ETF | | 0.00% | | 0.00% |
In early 2017, if applicable, shareholders of record received this information for the distributions paid to them by the Funds during the calendar year 2016 via Form 1099. The Funds will notify shareholders in early 2018 of amounts paid to them by the Funds, if any, during the calendar year 2017.
Pursuant to Section 853(c) of the Internal Revenue Code, the following Funds designated the following:
| | | Foreign Taxes Paid | | | Foreign Source Income | |
| ALPS Emerging Sector Dividend Dogs ETF | | $ | 137,247 | | | $ | 1,422,781 | |
| ALPS International Sector Dividend Dogs ETF | | $ | 774,608 | | | $ | 8,337,339 | |
LICENSING AGREEMENTS
ALPS Sector Dividend Dogs ETF, ALPS International Sector Dividend Dogs ETF, and ALPS Emerging Sector Dividend Dogs ETF
The Funds are not sponsored, endorsed, sold or promoted by the Index Provider. The Index Provider makes no representation or warranty, express or implied, to the owners of each Fund or any member of the public regarding the advisability of investing in securities generally or in each Fund particularly or the ability of each Fund to track the performance of the physical commodities market. The Index Provider’s only relationship to the Adviser or each Fund is the licensing of certain service marks and trade names of the Index Provider and of each Underlying Index that is determined, composed and calculated by the Index Provider without regard to the Adviser or the Funds. The Index Provider has no obligation to take the needs of the Adviser or the Funds or the owners of each Fund into consideration in determining, composing or calculating each Underlying Index. The Index Provider is not responsible for and has not participated in the determination of the timing of, prices at, or quantities of each Fund to be issued or in the determination or calculation of the equation by which each Fund is to be converted into cash. The Index Provider has no obligation or liability in connection with the administration, marketing or trading of each Fund.
THE INDEX PROVIDER DOES NOT GUARANTEE THE ACCURACY AND/OR THE COMPLETENESS OF EACH UNDERLYING INDEX OR ANY DATA INCLUDED THEREIN AND THE INDEX PROVIDER SHALL HAVE NO LIABILITY FOR ANY ERRORS, OMISSIONS, OR INTERRUPTIONS THEREIN. THE INDEX PROVIDER MAKES NO WARRANTY, EXPRESS OR IMPLIED, AS TO RESULTS TO BE OBTAINED BY THE ADVISER, EACH FUND, OWNERS OF EACH FUND, OR ANY OTHER PERSON OR ENTITY FROM THE USE OF THE UNDERLYING INDEX OR ANY DATA INCLUDED THEREIN. THE INDEX PROVIDER MAKES NO EXPRESS OR IMPLIED WARRANTIES, AND EXPRESSLY DISCLAIMS ALL WARRANTIES OF MERCHANTABILITY OR FITNESS FOR A PARTICULAR PURPOSE OR USE WITH RESPECT TO EACH UNDERLYING INDEX OR ANY DATA INCLUDED THEREIN. WITHOUT LIMITING ANY OF THE FOREGOING, IN NO EVENT SHALL THE INDEX PROVIDER HAVE ANY LIABILITY FOR ANY SPECIAL, PUNITIVE, INDIRECT, OR CONSEQUENTIAL DAMAGES (INCLUDING LOST PROFITS), EVEN IF NOTIFIED OF THE POSSIBILITY OF SUCH DAMAGES.
ALPS ETF Trust
| Additional Information | November 30, 2017 (Unaudited) |
The Funds are not sponsored, endorsed, sold or promoted by Standard & Poor’s, a division of The McGraw-Hill Companies, Inc. (“S&P”) or its third party licensors. Neither S&P nor its third party licensors make any representation or warranty, express or implied, to the owners of each Fund or any member of the public regarding the advisability of investing in securities generally or in each Fund particularly or the ability of each Underlying Index to track general stock market performance. S&P’s and its third party licensor’s only relationship to the Index Provider is the licensing of certain trademarks, service marks and trade names of S&P and/or its third party licensors and for the providing of calculation and maintenance services related to the Underlying Index. Neither S&P nor its third party licensors is responsible for and has not participated in the determination of the prices and amount of each Fund or the timing of the issuance or sale of each Fund or in the determination or calculation of the equation by which each Fund is to be converted into cash. S&P has no obligation or liability in connection with the administration, marketing or trading of each Fund.
NEITHER S&P, ITS AFFILIATES NOR THEIR THIRD PARTY LICENSORS GUARANTEE THE ADEQUACY, ACCURACY, TIMELINESS OR COMPLETENESS OF EACH UNDERLYING INDEX OR ANY DATA INCLUDED THEREIN OR ANY COMMUNICATIONS, INCLUDING BUT NOT LIMITED TO, ORAL OR WRITTEN COMMUNICATIONS (INCLUDING ELECTRONIC COMMUNICATIONS) WITH RESPECT THERETO. S&P, ITS AFFILIATES AND THEIR THIRD PARTY LICENSORS SHALL NOT BE SUBJECT TO ANY DAMAGES OR LIABILITY FOR ANY ERRORS, OMISSIONS OR DELAYS THEREIN. S&P MAKES NO EXPRESS OR IMPLIED WARRANTIES, AND EXPRESSLY DISCLAIMS ALL WARRANTIES OF MERCHANTABILITY OR FITNESS FOR A PARTICULAR PURPOSE OR USE WITH RESPECT TO ITS TRADEMARKS, EACH UNDERLYING INDEX OR ANY DATA INCLUDED THEREIN. WITHOUT LIMITING ANY OF THE FOREGOING, IN NO EVENT WHATSOEVER SHALL S&P, ITS AFFILIATES OR THEIR THIRD PARTY LICENSORS BE LIABLE FOR ANY INDIRECT, SPECIAL, INCIDENTAL, PUNITIVE OR CONSEQUENTIAL DAMAGES, INCLUDING BUT NOT LIMITED TO, LOSS OF PROFITS, TRADING LOSSES, LOST TIME OR GOODWILL, EVEN IF THEY HAVE BEEN ADVISED OF THE POSSIBILITY OF SUCH DAMAGES, WHETHER IN CONTRACT, TORT, STRICT LIABILITY OR OTHERWISE.
Standard & Poor’s® and S&P® are registered trademarks of The McGraw-Hill Companies, Inc.; “Calculated by S&P Custom Indices” and its related stylized mark are service marks of The McGraw-Hill Companies, Inc. These marks have been licensed for use by the Index Provider.
The S&P 500® is the property of Standard and Poor’s Financial Services LLC (“S&P”) and has been licensed by S&P for use by S-Network® Global Indexes, Inc. in connection with the S-Network® Sector Dividend Dogs Index (Ticker: SDOGX), the S-Network® Emerging Sector Dividend Dogs Index (Ticker: EDOGX), and the S-Network® International Sector Dividend Dogs Index (Ticker: IDOGX).
The Adviser does not guarantee the accuracy and/or the completeness of each Underlying Index or any data included therein, and the Adviser shall have no liability for any errors, omissions or interruptions therein. The Adviser makes no warranty, express or implied, as to results to be obtained by each Fund, owners of the Shares of each Fund or any other person or entity from the use of each Underlying Index or any data included therein. The Adviser makes no express or implied warranties, and expressly disclaims all warranties of merchantability or fitness for a particular purpose or use with respect to each Underlying Index or any data included therein. Without limiting any of the foregoing, in no event shall the Adviser have any liability for any special, punitive, direct, indirect or consequential damages (including lost profits) arising out of matters relating to the use of each Underlying Index, even if notified of the possibility of such damages.
ALPS | Dorsey Wright Sector Momentum ETF
The Product(s) is not sponsored, endorsed, sold or promoted by Nasdaq, Inc. or its affiliates (Nasdaq, with its affiliates, are referred to as the “Corporations”). The Corporations have not passed on the legality or suitability of, or the accuracy or adequacy of descriptions and disclosures relating to, the Product(s). The Corporations make no representation or warranty, express or implied to the owners of the Product(s) or any member of the public regarding the advisability of investing in securities generally or in the Product(s) particularly, or the ability of the Dorsey Wright US Sector Momentum Index to track general stock market performance. The Corporations’ only relationship to ALPS Advisors, Inc. (“Licensee”) is in the licensing of the Nasdaq®, Dorsey Wright US Sector Momentum Index, and certain trade names of the Corporations and the use of the Dorsey Wright US Sector Momentum Index which is determined, composed and calculated by Nasdaq without regard to Licensee or the Product(s). Nasdaq has no obligation to take the needs of the Licensee or the owners of the Product(s) www.alpsfunds.com 15 into consideration in determining, composing or calculating the Dorsey Wright US Sector Momentum Index. The Corporations are not responsible for and have not participated in the determination of the timing of, prices at, or quantities of the Product(s) to be issued or in the determination or calculation of the equation by which the Product(s) is to be converted into cash. The Corporations have no liability in connection with the administration, marketing or trading of the Product(s).
THE CORPORATIONS DO NOT GUARANTEE THE ACCURACY AND/ OR UNINTERRUPTED CALCULATION OF DORSEY WRIGHT US SECTOR MOMENTUM INDEX OR ANY DATA INCLUDED THEREIN. THE CORPORATIONS MAKE NO WARRANTY, EXPRESS OR IMPLIED, AS TO RESULTS TO BE OBTAINED BY LICENSEE, OWNERS OF THE PRODUCT(S), OR ANY OTHER PERSON OR ENTITY FROM THE USE OF THE DORSEY WRIGHT US SECTOR MOMENTUM INDEX OR ANY DATA INCLUDED THEREIN. THE CORPORATIONS MAKE NO EXPRESS OR IMPLIED WARRANTIES, AND EXPRESSLY DISCLAIM ALL WARRANTIES OF MERCHANTABILITY OR FITNESS FOR A PARTICULAR PURPOSE OR USE WITH RESPECT TO THE DORSEY WRIGHT US SECTOR MOMENTUM INDEX® OR ANY DATA INCLUDED THEREIN. WITHOUT LIMITING ANY OF THE FOREGOING, IN NO EVENT SHALL THE CORPORATIONS HAVE ANY LIABILITY FOR ANY LOST PROFITS OR SPECIAL, INCIDENTAL, PUNITIVE, INDIRECT, OR CONSEQUENTIAL DAMAGES, EVEN IF NOTIFIED OF THE POSSIBILITY OF SUCH DAMAGES.
ALPS ETF Trust
| Additional Information | November 30, 2017 (Unaudited) |
Nasdaq® and Dorsey Wright US Sector Momentum Index are registered trademarks of Nasdaq, Inc. (which with its affiliates is referred to as the “Corporations”) and are licensed for use by ALPS Advisors, Inc. The Product(s) have not been passed on by the Corporations as to their legality or suitability. The Product(s) are not issued, endorsed, sold, or promoted by the Corporations. THE CORPORATIONS MAKE NO WARRANTIES AND BEAR NO LIABILITY WITH RESPECT TO THE PRODUCT(S).
The Index Provider does not guarantee the accuracy and/or the completeness of the Underlying Index or any data included therein and the Index Provider shall have no liability for any errors, omissions, or interruptions therein. The Index Provider makes no warranty, express or implied, as to results to be obtained by the Adviser, the Fund, owners of the Fund, or any other person or entity from the use of the Underlying Index or any data included therein. The Index Provider makes no express or implied warranties, and expressly disclaims all warranties of merchantability or fitness for a particular purpose or use with respect to the Underlying Index or any data included therein. Without limiting any of the foregoing, in no event shall the Index Provider have any liability for any special, punitive, indirect, or consequential damages (including lost profits), even if notified of the possibility of such damages.
The Adviser does not guarantee the accuracy and/or the completeness of the Underlying Index or any data included therein, and the Adviser shall have no liability for any errors, omissions or interruptions therein. The Adviser makes no warranty, express or implied, as to results to be obtained by the Fund, owners of the Shares of the Fund or any other person or entity from the use of the Underlying Index or any data included therein. The Adviser makes no express or implied warranties, and expressly disclaims all warranties of merchantability or fitness for a particular purpose or use with respect to the Underlying Index or any data included therein. Without limiting any of the foregoing, in no event shall the Adviser have any liability for any special, punitive, direct, indirect or consequential damages (including lost profits) arising out of matters relating to the use of the Underlying Index, even if notified of the possibility of such damages.
ALPS ETF Trust
| Board Considerations Regarding Approval of Investment Advisory Agreement | November 30, 2017 (Unaudited) |
At an in-person meeting held on June 8, 2017, the Board of Trustees of the Trust (the “Board” or the “Trustees”), including the Trustees who are not “interested persons” of the Trust within the meaning of the 1940 Act, as amended (the “Independent Trustees”), evaluated a proposal to approve the continuance of the Investment Advisory Agreements between the Trust and ALPS Advisors, Inc. (the “Adviser” or “AAI”) with respect to the ALPS Sector Dividend Dogs ETF (“SDOG”), the ALPS International Sector Dividend Dogs ETF (“IDOG”), and the ALPS Emerging Sector Dividend Dogs ETF (“EDOG”) (each “a Fund” and collectively the “Funds”). The Independent Trustees also met separately to consider the Investment Advisory Agreements.
In evaluating the Investment Advisory Agreements with respect to each Fund, the Independent Trustees considered various factors, including (i) the nature, extent and quality of the services provided by AAI with respect to the applicable Fund under the Investment Advisory Agreements; (ii) the advisory fees and other expenses paid by the Fund compared to those of similar funds managed by other investment advisers; (iii) the costs of the services provided to the Fund by AAI and the profits realized by AAI and its affiliates from its relationship to the Fund; (iv) the extent to which economies of scale have been or would be realized if and as the assets of the Fund grow and whether fees reflect the economies of scale for the benefit of shareholders; and (v) any additional benefits and other considerations.
With respect to the nature, extent and quality of the services provided by AAI under the Investment Advisory Agreements, the Independent Trustees considered and reviewed information concerning the services provided under the Investment Advisory Agreements, the investment parameters of the index of each Fund, financial information regarding AAI and its parent company, information describing AAI’s current organization and the background and experience of the persons responsible for the day-to-day management of the Funds.
The Independent Trustees reviewed information on the performance of each Fund and its applicable benchmark. The Independent Trustees also evaluated the correlation and tracking error between each underlying index and its corresponding Fund’s performance. Based on their review, the Independent Trustees found that the nature and extent of services provided to each Fund under the Investment Advisory Agreements was appropriate and that the quality was satisfactory.
The Independent Trustees noted that the advisory fees for each Fund were unitary fees pursuant to which AAI assumes all expenses of the Funds (including the cost of transfer agency, custody, fund administration, legal, audit and other services) other than the payments under the Investment Advisory Agreement, brokerage expenses, taxes, interest, litigation expenses and other extraordinary expenses.
With respect to advisory fee rates, the Independent Trustees noted the following:
The net advisory fee rate for each of the Funds is higher than the median of its Broadridge expense group. The Funds’ respective expense ratios, however, are (i) in the case of IDOG and EDOG, at the median of their respective Broadridge expense groups, and (ii) in the case of SDOG, higher than the median of its Broadridge expense group.
Based on the foregoing, and the other information available to them, the Independent Trustees concluded that the advisory fee rate for each of the Funds was reasonable under the circumstances and in light of the quality of the services provided.
The Independent Trustees considered other benefits available to AAI because of its relationship with the Funds and concluded that the advisory fees were reasonable taking into account any such benefits.
The Independent Trustees also considered with respect to each Fund the information provided by AAI about the costs and profitability of AAI with respect to each of the Funds. The Independent Trustees reviewed and noted the relatively small sizes of the Funds (other than SDOG) and concluded that AAI was not realizing any economies of scale other than SDOG. With respect to SDOG, the Independent Trustees considered the growth in assets and that the Fund may be achieving some economies of scale. They also noted the Adviser’s view that SDOG remains in line with its category average for fees and at a smaller scale than many ETFs with similar fees. The Independent Trustees noted that SDOG is still a relatively new product, which makes it difficult to quantify the potential variability in net assets and thus determine the sustainability of any potential economies of scale which may exist. The Independent Trustees determined that they would continue to evaluate whether further economies of scale have been achieved on an ongoing basis.
In voting to renew each Investment Advisory Agreement, the Independent Trustees concluded that the terms of each Investment Advisory Agreement are reasonable and fair in light of the services to be performed, the fees paid by certain other funds, expenses to be incurred and such other matters as the Independent Trustees considered relevant in the exercise of their reasonable business judgment. The Independent Trustees did not identify any single factor or group of factors as all important or controlling and considered all factors together.
ALPS ETF Trust
| Trustees & Officers | November 30, 2017 (Unaudited) |
The general supervision of the duties performed by the Adviser for the Fund under the Investment Advisory Agreement is the responsibility of the Board of Trustees. The Trust currently has four Trustees. Three Trustees have no affiliation or business connection with the Adviser or any of its affiliated persons and do not own any stock or other securities issued by the Adviser. These are the “non-interested” or “independent” Trustees (“Independent Trustees”). The other Trustee (the “Interested Trustee”) is affiliated with the Adviser.
The Independent Trustees of the Trust, their term of office and length of time served, their principal business occupations during the past five years, the number of portfolios in the Fund Complex overseen by each Independent Trustee, and other directorships, if any, held by the Trustee are shown below.
INDEPENDENT TRUSTEES
| Name, Address & Year of Birth* | Position(s) Held with Trust | Term of Office and Length of Time Served** | Principal Occupation(s) During Past 5 Years | Number of Portfolios in Fund Complex Overseen by Trustees*** | Other Directorships Held by Trustees |
Mary K. Anstine, 1940 | Trustee | Since March 2008 | Ms. Anstine was President/Chief Executive Officer of HealthONE Alliance, Denver, Colorado, and former Executive Vice President of First Interstate Bank of Denver. Ms. Anstine is also Trustee/Director of AV Hunter Trust and Colorado Uplift Board. Ms. Anstine was formerly a Director of the Trust Bank of Colorado (later purchased and now known as Northern Trust Bank), HealthONE and Denver Area Council of the Boy Scouts of America and a member of the American Bankers Association Trust Executive Committee. | 42 | Ms. Anstine is a Trustee of ALPS Variable Investment Trust (10 funds); Financial Investors Trust (33 funds); Reaves Utility Income Fund (1 fund); and Westcore Trust (14 funds). |
Jeremy W. Deems, 1976 | Trustee | Since March 2008 | Mr. Deems is the Co-Founder, Chief Compliance Officer and Chief Financial Officer of Green Alpha Advisors, LLC. Mr. Deems is Co-Portfolio Manager of the Shelton Green Alpha Fund. Prior to joining Green Alpha Advisors, Mr. Deems was CFO and Treasurer of Forward Management, LLC, ReFlow Management Co., LLC, ReFlow Fund, LLC, a private investment fund, and Sutton Place Management, LLC, an administrative services company. | 44 | Mr. Deems is a Trustee of ALPS Variable Investment Trust (10 funds); Financial Investors Trust (33 funds); and Reaves Utility Income Fund (1 fund); Clough Funds Trust (1 fund) and Elevation ETF Trust (1 fund). |
Rick A. Pederson, 1952 | Trustee and Chairman | Has served as Trustee since March 2008. Has served as Chairman since July 2017. | Mr. Pederson is President, Foundation Properties, Inc. (a real estate investment management company), 1994 - present; Advisory Board Member, Bow River Capital Partners (private equity management), 2003 - present; Advisor, The Pauls Corporation (real estate investment management and development), 2008 - present; Chairman, Ross Consulting Group (real estate consulting services) 1983-2013; Advisory Board, Neenan Company (construction services) 2002-present; Board Member, Prosci Inc. (private business services) 2013-2016; Board Member, Citywide Banks (Colorado community bank) 2014-present; Board member, Professional Pediatric Health Care (a Denver-based home nursing firm) 2014 – present; Board Member, Strong-Bridge Consulting (management consulting) 2015-present; Director, National Western Stock Show (not-for-profit organization); Director, Biennial of the Americas (not-for-profit-organization), 2012- 2015; Board Member, History Colorado, 2015 -present. | 21 | Mr. Pederson is Trustee of Westcore Trust (14 funds) and Principal Real Estate Income Fund (1 fund). |
| * | The business address of the Trustee is c/o ALPS Advisors, Inc., 1290 Broadway, Suite 1100, Denver, Colorado 80203. |
| ** | This is the period for which the Trustee began serving the Trust. Each Trustee serves an indefinite term, until his successor is elected. |
| *** | The Fund Complex includes all series of the Trust and any other investment companies for which ALPS Advisors, Inc. provides investment advisory services. |
ALPS ETF Trust
| Trustees & Officers | November 30, 2017 (Unaudited) |
The Trustee who is affiliated with the Adviser or affiliates of the Adviser and executive officers of the Trust, his term of office and length of time served, his principal business occupations during the past five years, the number of portfolios in the Fund Complex overseen by the Interested Trustee and the other directorships, if any, held by the Trustee, are shown below.
INTERESTED TRUSTEE
| Name, Address and Year of Birth of Interested Trustee* | Position(s) Held with Trust | Term of Office and Length of Time Served** | Principal Occupation(s) During Past 5 Years | Number of Portfolios in Fund Complex Overseen by Trustees*** | Other Directorships Held by Trustee |
Edmund J. Burke, 1961 | Trustee and President | Mr. Burke was elected as Trustee of the Trust and President of the Trust at the December 11, 2017 meeting of the Board of Trustees. | Mr. Burke is President and a Director of ALPS Holdings, Inc. (“AHI”) (since 2005) and Director of Boston Financial Data Services, Inc. (“BFDS”), ALPS Advisors, Inc. (“AAI”), ALPS Distributors, Inc. (“ADI”), ALPS Fund Services, Inc. (“AFS”) and ALPS Portfolio Solutions Distributor, Inc. (“APSD”) and from 2001-2008, was President of AAI, ADI, AFS and APSD. Because of his positions with AHI, BFDS, AAI, ADI, AFS and APSD, Mr. Burke is deemed an affiliate of the Trust as defined under the 1940 Act. Mr. Burke is Trustee and President of the Clough Global Allocation Fund (Trustee since 2006; President since 2004); Trustee and President of the Clough Global Equity Fund (Trustee since 2006; President since 2005); Trustee and President of the Clough Global Opportunities Fund (since 2006); Trustee of the Liberty All-Star Equity Fund; Director of the Liberty All-Star Growth Fund, Inc. and Trustee and President of Financial Investors Trust (Trustee since 2009; President since 2002). | 36 | Mr. Burke is a Trustee of Clough Global Dividend and Income Fund (1 fund); Clough Global Equity Fund (1 fund); Clough Global Opportunities Fund (1 fund); Clough Funds Trust (1 fund); Liberty All -Star Equity Fund (1 fund); Director of the Liberty All-Star Growth Fund, Inc. (1 fund) and Financial Investors Trust (33 funds). |
| * | The business address of the Trustee is c/o ALPS Advisors, Inc., 1290 Broadway, Suite 1100, Denver, Colorado 80203. |
| ** | This is the period for which the Trustee began serving the Trust. Each Trustee serves an indefinite term, until his successor is elected. |
| *** | The Fund Complex includes all series of the Trust and any other investment companies for which ALPS Advisors, Inc. provides investment advisory services. |
ALPS ETF Trust
| Trustees & Officers | November 30, 2017 (Unaudited) |
OFFICERS
| Name, Address and Year of Birth of Officer | Position(s) Held with Trust | Length of Time Served* | Principal Occupation(s) During Past 5 Years |
Erin D. Nelson, 1977 | Chief Compliance Officer (“CCO”) | Since December 2015 | Erin Nelson became Senior Vice-President and Chief Compliance Officer of ALPS Advisors, Inc. (“AAI”) on July 1, 2015 and prior to that served as Vice President and Deputy Chief Compliance Officer of AAI since January 1, 2015. Prior to January 1, 2015, Ms. Nelson was Vice-President and Assistant General Counsel of ALPS Fund Services, Inc. Because of her position with AAI, Ms. Nelson is deemed an affiliate of the Trust as defined under the 1940 Act. Ms. Nelson is also the CCO of ALPS Variable Investment Trust, Liberty All-Star Growth Fund, Inc., Liberty All- Star Equity Fund, Principal Real Estate Income Fund, RiverNorth Opportunities Fund, Inc. and Red Rocks Capital, LLC. |
Patrick D. Buchanan, 1972 | Treasurer | Since June 2012 | Mr. Buchanan is Vice President of AAI. Mr. Buchanan joined ALPS in 2007 and because of his position with AAI, he is deemed an affiliate of the Trust as defined under the 1940 Act. Mr. Buchanan is also Treasurer of the ALPS Variable Insurance Trust, Principal Real Estate Income Fund, Clough Funds Trust and RiverNorth Opportunities Fund, Inc. |
Andrea E. Kuchli, 1985 | Secretary | Since December 2017 | Ms. Kuchli joined ALPS in 2015 and is currently Vice President and Senior Counsel of ALPS. Prior to joining ALPS, Ms. Kuchli was an Associate with Davis Graham & Stubbs LLP from April 2014 to February 2015, and an Associate with Dechert LLP from 2011 to April 2014. Because of her position with ALPS, Ms. Kuchli is deemed an affiliate of the Trust as defined under the 1940 Act. Ms. Kuchli is also Secretary of ALPS Variable Investment Trust, Elevation ETF Trust and Principal Real Estate Income Fund as well as Assistant Secretary of the James Advantage Funds. |
Sharon Akselrod, 1974 | Assistant Secretary | Since December 2016 | Ms. Akselrod joined ALPS in August 2014 and is currently Senior Investment Company Act Paralegal of ALPS Fund Services, Inc. Prior to joining ALPS, Ms. Akselrod served as Corporate Governance and Regulatory Associate for Nordstrom fsb (2013-2014) and Senior Legal Assistant – Legal Manager for AXA Equitable Life Insurance Company (2008-2013). Because of her position with ALPS, Ms. Akselrod is deemed an affiliate of the Trust as defined under the 1940 Act. Ms. Akselrod is also Assistant Secretary of Financial Investors Trust and Principal Real Estate Income Fund. |
Stephanie G. Danner, 1992 | Assistant Secretary | Since December 2017 | Ms. Danner joined ALPS in September of 2017 and is currently Vice President and Associate Senior Counsel of ALPS. Because of her position with ALPS, Ms. Danner is deemed an affiliate of the Trust as defined under the 1940 Act. |
| * | The business address of each Officer is c/o ALPS Advisors, Inc., 1290 Broadway, Suite 1100, Denver, Colorado 80203. |
| ** | This is the period for which the Officer began serving the Trust. Each Officer serves an indefinite term, until his/her successor is elected. |
The Statement of Additional Information includes additional information about the Fund's Trustees and is available, without charge, upon request by calling (toll-free) 1-866-675-2639.
Intentionally Left Blank
Intentionally Left Blank
TABLE OF CONTENTS
| Performance Overview | 1 |
| Disclosure of Fund Expenses | 5 |
| Report of Independent Registered Public Accounting Firm | 6 |
| Schedule of Investments | 7 |
| Statement of Assets and Liabilities | 12 |
| Statement of Operations | 13 |
| Statements of Changes in Net Assets | 14 |
| Financial Highlights | 15 |
| Notes to Financial Statements | 16 |
| Additional Information | 22 |
| Board Considerations Regarding Approval of Investment Advisory Agreement | 24 |
| Trustees & Officers | 25 |
Barron’s 400SM ETF
| Performance Overview | November 30, 2017 (Unaudited) |
Investment Objective
The Barron’s 400SM ETF (the “Fund”) seeks investment results that correspond generally, before fees and expenses, to the performance of the Barron’s 400 IndexSM (the “Underlying Index”). The Underlying Index is a rules-based index intended to give investors a means of tracking the overall performance of high performing equity securities of U.S. companies. The Fund will invest at least 80% of its total assets in the equity securities which comprise the Underlying Index.
The Underlying Index generally consists of 400 stocks. The Underlying Index’s stocks are constituents of the MarketGrader U.S. Coverage Universe. In compiling the Underlying Index, MarketGrader Capital, LLC (the “Index Provider”) selects the 400 stocks from the MarketGrader U.S. Coverage Universe by using a methodology that selects components based on the strength of their fundamentals in growth, value, profitability and cash flow and then screens such potential Underlying Index components for certain criteria regarding concentration, market capitalization and liquidity. The eligible stocks that are selected for inclusion in the Underlying Index’s portfolio are equally weighted. The Underlying Index is rebalanced by the Index Provider semiannually, on the third Friday of March and September each year.
Performance Overview
In yet another year in which large cap equities significantly outperformed small caps1, the Barron’s 400SM ETF (the “Fund”) delivered a strong performance and gained 20.9% (total return) during its fiscal year ended November 30th. The reference to the large cap vs. small cap divergence in returns is worth making considering that the Fund’s underlying benchmark, the Barron’s 400 IndexSM (B400), is weighted equally across its 400 constituents, which lessens the impact of positive returns by large companies relative to smaller ones. The Fund nevertheless did fairly well relative to broad market cap weighted benchmarks, barely trailing the Dow Jones U.S. Total Stock Market Index (DWCFT), the broadest measure of the U.S. equity market, by 140 basis points2. The Fund also trailed its benchmark, the Barron’s 400 IndexSM (B400), which gained 21.9% during the same time period.
The Barron’s 400SM ETF (BFOR) has now risen 71.3% since its inception on June 3, 2013 compared to the 76.8% total return delivered by Underlying Index in the same period. This equates to an average annual return of 12.6% for the Fund and 13.4% for the Underlying Index.
During the most recent fiscal year ended November 30, 2017, a total of 722 stocks were members of the Barron’s 400 Index, which rebalances semi-annually in March and September. Of these, 499 stocks had a net positive return during the index’s fiscal year while 223 had a net negative return. The fact that the number of total stocks in the index during a single fiscal year is higher than its 400-constituent cap is explained by the fact that each fiscal year includes stocks from three selection periods (in the most recent year’s case these included the selections from September 2016, March 2017 and September 2017). A total of 158 stocks were selected in all three periods, with 76.6% of them delivering a positive return; those selected in two of the three periods totaled 220 stocks, with 72.7% of them earning a positive return and, lastly, 344 stocks were selected during only one rebalance period with 63.4% of them delivering a positive return during the period of time they belonged in the index.
The sector with the biggest number of stocks with a positive return contribution during the year was Financials, where 115 stocks rose compared to only 32 that fell. This was followed by Industrials with 98 gainers and 40 losers and Technology with 90 stocks that gained and 30 that lost ground. Figure 1 illustrates the number of stocks that rose and fell during the latest fiscal year in each sector.
Figure 1. Number of Stocks with Positive and Negative Returns, by Sector, In the Underlying Index During Fiscal Year 20173
| Sector | Positive | Negative | Sector | Positive | Negative |
| Consumer Discretionary | 79 | 49 | Industrials | 98 | 40 |
| Consumer Staples | 23 | 10 | Materials | 21 | 11 |
| Energy | 19 | 20 | Technology | 90 | 30 |
| Financials | 115 | 32 | Telecommunications | 5 | 1 |
| Health Care | 47 | 29 | Utilities | 2 | 1 |
The 499 stocks that had a positive return during the recently ended fiscal year gained, on average, 22.4%, while the 223 that fell, did so by an average of 12.0% (with both figures based on price returns only, excluding dividends). Figure 2 illustrates the top and bottom 10 performers in the Underlying Index in fiscal year 2017, for the period of time during which the index held each stock.
| 1 | The comparison between large and small cap stocks is based on a cumulative total return of 22.6% for the Russell 1000 Total Return Index (RU10INTR) vs. 18.3% for the Russell 2000 Total Return Index (RU20INTR). Source: Bloomberg. |
| 2 | Based on a cumulative total return of 21.9% for the Barron’s 400 Index (B400T) vs. 22.3% for the Dow Jones U.S. Total Stock Market Index (DWCFT). Source: Bloomberg. |
| 3 | Based on cumulative price return for every stock while they were members of the Barron’s 400 Index between December 1, 2016 and November 30, 2017. Sources: FactSet and MarketGrader Research. |
Barron’s 400SM ETF
| Performance Overview | November 30, 2017 (Unaudited) |
Figure 2. Top and Bottom 10 Performing Stocks In the Underlying Index During Fiscal Year 20174
Top Ten Performing Stocks
| Name | Ticker | Sector | Return (%) |
| Universal Display Corp. | OLED | Technology | 231.2 |
| Align Technology, Inc. | ALGN | Health Care | 180.4 |
| Arista Networks, Inc. | ANET | Technology | 145.9 |
| IPG Photonics Corp. | IPGP | Technology | 138.7 |
| Coherent, Inc. | COHR | Technology | 123.7 |
| NVR, Inc. | NVR | Consumer Discretionary | 117.9 |
| NVIDIA Corp. | NVDA | Technology | 117.7 |
| National Beverage Corp. | FIZZ | Consumer Staples | 116.1 |
| LGI Homes, Inc. | LGIH | Consumer Discretionary | 115.0 |
| OraSure Technologies, Inc. | OSUR | Health Care | 96.3 |
Bottom Ten Performing Stocks
| Name | Ticker | Sector | Return (%) |
| Tahoe Resources Inc. | TAHO | Materials | -54.0 |
| Francesca’s Holdings Corp. | FRAN | Consumer Discretionary | -53.6 |
| Greenhill & Co., Inc. | GHL | Financials | -52.7 |
| Sportman’s Warehouse Holdings, Inc. | SPWH | Consumer Discretionary | -49.3 |
| Foot Locker, Inc. | FL | Consumer Discretionary | -49.5 |
| MeetMe, Inc. | MEET | Technology | -47.3 |
| Duluth Holdings, Inc. | DLTH | Consumer Discretionary | -43.8 |
| American Outdoor Brands Corp. | AOBC | Industrials | -39.9 |
| Hudson Technologies, Inc. | HDSN | Industrials | -38.9 |
| Chuy’s Holdings, Inc. | CHUY | Consumer Discretionary | -37.0 |
| 4 | Based on cumulative price return for every stock while they were members of the Underlying Index between December 1, 2016 and November 30, 2017. Sources: FactSet and MarketGrader Research. |
Barron’s 400SM ETF
| Performance Overview | November 30, 2017 (Unaudited) |
Performance (as of November 30, 2017)
| | 1 Year | 3 Year | Since Inception^ |
| Barron’s 400SM ETF – NAV | 21.87% | 10.36% | 12.60% |
| Barron’s 400SM ETF – Market Price* | 21.87% | 10.36% | 12.60% |
| Barron’s 400 IndexSM | 22.59% | 11.08% | 13.35% |
Total Expense Ratio (per the current prospectus) 0.65%
Performance data quoted represents past performance. Past performance does not guarantee future results. The table does not reflect the deduction of taxes that a shareholder would pay on Fund distributions or the redemption of Fund shares. Investment return and principal value of an investment will fluctuate so that an investor’s shares, when sold or redeemed, may be worth more or less than the original cost. Current performance data may be higher or lower than actual data quoted. For the most current month-end performance data please visit www.alpsfunds.com or call 1.855.724.0450.
NAV is an exchange-traded fund’s per-share value. The per-share dollar amount of the Fund is derived by dividing the total value of all the securities in its portfolio, less any liabilities, by the number of Fund shares outstanding. Market Price is the price at which a share can currently be traded in the market. Information detailing the number of days the Market Price of the Fund was greater than the Fund’s NAV and the number of days it was less than the Fund’s NAV can be obtained at www.alpsfunds.com.
| ^ | The Fund commenced Investment Operations on June 4, 2013. |
| * | Market Price is based on the midpoint of the bid/ask spread at 4 p.m. ET and does not represent the returns an investor would receive if shares were traded at other times. |
The Barron’s 400 IndexSM, calculated by NYSE Arca or its affiliates, measures the performance of a diversified group of U.S. companies selected in part based on fundamentals-related rules-based criteria. The index includes companies that have scored highest according to fundamentals-related rankings calculated by MarketGrader Capital, LLC. Additional rules-based screening provides for sector and market cap diversification. The Underlying Index has been licensed by MarketGrader for use with the Barron’s 400SM ETF.
The index is not actively managed and does not reflect any deductions for fees, expenses or taxes. One cannot invest directly in an index. Index performance does not reflect Fund performance.
Funds that emphasize investments in small/mid cap companies will generally experience greater price volatility.
Barron’s 400SM ETF shares are not individually redeemable. Investors buy and sell shares of the Barron’s 400SM ETF on a secondary market. Only market makers or “authorized participants” may trade directly with the Fund, typically in blocks of 50,000 shares.
The Barron’s 400SM ETF is not suitable for all investors. Investments in the Fund are subject to investment risks, including possible loss of the principal amount invested.
ALPS Portfolio Solutions Distributor, Inc., a FINRA member, is the distributor for the Fund.
Barron’s 400SM ETF
| Performance Overview | November 30, 2017 (Unaudited) |
Top 10 Holdings* (as of November 30, 2017)
| Andeavor Logistics LP | 0.42% |
| PacWest Bancorp | 0.40% |
| LGI Homes, Inc. | 0.35% |
| Trex Co., Inc. | 0.34% |
| Insperity, Inc. | 0.33% |
| Winnebago Industries, Inc. | 0.33% |
| NetApp, Inc. | 0.32% |
| Axcelis Technologies, Inc. | 0.32% |
| Align Technology, Inc. | 0.32% |
| Thor Industries, Inc. | 0.32% |
| Total % of Top 10 Holdings | 3.45% |
| * | % of Total Investments excluding Short Term Investments. |
Sector Allocation* (as of November 30, 2017)
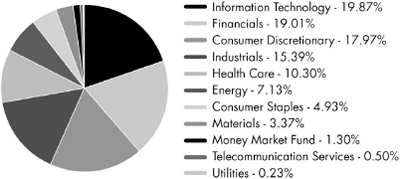
Future holdings are subject to change.
Growth of $10,000 (as of November 30, 2017)
Comparison of change in value of a $10,000 investment in the Fund and the Underlying Index
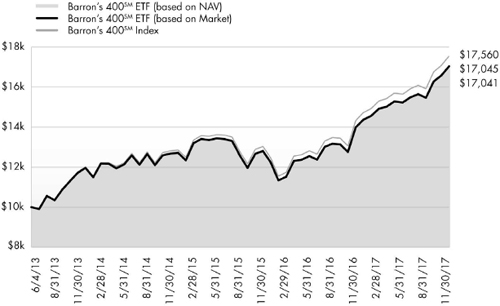
The chart above represents historical performance of a hypothetical investment of $10,000 in the Fund over the life of the Fund. Past performance does not guarantee future results. This chart does not reflect the deduction of taxes that a shareholder would pay on Fund distributions or the redemption of Fund shares.
Barron’s 400SM ETF
| Disclosure of Fund Expenses | November 30, 2017 (Unaudited) |
Shareholder Expense Example: As a shareholder of the Fund, you incur two types of costs: (1) transaction costs which may include creation and redemption fees or brokerage charges, and (2) ongoing costs, including management fees and other Fund expenses. These examples are intended to help you understand your ongoing costs (in dollars) of investing in the Fund and to compare these costs with the ongoing costs of investing in other funds. It is based on an investment of $1,000 invested at the beginning of the (six month) period and held through November 30, 2017.
Actual Return: The first line of the table provides information about actual account values and actual expenses. You may use the information in this line, together with the amount you invested, to estimate the expenses that you incurred over the period. Simply divide your account value by $1,000 (for example, an $8,600 account value divided by $1,000 = 8.6), then multiply the result by the number in the first line under the heading entitled “Expenses Paid During Period” to estimate the expenses attributable to your investment during this period.
Hypothetical 5% Return: The second line of the table provides information about hypothetical account values and hypothetical expenses based on the Fund’s actual expense ratio and an assumed rate of return of 5% per year before expenses, which is not the Fund’s actual return. The hypothetical account values and expenses may not be used to estimate the actual ending account balance or expenses you paid for the period. You may use this information to compare ongoing costs of investing in the Fund and other funds. To do so, compare this 5% hypothetical example with the 5% hypothetical examples that appear in the shareholder reports of other funds.
The expenses shown in the table are meant to highlight ongoing Fund costs only and do not reflect any transaction costs, such as creation and redemption fees or brokerage charges. Therefore, the second line is useful in comparing ongoing costs only, and will not help you determine the relative total costs of owning different funds. In addition, if these costs were included, your costs would have been higher.
| | Beginning Account Value 6/1/17 | Ending Account Value 11/30/17 | Expense Ratio(a) | Expenses Paid During Period 6/1/17 - 11/30/17(b) |
| Actual | $1,000.00 | $1,118.80 | 0.65% | $3.45 |
| Hypothetical (5% return before expenses) | $1,000.00 | $1,021.81 | 0.65% | $3.29 |
| (a) | Annualized, based on the Fund’s most recent fiscal half year expenses. |
| (b) | Expenses are equal to the Fund’s annualized expense ratio multiplied by the average account value over the period, multiplied by the number of days in the most recent fiscal half year (183), divided by 365. |
Barron’s 400SM ETF
| Report of Independent Registered Public Accounting Firm | |
To the Board of Trustees and Shareholders of ALPS ETF Trust:
We have audited the accompanying statement of assets and liabilities, including the schedule of investments, of Barron’s 400SM ETF, one of the portfolios constituting the ALPS ETF Trust (the “Trust”), as of November 30, 2017, and the related statement of operations for the year then ended, the statements of changes in net assets for each of the two years in the period then ended, and the financial highlights for each of the periods presented. These financial statements and financial highlights are the responsibility of the Trust’s management. Our responsibility is to express an opinion on these financial statements and financial highlights based on our audits.
We conducted our audits in accordance with the standards of the Public Company Accounting Oversight Board (United States). Those standards require that we plan and perform the audit to obtain reasonable assurance about whether the financial statements and financial highlights are free of material misstatement. The Trust is not required to have, nor were we engaged to perform, an audit of its internal control over financial reporting. Our audits included consideration of internal control over financial reporting as a basis for designing audit procedures that are appropriate in the circumstances, but not for the purpose of expressing an opinion on the effectiveness of the Trust’s internal control over financial reporting. Accordingly, we express no such opinion. An audit also includes examining, on a test basis, evidence supporting the amounts and disclosures in the financial statements, assessing the accounting principles used and significant estimates made by management, as well as evaluating the overall financial statement presentation. Our procedures included confirmation of securities owned as of November 30, 2017, by correspondence with the custodian. We believe that our audits provide a reasonable basis for our opinion.
In our opinion, the financial statements and financial highlights referred to above present fairly, in all material respects, the financial position of Barron’s 400SM ETF of the ALPS ETF Trust as of November 30, 2017, the results of its operations for the year then ended, the changes in its net assets for each of the two years in the period then ended, and the financial highlights for each of the periods presented, in conformity with accounting principles generally accepted in the United States of America.
DELOITTE & TOUCHE LLP
Denver, Colorado
January 26, 2018
Barron’s 400SM ETF
| Schedule of Investments | November 30, 2017 |
| Security Description | | Shares | | | Value | |
| COMMON STOCKS (93.73%) | | | | | | | | |
| Consumer Discretionary (17.96%) | | | | | | | | |
| Adtalem Global Education, Inc.(a) | | | 13,637 | | | $ | 565,254 | |
| AMC Networks, Inc., Class A(a) | | | 8,336 | | | | 429,637 | |
| American Outdoor Brands Corp.(a) | | | 33,581 | | | | 471,141 | |
| Big Lots, Inc. | | | 9,720 | | | | 574,452 | |
| Callaway Golf Co. | | | 33,606 | | | | 487,623 | |
| Capella Education Co. | | | 6,984 | | | | 595,735 | |
| Carter's, Inc. | | | 5,112 | | | | 553,732 | |
| Children's Place, Inc. | | | 4,072 | | | | 541,169 | |
| Columbia Sportswear Co. | | | 8,030 | | | | 564,589 | |
| Comcast Corp., Class A | | | 12,412 | | | | 465,947 | |
| Cooper-Standard Holding, Inc.(a) | | | 4,621 | | | | 582,569 | |
| Cracker Barrel Old Country Store, Inc.(b) | | | 3,170 | | | | 495,566 | |
| Dana, Inc. | | | 18,880 | | | | 623,795 | |
| Dave & Buster's Entertainment, Inc.(a) | | | 9,221 | | | | 488,990 | |
| Dollar General Corp. | | | 6,112 | | | | 538,345 | |
| Dollar Tree, Inc.(a) | | | 5,600 | | | | 575,456 | |
| Dorman Products, Inc.(a) | | | 6,862 | | | | 468,743 | |
| Five Below, Inc.(a) | | | 9,348 | | | | 577,706 | |
| Fox Factory Holding Corp.(a) | | | 11,544 | | | | 450,216 | |
| Francesca's Holdings Corp.(a) | | | 66,176 | | | | 491,026 | |
| The Gap, Inc. | | | 17,043 | | | | 550,659 | |
| Gentex Corp. | | | 24,857 | | | | 509,071 | |
| Grand Canyon Education, Inc.(a) | | | 5,729 | | | | 544,026 | |
| Gray Television, Inc.(a) | | | 34,219 | | | | 492,754 | |
| Hanesbrands, Inc.(b) | | | 18,378 | | | | 383,916 | |
| Hasbro, Inc. | | | 4,957 | | | | 461,100 | |
| Home Depot, Inc. | | | 2,941 | | | | 528,851 | |
| Hooker Furniture Corp. | | | 10,826 | | | | 541,300 | |
| Installed Building Products, Inc.(a) | | | 8,083 | | | | 622,795 | |
| iRobot Corp.(a)(b) | | | 4,665 | | | | 320,112 | |
| Johnson Outdoors, Inc., Class A | | | 7,282 | | | | 532,605 | |
| Las Vegas Sands Corp. | | | 7,295 | | | | 505,471 | |
| LCI Industries | | | 4,548 | | | | 595,333 | |
| Lear Corp. | | | 3,021 | | | | 546,469 | |
| LGI Homes, Inc.(a)(b) | | | 10,293 | | | | 722,672 | |
| Liberty Expedia Holdings, Inc., Class A(a) | | | 8,783 | | | | 395,938 | |
| Lowe's Cos., Inc. | | | 5,978 | | | | 498,386 | |
| Malibu Boats, Inc., Class A(a) | | | 17,447 | | | | 545,393 | |
| Marriott International, Inc., Class A | | | 4,478 | | | | 568,706 | |
| MCBC Holdings, Inc.(a) | | | 25,840 | | | | 609,824 | |
| Meredith Corp. | | | 8,516 | | | | 580,365 | |
| Mohawk Industries, Inc.(a) | | | 1,813 | | | | 512,372 | |
| Motorcar Parts of America, Inc.(a) | | | 17,687 | | | | 460,923 | |
| New York Times Co., Class A | | | 24,566 | | | | 461,841 | |
| Nexstar Media Group, Inc., Class A | | | 8,001 | | | | 543,268 | |
| NIKE, Inc., Class B | | | 8,811 | | | | 532,361 | |
| Norwegian Cruise Line Holdings, Ltd.(a) | | | 8,226 | | | | 445,520 | |
| Nutrisystem, Inc. | | | 8,987 | | | | 456,090 | |
| NVR, Inc.(a) | | | 166 | | | | 576,850 | |
| O'Reilly Automotive, Inc.(a) | | | 2,360 | | | | 557,456 | |
| Papa John's International, Inc. | | | 6,278 | | | | 367,012 | |
| PetMed Express, Inc. | | | 12,289 | | | | 483,572 | |
| Priceline Group, Inc.(a) | | | 249 | | | | 433,188 | |
| Security Description | | Shares | | | Value | |
| Consumer Discretionary (continued) | | | | | | | | |
| Ross Stores, Inc. | | | 7,758 | | | $ | 589,841 | |
| Royal Caribbean Cruises, Ltd. | | | 3,867 | | | | 479,044 | |
| Ruth's Hospitality Group, Inc. | | | 23,644 | | | | 507,164 | |
Scripps Networks Interactive, Inc.,
Class A | | | 5,521 | | | | 451,839 | |
| Shake Shack, Inc., Class A(a)(b) | | | 15,027 | | | | 617,610 | |
| Signet Jewelers, Ltd.(b) | | | 6,887 | | | | 360,121 | |
| Sinclair Broadcast Group, Inc., Class A | | | 16,392 | | | | 558,148 | |
| Sleep Number Corp.(a) | | | 15,991 | | | | 562,723 | |
| Steven Madden, Ltd.(a) | | | 11,255 | | | | 481,151 | |
| Sturm Ruger & Co., Inc.(b) | | | 10,040 | | | | 549,690 | |
| Thor Industries, Inc. | | | 4,248 | | | | 652,280 | |
| TJX Cos., Inc. | | | 6,396 | | | | 483,218 | |
| TopBuild Corp.(a) | | | 7,921 | | | | 538,549 | |
| Tractor Supply Co. | | | 7,626 | | | | 520,398 | |
| Ulta Beauty, Inc.(a) | | | 2,073 | | | | 459,605 | |
| Visteon Corp.(a) | | | 3,941 | | | | 518,990 | |
| Williams-Sonoma, Inc. | | | 9,565 | | | | 489,345 | |
| Winnebago Industries, Inc. | | | 12,365 | | | | 676,984 | |
| Total Consumer Discretionary | | | | | | | 36,924,590 | |
| | | | | | | | | |
| Consumer Staples (4.93%) | | | | | | | | |
| Altria Group, Inc. | | | 7,528 | | | | 510,624 | |
| Blue Buffalo Pet Products, Inc.(a) | | | 18,293 | | | | 561,778 | |
| Boston Beer Co., Inc., Class A(a) | | | 3,047 | | | | 548,003 | |
| Central Garden & Pet Co., Class A(a) | | | 13,633 | | | | 525,825 | |
| Constellation Brands, Inc., Class A | | | 2,300 | | | | 500,457 | |
| Energizer Holdings, Inc. | | | 10,216 | | | | 469,221 | |
| Estee Lauder Cos., Inc., Class A | | | 4,319 | | | | 539,141 | |
| Ingredion, Inc. | | | 3,773 | | | | 522,485 | |
| Inter Parfums, Inc. | | | 11,614 | | | | 514,500 | |
| Medifast, Inc. | | | 8,519 | | | | 583,807 | |
| MGP Ingredients, Inc. | | | 8,059 | | | | 599,187 | |
| Molson Coors Brewing Co., Class B | | | 5,245 | | | | 409,634 | |
| Monster Beverage Corp.(a) | | | 8,389 | | | | 525,739 | |
| National Beverage Corp. | | | 3,856 | | | | 420,767 | |
| Omega Protein Corp. | | | 29,042 | | | | 637,472 | |
| Pilgrim's Pride Corp.(a) | | | 16,230 | | | | 595,154 | |
| Sanderson Farms, Inc. | | | 3,076 | | | | 521,966 | |
| Sprouts Farmers Market, Inc.(a) | | | 24,056 | | | | 562,429 | |
| USANA Health Sciences, Inc.(a) | | | 8,141 | | | | 583,710 | |
| Total Consumer Staples | | | | | | | 10,131,899 | |
| | | | | | | | | |
| Energy (2.67%) | | | | | | | | |
| BP Prudhoe Bay Royalty Trust(b) | | | 23,005 | | | | 470,452 | |
| Callon Petroleum Co.(a) | | | 44,935 | | | | 496,082 | |
| Cimarex Energy Co. | | | 4,644 | | | | 539,215 | |
| Devon Energy Corp. | | | 14,625 | | | | 563,501 | |
| Diamondback Energy, Inc.(a) | | | 5,202 | | | | 568,631 | |
| Gulfport Energy Corp.(a) | | | 35,970 | | | | 460,416 | |
| Laredo Petroleum, Inc.(a) | | | 38,567 | | | | 412,281 | |
| Matador Resources Co.(a) | | | 20,213 | | | | 578,092 | |
| Midstates Petroleum Co., Inc.(a) | | | 29,259 | | | | 485,992 | |
| Penn Virginia Corp(a) | | | 12,067 | | | | 414,019 | |
| SRC Energy, Inc.(a) | | | 58,520 | | | | 512,635 | |
| Total Energy | | | | | | | 5,501,316 | |
Barron��s 400SM ETF
| Schedule of Investments | November 30, 2017 |
| Security Description | | Shares | | | Value | |
| Financials (18.54%) | | | | | | |
| American Financial Group, Inc. | | | 4,693 | | | $ | 493,047 | |
| Ameris Bancorp | | | 10,878 | | | | 539,549 | |
| Athene Holding, Ltd., Class A(a) | | | 8,874 | | | | 426,573 | |
| B. Riley Financial, Inc. | | | 27,838 | | | | 501,084 | |
| Bancfirst Corp. | | | 9,161 | | | | 520,345 | |
| Bank of Hawaii Corp. | | | 5,993 | | | | 508,686 | |
| The Bank of NT Butterfield & Son, Ltd. | | | 14,106 | | | | 561,137 | |
| Bank of the Ozarks | | | 10,781 | | | | 519,860 | |
| Banner Corp. | | | 8,359 | | | | 481,395 | |
| BB&T Corp. | | | 10,505 | | | | 519,157 | |
| Beneficial Bancorp, Inc. | | | 30,751 | | | | 521,229 | |
| BofI Holding, Inc.(a)(b) | | | 18,164 | | | | 502,053 | |
| Carolina Financial Corp. | | | 13,855 | | | | 535,496 | |
| Cathay General Bancorp | | | 12,900 | | | | 559,731 | |
| Citizens Financial Group, Inc. | | | 13,645 | | | | 555,351 | |
| Cohen & Steers, Inc. | | | 12,408 | | | | 577,965 | |
| Comerica, Inc. | | | 6,798 | | | | 566,341 | |
| Credit Acceptance Corp.(a)(b) | | | 1,754 | | | | 531,287 | |
| Cullen/Frost Bankers, Inc. | | | 5,288 | | | | 520,392 | |
| Customers Bancorp, Inc.(a) | | | 16,398 | | | | 444,386 | |
| Diamond Hill Investment Group, Inc. | | | 2,400 | | | | 506,544 | |
| Discover Financial Services | | | 8,113 | | | | 572,778 | |
| Eagle Bancorp, Inc.(a) | | | 7,409 | | | | 490,105 | |
| East West Bancorp, Inc. | | | 8,313 | | | | 511,582 | |
| Essent Group, Ltd.(a) | | | 12,061 | | | | 533,699 | |
| Evercore Partners, Inc., Class A | | | 6,497 | | | | 564,264 | |
| FactSet Research Systems, Inc. | | | 2,918 | | | | 583,250 | |
| FCB Financial Holdings, Inc., Class A(a) | | | 10,753 | | | | 568,296 | |
| Federated Investors, Inc., Class B | | | 17,076 | | | | 573,071 | |
| First Financial Bankshares, Inc. | | | 11,731 | | | | 556,636 | |
| First Merchants Corp. | | | 12,051 | | | | 527,834 | |
| Franklin Financial Network, Inc.(a) | | | 13,838 | | | | 483,638 | |
| Glacier Bancorp, Inc. | | | 14,092 | | | | 564,385 | |
| Guaranty Bancorp | | | 18,029 | | | | 523,742 | |
| Hanmi Financial Corp. | | | 17,170 | | | | 545,148 | |
Health Insurance Innovations, Inc.,
Class A(a)(b) | | | 23,822 | | | | 556,244 | |
| Heritage Financial Corp. | | | 17,491 | | | | 569,332 | |
| Home BancShares, Inc. | | | 20,967 | | | | 499,015 | |
| Houlihan Lokey, Inc. | | | 12,736 | | | | 568,535 | |
| Independent Bank Group, Inc. | | | 8,354 | | | | 575,591 | |
| JPMorgan Chase & Co. | | | 5,178 | | | | 541,205 | |
| Lakeland Bancorp, Inc. | | | 25,501 | | | | 532,971 | |
| Lakeland Financial Corp. | | | 10,720 | | | | 543,290 | |
| Lazard, Ltd., Class A | | | 11,320 | | | | 557,510 | |
| LegacyTexas Financial Group, Inc. | | | 12,539 | | | | 525,008 | |
| MainSource Financial Group, Inc. | | | 13,992 | | | | 553,384 | |
| Meridian Bancorp, Inc. | | | 25,643 | | | | 516,706 | |
| Moelis & Co., Class A | | | 11,819 | | | | 566,130 | |
| Morningstar, Inc. | | | 5,737 | | | | 529,525 | |
| New Residential Investment Corp., REIT | | | 28,481 | | | | 503,829 | |
| OceanFirst Financial Corp. | | | 18,856 | | | | 523,254 | |
| PacWest Bancorp | | | 17,082 | | | | 814,128 | |
| Park Sterling Corp. | | | 40,912 | | | | 526,537 | |
| Preferred Bank | | | 8,944 | | | | 559,894 | |
| Security Description | | Shares | | | Value | |
| Financials (continued) | | | | | | | | |
| Provident Financial Services, Inc. | | | 19,012 | | | $ | 519,788 | |
| S&P Global, Inc. | | | 3,063 | | | | 506,865 | |
| S&T Bancorp, Inc. | | | 12,833 | | | | 535,906 | |
| Sandy Spring Bancorp, Inc. | | | 12,232 | | | | 481,818 | |
| ServisFirst Bancshares, Inc. | | | 13,563 | | | | 569,510 | |
| State Bank Financial Corp. | | | 17,332 | | | | 527,586 | |
| SunTrust Banks, Inc. | | | 8,611 | | | | 530,696 | |
| Synovus Financial Corp. | | | 10,905 | | | | 541,215 | |
| T Rowe Price Group, Inc. | | | 5,544 | | | | 570,588 | |
| Texas Pacific Land Trust | | | 1,243 | | | | 506,846 | |
| TriCo Bancshares | | | 13,246 | | | | 556,729 | |
| TrustCo Bank Corp. | | | 59,180 | | | | 553,333 | |
| United Community Banks, Inc. | | | 17,970 | | | | 516,458 | |
| Walker & Dunlop, Inc.(a) | | | 9,945 | | | | 490,090 | |
| Western Alliance Bancorp(a) | | | 9,869 | | | | 574,178 | |
| Wintrust Financial Corp. | | | 6,538 | | | | 548,211 | |
| Zions Bancorporation | | | 10,857 | | | | 537,964 | |
| Total Financials | | | | | | | 38,119,905 | |
| | | | | | | | | |
| Health Care (10.29%) | | | | | | | | |
| AbbVie, Inc. | | | 5,363 | | | | 519,782 | |
| ABIOMED, Inc.(a) | | | 2,980 | | | | 580,623 | |
| Alexion Pharmaceuticals, Inc.(a) | | | 3,265 | | | | 358,530 | |
| Align Technology, Inc.(a) | | | 2,532 | | | | 660,548 | |
| Amgen, Inc. | | | 2,462 | | | | 432,475 | |
| AMN Healthcare Services, Inc.(a) | | | 12,235 | | | | 614,197 | |
| Anika Therapeutics, Inc.(a) | | | 8,398 | | | | 462,898 | |
| Biogen, Inc.(a) | | | 1,429 | | | | 460,381 | |
| BioTelemetry, Inc.(a) | | | 12,429 | | | | 360,441 | |
| Bioverativ, Inc.(a) | | | 8,235 | | | | 411,915 | |
| Bristol-Myers Squibb Co. | | | 7,463 | | | | 471,587 | |
| Bruker Corp. | | | 15,660 | | | | 550,919 | |
| Cambrex Corp.(a) | | | 9,217 | | | | 450,250 | |
| Celgene Corp.(a) | | | 3,310 | | | | 333,747 | |
| Cerner Corp.(a) | | | 6,628 | | | | 468,533 | |
| Charles River Laboratories International, Inc.(a) | | | 4,304 | | | | 448,477 | |
| Corcept Therapeutics, Inc.(a) | | | 26,212 | | | | 470,243 | |
| Eagle Pharmaceuticals, Inc.(a) | | | 7,794 | | | | 460,314 | |
| Edwards Lifesciences Corp.(a) | | | 4,104 | | | | 480,989 | |
| Emergent BioSolutions, Inc.(a) | | | 12,225 | | | | 537,044 | |
| Enzo Biochem, Inc.(a) | | | 42,771 | | | | 419,584 | |
| Exelixis, Inc.(a) | | | 17,456 | | | | 472,708 | |
| Gilead Sciences, Inc. | | | 5,568 | | | | 416,375 | |
| Globus Medical, Inc., Class A(a) | | | 15,299 | | | | 581,515 | |
| HealthEquity, Inc.(a) | | | 10,355 | | | | 537,114 | |
| Heska Corp.(a) | | | 4,836 | | | | 415,074 | |
| Illumina, Inc.(a) | | | 2,200 | | | | 506,066 | |
| Innoviva, Inc.(a) | | | 33,949 | | | | 445,411 | |
| Intuitive Surgical, Inc.(a) | | | 1,344 | | | | 537,304 | |
| Johnson & Johnson | | | 3,546 | | | | 494,064 | |
| LeMaitre Vascular, Inc. | | | 12,307 | | | | 405,270 | |
| LHC Group, Inc.(a) | | | 7,222 | | | | 474,991 | |
| Masimo Corp.(a) | | | 5,393 | | | | 479,114 | |
| OraSure Technologies, Inc.(a) | | | 21,720 | | | | 359,466 | |
| PDL BioPharma, Inc.(a) | | | 146,120 | | | | 425,209 | |
| Phibro Animal Health Corp., Class A | | | 12,873 | | | | 446,693 | |
| Prestige Brands Holdings, Inc.(a) | | | 9,331 | | | | 421,761 | |
Barron’s 400SM ETF
| Schedule of Investments | November 30, 2017 |
| Security Description | | Shares | | | Value | |
| Health Care (continued) | | | | | | | | |
| R1 RCM, Inc.(a) | | | 148,425 | | | $ | 575,889 | |
| Regeneron Pharmaceuticals, Inc.(a) | | | 1,057 | | | | 382,486 | |
| Stryker Corp. | | | 3,278 | | | | 511,368 | |
| Supernus Pharmaceuticals, Inc.(a) | | | 9,734 | | | | 367,945 | |
| Tivity Health, Inc.(a) | | | 12,141 | | | | 446,789 | |
| Veeva Systems, Inc., Class A(a) | | | 8,209 | | | | 494,264 | |
| Waters Corp.(a) | | | 2,476 | | | | 488,193 | |
| Zoetis, Inc. | | | 7,193 | | | | 519,982 | |
| Total Health Care | | | | | | | 21,158,528 | |
| | | | | | | | | |
| Industrials (15.38%) | | | | | | | | |
| AAON, Inc. | | | 14,725 | | | | 536,726 | |
| Acuity Brands, Inc. | | | 2,577 | | | | 441,749 | |
| Alaska Air Group, Inc. | | | 6,166 | | | | 426,502 | |
| Allegiant Travel Co. | | | 3,966 | | | | 602,832 | |
| Allison Transmission Holdings, Inc. | | | 13,592 | | | | 557,816 | |
| American Woodmark Corp.(a) | | | 5,236 | | | | 521,506 | |
| AO Smith Corp. | | | 8,087 | | | | 512,878 | |
| Apogee Enterprises, Inc. | | | 10,451 | | | | 522,864 | |
| Applied Industrial Technologies, Inc. | | | 7,957 | | | | 508,850 | |
| Argan, Inc. | | | 7,667 | | | | 452,353 | |
| Armstrong World Industries, Inc.(a) | | | 9,639 | | | | 577,858 | |
| Barnes Group, Inc. | | | 7,319 | | | | 485,030 | |
| Brady Corp., Class A | | | 12,924 | | | | 505,328 | |
| Builders FirstSource, Inc.(a) | | | 27,693 | | | | 564,937 | |
| Copart, Inc.(a) | | | 14,535 | | | | 627,331 | |
| Deluxe Corp. | | | 6,691 | | | | 475,730 | |
| Dycom Industries, Inc.(a) | | | 5,930 | | | | 636,704 | |
| Exponent, Inc. | | | 6,716 | | | | 507,058 | |
| Fastenal Co. | | | 10,805 | | | | 566,074 | |
| FedEx Corp. | | | 2,183 | | | | 505,277 | |
| Fortune Brands Home & Security, Inc. | | | 7,188 | | | | 491,803 | |
| Generac Holdings, Inc.(a) | | | 10,834 | | | | 532,708 | |
| Hawaiian Holdings, Inc. | | | 11,882 | | | | 512,708 | |
| Healthcare Services Group, Inc. | | | 9,292 | | | | 482,534 | |
| HEICO Corp., Class A | | | 6,539 | | | | 496,310 | |
| Herman Miller, Inc. | | | 13,637 | | | | 487,523 | |
| Hudson Technologies, Inc.(a) | | | 52,744 | | | | 302,751 | |
| Huntington Ingalls Industries, Inc. | | | 2,204 | | | | 532,641 | |
| Insperity, Inc. | | | 5,811 | | | | 685,117 | |
| JetBlue Airways Corp.(a) | | | 23,784 | | | | 510,642 | |
| Kadant, Inc. | | | 5,224 | | | | 534,415 | |
| Lennox International, Inc. | | | 2,736 | | | | 573,849 | |
| Lincoln Electric Holdings, Inc. | | | 5,267 | | | | 480,034 | |
| Lydall, Inc.(a) | | | 9,895 | | | | 544,720 | |
| Middleby Corp.(a) | | | 3,876 | | | | 494,268 | |
| Nordson Corp. | | | 4,172 | | | | 535,518 | |
| Northrop Grumman Corp. | | | 1,747 | | | | 537,028 | |
| Old Dominion Freight Line, Inc. | | | 4,619 | | | | 596,960 | |
| Oshkosh Corp. | | | 6,176 | | | | 556,087 | |
| Parker-Hannifin Corp. | | | 2,823 | | | | 529,284 | |
| Patrick Industries, Inc.(a) | | | 6,276 | | | | 635,131 | |
| PGT Innovations, Inc.(a) | | | 33,606 | | | | 549,458 | |
| Raven Industries, Inc. | | | 16,002 | | | | 611,276 | |
| Rockwell Automation, Inc. | | | 2,782 | | | | 537,149 | |
| Simpson Manufacturing Co., Inc. | | | 10,186 | | | | 610,854 | |
| Snap-on, Inc. | | | 3,149 | | | | 533,535 | |
| Security Description | | Shares | | | Value | |
| Industrials (continued) | | | | | | | | |
| Spirit Airlines, Inc.(a) | | | 13,488 | | | $ | 574,993 | |
| Teledyne Technologies, Inc.(a) | | | 3,042 | | | | 566,542 | |
| Toro Co. | | | 7,726 | | | | 504,121 | |
| TPI Composites, Inc.(a) | | | 23,222 | | | | 439,825 | |
| Trex Co., Inc.(a) | | | 5,887 | | | | 693,253 | |
| TriNet Group, Inc.(a) | | | 13,296 | | | | 595,129 | |
| Union Pacific Corp. | | | 4,336 | | | | 548,504 | |
| United Rentals, Inc.(a) | | | 3,686 | | | | 587,843 | |
| Universal Forest Products, Inc. | | | 15,888 | | | | 622,174 | |
| Valmont Industries, Inc. | | | 3,156 | | | | 545,357 | |
| Viad Corp. | | | 8,540 | | | | 491,904 | |
| WageWorks, Inc.(a) | | | 8,030 | | | | 515,124 | |
| Woodward, Inc. | | | 6,594 | | | | 510,046 | |
| Total Industrials | | | | | | | 31,624,521 | |
| | | | | | | | | |
| Information Technology (19.86%) | | | | | | | | |
| Acacia Communications, Inc.(a)(b) | | | 10,177 | | | | 393,646 | |
| Adobe Systems, Inc.(a) | | | 3,012 | | | | 546,588 | |
| ADTRAN, Inc. | | | 21,051 | | | | 486,278 | |
| Advanced Energy Industries, Inc.(a) | | | 6,267 | | | | 469,837 | |
| Amphenol Corp., Class A | | | 5,729 | | | | 518,990 | |
| Apple, Inc. | | | 2,922 | | | | 502,146 | |
| Applied Materials, Inc. | | | 10,307 | | | | 543,900 | |
| Applied Optoelectronics, Inc.(a)(b) | | | 8,113 | | | | 354,214 | |
| Arista Networks, Inc.(a) | | | 2,708 | | | | 631,289 | |
| Aspen Technology, Inc.(a) | | | 7,285 | | | | 487,512 | |
| Axcelis Technologies, Inc.(a) | | | 20,773 | | | | 664,736 | |
| Badger Meter, Inc. | | | 10,442 | | | | 484,509 | |
| Broadridge Financial Solutions, Inc. | | | 5,846 | | | | 527,660 | |
| Brooks Automation, Inc. | | | 17,545 | | | | 436,695 | |
| Cabot Microelectronics Corp. | | | 6,474 | | | | 623,576 | |
| Cadence Design Systems, Inc.(a) | | | 12,528 | | | | 550,104 | |
| CEVA, Inc.(a) | | | 11,461 | | | | 544,397 | |
| Cirrus Logic, Inc.(a) | | | 8,255 | | | | 456,006 | |
| Cognex Corp. | | | 4,214 | | | | 583,934 | |
| Cognizant Technology Solutions Corp., Class A | | | 6,461 | | | | 467,001 | |
| Coherent, Inc.(a) | | | 1,839 | | | | 536,914 | |
| CommerceHub, Inc., Series C(a) | | | 21,864 | | | | 469,201 | |
| DST Systems, Inc. | | | 8,931 | | | | 558,902 | |
| Electronic Arts, Inc.(a) | | | 3,905 | | | | 415,297 | |
| Entegris, Inc. | | | 17,427 | | | | 528,038 | |
| ePlus, Inc.(a) | | | 6,003 | | | | 487,444 | |
| EVERTEC, Inc. | | | 24,697 | | | | 343,288 | |
| ExlService Holdings, Inc.(a) | | | 8,290 | | | | 508,840 | |
| F5 Networks, Inc.(a) | | | 4,004 | | | | 537,337 | |
| Fabrinet(a) | | | 12,307 | | | | 392,716 | |
| Facebook, Inc., Class A(a) | | | 2,717 | | | | 481,398 | |
| FleetCor Technologies, Inc.(a) | | | 3,245 | | | | 590,168 | |
| GrubHub, Inc.(a) | | | 8,395 | | | | 567,166 | |
| Ichor Holdings, Ltd.(a) | | | 19,895 | | | | 565,217 | |
| II-VI, Inc.(a) | | | 12,331 | | | | 584,489 | |
| Intel Corp. | | | 13,036 | | | | 584,534 | |
| InterDigital, Inc. | | | 6,686 | | | | 508,805 | |
| Intuit, Inc. | | | 3,306 | | | | 519,769 | |
| IPG Photonics Corp.(a) | | | 2,642 | | | | 604,965 | |
| KEMET Corp.(a) | | | 23,156 | | | | 357,066 | |
| KLA-Tencor Corp. | | | 4,801 | | | | 490,854 | |
Barron’s 400SM ETF
| Schedule of Investments | November 30, 2017 |
| Security Description | | Shares | | | Value | |
| Information Technology (continued) | | | | | | | | |
| Lam Research Corp. | | | 2,739 | | | $ | 526,792 | |
| Littelfuse, Inc. | | | 2,533 | | | | 513,946 | |
| Manhattan Associates, Inc.(a) | | | 11,069 | | | | 490,910 | |
| Mastercard, Inc., Class A | | | 3,305 | | | | 497,303 | |
| Match Group, Inc.(a)(b) | | | 19,905 | | | | 585,207 | |
| Maxim Integrated Products, Inc. | | | 10,088 | | | | 527,905 | |
| MAXIMUS, Inc. | | | 7,407 | | | | 511,676 | |
| The Meet Group, Inc.(a) | | | 117,332 | | | | 298,023 | |
| Microchip Technology, Inc. | | | 5,318 | | | | 462,613 | |
| Micron Technology, Inc.(a) | | | 13,720 | | | | 581,591 | |
| Microsoft Corp. | | | 6,298 | | | | 530,103 | |
| MKS Instruments, Inc. | | | 5,475 | | | | 516,293 | |
| Nanometrics, Inc.(a) | | | 17,875 | | | | 449,735 | |
| NetApp, Inc. | | | 11,784 | | | | 665,914 | |
| NIC, Inc. | | | 28,090 | | | | 466,294 | |
| Novanta, Inc.(a) | | | 11,461 | | | | 551,274 | |
| NVIDIA Corp. | | | 2,774 | | | | 556,770 | |
| Oclaro, Inc.(a)(b) | | | 55,353 | | | | 394,113 | |
| ON Semiconductor Corp.(a) | | | 27,693 | | | | 556,075 | |
| Paychex, Inc. | | | 8,088 | | | | 544,403 | |
| Paycom Software, Inc.(a) | | | 6,294 | | | | 516,108 | |
| Qualys, Inc.(a) | | | 9,241 | | | | 544,295 | |
| Red Hat, Inc.(a) | | | 4,371 | | | | 554,068 | |
| Rogers Corp.(a) | | | 3,796 | | | | 611,536 | |
| Rudolph Technologies, Inc.(a) | | | 20,773 | | | | 504,784 | |
| Silicon Laboratories, Inc.(a) | | | 6,206 | | | | 565,367 | |
| Skyworks Solutions, Inc. | | | 4,400 | | | | 460,856 | |
| Stamps.com, Inc.(a) | | | 2,362 | | | | 397,761 | |
| Take-Two Interactive Software, Inc.(a) | | | 4,705 | | | | 524,843 | |
| Teradyne, Inc. | | | 13,032 | | | | 527,405 | |
| Texas Instruments, Inc. | | | 5,678 | | | | 552,413 | |
| The Trade Desk, Inc., Class A(a)(b) | | | 7,628 | | | | 374,840 | |
| Ubiquiti Networks, Inc.(a)(b) | | | 8,061 | | | | 538,717 | |
| Ultra Clean Holdings, Inc.(a) | | | 19,606 | | | | 411,334 | |
| Universal Display Corp. | | | 3,553 | | | | 643,093 | |
| Vantiv, Inc., Class A(a) | | | 6,489 | | | | 486,675 | |
| Visa, Inc., Class A | | | 4,428 | | | | 498,549 | |
| VMware, Inc., Class A(a)(b) | | | 4,295 | | | | 515,872 | |
| Xcerra Corp.(a) | | | 47,865 | | | | 474,342 | |
| Total Information Technology | | | | | | | 40,835,224 | |
| | | | | | | | | |
| Materials (3.37%) | | | | | | | | |
| Berry Global Group, Inc.(a) | | | 8,253 | | | | 493,282 | |
| Celanese Corp., Series A | | | 4,748 | | | | 509,176 | |
| Chase Corp. | | | 4,801 | | | | 606,366 | |
| Eagle Materials, Inc. | | | 4,588 | | | | 513,535 | |
| Kronos Worldwide, Inc. | | | 21,282 | | | | 593,981 | |
| Louisiana-Pacific Corp.(a) | | | 17,386 | | | | 480,027 | |
| Martin Marietta Materials, Inc. | | | 2,294 | | | | 478,047 | |
| Monsanto Co. | | | 4,003 | | | | 473,715 | |
| Neenah Paper, Inc. | | | 5,933 | | | | 530,410 | |
| Nucor Corp. | | | 8,797 | | | | 505,827 | |
| Packaging Corp. of America | | | 3,979 | | | | 471,909 | |
| Steel Dynamics, Inc. | | | 14,146 | | | | 544,621 | |
| Tahoe Resources, Inc. | | | 76,134 | | | | 335,751 | |
| Security Description | | Shares | | | Value | |
| Materials (continued) | | | | | | | | |
| Worthington Industries, Inc. | | | 9,271 | | | $ | 385,674 | |
| Total Materials | | | | | | | 6,922,321 | |
| | | | | | | | | |
| Telecommunication Services (0.50%) | | | | | | | | |
| ATN International, Inc. | | | 8,601 | | | | 513,996 | |
| Verizon Communications, Inc. | | | 10,054 | | | | 511,648 | |
| Total Telecommunication Services | | | | | | | 1,025,644 | |
| | | | | | | | | |
| Utilities (0.23%) | | | | | | | | |
| National Fuel Gas Co. | | | 8,067 | | | | 474,340 | |
| Total Utilities | | | | | | | 474,340 | |
| | | | | | | | | |
| TOTAL COMMON STOCKS | | | | | | | | |
| (Cost $157,678,879) | | | | | | | 192,718,288 | |
| | | | | | | | | |
| LIMITED PARTNERSHIPS (4.91%) | | | | | | | | |
| Energy (4.45%) | | | | | | | | |
| Andeavor Logistics LP | | | 19,289 | | | | 863,376 | |
| Antero Midstream Partners LP | | | 14,863 | | | | 409,476 | |
| Black Stone Minerals LP | | | 27,545 | | | | 494,708 | |
| Cone Midstream Partners LP | | | 26,156 | | | | 441,513 | |
| Dominion Energy Midstream Partners LP | | | 15,474 | | | | 497,489 | |
| EQT GP Holdings LP | | | 16,392 | | | | 419,143 | |
| EQT Midstream Partners LP | | | 6,264 | | | | 429,836 | |
| Golar LNG Partners LP | | | 21,511 | | | | 430,005 | |
| Magellan Midstream Partners LP | | | 6,714 | | | | 449,838 | |
| MPLX LP | | | 13,728 | | | | 492,286 | |
| Noble Midstream Partners LP | | | 9,976 | | | | 493,313 | |
| PBF Logistics LP | | | 22,296 | | | | 439,231 | |
| Phillips 66 Partners LP | | | 9,921 | | | | 464,898 | |
| Rice Midstream Partners LP | | | 22,471 | | | | 468,071 | |
| Shell Midstream Partners LP | | | 16,874 | | | | 456,442 | |
| Tallgrass Energy Partners LP | | | 10,117 | | | | 444,339 | |
| Valero Energy Partners LP | | | 11,043 | | | | 458,947 | |
| Viper Energy Partners LP | | | 27,596 | | | | 578,964 | |
| Western Gas Equity Partners LP | | | 11,706 | | | | 417,904 | |
| Total Energy | | | | | | | 9,149,779 | |
| | | | | | | | | |
| Financials (0.46%) | | | | | | | | |
Apollo Global Management LLC,
Class A | | | 16,249 | | | | 508,756 | |
| Oaktree Capital Group LLC | | | 10,423 | | | | 446,626 | |
| Total Financials | | | | | | | 955,382 | |
| | | | | | | | | |
| TOTAL LIMITED PARTNERSHIPS | | | | | | | | |
| (Cost $10,365,426) | | | | | | | 10,105,161 | |
Barron’s 400SM ETF
| Schedule of Investments | November 30, 2017 |
| | | 7 Day Yield | | | Shares | | | Value | |
| SHORT TERM INVESTMENTS (3.64%) | | | | | |
| Money Market Fund (1.30%) | | | | | | | | | |
| State Street Institutional Treasury Plus Money Market Fund | | | | | | | | | | | | |
| (Cost $2,681,600) | | | 0.970 | % | | | 2,681,600 | | | $ | 2,681,600 | |
| | | | | | | | | | | | | |
| Investments Purchased With Collateral From Securities Loaned (2.34%) | |
| State Street Navigator Securities Lending Government Money Market Portfolio, 1.04% | | | | | | | | | | | | |
| (Cost $4,811,455) | | | | | | | 4,811,455 | | | $ | 4,811,455 | |
| | | | | | | | | | | | | |
| TOTAL SHORT TERM INVESTMENTS | | | | | |
| (Cost $7,493,055) | | | | | | | | 7,493,055 | |
| | | | | | | | | | | | | |
| TOTAL INVESTMENTS (102.28%) | | | | | |
| (Cost $175,537,360) | | | | | | | | | | $ | 210,316,504 | |
| | | | | | | | | | | | | |
| NET OTHER ASSETS AND LIABILITIES (-2.28%) | | | | (4,715,974 | ) |
| | | | | | | | | | | | | |
| NET ASSETS (100.00%) | | | | | | | $ | 205,600,530 | |
| (a) | Non-income producing security. |
| (b) | Security, or a portion of the security position, is currently on loan. The total market value of securities on loan is $5,901,102. |
See Notes to Financial Statements.
Barron’s 400SM ETF
| Statement of Assets and Liabilities | November 30, 2017 |
| ASSETS: | | | |
| Investments, at value | | $ | 210,316,504 | |
| Foreign tax reclaims | | | 203 | |
| Dividends receivable | | | 201,419 | |
| Total Assets | | | 210,518,126 | |
| | | | | |
| LIABILITIES: | | | | |
| Payable to adviser | | | 106,141 | |
| Payable for collateral upon return of securities loaned | | | 4,811,455 | |
| Total Liabilities | | | 4,917,596 | |
| NET ASSETS | | $ | 205,600,530 | |
| | | | | |
| NET ASSETS CONSIST OF: | | | | |
| Paid-in capital | | $ | 200,752,780 | |
| Accumulated net investment income | | | 1,009,278 | |
| Accumulated net realized loss | | | (30,940,672 | ) |
| Net unrealized appreciation | | | 34,779,144 | |
| NET ASSETS | | $ | 205,600,530 | |
| | | | | |
| INVESTMENTS, AT COST | | $ | 175,537,360 | |
| | | | | |
| PRICING OF SHARES | | | | |
| Net Assets | | $ | 205,600,530 | |
| Shares of beneficial interest outstanding (Unlimited number of shares authorized, par value $0.01 per share) | | | 4,950,000 | |
| Net Asset Value, offering and redemption price per share | | $ | 41.54 | |
See Notes to Financial Statements.
Barron’s 400SM ETF
| Statement of Operations | For the Year Ended November 30, 2017 |
| INVESTMENT INCOME: | | | | |
| Dividends(a) | | $ | 2,575,625 | |
| Securities lending income | | | 222,926 | |
| Total investment income | | | 2,798,551 | |
| | | | | |
| EXPENSES: | | | | |
| Investment adviser fees | | | 1,268,083 | |
| Total expenses | | | 1,268,083 | |
| NET INVESTMENT INCOME | | | 1,530,468 | |
| | | | | |
| REALIZED AND UNREALIZED GAIN/(LOSS) | | | | |
| Net realized gain on investments | | | 23,132,804 | |
| Net change in unrealized appreciation on investments | | | 13,971,313 | |
| NET REALIZED AND UNREALIZED GAIN ON INVESTMENTS | | | 37,104,117 | |
| NET INCREASE IN NET ASSETS RESULTING FROM OPERATIONS | | $ | 38,634,585 | |
| (a) | Net of foreign tax withholding in the amount of $1,117. |
See Notes to Financial Statements.
Barron’s 400SM ETF
Statements of Changes in Net Assets
| | | For the Year Ended November 30, 2017 | | | For the Year Ended November 30, 2016 | |
| OPERATIONS: | | | | | | |
| Net investment income | | $ | 1,530,468 | | | $ | 1,857,709 | |
| Net realized gain/(loss) | | | 23,132,804 | | | | (4,619,422 | ) |
| Net change in unrealized appreciation | | | 13,971,313 | | | | 15,004,846 | |
| Net increase in net assets resulting from operations | | | 38,634,585 | | | | 12,243,133 | |
| | | | | | | | | |
| DISTRIBUTIONS TO SHAREHOLDERS: | | | | | | | | |
| From net investment income | | | (1,450,001 | ) | | | (1,670,002 | ) |
| Total distributions | | | (1,450,001 | ) | | | (1,670,002 | ) |
| | | | | | | | | |
| CAPITAL SHARE TRANSACTIONS: | | | | | | | | |
| Proceeds from sale of shares | | | 99,009,478 | | | | – | |
| Cost of shares redeemed | | | (109,205,210 | ) | | | (36,766,171 | ) |
| Net decrease from share transactions | | | (10,195,732 | ) | | | (36,766,171 | ) |
| | | | | | | | | |
| Net increase/(decrease) in net assets | | | 26,988,852 | | | | (26,193,040 | ) |
| | | | | | | | | |
| NET ASSETS | | | | | | | | |
| Beginning of period | | | 178,611,678 | | | | 204,804,718 | |
| End of period * | | $ | 205,600,530 | | | $ | 178,611,678 | |
| | | | | | | | | |
| *Including accumulated net investment income of: | | $ | 1,009,278 | | | $ | 1,157,459 | |
| | | | | | | | | |
| OTHER INFORMATION: | | | | | | | | |
| CAPITAL SHARE TRANSACTIONS: | | | | | | | | |
| Beginning shares | | | 5,200,000 | | | | 6,450,000 | |
| Shares sold | | | 2,650,000 | | | | – | |
| Shares redeemed | | | (2,900,000 | ) | | | (1,250,000 | ) |
| Shares outstanding, end of period | | | 4,950,000 | | | | 5,200,000 | |
See Notes to Financial Statements.
Barron’s 400SM ETF
| Financial Highlights | For a Share Outstanding Throughout the Periods Presented |
| | | For the Year Ended November 30, 2017 | | | For the Year Ended November 30, 2016 | | | For the Year Ended November 30, 2015 | | | For the Year Ended November 30, 2014 | | | For the Period June 4, 2013 (Commencement) to November 30, 2013 | |
| NET ASSET VALUE, BEGINNING OF PERIOD | | $ | 34.35 | | | $ | 31.75 | | | $ | 31.64 | | | $ | 29.30 | | | $ | 25.00 | |
| | | | | | | | | | | | | | | | | | | | | |
| INCOME/(LOSS) FROM INVESTMENT OPERATIONS: | | | | | | | | | | | | | | | | | | | | |
| Net investment income(a) | | | 0.29 | | | | 0.33 | | | | 0.32 | | | | 0.23 | | | | 0.10 | |
| Net realized and unrealized gain | | | 7.17 | | | | 2.53 | | | | 0.02 | | | | 2.16 | | | | 4.20 | |
| Total from investment operations | | | 7.46 | | | | 2.86 | | | | 0.34 | | | | 2.39 | | | | 4.30 | |
| | | | | | | | | | | | | | | | | | | | | |
| DISTRIBUTIONS: | | | | | | | | | | | | | | | | | | | | |
| From net investment income | | | (0.27 | ) | | | (0.26 | ) | | | (0.23 | ) | | | (0.05 | ) | | | – | |
| Total distributions | | | (0.27 | ) | | | (0.26 | ) | | | (0.23 | ) | | | (0.05 | ) | | | – | |
| | | | | | | | | | | | | | | | | | | | | |
| NET INCREASE IN NET ASSET VALUE | | | 7.19 | | | | 2.60 | | | | 0.11 | | | | 2.34 | | | | 4.30 | |
| NET ASSET VALUE, END OF PERIOD | | $ | 41.54 | | | $ | 34.35 | | | $ | 31.75 | | | $ | 31.64 | | | $ | 29.30 | |
| TOTAL RETURN(b) | | | 21.87 | % | | | 9.12 | % | | | 1.07 | % | | | 8.18 | % | | | 17.20 | % |
| | | | | | | | | | | | | | | | | | | | | |
| RATIOS/SUPPLEMENTAL DATA: | | | | | | | | | | | | | | | | | | | | |
| Net assets, end of period (000s) | | $ | 205,601 | | | $ | 178,612 | | | $ | 204,805 | | | $ | 219,901 | | | $ | 181,652 | |
| | | | | | | | | | | | | | | | | | | | | |
| Ratio of expenses to average net assets | | | 0.65 | % | | | 0.65 | % | | | 0.65 | % | | | 0.65 | % | | | 0.65 | %(c) |
| Ratio of net investment income to average net assets | | | 0.78 | % | | | 1.07 | % | | | 1.00 | % | | | 0.75 | % | | | 0.78 | %(c) |
| Portfolio turnover rate(d) | | | 84 | % | | | 88 | % | | | 87 | % | | | 55 | % | | | 11 | % |
| (a) | Based on average shares outstanding during the period. |
| (b) | Total return is calculated assuming an initial investment made at the net asset value at the beginning of the period and redemption at the net asset value on the last day of the period and assuming all distributions are reinvested at actual reinvestment prices. Total return calculated for a period less than one year is not annualized. |
| (d) | Portfolio turnover for periods less than one year is not annualized and does not include securities received or delivered from processing creations or redemptions in-kind. |
See Notes to Financial Statements.
Barron’s 400SM ETF
| Notes to Financial Statements | November 30, 2017 |
1. ORGANIZATION
ALPS ETF Trust (the “Trust”), a Delaware statutory trust, is an open-end management investment company registered under the Investment Company Act of 1940, as amended (the “1940 Act”). As of November 30, 2017, the Trust consisted of nineteen separate portfolios. Each portfolio represents a separate series of the Trust. This report pertains solely to the Barron’s 400SM ETF (the “Fund”). The investment objective of the Fund is to seek investment results that correspond generally, before fees and expenses, to the performance of the Barron’s 400 IndexSM (the “Underlying Index”). The Fund has elected to qualify as a diversified series of the Trust under the 1940 Act.
The Fund’s Shares (“Shares”) are listed on the NYSE Arca, Inc. The Fund issues and redeems Shares at net asset value (“NAV”) in blocks of 50,000 Shares, each of which is called a “Creation Unit”. Creation Units are issued and redeemed principally in-kind for securities included in the Underlying Index. Except when aggregated in Creation Units, Shares are not redeemable securities of the Fund.
Pursuant to the Trust’s organizational documents, its Officers and Trustees are indemnified against certain liability arising out of the performance of their duties to the Trust. Additionally, in the normal course of business, the Trust enters into contracts with service providers that contain general indemnification clauses. The Trust’s maximum exposure under these arrangements is unknown, as this would involve future claims that may be made against the Trust that have not yet occurred.
2. SIGNIFICANT ACCOUNTING POLICIES
The following is a summary of significant accounting policies consistently followed by the Fund in the preparation of the financial statements. The accompanying financial statements were prepared in accordance with accounting principles generally accepted in the United States of America (“U.S. GAAP”). The preparation of financial statements in conformity with U.S. GAAP requires management to make certain estimates and assumptions that affect the reported amounts of assets and liabilities and disclosures of contingent assets and liabilities at the date of the financial statements and the reported amounts of revenue and expenses during the period. Actual results could differ from those estimates. The Fund is considered an investment company under U.S. GAAP and follows the accounting and reporting guidance applicable to investment companies in the Financial Accounting Standards Board Accounting Standards Codification Topic 946.
A. Portfolio Valuation
The Fund’s NAV is determined daily, as of the close of regular trading on the New York Stock Exchange (the “NYSE”), normally 4:00 p.m. Eastern time, on each day the NYSE is open for trading. The NAV is computed by dividing the value of all assets of the Fund (including accrued interest and dividends), less all liabilities (including accrued expenses and dividends declared but unpaid), by the total number of shares outstanding.
Portfolio securities listed on any exchange other than the NASDAQ Stock Market LLC (“NASDAQ”) are valued at the last sale price on the business day as of which such value is being determined. If there has been no sale on such day, the securities are valued at the mean of the most recent bid and ask prices on such day. Securities traded on the NASDAQ are valued at the NASDAQ Official Closing Price as determined by NASDAQ. Portfolio securities traded on more than one securities exchange are valued at the last sale price on the business day as of which such value is being determined at the close of the exchange representing the principal market for such securities. Portfolio securities traded in the over-the-counter market, but excluding securities traded on the NASDAQ, are valued at the latest quoted sale price in such market.
The Fund’s investments are valued at market value or, in the absence of market value with respect to any portfolio securities, at fair value according to procedures adopted by the Trust’s Board of Trustees (the “Board”). When market quotations are not readily available or when events occur that make established valuation methods unreliable, securities of the Fund may be valued in good faith by or under the direction of the Board. These securities generally include, but are not limited to, restricted securities (securities which may not be publicly sold without registration under the Securities Act of 1933) for which a pricing service is unable to provide a market price; securities whose trading has been formally suspended; a security whose market price is not available from a pre-established primary pricing source or the pricing source is not willing to provide a price; a security with respect to which an event has occurred that is most likely to materially affect the value of the security after the market has closed but before the calculation of the Fund’s NAV or make it difficult or impossible to obtain a reliable market quotation; or a security whose price, as provided by the pricing service, does not reflect the security’s “fair value” due to the security being de-listed from a national exchange or the security’s primary trading market is temporarily closed at a time when, under normal conditions, it would be open. As a general principle, the current “fair value” of a security would be the amount which the owner might reasonably expect to receive from the sale on the applicable exchange or principal market. A variety of factors may be considered in determining the fair value of such securities.
Barron’s 400SM ETF
| Notes to Financial Statements | November 30, 2017 |
B. Fair Value Measurements
The Fund discloses the classification of its fair value measurements following a three-tier hierarchy based on the inputs used to measure fair value. Inputs refer broadly to the assumptions that market participants would use in pricing the asset or liability; including assumptions about risk. Inputs may be observable or unobservable. Observable inputs reflect the assumptions market participants would use in pricing the asset or liability that are developed based on market data obtained from sources independent of the reporting entity. Unobservable inputs reflect the reporting entity’s own assumptions about the assumptions market participants would use in pricing the asset or liability that are developed based on the best information available.
Valuation techniques used to value the Fund's investments by major category are as follows:
Equity securities and Limited Partnerships, including restricted securities, for which market quotations are readily available, are valued at the last reported sale price or official closing price as reported by a third party pricing vendor on the primary market or exchange on which they are traded and are categorized as Level 1 in the hierarchy. In the event there were no sales during the day or closing prices are not available, securities are valued at the mean of the most recent quoted bid and ask prices on such day and are generally categorized as Level 2 in the hierarchy. Investments in open-end mutual funds are valued at their closing NAV each business day and are categorized as Level 1 in the hierarchy.
Changes in valuation techniques may result in transfers in or out of an assigned level within the disclosure hierarchy.
Various inputs are used in determining the value of the Fund’s investments as of the end of the reporting period. When inputs used fall into different levels of the fair value hierarchy, the level in the hierarchy within which the fair value measurement falls is determined based on the lowest level input that is significant to the fair value measurement in its entirety. The designated input levels are not necessarily an indication of the risk or liquidity associated with these investments.
These inputs are categorized in the following hierarchy under applicable financial accounting standards:
| Level 1 – | Unadjusted quoted prices in active markets for identical investments, unrestricted assets or liabilities that a Fund has the ability to access at the measurement date; |
| Level 2 – | Quoted prices which are not active, quoted prices for similar assets or liabilities in active markets or inputs other than quoted prices that are observable (either directly or indirectly) for substantially the full term of the asset or liability; and |
| Level 3 – | Significant unobservable prices or inputs (including the Fund’s own assumptions in determining the fair value of investments) where there is little or no market activity for the asset or liability at the measurement date. |
The following is a summary of the inputs used to value the Fund’s investments as of November 30, 2017:
| Investments in Securities at Value* | | Level 1 - Unadjusted Quoted Prices | | | Level 2 - Other Significant Observable Inputs | | | Level 3 - Significant Unobservable Inputs | | | Total | |
| Common Stocks | | $ | 192,718,288 | | | $ | – | | | $ | – | | | $ | 192,718,288 | |
| Limited Partnerships | | | 10,105,161 | | | | – | | | | – | | | | 10,105,161 | |
| Short Term Investments | | | | | | | | | | | | | | | | |
| Money Market Fund | | | 2,681,600 | | | | – | | | | – | | | | 2,681,600 | |
| Investments Purchased with Collateral from | | | | | | | | | | | | | | | | |
| Securities Loaned | | | 4,811,455 | | | | – | | | | – | | | | 4,811,455 | |
| TOTAL | | $ | 210,316,504 | | | $ | – | | | $ | – | | | $ | 210,316,504 | |
| * | For a detailed sector breakdown, see the accompanying Schedule of Investments. |
The Fund recognizes transfers between levels as of the end of the period. For the year ended November 30, 2017, the Fund did not have any transfers between Level 1 and Level 2 securities. The Fund did not have any securities that used significant unobservable inputs (Level 3) in determining fair value.
C. Securities Transactions and Investment Income
Securities transactions are recorded as of the trade date. Realized gains and losses from securities transactions are recorded on the highest cost basis. Dividend income and capital gains distributions, if any, are recorded on the ex-dividend date. Interest income, if any, is recorded on the accrual basis.
Barron’s 400SM ETF
| Notes to Financial Statements | November 30, 2017 |
D. Dividends and Distributions to Shareholders
Dividends from net investment income of the Fund, if any, are declared and paid annually or as the Board may determine from time to time. Distributions of net realized capital gains earned by the Fund, if any, are distributed at least annually.
E. Federal Tax and Tax Basis Information
The timing and character of income and capital gain distributions are determined in accordance with income tax regulations, which may differ from U.S. GAAP. Reclassifications are made to the Fund’s capital accounts for permanent tax differences to reflect income and gains available for distribution (or available capital loss carryforwards) under income tax regulations.
For the year ended November 30, 2017, the following reclassifications, which had no impact on results of operations or net assets, were recorded to reflect permanent tax differences resulting primarily from in-kind transactions:
| Fund | | Paid-in Capital | | Accumulated Net Investment Gain/(Loss) | | Accumulated Net Realized Gain/(Loss) on Investments | |
| Barron’s 400SM ETF | | $ | 27,031,555 | | | $ | (228,648 | ) | | $ | (26,802,907 | ) |
At November 30, 2017, the Fund had available for tax purposes unused post-enactment capital loss carryforwards as follows:
| Fund | | Short-Term | | | Long-Term | |
| Barron’s 400SM ETF | | $ | 20,973,191 | | | $ | 10,351,112 | |
The tax character of the distributions paid during the fiscal years ended November 30, 2017 and November 30, 2016 were as follows:
| | | Ordinary Income | |
| November 30, 2017 | | | |
| Barron’s 400SM ETF | | $ | 1,450,001 | |
| November 30, 2016 | | | | |
| Barron’s 400SM ETF | | $ | 1,670,002 | |
As of November 30, 2017, the components of distributable earnings on a tax basis for the Fund were as follows:
| | | Barron’s 400SM ETF | |
| Undistributed net investment income | | $ | 1,029,698 | |
| Accumulated net realized loss on investments | | | (31,324,303 | ) |
| Net unrealized appreciation on investments | | | 35,165,973 | |
| Other accumulated losses | | | (23,618 | ) |
| Total | | $ | 4,847,750 | |
Other accumulated losses are mostly due to partnership losses being suspended for tax purposes.
As of November 30, 2017, the cost of investments for federal income tax purposes and accumulated net unrealized appreciation/(depreciation) on investments were as follows:
| | | Barron’s 400SM ETF | |
| Gross appreciation (excess of value over tax cost) | | $ | 39,314,331 | |
| Gross depreciation (excess of tax cost over value) | | | (4,148,358 | ) |
| Net unrealized appreciation (depreciation) | | | 35,165,973 | |
| Cost of investments for income tax purposes | | $ | 175,150,531 | |
The differences between book-basis and tax-basis are primarily due to the deferral of losses from wash sales and investments in partnerships.
Barron’s 400SM ETF
| Notes to Financial Statements | November 30, 2017 |
F. Income Taxes
No provision for income taxes is included in the accompanying financial statements, as the Fund intends to distribute to shareholders all taxable investment income and realized gains and otherwise comply with Subchapter M of the Internal Revenue Code of 1986, as amended, applicable to regulated investment companies. The Fund evaluates tax positions taken (or expected to be taken) in the course of preparing the Fund’s tax returns to determine whether these positions meet a “more-likely -than-not” standard that, based on the technical merits, have a more than fifty percent likelihood of being sustained by a taxing authority upon examination. A tax position that meets the “more-likely-than-not” recognition threshold is measured to determine the amount of benefit to recognize in the financial statements.
As of and during the year ended November 30, 2017, the Fund did not have a liability for any unrecognized tax benefits. The Fund files U.S. federal, state, and local tax returns as required. The Fund’s tax returns are subject to examination by the relevant tax authorities until expiration of the applicable statute of limitations, which is generally three years after the filing of the tax return, but may extend to four years in certain jurisdictions. Tax returns for open years have incorporated no uncertain tax positions that require a provision for income taxes.
G. Lending of Portfolio Securities
The Fund has entered into a securities lending agreement with State Street Bank & Trust Co. (“SSB”), the Fund’s lending agent. The Fund may lend its portfolio securities only to borrowers that are approved by SSB. The Fund will limit such lending to not more than 33 1/3% of the value of its total assets. The Fund’s securities held at SSB as custodian shall be available to be lent except those securities the Fund or ALPS Advisors, Inc. specifically identifies in writing as not being available for lending. The borrower pledges and maintains with the Fund collateral consisting of cash (U.S. Dollars only), securities issued or guaranteed by the U.S. government or its agencies or instrumentalities, and cash equivalents (including irrevocable bank letters of credit) issued by a person other than the borrower or an affiliate of the borrower. The initial collateral received by the Fund is required to have a value of no less than 102% of the market value of the loaned securities for U.S equity securities and a value of no less than 105% of the market value for non-U.S. equity securities. The collateral is maintained thereafter, at a market value equal to not less than 102% of the current value of the U.S. equity securities on loan and not less than 105% of the current value of the non-U.S. equity securities on loan. The market value of the loaned securities is determined at the close of each business day and any additional required collateral is delivered to the Fund on the next business day. During the term of the loan, the Fund is entitled to all distributions made on or in respect of the loaned securities. Loans of securities are terminable at any time and the borrower, after notice, is required to return borrowed securities within the customary time period for settlement of securities transactions.
Any cash collateral received is reinvested in a money market fund managed by SSB as disclosed in the Fund’s Schedule of Investments and is reflected in the Statements of Assets and Liabilities as a payable for collateral upon return of securities loaned. Non-cash collateral, in the form of securities issued or guaranteed by the U.S. government or its agencies or instrumentalities, is not disclosed in the Fund’s Statements of Assets and Liabilities as it is held by the lending agent on behalf of the Fund, and the Fund does not have the ability to re-hypothecate these securities. Income earned by the Fund from securities lending activity is disclosed in the Statement of Operations.
The following is a summary of the Fund's securities lending agreement and related cash and non-cash collateral received as of November 30, 2017.
| | | Market Value of Securities on Loan | | | Cash Collateral Received | | | Non-Cash Collateral Received | | | Total Collateral Received | |
| Barron's 400 ETF | | $ | 5,901,102 | | | $ | 4,811,455 | | | $ | 1,166,433 | | | $ | 5,977,888 | |
The risks of securities lending include the risk that the borrower may not provide additional collateral when required or may not return the securities when due. To mitigate these risks, the Fund benefits from a borrower default indemnity provided by SSB. SSB’s indemnity allows for full replacement of securities lent wherein SSB will purchase the unreturned loaned securities on the open market by applying the proceeds of the collateral, or to the extent such proceeds are insufficient or the collateral is unavailable, SSB will purchase the unreturned loan securities at SSB’s expense. However, the Fund could suffer a loss if the value of the investments purchased with cash collateral falls below the value of the cash collateral received.
Barron’s 400SM ETF
| Notes to Financial Statements | November 30, 2017 |
The following table reflects a breakdown of transactions accounted for as secured borrowings, the gross obligation by the type of collateral pledged or securities loaned, and the remaining contractual maturity of those transactions as of November 30, 2017:
| Barron's 400 ETF | | Remaining contractual maturity of the agreement | |
| Securities Lending Transactions | | Overnight & Continuous | | | Up to 30 days | | | 30-90 days | | | Greater than 90 days | | | Total | |
| Common Stocks | | $ | 4,811,455 | | | $ | – | | | $ | – | | | $ | – | | | $ | 4,811,455 | |
| Total Borrowings | | | | | | | | | | | | | | | | | | | 4,811,455 | |
| Gross amount of recognized liabilities for securities lending (collateral received) | | | | | | | $ | 4,811,455 | |
3. INVESTMENT ADVISORY FEE AND OTHER AFFILIATED TRANSACTIONS
ALPS Advisors, Inc. (the “Adviser”) acts as the Fund’s investment adviser pursuant to an Advisory Agreement with the Trust on behalf of the Fund (the “Advisory Agreement”). Pursuant to the Advisory Agreement, the Fund pays the Adviser a unitary fee for the services and facilities it provides payable on a monthly basis at the annual rate of 0.65% of the Fund’s average daily net assets. From time to time, the Adviser may waive all or a portion of its fee.
Out of the unitary management fee, the Adviser pays substantially all expenses of the Fund, the cost of transfer agency, custody, fund administration, legal, audit, independent trustees and other services, except for interest expenses, distribution fees or expenses, brokerage expenses, taxes and extraordinary expenses not incurred in the ordinary course of the Fund’s business. The Adviser’s unitary management fee is designed to pay substantially all of the Fund’s expenses and to compensate the Adviser for providing services for the Fund.
ALPS Fund Services, Inc., an affiliate of the Adviser, is the administrator of the Fund.
Each Trustee who is not an officer or employee of the Adviser, any sub-adviser or any of their affiliates (“Independent Trustees”) receives (1) a quarterly retainer of $5,000, (2) a per meeting fee for regularly scheduled meetings of $3,750, (3) $1,500 for any special meeting held outside of a regularly scheduled board meeting, and (4) reimbursement for all reasonable out-of-pocket expenses relating to attendance at meetings.
4. PURCHASES AND SALES OF SECURITIES
For the year ended November 30, 2017, the cost of purchases and proceeds from sales of investment securities, excluding in-kind transactions and short-term investments, were as follows:
| Fund | | Purchases | | | Sales | |
| Barron's 400 ETF | | $ | 161,779,808 | | | $ | 162,423,995 | |
For the year ended November 30, 2017, the cost of in-kind purchases and proceeds from in-kind sales were as follows:
| Fund | | Purchases | | | Sales | |
| Barron's 400 ETF | | $ | 98,007,455 | | | $ | 109,295,877 | |
For the year ended November 30, 2017, the Barron's 400SM ETF had in-kind net realized gain of $26,190,083.
Gains on in-kind transactions are not considered taxable for federal income tax purposes and losses on in kind transactions are also not deductible for tax purposes.
5. CAPITAL SHARE TRANSACTIONS
Shares are created and redeemed by the Fund only in Creation Unit size aggregations of 50,000 Shares. Only broker-dealers or large institutional investors with creation and redemption agreements called Authorized Participants (“AP”) are permitted to purchase or redeem Creation Units from the Fund. Such transactions are generally permitted on an in-kind basis, with a balancing cash component to equate the transaction to the NAV per unit of the Fund on the transaction date. Cash may be substituted equivalent to the value of certain securities generally when they are not available in sufficient quantity for delivery, not eligible for trading by the AP or as a result of other market circumstances.
Barron’s 400SM ETF
| Notes to Financial Statements | November 30, 2017 |
6. RELATED PARTY TRANSACTIONS
The Fund engaged in cross trades between other funds in the Trust during the year ended November 30, 2017 pursuant to Rule 17a-7 under the 1940 Act. Cross trading is the buying or selling of portfolio securities between funds to which the Adviser serves as the investment adviser. The Board previously adopted procedures that apply to transactions between the Funds of the Trust pursuant to Rule 17a-7. These transactions related to cross trades during the period complied with the requirements set forth by Rule 17a-7 and the Trust’s procedures.
Transactions related to cross trades during the year ended November 30, 2017, were as follows:
| Fund | | Purchase cost paid | | | Sale proceeds received | | | Realized gain/ (loss) on sales | |
| Barron's 400 ETF | | $ | 3,499,538 | | | $ | 1,137,727 | | | $ | 144,356 | |
Barron’s 400SM ETF
| Additional Information | November 30, 2017 (Unaudited) |
PROXY VOTING RECORDS, POLICIES AND PROCEDURES
Information regarding how the Fund voted proxies relating to portfolio securities during the most recent 12-month period ended November 30 and a description of the Fund’s proxy voting policies and procedures used in determining how to vote for proxies are available without charge on the SEC’s website at www.sec.gov and upon request, by calling (toll-free) 1-866-675-2639.
PORTFOLIO HOLDINGS
The Trust is required to disclose, after its first and third fiscal quarters, the complete schedule of the Fund’s portfolio holdings with the SEC on Form N-Q. Forms N-Q for the Fund are available on the SEC’s website at www.sec.gov. The Fund’s Forms N-Q may also be reviewed and copied at the SEC’s Public Reference Room in Washington, D.C. and information on the operation of the Public Reference Room may be obtained by calling 1-800-SEC-0330. The Fund’s Forms N-Q are available without charge, upon request, by calling (toll-free) 1-866-675-2639 or by writing to ALPS ETF Trust at 1290 Broadway, Suite 1100, Denver, Colorado 80203.
TAX INFORMATION
The Fund designated the following for federal income tax purposes for distributions made during the calendar year ended December 31, 2016:
| | Qualified Dividend Income | Dividend Received Deduction |
| Barron's 400SM ETF | 100.00 % | 100.00 % |
In early 2017, if applicable, shareholders of record received this information for the distribution paid to them by the Fund during the calendar year 2016 via Form 1099. The Fund will notify shareholders in early 2018 of amounts paid to them by the Fund, if any, during the calendar year 2017.
LICENSING AGREEMENT
MarketGrader Capital, LLC has entered into a license agreement with Dow Jones & Company to use the “Barron’s” name and certain related intellectual property in connection with the Underlying Index. MarketGrader Capital, LLC also has entered into a license and services agreement with its parent company, MarketGrader.com, to use the methodology for constructing the Underlying Index. MarketGrader Capital, LLC in turn has entered into the Sublicense Agreement with ALPS Advisers, Inc. to use the Underlying Index. The following disclosure relates to such licensing agreements:
The Barron’s 400SM ETF (the “Fund”) is not sponsored, endorsed, sold or promoted by the MarketGrader Capital, LLC (the “Index Provider”). The Index Provider makes no representation or warranty, express or implied, to the owners of the Fund or any member of the public regarding the advisability of investing in securities generally or in the Fund particularly or the ability of the Fund to track the performance of the physical commodities market. The Index Provider’s only relationship to the ALPS Advisors, Inc. (the “Adviser”) or the Fund is the licensing of certain service marks and trade names of the Index Provider and of the Underlying Index that is determined, composed and calculated by the Index Provider without regard to the Adviser or the Fund. The Index Provider has no obligation to take the needs of the Adviser or the Fund or the owners of the Fund into consideration in determining, composing or calculating the Underlying Index. The Index Provider is not responsible for and has not participated in the determination of the timing of, prices at, or quantities of the Fund to be issued or in the determination or calculation of the equation by which the Fund is to be converted into cash. The Index Provider has no obligation or liability in connection with the administration, marketing or trading of the Fund.
THE INDEX PROVIDER DOES NOT GUARANTEE THE ACCURACY AND/OR THE COMPLETENESS OF THE UNDERLYING INDEX OR ANY DATA INCLUDED THEREIN AND THE INDEX PROVIDER SHALL HAVE NO LIABILITY FOR ANY ERRORS, OMISSIONS, OR INTERRUPTIONS THEREIN. THE INDEX PROVIDER MAKES NO WARRANTY, EXPRESS OR IMPLIED, AS TO RESULTS TO BE OBTAINED BY THE ADVISER, THE FUND, OWNERS OF THE FUND, OR ANY OTHER PERSON OR ENTITY FROM THE USE OF THE UNDERLYING INDEX OR ANY DATA INCLUDED THEREIN. THE INDEX PROVIDER MAKES NO EXPRESS OR IMPLIED WARRANTIES, AND EXPRESSLY DISCLAIMS ALL WARRANTIES OF MERCHANTABILITY OR FITNESS FOR A PARTICULAR PURPOSE OR USE WITH RESPECT TO THE UNDERLYING INDEX OR ANY DATA INCLUDED THEREIN. WITHOUT LIMITING ANY OF THE FOREGOING, IN NO EVENT SHALL THE INDEX PROVIDER HAVE ANY LIABILITY FOR ANY SPECIAL, PUNITIVE, INDIRECT, OR CONSEQUENTIAL DAMAGES (INCLUDING LOST PROFITS), EVEN IF NOTIFIED OF THE POSSIBILITY OF SUCH DAMAGES.
“The Barron’s 400 IndexSM” is calculated and published by MarketGrader Capital, LLC (“MarketGrader”). “Barron’s,” “Barron’s 400” and “Barron’s 400 Index” are trademarks or service marks of DJC & Company, Inc. or its affiliates and have been licensed to MarketGrader and sublicensed for certain purposes by Barron’s 400 Exchange Traded Fund, a sub-fund of that certain ALPS ETF Trust, a Delaware Statutory Trust (“Sub-Licensee”).
Barron’s 400SM ETF
| Additional Information | November 30, 2017 (Unaudited) |
The Barron’s 400 ETF (the “Product”) is not sponsored, endorsed, sold or promoted by DJC or its affiliates. DJC and its affiliates make no representation or warranty, express or implied, to the owners of the Fund or any member of the public regarding the advisability of trading in the Fund particularly. DJC and its affiliates’ only relationship to the Licensee is the licensing of certain trademarks and trade names of DJC. DJC has no obligation to take the needs of the Licensee or the owners of the Fund into consideration in connection with its licensing of the Barron’s 400 Index to MarketGrader or the sublicense to Licensee. DJC and its affiliates are not responsible for and have not participated in the determination of the timing of, prices at, or quantities of the Fund to be sold or in the determination or calculation of the equation by which the Product are to be converted into cash. DJC and its affiliates have no obligation or liability in connection with the administration, marketing or trading of the Barron’s 400 Index or the Product.
DOW JONES DOES NOT GUARANTEE THE ACCURACY AND/OR THE COMPLETENESS OF THE BARRON’S 400 INDEX OR ANY DATA INCLUDED THEREIN AND DOW JONES AND ITS AFFILIATES SHALL HAVE NO LIABILITY FOR ANY ERRORS, OMISSIONS, OR INTERRUPTIONS THEREIN. DOW JONESAND ITS AFFILIATES MAKE NO WARRANTY, EXPRESS OR IMPLIED, AS TO RESULTS TO BE OBTAINED BY THE LICENSEE, OWNERS OF THE FUND, OR ANY OTHER PERSON OR ENTITY FROM THE USE OF THE BARRON’S 400 INDEX OR ANY DATA INCLUDED THEREIN. DOW JONES AND ITS AFFILIATES MAKE NO EXPRESS OR IMPLIED WARRANTIES. AND EXPRESSLY DISCLAIM ALL WARRANTIES, OF MERCHANTABILITY OR FITNESS FOR A PARTICULAR PURPOSE OR USE WITH RESPECT TO THE BARRON’S 400 INDEX OR ANY DATA INCLUDED THEREIN. WITHOUT LIMITING ANY OF THE FOREGOING, IN NO EVENT SHALL DOW JONES AND ITS AFFILIATES HAVE ANY LIABILITY FOR ANY LOST PROFITS OR INDIRECT, PUNITIVE, SPECIAL OR CONSEQUENTIAL DAMAGES OR LOSSES, EVEN IF NOTIFIED OF THE POSSIBILITY OF SUCH DAMAGES. THERE ARE NO THIRD PARTY BENEFICIARIES OF ANY AGREEMENTS OR ARRANGEMENTS BETWEEN DJC AND THE LICENSEE, OTHER THAN THE LICENSORS OF MARKETGRADER.
The Adviser does not guarantee the accuracy and/or the completeness of the Underlying Index or any data included therein, and the Adviser shall have no liability for any errors, omissions or interruptions therein. The Adviser makes no warranty, express or implied, as to results to be obtained by the Fund, owners of the Shares of the Fund or any other person or entity from the use of the Underlying Index or any data included therein. The Adviser makes no express or implied warranties, and expressly disclaims all warranties of merchantability or fitness for a particular purpose or use with respect to the Underlying Index or any data included therein. Without limiting any of the foregoing, in no event shall the Adviser have any liability for any special, punitive, direct, indirect or consequential damages (including lost profits) arising out of matters relating to the use of the Underlying Index, even if notified of the possibility of such damages.
Barron’s 400SM ETF
| Board Considerations Regarding Approval of Investment Advisory Agreement | November 30, 2017 (Unaudited) |
At an in-person meeting held on June 8, 2017, the Board of Trustees of the Trust (the “Board” or the “Trustees”), including the Trustees who are not “interested persons” of the Trust within the meaning of the 1940 Act, as amended (the “Independent Trustees”), evaluated a proposal to approve the continuance of the Investment Advisory Agreement between the Trust and ALPS Advisors, Inc. (the “Adviser” or “AAI”) with respect to the Barons 400 ETF (“BFOR” or “the Fund”). The Independent Trustees also met separately to consider the Investment Advisory Agreement.
In evaluating the Investment Advisory Agreement with respect to the Fund, the Independent Trustees considered various factors, including (i) the nature, extent and quality of the services provided by AAI with respect to the Fund under the Investment Advisory Agreements; (ii) the advisory fees and other expenses paid by the Fund compared to those of similar funds managed by other investment advisers; (iii) the costs of the services provided to the Fund by AAI and the profits realized by AAI and its affiliates from its relationship to the Fund; (iv) the extent to which economies of scale have been or would be realized if and as the assets of the Fund grow and whether fees reflect the economies of scale for the benefit of shareholders; and (v) any additional benefits and other considerations.
With respect to the nature, extent and quality of the services provided by AAI under the Investment Advisory Agreement, the Independent Trustees considered and reviewed information concerning the services provided under the Investment Advisory Agreement, the investment parameters of the index of the Fund, financial information regarding AAI and its parent company, information describing AAI’s current organization and the background and experience of the persons responsible for the day-to-day management of the Fund.
The Independent Trustees reviewed information on the performance of the Fund and its benchmark. The Independent Trustees also evaluated the correlation and tracking error between the underlying index and the Fund’s performance. Based on their review, the Independent Trustees found that the nature and extent of services provided to each Fund under the Investment Advisory Agreements was appropriate and that the quality was satisfactory.
The Independent Trustees noted that the advisory fee for the Fund was a unitary fee pursuant to which AAI assumes all expenses of the Fund (including the cost of transfer agency, custody, fund administration, legal, audit and other services) other than the payments under the Investment Advisory Agreement, brokerage expenses, taxes, interest, litigation expenses and other extraordinary expenses.
With respect to the advisory fee rate, the Independent Trustees noted the following:
The net advisory fee rate for the Fund is higher than the median of its Broadridge expense group and the Fund’s expense ratio is higher than the median of its Broadridge expense group.
The Independent Trustees took into account, among other things, the unique features and performance of the Fund’s underlying index and the costs and benefits of linkage to the Barron’s name.
Based on the foregoing, and the other information available to them, the Independent Trustees concluded that the advisory fee rate for the Fund was reasonable under the circumstances and in light of the quality of the services provided.
The Independent Trustees considered other benefits available to AAI because of its relationship with the Fund and concluded that the advisory fees were reasonable taking into account any such benefits.
The Independent Trustees also considered with respect to the Fund the information provided by AAI about the costs and profitability of AAI with respect to the Fund. The Independent Trustees reviewed and noted the relatively small size of the Fund and concluded that AAI was not realizing any economies of scale. The Independent Trustees determined that they would continue to evaluate whether further economies of scale have been achieved on an ongoing basis.
In voting to renew the Investment Advisory Agreement, the Independent Trustees concluded that the terms of the Investment Advisory Agreement are reasonable and fair in light of the services to be performed, the fees paid by certain other funds, expenses to be incurred and such other matters as the Independent Trustees considered relevant in the exercise of their reasonable business judgment. The Independent Trustees did not identify any single factor or group of factors as all important or controlling and considered all factors together.
Barron’s 400SM ETF
| Trustees & Officers | November 30, 2017 (Unaudited) |
The general supervision of the duties performed by the Adviser for the Fund under the Investment Advisory Agreement is the responsibility of the Board of Trustees. The Trust currently has four Trustees. Three Trustees have no affiliation or business connection with the Adviser or any of its affiliated persons and do not own any stock or other securities issued by the Adviser. These are the “non-interested” or “independent” Trustees (“Independent Trustees”). The other Trustee (the “Interested Trustee”) is affiliated with the Adviser.
The Independent Trustees of the Trust, their term of office and length of time served, their principal business occupations during the past five years, the number of portfolios in the Fund Complex overseen by each Independent Trustee, and other directorships, if any, held by the Trustee are shown below.
| INDEPENDENT TRUSTEES | | | | |
| Name, Address & Year of Birth* | Position(s) Held with Trust | Term of Office and Length of Time Served** | Principal Occupation(s) During Past 5 Years | Number of Portfolios in Fund Complex Overseen by Trustees*** | Other Directorships Held by Trustees |
Mary K.
Anstine,
1940 | Trustee | Since March 2008 | Ms. Anstine was President/Chief Executive Officer of HealthONE Alliance, Denver, Colorado, and former Executive Vice President of First Interstate Bank of Denver. Ms. Anstine is also Trustee/Director of AV Hunter Trust and Colorado Uplift Board. Ms. Anstine was formerly a Director of the Trust Bank of Colorado (later purchased and now known as Northern Trust Bank), HealthONE and Denver Area Council of the Boy Scouts of America and a member of the American Bankers Association Trust Executive Committee. | 42 | Ms. Anstine is a Trustee of ALPS Variable Investment Trust (10 funds); Financial Investors Trust (33 funds); Reaves Utility Income Fund (1 fund); and Westcore Trust (14 funds). |
Jeremy W.
Deems,
1976 | Trustee | Since March 2008 | Mr. Deems is the Co-Founder, Chief Compliance Officer and Chief Financial Officer of Green Alpha Advisors, LLC. Mr. Deems is Co-Portfolio Manager of the Shelton Green Alpha Fund. Prior to joining Green Alpha Advisors, Mr. Deems was CFO and Treasurer of Forward Management, LLC, ReFlow Management Co., LLC, ReFlow Fund, LLC, a private investment fund, and Sutton Place Management, LLC, an administrative services company. | 44 | Mr. Deems is a Trustee of ALPS Variable Investment Trust (10 funds); Financial Investors Trust (33 funds); and Reaves Utility Income Fund (1 fund); Clough Funds Trust (1 fund) and Elevation ETF Trust (1 fund). |
Rick A.
Pederson,
1952 | Trustee and Chairman | Has served as Trustee since March 2008. Has served as Chairman since July 2017. | Mr. Pederson is President, Foundation Properties, Inc. (a real estate investment management company), 1994 - present; Advisory Board Member, Bow River Capital Partners (private equity management), 2003 - present; Advisor, The Pauls Corporation (real estate investment management and development), 2008 - present; Chairman, Ross Consulting Group (real estate consulting services) 1983-2013; Advisory Board, Neenan Company (construction services) 2002-present; Board Member, Prosci Inc. (private business services) 2013-2016; Board Member, Citywide Banks (Colorado community bank) 2014-present; Board member, Professional Pediatric Health Care (a Denver-based home nursing firm) 2014 – present; Board Member, Strong-Bridge Consulting (management consulting) 2015-present; Director, National Western Stock Show (not-for-profit organization); Director, Biennial of the Americas (not-for-profit-organization), 2012- 2015; Board Member, History Colorado, 2015 -present. | 21 | Mr. Pederson is Trustee of Westcore Trust (14 funds) and Principal Real Estate Income Fund (1 fund). |
| * | The business address of the Trustee is c/o ALPS Advisors, Inc., 1290 Broadway, Suite 1100, Denver, Colorado 80203. |
| ** | This is the period for which the Trustee began serving the Trust. Each Trustee serves an indefinite term, until his successor is elected. |
| *** | The Fund Complex includes all series of the Trust and any other investment companies for which ALPS Advisors, Inc. provides investment advisory services. |
Barron’s 400SM ETF
| Trustees & Officers | November 30, 2017 (Unaudited) |
The Trustee who is affiliated with the Adviser or affiliates of the Adviser and executive officers of the Trust, his term of office and length of time served, his principal business occupations during the past five years, the number of portfolios in the Fund Complex overseen by the Interested Trustee and the other directorships, if any, held by the Trustee, are shown below.
| INTERESTED TRUSTEE | | | | |
| Name, Address and Year of Birth of Interested Trustee* | Position(s) Held with Trust | Term of Office and Length of Time Served** | Principal Occupation(s) During Past 5 Years | Number of Portfolios in Fund Complex Overseen by Trustees*** | Other Directorships Held by Trustee |
Edmund J.
Burke,
1961 | Trustee and President | Mr. Burke was elected as Trustee of the Trust and President of the Trust at the December 11, 2017 meeting of the Board of Trustees. | Mr. Burke is President and a Director of ALPS Holdings, Inc. (“AHI”) (since 2005) and Director of Boston Financial Data Services, Inc. (“BFDS”), ALPS Advisors, Inc. (“AAI”), ALPS Distributors, Inc. (“ADI”), ALPS Fund Services, Inc. (“AFS”) and ALPS Portfolio Solutions Distributor, Inc. (“APSD”) and from 2001-2008, was President of AAI, ADI, AFS and APSD. Because of his positions with AHI, BFDS, AAI, ADI, AFS and APSD, Mr. Burke is deemed an affiliate of the Trust as defined under the 1940 Act. Mr. Burke is Trustee and President of the Clough Global Allocation Fund (Trustee since 2006; President since 2004); Trustee and President of the Clough Global Equity Fund (Trustee since 2006; President since 2005); Trustee and President of the Clough Global Opportunities Fund (since 2006); Trustee of the Liberty All-Star Equity Fund; Director of the Liberty All-Star Growth Fund, Inc. and Trustee and President of Financial Investors Trust (Trustee since 2009; President since 2002). | 36 | Mr. Burke is a Trustee of Clough Global Dividend and Income Fund (1 fund); Clough Global Equity Fund (1 fund); Clough Global Opportunities Fund (1 fund); Clough Funds Trust (1 fund); Liberty All -Star Equity Fund (1 fund); Director of the Liberty All-Star Growth Fund, Inc. (1 fund) and Financial Investors Trust (33 funds). |
| * | The business address of the Trustee is c/o ALPS Advisors, Inc., 1290 Broadway, Suite 1100, Denver, Colorado 80203. |
| ** | This is the period for which the Trustee began serving the Trust. Each Trustee serves an indefinite term, until his successor is elected. |
| *** | The Fund Complex includes all series of the Trust and any other investment companies for which ALPS Advisors, Inc. provides investment advisory services. |
Barron’s 400SM ETF
| Trustees & Officers | November 30, 2017 (Unaudited) |
| OFFICERS | | | |
| Name, Address and Year of Birth of Officer | Position(s) Held with Trust | Length of Time Served* | Principal Occupation(s) During Past 5 Years |
Erin D.
Nelson,
1977 | Chief Compliance Officer (“CCO”) | Since December 2015 | Erin Nelson became Senior Vice-President and Chief Compliance Officer of ALPS Advisors, Inc. (“AAI”) on July 1, 2015 and prior to that served as Vice President and Deputy Chief Compliance Officer of AAI since January 1, 2015. Prior to January 1, 2015, Ms. Nelson was Vice-President and Assistant General Counsel of ALPS Fund Services, Inc. Because of her position with AAI, Ms. Nelson is deemed an affiliate of the Trust as defined under the 1940 Act. Ms. Nelson is also the CCO of ALPS Variable Investment Trust, Liberty All-Star Growth Fund, Inc., Liberty All- Star Equity Fund, Principal Real Estate Income Fund, RiverNorth Opportunities Fund, Inc. and Red Rocks Capital, LLC. |
Patrick D.
Buchanan,
1972 | Treasurer | Since June 2012 | Mr. Buchanan is Vice President of AAI. Mr. Buchanan joined ALPS in 2007 and because of his position with AAI, he is deemed an affiliate of the Trust as defined under the 1940 Act. Mr. Buchanan is also Treasurer of the ALPS Variable Insurance Trust, Principal Real Estate Income Fund, Clough Funds Trust and RiverNorth Opportunities Fund, Inc. |
Andrea E.
Kuchli,
1985 | Secretary | Since December 2017 | Ms. Kuchli joined ALPS in 2015 and is currently Vice President and Senior Counsel of ALPS. Prior to joining ALPS, Ms. Kuchli was an Associate with Davis Graham & Stubbs LLP from April 2014 to February 2015, and an Associate with Dechert LLP from 2011 to April 2014. Because of her position with ALPS, Ms. Kuchli is deemed an affiliate of the Trust as defined under the 1940 Act. Ms. Kuchli is also Secretary of ALPS Variable Investment Trust, Elevation ETF Trust and Principal Real Estate Income Fund as well as Assistant Secretary of the James Advantage Funds. |
Sharon
Akselrod,
1974 | Assistant Secretary | Since December 2016 | Ms. Akselrod joined ALPS in August 2014 and is currently Senior Investment Company Act Paralegal of ALPS Fund Services, Inc. Prior to joining ALPS, Ms. Akselrod served as Corporate Governance and Regulatory Associate for Nordstrom fsb (2013-2014) and Senior Legal Assistant – Legal Manager for AXA Equitable Life Insurance Company (2008-2013). Because of her position with ALPS, Ms. Akselrod is deemed an affiliate of the Trust as defined under the 1940 Act. Ms. Akselrod is also Assistant Secretary of Financial Investors Trust and Principal Real Estate Income Fund. |
Stephanie G.
Danner,
1992 | Assistant Secretary | Since December 2017 | Ms. Danner joined ALPS in September of 2017 and is currently Vice President and Associate Senior Counsel of ALPS. Because of her position with ALPS, Ms. Danner is deemed an affiliate of the Trust as defined under the 1940 Act. |
| * | The business address of each Officer is c/o ALPS Advisors, Inc., 1290 Broadway, Suite 1100, Denver, Colorado 80203. |
| ** | This is the period for which the Officer began serving the Trust. Each Officer serves an indefinite term, until his/her successor is elected. |
The Statement of Additional Information includes additional information about the Fund's Trustees and is available, without charge, upon request by calling (toll-free) 1-855-724-0450.
Page Intentionally Left Blank.
Page Intentionally Left Blank.

Must be accompanied or preceded by a prospectus.
ALPS Portfolio Solutions Distributor, Inc., a FINRA member, is the Distributor for the Barron’s 400SM ETF.

| Performance Overview | 1 |
| Disclosure of Fund Expenses | 4 |
| Report of Independent Registered Public Accounting Firm | 5 |
| Schedules of Investments | 6 |
| Statement of Assets and Liabilities | 8 |
| Statement of Operations | 9 |
| Statements of Changes in Net Assets | 10 |
| Financial Highlights | 11 |
| Notes to Financial Statements | 12 |
| Additional Information | 18 |
| Board Considerations Regarding Approval of Investment Advisory Agreements | 20 |
| Trustees & Officers | 21 |
alpsfunds.com
| BUZZ US Sentiment Leaders ETF | |
| Performance Overview | November 30, 2017 (Unaudited) |
Investment Objective
The BUZZ US Sentiment Leaders ETF (the “Fund”) employs a “passive management” – or indexing – investment approach designed to seek investment results that correspond (before fees and expenses) generally to the performance of its underlying index, the BUZZ NextGen AI US Sentiment Leaders Index (the “Underlying Index”).
The Underlying Index utilizes a rules-based quantitative methodology developed by BUZZ Indexes Inc. (the “Index Provider”), which is designed to identify the U.S. common stocks with the most “positive insights” collected from social media networks. Such positive insights are a measure of the degree of positive company sentiment as well as the breadth of active discussion about each company by participants on social media networks. The Index Provider then selects the 75 companies with the highest positive insight scores for inclusion in the Underlying Index and weights the 75 constituent common stocks of the Underlying Index based on a proprietary scoring model.
Performance Overview
BUZZ US Sentiment Leaders ETF (BUZ) for the twelve month period ended November 30, 2017, generated a total return of 23.72%, in line with the Fund’s Underlying Index, net of fees, which returned 24.27%. The Fund outperformed the S&P 500, which returned 22.87% for the same period.
The S&P 500 rallied from 11/30/16 through the end of the first calendar quarter in 2017. The election of President Trump fueled optimism in the marketplace on hopes that tax and healthcare reform would pass in a Republican controlled congress. Oil saw moderate volatility during the year, exhibiting a low of $42.53 per barrel on June 21 and reached a high of $58.95 on November 24th. During the year, oil exhibited an average price of $50.40. The S&P 500 returned 3.07% in Q2 2017. Relative to the previous quarter, the U.S. market saw modest positive returns. Monetary policy remained unsurprising due to the continued assurance from the Federal Reserve that a slow and anticipated rise in short term interest rates will continue. During the third calendar quarter of 2017, the S&P 500 returned 4.41%. Although pro-growth policies and reform had yet to surface in the first half of the year, optimism remained in the market. The majority of U.S. equities’ gains came in the first two months of Q4, which returned 5.49%. The announcement that the Republican Party had enough votes to pass tax reforms in the House and Senate spurred a strong rally in the U.S. Market. In addition, companies in the S&P 500, on average, reported strong Q3 earnings.
The BUZZ US Sentiment Leaders ETF largely outperformed the S&P 500 during the year providing 1.77% in alpha. Outperformance was driven solely by allocation effect with an overweight to Information Technology providing the lift. NVIDIA Corp (NVDA), Micron Technology INC (MU), and Square INC – A (SQ) provided a bulk of the boost contributing 1.51%, 1.42%, and 1.20% to Fund return, respectively. Valeant Pharmaceuticals (Valeant) was the overall loser for the portfolio detracting 1.65% from return. Note that Valeant was re-added to the portfolio on 11/16/17 and has returned 16.81% through the end of November. While allocation effect resulted in positive attribution for BUZ, selection effect was negative for the period driven down by names in Health Care and Materials.
Looking forward we believe the Fund’s strategy of using Artificial Intelligence, Natural Language Processing, and Machine learning to identify the top names within the social universe with positive sentiment may lead to market participation in all economic cycles.
Performance (as of November 30, 2017)
| | 1 Year | Since Inception^ |
| BUZZ US Sentiment Leaders ETF - NAV | 23.72% | 15.97% |
| BUZZ US Sentiment Leaders ETF - Market Price* | 23.92% | 16.08% |
| BUZZ NextGen AI US Sentiment Leaders Total Return Index | 24.27% | 16.49% |
| S&P 500® Total Return Index | 22.87% | 18.03% |
Total Expense Ratio (per the current prospectus) 0.75%
Performance data quoted represents past performance. Past performance does not guarantee future results. The table does not reflect the deduction of taxes that a shareholder would pay on Fund distributions or the redemption of Fund shares. Investment return and principal value of an investment will fluctuate so that an investor’s shares, when redeemed, may be worth more or less than their original cost. Current performance may be higher or lower than actual data quoted. For the most current month-end performance data please visit www.alpsfunds.com or call 1.855.215.1425.
| BUZZ US Sentiment Leaders ETF | |
| Performance Overview | November 30, 2017 (Unaudited) |
NAV is an exchange-traded fund’s per-share value. The per-share dollar amount of the Fund is derived by dividing the total value of all the securities in its portfolio, less any liabilities, by the number of Fund shares outstanding. Market Price is the price at which a share can currently be traded in the market. Information detailing the number of days the Market Price of the Fund was greater than the Fund’s NAV and the number of days it was less than the Fund’s NAV can be obtained at www.alpsfunds.com.
| ^ | The Fund’s Commencement date was April 19, 2016. Total return for a period of less than one year is not annualized. |
| * | Market Price is based on the midpoint of the bid-ask spread at 4 p.m. ET and does not represent the returns an investor would receive if shares were traded at other times. |
BUZZ NextGen AI US Sentiment Leaders Total Return Index is comprised of 75 stocks with the highest “positive insight” rankings collected from online forums. These stocks must meet certain market capitalization and average daily trading volume requirements to be included in the index and are weighted based on a proprietary scoring model developed by BUZZ Indexes Inc.
S&P 500® Total Return Index is the Standard & Poor’s composite index of 500 stocks, a widely recognized, unmanaged index of common stock prices.
The indexes are reported on a total return basis, which assumes reinvestment of any dividends and distributions realized during a given time period. The indexes are not actively managed and do not reflect any deductions for fees, expenses or taxes. One cannot invest directly in an index. Index performance does not reflect fund performance.
Funds that invest in securities of medium capitalization companies involve greater risk than customarily is associated with investing in larger, more established companies. A medium capitalization company is defined as a company with a market capitalization between $2 billion and $10 billion. These companies’ securities may be more volatile and less liquid than those of more established companies. These securities may have returns that vary, sometimes significantly, from the overall securities market. Often medium capitalization companies and the industries in which they focus are still evolving and, as a result, they may be more sensitive to changing market conditions.
The Fund’s shares are not individually redeemable. Investors buy and sell shares of the Fund on a secondary market. Only market makers or “authorized participants” may trade directly with the Fund, typically in blocks of 50,000 shares.
The BUZZ US Sentiment Leaders ETF is not suitable for all investors. Investments in the Fund are subject to investment risks, including possible loss of the principal amount invested.
ALPS Portfolio Solutions Distributor, Inc., a FINRA member, is the distributor for the BUZZ US Sentiment Leaders ETF.
ALPS Portfolio Solutions Distributor, Inc. is not affiliated with BUZZ Indexes Inc.
| BUZZ US Sentiment Leaders ETF | |
| Performance Overview | November 30, 2017 (Unaudited) |
Top 10 Holdings* (as of November 30, 2017)
| Valeant Pharmaceuticals International, Inc. | 3.47% |
| Amazon.com, Inc. | 3.08% |
| Gilead Sciences, Inc. | 3.07% |
| Microsoft Corp. | 3.01% |
| Apple, Inc. | 2.99% |
| Alphabet, Inc. | 2.94% |
| Facebook, Inc. | 2.93% |
| PayPal Holdings, Inc. | 2.90% |
| Advanced Micro Devices, Inc. | 2.88% |
| Intuitive Surgical, Inc. | 2.88% |
| Total % of Top 10 Holdings | 30.15% |
Sector Allocation* (as of November 30, 2017)
| Information Technology | 44.57% |
| Health Care | 19.14% |
| Consumer Discretionary | 13.83% |
| Telecommunication Services | 5.98% |
| Consumer Staples | 5.57% |
| Industrials | 5.33% |
| Financials | 3.25% |
| Materials | 1.43% |
| Energy | 0.75% |
| Money Market Fund | 0.15% |
| Total | 100.00% |
Future holdings are subject to change.
Growth of $10,000 (as of November 30, 2017)
Comparison of Change in Value of $10,000 Investment in the Fund and the Underlying Index
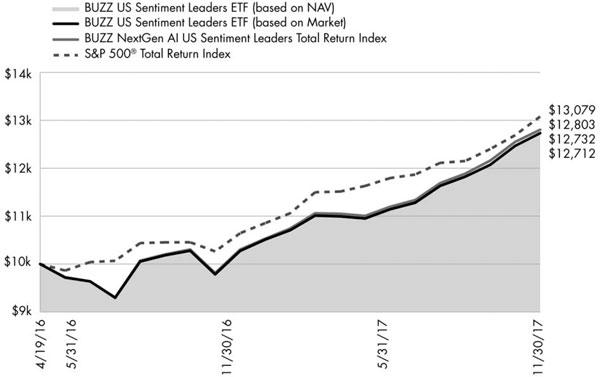
The chart above represents historical performance of a hypothetical investment of $10,000 in the Fund over the life of the Fund. Past performance does not guarantee future results. This chart does not reflect the deduction of taxes that a shareholder would pay on Fund distributions or the redemption of Fund shares.
| BUZZ US Sentiment Leaders ETF | |
| Disclosure of Fund Expenses | November 30, 2017 (Unaudited) |
Shareholder Expense Example: As a shareholder of the Fund, you incur two types of costs: (1) transaction costs which may include creation and redemption fees or brokerage charges, and (2) ongoing costs, including management fees and other Fund expenses. These examples are intended to help you understand your ongoing costs (in dollars) of investing in a Fund and to compare these costs with the ongoing costs of investing in other funds. It is based on an investment of $1,000 invested at the beginning of the (six month) period and held through November 30, 2017.
Actual Return: The first line of the table provides information about actual account values and actual expenses. You may use the information in this line, together with the amount you invested, to estimate the expenses that you incurred over the period. Simply divide your account value by $1,000 (for example, an $8,600 account value divided by $1,000 = 8.6), then multiply the result by the number in the first line under the heading entitled “Expenses Paid During Period” to estimate the expenses attributable to your investment during this period.
Hypothetical 5% Return: The second line of the table provides information about hypothetical account values and hypothetical expenses based on the Fund’s actual expense ratio and an assumed rate of return of 5% per year before expenses, which is not the Fund’s actual return. The hypothetical account values and expenses may not be used to estimate the actual ending account balance or expenses you paid for the period. You may use this information to compare ongoing costs of investing in the Fund and other funds. To do so, compare this 5% hypothetical example with the 5% hypothetical examples that appear in the shareholder reports of other funds.
The expenses shown in the table are meant to highlight ongoing Fund costs only and do not reflect any transaction costs, such as creation and redemption fees or brokerage charges. Therefore, the second line is useful in comparing ongoing costs only, and will not help you determine the relative total costs of owning different funds. In addition, if these costs were included, your costs would have been higher.
| | Beginning Account Value 6/1/17 | Ending Account Value 11/30/17 | Expense Ratio(a) | Expenses Paid During Period 6/1/17 - 11/30/17(b) |
| Actual | $1,000.00 | $1,140.80 | 0.75% | $4.02 |
| Hypothetical (5% return before expenses) | $1,000.00 | $1,021.31 | 0.75% | $3.80 |
| (a) | Annualized, based on the Fund's most recent fiscal half year expenses. |
| (b) | Expenses are equal to the Fund's annualized expense ratio multiplied by the average account value over the period, multiplied by the number of days in the most recent fiscal half year (183), divided by 365. |
BUZZ US Sentiment Leaders ETF
Report of Independent Registered Public Accounting Firm
To the Board of Trustees and Shareholders of ALPS ETF Trust:
We have audited the accompanying statement of assets and liabilities, including the schedule of investments, of BUZZ US Sentiment Leaders ETF, one of the portfolios constituting the ALPS ETF Trust (the “Trust”), as of November 30, 2017, and the related statement of operations for the year then ended and the statements of changes in net assets and financial highlights for the year then ended and for the period April 19, 2016 (commencement of operations) to November 30, 2016. These financial statements and financial highlights are the responsibility of the Trust’s management. Our responsibility is to express an opinion on these financial statements and financial highlights based on our audits.
We conducted our audits in accordance with the standards of the Public Company Accounting Oversight Board (United States). Those standards require that we plan and perform the audit to obtain reasonable assurance about whether the financial statements and financial highlights are free of material misstatement. The Trust is not required to have, nor were we engaged to perform, an audit of its internal control over financial reporting. Our audits included consideration of internal control over financial reporting as a basis for designing audit procedures that are appropriate in the circumstances, but not for the purpose of expressing an opinion on the effectiveness of the Trust’s internal control over financial reporting. Accordingly, we express no such opinion. An audit also includes examining, on a test basis, evidence supporting the amounts and disclosures in the financial statements, assessing the accounting principles used and significant estimates made by management, as well as evaluating the overall financial statement presentation. Our procedures included confirmation of securities owned as of November 30, 2017, by correspondence with the custodian and broker. We believe that our audits provide a reasonable basis for our opinion.
In our opinion, the financial statements and financial highlights referred to above present fairly, in all material respects, the financial position of BUZZ US Sentiment Leaders ETF of the ALPS ETF Trust as of November 30, 2017, the results of its operations for the year then ended, and the changes in its net assets and the financial highlights for the year then ended and for the period April 19, 2016 (commencement of operations) to November 30, 2016, in conformity with accounting principles generally accepted in the United States of America.
DELOITTE & TOUCHE LLP
Denver, Colorado
January 26, 2018
| BUZZ US Sentiment Leaders ETF | |
| Schedule of Investments | November 30, 2017 |
| Security Description | | Shares | | Value |
| COMMON STOCKS (99.92%) | | | | | | | | |
| Consumer Discretionary (13.84%) | | | | | | | | |
| Amazon.com, Inc.(a) | | | 249 | | | $ | 293,011 | |
| Ford Motor Co. | | | 6,384 | | | | 79,928 | |
| Harley-Davidson, Inc. | | | 1,008 | | | | 50,602 | |
| Home Depot, Inc. | | | 253 | | | | 45,494 | |
| Netflix, Inc.(a) | | | 1,091 | | | | 204,650 | |
| NIKE, Inc., Class B | | | 1,335 | | | | 80,661 | |
| Starbucks Corp. | | | 901 | | | | 52,096 | |
| Target Corp. | | | 1,479 | | | | 88,592 | |
| Tesla, Inc.(a) | | | 377 | | | | 116,436 | |
| Viacom, Inc., Class B | | | 2,914 | | | | 82,524 | |
| Walt Disney Co. | | | 1,540 | | | | 161,423 | |
| Wynn Resorts, Ltd. | | | 401 | | | | 63,390 | |
| Total Consumer Discretionary | | | | | | | 1,318,807 | |
| | | | | | | | | |
| Consumer Staples (5.57%) | | | | | | | | |
| Altria Group, Inc. | | | 806 | | | | 54,671 | |
| Costco Wholesale Corp. | | | 282 | | | | 52,009 | |
| CVS Health Corp. | | | 1,214 | | | | 92,993 | |
| Kroger Co. | | | 3,651 | | | | 94,415 | |
| Procter & Gamble Co. | | | 620 | | | | 55,794 | |
| Walgreens Boots Alliance, Inc. | | | 1,175 | | | | 85,493 | |
| Wal-Mart Stores, Inc. | | | 980 | | | | 95,285 | |
| Total Consumer Staples | | | | | | | 530,660 | |
| | | | | | | | | |
| Energy (0.75%) | | | | | | | | |
| Kinder Morgan, Inc. | | | 4,159 | | | | 71,659 | |
| Total Energy | | | | | | | 71,659 | |
| | | | | | | | | |
| Financials (3.25%) | | | | | | | | |
| Bank of America Corp. | | | 5,933 | | | | 167,133 | |
| Citigroup, Inc. | | | 604 | | | | 45,602 | |
| JPMorgan Chase & Co. | | | 925 | | | | 96,681 | |
| Total Financials | | | | | | | 309,416 | |
| | | | | | | | | |
| Health Care (19.16%) | | | | | | | | |
| AbbVie, Inc. | | | 1,638 | | | | 158,755 | |
| Amgen, Inc. | | | 289 | | | | 50,766 | |
| Biogen, Inc.(a) | | | 175 | | | | 56,380 | |
| Celgene Corp.(a) | | | 1,646 | | | | 165,966 | |
| Exelixis, Inc.(a) | | | 6,959 | | | | 188,450 | |
| Gilead Sciences, Inc. | | | 3,914 | | | | 292,689 | |
| Intuitive Surgical, Inc.(a) | | | 686 | | | | 274,249 | |
| Ionis Pharmaceuticals, Inc.(a) | | | 1,639 | | | | 90,948 | |
| Johnson & Johnson | | | 527 | | | | 73,427 | |
| Merck & Co., Inc. | | | 956 | | | | 52,838 | |
| Pfizer, Inc. | | | 1,247 | | | | 45,216 | |
| Regeneron Pharmaceuticals, Inc.(a) | | | 122 | | | | 44,147 | |
| Valeant Pharmaceuticals International, Inc.(a) | | | 19,762 | | | | 331,013 | |
| Total Health Care | | | | | | | 1,824,844 | |
| | | | | | | | | |
| Industrials (5.33%) | | | | | | | | |
| Boeing Co. | | | 458 | | | | 126,774 | |
| Caterpillar, Inc. | | | 505 | | | | 71,281 | |
| General Electric Co. | | | 2,864 | | | | 52,383 | |
| Lockheed Martin Corp. | | | 180 | | | | 57,442 | |
| Raytheon Co. | | | 670 | | | | 128,070 | |
| United Continental Holdings, Inc.(a) | | | 1,137 | | | | 71,995 | |
| Total Industrials | | | | | | | 507,945 | |
| | | | | | | | | |
| Information Technology (44.60%) | | | | | | | | |
| Activision Blizzard, Inc. | | | 4,168 | | | | 260,083 | |
| Adobe Systems, Inc.(a) | | | 321 | | | | 58,252 | |
| Advanced Micro Devices, Inc.(a) | | | 25,193 | | | | 274,352 | |
| Alphabet, Inc., Class A(a) | | | 270 | | | | 279,766 | |
| Apple, Inc. | | | 1,655 | | | | 284,412 | |
| Applied Materials, Inc. | | | 1,815 | | | | 95,778 | |
| Arista Networks, Inc.(a) | | | 202 | | | | 47,090 | |
| Broadcom, Ltd. | | | 441 | | | | 122,572 | |
| Electronic Arts, Inc.(a) | | | 434 | | | | 46,156 | |
| Facebook, Inc., Class A(a) | | | 1,577 | | | | 279,413 | |
| Intel Corp. | | | 5,140 | | | | 230,478 | |
| International Business Machines Corp. | | | 380 | | | | 58,509 | |
| Lam Research Corp. | | | 470 | | | | 90,395 | |
| Mastercard, Inc., Class A | | | 752 | | | | 113,153 | |
| Micron Technology, Inc.(a) | | | 6,137 | | | | 260,147 | |
| Microsoft Corp. | | | 3,408 | | | | 286,851 | |
| NVIDIA Corp. | | | 1,340 | | | | 268,951 | |
| Oracle Corp. | | | 1,008 | | | | 49,452 | |
| PayPal Holdings, Inc.(a) | | | 3,649 | | | | 276,339 | |
| QUALCOMM, Inc. | | | 1,741 | | | | 115,498 | |
| Skyworks Solutions, Inc. | | | 573 | | | | 60,016 | |
| Square, Inc., Class A(a) | | | 6,763 | | | | 265,245 | |
| Take-Two Interactive Software, Inc. (a) | | | 655 | | | | 73,065 | |
| Texas Instruments, Inc. | | | 492 | | | | 47,867 | |
| Twitter, Inc.(a) | | | 6,975 | | | | 143,545 | |
| Universal Display Corp. | | | 609 | | | | 110,229 | |
| Visa, Inc., Class A | | | 461 | | | | 51,904 | |
| Total Information Technology | | | | | | | 4,249,518 | |
| | | | | | | | | |
| Materials (1.43%) | | | | | | | | |
| Albemarle Corp. | | | 393 | | | | 52,788 | |
| Freeport-McMoRan, Inc.(a) | | | 6,010 | | | | 83,659 | |
| Total Materials | | | | | | | 136,447 | |
| | | | | | | | | |
| Telecommunication Services (5.99%) | | | | | | | | |
| AT&T, Inc. | | | 7,278 | | | | 264,774 | |
| Sprint Corp.(a) | | | 30,166 | | | | 180,694 | |
| T-Mobile US, Inc.(a) | | | 830 | | | | 50,688 | |
| Verizon Communications, Inc. | | | 1,459 | | | | 74,248 | |
| Total Telecommunication Services | | | | | | | 570,404 | |
| | | | | | | | | |
| TOTAL COMMON STOCKS | | | | | | | | |
| (Cost $8,454,540) | | | | | | | 9,519,700 | |
| | | 7 Day Yield | | Shares | | Value |
| SHORT TERM INVESTMENTS (0.15%) | | | | | |
| Money Market Fund (0.15%) | | | | | | | | | |
| State Street Institutional Treasury Plus Money Market Fund | | | 0.970 | % | | | 14,406 | | | | 14,406 | |
| TOTAL SHORT TERM INVESTMENTS | | | | | |
| (COST OF $14,406) | | | | | | | | | | | 14,406 | |
| BUZZ US Sentiment Leaders ETF | |
| Schedule of Investments | November 30, 2017 |
| TOTAL INVESTMENTS (100.07%) | | |
| (Cost $8,468,946) | | $ | 9,534,106 | |
| | | | | |
| NET OTHER ASSETS AND LIABILITIES (-0.07%) | | | (6,275 | ) |
| | | | | |
| NET ASSETS (100.00%) | | $ | 9,527,831 | |
| (a) | Non-income producing security. |
See Notes to Financial Statements.
| BUZZ US Sentiment Leaders ETF | |
| Statement of Assets and Liabilities | November 30, 2017 |
| ASSETS: | | |
| Investments, at value | | $ | 9,534,106 | |
| Dividends receivable | | | 13,486 | |
| Total Assets | | | 9,547,592 | |
| | | | | |
| LIABILITIES: | | | | |
| Payable for investments purchased | | | 13,934 | |
| Payable to adviser | | | 5,827 | |
| Total Liabilities | | | 19,761 | |
| NET ASSETS | | $ | 9,527,831 | |
| | | | | |
| NET ASSETS CONSIST OF: | | | | |
| Paid-in capital | | $ | 8,944,902 | |
| Accumulated net investment income | | | 39,558 | |
| Accumulated net realized loss | | | (521,789 | ) |
| Net unrealized appreciation | | | 1,065,160 | |
| NET ASSETS | | $ | 9,527,831 | |
| | | | | |
| INVESTMENTS, AT COST | | $ | 8,468,946 | |
| | | | | |
| PRICING OF SHARES | | | | |
| Net Assets | | $ | 9,527,831 | |
| Shares of beneficial interest outstanding (Unlimited number of shares authorized, par value $0.01 per share) | | | 300,002 | |
| Net Asset Value, offering and redemption price per share | | $ | 31.76 | |
See Notes to Financial Statements.
| BUZZ US Sentiment Leaders ETF | |
| Statement of Operations | For the Year Ended November 30, 2017 |
| INVESTMENT INCOME: | | |
| Dividends | | $ | 103,135 | |
| Securities lending income | | | 1,377 | |
| Total Investment Income | | | 104,512 | |
| | | | | |
| EXPENSES: | | | | |
| Investment adviser fees | | | 56,482 | |
| Total Expenses | | | 56,482 | |
| NET INVESTMENT INCOME | | | 48,030 | |
| | | | | |
| REALIZED AND UNREALIZED GAIN/(LOSS) | | | | |
| Net realized gain on investments | | | 779,407 | |
| Net change in unrealized appreciation on investments | | | 909,686 | |
| NET REALIZED AND UNREALIZED GAIN ON INVESTMENTS | | | 1,689,093 | |
| NET INCREASE IN NET ASSETS RESULTING FROM OPERATIONS | | $ | 1,737,123 | |
See Notes to Financial Statements.
| BUZZ US Sentiment Leaders ETF |
| Statements of Changes in Net Assets |
| | | For the Year Ended November 30, 2017 | | For the Period April 19, 2016 (Commencement of Operations) to November 30, 2016 |
| OPERATIONS: | | | | |
| Net investment income | | $ | 48,030 | | | $ | 26,004 | |
| Net realized gain | | | 779,407 | | | | 17,488 | |
| Net change in unrealized appreciation | | | 909,686 | | | | 155,474 | |
| Net increase in net assets resulting from operations | | | 1,737,123 | | | | 198,966 | |
| | | | | | | | | |
| DISTRIBUTIONS TO SHAREHOLDERS: | | | | | | | | |
| From net investment income | | | (35,000 | ) | | | – | |
| Total distributions | | | (35,000 | ) | | | – | |
| | | | | | | | | |
| CAPITAL SHARE TRANSACTIONS: | | | | | | | | |
| Proceeds from sale of shares | | | 11,412,195 | | | | 7,542,694 | |
| Cost of shares redeemed | | | (8,755,528 | ) | | | (2,572,619 | ) |
| Net increase from capital share transactions | | | 2,656,667 | | | | 4,970,075 | |
| Net increase in net assets | | | 4,358,790 | | | | 5,169,041 | |
| | | | | | | | | |
| NET ASSETS: | | | | | | | | |
| Beginning of year | | | 5,169,041 | | | | – | |
| End of year * | | $ | 9,527,831 | | | $ | 5,169,041 | |
| | | | | | | | | |
| *Including accumulated net investment income of: | | $ | 39,558 | | | $ | 24,716 | |
| | | | | | | | | |
| OTHER INFORMATION: | | | | | | | | |
| CAPITAL SHARE TRANSACTIONS: | | | | | | | | |
| Beginning shares | | | 200,002 | | | | – | |
| Shares sold | | | 400,000 | | | | 300,002 | |
| Shares redeemed | | | (300,000 | ) | | | (100,000 | ) |
| Shares outstanding, end of period | | | 300,002 | | | | 200,002 | |
See Notes to Financial Statements.
| BUZZ US Sentiment Leaders ETF | |
| Financial Highlights | For a Share Outstanding Throughout the Period Presented |
| | | For the Year Ended November 30, 2017 | | For the Period April 19, 2016 (Commencement of Operations) to November 30, 2016 |
| NET ASSET VALUE, BEGINNING OF PERIOD | | $ | 25.84 | | | $ | 25.15 | |
| | | | | | | | | |
| INCOME/(LOSS) FROM INVESTMENT OPERATIONS: | | | | | | | | |
| Net investment income (a) | | | 0.18 | | | | 0.13 | |
| Net realized and unrealized gain | | | 5.92 | | | | 0.56 | |
| Total from investment operations | | | 6.10 | | | | 0.69 | |
| | | | | | | | | |
| DISTRIBUTIONS: | | | | | | | | |
| From net investment income | | | (0.18 | ) | | | – | |
| Total distributions | | | (0.18 | ) | | | – | |
| | | | | | | | | |
| Net increase in net asset value | | | 5.92 | | | | 0.69 | |
| NET ASSET VALUE, END OF PERIOD | | $ | 31.76 | | | $ | 25.84 | |
| TOTAL RETURN(b) | | | 23.72 | % | | | 2.74 | % |
| | | | | | | | | |
| RATIOS/SUPPLEMENTAL DATA: | | | | | | | | |
| Net assets, end of period (000s) | | $ | 9,528 | | | $ | 5,169 | |
| | | | | | | | | |
| Ratio of expenses to average net assets | | | 0.75 | % | | | 0.75 | %(c) |
| Ratio of net investment income to average net assets | | | 0.64 | % | | | 0.87 | %(c) |
| Portfolio turnover rate(d) | | | 260 | % | | | 157 | % |
| (a) | Based on average shares outstanding during the period. |
| (b) | Total return is calculated assuming an initial investment made at the net asset value at the beginning of the period and redemption at the net asset value on the last day of the period and assuming all distributions are reinvested at reinvestment prices. Total return calculated for a period of less than one year is not annualized. |
| (d) | Portfolio turnover for periods less than one year are not annualized and does not include securities received or delivered from processing creations or redemptions in-kind. |
See Notes to Financial Statements.
| BUZZ US Sentiment Leaders ETF | |
| Notes to Financial Statements | November 30, 2017 |
1. ORGANIZATION
ALPS ETF Trust (the “Trust”), a Delaware statutory trust, is an open-end management investment company registered under the Investment Company Act of 1940, as amended (the “1940 Act”). As of November 30, 2017, the Trust consisted of nineteen separate portfolios. Each portfolio represents a separate series of the Trust. This report pertains solely to the BUZZ US Sentiment Leaders ETF (the “Fund”). Prior to March 31, 2017, the Fund was known as the Sprott BUZZ Social Media Insights ETF. The investment objective of the Fund is to seek investment results that correspond (before fees and expenses) generally to the performance of the BUZZ NextGen AI US Sentiment Leaders Index (the “Underlying Index”). The BUZZ US Sentiment Leaders ETF is considered a non-diversified and may invest a greater portion of assets in securities of individual issuers than a diversified fund. As a result, changes in the market value of a single investment could cause greater fluctuations in share price than would occur in a diversified fund.
The Fund’s Shares (“Shares”) are listed on the NYSE Arca, Inc. The Fund issues and redeems Shares at net asset value (“NAV”) in blocks of 50,000 Shares, each of which is called a “Creation Unit”. Creation Units are issued and redeemed principally in-kind for securities included in the Underlying Index. Except when aggregated in Creation Units, Shares are not redeemable securities of the Fund.
Pursuant to the Trust’s organizational documents, its Officers and Trustees are indemnified against certain liability arising out of the performance of their duties to the Trust. Additionally, in the normal course of business, the Trust enters into contracts with service providers that contain general indemnification clauses. The Trust’s maximum exposure under these arrangements is unknown, as this would involve future claims that may be made against the Trust that have not yet occurred.
2. SIGNIFICANT ACCOUNTING POLICIES
The following is a summary of significant accounting policies consistently followed by the Fund in the preparation of the financial statements. The accompanying financial statements were prepared in accordance with accounting principles generally accepted in the United States of America (“U.S. GAAP”). The preparation of financial statements in conformity with U.S. GAAP requires management to make certain estimates and assumptions that affect the reported amounts of assets and liabilities and disclosures of contingent assets and liabilities at the date of the financial statements and the reported amounts of revenue and expenses during the period. Actual results could differ from those estimates. The Fund is considered an investment company under U.S. GAAP and follows the accounting and reporting guidance applicable to investment companies in the Financial Accounting Standards Board Accounting Standards Codification Topic 946.
A. Portfolio Valuation
The Fund’s NAV is determined daily, as of the close of regular trading on the New York Stock Exchange (the “NYSE”), normally 4:00 p.m. Eastern time, on each day the NYSE is open for trading. The NAV is computed by dividing the value of all assets of the Fund (including accrued interest and dividends), less all liabilities (including accrued expenses and dividends declared but unpaid), by the total number of shares outstanding.
Portfolio securities listed on any exchange other than the NASDAQ Stock Market LLC (“NASDAQ”) are valued at the last sale price on the business day as of which such value is being determined. If there has been no sale on such day, the securities are valued at the mean of the most recent bid and ask prices on such day. Securities traded on the NASDAQ are valued at the NASDAQ Official Closing Price as determined by NASDAQ. Portfolio securities traded on more than one securities exchange are valued at the last sale price on the business day as of which such value is being determined at the close of the exchange representing the principal market for such securities. Portfolio securities traded in the over-the-counter market, but excluding securities traded on the NASDAQ, are valued at the latest quoted sale price in such market.
The Fund’s investments are valued at market value or, in the absence of market value with respect to any portfolio securities, at fair value according to procedures adopted by the Trust’s Board of Trustees (the “Board”). When market quotations are not readily available or when events occur that make established valuation methods unreliable, securities of the Fund may be valued in good faith by or under the direction of the Board. These securities generally include, but are not limited to, restricted securities (securities which may not be publicly sold without registration under the Securities Act of 1933) for which a pricing service is unable to provide a market price; securities whose trading has been formally suspended; a security whose market price is not available from a pre-established primary pricing source or the pricing source is not willing to provide a price; a security with respect to which an event has occurred that is most likely to materially affect the value of the security after the market has closed but before the calculation of the Fund’s NAV or make it difficult or impossible to obtain a reliable market quotation; or a security whose price, as provided by the pricing service, does not reflect the security’s “fair value” due to the security being de-listed from a national exchange or the security’s primary trading market is temporarily closed at a time when, under normal conditions, it would be open. As a general principle, the current “fair value” of a security would be the amount which the owner might reasonably expect to receive from the sale on the applicable exchange or principal market. A variety of factors may be considered in determining the fair value of such securities.
| BUZZ US Sentiment Leaders ETF | |
| Notes to Financial Statements | November 30, 2017 |
B. Fair Value Measurements
The Fund discloses the classification of its fair value measurements following a three-tier hierarchy based on the inputs used to measure fair value. Inputs refer broadly to the assumptions that market participants would use in pricing the asset or liability; including assumptions about risk. Inputs may be observable or unobservable. Observable inputs reflect the assumptions market participants would use in pricing the asset or liability that are developed based on market data obtained from sources independent of the reporting entity. Unobservable inputs reflect the reporting entity’s own assumptions about the assumptions market participants would use in pricing the asset or liability that are developed based on the best information available.
Valuation techniques used to value the Fund's investments by major category are as follows:
Equity securities and Limited Partnerships, including restricted securities, for which market quotations are readily available, are valued at the last reported sale price or official closing price as reported by a third party pricing vendor on the primary market or exchange on which they are traded and are categorized as Level 1 in the hierarchy. In the event there were no sales during the day or closing prices are not available, securities are valued at the mean of the most recent quoted bid and ask prices on such day and are generally categorized as Level 2 in the hierarchy. Investments in open-end mutual funds are valued at their closing NAV each business day and are categorized as Level 1 in the hierarchy.
Changes in valuation techniques may result in transfers in or out of an assigned level within the disclosure hierarchy.
Various inputs are used in determining the value of the Fund’s investments as of the end of the reporting period. When inputs used fall into different levels of the fair value hierarchy, the level in the hierarchy within which the fair value measurement falls is determined based on the lowest level input that is significant to the fair value measurement in its entirety. The designated input levels are not necessarily an indication of the risk or liquidity associated with these investments.
These inputs are categorized in the following hierarchy under applicable financial accounting standards:
| Level 1 – | Unadjusted quoted prices in active markets for identical investments, unrestricted assets or liabilities that a Fund has the ability to access at the measurement date; |
| Level 2 – | Quoted prices which are not active, quoted prices for similar assets or liabilities in active markets or inputs other than quoted prices that are observable (either directly or indirectly) for substantially the full term of the asset or liability; and |
| Level 3 – | Significant unobservable prices or inputs (including the Fund’s own assumptions in determining the fair value of investments) where there is little or no market activity for the asset or liability at the measurement date. |
The following is a summary of the inputs used to value the Fund’s investments as of November 30, 2017:
BUZZ US Sentiment Leaders ETF
| Investments in Securities at Value* | | Level 1 - Unadjusted Quoted Prices | | Level 2 - Other Significant Observable Inputs | | Level 3 - Significant Unobservable Inputs | | Total |
| Common Stocks | | $ | 9,519,700 | | | $ | – | | | $ | – | | | $ | 9,519,700 | |
| Short Term Investments | | | 14,406 | | | | – | | | | – | | | | 14,406 | |
| TOTAL | | $ | 9,534,106 | | | $ | – | | | $ | – | | | $ | 9,534,106 | |
| * | For a detailed sector breakdown, see the accompanying Schedule of Investments. |
The Fund recognizes transfers between levels as of the end of the period. For the year ended November 30, 2017, the Fund did not have any transfers between Level 1 and Level 2 securities. The Fund did not have any securities that used significant unobservable inputs (Level 3) in determining fair value.
C. Securities Transactions and Investment Income
Securities transactions are recorded as of the trade date. Realized gains and losses from securities transactions are recorded on the highest cost basis. Dividend income and capital gains distributions, if any, are recorded on the ex-dividend date. Interest income, if any, is recorded on the accrual basis.
| BUZZ US Sentiment Leaders ETF | |
| Notes to Financial Statements | November 30, 2017 |
D. Dividends and Distributions to Shareholders
Dividends from net investment income of the Fund, if any, are declared and paid annually or as the Board may determine from time to time. Distributions of net realized capital gains earned by the Fund, if any, are distributed at least annually.
E. Federal Tax and Tax Basis Information
The timing and character of income and capital gain distributions are determined in accordance with income tax regulations, which may differ from U.S. GAAP. Reclassifications are made to the Fund’s capital accounts for permanent tax differences to reflect income and gains available for distribution (or available capital loss carryforwards) under income tax regulations.
For the year or period ended November 30, 2017, the following reclassifications, which had no impact on results of operations or net assets, were recorded to reflect permanent tax differences resulting primarily from in-kind transactions:
| Fund | | Paid-in Capital | | Accumulated Net Investment Income/(Loss) | | Accumulated Net Realized Gain/(Loss) on Investments |
| BUZZ US Sentiment Leaders ETF | | $ | 1,051,603 | | | $ | 1,812 | | | $ | (1,053,415 | ) |
The tax character of the distribution paid by the Fund was as follows:
| | | Ordinary Income |
| November 30, 2017 | | |
| BUZZ US Sentiment Leaders ETF | | $ | 35,000 | |
As of the period ended November 30, 2017, the BUZZ US Sentiment Leaders ETF paid no distributions.
At November 30, 2017, the Funds had available for tax purposes unused capital loss carryforwards as follows:
| Fund | | Short-Term | | Long-Term |
| BUZZ US Sentiment Leaders ETF | | $ | 407,724 | | | $ | 28,135 | |
As of November 30, 2017, the components of distributable earnings on a tax basis for the Fund were as follows:
| | | Accumulated net investment income | | Accumulated net realized loss on investments | | Net unrealized appreciation/(depreciation) on investments | | Total |
| BUZZ US Sentiment Leaders ETF | | $ | 39,558 | | | $ | (435,859 | ) | | $ | 979,230 | | | $ | 582,929 | |
| BUZZ US Sentiment Leaders ETF | |
| Notes to Financial Statements | November 30, 2017 |
As of November 30, 2017, the costs of investments for federal income tax purposes and accumulated net unrealized appreciation/(depreciation) on investments were as follows:
| | | BUZZ US Sentiment Leaders ETF |
| Gross appreciation (excess of value over tax cost) | | $ | 1,126,259 | |
| Gross depreciation (excess of tax cost over value) | | | (147,029 | ) |
| Net unrealized appreciation (depreciation) | | | 979,230 | |
| Cost of investments for income tax purposes | | $ | 8,554,876 | |
The differences between book-basis and tax-basis are due to the deferral of losses from wash sales and Passive Foreign Investment Company (“PFIC”) adjustments.
F. Income Taxes
No provision for income taxes is included in the accompanying financial statements, as the Fund intends to distribute to shareholders all taxable investment income and realized gains and otherwise comply with Subchapter M of the Internal Revenue Code of 1986, as amended, applicable to regulated investment companies. The Fund evaluates tax positions taken (or expected to be taken) in the course of preparing the Fund’s tax returns to determine whether these positions meet a “more-likely-than-not” standard that, based on the technical merits, have a more than fifty percent likelihood of being sustained by a taxing authority upon examination. A tax position that meets the “more-likely-than-not” recognition threshold is measured to determine the amount of benefit to recognize in the financial statements.
As of and during the year ended November 30, 2017, the Fund did not have a liability for any unrecognized tax benefits. The Fund files U.S. federal, state, and local tax returns as required. The Fund’s tax returns are subject to examination by the relevant tax authorities until expiration of the applicable statute of limitations, which is generally three years after the filing of the tax return, but may extend to four years in certain jurisdictions. Tax returns for open years have incorporated no uncertain tax positions that require a provision for income taxes. Being that the Fund commenced operations on April 19, 2016, no tax returns have been filed for the Fund as of the date of this report
G. Lending of Portfolio Securities
The Fund has entered into a securities lending agreement with State Street Bank & Trust Co. (“SSB”), the Fund’s lending agent. The Fund may lend its portfolio securities only to borrowers that are approved by SSB. The Fund will limit such lending to not more than 33 1/3% of the value of its total assets. The Fund’s securities held at SSB as custodian shall be available to be lent except those securities the Fund or ALPS Advisors, Inc. specifically identifies in writing as not being available for lending. The borrower pledges and maintains with the Fund collateral consisting of cash (U.S. Dollars only), securities issued or guaranteed by the U.S. government or its agencies or instrumentalities, and cash equivalents (including irrevocable bank letters of credit) issued by a person other than the borrower or an affiliate of the borrower. The initial collateral received by the Fund is required to have a value of no less than 102% of the market value of the loaned securities for U.S equity securities and a value of no less than 105% of the market value for non-U.S. equity securities. The collateral is maintained thereafter, at a market value equal to not less than 102% of the current value of the U.S. equity securities on loan and not less than 105% of the current value of the non-U.S. equity securities on loan. The market value of the loaned securities is determined at the close of each business day and any additional required collateral is delivered to the Fund on the next business day. During the term of the loan, the Fund is entitled to all distributions made on or in respect of the loaned securities. Loans of securities are terminable at any time and the borrower, after notice, is required to return borrowed securities within the customary time period for settlement of securities transactions.
Any cash collateral received is reinvested in a money market fund managed by SSB as disclosed in the Fund’s Schedule of Investments and is reflected in the Statement of Assets and Liabilities as a payable for collateral upon return of securities loaned. Non-cash collateral, in the form of securities issued or guaranteed by the U.S. government or its agencies or instrumentalities, is not disclosed in the Fund’s Statement of Assets and Liabilities as it is held by the lending agent on behalf of the Fund, and the Fund does not have the ability to re-hypothecate these securities. Income earned by the Fund from securities lending activity is disclosed in the Statement of Operations. As of November 30, 2017, the Fund had no securities on loan.
The risks of securities lending include the risk that the borrower may not provide additional collateral when required or may not return the securities when due. To mitigate these risks, the Fund benefits from a borrower default indemnity provided by SSB. SSB’s indemnity allows for full replacement of securities lent wherein SSB will purchase the unreturned loaned securities on the open market by applying the proceeds of the collateral, or to the extent such proceeds are insufficient or the collateral is unavailable, SSB will purchase the unreturned loan securities at SSB’s expense. However, the Fund could suffer a loss if the value of the investments purchased with cash collateral falls below the value of the cash collateral received.
| BUZZ US Sentiment Leaders ETF | |
| Notes to Financial Statements | November 30, 2017 |
H. Risks Related to Social Media Analytics
The Underlying Index for the Fund utilizes a rules-based quantitative methodology developed by BUZZ Indexes Inc. (the “Index Provider”), which is designed to identify the U.S. common stocks with the most “positive insights” collected from social media networks. The ability to invest based on social media analytics is relatively new and untested. “Social media” is an umbrella term that encompasses various activities that integrate technology, social interaction and content creation. Social media may use many technologies, including, but not limited to, blogs, microblogs, wikis, photos and video sharing, podcasts, social networking, and virtual worlds. Some examples of social media sites may include, but are not limited to, the following: Facebook, Twitter, LinkedIn, Digg, Reddit, RSS, blogs, Investopedia, stock forums, etc. Investing in companies based on social media analytics involves the potential for market manipulation because social media posts may be made with an intent to inflate, or otherwise manipulate, the public perception of a stock or other investment. Although the Underlying Index attempts to mitigate the potential for such market manipulation by employing screens to identify posts which may be computer generated or deceptive, and by employing market capitalization and trading volume criteria to remove small and penny-cap stocks which may be more likely targets for such manipulation, there is no guarantee that the Underlying Index’s model will successfully reduce such risk. Furthermore, text and sentiment analysis of social media postings may prove inaccurate; that is, high positive sentiment may not correlate with positive change in the value of a company’s stock and low positive or negative sentiment may not correlate with negative change in the value of a company’s stock. Additionally, as data suppliers for the Index Provider’s algorithm, social media companies are susceptible to the following risks which may disrupt the Index Provider’s ability to receive meaningful data from such sites: permanent cessation of operations, disruption in service caused by hardware or software failure, interruptions or delays in service by third-party data center hosting facilities and maintenance providers, security breaches involving certain private, sensitive, proprietary and confidential information managed and transmitted by social media companies, and privacy concerns and laws, evolving Internet regulation and other foreign or domestic regulations that may limit or otherwise affect the operations of social media companies.
3. INVESTMENT ADVISORY FEE AND OTHER AFFILIATED TRANSACTIONS
ALPS Advisors, Inc. (the “Adviser”) acts as the Fund’s investment adviser pursuant to an Advisory Agreement with the Trust on behalf of the Fund (the “Advisory Agreement”). Pursuant to the Advisory Agreement, the Fund pays the Adviser a unitary fee for the services and facilities it provides payable on a monthly basis at the annual rate of 0.75% of the Fund’s average daily net assets. From time to time, the Adviser may waive all or a portion of its fee.
Out of the unitary management fee, the Adviser pays substantially all expenses of the Fund, including the cost of transfer agency, custody, fund administration, legal, audit, and other services, except for interest expenses, distribution fees or expenses, brokerage expenses, taxes and extraordinary expenses not incurred in the ordinary course of the Fund’s business. The Adviser’s unitary management fee is designed to pay substantially all of the Fund’s expenses and to compensate the Adviser for providing services for the Fund.
ALPS Fund Services, Inc., an affiliate of the Adviser, is the administrator of the Fund.
Each Trustee who is not an officer or employee of the Adviser, any sub-adviser or any of their affiliates (“Independent Trustees”) receives (1) a quarterly retainer of $5,000, (2) a per meeting fee for regularly scheduled meetings of $3,750, (3) $1,500 for any special meeting held outside of a regularly scheduled board meeting, and (4) reimbursement for all reasonable out-of-pocket expenses relating to attendance at meetings.
4. PURCHASES AND SALES OF SECURITIES
For the year ended November 30, 2017, the cost of purchases and proceeds from sales of investment securities, excluding in-kind transactions and short-term investments, were as follows:
| Fund | | Purchases | | Sales |
| BUZZ US Sentiment Leaders ETF | | $ | 19,407,121 | | | $ | 19,918,684 | |
For the year ended November 30, 2017, the cost of in-kind purchases and proceeds from in-kind sales were as follows:
| Fund | | Purchases | | Sales |
| BUZZ US Sentiment Leaders ETF | | $ | 11,406,312 | | | $ | 8,222,462 | |
For the year ended November 30, 2017, the BUZZ US Sentiment Leaders ETF had in-kind net realized gains of $1,096,094.
Gains on in-kind transactions are not considered taxable for federal income tax purposes and losses on in kind transactions are also not deductible for tax purposes.
| BUZZ US Sentiment Leaders ETF | |
| Notes to Financial Statements | November 30, 2017 |
5. CAPITAL SHARE TRANSACTIONS
Shares are created and redeemed by the Fund only in Creation Unit size aggregations of 50,000 Shares. Only broker-dealers or large institutional investors with creation and redemption agreements called Authorized Participants (“AP”) are permitted to purchase or redeem Creation Units from the Fund. Such transactions are generally permitted on an in-kind basis, with a balancing cash component to equate the transaction to the NAV per unit of the Fund on the transaction date. Cash may be substituted equivalent to the value of certain securities generally when they are not available in sufficient quantity for delivery, not eligible for trading by the AP or as a result of other market circumstances.
| BUZZ US Sentiment Leaders ETF | |
| Additional Information | November 30, 2017 (Unaudited) |
PROXY VOTING RECORDS, POLICIES AND PROCEDURES
Information regarding how the Fund voted proxies relating to portfolio securities during the most recent 12-month period ended June 30 and a description of the Fund’s proxy voting policies and procedures used in determining how to vote for proxies are available without charge on the SEC’s website at www.sec.gov and upon request, by calling (toll-free) 1-866-675-2639.
PORTFOLIO HOLDINGS
The Trust is required to disclose, after its first and third fiscal quarters, the complete schedule of the Fund’s portfolio holdings with the SEC on Form N-Q. Forms N-Q for the Fund are available on the SEC’s website at www.sec.gov. The Fund’s Forms N-Q may also be reviewed and copied at the SEC’s Public Reference Room in Washington, D.C. and information on the operation of the Public Reference Room may be obtained by calling 1-800-SEC-0330. The Fund’s Forms N-Q are available without charge, upon request, by calling (toll-free) 1-866-675-2639 or by writing to ALPS ETF Trust at 1290 Broadway, Suite 1100, Denver, Colorado 80203.
TAX INFORMATION
The Fund designated the following for federal income tax purposes for distributions made during the calendar year ended December 31, 2016:
| | Qualified Dividend Income | Dividend Received Deduction |
| BUZZ US Sentiment Leaders ETF | 81.12 % | 81.12 % |
In early 2017, if applicable, shareholders of record received this information for the distribution paid to them by the Fund during the calendar year 2016 via Form 1099. The Fund will notify shareholders in early 2018 of amounts paid to them by the Fund, if any, during the calendar year 2017.
LICENSING AGREEMENT
BUZZ NextGen AI US Sentiment Leaders Index (the “BUZZ Index”) is a product of BUZZ Indexes Inc. (“BUZZ Indexes”), and has been licensed to ALPS Advisors, Inc. for use in connection with the BUZZ US Sentiment Leaders ETF.
“BUZZ” is a trademark of BUZZ Indexes, which have been licensed by ALPS Advisors, Inc. for use in connection with the BUZZ Index.
BUZZ US Sentiment Leaders ETF is not sponsored, endorsed, sold or promoted by BUZZ Indexes, or its shareholders, or the licensor of the BUZZ Index and/or its affiliates and third party licensors. BUZZ Indexes makes no representation or warranty, express or implied, to the owners of the BUZZ US Sentiment Leaders ETF or any member of the public regarding the advisability of investing in securities generally or in BUZZ US Sentiment Leaders ETF, particularly or the ability of the BUZZ Index to track general market performance.
BUZZ Indexes’ only relationship to ALPS Advisors, Inc. with respect to the BUZZ Index is the licensing of the BUZZ Index and certain trademarks of BUZZ Indexes. The BUZZ Indexes are determined and composed by BUZZ Indexes without regard to ALPS Advisors, Inc. or the BUZZ US Sentiment Leaders ETF. BUZZ Indexes has no obligation to take the needs of ALPS Advisors, Inc. or the owners of BUZZ US Sentiment Leaders ETF into consideration in determining and composing the BUZZ Index.
BUZZ Indexes are not responsible for and have not participated in the determination of the prices of BUZZ US Sentiment Leaders ETF or the timing of the issuance or sale of securities of BUZZ US Sentiment Leaders ETF or in the determination or calculation of the equation by which BUZZ US Sentiment Leaders ETF securities may be converted into cash, surrendered, or redeemed, as the case may be. BUZZ Indexes have no obligation or liability in connection with the administration, marketing or trading of BUZZ US Sentiment Leaders ETF. There is no assurance that investment products based on the BUZZ Index will accurately track index performance or provide positive investment returns.
BUZZ Indexes is not an investment advisor and the inclusion of a security in the BUZZ Index is not a recommendation by BUZZ Indexes to buy, sell, or hold such security, nor should it be considered investment advice.
| BUZZ US Sentiment Leaders ETF | |
| Additional Information | November 30, 2017 (Unaudited) |
BUZZ INDEXES DOES NOT GUARANTEE THE ADEQUACY, ACCURACY, TIMELINESS AND/OR THE COMPLETENESS OF THE BUZZ INDEX OR ANY DATA RELATED THERETO OR ANY COMMUNICATION WITH RESPECT THERETO, INCLUDING BUT NOT LIMITED TO, ORAL OR WRITTEN COMMUNICATION (INCLUDING ELECTRONIC COMMUNICATIONS). BUZZ INDEXES SHALL NOT BE SUBJECT TO ANY DAMAGES OR LIABILITY FOR ANY ERRORS, OMISSIONS, OR DELAYS THEREIN. BUZZ INDEXES MAKES NO EXPRESS OR IMPLIED WARRANTIES, AND EXPRESSLY DISCLAIMS ALL WARRANTIES, OF MERCHANTABILITY OR FITNESS FOR A PARTICULAR PURPOSE OR USE OR AS TO RESULTS TO BE OBTAINED BY ALPS ADVISORS, INC., OWNERS OF THE BUZZ US SENTIMENT LEADERS ETF, OR ANY OTHER PERSON OR ENTITY FROM THE USE OF THE BUZZ INDEX OR WITH RESPECT TO ANY DATA RELATED THERETO. WITHOUT LIMITING ANY OF THE FOREGOING, IN NO EVENT WHATSOEVER SHALL BUZZ INDEXES BE LIABLE FOR ANY INDIRECT, SPECIAL, INCIDENTAL, PUNITIVE, OR CONSEQUENTIAL DAMAGES INCLUDING BUT NOT LIMITED TO, LOSS OF PROFITS, TRADING LOSSES, LOST TIME OR GOODWILL, EVEN IF THEY HAVE BEEN ADVISED OF THE POSSIBILITY OF SUCH DAMAGES, WHETHER IN CONTRACT, TORT, STRICT LIABILITY, OR OTHERWISE. THERE ARE NO THIRD PARTY BENEFICIARIES OF ANY AGREEMENTS OR ARRANGEMENTS BETWEEN BUZZ INDEXES AND ALPS ADVISORS, INC., OTHER THAN THE LICENSORS OF BUZZ INDEXES.
The Adviser does not guarantee the accuracy and/or the completeness of the Underlying Index or any data included therein, and the Adviser shall have no liability for any errors, omissions or interruptions therein. The Adviser makes no warranty, express or implied, as to results to be obtained by the Fund, owners of the Shares of the Fund or any other person or entity from the use of the Underlying Index or any data included therein. The Adviser makes no express or implied warranties, and expressly disclaims all warranties of merchantability or fitness for a particular purpose or use with respect to the Underlying Index or any data included therein. Without limiting any of the foregoing, in no event shall the Adviser have any liability for any special, punitive, direct, indirect, or consequential damages (including lost profits) arising out of matters relating to the use of the Underlying Index, even if notified of the possibility of such damages.
| BUZZ US Sentiment Leaders ETF | |
| Board Considerations Regarding Approval of Investment Advisory Agreements | November 30, 2017 (Unaudited) |
At an in-person meeting held on June 8, 2017, the Board of Trustees of the Trust (the “Board” or the “Trustees”), including the Trustees who are not “interested persons” of the Trust within the meaning of the 1940 Act, as amended (the “Independent Trustees”), evaluated a proposal to approve the continuance of the Investment Advisory Agreement between the Trust and ALPS Advisors, Inc. (the “Adviser” or “AAI”) with respect to the BUZZ US Sentiment Leaders ETF (“BUZ” or “the Fund”). The Independent Trustees also met separately to consider the Investment Advisory Agreement.
In evaluating the Investment Advisory Agreement with respect to the Fund, the Independent Trustees considered various factors, including (i) the nature, extent and quality of the services provided by AAI with respect to the Fund under the Investment Advisory Agreements; (ii) the advisory fees and other expenses paid by the Fund compared to those of similar funds managed by other investment advisers; (iii) the costs of the services provided to the Fund by AAI and the profits realized by AAI and its affiliates from its relationship to the Fund; (iv) the extent to which economies of scale have been or would be realized if and as the assets of the Fund grow and whether fees reflect the economies of scale for the benefit of shareholders; and (v) any additional benefits and other considerations.
With respect to the nature, extent and quality of the services provided by AAI under the Investment Advisory Agreement, the Independent Trustees considered and reviewed information concerning the services provided under the Investment Advisory Agreement, the investment parameters of the index of the Fund, financial information regarding AAI and its parent company, information describing AAI’s current organization and the background and experience of the persons responsible for the day-to-day management of the Fund.
The Independent Trustees reviewed information on the performance of the Fund and its benchmark. The Independent Trustees also evaluated the correlation and tracking error between the underlying index and the Fund’s performance. Based on their review, the Independent Trustees found that the nature and extent of services provided to each Fund under the Investment Advisory Agreements was appropriate and that the quality was satisfactory.
The Independent Trustees noted that the advisory fee for the Fund was a unitary fee pursuant to which AAI assumes all expenses of the Fund (including the cost of transfer agency, custody, fund administration, legal, audit and other services) other than the payments under the Investment Advisory Agreement, brokerage expenses, taxes, interest, litigation expenses and other extraordinary expenses.
With respect to the advisory fee rate, the Independent Trustees noted the following:
The net advisory fee rate for the Fund is higher than the median of its Broadridge expense group and the Fund’s expense ratio is higher than the median of its Broadridge expense group.
The Independent Trustees took into account, among other things, the unique nature of the Fund’s underlying index.
Based on the foregoing, and the other information available to them, the Independent Trustees concluded that the advisory fee rate for the Fund was reasonable under the circumstances and in light of the quality of the services provided.
The Independent Trustees considered other benefits available to AAI because of its relationship with the Fund and concluded that the advisory fees were reasonable taking into account any such benefits.
The Independent Trustees also considered with respect to the Fund the information provided by AAI about the costs and profitability of AAI with respect to the Fund. The Independent Trustees reviewed and noted the relatively small size of the Fund and concluded that AAI was not realizing any economies of scale. The Independent Trustees determined that they would continue to evaluate whether further economies of scale have been achieved on an ongoing basis.
In voting to renew the Investment Advisory Agreement, the Independent Trustees concluded that the terms of the Investment Advisory Agreement are reasonable and fair in light of the services to be performed, the fees paid by certain other funds, expenses to be incurred and such other matters as the Independent Trustees considered relevant in the exercise of their reasonable business judgment. The Independent Trustees did not identify any single factor or group of factors as all important or controlling and considered all factors together.
| BUZZ US Sentiment Leaders ETF | |
| Trustees & Officers | November 30, 2017 (Unaudited) |
The general supervision of the duties performed by the Adviser for the Fund under the Investment Advisory Agreement is the responsibility of the Board of Trustees. The Trust currently has four Trustees. Three Trustees have no affiliation or business connection with the Adviser or any of its affiliated persons and do not own any stock or other securities issued by the Adviser. These are the “non-interested” or “independent” Trustees (“Independent Trustees”). The other Trustee (the “Interested Trustee”) is affiliated with the Adviser.
The Independent Trustees of the Trust, their term of office and length of time served, their principal business occupations during the past five years, the number of portfolios in the Fund Complex overseen by each Independent Trustee, and other directorships, if any, held by the Trustee are shown below.
| INDEPENDENT TRUSTEES | | |
| Name, Address & Year of Birth* | Position(s) Held with Trust | Term of Office and Length of Time Served** | Principal Occupation(s) During Past 5 Years | Number of Portfolios in Fund Complex Overseen by Trustees*** | Other Directorships Held by Trustees |
Mary K. Anstine, 1940 | Trustee | Since March 2008 | Ms. Anstine was President/Chief Executive Officer of HealthONE Alliance, Denver, Colorado, and former Executive Vice President of First Interstate Bank of Denver. Ms. Anstine is also Trustee/Director of AV Hunter Trust and Colorado Uplift Board. Ms. Anstine was formerly a Director of the Trust Bank of Colorado (later purchased and now known as Northern Trust Bank), HealthONE and Denver Area Council of the Boy Scouts of America and a member of the American Bankers Association Trust Executive Committee. | 42 | Ms. Anstine is a Trustee of ALPS Variable Investment Trust (10 funds); Financial Investors Trust (33 funds); Reaves Utility Income Fund (1 fund); and Westcore Trust (14 funds). |
| Jeremy W. Deems, 1976 | Trustee | Since March 2008 | Mr. Deems is the Co-Founder, Chief Compliance Officer and Chief Financial Officer of Green Alpha Advisors, LLC. Mr. Deems is Co-Portfolio Manager of the Shelton Green Alpha Fund. Prior to joining Green Alpha Advisors, Mr. Deems was CFO and Treasurer of Forward Management, LLC, ReFlow Management Co., LLC, ReFlow Fund, LLC, a private investment fund, and Sutton Place Management, LLC, an administrative services company. | 44 | Mr. Deems is a Trustee of ALPS Variable Investment Trust (10 funds); Financial Investors Trust (33 funds); and Reaves Utility Income Fund (1 fund); Clough Funds Trust (1 fund) and Elevation ETF Trust (1 fund). |
| Rick A. Pederson, 1952 | Trustee and Chairman | Has served as Trustee since March 2008. Has served as Chairman since July 2017. | Mr. Pederson is President, Foundation Properties, Inc. (a real estate investment management company), 1994 - present; Advisory Board Member, Bow River Capital Partners (private equity management), 2003 - present; Advisor, The Pauls Corporation (real estate investment management and development), 2008 - present; Chairman, Ross Consulting Group (real estate consulting services) 1983-2013; Advisory Board, Neenan Company (construction services) 2002-present; Board Member, Prosci Inc. (private business services) 2013-2016; Board Member, Citywide Banks (Colorado community bank) 2014-present; Board member, Professional Pediatric Health Care (a Denver-based home nursing firm) 2014 – present; Board Member, Strong-Bridge Consulting (management consulting) 2015-present; Director, National Western Stock Show (not-for-profit organization); Director, Biennial of the Americas (not-for-profit-organization), 2012-2015; Board Member, History Colorado, 2015 -present. | 21 | Mr. Pederson is Trustee of Westcore Trust (14 funds) and Principal Real Estate Income Fund (1 fund). |
| * | The business address of the Trustee is c/o ALPS Advisors, Inc., 1290 Broadway, Suite 1100, Denver, Colorado 80203. |
| ** | This is the period for which the Trustee began serving the Trust. Each Trustee serves an indefinite term, until his successor is elected. |
| *** | The Fund Complex includes all series of the Trust and any other investment companies for which ALPS Advisors, Inc. provides investment advisory services. |
| BUZZ US Sentiment Leaders ETF | |
| Trustees & Officers | November 30, 2017 (Unaudited) |
The Trustee who is affiliated with the Adviser or affiliates of the Adviser and executive officers of the Trust, his term of office and length of time served, his principal business occupations during the past five years, the number of portfolios in the Fund Complex overseen by the Interested Trustee and the other directorships, if any, held by the Trustee, are shown below.
| INTERESTED TRUSTEE | | |
| Name, Address and Year of Birth of Interested Trustee* | Position(s) Held with Trust | Term of Office and Length of Time Served** | Principal Occupation(s) During Past 5 Years | Number of Portfolios in Fund Complex Overseen by Trustees*** | Other Directorships Held by Trustee |
Edmund J. Burke, 1961 | Trustee and President | Mr. Burke was elected as Trustee of the Trust and President of the Trust at the December 11, 2017 meeting of the Board of Trustees. | Mr. Burke is President and a Director of ALPS Holdings, Inc. (“AHI”) (since 2005) and Director of Boston Financial Data Services, Inc. (“BFDS”), ALPS Advisors, Inc. (“AAI”), ALPS Distributors, Inc. (“ADI”), ALPS Fund Services, Inc. (“AFS”) and ALPS Portfolio Solutions Distributor, Inc. (“APSD”) and from 2001-2008, was President of AAI, ADI, AFS and APSD. Because of his positions with AHI, BFDS, AAI, ADI, AFS and APSD, Mr. Burke is deemed an affiliate of the Trust as defined under the 1940 Act. Mr. Burke is Trustee and President of the Clough Global Allocation Fund (Trustee since 2006; President since 2004); Trustee and President of the Clough Global Equity Fund (Trustee since 2006; President since 2005); Trustee and President of the Clough Global Opportunities Fund (since 2006); Trustee of the Liberty All-Star Equity Fund; Director of the Liberty All-Star Growth Fund, Inc. and Trustee and President of Financial Investors Trust (Trustee since 2009; President since 2002). | 36 | Mr. Burke is a Trustee of Clough Global Dividend and Income Fund (1 fund); Clough Global Equity Fund (1 fund); Clough Global Opportunities Fund (1 fund); Clough Funds Trust (1 fund); Liberty All -Star Equity Fund (1 fund); Director of the Liberty All-Star Growth Fund, Inc. (1 fund) and Financial Investors Trust (33 funds). |
| * | The business address of the Trustee is c/o ALPS Advisors, Inc., 1290 Broadway, Suite 1100, Denver, Colorado 80203. |
| ** | This is the period for which the Trustee began serving the Trust. Each Trustee serves an indefinite term, until his successor is elected. |
| *** | The Fund Complex includes all series of the Trust and any other investment companies for which ALPS Advisors, Inc. provides investment advisory services. |
| BUZZ US Sentiment Leaders ETF | |
| Trustees & Officers | November 30, 2017 (Unaudited) |
| OFFICERS | | |
| Name, Address and Year of Birth of Officer | Position(s) Held with Trust | Length of Time Served* | Principal Occupation(s) During Past 5 Years |
| Erin D. Nelson, 1977 | Chief Compliance Officer (“CCO”) | Since December 2015 | Erin Nelson became Senior Vice-President and Chief Compliance Officer of ALPS Advisors, Inc. (“AAI”) on July 1, 2015 and prior to that served as Vice President and Deputy Chief Compliance Officer of AAI since January 1, 2015. Prior to January 1, 2015, Ms. Nelson was Vice-President and Assistant General Counsel of ALPS Fund Services, Inc. Because of her position with AAI, Ms. Nelson is deemed an affiliate of the Trust as defined under the 1940 Act. Ms. Nelson is also the CCO of ALPS Variable Investment Trust, Liberty All-Star Growth Fund, Inc., Liberty All- Star Equity Fund, Principal Real Estate Income Fund, RiverNorth Opportunities Fund, Inc. and Red Rocks Capital, LLC. |
Patrick D. Buchanan, 1972 | Treasurer | Since June 2012 | Mr. Buchanan is Vice President of AAI. Mr. Buchanan joined ALPS in 2007 and because of his position with AAI, he is deemed an affiliate of the Trust as defined under the 1940 Act. Mr. Buchanan is also Treasurer of the ALPS Variable Insurance Trust, Principal Real Estate Income Fund, Clough Funds Trust and RiverNorth Opportunities Fund, Inc. |
| Andrea E. Kuchli, 1985 | Secretary | Since December 2017 | Ms. Kuchli joined ALPS in 2015 and is currently Vice President and Senior Counsel of ALPS. Prior to joining ALPS, Ms. Kuchli was an Associate with Davis Graham & Stubbs LLP from April 2014 to February 2015, and an Associate with Dechert LLP from 2011 to April 2014. Because of her position with ALPS, Ms. Kuchli is deemed an affiliate of the Trust as defined under the 1940 Act. Ms. Kuchli is also Secretary of ALPS Variable Investment Trust, Elevation ETF Trust and Principal Real Estate Income Fund as well as Assistant Secretary of the James Advantage Funds. |
| Sharon Akselrod, 1974 | Assistant Secretary | Since December 2016 | Ms. Akselrod joined ALPS in August 2014 and is currently Senior Investment Company Act Paralegal of ALPS Fund Services, Inc. Prior to joining ALPS, Ms. Akselrod served as Corporate Governance and Regulatory Associate for Nordstrom fsb (2013-2014) and Senior Legal Assistant – Legal Manager for AXA Equitable Life Insurance Company (2008-2013). Because of her position with ALPS, Ms. Akselrod is deemed an affiliate of the Trust as defined under the 1940 Act. Ms. Akselrod is also Assistant Secretary of Financial Investors Trust and Principal Real Estate Income Fund. |
Stephanie G. Danner, 1992 | Assistant Secretary | Since December 2017 | Ms. Danner joined ALPS in September of 2017 and is currently Vice President and Associate Senior Counsel of ALPS. Because of her position with ALPS, Ms. Danner is deemed an affiliate of the Trust as defined under the 1940 Act. |
| * | The business address of each Officer is c/o ALPS Advisors, Inc., 1290 Broadway, Suite 1100, Denver, Colorado 80203. |
| ** | This is the period for which the Officer began serving the Trust. Each Officer serves an indefinite term, until his/her successor is elected. |
The Statement of Additional Information includes additional information about the Fund's Trustees and is available, without charge, upon request by calling (toll-free) 1-855-215-1425.

| Performance Overview | 1 |
| Disclosure of Fund Expenses | 4 |
| Report of Independent Registered Public Accounting Firm | 5 |
| Schedule of Investments | 6 |
| Statement of Assets & Liabilities | 9 |
| Statement of Operations | 10 |
| Statements of Changes In Net Assets | 11 |
| Financial Highlights | 12 |
| Notes to Financial Statements | 13 |
| Additional Information | 19 |
| Board Considerations Regarding Approval of Investment Advisory Agreement | 20 |
| Trustees & Officers | 21 |
alpsfunds.com
Cohen & Steers Global Realty Majors ETF
| Performance Overview | November 30, 2017 (Unaudited) |
Investment Objective
The Cohen & Steers Global Realty Majors ETF (the “Fund”) seeks investment results that correspond generally to the performance, before the Fund’s fees and expenses, of an index called the Cohen & Steers Global Realty Majors Index (the “Underlying Index”). The Fund will normally invest at least 90% of its total assets in common stocks and other equity securities (which may include American Depositary Receipts (“ADRs”), American Depositary Shares (“ADSs”) and Global Depositary Receipts (“GDRs”)) that comprise the Underlying Index.
The Underlying Index consists of the largest and most liquid securities within the global real estate universe that Cohen & Steers Capital Management, Inc. (“Cohen & Steers” or the “Index Provider”) believes are likely to lead the global securitization of real estate. The Underlying Index is free float and modified market-capitalization weighted, with a limit of 4.0% on any security’s weighting. Underlying Index constituents must have a free float adjusted market-capitalization of $750 million or greater for initial inclusion in the Underlying Index. Cohen & Steers considers country weights relative to each country’s GDP share representing the real estate securities universe and share of the private market for real estate, with up to 10% being allocated to securities of emerging markets. The Underlying Index is rebalanced quarterly.
Performance Overview
For the year ended November 30, 2017, the Fund’s market price increased 12.88% and the Fund’s net asset value (NAV) increased 12.77%.
Global real estate stocks had a strong absolute gain in the period, aided by signs of a strengthening economic recovery and related improvements in operating fundamentals for many property markets. However, real estate securities trailed the broader rally in global equities, restrained perhaps by concerns about rising interest rates, even as central banks remained highly accommodative. At the end of the period, earnings multiples for real estate companies were at the low end of their five-year range, whereas multiples for broad equities had expanded to near their cycle high.
In the U.S. (8.7% total return1), returns varied widely by property type. Data centers and industrial landlords were among the strongest performers, aided by exceptional demand. Data centers continued to benefit from the outsourcing of IT infrastructure and the migration to cloud computing, while industrial landlords benefited from retailers seeking well-located warehouses to meet faster delivery times demanded by online purchasers. Shopping center and regional malls were the only U.S. sectors to decline in the period. Retail REITs were hindered by ongoing news of store closings and concerns regarding the expansion of e-commerce, trends that could weigh on a number of these companies’ operating fundamentals for an extended period.
Markets in continental Europe were aided by an easing of political concerns and broad economic improvements. Germany (29.1%) had particularly strong performance, led by residential landlords that benefited from strong apartment fundamentals. France (14.9%) and the Netherlands (9.0%) had lesser gains.
In the U.K. (10.9%), the best performers were generally companies that are considered to be largely immune from the economic fallout of Brexit, with significant gains made by certain student housing, health care and e-commerce-focused industrial REITs. Near the end of the period, the Bank of England raised its short-term lending rate by 0.25% in a bid to combat inflation amid a weak pound–although central bankers later signaled that they would likely not hike the short-term lending rate again in the foreseeable future.
The Asia Pacific region underperformed Europe, hindered by Japan (–2.6%), which declined despite significant improvements in the country’s economy, including manufacturing, and a strong recovery in business sentiment. Real estate securities struggled as outflows from domestic REIT funds persisted amid ongoing concerns over potential dividend cuts at the fund level.
Hong Kong (27.7%) was a strong performer, benefiting from healthier growth in China, which helped propel real estate companies to broad-based gains. In addition, the residential property market continued to surprise to the upside despite restrictions designed to cool the market. Singapore (26.6%) outperformed as well, experiencing positive sentiment driven by favorable trade and economic data. However, the country’s employment growth continued to stall and property fundamentals remained poor amid significant new supply and sluggish demand growth. In Australia (1.9%), certain office companies performed well amid improvements in Sydney’s office fundamentals.
| 1 | Country returns are in local currencies. |
Cohen & Steers Global Realty Majors ETF
| Performance Overview | November 30, 2017 (Unaudited) |
Performance (as of November 30, 2017)
| | 1 Year | 3 Year | 5 Year | Since Inception^ |
| Cohen & Steers Global Realty Majors ETF - NAV | 12.77% | 4.17% | 6.52% | 2.86% |
| Cohen & Steers Global Realty Majors ETF - Market Price* | 12.88% | 4.24% | 6.53% | 2.86% |
| Cohen & Steers Global Realty Majors Index | 13.60% | 4.90% | 7.30% | 3.68% |
| FTSE EPRA/ NAREIT Developed Real Estate Index | 13.21% | 5.05% | 7.71% | 3.85% |
| S&P 500® Total Return Index | 22.87% | 10.91% | 15.74% | 9.30% |
Total Expense Ratio (per the current Prospectus) 0.55%
Data quoted represents past performance, which is no guarantee of future results. The table does not reflect the deduction of taxes that a shareholder would pay on Fund distributions or the redemption of Fund shares. The Fund's portfolio holdings are subject to change without notice.
Investment return and principal value of an investment will fluctuate so that an investor’s shares, when sold or redeemed, may be worth more or less than the original cost. Current performance data may be higher or lower than actual data quoted. For the most current month-end performance data please visit www.alpsfunds.com or call 1.866.513.5856.
NAV is an exchange-traded fund’s per-share value. The per-share dollar amount of the Fund is derived by dividing the total value of all the securities in its portfolio, less any liabilities, by the number of Fund shares outstanding. Market Price is the price at which a share can currently be traded in the market. Information detailing the number of days the Market Price of the Fund was greater than the Fund’s NAV and the number of days it was less than the Fund’s NAV can be obtained at www.alpsfunds.com.
| ^ | Fund Inception May 7, 2008. |
| * | Market Price is based on the midpoint of the bid/ask spread at 4p.m. ET and does not represent the returns an investor would receive if shares were traded at other times. |
Risks of Investing in Real Estate Securities
Risks of investing in real estate securities are similar to those associated with direct investments in real estate, including falling property values due to increasing vacancies or declining rents resulting from economic, legal, political or technological developments, lack of liquidity, limited diversification and sensitivity to certain economic factors such as interest rate changes and market recessions. Foreign securities involve special risks, including currency fluctuations, lower liquidity, political and economic uncertainties, and differences in accounting standards. Some international securities may represent small- and medium-sized companies, which may be more susceptible to price volatility and less liquidity than larger companies.
Cohen & Steers Global Realty Majors® Index: A free-float adjusted, modified market capitalization-weighted index of global real estate equities. The modified market capitalization weighting approach and qualitative screening process emphasize those companies that, in the opinion of the Cohen & Steers investment committee, are leading the securitization of real estate globally.
FTSE EPRA/NAREIT Developed Real Estate Index: An unmanaged market-weighted total return index that consists of many companies from developed markets whose floats are larger than $100 million and which derive more than half of their revenue from property-related activities.
S&P 500® Total Return Index: The Standard & Poor’s composite index of 500 stocks, a widely recognized, unmanaged index of common stock prices.
The indexes are not actively managed and do not reflect any deductions for fees, expenses or taxes. Total return assumes reinvestment of any dividends and distributions realized during a given time period. One cannot invest directly in an index. Index performance does not reflect fund performance.
The Fund’s shares are not individually redeemable. Investors buy and sell shares of the Fund on a secondary market. Only market makers or “authorized participants” may trade directly with the Fund, typically in blocks of 50,000 shares.
The Cohen & Steers Global Realty Majors ETF is not suitable for all investors. An investor should consider investment objectives, risks, charges and expenses carefully before investing. Investments in the Fund are subject to investment risks, including possible loss of the principal amount invested.
ALPS Portfolio Solutions Distributor, Inc., a FINRA member, is the distributor for the Cohen & Steers Global Realty Majors ETF.
ALPS Portfolio Solutions Distributor, Inc. is not affiliated with Cohen & Steers.
Cohen & Steers Global Realty Majors ETF
| Performance Overview | November 30, 2017 (Unaudited) |
Top 10 Holdings* (as of November 30, 2017)
| Simon Property Group, Inc. | 4.15% |
| ProLogis, Inc. | 3.89% |
| Equinix, Inc. | 3.80% |
| Public Storage | 3.52% |
| Sun Hung Kai Properties, Ltd. | 2.98% |
| Unibail-Rodamco SE | 2.80% |
| AvalonBay Communities, Inc. | 2.76% |
| Welltower, Inc. | 2.75% |
| Mitsubishi Estate Co., Ltd. | 2.73% |
| Equity Residential | 2.71% |
| Total % of Top 10 Holdings | 32.09% |
Future holdings are subject to change.
Country Allocation* (as of November 30, 2017)
| United States | 53.81% |
| Hong Kong | 10.81% |
| Japan | 8.21% |
| Australia | 7.73% |
| France | 5.22% |
| Germany | 5.17% |
| United Kingdom | 3.89% |
| Singapore | 2.30% |
| Canada | 1.15% |
| Sweden | 0.48% |
| Spain | 0.48% |
| Switzerland | 0.39% |
| Brazil | 0.36% |
| Total | 100.00% |
Comparison of Change in Value of $10,000 Investment in the Fund and the Indexes
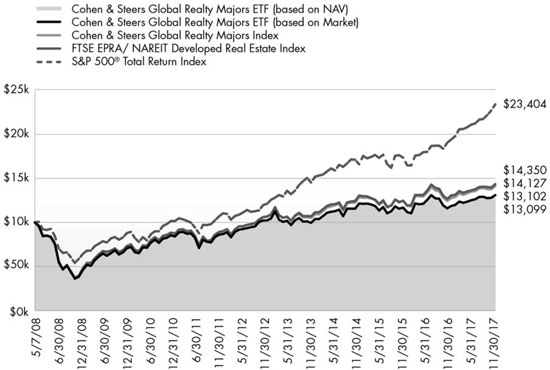
The chart above represents historical performance of a hypothetical investment of $10,000 in the Fund over the life of the Fund. Past performance does not guarantee future results. This chart does not reflect the deduction of taxes that a shareholder would pay on Fund distributions or the redemption of Fund shares.
Cohen & Steers Global Realty Majors ETF
| Disclosure of Fund Expenses | November 30, 2017 (Unaudited) |
Shareholder Expense Example: As a shareholder of the Fund, you incur two types of costs: (1) transaction costs which may include creation and redemption fees or brokerage charges, and (2) ongoing costs, including management fees and other Fund expenses. These examples are intended to help you understand your ongoing costs (in dollars) of investing in the Fund and to compare these costs with the ongoing costs of investing in other funds. It is based on an investment of $1,000 invested at the beginning of the (six month) period and held through November 30, 2017.
Actual Return: The first line of the table provides information about actual account values and actual expenses. You may use the information in this line, together with the amount you invested, to estimate the expenses that you incurred over the period. Simply divide your account value by $1,000 (for example, an $8,600 account value divided by $1,000 = 8.6), then multiply the result by the number in the first line under the heading entitled “Expenses Paid During Period” to estimate the expenses attributable to your investment during this period.
Hypothetical 5% Return: The second line of the table provides information about hypothetical account values and hypothetical expenses based on the Fund’s actual expense ratio and an assumed rate of return of 5% per year before expenses, which is not the Fund’s actual return. The hypothetical account values and expenses may not be used to estimate the actual ending account balance or expenses you paid for the period. You may use this information to compare ongoing costs of investing in the Fund and other funds. To do so, compare this 5% hypothetical example with the 5% hypothetical examples that appear in the shareholder reports of other funds.
The expenses shown in the table are meant to highlight ongoing Fund costs only and do not reflect any transaction costs, such as creation and redemption fees or brokerage charges. Therefore, the second line is useful in comparing ongoing costs only, and will not help you determine the relative total costs of owning different funds. In addition, if these costs were included, your costs would have been higher.
| | Beginning Account Value 6/1/17 | Ending Account Value 11/30/17 | Expense Ratio(a) | Expenses Paid During Period 6/1/17 - 11/30/17(b) |
| Cohen & Steers Global Realty Majors ETF | | | | |
| Actual | $1,000.00 | $1,043.10 | 0.55% | $2.82 |
| Hypothetical (5% return before expenses) | $1,000.00 | $1,022.31 | 0.55% | $2.79 |
| (a) | Annualized, based on the Fund's most recent fiscal half-year expenses. |
| (b) | Expenses are equal to the Fund's annualized expense ratio multiplied by the average account value over the period, multiplied by the number of days in the most recent fiscal half year (183), divided by 365. |
Cohen & Steers Global Realty Majors ETF
Report of Independent Registered Public Accounting Firm
To the Board of Trustees and Shareholders of ALPS ETF Trust:
We have audited the accompanying statement of assets and liabilities, including the schedule of investments, of Cohen & Steers Global Realty Majors ETF, one of the portfolios constituting the ALPS ETF Trust (the “Trust”), as of November 30, 2017, and the related statement of operations for the year then ended, the statements of changes in net assets statements for each of the two years in the period then ended, and the financial highlights for each of the five years in the period then ended. These financial statements and financial highlights are the responsibility of the Trust’s management. Our responsibility is to express an opinion on these financial statements and financial highlights based on our audits.
We conducted our audits in accordance with the standards of the Public Company Accounting Oversight Board (United States). Those standards require that we plan and perform the audit to obtain reasonable assurance about whether the financial statements and financial highlights are free of material misstatement. The Trust is not required to have, nor were we engaged to perform, an audit of its internal control over financial reporting. Our audits included consideration of internal control over financial reporting as a basis for designing audit procedures that are appropriate in the circumstances, but not for the purpose of expressing an opinion on the effectiveness of the Trust’s internal control over financial reporting. Accordingly, we express no such opinion. An audit also includes examining, on a test basis, evidence supporting the amounts and disclosures in the financial statements, assessing the accounting principles used and significant estimates made by management, as well as evaluating the overall financial statement presentation. Our procedures included confirmation of securities owned as of November 30, 2017, by correspondence with the custodian and broker. We believe that our audits provide a reasonable basis for our opinion.
In our opinion, the financial statements and financial highlights referred to above present fairly, in all material respects, the financial position of Cohen & Steers Global Realty Majors ETF of the ALPS ETF Trust as of November 30, 2017, the results of its operations for the year then ended, the changes in its net assets for each of the two years in the period then ended, and the financial highlights for each of the five years in the period then ended, in conformity with accounting principles generally accepted in the United States of America.
DELOITTE & TOUCHE LLP
Denver, Colorado
January 26, 2018
Cohen & Steers Global Realty Majors ETF
| Schedule of Investments | November 30, 2017 |
| Security Description | | Shares | | | Value | |
| | | | | | | |
| COMMON STOCKS (99.80%) | | | | | | | | |
| Australia (7.74%) | | | | | | | | |
| Dexus | | | 76,102 | | | $ | 596,359 | |
| Goodman Group | | | 119,177 | | | | 783,364 | |
| The GPT Group | | | 133,618 | | | | 546,782 | |
| Scentre Group, Ltd. | | | 398,433 | | | | 1,274,815 | |
| Stockland | | | 180,054 | | | | 640,107 | |
| Vicinity Centres | | | 246,135 | | | | 521,294 | |
| Westfield Corp. | | | 142,951 | | | | 906,114 | |
| Total Australia | | | | | | | 5,268,835 | |
| | | | | | | | | |
| Brazil (0.36%) | | | | | | | | |
| BR Malls Participacoes SA | | | 65,651 | | | | 242,472 | |
| | | | | | | | | |
| Canada (1.15%) | | | | | | | | |
| Allied Properties Real Estate Investment Trust | | | 6,908 | | | | 222,101 | |
| Boardwalk Real Estate Investment Trust | | | 2,827 | | | | 88,284 | |
| RioCan Real Estate Investment Trust | | | 24,505 | | | | 472,949 | |
| Total Canada | | | | | | | 783,334 | |
| | | | | | | | | |
| France (5.23%) | | | | | | | | |
| Fonciere Des Regions | | | 4,000 | | | | 427,967 | |
| Gecina SA | | | 3,459 | | | | 576,391 | |
| Klepierre | | | 15,609 | | | | 644,678 | |
| Unibail-Rodamco SE | | | 7,457 | | | | 1,907,832 | |
| Total France | | | | | | | 3,556,868 | |
| | | | | | | | | |
| Germany (5.18%) | | | | | | | | |
| alstria office REIT-AG | | | 9,148 | | | | 137,847 | |
| Deutsche Wohnen AG | | | 26,532 | | | | 1,172,872 | |
| LEG Immobilien AG | | | 4,713 | | | | 500,998 | |
| Vonovia SE | | | 36,333 | | | | 1,710,139 | |
| Total Germany | | | | | | | 3,521,856 | |
| | | | | | | | | |
| Hong Kong (10.82%) | | | | | | | | |
| China Overseas Land & Investment, Ltd. | | | 287,000 | | | | 911,327 | |
| CK Asset Holdings, Ltd. | | | 197,000 | | | | 1,658,451 | |
| Hang Lung Properties, Ltd. | | | 152,000 | | | | 357,709 | |
| Hongkong Land Holdings, Ltd. | | | 88,000 | | | | 642,400 | |
| Link REIT | | | 166,164 | | | | 1,481,831 | |
| Sun Hung Kai Properties, Ltd. | | | 124,000 | | | | 2,025,876 | |
| Wharf Holdings, Ltd. | | | 90,700 | | | | 285,682 | |
| Total Hong Kong | | | | | | | 7,363,276 | |
| | | | | | | | | |
| Japan (8.22%) | | | | | | | | |
| Japan Real Estate Investment Corp. | | | 96 | | | | 465,734 | |
| Japan Retail Fund Investment Corp. | | | 198 | | | | 350,628 | |
| Mitsubishi Estate Co., Ltd. | | | 104,500 | | | | 1,859,356 | |
| Mitsui Fudosan Co., Ltd. | | | 74,500 | | | | 1,678,724 | |
| Nippon Building Fund, Inc. | | | 103 | | | | 515,252 | |
| Nippon Prologis REIT, Inc. | | | 154 | | | | 329,907 | |
Cohen & Steers Global Realty Majors ETF
| Schedule of Investments | November 30, 2017 |
| Security Description | | Shares | | | Value | |
| Japan (8.22%) (continued) | | | | | | | | |
| Nomura Real Estate Master Fund, Inc. | | | 311 | | | $ | 391,565 | |
| Total Japan | | | | | | | 5,591,166 | |
| | | | | | | | | |
| Singapore (2.31%) | | | | | | | | |
| Ascendas Real Estate Investment Trust | | | 179,705 | | | | 351,788 | |
| CapitaLand Mall Trust | | | 201,747 | | | | 306,675 | |
| CapitaLand, Ltd. | | | 190,600 | | | | 498,901 | |
| City Developments, Ltd. | | | 45,900 | | | | 412,167 | |
| Total Singapore | | | | | | | 1,569,531 | |
| | | | | | | | | |
| Spain (0.48%) | | | | | | | | |
| Merlin Properties Socimi SA | | | 24,932 | | | | 327,913 | |
| | | | | | | | | |
| Sweden (0.48%) | | | | | | | | |
| Castellum AB | | | 20,326 | | | | 329,258 | |
| | | | | | | | | |
| Switzerland (0.39%) | | | | | | | | |
| PSP Swiss Property AG | | | 3,001 | | | | 267,535 | |
| | | | | | | | | |
| United Kingdom (3.89%) | | | | | | | | |
| British Land Co. PLC | | | 77,550 | | | | 659,687 | |
| Derwent London PLC | | | 8,260 | | | | 310,326 | |
| Hammerson PLC | | | 59,364 | | | | 417,075 | |
| Land Securities Group PLC | | | 56,137 | | | | 709,090 | |
| Segro PLC | | | 74,353 | | | | 551,545 | |
| Total United Kingdom | | | | | | | 2,647,723 | |
| | | | | | | | | |
| United States (53.55%) | | | | | | | | |
| Alexandria Real Estate Equities, Inc. | | | 7,017 | | | | 891,580 | |
| American Campus Communities, Inc. | | | 10,229 | | | | 433,505 | |
| AvalonBay Communities, Inc. | | | 10,364 | | | | 1,879,304 | |
| Boston Properties, Inc. | | | 11,589 | | | | 1,453,029 | |
| Digital Realty Trust, Inc. | | | 15,362 | | | | 1,792,745 | |
| Douglas Emmett, Inc. | | | 11,437 | | | | 461,025 | |
| Duke Realty Corp. | | | 26,628 | | | | 749,046 | |
| Equinix, Inc. | | | 5,569 | | | | 2,586,745 | |
| Equity LifeStyle Properties, Inc. | | | 6,532 | | | | 589,905 | |
| Equity Residential | | | 27,613 | | | | 1,845,101 | |
| Essex Property Trust, Inc. | | | 4,943 | | | | 1,220,872 | |
| Extra Space Storage, Inc. | | | 9,487 | | | | 809,810 | |
| Federal Realty Investment Trust | | | 5,428 | | | | 717,636 | |
| GGP, Inc. | | | 46,738 | | | | 1,098,343 | |
| HCP, Inc. | | | 35,093 | | | | 927,859 | |
| Highwoods Properties, Inc. | | | 7,736 | | | | 392,911 | |
| Host Hotels & Resorts, Inc. | | | 55,683 | | | | 1,101,967 | |
| Kilroy Realty Corp. | | | 7,374 | | | | 555,852 | |
| Kimco Realty Corp. | | | 31,893 | | | | 590,658 | |
| National Retail Properties, Inc. | | | 11,180 | | | | 459,163 | |
| ProLogis, Inc. | | | 39,965 | | | | 2,646,882 | |
| Public Storage | | | 11,243 | | | | 2,396,108 | |
| Realty Income Corp. | | | 20,520 | | | | 1,134,756 | |
| Regency Centers Corp. | | | 11,088 | | | | 751,877 | |
| Simon Property Group, Inc. | | | 17,465 | | | | 2,824,964 | |
| SL Green Realty Corp. | | | 7,415 | | | | 758,035 | |
Cohen & Steers Global Realty Majors ETF
| Schedule of Investments | November 30, 2017 |
| Security Description | | Shares | | | Value | |
| United States (53.55%) (continued) | | | | | | | | |
| UDR, Inc. | | | 20,015 | | | $ | 787,190 | |
| Ventas, Inc. | | | 26,777 | | | | 1,713,996 | |
| Vornado Realty Trust | | | 12,923 | | | | 1,003,083 | |
| Welltower, Inc. | | | 27,693 | | | | 1,868,170 | |
| Total United States | | | | | | | 36,442,117 | |
| | | | | | | | | |
| TOTAL COMMON STOCKS | | | | | | | | |
| (Cost $59,004,112) | | | | | | | 67,911,884 | |
| | | 7 Day Yield | | | Shares | | | Value | |
| | | | | | | | | | |
| SHORT TERM INVESTMENTS (0.33%) | | | | | | | | | | | | |
| State Street Institutional Treasury Plus Money Market Fund | | | 0.970 | % | | | 223,956 | | | | 223,956 | |
| | | | | | | | | | | | | |
| TOTAL SHORT TERM INVESTMENTS | | | | | | | | | | | | |
| (Cost $223,956) | | | | | | | | | | | 223,956 | |
| | | | | | | | | | | | | |
| TOTAL INVESTMENTS (100.13%) | | | | | | | | | | | | |
| (Cost $59,228,068) | | | | | | | | | | $ | 68,135,840 | |
| | | | | | | | | | | | | |
| NET LIABILITIES LESS OTHER ASSETS (-0.13%) | | | | | | | | | | | (85,661 | ) |
| | | | | | | | | | | | | |
| NET ASSETS (100.00%) | | | | | | | | | | $ | 68,050,179 | |
See Notes to Financial Statements.
Cohen & Steers Global Realty Majors ETF
| Statement of Assets and Liabilities | November 30, 2017 |
| ASSETS: | | | |
| Investments, at value | | $ | 68,135,840 | |
| Foreign currency, at value (Cost $239) | | | 239 | |
| Foreign tax reclaims | | | 38,344 | |
| Dividends receivable | | | 110,240 | |
| Total Assets | | | 68,284,663 | |
| | | | | |
| LIABILITIES: | | | | |
| Payable for investments purchased | | | 203,838 | |
| Payable to adviser | | | 30,646 | |
| Total Liabilities | | | 234,484 | |
| NET ASSETS | | $ | 68,050,179 | |
| | | | | |
| NET ASSETS CONSIST OF: | | | | |
| Paid-in capital | | $ | 64,418,453 | |
| Accumulated net investment loss | | | (862,251 | ) |
| Accumulated net realized loss | | | (4,413,430 | ) |
| Net unrealized appreciation | | | 8,907,407 | |
| NET ASSETS | | $ | 68,050,179 | |
| | | | | |
| INVESTMENTS, AT COST | | $ | 59,228,068 | |
| | | | | |
| PRICING OF SHARES | | | | |
| Net Assets | | $ | 68,050,179 | |
| Shares of beneficial interest outstanding (Unlimited number of shares authorized, par value $0.01 per share) | | | 1,500,000 | |
| Net Asset Value, offering and redemption price per share | | $ | 45.37 | |
See Notes to Financial Statements.
Cohen & Steers Global Realty Majors ETF
| Statement of Operations | For the Year Ended November 30, 2017 |
| INVESTMENT INCOME: | | | |
| Dividends(a) | | $ | 1,674,935 | |
| Total Investment Income | | | 1,674,935 | |
| | | | | |
| EXPENSES: | | | | |
| Investment adviser fees | | | 406,955 | |
| Total Expenses | | | 406,955 | |
| NET INVESTMENT INCOME | | | 1,267,980 | |
| | | | | |
| REALIZED AND UNREALIZED GAIN/(LOSS) | | | | |
| Net realized gain on investments | | | 5,273,690 | |
| Net realized loss on foreign currency transactions | | | (916 | ) |
| Total net realized gain | | | 5,272,774 | |
| Net change in unrealized appreciation on investments | | | 2,676,610 | |
| Net change in unrealized appreciation on translation of assets and liabilities denominated in foreign currencies | | | 7,749 | |
| Total net change in unrealized appreciation | | | 2,684,359 | |
| NET REALIZED AND UNREALIZED GAIN ON INVESTMENTS | | | 7,957,133 | |
| NET INCREASE IN NET ASSETS RESULTING FROM OPERATIONS | | $ | 9,225,113 | |
| (a) | Net of foreign tax withholding of $94,917. |
See Notes to Financial Statements.
Cohen & Steers Global Realty Majors ETF
| Statements of Changes in Net Assets |
| | | For the Year Ended November 30, 2017 | | | For the Year Ended November 30, 2016 | |
| OPERATIONS: | | | | | | |
| Net investment income | | $ | 1,267,980 | | | $ | 2,727,045 | |
| Net realized gain | | | 5,272,774 | | | | 4,074,936 | |
| Net change in unrealized appreciation/(depreciation) | | | 2,684,359 | | | | (5,589,567 | ) |
| Net increase in net assets resulting from operations | | | 9,225,113 | | | | 1,212,414 | |
| | | | | | | | | |
| DISTRIBUTIONS TO SHAREHOLDERS: | | | | | | | | |
| From net investment income | | | (1,968,767 | ) | | | (2,806,590 | ) |
| Total distributions | | | (1,968,767 | ) | | | (2,806,590 | ) |
| | | | | | | | | |
| CAPITAL SHARE TRANSACTIONS: | | | | | | | | |
| Cost of shares redeemed | | | (19,756,525 | ) | | | (17,153,596 | ) |
| Net decrease from share transactions | | | (19,756,525 | ) | | | (17,153,596 | ) |
| Net decrease in net assets | | | (12,500,179 | ) | | | (18,747,772 | ) |
| | | | | | | | | |
| NET ASSETS: | | | | | | | | |
| Beginning of year | | | 80,550,358 | | | | 99,298,130 | |
| End of year * | | $ | 68,050,179 | | | $ | 80,550,358 | |
| | | | | | | | | |
| *Including accumulated net investment loss of: | | $ | (862,251 | ) | | $ | (936,753 | ) |
| | | | | | | | | |
| OTHER INFORMATION: | | | | | | | | |
| CAPITAL SHARE TRANSACTIONS: | | | | | | | | |
| Beginning shares | | | 1,950,000 | | | | 2,350,000 | |
| Shares sold | | | – | | | | – | |
| Shares redeemed | | | (450,000 | ) | | | (400,000 | ) |
| Shares outstanding, end of year | | | 1,500,000 | | | | 1,950,000 | |
See Notes to Financial Statements.
Cohen & Steers Global Realty Majors ETF
| Financial Highlights | For a Share Outstanding Throughout the Periods Presented |
| | | For the Year Ended November 30, 2017 | | | For the Year Ended November 30, 2016 | | | For the Year Ended November 30, 2015 | | | For the Year Ended November 30, 2014 | | | For the Year Ended November 30, 2013 | |
| NET ASSET VALUE, BEGINNING OF PERIOD | | $ | 41.31 | | | $ | 42.25 | | | $ | 44.07 | | | $ | 39.32 | | | $ | 39.59 | |
| | | | | | | | | | | | | | | | | | | | | |
| INCOME/(LOSS) FROM INVESTMENT OPERATIONS: | | | | | | | | | | | | | | | | | | | | |
| Net investment income(a) | | | 0.75 | | | | 1.24 | | | | 1.41 | | | | 0.92 | | | | 0.94 | |
| Net realized and unrealized gain/(loss) | | | 4.45 | | | | (0.90 | ) | | | (1.57 | ) | | | 4.85 | | | | 1.25 | |
| Total from investment operations | | | 5.20 | | | | 0.34 | | | | (0.16 | ) | | | 5.77 | | | | 2.19 | |
| | | | | | | | | | | | | | | | | | | | | |
| DISTRIBUTIONS: | | | | | | | | | | | | | | | | | | | | |
| From net investment income | | | (1.14 | ) | | | (1.28 | ) | | | (1.66 | ) | | | (1.02 | ) | | | (2.27 | ) |
| From tax return of capital | | | – | | | | – | | | | – | | | | – | | | | (0.19 | ) |
| Total distributions | | | (1.14 | ) | | | (1.28 | ) | | | (1.66 | ) | | | (1.02 | ) | | | (2.46 | ) |
| | | | | | | | | | | | | | | | | | | | | |
| NET INCREASE/(DECREASE) IN NET ASSET VALUE | | | 4.06 | | | | (0.94 | ) | | | (1.82 | ) | | | 4.75 | | | | (0.27 | ) |
| NET ASSET VALUE, END OF PERIOD | | $ | 45.37 | | | $ | 41.31 | | | $ | 42.25 | | | $ | 44.07 | | | $ | 39.32 | |
| TOTAL RETURN(b) | | | 12.77 | % | | | 0.61 | % | | | (0.38 | )% | | | 14.90 | % | | | 5.60 | % |
| | | | | | | | | | | | | | | | | | | | | |
| RATIOS/SUPPLEMENTAL DATA: | | | | | | | | | | | | | | | | | | | | |
| Net assets, end of period (000s) | | $ | 68,050 | | | $ | 80,550 | | | $ | 99,298 | | | $ | 96,953 | | | $ | 108,137 | |
| | | | | | | | | | | | | | | | | | | | | |
| Ratio of expenses to average net assets | | | 0.55 | % | | | 0.55 | % | | | 0.55 | % | | | 0.55 | % | | | 0.55 | % |
| Ratio of net investment income to average net assets | | | 1.71 | % | | | 2.86 | % | | | 3.24 | % | | | 2.21 | % | | | 2.31 | % |
| Portfolio turnover rate(c) | | | 10 | % | | | 8 | % | | | 7 | % | | | 11 | % | | | 10 | % |
| (a) | Based on average shares outstanding during the period. |
| (b) | Total return is calculated assuming an initial investment made at the net asset value at the beginning of the period and redemption at the net asset value on the last day of the period and assuming all distributions are reinvested at reinvestment prices. |
| (c) | Portfolio turnover for periods less than one year is not annualized and does not include securities received or delivered from processing creations or redemptions in-kind. |
See Notes to Financial Statements.
Cohen & Steers Global Realty Majors ETF
| Notes to Financial Statements | November 30, 2017 |
1. ORGANIZATION
ALPS ETF Trust (the “Trust”), a Delaware statutory trust, is an open-end management investment company registered under the Investment Company Act of 1940, as amended (the “1940 Act”). As of November 30, 2017, the Trust consisted of nineteen separate portfolios. Each portfolio represents a separate series of the Trust. This report pertains solely to the Cohen & Steers Global Realty Majors ETF (the “Fund”). The investment objective of the Fund is to seek investment results that correspond generally to the performance, before the Fund’s fees and expenses, of an index called the Cohen & Steers Global Realty Majors Index (the “Underlying Index”). The investment advisor uses a “passive” or indexing approach to try to achieve the Fund’s investment objective. The Fund is considered non-diversified and may invest a greater portion of assets in securities of individual issuers than a diversified fund. As a result, changes in the market value of a single investment could cause greater fluctuations in share price than would occur in a diversified fund.
The Fund’s Shares (“Shares”) are listed on the NYSE Arca, Inc. The Fund issues and redeems Shares at net asset value (“NAV”) in blocks of 50,000 Shares, each of which is called a “Creation Unit”. Creation Units are issued and redeemed principally in-kind for securities included in the Underlying Index. Except when aggregated in Creation Units, Shares are not redeemable securities of the Fund.
Pursuant to the Trust’s organizational documents, its Officers and Trustees are indemnified against certain liability arising out of the performance of their duties to the Trust. Additionally, in the normal course of business, the Trust enters into contracts with service providers that contain general indemnification clauses. The Trust’s maximum exposure under these arrangements is unknown, as this would involve future claims that may be made against the Trust that have not yet occurred.
2. SIGNIFICANT ACCOUNTING POLICIES
The following is a summary of significant accounting policies consistently followed by the Fund in the preparation of the financial statements. The accompanying financial statements were prepared in accordance with accounting principles generally accepted in the United States of America (“U.S. GAAP”). The preparation of financial statements in conformity with U.S. GAAP requires management to make certain estimates and assumptions that affect the reported amounts of assets and liabilities and disclosures of contingent assets and liabilities at the date of the financial statements and the reported amounts of revenue and expenses during the period. Actual results could differ from those estimates. The Fund is considered an investment company under U.S. GAAP and follows the accounting and reporting guidance applicable to investment companies in the Financial Accounting Standards Board Accounting Standards Codification Topic 946.
A. Portfolio Valuation
The Fund’s NAV is determined daily, as of the close of regular trading on the New York Stock Exchange (the “NYSE”), normally 4:00 p.m. Eastern time, on each day the NYSE is open for trading. The NAV is computed by dividing the value of all assets of the Fund (including accrued interest and dividends), less all liabilities (including accrued expenses and dividends declared but unpaid), by the total number of shares outstanding.
Portfolio securities listed on any exchange other than the NASDAQ Stock Market LLC (“NASDAQ”) are valued at the last sale price on the business day as of which such value is being determined. If there has been no sale on such day, the securities are valued at the mean of the most recent bid and asked prices on such day. Securities traded on the NASDAQ are valued at the NASDAQ Official Closing Price as determined by NASDAQ. Portfolio securities traded on more than one securities exchange are valued at the last sale price on the business day as of which such value is being determined at the close of the exchange representing the principal market for such securities. Portfolio securities traded in the over-the-counter market, but excluding securities traded on the NASDAQ, are valued at the latest quoted sale price in such market.
The Fund’s investments are valued at market value or, in the absence of market value with respect to any portfolio securities, at fair value according to procedures adopted by the Trust’s Board of Trustees (the “Board”). When market quotations are not readily available or when events occur that make established valuation methods unreliable, securities of the Fund may be valued in good faith by or under the direction of the Board. These securities generally include, but are not limited to, restricted securities (securities which may not be publicly sold without registration under the Securities Act of 1933) for which a pricing service is unable to provide a market price; securities whose trading has been formally suspended; a security whose market price is not available from a pre-established primary pricing source or the pricing source is not willing to provide a price; a security with respect to which an event has occurred that is most likely to materially affect the value of the security after the market has closed but before the calculation of the Fund’s NAV or make it difficult or impossible to obtain a reliable market quotation; or a security whose price, as provided by the pricing service, does not reflect the security’s “fair value” due to the security being de-listed from a national exchange or the security’s primary trading market is temporarily closed at a time when, under normal conditions, it would be open. As a general principle, the current “fair value” of a security would be the amount which the owner might reasonably expect to receive from the sale on the applicable exchange or principal market. A variety of factors may be considered in determining the fair value of such securities.
Cohen & Steers Global Realty Majors ETF
| Notes to Financial Statements | November 30, 2017 |
B. Fair Value Measurements
The Fund discloses the classification of its fair value measurements following a three-tier hierarchy based on the inputs used to measure fair value. Inputs refer broadly to the assumptions that market participants would use in pricing the asset or liability, including assumptions about risk. Inputs may be observable or unobservable. Observable inputs reflect the assumptions market participants would use in pricing the asset or liability that are developed based on market data obtained from sources independent of the reporting entity. Unobservable inputs reflect the reporting entity’s own assumptions about the assumptions market participants would use in pricing the asset or liability that are developed based on the best information available.
Valuation techniques used to value the Fund’s investments by major category are as follows:
Equity securities, including restricted securities, for which market quotations are readily available, are valued at the last reported sale price or official closing price as reported by a third party pricing vendor on the primary market or exchange on which they are traded and are categorized as Level 1 in the hierarchy. In the event there were no sales during the day or closing prices are not available, securities are valued at the mean of the most recent quoted bid and ask prices on such day and are generally categorized as Level 2 in the hierarchy. Investments in open-end mutual funds are valued at their NAV each business day and are categorized as Level 1 in the hierarchy.
Changes in valuation techniques may result in transfers in or out of an assigned level within the disclosure hierarchy.
Various inputs are used in determining the value of the Fund’s investments as of the end of the reporting period. When inputs used fall into different levels of the fair value hierarchy, the level in the hierarchy within which the fair value measurement falls is determined based on the lowest level input that is significant to the fair value measurement in its entirety. The designated input levels are not necessarily an indication of the risk or liquidity associated with these investments.
These inputs are categorized in the following hierarchy under applicable financial accounting standards:
| Level 1 – | Unadjusted quoted prices in active markets for identical investments, unrestricted assets or liabilities that a Fund has the ability to access at the measurement date; |
| Level 2 – | Quoted prices which are not active, quoted prices for similar assets or liabilities in active markets or inputs other than quoted prices that are observable (either directly or indirectly) for substantially the full term of the asset or liability; and |
| Level 3 – | Significant unobservable prices or inputs (including the Fund’s own assumptions in determining the fair value of investments) where there is little or no market activity for the asset or liability at the measurement date. |
The following is a summary of the inputs used to value the Fund’s investments as of November 30, 2017:
| Investments in Securities at Value* | | Level 1- Unadjusted Quoted Prices | | | Level 2- Other Significant Observable Inputs | | | Level 3- Significant Unobservable Inputs | | | Total | |
| Common Stocks | | $ | 67,911,884 | | | $ | – | | | $ | – | | | $ | 67,911,884 | |
| Short Term Investments | | | 223,956 | | | | – | | | | – | | | | 223,956 | |
| TOTAL | | $ | 68,135,840 | | | $ | – | | | $ | – | | | $ | 68,135,840 | |
| * | For a detailed geographical breakdown, see the accompanying Schedule of Investments. |
The Fund recognizes transfers between levels as of the end of the period. For the year ended November 30, 2017, the Fund did not have any transfers between Level 1 and Level 2 securities. The Fund did not have any securities that used significant unobservable inputs (Level 3) in determining fair value.
C. Foreign Securities
The Fund may directly purchase securities of non-U.S. issuers. Investing in securities of non-U.S. issuers may involve unique risks compared to investing in securities of U.S. issuers, including, among others, less liquidity generally, greater market volatility than U.S. securities and less complete financial information than for U.S. issuers. In addition, adverse political, economic or social developments could undermine the value of the Fund’s investments or prevent the Fund from realizing the full value of its investments. Financial reporting standards for companies based in foreign markets differ from those in the United States. Finally, the value of the currency of the country in which the Fund has invested could decline relative to the value of the U.S. dollar, which may affect the value of the investment to U.S. investors.
Cohen & Steers Global Realty Majors ETF
| Notes to Financial Statements | November 30, 2017 |
D. Foreign Currency Translation
The books and records of the Fund are maintained in U.S. dollars. Investment valuations and other assets and liabilities initially expressed in foreign currencies are converted each business day into U.S. dollars based upon current exchange rates. The portion of realized and unrealized gains or losses on investments due to fluctuations in foreign currency exchange rates is not separately disclosed and is included in realized and unrealized gains or losses on investments, when applicable.
E. Securities Transactions and Investment Income
Securities transactions are recorded as of the trade date. Realized gains and losses from securities transactions are recorded on the highest cost basis. Dividend income and capital gains distributions, if any, are recorded on the ex-dividend date, net of any foreign taxes withheld. Interest income, if any, is recorded on the accrual basis.
F. Dividends and Distributions to Shareholders
Dividends from net investment income of the Fund, if any, are declared and paid quarterly or as the Board may determine from time to time. Distributions of net realized capital gains earned by the Fund, if any, are distributed at least annually.
G. Real Estate Investment Trusts (“REITs”)
As part of its investments in real estate related securities, the Fund will invest in REITs and is subject to certain risks associated with direct investment in REITs. REITs possess certain risks which differ from an investment in common stocks. REITs are financial vehicles that pool investors’ capital to acquire, develop and/or finance real estate and provide services to their tenants. REITs may concentrate their investments in specific geographic areas or in specific property types, e.g., regional malls, shopping centers, office buildings, apartment buildings and industrial warehouses. REITs may be affected by changes in the value of their underlying properties and by defaults by borrowers or tenants. REITs depend generally on their ability to generate cash flow to make distributions to shareowners, and certain REITs have self-liquidation provisions by which mortgages held may be paid in full and distributions of capital returns may be made at any time.
As REITs generally pay a higher rate of dividends than most other operating companies, to the extent application of the Fund’s investment strategy results in the Fund investing in REIT shares, the percentage of the Fund’s dividend income received from REIT shares will likely exceed the percentage of the Fund’s portfolio that is comprised of REIT shares. Distributions received by the Fund from REITs may consist of dividends, capital gains and/or return of capital.
Dividend income from REITs is recognized on the ex-dividend date. The calendar year-end amounts of ordinary income, capital gains, and return of capital included in distributions received from the Fund’s investments in REITs are reported to the Fund after the end of the calendar year; accordingly, the Fund estimates these amounts for accounting purposes until the characterization of REIT distributions is reported to the Fund after the end of the calendar year. Estimates are based on the most recent REIT distribution information available.
The performance of a REIT may be affected by its failure to qualify for tax-free pass-through of income under the Internal Revenue Code of 1986, as amended (the “Code”), or its failure to maintain exemption from registration under the 1940 Act. Due to the Fund’s investments in REITs, the Fund may also make distributions in excess of the Fund’s earnings and capital gains. Distributions, if any, in excess of the Fund’s earnings and profits will first reduce the adjusted tax basis of a holder’s shares and, after that basis has been reduced to zero, will constitute capital gains to the shareholder.
H. Federal Tax and Tax Basis Information
The timing and character of income and capital gain distributions are determined in accordance with income tax regulations, which may differ from U.S. GAAP. Reclassifications are made to the Fund’s capital accounts for permanent tax differences to reflect income and gains available for distribution (or available capital loss carryforwards) under income tax regulations.
Cohen & Steers Global Realty Majors ETF
| Notes to Financial Statements | November 30, 2017 |
For the year ended November 30, 2017, the following reclassifications, which had no impact on results of operations or net assets, were recorded to reflect permanent tax differences resulting primarily from in-kind transactions:
| Fund | | Paid-in Capital | | | Accumulated Net Investment Gain/(Loss) | | | Accumulated Net Realized Gain/(Loss) on Investments | |
| Cohen & Steers Global Realty Majors ETF | | $ | 3,541,485 | | | $ | 775,289 | | | $ | (4,316,774 | ) |
Included in the amounts reclassified was a net operating loss offset to PIC of $37.
The tax character of the distribution paid during the fiscal years ended November 30, 2017 and November 30, 2016 were as follows:
| | | Ordinary Income | |
| November 30, 2017 | | | | |
| Cohen & Steers Global Realty Majors ETF | | $ | 1,968,767 | |
| November 30, 2016 | | | | |
| Cohen & Steers Global Realty Majors ETF | | $ | 2,806,590 | |
Under the Regulated Investment Company Modernization Act of 2010 (“the Modernization Act”), net capital losses recognized in tax years beginning after December 22, 2010 may be carried forward indefinitely, and the character of the losses is retained as short-term and/or long-term. Under the law in effect prior to the Modernization Act, net capital losses were carried forward for eight years and treated as short-term. As a transition rule, the Modernization Act requires that post-enactment net capital losses be used before pre-enactment net capital losses. Additionally, post-enactment capital losses that are carried forward will retain their character as either short-term or long-term losses rather than being considered all short-term as under previous law.
At November 30, 2017, the Fund had available for tax purposes unused pre-enactment capital loss carryforwards as follows:
| Fund | | Expiring in 2018 | |
| Cohen & Steers Global Realty Majors ETF | | $ | 187,815 | |
Capital loss carryovers used during the period ended November 30, 2017 were $371,839
At November 30, 2017, the Fund had available for tax purposes unused post-enactment capital loss carryforwards as follows:
| Fund | | Short-Term | | | Long-Term | |
| Cohen & Steers Global Realty Majors ETF | | $ | 1,135,828 | | | $ | 2,562,321 | |
As of November 30, 2017, the components of distributable earnings on a tax basis for the Fund were as follows:
| Undistributed net investment income | | $ | 1,144,953 | |
| Accumulated net realized loss on investments | | | (3,885,964 | ) |
| Net unrealized appreciation on investments | | | 6,372,737 | |
| Total | | $ | 3,631,726 | |
Cohen & Steers Global Realty Majors ETF
| Notes to Financial Statements | November 30, 2017 |
As of November 30, 2017, the cost of investments for federal income tax purposes and accumulated net unrealized appreciation/(depreciation) on investments were as follows:
| Gross appreciation (excess of value over tax cost) | | $ | 9,129,822 | |
| Gross depreciation (excess of tax cost over value) | | | (2,756,720 | ) |
| Net depreciation on foreign currency transactions | | | (365 | ) |
| Net unrealized appreciation (depreciation) | | | 6,372,737 | |
| Cost of investments for income tax purposes | | $ | 61,762,968 | |
The differences between book-basis and tax-basis are primarily due to Passive Foreign Investment Company (“PFIC”) adjustments and the deferral of losses due to wash sales.
I. Income Taxes
No provision for income taxes is included in the accompanying financial statements, as the Fund intends to distribute to shareholders all taxable investment income and realized gains and otherwise comply with Subchapter M of the Internal Revenue Code of 1986, as amended, applicable to regulated investment companies. The Fund evaluates tax positions taken (or expected to be taken) in the course of preparing the Fund’s tax returns to determine whether these positions meet a “more-likely-than-not” standard that, based on the technical merits, have a more than fifty percent likelihood of being sustained by a taxing authority upon examination. A tax position that meets the “more-likely-than-not” recognition threshold is measured to determine the amount of benefit to recognize in the financial statements.
As of and during the year ended November 30, 2017, the Fund did not have a liability for any unrecognized tax benefits. The Fund files U.S. federal, state, and local tax returns as required. The Fund’s tax returns are subject to examination by the relevant tax authorities until expiration of the applicable statute of limitations, which is generally three years after the filing of the tax return, but may extend to four years in certain jurisdictions. Tax returns for open years have incorporated no uncertain tax positions that require a provision for income taxes.
J. Lending of Portfolio Securities
The Fund has entered into a securities lending agreement with State Street Bank & Trust Co. (“SSB”), the Fund’s lending agent. The Fund may lend its portfolio securities only to borrowers that are approved by SSB. The Fund will limit such lending to not more than 33 1/3% of the value of its total assets. The Fund’s securities held at SSB as custodian shall be available to be lent except those securities the Fund or ALPS Advisors, Inc. specifically identifies in writing as not being available for lending. The borrower pledges and maintains with the Fund collateral consisting of cash (U.S. Dollars only), securities issued or guaranteed by the U.S. government or its agencies or instrumentalities, and cash equivalents (including irrevocable bank letters of credit) issued by a person other than the borrower or an affiliate of the borrower. The initial collateral received by the Fund is required to have a value of no less than 102% of the market value of the loaned securities for U.S equity securities and a value of no less than 105% of the market value for non-U.S. equity securities. The collateral is maintained thereafter, at a market value equal to not less than 102% of the current value of the U.S. equity securities on loan and not less than 105% of the current value of the non-U.S. equity securities on loan. The market value of the loaned securities is determined at the close of each business day and any additional required collateral is delivered to the Fund on the next business day. During the term of the loan, the Fund is entitled to all distributions made on or in respect of the loaned securities. Loans of securities are terminable at any time and the borrower, after notice, is required to return borrowed securities within the customary time period for settlement of securities transactions.
Any cash collateral received is reinvested in a money market fund managed by SSB as disclosed in the Fund’s Schedule of Investments and is reflected in the Statement of Assets and Liabilities as a payable for collateral upon return of securities loaned. Non-cash collateral, in the form of securities issued or guaranteed by the U.S. government or its agencies or instrumentalities, is not disclosed in the Fund’s Statement of Assets and Liabilities as it is held by the lending agent on behalf of the Fund, and the Fund does not have the ability to re-hypothecate these securities. Income earned by the Fund from securities lending activity is disclosed in the Statement of Operations. As of November 30, 2017, the Fund had no securities on loan.
The risks of securities lending include the risk that the borrower may not provide additional collateral when required or may not return the securities when due. To mitigate these risks, the Fund benefits from a borrower default indemnity provided by SSB. SSB’s indemnity allows for full replacement of securities lent wherein SSB will purchase the unreturned loaned securities on the open market by applying the proceeds of the collateral, or to the extent such proceeds are insufficient or the collateral is unavailable, SSB will purchase the unreturned loan securities at SSB’s expense. However, the Fund could suffer a loss if the value of the investments purchased with cash collateral falls below the value of the cash collateral received.
Cohen & Steers Global Realty Majors ETF
| Notes to Financial Statements | November 30, 2017 |
3. INVESTMENT ADVISORY FEE AND OTHER AFFILIATED TRANSACTIONS
ALPS Advisors, Inc. (the “Adviser”) acts as the Fund’s investment adviser pursuant to an Advisory Agreement with the Trust on behalf of the Fund (the “Advisory Agreement”). Pursuant to the Advisory Agreement, the Fund pays the Adviser a unitary fee for the services and facilities it provides payable on a monthly basis at the annual rate of 0.55% of the Fund’s average daily net assets. From time to time, the Adviser may waive all or a portion of its fee.
Out of the unitary management fee, the Adviser pays substantially all expenses of the Fund, including the cost of transfer agency, custody, fund administration, legal, audit, independent trustees and other services, except for interest expenses, distribution fees or expenses, brokerage expenses, taxes and extraordinary expenses such as litigation and other expenses not incurred in the ordinary course of the Fund’s business. The Adviser’s unitary management fee is designed to pay substantially all the Fund's expenses and to compensate the Adviser for providing services for the Fund.
ALPS Fund Services, Inc., an affiliate of the Adviser, is the administrator of the Fund.
Each Trustee who is not an officer or employee of the Adviser, any sub-adviser or any of their affiliates (“Independent Trustees”) receives (1) a quarterly retainer of $5,000, (2) a per meeting fee for regularly scheduled meetings of $3,750, (3) $1,500 for any special meeting held outside of a regularly scheduled board meeting, and (4) reimbursement for all reasonable out-of-pocket expenses relating to attendance at meetings.
4. PURCHASES AND SALES OF SECURITIES
For the year ended November 30, 2017, the cost of purchases and proceeds from sales of investment securities, excluding in-kind transactions and short-term investments, were as follows:
| | | Purchases | | | | Sales | |
| | $ | 7,618,199 | | | $ | 7,205,918 | |
For the year ended November 30, 2017, the cost of in-kind purchases and proceeds from in-kind sales were as follows:
| | Purchases | | | Sales | |
| $ | – | | | $ | 19,724,813 | |
For the year ended November 30, 2017, the Cohen and Steers Global Realty Majors ETF had in-kind net realized gain of $4,416,359.
Gains on in-kind transactions are not considered taxable for federal income tax purposes and losses on in kind transactions are also not deductible for tax purposes.
5. CAPITAL SHARE TRANSACTIONS
Shares are created and redeemed by the Fund only in Creation Unit size aggregations of 50,000 Shares. Only broker-dealers or large institutional investors with creation and redemption agreements called Authorized Participants (“AP”) are permitted to purchase or redeem Creation Units from the Fund. Such transactions are generally permitted on an in-kind basis, with a balancing cash component to equate the transaction to the NAV per unit of the Fund on the transaction date. Cash may be substituted equivalent to the value of certain securities generally when they are not available in sufficient quantity for delivery, not eligible for trading by the AP or as a result of other market circumstances.
Cohen & Steers Global Realty Majors ETF
| Additional Information | November 30, 2017 (Unaudited) |
PROXY VOTING POLICIES AND PROCEDURES
Information regarding how the Fund voted proxies relating to portfolio securities during the most recent 12-month period ended June 30 and a description of the Fund’s proxy voting policies and procedures used in determining how to vote for proxies are available without charge on the SEC’s website at www.sec.gov and upon request, by calling (toll-free) 1-866-675-2639.
PORTFOLIO HOLDINGS
The Trust is required to disclose, after its first and third fiscal quarters, the complete schedule of the Fund’s portfolio holdings with the SEC on Form N-Q. Forms N-Q for the Fund are available on the SEC’s website at www.sec.gov. The Fund’s Forms N-Q may also be reviewed and copied at the SEC’s Public Reference Room in Washington, D.C. and information on the operation of the Public Reference Room may be obtained by calling 1-800-SEC-0330. The Fund’s Forms N-Q are available without charge, upon request, by calling (toll-free) 1-866-675-2639 or by writing to ALPS ETF Trust at 1290 Broadway, Suite 1100, Denver, Colorado 80203.
TAX INFORMATION
The Fund designated the following for federal income tax purposes for distributions made during the calendar year ended December 31, 2016:
| | Qualified Dividend Income | Dividend Received Deduction |
| Cohen and Steers Global Realty Majors ETF | 14.62% | 0.00% |
In early 2017, if applicable, shareholders of record received this information for the distribution paid to them by the Fund during the calendar year 2016 via Form 1099. The Fund will notify shareholders in early 2018 of amounts paid to them by the Fund, if any, during the calendar year 2017.
LICENSING AGREEMENT
Cohen & Steers is the Index Provider for the Cohen & Steers Global Realty Majors ETF. Cohen & Steers is not affiliated with the Trust, the Adviser or the Distributor. ALPS, an affiliate of the Adviser, and the Trust have entered into a license agreement with Cohen & Steers to use the Index.
THE FUND IS NOT SPONSORED, MANAGED OR ADVISED BY COHEN & STEERS CAPTIAL MANAGEMENT, INC. (“C&S”). C&S MAKES NO REPRESENTATION OR WARRANTY, EXPRESS OR IMPLIED, TO THE SHAREHOLDERS OF THE FUND OR ANY MEMBER OF THE PUBLIC REGARDING THE ADVISABILITY OF INVESTING IN SECURITIES GENERALLY OR IN THE FUND PARTICULARLY OR THE ABILITY OF THE COHEN & STEERS GLOBAL REALTY MAJORS INDEX TO TRACK PERFORMANCE OF A MARKET OR SECTOR. C&S’S ONLY RELATIONSHIP TO ALPS IS IN RELATION TO THE LICENSING OF CERTAIN TRADEMARKS AND TRADE NAMES OF C&S AND OF ONE OR MORE C&S INDEXES, INCLUDING THE COHEN & STEERS GLOBAL REALTY MAJORS INDEX WHICH IS DETERMINED, COMPOSED AND CALCULATED BY C&S WITHOUT REGARD TO ALPS OR THE FUND. C&S HAS NO OBLIGATION TO TAKE THE NEEDS OF ALPS, THE FUND OR THE FUND SHAREHOLDERS INTO CONSIDERATION IN DETERMINING, COMPOSING OR CALCULATING THE COHEN & STEERS GLOBAL REALTY MAJORS INDEX. C&S IS NOT RESPONSIBLE FOR AND HAS NOT PARTICIPATED IN THE TIMING OF THE ISSUANCE OR SALE OF FUND SHARES OR IN THE DETERMINATION OR CALCULATION OF THE VALUATION OF THE FUND’S ASSETS. C&S HAS NO OBLIGATION OR LIABILITY IN CONNECTION WITH THE ADMINISTRATION, MARKETING OR PORTFOLIO MANAGEMENT OF THE FUND. C&S DOES NOT GUARANTEE THE ACCURACY AND/OR THE COMPLETENESS OF THE COHEN & STEERS GLOBAL REALTY MAJORS INDEX OR ANY DATA INCLUDED THEREIN AND C&S SHALL HAVE NO LIABILITY FOR ANY ERRORS, OMISSIONS, OR INTERRUPTIONS THEREIN. C&S MAKES NO WARRANTY, EXPRESS OR IMPLIED, AS TO RESULTS TO BE OBTAINED BY ALPS, THE FUND, FUND SHAREHOLDERS, OR ANY OTHER PERSON OR ENTITY FROM THE USE OF THE COHEN & STEERS GLOBAL REALTY MAJORS INDEX OR ANY DATA INCLUDED THEREIN. C&S MAKES NO EXPRESS OR IMPLIED WARRANTIES, AND EXPRESSLY DISCLAIMS ALL WARRANTIES OF MERCHANTABILITY OR FITNESS FOR A PARTICULAR PURPOSE OF USE WITH RESPECT TO THE COHEN & STEERS GLOBAL REALTY MAJORS INDEX OR ANY DATA INCLUDED THEREIN. WITHOUT LIMITING ANY OF THE FOREGOING, IN NO EVENT SHALL C&S HAVE ANY LIABILITY FOR ANY SPECIAL, PUNITIVE, INDIRECT OR CONSEQUENTIAL DAMAGES (INCLUDING LOST PROFITS) RESULTING FROM THE USE OF THE COHEN & STEERS GLOBAL REALTY MAJORS INDEX OR ANY DATA INCLUDED THEREIN, EVEN IF NOTIFIED OF THE POSSIBILITY OF SUCH DAMAGES.
The Advisor does not guarantee the accuracy and/or the completeness of the Index or any data included therein, and the Advisor shall have no liability for any errors, omissions or interruptions therein. The Advisor makes no warranty, express or implied, as to results to be obtained by the Fund, owners of the Shares of the Fund or any other person or entity from the use of the Index or any data included therein. The Advisor makes no express or implied warranties, and expressly disclaims all warranties of merchantability or fitness for a particular purpose or use with respect to the Index or any data included therein. Without limiting any of the foregoing, in no event shall the Advisor have any liability for any special, punitive, direct, indirect or consequential damages (including lost profits) arising out of matters relating to the use of the Index even if notified of the possibility of such damages.
Cohen & Steers Global Realty Majors ETF
| Board Considerations Regarding Approval of Investment Advisory Agreement | November 30, 2017 (Unaudited) |
At an in-person meeting held on June 8, 2017, the Board of Trustees of the Trust (the “Board” or the “Trustees”), including the Trustees who are not “interested persons” of the Trust within the meaning of the 1940 Act, as amended (the “Independent Trustees”), evaluated a proposal to approve the continuance of the Investment Advisory Agreement between the Trust and ALPS Advisors, Inc. (the “Adviser” or “AAI”) with respect to the Cohen & Steers Global Realty Majors ETF (“GRI” or “the Fund”). The Independent Trustees also met separately to consider the Investment Advisory Agreement.
In evaluating the Investment Advisory Agreement with respect to the Fund, the Independent Trustees considered various factors, including (i) the nature, extent and quality of the services provided by AAI with respect to the Fund under the Investment Advisory Agreements; (ii) the advisory fees and other expenses paid by the Fund compared to those of similar funds managed by other investment advisers; (iii) the costs of the services provided to the Fund by AAI and the profits realized by AAI and its affiliates from its relationship to the Fund; (iv) the extent to which economies of scale have been or would be realized if and as the assets of the Fund grow and whether fees reflect the economies of scale for the benefit of shareholders; and (v) any additional benefits and other considerations.
With respect to the nature, extent and quality of the services provided by AAI under the Investment Advisory Agreement, the Independent Trustees considered and reviewed information concerning the services provided under the Investment Advisory Agreement, the investment parameters of the index of the Fund, financial information regarding AAI and its parent company, information describing AAI’s current organization and the background and experience of the persons responsible for the day-to-day management of the Fund.
The Independent Trustees reviewed information on the performance of the Fund and its benchmark. The Independent Trustees also evaluated the correlation and tracking error between the underlying index and the Fund’s performance. Based on their review, the Independent Trustees found that the nature and extent of services provided to each Fund under the Investment Advisory Agreements was appropriate and that the quality was satisfactory.
The Independent Trustees noted that the advisory fee for the Fund was a unitary fee pursuant to which AAI assumes all expenses of the Fund (including the cost of transfer agency, custody, fund administration, legal, audit and other services) other than the payments under the Investment Advisory Agreement, brokerage expenses, taxes, interest, litigation expenses and other extraordinary expenses.
With respect to the advisory fee rate, the Independent Trustees noted the following:
The net advisory fee rate for the Fund is higher than the median of its Broadridge expense group and the Fund’s expense ratio is slightly above the median of its Broadridge expense group.
Based on the foregoing, and the other information available to them, the Independent Trustees concluded that the advisory fee rate for the Fund was reasonable under the circumstances and in light of the quality of the services provided.
The Independent Trustees considered other benefits available to AAI because of its relationship with the Fund and concluded that the advisory fees were reasonable taking into account any such benefits.
The Independent Trustees also considered with respect to the Fund the information provided by AAI about the costs and profitability of AAI with respect to the Fund. The Independent Trustees reviewed and noted the relatively small size of the Fund and concluded that AAI was not realizing any economies of scale. The Independent Trustees determined that they would continue to evaluate whether further economies of scale have been achieved on an ongoing basis.
In voting to renew the Investment Advisory Agreement, the Independent Trustees concluded that the terms of the Investment Advisory Agreement are reasonable and fair in light of the services to be performed, the fees paid by certain other funds, expenses to be incurred and such other matters as the Independent Trustees considered relevant in the exercise of their reasonable business judgment. The Independent Trustees did not identify any single factor or group of factors as all important or controlling and considered all factors together.
Cohen & Steers Global Realty Majors ETF
| Trustees & Officers | November 30, 2017 (Unaudited) |
The general supervision of the duties performed by the Adviser for the Fund under the Investment Advisory Agreement is the responsibility of the Board of Trustees. The Trust currently has four Trustees. Three Trustees have no affiliation or business connection with the Adviser or any of its affiliated persons and do not own any stock or other securities issued by the Adviser. These are the “non-interested” or “independent” Trustees (“Independent Trustees”). The other Trustee (the “Interested Trustee”) is affiliated with the Adviser.
The Independent Trustees of the Trust, their term of office and length of time served, their principal business occupations during the past five years, the number of portfolios in the Fund Complex overseen by each Independent Trustee, and other directorships, if any, held by the Trustee are shown below.
| INDEPENDENT TRUSTEES |
| Name, Address & Year of Birth* | Position(s) Held with Trust | Term of Office and Length of Time Served** | Principal Occupation(s) During Past 5 Years | Number of Portfolios in Fund Complex Overseen by Trustees*** | Other Directorships Held by Trustees |
| Mary K. Anstine, 1940 | Trustee | Since March 2008 | Ms. Anstine was President/Chief Executive Officer of HealthONE Alliance, Denver, Colorado, and former Executive Vice President of First Interstate Bank of Denver. Ms. Anstine is also Trustee/Director of AV Hunter Trust and Colorado Uplift Board. Ms. Anstine was formerly a Director of the Trust Bank of Colorado (later purchased and now known as Northern Trust Bank), HealthONE and Denver Area Council of the Boy Scouts of America and a member of the American Bankers Association Trust Executive Committee. | 42 | Ms. Anstine is a Trustee of ALPS Variable Investment Trust (10 funds); Financial Investors Trust (33 funds); Reaves Utility Income Fund (1 fund); and Westcore Trust (14 funds). |
| Jeremy W. Deems, 1976 | Trustee | Since March 2008 | Mr. Deems is the Co-Founder, Chief Compliance Officer and Chief Financial Officer of Green Alpha Advisors, LLC. Mr. Deems is Co-Portfolio Manager of the Shelton Green Alpha Fund. Prior to joining Green Alpha Advisors, Mr. Deems was CFO and Treasurer of Forward Management, LLC, ReFlow Management Co., LLC, ReFlow Fund, LLC, a private investment fund, and Sutton Place Management, LLC, an administrative services company. | 44 | Mr. Deems is a Trustee of ALPS Variable Investment Trust (10 funds); Financial Investors Trust (33 funds); and Reaves Utility Income Fund (1 fund); Clough Funds Trust (1 fund) and Elevation ETF Trust (1 fund). |
| Rick A. Pederson, 1952 | Trustee and Chairman | Has served as Trustee since March 2008. Has served as Chairman since July 2017. | Mr. Pederson is President, Foundation Properties, Inc. (a real estate investment management company), 1994 - present; Advisory Board Member, Bow River Capital Partners (private equity management), 2003 - present; Advisor, The Pauls Corporation (real estate investment management and development), 2008 - present; Chairman, Ross Consulting Group (real estate consulting services) 1983-2013; Advisory Board, Neenan Company (construction services) 2002-present; Board Member, Prosci Inc. (private business services) 2013-2016; Board Member, Citywide Banks (Colorado community bank) 2014-present; Board member, Professional Pediatric Health Care (a Denver-based home nursing firm) 2014 – present; Board Member, Strong-Bridge Consulting (management consulting) 2015-present; Director, National Western Stock Show (not-for-profit organization); Director, Biennial of the Americas (not-for-profit-organization), 2012- 2015; Board Member, History Colorado, 2015 -present. | 21 | Mr. Pederson is Trustee of Westcore Trust (14 funds) and Principal Real Estate Income Fund (1 fund). |
| * | The business address of the Trustee is c/o ALPS Advisors, Inc., 1290 Broadway, Suite 1100, Denver, Colorado 80203. |
| ** | This is the period for which the Trustee began serving the Trust. Each Trustee serves an indefinite term, until his successor is elected. |
| *** | The Fund Complex includes all series of the Trust and any other investment companies for which ALPS Advisors, Inc. provides investment advisory services. |
Cohen & Steers Global Realty Majors ETF
| Trustees & Officers | November 30, 2017 (Unaudited) |
The Trustee who is affiliated with the Adviser or affiliates of the Adviser and executive officers of the Trust, his term of office and length of time served, his principal business occupations during the past five years, the number of portfolios in the Fund Complex overseen by the Interested Trustee and the other directorships, if any, held by the Trustee, are shown below.
| INTERESTED TRUSTEE |
| Name, Address and Year of Birth of Interested Trustee* | Position(s) Held with Trust | Term of Office and Length of Time Served** | Principal Occupation(s) During Past 5 Years | Number of Portfolios in Fund Complex Overseen by Trustees*** | Other Directorships Held by Trustee |
| Edmund J. Burke, 1961 | Trustee and President | Mr. Burke was elected as Trustee of the Trust and President of the Trust at the December 11, 2017 meeting of the Board of Trustees. | Mr. Burke is President and a Director of ALPS Holdings, Inc. (“AHI”) (since 2005) and Director of Boston Financial Data Services, Inc. (“BFDS”), ALPS Advisors, Inc. (“AAI”), ALPS Distributors, Inc. (“ADI”), ALPS Fund Services, Inc. (“AFS”) and ALPS Portfolio Solutions Distributor, Inc. (“APSD”) and from 2001-2008, was President of AAI, ADI, AFS and APSD. Because of his positions with AHI, BFDS, AAI, ADI, AFS and APSD, Mr. Burke is deemed an affiliate of the Trust as defined under the 1940 Act. Mr. Burke is Trustee and President of the Clough Global Allocation Fund (Trustee since 2006; President since 2004); Trustee and President of the Clough Global Equity Fund (Trustee since 2006; President since 2005); Trustee and President of the Clough Global Opportunities Fund (since 2006); Trustee of the Liberty All-Star Equity Fund; Director of the Liberty All-Star Growth Fund, Inc. and Trustee and President of Financial Investors Trust (Trustee since 2009; President since 2002). | 36 | Mr. Burke is a Trustee of Clough Global Dividend and Income Fund (1 fund); Clough Global Equity Fund (1 fund); Clough Global Opportunities Fund (1 fund); Clough Funds Trust (1 fund); Liberty All -Star Equity Fund (1 fund); Director of the Liberty All-Star Growth Fund, Inc. (1 fund) and Financial Investors Trust (33 funds). |
| * | The business address of the Trustee is c/o ALPS Advisors, Inc., 1290 Broadway, Suite 1100, Denver, Colorado 80203. |
| ** | This is the period for which the Trustee began serving the Trust. Each Trustee serves an indefinite term, until his successor is elected. |
| *** | The Fund Complex includes all series of the Trust and any other investment companies for which ALPS Advisors, Inc. provides investment advisory services. |
Cohen & Steers Global Realty Majors ETF
| Trustees & Officers | November 30, 2017 (Unaudited) |
| OFFICERS | | | |
| Name, Address and Year of Birth of Officer | Position(s) Held with Trust | Length of Time Served* | Principal Occupation(s) During Past 5 Years |
Erin D. Nelson, 1977 | Chief Compliance Officer (“CCO”) | Since December 2015 | Erin Nelson became Senior Vice-President and Chief Compliance Officer of ALPS Advisors, Inc. (“AAI”) on July 1, 2015 and prior to that served as Vice President and Deputy Chief Compliance Officer of AAI since January 1, 2015. Prior to January 1, 2015, Ms. Nelson was Vice-President and Assistant General Counsel of ALPS Fund Services, Inc. Because of her position with AAI, Ms. Nelson is deemed an affiliate of the Trust as defined under the 1940 Act. Ms. Nelson is also the CCO of ALPS Variable Investment Trust, Liberty All-Star Growth Fund, Inc., Liberty All- Star Equity Fund, Principal Real Estate Income Fund, RiverNorth Opportunities Fund, Inc. and Red Rocks Capital, LLC. |
| Patrick D. Buchanan, 1972 | Treasurer | Since June 2012 | Mr. Buchanan is Vice President of AAI. Mr. Buchanan joined ALPS in 2007 and because of his position with AAI, he is deemed an affiliate of the Trust as defined under the 1940 Act. Mr. Buchanan is also Treasurer of the ALPS Variable Insurance Trust, Principal Real Estate Income Fund, Clough Funds Trust and RiverNorth Opportunities Fund, Inc. |
| Andrea E. Kuchli, 1985 | Secretary | Since December 2017 | Ms. Kuchli joined ALPS in 2015 and is currently Vice President and Senior Counsel of ALPS. Prior to joining ALPS, Ms. Kuchli was an Associate with Davis Graham & Stubbs LLP from April 2014 to February 2015, and an Associate with Dechert LLP from 2011 to April 2014. Because of her position with ALPS, Ms. Kuchli is deemed an affiliate of the Trust as defined under the 1940 Act. Ms. Kuchli is also Secretary of ALPS Variable Investment Trust, Elevation ETF Trust and Principal Real Estate Income Fund as well as Assistant Secretary of the James Advantage Funds. |
| Sharon Akselrod, 1974 | Assistant Secretary | Since December 2016 | Ms. Akselrod joined ALPS in August 2014 and is currently Senior Investment Company Act Paralegal of ALPS Fund Services, Inc. Prior to joining ALPS, Ms. Akselrod served as Corporate Governance and Regulatory Associate for Nordstrom fsb (2013-2014) and Senior Legal Assistant – Legal Manager for AXA Equitable Life Insurance Company (2008-2013). Because of her position with ALPS, Ms. Akselrod is deemed an affiliate of the Trust as defined under the 1940 Act. Ms. Akselrod is also Assistant Secretary of Financial Investors Trust and Principal Real Estate Income Fund. |
| Stephanie G. Danner, 1992 | Assistant Secretary | Since December 2017 | Ms. Danner joined ALPS in September of 2017 and is currently Vice President and Associate Senior Counsel of ALPS. Because of her position with ALPS, Ms. Danner is deemed an affiliate of the Trust as defined under the 1940 Act. |
| * | The business address of each Officer is c/o ALPS Advisors, Inc., 1290 Broadway, Suite 1100, Denver, Colorado 80203. |
| ** | This is the period for which the Officer began serving the Trust. Each Officer serves an indefinite term, until his/her successor is elected. |
The Statement of Additional Information includes additional information about the Fund's Trustees and is available, without charge, upon request by calling (toll-free) 1-866-513-5856.

| Performance Overview | |
| RiverFront Dynamic Core Income ETF | 1 |
| RiverFront Dynamic Unconstrained Income ETF | 3 |
| RiverFront Dynamic US Dividend Advantage ETF | 5 |
| RiverFront Dynamic US Flex-Cap ETF | 8 |
| RiverFront Strategic Income Fund | 11 |
| Disclosure of Fund Expenses | 14 |
| Report of Independent Registered Public Accounting Firm | 15 |
| Financial Statements | |
| Schedule of Investments | |
| RiverFront Dynamic Core Income ETF | 16 |
| RiverFront Dynamic Unconstrained Income ETF | 20 |
| RiverFront Dynamic US Dividend Advantage ETF | 23 |
| RiverFront Dynamic US Flex-Cap ETF | 25 |
| RiverFront Strategic Income Fund | 28 |
| Statements of Assets and Liabilities | 31 |
| Statements of Operations | 32 |
| Statements of Changes in Net Assets | |
| RiverFront Dynamic Core Income ETF | 33 |
| RiverFront Dynamic Unconstrained Income ETF | 34 |
| RiverFront Dynamic US Dividend Advantage ETF | 35 |
| RiverFront Dynamic US Flex-Cap ETF | 36 |
| RiverFront Strategic Income Fund | 37 |
| Financial Highlights | 38 |
| Notes to Financial Statements | 43 |
| Additional Information | 52 |
| Board Consideratons Regarding Approval of Investment Advisory Agreement and Investment Sub-Advisory Agreements | 53 |
| Trustees & Officers | 55 |
alpsfunds.com
RiverFront Dynamic Core Income ETF
| Performance Overview | November 30, 2017 (Unaudited) |
Investment Objective
RiverFront Dynamic Core Income ETF (the “Fund”) seeks total return, with an emphasis on income as the source of that total return. The Fund seeks to achieve its investment objective by investing in a global portfolio of fixed income securities of various maturities, ratings and currency denominations.
| | Annual Returns as of November 30, 2017 |
| RFCI Market | 3.10% |
| RFCI NAV | 3.15% |
| Benchmark: Bloomberg Barclays US Aggregate Bond Index | 3.21% |
2017 Performance Attribution
RFCI slightly underperformed its benchmark by 11 bps over the 12 months ending 11/30/17. The underperformance of RFCI relative to its benchmark was primarily due to its shorter average maturity, driven by an underweight to 20+ year maturity bonds. The fund ended the year with a duration of about 5 years, approximately 1 year shorter than its benchmark. Yields on 30-year Treasuries fell about 21 basis points over the course of the year, while shorter-term (1-5 Year) Treasury yields rose 30 to 67 basis points. The negative impact of being short duration was somewhat offset by investing primarily in corporate bonds. Risk premiums on corporate bonds, as measured by the ICE BofAML US Corporate Index, tightened 33 basis points, leading to a total return of 6.2%
2018 Outlook
We believe the US fixed income market is likely to face headwinds over the coming year including accelerating global growth and a less accommodative Federal Reserve (the “Fed”). The Fed is forecasting another three rate hikes during 2018, which will likely put upward pressure on short-term interest rates. The Fed is also scheduled to increase the pace of its balance sheet reduction and the European Central Bank (ECB) may also begin its balance sheet unwind towards the end of 2018. Unprecedented global central bank accommodation from the Fed, ECB, and Bank of Japan (BOJ) has depressed interest rates, risk premiums and market volatility across the globe. We believe that the combination of rising rates, less central bank support, and rich starting valuations are likely to depress fixed income returns in 2018 compared to 2017. Within the US fixed income market, we believe that corporate and high yield bonds are likely to outperform other higher quality sectors, such as Treasuries and Agency Mortgage Backed Securities (MBS). This belief is based primarily on our positive view of global macroeconomic growth in 2018 which we believe is translating into corporate earnings. We believe the backdrop of strong corporate and economic fundamentals is likely to keep default rates low. On the other hand, we are expecting higher, more normal levels of market volatility going forward due to a less accommodative Fed and elevated political/geo-political risks.
Performance (as of November 30, 2017)
| | 1 Year | Since Inception^ |
| RiverFront Dynamic Core Income ETF – NAV | 3.15% | 0.90% |
| RiverFront Dynamic Core Income ETF – Market Price* | 3.10% | 0.98% |
| Bloomberg Barclays U.S. Aggregate Bond Total Return Index | 3.21% | 0.80% |
Total Expense Ratio (per the current prospectus) 0.52%.
Performance data quoted represents past performance. Past performance does not guarantee future results. The table does not reflect the deduction of taxes that a shareholder would pay on Fund distributions or the redemption of Fund shares. Investment return and principal value of an investment will fluctuate so that an investor’s shares, when sold or redeemed, may be worth more or less than the original cost. Current performance data may be higher or lower than actual data quoted. For the most current month-end performance data please visit www.alpsfunds.com or call 1.866.759.5679.
NAV is an exchange-traded fund’s per-share value. The per-share dollar amount of the fund is derived by dividing the total value of all the securities in its portfolio, less any liabilities, by the number of fund shares outstanding. Market Price is the price at which a share can currently be traded in the market. Information detailing the number of days the Market Price of the Fund was greater than the Fund’s NAV and the number of days it was less than the Fund’s NAV can be obtained at www.alpsfunds.com.
| ^ | The Fund commenced operations on June 14, 2016. |
| * | Market Price is based on the midpoint of the bid-ask spread at 4 p.m. ET and does not represent the returns an investor would receive if shares were traded at other times. |
Bloomberg Barclays U.S. Aggregate Bond Index is a broad-based benchmark that measures the investment grade, U.S. dollar-denominated, fixed-rate taxable bond market, including Treasuries, government-related and corporate securities, MBS (agency fixed-rate and hybrid ARM pass-throughs), ABS, and CMBS (agency and non-agency). The index is reported on a total return basis, which assumes reinvestment of any dividends and distributions realized during a given time period. The index is not actively managed and does not reflect any deductions for fees, expenses or taxes. One cannot invest directly in an index. Index performance does not reflect fund performance.
The RiverFront Dynamic Core Income ETF is not suitable for all investors. Investments in the Fund are subject to investment risks, including possible loss of the principal amount invested.
The Fund’s shares are not individually redeemable. Investors buy and sell shares of the Fund on a secondary market. Only market makers or “authorized participants” may trade directly with the Fund, typically in blocks of 50,000 shares.
ALPS Portfolio Solutions Distributor, Inc., a FINRA member, is the Distributor for the RiverFront Dynamic Core Income ETF.
RiverFront Dynamic Core Income ETF
| Performance Overview | November 30, 2017 (Unaudited) |
Top 10 Holdings*^ (as of November 30, 2017)
| United States Treasury Inflation Indexed Bonds | 2.26% |
| Home Depot, Inc. | 1.72% |
| Southern Co. | 1.71% |
| Morgan Stanley | 1.68% |
| MetLife, Inc. | 1.56% |
| Flex, Ltd. | 1.50% |
| Pfizer, Inc. | 1.49% |
| Bank of New York Mellon Corp. | 1.47% |
Hilton Worldwide Finance LLC / Hilton Worldwide Finance Corp. | 1.46% |
| Bank of America Corp. | 1.42% |
| Total % of Top 10 Holdings | 16.27% |
| ^ | Excludes Money Market Fund |
Asset Allocation* (as of November 30, 2017)
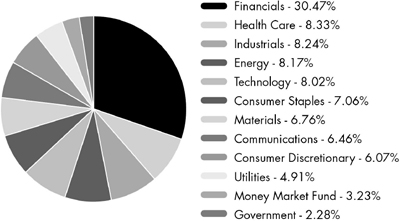
Future holdings are subject to change.
Growth of $10,000 (as of November 30, 2017)
Comparison of Change in Value of $10,000 Investment in the Fund and the Fund’s benchmark
The chart above represents historical performance of a hypothetical investment of $10,000 in the Fund over the life of the Fund. Past performance does not guarantee future results. This chart does not reflect the deduction of taxes that a shareholder would pay on Fund distributions or the redemption of Fund shares.
RiverFront Dynamic Unconstrained Income ETF
| Performance Overview | November 30, 2017 (Unaudited) |
Investment Objective
RiverFront Dynamic Unconstrained Income ETF (the “Fund”) seeks total return, with an emphasis on income as the source of that total return. The Fund seeks to achieve its investment objective by investing in a global portfolio of fixed income securities of various maturities, ratings and currency denominations.
| | Annual Returns as of November 30, 2017 |
| RFUN Market | 7.35% |
| RFUN NAV | 7.06% |
| Benchmark: ICE BofA Merrill Lynch High Yield Index | 9.28% |
2017 Performance Attribution
RFUN underperformed its benchmark by 193 bps over the 12 months ending 11/30/17. The underperformance of RFUN relative to its benchmark was primarily due to its higher credit quality. RFUN on average was overweight BB-rated bonds and underweight lower quality B and CCC-rated bonds. As measured by the ICE BofAML CCC & Lower US High Yield Index, the lowest rated sector of the high yield market returned 13.7%. We believe that this higher quality strategy will outperform over a full credit cycle however, due to the lower historical defaults on higher quality bonds.
2018 Outlook
We believe the US fixed income market is likely to face headwinds over the coming year including accelerating global growth and a less accommodative Federal Reserve. The Fed is forecasting another three rate hikes during 2018, which will likely put upward pressure on short-term interest rates. The Fed is also scheduled to increase the pace of its balance sheet reduction and the European Central Bank (ECB) may also begin its balance sheet unwind towards the end of 2018. Unprecedented global central bank accommodation from the Fed, ECB, and Bank of Japan (BOJ) has depressed interest rates, risk premiums and market volatility across the globe. We believe that the combination of rising rates, less central bank support, and rich starting valuations are likely to depress fixed income returns in 2018 compared to 2017. Within the US fixed income market, we believe that corporate and high yield bonds are likely to outperform other higher quality sectors, such as Treasuries and Agency Mortgage Backed Securities (MBS). This belief is based primarily on our positive view of global macroeconomic growth in 2018 which we believe is translating into corporate earnings. We believe the backdrop of strong corporate and economic fundamentals is likely to keep default rates low. On the other hand, we are expecting higher, more normal levels of market volatility going forward due to a less accommodative Fed and elevated political/geo-political risks.
Performance (as of November 30, 2017)
| | 1 Year | Since Inception^ |
| RiverFront Dynamic Unconstrained Income ETF – NAV | 7.06% | 8.12% |
| RiverFront Dynamic Unconstrained Income ETF – Market Price* | 7.35% | 8.26% |
| BofA Merrill Lynch U.S. High Yield Master II Total Return Index | 9.28% | 10.41% |
Total Expense Ratio (per the current prospectus) 0.53%.
Performance data quoted represents past performance. Past performance does not guarantee future results. The table does not reflect the deduction of taxes that a shareholder would pay on Fund distributions or the redemption of Fund shares. Investment return and principal value of an investment will fluctuate so that an investor’s shares, when sold or redeemed, may be worth more or less than the original cost. Current performance data may be higher or lower than actual data quoted. For the most current month-end performance data please visit www.alpsfunds.com or call 1.866.759.5679.
NAV is an exchange-traded fund’s per-share value. The per-share dollar amount of the fund is derived by dividing the total value of all the securities in its portfolio, less any liabilities, by the number of fund shares outstanding. Market Price is the price at which a share can currently be traded in the market. Information detailing the number of days the Market Price of the Fund was greater than the Fund’s NAV and the number of days it was less than the Fund’s NAV can be obtained at www.alpsfunds.com.
| ^ | The Fund commenced operations on June 14, 2016. |
| * | Market Price is based on the midpoint of the bid-ask spread at 4 p.m. ET and does not represent the returns an investor would receive if shares were traded at other times. |
BofA Merrill Lynch U.S. High Yield Master II Index tracks the performance of below-investment grade U.S. dollar-denominated corporate bonds issued in the U.S. Domestic market. The index is reported on a total return basis, which assumes reinvestment of any dividends and distributions realized during a given time period. The index is not actively managed and does not reflect any deductions for fees, expenses or taxes. One cannot invest directly in an index. Index performance does not reflect fund performance.
The RiverFront Dynamic Unconstrained Income ETF is not suitable for all investors. Investments in the Fund are subject to investment risks, including possible loss of the principal amount invested.
RiverFront Dynamic Unconstrained Income ETF
| Performance Overview | November 30, 2017 (Unaudited) |
The Fund’s shares are not individually redeemable. Investors buy and sell shares of the Fund on a secondary market. Only market makers or “authorized participants” may trade directly with the Fund, typically in blocks of 50,000 shares.
ALPS Portfolio Solutions Distributor, Inc., a FINRA member, is the Distributor for the RiverFront Dynamic Unconstrained Income ETF.
Top 10 Holdings*^ (as of November 30, 2017)
| Newfield Exploration Co. | 1.83% |
| Iron Mountain, Inc. | 1.75% |
| ADT Corp. | 1.41% |
| Ally Financial, Inc. | 1.40% |
| Ball Corp. | 1.40% |
| Chemours Co. | 1.40% |
| International Game Technology PLC | 1.40% |
| United Rentals North America, Inc. | 1.38% |
| Weatherford International, Ltd. | 1.36% |
| T-Mobile USA, Inc. | 1.36% |
| Total % of Top 10 Holdings | 14.69% |
| ^ | Excludes Money Market Fund |
Asset Allocation* (as of November 30, 2017)
Future holdings are subject to change.
Growth of $10,000 (as of November 30, 2017)
Comparison of Change in Value of $10,000 Investment in the Fund and the Fund’s benchmark
The chart above represents historical performance of a hypothetical investment of $10,000 in the Fund over the life of the Fund. Past performance does not guarantee future results. This chart does not reflect the deduction of taxes that a shareholder would pay on Fund distributions or the redemption of Fund shares.
RiverFront Dynamic US Dividend Advantage ETF
| Performance Overview | November 30, 2017 (Unaudited) |
Investment Objective
RiverFront Dynamic US Dividend Advantage ETF (the “Fund”) seeks to provide capital appreciation and dividend income. The Fund seeks to achieve its investment objective by investing at least 65% of its net assets in a portfolio of equity securities of publicly traded U.S. companies with the potential for dividend growth. Equity securities include common stocks and common or preferred shares of real estate investment trusts (“REITs”).
| | Annual Returns as of November 30, 2017 |
| RFDA Market | 20.36% |
| RFDA NAV | 20.49% |
| Benchmark: S&P 500 | 22.87% |
2017 Performance Attribution
RFDA underperformed its benchmark in 2017 by 251bps. The underperformance of RFDA relative to the broad US market was not surprising for two reasons. First, dividend stocks often underperform when there is a threat of rising interest rates since substitute asset classes, like cash and bonds, become more attractive. Second, dividend-paying companies tend to be more mature and slower growth and thus more likely to lag when market returns are higher than normal, as was the case in 2017.
Specifically, the main sources of underperformance came from sector allocation and security selection.
| 1. | Sector Allocation: The sector allocations in RFDA are determined through a bottoms-up process that ranks stocks on three fundamental cornerstones: value, quality and momentum/sentiment. If a sector produces more highly ranked stocks relative to another sector, that sector’s allocation is allowed to exceed its benchmark by a tolerable level, and vice versa. Sector allocation was a negative contributor for RFDA in 2017. |
| a. | Positive contributors: The underweight to energy, which was the worst performing sector in the S&P 500, was a positive contributor. |
| b. | Negative contributors: The portfolio’s overweight to telecommunication services and cash negatively impacted portfolio returns. |
| 2. | Security Selection: The investment selection process behind RFDA is built on making a number of security selection choices. This means that there are rarely just one or two things contributing to the returns in the fund. In 2017, our equity selection posted negative results in aggregate. A few of the top themes that contributed most to performance in the year were: |
| a. | Positive contributors: Security selection in industrials and energy. |
| b. | Negative contributors: Security selection in technology, financials, consumer discretionary and telecommunication services. |
2018 Outlook
We remain constructive on global equities and expect positive returns in most regions for 2018. Our cautious optimism is based primarily on a positive view of the global macroeconomic cycle in 2018. We think the backdrop of strong corporate fundamentals, combined with low interest rates and inflation, is a positive environment for stocks. However, we would prepare investors for higher levels of market volatility in the year(s) to come.
RiverFront Dynamic US Dividend Advantage ETF
| Performance Overview | November 30, 2017 (Unaudited) |
Performance (as of November 30, 2017)
| | 1 Year | Since Inception^ |
| RiverFront Dynamic US Dividend Advantage ETF – NAV | 20.49% | 18.39% |
| RiverFront Dynamic US Dividend Advantage ETF – Market Price* | 20.36% | 18.36% |
| S&P 500® Total Return Index | 22.87% | 18.98% |
Total Expense Ratio (per the current prospectus) 0.52%.
Performance data quoted represents past performance. Past performance does not guarantee future results. The table does not reflect the deduction of taxes that a shareholder would pay on Fund distributions or the redemption of Fund shares. Investment return and principal value of an investment will fluctuate so that an investor’s shares, when sold or redeemed, may be worth more or less than the original cost. Current performance data may be higher or lower than actual data quoted. For the most current month-end performance data please visit www.alpsfunds.com or call 1.866.759.5679.
NAV is an exchange-traded fund’s per-share value. The per-share dollar amount of the fund is derived by dividing the total value of all the securities in its portfolio, less any liabilities, by the number of fund shares outstanding. Market Price is the price at which a share can currently be traded in the market. Information detailing the number of days the Market Price of the Fund was greater than the Fund’s NAV and the number of days it was less than the Fund’s NAV can be obtained at www.alpsfunds.com.
| ^ | The Fund commenced operations on June 7, 2016. |
| * | Market Price is based on the midpoint of the bid-ask spread at 4 p.m. ET and does not represent the returns an investor would receive if shares were traded at other times. |
S&P 500® Index is the Standard & Poor’s composite index of 500 stocks, a widely recognized, unmanaged index of common stock prices. The index is reported on a total return basis, which assumes reinvestment of any dividends and distributions realized during a given time period. The index is not actively managed and does not reflect any deductions for fees, expenses or taxes. One cannot invest directly in an index. Index performance does not reflect fund performance.
The RiverFront Dynamic US Dividend Advantage ETF is not suitable for all investors. Investments in the Fund are subject to investment risks, including possible loss of the principal amount invested.
The Fund’s shares are not individually redeemable. Investors buy and sell shares of the Fund on a secondary market. Only market makers or “authorized participants” may trade directly with the Fund, typically in blocks of 50,000 shares.
ALPS Portfolio Solutions Distributor, Inc., a FINRA member, is the Distributor for the RiverFront Dynamic US Dividend Advantage ETF.
RiverFront Dynamic US Dividend Advantage ETF
| Performance Overview | November 30, 2017 (Unaudited) |
Top 10 Holdings* (as of November 30, 2017)
| Apple, Inc. | 4.17% |
| Wal-Mart Stores, Inc. | 2.83% |
| Texas Instruments, Inc. | 1.93% |
| HealthSouth Corp. | 1.91% |
| Pfizer, Inc. | 1.81% |
| AT&T, Inc. | 1.80% |
| Applied Materials, Inc. | 1.79% |
| T Rowe Price Group, Inc. | 1.72% |
| JPMorgan Chase & Co. | 1.63% |
| Wells Fargo & Co. | 1.63% |
| Total % of Top 10 Holdings | 21.22% |
Asset Allocation* (as of November 30, 2017)
Future holdings are subject to change.
Growth of $10,000 (as of November 30, 2017)
Comparison of Change in Value of $10,000 Investment in the Fund and the Fund’s benchmark
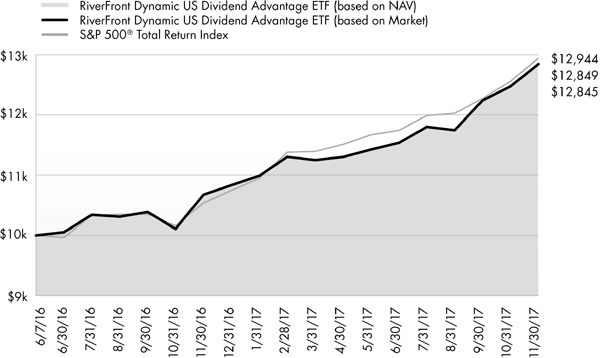
The chart above represents historical performance of a hypothetical investment of $10,000 in the Fund over the life of the Fund. Past performance does not guarantee future results. This chart does not reflect the deduction of taxes that a shareholder would pay on Fund distributions or the redemption of Fund shares.
RiverFront Dynamic US Flex-Cap ETF
Performance Overview | November 30, 2017 (Unaudited) |
Investment Objective
RiverFront Dynamic US Flex-Cap ETF (the “Fund”) seeks to provide capital appreciation. The Fund seeks to achieve its investment objective by investing at least 65% of its net assets in a portfolio of equity securities of publicly traded U.S. companies. Equity securities include common stocks and common or preferred shares of real estate investment trusts (“REITs”).
| | Annual Returns as of November 30, 2017 |
| RFFC Market | 22.02% |
| RFFC NAV | 22.08% |
| Benchmark: S&P 1500 | 22.38% |
2017 Performance Attribution
RFFC underperformed its benchmark in 2017 by 36bps. We are not surprised by the slight underperformance of the portfolio given that 2 of its 3 fundamental cornerstones: ‘value’ and ‘quality’ were not characteristics the market favored in 2017. Stocks that score well on ‘value’ and ‘quality’ metrics tend to outperform in normal or below normal market return environments. When market returns are well above normal, as they were in 2017, portfolios with a ‘quality’ or ‘value’ bias can be expected to underperform.
Specifically, the main sources of underperformance came from sector allocation and security selection.
| 1. | Sector Allocation: The sector allocations in RFFC are determined through a bottoms-up process that ranks stocks on three fundamental cornerstones: value, quality and momentum/sentiment. If a sector produces more highly ranked stocks relative to another sector, that sector’s allocation is allowed to exceed its benchmark by a tolerable level, and vice versa. Sector allocation was a positive contributor in 2017. |
| a. | Positive contributors: Our overweight to technology and underweight to energy were positive contributors. |
| b. | Negative contributors: The portfolio’s overweight to cash negatively impacted portfolio returns. |
| 2. | Security Selection: The investment selection process behind RFFC is built on making a number of security selection choices. This means that there are rarely just one or two things contributing to the returns in the fund. In 2017, our equity selection posted negative results in aggregate. A few of the top themes that contributed most to performance in the year were: |
| a. | Positive contributors: Security selection in consumer discretionary and industrials. |
| b. | Negative contributors: Security selection in technology, healthcare, consumer staples and basic materials. |
2018 Outlook
We remain constructive on global equities and expect positive returns in most regions for 2018. Our cautious optimism is based primarily on a positive view of the global macroeconomic cycle in 2018. We think the backdrop of strong corporate fundamentals, combined with low interest rates and inflation, is a positive environment for stocks. However, we would prepare investors for higher levels of market volatility in the year(s) to come.
RiverFront Dynamic US Flex-Cap ETF
Performance Overview | November 30, 2017 (Unaudited) |
Performance (as of November 30, 2017)
| | 1 Year | Since Inception^ |
| RiverFront Dynamic US Flex-Cap ETF – NAV | 22.08% | 20.05% |
| RiverFront Dynamic US Flex-Cap ETF – Market Price* | 22.02% | 20.07% |
| S&P Composite 1500® Total Return Index | 22.38% | 19.04% |
Total Expense Ratio (per the current prospectus) 0.52%.
Performance data quoted represents past performance. Past performance does not guarantee future results. The table does not reflect the deduction of taxes that a shareholder would pay on Fund distributions or the redemption of Fund shares. Investment return and principal value of an investment will fluctuate so that an investor’s shares, when sold or redeemed, may be worth more or less than the original cost. Current performance data may be higher or lower than actual data quoted. For the most current month-end performance data please visit www.alpsfunds.com or call 1.866.759.5679.
NAV is an exchange-traded fund’s per-share value. The per-share dollar amount of the fund is derived by dividing the total value of all the securities in its portfolio, less any liabilities, by the number of fund shares outstanding. Market Price is the price at which a share can currently be traded in the market. Information detailing the number of days the Market Price of the Fund was greater than the Fund’s NAV and the number of days it was less than the Fund’s NAV can be obtained at www.alpsfunds.com.
| ^ | The Fund commenced operations on June 7, 2016. |
| * | Market Price is based on the midpoint of the bid-ask spread at 4 p.m. ET and does not represent the returns an investor would receive if shares were traded at other times. |
S&P Composite 1500® Index is the Standard & Poor’s broad-based unmanaged capitalization-weighted index comprising 1,500 stocks of Large-cap, Mid-cap, and Small-cap U.S. companies. The index is reported on a total return basis, which assumes reinvestment of any dividends and distributions realized during a given time period. The index is not actively managed and does not reflect any deductions for fees, expenses or taxes. One cannot invest directly in an index. Index performance does not reflect fund performance.
The RiverFront Dynamic US Flex-Cap ETF is not suitable for all investors. Investments in the Fund are subject to investment risks, including possible loss of the principal amount invested.
The Fund’s shares are not individually redeemable. Investors buy and sell shares of the Fund on a secondary market. Only market makers or “authorized participants” may trade directly with the Fund, typically in blocks of 50,000 shares.
ALPS Portfolio Solutions Distributor, Inc., a FINRA member, is the Distributor for the RiverFront Dynamic US Flex-Cap ETF.
RiverFront Dynamic US Flex-Cap ETF
Performance Overview | November 30, 2017 (Unaudited) |
Top 10 Holdings* (as of November 30, 2017)
| United Rentals, Inc. | 3.96% |
| Apple, Inc. | 3.63% |
| International Game Technology PLC | 2.95% |
| Timken Co. | 2.48% |
| E*TRADE Financial Corp | 2.37% |
| Facebook, Inc. | 2.36% |
| Cigna Corp. | 1.58% |
| RH | 1.47% |
| Boeing Co. | 1.44% |
| PayPal Holdings, Inc. | 1.42% |
| Total % of Top 10 Holdings | 23.66% |
Asset Allocation* (as of November 30, 2017)
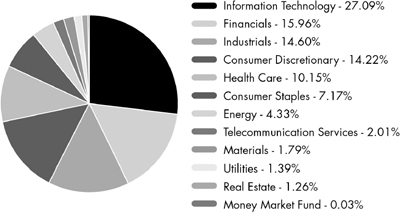
Future holdings are subject to change.
Growth of $10,000 (as of November 30, 2017)
Comparison of Change in Value of $10,000 Investment in the Fund and the Fund’s benchmark
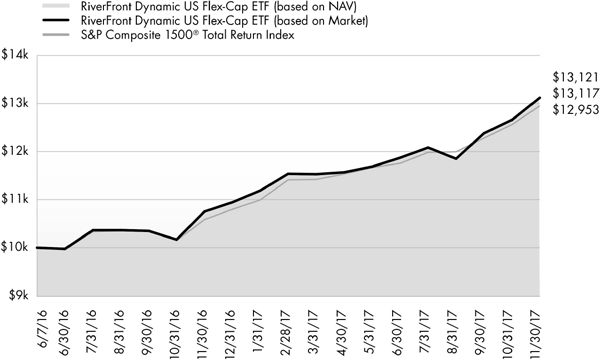
The chart above represents historical performance of a hypothetical investment of $10,000 in the Fund over the life of the Fund. Past performance does not guarantee future results. This chart does not reflect the deduction of taxes that a shareholder would pay on Fund distributions or the redemption of Fund shares.
RiverFront Strategic Income Fund
Performance Overview | November 30, 2017 (Unaudited) |
Investment Objective
The RiverFront Strategic Income Fund (the “Fund”) seeks total return, with an emphasis on income as the source of that total return. The Fund seeks to achieve its investment objective by investing in a global portfolio of fixed income securities of various maturities, ratings and currency denominations. The Fund intends to utilize various investment strategies in a broad array of fixed income sectors.
| | Annual Returns as of November 30, 2017 |
| RIGS Market | 5.17% |
| RIGS NAV | 5.29% |
| Benchmark: Bloomberg Barclay’s US Aggregate Bond Index | 3.21% |
2017 Performance Attribution
RIGS outperformed its benchmark by 196 bps over the 12 months ending 11/30/17. The outperformance of RIGS relative to its benchmark was primarily due to the Fund’s current strategy of assuming shorter-term credit risk. The sector allocations in RIGS are determined through a relative value framework that allocates to sectors of the bond market that we believe offer the best income opportunities and favorable risk/reward profiles. Over the course of the year the Fund was primarily invested in shorter-maturity, higher quality, below investment grade rated bonds. The average credit quality of the Fund was approximately BB-rated, compared to AA-rated for its benchmark. This lower credit quality strategy positively contributed to performance as risk premiums on lower rated bonds tightened significantly more than those on higher quality bonds. For example, spreads on the ICE BofA Merrill Lynch 1-5 Year BB U.S. High Yield Index narrowed 81 basis points over the past year, leading to meaningful price appreciation in addition to the incremental yield. The duration of the Fund averaged around 3 years compared to about 6 years for its benchmark. We believe that short-term high yield bonds should continue to do relatively well going forward, as accelerating global growth is likely to keep default rates at low levels.
2018 Outlook
We believe the US fixed income market is likely to face headwinds over the coming year including accelerating global growth and a less accommodative Federal Reserve. The Fed is forecasting another three rate hikes during 2018, which will likely put upward pressure on short-term interest rates. The Fed is also scheduled to increase the pace of its balance sheet reduction and the European Central Bank (ECB) may also begin its balance sheet unwind towards the end of 2018. Unprecedented global central bank accommodation from the Fed, ECB, and Bank of Japan (BOJ) has depressed interest rates, risk premiums and market volatility across the globe. We believe that the combination of rising rates, less central bank support, and rich starting valuations are likely to depress fixed income returns in 2018 compared to 2017. Within the US fixed income market, we believe that corporate and high yield bonds are likely to outperform other higher quality sectors, such as Treasuries and Agency Mortgage Backed Securities (MBS). This belief is based primarily on our positive view of global macroeconomic growth in 2018 which we believe is translating into corporate earnings. We believe the backdrop of strong corporate and economic fundamentals is likely to keep default rates low. On the other hand, we are expecting higher, more normal levels of market volatility going forward due to a less accommodative Fed and elevated political/geo-political risks.
RiverFront Strategic Income Fund
Performance Overview | November 30, 2017 (Unaudited) |
Performance (as of November 30, 2017)
| | 1 Year | 3 Year | Since Inception^ |
| RiverFront Strategic Income Fund – NAV | 5.29% | 4.49% | 4.68% |
| RiverFront Strategic Income Fund – Market Price* | 5.50% | 4.53% | 4.71% |
| Bloomberg Barclays U.S. Aggregate Bond Total Return Index | 3.21% | 2.11% | 2.89% |
Total Expense Ratio (per the current prospectus) 0.47%. Net Expense Ratio (per the current prospectus) 0.17%. Net expense ratio reflects the Sub-Adviser’s decision to voluntarily waive its sub-advisory fee until at least March 31, 2018. Please see the prospectus for additional information.
Performance data quoted represents past performance. Past performance does not guarantee future results. The table does not reflect the deduction of taxes that a shareholder would pay on Fund distributions or the redemption of Fund shares. Investment return and principal value of an investment will fluctuate so that an investor’s shares, when sold or redeemed, may be worth more or less than the original cost. Current performance data may be higher or lower than actual data quoted. For most current month-end performance data please visit www.alpsfunds.com or call 1.866.759.5679.
NAV is an exchange-traded fund’s per-share value. The per-share dollar amount of the Fund is derived by dividing the total value of all the securities in its portfolio, less any liabilities, by the number of Fund shares outstanding. Market Price is the price at which a share can currently be traded in the market. Information detailing the number of days the Market Price of the Fund was greater than the Fund’s NAV and the number of days it was less than the Fund’s NAV can be obtained at www.alpsfunds.com.
| ^ | The Fund commenced Investment Operations on October 8, 2013. |
| * | Market Price is based on the midpoint of the bid/ask spread at 4 p.m. ET and does not represent the returns an investor would receive if shares were traded at other times |
Duration is a measure of the sensitivity of the price (the value of principal) of a fixed-income investment to a change in interest rates. Duration is expressed as a number of years. The duration number is a calculation involving present value, yield, coupon, final maturity and call features. The bigger the duration number, the greater the interest-rate risk or reward for bond prices. Rising interest rates mean falling bond prices, while declining interest rates mean rising bond prices.
Bloomberg Barclays U.S. Aggregate Bond Index is a broad-based benchmark that measures the investment grade, U.S. dollar-denominated, fixed-rate taxable bond market, including Treasuries, government-related and corporate securities, MBS (agency fixed-rate and hybrid ARM pass-throughs), ABS, and CMBS (agency and non-agency). The index is reported on a total return basis, which assumes reinvestment of any dividends and distributions realized during a given time period. The index is not actively managed and does not reflect any deductions for fees, expenses or taxes. One cannot invest directly in an index. Index performance does not reflect fund performance.
One cannot invest directly in an index. Index performance does not reflect fund performance.
The RiverFront Strategic Income Fund is not suitable for all investors. Investments in the Fund are subject to investment risks, including possible loss of the principal amount invested.
ALPS Portfolio Solutions Distributor, Inc., a FINRA member, is the distributor for the RiverFront Strategic Income Fund.
RiverFront Strategic Income Fund
Performance Overview | November 30, 2017 (Unaudited) |
Top 10 Holdings*^ (as of November 30, 2017)
| United States Treasury Inflation Indexed Bonds | 2.89% |
| WESCO Distribution, Inc. | 2.66% |
| Andeavor | 2.45% |
| Ball Corp. | 2.43% |
| Celanese US Holdings LLC | 2.25% |
| Newfield Exploration Co. | 2.23% |
| Goodyear Tire & Rubber Co. | 2.16% |
| DR Horton, Inc. | 2.08% |
| DISH DBS Corp. | 2.06% |
| Kinder Morgan Energy Partners LP | 2.06% |
| Total % of Top 10 Holdings | 23.27% |
| ^ | Excludes Money Market Fund |
Asset Allocation* (as of November 30, 2017)
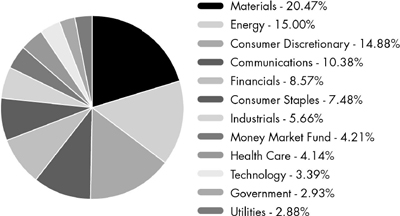
Future holdings are subject to change.
Growth of $10,000 (as of November 30, 2017)
Comparison of Change in Value of $10,000 Investment in the Fund and the Fund’s benchmark
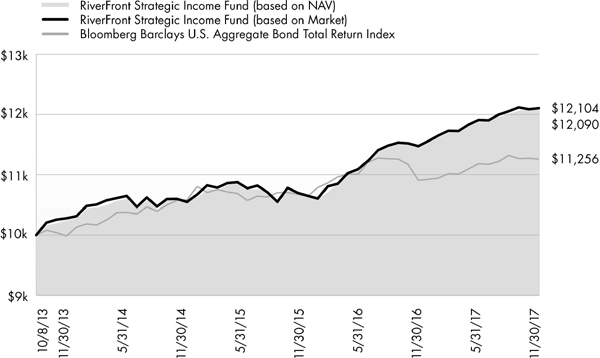
The chart above represents historical performance of a hypothetical investment of $10,000 in the Fund over the life of the Fund. Past performance does not guarantee future results. This chart does not reflect the deduction of taxes that a shareholder would pay on Fund distributions or the redemption of Fund shares.
RiverFront ETFs
Disclosure of Fund Expenses | November 30, 2017 (Unaudited) |
Shareholder Expense Example: As a shareholder of a Fund, you incur two types of costs: (1) transaction costs which may include creation and redemption fees or brokerage charges, and (2) ongoing costs, including management fees and other Fund expenses. These examples are intended to help you understand your ongoing costs (in dollars) of investing in a Fund and to compare these costs with the ongoing costs of investing in other funds. It is based on an investment of $1,000 invested at the beginning of the (six month) period and held through November 30, 2017.
Actual Return: The first line of the table provides information about actual account values and actual expenses. You may use the information in this line, together with the amount you invested, to estimate the expenses that you incurred over the period. Simply divide your account value by $1,000 (for example, an $8,600 account value divided by $1,000 = 8.6), then multiply the result by the number in the first line under the heading entitled “Expenses Paid During Period” to estimate the expenses attributable to your investment during this period.
Hypothetical 5% Return: The second line of the table provides information about hypothetical account values and hypothetical expenses based on the Fund’s actual expense ratio and an assumed rate of return of 5% per year before expenses, which is not the Fund’s actual return. The hypothetical account values and expenses may not be used to estimate the actual ending account balance or expenses you paid for the period. You may use this information to compare ongoing costs of investing in the Fund and other funds. To do so, compare this 5% hypothetical example with the 5% hypothetical examples that appear in the shareholder reports of other funds.
The expenses shown in the table are meant to highlight ongoing Fund costs only and do not reflect any transaction costs, such as creation and redemption fees or brokerage charges. Therefore, the second line is useful in comparing ongoing costs only, and will not help you determine the relative total costs of owning different funds. In addition, if these costs were included, your costs would have been higher.
| | Beginning Account Value 6/1/17 | Ending Account Value 11/30/17 | Expense Ratio(a) | Expenses Paid During Period 6/1/17 - 11/30/17(b) |
| RiverFront Dynamic Core Income ETF | | | | |
| Actual | $1,000.00 | $1,007.60 | 0.51% | $2.57 |
| Hypothetical (5% return before expenses) | $1,000.00 | $1,022.51 | 0.51% | $2.59 |
| RiverFront Dynamic Unconstrained Income ETF | | | | |
| Actual | $1,000.00 | $1,019.10 | 0.51% | $2.58 |
| Hypothetical (5% return before expenses) | $1,000.00 | $1,022.51 | 0.51% | $2.59 |
| RiverFront Dynamic US Dividend Advantage ETF | | | | |
| Actual | $1,000.00 | $1,124.60 | 0.52% | $2.77 |
| Hypothetical (5% return before expenses) | $1,000.00 | $1,022.46 | 0.52% | $2.64 |
| RiverFront Dynamic US Flex-Cap ETF | | | | |
| Actual | $1,000.00 | $1,122.50 | 0.52% | $2.77 |
| Hypothetical (5% return before expenses) | $1,000.00 | $1,022.46 | 0.52% | $2.64 |
| RiverFront Strategic Income Fund | | | | |
| Actual | $1,000.00 | $1,017.30 | 0.16% | $0.81 |
| Hypothetical (5% return before expenses) | $1,000.00 | $1,024.27 | 0.16% | $0.81 |
| (a) | Annualized, based on the Fund's most recent fiscal half year expenses. |
| (b) | Expenses are equal to the Fund's annualized expense ratio multiplied by the average account value over the period, multiplied by the number of days in the most recent fiscal half year (183), divided by 365. |
RiverFront ETFs
Report of Independent Registered Public Accounting Firm |
To the Board of Trustees and Shareholders of ALPS ETF Trust:
We have audited the accompanying statements of assets and liabilities, including the schedules of investments, of RiverFront Dynamic Core Income ETF, RiverFront Dynamic Unconstrained Income ETF, RiverFront Dynamic US Dividend Advantage ETF, RiverFront Dynamic US Flex-Cap ETF, and RiverFront Strategic Income Fund, five of the portfolios constituting the ALPS ETF Trust (the “Trust”), as of November 30, 2017, and the related statements of operations for the year then ended, and the changes in net assets and the financial highlights for each of the periods presented. These financial statements and financial highlights are the responsibility of the Trust’s management. Our responsibility is to express an opinion on these financial statements and financial highlights based on our audits.
We conducted our audits in accordance with the standards of the Public Company Accounting Oversight Board (United States). Those standards require that we plan and perform the audit to obtain reasonable assurance about whether the financial statements and financial highlights are free of material misstatement. The Trust is not required to have, nor were we engaged to perform, an audit of its internal control over financial reporting. Our audits included consideration of internal control over financial reporting as a basis for designing audit procedures that are appropriate in the circumstances, but not for the purpose of expressing an opinion on the effectiveness of the Trust’s internal control over financial reporting. Accordingly, we express no such opinion. An audit also includes examining, on a test basis, evidence supporting the amounts and disclosures in the financial statements, assessing the accounting principles used and significant estimates made by management, as well as evaluating the overall financial statement presentation. Our procedures included confirmation of securities owned as of November 30, 2017, by correspondence with the custodian and broker. We believe that our audits provide a reasonable basis for our opinion.
In our opinion, the financial statements and financial highlights referred to above present fairly, in all material respects, the financial position of RiverFront Dynamic Core Income ETF, RiverFront Dynamic Unconstrained Income ETF, RiverFront Dynamic US Dividend Advantage ETF, RiverFront Dynamic US Flex-Cap ETF, and RiverFront Strategic Income Fund of the ALPS ETF Trust as of November 30, 2017, the results of their operations for the year then ended, and the changes in their net assets and the financial highlights for each of the periods presented, in conformity with accounting principles generally accepted in the United States of America.
DELOITTE & TOUCHE LLP
Denver, Colorado
January 26, 2018
RiverFront Dynamic Core Income ETF
| Schedule of Investments | November 30, 2017 |
| Security Description | | Principal Amount | | | Value | |
| CORPORATE BONDS (93.74%) | | | | | | | | |
| Communications (6.41%) | | | | | | | | |
| Alphabet, Inc. | | | | | | | | |
| 2.00%, 08/15/2026 | | $ | 45,000 | | | $ | 42,419 | |
| AT&T, Inc. | | | | | | | | |
| 2.45%, 06/30/2020 | | | 668,000 | | | | 666,915 | |
| Charter Communications Operating LLC / Charter Communications Operating Capital | | | | | | | | |
| 3.58%, 07/23/2020 | | | 668,000 | | | | 679,256 | |
| Comcast Corp. | | | | | | | | |
| 5.15%, 03/01/2020 | | | 637,000 | | | | 678,079 | |
| Discovery Communications LLC | | | | | | | | |
| 3.95%, 03/20/2028 | | | 250,000 | | | | 245,898 | |
| Time Warner, Inc. | | | | | | | | |
| 4.70%, 01/15/2021 | | | 98,000 | | | | 103,998 | |
| 4.75%, 03/29/2021 | | | 175,000 | | | | 186,390 | |
| 2.95%, 07/15/2026 | | | 500,000 | | | | 472,107 | |
| Total Communications | | | | | | | 3,075,062 | |
| | | | | | | | | |
| Consumer Discretionary (6.02%) | | | | | | | | |
| Amazon.com, Inc. | | | | | | | | |
| 3.88%, 08/22/2037(a) | | | 150,000 | | | | 156,999 | |
| eBay, Inc. | | | | | | | | |
| 2.20%, 08/01/2019 | | | 20,000 | | | | 19,999 | |
| 3.45%, 08/01/2024 | | | 100,000 | | | | 101,722 | |
| Ford Motor Credit Co. LLC | | | | | | | | |
| 2.24%, 06/15/2018 | | | 200,000 | | | | 200,319 | |
| 2.02%, 05/03/2019 | | | 150,000 | | | | 149,295 | |
| 4.13%, 08/04/2025 | | | 100,000 | | | | 102,989 | |
| General Motors Financial Co., Inc. | | | | | | | | |
| 3.20%, 07/13/2020 | | | 205,000 | | | | 208,094 | |
| 3.70%, 05/09/2023 | | | 150,000 | | | | 153,031 | |
| 4.00%, 01/15/2025 | | | 95,000 | | | | 96,945 | |
| Hilton Worldwide Finance LLC / Hilton Worldwide Finance Corp. | | | | | | | | |
| 4.63%, 04/01/2025 | | | 675,000 | | | | 699,468 | |
| Home Depot, Inc. | | | | | | | | |
| 2.63%, 06/01/2022 | | | 818,000 | | | | 823,631 | |
| Lowe's Cos., Inc. | | | | | | | | |
| 3.10%, 05/03/2027 | | | 175,000 | | | | 173,998 | |
| Total Consumer Discretionary | | | | | | | 2,886,490 | |
| | | | | | | | | |
| Consumer Staples (7.01%) | | | | | | | | |
| Anheuser-Busch InBev Finance, Inc. | | | | | | | | |
| 2.65%, 02/01/2021 | | | 668,000 | | | | 673,782 | |
| Constellation Brands, Inc. | | | | | | | | |
| 4.25%, 05/01/2023 | | | 600,000 | | | | 637,385 | |
| 4.75%, 12/01/2025 | | | 100,000 | | | | 109,805 | |
| CVS Health Corp. | | | | | | | | |
| 2.25%, 08/12/2019 | | | 625,000 | | | | 624,640 | |
| Kraft Heinz Foods Co. | | | | | | | | |
| 5.38%, 02/10/2020 | | | 250,000 | | | | 265,692 | |
| 3.50%, 06/06/2022 | | | 215,000 | | | | 220,125 | |
| Security Description | | Principal Amount | | | Value | |
| Consumer Staples (continued) | | | | | | | | |
| PepsiCo, Inc. | | | | | | | | |
| 3.10%, 07/17/2022 | | $ | 620,000 | | | $ | 635,986 | |
| Procter & Gamble Co. | | | | | | | | |
| 2.45%, 11/03/2026 | | | 200,000 | | | | 193,006 | |
| Total Consumer Staples | | | | | | | 3,360,421 | |
| | | | | | | | | |
| Energy (8.10%) | | | | | | | | |
| Chevron Corp. | | | | | | | | |
| 2.90%, 03/03/2024 | | | 200,000 | | | | 201,816 | |
| Concho Resources, Inc. | | | | | | | | |
| 3.75%, 10/01/2027 | | | 300,000 | | | | 301,743 | |
| ConocoPhillips Co. | | | | | | | | |
| 4.95%, 03/15/2026 | | | 200,000 | | | | 225,640 | |
| Enterprise Products Operating LLC | | | | | | | | |
| 3.35%, 03/15/2023 | | | 668,000 | | | | 681,752 | |
| Exxon Mobil Corp. | | | | | | | | |
| 3.04%, 03/01/2026 | | | 60,000 | | | | 60,940 | |
| Kinder Morgan, Inc. | | | | | | | | |
| 3.05%, 12/01/2019 | | | 668,000 | | | | 674,105 | |
| 4.30%, 06/01/2025 | | | 65,000 | | | | 67,337 | |
| ONEOK Partners LP | | | | | | | | |
| 3.38%, 10/01/2022 | | | 600,000 | | | | 607,823 | |
| Sabine Pass Liquefaction LLC | | | | | | | | |
| 5.63%, 04/15/2023 | | | 500,000 | | | | 550,763 | |
| Targa Resources Partners LP / Targa Resources Partners Finance Corp | | | | | | | | |
| 5.00%, 01/15/2028(a) | | | 200,000 | | | | 199,250 | |
| Williams Partners LP | | | | | | | | |
| 3.90%, 01/15/2025 | | | 310,000 | | | | 316,071 | |
| Total Energy | | | | | | | 3,887,240 | |
| | | | | | | | | |
| Financials (30.23%) | | | | | | | | |
| American Express Credit Corp. | | | | | | | | |
| 2.38%, 05/26/2020 | | | 150,000 | | | | 150,289 | |
| American International Group, Inc. | | | | | | | | |
| 4.13%, 02/15/2024 | �� | | 100,000 | | | | 105,654 | |
| 3.90%, 04/01/2026 | | | 100,000 | | | | 103,403 | |
| Bank of America Corp. | | | | | | | | |
| 3.30%, 01/11/2023 | | | 668,000 | | | | 682,410 | |
| 3M US L + 0.93%, 07/21/2023(b) | | | 150,000 | | | | 149,668 | |
| Bank of Montreal | | | | | | | | |
| 2.55%, 11/06/2022 | | | 175,000 | | | | 173,981 | |
| Bank of New York Mellon Corp. | | | | | | | | |
| 2.45%, 11/27/2020 | | | 700,000 | | | | 703,772 | |
| Barclays PLC | | | | | | | | |
| 5.20%, 05/12/2026 | | | 187,000 | | | | 200,079 | |
| Berkshire Hathaway Finance Corp. | | | | | | | | |
| 5.75%, 01/15/2040 | | | 101,000 | | | | 131,025 | |
| Berkshire Hathaway, Inc. | | | | | | | | |
| 3.13%, 03/15/2026 | | | 150,000 | | | | 151,231 | |
| 4.50%, 02/11/2043 | | | 227,000 | | | | 255,019 | |
See Notes to Financial Statements.
RiverFront Dynamic Core Income ETF
| Schedule of Investments | November 30, 2017 |
| Security Description | | Principal Amount | | | Value | |
| Financials (continued) | | | | | | | | |
| Boston Properties LP | | | | | | | | |
| 3.85%, 02/01/2023 | | $ | 600,000 | | | $ | 627,783 | |
| 3.13%, 09/01/2023 | | | 100,000 | | | | 101,052 | |
| Capital One Financial Corp. | | | | | | | | |
| 3.50%, 06/15/2023 | | | 448,000 | | | | 456,518 | |
| Capital One NA | | | | | | | | |
| 2.25%, 09/13/2021 | | | 200,000 | | | | 196,202 | |
| Chubb INA Holdings, Inc. | | | | | | | | |
| 3.35%, 05/03/2026 | | | 400,000 | | | | 408,176 | |
| Citigroup, Inc. | | | | | | | | |
| 2.65%, 10/26/2020 | | | 402,000 | | | | 403,702 | |
| 2.70%, 03/30/2021 | | | 324,000 | | | | 325,569 | |
| Credit Suisse Group Funding Guernsey, Ltd. | | | | | | | | |
| 3.13%, 12/10/2020 | | | 200,000 | | | | 202,778 | |
| 3.45%, 04/16/2021 | | | 200,000 | | | | 204,551 | |
| 4.55%, 04/17/2026 | | | 200,000 | | | | 214,251 | |
| Deutsche Bank AG | | | | | | | | |
| 4.25%, 10/14/2021 | | | 20,000 | | | | 20,832 | |
| Discover Bank | | | | | | | | |
| 7.00%, 04/15/2020 | | | 200,000 | | | | 219,176 | |
| Goldman Sachs Group, Inc. | | | | | | | | |
| 2.55%, 10/23/2019 | | | 678,000 | | | | 680,266 | |
| HSBC Finance Corp. | | | | | | | | |
| 6.68%, 01/15/2021 | | | 158,000 | | | | 176,471 | |
| HSBC Holdings PLC | | | | | | | | |
| 3.90%, 05/25/2026 | | | 155,000 | | | | 160,467 | |
| 4.38%, 11/23/2026 | | | 200,000 | | | | 208,760 | |
| HSBC USA, Inc. | | | | | | | | |
| 2.35%, 03/05/2020 | | | 125,000 | | | | 125,119 | |
| Intercontinental Exchange, Inc. | | | | | | | | |
| 3.75%, 12/01/2025 | | | 150,000 | | | | 157,155 | |
| 3.10%, 09/15/2027 | | | 200,000 | | | | 198,630 | |
| International Lease Finance Corp. | | | | | | | | |
| 8.25%, 12/15/2020 | | | 350,000 | | | | 403,287 | |
| 5.88%, 08/15/2022 | | | 300,000 | | | | 335,472 | |
| JPMorgan Chase & Co. | | | | | | | | |
| 3.38%, 05/01/2023 | | | 668,000 | | | | 680,313 | |
| 3M US L + 1.34%, 02/01/2028(b) | | | 130,000 | | | | 133,875 | |
| MetLife, Inc. | | | | | | | | |
| 7.72%, 02/15/2019 | | | 700,000 | | | | 747,282 | |
| Mitsubishi UFJ Financial Group, Inc. | | | | | | | | |
| 3.85%, 03/01/2026 | | | 85,000 | | | | 88,139 | |
| Mizuho Financial Group, Inc. | | | | | | | | |
| 3.17%, 09/11/2027 | | | 350,000 | | | | 343,785 | |
| Morgan Stanley | | | | | | | | |
| 5.63%, 09/23/2019 | | | 760,000 | | | | 803,713 | |
| PNC Bank NA | | | | | | | | |
| 2.95%, 01/30/2023 | | | 15,000 | | | | 15,127 | |
| PNC Financial Services Group, Inc. | | | | | | | | |
| 3.15%, 05/19/2027 | | | 650,000 | | | | 646,259 | |
| Prudential Financial, Inc. | | | | | | | | |
| 4.50%, 11/16/2021 | | | 150,000 | | | | 160,104 | |
| Security Description | | Principal Amount | | | Value | |
| Financials (continued) | | | | | | | | |
| Royal Bank of Scotland Group PLC | | | | | | | | |
| 3M US L + 1.48%, 05/15/2023(b) | | $ | 200,000 | | | $ | 200,634 | |
| US Bancorp | | | | | | | | |
| 2.63%, 01/24/2022 | | | 175,000 | | | | 176,447 | |
| 3.00%, 03/15/2022 | | | 500,000 | | | | 511,817 | |
| Visa, Inc. | | | | | | | | |
| 3.15%, 12/14/2025 | | | 150,000 | | | | 153,079 | |
| 2.75%, 09/15/2027 | | | 450,000 | | | | 442,022 | |
| Wells Fargo & Co. | | | | | | | | |
| 2.13%, 04/22/2019 | | | 500,000 | | | | 500,151 | |
| 2.55%, 12/07/2020 | | | 231,000 | | | | 231,772 | |
| 4.60%, 04/01/2021 | | | 29,000 | | | | 30,914 | |
| Total Financials | | | | | | | 14,498,181 | |
| | | | | | | | | |
| Health Care (8.26%) | | | | | | | | |
| AbbVie, Inc. | | | | | | | | |
| 2.90%, 11/06/2022 | | | 670,000 | | | | 671,993 | |
| Allergan Funding SCS | | | | | | | | |
| 3.00%, 03/12/2020 | | | 668,000 | | | | 674,424 | |
| Fresenius Medical Care US Finance II, Inc. | | | | | | | | |
| 4.13%, 10/15/2020(a) | | | 600,000 | | | | 621,265 | |
| Gilead Sciences, Inc. | | | | | | | | |
| 4.40%, 12/01/2021 | | | 125,000 | | | | 133,660 | |
| 2.50%, 09/01/2023 | | | 200,000 | | | | 197,274 | |
| Johnson & Johnson | | | | | | | | |
| 2.63%, 01/15/2025 | | | 150,000 | | | | 149,415 | |
| 2.45%, 03/01/2026 | | | 25,000 | | | | 24,361 | |
| 3.63%, 03/03/2037 | | | 150,000 | | | | 155,444 | |
| Medtronic, Inc. | | | | | | | | |
| 3.50%, 03/15/2025 | | | 100,000 | | | | 103,428 | |
| Pfizer, Inc. | | | | | | | | |
| 3.00%, 12/15/2026 | | | 712,000 | | | | 715,914 | |
| UnitedHealth Group, Inc. | | | | | | | | |
| 2.88%, 03/15/2023 | | | 250,000 | | | | 252,360 | |
| 3.75%, 07/15/2025 | | | 250,000 | | | | 262,526 | |
| Total Health Care | | | | | | | 3,962,064 | |
| | | | | | | | | |
| Industrials (8.17%) | | | | | | | | |
| Burlington Northern Santa Fe LLC | | | | | | | | |
| 3.05%, 09/01/2022 | | | 227,000 | | | | 232,551 | |
| 3.00%, 04/01/2025 | | | 173,000 | | | | 174,466 | |
| Caterpillar Financial Services Corp. | | | | | | | | |
| 2.50%, 11/13/2020 | | | 270,000 | | | | 271,632 | |
| 2.75%, 08/20/2021 | | | 200,000 | | | | 201,946 | |
| 2.40%, 06/06/2022 | | | 150,000 | | | | 149,427 | |
| CSX Corp. | | | | | | | | |
| 4.25%, 06/01/2021 | | | 50,000 | | | | 52,770 | |
| 3.40%, 08/01/2024 | | | 255,000 | | | | 262,157 | |
| 2.60%, 11/01/2026 | | | 100,000 | | | | 95,358 | |
| General Dynamics Corp. | | | | | | | | |
| 2.63%, 11/15/2027 | | | 250,000 | | | | 241,233 | |
See Notes to Financial Statements.
RiverFront Dynamic Core Income ETF
| Schedule of Investments | November 30, 2017 |
| Security Description | | Principal Amount | | | Value | |
| Industrials (continued) | | | | | | | | |
| General Electric Co. | | | | | | | | |
| 2.70%, 10/09/2022 | | $ | 668,000 | | | $ | 669,169 | |
| Honeywell International, Inc. | | | | | | | | |
| 1.85%, 11/01/2021 | | | 135,000 | | | | 132,320 | |
| 2.50%, 11/01/2026 | | | 300,000 | | | | 287,647 | |
| John Deere Capital Corp. | | | | | | | | |
| 2.65%, 06/24/2024 | | | 251,000 | | | | 249,846 | |
| Lockheed Martin Corp. | | | | | | | | |
| 4.25%, 11/15/2019 | | | 200,000 | | | | 208,205 | |
| 3.55%, 01/15/2026 | | | 450,000 | | | | 466,521 | |
| Northrop Grumman Corp. | | | | | | | | |
| 3.25%, 01/15/2028 | | | 200,000 | | | | 200,481 | |
| 3.85%, 04/15/2045 | | | 25,000 | | | | 24,831 | |
| Total Industrials | | | | | | | 3,920,560 | |
| | | | | | | | | |
| Materials (6.71%) | | | | | | | | |
| Dow Chemical Co. | | | | | | | | |
| 4.25%, 11/15/2020 | | | 600,000 | | | | 628,823 | |
| 3.00%, 11/15/2022 | | | 100,000 | | | | 100,739 | |
| Glencore Funding LLC | | | | | | | | |
| 3.00%, 10/27/2022(a) | | | 500,000 | | | | 496,843 | |
| Sherwin-Williams Co. | | | | | | | | |
| 3.45%, 08/01/2025 | | | 650,000 | | | | 659,938 | |
| Steel Dynamics, Inc. | | | | | | | | |
| 5.50%, 10/01/2024 | | | 500,000 | | | | 533,450 | |
| USG Corp. | | | | | | | | |
| 4.88%, 06/01/2027(a) | | | 650,000 | | | | 680,875 | |
| Vale Overseas, Ltd. | | | | | | | | |
| 6.25%, 08/10/2026 | | | 100,000 | | | | 116,239 | |
| Total Materials | | | | | | | 3,216,907 | |
| | | | | | | | | |
| Technology (7.96%) | | | | | | | | |
| Apple, Inc. | | | | | | | | |
| 2.40%, 05/03/2023 | | | 503,000 | | | | 497,958 | |
| 3.20%, 05/11/2027 | | | 174,000 | | | | 176,119 | |
| Cisco Systems, Inc. | | | | | | | | |
| 4.95%, 02/15/2019 | | | 606,000 | | | | 627,469 | |
| Flex, Ltd. | | | | | | | | |
| 5.00%, 02/15/2023 | | | 668,000 | | | | 718,183 | |
| International Business Machines Corp. | | | | | | | | |
| 2.88%, 11/09/2022 | | | 550,000 | | | | 556,440 | |
| Microsoft Corp. | | | | | | | | |
| 2.00%, 08/08/2023 | | | 450,000 | | | | 434,507 | |
| 4.10%, 02/06/2037 | | | 150,000 | | | | 164,468 | |
| Oracle Corp. | | | | | | | | |
| 3.40%, 07/08/2024 | | | 55,000 | | | | 56,826 | |
| 3.25%, 05/15/2030 | | | 15,000 | | | | 14,905 | |
| S&P Global, Inc. | | | | | | | | |
| 4.00%, 06/15/2025 | | | 450,000 | | | | 473,219 | |
| Security Description | | Principal Amount | | | Value | |
| Technology (continued) | | | | | | | | |
| Xerox Corp. | | | | | | | | |
| 3.63%, 03/15/2023 | | $ | 100,000 | | | $ | 97,213 | |
| Total Technology | | | | | | | 3,817,307 | |
| | | | | | | | | |
| Utilities (4.87%) | | | | | | | | |
| CMS Energy Corp. | | | | | | | | |
| 3.60%, 11/15/2025 | | | 100,000 | | | | 102,528 | |
| Consumers Energy Co. | | | | | | | | |
| 3.13%, 08/31/2024 | | | 175,000 | | | | 177,618 | |
| Dominion Energy, Inc. | | | | | | | | |
| 5.20%, 08/15/2019 | | | 500,000 | | | | 524,232 | |
| 3.63%, 12/01/2024 | | | 50,000 | | | | 51,642 | |
| Duke Energy Corp. | | | | | | | | |
| 1.80%, 09/01/2021 | | | 675,000 | | | | 658,165 | |
| Southern Co. | | | | | | | | |
| 2.95%, 07/01/2023 | | | 818,000 | | | | 819,767 | |
| Total Utilities | | | | | | | 2,333,952 | |
| | | | | | | | | |
| TOTAL CORPORATE BONDS | | | | | | | | |
| (Cost $44,952,407) | | | | | | | 44,958,184 | |
| | | | | | | | | |
| GOVERNMENT BONDS (2.26%) | | | | | | | | |
| United States Treasury Inflation Indexed Bonds | | | | | | | | |
| 2.13%, 02/15/2040 | | | 856,305 | | | | 1,085,284 | |
| | | | | | | | | |
| TOTAL GOVERNMENT BONDS | | | | | | | | |
| (Cost $1,045,969) | | | | | | | 1,085,284 | |
| | | | | | | | | |
| Security Description | | 7 Day Yield | | | Shares | | | Value | |
| SHORT TERM INVESTMENTS (3.20%) | | | | | | | | | |
| State Street Institutional Treasury Plus Money Market Fund | | | | | | | | | |
| (Cost $1,534,758) | | | 0.970 | % | | | 1,534,758 | | | | 1,534,758 | |
| | | | | | | | | | | | | |
| TOTAL SHORT TERM INVESTMENTS | | | | | | | | | |
| (Cost $1,534,758) | | | | | | | | | | | 1,534,758 | |
| | | | | | | | | | | | | |
| TOTAL INVESTMENTS (99.20%) | | | | | | | | | |
| (Cost $47,533,134) | | | | | | | | | | $ | 47,578,226 | |
| | | | | | | | | | | | | |
| NET OTHER ASSETS AND LIABILITIES (0.80%) | | | | | | | | 383,476 | |
| | | | | | | | | | | | | |
| NET ASSETS (100.00%) | | | | | | | $ | 47,961,702 | |
See Notes to Financial Statements.
RiverFront Dynamic Core Income ETF
| Schedule of Investments | November 30, 2017 |
Investment Abbreviations:
LIBOR - London Interbank Offered Rate
LIBOR Rate:
3M US L - 3 Month LIBOR as of November 30, 2017 was 1.49%
| (a) | Securities exempt from registration under Rule 144A of the Securities Act of 1933. These securities may be sold in the ordinary course of business in transactions exempt from registration, normally to qualified institutional buyers. At period end, the aggregate market value of those securities was $2,155,232, representing 4.49% of net assets. |
| (b) | Floating or variable rate security. The reference rate is described above. The Rate in effect as of November 30, 2017 is based on the reference rate plus the displayed spread as of the security's last reset date. |
See Notes to Financial Statements.
RiverFront Dynamic Unconstrained Income ETF
| Schedule of Investments | November 30, 2017 |
| Security Description | | Principal Amount | | | Value | |
| CORPORATE BONDS (96.22%) | | | | | | | | |
| Communications (12.25%) | | | | | | | | |
| Cablevision Systems Corp. | | | | | | | | |
| 5.88%, 09/15/2022 | | $ | 150,000 | | | $ | 148,875 | |
| CCO Holdings LLC / CCO Holdings Capital Corp. | | | | | | | | |
| 5.13%, 05/01/2027(a) | | | 150,000 | | | | 148,969 | |
| CenturyLink, Inc. | | | | | | | | |
| 7.50%, 04/01/2024 | | | 100,000 | | | | 97,750 | |
| Clear Channel Worldwide Holdings, Inc. | | | | | | | | |
| 6.50%, 11/15/2022 | | | 150,000 | | | | 153,000 | |
| Lamar Media Corp. | | | | | | | | |
| 5.75%, 02/01/2026 | | | 100,000 | | | | 107,750 | |
| Level 3 Financing, Inc. | | | | | | | | |
| 5.38%, 01/15/2024 | | | 60,000 | | | | 60,300 | |
| Netflix, Inc. | | | | | | | | |
| 4.38%, 11/15/2026 | | | 100,000 | | | | 98,625 | |
| SFR Group SA | | | | | | | | |
| 6.25%, 05/15/2024(a) | | | 75,000 | | | | 73,969 | |
| Sirius XM Radio, Inc. | | | | | | | | |
| 4.63%, 05/15/2023(a) | | | 25,000 | | | | 25,750 | |
| Sprint Communications, Inc. | | | | | | | | |
| 9.00%, 11/15/2018(a) | | | 56,000 | | | | 59,220 | |
| 6.00%, 11/15/2022 | | | 100,000 | | | | 101,249 | |
| T-Mobile USA, Inc. | | | | | | | | |
| 6.50%, 01/15/2024 | | | 150,000 | | | | 159,563 | |
| Univision Communications, Inc. | | | | | | | | |
| 5.13%, 05/15/2023(a) | | | 50,000 | | | | 50,125 | |
| VeriSign, Inc. | | | | | | | | |
| 4.75%, 07/15/2027 | | | 150,000 | | | | 155,438 | |
| Total Communications | | | | | | | 1,440,583 | |
| | | | | | | | | |
| Consumer Discretionary (16.85%) | | | | | | | | |
| ADT Corp. | | | | | | | | |
| 6.25%, 10/15/2021 | | | 150,000 | | | | 165,749 | |
| Aramark Services, Inc. | | | | | | | | |
| 5.13%, 01/15/2024 | | | 150,000 | | | | 158,625 | |
| Avis Budget Car Rental LLC / Avis Budget Finance, Inc. | | | | | | | | |
| 5.50%, 04/01/2023 | | | 57,000 | | | | 58,268 | |
| Dana Financing Luxembourg Sarl | | | | | | | | |
| 5.75%, 04/15/2025(a) | | | 100,000 | | | | 106,470 | |
| Goodyear Tire & Rubber Co. | | | | | | | | |
| 5.00%, 05/31/2026 | | | 150,000 | | | | 155,858 | |
| Hanesbrands, Inc. | | | | | | | | |
| 4.63%, 05/15/2024(a) | | | 150,000 | | | | 153,563 | |
| Hilton Worldwide Finance LLC / Hilton Worldwide Finance Corp. | | | | | | | | |
| 4.63%, 04/01/2025 | | | 150,000 | | | | 155,438 | |
| International Game Technology PLC | | | | | | | | |
| 6.25%, 02/15/2022(a) | | | 150,000 | | | | 164,437 | |
| Jaguar Land Rover Automotive PLC | | | | | | | | |
| 4.50%, 10/01/2027(a) | | | 50,000 | | | | 49,656 | |
| Security Description | | | Principal Amount | | | | Value | |
| Consumer Discretionary (continued) | | | | | | | | |
| KB Home | | | | | | | | |
| 7.50%, 09/15/2022 | | $ | 30,000 | | | $ | 34,575 | |
| KFC Holding Co. / Pizza Hut Holdings LLC / Taco Bell of America LLC | | | | | | | | |
| 5.00%, 06/01/2024(a) | | | 150,000 | | | | 157,500 | |
| Lennar Corp. | | | | | | | | |
| 4.13%, 01/15/2022 | | | 150,000 | | | | 153,938 | |
| PulteGroup, Inc. | | | | | | | | |
| 5.50%, 03/01/2026 | | | 55,000 | | | | 59,881 | |
| 5.00%, 01/15/2027 | | | 40,000 | | | | 42,242 | |
| Scotts Miracle-Gro Co. | | | | | | | | |
| 5.25%, 12/15/2026 | | | 100,000 | | | | 105,625 | |
| Service Corp. International | | | | | | | | |
| 5.38%, 05/15/2024 | | | 150,000 | | | | 158,438 | |
| ServiceMaster Co. LLC | | | | | | | | |
| 5.13%, 11/15/2024(a) | | | 100,000 | | | | 101,750 | |
| Total Consumer Discretionary | | | | | | | 1,982,013 | |
| | | | | | | | | |
| Consumer Staples (3.23%) | | | | | | | | |
| Pinnacle Foods Finance LLC / Pinnacle Foods Finance Corp. | | | | | | | | |
| 5.88%, 01/15/2024 | | | 100,000 | | | | 106,500 | |
| Spectrum Brands, Inc. | | | | | | | | |
| 5.75%, 07/15/2025 | | | 110,000 | | | | 116,050 | |
| TreeHouse Foods, Inc. | | | | | | | | |
| 6.00%, 02/15/2024(a) | | | 150,000 | | | | 157,688 | |
| Total Consumer Staples | | | | | | | 380,238 | |
| | | | | | | | | |
| Energy (10.28%) | | | | | | | | |
| Andeavor Logistics LP / Tesoro Logistics Finance Corp. | | | | | | | | |
| 6.38%, 05/01/2024 | | | 125,000 | | | | 136,250 | |
| Cheniere Corpus Christi Holdings LLC | | | | | | | | |
| 7.00%, 06/30/2024 | | | 125,000 | | | | 142,500 | |
| CNX Resources Corp. | | | | | | | | |
| 5.88%, 04/15/2022 | | | 50,000 | | | | 51,375 | |
| Continental Resources, Inc. | | | | | | | | |
| 5.00%, 09/15/2022 | | | 125,000 | | | | 127,813 | |
| DCP Midstream Operating LP | | | | | | | | |
| 3.88%, 03/15/2023 | | | 100,000 | | | | 100,250 | |
| Newfield Exploration Co. | | | | | | | | |
| 5.75%, 01/30/2022 | | | 200,000 | | | | 214,749 | |
| Range Resources Corp. | | | | | | | | |
| 5.00%, 08/15/2022 | | | 35,000 | | | | 35,044 | |
| 5.00%, 03/15/2023 | | | 35,000 | | | | 34,825 | |
| Southwestern Energy Co. | | | | | | | | |
| 6.70%, 01/23/2025 | | | 97,000 | | | | 101,123 | |
| Targa Resources Partners LP / Targa Resources Partners Finance Corp | | | | | | | | |
| 5.00%, 01/15/2028(a) | | | 50,000 | | | | 49,813 | |
| Transocean, Inc. | | | | | | | | |
| 9.00%, 07/15/2023(a) | | | 50,000 | | | | 54,188 | |
See Notes to Financial Statements.
RiverFront Dynamic Unconstrained Income ETF
| Schedule of Investments | November 30, 2017 |
| Security Description | | Principal Amount | | | Value | |
| Energy (continued) | | | | | | | | |
| Weatherford International, Ltd. | | | | | | | | |
| 9.63%, 03/01/2019 | | $ | 150,000 | | | $ | 160,499 | |
| Total Energy | | | | | | | 1,208,429 | |
| | | | | | | | | |
| Financials (10.46%) | | | | | | | | |
| Aircastle, Ltd. | | | | | | | | |
| 4.13%, 05/01/2024 | | | 65,000 | | | | 66,615 | |
| Ally Financial, Inc. | | | | | | | | |
| 5.75%, 11/20/2025 | | | 150,000 | | | | 164,999 | |
| CIT Group, Inc. | | | | | | | | |
| 5.00%, 08/15/2022 | | | 136,000 | | | | 145,690 | |
| Equinix, Inc. | | | | | | | | |
| 5.75%, 01/01/2025 | | | 100,000 | | | | 107,625 | |
| First Data Corp. | | | | | | | | |
| 5.38%, 08/15/2023(a) | | | 125,000 | | | | 130,000 | |
| Icahn Enterprises LP / Icahn Enterprises Finance Corp. | | | | | | | | |
| 6.00%, 08/01/2020 | | | 150,000 | | | | 154,594 | |
| 5.88%, 02/01/2022 | | | 25,000 | | | | 25,656 | |
| Iron Mountain, Inc. | | | | | | | | |
| 5.75%, 08/15/2024 | | | 200,000 | | | | 205,749 | |
| iStar, Inc. | | | | | | | | |
| 5.25%, 09/15/2022 | | | 100,000 | | | | 101,375 | |
| Park Aerospace Holdings, Ltd. | | | | | | | | |
| 5.25%, 08/15/2022(a) | | | 125,000 | | | | 128,281 | |
| Total Financials | | | | | | | 1,230,584 | |
| | | | | | | | | |
| Health Care (7.15%) | | | | | | | | |
| Centene Corp. | | | | | | | | |
| 4.75%, 05/15/2022 | | | 76,000 | | | | 79,269 | |
| 6.13%, 02/15/2024 | | | 100,000 | | | | 107,249 | |
| DaVita, Inc. | | | | | | | | |
| 5.00%, 05/01/2025 | | | 100,000 | | | | 100,280 | |
| HCA, Inc. | | | | | | | | |
| 5.00%, 03/15/2024 | | | 150,000 | | | | 157,875 | |
| HealthSouth Corp. | | | | | | | | |
| 5.75%, 11/01/2024 | | | 125,000 | | | | 128,438 | |
| LifePoint Health, Inc. | | | | | | | | |
| 5.38%, 05/01/2024 | | | 65,000 | | | | 63,944 | |
| Tenet Healthcare Corp. | | | | | | | | |
| 4.75%, 06/01/2020 | | | 150,000 | | | | 153,795 | |
| Valeant Pharmaceuticals International, Inc. | | | | | | | | |
| 5.38%, 03/15/2020(a) | | | 50,000 | | | | 49,688 | |
| Total Health Care | | | | | | | 840,538 | |
| | | | | | | | | |
| Industrials (7.41%) | | | | | | | | |
| Bombardier, Inc. | | | | | | | | |
| 7.75%, 03/15/2020(a) | | | 100,000 | | | | 108,084 | |
| CNH Industrial NV | | | | | | | | |
| 4.50%, 08/15/2023 | | | 100,000 | | | | 105,375 | |
| Terex Corp. | | | | | | | | |
| 5.63%, 02/01/2025(a) | | | 100,000 | | | | 105,688 | |
| Security Description | | Principal Amount | | | Value | |
| Industrials (continued) | | | | | | | | |
| TransDigm, Inc. | | | | | | | | |
| 6.00%, 07/15/2022 | | $ | 100,000 | | | $ | 103,375 | |
| United Rentals North America, Inc. | | | | | | | | |
| 5.88%, 09/15/2026 | | | 150,000 | | | | 161,999 | |
| WESCO Distribution, Inc. | | | | | | | | |
| 5.38%, 06/15/2024 | | | 150,000 | | | | 155,625 | |
| XPO Logistics, Inc. | | | | | | | | |
| 6.50%, 06/15/2022(a) | | | 125,000 | | | | 131,094 | |
| Total Industrials | | | | | | | 871,240 | |
| | | | | | | | | |
| Materials (19.86%) | | | | | | | | |
| AK Steel Corp. | | | | | | | | |
| 7.50%, 07/15/2023 | | | 100,000 | | | | 109,000 | |
| Ashland LLC | | | | | | | | |
| 4.75%, 08/15/2022 | | | 150,000 | | | | 156,750 | |
| Ball Corp. | | | | | | | | |
| 5.25%, 07/01/2025 | | | 150,000 | | | | 164,812 | |
| BWAY Holding Co. | | | | | | | | |
| 5.50%, 04/15/2024(a) | | | 100,000 | | | | 104,500 | |
| Cascades, Inc. | | | | | | | | |
| 5.50%, 07/15/2022(a) | | | 150,000 | | | | 155,438 | |
| Chemours Co. | | | | | | | | |
| 7.00%, 05/15/2025 | | | 150,000 | | | | 164,812 | |
| Crown Americas LLC / Crown | | | | | | | | |
| Americas Capital Corp. V | | | | | | | | |
| 4.25%, 09/30/2026 | | | 100,000 | | | | 100,750 | |
| Freeport-McMoRan, Inc. | | | | | | | | |
| 6.50%, 11/15/2020 | | | 100,000 | | | | 102,004 | |
| 3.88%, 03/15/2023 | | | 75,000 | | | | 74,520 | |
| Glencore Funding LLC | | | | | | | | |
| 4.00%, 03/27/2027(a) | | | 150,000 | | | | 149,072 | |
| Graphic Packaging International, Inc. | | | | | | | | |
| 4.88%, 11/15/2022 | | | 100,000 | | | | 106,875 | |
| Owens-Brockway Glass Container, Inc. | | | | | | | | |
| 5.00%, 01/15/2022(a) | | | 150,000 | | | | 157,875 | |
| Plastipak Holdings, Inc. | | | | | | | | |
| 6.25%, 10/15/2025(a) | | | 50,000 | | | | 51,125 | |
| Reynolds Group Issuer, Inc. / Reynolds Group Issuer LLC | | | | | | | | |
| 5.13%, 07/15/2023(a) | | | 65,000 | | | | 67,519 | |
| Silgan Holdings, Inc. | | | | | | | | |
| 4.75%, 03/15/2025(a) | | | 150,000 | | | | 154,500 | |
| Steel Dynamics, Inc. | | | | | | | | |
| 5.00%, 12/15/2026 | | | 100,000 | | | | 105,938 | |
| Teck Resources, Ltd. | | | | | | | | |
| 8.50%, 06/01/2024(a) | | | 125,000 | | | | 142,188 | |
| USG Corp. | | | | | | | | |
| 4.88%, 06/01/2027(a) | | | 150,000 | | | | 157,125 | |
| Vale Overseas, Ltd. | | | | | | | | |
| 5.88%, 06/10/2021 | | | 100,000 | | | | 109,875 | |
| Total Materials | | | | | | | 2,334,678 | |
See Notes to Financial Statements.
RiverFront Dynamic Unconstrained Income ETF
| Schedule of Investments | November 30, 2017 |
| Security Description | | Principal Amount | | | Value | |
| Technology (4.61%) | | | | | | | | |
| Dell International LLC / EMC Corp. | | | | | | | | |
| 5.88%, 06/15/2021(a) | | $ | 50,000 | | | $ | 52,125 | |
| 7.13%, 06/15/2024(a) | | | 50,000 | | | | 54,372 | |
| 6.02%, 06/15/2026(a) | | | 50,000 | | | | 55,056 | |
| j2 Cloud Services LLC / j2 Global Co.- Obligor, Inc. | | | | | | | | |
| 6.00%, 07/15/2025(a) | | | 25,000 | | | | 26,125 | |
| NCR Corp. | | | | | | | | |
| 5.00%, 07/15/2022 | | | 100,000 | | | | 102,000 | |
| SS&C Technologies Holdings, Inc. | | | | | | | | |
| 5.88%, 07/15/2023 | | | 150,000 | | | | 159,375 | |
| Western Digital Corp. | | | | | | | | |
| 10.50%, 04/01/2024 | | | 80,000 | | | | 93,120 | |
| Total Technology | | | | | | | 542,173 | |
| | | | | | | | | |
| Utilities (4.12%) | | | | | | | | |
| AES Corp. | | | | | | | | |
| 5.13%, 09/01/2027 | | | 100,000 | | | | 103,500 | |
| AmeriGas Partners LP / AmeriGas Finance Corp. | | | | | | | | |
| 5.75%, 05/20/2027 | | | 150,000 | | | | 152,250 | |
| Calpine Corp. | | | | | | | | |
| 5.38%, 01/15/2023 | | | 60,000 | | | | 60,000 | |
| Dynegy, Inc. | | | | | | | | |
| 7.38%, 11/01/2022 | | | 60,000 | | | | 64,275 | |
| NRG Energy, Inc. | | | | | | | | |
| 6.63%, 03/15/2023 | | | 100,000 | | | | 103,960 | |
| Total Utilities | | | | | | | 483,985 | |
| | | | | | | | | |
| TOTAL CORPORATE BONDS | | | | | | | | |
| (Cost $11,152,871) | | | | | | | 11,314,461 | |
| Security Description | | | 7 Day Yield | | | | Shares | | | | Value | |
| SHORT TERM INVESTMENTS (2.50%) | | | | | |
| State Street Institutional Treasury Plus Money Market Fund | | | | | | | | | | | | |
| (Cost $293,674) | | | 0.970 | % | | | 293,674 | | | | 293,674 | |
| | | | | | | | | | | | | |
| TOTAL SHORT TERM INVESTMENTS | | | | | |
| (Cost $293,674) | | | | 293,674 | |
| | | | | | | | | | | | | |
| TOTAL INVESTMENTS (98.72%) | | | | | |
| (Cost $11,446,545) | | | $ | 11,608,135 | |
| | | | | | | | | | | | | |
| NET OTHER ASSETS AND LIABILITIES (1.28%) | | | | 151,166 | |
| | | | | | | | | | | | | |
| NET ASSETS (100.00%) | | | | $ | 11,759,301 | |
| (a) | Securities exempt from registration under Rule 144A of the Securities Act of 1933. These securities may be sold in the ordinary course of business in transactions exempt from registration, normally to qualified institutional buyers. At period end, the aggregate market value of those securities was $3,332,953, representing 28.34% of net assets. |
See Notes to Financial Statements.
RiverFront Dynamic US Dividend Advantage ETF
| Schedule of Investments | November 30, 2017 |
| Security Description | | Shares | | | Value | |
| COMMON STOCKS (99.75%) | | | | | | | | |
| Consumer Discretionary (9.95%) | | | | | | | | |
| Amazon.com, Inc.(a) | | | 609 | | | $ | 716,641 | |
| Best Buy Co., Inc. | | | 7,721 | | | | 460,249 | |
| Comcast Corp., Class A | | | 13,109 | | | | 492,112 | |
| Darden Restaurants, Inc. | | | 5,907 | | | | 498,078 | |
| Dunkin' Brands Group, Inc. | | | 4,725 | | | | 282,083 | |
| Ford Motor Co. | | | 60,540 | | | | 757,960 | |
| Garmin, Ltd. | | | 5,184 | | | | 321,823 | |
| International Game Technology PLC | | | 30,245 | | | | 831,434 | |
| Meredith Corp. | | | 8,211 | | | | 559,580 | |
| Target Corp. | | | 10,884 | | | | 651,952 | |
| Time Warner, Inc. | | | 3,989 | | | | 365,033 | |
| Total Consumer Discretionary | | | | | | | 5,936,945 | |
| | | | | | | | | |
| Consumer Staples (8.88%) | | | | | | | | |
| Avon Products, Inc.(a) | | | 78,217 | | | | 154,870 | |
| Bob Evans Farms, Inc. | | | 6,057 | | | | 472,688 | |
| CVS Health Corp. | | | 12,200 | | | | 934,520 | |
| Flowers Foods, Inc. | | | 39,099 | | | | 781,198 | |
| PepsiCo, Inc. | | | 4,686 | | | | 546,013 | |
| Philip Morris International, Inc. | | | 3,515 | | | | 361,166 | |
| SUPERVALU, Inc.(a) | | | 19,664 | | | | 359,458 | |
| Wal-Mart Stores, Inc. | | | 17,346 | | | | 1,686,551 | |
| Total Consumer Staples | | | | | | | 5,296,464 | |
| | | | | | | | | |
| Energy (7.25%) | | | | | | | | |
| Apache Corp. | | | 8,446 | | | | 353,296 | |
| Chevron Corp. | | | 5,316 | | | | 632,551 | |
| EOG Resources, Inc. | | | 6,487 | | | | 663,750 | |
| Exxon Mobil Corp. | | | 9,202 | | | | 766,434 | |
| Occidental Petroleum Corp. | | | 6,075 | | | | 428,288 | |
| ONEOK, Inc. | | | 8,137 | | | | 422,310 | |
| Phillips 66 | | | 5,244 | | | | 511,605 | |
| Williams Cos., Inc. | | | 18,701 | | | | 543,264 | |
| Total Energy | | | | | | | 4,321,498 | |
| | | | | | | | | |
| Financials (17.63%) | | | | | | | | |
| Ameriprise Financial, Inc. | | | 3,338 | | | | 544,862 | |
| Bank of America Corp. | | | 23,317 | | | | 656,840 | |
| East West Bancorp, Inc. | | | 7,356 | | | | 452,688 | |
| Federated Investors, Inc., Class B | | | 12,325 | | | | 413,627 | |
| First American Financial Corp. | | | 13,668 | | | | 759,804 | |
| Greenhill & Co., Inc. | | | 20,504 | | | | 416,231 | |
| Hartford Financial Services Group, Inc. | | | 16,289 | | | | 935,640 | |
| JPMorgan Chase & Co. | | | 9,312 | | | | 973,290 | |
| MetLife, Inc. | | | 8,532 | | | | 457,998 | |
| Old Republic International Corp. | | | 19,405 | | | | 406,923 | |
| People's United Financial, Inc. | | | 16,615 | | | | 316,017 | |
| Progressive Corp. | | | 6,600 | | | | 350,988 | |
| Prudential Financial, Inc. | | | 3,947 | | | | 457,220 | |
| S&P Global, Inc. | | | 2,991 | | | | 494,951 | |
| SunTrust Banks, Inc. | | | 7,755 | | | | 477,941 | |
| Security Description | | Shares | | | Value | |
| Financials (continued) | | | | | | | | |
| T Rowe Price Group, Inc. | | | 9,970 | | | $ | 1,026,113 | |
| Wells Fargo & Co. | | | 17,170 | | | | 969,590 | |
| XL Group, Ltd. | | | 10,449 | | | | 405,630 | |
| Total Financials | | | | | | | 10,516,353 | |
| | | | | | | | | |
| Health Care (12.28%) | | | | | | | | |
| AbbVie, Inc. | | | 4,181 | | | | 405,223 | |
| Aetna, Inc. | | | 3,824 | | | | 689,008 | |
| AmerisourceBergen Corp. | | | 7,768 | | | | 658,882 | |
| Amgen, Inc. | | | 2,626 | | | | 461,283 | |
| Cigna Corp. | | | 3,702 | | | | 783,824 | |
| Gilead Sciences, Inc. | | | 11,685 | | | | 873,804 | |
| HealthSouth Corp. | | | 22,832 | | | | 1,140,459 | |
| Kindred Healthcare, Inc. | | | 41,467 | | | | 304,782 | |
| McKesson Corp. | | | 2,698 | | | | 398,603 | |
| PDL BioPharma, Inc.(a) | | | 182,315 | | | | 530,537 | |
| Pfizer, Inc. | | | 29,735 | | | | 1,078,191 | |
| Total Health Care | | | | | | | 7,324,596 | |
| | | | | | | | | |
| Industrials (8.27%) | | | | | | | | |
| Boeing Co. | | | 3,459 | | | | 957,451 | |
| Brink's Co. | | | 6,552 | | | | 529,729 | |
| Caterpillar, Inc. | | | 3,757 | | | | 530,301 | |
| Cummins, Inc. | | | 2,496 | | | | 417,830 | |
| Eaton Corp. PLC | | | 9,651 | | | | 750,655 | |
| Emerson Electric Co. | | | 7,253 | | | | 470,139 | |
| MSA Safety, Inc. | | | 4,395 | | | | 377,970 | |
| RR Donnelley & Sons Co. | | | 48,224 | | | | 452,823 | |
| Timken Co. | | | 8,875 | | | | 442,863 | |
| Total Industrials | | | | | | | 4,929,761 | |
| | | | | | | | | |
| Information Technology (23.31%) | | | | | | | | |
| Analog Devices, Inc. | | | 7,963 | | | | 685,694 | |
| Apple, Inc. | | | 14,461 | | | | 2,485,124 | |
| Applied Materials, Inc. | | | 20,218 | | | | 1,066,904 | |
| Broadcom, Ltd. | | | 1,668 | | | | 463,604 | |
| Cognizant Technology Solutions Corp., Class A | | | 12,161 | | | | 878,997 | |
| Facebook, Inc., Class A(a) | | | 1,047 | | | | 185,507 | |
| HP, Inc. | | | 22,996 | | | | 493,264 | |
| Intel Corp. | | | 7,343 | | | | 329,260 | |
| InterDigital, Inc. | | | 6,471 | | | | 492,443 | |
| Lam Research Corp. | | | 3,031 | | | | 582,952 | |
| Leidos Holdings, Inc. | | | 12,671 | | | | 805,495 | |
| Maxim Integrated Products, Inc. | | | 8,825 | | | | 461,812 | |
| Microchip Technology, Inc. | | | 5,961 | | | | 518,547 | |
| Micron Technology, Inc.(a) | | | 16,419 | | | | 696,001 | |
| NetApp, Inc. | | | 9,626 | | | | 543,965 | |
| NVIDIA Corp. | | | 4,160 | | | | 834,954 | |
| Texas Instruments, Inc. | | | 11,828 | | | | 1,150,747 | |
| Western Digital Corp. | | | 6,792 | | | | 535,617 | |
| Xilinx, Inc. | | | 9,913 | | | | 689,053 | |
| Total Information Technology | | | | | | | 13,899,940 | |
See Notes to Financial Statements.
RiverFront Dynamic US Dividend Advantage ETF
| Schedule of Investments | November 30, 2017 |
| Security Description | | Shares | | | Value | |
| Materials (2.52%) | | | | | | |
| Avery Dennison Corp. | | | 3,908 | | | $ | 445,981 | |
| Compass Minerals International, Inc. | | | 4,481 | | | | 312,550 | |
| LyondellBasell Industries NV, Class A | | | 7,130 | | | | 746,511 | |
| Total Materials | | | | | | | 1,505,042 | |
| | | | | | | | | |
| Real Estate (2.65%) | | | | | | | | |
| Core Civic, Inc. | | | 9,505 | | | | 223,463 | |
| LaSalle Hotel Properties | | | 18,118 | | | | 515,276 | |
| Macerich Co. | | | 3,571 | | | | 231,222 | |
| Washington Prime Group, Inc. | | | 85,726 | | | | 609,512 | |
| Total Real Estate | | | | | | | 1,579,473 | |
| | | | | | | | | |
| Telecommunication Services (3.39%) | | | | | | | | |
| AT&T, Inc. | | | 29,526 | | | | 1,074,155 | |
| CenturyLink, Inc. | | | 23,745 | | | | 346,440 | |
| Verizon Communications, Inc. | | | 11,867 | | | | 603,912 | |
| Total Telecommunication Services | | | | | | | 2,024,507 | |
| | | | | | | | | |
| Utilities (3.62%) | | | | | | | | |
| American Electric Power Co., Inc. | | | 3,061 | | | | 237,625 | |
| Consolidated Edison, Inc. | | | 7,570 | | | | 674,033 | |
| Duke Energy Corp. | | | 3,094 | | | | 275,923 | |
| Entergy Corp. | | | 6,331 | | | | 547,505 | |
| FirstEnergy Corp. | | | 6,862 | | | | 234,269 | |
| Southern Co. | | | 3,700 | | | | 189,440 | |
| Total Utilities | | | | | | | 2,158,795 | |
| | | | | | | | | |
| TOTAL COMMON STOCKS | | | | | | | | |
| (Cost $53,100,399) | | | | | | | 59,493,374 | |
| | | | | | | | | |
| TOTAL INVESTMENTS (99.75%) | | | | | | | | |
| (Cost $53,100,399) | | | | | | $ | 59,493,374 | |
| | | | | | | | | |
| NET OTHER ASSETS AND LIABILITIES (0.25%) | | | | | | | 150,571 | |
| | | | | | | | | |
| NET ASSETS (100.00%) | | | | | | $ | 59,643,945 | |
| (a) | Non income producing security. |
See Notes to Financial Statements.
RiverFront Dynamic US Flex-Cap ETF
| Schedule of Investments | November 30, 2017 |
| Security Description | | Shares | | | Value | |
| COMMON STOCKS (99.83%) | | | | | | | | |
| Consumer Discretionary (14.20%) | | | | | | | | |
| Amazon.com, Inc.(a) | | | 386 | | | $ | 454,226 | |
| American Public Education, Inc.(a) | | | 2,702 | | | | 72,549 | |
| Best Buy Co., Inc. | | | 4,498 | | | | 268,126 | |
| Boyd Gaming Corp. | | | 3,069 | | | | 97,870 | |
| Darden Restaurants, Inc. | | | 4,839 | | | | 408,024 | |
| Dave & Buster's Entertainment, Inc.(a) | | | 1,544 | | | | 81,878 | |
| Delphi Automotive PLC | | | 2,603 | | | | 272,456 | |
| Dollar General Corp. | | | 2,640 | | | | 232,531 | |
| Entercom Communications Corp., Class A | | | 4,891 | | | | 56,736 | |
| EW Scripps Co., Class A(a) | | | 3,043 | | | | 45,858 | |
| Five Below, Inc.(a) | | | 1,815 | | | | 112,167 | |
| Ford Motor Co. | | | 29,259 | | | | 366,323 | |
| GameStop Corp., Class A | | | 2,555 | | | | 47,906 | |
| International Game Technology PLC | | | 43,611 | | | | 1,198,867 | |
| JC Penney Co., Inc.(a)(b) | | | 24,420 | | | | 80,830 | |
| La-Z-Boy, Inc. | | | 3,987 | | | | 131,172 | |
| Michaels Cos., Inc.(a) | | | 4,515 | | | | 97,524 | |
| Netflix, Inc.(a) | | | 2,806 | | | | 526,349 | |
| Priceline Group, Inc.(a) | | | 70 | | | | 121,780 | |
| RH(a) | | | 5,900 | | | | 598,201 | |
| Sally Beauty Holdings, Inc.(a) | | | 4,823 | | | | 82,232 | |
| Steven Madden, Ltd.(a) | | | 2,297 | | | | 98,197 | |
| Wyndham Worldwide Corp. | | | 2,756 | | | | 309,747 | |
| Total Consumer Discretionary | | | | | | | 5,761,549 | |
| | | | | | | | | |
| Consumer Staples (7.16%) | | | | | | | | |
| Avon Products, Inc.(a) | | | 117,808 | | | | 233,260 | |
| Bob Evans Farms, Inc. | | | 5,684 | | | | 443,579 | |
| Boston Beer Co., Inc., Class A(a) | | | 723 | | | | 130,032 | |
| CVS Health Corp. | | | 5,623 | | | | 430,722 | |
| Flowers Foods, Inc. | | | 8,239 | | | | 164,615 | |
| Ingredion, Inc. | | | 767 | | | | 106,214 | |
| Kimberly-Clark Corp. | | | 620 | | | | 74,251 | |
| Kroger Co. | | | 1,727 | | | | 44,660 | |
| PepsiCo, Inc. | | | 1,896 | | | | 220,922 | |
| Tyson Foods, Inc., Class A | | | 4,679 | | | | 384,848 | |
| United Natural Foods, Inc.(a) | | | 3,570 | | | | 171,431 | |
| Wal-Mart Stores, Inc. | | | 5,140 | | | | 499,763 | |
| Total Consumer Staples | | | | | | | 2,904,297 | |
| | | | | | | | | |
| Energy (4.32%) | | | | | | | | |
| Bill Barrett Corp.(a) | | | 9,658 | | | | 56,499 | |
| Chevron Corp. | | | 2,960 | | | | 352,210 | |
| Ensco PLC, Class A | | | 15,434 | | | | 82,881 | |
| Exxon Mobil Corp. | | | 2,365 | | | | 196,981 | |
| Green Plains, Inc. | | | 2,069 | | | | 34,863 | |
| Kinder Morgan, Inc. | | | 13,367 | | | | 230,313 | |
| Occidental Petroleum Corp. | | | 2,065 | | | | 145,583 | |
| Rowan Cos. PLC, Class A(a) | | | 4,077 | | | | 58,994 | |
| Transocean, Ltd.(a)(b) | | | 23,506 | | | | 238,351 | |
| Security Description | | Shares | | | Value | |
| Energy (continued) | | | | | | | | |
| Unit Corp.(a) | | | 2,142 | | | $ | 45,817 | |
| Williams Cos., Inc. | | | 10,738 | | | | 311,939 | |
| Total Energy | | | | | | | 1,754,431 | |
| | | | | | | | | |
| Financials (15.94%) | | | | | | | | |
| American Express Co. | | | 5,462 | | | | 533,692 | |
| Brookline Bancorp, Inc. | | | 5,225 | | | | 84,123 | |
| Capital One Financial Corp. | | | 1,863 | | | | 171,396 | |
| Capstead Mortgage Corp. | | | 7,558 | | | | 68,551 | |
| Citigroup, Inc. | | | 5,016 | | | | 378,708 | |
| CNO Financial Group, Inc. | | | 4,926 | | | | 124,184 | |
| E*TRADE Financial Corp(a) | | | 19,955 | | | | 960,634 | |
| East West Bancorp, Inc. | | | 3,553 | | | | 218,652 | |
| Everest Re Group, Ltd. | | | 408 | | | | 89,597 | |
| EZCORP, Inc., Class A(a) | | | 10,278 | | | | 123,850 | |
| First American Financial Corp. | | | 3,601 | | | | 200,180 | |
| First Financial Bankshares, Inc. | | | 2,414 | | | | 114,544 | |
| Goldman Sachs Group, Inc. | | | 1,963 | | | | 486,117 | |
| Northern Trust Corp. | | | 3,954 | | | | 386,622 | |
| Old Republic International Corp. | | | 3,311 | | | | 69,432 | |
| Progressive Corp. | | | 5,341 | | | | 284,034 | |
| Prudential Financial, Inc. | | | 3,443 | | | | 398,837 | |
| Signature Bank(a) | | | 198 | | | | 27,181 | |
| SLM Corp.(a) | | | 9,802 | | | | 113,409 | |
| T Rowe Price Group, Inc. | | | 3,735 | | | | 384,406 | |
| Virtus Investment Partners, Inc. | | | 426 | | | | 51,141 | |
| Washington Federal, Inc. | | | 11,621 | | | | 404,411 | |
| Wells Fargo & Co. | | | 6,121 | | | | 345,653 | |
| Wintrust Financial Corp. | | | 638 | | | | 53,496 | |
| XL Group, Ltd. | | | 10,157 | | | | 394,295 | |
| Total Financials | | | | | | | 6,467,145 | |
| | | | | | | | | |
| Health Care (10.13%) | | | | | | | | |
| ANI Pharmaceuticals, Inc.(a) | | | 767 | | | | 54,541 | |
| Centene Corp.(a) | | | 3,521 | | | | 359,459 | |
| Chemed Corp. | | | 330 | | | | 81,160 | |
| Cigna Corp. | | | 3,031 | | | | 641,754 | |
| Community Health Systems, Inc.(a) | | | 11,077 | | | | 50,400 | |
| CR Bard, Inc. | | | 568 | | | | 190,814 | |
| DaVita, Inc.(a) | | | 3,866 | | | | 236,058 | |
| Endo International PLC(a) | | | 33,268 | | | | 244,187 | |
| Express Scripts Holding Co.(a) | | | 5,496 | | | | 358,229 | |
| Gilead Sciences, Inc. | | | 6,950 | | | | 519,721 | |
| HCA Healthcare, Inc.(a) | | | 2,236 | | | | 190,060 | |
| Hologic, Inc.(a) | | | 1,438 | | | | 59,993 | |
| Humana, Inc. | | | 1,177 | | | | 307,032 | |
| Lannett Co., Inc.(a)(b) | | | 2,049 | | | | 54,196 | |
| Mallinckrodt PLC(a) | | | 7,791 | | | | 170,000 | |
| McKesson Corp. | | | 2,655 | | | | 392,250 | |
| OraSure Technologies, Inc.(a) | | | 4,634 | | | | 76,693 | |
| Supernus Pharmaceuticals, Inc.(a) | | | 1,753 | | | | 66,263 | |
| United Therapeutics Corp.(a) | | | 450 | | | | 58,496 | |
| Total Health Care | | | | | | | 4,111,306 | |
See Notes to Financial Statements.
RiverFront Dynamic US Flex-Cap ETF
| Schedule of Investments | November 30, 2017 |
| Security Description | | Shares | | | Value | |
| Industrials (14.58%) | | | | | | |
| AO Smith Corp. | | | 910 | | | $ | 57,712 | |
| Boeing Co. | | | 2,118 | | | | 586,262 | |
| Brink's Co. | | | 5,037 | | | | 407,241 | |
| Carlisle Cos., Inc. | | | 1,208 | | | | 138,884 | |
| Curtiss-Wright Corp. | | | 4,140 | | | | 514,188 | |
| Delta Air Lines, Inc. | | | 3,875 | | | | 205,065 | |
| Engility Holdings, Inc.(a) | | | 3,153 | | | | 92,036 | |
| Hub Group, Inc., Class A(a) | | | 881 | | | | 42,112 | |
| JetBlue Airways Corp.(a) | | | 3,972 | | | | 85,279 | |
| L3 Technologies, Inc. | | | 1,329 | | | | 263,926 | |
| ManpowerGroup, Inc. | | | 788 | | | | 101,573 | |
| Regal Beloit Corp. | | | 609 | | | | 46,863 | |
| RR Donnelley & Sons Co. | | | 32,345 | | | | 303,720 | |
| Saia, Inc.(a) | | | 1,758 | | | | 115,676 | |
| Timken Co. | | | 20,182 | | | | 1,007,082 | |
| United Rentals, Inc.(a) | | | 10,076 | | | | 1,606,920 | |
| Waste Management, Inc. | | | 4,159 | | | | 342,078 | |
| Total Industrials | | | | | | | 5,916,617 | |
| | | | | | | | | |
| Information Technology (27.05%) | | | | | | | | |
| Adobe Systems, Inc.(a) | | | 2,003 | | | | 363,484 | |
| Alphabet, Inc., Class C(a) | | | 396 | | | | 404,478 | |
| Analog Devices, Inc. | | | 4,063 | | | | 349,865 | |
| Apple, Inc. | | | 8,560 | | | | 1,471,035 | |
| Applied Materials, Inc. | | | 9,263 | | | | 488,809 | |
| ARRIS International PLC(a) | | | 3,522 | | | | 105,554 | |
| Benchmark Electronics, Inc.(a) | | | 2,645 | | | | 80,673 | |
| Cognex Corp. | | | 3,566 | | | | 494,141 | |
| DHI Group, Inc.(a) | | | 12,256 | | | | 22,674 | |
| Diodes, Inc.(a) | | | 3,489 | | | | 102,228 | |
| DXC Technology Co. | | | 2,448 | | | | 235,351 | |
| Facebook, Inc., Class A(a) | | | 5,416 | | | | 959,606 | |
| IPG Photonics Corp.(a) | | | 2,161 | | | | 494,826 | |
| Lam Research Corp. | | | 2,641 | | | | 507,944 | |
| Manhattan Associates, Inc.(a) | | | 2,449 | | | | 108,613 | |
| Microchip Technology, Inc. | | | 2,886 | | | | 251,053 | |
| Micron Technology, Inc.(a) | | | 12,343 | | | | 523,220 | |
| Microsoft Corp. | | | 5,350 | | | | 450,310 | |
| MoneyGram International, Inc.(a) | | | 23,324 | | | | 332,134 | |
| NCR Corp.(a) | | | 2,522 | | | | 78,913 | |
| NetApp, Inc. | | | 5,188 | | | | 293,174 | |
| NETGEAR, Inc.(a) | | | 1,427 | | | | 73,491 | |
| NVIDIA Corp. | | | 2,245 | | | | 450,594 | |
| PayPal Holdings, Inc.(a) | | | 7,613 | | | | 576,531 | |
| Photronics, Inc.(a) | | | 10,448 | | | | 100,823 | |
| Skyworks Solutions, Inc. | | | 2,763 | | | | 289,397 | |
| Synchronoss Technologies, Inc.(a) | | | 9,407 | | | | 94,446 | |
| Take-Two Interactive Software, Inc.(a) | | | 3,827 | | | | 426,902 | |
| Tech Data Corp.(a) | | | 4,217 | | | | 407,784 | |
| TTM Technologies, Inc.(a) | | | 4,281 | | | | 69,909 | |
| Western Digital Corp. | | | 4,271 | | | | 336,811 | |
| Xperi Corp. | | | 1,733 | | | | 33,447 | |
| Total Information Technology | | | | | | | 10,978,220 | |
| Security Description | | Shares | | | Value | |
| Materials (1.79%) | | | | | | |
| Cabot Corp. | | | 2,992 | | | $ | 183,230 | |
| Greif, Inc., Class A | | | 1,703 | | | | 92,933 | |
| Koppers Holdings, Inc.(a) | | | 2,438 | | | | 121,656 | |
| Owens-Illinois, Inc.(a) | | | 9,253 | | | | 224,108 | |
| Scotts Miracle-Gro Co., Class A | | | 386 | | | | 38,175 | |
| TimkenSteel Corp.(a) | | | 4,329 | | | | 65,368 | |
| Total Materials | | | | | | | 725,470 | |
| | | | | | | | | |
| Real Estate (1.26%) | | | | | | | | |
| Jones Lang LaSalle, Inc. | | | 515 | | | | 78,532 | |
| LTC Properties, Inc. | | | 2,006 | | | | 91,955 | |
| Quality Care Properties, Inc.(a) | | | 10,908 | | | | 160,238 | |
| RMR Group, Inc., Class A | | | 1,375 | | | | 82,844 | |
| Washington Prime Group, Inc. | | | 13,562 | | | | 96,426 | |
| Total Real Estate | | | | | | | 509,995 | |
| | | | | | | | | |
| Telecommunication Services (2.01%) | | | | |
| AT&T, Inc. | | | 9,711 | | | | 353,286 | |
| Iridium Communications, Inc.(a)(b) | | | 4,789 | | | | 59,144 | |
| Telephone & Data Systems, Inc. | | | 2,681 | | | | 74,237 | |
| Verizon Communications, Inc. | | | 6,459 | | | | 328,699 | |
| Total Telecommunication Services | | | | | | | 815,366 | |
| | | | | | | | | |
| Utilities (1.39%) | | | | | | | | |
| Avangrid, Inc. | | | 928 | | | | 49,249 | |
| Consolidated Edison, Inc. | | | 1,448 | | | | 128,931 | |
| Dominion Energy, Inc. | | | 729 | | | | 61,331 | |
| Duke Energy Corp. | | | 1,045 | | | | 93,193 | |
| Great Plains Energy, Inc. | | | 1,787 | | | | 61,312 | |
| PG&E Corp. | | | 1,752 | | | | 95,028 | |
| Southern Co. | | | 1,457 | | | | 74,598 | |
| Total Utilities | | | | | | | 563,642 | |
| | | | | | | | | |
| TOTAL COMMON STOCKS | | | | | | | | |
| (Cost $35,607,310) | | | | | | | 40,508,038 | |
| Security Description | | 7 Day Yield | | | Shares | | | Value | |
| SHORT TERM INVESTMENTS (0.31%) | | | | | |
| Money Market Fund (0.03%) | | | | | | | | | |
| State Street Institutional Treasury Plus Money Market Fund | | | | | | | | | | | | |
| (Cost $14,031) | | | 0.970 | % | | | 14,031 | | | | 14,031 | |
| Investments Purchased with Collateral from Securities Loaned (0.28%) | | | | | |
| State Street Navigator Securities Lending Government Money Market Portfolio, 1.04% | | | | | | | | | | | | |
| (Cost 111,744) | | | 111,744 | | | | | | | | 111,744 | |
See Notes to Financial Statements.
RiverFront Dynamic US Flex-Cap ETF
| Schedule of Investments | November 30, 2017 |
| Security Description | | Shares | | | Value | |
| TOTAL SHORT TERM INVESTMENTS | | | | | |
| (Cost $125,775) | | | $ | 125,775 | |
| | | | | | | | | |
| TOTAL INVESTMENTS (100.14%) | | | | | |
| (Cost $35,733,085) | | | | | | $ | 40,633,813 | |
| | | | | | | | | |
| NET OTHER ASSETS AND LIABILITIES (-0.14%) | | | | (57,543 | ) |
| �� | | | | | | | | |
| NET ASSETS (100.00%) | | | $ | 40,576,270 | |
| (a) | Non income producing security. |
| (b) | Security, or a portion of the security position, is currently on loan. The total market value of securities on loan is $141,563. |
See Notes to Financial Statements.
RiverFront Strategic Income Fund
| Schedule of Investments | November 30, 2017 |
| Security Description | | Principal Amount | | | Value | |
| CORPORATE BONDS (91.71%) | | | | | | | | |
| Communications (10.26%) | | | | | | | | |
| CCO Holdings LLC / CCO Holdings Capital Corp. | | | | | | | | |
| 5.13%, 05/01/2027(a) | | $ | 3,400,000 | | | $ | 3,376,625 | |
| CenturyLink, Inc. | | | | | | | | |
| 5.63%, 04/01/2020 | | | 2,800,000 | | | | 2,817,500 | |
| DISH DBS Corp. | | | | | | | | |
| 7.88%, 09/01/2019 | | | 6,500,000 | | | | 6,972,615 | |
| Lamar Media Corp. | | | | | | | | |
| 5.00%, 05/01/2023 | | | 4,500,000 | | | | 4,657,500 | |
| 5.38%, 01/15/2024 | | | 500,000 | | | | 527,500 | |
| Sprint Communications, Inc. | | | | | | | | |
| 9.00%, 11/15/2018(a) | | | 1,113,000 | | | | 1,176,998 | |
| 7.00%, 08/15/2020 | | | 4,500,000 | | | | 4,815,000 | |
| T-Mobile USA, Inc. | | | | | | | | |
| 6.13%, 01/15/2022 | | | 2,000,000 | | | | 2,075,000 | |
| 6.50%, 01/15/2024 | | | 3,000,000 | | | | 3,191,250 | |
| VeriSign, Inc. | | | | | | | | |
| 5.25%, 04/01/2025 | | | 4,600,000 | | | | 5,031,250 | |
| Total Communications | | | | | | | 34,641,238 | |
| | | | | | | | | |
| Consumer Discretionary (14.69%) | | | | | | | | |
| ADT Corp. | | | | | | | | |
| 6.25%, 10/15/2021 | | | 5,390,000 | | | | 5,955,950 | |
| Aramark Services, Inc. | | | | | | | | |
| 5.13%, 01/15/2024 | | | 4,500,000 | | | | 4,758,750 | |
| DR Horton, Inc. | | | | | | | | |
| 4.38%, 09/15/2022 | | | 6,640,000 | | | | 7,034,321 | |
| Goodyear Tire & Rubber Co. | | | | | | | | |
| 5.13%, 11/15/2023 | | | 7,000,000 | | | | 7,279,999 | |
| Hanesbrands, Inc. | | | | | | | | |
| 4.63%, 05/15/2024(a) | | | 3,265,000 | | | | 3,342,544 | |
| Hilton Worldwide Finance LLC / Hilton Worldwide Finance Corp. | | | | | | | | |
| 4.63%, 04/01/2025 | | | 5,050,000 | | | | 5,233,063 | |
| International Game Technology PLC | | | | | | | | |
| 6.25%, 02/15/2022(a) | | | 4,000,000 | | | | 4,385,000 | |
| KFC Holding Co. / Pizza Hut Holdings LLC / Taco Bell of America LLC | | | | | | | | |
| 5.00%, 06/01/2024(a) | | | 5,087,000 | | | | 5,341,350 | |
| Scotts Miracle-Gro Co. | | | | | | | | |
| 6.00%, 10/15/2023 | | | 581,000 | | | | 620,944 | |
| 5.25%, 12/15/2026 | | | 783,000 | | | | 827,044 | |
| Service Corp. International | | | | | | | | |
| 5.38%, 01/15/2022 | | | 3,000,000 | | | | 3,084,375 | |
| 5.38%, 05/15/2024 | | | 1,675,000 | | | | 1,769,219 | |
| Total Consumer Discretionary | | | | | | | 49,632,559 | |
| | | | | | | | | |
| Consumer Staples (7.39%) | | | | | | | | |
| Dollar Tree, Inc. | | | | | | | | |
| 5.75%, 03/01/2023 | | | 6,000,000 | | | | 6,307,500 | |
| Security Description | | Principal Amount | | | Value | |
| Consumer Staples (continued) | | | | | | | | |
| Pinnacle Foods Finance LLC / Pinnacle Foods Finance Corp. | | | | | | | | |
| 4.88%, 05/01/2021 | | $ | 1,400,000 | | | $ | 1,428,000 | |
| 5.88%, 01/15/2024 | | | 6,189,000 | | | | 6,591,285 | |
| Spectrum Brands, Inc. | | | | | | | | |
| 5.75%, 07/15/2025 | | | 5,100,000 | | | | 5,380,500 | |
| TreeHouse Foods, Inc. | | | | | | | | |
| 6.00%, 02/15/2024(a) | | | 5,000,000 | | | | 5,256,250 | |
| Total Consumer Staples | | | | | | | 24,963,535 | |
| | | | | | | | | |
| Energy (14.81%) | | | | | | | | |
| Andeavor | | | | | | | | |
| 5.38%, 10/01/2022 | | | 8,044,000 | | | | 8,262,700 | |
| Andeavor Logistics LP / Tesoro Logistics Finance Corp. | | | | | | | | |
| 5.88%, 10/01/2020 | | | 1,585,000 | | | | 1,610,855 | |
| 6.13%, 10/15/2021 | | | 1,000,000 | | | | 1,030,630 | |
| Cheniere Corpus Christi Holdings LLC | | | | | | | | |
| 7.00%, 06/30/2024 | | | 3,396,000 | | | | 3,871,440 | |
| Concho Resources, Inc. | | | | | | | | |
| 4.38%, 01/15/2025 | | | 4,000,000 | | | | 4,175,000 | |
| Continental Resources, Inc. | | | | | | | | |
| 5.00%, 09/15/2022 | | | 4,200,000 | | | | 4,294,500 | |
| DCP Midstream Operating LP | | | | | | | | |
| 5.35%, 03/15/2020(a) | | | 4,550,000 | | | | 4,732,000 | |
| Kinder Morgan Energy Partners LP | | | | | | | | |
| 5.00%, 10/01/2021 | | | 6,500,000 | | | | 6,945,678 | |
| MPLX LP | | | | | | | | |
| 5.50%, 02/15/2023 | | | 2,000,000 | | | | 2,060,082 | |
| Newfield Exploration Co. | | | | | | | | |
| 5.75%, 01/30/2022 | | | 7,000,000 | | | | 7,516,250 | |
| Range Resources Corp. | | | | | | | | |
| 5.75%, 06/01/2021 | | | 1,490,000 | | | | 1,549,600 | |
| 5.00%, 08/15/2022 | | | 510,000 | | | | 510,638 | |
| Southwestern Energy Co. | | | | | | | | |
| 4.10%, 03/15/2022 | | | 1,200,000 | | | | 1,185,000 | |
| Targa Resources Partners LP / Targa | | | | | | | | |
| Resources Partners Finance Corp. | | | | | | | | |
| 5.25%, 05/01/2023 | | | 2,140,000 | | | | 2,198,850 | |
| 6.75%, 03/15/2024 | | | 84,000 | | | | 90,615 | |
| Total Energy | | | | | | | 50,033,838 | |
| | | | | | | | | |
| Financials (8.46%) | | | | | | | | |
| AerCap Ireland Capital DAC / AerCap | | | | | | | | |
| Global Aviation Trust | | | | | | | | |
| 4.63%, 10/30/2020 | | | 3,881,000 | | | | 4,084,315 | |
| Aircastle, Ltd. | | | | | | | | |
| 6.25%, 12/01/2019 | | | 3,000,000 | | | | 3,196,500 | |
| 5.13%, 03/15/2021 | | | 2,000,000 | | | | 2,125,000 | |
| Ally Financial, Inc. | | | | | | | | |
| 4.75%, 09/10/2018 | | | 3,200,000 | | | | 3,256,000 | |
| 4.25%, 04/15/2021 | | | 1,000,000 | | | | 1,038,750 | |
See Notes to Financial Statements.
RiverFront Strategic Income Fund
| Schedule of Investments | November 30, 2017 |
| Security Description | | Principal Amount | | | Value | |
| Financials (continued) | | | | | | | | |
| CIT Group, Inc. | | | | | | | | |
| 5.00%, 08/15/2022 | | $ | 3,600,000 | | | $ | 3,856,500 | |
| iStar, Inc. | | | | | | | | |
| 4.63%, 09/15/2020 | | | 1,150,000 | | | | 1,170,125 | |
| Navient Corp. | | | | | | | | |
| 8.45%, 06/15/2018 | | | 900,000 | | | | 930,150 | |
| 5.50%, 01/15/2019 | | | 2,900,000 | | | | 2,978,300 | |
| Park Aerospace Holdings, Ltd. | | | | | | | | |
| 5.25%, 08/15/2022(a) | | | 5,800,000 | | | | 5,952,250 | |
| Total Financials | | | | | | | 28,587,890 | |
| | | | | | | | | |
| Health Care (4.09%) | | | | | | | | |
| DaVita, Inc. | | | | | | | | |
| 5.75%, 08/15/2022 | | | 4,000,000 | | | | 4,124,500 | |
| HCA, Inc. | | | | | | | | |
| 5.88%, 03/15/2022 | | | 4,100,000 | | | | 4,453,625 | |
| Hologic, Inc. | | | | | | | | |
| 5.25%, 07/15/2022(a) | | | 5,000,000 | | | | 5,237,500 | |
| Total Health Care | | | | | | | 13,815,625 | |
| | | | | | | | | |
| Industrials (5.59%) | | | | | | | | |
| United Rentals North America, Inc. | | | | | | | | |
| 5.75%, 11/15/2024 | | | 4,500,000 | | | | 4,764,375 | |
| WESCO Distribution, Inc. | | | | | | | | |
| 5.38%, 12/15/2021 | | | 8,750,000 | | | | 8,979,688 | |
| XPO Logistics, Inc. | | | | | | | | |
| 6.50%, 06/15/2022(a) | | | 4,900,000 | | | | 5,138,875 | |
| Total Industrials | | | | | | | 18,882,938 | |
| | | | | | | | | |
| Materials (20.23%) | | | | | | | | |
| AK Steel Corp. | | | | | | | | |
| 7.50%, 07/15/2023 | | | 3,000,000 | | | | 3,270,000 | |
| Ashland LLC | | | | | | | | |
| 4.75%, 08/15/2022 | | | 4,300,000 | | | | 4,493,500 | |
| Ball Corp. | | | | | | | | |
| 5.00%, 03/15/2022 | | | 7,606,000 | | | | 8,195,464 | |
| Cascades, Inc. | | | | | | | | |
| 5.50%, 07/15/2022(a) | | | 4,889,000 | | | | 5,066,226 | |
| 5.75%, 07/15/2023(a) | | | 1,000,000 | | | | 1,055,000 | |
| Celanese US Holdings LLC | | | | | | | | |
| 5.88%, 06/15/2021 | | | 6,920,000 | | | | 7,607,858 | |
| Crown Americas LLC / Crown Americas Capital Corp. IV | | | | | | | | |
| 4.50%, 01/15/2023 | | | 1,323,000 | | | | 1,384,784 | |
| Glencore Funding LLC | | | | | | | | |
| 4.63%, 04/29/2024(a) | | | 1,000,000 | | | | 1,054,355 | |
| Graphic Packaging International, Inc. | | | | | | | | |
| 4.75%, 04/15/2021 | | | 645,000 | | | | 680,798 | |
| 4.88%, 11/15/2022 | | | 4,615,000 | | | | 4,932,281 | |
| 4.13%, 08/15/2024 | | | 500,000 | | | | 523,750 | |
| Huntsman International LLC | | | | | | | | |
| 4.88%, 11/15/2020 | | | 6,000,000 | | | | 6,300,000 | |
| Security Description | | Principal Amount | | | Value | |
| Materials (continued) | | | | | | | | |
| Owens-Brockway Glass Container, Inc. | | | | | | | | |
| 5.00%, 01/15/2022(a) | | $ | 6,145,000 | | | $ | 6,467,613 | |
| Silgan Holdings, Inc. | | | | | | | | |
| 5.00%, 04/01/2020 | | | 4,332,000 | | | | 4,364,490 | |
| 4.75%, 03/15/2025(a) | | | 2,176,000 | | | | 2,241,280 | |
| Steel Dynamics, Inc. | | | | | | | | |
| 4.13%, 09/15/2025(a) | | | 1,910,000 | | | | 1,919,550 | |
| USG Corp. | | | | | | | | |
| 5.50%, 03/01/2025(a) | | | 4,034,000 | | | | 4,331,508 | |
| Vale Overseas, Ltd. | | | | | | | | |
| 5.88%, 06/10/2021 | | | 4,000,000 | | | | 4,395,000 | |
| Total Materials | | | | | | | 68,283,457 | |
| | | | | | | | | |
| Technology (3.35%) | | | | | | | | |
| Flex, Ltd. | | | | | | | | |
| 5.00%, 02/15/2023 | | | 5,682,000 | | | | 6,108,854 | |
| SS&C Technologies Holdings, Inc. | | | | | | | | |
| 5.88%, 07/15/2023 | | | 4,900,000 | | | | 5,206,250 | |
| Total Technology | | | | | | | 11,315,104 | |
| | | | | | | | | |
| Utilities (2.84%) | | | | | | | | |
| AES Corp. | | | | | | | | |
| 8.00%, 06/01/2020 | | | 1,121,000 | | | | 1,275,138 | |
| 5.50%, 03/15/2024 | | | 3,900,000 | | | | 4,104,750 | |
| AmeriGas Partners LP / AmeriGas Finance Corp. | | | | | | | | |
| 5.63%, 05/20/2024 | | | 4,025,000 | | | | 4,226,250 | |
| Total Utilities | | | | | | | 9,606,138 | |
| | | | | | | | | |
| TOTAL CORPORATE BONDS | | | | | | | | |
| (Cost $302,664,997) | | | | | | | 309,762,322 | |
| | | | | | | | | |
| GOVERNMENT BONDS (2.89%) | | | | | | | | |
| United States Treasury Inflation Indexed Bonds | | | | | | | | |
| 2.13%, 02/15/2040 | | | 7,706,745 | | | | 9,767,559 | |
| | | | | | | | | |
| TOTAL GOVERNMENT BONDS | | | | | | | | |
| (Cost $9,413,720) | | | | | | | 9,767,559 | |
| Security Description | | 7 Day Yield | | | Shares | | | Value | |
| SHORT TERM INVESTMENTS (4.16%) | | | | | |
| State Street Institutional Treasury Plus Money Market Fund | | | | | | | | | | | | |
| (Cost $14,040,524) | | | 0.970 | % | | | 14,056,480 | | | | 14,040,524 | |
| | | | | | | | | | | | | |
| TOTAL SHORT TERM INVESTMENTS | | | | | |
| (Cost $14,040,524) | | | | | | | | | | | 14,040,524 | |
See Notes to Financial Statements.
RiverFront Strategic Income Fund
| Schedule of Investments | November 30, 2017 |
| Security Description | | Value | |
| TOTAL INVESTMENTS (98.76%) | | | | |
| (Cost $326,119,241) | | $ | 333,570,405 | |
| | | | | |
| NET OTHER ASSETS AND LIABILITIES (1.24%) | | | 4,198,861 | |
| | | | | |
| NET ASSETS (100.00%) | | $ | 337,769,266 | |
| (a) | Securities exempt from registration under Rule 144A of the Securities Act of 1933. These securities may be sold in the ordinary course of business in transactions exempt from registration, normally to qualified institutional buyers. At period end, the aggregate market value of those securities was $66,074,924, representing 19.56% of net assets. |
See Notes to Financial Statements.
| Statement of Assets and Liabilities | November 30, 2017 |
| | | RiverFront Dynamic Core Income ETF | | | RiverFront Dynamic Unconstrained Income ETF | | | RiverFront Dynamic US Dividend Advantage ETF | | | RiverFront Dynamic US Flex-Cap ETF | | | RiverFront Strategic Income Fund | |
| ASSETS: | | | | | | | | | | | | | | | |
| Investments, at value | | $ | 47,578,226 | | | $ | 11,608,135 | | | $ | 59,493,374 | | | $ | 40,633,813 | | | $ | 333,570,405 | |
| Cash | | | – | | | | 485 | | | | – | | | | – | | | | 6,000 | |
| Interest receivable | | | 403,182 | | | | 155,612 | | | | – | | | | – | | | | 4,337,201 | |
| Dividend receivable | | | – | | | | – | | | | 190,359 | | | | 70,431 | | | | – | |
| Total Assets | | | 47,981,408 | | | | 11,764,232 | | | | 59,683,733 | | | | 40,704,244 | | | | 337,913,606 | |
| | | | | | | | | | | | | | | | | | | | | |
| LIABILITIES: | | | | | | | | | | | | | | | | | | | | |
| Payable to adviser | | | 19,706 | | | | 4,931 | | | | 23,955 | | | | 16,230 | | | | 44,007 | |
| Payable for investments purchased | | | – | | | | – | | | | 371 | | | | – | | | | 100,333 | |
| Due to custodian | | | – | | | | – | | | | 15,462 | | | | – | | | | – | |
| Payable for collateral upon return of securities loaned | | | – | | | | – | | | | – | | | | 111,744 | | | | – | |
| Total Liabilities | | | 19,706 | | | | 4,931 | | | | 39,788 | | | | 127,974 | | | | 144,340 | |
| NET ASSETS | | $ | 47,961,702 | | | $ | 11,759,301 | | | $ | 59,643,945 | | | $ | 40,576,270 | | | $ | 337,769,266 | |
| | | | | | | | | | | | | | | | | | | | | |
| NET ASSETS CONSIST OF: | | | | | | | | | | | | | | | | | | | | |
| Paid-in capital | | $ | 47,984,472 | | | $ | 11,557,291 | | | $ | 53,825,109 | | | $ | 36,655,503 | | | $ | 338,765,299 | |
| Accumulated net investment income | | | 8,013 | | | | 1,356 | | | | 25,697 | | | | 17,211 | | | | 35,631 | |
| Accumulated net realized gain/(loss) | | | (75,875 | ) | | | 39,064 | | | | (599,836 | ) | | | (997,172 | ) | | | (8,482,828 | ) |
| Net unrealized appreciation | | | 45,092 | | | | 161,590 | | | | 6,392,975 | | | | 4,900,728 | | | | 7,451,164 | |
| NET ASSETS | | $ | 47,961,702 | | | $ | 11,759,301 | | | $ | 59,643,945 | | | $ | 40,576,270 | | | $ | 337,769,266 | |
| | | | | | | | | | | | | | | | | | | | | |
| INVESTMENTS, AT COST | | $ | 47,533,134 | | | $ | 11,446,545 | | | $ | 53,100,399 | | | $ | 35,733,085 | | | $ | 326,119,241 | |
| | | | | | | | | | | | | | | | | | | | | |
| PRICING OF SHARES | | | | | | | | | | | | | | | | | | | | |
| Net Assets | | $ | 47,961,702 | | | $ | 11,759,301 | | | $ | 59,643,945 | | | $ | 40,576,270 | | | $ | 337,769,266 | |
| Shares of beneficial interest outstanding (Unlimited number of shares authorized, par value $0.01 per share) | | | 1,950,000 | | | | 450,000 | | | | 1,900,002 | | | | 1,250,002 | | | | 13,400,000 | |
| Net Asset Value, offering and redemption price per share | | $ | 24.60 | | | $ | 26.13 | | | $ | 31.39 | | | $ | 32.46 | | | $ | 25.21 | |
See Notes to Financial Statements.
| Statement of Operations | For the Year Ended November 30, 2017 |
| | | RiverFront Dynamic Core Income ETF | | | RiverFront Dynamic Unconstrained Income ETF | | | RiverFront Dynamic US Dividend Advantage ETF | | | RiverFront Dynamic US Flex-Cap ETF | | | RiverFront Strategic Income Fund | |
| INVESTMENT INCOME: | | | | | | | | | | | | | | | |
| Interest | | $ | 764,938 | | | $ | 450,997 | | | $ | – | | | $ | – | | | $ | 14,433,683 | |
| Dividends(a) | | | 13,662 | | | | 3,130 | | | | 958,235 | | | | 393,409 | | | | 145,742 | |
| Securities Lending Income | | | – | | | | – | | | | 461 | | | | 11,801 | | | | – | |
| Total Investment Income | | | 778,600 | | | | 454,127 | | | | 958,696 | | | | 405,210 | | | | 14,579,425 | |
| | | | | | | | | | | | | | | | | | | | | |
| EXPENSES: | | | | | | | | | | | | | | | | | | | | |
| Investment adviser and sub-adviser fees (note 3) | | | 149,192 | | | | 44,857 | | | | 184,210 | | | | 134,175 | | | | 1,466,870 | |
| Total Expenses before waiver/reimbursement | | | 149,192 | | | | 44,857 | | | | 184,210 | | | | 134,175 | | | | 1,466,870 | |
| Less fees waived/reimbursed by sub-adviser (note 3) | | | – | | | | – | | | | – | | | | – | | | | (956,629 | ) |
| Net Expenses | | | 149,192 | | | | 44,857 | | | | 184,210 | | | | 134,175 | | | | 510,241 | |
| NET INVESTMENT INCOME | | | 629,408 | | | | 409,270 | | | | 774,486 | | | | 271,035 | | | | 14,069,184 | |
| | | | | | | | | | | | | | | | | | | | | |
| REALIZED AND UNREALIZED GAIN/(LOSS) | | | | | | | | | | | | | | | | | | | | |
| Net realized gain/(loss) on investments | | | (27,864 | ) | | | 40,613 | | | | 553,688 | | | | 210,734 | | | | 1,790,752 | |
| Net realized loss on foreign currency transactions | | | – | | | | – | | | | – | | | | (78 | ) | | | – | |
| NET REALIZED GAIN/(LOSS) | | | (27,864 | ) | | | 40,613 | | | | 553,688 | | | | 210,656 | | | | 1,790,752 | |
| Net change in unrealized appreciation on investments | | | 168,683 | | | | 43,582 | | | | 5,893,754 | | | | 4,586,568 | | | | 136,438 | |
| Net change in unrealized appreciation on translation of assets and liabilities denominated in foreign currencies | | | – | | | | – | | | | – | | | | 5 | | | | – | |
| NET CHANGE IN UNREALIZED APPRECIATION | | | 168,683 | | | | 43,582 | | | | 5,893,754 | | | | 4,586,573 | | | | 136,438 | |
| NET REALIZED AND UNREALIZED GAIN ON INVESTMENTS | | | 140,819 | | | | 84,195 | | | | 6,447,442 | | | | 4,797,229 | | | | 1,927,190 | |
| NET INCREASE IN NET ASSETS RESULTING FROM OPERATIONS | | $ | 770,227 | | | $ | 493,465 | | | $ | 7,221,928 | | | $ | 5,068,264 | | | $ | 15,996,374 | |
| (a) | Net of foreign tax withholding in the amounts of $330, $0, $641, $295 and $0 respectively. |
See Notes to Financial Statements.
| RiverFront Dynamic Core Income ETF |
| Statements of Changes in Net Assets |
| | | For the Year Ended November 30, 2017 | | | For the Period June 14, 2016 (Commencement) to November 30, 2016 | |
| OPERATIONS: | | | | | | |
| Net investment income | | $ | 629,408 | | | $ | 33,215 | |
| Net realized loss | | | (27,864 | ) | | | (47,984 | ) |
| Net change in unrealized appreciation/(depreciation) | | | 168,683 | | | | (123,591 | ) |
| Net Increase/(Decrease) in net assets resulting from operations | | | 770,227 | | | | (138,360 | ) |
| | | | | | | | | |
| DISTRIBUTIONS TO SHAREHOLDERS: | | | | | | | | |
| From net investment income | | | (621,587 | ) | | | (33,050 | ) |
| Total distributions | | | (621,587 | ) | | | (33,050 | ) |
| | | | | | | | | |
| CAPITAL SHARE TRANSACTIONS: | | | | | | | | |
| Proceeds from sale of shares | | | 41,731,911 | | | | 6,252,561 | |
| Net increase from share transactions | | | 41,731,911 | | | | 6,252,561 | |
| | | | | | | | | |
| Net increase in net assets | | | 41,880,551 | | | | 6,081,151 | |
| | | | | | | | | |
| NET ASSETS: | | | | | | | | |
| Beginning of period | | | 6,081,151 | | | | – | |
| End of period* | | $ | 47,961,702 | | | $ | 6,081,151 | |
| | | | | | | | | |
| *Including accumulated net investment income of: | | $ | 8,013 | | | $ | 192 | |
| | | | | | | | | |
| OTHER INFORMATION: | | | | | | | | |
| CAPITAL SHARE TRANSACTIONS: | | | | | | | | |
| Beginning shares | | | 250,000 | | | | – | |
| Shares sold | | | 1,700,000 | | | | 250,000 | |
| Shares redeemed | | | – | | | | – | |
| Shares outstanding, end of period | | | 1,950,000 | | | | 250,000 | |
See Notes to Financial Statements.
| RiverFront Dynamic Unconstrained Income ETF |
| Statements of Changes in Net Assets |
| | | For the Year Ended November 30, 2017 | | | For the Period June 14, 2016 (Commencement) to November 30, 2016 | |
| OPERATIONS: | | | | | | |
| Net investment income | | $ | 409,270 | | | $ | 126,700 | |
| Net realized gain/(loss) | | | 40,613 | | | | (8,757 | ) |
| Net change in unrealized appreciation | | | 43,582 | | | | 118,008 | |
| Net increase in net assets resulting from operations | | | 493,465 | | | | 235,951 | |
| | | | | | | | | |
| DISTRIBUTIONS TO SHAREHOLDERS: | | | | | | | | |
| From net investment income | | | (408,541 | ) | | | (126,123 | ) |
| Total distributions | | | (408,541 | ) | | | (126,123 | ) |
| | | | | | | | | |
| CAPITAL SHARE TRANSACTIONS: | | | | | | | | |
| Proceeds from sale of shares | | | 9,141,531 | | | | 5,000,000 | |
| Shares redeemed | | | (2,576,982 | ) | | | – | |
| Net increase from share transactions | | | 6,564,549 | | | | 5,000,000 | |
| | | | | | | | | |
| Net increase in net assets | | | 6,649,473 | | | | 5,109,828 | |
| | | | | | | | | |
| NET ASSETS: | | | | | | | | |
| Beginning of period | | | 5,109,828 | | | | – | |
| End of period* | | $ | 11,759,301 | | | $ | 5,109,828 | |
| | | | | | | | | |
| *Including accumulated net investment income of: | | $ | 1,356 | | | $ | 627 | |
| | | | | | | | | |
| OTHER INFORMATION: | | | | | | | | |
| CAPITAL SHARE TRANSACTIONS: | | | | | | | | |
| Beginning shares | | | 200,000 | | | | – | |
| Shares sold | | | 350,000 | | | | 200,000 | |
| Shares redeemed | | | (100,000 | ) | | | – | |
| Shares outstanding, end of period | | | 450,000 | | | | 200,000 | |
See Notes to Financial Statements
| RiverFront Dynamic US Dividend Advantage ETF |
| Statements of Changes in Net Assets |
| | | For the Year Ended November 30, 2017 | | | For the Period June 7, 2016 (Commencement) to November 30, 2016 | |
| OPERATIONS: | | | | | | |
| Net investment income | | $ | 774,486 | | | $ | 73,653 | |
| Net realized gain/(loss) | | | 553,688 | | | | (22,926 | ) |
| Net change in unrealized appreciation | | | 5,893,754 | | | | 499,221 | |
| Net increase in net assets resulting from operations | | | 7,221,928 | | | | 549,948 | |
| | | | | | | | | |
| DISTRIBUTIONS TO SHAREHOLDERS: | | | | | | | | |
| From net investment income | | | (753,106 | ) | | | (71,278 | ) |
| Total distributions | | | (753,106 | ) | | | (71,278 | ) |
| | | | | | | | | |
| CAPITAL SHARE TRANSACTIONS: | | | | | | | | |
| Proceeds from sale of shares | | | 49,651,673 | | | | 14,111,104 | |
| Shares redeemed | | | (9,773,232 | ) | | | (1,293,092 | ) |
| Net increase from share transactions | | | 39,878,441 | | | | 12,818,012 | |
| | | | | | | | | |
| Net increase in net assets | | | 46,347,263 | | | | 13,296,682 | |
| | | | | | | | | |
| NET ASSETS: | | | | | | | | |
| Beginning of period | | | 13,296,682 | | | | – | |
| End of period* | | $ | 59,643,945 | | | $ | 13,296,682 | |
| | | | | | | | | |
| *Including accumulated net investment income of: | | $ | 25,697 | | | $ | 2,375 | |
| | | | | | | | | |
| OTHER INFORMATION: | | | | | | | | |
| CAPITAL SHARE TRANSACTIONS: | | | | | | | | |
| Beginning shares | | | 500,002 | | | | – | |
| Shares sold | | | 1,750,000 | | | | 550,002 | |
| Shares redeemed | | | (350,000 | ) | | | (50,000 | ) |
| Shares outstanding, end of period | | | 1,900,002 | | | | 500,002 | |
See Notes to Financial Statements.
| RiverFront Dynamic US Flex-Cap ETF |
| Statements of Changes in Net Assets |
| | | For the Year Ended November 30, 2017 | | | For the Period June 7, 2016 (Commencement) to November 30, 2016 | |
| OPERATIONS: | | | | | | |
| Net investment income | | $ | 271,035 | | | $ | 34,328 | |
| Net realized gain | | | 210,656 | | | | 29,610 | |
| Net change in unrealized appreciation | | | 4,586,573 | | | | 314,155 | |
| Net increase in net assets resulting from operations | | | 5,068,264 | | | | 378,093 | |
| | | | | | | | | |
| DISTRIBUTIONS TO SHAREHOLDERS: | | | | | | | | |
| From net investment income | | | (254,258 | ) | | | (34,580 | ) |
| Total distributions | | | (254,258 | ) | | | (34,580 | ) |
| | | | | | | | | |
| CAPITAL SHARE TRANSACTIONS: | | | | | | | | |
| Proceeds from sale of shares | | | 36,346,437 | | | | 10,289,247 | |
| Shares redeemed | | | (8,637,056 | ) | | | (2,579,877 | ) |
| Net increase from share transactions | | | 27,709,381 | | | | 7,709,370 | |
| | | | | | | | | |
| Net increase in net assets | | | 32,523,387 | | | | 8,052,883 | |
| | | | | | | | | |
| NET ASSETS: | | | | | | | | |
| Beginning of period | | | 8,052,883 | | | | – | |
| End of period* | | $ | 40,576,270 | | | $ | 8,052,883 | |
| | | | | | | | | |
| *Including accumulated net investment income of: | | $ | 17,211 | | | $ | – | |
| | | | | | | | | |
| OTHER INFORMATION: | | | | | | | | |
| CAPITAL SHARE TRANSACTIONS: | | | | | | | | |
| Beginning shares | | | 300,002 | | | | – | |
| Shares sold | | | 1,250,000 | | | | 400,002 | |
| Shares redeemed | | | (300,000 | ) | | | (100,000 | ) |
| Shares outstanding, end of period | | | 1,250,002 | | | | 300,002 | |
See Notes to Financial Statements.
| RiverFront Strategic Income Fund |
| Statements of Changes in Net Assets |
| | | For the Year Ended November 30, 2017 | | | For the Year Ended November 30, 2016 | |
| OPERATIONS: | | | | | | |
| Net investment income | | $ | 14,069,184 | | | $ | 16,277,993 | |
| Net realized gain/(loss) | | | 1,790,752 | | | | (1,305,008 | ) |
| Net change in unrealized appreciation | | | 136,438 | | | | 13,124,646 | |
| Net increase in net assets resulting from operations | | | 15,996,374 | | | | 28,097,631 | |
| | | | | | | | | |
| DISTRIBUTIONS TO SHAREHOLDERS: | | | | | | | | |
| From net investment income | | | (14,055,252 | ) | | | (16,281,197 | ) |
| Total distributions | | | (14,055,252 | ) | | | (16,281,197 | ) |
| | | | | | | | | |
| CAPITAL SHARE TRANSACTIONS: | | | | | | | | |
| Proceeds from sale of shares | | | 49,315,186 | | | | 106,134,969 | |
| Shares redeemed | | | (40,002,027 | ) | | | (255,443,492 | ) |
| Net increase/(decrease) from share transactions | | | 9,313,159 | | | | (149,308,523 | ) |
| | | | | | | | | |
| Net increase/(decrease) in net assets | | | 11,254,281 | | | | (137,492,089 | ) |
| | | | | | | | | |
| NET ASSETS: | | | | | | | | |
| Beginning of period | | | 326,514,985 | | | | 464,007,074 | |
| End of period* | | $ | 337,769,266 | | | $ | 326,514,985 | |
| | | | | | | | | |
| *Including accumulated net investment income of: | | $ | 35,631 | | | $ | 21,699 | |
| | | | | | | | | |
| OTHER INFORMATION: | | | | | | | | |
| CAPITAL SHARE TRANSACTIONS: | | | | | | | | |
| Beginning shares | | | 13,050,000 | | | | 19,050,000 | |
| Shares sold | | | 1,950,000 | | | | 4,400,000 | |
| Shares redeemed | | | (1,600,000 | ) | | | (10,400,000 | ) |
| Shares outstanding, end of period | | | 13,400,000 | | | | 13,050,000 | |
See Notes to Financial Statements.
RiverFront Dynamic Core Income ETF
| Financial Highlights | For a share outstanding throughout the periods presented |
| | | For the Year Ended November 30, 2017 | | | For the Period June 14, 2016 (Commencement) to November 30, 2016 | |
| NET ASSET VALUE, BEGINNING OF PERIOD | | $ | 24.32 | | | $ | 25.00 | |
| | | | | | | | | |
| INCOME/(LOSS) FROM INVESTMENT OPERATIONS: | | | | | | | | |
| Net investment income(a) | | | 0.53 | | | | 0.24 | |
| Net realized and unrealized gain/(loss) | | | 0.23 | | | | (0.68 | ) |
| Total from investment operations | | | 0.76 | | | | (0.44 | ) |
| | | | | | | | | |
| DISTRIBUTIONS: | | | | | | | | |
| From net investment income | | | (0.48 | ) | | | (0.24 | ) |
| Total distributions | | | (0.48 | ) | | | (0.24 | ) |
| | | | | | | | | |
| NET INCREASE/(DECREASE) IN NET ASSET VALUE | | | 0.28 | | | | (0.68 | ) |
| NET ASSET VALUE, END OF PERIOD | | $ | 24.60 | | | $ | 24.32 | |
| TOTAL RETURN(b) | | | 3.15 | % | | | (1.77 | )% |
| | | | | | | | | |
| RATIOS/SUPPLEMENTAL DATA: | | | | | | | | |
| Net assets, end of period (000s) | | $ | 47,962 | | | $ | 6,081 | |
| | | | | | | | | |
| Ratio of expenses excluding waiver/reimbursement to average net assets | | | 0.51 | % | | | 0.51 | %(c) |
| Ratio of expenses including waiver/reimbursement to average net assets | | | 0.51 | % | | | 0.51 | %(c) |
| Ratio of net investment income including expenses waiver/reimbursement to average net assets | | | 2.15 | % | | | 2.12 | %(c) |
| Portfolio turnover rate(d) | | | 18 | % | | | 26 | % |
| (a) | Based on average shares outstanding during the period. |
| (b) | Total return is calculated assuming an initial investment made at the net asset value at the beginning of the period and the redemption at the net asset value on the last day of the period and assuming all distributions are reinvested at the actual reinvestment prices. Total return calculated for a period of less than one year is not annualized. |
| (d) | Portfolio turnover for periods less than one year are not annualized and does not include securities received or delivered from processing creations or redemptions in-kind. |
See Notes to Financial Statements.
| RiverFront Dynamic Unconstrained Income ETF | |
| Financial Highlights | For a share outstanding throughout the periods presented |
| | | For the Year Ended November 30, 2017 | | | For the Period June 14, 2016 (Commencement) to November 30, 2016 | |
| NET ASSET VALUE, BEGINNING OF PERIOD | | $ | 25.55 | | | $ | 25.00 | |
| | | | | | | | | |
| INCOME/(LOSS) FROM INVESTMENT OPERATIONS: | | | | | | | | |
| Net investment income(a) | | | 1.22 | | | | 0.63 | |
| Net realized and unrealized gain | | | 0.56 | | | | 0.55 | |
| Total from investment operations | | | 1.78 | | | | 1.18 | |
| | | | | | | | | |
| DISTRIBUTIONS: | | | | | | | | |
| From net investment income | | | (1.20 | ) | | | (0.63 | ) |
| Total distributions | | | (1.20 | ) | | | (0.63 | ) |
| | | | | | | | | |
| NET INCREASE IN NET ASSET VALUE | | | 0.58 | | | | 0.55 | |
| NET ASSET VALUE, END OF PERIOD | | $ | 26.13 | | | $ | 25.55 | |
| TOTAL RETURN(b) | | | 7.06 | % | | | 4.72 | % |
| | | | | | | | | |
| RATIOS/SUPPLEMENTAL DATA: | | | | | | | | |
| Net assets, end of period (000s) | | $ | 11,759 | | | $ | 5,110 | |
| | | | | | | | | |
| Ratio of expenses excluding waiver/reimbursement to average net assets | | | 0.51 | % | | | 0.51 | %(c) |
| Ratio of expenses including waiver/reimbursement to average net assets | | | 0.51 | % | | | 0.51 | %(c) |
| Ratio of net investment income including expenses waiver/reimbursement to average net assets | | | 4.65 | % | | | 5.31 | %(c) |
| Portfolio turnover rate(d) | | | 30 | % | | | 11 | % |
| (a) | Based on average shares outstanding during the period. |
| (b) | Total return is calculated assuming an initial investment made at the net asset value at the beginning of the period and the redemption at the net asset value on the last day of the period and assuming all distributions are reinvested at the actual reinvestment prices. Total return calculated for a period of less than one year is not annualized. |
| (d) | Portfolio turnover for periods less than one year are not annualized and does not include securities received or delivered from processing creations or redemptions in-kind. |
See Notes to Financial Statements.
| RiverFront Dynamic US Dividend Advantage ETF | |
| Financial Highlights | For a share outstanding throughout the periods presented |
| | | For the Year Ended November 30, 2017 | | | For the Period June 7, 2016 (Commencement) to November 30, 2016 | |
| NET ASSET VALUE, BEGINNING OF PERIOD | | $ | 26.59 | | | $ | 25.14 | |
| | | | | | | | | |
| INCOME/(LOSS) FROM INVESTMENT OPERATIONS: | | | | | | | | |
| Net investment income(a) | | | 0.63 | | | | 0.26 | |
| Net realized and unrealized gain | | | 4.76 | | | | 1.40 | |
| Total from investment operations | | | 5.39 | | | | 1.66 | |
| | | | | | | | | |
| DISTRIBUTIONS: | | | | | | | | |
| From net investment income | | | (0.59 | ) | | | (0.21 | ) |
| Total distributions | | | (0.59 | ) | | | (0.21 | ) |
| | | | | | | | | |
| NET INCREASE IN NET ASSET VALUE | | | 4.80 | | | | 1.45 | |
| NET ASSET VALUE, END OF PERIOD | | $ | 31.39 | | | $ | 26.59 | |
| TOTAL RETURN(b) | | | 20.49 | % | | | 6.64 | % |
| | | | | | | | | |
| RATIOS/SUPPLEMENTAL DATA: | | | | | | | | |
| Net assets, end of period (000s) | | $ | 59,644 | | | $ | 13,297 | |
| | | | | | | | | |
| Ratio of expenses excluding waiver/reimbursement to average net assets | | | 0.52 | % | | | 0.52 | %(c) |
| Ratio of expenses including waiver/reimbursement to average net assets | | | 0.52 | % | | | 0.52 | %(c) |
| Ratio of net investment income including expenses waiver/reimbursement to average net assets | | | 2.19 | % | | | 2.13 | %(c) |
| Portfolio turnover rate(d) | | | 54 | % | | | 45 | % |
| (a) | Based on average shares outstanding during the period. |
| (b) | Total return is calculated assuming an initial investment made at the net asset value at the beginning of the period and the redemption at the net asset value on the last day of the period and assuming all distributions are reinvested at the actual reinvestment prices. Total return calculated for a period of less than one year is not annualized. |
| (d) | Portfolio turnover for periods less than one year are not annualized and does not include securities received or delivered from processing creations or redemptions in-kind. |
See Notes to Financial Statements.
| RiverFront Dynamic US Flex-Cap ETF | |
| Financial Highlights | For a share outstanding throughout the periods presented |
| | | For the Year Ended November 30, 2017 | | | For the Period June 7, 2016 (Commencement) to November 30, 2016 | |
| NET ASSET VALUE, BEGINNING OF PERIOD | | $ | 26.84 | | | $ | 25.13 | |
| | | | | | | | | |
| INCOME/(LOSS) FROM INVESTMENT OPERATIONS: | | | | | | | | |
| Net investment income(a) | | | 0.31 | | | | 0.17 | |
| Net realized and unrealized gain | | | 5.59 | | | | 1.70 | |
| Total from investment operations | | | 5.90 | | | | 1.87 | |
| | | | | | | | | |
| DISTRIBUTIONS: | | | | | | | | |
| From net investment income | | | (0.28 | ) | | | (0.16 | ) |
| Total distributions | | | (0.28 | ) | | | (0.16 | ) |
| | | | | | | | | |
| NET INCREASE IN NET ASSET VALUE | | | 5.62 | | | | 1.71 | |
| NET ASSET VALUE, END OF PERIOD | | $ | 32.46 | | | $ | 26.84 | |
| TOTAL RETURN(b) | | | 22.08 | % | | | 7.45 | % |
| | | | | | | | | |
| RATIOS/SUPPLEMENTAL DATA: | | | | | | | | |
| Net assets, end of period (000s) | | $ | 40,576 | | | $ | 8,053 | |
| | | | | | | | | |
| Ratio of expenses excluding waiver/reimbursement to average net assets | | | 0.52 | % | | | 0.52 | %(c) |
| Ratio of expenses including waiver/reimbursement to average net assets | | | 0.52 | % | | | 0.52 | %(c) |
| Ratio of net investment income including expenses waiver/reimbursement to average net assets | | | 1.05 | % | | | 1.34 | %(c) |
| Portfolio turnover rate(d) | | | 86 | % | | | 41 | % |
| (a) | Based on average shares outstanding during the period. |
| (b) | Total return is calculated assuming an initial investment made at the net asset value at the beginning of the period and the redemption at the net asset value on the last day of the period and assuming all distributions are reinvested at the actual reinvestment prices. Total return calculated for a period of less than one year is not annualized. |
| (d) | Portfolio turnover for periods less than one year are not annualized and does not include securities received or delivered from processing creations or redemptions in-kind. |
See Notes to Financial Statements.
| RiverFront Strategic Income Fund | |
| Financial Highlights | For a share outstanding throughout the periods presented |
| | | For the Year Ended November 30, 2017 | | | For the Year Ended November 30, 2016 | | | For the Year Ended November 30, 2015 | | | For the Year Ended November 30, 2014 | | | For the Period October 8, 2013 (Commencement) to November 30, 2013 | |
| NET ASSET VALUE, BEGINNING OF PERIOD | | $ | 25.02 | | | $ | 24.36 | | | $ | 25.02 | | | $ | 24.90 | | | $ | 24.42 | |
| | | | | | | | | | | | | | | | | | | | | |
| INCOME/(LOSS) FROM INVESTMENT OPERATIONS: | | | | | | | | | | | | | | | | | | | | |
| Net investment income(a) | | | 1.11 | | | | 1.05 | | | | 0.88 | | | | 0.83 | | | | 0.11 | |
| Net realized and unrealized gain/(loss) | | | 0.19 | | | | 0.71 | | | | (0.65 | ) | | | 0.11 | | | | 0.40 | |
| Total from investment operations | | | 1.30 | | | | 1.76 | | | | 0.23 | | | | 0.94 | | | | 0.51 | |
| | | | | | | | | | | | | | | | | | | | | |
| DISTRIBUTIONS: | | | | | | | | | | | | | | | | | | | | |
| From net investment income | | | (1.11 | ) | | | (1.10 | ) | | | (0.87 | ) | | | (0.82 | ) | | | (0.03 | ) |
| From net realized gains | | | – | | | | – | | | | (0.02 | ) | | | – | | | | – | |
| Total distributions | | | (1.11 | ) | | | (1.10 | ) | | | (0.89 | ) | | | (0.82 | ) | | | (0.03 | ) |
| | | | | | | | | | | | | | | | | | | | | |
| NET INCREASE/(DECREASE) IN NET ASSET VALUE | | | 0.19 | | | | 0.66 | | | | (0.66 | ) | | | 0.12 | | | | 0.48 | |
| NET ASSET VALUE, END OF PERIOD | | $ | 25.21 | | | $ | 25.02 | | | $ | 24.36 | | | $ | 25.02 | | | $ | 24.90 | |
| TOTAL RETURN(b) | | | 5.29 | % | | | 7.38 | % | | | 0.91 | % | | | 3.80 | % | | | 2.08 | % |
| | | | | | | | | | | | | | | | | | | | | |
| RATIOS/SUPPLEMENTAL DATA: | | | | | | | | | | | | | | | | | | | | |
| Net assets, end of period (000s) | | $ | 337,769 | | | $ | 326,515 | | | $ | 464,007 | | | $ | 369,065 | | | $ | 97,102 | |
| | | | | | | | | | | | | | | | | | | | | |
| Ratio of expenses excluding waiver/reimbursement to average net assets | | | 0.46 | % | | | 0.46 | % | | | 0.46 | % | | | 0.46 | % | | | 0.46 | %(c) |
| Ratio of expenses including waiver/reimbursement to average net assets | | | 0.16 | %(d) | | | 0.17 | %(d) | | | 0.22 | % | | | 0.22 | % | | | 0.22 | %(c) |
| Ratio of net investment income including expenses waiver/reimbursement to average net assets | | | 4.41 | % | | | 4.26 | % | | | 3.54 | % | | | 3.30 | % | | | 3.28 | %(c) |
| Portfolio turnover rate(e) | | | 32 | % | | | 52 | % | | | 36 | % | | | 27 | % | | | 0 | % |
| (a) | Based on average shares outstanding during the period. |
| (b) | Total return is calculated assuming an initial investment made at the net asset value at the beginning of the period and the redemption at the net asset value on the last day of the period and assuming all distributions are reinvested at the actual reinvestment prices. Total return calculated for a period of less than one year is not annualized. |
| (d) | Effective July 1, 2016, the Fund’s management fee consists of a fee of 0.16% paid to the Fund’s investment adviser and a fee of 0.30% paid to the Fund’s sub-adviser. The Fund’s sub-adviser will voluntarily waive all of its 0.30% annual sub-advisory fee payable by the Fund until March 31, 2018. |
| (e) | Portfolio turnover for periods less than one year are not annualized and does not include securities received or delivered from processing creations or redemptions in-kind. |
See Notes to Financial Statements.
RiverFront ETFs
| Notes to Financial Statements | November 30, 2017 |
1. ORGANIZATION
ALPS ETF Trust (the “Trust”), a Delaware statutory trust, is an open-end management investment company registered under the Investment Company Act of 1940, as amended (the “1940 Act”). As of November 30, 2017, the Trust consists of nineteen separate portfolios. Each portfolio represents a separate series of the Trust. This report pertains solely to the RiverFront Dynamic Core Income ETF, the RiverFront Dynamic Unconstrained Income ETF, the RiverFront Dynamic US Dividend Advantage ETF, the RiverFront Dynamic US Flex-Cap ETF, and the RiverFront Strategic Income Fund (each a “Fund” and collectively, the “Funds”).
The investment objective of the RiverFront Dynamic Core Income ETF Fund is to seek total return, with an emphasis on income as the source of that total return. The Fund is considered non-diversified and may invest a greater portion of assets in securities of individual issuers than a diversified fund. As a result, changes in the market value of a single investment could cause greater fluctuations in share price than would occur in a diversified fund.
The investment objective of the RiverFront Dynamic Unconstrained Income ETF Fund is to seek total return, with an emphasis on income as the source of that total return. The Fund is considered non-diversified and may invest a greater portion of assets in securities of individual issuers than a diversified fund. As a result, changes in the market value of a single investment could cause greater fluctuations in share price than would occur in a diversified fund.
The investment objective of the RiverFront Dynamic US Dividend Advantage ETF Fund is to seek to provide capital appreciation and dividend income. The Fund is considered non-diversified and may invest a greater portion of assets in securities of individual issuers than a diversified fund. As a result, changes in the market value of a single investment could cause greater fluctuations in share price than would occur in a diversified fund.
The investment objective of the RiverFront Dynamic US Flex-Cap ETF Fund is to seek to provide capital appreciation. The Fund is considered non diversified and may invest a greater portion of assets in securities of individual issuers than a diversified fund. As a result, changes in the market value of a single investment could cause greater fluctuations in share price than would occur in a diversified fund.
The investment objective of the RiverFront Strategic Income Fund is to seek total return, with an emphasis on income as the source of that total return. The Fund is considered non-diversified and may invest a greater portion of assets in securities of individual issuers than a diversified fund. As a result, changes in the market value of a single investment could cause greater fluctuations in share price than would occur in a diversified fund.
Each Fund’s Shares (“Shares”) are listed on the NYSE Arca, Inc. Each Fund issues and redeems Shares at net asset value (“NAV”) in blocks of 50,000 Shares, each of which is called a “Creation Unit”. Creation Units are issued and redeemed principally in-kind for securities and/or cash. Except when aggregated in Creation Units, Shares are not redeemable securities of a Fund.
Pursuant to the Trust’s organizational documents, its Officers and Trustees are indemnified against certain liability arising out of the performance of their duties to the Trust. Additionally, in the normal course of business, the Trust enters into contracts with service providers that contain general indemnification clauses. The Trust’s maximum exposure under these arrangements is unknown, as this would involve future claims that may be made against the Trust that have not yet occurred.
2. SIGNIFICANT ACCOUNTING POLICIES
The following is a summary of significant accounting policies consistently followed by the Funds in the preparation of the financial statements. The accompanying financial statements were prepared in accordance with accounting principles generally accepted in the United States of America (“U.S. GAAP”). The preparation of financial statements in conformity with U.S. GAAP requires management to make certain estimates and assumptions that affect the reported amounts of assets and liabilities and disclosures of contingent assets and liabilities at the date of the financial statements and the reported amounts of revenue and expenses during the period. Actual results could differ from those estimates. Each Fund is considered an investment company under U.S. GAAP and follows the accounting and reporting guidance applicable to investment companies in the Financial Accounting Standards Board Accounting Standards Codification Topic 946.
A. Portfolio Valuation
Each Fund’s NAV is determined daily, as of the close of regular trading on the New York Stock Exchange (the “NYSE”), normally 4:00 p.m. Eastern time, on each day the NYSE is open for trading. The NAV is computed by dividing the value of all assets of each Fund (including accrued interest and dividends), less all liabilities (including accrued expenses and dividends declared but unpaid), by the total number of shares outstanding.
RiverFront ETFs
| Notes to Financial Statements | November 30, 2017 |
Portfolio securities listed on any exchange other than the NASDAQ Stock Market LLC (“NASDAQ”) are valued at the last sale price on the business day as of which such value is being determined. If there has been no sale on such day, the securities are valued at the mean of the most recent bid and ask prices on such day. Securities traded on the NASDAQ are valued at the NASDAQ Official Closing Price as determined by NASDAQ. Portfolio securities traded on more than one securities exchange are valued at the last sale price on the business day as of which such value is being determined at the close of the exchange representing the principal market for such securities. Portfolio securities traded in the over-the-counter market, but excluding securities traded on the NASDAQ, are valued at the last quoted sale price in such market.
Corporate bonds and United States government bonds are typically valued at the mean between the evaluated bid and ask prices formulated by an independent pricing service.
Each Fund’s investments are valued at market value or, in the absence of market value with respect to any portfolio securities, at fair value according to procedures adopted by the Trust’s Board of Trustees (the “Board”). When market quotations are not readily available or when events occur that make established valuation methods unreliable, securities of the Funds may be valued in good faith by or under the direction of the Board. These securities generally include, but are not limited to, restricted securities (securities which may not be publicly sold without registration under the Securities Act of 1933) for which a pricing service is unable to provide a market price; securities whose trading has been formally suspended; a security whose market price is not available from a pre-established primary pricing source or the pricing source is not willing to provide a price; a security with respect to which an event has occurred that is most likely to materially affect the value of the security after the market has closed but before the calculation of a Fund’s NAV or make it difficult or impossible to obtain a reliable market quotation; or a security whose price, as provided by the pricing service, does not reflect the security’s “fair value” due to the security being de-listed from a national exchange or the security’s primary trading market is temporarily closed at a time when, under normal conditions, it would be open. As a general principle, the current “fair value” of a security would be the amount which the owner might reasonably expect to receive from the sale on the applicable exchange or principal market. A variety of factors may be considered in determining the fair value of such securities.
B. Fair Value Measurements
Each Fund discloses the classification of its fair value measurements following a three-tier hierarchy based on the inputs used to measure fair value. Inputs refer broadly to the assumptions that market participants would use in pricing the asset or liability, including assumptions about risk. Inputs may be observable or unobservable. Observable inputs reflect the assumptions market participants would use in pricing the asset or liability that are developed based on market data obtained from sources independent of the reporting entity. Unobservable inputs reflect the reporting entity’s own assumptions about the assumptions market participants would use in pricing the asset or liability that are developed based on the best information available.
Valuation techniques used to value the Funds’ investments by major category are as follows:
Equity securities, including restricted securities, for which market quotations are readily available, are valued at the last reported sale price or official closing price as reported by a third party pricing vendor on the primary market or exchange on which they are traded and are categorized as Level 1 in the hierarchy. In the event there were no sales during the day or closing prices are not available, securities are valued at the mean of the most recent quoted bid and ask prices on such day and are generally categorized as Level 2 in the hierarchy. Investments in open-end mutual funds are valued at their closing NAV each business day and are categorized as Level 1 in the hierarchy.
Debt securities, including restricted securities, are valued based on evaluated prices received from third party pricing vendors or from brokers who make markets in such securities. For corporate bonds, pricing vendors utilize matrix pricing which considers yield or price of bonds of comparable quality, coupon, maturity and type as well as broker-supplied prices. When independent prices are unavailable or unreliable, debt securities may be valued utilizing pricing methodologies which consider similar factors that would be used by third party pricing vendors. Debt securities are generally categorized as Level 2 in the hierarchy but may be Level 3 depending on the circumstances. The RiverFront Dynamic Core Income ETF, the RiverFront Dynamic Unconstrained Income ETF, and the RiverFront Strategic Income Fund may invest a significant portion of their assets in below investment grade securities. The value of these securities can be more volatile due to changes in the credit quality of the issuer and is sensitive to changes in economic, market and regulatory conditions.
Changes in valuation techniques may result in transfers in or out of an assigned level within the disclosure hierarchy.
Various inputs are used in determining the value of each Fund’s investments as of the end of the reporting period. When inputs used fall into different levels of the fair value hierarchy, the level in the hierarchy within which the fair value measurement falls is determined based on the lowest level input that is significant to the fair value measurement in its entirety. The designated input levels are not necessarily an indication of the risk or liquidity associated with these investments.
RiverFront ETFs
| Notes to Financial Statements | November 30, 2017 |
These inputs are categorized in the following hierarchy under applicable financial accounting standards:
| Level 1 – | Unadjusted quoted prices in active markets for identical investments, unrestricted assets or liabilities that a Fund has the ability to access at the measurement date; |
| Level 2 – | Quoted prices which are not active, quoted prices for similar assets or liabilities in active markets or inputs other than quoted prices that are observable (either directly or indirectly) for substantially the full term of the asset or liability; and |
| Level 3 – | Significant unobservable prices or inputs (including the Fund’s own assumptions in determining the fair value of investments) where there is little or no market activity for the asset or liability at the measurement date. |
The following is a summary of the inputs used to value the Funds’ investments as of November 30, 2017:
RiverFront Dynamic Core Income ETF
| Investments in Securities at Value | | Level 1 - Unadjusted Quoted Prices | | | Level 2 - Other Significant Observable Inputs | | | Level 3 - Significant Unobservable Inputs | | | Total | |
| Corporate Bonds* | | $ | – | | | $ | 44,958,184 | | | $ | – | | | $ | 44,958,184 | |
| Government Bonds | | | – | | | | 1,085,284 | | | | – | | | | 1,085,284 | |
| Short Term Investments | | | 1,534,758 | | | | – | | | | – | | | | 1,534,758 | |
| TOTAL | | $ | 1,534,758 | | | $ | 46,043,468 | | | $ | – | | | $ | 47,578,226 | |
RiverFront Dynamic Unconstrained Income ETF
| Investments in Securities at Value | | Level 1 - Unadjusted Quoted Prices | | | Level 2 - Other Significant Observable Inputs | | | Level 3 - Significant Unobservable Inputs | | | Total | |
| Corporate Bonds* | | $ | – | | | $ | 11,314,461 | | | $ | – | | | $ | 11,314,461 | |
| Short Term Investments | | | 293,674 | | | | – | | | | – | | | | 293,674 | |
| TOTAL | | $ | 293,674 | | | $ | 11,314,461 | | | $ | – | | | $ | 11,608,135 | |
RiverFront Dynamic US Dividend Advantage ETF
| Investments in Securities at Value | | Level 1 - Unadjusted Quoted Prices | | | Level 2 - Other Significant Observable Inputs | | | Level 3 - Significant Unobservable Inputs | | | Total | |
| Common Stocks* | | $ | 59,493,374 | | | $ | – | | | $ | – | | | $ | 59,493,374 | |
| TOTAL | | $ | 59,493,374 | | | $ | – | | | $ | – | | | $ | 59,493,374 | |
RiverFront Dynamic US Flex-Cap ETF
| Investments in Securities at Value | | Level 1 - Unadjusted Quoted Prices | | | Level 2 - Other Significant Observable Inputs | | | Level 3 - Significant Unobservable Inputs | | | Total | |
| Common Stocks* | | $ | 40,508,038 | | | $ | – | | | $ | – | | | $ | 40,508,038 | |
| Short Term Investments | | | | | | | | | | | | | | | | |
| Money Market Fund | | | 14,031 | | | | – | | | | – | | | | 14,031 | |
| Investments Purchased with Collateral from Securities Loaned | | | 111,744 | | | | – | | | | – | | | | 111,744 | |
| TOTAL | | $ | 40,633,813 | | | $ | – | | | $ | – | | | $ | 40,633,813 | |
RiverFront ETFs
| Notes to Financial Statements | November 30, 2017 |
RiverFront Strategic Income Fund
| Investments in Securities at Value | | Level 1 - Unadjusted Quoted Prices | | | Level 2 - Other Significant Observable Inputs | | | Level 3 - Significant Unobservable Inputs | | | Total | |
| Corporate Bonds* | | $ | – | | | $ | 309,762,322 | | | $ | – | | | $ | 309,762,322 | |
| Government Bonds | | | – | | | | 9,767,559 | | | | – | | | | 9,767,559 | |
| Short Term Investments | | | 14,056,480 | | | | – | | | | – | | | | 14,056,480 | |
| TOTAL | | $ | 14,056,480 | | | $ | 319,529,881 | | | $ | – | | | $ | 333,586,361 | |
| * | For a detailed sector breakdown, see the accompanying Schedule of Investments. |
The Funds recognize transfers between levels as of the end of the period. For the year ended November 30, 2017, the Funds did not have any transfers between Level 1 and Level 2 securities. The Funds did not have any securities that used significant unobservable inputs (Level 3) in determining fair value.
C. Securities Transactions and Investment Income
Securities transactions are recorded as of the trade date. Realized gains and losses from securities transactions are recorded on the highest cost basis. Dividend income and capital gains distributions, if any, are recorded on the ex-dividend date. Interest income, if any, is recorded on the accrual basis, including amortization of premiums and accretion of discounts.
D. Dividends and Distributions to Shareholders
Dividends from net investment income for each Fund, if any, are declared and paid monthly or as the Board may determine from time to time. Distributions of net realized capital gains earned by the Funds, if any, are distributed at least annually.
E. Federal Tax and Tax Basis Information
The timing and character of income and capital gain distributions are determined in accordance with income tax regulations, which may differ from U.S. GAAP. Reclassifications are made to the Funds’ capital accounts for permanent tax differences to reflect income and gains available for distribution (or available capital loss carryforwards) under income tax regulations.
For the year or period ended November 30, 2017, the following reclassifications, which had no impact on results of operations or net assets, were recorded to reflect permanent tax differences resulting primarily from in-kind transactions:
| Fund | | Paid-in Capital | | | Accumulated Net Investment Income | | | Accumulated Net Realized Gain/(Loss) on Investments | |
| RiverFront Dynamic Core Income ETF | | $ | – | | | $ | – | | | $ | – | |
| RiverFront Dynamic Unconstrained Income ETF | | | (7,258 | ) | | | – | | | | 7,258 | |
| RiverFront Dynamic US Dividend Advantage ETF | | | 1,031,475 | | | | 1,942 | | | | (1,033,417 | ) |
| RiverFront Dynamic US Flex-Cap ETF | | | 1,091,903 | | | | 434 | | | | (1,092,337 | ) |
| RiverFront Strategic Income Fund | | | 355,556 | | | | – | | | | (355,556 | ) |
The tax character of the distributions paid by the Funds during the fiscal year ended November 30, 2017 were as follows:
| | | Ordinary Income | |
| November 30, 2017 | | | |
| RiverFront Dynamic Core Income ETF | | $ | 621,587 | |
| RiverFront Dynamic Unconstrained Income ETF | | | 408,541 | |
| RiverFront Dynamic US Dividend Advantage ETF | | | 753,106 | |
| RiverFront Dynamic US Flex-Cap ETF | | | 254,258 | |
| RiverFront Strategic Income Fund | | | 14,055,252 | |
RiverFront ETFs
| Notes to Financial Statements | November 30, 2017 |
The tax character of the distributions paid by the Funds during the fiscal year ended November 30, 2016 were as follows:
| | | Ordinary Income | |
| November 30, 2016 | | | |
| RiverFront Dynamic Core Income ETF | | $ | 33,050 | |
| RiverFront Dynamic Unconstrained Income ETF | | | 126,123 | |
| RiverFront Dynamic US Dividend Advantage ETF | | | 71,278 | |
| RiverFront Dynamic US Flex-Cap ETF | | | 34,555 | |
| RiverFront Strategic Income Fund | | | 16,281,197 | |
As of November 30, 2017, the components of distributable earnings on a tax basis were as follows:
| | | RiverFront Dynamic Core Income ETF | | | RiverFront Dynamic Unconstrained Income ETF | | | RiverFront Dynamic US Dividend Advantage ETF | | | RiverFront Dynamic US Flex- Cap ETF | | | RiverFront Strategic Income Fund | |
| Accumulated net investment income | | $ | 8,013 | | | $ | 12,987 | | | $ | 25,697 | | | $ | 17,211 | | | $ | 35,631 | |
| Accumulated net realized gain/(loss) on investments | | | (75,875 | ) | | | 27,433 | | | | (594,757 | ) | | | (997,172 | ) | | | (8,475,267 | ) |
| Net unrealized appreciation on investments | | | 45,092 | | | | 161,590 | | | | 6,387,896 | | | | 4,900,728 | | | | 7,443,603 | |
| Total | | $ | (22,770 | ) | | $ | 202,010 | | | $ | 5,818,836 | | | $ | 3,920,767 | | | $ | (996,033 | ) |
As of November 30, 2017, the cost of investments for federal income tax purposes and accumulated net unrealized appreciation/(depreciation) on investments were as follows:
| | | RiverFront Dynamic Core Income ETF | | | RiverFront Dynamic Unconstrained Income ETF | | | RiverFront Dynamic US Dividend Advantage ETF | | | RiverFront Dynamic US Flex- Cap ETF | | | RiverFront Strategic Income Fund | |
| Gross appreciation (excess of value over tax cost) | | $ | 209,480 | | | $ | 206,073 | | | $ | 7,593,003 | | | $ | 5,977,763 | | | $ | 8,013,966 | |
| Gross depreciation (excess of tax cost over value) | | | (164,388 | ) | | | (44,483 | ) | | | (1,205,107 | ) | | | (1,077,035 | ) | | | (570,363 | ) |
| Net unrealized appreciation | | | 45,092 | | | | 161,590 | | | | 6,387,896 | | | | 4,900,728 | | | | 7,443,603 | |
| Cost of investments for income tax purposes | | $ | 47,533,134 | | | $ | 11,446,545 | | | $ | 53,105,478 | | | $ | 35,733,085 | | | $ | 326,126,802 | |
The differences between book-basis and tax-basis are primarily due to the deferral of losses from wash sales.
The Riverfront Dynamic Unconstrained Income ETF and the Riverfront Strategic Income Fund used capital loss carryovers during the year ended November 30, 2017 of $8,807 and $1,382,737, respectively.
At November 30, 2017 the Funds post-enactment capital losses deferred to the next tax year were as follows:
| Fund | | Short-Term | | | Long-Term | |
| RiverFront Dynamic Core Income ETF | | $ | 74,857 | | | $ | 1,018 | |
| RiverFront Dynamic Unconstrained Income ETF | | | – | | | | – | |
| RiverFront Dynamic US Dividend Advantage ETF | | | 594,757 | | | | – | |
| RiverFront Dynamic US Flex-Cap ETF | | | 997,172 | | | | – | |
| RiverFront Strategic Income Fund | | | 5,325,853 | | | | 3,149,414 | |
RiverFront ETFs
| Notes to Financial Statements | November 30, 2017 |
F. Income Taxes
No provision for income taxes is included in the accompanying financial statements, as each Fund intends to distribute to shareholders all taxable investment income and realized gains and otherwise comply with Subchapter M of the Internal Revenue Code of 1986, as amended, applicable to regulated investment companies. Each Fund evaluates tax positions taken (or expected to be taken) in the course of preparing the Funds’ tax returns to determine whether these positions meet a “more-likely-than-not” standard that, based on the technical merits, have a more than fifty percent likelihood of being sustained by a taxing authority upon examination. A tax position that meets the “more-likely-than-not” recognition threshold is measured to determine the amount of benefit to recognize in the financial statements.
As of and during the year ended November 30, 2017, the Funds did not have a liability for any unrecognized tax benefits. Each Fund files U.S. federal, state, and local tax returns as required. Each Fund’s tax returns are subject to examination by the relevant tax authorities until expiration of the applicable statute of limitations, which is generally three years after the filing of the tax return, but may extend to four years in certain jurisdictions. Tax returns for open years have incorporated no uncertain tax positions that require a provision for income taxes.
G. Lending of Portfolio Securities
The Funds have entered into a securities lending agreement with State Street Bank & Trust Co. (“SSB”), the Funds’ lending agent. Each Fund may lend its portfolio securities only to borrowers that are approved by SSB. Each Fund will limit such lending to not more than 33 1/3% of the value of its total assets. Each Fund’s securities held at SSB as custodian shall be available to be lent except those securities the Fund or ALPS Advisors, Inc. specifically identifies in writing as not being available for lending. The borrower pledges and maintains with the Fund collateral consisting of cash (U.S. Dollars only), securities issued or guaranteed by the U.S. government or its agencies or instrumentalities, and cash equivalents (including irrevocable bank letters of credit) issued by a person other than the borrower or an affiliate of the borrower. The initial collateral received by each Fund is required to have a value of no less than 102% of the market value of the loaned securities for U.S equity securities and a value of no less than 105% of the market value for non-U.S. equity securities. The collateral is maintained thereafter, at a market value equal to not less than 102% of the current value of the U.S. equity securities on loan and not less than 105% of the current value of the non-U.S. equity securities on loan. The market value of the loaned securities is determined at the close of each business day and any additional required collateral is delivered to each Fund on the next business day. During the term of the loan, each Fund is entitled to all distributions made on or in respect of the loaned securities. Loans of securities are terminable at any time and the borrower, after notice, is required to return borrowed securities within the customary time period for settlement of securities transactions.
Any cash collateral received is reinvested in a money market fund managed by SSB as disclosed in the Fund’s Schedule of Investments and is reflected in the Statements of Assets and Liabilities as a payable for collateral upon return of securities loaned. Non-cash collateral, in the form of securities issued or guaranteed by the U.S. government or its agencies or instrumentalities, is not disclosed in the Fund’s Statements of Assets and Liabilities as it is held by the lending agent on behalf of the Fund, and the Fund does not have the ability to re-hypothecate these securities. Income earned by the Fund from securities lending activity is disclosed in the Statement of Operations.
The following is a summary of the securities lending agreement and related cash and non-cash collateral received as of November 30, 2017:
| | | Market Value of Securities on Loan | | | Cash Collateral Received | | | Non-Cash Collateral Received | | | Total Collateral Received | |
| RiverFront Dynamic US Flex-Cap ETF | | $ | 141,563 | | | $ | 111,744 | | | $ | 39,396 | | | $ | 151,140 | |
The risks of securities lending include the risk that the borrower may not provide additional collateral when required or may not return the securities when due. To mitigate these risks, the Funds benefit from a borrower default indemnity provided by SSB. SSB’s indemnity allows for full replacement of securities lent wherein SSB will purchase the unreturned loaned securities on the open market by applying the proceeds of the collateral, or to the extent such proceeds are insufficient or the collateral is unavailable, SSB will purchase the unreturned loan securities at SSB’s expense. However, the Funds could suffer a loss if the value of the investments purchased with cash collateral falls below the value of the cash collateral received.
RiverFront ETFs
| Notes to Financial Statements | November 30, 2017 |
The following table reflects a breakdown of transactions accounted for as secured borrowings, the gross obligation by the type of collateral pledged or securities loaned, and the remaining contractual maturity of those transactions as of November 30, 2017:
| RiverFront Dynamic US Flex-Cap ETF | Remaining contractual maturity of the agreement | |
| Securities Lending Transactions | | Overnight & Continuous | | | Up to 30 days | | | 30-90 days | | | Greater than 90 days | | | Total | |
| Common Stocks | | $ | 111,744 | | | $ | – | | | $ | – | | | $ | – | | | $ | 111,744 | |
| Total Borrowings | | | | | | | | | | | | | | | | | | | 111,744 | |
| Gross amount of recognized liabilities for securities lending (collateral received) | | | | | | $ | 111,744 | |
3. INVESTMENT ADVISORY FEE AND OTHER AFFILIATED TRANSACTIONS
ALPS Advisors, Inc. (the “Adviser”) acts as each Fund’s investment adviser pursuant to an Advisory Agreement with the Trust on behalf of each Fund (the “Advisory Agreement”). Pursuant to the Advisory Agreement, each Fund pays the Adviser an annual management fee for the services and facilities it provides as a percentage of the relevant Fund’s average daily net assets as set out below:
| Fund | Advisory Fee |
| RiverFront Dynamic Core Income ETF | 0.51%(a) |
| RiverFront Dynamic Unconstrained Income ETF | 0.51%(a) |
| RiverFront Dynamic US Dividend Advantage ETF | 0.52%(b) |
| RiverFront Dynamic US Flex-Cap ETF | 0.52%(b) |
| RiverFront Strategic Income Fund | 0.16% |
| (a) | The unitary advisory fee as a percentage of net assets is subject to the following breakpoints: (i) 0.51% for average net assets up to $600 million, (ii) 0.48% for average net assets equal to or greater than $600 million. |
| (b) | The unitary advisory fee as a percentage of net assets is subject to the following breakpoints: (i) 0.52% for average net assets up to $600 million, (ii) 0.49% for average net assets equal to or greater than $600 million. |
Out of the advisory fee, the Adviser pays substantially all expenses of each Fund, including the cost of transfer agency, custody, fund administration, legal, audit, independent trustees and other services, except for interest expenses, distribution fees or expenses, brokerage expenses, taxes and extraordinary expenses such as litigation and other expenses not incurred in the ordinary course of the Fund’s business. The Adviser’s unitary management fee is designed to pay substantially all of each Fund’s expenses and to compensate the Adviser for providing services for the Funds.
RiverFront Investment Group, LLC acts as each Fund’s sub-adviser (“Sub-Adviser”) pursuant to a sub-advisory agreement with the Trust (the “Sub-Advisory Agreement”). Pursuant to the Sub-Advisory Agreement, the Adviser pays the Sub-Adviser a sub-advisory fee out of the Adviser’s advisory fee for the services it provides besides RiverFront Strategic Income Fund, in which the Fund directly pays the Sub-Adviser. The fee is payable on a monthly basis at the annual rate of the relevant Fund’s average daily net assets as set out below:
| Fund | Sub-Advisory Fee |
| RiverFront Dynamic Core Income ETF | 0.35% |
| RiverFront Dynamic Unconstrained Income ETF | 0.35% |
| RiverFront Dynamic US Dividend Advantage ETF | 0.35% |
| RiverFront Dynamic US Flex-Cap ETF | 0.35% |
| RiverFront Strategic Income Fund | 0.30% |
For the RiverFront Strategic Income Fund, the Sub-Adviser has agreed to waive all of its sub-advisory fee until at least March 31, 2018. This waiver may only be terminated by the Fund’s Board (and not by the Fund’s Sub-Adviser) prior to such date.
ALPS Fund Services, Inc., an affiliate of the Adviser, is the administrator of the Funds.
Each Trustee who is not an officer or employee of the Adviser, any sub-adviser or any of their affiliates (“Independent Trustees”) receives (1) a quarterly retainer of $5,000, (2) a per meeting fee for regularly scheduled meetings of $3,750, (3) $1,500 for any special meeting held outside of a regularly scheduled board meeting, and (4) reimbursement for all reasonable out-of-pocket expenses relating to attendance at meetings.
RiverFront ETFs
| Notes to Financial Statements | November 30, 2017 |
4. PURCHASES AND SALES OF SECURITIES
For the year ended November 30, 2017, the cost of purchases and proceeds from sales of investment securities, excluding in-kind transactions and short-term investments, were as follows:
| Fund | | Purchases | | | Sales | |
| RiverFront Dynamic Core Income ETF | | $ | 4,057,575 | | | $ | 6,487,010 | |
| RiverFront Dynamic Unconstrained Income ETF | | | 4,112,795 | | | | 2,530,771 | |
| RiverFront Dynamic US Dividend Advantage ETF | | | 19,103,218 | | | | 19,099,095 | |
| RiverFront Dynamic US Flex-Cap ETF | | | 22,394,198 | | | | 22,516,023 | |
| RiverFront Strategic Income Fund | | | 95,332,219 | | | | 94,968,131 | |
For the year ended November 30, 2017, the cost of U.S. Government security purchases and proceeds from U.S. Government security sales were as follows:
| Fund | | Purchases | | | Sales | |
| RiverFront Dynamic Core Income ETF | | $ | 1,041,214 | | | $ | 254,348 | |
| RiverFront Strategic Income Fund | | | 9,370,924 | | | | – | |
For the year ended November 30, 2017, the cost of in-kind purchases and proceeds from in-kind sales were as follows:
| Fund | | Purchases | | | Sales | |
| RiverFront Dynamic Core Income ETF | | $ | 42,094,573 | | | $ | – | |
| RiverFront Dynamic Unconstrained Income ETF | | | 7,310,102 | | | | 2,511,863 | |
| RiverFront Dynamic US Dividend Advantage ETF | | | 49,636,389 | | | | 9,780,707 | |
| RiverFront Dynamic US Flex-Cap ETF | | | 36,334,630 | | | | 8,529,205 | |
| RiverFront Strategic Income Fund | | | 47,999,088 | | | | 38,268,769 | |
For the year ended November 30, 2017, the in-kind net realized gains/(losses) were as follows:
| Fund | | Net Realized Gain/(Loss) | |
| RiverFront Dynamic Core Income ETF | | $ | – | |
| RiverFront Dynamic Unconstrained Income ETF | | | (7,258 | ) |
| RiverFront Dynamic US Dividend Advantage ETF | | | 1,032,550 | |
| RiverFront Dynamic US Flex-Cap ETF | | | 1,091,893 | |
| RiverFront Strategic Income Fund | | | 415,576 | |
Gains on in-kind transactions are not considered taxable for federal income tax purposes.
5. CAPITAL SHARE TRANSACTIONS
Shares are created and redeemed by each Fund only in Creation Unit size aggregations of 50,000 Shares. Only broker-dealers or large institutional investors with creation and redemption agreements called Authorized Participants (“AP”) are permitted to purchase or redeem Creation Units from each Fund. Such transactions are generally permitted on an in-kind basis, with a balancing cash component to equate the transaction to the NAV per unit of each Fund on the transaction date. Cash may be substituted equivalent to the value of certain securities generally when they are not available in sufficient quantity for delivery, not eligible for trading by the AP or as a result of other market circumstances.
6. RELATED PARTY TRANSACTIONS
The Fund engaged in cross trades between other funds in the Trust during the year ended November 30, 2017 pursuant to Rule 17a-7 under the 1940 Act. Cross trading is the buying or selling of portfolio securities between funds to which the Adviser serves as the investment adviser. The Board previously adopted procedures that apply to transactions between the Funds of the Trust pursuant to Rule 17a-7. These transactions related to cross trades during the period complied with the requirements set forth by Rule 17a-7 and the Trust’s procedures.
RiverFront ETFs
| Notes to Financial Statements | November 30, 2017 |
Transactions related to cross trades during the year ended November 30, 2017, were as follows:
| Fund | | Purchase cost paid | | | Sale proceeds received | | | Realized gain/ (loss) on sales | |
| Riverfront Dynamic US Dividend | | $ | 236,876 | | | $ | 182,526 | | | $ | (59,901 | ) |
| Riverfront Dynamic US Flex | | $ | 182,526 | | | $ | 236,876 | | | $ | (15,861 | ) |
7. RECENT ACCOUNTING PRONOUNCEMENT
In March 2017, the Financial Accounting Standards Board issued Accounting Standards Update “Premium Amortization on Purchased Callable Debt Securities” which amends the amortization period for a callable debt security held at a premium from the maturity date to the earliest call date. The guidance is effective for annual periods beginning after December 15, 2018, and interim periods within those annual periods. At this time, management is evaluating the implications of these changes on the funds.
RiverFront ETFs
| Additional Information | November 30, 2017 (Unaudited) |
PROXY VOTING RECORDS, POLICIES AND PROCEDURES
Information regarding how each Fund voted proxies relating to portfolio securities during the most recent 12-month period ended June 30 and a description of the Funds’ proxy voting policies and procedures used in determining how to vote for proxies are available without charge on the SEC’s website at www.sec.gov and upon request, by calling (toll-free) 1-866-675-2639.
PORTFOLIO HOLDINGS
The Trust is required to disclose, after its first and third fiscal quarters, the complete schedule of each Fund’s portfolio holdings with the SEC on Form N-Q. Forms N-Q for each Fund are available on the SEC’s website at www.sec.gov. Each Fund’s Forms N-Q may also be reviewed and copied at the SEC’s Public Reference Room in Washington, D.C. and information on the operation of the Public Reference Room may be obtained by calling 1-800-SEC-0330. Each Fund’s Forms N-Q are available without charge, upon request, by calling (toll-free) 1-866-675-2639 or by writing to ALPS ETF Trust at 1290 Broadway, Suite 1100, Denver, Colorado 80203.
TAX INFORMATION
The Funds designate the following for federal income tax purposes for distributions made during the calendar year ended December 31, 2016:
| | Qualified Dividend Income | Dividend Received Deduction |
| ALPS RiverFront Dynamic Core Income ETF | 92.45% | 90.62% |
| ALPS RiverFront Dynamic Unconstrained Income ETF | 0.00% | 0.00% |
| ALPS Riverfront Strategic Income ETF | 0.00% | 0.00% |
| ALPS Riverfront Dynamic US Dividend Advantage ETF | 92.45% | 90.62% |
| ALPS Riverfront Dynamic US Flex-Cap ETF | 100.00% | 100.00% |
In early 2017, if applicable, shareholders of record received this information for the distributions paid to them by the Funds during the calendar year 2016 via Form 1099. The Funds will notify shareholders in early 2018 of amounts paid to them by the Funds, if any, during the calendar year 2017.
RiverFront ETFs
| Board Considerations Regarding Approval of Investment Advisory Agreement and Investment Sub-Advisory Agreements | November 30, 2017 (Unaudited) |
RIGS/RFFC/RFUN/RFDA/RFCI
At an in-person meeting held on June 8, 2017, the Board of Trustees of the Trust (the “Board” or the “Trustees”), including the Trustees who are not “interested persons” of the Trust within the meaning of the 1940 Act, as amended (the “Independent Trustees”), evaluated a proposal to approve the continuance of the Investment Advisory Agreements between the Trust and ALPS Advisors, Inc. (the “Adviser” or “AAI”) with respect to the RiverFront Dynamic Unconstrained Income ETF (“RFUN”), the RiverFront Dynamic Core Income ETF (“RFCI”), the RiverFront Dynamic US Dividend Advantage ETF (“RFDA”) and the RiverFront Dynamic US Flex-Cap ETF (“RFFC”) (each a “Fund” and collectively “the Funds”). The Independent Trustees also met separately to consider the Investment Advisory Agreement.
In evaluating the Investment Advisory Agreements with respect to each of the Funds, the Independent Trustees considered various factors, including (i) the nature, extent and quality of the services provided by AAI with respect to the applicable Fund under the Investment Advisory Agreements; (ii) the advisory fees and other expenses paid by the Fund compared to those of similar funds managed by other investment advisers; (iii) the costs of the services provided to the Fund by AAI and the profits realized by AAI and its affiliates from its relationship to the Fund; (iv) the extent to which economies of scale have been or would be realized if and as the assets of the Fund grow and whether fees reflect the economies of scale for the benefit of shareholders; and (v) any additional benefits and other considerations.
With respect to the nature, extent and quality of the services provided by AAI under the Investment Advisory Agreements, the Independent Trustees considered and reviewed information concerning the services provided under the Investment Advisory Agreements, financial information regarding AAI and its parent company, information describing AAI’s current organization and the background and experience of the persons responsible for the day-to-day management of the Funds.
The Independent Trustees reviewed information on the performance of each Fund and its Broadridge performance group. Based on their review, the Independent Trustees found that the nature and extent of services provided to each Fund under the Investment Advisory Agreements was appropriate and that the quality was satisfactory.
The Independent Trustees noted that the advisory fees for each Fund were unitary fees pursuant to which AAI assumes all expenses of the Funds (including the cost of transfer agency, custody, fund administration, legal, audit and other services) other than the payments under the Investment Advisory Agreement, brokerage expenses, taxes, interest, litigation expenses and other extraordinary expenses.
With respect to advisory fee rates, the Independent Trustees noted the following:
Based on the foregoing, and the other information available to them, the Independent Trustees concluded that the advisory fee rate for each of the Funds was reasonable under the circumstances and in light of the quality of the services provided.
The Independent Trustees considered other benefits available to AAI because of its relationship with the Funds and concluded that the advisory fees were reasonable taking into account any such benefits.
The Independent Trustees also considered with respect to each Fund the information provided by AAI about the costs and profitability of AAI with respect to each of the Funds. The Independent Trustees reviewed and noted the relatively small sizes of the Funds (other than RIGS) and concluded that AAI was not realizing any economies of scale other than RIGS. With respect to RIGS, the Independent Trustees noted that the Fund had not experienced significant growth in assets over the prior year. The Independent Trustees noted that RIGS is still a relatively new product, which makes it difficult to quantify the potential variability in net assets and thus determine the sustainability of any potential economies of scale which may exist. The Independent Trustees determined that they would continue to evaluate whether further economies of scale have been achieved on an ongoing basis.
In voting to renew each Investment Advisory Agreement, the Independent Trustees concluded that the terms of each Investment Advisory Agreement are reasonable and fair in light of the services to be performed, the fees paid by certain other funds, expenses to be incurred and such other matters as the Independent Trustees considered relevant in the exercise of their reasonable business judgment. The Independent Trustees did not identify any single factor or group of factors as all important or controlling and considered all factors together.
RiverFront ETFs
| Board Considerations Regarding Approval of Investment Advisory Agreement and Investment Sub-Advisory Agreements | November 30, 2017 (Unaudited) |
RiverFront Sub-Advisory Agreements
In evaluating the RiverFront Sub-Advisory Agreements, the Independent Trustees considered various factors, including (i) the nature, extent and quality of the services provided by RiverFront with respect to the RiverFront ETFs under the RiverFront Sub-Advisory Agreements; (ii) the advisory fees and other expenses paid by the RiverFront ETFs compared to those of similar funds managed by other investment advisers; (iii) the profitability to RiverFront of its sub-advisory relationship with the RiverFront ETFs and the reasonableness of compensation to RiverFront; (iv) the extent to which economies of scale would be realized if, and as, the RiverFront ETFs’ assets increase, and whether the fee level in the RiverFront Sub-Advisory Agreements reflects these economies of scale; and (v) any additional benefits and other considerations.
With respect to the nature, extent and quality of the services provided by RiverFront under the RiverFront Sub-Advisory Agreements, the Independent Trustees considered and reviewed information concerning the services provided under the RiverFront Sub-Advisory Agreements, the RiverFront ETFs’ respective performance, financial information regarding RiverFront, information describing RiverFront’s current organization and the background and experience of the persons responsible for the day-to-day management of the RiverFront ETFs. Based upon their review, the Independent Trustees concluded that RiverFront was qualified to oversee the portfolio management of the RiverFront ETFs and that the services provided by RiverFront to the RiverFront ETFs are satisfactory.
The Independent Trustees considered that the contractual sub-advisory fee to be paid to RiverFront from RIGS was 0.30% of RIGS’ average daily net assets out of a total management fee of 0.46% of RIGS’ average daily net assets. The Independent Trustees considered that RiverFront has waived its fee through March 31, 2018. The Independent Trustees considered that the contractual sub-advisory fee to be paid to RiverFront with respect to each of RFUN, RFCI, RFDA and RFFC was 0.35% of each Fund’s average daily net assets out of a total management fee of 0.52% with respect to each of RFUN’s and RFCI’s average daily net assets, respectively, and 0.51% with respect to each of RFDA’s and RFFC’s average daily net assets, respectively. Based on the consideration of all factors deemed relevant by them, the Independent Trustees concluded that the sub-advisory fees received by RiverFront under the RiverFront Sub-Advisory Agreements were reasonable under the circumstances and in light of the quality of services provided.
With respect to the costs of services provided and profits realized by RiverFront, the Independent Trustees considered the resources involved in managing the RiverFront ETFs as well as the fact that RiverFront has waived its fee through March 31, 2018 with respect to RIGS. Based on their review of the profitability of each of the RiverFront ETFs to RiverFront, the Independent Trustees concluded that the profitability of each RiverFront ETF to RiverFront was not unreasonable.
The Independent Trustees also considered other benefits that have been and may be realized by RiverFront from its relationships with each RiverFront ETF and concluded that the sub-advisory fees with respect to each RiverFront ETF were reasonable taking into account such benefits.
The Independent Trustees noted that RIGS had recently declined in assets. The Independent Trustees considered the extent to which economies of scale may be realized if RIGS’ assets increase to its previous levels and continue to grow in size and whether fee levels reflect a reasonable sharing of such economies of scale for the benefit of the Fund’s investors. Given that RiverFront is currently waiving its entire fee through March 31, 2018, the Independent Trustees concluded that economies of scale were not being achieved by RiverFront with respect to RIGS. The Independent Trustees considered that the Fund may be achieving some economies of scale. They also noted that RIGS is still a relatively new product that has experienced fluctuations in assets, which makes it difficult to quantify the potential variability in net assets and thus determine the sustainability of any potential economies of scale which may exist. The Independent Trustees also noted that RFUN, RFCI, RFDA and RFFC were all launched during June 2016 and have not yet reached significant scale in terms of assets. The Independent Trustees determined that they would continue to evaluate whether further economies of scale have been achieved on an ongoing basis with respect to each RiverFront ETF.
In voting to approve each of the RiverFront Sub-Advisory Agreements, the Independent Trustees concluded that the terms of each RiverFront Sub-Advisory Agreement are reasonable and fair in light of the services performed, expenses incurred and such other matters as the Independent Trustees considered relevant in the exercise of their reasonable business judgment. The Independent Trustees did not identify any single factor or group of factors as all important or controlling and considered all factors together.
RiverFront ETFs
| Trustees & Officers | November 30, 2017 (Unaudited) |
The general supervision of the duties performed by the Adviser for the Fund under the Investment Advisory Agreement is the responsibility of the Board of Trustees. The Trust currently has four Trustees. Three Trustees have no affiliation or business connection with the Adviser or any of its affiliated persons and do not own any stock or other securities issued by the Adviser. These are the “non-interested” or “independent” Trustees (“Independent Trustees”). The other Trustee (the “Interested Trustee”) is affiliated with the Adviser.
The Independent Trustees of the Trust, their term of office and length of time served, their principal business occupations during the past five years, the number of portfolios in the Fund Complex overseen by each Independent Trustee, and other directorships, if any, held by the Trustee are shown below.
INDEPENDENT TRUSTEES
| Name, Address & Year of Birth* | Position(s) Held with Trust | Term of Office and Length of Time Served** | Principal Occupation(s) During Past 5 Years | Number of Portfolios in Fund Complex Overseen by Trustees*** | Other Directorships Held by Trustees |
Mary K.
Anstine,
1940 | Trustee | Since March 2008 | Ms. Anstine was President/Chief Executive Officer of HealthONE Alliance, Denver, Colorado, and former Executive Vice President of First Interstate Bank of Denver. Ms. Anstine is also Trustee/Director of AV Hunter Trust and Colorado Uplift Board. Ms. Anstine was formerly a Director of the Trust Bank of Colorado (later purchased and now known as Northern Trust Bank), HealthONE and Denver Area Council of the Boy Scouts of America and a member of the American Bankers Association Trust Executive Committee. | 42 | Ms. Anstine is a Trustee of ALPS Variable Investment Trust (10 funds); Financial Investors Trust (33 funds); Reaves Utility Income Fund (1 fund); and Westcore Trust (14 funds). |
Jeremy W.
Deems,
1976 | Trustee | Since March 2008 | Mr. Deems is the Co-Founder, Chief Compliance Officer and Chief Financial Officer of Green Alpha Advisors, LLC. Mr. Deems is Co-Portfolio Manager of the Shelton Green Alpha Fund. Prior to joining Green Alpha Advisors, Mr. Deems was CFO and Treasurer of Forward Management, LLC, ReFlow Management Co., LLC, ReFlow Fund, LLC, a private investment fund, and Sutton Place Management, LLC, an administrative services company. | 44 | Mr. Deems is a Trustee of ALPS Variable Investment Trust (10 funds); Financial Investors Trust (33 funds); and Reaves Utility Income Fund (1 fund); Clough Funds Trust (1 fund) and Elevation ETF Trust (1 fund). |
Rick A.
Pederson,
1952 | Trustee and Chairman | Has served as Trustee since March 2008. Has served as Chairman since July 2017. | Mr. Pederson is President, Foundation Properties, Inc. (a real estate investment management company), 1994 - present; Advisory Board Member, Bow River Capital Partners (private equity management), 2003 - present; Advisor, The Pauls Corporation (real estate investment management and development), 2008 - present; Chairman, Ross Consulting Group (real estate consulting services) 1983-2013; Advisory Board, Neenan Company (construction services) 2002-present; Board Member, Prosci Inc. (private business services) 2013-2016; Board Member, Citywide Banks (Colorado community bank) 2014-present; Board member, Professional Pediatric Health Care (a Denver-based home nursing firm) 2014 – present; Board Member, Strong-Bridge Consulting (management consulting) 2015-present; Director, National Western Stock Show (not-for-profit organization); Director, Biennial of the Americas (not-for-profit-organization), 2012- 2015; Board Member, History Colorado, 2015 - present. | 21 | Mr. Pederson is Trustee of Westcore Trust (14 funds) and Principal Real Estate Income Fund (1 fund). |
| * | The business address of the Trustee is c/o ALPS Advisors, Inc., 1290 Broadway, Suite 1100, Denver, Colorado 80203. |
| ** | This is the period for which the Trustee began serving the Trust. Each Trustee serves an indefinite term, until his successor is elected. |
| *** | The Fund Complex includes all series of the Trust and any other investment companies for which ALPS Advisors, Inc. provides investment advisory services. |
RiverFront ETFs
| Trustees & Officers | November 30, 2017 (Unaudited) |
The Trustee who is affiliated with the Adviser or affiliates of the Adviser and executive officers of the Trust, his term of office and length of time served, his principal business occupations during the past five years, the number of portfolios in the Fund Complex overseen by the Interested Trustee and the other directorships, if any, held by the Trustee, are shown below.
INTERESTED TRUSTEE
| Name, Address and Year of Birth of Interested Trustee* | Position(s) Held with Trust | Term of Office and Length of Time Served** | Principal Occupation(s) During Past 5 Years | Number of Portfolios in Fund Complex Overseen by Trustees*** | Other Directorships Held by Trustee |
Edmund J.
Burke,
1961 | Trustee and President | Mr. Burke was elected as Trustee of the Trust and President of the Trust at the December 11, 2017 meeting of the Board of Trustees. | Mr. Burke is President and a Director of ALPS Holdings, Inc. (“AHI”) (since 2005) and Director of Boston Financial Data Services, Inc. (“BFDS”), ALPS Advisors, Inc. (“AAI”), ALPS Distributors, Inc. (“ADI”), ALPS Fund Services, Inc. (“AFS”) and ALPS Portfolio Solutions Distributor, Inc. (“APSD”) and from 2001-2008, was President of AAI, ADI, AFS and APSD. Because of his positions with AHI, BFDS, AAI, ADI, AFS and APSD, Mr. Burke is deemed an affiliate of the Trust as defined under the 1940 Act. Mr. Burke is Trustee and President of the Clough Global Allocation Fund (Trustee since 2006; President since 2004); Trustee and President of the Clough Global Equity Fund (Trustee since 2006; President since 2005); Trustee and President of the Clough Global Opportunities Fund (since 2006); Trustee of the Liberty All-Star Equity Fund; Director of the Liberty All-Star Growth Fund, Inc. and Trustee and President of Financial Investors Trust (Trustee since 2009; President since 2002). | 36 | Mr. Burke is a Trustee of Clough Global Dividend and Income Fund (1 fund); Clough Global Equity Fund (1 fund); Clough Global Opportunities Fund (1 fund); Clough Funds Trust (1 fund); Liberty All -Star Equity Fund (1 fund); Director of the Liberty All-Star Growth Fund, Inc. (1 fund) and Financial Investors Trust (33 funds). |
| * | The business address of the Trustee is c/o ALPS Advisors, Inc., 1290 Broadway, Suite 1100, Denver, Colorado 80203. |
| ** | This is the period for which the Trustee began serving the Trust. Each Trustee serves an indefinite term, until his successor is elected. |
| *** | The Fund Complex includes all series of the Trust and any other investment companies for which ALPS Advisors, Inc. provides investment advisory services. |
RiverFront ETFs
| Trustees & Officers | November 30, 2017 (Unaudited) |
OFFICERS
| Name, Address and Year of Birth of Officer | Position(s) Held with Trust | Length of Time Served* | Principal Occupation(s) During Past 5 Years |
Erin D.
Nelson,
1977 | Chief Compliance Officer (“CCO”) | Since December 2015 | Erin Nelson became Senior Vice-President and Chief Compliance Officer of ALPS Advisors, Inc. (“AAI”) on July 1, 2015 and prior to that served as Vice President and Deputy Chief Compliance Officer of AAI since January 1, 2015. Prior to January 1, 2015, Ms. Nelson was Vice-President and Assistant General Counsel of ALPS Fund Services, Inc. Because of her position with AAI, Ms. Nelson is deemed an affiliate of the Trust as defined under the 1940 Act. Ms. Nelson is also the CCO of ALPS Variable Investment Trust, Liberty All-Star Growth Fund, Inc., Liberty All-Star Equity Fund, Principal Real Estate Income Fund, RiverNorth Opportunities Fund, Inc. and Red Rocks Capital, LLC. |
Patrick D.
Buchanan,
1972 | Treasurer | Since June 2012 | Mr. Buchanan is Vice President of AAI. Mr. Buchanan joined ALPS in 2007 and because of his position with AAI, he is deemed an affiliate of the Trust as defined under the 1940 Act. Mr. Buchanan is also Treasurer of the ALPS Variable Insurance Trust, Principal Real Estate Income Fund, Clough Funds Trust and RiverNorth Opportunities Fund, Inc. |
Andrea E.
Kuchli,
1985 | Secretary | Since December 2017 | Ms. Kuchli joined ALPS in 2015 and is currently Vice President and Senior Counsel of ALPS. Prior to joining ALPS, Ms. Kuchli was an Associate with Davis Graham & Stubbs LLP from April 2014 to February 2015, and an Associate with Dechert LLP from 2011 to April 2014. Because of her position with ALPS, Ms. Kuchli is deemed an affiliate of the Trust as defined under the 1940 Act. Ms. Kuchli is also Secretary of ALPS Variable Investment Trust, Elevation ETF Trust and Principal Real Estate Income Fund as well as Assistant Secretary of the James Advantage Funds. |
Sharon
Akselrod,
1974 | Assistant Secretary | Since December 2016 | Ms. Akselrod joined ALPS in August 2014 and is currently Senior Investment Company Act Paralegal of ALPS Fund Services, Inc. Prior to joining ALPS, Ms. Akselrod served as Corporate Governance and Regulatory Associate for Nordstrom fsb (2013-2014) and Senior Legal Assistant – Legal Manager for AXA Equitable Life Insurance Company (2008-2013). Because of her position with ALPS, Ms. Akselrod is deemed an affiliate of the Trust as defined under the 1940 Act. Ms. Akselrod is also Assistant Secretary of Financial Investors Trust and Principal Real Estate Income Fund. |
Stephanie G.
Danner,
1992 | Assistant Secretary | Since December 2017 | Ms. Danner joined ALPS in September of 2017 and is currently Vice President and Associate Senior Counsel of ALPS. Because of her position with ALPS, Ms. Danner is deemed an affiliate of the Trust as defined under the 1940 Act. |
| * | The business address of each Officer is c/o ALPS Advisors, Inc., 1290 Broadway, Suite 1100, Denver, Colorado 80203. |
| ** | This is the period for which the Officer began serving the Trust. Each Officer serves an indefinite term, until his/her successor is elected. |
The Statement of Additional Information includes additional information about the Fund's Trustees and is available, without charge, upon request by calling (toll-free) 1-866-759-5679.
| Performance Overview | |
| Sprott Gold Miners ETF | 1 |
| Sprott Junior Gold Miners ETF | 4 |
| Disclosure of Fund Expenses | 7 |
| Report of Independent Registered Public Accounting Firm | 8 |
| Financial Statements | |
| Schedules of Investments | |
| Sprott Gold Miners ETF | 9 |
| Sprott Junior Gold Miners ETF | 10 |
| Statements of Assets and Liabilities | 11 |
| Statements of Operations | 12 |
| Statements of Changes in Net Assets | |
| Sprott Gold Miners ETF | 13 |
| Sprott Junior Gold Miners ETF | 14 |
| Financial Highlights | 15 |
| Notes to Financial Statements | 17 |
| Additional Information | 24 |
| Board Considerations Regarding Approval of Investment Advisory Agreements | 26 |
| Trustees & Officers | 27 |
alpsfunds.com
Sprott Gold Miners ETF
| Performance Overview | November 30, 2017 (Unaudited) |
Investment Objective
Sprott Gold Miners ETF (the “Fund”) employs a “passive management”—or indexing—investment approach designed to seek investment results that correspond (before fees and expenses) generally to the performance of the Sprott Zacks Gold Miners Index (the “Underlying Index”).
The Underlying Index was created by Zacks Index Services to provide a means of generally tracking the performance of gold and silver mining companies whose stocks are traded on major U.S. exchanges. The Underlying Index uses a transparent, rules-based methodology that is designed to identify the stocks of 25 gold and silver mining companies with the highest beta† to the spot price of gold, with each stock’s weighting in the index adjusted based on its quarterly revenue growth on a year-over-year basis and the quality of its balance sheet, as measured by long-term debt to equity. The Underlying Index is rebalanced on a quarterly basis to incorporate the latest financial data into the screening process. At least 80% of the Underlying Index (by weight) must consist of gold mining companies while no more than 20% may consist of silver mining companies.
Performance Overview
The Fund for the one-year period ended November 30, 2017 generated a total return of 3.52%, in-line with the Underlying Index, which returned 4.22%. The Fund’s Underlying Index emphasizes companies with the highest historical sensitivity to the price of gold, the highest relative revenue growth and the lowest relative long-term debt to equity. We believe these are important factors in determining the long-run success of senior gold miners.
Gold stocks posted modest gains in the year, despite a gain of 8.66%1 for spot gold during the same time period. Historically, gold stocks have provided “torque” to a higher spot gold price but the performance relationship become somewhat anomalous in the past year. Ebullient equity markets and a range-bound gold price have constrained investor enthusiasm for gold equities. Despite significant gains during 2016, gold stocks remain near historic lows in many valuation metrics. In our view, the current market is looking to the gold price to set the pace for gold equities future returns, and the market seems to be discounting a range-bound gold price. We continue to believe that there are a number of potential catalysts that can propel gold and gold stocks higher, including a correction to equity markets which are trading at high valuations compared to historical levels, the risk that announced tax cuts in the U.S. raise government debt levels, geopolitical risks and the dominance of the U.S. dollar being challenged.
Of the 31 positions that were held at some point on the portfolio during the time period, 14 contributed positively while 17 detracted. The top contributor for the period was Randgold Resources, Ltd., ADR (GOLD) with a total return of 29.11% resulting in 4.36% to the Fund. Wheaton Precious Metals Corp. (WPM) and Agnico Eagle Mines, Ltd. (AEM) ranked 2nd and 3rd contributing 1.41% and 1.36% while returning 11.27% and 7.43% respectively. Goldcorp Inc. (GG) detracted the most from the portfolio losing 23.74% resulting in 3.05% off the return. Helca Mining Co. (HL) and Asanko Gold, Inc. (AKG) were also detractors taking 1.25% and 0.95% from overall Fund return. HL and AKG were down 38.11% and 40.17% in total return, respectively, for the period.
The Underlying Index for the period did not experience material changes with the top 2 holdings, Randgold Resources, Ltd. and Agnico Eagle Mines, Ltd., remaining the largest weights. Both of these companies are considered among the highest quality gold miners given their strong production results, management teams and balance sheets. Larger gold miners as measured in ounces of annual production, such as Barrick Gold Corp. and Newmont Mining Corp., remain smaller weights in the Underlying Index due to their lower revenue growth and higher debt levels.
We continue to believe the underlying Index’s methodology of emphasizing companies with the highest relative revenue growth and lowest relative long-term debt to equity will provide exposure to higher-quality gold companies with stronger production results and the financial strength to take advantage of opportunities in the sector.
| 1 | Source: Bloomberg – December 1st 2016 to November 30th 2017 |
Performance (as of November 30, 2017)
| | 1 Year | 3 Year | Since Inception^ |
| Sprott Gold Miners ETF - NAV | 3.52% | 4.96% | -6.16% |
| Sprott Gold Miners ETF - Market Price* | 3.62% | 4.90% | -6.13% |
| Sprott Zacks Gold Miners Total Return Index | 4.22% | 5.76% | -5.47% |
| S&P 500® Total Return Index | 22.87% | 10.91% | 11.34% |
Total Expense Ratio (per the current prospectus) 0.57%
Performance data quoted represents past performance. Past performance does not guarantee future results. The table does not reflect the deduction of taxes that a shareholder would pay on Fund distributions or the redemption of Fund shares. Investment return and principal value of an investment will fluctuate so that an investor’s shares, when sold or redeemed, may be worth more or less than the original cost. Current performance data may be higher or lower than actual data quoted. For the most current month-end performance data please visit www.alpsfunds.com or call 1.855.215.1425.
Sprott Gold Miners ETF
| Performance Overview | November 30, 2017 (Unaudited) |
NAV is an exchange-traded fund’s per-share value. The per-share dollar amount of the Fund is derived by dividing the total value of all the securities in its portfolio, less any liabilities, by the number of Fund shares outstanding. Market Price is the price at which a share can currently be traded in the market. Information detailing the number of days the Market Price of the Fund was greater than the Fund’s NAV and the number of days it was less than the Fund’s NAV can be obtained at www.alpsfunds.com.
| † | Beta is defined as a sensitivity measure based on regression against the spot gold price movement during the trailing 36 months. |
| ^ | The Fund’s Commencement date was July 15, 2014. |
| * | Market Price is based on the midpoint of the bid-ask spread at 4 p.m. ET and does not represent the returns an investor would receive if shares were traded at other times. |
Sprott Zacks Gold Miners Total Return Index is comprised of approximately 25 stocks selected, based on investment and other criteria, from a universe of gold and silver mining companies whose stock is listed on a major U.S. exchange. The stocks are selected using a proprietary, quantitative rules-based methodology developed by Zacks Index Services.
S&P 500® Total Return Index is the Standard & Poor’s composite index of 500 stocks, a widely recognized, unmanaged index of common stock prices.
The indexes are reported on a total return basis, which assumes reinvestment of any dividends and distributions realized during a given time period. The indexes are not actively managed and do not reflect any deductions for fees, expenses or taxes. One cannot invest directly in an index. Index performance does not reflect fund performance.
The Fund is concentrated in the gold and silver mining industry. As a result, the Fund will be sensitive to changes in, and its performance will depend to a greater extent on, the overall condition of the gold and silver mining industry. Also, gold and silver mining companies are highly dependent on the price of gold and silver bullion. These prices may fluctuate substantially over short periods of time so the Fund’s Share price may be more volatile than other types of investments.
Funds that emphasize investments in small-cap and mid-cap companies will generally experience greater price volatility.
Funds investing in foreign and emerging markets will also generally experience greater price volatility.
The Fund’s shares are not individually redeemable. Investors buy and sell shares of the Fund on a secondary market. Only market makers or “authorized participants” may trade directly with the Fund, typically in blocks of 50,000 shares.
The Sprott Gold Miners ETF is not suitable for all investors. Investments in the Fund are subject to investment risks, including possible loss of the principal amount invested.
ALPS Portfolio Solutions Distributor, Inc., a FINRA member, is the distributor for the Sprott Gold Miners ETF.
ALPS Portfolio Solutions Distributor, Inc. is not affiliated with Sprott or Zacks Index Services, a division of Zacks Investment Management.
Sprott Gold Miners ETF
| Performance Overview | November 30, 2017 (Unaudited) |
Top 10 Holdings* (as of November 30, 2017)
| Randgold Resources, Ltd. | 16.70% |
| Agnico Eagle Mines, Ltd. | 13.66% |
| Goldcorp, Inc. | 12.71% |
| Pan American Silver Corp. | 4.64% |
| Newmont Mining Corp. | 4.63% |
| Cia de Minas Buenaventura SAA | 4.58% |
| Barrick Gold Corp. | 4.47% |
| Kinross Gold Corp. | 4.40% |
| Royal Gold, Inc. | 4.37% |
| IAMGOLD Corp. | 4.27% |
| Total % of Top 10 Holdings | 74.43% |
Country Allocation* (as of November 30, 2017)
| Canada | 60.41% |
| Jersey | 16.70% |
| United States | 12.77% |
| South Africa | 5.54% |
| Peru | 4.58% |
| Total | 100.00% |
| * | % of Total Investments (excluding investments purchased with collateral from securities loaned) |
Future holdings are subject to change.
Growth of $10,000 (as of November 30, 2017)
Comparison of Change in Value of $10,000 Investment in the Fund and the Underlying Index
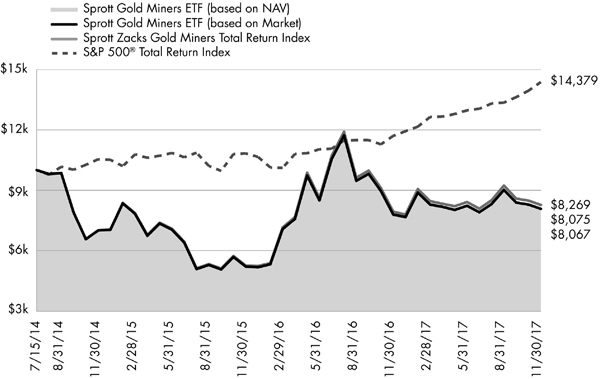
The chart above represents historical performance of a hypothetical investment of $10,000 in the Fund over the life of the Fund. Past performance does not guarantee future results. This chart does not reflect the deduction of taxes that a shareholder would pay on Fund distributions or the redemption of Fund shares.
Sprott Junior Gold Miners ETF
| Performance Overview | November 30, 2017 (Unaudited) |
Investment Objective
Sprott Junior Gold Miners ETF (the “Fund”) employs a “passive management”—or indexing—investment approach designed to seek investment results that correspond (before fees and expenses) generally to the performance of the Sprott Zacks Junior Gold Miners Index (the “Underlying Index”).
The Underlying Index was created by Zacks Index Services to provide a means of generally tracking the performance of “junior” gold and silver mining companies whose stocks are traded on major U.S. or Canadian exchanges. Junior companies include early stage mining companies that are in the exploration stage only or that hold properties that might not ultimately produce gold or silver. The Underlying Index uses a transparent, rules-based methodology that is designed to identify between 30 to 40 junior gold and silver stocks with market capitalization between $250 million and $2 billion. Excluding companies with market capitalization below $250 million aims to exclude very early stage exploration companies whose historical success rate is low. Each stock’s weighting in the Underlying Index is adjusted based on 2 company factors: 1) Revenue Growth and 2) Price Momentum. The Underlying Index is reconstituted on a semi-annual basis, in November and May, to incorporate the latest factor scores into the selection and weighting process. At least 80% of the Underlying Index (by weight) must consist of junior gold mining companies while no more than 20% may consist of junior silver mining companies.
Performance Overview
The Fund for the one-year period to November 30, 2017 generated a total return of -2.99%, in-line with the Underlying Index, which returned -2.07%. The Fund’s Underlying Index emphasizes companies with the highest historical revenue growth and the strongest relative stock price momentum. We believe these are important factors in determining the long-run success of junior gold miners.
Junior gold stocks posted a small loss in the year, despite a gain of 8.66%1 for spot gold during the same time period. Historically, gold stocks have provided “torque” to a higher spot gold price but the performance relationship become somewhat anomalous in the past year. Ebullient equity markets and a range-bound gold price have constrained investor enthusiasm for gold equities. Junior gold stocks also faced further selling pressure during the period when a multi-billion dollar junior gold miners ETF made material changes to its underlying index. The effect of the changes caused price sell-offs in a number of gold stocks which were being eliminated or reduced in the index.
Of the 45 positions that were held at some point on the portfolio for the time period, 16 contributed positively to return while 29 detracted. Kirkland Lake Gold, Ltd. (KL CN) contributed 3.97% returning 82.36% over the period. A close second, IAMGold Corp. (IAG) returned 56.68% adding 3.88% to the overall Fund return. The bottom two performers in the Fund were Asanko Gold, Inc. (AKG CN) and Coeur Mining, Inc. (CDE) detracting 1.96% and 1.47%, respectively. AKG CN and CDE were down 78.53% and 21.04% in total return, respectively, for the period.
Junior gold stocks remain near historic lows in many valuation metrics. In our view, the current market is looking to the gold price to set the pace for gold equities future returns, and the market seems to be discounting a range-bound gold price. We continue to believe that there are a number of potential catalysts that can propel gold and gold stocks higher, including a correction to equity markets which are trading at high valuations compared to historical levels, the risk that announced tax cuts in the U.S. raises government debt levels, geopolitical risks and the dominance of the U.S. dollar being challenged.
The most notable change to the Underlying Index for the period was a shift to smaller market capitalization stocks during the Q4 rebalancing as a number of companies had appreciated in value in excess of the upper market capitalization threshold of $2 billion. Looking forward, we continue to believe the underlying Index’s methodology of emphasizing companies with the highest dollar revenue growth and strongest price momentum will provide exposure to emerging producers as well as exploration companies with promising new discoveries.
| 1 | Source: Bloomberg – December 1st 2016 to November 30th 2017 |
Performance (as of November 30, 2017)
| | 1 Year | Since Inception^ |
| Sprott Junior Gold Miners ETF - NAV | -2.99% | 11.42% |
| Sprott Junior Gold Miners ETF - Market Price* | -3.21% | 11.37% |
| Sprott Zacks Junior Gold Miners Total Return Index | -2.07% | 12.47% |
| S&P 500® Total Return Index | 22.87% | 11.67% |
Total Expense Ratio (per the current prospectus) 0.57%
Performance data quoted represents past performance. Past performance does not guarantee future results. The table does not reflect the deduction of taxes that a shareholder would pay on Fund distributions or the redemption of Fund shares. Investment return and principal value of an investment will fluctuate so that an investor’s shares, when sold or redeemed, may be worth more or less than the original cost. Current performance data may be higher or lower than actual data quoted. For the most current month-end performance data please visit www.alpsfunds.com or call 1.855.215.1425.
Sprott Junior Gold Miners ETF
| Performance Overview | November 30, 2017 (Unaudited) |
NAV is an exchange-traded fund’s per-share value. The per-share dollar amount of the Fund is derived by dividing the total value of all the securities in its portfolio, less any liabilities, by the number of Fund shares outstanding. Market Price is the price at which a share can currently be traded in the market. Information detailing the number of days the Market Price of the Fund was greater than the Fund’s NAV and the number of days it was less than the Fund’s NAV can be obtained at www.alpsfunds.com.
| ^ | The Fund’s Commencement date was March 31, 2015. Total return for a period of less than one year is not annualized. |
| * | Market Price is based on the midpoint of the bid-ask spread at 4 p.m. ET and does not represent the returns an investor would receive if shares were traded at other times. |
Sprott Zacks Junior Gold Miners Total Return Index is comprised of between 30 to 40 stocks selected, based on investment and other criteria, from a universe of gold and silver mining companies whose stocks are listed on a major U.S. or Canadian exchange. The stocks are selected using a proprietary, quantitative rules-based methodology developed by Zacks Index Services.
S&P 500® Total Return Index is the Standard & Poor’s composite index of 500 stocks, a widely recognized, unmanaged index of common stock prices.
The indexes are reported on a total return basis, which assumes reinvestment of any dividends and distributions realized during a given time period. The indexes are not actively managed and do not reflect any deductions for fees, expenses or taxes. One cannot invest directly in an index. Index performance does not reflect fund performance.
The Fund is concentrated in the gold and silver mining industry. As a result, the Fund will be sensitive to changes in, and its performance will depend to a greater extent on, the overall condition of the gold and silver mining industry. Also, gold and silver mining companies are highly dependent on the price of gold and silver bullion. These prices may fluctuate substantially over short periods of time so the Fund’s Share price may be more volatile than other types of investments.
Funds that emphasize investments in small-cap and mid-cap companies will generally experience greater price volatility. Micro-cap stocks involve substantially greater risks of loss and price fluctuations because their earnings and revenues tend to be less predictable. These companies may be newly formed or in the early stages of development, with limited product lines, markets or financial resources and may lack management depth.
Funds investing in foreign and emerging markets will also generally experience greater price volatility.
The Fund’s shares are not individually redeemable. Investors buy and sell shares of the Fund on a secondary market. Only market makers or “authorized participants” may trade directly with the Fund, typically in blocks of 50,000 shares.
The Sprott Junior Gold Miners ETF is not suitable for all investors. Investments in the Fund are subject to investment risks, including possible loss of the principal amount invested.
ALPS Portfolio Solutions Distributor, Inc., a FINRA member, is the distributor for the Sprott Junior Gold Miners ETF.
ALPS Portfolio Solutions Distributor, Inc. is not affiliated with Sprott or Zacks Index Services, a division of Zacks Investment Management.
Sprott Junior Gold Miners ETF
| Performance Overview | November 30, 2017 (Unaudited) |
Top 10 Holdings* (as of November 30, 2017)
| Endeavour Mining Corp. | 8.26% |
| Osisko Gold Royalties, Ltd. | 8.23% |
| Pretium Resources, Inc. | 7.98% |
| Centerra Gold, Inc. | 7.47% |
| Detour Gold Corp. | 5.78% |
| New Gold, Inc. | 5.22% |
| Coeur Mining, Inc. | 3.97% |
| Tahoe Resources, Inc. | 3.81% |
| Sandstorm Gold, Ltd. | 3.32% |
| First Majestic Silver Corp. | 3.15% |
| Total % of Top 10 Holdings | 57.19% |
Country Allocation* (as of November 30, 2017)
| Canada | 71.52% |
| United States | 12.91% |
| Monaco | 8.26% |
| China | 2.71% |
| Australia | 2.39% |
| South Africa | 2.29% |
| Total | 100.00% |
| * | % of Total Investments (excluding investments purchased with collateral from securities loaned) |
Future holdings are subject to change.
Growth of $10,000 (as of November 30, 2017)
Comparison of Change in Value of $10,000 Investment in the Fund and the Underlying Index
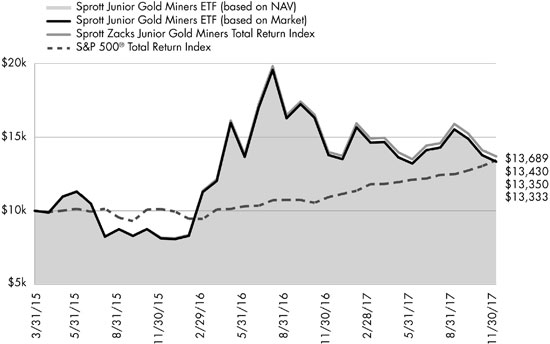
The chart above represents historical performance of a hypothetical investment of $10,000 in the Fund over the life of the Fund. Past performance does not guarantee future results. This chart does not reflect the deduction of taxes that a shareholder would pay on Fund distributions or the redemption of Fund shares.
Sprott ETFs
| Disclosure of Fund Expenses | November 30, 2017 (Unaudited) |
Shareholder Expense Example: As a shareholder of a Fund, you incur two types of costs: (1) transaction costs which may include creation and redemption fees or brokerage charges, and (2) ongoing costs, including management fees and other Fund expenses. These examples are intended to help you understand your ongoing costs (in dollars) of investing in a Fund and to compare these costs with the ongoing costs of investing in other funds. It is based on an investment of $1,000 invested at the beginning of the (six month) period and held through November 30, 2017.
Actual Return: The first line of the table provides information about actual account values and actual expenses. You may use the information in this line, together with the amount you invested, to estimate the expenses that you incurred over the period. Simply divide your account value by $1,000 (for example, an $8,600 account value divided by $1,000 = 8.6), then multiply the result by the number in the first line under the heading entitled “Expenses Paid During Period” to estimate the expenses attributable to your investment during this period.
Hypothetical 5% Return: The second line of the table provides information about hypothetical account values and hypothetical expenses based on each Fund’s actual expense ratio and an assumed rate of return of 5% per year before expenses, which is not the Fund’s actual return. The hypothetical account values and expenses may not be used to estimate the actual ending account balance or expenses you paid for the period. You may use this information to compare ongoing costs of investing in each Fund and other funds. To do so, compare this 5% hypothetical example with the 5% hypothetical examples that appear in the shareholder reports of other funds.
The expenses shown in the table are meant to highlight ongoing Fund costs only and do not reflect any transaction costs, such as creation and redemption fees or brokerage charges. Therefore, the second line is useful in comparing ongoing costs only, and will not help you determine the relative total costs of owning different funds. In addition, if these costs were included, your costs would have been higher.
| | Beginning Account Value 6/1/17 | Ending Account Value 11/30/17 | Expense Ratio(a) | Expenses Paid During Period 6/1/17 - 11/30/17(b) |
| Sprott Gold Miners ETF | | | | |
| Actual | $1,000.00 | $979.70 | 0.57% | $2.83 |
| Hypothetical (5% return before expenses) | $1,000.00 | $1,022.21 | 0.57% | $2.89 |
| Sprott Junior Gold Miners ETF | | | | |
| Actual | $1,000.00 | $1,010.90 | 0.57% | $2.87 |
| Hypothetical (5% return before expenses) | $1,000.00 | $1,022.21 | 0.57% | $2.89 |
| (a) | Annualized, based on the Fund’s most recent fiscal half year expenses. |
| (b) | Expenses are equal to the Fund’s annualized expense ratio multiplied by the average account value over the period, multiplied by the number of days in the most recent fiscal half year (183), divided by 365. |
Sprott ETFs
Report of Independent Registered Public Accounting Firm
To the Board of Trustees and Shareholders of ALPS ETF Trust:
We have audited the accompanying statements of assets and liabilities, including the schedules of investments, of Sprott Gold Miners ETF and Sprott Junior Gold Miners ETF, two of the portfolios constituting the ALPS ETF Trust (the “Trust”), as of November 30, 2017, and the related statements of operations for the year then, the statements of changes in net assets for each of the two years in the period then ended, and the financial highlights for each of the periods presented. These financial statements and financial highlights are the responsibility of the Trust’s management. Our responsibility is to express an opinion on these financial statements and financial highlights based on our audits.
We conducted our audits in accordance with the standards of the Public Company Accounting Oversight Board (United States). Those standards require that we plan and perform the audit to obtain reasonable assurance about whether the financial statements and financial highlights are free of material misstatement. The Trust is not required to have, nor were we engaged to perform, an audit of its internal control over financial reporting. Our audits included consideration of internal control over financial reporting as a basis for designing audit procedures that are appropriate in the circumstances, but not for the purpose of expressing an opinion on the effectiveness of the Trust’s internal control over financial reporting. Accordingly, we express no such opinion. An audit also includes examining, on a test basis, evidence supporting the amounts and disclosures in the financial statements, assessing the accounting principles used and significant estimates made by management, as well as evaluating the overall financial statement presentation. Our procedures included confirmation of securities owned as of November 30, 2017, by correspondence with the custodian and broker. We believe that our audits provide a reasonable basis for our opinion.
In our opinion, the financial statements and financial highlights referred to above present fairly, in all material respects, the financial position of Sprott Gold Miners ETF and Sprott Junior Gold Miners ETF of the ALPS ETF Trust as of November 30, 2017, the results of their operations for the year then ended, the changes in their net assets for each of the two years in the period then ended, and the financial highlights for each of the periods presented, in conformity with accounting principles generally accepted in the United States of America.
DELOITTE & TOUCHE LLP
Denver, Colorado
January 26, 2018
Sprott Gold Miners ETF
| Schedule of Investments | November 30, 2017 |
| Security Description | | Shares | | | Value | |
| COMMON STOCKS (99.91%) | | | | | | | | |
| Gold Mining (88.55%) | | | | | | | | |
| Agnico Eagle Mines, Ltd. | | | 514,299 | | | $ | 22,480,009 | |
| Alamos Gold, Inc., Class A | | | 923,992 | | | | 5,848,869 | |
| AngloGold Ashanti, Ltd., Sponsored ADR | | | 371,328 | | | | 3,880,378 | |
| B2Gold Corp.(a) | | | 1,779,214 | | | | 4,519,204 | |
| Barrick Gold Corp. | | | 533,514 | | | | 7,351,823 | |
| Cia de Minas Buenaventura SAA, ADR | | | 539,342 | | | | 7,545,395 | |
| Gold Fields, Ltd., Sponsored ADR | | | 747,985 | | | | 3,163,976 | |
| Goldcorp, Inc. | | | 1,655,062 | | | | 20,919,984 | |
| Harmony Gold Mining Co., Ltd., Sponsored ADR | | | 461,413 | | | | 849,000 | |
| IAMGOLD Corp.(a) | | | 1,293,156 | | | | 7,021,837 | |
| Kinross Gold Corp.(a) | | | 1,742,414 | | | | 7,248,442 | |
| McEwen Mining, Inc.(b) | | | 1,453,177 | | | | 2,920,886 | |
| Newmont Mining Corp. | | | 205,979 | | | | 7,619,163 | |
| Randgold Resources, Ltd., ADR(b) | | | 299,461 | | | | 27,478,541 | |
| Royal Gold, Inc. | | | 86,920 | | | | 7,190,022 | |
| Sandstorm Gold, Ltd.(a)(b) | | | 642,914 | | | | 2,803,105 | |
| Seabridge Gold, Inc.(a)(b) | | | 66,439 | | | | 714,219 | |
| Sibanye Gold, Ltd., Sponsored ADR | | | 219,133 | | | | 1,220,571 | |
| SSR Mining, Inc.(a) | | | 323,705 | | | | 2,693,226 | |
| Yamana Gold, Inc.(b) | | | 878,866 | | | | 2,232,320 | |
| Total Gold Mining | | | | | | | 145,700,970 | |
| | | | | | | | | |
| Silver Mining (11.36%) | | | | | | | | |
| Coeur Mining, Inc.(a) | | | 356,342 | | | | 2,715,326 | |
| First Majestic Silver Corp.(a)(b) | | | 324,537 | | | | 2,164,662 | |
| Fortuna Silver Mines, Inc.(a)(b) | | | 688,873 | | | | 2,893,266 | |
| Hecla Mining Co. | | | 881,864 | | | | 3,298,171 | |
| Pan American Silver Corp. | | | 504,041 | | | | 7,631,181 | |
| Total Silver Mining | | | | | | | 18,702,606 | |
| | | | | | | | | |
| TOTAL COMMON STOCKS | | | | | | | | |
| (Cost $163,065,557) | | | | | | | 164,403,576 | |
| | | 7 Day Yield | | | Shares | | | Value | |
| SHORT TERM INVESTMENTS (14.69%) | | | | | | | | | |
| Money Market Fund (0.12%) | | | | | | | | | |
| State Street Institutional Treasury Plus Money Market Fund | | | | | | | | | |
| (Cost $192,087) | | | 0.970 | % | | | 192,087 | | | | 192,087 | |
| | | | | | | | | | | | | |
| Investments Purchased with Collateral from Securities Loaned (14.57%) | | | | | | | | | |
| State Street Navigator Securities Lending Prime Portfolio, 1.04% | | | | | | | | | |
| (Cost $23,981,023) | | | | | | 23,981,023 | | | | 23,981,023 | |
| TOTAL SHORT TERM INVESTMENTS | | | | | | | | | |
| (Cost $24,173,110) | | | | | | | | | 24,173,110 | |
| | | 7 Day Yield | | | | | | Value | |
| TOTAL INVESTMENTS (114.60%) | | | | | | | | |
| (Cost $187,238,667) | | | | | | | $ | 188,576,686 | |
| | | | | | | | | | | | | |
| NET LIABILITIES LESS OTHER ASSETS (-14.60%) | | | | | | | | (24,031,276 | ) |
| | | | | | | | | | |
| NET ASSETS (100.00%) | | | | | | | $ | 164,545,410 | |
| (a) | Non-income producing security. |
| (b) | Security, or a portion of the security position, is currently on loan. The total market value of securities on loan is $23,137,637. |
See Notes to Financial Statements.
Sprott Junior Gold Miners ETF
| Schedule of Investments | November 30, 2017 |
| Security Description | | Shares | | | Value | |
| COMMON STOCKS (99.95%) | | | | | | | | |
| Gold Mining (84.91%) | | | | | | | | |
| Alacer Gold Corp.(a)(b) | | | 1,289,782 | | | $ | 2,089,404 | |
| Alamos Gold, Inc., Class A | | | 630,695 | | | | 3,992,299 | |
| Argonaut Gold, Inc.(a)(b) | | | 1,152,516 | | | | 2,108,234 | |
| Centerra Gold, Inc.(b) | | | 1,974,444 | | | | 11,171,911 | |
| China Gold International Resources Corp., Ltd.(a)(b) | | | 2,467,392 | | | | 4,054,467 | |
| Continental Gold, Inc.(a)(b) | | | 428,579 | | | | 1,006,545 | |
| Dalradian Resources, Inc.(b) | | | 620,600 | | | | 687,872 | |
| Detour Gold Corp.(b) | | | 796,600 | | | | 8,644,266 | |
| Eldorado Gold Corp. | | | 1,704,800 | | | | 1,926,424 | |
| Endeavour Mining Corp.(a)(b) | | | 682,420 | | | | 12,350,895 | |
| Gold Standard Ventures Corp.(a)(b) | | | 528,029 | | | | 744,521 | |
| Golden Star Resources, Ltd.(a)(b) | | | 2,284,295 | | | | 1,968,149 | |
| Guyana Goldfields, Inc.(b) | | | 1,170,068 | | | | 3,972,327 | |
| Harmony Gold Mining Co., Ltd., Sponsored ADR | | | 1,859,890 | | | | 3,422,198 | |
| Klondex Mines, Ltd.(b) | | | 826,636 | | | | 2,043,924 | |
| New Gold, Inc.(b) | | | 2,517,708 | | | | 7,804,895 | |
| Novagold Resources, Inc.(a)(b) | | | 679,490 | | | | 2,616,037 | |
| OceanaGold Corp. | | | 1,386,400 | | | | 3,567,684 | |
| Osisko Gold Royalties, Ltd.(a) | | | 1,036,223 | | | | 12,296,690 | |
| Premier Gold Mines, Ltd.(b) | | | 1,342,947 | | | | 3,778,551 | |
| Pretium Resources, Inc.(a)(b) | | | 1,115,249 | | | | 11,933,164 | |
| Sandstorm Gold, Ltd.(a)(b) | | | 1,136,937 | | | | 4,957,045 | |
| Seabridge Gold, Inc.(a)(b) | | | 118,759 | | | | 1,276,659 | |
| SEMAFO, Inc.(b) | | | 1,487,602 | | | | 3,678,216 | |
| SSR Mining, Inc.(b) | | | 250,250 | | | | 2,082,080 | |
| Tahoe Resources, Inc. | | | 1,292,800 | | | | 5,701,248 | |
| TMAC Resources, Inc.(a)(b)(c) | | | 614,233 | | | | 3,546,902 | |
| Torex Gold Resources, Inc.(b) | | | 359,842 | | | | 3,561,743 | |
| Total Gold Mining | | | | | | | 126,984,350 | |
| | | | | | | | | |
| Silver Mining (15.04%) | | | | | | | | |
| Coeur Mining, Inc.(b) | | | 779,550 | | | | 5,940,171 | |
| Endeavour Silver Corp.(b) | | | 277,475 | | | | 582,698 | |
| First Majestic Silver Corp.(a)(b) | | | 705,911 | | | | 4,708,426 | |
| Fortuna Silver Mines, Inc.(b) | | | 995,895 | | | | 4,182,759 | |
| Hecla Mining Co. | | | 892,500 | | | | 3,337,950 | |
| MAG Silver Corp.(b) | | | 176,858 | | | | 1,873,929 | |
| Silvercorp Metals, Inc. | | | 759,231 | | | | 1,865,490 | |
| Total Silver Mining | | | | | | | 22,491,423 | |
| | | | | | | | | |
| TOTAL COMMON STOCKS | | | | | | | | |
| (Cost $156,787,282) | | | | | | | 149,475,773 | |
| | | 7 Day Yield | | | Shares | | | Value | |
| SHORT TERM INVESTMENTS (7.04%) | | | | | | | | | |
| Money Market Fund (0.08%) | | | | | | | | | |
| State Street Institutional Treasury Plus Money Market Fund | | | | | | | | | |
| (Cost $119,924) | | | 0.970 | % | | | 119,924 | | | | 119,924 | |
| | | 7 Day Yield | | | Shares | | | Value | |
| Investments Purchased with Collateral from Securities Loaned (6.96%) | | | | | | | |
| State Street Navigator Securities Lending Prime Portfolio, 1.04% | | | | | | | | | |
| (Cost $10,415,527) | | | | | | | 10,415,527 | | | $ | 10,415,527 | |
| TOTAL SHORT TERM INVESTMENTS | | | | | | | | | |
| (Cost $10,535,451) | | | | | | | | 10,535,451 | |
| | | | | | | | | | |
| TOTAL INVESTMENTS (106.99%) | | | | | | | | | |
| (Cost $167,322,733) | | | | | | | $ | 160,011,224 | |
| | | | | | | | | | | | | |
| NET LIABILITIES LESS OTHER ASSETS (-6.99%) | | | | | | | | (10,460,761 | ) |
| | | | | | | | | | |
| NET ASSETS (100.00%) | | | | | | | $ | 149,550,463 | |
| (a) | Security, or a portion of the security position, is currently on loan. The total market value of securities on loan is $11,584,855. |
| (b) | Non-income producing security. |
| (c) | Securities were purchased pursuant to Regulation S under the Securities Act of 1933, which exempts securities offered and sold outside of the United States from registration. Such securities cannot be sold in the United States without either an effective registration statement filed pursuant to the Securities Act of 1933, or pursuant to an exemption from registration. As of November 30, 2017, the market value of those securities was $3,546,902 representing 2.37% of net assets. |
See Notes to Financial Statements.
Sprott ETFs
| Statements of Assets and Liabilities | November 30, 2017 |
| | | Sprott Gold Miners ETF | | | Sprott Junior Gold Miners ETF | |
| ASSETS: | | | | | | | | |
| Investments, at value | | $ | 188,576,686 | | | $ | 160,011,224 | |
| Foreign tax reclaims | | | 15,583 | | | | 1,964 | |
| Dividends receivable | | | 100,670 | | | | 25,011 | |
| Total Assets | | | 188,692,939 | | | | 160,038,199 | |
| | | | | | | | | |
| LIABILITIES: | | | | | | | | |
| Payable for investments purchased | | | 87,567 | | | | – | |
| Payable to adviser | | | 78,939 | | | | 72,209 | |
| Payable for collateral upon return of securities loaned | | | 23,981,023 | | | | 10,415,527 | |
| Total Liabilities | | | 24,147,529 | | | | 10,487,736 | |
| NET ASSETS | | $ | 164,545,410 | | | $ | 149,550,463 | |
| | | | | | | | | |
| NET ASSETS CONSIST OF: | | | | | | | | |
| Paid-in capital | | $ | 238,219,194 | | | $ | 170,981,091 | |
| Accumulated net investment income/(loss) | | | 1,061,993 | | | | (370,715 | ) |
| Accumulated net realized loss | | | (76,073,796 | ) | | | (13,748,314 | ) |
| Net unrealized appreciation/(depreciation) | | | 1,338,019 | | | | (7,311,599 | ) |
| NET ASSETS | | $ | 164,545,410 | | | $ | 149,550,463 | |
| | | | | | | | | |
| INVESTMENTS, AT COST | | $ | 187,238,667 | | | $ | 167,322,733 | |
| | | | | | | | | |
| PRICING OF SHARES | | | | | | | | |
| Net Assets | | $ | 164,545,410 | | | $ | 149,550,463 | |
| Shares of beneficial interest outstanding (Unlimited number of shares authorized, par value $0.01 per share) | | | 8,300,000 | | | | 4,750,000 | |
| Net Asset Value, offering and redemption price per share | | $ | 19.82 | | | $ | 31.48 | |
See Notes to Financial Statements.
Sprott ETFs
| Statements of Operations | For the Year Ended November 30, 2017 |
| | | Sprott Gold Miners ETF | | | Sprott Junior Gold Miners ETF | |
| INVESTMENT INCOME: | | | | | | |
| Dividends(a) | | $ | 1,240,316 | | | $ | 165,592 | |
| Securities lending income | | | 210,759 | | | | 185,009 | |
| Total Investment Income | | | 1,451,075 | | | | 350,601 | |
| | | | | | | | | |
| EXPENSES: | | | | | | | | |
| Investment adviser fees | | | 1,063,394 | | | | 645,323 | |
| Total Expense | | | 1,063,394 | | | | 645,323 | |
| NET INVESTMENT INCOME/(LOSS) | | | 387,681 | | | | (294,722 | ) |
| | | | | | | | | |
| REALIZED AND UNREALIZED GAIN/(LOSS) | | | | | | | | |
| Net realized gain/(loss) on investments | | | (18,766,672 | ) | | | 5,274,207 | |
| Net realized gain/(loss) on foreign currency transactions | | | 171 | | | | (7,504 | ) |
| Net realized gain/(loss) | | | (18,766,501 | ) | | | 5,266,703 | |
| Net change in unrealized appreciation/(depreciation) on investments | | | 24,893,190 | | | | (8,016,044 | ) |
| Net change in unrealized appreciation on translation of assets and liabilities denominated in foreign currencies | | | – | | | | 2,972 | |
| Net change in unrealized appreciation/(depreciation) | | | 24,893,190 | | | | (8,013,072 | ) |
| NET REALIZED AND UNREALIZED GAIN/LOSS ON INVESTMENTS | | | 6,126,689 | | | | (2,746,369 | ) |
| NET INCREASE/(DECREASE) IN NET ASSETS RESULTING FROM OPERATIONS | | $ | 6,514,370 | | | $ | (3,041,091 | ) |
| (a) | Net of foreign tax withholding in the amounts of $141,603 and $29,108 respectively. |
See Notes to Financial Statements.
Sprott Gold Miners ETF
Statements of Changes in Net Assets
| | | For the Year Ended November 30, 2017 | | | For the Year Ended November 30, 2016 | |
| OPERATIONS: | | | | | | |
| Net investment income/(loss) | | $ | 387,681 | | | $ | (22,365 | ) |
| Net realized gain/(loss) | | | (18,766,501 | ) | | | 28,894,011 | |
| Net change in unrealized appreciation | | | 24,893,190 | | | | 18,872,591 | |
| Net increase in net assets resulting from operations | | | 6,514,370 | | | | 47,744,237 | |
| | | | | | | | | |
| DISTRIBUTIONS TO SHAREHOLDERS: | | | | | | | | |
| From net investment income | | | (35,497 | ) | | | (1,513,542 | ) |
| Total distributions | | | (35,497 | ) | | | (1,513,542 | ) |
| | | | | | | | | |
| CAPITAL SHARE TRANSACTIONS: | | | | | | | | |
| Proceeds from sale of shares | | | 30,281,812 | | | | 177,943,316 | |
| Cost of shares redeemed | | | (56,080,225 | ) | | | (152,466,664 | ) |
| Net increase/(decrease) from capital share transactions | | | (25,798,413 | ) | | | 25,476,652 | |
| Net increase/(decrease) in net assets | | | (19,319,540 | ) | | | 71,707,347 | |
| | | | | | | | | |
| NET ASSETS: | | | | | | | | |
| Beginning of year | | | 183,864,950 | | | | 112,157,603 | |
| End of year * | | $ | 164,545,410 | | | $ | 183,864,950 | |
| | | | | | | | | |
| *Including accumulated net investment income/(loss) of: | | $ | 1,061,993 | | | $ | (92,793 | ) |
| | | | | | | | | |
| OTHER INFORMATION: | | | | | | | | |
| CAPITAL SHARE TRANSACTIONS: | | | | | | | | |
| Beginning shares | | | 9,600,000 | | | | 8,650,000 | |
| Shares sold | | | 1,500,000 | | | | 7,650,000 | |
| Shares redeemed | | | (2,800,000 | ) | | | (6,700,000 | ) |
| Shares outstanding, end of period | | | 8,300,000 | | | | 9,600,000 | |
See Notes to Financial Statements.
Sprott Junior Gold Miners ETF
Statements of Changes in Net Assets
| | | For the Year Ended November 30, 2017 | | | For the Year Ended November 30, 2016 | |
| OPERATIONS: | | | | | | |
| Net investment loss | | $ | (294,722 | ) | | $ | (59,387 | ) |
| Net realized gain | | | 5,266,703 | | | | 10,172,424 | |
| Net change in unrealized appreciation/(depreciation) | | | (8,013,072 | ) | | | 2,281,995 | |
| Net increase/(decrease) in net assets resulting from operations | | | (3,041,091 | ) | | | 12,395,032 | |
| | | | | | | | | |
| DISTRIBUTIONS TO SHAREHOLDERS: | | | | | | | | |
| From net investment income | | | (815,000 | ) | | | (195,292 | ) |
| Total distributions | | | (815,000 | ) | | | (195,292 | ) |
| | | | | | | | | |
| CAPITAL SHARE TRANSACTIONS: | | | | | | | | |
| Proceeds from sale of shares | | | 151,798,691 | | | | 53,843,641 | |
| Cost of shares redeemed | | | (46,248,833 | ) | | | (41,765,613 | ) |
| Net increase from capital share transactions | | | 105,549,858 | | | | 12,078,028 | |
| Net increase in net assets | | | 101,693,767 | | | | 24,277,768 | |
| | | | | | | | | |
| NET ASSETS: | | | | | | | | |
| Beginning of year | | | 47,856,696 | | | | 23,578,928 | |
| End of year * | | $ | 149,550,463 | | | $ | 47,856,696 | |
| | | | | | | | | |
| *Including accumulated net investment loss of: | | $ | (370,715 | ) | | $ | (102,091 | ) |
| | | | | | | | | |
| OTHER INFORMATION: | | | | | | | | |
| CAPITAL SHARE TRANSACTIONS: | | | | | | | | |
| Beginning shares | | | 1,450,000 | | | | 1,200,000 | |
| Shares sold | | | 4,700,000 | | | | 1,500,000 | |
| Shares redeemed | | | (1,400,000 | ) | | | (1,250,000 | ) |
| Shares outstanding, end of period | | | 4,750,000 | | | | 1,450,000 | |
See Notes to Financial Statements.
Sprott Gold Miners ETF
| Financial Highlights | For a Share Outstanding Throughout the Periods Presented |
| | | For the Year Ended November 30, 2017 | | | For the Year Ended November 30, 2016 | | | For the Year Ended November 30, 2015 | | | For the Period July 15, 2014 (Commencement of Operations) to November 30, 2014 | |
| NET ASSET VALUE, BEGINNING OF PERIOD | | $ | 19.15 | | | $ | 12.97 | | | $ | 17.44 | | | $ | 25.00 | |
| | | | | | | | | | | | | | | | | |
| INCOME/(LOSS) FROM INVESTMENT OPERATIONS: | | | | | | | | | | | | | | | | |
| Net investment income (a) | | | 0.04 | | | | (0.00 | )(b) | | | 0.10 | | | | 0.02 | |
| Net realized and unrealized gain/(loss) | | | 0.63 | | | | 6.37 | | | | (4.52 | ) | | | (7.58 | ) |
| Total from investment operations | | | 0.67 | | | | 6.37 | | | | (4.42 | ) | | | (7.56 | ) |
| | | | | | | | | | | | | | | | | |
| DISTRIBUTIONS: | | | | | | | | | | | | | | | | |
| From net investment income | | | (0.00 | )(b) | | | (0.19 | ) | | | (0.05 | ) | | | – | |
| Total distributions | | | (0.00 | )(b) | | | (0.19 | ) | | | (0.05 | ) | | | – | |
| | | | | | | | | | | | | | | | | |
| Net increase/(decrease) in net asset value | | | 0.67 | | | | 6.18 | | | | (4.47 | ) | | | (7.56 | ) |
| NET ASSET VALUE, END OF PERIOD | | $ | 19.82 | | | $ | 19.15 | | | $ | 12.97 | | | $ | 17.44 | |
| TOTAL RETURN(c) | | | 3.52 | % | | | 49.82 | % | | | (25.44 | )% | | | (30.24 | )% |
| | | | | | | | | | | | | | | | | |
| RATIOS/SUPPLEMENTAL DATA: | | | | | | | | | | | | | | | | |
| Net assets, end of period (000s) | | $ | 164,545 | | | $ | 183,865 | | | $ | 112,158 | | | $ | 88,956 | |
| | | | | | | | | | | | | | | | | |
| Ratio of expenses to average net assets | | | 0.57 | % | | | 0.57 | % | | | 0.57 | % | | | 0.57 | %(d) |
| Ratio of net investment income/(loss) to average net assets | | | 0.21 | % | | | (0.01 | )% | | | 0.61 | % | | | 0.31 | %(d) |
| Portfolio turnover rate(e) | | | 101 | % | | | 74 | % | | | 78 | % | | | 36 | % |
| (a) | Based on average shares outstanding during the period. |
| (b) | Less than $0.005 per share. |
| (c) | Total return is calculated assuming an initial investment made at the net asset value at the beginning of the period and redemption at the net asset value on the last day of the period and assuming all distributions are reinvested at reinvestment prices. Total return calculated for a period of less than one year is not annualized. |
| (e) | Portfolio turnover for periods less than one year are not annualized and does not include securities received or delivered from processing creations or redemptions in-kind. |
See Notes to Financial Statements.
| Sprott Junior Gold Miners ETF | |
| Financial Highlights | For a Share Outstanding Throughout the Periods Presented |
| | | For the Year Ended November 30, 2017 | | | For the Year Ended November 30, 2016 | | | For the Period March 31, 2015 (Commencement of Operations) to November 30, 2015 | |
| NET ASSET VALUE, BEGINNING OF PERIOD | | $ | 33.00 | | | $ | 19.65 | | | $ | 24.18 | |
| | | | | | | | | | | | | |
| INCOME/(LOSS) FROM INVESTMENT OPERATIONS: | | | | | | | | | | | | |
| Net investment income/(loss) (a) | | | (0.09 | ) | | | (0.05 | ) | | | 0.04 | |
| Net realized and unrealized gain/(loss) | | | (0.87 | ) | | | 13.56 | | | | (4.57 | ) |
| Total from investment operations | | | (0.96 | ) | | | 13.51 | | | | (4.53 | ) |
| | | | | | | | | | | | | |
| DISTRIBUTIONS: | | | | | | | | | | | | |
| From net investment income | | | (0.56 | ) | | | (0.16 | ) | | | – | |
| Total distributions | | | (0.56 | ) | | | (0.16 | ) | | | – | |
| | | | | | | | | | | | | |
| Net increase/(decrease) in net asset value | | | (1.52 | ) | | | 13.35 | | | | (4.53 | ) |
| NET ASSET VALUE, END OF PERIOD | | $ | 31.48 | | | $ | 33.00 | | | $ | 19.65 | |
| TOTAL RETURN(b) | | | (2.99 | )% | | | 69.35 | % | | | (18.73 | )% |
| | | | | | | | | | | | | |
| RATIOS/SUPPLEMENTAL DATA: | | | | | | | | | | | | |
| Net assets, end of period (000s) | | $ | 149,550 | | | $ | 47,857 | | | $ | 23,579 | |
| | | | | | | | | | | | | |
| Ratio of expenses to average net assets | | | 0.57 | % | | | 0.57 | % | | | 0.57 | %(c) |
| Ratio of net investment income/(loss) to average net assets | | | (0.26 | )% | | | (0.14 | )% | | | 0.29 | %(c) |
| Portfolio turnover rate(d) | | | 74 | % | | | 61 | % | | | 71 | % |
| (a) | Based on average shares outstanding during the period. |
| (b) | Total return is calculated assuming an initial investment made at the net asset value at the beginning of the period and redemption at the net asset value on the last day of the period and assuming all distributions are reinvested at reinvestment prices. Total return calculated for a period of less than one year is not annualized. |
| (d) | Portfolio turnover for periods less than one year are not annualized and does not include securities received or delivered from processing creations or redemptions in-kind. |
See Notes to Financial Statements.
| Notes to Financial Statements | November 30, 2017 |
1. ORGANIZATION
ALPS ETF Trust (the “Trust”), a Delaware statutory trust, is an open-end management investment company under the Investment Company Act of 1940, as amended (the “1940 Act”). As of November 30, 2017, the Trust consisted of nineteen separate portfolios. Each portfolio represents a separate series of the Trust. This report pertains to the Sprott Gold Miners ETF and the Sprott Junior Gold Miners ETF (each a “Fund” and collectively, the “Funds”).
The investment objective of the Sprott Gold Miners ETF is to seek investment results that correspond (before fees and expenses) generally to the performance of its underlying index, the Sprott Zacks Gold Miners Index (the “Underlying Index”). The investment advisor uses a “passive” or indexing approach to try to achieve the Fund’s investment objective. The Sprott Gold Miners ETF is considered non-diversified and may invest a greater portion of assets in securities of individual issuers than a diversified fund. As a result, changes in the market value of a single investment could cause greater fluctuations in share price than would occur in a diversified fund.
The investment objective of the Sprott Junior Gold Miners ETF is to seek investment results that correspond (before fees and expenses) generally to the performance of its underlying index, the Sprott Zacks Junior Gold Miners Index (the “Underlying Index”). The investment advisor uses a “passive” or indexing approach to try to achieve the Fund’s investment objective. The Sprott Junior Gold Miners ETF is considered non-diversified and may invest a greater portion of assets in securities of individual issuers than a diversified fund. As a result, changes in the market value of a single investment could cause greater fluctuations in share price than would occur in a diversified fund.
The Funds’ Shares (“Shares”) are listed on the New York Stock Exchange Arca. Each Fund issues and redeems Shares, at net asset value (“NAV”) in blocks of 50,000 Shares, each of which is called a “Creation Unit”. Creation Units are issued and redeemed principally in-kind for securities included in the specified Underlying Index. Except when aggregated in Creation Units, Shares are not redeemable securities of the Fund.
Pursuant to the Trust’s organizational documents, its Officers and Trustees are indemnified against certain liability arising out of the performance of their duties to the Trust. Additionally, in the normal course of business, the Trust enters into contracts with service providers that contain general indemnification clauses. The Trust’s maximum exposure under these arrangements is unknown, as this would involve future claims that may be made against the Trust that have not yet occurred.
2. SIGNIFICANT ACCOUNTING POLICIES
The following is a summary of significant accounting policies consistently followed by the Funds in the preparation of the financial statements. The accompanying financial statements were prepared in accordance with accounting principles generally accepted in the United States of America (“U.S. GAAP”). The preparation of financial statements in conformity with U.S. GAAP requires management to make certain estimates and assumptions that affect the reported amounts of assets and liabilities and disclosures of contingent assets and liabilities at the date of the financial statements and the reported amounts of revenue and expenses during the period. Actual results could differ from those estimates. Each Fund is considered an investment company under U.S. GAAP and follows the accounting and reporting guidance applicable to investment companies in the Financial Accounting Standards Board Accounting Standards Codification Topic 946.
A. Portfolio Valuation
Each Fund’s NAV is determined daily, as of the close of regular trading on the NYSE, normally 4:00 p.m. Eastern time, on each day the NYSE is open for trading. The NAV is computed by dividing the value of all assets of the Fund (including accrued interest and dividends), less all liabilities (including accrued expenses and dividends declared but unpaid), by the total number of shares outstanding.
Portfolio securities listed on any exchange other than the NASDAQ Stock Market LLC (“NASDAQ”) are valued at the last sale price on the business day as of which such value is being determined. If there has been no sale on such day, the securities are valued at the mean of the most recent bid and ask prices on such day. Securities traded on the NASDAQ are valued at the NASDAQ Official Closing Price as determined by NASDAQ. Portfolio securities traded on more than one securities exchange are valued at the last sale price on the business day as of which such value is being determined at the close of the exchange representing the principal market for such securities. Portfolio securities traded in the over-the-counter market, but excluding securities traded on the NASDAQ, are valued at the last quoted sale price in such market.
The Funds’ investments are valued at market value or, in the absence of market value with respect to any portfolio securities, at fair value according to procedures adopted by the Trust’s Board of Trustees (the “Board”). When market quotations are not readily available or when events occur that make established valuation methods unreliable, securities of the Funds may be valued in good faith by or under the direction of the Board. These securities generally include, but are not limited to, restricted securities (securities which may not be publicly sold without registration under the Securities Act of 1933) for which a pricing service is unable to provide a market price; securities whose trading has been formally suspended; a security whose market price is not available from a pre-established primary pricing source or the pricing source is not willing to provide a price; a security with respect to which an event has occurred that is most likely to materially affect the value of the security after the market has closed but before the calculation of the Fund’s NAV or make it difficult or impossible to obtain a reliable market quotation; or a security whose price, as provided by the pricing service, does not reflect the security’s “fair value” due to the security being de-listed from a national exchange or the security’s primary trading market is temporarily closed at a time when, under normal conditions, it would be open. As a general principle, the current “fair value” of a security would be the amount which the owner might reasonably expect to receive from the sale on the applicable exchange or principal market. A variety of factors may be considered in determining the fair value of such securities.
| Notes to Financial Statements | November 30, 2017 |
B. Fair Value Measurements
Each Fund discloses the classification of its fair value measurements following a three-tier hierarchy based on the inputs used to measure fair value. Inputs refer broadly to the assumptions that market participants would use in pricing the asset or liability, including assumptions about risk. Inputs may be observable or unobservable. Observable inputs reflect the assumptions market participants would use in pricing the asset or liability that are developed based on market data obtained from sources independent of the reporting entity. Unobservable inputs reflect the reporting entity’s own assumptions about the assumptions market participants would use in pricing the asset or liability that are developed based on the best information available.
Valuation techniques used to value the Funds’ investments by major category are as follows:
Equity securities, including restricted securities, for which market quotations are readily available, are valued at the last reported sale price or official closing price as reported by a third party pricing vendor on the primary market or exchange on which they are traded and are categorized as Level 1 in the hierarchy. In the event there were no sales during the day or closing prices are not available, securities are valued at the mean of the most recent quoted bid and ask prices on such day and are generally categorized as Level 2 in the hierarchy. Investments in open-end mutual funds are valued at their closing NAV each business day and are categorized as Level 1 in the hierarchy.
Changes in valuation techniques may result in transfers in or out of an assigned level within the disclosure hierarchy.
Various inputs are used in determining the value of each Fund’s investments as of the end of the reporting period. When inputs used fall into different levels of the fair value hierarchy, the level in the hierarchy within which the fair value measurement falls is determined based on the lowest level input that is significant to the fair value measurement in its entirety. The designated input levels are not necessarily an indication of the risk or liquidity associated with these investments.
These inputs are categorized in the following hierarchy under applicable financial accounting standards:
| Level 1 – | Unadjusted quoted prices in active markets for identical investments, unrestricted assets or liabilities that a Fund has the ability to access at the measurement date; |
| Level 2 – | Quoted prices which are not active, quoted prices for similar assets or liabilities in active markets or inputs other than quoted prices that are observable (either directly or indirectly) for substantially the full term of the asset or liability; and |
| Level 3 – | Significant unobservable prices or inputs (including the Fund’s own assumptions in determining the fair value of investments) where there is little or no market activity for the asset or liability at the measurement date. |
The following is a summary of the inputs used to value the Funds’ investments at November 30, 2017:
Sprott Gold Miners ETF
| Investments in Securities at Value* | | Level 1 - Unadjusted Quoted Prices | | | Level 2 - Other Significant Observable Inputs | | | Level 3 - Significant Unobservable Inputs | | | Total | |
| Common Stocks | | $ | 164,403,576 | | | $ | – | | | $ | – | | | $ | 164,403,576 | |
| Short Term Investments | | | | | | | | | | | | | | | | |
| Money Market Fund | | | 192,087 | | | | – | | | | – | | | | 192,087 | |
| Investments Purchased with Collateral from Securities Loaned | | | 23,981,023 | | | | – | | | | – | | | | 23,981,023 | |
| TOTAL | | $ | 188,576,686 | | | $ | – | | | $ | – | | | $ | 188,576,686 | |
| Notes to Financial Statements | November 30, 2017 |
Sprott Junior Gold Miners ETF
| Investments in Securities at Value* | | Level 1 - Unadjusted Quoted Prices | | | Level 2 - Other Significant Observable Inputs | | | Level 3 - Significant Unobservable Inputs | | | Total | |
| Common Stocks | | $ | 149,475,773 | | | $ | – | | | $ | – | | | $ | 149,475,773 | |
| Short Term Investments | | | | | | | | | | | | | | | | |
| Money Market Fund | | | 119,924 | | | | – | | | | – | | | | 119,924 | |
| Investments Purchased with Collateral from Securities Loaned | | | 10,415,527 | | | | – | | | | – | | | | 10,415,527 | |
| TOTAL | | $ | 160,011,224 | | | $ | – | | | $ | – | | | $ | 160,011,224 | |
| * | For a detailed sector breakdown, see the accompanying Schedule of Investments. |
The Funds recognize transfers between levels as of the end of the period. For the year ended November 30, 2017, the Funds did not have any transfers between Level 1 and Level 2 securities. The Funds did not have any securities that used significant unobservable inputs (Level 3) in determining fair value.
C. Gold and Silver Mining Industry Risk
The Funds are concentrated in the gold and silver mining industry. As a result, these Funds will be sensitive to changes in, and their performance will depend to a greater extent on, the overall condition of the gold and silver mining industry. Competitive pressures may have a significant effect on the financial condition of such companies in the gold and silver mining industry. Also, gold and silver mining companies are highly dependent on the price of gold and silver bullion. These prices may fluctuate substantially over short periods of time so a Fund’s Share price may be more volatile than other types of investments. In times of significant inflation or great economic uncertainty, gold, silver and other precious metals may outperform traditional investments such as bonds and stocks. However, in times of stable economic growth, traditional equity and debt investments could offer greater appreciation potential and the value of gold, silver and other precious metals may be adversely affected, which could in turn affect a Fund’s returns. The production and sale of precious metals by governments or central banks or other large holders can be affected by various economic, financial, social and political factors, which may be unpredictable and may have a significant impact on the supply and prices of precious metals. Economic and political conditions in those countries that are the largest producers of gold may have a direct effect on the production and marketing of gold and on sales of central bank gold holdings. Some gold and precious metals mining operation companies may hedge their exposure to falls in gold and precious metals prices by selling forward future production, which may result in lower returns during periods when the price of gold and precious metals increases. The gold and precious metals industry can be significantly affected by events relating to international political developments, the success of exploration projects, commodity prices and tax and government regulations. If a natural disaster or other event with a significant economic impact occurs in a region where the companies in which each Fund invests operate, such disaster or event could negatively affect the profitability of such companies and, in turn, the Funds’ investment in them.
D. Foreign Investment Risk
The Funds’ investments in non-U.S. issuers may involve unique risks compared to investing in securities of U.S. issuers, including, among others, greater market volatility than U.S. securities and less complete financial information than for U.S. issuers. In addition, adverse political, economic or social developments could undermine the value of a Fund’s investments or prevent a Fund from realizing the full value of its investments. Financial reporting standards for companies based in foreign markets differ from those in the United States. Finally, the value of the currency of the country in which a Fund has invested could decline relative to the value of the U.S. dollar, which may affect the value of the investment to U.S. investors. The Funds will not enter into transactions to hedge against declines in the value of a Fund’s assets that are denominated in a foreign currency.
Countries with emerging markets may have relatively unstable governments and may present the risks of nationalization of businesses, restrictions on foreign ownership and prohibitions on the repatriation of assets. The economies of emerging markets countries also may be based on only a few industries, making them more vulnerable to changes in local or global trade conditions and more sensitive to debt burdens or inflation rates.
E. Foreign Currency Translation
The books and records of the Funds are maintained in U.S. dollars. Investment valuations and other assets and liabilities initially expressed in foreign currencies are converted each business day into U.S. dollars based upon current exchange rates. The portion of realized and unrealized gains or losses on investments due to fluctuations in foreign currency exchange rates is not separately disclosed and is included in realized and unrealized gains or losses on investments, when applicable.
| Notes to Financial Statements | November 30, 2017 |
F. Concentration Risk
Each Fund seeks to track its respective Underlying Index, which itself may have concentration in certain regions, economies, countries, markets, industries or sectors. Based on the current composition of their respective Underlying Indexes, the Funds will be concentrated in the gold and silver mining industry. Underperformance or increased risk in such concentrated areas may result in underperformance or increased risk in each Fund.
G. Securities Transactions and Investment Income
Securities transactions are recorded as of the trade date. Realized gains and losses from securities transactions are recorded on the highest cost basis. Dividend income and capital gains distributions, if any, are recorded on the ex-dividend date. Interest income, if any, is recorded on the accrual basis.
H. Dividends and Distributions to Shareholders
Dividends from net investment income for each Fund, if any, are declared and paid annually or as the Board may determine from time to time. Distributions of net realized capital gains earned by the Funds, if any, are distributed at least annually.
I. Federal Tax and Tax Basis Information
The timing and character of income and capital gain distributions are determined in accordance with income tax regulations, which may differ from U.S. GAAP. Reclassifications are made to the Funds’ capital accounts for permanent tax differences to reflect income and gains available for distribution (or available capital loss carryforwards) under income tax regulations.
For the year or period ended November 30, 2017, the following reclassifications, which had no impact on results of operations or net assets, were recorded to reflect permanent tax differences resulting primarily from in-kind transactions:
| Fund | | Paid-in Capital | | | Accumulated Net Investment Income/(Loss) | | | Accumulated Net Realized Gain/(Loss) on Investments | |
| Sprott Gold Miners ETF | | $ | 8,388,424 | | | $ | 802,602 | | | $ | (9,191,026 | ) |
| Sprott Junior Gold Miners ETF | | | 10,244,956 | | | | 841,098 | | | | (11,086,054 | ) |
The tax character of the distributions paid by the Funds were as follows:
| | | Ordinary Income | |
| November 30, 2017 | | | |
| Sprott Gold Miners ETF | | $ | 35,497 | |
| Sprott Junior Gold Miners ETF | | | 815,342 | |
| November 30, 2016 | | | | |
| Sprott Gold Miners ETF | | $ | 1,513,542 | |
| Sprott Junior Gold Miners ETF | | | 195,292 | |
At November 30, 2017, the Funds had available for tax purposes unused capital loss carryforwards as follows:
| Fund | | Short-Term | | | Long-Term | |
| Sprott Gold Miners ETF | | $ | 57,151,739 | | | $ | 18,695,050 | |
| Sprott Junior Gold Miners ETF | | | 11,262,272 | | | | 1,790,432 | |
| Notes to Financial Statements | November 30, 2017 |
As of November 30, 2017, the components of distributable earnings on a tax basis for each Fund were as follows:
| | | Accumulated net investment income | | | Accumulated net realized loss on investments | | | Net unrealized appreciation/ (depreciation)on investments | | | Total | |
| Sprott Gold Miners ETF | | $ | 1,067,486 | | | $ | (75,846,789 | ) | | $ | 1,105,519 | | | $ | (73,673,784 | ) |
| Sprott Junior Gold Miners ETF | | | 223,062 | | | | (13,052,704 | ) | | | (8,600,986 | ) | | | (21,430,628 | ) |
As of November 30, 2017, the costs of investments for federal income tax purposes and accumulated net unrealized appreciation/(depreciation) on investments were as follows:
| | | Sprott Gold Miners ETF | | | Sprott Junior Gold Miners ETF | |
| Gross appreciation (excess of value over tax cost) | | $ | 11,353,443 | | | $ | 3,514,615 | |
| Gross depreciation (excess of tax cost over value) | | | (10,247,924 | ) | | | (12,115,511 | ) |
| Net depreciation of foreign currency | | | – | | | | (90 | ) |
| Net unrealized appreciation (depreciation) | | | 1,105,519 | | | | (8,600,986 | ) |
| Cost of investments for income tax purposes | | $ | 187,471,167 | | | $ | 168,612,120 | |
The differences between book-basis and tax-basis are due to the deferral of losses from wash sales and Passive Foreign Investment Company (“PFIC”) adjustments.
J. Income Taxes
No provision for income taxes is included in the accompanying financial statements, as each Fund intends to distribute to shareholders all taxable investment income and realized gains and otherwise comply with Subchapter M of the Internal Revenue Code of 1986, as amended, applicable to regulated investment companies. Each Fund evaluates tax positions taken (or expected to be taken) in the course of preparing the Fund’s tax returns to determine whether these positions meet a “more-likely-than-not” standard that, based on the technical merits, have a more than fifty percent likelihood of being sustained by a taxing authority upon examination. A tax position that meets the “more-likely-than-not” recognition threshold is measured to determine the amount of benefit to recognize in the financial statements.
As of and during the year ended November 30, 2017, the Funds did not have a liability for any unrecognized tax benefits. Each Fund files U.S. federal, state, and local tax returns as required. Each Fund’s tax returns are subject to examination by the relevant tax authorities until expiration of the applicable statute of limitations, which is generally three years after the filing of the tax return, but may extend to four years in certain jurisdictions. Tax returns for open years for the Sprott Gold Miners ETF and the Sprott Junior Gold Miners ETF have incorporated no uncertain tax positions that require a provision for income taxes.
K. Lending of Portfolio Securities
The Funds have entered into a securities lending agreement with State Street Bank & Trust Co. (“SSB”), the Funds’ lending agent. The Funds may lend their portfolio securities only to borrowers that are approved by SSB. Each Fund will limit such lending to not more than 33 1/3% of the value of its total assets. Each Fund’s securities held at SSB as custodian shall be available to be lent except those securities the Fund or ALPS Advisors, Inc. specifically identifies in writing as not being available for lending. The borrower pledges and maintains with each Fund collateral consisting of cash (U.S. Dollars only), securities issued or guaranteed by the U.S. government or its agencies or instrumentalities, and by cash equivalents (including irrevocable bank letters of credit issued by a person other than the borrower or an affiliate of the borrower). The initial collateral received by each Fund is required to have a value of no less than 102% of the market value of the loaned securities for U.S. equity securities and a value of no less than 105% of the market value for non-U.S. equity securities. The collateral is maintained thereafter, at a market value equal to not less than 102% of the current value of the U.S. equity securities on loan and not less than 105% of the current value of the non-U.S. equity securities on loan. The market value of the loaned securities is determined at the close of each business day and any additional required collateral is delivered to each Fund on the next business day. During the term of the loan, each Fund is entitled to all distributions made on or in respect of the loaned securities. Loans of securities are terminable at any time and the borrower, after notice, is required to return borrowed securities within the customary time period for settlement of securities transactions.
Any cash collateral received is reinvested in a money market fund managed by SSB as disclosed in each Fund’s Schedule of Investments and is reflected in the Statements of Assets and Liabilities as a payable for collateral upon return of securities loaned. Non-cash collateral, in the form of securities issued or guaranteed by the U.S. government or its agencies or instrumentalities, is not disclosed in a Fund’s Statements of Assets and Liabilities as it is held by the lending agent on behalf of each Fund, and each Fund does not have the ability to re-hypothecate these securities. Income earned by the Fund from securities lending activity is disclosed in the Statement of Operations.
| Notes to Financial Statements | November 30, 2017 |
The following is a summary of each Fund’s securities lending agreements and related cash and non-cash collateral received as of November 30, 2017:
| | | Market Value of Securities on Loan | | | Cash Collateral Received | | | Non-Cash Collateral Received | | | Total Collateral Received | |
| Sprott Gold Miners ETF | | $ | 23,137,637 | | | $ | 23,981,023 | | | $ | 334,775 | | | $ | 24,315,798 | |
| Sprott Junior Gold Miners ETF | | | 11,584,855 | | | | 10,415,527 | | | | 1,663,403 | | | | 12,078,930 | |
The risks of securities lending include the risk that the borrower may not provide additional collateral when required or may not return the securities when due. To mitigate these risks, each Fund benefits from a borrower default indemnity provided by SSB. SSB’s indemnity allows for full replacement of securities lent wherein SSB will purchase the unreturned loaned securities on the open market by applying the proceeds of the collateral, or to the extent such proceeds are insufficient or the collateral is unavailable, SSB will purchase the unreturned loan securities at SSB’s expense. However, the Funds could suffer a loss if the value of the investments purchased with cash collateral falls below the value of the cash collateral received.
The following tables reflect a breakdown of transactions accounted for as secured borrowings, the gross obligation by the type of collateral pledged or securities loaned, and the remaining contractual maturity of those transactions as of November 30, 2017:
| Sprott Gold Miners ETF | Remaining contractual maturity of the agreements |
| Securities Lending Transactions | | Overnight & Continuous | | | Up to 30 days | | | 30-90 days | | | Greater than 90 days | | | Total | |
| Common Stocks | | $ | 23,981,023 | | | $ | – | | | $ | – | | | $ | – | | | $ | 23,981,023 | |
| Total Borrowings | | | | | | | | | | | | | | | | | | | 23,981,023 | |
| Gross amount of recognized liabilities for securities lending (collateral received) | | | | | | | | | | $ | 23,981,023 | |
| Sprott Junior Gold Miners ETF | Remaining contractual maturity of the agreements |
| Securities Lending Transactions | | Overnight & Continuous | | | Up to 30 days | | | 30-90 days | | | Greater than 90 days | | | Total | |
| Common Stocks | | $ | 10,415,527 | | | $ | – | | | $ | – | | | $ | – | | | $ | 10,415,527 | |
| Total Borrowings | | | | | | | | | | | | | | | | | | | 10,415,527 | |
| Gross amount of recognized liabilities for securities lending (collateral received) | | | | | | | | | | $ | 10,415,527 | |
3. INVESTMENT ADVISORY FEE AND OTHER AFFILIATED TRANSACTIONS
ALPS Advisors, Inc. (the “Adviser”) acts as the Funds’ investment adviser pursuant to an advisory agreement with the Trust on behalf of each Fund (the “Advisory Agreement”). Pursuant to the Advisory Agreement, each Fund pays the Adviser a unitary fee for the services and facilities it provides, payable on a monthly basis as a percentage of each Fund’s average daily net assets as set forth below. From time to time, the Adviser may waive all or a portion of its fee.
| Fund | Advisory Fee |
| Sprott Gold Miners ETF | 0.57% |
| Sprott Junior Gold Miners ETF | 0.57% |
Out of the unitary management fee, the Adviser pays substantially all expenses for each Fund, including the cost of transfer agency, custody, fund administration, legal, audit, independent trustees and other services, except for interest expenses, distribution fees or expenses, brokerage expenses, taxes and extraordinary expenses, such as litigation, not incurred in the ordinary course of each Fund’s business. The Adviser’s unitary management fee is designed to pay substantially all of the Funds’ expenses and to compensate the Adviser for providing services for the Funds.
ALPS Fund Services, Inc., an affiliate of the Adviser, is the administrator to the Funds.
| Notes to Financial Statements | November 30, 2017 |
Each Trustee who is not an officer or employee of the Adviser, any sub-adviser or any of their affiliates (“Independent Trustees”) receives (1) a quarterly retainer of $5,000, (2) a per meeting fee for regularly scheduled meetings of $3,750, (3) $1,500 for any special meeting held outside of a regularly scheduled board meeting, and (4) reimbursement for all reasonable out-of-pocket expenses relating to attendance at meetings.
4. PURCHASES AND SALES OF SECURITIES
For the year ended November 30, 2017, the cost of purchases and proceeds from sales of investment securities, excluding short-term investments and in-kind transactions, were as follows:
| Fund | | Purchases | | | Sales | |
| Sprott Gold Miners ETF | | $ | 187,760,176 | | | $ | 187,367,343 | |
| Sprott Junior Gold Miners ETF | | | 83,940,057 | | | | 83,991,410 | |
For the year or period ended November 30, 2017, the cost of in-kind purchases and proceeds from in-kind sales were as follows:
| Fund | | Purchases | | | Sales | |
| Sprott Gold Miners ETF | | $ | 30,281,921 | | | $ | 56,080,895 | |
| Sprott Junior Gold Miners ETF | | | 150,205,951 | | | | 45,781,864 | |
For the year ended November 30, 2017, the Sprott Gold Miners ETF and the Sprott Junior Gold Miners ETF had in-kind net realized gains of $8,521,540 and $11,173,345 respectively.
Gains on in-kind transactions are not considered taxable for federal income tax purposes and losses on in kind transactions are also not deductible for tax purposes.
5. CAPITAL SHARE TRANSACTIONS
Shares are created and redeemed by each Fund only in Creation Unit size aggregations of 50,000 Shares. Only broker-dealers or large institutional investors with creation and redemption agreements called Authorized Participants (“AP”) are permitted to purchase or redeem Creation Units from the Funds. Such transactions are generally permitted on an in-kind basis, with a balancing cash component to equate the transaction to the NAV per unit of each Fund on the transaction date. Cash may be substituted equivalent to the value of certain securities generally when they are not available in sufficient quantity for delivery, not eligible for trading by the AP or as a result of other market circumstances.
6. RELATED PARTY TRANSACTIONS
The Fund engaged in cross trades between other funds in the Trust during the year ended November 30, 2017 pursuant to Rule 17a-7 under the 1940 Act. Cross trading is the buying or selling of portfolio securities between funds to which the Adviser serves as the investment adviser. The Board previously adopted procedures that apply to transactions between the Funds of the Trust pursuant to Rule 17a-7. These transactions related to cross trades during the period complied with the requirements set forth by Rule 17a-7 and the Trust’s procedures.
Transactions related to cross trades during the year ended November 30, 2017 was as follows:
| Fund | | Purchase cost paid | | | Sale proceeds received | | | Realized gain/ (loss) on sales | |
| Sprott Gold Miners ETF | | $ | 6,560,443 | | | $ | 6,864,561 | | | $ | (784,102 | ) |
| Sprott Junior Gold Miners ETF | | $ | 6,864,561 | | | $ | 6,560,443 | | | $ | (943,685 | ) |
| Additional Information | November 30, 2017 (Unaudited) |
PROXY VOTING RECORDS, POLICIES AND PROCEDURES
Information regarding how each Fund voted proxies relating to portfolio securities during the most recent 12-month period ended June 30 and a description of the Funds’ proxy voting policies and procedures used in determining how to vote for proxies are available without charge on the SEC’s website at www.sec.gov and upon request, by calling (toll-free) 1-866-675-2639.
PORTFOLIO HOLDINGS
The Trust is required to disclose, after its first and third fiscal quarters, the complete schedule of each Fund’s portfolio holdings with the SEC on Form N-Q. Form N-Q for each Fund will be available on the SEC’s website at www.sec.gov. Each Fund’s Form N-Q may also be reviewed and copied at the SEC’s Public Reference Room in Washington, D.C. and information on the operation of the Public Reference Room may be obtained by calling 1-800-SEC-0330. Each Fund’s Form N-Q will be available without charge, upon request, by calling (toll-free) 1-866-675-2639 or by writing to ALPS ETF Trust at 1290 Broadway, Suite 1100, Denver, Colorado 80203.
TAX INFORMATION
Pursuant to Section 853(c) of the Internal Revenue Code, the Funds designated the following:
| | Foreign Taxes Paid | | | Foreign Source Income | |
| Sprott Gold Miners ETF | | $ | 119,375 | | | $ | 1,108,435 | |
| Sprott Gold Miners Junior ETF | | $ | 27,619 | | | $ | 184,125 | |
The Funds designate the following for federal income tax purposes for distributions made during the calendar year ended December 31, 2016:
| | Qualified Dividend Income | Dividend Received Deduction |
| Sprott Gold Miners ETF | 0.00% | 0.00% |
| Sprott Gold Miners Junior ETF | 0.00% | 0.00% |
In early 2017, if applicable, shareholders of record received this information for the distribution paid to them by the Funds during the calendar year 2016 via Form 1099. The Funds will notify shareholders in early 2018 of amounts paid to them by the Funds, if any, during the calendar year 2017.
LICENSING AGREEMENTS
Sprott Gold Miners ETF
Zacks Investment Management, Inc. (the “Licensor”) has entered into a license agreement with Sprott Asset Management LP (“Sprott”) to use the “Sprott” name and certain related intellectual property in connection with the underlying index, the Sprott Zacks Gold Miners Index (the “Underlying Index”) (the “Sprott License Agreement”). Pursuant to the Sprott License Agreement, Sprott in turn has entered into a sublicense agreement with ALPS Advisers, Inc. to use the Underlying Index (the “Sublicense Agreement”) in connection with the Sprott Gold Miners ETF (the “Product”).
The following disclosure relates to the Licensor and Sprott:
The Product(s) is not sponsored, endorsed, sold or promoted by ZACKS INVESTMENT MANAGEMENT, INC. (“Licensor”) Licensor makes no representation or warranty, express or implied, regarding the advisability of investing in securities generally or in the Product(s) particularly or the ability of the Index to track general market performance. Licensor’s only relationship to the Licensee is the licensing of the Index which is determined and composed by Licensor without regard to the Licensee or the owners of the Product(s). Licensor has no obligation to take the needs of the Licensee or the owners of the Product(s) into consideration in determining or composing the Index. Licensor shall not be liable to any person for any error in the Index nor shall it be under any obligation to advise any person of any error therein.
The Fund is not sponsored by Sprott. Sprott makes no representation or warranty, express or implied, to the owners of the Fund or any member of the public regarding the advisability of investing in securities or commodities generally or in the Fund particularly and does not guarantee the quality, accuracy or completeness of the Underlying Index or any Underlying Index data included herein or derived therefrom and assume no liability in connection with their use. The Underlying Index is determined and composed without regard to the Adviser or the Fund. Sprott has no obligation to take the needs of the Adviser, the Fund or the shareholders of the Fund into consideration in connection with the foregoing. Sprott is not responsible for and has not participated in the determination of pricing or the timing of the issuance or sale of the Shares of the Fund or in the determination or calculation of the NAV of the Fund. Sprott has no obligation or liability in connection with the administration or trading of the Fund.
| Additional Information | November 30, 2017 (Unaudited) |
Sprott does not guarantee the accuracy and/or completeness of the Underlying Index or any data included therein, and Sprott shall have no liability for any errors, omissions, or interruptions therein. Sprott makes no warranty, express or implied, as to results to be obtained by the Adviser, the Fund, Fund shareholders or any other person or entity from the use of the Underlying Index or any data included therein. Sprott makes no express or implied warranties, and expressly disclaims all warranties of merchantability or fitness for a particular purpose or use with respect to the Underlying Index or any data included therein. Without limiting any of the foregoing, in no event shall Sprott have any liability for any special, punitive, indirect, or consequential damages (including lost profits) arising out of matters relating to the use of the Underlying Index, even if notified of the possibility of such damages.
Sprott Junior Gold Miners ETF
Zacks Investment Management, Inc. (the “Licensor”) has entered into a license agreement with Sprott Asset Management LP (“Sprott”) to use the “Sprott” name and certain related intellectual property in connection with the underlying index, the Sprott Zacks Junior Gold Miners Index (the “Underlying Index”) (the “Sprott License Agreement”). Pursuant to the Sprott License Agreement, Sprott in turn has entered into a sublicense agreement with ALPS Advisers, Inc. to use the Underlying Index (the “Sublicense Agreement”) in connection with the Sprott Junior Gold Miners ETF (the “Product”).
The following disclosure relates to the Licensor and Sprott:
The Product(s) is not sponsored, endorsed, sold or promoted by ZACKS INVESTMENT MANAGEMENT, INC. (“Licensor”) Licensor makes no representation or warranty, express or implied, regarding the advisability of investing in securities generally or in the Product(s) particularly or the ability of the Index to track general market performance. Licensor’s only relationship to the Licensee is the licensing of the Index which is determined and composed by Licensor without regard to the Licensee or the owners of the Product(s). Licensor has no obligation to take the needs of the Licensee or the owners of the Product(s) into consideration in determining or composing the Index. Licensor shall not be liable to any person for any error in the Index nor shall it be under any obligation to advise any person of any error therein.
The Fund is not sponsored by Sprott. Sprott makes no representation or warranty, express or implied, to the owners of the Fund or any member of the public regarding the advisability of investing in securities or commodities generally or in the Fund particularly and does not guarantee the quality, accuracy or completeness of the Underlying Index or any Underlying Index data included herein or derived therefrom and assume no liability in connection with their use. The Underlying Index is determined and composed without regard to the Adviser or the Fund. Sprott has no obligation to take the needs of the Adviser, the Fund or the shareholders of the Fund into consideration in connection with the foregoing. Sprott is not responsible for and has not participated in the determination of pricing or the timing of the issuance or sale of the Shares of the Fund or in the determination or calculation of the NAV of the Fund. Sprott has no obligation or liability in connection with the administration or trading of the Fund.
Sprott does not guarantee the accuracy and/or completeness of the Underlying Index or any data included therein, and Sprott shall have no liability for any errors, omissions, or interruptions therein. Sprott makes no warranty, express or implied, as to results to be obtained by the Adviser, the Fund, Fund shareholders or any other person or entity from the use of the Underlying Index or any data included therein. Sprott makes no express or implied warranties, and expressly disclaims all warranties of merchantability or fitness for a particular purpose or use with respect to the Underlying Index or any data included therein. Without limiting any of the foregoing, in no event shall Sprott have any liability for any special, punitive, indirect, or consequential damages (including lost profits) arising out of matters relating to the use of the Underlying Index, even if notified of the possibility of such damages.
| Board Considerations Regarding Approval of Investment Advisory Agreements | November 30, 2017 (Unaudited) |
At an in-person meeting held on June 8, 2017, the Board of Trustees of the Trust (the “Board” or the “Trustees”), including the Trustees who are not “interested persons” of the Trust within the meaning of the 1940 Act, as amended (the “Independent Trustees”), evaluated a proposal to approve the continuance of the Investment Advisory Agreements between the Trust and ALPS Advisors, Inc. (the “Adviser” or “AAI”) with respect to the Sprott Gold Miners ETF (“SGDM”) and Sprott Junior Gold Miners ETF (“SGDJ”), (each “a Fund” and collectively the “Funds”). The Independent Trustees also met separately to consider the Investment Advisory Agreement.
In evaluating the Investment Advisory Agreements with respect to each Fund, the Independent Trustees considered various factors, including (i) the nature, extent and quality of the services provided by AAI with respect to the applicable Fund under the Investment Advisory Agreements; (ii) the advisory fees and other expenses paid by the Fund compared to those of similar funds managed by other investment advisers; (iii) the costs of the services provided to the Fund by AAI and the profits realized by AAI and its affiliates from its relationship to the Fund; (iv) the extent to which economies of scale have been or would be realized if and as the assets of the Fund grow and whether fees reflect the economies of scale for the benefit of shareholders; and (v) any additional benefits and other considerations.
With respect to the nature, extent and quality of the services provided by AAI under the Investment Advisory Agreements, the Independent Trustees considered and reviewed information concerning the services provided under the Investment Advisory Agreements, the investment parameters of the index of each Fund, financial information regarding AAI and its parent company, information describing AAI’s current organization and the background and experience of the persons responsible for the day-to-day management of the Funds.
The Independent Trustees reviewed information on the performance of each Fund and its applicable benchmark. The Independent Trustees also evaluated the correlation and tracking error between each underlying index and its corresponding Fund’s performance. Based on their review, the Independent Trustees found that the nature and extent of services provided to each Fund under the Investment Advisory Agreements was appropriate and that the quality was satisfactory.
The Independent Trustees noted that the advisory fees for each Fund were unitary fees pursuant to which AAI assumes all expenses of the Funds (including the cost of transfer agency, custody, fund administration, legal, audit and other services) other than the payments under the Investment Advisory Agreement, brokerage expenses, taxes, interest, litigation expenses and other extraordinary expenses.
With respect to advisory fee rates, the Independent Trustees noted the following:
The net advisory fee rate for each of the Funds is equal to the median of its Broadridge expense group and the Funds’ respective expense ratios are equal to the median for its respective Broadridge expense group.
Based on the foregoing, and the other information available to them, the Independent Trustees concluded that the advisory fee rate for each of the Funds was reasonable under the circumstances and in light of the quality of the services provided.
The Independent Trustees considered other benefits available to AAI because of its relationship with the Funds and concluded that the advisory fees were reasonable taking into account any such benefits.
The Independent Trustees also considered with respect to each Fund the information provided by AAI about the costs and profitability of AAI with respect to each of the Funds. The Independent Trustees reviewed and noted the relatively small sizes of the Funds and concluded that AAI was not realizing any economies of scale. The Independent Trustees determined that they would continue to evaluate whether further economies of scale have been achieved on an ongoing basis.
In voting to renew each Investment Advisory Agreement, the Independent Trustees concluded that the terms of each Investment Advisory Agreement are reasonable and fair in light of the services to be performed, the fees paid by certain other funds, expenses to be incurred and such other matters as the Independent Trustees considered relevant in the exercise of their reasonable business judgment. The Independent Trustees did not identify any single factor or group of factors as all important or controlling and considered all factors together.
Sprott ETFs
| Trustees & Officers | November 30, 2017 (Unaudited) |
The general supervision of the duties performed by the Adviser for the Fund under the Investment Advisory Agreement is the responsibility of the Board of Trustees. The Trust currently has four Trustees. Three Trustees have no affiliation or business connection with the Adviser or any of its affiliated persons and do not own any stock or other securities issued by the Adviser. These are the “non-interested” or “independent” Trustees (“Independent Trustees”). The other Trustee (the “Interested Trustee”) is affiliated with the Adviser.
The Independent Trustees of the Trust, their term of office and length of time served, their principal business occupations during the past five years, the number of portfolios in the Fund Complex overseen by each Independent Trustee, and other directorships, if any, held by the Trustee are shown below.
| INDEPENDENT TRUSTEES |
| Name, Address & Year of Birth* | Position(s) Held with Trust | Term of Office and Length of Time Served** | Principal Occupation(s) During Past 5 Years | Number of Portfolios in Fund Complex Overseen by Trustees*** | Other Directorships Held by Trustees |
Mary K.
Anstine,
1940 | Trustee | Since March 2008 | Ms. Anstine was President/Chief Executive Officer of HealthONE Alliance, Denver, Colorado, and former Executive Vice President of First Interstate Bank of Denver. Ms. Anstine is also Trustee/Director of AV Hunter Trust and Colorado Uplift Board. Ms. Anstine was formerly a Director of the Trust Bank of Colorado (later purchased and now known as Northern Trust Bank), HealthONE and Denver Area Council of the Boy Scouts of America and a member of the American Bankers Association Trust Executive Committee. | 42 | Ms. Anstine is a Trustee of ALPS Variable Investment Trust (10 funds); Financial Investors Trust (33 funds); Reaves Utility Income Fund (1 fund); and Westcore Trust (14 funds). |
Jeremy W.
Deems,
1976 | Trustee | Since March 2008 | Mr. Deems is the Co-Founder, Chief Compliance Officer and Chief Financial Officer of Green Alpha Advisors, LLC. Mr. Deems is Co-Portfolio Manager of the Shelton Green Alpha Fund. Prior to joining Green Alpha Advisors, Mr. Deems was CFO and Treasurer of Forward Management, LLC, ReFlow Management Co., LLC, ReFlow Fund, LLC, a private investment fund, and Sutton Place Management, LLC, an administrative services company. | 44 | Mr. Deems is a Trustee of ALPS Variable Investment Trust (10 funds); Financial Investors Trust (33 funds); and Reaves Utility Income Fund (1 fund); Clough Funds Trust (1 fund) and Elevation ETF Trust (1 fund). |
Rick A.
Pederson,
1952 | Trustee and Chairman | Has served as Trustee since March 2008. Has served as Chairman since July 2017. | Mr. Pederson is President, Foundation Properties, Inc. (a real estate investment management company), 1994 - present; Advisory Board Member, Bow River Capital Partners (private equity management), 2003 - present; Advisor, The Pauls Corporation (real estate investment management and development), 2008 - present; Chairman, Ross Consulting Group (real estate consulting services) 1983-2013; Advisory Board, Neenan Company (construction services) 2002-present; Board Member, Prosci Inc. (private business services) 2013-2016; Board Member, Citywide Banks (Colorado community bank) 2014-present; Board member, Professional Pediatric Health Care (a Denver-based home nursing firm) 2014 – present; Board Member, Strong-Bridge Consulting (management consulting) 2015-present; Director, National Western Stock Show (not-for-profit organization); Director, Biennial of the Americas (not-for-profit-organization), 2012- 2015; Board Member, History Colorado, 2015 - present. | 21 | Mr. Pederson is Trustee of Westcore Trust (14 funds) and Principal Real Estate Income Fund (1 fund). |
| * | The business address of the Trustee is c/o ALPS Advisors, Inc., 1290 Broadway, Suite 1100, Denver, Colorado 80203. |
| ** | This is the period for which the Trustee began serving the Trust. Each Trustee serves an indefinite term, until his successor is elected. |
| *** | The Fund Complex includes all series of the Trust and any other investment companies for which ALPS Advisors, Inc. provides investment advisory services. |
Sprott ETFs
| Trustees & Officers | November 30, 2017 (Unaudited) |
The Trustee who is affiliated with the Adviser or affiliates of the Adviser and executive officers of the Trust, his term of office and length of time served, his principal business occupations during the past five years, the number of portfolios in the Fund Complex overseen by the Interested Trustee and the other directorships, if any, held by the Trustee, are shown below.
| INTERESTED TRUSTEE |
| Name, Address and Year of Birth of Interested Trustee* | Position(s) Held with Trust | Term of Office and Length of Time Served** | Principal Occupation(s) During Past 5 Years | Number of Portfolios in Fund Complex Overseen by Trustees*** | Other Directorships Held by Trustee |
| Edmund J. Burke, 1961 | Trustee and President | Mr. Burke was elected as Trustee of the Trust and President of the Trust at the December 11, 2017 meeting of the Board of Trustees. | Mr. Burke is President and a Director of ALPS Holdings, Inc. (“AHI”) (since 2005) and Director of Boston Financial Data Services, Inc. (“BFDS”), ALPS Advisors, Inc. (“AAI”), ALPS Distributors, Inc. (“ADI”), ALPS Fund Services, Inc. (“AFS”) and ALPS Portfolio Solutions Distributor, Inc. (“APSD”) and from 2001-2008, was President of AAI, ADI, AFS and APSD. Because of his positions with AHI, BFDS, AAI, ADI, AFS and APSD, Mr. Burke is deemed an affiliate of the Trust as defined under the 1940 Act. Mr. Burke is Trustee and President of the Clough Global Allocation Fund (Trustee since 2006; President since 2004); Trustee and President of the Clough Global Equity Fund (Trustee since 2006; President since 2005); Trustee and President of the Clough Global Opportunities Fund (since 2006); Trustee of the Liberty All-Star Equity Fund; Director of the Liberty All-Star Growth Fund, Inc. and Trustee and President of Financial Investors Trust (Trustee since 2009; President since 2002). | 36 | Mr. Burke is a Trustee of Clough Global Dividend and Income Fund (1 fund); Clough Global Equity Fund (1 fund); Clough Global Opportunities Fund (1 fund); Clough Funds Trust (1 fund); Liberty All-Star Equity Fund (1 fund); Director of the Liberty All-Star Growth Fund, Inc. (1 fund) and Financial Investors Trust (33 funds). |
| * | The business address of the Trustee is c/o ALPS Advisors, Inc., 1290 Broadway, Suite 1100, Denver, Colorado 80203. |
| ** | This is the period for which the Trustee began serving the Trust. Each Trustee serves an indefinite term, until his successor is elected. |
| *** | The Fund Complex includes all series of the Trust and any other investment companies for which ALPS Advisors, Inc. provides investment advisory services. |
Sprott ETFs
| Trustees & Officers | November 30, 2017 (Unaudited) |
| OFFICERS |
| Name, Address and Year of Birth of Officer | Position(s) Held with Trust | Length of Time Served* | Principal Occupation(s) During Past 5 Years |
Erin D.
Nelson,
1977 | Chief Compliance Officer (“CCO”) | Since December 2015 | Erin Nelson became Senior Vice-President and Chief Compliance Officer of ALPS Advisors, Inc. (“AAI”) on July 1, 2015 and prior to that served as Vice President and Deputy Chief Compliance Officer of AAI since January 1, 2015. Prior to January 1, 2015, Ms. Nelson was Vice-President and Assistant General Counsel of ALPS Fund Services, Inc. Because of her position with AAI, Ms. Nelson is deemed an affiliate of the Trust as defined under the 1940 Act. Ms. Nelson is also the CCO of ALPS Variable Investment Trust, Liberty All-Star Growth Fund, Inc., Liberty All-Star Equity Fund, Principal Real Estate Income Fund, RiverNorth Opportunities Fund, Inc. and Red Rocks Capital, LLC. |
Patrick D.
Buchanan,
1972 | Treasurer | Since June 2012 | Mr. Buchanan is Vice President of AAI. Mr. Buchanan joined ALPS in 2007 and because of his position with AAI, he is deemed an affiliate of the Trust as defined under the 1940 Act. Mr. Buchanan is also Treasurer of the ALPS Variable Insurance Trust, Principal Real Estate Income Fund, Clough Funds Trust and RiverNorth Opportunities Fund, Inc. |
Andrea E.
Kuchli,
1985 | Secretary | Since December 2017 | Ms. Kuchli joined ALPS in 2015 and is currently Vice President and Senior Counsel of ALPS. Prior to joining ALPS, Ms. Kuchli was an Associate with Davis Graham & Stubbs LLP from April 2014 to February 2015, and an Associate with Dechert LLP from 2011 to April 2014. Because of her position with ALPS, Ms. Kuchli is deemed an affiliate of the Trust as defined under the 1940 Act. Ms. Kuchli is also Secretary of ALPS Variable Investment Trust, Elevation ETF Trust and Principal Real Estate Income Fund as well as Assistant Secretary of the James Advantage Funds. |
Sharon
Akselrod,
1974 | Assistant Secretary | Since December 2016 | Ms. Akselrod joined ALPS in August 2014 and is currently Senior Investment Company Act Paralegal of ALPS Fund Services, Inc. Prior to joining ALPS, Ms. Akselrod served as Corporate Governance and Regulatory Associate for Nordstrom fsb (2013-2014) and Senior Legal Assistant – Legal Manager for AXA Equitable Life Insurance Company (2008-2013). Because of her position with ALPS, Ms. Akselrod is deemed an affiliate of the Trust as defined under the 1940 Act. Ms. Akselrod is also Assistant Secretary of Financial Investors Trust and Principal Real Estate Income Fund. |
Stephanie G.
Danner,
1992 | Assistant Secretary | Since December 2017 | Ms. Danner joined ALPS in September of 2017 and is currently Vice President and Associate Senior Counsel of ALPS. Because of her position with ALPS, Ms. Danner is deemed an affiliate of the Trust as defined under the 1940 Act. |
| * | The business address of each Officer is c/o ALPS Advisors, Inc., 1290 Broadway, Suite 1100, Denver, Colorado 80203. |
| ** | This is the period for which the Officer began serving the Trust. Each Officer serves an indefinite term, until his/her successor is elected. |
The Statement of Additional Information includes additional information about the Fund's Trustees and is available, without charge, upon request by calling (toll-free) 1-855-215-1425.
table of
CONTENTS
| Performance Overview | 1 |
| Disclosure of Fund Expenses | 4 |
| Report of Independent Registered Public Accounting Firm | 5 |
| Financial Statements | |
| Schedule of Investments | 6 |
| Statement of Assets and Liabilities | 9 |
| Statement of Operations | 10 |
| Statements of Changes in Net Assets | 11 |
| Financial Highlights | 12 |
| Notes to Financial Statements | 13 |
| Additional Information | 19 |
| Board Considerations Regarding Approval of Investment Advisory Agreement | 20 |
| Trustees & Officers | 21 |
www.alpsfunds.com
| Workplace Equality Portfolio | |
| Performance Overview | November 30, 2017 (Unaudited) |
Investment Objective
The Workplace Equality Portfolio (the “Fund”) seeks investment results that correspond (before fees and expenses) generally to the price and yield performance of its underlying index, the Workplace Equality Index™ (the “Underlying Index”).
The Underlying Index is designed to provide a means of tracking the performance of companies which support workplace equality for lesbian, gay, bisexual and transgender (“LGBT”) employees. The Underlying Index consists of approximately 200 publicly traded stocks of U.S. and foreign companies which support equality for LGBT employees through their workplace practices, including non-discrimination policies regarding sexual orientation and gender identity and providing full benefits to for same-sex spouses, domestic partners and transgender individuals. The Underlying Index is compiled by Denver Investment Advisors LLC (“Denver Investments” or the “Index Provider”). The Index Provider uses publicly available lists and screening sources such as the National Gay & Lesbian Chamber of Commerce®, Diversity Inc. Top 50®, Stonewall® or other screening sources, to identify companies with workplace policies that meet the Underlying Index’s criteria for equality for LGBT employees as described above (as well as market capitalization and liquidity requirements). The Index Provider also utilizes its own proprietary database for index screening. The criteria are subject to change in response to changes in law.
Performance Overview
For the 2017 fiscal year, the Workplace Equality Index slightly underperformed its benchmark S&P 500 Index, returning 21.44% versus the benchmarks 22.87% return for the year. We originally created the screening process used in the Workplace Equality Index® as a way for LGBT oriented foundations to satisfy their fiduciary duty for broad equity market exposure while aligning with their support of companies that treat their LGBT employees with dignity, respect and equality. As an equally-weighted index, the small- and mid-cap exposure were a drag on performance in 2017 as the largest stocks in the benchmark index provided outsized contributions to return based on their large weights.
The bulk of the underperformance came from the technology sector. Our equal-weight methodology had a negative impact on performance relative to the benchmark. For example, the Underlying Index’s average weight in Apple was 0.48% which gave Apple a performance contribution of 0.24% for the year. Compared to the benchmark’s average weight in Apple of 3.68%, providing a performance contribution of 1.84% for the year. This theme played out in the large technology companies that have come dominate market-cap weighted indices such as Facebook, Alphabet, and Microsoft.
The best performing stocks for the year included NVIDIA (+129%), Chemours Co. (+109%), PayPal (+98%), Boeing (+82%) and Yahoo spin-off Altaba (+77%). The worst performing stocks in the Underlying Index all came from the retail space, including Sears Holding (-69%), Avon Products (-61%), Macy’s (-44%), Barnes & Noble (-44%) and Mattell (-39%).
Positive relative performance came from Energy, Financials, Health Care, Industrials, Materials and Real Estate. The Consumer sectors struggled on a relative basis during the year, as did Information Technology as discussed above.
Stocks in the Workplace Equality Index outperformed their respective GICS sector peers in a majority of the economic sectors for the year, confirming our thesis that companies that treat all of their employees equally provide better shareholder returns in the long run.
| Workplace Equality Portfolio | |
| Performance Overview | November 30, 2017 (Unaudited) |
Performance (as of November 30, 2017)
| | 1 Year | 3 Year | Since Inception^ |
| Workplace Equality Portfolio – NAV | 20.56% | 10.43% | 11.45% |
| Workplace Equality Portfolio – Market Price* | 20.59% | 10.44% | 11.47% |
| Workplace Equality IndexTM | 21.44% | 11.27% | 12.30% |
| S&P 500® Total Return Index | 22.87% | 10.91% | 12.36% |
Total Expense Ratio (per the current prospectus) 0.75%
Performance data quoted represents past performance. Past performance does not guarantee future results. The table does not reflect the deduction of taxes that a shareholder would pay on Fund distributions or the redemption of Fund shares. Investment return and principal value of an investment will fluctuate so that an investor’s shares, when sold or redeemed, may be worth more or less than the original cost. Current performance data may be higher or lower than actual data quoted. For the most current month-end performance data please visit www.alpsfunds.com or call 1.844.375.8383.
NAV is an exchange-traded fund’s per-share value. The per-share dollar amount of the Fund is derived by dividing the total value of all the securities in its portfolio, less any liabilities, by the number of Fund shares outstanding. Market Price is the price at which a share can currently be traded in the market. Information detailing the number of days the Market Price of the Fund was greater than the Fund’s NAV and the number of days it was less than the Fund’s NAV can be obtained at www.alpsfunds.com.
| ^ | The Fund Commencement date was February 25, 2014. |
| * | Market Price is based on the midpoint of the bid-ask spread at 4 p.m. ET and does not represent the returns an investor would receive if shares were traded at other times. |
The Workplace Equality IndexTM: an equal weighted index of companies that support lesbian, gay, bisexual and transgender (LGBT) equality in their workplace.
The S&P 500® Total Return Index: the Standard & Poor’s composite index of 500 stocks, a widely recognized, unmanaged index of common stock prices.
The indexes are not actively managed and do not reflect any deductions for fees, expenses or taxes. The indexes are reported on a total return basis, which assumes reinvestment of any dividends and distributions realized during a given time period. One cannot invest directly in an index. Index performance does not reflect Fund performance.
The Fund invests in stocks of companies which meet the Underlying Index's criteria for supporting workplace equality for LGBT employees. The trend of companies supporting workplace equality in this fashion is relatively recent, and there may be a limited number of companies which meet the Underlying Index's criteria.
The Fund’s shares are not individually redeemable. Investors buy and sell shares of the Fund on a secondary market. Only market makers or “authorized participants” may trade directly with the Fund, typically in blocks of 50,000 shares.
The Workplace Equality Portfolio is not suitable for all investors. Investments in the Fund are subject to investment risks, including possible loss of the principal amount invested.
ALPS Portfolio Solutions Distributor, Inc., a FINRA member, is the distributor for the Workplace Equality Portfolio.
ALPS Portfolio Solutions Distributor, Inc. is not affiliated with Denver Investments.
| Workplace Equality Portfolio | |
| Performance Overview | November 30, 2017 (Unaudited) |
Top 10 Holdings* (as of November 30, 2017)
| Time, Inc. | 0.54% |
| NetApp, Inc. | 0.53% |
| L Brands, Inc. | 0.53% |
| WW Grainger, Inc. | 0.51% |
| Choice Hotels International, Inc. | 0.49% |
| Groupon, Inc. | 0.49% |
| Anthem, Inc. | 0.49% |
| QUALCOMM, Inc. | 0.49% |
| Jones Lang LaSalle, Inc. | 0.48% |
| Pearson PLC | 0.48% |
| Total % of Top 10 Holdings | 5.03% |
Sector Allocation* (as of November 30, 2017)
| Financials | 22.21% |
| Consumer Discretionary | 21.67% |
| Information Technology | 16.00% |
| Industrials | 11.07% |
| Health Care | 10.50% |
| Consumer Staples | 8.54% |
| Materials | 2.74% |
| Utilities | 2.69% |
| Telecommunication Services | 1.82% |
| Real Estate | 1.77% |
| Energy | 0.82% |
| Money Market Fund | 0.17% |
| Total | 100.00% |
| * | % of Total Investments (excluding investments purchased with collateral from securities loaned) |
Future holdings are subject to change.
Growth of $10,000 (as of November 30, 2017)
Comparison of Change in Value of $10,000 Investment in the Fund and the Indexes
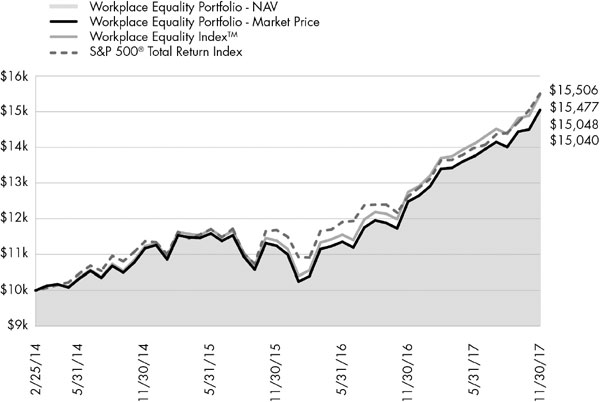
The chart above represents historical performance of a hypothetical investment of $10,000 in the Fund over the life of the Fund. Past performance does not guarantee future results. This chart does not reflect the deduction of taxes that a shareholder would pay on Fund distributions or the redemption of Fund shares
| Workplace Equality Portfolio | |
| Disclosure of Fund Expenses | November 30, 2017 (Unaudited) |
Shareholder Expense Example: As a shareholder of the Fund, you incur two types of costs: (1) transaction costs which may include creation and redemption fees or brokerage charges, and (2) ongoing costs, including management fees and other Fund expenses. These examples are intended to help you understand your ongoing costs (in dollars) of investing in the Fund and to compare these costs with the ongoing costs of investing in other funds. It is based on an investment of $1,000 invested at the beginning of the (six month) period and held through November 30, 2017.
Actual Return: The first line of the table provides information about actual account values and actual expenses. You may use the information in this line, together with the amount you invested, to estimate the expenses that you incurred over the period. Simply divide your account value by $1,000 (for example, an $8,600 account value divided by $1,000 = 8.6), then multiply the result by the number in the first line under the heading entitled “Expenses Paid During Period” to estimate the expenses attributable to your investment during this period.
Hypothetical 5% Return: The second line of the table provides information about hypothetical account values and hypothetical expenses based on the Fund’s actual expense ratio and an assumed rate of return of 5% per year before expenses, which is not the Fund’s actual return. The hypothetical account values and expenses may not be used to estimate the actual ending account balance or expenses you paid for the period. You may use this information to compare ongoing costs of investing in the Fund and other funds. To do so, compare this 5% hypothetical example with the 5% hypothetical examples that appear in the shareholder reports of other funds.
The expenses shown in the table are meant to highlight ongoing Fund costs only and do not reflect any transaction costs, such as creation and redemption fees or brokerage charges. Therefore, the second line is useful in comparing ongoing costs only, and will not help you determine the relative total costs of owning different funds. In addition, if these costs were included, your costs would have been higher.
| | Beginning Account Value 6/1/17 | Ending Account Value 11/30/17 | Expense Ratio(a) | Expenses Paid During Period 6/1/17 - 11/30/17(b) |
| Workplace Equality Portfolio | | | | |
| Actual | $1,000.00 | $1,094.20 | 0.75% | $3.94 |
| Hypothetical (5% return before expenses) | $1,000.00 | $1,021.31 | 0.75% | $3.80 |
| (a) | Annualized, based on the Fund's most recent fiscal half year expenses. |
| (b) | Expenses are equal to the Fund's annualized expense ratio multiplied by the average account value over the period, multiplied by the number of days in the most recent fiscal half year (183), divided by 365. |
Workplace Equality Portfolio
Report of Independent Registered Public Accounting Firm
To the Board of Trustees and Shareholders of ALPS ETF Trust:
We have audited the accompanying statement of assets and liabilities, including the schedule of investments, of Workplace Equality Portfolio, one of the portfolios constituting the ALPS ETF Trust (the “Trust”), as of November 30, 2017, and the related statement of operations for the year then ended, the statements of changes in net assets for each of the two years in the period then ended, and the financial highlights for each of the periods presented. These financial statements and financial highlights are the responsibility of the Trust’s management. Our responsibility is to express an opinion on these financial statements and financial highlights based on our audits.
We conducted our audits in accordance with the standards of the Public Company Accounting Oversight Board (United States). Those standards require that we plan and perform the audit to obtain reasonable assurance about whether the financial statements and financial highlights are free of material misstatement. The Trust is not required to have, nor were we engaged to perform, an audit of its internal control over financial reporting. Our audits included consideration of internal control over financial reporting as a basis for designing audit procedures that are appropriate in the circumstances, but not for the purpose of expressing an opinion on the effectiveness of the Trust’s internal control over financial reporting. Accordingly, we express no such opinion. An audit also includes examining, on a test basis, evidence supporting the amounts and disclosures in the financial statements, assessing the accounting principles used and significant estimates made by management, as well as evaluating the overall financial statement presentation. Our procedures included confirmation of securities owned as of November 30, 2017, by correspondence with the custodian. We believe that our audits provide a reasonable basis for our opinion.
In our opinion, the financial statements and financial highlights referred to above present fairly, in all material respects, the financial position of Workplace Equality Portfolio of the ALPS ETF Trust as of November 30, 2017, the results of its operations for the year then ended, the changes in its net assets for each of the two years in the period then ended, and the financial highlights for each of the periods presented, in conformity with accounting principles generally accepted in the United States of America.
DELOITTE & TOUCHE LLP
Denver, Colorado
January 26, 2018
| Workplace Equality Portfolio | |
| Schedule of Investments | November 30, 2017 |
| Security Description | | Shares | | | Value | |
| COMMON STOCKS (99.68%) | | | | | | | | |
| Consumer Discretionary (21.63%) | | | | | | | | |
| Abercrombie & Fitch Co., Class A | | | 4,847 | | | $ | 84,144 | |
| American Eagle Outfitters, Inc. | | | 5,259 | | | | 84,565 | |
| Aramark | | | 1,707 | | | | 72,718 | |
| Barnes & Noble, Inc. | | | 9,818 | | | | 67,744 | |
| Best Buy Co., Inc. | | | 1,192 | | | | 71,055 | |
| Caesars Entertainment Corp.(a) | | | 5,751 | | | | 76,201 | |
| CBS Corp., Class B | | | 1,172 | | | | 65,702 | |
| Choice Hotels International, Inc. | | | 1,131 | | | | 88,784 | |
| Comcast Corp., Class A | | | 1,862 | | | | 69,899 | |
| Darden Restaurants, Inc. | | | 819 | | | | 69,058 | |
| Ford Motor Co. | | | 5,896 | | | | 73,818 | |
| GameStop Corp., Class A | | | 3,394 | | | | 63,638 | |
| Gap, Inc. | | | 2,451 | | | | 79,192 | |
| General Motors Co. | | | 1,757 | | | | 75,709 | |
| Groupon, Inc.(a) | | | 15,741 | | | | 88,779 | |
| Hilton Grand Vacations, Inc.(a) | | | 1,899 | | | | 75,903 | |
| Hilton Worldwide Holdings, Inc. | | | 1,024 | | | | 79,421 | |
| Home Depot, Inc. | | | 438 | | | | 78,761 | |
| Hyatt Hotels Corp., Class A(a) | | | 1,127 | | | | 81,550 | |
| InterContinental Hotels Group PLC, ADR | | | 1,395 | | | | 81,831 | |
| Interpublic Group of Cos., Inc. | | | 3,475 | | | | 68,736 | |
| L Brands, Inc. | | | 1,686 | | | | 94,534 | |
| Macy's, Inc. | | | 3,098 | | | | 73,732 | |
| Marriott International, Inc., Class A | | | 659 | | | | 83,693 | |
| Mattel, Inc.(b) | | | 4,303 | | | | 78,530 | |
| McDonald's Corp. | | | 439 | | | | 75,495 | |
| MGM Resorts International | | | 2,176 | | | | 74,245 | |
| Netflix, Inc.(a) | | | 378 | | | | 70,905 | |
| Newell Brands, Inc. | | | 1,600 | | | | 49,552 | |
| NIKE, Inc., Class B | | | 1,268 | | | | 76,613 | |
| Nordstrom, Inc. | | | 1,458 | | | | 66,266 | |
| Office Depot, Inc. | | | 15,479 | | | | 50,616 | |
| Pearson PLC, Sponsored ADR(b) | | | 9,049 | | | | 85,966 | |
| Royal Caribbean Cruises, Ltd. | | | 571 | | | | 70,735 | |
| Sears Holdings Corp.(a)(b) | | | 8,992 | | | | 36,687 | |
| Sirius XM Holdings, Inc.(b) | | | 12,529 | | | | 68,910 | |
| Sony Corp., Sponsored ADR | | | 1,790 | | | | 83,772 | |
| Starbucks Corp. | | | 1,249 | | | | 72,217 | |
| Tapestry, Inc. | | | 1,667 | | | | 69,497 | |
| Target Corp. | | | 1,146 | | | | 68,645 | |
| TEGNA, Inc. | | | 5,656 | | | | 75,112 | |
| Tesla, Inc.(a) | | | 184 | | | | 56,828 | |
| Tiffany & Co. | | | 764 | | | | 72,198 | |
| Time Warner, Inc. | | | 673 | | | | 61,586 | |
| Time, Inc. | | | 5,244 | | | | 97,538 | |
| TJX Cos., Inc. | | | 927 | | | | 70,035 | |
| Toyota Motor Corp., Sponsored ADR | | | 582 | | | | 73,530 | |
| Viacom, Inc., Class B | | | 2,491 | | | | 70,545 | |
| Visteon Corp.(a) | | | 572 | | | | 75,327 | |
| Walt Disney Co. | | | 696 | | | | 72,955 | |
| Whirlpool Corp. | | | 404 | | | | 68,102 | |
| Wyndham Worldwide Corp. | | | 682 | | | | 76,650 | |
| Wynn Resorts, Ltd. | | | 483 | | | | 76,353 | |
| Total Consumer Discretionary | | | | | | | 3,894,577 | |
| Security Description | | Shares | | | Value | |
| Consumer Staples (8.53%) | | | | | | | | |
| Altria Group, Inc. | | | 1,094 | | | $ | 74,206 | |
| Avon Products, Inc.(a) | | | 27,373 | | | | 54,199 | |
| Brown-Forman Corp., Class B | | | 1,282 | | | | 76,664 | |
| Campbell Soup Co. | | | 1,427 | | | | 70,351 | |
| Clorox Co. | | | 505 | | | | 70,342 | |
| Coca-Cola Co. | | | 1,479 | | | | 67,694 | |
| Colgate-Palmolive Co. | | | 944 | | | | 68,393 | |
| CVS Health Corp. | | | 824 | | | | 63,118 | |
| Diageo PLC, Sponsored ADR | | | 505 | | | | 69,927 | |
| Estee Lauder Cos., Inc., Class A | | | 634 | | | | 79,142 | |
| General Mills, Inc. | | | 1,238 | | | | 70,021 | |
| Hershey Co. | | | 623 | | | | 69,109 | |
| Hormel Foods Corp. | | | 2,205 | | | | 80,372 | |
| Kellogg Co. | | | 1,007 | | | | 66,623 | |
| Kimberly-Clark Corp. | | | 564 | | | | 67,545 | |
| Kraft Heinz Co. | | | 838 | | | | 68,188 | |
| Kroger Co. | | | 3,206 | | | | 82,907 | |
| Mondelez International, Inc., Class A | | | 1,700 | | | | 72,998 | |
| PepsiCo, Inc. | | | 596 | | | | 69,446 | |
| Procter & Gamble Co. | | | 753 | | | | 67,763 | |
| Unilever NV, NY Shares | | | 1,137 | | | | 65,650 | |
| Walgreens Boots Alliance, Inc. | | | 831 | | | | 60,464 | |
| Total Consumer Staples | | | | | | | 1,535,122 | |
| | | | | | | | | |
| Energy (0.82%) | | | | | | | | |
| Chevron Corp. | | | 595 | | | | 70,799 | |
| Royal Dutch Shell PLC, Class A, Sponsored ADR | | | 1,204 | | | | 77,200 | |
| Total Energy | | | | | | | 147,999 | |
| | | | | | | | | |
| Financials (22.17%) | | | | | | | | |
| American Express Co. | | | 790 | | | | 77,191 | |
| American International Group, Inc. | | | 1,164 | | | | 69,793 | |
| Ameriprise Financial, Inc. | | | 490 | | | | 79,983 | |
| Aon PLC | | | 479 | | | | 67,165 | |
| Aviva PLC, Sponsored ADR(b) | | | 5,032 | | | | 70,342 | |
| Bank of America Corp. | | | 2,850 | | | | 80,285 | |
| Bank of Montreal | | | 924 | | | | 71,157 | |
| Bank of New York Mellon Corp. | | | 1,343 | | | | 73,516 | |
| Barclays PLC, Sponsored ADR | | | 6,755 | | | | 69,914 | |
| BlackRock, Inc. | | | 164 | | | | 82,195 | |
| Brighthouse Financial, Inc.(a) | | | 1,225 | | | | 72,018 | |
| Capital One Financial Corp. | | | 866 | | | | 79,672 | |
| Charles Schwab Corp. | | | 1,704 | | | | 83,138 | |
| Chubb, Ltd. | | | 477 | | | | 72,556 | |
| Citigroup, Inc. | | | 1,009 | | | | 76,180 | |
| CNA Financial Corp. | | | 1,430 | | | | 77,763 | |
| Comerica, Inc. | | | 999 | | | | 83,227 | |
| Credit Suisse Group AG, Sponsored ADR | | | 4,423 | | | | 74,749 | |
| Deutsche Bank AG | | | 4,186 | | | | 78,948 | |
| Discover Financial Services | | | 1,162 | | | | 82,037 | |
| FactSet Research Systems, Inc. | | | 422 | | | | 84,349 | |
| Fifth Third Bancorp | | | 2,590 | | | | 79,021 | |
| Franklin Resources, Inc. | | | 1,617 | | | | 70,097 | |
| Genworth Financial, Inc., Class A(a) | | | 17,125 | | | | 58,054 | |
| Goldman Sachs Group, Inc. | | | 311 | | | | 77,016 | |
| Workplace Equality Portfolio | |
| Schedule of Investments | November 30, 2017 |
| Security Description | | Shares | | | Value | |
| Financials (continued) | | | | | | | | |
| Hartford Financial Services Group, Inc. | | | 1,282 | | | $ | 73,638 | |
| HSBC Holdings PLC, Sponsored ADR | | | 1,452 | | | | 72,092 | |
| Huntington Bancshares, Inc. | | | 5,358 | | | | 77,155 | |
| JPMorgan Chase & Co. | | | 749 | | | | 78,286 | |
| KeyCorp | | | 3,812 | | | | 72,352 | |
| M&T Bank Corp. | | | 464 | | | | 78,393 | |
| Marsh & McLennan Cos., Inc. | | | 857 | | | | 71,928 | |
| MetLife, Inc. | | | 1,409 | | | | 75,635 | |
| Moody's Corp. | | | 505 | | | | 76,669 | |
| Morgan Stanley | | | 1,468 | | | | 75,763 | |
| Northern Trust Corp. | | | 776 | | | | 75,877 | |
| PNC Financial Services Group, Inc. | | | 535 | | | | 75,200 | |
| Principal Financial Group, Inc. | | | 1,099 | | | | 77,798 | |
| Progressive Corp. | | | 1,494 | | | | 79,451 | |
| Prudential Financial, Inc. | | | 668 | | | | 77,381 | |
| Royal Bank of Canada | | | 921 | | | | 72,114 | |
| S&P Global, Inc. | | | 451 | | | | 74,631 | |
| State Street Corp. | | | 739 | | | | 70,464 | |
| Sun Life Financial, Inc. | | | 1,779 | | | | 70,342 | |
| SunTrust Banks, Inc. | | | 1,245 | | | | 76,729 | |
| T Rowe Price Group, Inc. | | | 808 | | | | 83,159 | |
| Thomson Reuters Corp. | | | 1,500 | | | | 66,105 | |
| Toronto-Dominion Bank | | | 1,259 | | | | 71,687 | |
| Travelers Cos., Inc. | | | 568 | | | | 77,004 | |
| UBS Group AG | | | 4,125 | | | | 70,868 | |
| US Bancorp | | | 1,344 | | | | 74,122 | |
| Voya Financial, Inc. | | | 1,813 | | | | 80,135 | |
| Wells Fargo & Co. | | | 1,328 | | | | 74,992 | |
| Total Financials | | | | | | | 3,990,336 | |
| | | | | | | | | |
| Health Care (10.50%) | | | | | | | | |
| AbbVie, Inc. | | | 788 | | | | 76,373 | |
| Aetna, Inc. | | | 428 | | | | 77,117 | |
| Anthem, Inc. | | | 374 | | | | 87,875 | |
| AstraZeneca PLC, Sponsored ADR | | | 2,139 | | | | 70,309 | |
| athenahealth, Inc.(a) | | | 535 | | | | 71,096 | |
| Baxter International, Inc. | | | 1,079 | | | | 70,707 | |
| Biogen, Inc.(a) | | | 216 | | | | 69,589 | |
| Bioverativ, Inc.(a) | | | 1,257 | | | | 62,875 | |
| Boston Scientific Corp.(a) | | | 2,402 | | | | 63,125 | |
| Bristol-Myers Squibb Co. | | | 1,112 | | | | 70,267 | |
| Cardinal Health, Inc. | | | 1,030 | | | | 60,966 | |
| Cigna Corp. | | | 367 | | | | 77,705 | |
| Danaher Corp. | | | 785 | | | | 74,073 | |
| Eli Lilly & Co. | | | 840 | | | | 71,098 | |
| Express Scripts Holding Co.(a) | | | 1,093 | | | | 71,242 | |
| GlaxoSmithKline PLC, Sponsored ADR | | | 1,729 | | | | 60,619 | |
| Henry Schein, Inc.(a) | | | 845 | | | | 60,375 | |
| Humana, Inc. | | | 276 | | | | 71,997 | |
| Johnson & Johnson | | | 513 | | | | 71,476 | |
| McKesson Corp. | | | 464 | | | | 68,551 | |
| Medtronic PLC | | | 853 | | | | 70,057 | |
| Merck & Co., Inc. | | | 1,030 | | | | 56,928 | |
| Novartis AG, Sponsored ADR | | | 814 | | | | 69,841 | |
| Pfizer, Inc. | | | 1,957 | | | | 70,961 | |
| Sanofi, Sponsored ADR | | | 1,429 | | | | 65,220 | |
| Security Description | | Shares | | | Value | |
| Health Care (continued) | | | | | | | | |
| Thermo Fisher Scientific, Inc. | | | 365 | | | $ | 70,357 | |
| UnitedHealth Group, Inc. | | | 344 | | | | 78,490 | |
| Total Health Care | | | | | | | 1,889,289 | |
| | | | | | | | | |
| Industrials (11.05%) | | | | | | | | |
| 3M Co. | | | 324 | | | | 78,777 | |
| Alaska Air Group, Inc. | | | 929 | | | | 64,259 | |
| American Airlines Group, Inc. | | | 1,500 | | | | 75,735 | |
| Arconic, Inc. | | | 2,737 | | | | 67,358 | |
| Boeing Co. | | | 277 | | | | 76,674 | |
| Cummins, Inc. | | | 418 | | | | 69,973 | |
| Eaton Corp. PLC | | | 901 | | | | 70,080 | |
| Fortive Corp. | | | 985 | | | | 73,530 | |
| General Electric Co. | | | 2,912 | | | | 53,260 | |
| Herman Miller, Inc. | | | 1,998 | | | | 71,429 | |
| Huron Consulting Group, Inc.(a) | | | 2,062 | | | | 84,336 | |
| IHS Markit, Ltd.(a) | | | 1,445 | | | | 64,476 | |
| JetBlue Airways Corp.(a) | | | 3,518 | | | | 75,531 | |
| Lockheed Martin Corp. | | | 226 | | | | 72,121 | |
| ManpowerGroup, Inc. | | | 608 | | | | 78,371 | |
| Navigant Consulting, Inc.(a) | | | 4,349 | | | | 83,457 | |
| Nielsen Holdings PLC | | | 1,743 | | | | 64,003 | |
| Northrop Grumman Corp. | | | 258 | | | | 79,309 | |
| Owens Corning | | | 906 | | | | 80,045 | |
| Raytheon Co. | | | 375 | | | | 71,681 | |
| Rockwell Automation, Inc. | | | 395 | | | | 76,267 | |
| Rockwell Collins, Inc. | | | 528 | | | | 69,860 | |
| Southwest Airlines Co. | | | 1,254 | | | | 76,080 | |
| Steelcase, Inc., Class A | | | 4,868 | | | | 73,994 | |
| United Continental Holdings, Inc.(a) | | | 1,162 | | | | 73,578 | |
| United Technologies Corp. | | | 612 | | | | 74,327 | |
| WW Grainger, Inc. | | | 412 | | | | 91,180 | |
| Total Industrials | | | | | | | 1,989,691 | |
| | | | | | | | | |
| Information Technology (15.97%) | | | | | | | | |
| Accenture PLC, Class A | | | 505 | | | | 74,745 | |
| Adobe Systems, Inc.(a) | | | 449 | | | | 81,480 | |
| Alphabet, Inc., Class C(a) | | | 75 | | | | 76,606 | |
| Apple, Inc. | | | 430 | | | | 73,896 | |
| Automatic Data Processing, Inc. | | | 646 | | | | 73,941 | |
| Booz Allen Hamilton Holding Corp. | | | 1,978 | | | | 76,529 | |
| Broadridge Financial Solutions, Inc. | | | 879 | | | | 79,339 | |
| CA, Inc. | | | 2,104 | | | | 69,579 | |
| Cars.com, Inc.(a)(b) | | | 2,649 | | | | 64,212 | |
| Cisco Systems, Inc. | | | 2,123 | | | | 79,188 | |
| Conduent, Inc.(a) | | | 4,370 | | | | 66,686 | |
| Convergys Corp. | | | 2,800 | | | | 69,104 | |
| Corning, Inc. | | | 2,330 | | | | 75,469 | |
| eBay, Inc.(a) | | | 1,779 | | | | 61,678 | |
| Electronic Arts, Inc.(a) | | | 571 | | | | 60,726 | |
| Facebook, Inc., Class A(a) | | | 398 | | | | 70,518 | |
| Harris Corp. | | | 548 | | | | 79,186 | |
| Hewlett Packard Enterprise Co. | | | 5,060 | | | | 70,587 | |
| HP, Inc. | | | 3,502 | | | | 75,118 | |
| Intel Corp. | | | 1,868 | | | | 83,761 | |
| International Business Machines Corp. | | | 478 | | | | 73,598 | |
| Intuit, Inc. | | | 488 | | | | 76,723 | |
| Workplace Equality Portfolio | |
| Schedule of Investments | November 30, 2017 |
| Security Description | | Shares | | | Value | |
| Information Technology (continued) | | | | | | | | |
| Mastercard, Inc., Class A | | | 491 | | | $ | 73,881 | |
| Microsoft Corp. | | | 911 | | | | 76,679 | |
| NCR Corp.(a) | | | 1,866 | | | | 58,387 | |
| NetApp, Inc. | | | 1,676 | | | | 94,711 | |
| Nokia OYJ, Sponsored ADR | | | 11,341 | | | | 56,818 | |
| NVIDIA Corp. | | | 402 | | | | 80,685 | |
| Oracle Corp. | | | 1,425 | | | | 69,911 | |
| PayPal Holdings, Inc.(a) | | | 1,095 | | | | 82,924 | |
| QUALCOMM, Inc. | | | 1,324 | | | | 87,834 | |
| Salesforce.com, Inc.(a) | | | 735 | | | | 76,675 | |
| Symantec Corp. | | | 2,068 | | | | 59,910 | |
| Tech Data Corp.(a) | | | 802 | | | | 77,553 | |
| Texas Instruments, Inc. | | | 818 | | | | 79,583 | |
| Twitter, Inc.(a) | | | 3,843 | | | | 79,089 | |
| Visa, Inc., Class A | | | 657 | | | | 73,972 | |
| Xerox Corp. | | | 2,146 | | | | 63,650 | |
| Yelp, Inc.(a) | | | 1,588 | | | | 70,745 | |
| Total Information Technology | | | | | | | 2,875,676 | |
| | | | | | | | | |
| Materials (2.73%) | | | | | | | | |
| Alcoa Corp.(a) | | | 1,546 | | | | 64,175 | |
| Ball Corp. | | | 1,686 | | | | 67,288 | |
| Chemours Co. | | | 1,372 | | | | 70,521 | |
| DowDuPont, Inc. | | | 992 | | | | 71,384 | |
| Ecolab, Inc. | | | 530 | | | | 72,038 | |
| Monsanto Co. | | | 579 | | | | 68,519 | |
| Praxair, Inc. | | | 508 | | | | 78,191 | |
| Total Materials | | | | | | | 492,116 | |
| | | | | | | | | |
| Real Estate (1.77%) | | | | | | | | |
| CBRE Group, Inc., Class A(a) | | | 1,894 | | | | 82,124 | |
| Jones Lang LaSalle, Inc. | | | 570 | | | | 86,919 | |
| Park Hotels & Resorts, Inc. | | | 2,560 | | | | 74,752 | |
| Weyerhaeuser Co. | | | 2,111 | | | | 74,687 | |
| Total Real Estate | | | | | | | 318,482 | |
| | | | | | | | | |
| Telecommunication Services (1.82%) | | | | | | | | |
| AT&T, Inc. | | | 1,876 | | | | 68,249 | |
| BT Group PLC, Sponsored ADR | | | 3,561 | | | | 62,994 | |
| Sprint Corp.(a) | | | 8,994 | | | | 53,874 | |
| T-Mobile US, Inc.(a) | | | 1,114 | | | | 68,032 | |
| Verizon Communications, Inc. | | | 1,464 | | | | 74,503 | |
| Total Telecommunication Services | | | | | | | 327,652 | |
| | | | | | | | | |
| Utilities (2.69%) | | | | | | | | |
| American Electric Power Co., Inc. | | | 947 | | | | 73,516 | |
| Edison International | | | 861 | | | | 69,973 | |
| Exelon Corp. | | | 1,856 | | | | 77,414 | |
| PG&E Corp. | | | 992 | | | | 53,806 | |
| Portland General Electric Co. | | | 1,487 | | | | 73,815 | |
| PPL Corp. | | | 1,742 | | | | 63,879 | |
| Sempra Energy | | | 589 | | | | 71,263 | |
| Total Utilities | | | | | | | 483,666 | |
| | | | | | | | | |
| TOTAL COMMON STOCKS | | | | | | | | |
| (Cost $14,519,361) | | | | | | | 17,944,606 | |
| | | 7 Day Yield | | | Shares | | | Value | |
| SHORT TERM INVESTMENTS (1.65%) | | | | | | | |
| Money Market Fund (0.17%) | | | | | | | | | |
| State Street Institutional Treasury Plus Money Market Fund (Cost $30,509) | | | 0.970 | % | | | 30,509 | | | $ | 30,509 | |
| | | | | | | | | | | | | |
| Investments Purchased with Collateral from Securities Loaned (1.48%) | | | | | | |
| State Street Navigator Securities Lending Prime Portfolio, (Cost $265,972) | | | 1.04 | % | | | 265,972 | | | | 265,972 | |
| | | | | | | | | | | | | |
| TOTAL SHORT TERM INVESTMENTS | | | | | | | |
| (Cost $296,481) | | | | | | | | | | | 296,481 | |
| | | | | | | | | | | | | |
| TOTAL INVESTMENTS (101.33%) | | | | | | | | | |
| (Cost 14,815,842) | | | | | | | | | | $ | 18,241,087 | |
| | | | | | | | | | | | | |
| NET LIABILITIES LESS OTHER ASSETS (-1.33%) | | | | | | | | (239,313 | ) |
| | | | | | | | | | | | | |
| NET ASSETS (100.00%) | | | | | | | | | | $ | 18,001,774 | |
| (a) | Non-income producing security. |
| (b) | Security, or a portion of the security position, is currently on loan. The total market value of securities on loan is $261,055. |
See Notes to Financial Statements.
| Workplace Equality Portfolio | |
| Statement of Assets and Liabilities | November 30, 2017 |
| ASSETS: | | | |
| Investments, at value | | $ | 18,241,087 | |
| Dividends receivable | | | 37,406 | |
| Total Assets | | | 18,278,493 | |
| | | | | |
| LIABILITIES: | | | | |
| Payable to adviser | | | 10,747 | |
| Payable for collateral upon return of securities loaned | | | 265,972 | |
| Total Liabilities | | | 276,719 | |
| NET ASSETS | | $ | 18,001,774 | |
| | | | | |
| NET ASSETS CONSIST OF: | | | | |
| Paid-in capital | | $ | 14,507,562 | |
| Accumulated net investment income | | | 184,792 | |
| Accumulated net realized loss on investments | | | (115,821 | ) |
| Net unrealized appreciation on investments | | | 3,425,241 | |
| NET ASSETS | | $ | 18,001,774 | |
| | | | | |
| INVESTMENTS, AT COST | | $ | 14,815,842 | |
| | | | | |
| PRICING OF SHARES | | | | |
| Net Assets | | $ | 18,001,774 | |
| Shares of beneficial interest outstanding (Unlimited number of shares authorized, par value $0.01 per share) | | | 500,000 | |
| Net Asset Value, offering and redemption price per share | | $ | 36.00 | |
See Notes to Financial Statements.
| Workplace Equality Portfolio | |
| Statement of Operations | For the Year Ended November 30, 2017 |
| INVESTMENT INCOME: | | | |
| Dividends(a) | | $ | 298,227 | |
| Securities lending income | | | 12,198 | |
| Total Investment Income | | | 310,425 | |
| | | | | |
| EXPENSES: | | | | |
| Investment adviser fees | | | 109,261 | |
| Total Expenses | | | 109,261 | |
| NET INVESTMENT INCOME | | | 201,164 | |
| | | | | |
| REALIZED AND UNREALIZED GAIN/(LOSS) | | | | |
| Net realized gain on investments | | | 572,809 | |
| Net realized gain on foreign currency transactions | | | 14 | |
| Net realized gain | | | 572,823 | |
| Net change in unrealized appreciation on investments | | | 2,027,742 | |
| Net change in unrealized depreciation on foreign currency transactions | | | (4 | ) |
| Net change in unrealized appreciation | | | 2,027,738 | |
| NET REALIZED AND UNREALIZED GAIN ON INVESTMENTS | | | 2,600,561 | |
| NET INCREASE IN NET ASSETS RESULTING FROM OPERATIONS | | $ | 2,801,725 | |
| (a) | Net of foreign tax withholding $3,690. |
See Notes to Financial Statements.
Workplace Equality Portfolio
Statements of Changes in Net Assets
| | | For the Year Ended November 30, 2017 | | | For the Year Ended November 30, 2016 | |
| OPERATIONS: | | | | | | |
| Net investment income | | $ | 201,164 | | | $ | 174,248 | |
| Net realized gain/(loss) | | | 572,823 | | | | (201,456 | ) |
| Net change in unrealized appreciation | | | 2,027,738 | | | | 1,251,679 | |
| Net increase in net assets resulting from operations | | | 2,801,725 | | | | 1,224,471 | |
| | | | | | | | | |
| DISTRIBUTIONS: | | | | | | | | |
| Dividends to shareholders from net investment income | | | (183,001 | ) | | | (135,078 | ) |
| Net decrease in net assets from distributions | | | (183,001 | ) | | | (135,078 | ) |
| | | | | | | | | |
| CAPITAL SHARE TRANSACTIONS: | | | | | | | | |
| Proceeds from sale of shares | | | 4,813,655 | | | | 1,342,125 | |
| Cost of shares redeemed | | | (1,553,228 | ) | | | – | |
| Net increase from capital share transactions | | | 3,260,427 | | | | 1,342,125 | |
| Net increase in net assets | | | 5,879,151 | | | | 2,431,518 | |
| | | | | | | | | |
| NET ASSETS: | | | | | | | | |
| Beginning of year | | | 12,122,623 | | | | 9,691,105 | |
| End of year* | | $ | 18,001,774 | | | $ | 12,122,623 | |
| | | | | | | | | |
| *Including accumulated net investment income of: | | $ | 184,792 | | | $ | 166,615 | |
| | | | | | | | | |
| OTHER INFORMATION: | | | | | | | | |
| CAPITAL SHARE TRANSACTIONS: | | | | | | | | |
| Beginning shares | | | 400,000 | | | | 350,000 | |
| Shares sold | | | 150,000 | | | | 50,000 | |
| Shares redeemed | | | (50,000 | ) | | | – | |
| Shares outstanding, end of period | | | 500,000 | | | | 400,000 | |
See Notes to Financial Statements.
| Workplace Equality Portfolio | |
| Financial Highlights | For a Share Outstanding Throughout the Periods Presented |
| | | For the Year Ended November 30, 2017 | | | For the Year Ended November 30, 2016 | | | For the Year Ended November 30, 2015 | | | For the Period February 25, 2014 (Commencement of Operations) to November 30, 2014 | |
| NET ASSET VALUE, BEGINNING OF PERIOD | | $ | 30.31 | | | $ | 27.69 | | | $ | 27.92 | | | $ | 25.00 | |
| | | | | | | | | | | | | | | | | |
| INCOME/(LOSS) FROM INVESTMENT OPERATIONS: | | | | | | | | | | | | | | | | |
| Net investment income(a) | | | 0.45 | | | | 0.46 | | | | 0.36 | | | | 0.28 | |
| Net realized and unrealized gain/(loss) | | | 5.70 | | | | 2.55 | | | | (0.20 | ) | | | 2.64 | |
| Total from investment operations | | | 6.15 | | | | 3.01 | | | | 0.16 | | | | 2.92 | |
| | | | | | | | | | | | | | | | | |
| DISTRIBUTIONS: | | | | | | | | | | | | | | | | |
| From net investment income | | | (0.46 | ) | | | (0.39 | ) | | | (0.39 | ) | | | – | |
| Total distributions | | | (0.46 | ) | | | (0.39 | ) | | | (0.39 | ) | | | – | |
| | | | | | | | | | | | | | | | | |
| Net increase/(decrease) in net asset value | | | 5.69 | | | | 2.62 | | | | (0.23 | ) | | | 2.92 | |
| NET ASSET VALUE, END OF PERIOD | | $ | 36.00 | | | $ | 30.31 | | | $ | 27.69 | | | $ | 27.92 | |
| TOTAL RETURN(b) | | | 20.56 | % | | | 11.04 | % | | | 0.59 | % | | | 11.68 | % |
| | | | | | | | | | | | | | | | | |
| RATIOS/SUPPLEMENTAL DATA: | | | | | | | | | | | | | | | | |
| Net assets, end of period (000s) | | $ | 18,002 | | | $ | 12,123 | | | $ | 9,691 | | | $ | 6,979 | |
| | | | | | | | | | | | | | | | | |
| Ratio of expenses to average net assets | | | 0.75 | % | | | 0.75 | % | | | 0.75 | % | | | 0.75 | %(c) |
| Ratio of net investment income to average net assets | | | 1.38 | % | | | 1.69 | % | | | 1.31 | % | | | 1.42 | %(c) |
| Portfolio turnover rate(d) | | | 22 | % | | | 34 | % | | | 26 | % | | | 8 | % |
| (a) | Based on average shares outstanding during the period. |
| (b) | Total return is calculated assuming an initial investment made at the net asset value at the beginning of the period and redemption at the net asset value on the last day of the period and assuming all distributions are reinvested at reinvestment prices. Total return calculated for a period of less than one year is not annualized. |
| (d) | Portfolio turnover for periods less than one year are not annualized and does not include securities received or delivered from processing creations or redemptions in-kind. |
See Notes to Financial Statements.
| Workplace Equality Portfolio | |
| Notes to Financial Statements | November 30, 2017 |
1. ORGANIZATION
ALPS ETF Trust (the “Trust”), a Delaware statutory trust, is an open-end management investment company registered under the Investment Company Act of 1940, as amended (the “1940 Act”). As of November 30, 2017, the Trust consisted of nineteen separate portfolios. Each portfolio represents a separate series of the Trust. This report pertains solely to the Workplace Equality Portfolio (the “Fund”). The investment objective of the Fund is to seek investment results that correspond generally, before fees and expenses, to the price and yield of the Workplace Equality IndexTM. The investment advisor uses a “passive” or indexing approach to try to achieve the Fund’s investment objective. The Fund has elected to qualify as a diversified series of the Trust under the 1940 Act.
The Fund’s Shares (“Shares”) are listed on the NYSE Arca, Inc. The Fund issues and redeems Shares at net asset value (“NAV”) in blocks of 50,000 Shares, each of which is called a “Creation Unit”. Creation Units are issued and redeemed principally in-kind for securities included in the Underlying Index. Except when aggregated in Creation Units, Shares are not redeemable securities of the Fund.
Pursuant to the Trust’s organizational documents, its Officers and Trustees are indemnified against certain liability arising out of the performance of their duties to the Trust. Additionally, in the normal course of business, the Trust enters into contracts with service providers that contain general indemnification clauses. The Trust’s maximum exposure under these arrangements is unknown, as this would involve future claims that may be made against the Trust that have not yet occurred.
2. SIGNIFICANT ACCOUNTING POLICIES
The following is a summary of significant accounting policies consistently followed by the Fund in the preparation of the financial statements. The accompanying financial statements were prepared in accordance with accounting principles generally accepted in the United States of America (“U.S. GAAP”). The preparation of financial statements in conformity with U.S. GAAP requires management to make certain estimates and assumptions that affect the reported amounts of assets and liabilities and disclosures of contingent assets and liabilities at the date of the financial statements and the reported amounts of revenue and expenses during the period. Actual results could differ from those estimates. The Fund is considered an investment company under U.S. GAAP and follows the accounting and reporting guidance applicable to investment companies in the Financial Accounting Standards Board Accounting Standards Codification Topic 946.
A. Portfolio Valuation
The Fund’s NAV is determined daily, as of the close of regular trading on the New York Stock Exchange (the “NYSE”), normally 4:00 p.m. Eastern time, on each day the NYSE is open for trading. The NAV is computed by dividing the value of all assets of the Fund (including accrued interest and dividends), less all liabilities (including accrued expenses and dividends declared but unpaid), by the total number of shares outstanding.
Portfolio securities listed on any exchange other than the NASDAQ Stock Market LLC (“NASDAQ”) are valued at the last sale price on the business day as of which such value is being determined. If there has been no sale on such day, the securities are valued at the mean of the most recent bid and ask prices on such day. Securities traded on the NASDAQ are valued at the NASDAQ Official Closing Price as determined by NASDAQ. Portfolio securities traded on more than one securities exchange are valued at the last sale price on the business day as of which such value is being determined at the close of the exchange representing the principal market for such securities. Portfolio securities traded in the over-the-counter market, but excluding securities traded on the NASDAQ, are valued at the latest quoted sale price in such market.
The Fund’s investments are valued at market value or, in the absence of market value with respect to any portfolio securities, at fair value according to procedures adopted by the Trust’s Board of Trustees (the “Board”). When market quotations are not readily available or when events occur that make established valuation methods unreliable, securities of the Fund may be valued in good faith by or under the direction of the Board. These securities generally include, but are not limited to, restricted securities (securities which may not be publicly sold without registration under the Securities Act of 1933) for which a pricing service is unable to provide a market price; securities whose trading has been formally suspended; a security whose market price is not available from a pre-established primary pricing source or the pricing source is not willing to provide a price; a security with respect to which an event has occurred that is most likely to materially affect the value of the security after the market has closed but before the calculation of the Fund’s NAV or make it difficult or impossible to obtain a reliable market quotation; or a security whose price, as provided by the pricing service, does not reflect the security’s “fair value” due to the security being de-listed from a national exchange or the security’s primary trading market is temporarily closed at a time when, under normal conditions, it would be open. As a general principle, the current “fair value” of a security would be the amount which the owner might reasonably expect to receive from the sale on the applicable exchange or principal market. A variety of factors may be considered in determining the fair value of such securities.
| Workplace Equality Portfolio | |
| Notes to Financial Statements | November 30, 2017 |
B. Fair Value Measurements
The Fund discloses the classification of its fair value measurements following a three-tier hierarchy based on the inputs used to measure fair value. Inputs refer broadly to the assumptions that market participants would use in pricing the asset or liability; including assumptions about risk. Inputs may be observable or unobservable. Observable inputs reflect the assumptions market participants would use in pricing the asset or liability that are developed based on market data obtained from sources independent of the reporting entity. Unobservable inputs reflect the reporting entity’s own assumptions about the assumptions market participants would use in pricing the asset or liability that are developed based on the best information available.
Valuation techniques used to value the Fund's investments by major category are as follows:
Equity securities, including restricted securities, for which market quotations are readily available, are valued at the last reported sale price or official closing price as reported by a third party pricing vendor on the primary market or exchange on which they are traded and are categorized as Level 1 in the hierarchy. In the event there were no sales during the day or closing prices are not available, securities are valued at the mean of the most recent quoted bid and ask prices on such day and are generally categorized as Level 2 in the hierarchy. Investments in open-end mutual funds are valued at their closing NAV each business day and are categorized as Level 1 in the hierarchy.
Changes in valuation techniques may result in transfers in or out of an assigned level within the disclosure hierarchy.
Various inputs are used in determining the value of the Fund’s investments as of the end of the reporting period. When inputs used fall into different levels of the fair value hierarchy, the level in the hierarchy within which the fair value measurement falls is determined based on the lowest level input that is significant to the fair value measurement in its entirety. The designated input levels are not necessarily an indication of the risk or liquidity associated with these investments.
These inputs are categorized in the following hierarchy under applicable financial accounting standards:
| Level 1 – | Unadjusted quoted prices in active markets for identical investments, unrestricted assets or liabilities that a Fund has the ability to access at the measurement date; |
| Level 2 – | Quoted prices which are not active, quoted prices for similar assets or liabilities in active markets or inputs other than quoted prices that are observable (either directly or indirectly) for substantially the full term of the asset or liability; and |
| Level 3 – | Significant unobservable prices or inputs (including the Fund’s own assumptions in determining the fair value of investments) where there is little or no market activity for the asset or liability at the measurement date. |
The following is a summary of the inputs used to value the Fund’s investments as of November 30, 2017:
| Investments in Securities at Value | | Level 1 - Unadjusted Quoted Prices | | Level 2 - Other Significant Observable Inputs | | Level 3 - Significant Unobservable Inputs | | Total |
| Common Stocks* | | $ | 17,944,606 | | | $ | – | | | $ | – | | | $ | 17,944,606 | |
| Short Term Investments | | | | | | | | | | | | | | | | |
| Money Market Fund | | | 30,509 | | | | – | | | | – | | | | 30,509 | |
| Investments Purchased with Collateral from Securities Loaned | | | 265,972 | | | | – | | | | – | | | | 265,972 | |
| TOTAL | | $ | 18,241,087 | | | $ | – | | | $ | – | | | $ | 18,241,087 | |
| * | For a detailed sector breakdown, see the accompanying Schedule of Investments. |
The Fund recognizes transfers between levels as of the end of the period. For the year ended November 30, 2017, the Fund did not have any transfers between Level 1 and Level 2 securities. The Fund did not have any securities that used significant unobservable inputs (Level 3) in determining fair value.
C. Securities Transactions and Investment Income
Securities transactions are recorded as of the trade date. Realized gains and losses from securities transactions are recorded on the highest cost basis. Dividend income and capital gains distributions, if any, are recorded on the ex-dividend date. Interest income, if any, is recorded on the accrual basis.
| Workplace Equality Portfolio | |
| Notes to Financial Statements | November 30, 2017 |
D. Dividends and Distributions to Shareholders
Dividends from net investment income of the Fund, if any, are declared and paid annually or as the Board may determine from time to time. Distributions of net realized capital gains earned by the Fund, if any, are distributed at least annually.
E. Federal Tax and Tax Basis Information
The timing and character of income and capital gain distributions are determined in accordance with income tax regulations, which may differ from U.S. GAAP. Reclassifications are made to the Fund’s capital accounts for permanent tax differences to reflect income and gains available for distribution (or available capital loss carryforwards) under income tax regulations.
For the year ended November 30, 2017, the following reclassifications, which had no impact on results of operations or net assets, were recorded to reflect tax character:
| Fund | | Paid-in Capital | | Accumulated Net Investment Income/(Loss) | | Accumulated Net Realized Gain/(Loss) on Investments |
| Workplace Equality Portfolio | | $ | 461,986 | | | $ | 14 | | | $ | (462,000 | ) |
At November 30, 2017, the Fund had available for tax purposes unused post-enactment capital loss carryforwards as follows:
| Fund | | Short-Term | | Long-Term |
| Workplace Equality Portfolio | | $ | – | | | $ | 66,172 | |
Capital loss carryovers used during the period ended November 30, 2017 were $114,152
The tax character of the distributions paid during the fiscal years ended November 30, 2017 and November 30, 2016 were as follows:
| | | Ordinary Income |
| November 30, 2017 | | |
| Workplace Equality Portfolio | | $ | 183,001 | |
| November 30, 2016 | | | | |
| Workplace Equality Portfolio | | $ | 135,078 | |
As of November 30, 2017, the components of distributable earnings on a tax basis for the Fund were as follows:
| | | Workplace Equality Portfolio Fund |
| Undistributed net investment income | | $ | 184,792 | |
| Accumulated net realized loss on investments | | | (66,172 | ) |
| Net unrealized appreciation on investments | | | 3,375,592 | |
| Total | | $ | 3,494,212 | |
| Workplace Equality Portfolio | |
| Notes to Financial Statements | November 30, 2017 |
As of November 30, 2017, the cost of investments for federal income tax purposes and accumulated net unrealized appreciation/(depreciation) on investments were as follows:
| | | Workplace Equality Portfolio |
| Gross appreciation (excess of value over tax cost) | | $ | 3,942,639 | |
| Gross depreciation (excess of tax cost over value) | | | (567,043 | ) |
| Net depreciation on foreign currency transactions | | | (4 | ) |
| Net unrealized appreciation (depreciation) | | $ | 3,375,592 | |
| Cost of investments for income tax purposes | | $ | 14,865,491 | |
The differences between book-basis and tax-basis are primarily due to the deferral of losses from wash sales.
F. Income Taxes
No provision for income taxes is included in the accompanying financial statements, as the Fund intends to distribute to shareholders all taxable investment income and realized gains and otherwise comply with Subchapter M of the Internal Revenue Code of 1986, as amended, applicable to regulated investment companies. The Fund evaluates tax positions taken (or expected to be taken) in the course of preparing the Fund’s tax returns to determine whether these positions meet a “more-likely-than-not” standard that, based on the technical merits, have a more than fifty percent likelihood of being sustained by a taxing authority upon examination. A tax position that meets the “more-likely-than-not” recognition threshold is measured to determine the amount of benefit to recognize in the financial statements.
As of and during the year ended November 30, 2017, the Fund did not have a liability for any unrecognized tax benefits. The Fund files U.S. federal, state, and local tax returns as required. The Fund’s tax returns are subject to examination by the relevant tax authorities until expiration of the applicable statute of limitations, which is generally three years after the filing of the tax return, but may extend to four years in certain jurisdictions. Tax returns for open years have incorporated no uncertain tax positions that require a provision for income taxes.
G. Lending of Portfolio Securities
The Fund has entered into a securities lending agreement with State Street Bank & Trust Co. (“SSB”), the Fund’s lending agent. The Fund may lend its portfolio securities only to borrowers that are approved by SSB. The Fund will limit such lending to not more than 33 1/3% of the value of its total assets. The Fund’s securities held at SSB as custodian shall be available to be lent except those securities the Fund or ALPS Advisors, Inc. specifically identifies in writing as not being available for lending. The borrower pledges and maintains with the Fund collateral consisting of cash (U.S. Dollars only), securities issued or guaranteed by the U.S. government or its agencies or instrumentalities, and cash equivalents (including irrevocable bank letters of credit) issued by a person other than the borrower or an affiliate of the borrower. The initial collateral received by the Fund is required to have a value of no less than 102% of the market value of the loaned securities for U.S equity securities and a value of no less than 105% of the market value for non-U.S. equity securities. The collateral is maintained thereafter, at a market value equal to not less than 102% of the current value of the U.S. equity securities on loan and not less than 105% of the current value of the non-U.S. equity securities on loan. The market value of the loaned securities is determined at the close of each business day and any additional required collateral is delivered to the Fund on the next business day. During the term of the loan, the Fund is entitled to all distributions made on or in respect of the loaned securities. Loans of securities are terminable at any time and the borrower, after notice, is required to return borrowed securities within the customary time period for settlement of securities transactions.
Any cash collateral received is reinvested in a money market fund managed by SSB as disclosed in the Fund’s Schedule of Investments and is reflected in the Statements of Assets and Liabilities as a payable for collateral upon return of securities loaned. Non-cash collateral, in the form of securities issued or guaranteed by the U.S. government or its agencies or instrumentalities, is not disclosed in the Fund’s Statements of Assets and Liabilities as it is held by the lending agent on behalf of the Fund, and the Fund does not have the ability to re-hypothecate these securities. Income earned by the Fund from securities lending activity is disclosed in the Statement of Operations.
The following is a summary of the Fund's securities lending agreement and related cash and non-cash collateral received as of November 30, 2017:
| | | Market Value of Securities on Loan | | Cash Collateral Received | | Non-Cash Collateral Received | | Total Collateral Received |
| Workplace Equality Portfolio | | $ | 261,055 | | | $ | 265,972 | | | $ | 4,896 | | | $ | 270,868 | |
The risks of securities lending include the risk that the borrower may not provide additional collateral when required or may not return the securities when due. To mitigate these risks, the Fund benefits from a borrower default indemnity provided by SSB. SSB’s indemnity allows for full replacement of securities lent wherein SSB will purchase the unreturned loaned securities on the open market by applying the proceeds of the collateral, or to the extent such proceeds are insufficient or the collateral is unavailable, SSB will purchase the unreturned loan securities at SSB’s expense. However, the Fund could suffer a loss if the value of the investments purchased with cash collateral falls below the value of the cash collateral received.
| Workplace Equality Portfolio | |
| Notes to Financial Statements | November 30, 2017 |
The following table reflects a breakdown of transactions accounted for as secured borrowings, the gross obligation by the type of collateral pledged or securities loaned, and the remaining contractual maturity of those transactions as of November 30, 2017:
| Workplace Equality Portfolio | Remaining contractual maturity of the agreement |
| Securities Lending Transactions | | Overnight & Continuous | | Up to 30 days | | 30-90 days | | Greater than 90 days | | Total |
| Common Stocks | | $ | 265,972 | | | $ | – | | | $ | – | | | $ | – | | | $ | 265,972 | |
| Total Borrowings | | | | | | | | | | | | | | | | | | | 265,972 | |
| Gross amount of recognized liabilities for securities lending(collateral received) | | | | | | | $ | 265,972 | |
3. INVESTMENT ADVISORY FEE AND OTHER AFFILIATED TRANSACTIONS
ALPS Advisors, Inc. (the “Adviser”) acts as the Fund’s investment adviser pursuant to an Advisory Agreement with the Trust on behalf of the Fund (the “Advisory Agreement”). Pursuant to the Advisory Agreement, the Fund pays the Adviser a unitary fee for the services and facilities it provides payable on a monthly basis at the annual rate of 0.75% of the Fund’s average daily net assets. From time to time, the Adviser may waive all or a portion of its fee.
Out of the unitary management fee, the Adviser pays substantially all expenses of the Fund, including the licensing fees to the Index provider, the cost of transfer agency, custody, fund administration, legal, audit, independent trustees and other services, except for interest expenses, distribution fees or expenses, brokerage expenses, taxes and extraordinary expenses not incurred in the ordinary course of the Fund’s business. The Adviser’s unitary management fee is designed to pay substantially all the Fund’s expenses and to compensate the Adviser for providing services for the Fund.
ALPS Fund Services, Inc., an affiliate of the Adviser, is the administrator of the Fund.
Each Trustee who is not an officer or employee of the Adviser, any sub-adviser or any of their affiliates (“Independent Trustees”) receives (1) a quarterly retainer of $5,000, (2) a per meeting fee for regularly scheduled meetings of $3,750, (3) $1,500 for any special meeting held outside of a regularly scheduled board meeting, and (4) reimbursement for all reasonable out-of-pocket expenses relating to attendance at meetings.
4. PURCHASES AND SALES OF SECURITIES
For the year ended November 30, 2017, the cost of purchases and proceeds from sales of investment securities, excluding in-kind transactions and short-term investments, were as follows:
| Fund | | Purchases | | Sales |
| Workplace Equality Portfolio | | $ | 3,244,735 | | | $ | 3,304,175 | |
For the year ended November 30, 2017, the cost of in-kind purchases and proceeds from in-kind sales were as follows:
| Fund | | Purchases | | Sales |
| Workplace Equality Portfolio | | $ | 4,814,381 | | | $ | 1,499,570 | |
For the year ended November 30, 2017, the Workplace Equality Portfolio had in-kind net realized gain of $467,389.
Gains on in-kind transactions are not considered taxable for federal income tax purposes and losses on in kind transactions are also not deductible for tax purposes.
| Workplace Equality Portfolio | |
| Notes to Financial Statements | November 30, 2017 |
5. CAPITAL SHARE TRANSACTIONS
Shares are created and redeemed by the Fund only in Creation Unit size aggregations of 50,000 Shares. Only broker-dealers or large institutional investors with creation and redemption agreements called Authorized Participants (“AP”) are permitted to purchase or redeem Creation Units from the Fund. Such transactions are generally permitted on an in-kind basis, with a balancing cash component to equate the transaction to the NAV per unit of the Fund on the transaction date. Cash may be substituted equivalent to the value of certain securities generally when they are not available in sufficient quantity for delivery, not eligible for trading by the AP or as a result of other market circumstances.
6. RELATED PARTY TRANSACTIONS
The Fund engaged in cross trades between other funds in the Trust during the year ended November 30, 2017 pursuant to Rule 17a-7 under the 1940 Act. Cross trading is the buying or selling of portfolio securities between funds to which the Adviser serves as the investment adviser. The Board previously adopted procedures that apply to transactions between the Funds of the Trust pursuant to Rule 17a-7. These transactions related to cross trades during the period complied with the requirements set forth by Rule 17a-7 and the Trust’s procedures.
Transactions related to cross trades during the year ended November 30, 2017, were as follows:
| Fund | | Purchase cost paid | | Sale proceeds received | | Realized gain/ (loss) on sales |
| Workplace Equality ETF | | $ | 12,659 | | | $ | 7,799 | | | $ | 2,019 | |
| Workplace Equality Portfolio | |
| Additional Information | November 30, 2017 (Unaudited) |
PROXY VOTING RECORDS, POLICIES AND PROCEDURES
Information regarding how the Fund voted proxies relating to portfolio securities during the most recent 12-month period ended June 30 and a description of the Fund’s proxy voting policies and procedures used in determining how to vote for proxies are available without charge on the SEC’s website at www.sec.gov and upon request, by calling (toll-free) 1-866-675-2639.
PORTFOLIO HOLDINGS
The Trust is required to disclose, after its first and third fiscal quarters, the complete schedule of the Fund’s portfolio holdings with the SEC on Form N-Q. Forms N-Q for the Fund are available on the SEC’s website at www.sec.gov. The Fund’s Forms N-Q may also be reviewed and copied at the SEC’s Public Reference Room in Washington, D.C. and information on the operation of the Public Reference Room may be obtained by calling 1-800-SEC-0330. The Fund’s Forms N-Q are available without charge, upon request, by calling (toll-free) 1-866-675-2639 or by writing to ALPS ETF Trust at 1290 Broadway, Suite 1100, Denver, Colorado 80203.
TAX INFORMATION
The Fund designates the following for federal income tax purposes for distributions made during the calendar year ended December 31, 2016:
| | Qualified Dividend Income | Dividend Received Deduction |
| Workplace Equality Portfolio | 100.00% | 99.92% |
In early 2017, if applicable, shareholders of record received this information for the distribution paid to them by the Fund during the calendar year 2016 via Form 1099. The Fund will notify shareholders in early 2018 of amounts paid to them by the Fund, if any, during the calendar year 2017.
LICENSING AGREEMENT
Denver Investments has entered into an index licensing agreement with ALPS Advisors Inc. (the “Adviser”) to allow the Adviser’s use of the Workplace Equality Index™, the underlying index of the Workplace Equality Portfolio (the “Fund”). The following disclosure relates to such licensing agreement:
Denver Investments is the designer of the construction and methodology for the Index. “Denver Investments” and “Workplace Equality Index™” are service marks or trademarks of Denver Investments. Denver Investments acts as brand licensor for the Index. Denver Investments is not responsible for the descriptions of the Index or the Fund that appear herein. Denver Investments is not affiliated with the Trust, the Adviser or the Distributor.
The Fund is not sponsored, endorsed or promoted by Denver Investments. Denver Investments makes no representation or warranty, express or implied, to the owners of the Fund or any member of the public regarding the advisability of investing in securities or commodities generally or in the Fund particularly and does not guarantee the quality, accuracy or completeness of the Index or any Index data included herein or derived there from and assume no liability in connection with their use. The Index is determined and composed without regard to the Adviser or the Fund. Denver Investments has no obligation to take the needs of the Adviser, the Fund or the shareholders of the Fund into consideration in connection with the foregoing. Denver Investments is not responsible for and has not participated in the determination of pricing or the timing of the issuance or sale of the Shares of the Fund or in the determination or calculation of the NAV of the Fund. Denver Investments has no obligation or liability in connection with the administration or trading of the Fund.
Denver Investments does not guarantee the accuracy and/or completeness of the Index or any data included therein, and Denver Investments shall have no liability for any errors, omissions, or interruptions therein. Denver Investments makes no warranty, express or implied, as to results to be obtained by the Adviser, the Fund, Fund shareholders or any other person or entity from the use of the Index or any data included therein. Denver Investments makes no express or implied warranties, and expressly disclaims all warranties of merchantability or fitness for a particular purpose or use with respect to the Index or any data included therein. Without limiting any of the foregoing, in no event shall Denver Investments have any liability for any special, punitive, indirect, or consequential damages (including lost profits) arising out of matters relating to the use of the Index, even if notified of the possibility of such damages.
The Adviser does not guarantee the accuracy and/or the completeness of the Index or any data included therein, and the Adviser shall have no liability for any errors, omissions or interruptions therein. The Adviser makes no warranty, express or implied, as to results to be obtained by the Fund, owners of the Shares of the Fund or any other person or entity from the use of the Index or any data included therein. The Adviser makes no express or implied warranties, and expressly disclaims all warranties of merchantability or fitness for a particular purpose or use with respect to the Index or any data included therein. Without limiting any of the foregoing, in no event shall the Adviser have any liability for any special, punitive, direct, indirect, or consequential damages (including lost profits) arising out of matters relating to the use of the Index, even if notified of the possibility of such damages.
| Workplace Equality Portfolio | |
| Board Considerations Regarding Approval of Investment Advisory Agreement | November 30, 2017 (Unaudited) |
At an in-person meeting held on June 8, 2017, the Board of Trustees of the Trust (the “Board” or the “Trustees”), including the Trustees who are not “interested persons” of the Trust within the meaning of the 1940 Act, as amended (the “Independent Trustees”), evaluated a proposal to approve the continuance of the Investment Advisory Agreement between the Trust and ALPS Advisors, Inc. (the “Adviser” or “AAI”) with respect to the Workplace Equality Portfolio (“EQLT” or “the Fund”). The Independent Trustees also met separately to consider the Investment Advisory Agreement.
In evaluating the Investment Advisory Agreement with respect to the Fund, the Independent Trustees considered various factors, including (i) the nature, extent and quality of the services provided by AAI with respect to the Fund under the Investment Advisory Agreements; (ii) the advisory fees and other expenses paid by the Fund compared to those of similar funds managed by other investment advisers; (iii) the costs of the services provided to the Fund by AAI and the profits realized by AAI and its affiliates from its relationship to the Fund; (iv) the extent to which economies of scale have been or would be realized if and as the assets of the Fund grow and whether fees reflect the economies of scale for the benefit of shareholders; and (v) any additional benefits and other considerations.
With respect to the nature, extent and quality of the services provided by AAI under the Investment Advisory Agreement, the Independent Trustees considered and reviewed information concerning the services provided under the Investment Advisory Agreement, the investment parameters of the index of the Fund, financial information regarding AAI and its parent company, information describing AAI’s current organization and the background and experience of the persons responsible for the day-to-day management of the Fund.
The Independent Trustees reviewed information on the performance of the Fund and its benchmark. The Independent Trustees also evaluated the correlation and tracking error between the underlying index and the Fund’s performance. Based on their review, the Independent Trustees found that the nature and extent of services provided to the Fund under the Investment Advisory Agreements was appropriate and that the quality was satisfactory.
The Independent Trustees noted that the advisory fee for the Fund was a unitary fee pursuant to which AAI assumes all expenses of the Fund (including the cost of transfer agency, custody, fund administration, legal, audit and other services) other than the payments under the Investment Advisory Agreement, brokerage expenses, taxes, interest, litigation expenses and other extraordinary expenses.
With respect to the advisory fee rate, the Independent Trustees noted the following:
The net advisory fee rate for the Fund is higher than the median of its Broadridge expense group and the Fund’s expense ratio is higher than the median of its Broadridge expense group.
The Independent Trustees took into account, among other things, the uniqueness of EQLT’s underlying index (and the fees charged by the index provider for licensing its index) and AAI’s view that “socially responsible” funds (which the Broadridge peer group did not include) would be EQLT’s closest competitors in the marketplace.
Based on the foregoing, and the other information available to them, the Independent Trustees concluded that the advisory fee rate for the Fund was reasonable under the circumstances and in light of the quality of the services provided.
The Independent Trustees considered other benefits available to AAI because of its relationship with the Fund and concluded that the advisory fees were reasonable taking into account any such benefits.
The Independent Trustees also considered with respect to the Fund the information provided by AAI about the costs and profitability of AAI with respect to the Fund. The Independent Trustees reviewed and noted the relatively small size of the Fund and concluded that AAI was not realizing any economies of scale. The Independent Trustees determined that they would continue to evaluate whether further economies of scale have been achieved on an ongoing basis.
In voting to renew the Investment Advisory Agreement, the Independent Trustees concluded that the terms of the Investment Advisory Agreement are reasonable and fair in light of the services to be performed, the fees paid by certain other funds, expenses to be incurred and such other matters as the Independent Trustees considered relevant in the exercise of their reasonable business judgment. The Independent Trustees did not identify any single factor or group of factors as all important or controlling and considered all factors together.
| Workplace Equality Portfolio | |
| Trustees & Officers | November 30, 2017 (Unaudited) |
The general supervision of the duties performed by the Adviser for the Fund under the Investment Advisory Agreement is the responsibility of the Board of Trustees. The Trust currently has four Trustees. Three Trustees have no affiliation or business connection with the Adviser or any of its affiliated persons and do not own any stock or other securities issued by the Adviser. These are the “non-interested” or “independent” Trustees (“Independent Trustees”). The other Trustee (the “Interested Trustee”) is affiliated with the Adviser.
The Independent Trustees of the Trust, their term of office and length of time served, their principal business occupations during the past five years, the number of portfolios in the Fund Complex overseen by each Independent Trustee, and other directorships, if any, held by the Trustee are shown below.
INDEPENDENT TRUSTEES
| Name, Address & Year of Birth* | Position(s) Held with Trust | Term of Office and Length of Time Served** | Principal Occupation(s) During Past 5 Years | Number of Portfolios in Fund Complex Overseen by Trustees*** | Other Directorships Held by Trustees |
Mary K. Anstine, 1940 | Trustee | Since March 2008 | Ms. Anstine was President/Chief Executive Officer of HealthONE Alliance, Denver, Colorado, and former Executive Vice President of First Interstate Bank of Denver. Ms. Anstine is also Trustee/Director of AV Hunter Trust and Colorado Uplift Board. Ms. Anstine was formerly a Director of the Trust Bank of Colorado (later purchased and now known as Northern Trust Bank), HealthONE and Denver Area Council of the Boy Scouts of America and a member of the American Bankers Association Trust Executive Committee. | 42 | Ms. Anstine is a Trustee of ALPS Variable Investment Trust (10 funds); Financial Investors Trust (33 funds); Reaves Utility Income Fund (1 fund); and Westcore Trust (14 funds). |
| Jeremy W. Deems, 1976 | Trustee | Since March 2008 | Mr. Deems is the Co-Founder, Chief Compliance Officer and Chief Financial Officer of Green Alpha Advisors, LLC. Mr. Deems is Co-Portfolio Manager of the Shelton Green Alpha Fund. Prior to joining Green Alpha Advisors, Mr. Deems was CFO and Treasurer of Forward Management, LLC, ReFlow Management Co., LLC, ReFlow Fund, LLC, a private investment fund, and Sutton Place Management, LLC, an administrative services company. | 44 | Mr. Deems is a Trustee of ALPS Variable Investment Trust (10 funds); Financial Investors Trust (33 funds); and Reaves Utility Income Fund (1 fund); Clough Funds Trust (1 fund) and Elevation ETF Trust (1 fund). |
| Rick A. Pederson, 1952 | Trustee and Chairman | Has served as Trustee since March 2008. Has served as Chairman since July 2017. | Mr. Pederson is President, Foundation Properties, Inc. (a real estate investment management company), 1994 - present; Advisory Board Member, Bow River Capital Partners (private equity management), 2003 - present; Advisor, The Pauls Corporation (real estate investment management and development), 2008 - present; Chairman, Ross Consulting Group (real estate consulting services) 1983-2013; Advisory Board, Neenan Company (construction services) 2002-present; Board Member, Prosci Inc. (private business services) 2013-2016; Board Member, Citywide Banks (Colorado community bank) 2014-present; Board member, Professional Pediatric Health Care (a Denver-based home nursing firm) 2014 – present; Board Member, Strong-Bridge Consulting (management consulting) 2015-present; Director, National Western Stock Show (not-for-profit organization); Director, Biennial of the Americas (not-for-profit-organization), 2012- 2015; Board Member, History Colorado, 2015 - present. | 21 | Mr. Pederson is Trustee of Westcore Trust (14 funds) and Principal Real Estate Income Fund (1 fund). |
| * | The business address of the Trustee is c/o ALPS Advisors, Inc., 1290 Broadway, Suite 1100, Denver, Colorado 80203. |
| ** | This is the period for which the Trustee began serving the Trust. Each Trustee serves an indefinite term, until his successor is elected. |
| *** | The Fund Complex includes all series of the Trust and any other investment companies for which ALPS Advisors, Inc. provides investment advisory services. |
| Workplace Equality Portfolio | |
| Trustees & Officers | November 30, 2017 (Unaudited) |
The Trustee who is affiliated with the Adviser or affiliates of the Adviser and executive officers of the Trust, his term of office and length of time served, his principal business occupations during the past five years, the number of portfolios in the Fund Complex overseen by the Interested Trustee and the other directorships, if any, held by the Trustee, are shown below.
INTERESTED TRUSTEE
| Name, Address and Year of Birth of Interested Trustee* | Position(s) Held with Trust | Term of Office and Length of Time Served** | Principal Occupation(s) During Past 5 Years | Number of Portfolios in Fund Complex Overseen by Trustees*** | Other Directorships Held by Trustee |
Edmund J. Burke, 1961 | Trustee and President | Mr. Burke was elected as Trustee of the Trust and President of the Trust at the December 11, 2017 meeting of the Board of Trustees. | Mr. Burke is President and a Director of ALPS Holdings, Inc. (“AHI”) (since 2005) and Director of Boston Financial Data Services, Inc. (“BFDS”), ALPS Advisors, Inc. (“AAI”), ALPS Distributors, Inc. (“ADI”), ALPS Fund Services, Inc. (“AFS”) and ALPS Portfolio Solutions Distributor, Inc. (“APSD”) and from 2001-2008, was President of AAI, ADI, AFS and APSD. Because of his positions with AHI, BFDS, AAI, ADI, AFS and APSD, Mr. Burke is deemed an affiliate of the Trust as defined under the 1940 Act. Mr. Burke is Trustee and President of the Clough Global Allocation Fund (Trustee since 2006; President since 2004); Trustee and President of the Clough Global Equity Fund (Trustee since 2006; President since 2005); Trustee and President of the Clough Global Opportunities Fund (since 2006); Trustee of the Liberty All-Star Equity Fund; Director of the Liberty All-Star Growth Fund, Inc. and Trustee and President of Financial Investors Trust (Trustee since 2009; President since 2002). | 36 | Mr. Burke is a Trustee of Clough Global Dividend and Income Fund (1 fund); Clough Global Equity Fund (1 fund); Clough Global Opportunities Fund (1 fund); Clough Funds Trust (1 fund); Liberty All -Star Equity Fund (1 fund); Director of the Liberty All-Star Growth Fund, Inc. (1 fund) and Financial Investors Trust (33 funds). |
| * | The business address of the Trustee is c/o ALPS Advisors, Inc., 1290 Broadway, Suite 1100, Denver, Colorado 80203. |
| ** | This is the period for which the Trustee began serving the Trust. Each Trustee serves an indefinite term, until his successor is elected. |
| *** | The Fund Complex includes all series of the Trust and any other investment companies for which ALPS Advisors, Inc. provides investment advisory services. |
| Workplace Equality Portfolio | |
| Trustees & Officers | November 30, 2017 (Unaudited) |
OFFICERS
| Name, Address and Year of Birth of Officer | Position(s) Held with Trust | Length of Time Served* | Principal Occupation(s) During Past 5 Years |
| Erin D. Nelson, 1977 | Chief Compliance Officer (“CCO”) | Since December 2015 | Erin Nelson became Senior Vice-President and Chief Compliance Officer of ALPS Advisors, Inc. (“AAI”) on July 1, 2015 and prior to that served as Vice President and Deputy Chief Compliance Officer of AAI since January 1, 2015. Prior to January 1, 2015, Ms. Nelson was Vice-President and Assistant General Counsel of ALPS Fund Services, Inc. Because of her position with AAI, Ms. Nelson is deemed an affiliate of the Trust as defined under the 1940 Act. Ms. Nelson is also the CCO of ALPS Variable Investment Trust, Liberty All-Star Growth Fund, Inc., Liberty All-Star Equity Fund, Principal Real Estate Income Fund, RiverNorth Opportunities Fund, Inc. and Red Rocks Capital, LLC. |
Patrick D. Buchanan, 1972 | Treasurer | Since June 2012 | Mr. Buchanan is Vice President of AAI. Mr. Buchanan joined ALPS in 2007 and because of his position with AAI, he is deemed an affiliate of the Trust as defined under the 1940 Act. Mr. Buchanan is also Treasurer of the ALPS Variable Insurance Trust, Principal Real Estate Income Fund, Clough Funds Trust and RiverNorth Opportunities Fund, Inc. |
| Andrea E. Kuchli, 1985 | Secretary | Since December 2017 | Ms. Kuchli joined ALPS in 2015 and is currently Vice President and Senior Counsel of ALPS. Prior to joining ALPS, Ms. Kuchli was an Associate with Davis Graham & Stubbs LLP from April 2014 to February 2015, and an Associate with Dechert LLP from 2011 to April 2014. Because of her position with ALPS, Ms. Kuchli is deemed an affiliate of the Trust as defined under the 1940 Act. Ms. Kuchli is also Secretary of ALPS Variable Investment Trust, Elevation ETF Trust and Principal Real Estate Income Fund as well as Assistant Secretary of the James Advantage Funds. |
| Sharon Akselrod, 1974 | Assistant Secretary | Since December 2016 | Ms. Akselrod joined ALPS in August 2014 and is currently Senior Investment Company Act Paralegal of ALPS Fund Services, Inc. Prior to joining ALPS, Ms. Akselrod served as Corporate Governance and Regulatory Associate for Nordstrom fsb (2013-2014) and Senior Legal Assistant – Legal Manager for AXA Equitable Life Insurance Company (2008-2013). Because of her position with ALPS, Ms. Akselrod is deemed an affiliate of the Trust as defined under the 1940 Act. Ms. Akselrod is also Assistant Secretary of Financial Investors Trust and Principal Real Estate Income Fund. |
Stephanie G. Danner, 1992 | Assistant Secretary | Since December 2017 | Ms. Danner joined ALPS in September of 2017 and is currently Vice President and Associate Senior Counsel of ALPS. Because of her position with ALPS, Ms. Danner is deemed an affiliate of the Trust as defined under the 1940 Act. |
| * | The business address of each Officer is c/o ALPS Advisors, Inc., 1290 Broadway, Suite 1100, Denver, Colorado 80203. |
| ** | This is the period for which the Officer began serving the Trust. Each Officer serves an indefinite term, until his/her successor is elected. |
The Statement of Additional Information includes additional information about the Fund's Trustees and is available, without charge, upon request by calling (toll-free) 1-866-375-8383.
Item 2. Code of Ethics.
| (a) | The Registrant, as of the end of the period covered by this report, has adopted a code of ethics that applies to the Registrant's principal executive officer, principal financial officer, principal accounting officer or controller or any persons performing similar functions on behalf of the Registrant. |
| (c) | During the period covered by this report, no amendments to the provisions of the code of ethics adopted in 2(a) above were made. |
| (d) | During the period covered by this report, no implicit or explicit waivers to the provisions of the code of ethics adopted in 2(a) above were granted. |
| (f) | The Registrant's Code of Ethics is attached as an Exhibit hereto. |
Item 3. Audit Committee Financial Expert.
The Board of Trustees of the Registrant has determined that the Registrant has at least one Audit Committee Financial Expert serving on its audit committee. The Board of Trustees of the Registrant has designated Jeremy W. Deems as the Registrant’s “Audit Committee Financial Expert”. Mr. Deems is “independent” as defined in paragraph (a)(2) of Item 3 to Form N-CSR.
Item 4. Principal Accountant Fees and Services.
| (a) | Audit Fees: For the Registrant’s fiscal year ended November 30, 2017 and November 30, 2016, the aggregate fees billed for professional services rendered by the principal accountant for the audit of the Registrant’s annual financial statements were $342,670 and $318,575, respectively. |
| (b) | Audit-Related Fees: For the Registrant’s fiscal year ended November 30, 2017 and November 30, 2016, the aggregate fees billed for professional services rendered by the principal accountant for the verification of the Registrant’s securities and similar investments in accordance with Rule 17f-2 under the Investment Company Act of 1940 were $0 and $0, respectively. |
| (c) | Tax Fees: For the Registrant’s fiscal year ended November 30, 2017 and November 30, 2016, the aggregate fees billed for professional services rendered by the principal accountant for tax compliance, tax advice and tax planning were $110,455 and $192,650, respectively. The fiscal year 2017 and 2016 tax fees were for services pertaining to federal and state income tax return review, review of year end dividend distributions and excise tax preparation. |
| (d) | All Other Fees: For the Registrant’s fiscal year ended November 30, 2017 and November 30, 2016, aggregate fees billed to the Registrant by the principal accountant for services provided by the principal accountant other than the services reported in paragraphs (a) through (c) of this Item 4 were $0 and $0, respectively. |
| (e)(1) | Audit Committee Pre-Approval Policies and Procedures: All services to be performed by the Registrant's principal accountant must be pre-approved by the Registrant's audit committee. |
| (e)(2) | No services described in paragraphs (b) through (d) of this Item were approved by the Registrant’s audit committee pursuant to paragraph (c)(7)(i)(C) of Rule 2-01 of Regulation S-X. |
| (g) | The aggregate non-audit fees billed by the Registrant’s accountant for the fiscal year ended November 30, 2017 and November 30, 2016 of the Registrant were $415,355 and $520,050, respectively. These fees consisted of non-audit fees billed to (i) the Registrant of $110,455 and $192,650 as described in response to paragraph (c) above and (ii) to ALPS Fund Services, Inc. (“AFS”), an entity under common control with ALPS Advisors, Inc., the Registrant’s investment adviser, of $304,900 and $327,400, respectively. The non-audit fees billed to AFS related to SSAE 18 services and other compliance-related matters. |
| (h) | The Registrant’s audit committee has considered whether the provision of non-audit services that were rendered to the Registrant’s investment adviser (not including any sub-adviser whose role is primarily portfolio management and is subcontracted with or overseen by another investment adviser), and any entity controlling, controlled by, or under common control with the investment adviser that provides ongoing services to the Registrant that were not pre-approved pursuant to paragraph (c)(7)(ii) of Rule 2-01 of Regulation S-X, is compatible with maintaining the principal accountant’s independence. The Registrant’s audit committee determined that the provision of such non-audit services is compatible with maintaining the principal accountant’s independence. |
Item 5. Audit Committee of Listed Registrants.
Not applicable.
Item 6. Investments.
| (a) | Schedule of Investments is included as part of the Report to Stockholders filed under Item 1 of this Form N-CSR. |
Item 7. Disclosure of Proxy Voting Policies and Procedures for Closed-End Management Investment Companies.
Not applicable.
Item 8. Portfolio Managers of Closed-End Management Investment Companies.
Not applicable.
Item 9. Purchases of Equity Securities by Closed-End Management Investment Company and Affiliated Purchasers.
Not applicable.
Item 10. Submission of Matters to Vote of Security Holders.
There have been no material changes to the procedures by which shareholders may recommend nominees to the Registrant’s Board of Trustees, where those changes were implemented after the Registrant last provided disclosure in response to the requirements of Item 407(c)(2) of Regulation S-K, or this Item.
Item 11. Controls and Procedures.
| (a) | The Registrant’s principal executive officer and principal financial officer have concluded that the Registrant’s disclosure controls and procedures (as defined in Rule 30a-3(c) under the Investment Company Act of 1940, as amended) are effective based on their evaluation of these controls and procedures as of a date within 90 days of the filing date of this report. |
| (b) | There was no change in the Registrant's internal control over financial reporting (as defined in Rule 30a-3(d) under the Investment Company Act of 1940, as amended) during the last fiscal quarter of the period covered by this report that has materially affected, or is reasonably likely to materially affect, the Registrant's internal control over financial reporting. |
Item 12. Disclosure of Securities Lending Activities for Closed-End Management Investment Companies.
Not applicable.
Item 13. Exhibits.
| (a)(1) | Registrant’s Code of Ethics for Senior Financial Officers, which is the subject of the disclosure required by Item 2 of Form N-CSR, was filed as Exhibit 12(a)(1) to the Registrant’s Certified Shareholder Report on Form N-CSR, File No. 811-22175, on February 6, 2015. |
| (a)(2) | The certifications required by Rule 30a-2(a) of the Investment Company Act of 1940, as amended, and Section 302 of the Sarbanes-Oxley Act of 2002 are attached hereto as Exhibit 99.Cert. |
| (b) | The certifications by the Registrant’s principal executive officer and principal financial officer, as required by Rule 30a-2(b) of the Investment Company Act of 1940, as amended, and Section 906 of the Sarbanes-Oxley Act of 2002 are attached hereto as Exhibit 99.906Cert. |
SIGNATURES
Pursuant to the requirements of the Securities Exchange Act of 1934 and the Investment Company Act of 1940, the registrant has duly caused this report to be signed on its behalf by the undersigned, thereunto duly authorized.
| | ALPS ETF TRUST |
| | | | |
| | By: | /s/ Edmund J. Burke | |
| | | Edmund J. Burke | |
| | | President (Principal Executive Officer) | |
| | | | |
| | Date: | February 5, 2018 | |
Pursuant to the requirements of the Securities Exchange Act of 1934 and the Investment Company Act of 1940, this report has been signed below by the following persons on behalf of the registrant and in the capacities and on the dates indicated.
| | By: | /s/ Edmund J. Burke | |
| | | Edmund J. Burke | |
| | | President (Principal Executive Officer) | |
| | | | |
| | Date: | February 5, 2018 | |
| | | | |
| | By: | /s/ Jeremy O. May | |
| | | Jeremy O. May | |
| | | Treasurer (Principal Financial Officer) | |
| | | | |
| | Date: | February 5, 2018 | |