UNITED STATES
SECURITIES AND EXCHANGE COMMISSION
Washington, D.C. 20549
FORM N-CSR
CERTIFIED SHAREHOLDER REPORT OF REGISTERED
MANAGEMENT INVESTMENT COMPANIES
Investment Company Act file number:
811-22175
ALPS ETF TRUST
(Exact name of registrant as specified in charter)
1290 Broadway, Suite 1000, Denver, Colorado 80203
(Address of principal executive offices) (Zip code)
Cara Owen, Esq., Secretary
ALPS ETF Trust
1290 Broadway, Suite 1000
Denver, Colorado 80203
(Name and address of agent for service)
Registrant’s Telephone Number, including Area Code: 877-398-8461
Date of fiscal year end: November 30
Date of reporting period: December 1, 2019 – November 30, 2020
Item 1. Report to Stockholders.

Table of Contents
| Performance Overview | |
| Alerian MLP ETF | 1 |
| Alerian Energy Infrastructure ETF | 4 |
| Disclosure of Fund Expenses | 7 |
| Report of Independent Registered Public Accounting Firm | 8 |
| Financial Statements | |
| Alerian MLP ETF | |
| Schedule of Investments | 9 |
| Statement of Assets and Liabilities | 10 |
| Statement of Operations | 11 |
| Statements of Changes in Net Assets | 12 |
| Financial Highlights | 13 |
| Alerian Energy Infrastructure ETF | |
| Schedule of Investments | 14 |
| Statement of Assets and Liabilities | 16 |
| Statement of Operations | 17 |
| Statements of Changes in Net Assets | 18 |
| Financial Highlights | 19 |
| Notes to Financial Statements | 20 |
| Additional Information | 32 |
| Board Considerations Regarding Approval of Investment Advisory Agreements | 34 |
| Trustees & Officers | 36 |
Beginning on January 1, 2021, as permitted by regulations adopted by the U.S. Securities and Exchange Commission, paper copies of the Funds’ annual and semi-annual shareholder reports will no longer be sent by mail, unless you specifically request paper copies of the reports from your financial intermediary (such as a broker-dealer or bank). Instead, the reports will be made available on the Funds’ website (www.alpsfunds.com), and you will be notified by mail each time a report is posted and provided with a website link to access the report.
If you already elected to receive shareholder reports electronically, you will not be affected by this change and you need not take any action. You may elect to receive shareholder reports and other communications from a Fund electronically anytime by contacting your financial intermediary.
You may elect to receive all future reports in paper free of charge. You can contact your financial intermediary to request that you continue to receive paper copies of your shareholder reports. Your election to receive reports in paper will apply to all funds held in your account with your financial intermediary.
alpsfunds.com
Alerian MLP ETF
| Performance Overview | November 30, 2020 (Unaudited) |
INVESTMENT OBJECTIVE
The Alerian MLP ETF (the “Fund” or “AMLP”) seeks investment results that correspond (before fees and expenses) generally to the price and yield performance of its underlying index, the Alerian MLP Infrastructure Total Return Index (the “Underlying Index” or “AMZI”). The shares of the Fund are listed and trade on the NYSE Arca, Inc. (“NYSE”) under the ticker symbol AMLP. The Fund will normally invest at least 90% of its total assets in securities that comprise the Underlying Index.
The Underlying Index is a rules based, modified capitalization weighted, float-adjusted index intended to give investors a means of tracking the overall performance of the United States energy infrastructure Master Limited Partnership (“MLP”) asset class. The Underlying Index is comprised of energy infrastructure MLPs that earn a majority of their cash flow from the transportation, storage, and processing of energy commodities.
PERFORMANCE OVERVIEW
During the twelve-month period from December 1, 2019, to November 30, 2020, the Fund delivered a total return of -28.51% (-28.36% NAV). This compares to the Fund’s Underlying Index, which decreased 35.08% on a price-return basis and 27.19% on a total-return basis. The difference in performance between the AMZI and AMLP is primarily attributable to the Fund’s operating expenses and the tax impact of the Fund’s C-Corporation structure.
During the period, the Fund paid four distributions:
| · | $0.9500 per share on February 20, 2020 |
| · | $0.7500 per share on May 14, 2020 |
| · | $0.7500 per share on August 20, 2020 |
| · | $0.7100 per share on November 19, 2020 |
In conjunction with macro headwinds in March and April stemming from the novel coronavirus ("COVID-19") pandemic, twelve AMZI constituents cut their distributions for 1Q20 (paid in 2Q20), representing approximately a third of the index by weighting. This drove the 21.1% decrease in the May distribution for the Fund. Distribution cuts were mostly confined to smaller, gathering and processing names. After a quarter of steady payouts for 2Q20, two constituents announced distribution cuts for 3Q20 headlined by a 50% reduction from Energy Transfer (ET). The result was a 5.33% reduction in the November distribution.
In a bid to reduce trading costs for investors, the Fund underwent a 1-for-5 reverse split of the Fund shares. The reverse split occurred on May 18, 2020.
During the fund year, CNX Midstream (CNXM) and Holly Energy Partners (HEP) were added to AMZI during quarterly rebalancings, while Tallgrass Energy (TGE) and EQM Midstream Partners (EQM) were removed in relation to their acquisition by another entity. CNXM was subsequently removed in September following the completion of its merger with CNX Resources (CNX). The methodology for AMZI was updated in May with no material changes. Additional methodology updates were made in July and November related to corporate actions and constituent criteria, respectively.
In 2020, energy infrastructure MLPs faced headwinds from a dramatic oil price decline, production cuts and the economic impacts of COVID-19. The sell-off in midstream accelerated into March as global equity markets cratered. Significant deleveraging in MLP closed-end funds resulted in forced liquidations that exacerbated selling pressure. Since March, energy equities have rallied considerably, and MLPs have provided strong performance off the March lows. From the bottom in mid-March to the end of November, the AMZI has rallied 100.22% on a total-return basis, with a very strong start to the fourth quarter. In November alone, the AMZI jumped 23.86% due to higher oil prices and improving energy sentiment on positive vaccine developments. Year-to-date through November 30, the AMZI has outperformed broader energy, represented by the Energy Select Sector Index (IXE), by over 250 basis points on a total-return basis.
Despite a challenging year, energy infrastructure MLPs weathered the storm due to the fee-based nature of these businesses. MLPs took additional steps in 2020 to improve financial flexibility, including cutting costs, reducing capital budgets, and in some cases, lowering distributions. The combination of these proactive steps and resilient, fee-based cash flows have strengthened the position of companies heading into 2021. Many AMZI constituents are anticipating meaningful free cash flow generation in 2021 with some targeting excess cash flow after distributions. As of November 30, eight AMZI constituents have buyback authorizations in place, representing approximately 60% of the index by weighting. Free cash flow generation and buybacks could be added tailwinds for midstream MLPs, which also stand to benefit from a potential recovery in energy markets and an improved outlook for the global economy.
Alerian MLP ETF
| Performance Overview | November 30, 2020 (Unaudited) |
Performance (as of November 30, 2020)
| | 1 Year | 5 Year | 10 Year | Since Inception^ |
| Alerian MLP ETF – NAV | -28.36% | -8.74% | -3.84% | -3.08% |
| Alerian MLP ETF – Market Price* | -28.51% | -8.78% | -3.85% | -3.08% |
| Alerian MLP Infrastructure Total Return Index | -27.19% | -7.83% | -2.16% | -1.02% |
| Alerian MLP Total Return Index | -24.50% | -7.09% | -2.38% | -1.14% |
Total Expense Ratio (per the current prospectus) is 0.87%.
Performance data quoted represents past performance. Past performance does not guarantee future results. Total return figures assume reinvestment of dividends, if any. The table does not reflect the deduction of taxes that a shareholder would pay on Fund distributions or the redemption of Fund shares. Investment return and principal value of an investment will fluctuate so that an investor’s shares, when sold or redeemed, may be worth more or less than the original cost. Current performance data may be higher or lower than actual data quoted. For the most current month-end performance data please visit www.alpsfunds.com or call 1.877.398.8461. The Fund accrues deferred income taxes for future tax liabilities associated with the portion of MLP distributions considered to be a tax-deferred return of capital and for any net operating gains as well as capital appreciation of its investment. This deferred tax liability is reflected in the daily NAV and as a result the fund's after-tax performance could differ significantly from the underlying assets even if the pre-tax performance is closely tracked.
NAV is an exchange-traded fund’s per-share value. The per-share dollar amount of the Fund is derived by dividing the total value of all the securities in its portfolio, less any liabilities, by the number of Fund shares outstanding. Market Price is the price at which a share can currently be traded in the market. Information detailing the number of days the Market Price of the Fund was greater than the Fund’s NAV and the number of days it was less than the Fund’s NAV can be obtained at www.alpsfunds.com.
| ^ | The Fund commenced Investment Operations on August 24, 2010 with an Inception Date, the first day of trading on the NYSE ARCA, of August 25, 2010. |
| * | Market Price means the official closing price of a share or, if it more accurately reflects the market value of a share at the time as of which the Fund calculates current net asset value per share, the price that is the midpoint of the bid-ask spread as of that time. It does not represent the returns an investor would receive if shares were traded at other times. |
The Alerian MLP Infrastructure Total Return Index is comprised of 21 midstream energy Master Limited Partnerships and provides investors with an unbiased benchmark for the infrastructure component of this emerging asset class. Total return assumes reinvestment of any dividends and distributions realized during a given time period.
The Alerian MLP Total Return Index is recognized as a leading gauge of energy infrastructure Master Limited Partnerships (MLPs). The capped, float-adjusted, capitalization-weighted index, whose constituents earn the majority of their cash flow from midstream activities involving energy commodities, is reported on a total-return basis (AMZX), which assumes reinvestment of any dividends and distributions realized during a given period.
The index is not actively managed and does not reflect any deductions for fees, expenses or taxes. One cannot invest directly in an index. Index performance does not reflect fund performance.
The Fund’s shares are not individually redeemable. Investors buy and sell shares of the Fund on a secondary market. Only market makers or “authorized participants” may trade directly with the Fund, typically in blocks of 25,000 shares.
The Alerian MLP ETF is not suitable for all investors. Investments in the Fund are subject to investment risks, including possible loss of the principal amount invested.
ALPS Portfolio Solutions Distributor, Inc., a FINRA member, is the distributor for the Fund.
Alerian MLP ETF
| Performance Overview | November 30, 2020 (Unaudited) |
Top 10 Holdings* (as of November 30, 2020)
| MPLX LP | 10.51% |
| Plains All American Pipeline LP | 10.31% |
| Enterprise Products Partners LP | 9.83% |
| Magellan Midstream Partners LP | 9.67% |
| Energy Transfer LP | 8.99% |
| Western Midstream Partners LP | 8.24% |
| Phillips 66 Partners LP | 6.15% |
| TC PipeLines LP | 5.31% |
| Cheniere Energy Partners LP | 4.93% |
| DCP Midstream LP | 4.64% |
| Total % of Top 10 Holdings | 78.58% |
Future holdings are subject to change.
Growth of $10,000 (as of November 30, 2020)
Comparison of change in value of a $10,000 investment in the Fund and the Indexes
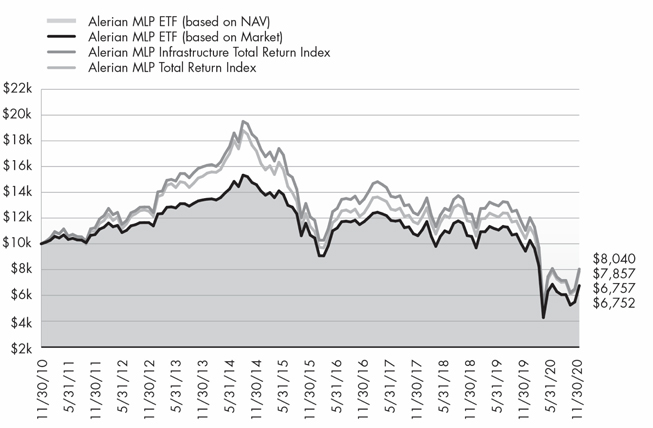
The chart above compares historical performance of a hypothetical investment of $10,000 in the Fund over the past ten years with the performance of the Fund’s benchmark index. Past performance does not guarantee future results. The chart does not reflect the deduction of taxes that a shareholder would pay on Fund distributions or the redemption of Fund shares.
Alerian Energy Infrastructure ETF
| Performance Overview | November 30, 2020 (Unaudited) |
INVESTMENT OBJECTIVE
The Alerian Energy Infrastructure ETF (the “Fund” or “ENFR”) seeks investment results that correspond (before fees and expenses) generally to the price and yield performance of its underlying index, the Alerian Midstream Energy Select Total Return Index (the “Underlying Index” or “AMEI”). As a secondary objective, the Fund seeks to provide total return through income and capital appreciation. The Shares of the Fund are listed and trade on the NYSE Arca, Inc. (“NYSE”) under the ticker symbol ENFR. The Fund will normally invest at least 90% of its total assets in securities that comprise the Underlying Index.
The Underlying Index is a composite of North American energy infrastructure companies engaged in midstream activities involving energy commodities, including gathering and processing, liquefaction, pipeline transportation, rail terminaling, and storage (also known as “midstream energy businesses”). Midstream energy companies include midstream MLPs and midstream corporations, either based in the United States or Canada. The Underlying Index has a 25% limit for companies taxed as pass-through entities.
PERFORMANCE OVERVIEW
During the twelve-month period from December 1, 2019, to November 30, 2020, ENFR delivered a total return of -18.89% (-18.82% NAV). This compares to the Fund’s Underlying Index, which decreased 24.32% on a price-return basis and 17.86% on a total-return basis.
During the period, the Fund paid four distributions:
| · | $0.287590 per share on February 20, 2020 |
| · | $0.284230 per share on May 14, 2020 |
| · | $0.262490 per share on August 20, 2020 |
| · | $0.243550 per share on November 19, 2020 |
The quarterly distribution for ENFR paid in May decreased 1.4% from the prior quarter. The payout was relatively resilient considering approximately 20% of ENFR’s portfolio by weight cut their dividends on a quarter-over-quarter basis. As a few more cuts were announced, ENFR’s dividend fell by another 7.6% in August to $0.262 and finally to $0.244 in November. Many of the companies that cut their payouts shared similar characteristics, including greater exposure to the wellhead given gathering and processing activities, higher leverage, and lower distribution coverage.
During the fund year, Rattler Midstream (RTLR), Hess Midstream (HESM), PBF Logistics (PBFX), and Delek Logistics Partners (DKL) were added to AMEI, while Summit Midstream Partners (SMLP) was removed. SemGroup (SEMG), Tallgrass Energy (TGE), and CNX Midstream (CNXM) were removed in special rebalancings in relation to their acquisition by another entity. The methodology for AMEI was updated in May and November with no material changes. An additional methodology update was made in July related to corporate actions.
In 2020, midstream energy infrastructure companies faced headwinds from a dramatic oil price decline, production cuts and the economic impacts of the novel coronavirus ("COVID-19"). The worst came in the spring as midstream firms experienced sharp declines in March, hitting record lows. Energy equities have rallied considerably since capitulating in the spring, including midstream. In November alone, the AMEI gained 19.51% on a total return basis due to WTI oil prices rising above $45 a barrel for the first time since March and improving energy sentiment on positive vaccine news. Overall, midstream performed defensively amid the challenges of 2020, with the AMEI having fallen 24.35% on a total-return basis year-to-date through November 30 compared to a 35.72% loss for the broad Energy Select Sector Index (IXE). Canadian corporations were particularly resilient as demonstrated by the two largest Canadian constituents. Enbridge (ENB) and TC Energy (TRP) have only fallen 15.52% and 13.87%, respectively, for the same year-to-date period.
Fundamental improvements made by midstream firms have softened the impact of the macroeconomic headwinds. Companies have taken additional steps to enhance financial flexibility by cutting costs, reducing capital spending budgets, and cutting dividends in some cases. The combination of these proactive steps and resilient, fee-based cash flows has strengthened the position of companies heading into 2021. Many AMEI constituents are anticipating meaningful free cash flow generation in 2021 with some targeting excess cash flow after dividends. As of November 30, fourteen AMEI constituents have buyback authorizations in place, representing approximately 45% of the index by weighting. Free cash flow generation and buybacks could be added tailwinds for midstream energy infrastructure companies, which also stand to benefit from a potential recovery in energy markets and an improved outlook for the global economy.
Alerian Energy Infrastructure ETF
| Performance Overview | November 30, 2020 (Unaudited) |
Performance (as of November 30, 2020)
| | 1 Year | 5 Year | Since Inception^ |
| Alerian Energy Infrastructure ETF - NAV | -18.82% | -0.64% | -3.64% |
| Alerian Energy Infrastructure ETF - Market Price* | -18.89% | -0.64% | -3.63% |
| Alerian Midstream Energy Select Total Return Index | -17.86% | 0.27% | -2.79% |
| Alerian MLP Total Return Index | -24.50% | -7.09% | -8.82% |
Total Expense Ratio (per the current prospectus) is 0.65%.
Performance data quoted represents past performance. Past performance does not guarantee future results. Total return figures assume reinvestment of dividends and capital gains distributions, if any. The table does not reflect the deduction of taxes that a shareholder would pay on Fund distributions or the redemption of Fund shares. Investment return and principal value of an investment will fluctuate so that an investor’s shares, when sold or redeemed, may be worth more or less than the original cost. Current performance data may be higher or lower than actual data quoted. For most current month-end performance data please visit www.alpsfunds.com or call 1.866.675.2639.
NAV is an exchange-traded fund’s per-share value. The per-share dollar amount of the Fund is derived by dividing the total value of all the securities in its portfolio, less any liabilities, by the number of Fund shares outstanding. Market Price is the price at which a share can currently be traded in the market. Information detailing the number of days the Market Price of the Fund was greater than the Fund’s NAV and the number of days it was less than the Fund’s NAV can be obtained at www.alpsfunds.com.
| ^ | The Fund commenced Investment Operations on November 1, 2013. |
| * | Market Price is based on the midpoint of the bid-ask spread at 4 p.m. ET and does not represent the returns an investor would receive if shares were traded at other times. |
The Alerian Midstream Energy Select Total Return Index is comprised of 35 equity securities of issuers headquartered or incorporated in the United States and Canada that engage in the transportation, storage, and processing of energy commodities. Total return assumes reinvestment of any dividends and distributions realized during a given time period.
The Alerian MLP Total Return Index is recognized as a leading gauge of energy infrastructure Master Limited Partnerships (MLPs). The capped, float-adjusted, capitalization-weighted index, whose constituents earn the majority of their cash flow from midstream activities involving energy commodities, is reported on a total-return basis (AMZX), which assumes reinvestment of any dividends and distributions realized during a given period.
The index is not actively managed and does not reflect any deductions for fees, expenses or taxes. One cannot invest directly in an index. Index performance does not reflect fund performance.
The Fund’s shares are not individually redeemable. Investors buy and sell shares of the Fund on a secondary market. Only market makers or “authorized participants” may trade directly with the Fund, typically in blocks of 50,000 shares.
The Alerian Energy Infrastructure ETF is not suitable for all investors. Investments in the Fund are subject to investment risks, including possible loss of the principal amount invested.
ALPS Portfolio Solutions Distributor, Inc., a FINRA member, is the distributor for the Fund.
Alerian Energy Infrastructure ETF
| Performance Overview | November 30, 2020 (Unaudited) |
Top 10 Holdings* (as of November 30, 2020)
| Enbridge, Inc. | 9.27% |
| Enterprise Products Partners LP | 9.18% |
| TC Energy Corp. | 8.91% |
| Kinder Morgan, Inc. | 8.43% |
| The Williams Cos., Inc. | 7.68% |
| ONEOK, Inc. | 6.35% |
| Pembina Pipeline Corp. | 4.95% |
| Cheniere Energy, Inc. | 4.86% |
| Energy Transfer LP | 4.78% |
| Targa Resources Corp. | 4.31% |
| Total % of Top 10 Holdings | 68.72% |
| * | % of Total Investments (excluding investments purchased with collateral from securities loaned) |
Future holdings are subject to change.
Growth of $10,000 (as of November 30, 2020)
Comparison of change in value of a $10,000 investment in the Fund and the Indexes
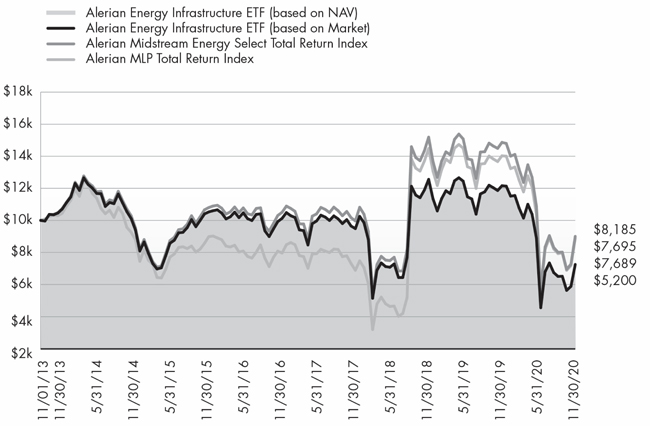
The chart above compares historical performance of a hypothetical investment of $10,000 in the Fund since inception with the performance of the Fund’s benchmark index. Past performance does not guarantee future results. The chart does not reflect the deduction of taxes that a shareholder would pay on Fund distributions or the redemption of Fund shares.
Alerian Exchange Traded Funds
| Disclosure of Fund Expenses | November 30, 2020 (Unaudited) |
Shareholder Expense Example: As a shareholder of a Fund, you incur certain ongoing costs, including management fees and other Fund expenses. These examples are intended to help you understand your ongoing costs (in dollars) of investing in the Fund and to compare these costs with the ongoing costs of investing in other funds. It is based on an investment of $1,000 invested at the beginning of the (six month) period and held through November 30, 2020.
Actual Return: The first line of the table provides information about actual account values and actual expenses. You may use the information in this line, together with the amount you invested, to estimate the expenses that you incurred over the period. Simply divide your account value by $1,000 (for example, an $8,600 account value divided by $1,000 = 8.6), then multiply the result by the number in the first line under the heading entitled “Expenses Paid During Period” to estimate the expenses attributable to your investment during this period.
Hypothetical 5% Return: The second line of the table provides information about hypothetical account values and hypothetical expenses based on the Fund’s actual expense ratio and an assumed rate of return of 5% per year before expenses, which is not the Fund’s actual return. The hypothetical account values and expenses may not be used to estimate the actual ending account balance or expenses you paid for the period. You may use this information to compare ongoing costs of investing in the Fund and other funds. To do so, compare this 5% hypothetical example with the 5% hypothetical examples that appear in the shareholder reports of other funds.
The expenses shown in the table are meant to highlight ongoing Fund costs only and do not reflect any transaction costs, such as brokerage commissions and other fees to financial intermediaries. Therefore, the second line is useful in comparing ongoing costs only, and will not help you determine the relative total costs of owning different funds. In addition, if these costs were included, your costs would have been higher.
| | Beginning Account Value 6/1/20 | Ending Account Value 11/30/20 | Expense Ratio(a) | Expenses Paid During Period 6/1/20 - 11/30/20(b) |
| Alerian MLP ETF | | | | |
| Actual | $1,000.00 | $985.70 | 0.98% | $4.86 |
| Hypothetical (5% return before expenses) | $1,000.00 | $1,020.10 | 0.98% | $4.95 |
| | | | | |
| Alerian Energy Infrastructure ETF | | | | |
| Actual | $1,000.00 | $1,046.50 | 0.65% | $3.33 |
| Hypothetical (5% return before expenses) | $1,000.00 | $1,021.75 | 0.65% | $3.29 |
| (a) | Annualized, based on the Fund's most recent fiscal half-year expenses. |
| (b) | Expenses are equal to the Fund's annualized expense ratio multiplied by the average account value over the period, multiplied by the number of days in the most recent fiscal half year (183), divided by 366. |
Alerian Exchange Traded Funds
Report of Independent Registered Public Accounting Firm
To the shareholders and the Board of Trustees of ALPS ETF Trust:
Opinion on the Financial Statements and Financial Highlights
We have audited the accompanying statements of assets and liabilities, including the statements of investments, of Alerian MLP ETF and Alerian Energy Infrastructure ETF (the “Funds”), two of the funds constituting the ALPS ETF Trust, as of November 30, 2020, the related statements of operations for the year then ended, the statements of changes in net assets for each of the two years in the period then ended, and the financial highlights for each of the five years in the period then ended for the Funds, and the related notes.
In our opinion, the financial statements and financial highlights present fairly, in all material respects, the financial position of the Funds as of November 30, 2020, and the results of their operations for the year then ended, the changes in their net assets for each of the two years in the period then ended, and the financial highlights for each of the five years in the period then ended in conformity with accounting principles generally accepted in the United States of America.
Basis for Opinion
These financial statements and financial highlights are the responsibility of the Funds’ management. Our responsibility is to express an opinion on the Funds’ financial statements and financial highlights based on our audits. We are a public accounting firm registered with the Public Company Accounting Oversight Board (United States) (PCAOB) and are required to be independent with respect to the Funds in accordance with the U.S. federal securities laws and the applicable rules and regulations of the Securities and Exchange Commission and the PCAOB.
We conducted our audits in accordance with the standards of the PCAOB. Those standards require that we plan and perform the audit to obtain reasonable assurance about whether the financial statements and financial highlights are free of material misstatement, whether due to error or fraud. The Funds are not required to have, nor were we engaged to perform, an audit of their internal control over financial reporting. As part of our audits, we are required to obtain an understanding of internal control over financial reporting but not for the purpose of expressing an opinion on the effectiveness of the Funds’ internal control over financial reporting. Accordingly, we express no such opinion.
Our audits included performing procedures to assess the risks of material misstatement of the financial statements and financial highlights, whether due to error or fraud, and performing procedures that respond to those risks. Such procedures included examining, on a test basis, evidence regarding the amounts and disclosures in the financial statements and financial highlights. Our audits also included evaluating the accounting principles used and significant estimates made by management, as well as evaluating the overall presentation of the financial statements and financial highlights. Our procedures included confirmation of securities owned as of November 30, 2020, by correspondence with the custodian and brokers; when replies were not received from brokers, we performed other auditing procedures. We believe that our audits provide a reasonable basis for our opinion.
DELOITTE & TOUCHE LLP
Denver, Colorado
January 25, 2021
We have served as the auditor of one or more investment companies advised by ALPS Advisors, Inc. since 2007.
Alerian MLP ETF
| Schedule of Investments | November 30, 2020 |
| Security Description | | Shares | | | Value | |
| MASTER LIMITED PARTNERSHIPS (99.95%) | | | | | | | | |
| Gathering + Processing (21.03%) | | | | | | | | |
| Crestwood Equity Partners LP(a) | | | 6,225,119 | | | $ | 101,531,691 | |
| DCP Midstream LP(a) | | | 11,142,291 | | | | 179,947,999 | |
| Enable Midstream Partners LP | | | 11,007,897 | | | | 56,030,196 | |
| EnLink Midstream LLC(a) | | | 32,176,270 | | | | 119,052,199 | |
| Noble Midstream Partners LP | | | 4,166,781 | | | | 39,709,423 | |
| Western Midstream Partners LP(a) | | | 24,796,503 | | | | 319,874,889 | |
| Total Gathering + Processing | | | | | | | 816,146,397 | |
| | | | | | | | | |
| Liquefaction (4.93%) | | | | | | | | |
| Cheniere Energy Partners LP | | | 5,017,545 | | | | 191,168,464 | |
| | | | | | | | | |
| Pipeline Transportation | Natural Gas (24.14%) | | | | | | | | |
| Energy Transfer LP | | | 56,478,653 | | | | 349,038,076 | |
| Enterprise Products Partners LP | | | 19,661,511 | | | | 381,433,313 | |
| TC PipeLines LP(a) | | | 6,669,203 | | | | 206,078,373 | |
| Total Pipeline Transportation | Natural Gas | | | | | | | 936,549,762 | |
| | | | | | | | | |
| Pipeline Transportation | Petroleum (49.85%) | | | | | | | | |
| Genesis Energy LP(a) | | | 13,405,732 | | | | 86,198,857 | |
| Holly Energy Partners LP(a) | | | 5,634,473 | | | | 76,290,764 | |
| Magellan Midstream Partners LP | | | 9,116,142 | | | | 375,129,243 | |
| MPLX LP | | | 19,384,044 | | | | 407,840,286 | |
| NGL Energy Partners LP(a) | | | 14,704,054 | | | | 32,054,838 | |
| NuStar Energy LP(a) | | | 12,165,747 | | | | 161,682,778 | |
| Phillips 66 Partners LP | | | 8,882,361 | | | | 238,757,864 | |
| Plains All American Pipeline LP(a) | | | 50,387,023 | | | | 400,072,962 | |
| Shell Midstream Partners LP | | | 15,235,191 | | | | 156,313,060 | |
| Total Pipeline Transportation | Petroleum | | | | | | | 1,934,340,652 | |
| | | | | | | | | |
| TOTAL MASTER LIMITED PARTNERSHIPS | | | | | | | | |
| (Cost $4,545,069,661) | | | | | | | 3,878,205,275 | |
| | | 7 Day Yield | | | Shares | | | Value | |
| SHORT TERM INVESTMENTS (0.07%) | | | | | | | | | | | | |
| State Street Institutional | | | | | | | | | | | | |
| Treasury Plus Money | | | | | | | | | | | | |
| Market Fund | | | 0.01 | % | | | 2,877,834 | | | | 2,877,834 | |
| TOTAL SHORT TERM INVESTMENTS | | | | | | | | | | | | |
| (Cost $2,877,834) | | | | | | | | | | | 2,877,834 | |
| | | | | | | | | | | | | |
| TOTAL INVESTMENTS (100.02%) | | | | | | | | | | | | |
| (Cost $4,547,947,495) | | | | | | | | | | $ | 3,881,083,109 | |
| LIABILITIES IN EXCESS OF OTHER ASSETS | | | | | | | (-0.02%) | | | | (945,831 | ) |
| NET ASSETS - 100.00% | | | | | | | | | | $ | 3,880,137,278 | |
(a) Affiliated Company. See Note 8 in Notes to Financial Statement.
See Notes to Financial Statements.
Alerian MLP ETF
| Statement of Assets and Liabilities | November 30, 2020 |
| ASSETS: | | | |
| Investments, at value | | $ | 2,198,297,759 | |
| Investments in affiliates, at value | | | 1,682,785,350 | |
| Receivable for investments sold | | | 17,504,679 | |
| Receivable for fund shares sold | | | 1,947,634 | |
| Deferred tax asset (Note 2) | | | – | (a) |
| Income tax receivable | | | 1,291,761 | |
| Franchise tax receivable | | | 320,713 | |
| Total Assets | | | 3,902,147,896 | |
| | | | | |
| LIABILITIES: | | | | |
| Payable for investments purchased | | | 1,950,007 | |
| Payable for shares redeemed | | | 17,516,768 | |
| Payable to adviser | | | 2,543,843 | |
| Total Liabilities | | | 22,010,618 | |
| NET ASSETS | | $ | 3,880,137,278 | |
| | | | | |
| NET ASSETS CONSIST OF: | | | | |
| Paid-in capital | | $ | 8,634,293,711 | |
| Distributable earnings | | | (4,754,156,433 | ) |
| NET ASSETS | | $ | 3,880,137,278 | |
| | | | | |
| INVESTMENTS, AT COST | | $ | 2,328,207,954 | |
| INVESTMENTS IN AFFILIATES, AT COST | | | 2,219,739,541 | |
| | | | | |
| PRICING OF SHARES | | | | |
| Net Assets | | $ | 3,880,137,278 | |
| Shares of beneficial interest outstanding (Unlimited number of shares authorized, par value $0.01 per share) | | | 155,057,420 | |
| Net Asset Value, offering and redemption price per share | | $ | 25.02 | |
| (a) | Net Deferred Tax Asset of $857,213,118 is offset 100% by Valuation Allowance. |
See Notes to Financial Statements.
Alerian MLP ETF
| Statement of Operations | For the Year Ended November 30, 2020 |
| INVESTMENT INCOME: | | | |
| Distributions from master limited partnerships | | $ | 499,750,725 | |
| Less return of capital distributions | | | (499,750,725 | ) |
| Total Investment Income | | | – | |
| | | | | |
| EXPENSES: | | | | |
| Franchise tax expense | | | 63,772 | |
| Investment adviser fee | | | 39,748,611 | |
| Total Expenses | | | 39,812,383 | |
| NET INVESTMENT LOSS, BEFORE INCOME TAXES | | | (39,812,383 | ) |
| Current income tax benefit/(expense) | | | (44,937 | ) |
| NET INVESTMENT LOSS | | | (39,857,320 | ) |
| | | | | |
| REALIZED AND UNREALIZED GAIN/(LOSS): | | | | |
| Net realized loss on investments, before income taxes | | | (569,178,769 | ) |
| Net realized loss on affiliated investments, before income taxes | | | (1,554,831,473 | ) |
| Current income tax benefit/(expense) | | | (2,397,385 | ) |
| Net realized loss | | | (2,126,407,627 | ) |
| Net change in unrealized depreciation on investments, before income taxes | | | (124,346,027 | ) |
| Net change in unrealized appreciation on affiliated investments, before income taxes | | | 290,314,912 | |
| Current income tax benefit/(expense) | | | 187,331 | |
| Net change in unrealized appreciation | | | 166,156,216 | |
| NET REALIZED AND UNREALIZED LOSS ON INVESTMENTS | | | (1,960,251,411 | ) |
| NET DECREASE IN NET ASSETS RESULTING FROM OPERATIONS | | $ | (2,000,108,731 | ) |
See Notes to Financial Statements.
Alerian MLP ETF
Statements of Changes in Net Assets
| | | For the Year Ended November 30, 2020 | | | For the Year Ended November 30, 2019 | |
| OPERATIONS: | | | | | | | | |
| Net investment loss | | $ | (39,857,320 | ) | | $ | (66,514,625 | ) |
| Net realized loss | | | (2,126,407,627 | ) | | | (1,107,683,146 | ) |
| Net change in unrealized appreciation | | | 166,156,216 | | | | 379,463,225 | |
| Net decrease in net assets resulting from operations | | | (2,000,108,731 | ) | | | (794,734,546 | ) |
| | | | | | | | | |
| DISTRIBUTIONS TO SHAREHOLDERS: | | | | | | | | |
| From tax return of capital | | | (518,981,697 | ) | | | (704,785,128 | ) |
| Total distributions | | | (518,981,697 | ) | | | (704,785,128 | ) |
| | | | | | | | | |
| CAPITAL SHARE TRANSACTIONS: | | | | | | | | |
| Proceeds from sale of shares | | | 1,148,144,286 | | | | 1,923,590,589 | |
| Cost of shares redeemed | | | (1,997,921,707 | ) | | | (1,874,813,815 | ) |
| Net increase/(decrease) from share transactions | | | (849,777,421 | ) | | | 48,776,774 | |
| | | | | | | | | |
| Net decrease in net assets | | | (3,368,867,849 | ) | | | (1,450,742,900 | ) |
| | | | | | | | | |
| NET ASSETS: | | | | | | | | |
| Beginning of year | | | 7,249,005,127 | | | | 8,699,748,027 | |
| End of year | | $ | 3,880,137,278 | | | $ | 7,249,005,127 | |
| | | | | | | | | |
| OTHER INFORMATION: | | | | | | | | |
| SHARE TRANSACTIONS: | | | | | | | | |
| Beginning shares | | | 926,062,100 | | | | 910,762,100 | |
| Shares sold | | | 130,075,000 | | | | 209,850,000 | |
| Shares redeemed | | | (240,750,000 | ) | | | (194,550,000 | ) |
| Reverse stock split (Note 1) | | | (660,329,680 | ) | | | – | |
| Shares outstanding, end of period | | | 155,057,420 | | | | 926,062,100 | |
See Notes to Financial Statements.
Alerian MLP ETF
| Financial Highlights | For a Share Outstanding Throughout the Periods Presented |
| | | For the Year Ended November 30, 2020 (a) | | | For the Year Ended November 30, 2019 (a) | | | For the Year Ended November 30, 2018 (a) | | | For the Year Ended November 30, 2017 (a) | | | For the Year Ended November 30, 2016 (a) | |
| NET ASSET VALUE, BEGINNING OF PERIOD | | $ | 39.15 | | | $ | 47.75 | | | $ | 51.85 | | | $ | 61.55 | | | $ | 61.25 | |
| | | | | | | | | | | | | | | | | | | | | |
| INCOME/(LOSS) FROM OPERATIONS: | | | | | | | | | | | | | | | | | | | | |
| Net investment income/(loss)(b) | | | (0.24 | ) | | | (0.35 | ) | | | (0.45 | ) | | | (1.10 | ) | | | 0.20 | |
| Net realized and unrealized gain/(loss) on investments | | | (10.73 | ) | | | (4.35 | ) | | | 0.40 | | | | (4.30 | ) | | | 5.20 | |
| Total from investment operations | | | (10.97 | ) | | | (4.70 | ) | | | (0.05 | ) | | | (5.40 | ) | | | 5.40 | |
| | | | | | | | | | | | | | | | | | | | | |
| DISTRIBUTIONS: | | | | | | | | | | | | | | | | | | | | |
| From net realized gains | | | – | | | | – | | | | (4.05 | ) | | | – | | | | – | |
| From tax return of capital | | | (3.16 | ) | | | (3.90 | ) | | | – | | | | (4.30 | ) | | | (5.10 | ) |
| Total distributions | | | (3.16 | ) | | | (3.90 | ) | | | (4.05 | ) | | | (4.30 | ) | | | (5.10 | ) |
| | | | | | | | | | | | | | | | | | | | | |
| NET INCREASE/(DECREASE) IN NET ASSET VALUE | | | (14.13 | ) | | | (8.60 | ) | | | (4.10 | ) | | | (9.70 | ) | | | 0.30 | |
| NET ASSET VALUE, END OF PERIOD | | $ | 25.02 | | | $ | 39.15 | | | $ | 47.75 | | | $ | 51.85 | | | $ | 61.55 | |
| TOTAL RETURN(c) | | | (28.36 | )% | | | (10.79 | )% | | | (0.55 | )% | | | (9.27 | )% | | | 9.76 | % |
| | | | | | | | | | | | | | | | | | | | | |
| RATIOS/SUPPLEMENTAL DATA: | | | | | | | | | | | | | | | | | | | | |
| Net assets, end of period (000s) | | $ | 3,880,137 | | | $ | 7,249,005 | | | $ | 8,699,748 | | | $ | 9,405,284 | | | $ | 9,378,019 | |
| | | | | | | | | | | | | | | | | | | | | |
| RATIO TO AVERAGE NET ASSETS: | | | | | | | | | | | | | | | | | | | | |
| Expenses (excluding net current and deferred tax expenses/benefits and franchise tax expense) | | | 0.85 | % | | | 0.85 | % | | | 0.85 | % | | | 0.85 | % | | | 0.85 | % |
| Expenses (including net current and deferred tax expenses/benefits)(d) | | | 0.90 | % | | | 0.87 | % | | | 0.85 | % | | | 0.41 | % | | | 1.42 | % |
| Expenses (including current and deferred tax expenses/benefits)(e) | | | 0.85 | % | | | 0.85 | % | | | 0.85 | % | | | 1.81 | % | | | (0.36 | )% |
| Net investment loss (excluding deferred tax | | | | | | | | | | | | | | | | | | | | |
| expenses/benefits and franchise tax expense) | | | (0.85 | )% | | | (0.77 | )% | | | (0.85 | )% | | | (0.85 | )% | | | (0.85 | )% |
| Net investment income/(loss)(including deferred tax expenses/benefits)(e) | | | (0.85 | )% | | | (0.77 | )% | | | (0.85 | )% | | | (1.81 | )% | | | 0.36 | % |
| PORTFOLIO TURNOVER RATE(f) | | | 23 | % | | | 34 | % | | | 26 | % | | | 23 | % | | | 31 | % |
| (a) | On May 18, 2020, the Alerian MLP ETF underwent a one for five reverse stock split. The capital share activity presented here has been retroactively adjusted to reflect this reverse split. See Note 1. |
| (b) | Based on average shares outstanding during the period. |
| (c) | Total return is calculated assuming an initial investment made at the net assets value at the beginning of the period and redemption at the net asset value on the last day of the period and assuming all distributions are reinvested at actual reinvestment prices. Total return calculated for a period of less than one year is not annualized. |
| (d) | Includes amount of current and deferred taxes/benefits for all components of the Statement of Operations. |
| (e) | Includes amount of current and deferred tax benefit associated with net investment income/(loss). |
| (f) | Portfolio turnover for periods less than one year is not annualized and does not include securities received or delivered from processing creations or redemptions in-kind. |
See Notes to Financial Statements.
Alerian Energy Infrastructure ETF
| Schedule of Investments | November 30, 2020 |
| Security Description | | Shares | | | Value | |
| CANADIAN ENERGY INFRASTRUCTURE COMPANIES (31.01%) | | | | | | | | |
| Gathering + Processing (2.98%) | | | | | | | | |
| Keyera Corp. | | | 63,793 | | | $ | 1,100,794 | |
| | | | | | | | | |
| Pipeline Transportation | Natural Gas (8.79%) | | | | | | | | |
| TC Energy Corp.(a) | | | 73,923 | | | | 3,251,883 | |
| | | | | | | | | |
| Pipeline Transportation | Petroleum (17.40%) | | | | | | | | |
| Enbridge, Inc. | | | 108,391 | | | | 3,385,184 | |
| Inter Pipeline, Ltd. | | | 124,755 | | | | 1,243,035 | |
| Pembina Pipeline Corp. | | | 70,935 | | | | 1,809,015 | |
| Total Pipeline Transportation | Petroleum | | | | | | | 6,437,234 | |
| | | | | | | | | |
| Storage (1.84%) | | | | | | | | |
| Gibson Energy, Inc.(a) | | | 42,447 | | | | 681,793 | |
| | | | | | | | | |
| TOTAL CANADIAN ENERGY INFRASTRUCTURE COMPANIES | | | | | | | | |
| (Cost $14,721,651) | | | | | | | 11,471,704 | |
| | | | | | | | | |
| U.S. ENERGY INFRASTRUCTURE COMPANIES (28.37%) | | | | | | | | |
| Gathering + Processing (10.52%) | | | | | | | | |
| ONEOK, Inc. | | | 64,660 | | | | 2,319,354 | |
| Targa Resources Corp. | | | 66,934 | | | | 1,572,949 | |
| Total Gathering + Processing | | | | | | | 3,892,303 | |
| | | | | | | | | |
| Liquefaction (5.04%) | | | | | | | | |
| Cheniere Energy, Inc.(b) | | | 31,314 | | | | 1,775,191 | |
| Tellurian, Inc.(b) | | | 59,444 | | | | 88,571 | |
| Total Liquefaction | | | | | | | 1,863,762 | |
| | | | | | | | | |
| Pipeline Transportation | Natural Gas (10.94%) | | | | | | | | |
| Equitrans Midstream Corp. | | | 118,700 | | | | 968,592 | |
| Kinder Morgan, Inc. | | | 213,972 | | | | 3,076,918 | |
| Total Pipeline Transportation | Natural Gas | | | | | | | 4,045,510 | |
| | | | | | | | | |
| Storage (1.87%) | | | | | | | | |
| Macquarie Infrastructure Corp. | | | 21,379 | | | | 691,611 | |
| | | | | | | | | |
| TOTAL U.S. ENERGY INFRASTRUCTURE COMPANIES | | | | | | | | |
| (Cost $15,709,632) | | | | | | | 10,493,186 | |
| | | | | | | | | |
| U.S. ENERGY INFRASTRUCTURE MLPS (25.29%) | | | | | | | | |
| Gathering + Processing (5.43%) | | | | | | | | |
| Crestwood Equity Partners LP | | | 7,646 | | | | 124,706 | |
| Enable Midstream Partners LP | | | 13,312 | | | | 67,758 | |
| Hess Midstream LP, Class A | | | 4,816 | | | | 86,832 | |
| MPLX LP | | | 56,397 | | | | 1,186,593 | |
| Noble Midstream Partners LP | | | 5,038 | | | | 48,012 | |
| Rattler Midstream LP | | | 12,769 | | | | 105,855 | |
| Security Description | | Shares | | | Value | |
| Gathering + Processing (continued) | | | | | | | | |
| Western Midstream Partners LP | | | 30,075 | | | $ | 387,968 | |
| Total Gathering + Processing | | | | | | | 2,007,724 | |
| | | | | | | | | |
| Pipeline Transportation | Natural Gas (13.78%) | | | | | | | | |
| Energy Transfer LP | | | 282,409 | | | | 1,745,287 | |
| Enterprise Products Partners LP | | | 172,772 | | | | 3,351,777 | |
| Total Pipeline Transportation | Natural Gas | | | | | | | 5,097,064 | |
| | | | | | | | | |
| Pipeline Transportation | Petroleum (6.08%) | | | | | | | | |
| BP Midstream Partners LP | | | 7,124 | | | | 80,786 | |
| Delek Logistics Partners LP | | | 1,300 | | | | 39,364 | |
| Genesis Energy LP | | | 16,283 | | | | 104,700 | |
| Holly Energy Partners LP | | | 6,814 | | | | 92,262 | |
| Magellan Midstream Partners LP | | | 28,496 | | | | 1,172,610 | |
| NGL Energy Partners LP | | | 17,781 | | | | 38,763 | |
| NuStar Energy LP | | | 14,842 | | | | 197,250 | |
| PBF Logistics LP | | | 4,762 | | | | 44,429 | |
| Phillips 66 Partners LP | | | 10,784 | | | | 289,874 | |
| Shell Midstream Partners LP | | | 18,660 | | | | 191,452 | |
| Total Pipeline Transportation | Petroleum | | | | | | | 2,251,490 | |
| | | | | | | | | |
| TOTAL U.S. ENERGY INFRASTRUCTURE MLPS | | | | | | | | |
| (Cost $16,753,540) | | | | | | | 9,356,278 | |
| | | | | | | | | |
| U.S. GENERAL PARTNERS (14.00%) | | | | | | | | |
| Gathering + Processing (10.01%) | | | | | | | | |
| Antero Midstream Corp. | | | 91,640 | | | | 617,654 | |
| EnLink Midstream LLC | | | 76,227 | | | | 282,040 | |
| The Williams Cos., Inc. | | | 133,583 | | | | 2,802,571 | |
| Total Gathering + Processing | | | | | | | 3,702,265 | |
| | | | | | | | | |
| Pipeline Transportation | Petroleum (3.99%) | | | | | | | | |
| Plains GP Holdings LP, Class A | | | 186,169 | | | | 1,476,320 | |
| | | | | | | | | |
| TOTAL U.S. GENERAL PARTNERS | | | | | | | | |
| (Cost $9,752,877) | | | | | | | 5,178,585 | |
See Notes to Financial Statements.
Alerian Energy Infrastructure ETF
| Schedule of Investments | November 30, 2020 |
| | | 7 Day Yield | | | Shares | | | Value | |
| SHORT TERM INVESTMENTS (1.51%) | | | | | | | | | | | | |
| Money Market Fund (0.04%) | | | | | | | | | | | | |
| State Street Institutional | | | | | | | | | | | | |
| Treasury Plus Money | | | | | | | | | | | | |
| Market Fund | | | | | | | | | | | | |
| (Cost $12,986) | | | 0.01 | % | | | 12,986 | | | $ | 12,986 | |
| | | | | | | | | | | | | |
| Investments Purchased with Collateral from Securities Loaned (1.47%) | | | | | | | | | | | | |
| State Street Navigator | | | | | | | | | | | | |
| Securities Lending | | | | | | | | | | | | |
| Government Money Market | | | | | | | | | | | | |
| Portfolio, 0.11% | | | | | | | | | | | | |
| (Cost $542,809) | | | | | | | 542,809 | | | | 542,809 | |
| TOTAL SHORT TERM INVESTMENTS | | | | | | | | | | | | |
| (Cost $555,795) | | | | | | | | | | | 555,795 | |
| | | | | | | | | | | | | |
| TOTAL INVESTMENTS (100.18%) | | | | | | | | | | | | |
| (Cost $57,493,495) | | | | | | | | | | $ | 37,055,548 | |
| LIABILITIES IN EXCESS OF OTHER ASSETS (-0.18%) | | | | | | | | | | | (67,099 | ) |
| NET ASSETS - 100.00% | | | | | | | | | | $ | 36,988,449 | |
| (a) | Security, or a portion of the security position is currently on loan. The total market value of securities on loan is $498,674. |
| (b) | Non-income producing security. |
See Notes to Financial Statements.
Alerian Energy Infrastructure ETF
| Statement of Assets and Liabilities | November 30, 2020 |
| ASSETS: | | | |
| Investments, at value | | $ | 37,055,548 | |
| Receivable for Investments Sold | | | 651,234 | |
| Receivable for Shares Sold | | | 749,396 | |
| Dividends receivable | | | 75,804 | |
| Total Assets | | | 38,531,982 | |
| | | | | |
| LIABILITIES: | | | | |
| Payable for investments purchased | | | 982,532 | |
| Payable to adviser | | | 18,192 | |
| Payable for collateral upon return of securities loaned | | | 542,809 | |
| Total Liabilities | | | 1,543,533 | |
| NET ASSETS | | $ | 36,988,449 | |
| | | | | |
| NET ASSETS CONSIST OF: | | | | |
| Paid-in capital | | $ | 56,331,724 | |
| Distributable earnings | | | (19,343,275 | ) |
| NET ASSETS | | $ | 36,988,449 | |
| | | | | |
| INVESTMENTS, AT COST | | $ | 57,493,495 | |
| | | | | |
| PRICING OF SHARES | | | | |
| Net Assets | | $ | 36,988,449 | |
| Shares of beneficial interest outstanding (Unlimited number of shares authorized, par value $0.01 per share) | | | 2,550,000 | |
| Net Asset Value, offering and redemption price per share | | $ | 14.51 | |
See Notes to Financial Statements.
Alerian Energy Infrastructure ETF
| Statement of Operations | For the Year Ended November 30, 2020 |
| INVESTMENT INCOME: | | | |
| Dividends* | | $ | 2,609,278 | |
| Securities lending income | | | 7,823 | |
| Total Investment Income | | | 2,617,101 | |
| | | | | |
| EXPENSES: | | | | |
| Investment adviser fees | | | 259,389 | |
| Total Expenses | | | 259,389 | |
| NET INVESTMENT INCOME | | | 2,357,712 | |
| | | | | |
| REALIZED AND UNREALIZED GAIN/(LOSS): | | | | |
| Net realized loss on investments | | | (5,565,385 | ) |
| Net realized loss on foreign currency transactions | | | (5,590 | ) |
| Net realized loss | | | (5,570,975 | ) |
| Net change in unrealized depreciation on investments | | | (10,123,756 | ) |
| Net change in unrealized appreciation on translation of assets and liabilities denominated in foreign currencies | | | 932 | |
| Net change in unrealized depreciation | | | (10,122,824 | ) |
| NET REALIZED AND UNREALIZED LOSS ON INVESTMENTS AND FOREIGN CURRENCIES | | | (15,693,799 | ) |
| NET DECREASE IN NET ASSETS RESULTING FROM OPERATIONS | | $ | (13,336,087 | ) |
| * Net of foreign tax withholding. | | $ | 128,806 | |
See Notes to Financial Statements.
Alerian Energy Infrastructure ETF
Statements of Changes in Net Assets
| | | For the Year Ended November 30, 2020 | | | For the Year Ended November 30, 2019 | |
| OPERATIONS: | | | | | | | | |
| Net investment income | | $ | 2,357,712 | | | $ | 2,547,452 | |
| Net realized gain/(loss) | | | (5,570,975 | ) | | | 385,284 | |
| Net change in unrealized depreciation | | | (10,122,824 | ) | | | (1,916,143 | ) |
| Net increase/(decrease) in net assets resulting from operations | | | (13,336,087 | ) | | | 1,016,593 | |
| | | | | | | | | |
| DISTRIBUTIONS: | | | | | | | | |
| From distributable earnings | | | (1,140,689 | ) | | | (1,375,978 | ) |
| From tax return of capital | | | (1,627,034 | ) | | | (2,575,568 | ) |
| Total distributions | | | (2,767,723 | ) | | | (3,951,546 | ) |
| | | | | | | | | |
| CAPITAL SHARE TRANSACTIONS: | | | | | | | | |
| Proceeds from sale of shares | | | 20,059,786 | | | | 28,422,425 | |
| Cost of shares redeemed | | | (18,776,258 | ) | | | (15,378,212 | ) |
| Net increase from share transactions | | | 1,283,528 | | | | 13,044,213 | |
| Net increase/(decrease) in net assets | | | (14,820,282 | ) | | | 10,109,260 | |
| | | | | | | | | |
| NET ASSETS: | | | | | | | | |
| Beginning of period | | | 51,808,731 | | | | 41,699,471 | |
| End of period | | $ | 36,988,449 | | | $ | 51,808,731 | |
| | | | | | | | | |
| OTHER INFORMATION: | | | | | | | | |
| CAPITAL SHARE TRANSACTIONS: | | | | | | | | |
| Beginning shares | | | 2,700,000 | | | | 2,050,000 | |
| Shares sold | | | 1,250,000 | | | | 1,400,000 | |
| Shares redeemed | | | (1,400,000 | ) | | | (750,000 | ) |
| Shares outstanding, end of period | | | 2,550,000 | | | | 2,700,000 | |
See Notes to Financial Statements.
Alerian Energy Infrastructure ETF
| Financial Highlights | For a Share Outstanding Throughout the Periods Presented |
| | | For the Year Ended November 30, 2020 | | | For the Year Ended November 30, 2019 | | | For the Year Ended November 30, 2018 | | | For the Year Ended November 30, 2017 | | | For the Year Ended November 30, 2016 | |
| NET ASSET VALUE, BEGINNING OF PERIOD | | $ | 19.19 | | | $ | 20.34 | | | $ | 22.30 | | | $ | 22.95 | | | $ | 18.97 | |
| | | | | | | | | | | | | | | | | | | | | |
| INCOME/(LOSS) FROM INVESTMENT OPERATIONS: | | | | | | | | | | | | | | | | | | | | |
| Net investment income(a) | | | 0.90 | | | | 0.88 | | | | 0.85 | | | | 0.79 | | | | 0.80 | |
| Net realized and unrealized gain/(loss) on investments | | | (4.50 | ) | | | (0.64 | ) | | | (2.23 | ) | | | (0.72 | ) | | | 3.95 | |
| Total from investment operations | | | (3.60 | ) | | | 0.24 | | | | (1.38 | ) | | | 0.07 | | | | 4.75 | |
| | | | | | | | | | | | | | | | | | | | | |
| DISTRIBUTIONS: | | | | | | | | | | | | | | | | | | | | |
| From net investment income | | | (0.45 | ) | | | (0.50 | ) | | | (0.47 | ) | | | (0.47 | ) | | | (0.63 | ) |
| Tax return of capital | | | (0.63 | ) | | | (0.89 | ) | | | (0.11 | ) | | | (0.25 | ) | | | (0.14 | ) |
| Total distributions | | | (1.08 | ) | | | (1.39 | ) | | | (0.58 | ) | | | (0.72 | ) | | | (0.77 | ) |
| | | | | | | | | | | | | | | | | | | | | |
| NET INCREASE/(DECREASE) IN NET ASSET VALUE | | | (4.68 | ) | | | (1.15 | ) | | | (1.96 | ) | | | (0.65 | ) | | | 3.98 | |
| NET ASSET VALUE, END OF PERIOD | | $ | 14.51 | | | $ | 19.19 | | | $ | 20.34 | | | $ | 22.30 | | | $ | 22.95 | |
| TOTAL RETURN(b) | | | (18.82 | )% | | | 1.09 | % | | | (6.27 | )% | | | 0.21 | % | | | 25.63 | % |
| | | | | | | | | | | | | | | | | | | | | |
| RATIOS/SUPPLEMENTAL DATA: | | | | | | | | | | | | | | | | | | | | |
| Net assets, end of period (000s) | | $ | 36,988 | | | $ | 51,809 | | | $ | 41,699 | | | $ | 42,370 | | | $ | 18,357 | |
| | | | | | | | | | | | | | | | | | | | | |
| Ratio of expenses to average net assets | | | 0.65 | % | | | 0.65 | % | | | 0.65 | % | | | 0.65 | % | | | 0.65 | % |
| Ratio of net investment income to average net assets | | | 5.91 | % | | | 4.23 | % | | | 3.86 | % | | | 3.39 | % | | | 4.04 | % |
| PORTFOLIO TURNOVER RATE(c) | | | 34 | % | | | 26 | % | | | 73 | % | | | 37 | % | | | 38 | % |
| (a) | Based on average shares outstanding during the period. |
| (b) | Total return is calculated assuming an initial investment made at the net assets value at the beginning of the period and redemption at the net asset value on the last day of the period and assuming all distributions are reinvested at actual reinvestment prices. Total return calculated for a period of less than one year is not annualized. |
| (c) | Portfolio turnover for periods less than one year is not annualized and does not include securities received or delivered from processing creations or redemptions in-kind. |
See Notes to Financial Statements.
Alerian Exchange Traded Funds
| Notes to Financial Statements | November 30, 2020 |
1. ORGANIZATION
ALPS ETF Trust (the “Trust”), a Delaware statutory trust, is an open-end management investment company registered under the Investment Company Act of 1940, as amended (the “1940 Act”). As of November 30, 2020, the Trust consisted of sixteen separate portfolios. Each portfolio represents a separate series of the Trust. This report pertains to the Alerian MLP ETF and the Alerian Energy Infrastructure ETF (each a “Fund” and collectively, the “Funds”).
The investment objective of the Alerian MLP ETF is to seek investment results that correspond (before fees and expenses) generally to the price and yield performance of its underlying index, the Alerian MLP Infrastructure Total Return Index. The investment objective of the Alerian Energy Infrastructure ETF is to seek investment results that correspond (before fees and expenses) generally to the price and yield performance of its underlying index, the Alerian Midstream Energy Select Total Return Index. The investment advisor uses a “passive management” or indexing investment approach to try to achieve each Fund’s investment objective. Each Fund is considered non-diversified and may invest a greater portion of assets in securities of individual issuers than a diversified fund. As a result, changes in the market value of a single investment could cause greater fluctuations in share price than would occur in a diversified fund.
Each Fund’s Shares (“Shares”) are listed on the NYSE Arca, Inc. (“the NYSE Arca”). Each Fund issues and redeems Shares at net asset value (“NAV”), in blocks of 50,000 Shares, each of which is called a “Creation Unit”. Creation Units are issued and redeemed principally in-kind for securities included in the Underlying Index. Except when aggregated in Creation Units, Shares are not redeemable securities of the Fund. On May 18, 2020, Alerian MLP ETF reduced its Creation Unit size from 50,000 to 25,000 shares.
The Board authorized a one-for-five reverse stock split of Alerian MLP ETF that was effective at the market open on May 18, 2020. The impact of the reverse stock split was to decrease the number of shares outstanding by a factor of five, while increasing the NAV of shares outstanding by a factor of five, resulting in no effect to the net assets of the Fund. The financial statements of the Fund have been adjusted to reflect the reverse stock split.
Pursuant to the Trust’s organizational documents, its Officers and Trustees are indemnified against certain liability arising out of the performance of their duties to the Trust. Additionally, in the normal course of business, the Trust enters into contracts with service providers that contain general indemnification clauses. The Trust’s maximum exposure under these arrangements is unknown, as this would involve future claims that may be made against the Trust that have not yet occurred.
2. SIGNIFICANT ACCOUNTING POLICIES
The following is a summary of significant accounting policies consistently followed by the Funds in the preparation of the financial statements. The accompanying financial statements were prepared in accordance with accounting principles generally accepted in the United States of America (“U.S. GAAP”). The preparation of financial statements in conformity with U.S. GAAP requires management to make certain estimates and assumptions that affect the reported amounts of assets and liabilities and disclosures of contingent assets and liabilities at the date of the financial statements and the reported amounts of revenue and expenses during the period. Actual results could differ from those estimates. Each Fund is considered an investment company under U.S. GAAP and follows the accounting and reporting guidance applicable to investment companies in the Financial Accounting Standards Board (“FASB”) Accounting Standards Codification Topic 946.
A. Portfolio Valuation
Each Fund’s NAV is determined daily, as of the close of regular trading on the New York Stock Exchange (“NYSE”), normally 4:00 p.m. Eastern Time, on each day the NYSE is open for trading. The NAV is computed by dividing the value of all assets of the Fund (including accrued interest and dividends), less all liabilities (including accrued expenses and dividends declared but unpaid), by the total number of shares outstanding.
Portfolio securities listed on any exchange other than the NASDAQ Stock Market LLC (“NASDAQ”) are valued at the last sale price on the business day as of which such value is being determined. If there has been no sale on such day, the securities are valued at the mean of the most recent bid and ask prices on such day. Securities traded on the NASDAQ are valued at the NASDAQ Official Closing Price as determined by NASDAQ. Portfolio securities traded on more than one securities exchange are valued at the last sale price on the business day as of which such value is being determined at the close of the exchange representing the principal market for such securities. Portfolio securities traded in the over-the-counter market, but excluding securities traded on the NASDAQ, are valued at the latest quoted sale price in such market.
Alerian Exchange Traded Funds
| Notes to Financial Statements | November 30, 2020 |
The Funds’ investments are valued at market value or, in the absence of market value with respect to any portfolio securities, at fair value according to procedures adopted by the Trust’s Board of Trustees (the “Board”). When market quotations are not readily available or when events occur that make established valuation methods unreliable, securities of the Funds may be valued in good faith by or under the direction of the Board. These securities generally include, but are not limited to, restricted securities (securities which may not be publicly sold without registration under the Securities Act of 1933) for which a pricing service is unable to provide a market price; securities whose trading has been formally suspended; a security whose market price is not available from a pre-established primary pricing source or the pricing source is not willing to provide a price; a security with respect to which an event has occurred that is most likely to materially affect the value of the security after the market has closed but before the calculation of the Funds’ NAV or make it difficult or impossible to obtain a reliable market quotation; or a security whose price, as provided by the pricing service, does not reflect the security’s “fair value” due to the security being de-listed from a national exchange or the security’s primary trading market is temporarily closed at a time when, under normal conditions, it would be open. As a general principle, the current “fair value” of a security would be the amount which the owner might reasonably expect to receive from the sale on the applicable exchange or principal market. A variety of factors may be considered in determining the fair value of such securities.
B. Fair Value Measurements
Each Fund discloses the classification of its fair value measurements following a three-tier hierarchy based on the inputs used to measure fair value. Inputs refer broadly to the assumptions that market participants would use in pricing the asset or liability, including assumptions about risk. Inputs may be observable or unobservable. Observable inputs reflect the assumptions market participants would use in pricing the asset or liability that are developed based on market data obtained from sources independent of the reporting entity. Unobservable inputs reflect the reporting entity’s own assumptions about the assumptions market participants would use in pricing the asset or liability that are developed based on the best information available.
Valuation techniques used to value the Funds’ investments by major category are as follows:
Equity securities, including restricted securities, and Limited Partnerships for which market quotations are readily available, are valued at the last reported sale price or official closing price as reported by a third party pricing vendor on the primary market or exchange on which they are traded and are categorized as Level 1 in the hierarchy. In the event there were no sales during the day or closing prices are not available, securities are valued at the mean of the most recent quoted bid and ask prices on such day and are generally categorized as Level 2 in the hierarchy. Investments in open-end mutual funds are valued at their closing NAV each business day and are categorized as Level 1 in the hierarchy.
Changes in valuation techniques may result in transfers in or out of an assigned level within the disclosure hierarchy.
Various inputs are used in determining the value of the Funds’ investments as of the end of the reporting period. When inputs used fall into different levels of the fair value hierarchy, the level in the hierarchy within which the fair value measurement falls is determined based on the lowest level input that is significant to the fair value measurement in its entirety. The designated input levels are not necessarily an indication of the risk or liquidity associated with these investments.
These inputs are categorized in the following hierarchy under applicable financial accounting standards:
Level 1 – Unadjusted quoted prices in active markets for identical investments, unrestricted assets or liabilities that a Fund has the ability to access at the measurement date;
Level 2 – Quoted prices which are not active, quoted prices for similar assets or liabilities in active markets or inputs other than quoted prices that are observable (either directly or indirectly) for substantially the full term of the asset or liability; and
Level 3 – Significant unobservable prices or inputs (including the Fund’s own assumptions in determining the fair value of investments) where there is little or no market activity for the asset or liability at the measurement date.
Alerian Exchange Traded Funds
| Notes to Financial Statements | November 30, 2020 |
The following is a summary of the inputs used to value each Fund’s investments as of November 30, 2020:
Alerian MLP ETF
| Investments in Securities at Value | | Level 1 - Quoted and Unadjusted Prices | | | Level 2 - Other Significant Observable Inputs | | | Level 3 - Significant Unobservable Inputs | | | Total | |
| Master Limited Partnerships* | | $ | 3,878,205,275 | | | $ | – | | | $ | – | | | $ | 3,878,205,275 | |
| Short Term Investments | | | 2,877,834 | | | | – | | | | – | | | | 2,877,834 | |
| Total | | $ | 3,881,083,109 | | | $ | – | | | $ | – | | | $ | 3,881,083,109 | |
Alerian Energy Infrastructure ETF
| Investments in Securities at Value | | Level 1 - Quoted and Unadjusted Prices | | | Level 2 - Other Significant Observable Inputs | | | Level 3 - Significant Unobservable Inputs | | | Total | |
| Canadian Energy Infrastructure Companies* | | $ | 11,471,704 | | | $ | – | | | $ | – | | | $ | 11,471,704 | |
| U.S. Energy Infrastructure Companies* | | | 10,493,186 | | | | – | | | | – | | | | 10,493,186 | |
| U.S. Energy Infrastructure MLPs* | | | 9,356,278 | | | | – | | | | – | | | | 9,356,278 | |
| U.S. General Partners* | | | 5,178,585 | | | | – | | | | – | | | | 5,178,585 | |
| Short Term Investments | | | 555,795 | | | | – | | | | – | | | | 555,795 | |
| Total | | $ | 37,055,548 | | | $ | – | | | $ | – | | | $ | 37,055,548 | |
| * | For a detailed breakdown of sectors, see the accompanying Schedule of Investments. |
The Funds did not have any securities that used significant unobservable inputs (Level 3) in determining fair value and there were no transfers into or out of Level 3 during the year ended November 30, 2020.
C. Foreign Currency Translation
The books and records of the Funds are maintained in U.S. dollars. Investment valuations and other assets and liabilities initially expressed in foreign currencies are converted each business day into U.S. dollars based upon current exchange rates. The portion of realized and unrealized gains or losses on investments due to fluctuations in foreign currency exchange rates is not separately disclosed and is included in realized and unrealized gains or losses on investments, when applicable.
D. Securities Transactions and Investment Income
Securities transactions are recorded as of the trade date. Realized gains and losses from securities transactions are recorded using the specific identification method. Dividend income and capital gains distributions, if any, are recorded on the ex-dividend date, net of any foreign taxes withheld. Interest income, if any, is recorded on the accrual basis, including amortization of premiums and accretion of discounts.
E. Dividends and Distributions to Shareholders
Each Fund intends to declare and make quarterly distributions, or as the Board may determine from time to time. Distributions of net realized capital gains earned by the Alerian Energy Infrastructure ETF, if any, are distributed at least annually. Distributions from net investment income and capital gains are determined in accordance with income tax regulations, which may differ from U.S. GAAP. These differences are primarily due to differing treatments of income and gains on various investment securities held by the Funds, timing differences and differing characterization of distributions made by the Funds.
Distributions received from each Fund’s investments in Master Limited Partnerships (“MLPs”) may be comprised of both income and return of capital. Each Fund records investment income and return of capital based on estimates made at the time such distributions are received. Such estimates are based on historical information available from each MLP and other industry sources. These estimates may subsequently be revised based on information received from MLPs after their tax reporting periods are concluded.
The Funds each expect a portion of its distributions to shareholders might be comprised of tax deferred return of capital. Return of capital distributions are not taxable income to the shareholder, but reduce the investor’s tax basis in the investor’s Fund Shares. Such a reduction in tax basis will result in larger taxable gains and/or lower tax losses on a subsequent sale of Fund Shares. Shareholders who periodically receive the payment of dividends or other distributions consisting of a return of capital may be under the impression that they are receiving net profits from the Funds when, in fact, they are not. Shareholders should not assume that the source of the distributions is from the net profits of the Funds.
Alerian Exchange Traded Funds
| Notes to Financial Statements | November 30, 2020 |
F. Federal Income Taxation and Tax Basis Information
Alerian MLP ETF
The Fund is taxed as a regular C-corporation for federal income tax purposes and as such is obligated to pay federal and state income tax. This treatment differs from most investment companies, which elect to be treated as “regulated investment companies” under the Internal Revenue Code of 1986, as amended (the “Code”) in order to avoid paying entity level income taxes. Under current law, the Fund is not eligible to elect treatment as a regulated investment company due to its investments primarily in MLPs invested in energy assets. The Fund expects that substantially all of the distributions it receives from MLPs may be treated as a tax-deferred return of capital, thus reducing the Fund’s current tax liability. However, the amount of taxes paid by the Fund will vary depending on the amount of income and gains derived from investments and/or sales of MLP interests and such taxes will reduce your return from an investment in the Fund.
Since the Fund will be subject to taxation on its taxable income, the NAV of the Fund shares will also be reduced by the accrual of any deferred tax liabilities. The Underlying Index however is calculated without any deductions for taxes. As a result, the Fund's after tax performance could differ significantly from the Underlying Index even if the pretax performance of the Fund and the performance of Underlying Index are closely related.
Cash distributions from MLPs to the Fund that exceed the Fund’s allocable share of such MLP’s net taxable income are considered a tax deferred return of capital that will reduce the Fund’s adjusted tax basis in the equity securities of the MLP. These reductions in the Fund’s adjusted tax basis in the MLP equity securities will increase the amount of any taxable gain (or decrease the amount of any tax loss) recognized by the Fund on a subsequent sale of the securities. The Fund will accrue deferred income taxes for any future tax liability associated with (i) that portion of MLP distributions considered to be a tax-deferred return of capital as well as (ii) capital appreciation of its investments. Upon the sale of an MLP security, the Fund may be liable for previously deferred taxes. The Fund will rely to some extent on information provided by the MLPs, which is not necessarily timely, to estimate the deferred tax liability for purposes of financial statement reporting and determining the Fund’s NAV. From time to time, the Adviser will modify the estimates or assumptions related to the Fund’s deferred tax liability as new information becomes available. The Fund will generally compute deferred income taxes based on the federal income tax rate applicable to corporations and an assumed rate attributable to state taxes.
The Fund’s income tax expense/(benefit) consists of the following:
| Alerian MLP ETF | | | | | Year ended November 30, 2020 | | | | |
| | | Current | | | Deferred | | | Total | |
| Federal | | $ | – | | | $ | (420,088,902 | ) | | $ | (420,088,902 | ) |
| State | | | 2,254,991 | | | | (43,578,276 | ) | | | (41,323,285 | ) |
| Valuation Allowance | | | – | | | | 463,667,178 | | | | 463,667,178 | |
| Total tax expense/(benefit) | | $ | 2,254,991 | | | $ | – | | | $ | 2,254,991 | |
Deferred income taxes reflect the net tax effect of temporary differences between the carrying amount of assets and liabilities for financial reporting and tax purposes.
Components of the Fund’s deferred tax assets and liabilities are as follows:
| Alerian MLP ETF | | As of November 30, 2020 | |
| Deferred tax assets: | | | | |
| Capital loss carryforward | | $ | 516,295,149 | |
| Net operating loss carryforward | | | 45,471,526 | |
| Income recognized from MLP investments | | | 1,387,853,626 | |
| Other deferred tax assets | | | 11,610,062 | |
| Valuation allowance | | | (857,213,118 | ) |
| Less Deferred tax liabilities: | | | | |
| Net unrealized gain on investment securities | | | (1,104,017,245 | ) |
| Net Deferred Tax Asset/(Liability) | | $ | – | |
Due to the activities of the MLPs that the fund is invested in, the Fund is required to pay franchise tax in certain states. Generally speaking, franchise tax expense is a tax on equity of a corporation, or base minimum fees, imposed by various jurisdictions. The amounts of the tax are estimated throughout the year based upon the Fund's estimate of underlying activities conducted in the states and reconciled to actual amounts paid upon the filing of the tax returns for the states. These taxes are paid as either estimated tax payments, extension payments, or with the tax return filings of the various states.
Alerian Exchange Traded Funds
| Notes to Financial Statements | November 30, 2020 |
The capital loss carryforward is available to offset future taxable income. The capital loss can be carried forward for 5 years and, accordingly, would begin to expire as of November 30, 2021. The Fund has net capital loss carryforwards for federal income tax purposes as follows:
| Alerian MLP ETF | | Period-Ended | | Amount | | | Expiration |
| Federal | | 11/30/2016 | | $ | 218,006,925 | | | 11/30/2021 |
| Federal | | 11/30/2017 | | | 20,624,857 | | | 11/30/2022 |
| Federal | | 11/30/2019 | | | 757,980,977 | | | 11/30/2024 |
| Federal | | 11/30/2020 | | | 1,253,039,304 | | | 11/30/2025 |
| Total | | | | $ | 2,249,652,063 | | | |
The net operating loss carryforward is available to offset future taxable income. The Fund has net operating loss carryforwards for federal income tax purposes as follows:
| Alerian MLP ETF | | Period-Ended | | Amount | | | Expiration |
| Federal | | 11/30/2017 | | | 139,464,188 | | | 11/30/2037 |
| Total | | | | $ | 139,464,188 | | | |
The Fund also has state tax net operating loss carryforwards of various amounts per state. The Deferred Tax Assets associated with these state tax net operating losses are as follows:
| Alerian MLP ETF | | Period-Ended | | Amount | | | Expiration |
| State | | 11/30/2016 | | | 3,913,692 | | | Varies by State |
| State | | 11/30/2017 | | | 7,472,303 | | | Varies by State |
| State | | 11/30/2018 | | | 2,553,292 | | | Varies by State |
| State | | 11/30/2019 | | | 2,244,759 | | | Varies by State |
| Total | | | | $ | 16,184,046 | | | |
The Tax Cuts and Jobs Act (“TCJA”) was signed into law on December 22, 2017. The TCJA made modifications to the net operating loss (“NOL”) deduction. The TCJA eliminated the NOL carryback ability and replaced the 20 year carryforward period with an indefinite carryforward period for any NOLs arising in tax years beginning after December 31, 2017. The TCJA also established a limitation for any NOLs generated in tax years beginning after December 31, 2017 to the lesser of the aggregate of available NOLs or 80% of taxable income before any NOL utilization. The Coronavirus Aid, Relief, and Economic Stability Act (“CARES Act”) was signed into law on March 27, 2020. The CARES Act delays the application of the 80% net operating loss limitation, established under TCJA, to tax years ending November 30, 2022 and beyond.
The Fund reviews the recoverability of its deferred tax assets based upon the weight of available evidence. When assessing the recoverability of its deferred tax assets, significant weight was given to the effects of potential future realized and unrealized gains on investments and the period over which these deferred tax assets can be realized. Currently, any capital losses that may be generated by the Fund are eligible to be carried back up to three years and can be carried forward for five years to offset capital gains recognized by the Fund in those years.
Based upon the Fund’s assessment, it has determined that it is “more-likely-than-not” that a portion of its deferred tax assets will not be realized through future taxable income of the appropriate character. Accordingly, a valuation allowance has been established for the Fund’s deferred tax assets. The Fund will continue to assess the need for a valuation allowance in the future. Significant increases in the fair value of its portfolio of investments may change the Fund’s assessment of the recoverability of these assets and may result in the removal of the valuation allowance against all or a portion of the Fund’s gross deferred tax assets.
Total income tax expense/(benefit) (current and deferred) differs from the amount computed by applying the federal statutory income tax rate of 21% to net investment income and realized and unrealized gain/(losses) on investment before taxes as follows:
Alerian Exchange Traded Funds
| Notes to Financial Statements | November 30, 2020 |
| Alerian MLP ETF | | As of November 30, 2020 | |
| Income tax expense at statutory rate | | $ | (419,549,285 | ) |
| State income tax benefit (net of federal benefit) | | | (38,958,148 | ) |
| Permanent differences, net | | | (7,239,782 | ) |
| Effect of tax rate change | | | 2,080,036 | |
| Valuation allowance | | | 465,922,170 | |
| Net income tax expense | | $ | 2,254,991 | |
The following is a tabular reconciliation of the total amounts of unrecognized tax benefits:
| Alerian MLP ETF | | Inception to November 30, 2020 | |
| Unrecognized tax benefit - Beginning | | $ | – | |
| Gross increases - tax positions in prior period | | | – | |
| Gross decreases - tax positions in prior period | | | – | |
| Gross increases - tax positions in current period | | | – | |
| Settlement | | | – | |
| Lapse of statute of limitations | | | – | |
| Unrecognized tax benefit - Ending | | $ | – | |
The Fund recognizes interest accrued related to unrecognized tax benefits and penalties as income tax expense. For the year ended November 30, 2020, the Fund paid $54,313 in penalties and interest.
The Fund recognizes the tax benefits of uncertain tax positions only where the position is “more-likely-than-not” to be sustained assuming examination by tax authorities. Management has analyzed the Fund’s tax positions, and has concluded that no liability for unrecognized tax benefits should be recorded related to uncertain tax positions taken on U.S. tax returns and state tax returns filed since inception of the Fund. Tax periods ended November 30, 2017 through November 30, 2019 remain subject to examination by tax authorities in the United States. Due to the nature of the Fund’s investments, the Fund may be required to file income tax returns in several states. The Fund is not aware of any tax positions for which it is reasonably possible that the total amounts of unrecognized tax benefits will change materially in the next 12 months.
Alerian Energy Infrastructure ETF
The timing and character of income and capital gain distributions are determined in accordance with income tax regulations, which may differ from U.S. GAAP. Reclassifications are made to the Fund’s capital accounts for permanent tax differences to reflect income and gains available for distribution (or available capital loss carryforwards) under income tax regulations.
No provision for income taxes is included in the accompanying financial statements, as the Alerian Energy Infrastructure ETF intends to distribute to shareholders all taxable investment income and realized gains and otherwise comply with Subchapter M of the Internal Revenue Code of 1986, as amended, applicable to regulated investment companies. The Alerian Energy Infrastructure ETF evaluates tax positions taken (or expected to be taken) in the course of preparing the Fund’s tax returns to determine whether these positions meet a “more-likely-than-not” standard that, based on the technical merits, have a more than fifty percent likelihood of being sustained by a taxing authority upon examination. A tax position that meets the “more-likely-than-not” recognition threshold is measured to determine the amount of benefit to recognize in the financial statements.
As of and during the year ended November 30, 2020, the Alerian Energy Infrastructure ETF did not have a liability for any unrecognized tax benefits. The Alerian Energy Infrastructure ETF files U.S. federal, state, and local tax returns as required. The Fund’s tax returns are subject to examination by the relevant tax authorities until expiration of the applicable statute of limitations, which is generally three years after the filing of the tax return, but may extend to four years in certain jurisdictions. Tax returns for open years have incorporated no uncertain tax positions that require a provision for income taxes.
Alerian Exchange Traded Funds
| Notes to Financial Statements | November 30, 2020 |
For the year ended November 30, 2020, permanent book and tax differences resulting primarily from differing treatment of investments in partnerships and redemptions in kind were identified and reclassified among components of the Fund’s net assets as follows:
| Fund | | Paid-in Capital | | | Total Distributable Earnings | |
| Alerian Energy Infrastructure ETF | | $ | (5,702,359 | ) | | $ | 5,702,359 | |
The tax character of the distributions paid during the fiscal years ended November 30, 2020 and November 30, 2019 was as follows:
| | | Ordinary Income | | | Long-Term Capital Gain | | | Return of Capital | |
| November 30, 2020 | | | | | | | | | |
| Alerian Energy Infrastructure ETF | | $ | 1,140,689 | | | $ | – | | | $ | 1,627,034 | |
| | | Ordinary Income | | | Long-Term Capital Gain | | | Return of Capital | |
| November 30, 2019 | | | | | | | | | |
| Alerian Energy Infrastructure ETF | | $ | 1,375,978 | | | $ | – | | | $ | 2,575,568 | |
The character of distributions made during the year may differ from its ultimate characterization for federal income tax purposes.
The Alerian Energy Infrastructure ETF used capital loss carryovers during the year ended November 30, 2020 in the amount of $664,518.
Under current law, capital losses maintain their character as short-term or long-term and are carried forward to the next tax year without expiration. As of November 30, 2020, the following amounts are available as carry forwards to the next tax year:
| | | Short-Term | | | Long-Term | |
| Alerian Energy Infrastructure ETF | | $ | 286,666 | | | $ | 1,001,582 | |
As of November 30, 2020, the components of distributable earnings on a tax basis were as follows:
| | | Alerian Energy | |
| | | Infrastructure ETF | |
| Accumulated net realized loss on investments | | $ | (1,288,248 | ) |
| Net unrealized depreciation on investments | | | (14,633,146 | ) |
| Other accumulated losses | | | (3,421,881 | ) |
| Total | | $ | (19,343,275 | ) |
As of November 30, 2020, the costs of investments for federal income tax purposes and accumulated net unrealized appreciation/(depreciation) on investments were as follows:
| | | Alerian MLP ETF | | | Alerian Energy Infrastructure ETF | |
| Cost of investments for income tax purposes | | $ | 4,952,386,087 | | | $ | 51,689,445 | |
| Gross appreciation (excess of value over tax cost) | | $ | 970,915,641 | | | $ | 8,117,463 | |
| Gross depreciation (excess of tax cost over value) | | | (2,042,218,619 | ) | | | (22,751,360 | ) |
| Net appreciation (depreciation) of foreign currency | | | – | | | | 751 | |
| Net unrealized appreciation/(depreciation) | | $ | (1,071,302,978 | ) | | $ | (14,633,146 | ) |
The difference between cost amounts for financial statement purposes is due primarily to the recognition of pass-through income from a Fund’s investments in master limited partnerships and wash sales.
Alerian Exchange Traded Funds
| Notes to Financial Statements | November 30, 2020 |
G. Lending of Portfolio Securities
The Alerian Energy Infrastructure ETF has entered into a securities lending agreement with State Street Bank & Trust Co. (“SSB”), the Fund’s lending agent. The Fund may lend its portfolio securities only to borrowers that are approved by SSB. The Fund will limit such lending to not more than 33 1/3% of the value of its total assets. The Fund’s securities held at SSB as custodian shall be available to be lent except those securities the Fund or ALPS Advisors, Inc. specifically identifies in writing as not being available for lending. The borrower pledges and maintains with the Fund collateral consisting of cash (U.S. Dollars only), securities issued or guaranteed by the U.S. government or its agencies or instrumentalities, and cash equivalents (including irrevocable bank letters of credit) issued by a person other than the borrower or an affiliate of the borrower. The initial collateral received by the Fund is required to have a value of no less than 102% of the market value of the loaned securities for U.S equity securities and a value of no less than 105% of the market value for non-U.S. equity securities. The collateral is maintained thereafter, at a market value equal to not less than 102% of the current value of the U.S. equity securities on loan and not less than 105% of the current value of the non-U.S. equity securities on loan. The market value of the loaned securities is determined at the close of each business day and any additional required collateral is delivered to the Fund on the next business day. During the term of the loan, the Fund is entitled to all distributions made on or in respect of the loaned securities. Loans of securities are terminable at any time and the borrower, after notice, is required to return borrowed securities within the customary time period for settlement of securities transactions.
Any cash collateral received is reinvested in a money market fund managed by SSB as disclosed in the Fund’s Schedule of Investments and is reflected in the Statements of Assets and Liabilities as a payable for collateral upon return of securities loaned. Non-cash collateral, in the form of securities issued or guaranteed by the U.S. government or its agencies or instrumentalities, is not disclosed in the Fund’s Statements of Assets and Liabilities as it is held by the lending agent on behalf of the Fund, and the Fund does not have the ability to re-hypothecate these securities. Income earned by the Fund from securities lending activity is disclosed in the Statement of Operations.
The following is a summary of the Fund's securities lending agreement and related cash and non-cash collateral received as of November 30, 2020:
| | | Market Value of Securities on Loan | | | Cash Collateral Received | | | Non-Cash Collateral Received | | | Total Collateral Received | |
| Alerian Energy Infrastructure ETF | | $ | 498,674 | | | $ | 542,809 | | | $ | – | | | $ | 542,809 | |
The risks of securities lending include the risk that the borrower may not provide additional collateral when required or may not return the securities when due. To mitigate these risks, the Fund benefits from a borrower default indemnity provided by SSB. SSB’s indemnity allows for full replacement of securities lent wherein SSB will purchase the unreturned loaned securities on the open market by applying the proceeds of the collateral, or to the extent such proceeds are insufficient or the collateral is unavailable, SSB will purchase the unreturned loan securities at SSB’s expense. However, the Fund could suffer a loss if the value of the investments purchased with cash collateral falls below the value of the cash collateral received.
The following table reflects a breakdown of transactions accounted for as secured borrowings, the gross obligation by the type of collateral pledged or securities loaned, and the remaining contractual maturity of those transactions as of November 30, 2020:
| Alerian Energy Infrastructure ETF | Remaining contractual maturity of the agreements |
| Securities Lending Transactions | | Overnight & Continuous | | | Up to 30 days | | | 30-90 days | | | Greater than 90 days | | | Total | |
| Common Stocks | | $ | 542,809 | | | $ | – | | | $ | – | | | $ | – | | | $ | 542,809 | |
| Total Borrowings | | | | | | | | | | | | | | | | | | | 542,809 | |
| Gross amount of recognized liabilities for securities lending (collateral received) | | | | | | | | | | | | | | | | | | $ | 542,809 | |
Alerian Exchange Traded Funds
| Notes to Financial Statements | November 30, 2020 |
3. INVESTMENT ADVISORY FEE AND OTHER AFFILIATED TRANSACTIONS
ALPS Advisors, Inc. (the “Adviser”) serves as the Funds’ investment adviser pursuant to an Investment Advisory Agreement with the Trust on behalf of each Fund (the “Advisory Agreement”). Pursuant to the Advisory Agreement, each Fund pays the Adviser an annual management fee for the services and facilities it provides, payable on a monthly basis as a percentage of the relevant Fund’s average daily net assets as set out below.
| Fund | | Advisory Fee |
| Alerian MLP ETF | 0.85% | up to and including $10 billion |
| | 0.80% | greater than $10 billion up to and including $15 billion |
| | 0.70% | greater than $15 billion up to and including $20 billion |
| | 0.55% | greater than $20 billion up to and including $25 billion |
| | 0.40% | greater than $25 billion |
| Fund | | Advisory Fee |
| Alerian Energy Infrastructure ETF | 0.65% | |
Out of the unitary management fees, the Adviser pays substantially all expenses of each Fund, including the cost of transfer agency, custody, fund administration, legal, audit, independent trustees and other services, except for interest expenses, distribution fees or expenses, brokerage expenses, taxes and extraordinary expenses not incurred in the ordinary course of each Fund's business. The Adviser’s unitary management fee is designed to pay substantially all of each Fund’s expenses and to compensate the Adviser for providing services for each Fund.
ALPS Fund Services, Inc., an affiliate of the Adviser, is the administrator of the Funds.
Effective July 1, 2020, each Trustee receives (1) a quarterly retainer of $10,000, (2) a per meeting fee of $5,000, (3) $1,500 for any special meeting held outside of a regularly scheduled board meeting, and (4) reimbursement for all reasonable out-of-pocket expenses relating to attendance at meetings. Prior to July 1, 2020, each Trustee who is not considered an "interested person" (as defined in the 1940 Act), received (1) a quarterly retainer of $5,000, (2) a per meeting fee of $3,750, (3) $1,500 for any special meeting held outside of a regularly scheduled board meeting, and (4) reimbursement for all reasonable out-of-pocket expenses relating to attendance at meetings. Prior to January 1, 2020, a Trustee who is considered an “interested person” (as defined in the 1940 Act) (“Interested Trustee”) received no compensation or expense reimbursements from the Trust. From January 1, 2020 to June 30, 2020, the Interested Trustee received (1) a quarterly retainer of $5,000, (2) a per meeting fee of $3,750, (3) $1,500 for any special meeting held outside of a regularly scheduled board meeting, and (4) reimbursement for all reasonable out-of-pocket expenses relating to attendance at meetings. In addition, the Chairman of the Board and Chairman of the Audit Committee each receives a quarterly retainer of $2,000, in connection with their respective roles.
4. PURCHASES AND SALES OF SECURITIES
For the year ended November 30, 2020, the cost of purchases and proceeds from sales of investment securities, excluding short-term investments and in-kind transactions, were as follows:
| Fund | | Purchases | | | Sales | |
| Alerian MLP ETF | | $ | 1,093,598,678 | | | $ | 3,147,072,446 | |
| Alerian Energy Infrastructure ETF | | | 13,729,478 | | | | 13,541,479 | |
For the year ended November 30, 2020, the cost of in-kind purchases and proceeds from in-kind sales were as follows:
| Fund | | Purchases | | | Sales | |
| Alerian MLP ETF | | $ | 1,141,431,917 | | | $ | – | |
| Alerian Energy Infrastructure ETF | | | 20,052,233 | | | | 18,757,069 | |
For the year ended November 30, 2020, the Alerian Energy Infrastructure ETF had in-kind net realized loss of $6,011,010.
Gains on in-kind transactions are not considered taxable for federal income tax purposes and losses on in-kind transactions are also not deductible for tax purposes.
Alerian Exchange Traded Funds
| Notes to Financial Statements | November 30, 2020 |
5. MASTER LIMITED PARTNERSHIPS
MLPs are publicly traded partnerships engaged in, among other things, the transportation, storage and processing of minerals and natural resources, and are treated as partnerships for U.S. federal income tax purposes. By confining their operations to these specific activities, their interests, or units, are able to trade on public securities exchanges exactly like the shares of a corporation, without entity level taxation. To qualify as a MLP and to not be taxed as a corporation, a partnership must receive at least 90% of its income from qualifying sources as set forth in Section 7704(d) of the Code. These qualifying sources include, among other things, natural resource-based activities such as the processing, transportation and storage of mineral or natural resources. MLPs generally have two classes of owners, the general partner and limited partners. The general partner of an MLP is typically owned by a major energy company, an investment fund, the direct management of the MLP, or is an entity owned by one or more of such parties. The general partner may be structured as a private or publicly traded corporation or other entity. The general partner typically controls the operations and management of the MLP through an up to 2% equity interest in the MLP plus, in many cases, ownership of common units and subordinated units. Limited partners typically own the remainder of the partnership, through ownership of common units, and have a limited role in the partnership’s operations and management.
MLPs are typically structured such that common units and general partner interests have first priority to receive quarterly cash distributions up to an established minimum amount (“minimum quarterly distributions” or “MQD”). Common and general partner interests also accrue arrearages in distributions to the extent the MQD is not paid. Once common and general partner interests have been paid, subordinated units receive distributions of up to the MQD; however, subordinated units do not accrue arrearages. Distributable cash in excess of the MQD is distributed to both common and subordinated units and generally on a pro rata basis. The general partner is also eligible to receive incentive distributions if the general partner operates the business in a manner which results in distributions paid per common unit surpassing specified target levels. As the general partner increases cash distributions to the limited partners, the general partner receives an increasingly higher percentage of the incremental cash distributions.
6. CAPITAL SHARE TRANSACTIONS
Shares are created and redeemed by each Fund only in Creation Unit size aggregations of 50,000 Shares. On May 18, 2020, Alerian MLP ETF reduced its Creation Unit size from 50,000 to 25,000 shares. Only broker-dealers or large institutional investors with creation and redemption agreements called Authorized Participants (“AP”) are permitted to purchase or redeem Creation Units from the Funds. Such transactions are generally permitted on an in-kind basis, with a balancing cash component to equate the transaction to the NAV per unit of each Fund on the transaction date. Cash may be substituted equivalent to the value of certain securities generally when they are not available in sufficient quantity for delivery, not eligible for trading by the AP or as a result of other market circumstances.
7. RELATED PARTY TRANSACTIONS
The Funds engaged in cross trades between other funds in the Trust during the year ended November 30, 2020 pursuant to Rule 17a-7 under the 1940 Act. Cross trading is the buying or selling of portfolio securities between funds to which the Adviser serves as the investment adviser. The Board previously adopted procedures that apply to transactions between the Funds of the Trust pursuant to Rule 17a-7. These transactions related to cross trades during the period complied with the requirements set forth by Rule 17a-7 and the Trust’s procedures.
Transactions related to cross trades during the year ended November 30, 2020, were as follows:
| Fund | | Purchase cost paid | | | Sale proceeds received | | | Realized gain/(loss) on sales | |
| Alerian MLP ETF | | $ | 2,130,047 | | | $ | 1,110,188 | | | $ | (760,605 | ) |
| Alerian Energy Infrastructure ETF | | $ | 1,242,703 | | | $ | 465,089 | | | $ | 17,039 | |
Alerian Exchange Traded Funds
| Notes to Financial Statements | November 30, 2020 |
8. AFFILIATED COMPANIES
As defined by the 1940 Act, an affiliated person, including an affiliated company, is one in which a Fund owns 5% or more of the outstanding voting securities, or a company which is under common ownership or control with the Fund.
For the year ended November 30, 2020, the Alerian MLP ETF held shares in the following affiliates, as defined by the 1940 Act.
| Security Name | | Share Balance as of November 30, 2020 | | | Market Value as of November 30, 2019 | | | Purchases | | | Purchases In-Kind | | | Sales | | | Corporate Action | | | Market Value as of November 30, 2020 | | | Dividends* | | | Change in Unrealized Gain (Loss) | | | Realized Gain/Loss | |
| Affiliated Investments as of November 30, 2020 | | | | | | | | | | | | | | | | | | | | | | |
| Crestwood Equity Partners LP | | | 6,225,119 | | | $ | 193,019,499 | | | $ | 17,167,890 | | | $ | 24,736,624 | | | $ | (48,339,051 | ) | | $ | – | | | $ | 101,531,691 | | | $ | – | | | $ | (16,113,601 | ) | | $ | (60,177,361 | ) |
| DCP Midstream LP | | | 11,142,291 | | | | 235,207,472 | | | | 22,575,766 | | | | 36,776,479 | | | | (73,261,196 | ) | | | – | | | | 179,947,999 | | | | – | | | | 70,307,440 | | | | (91,040,382 | ) |
| EnLink Midstream LLC | | | 32,176,270 | | | | 151,555,599 | | | | 16,338,772 | | | | 23,706,227 | | | | (48,015,233 | ) | | | – | | | | 119,052,199 | | | | – | | | | 100,816,312 | | | | (111,070,920 | ) |
| Genesis Energy LP | | | 13,405,732 | | | | 255,950,735 | | | | 19,819,075 | | | | 28,564,560 | | | | (63,267,573 | ) | | | – | | | | 86,198,857 | | | | – | | | | (56,153,499 | ) | | | (86,014,290 | ) |
| Holly Energy Partners LP | | | 5,634,473 | | | | – | | | | 91,365,397 | | | | 13,807,839 | | | | (28,296,139 | ) | | | – | | | | 76,290,764 | | | | – | | | | 7,058,595 | | | | (1,930,254 | ) |
| NGL Energy Partners LP | | | 14,704,054 | | | | 142,634,103 | | | | 16,190,070 | | | | 18,611,015 | | | | (38,681,176 | ) | | | – | | | | 32,054,838 | | | | – | | | | (49,100,520 | ) | | | (45,280,272 | ) |
| NuStar Energy LP | | | 12,165,747 | | | | 341,042,510 | | | | 37,172,775 | | | | 46,880,874 | | | | (95,913,047 | ) | | | – | | | | 161,682,778 | | | | – | | | | (76,688,855 | ) | | | (69,975,973 | ) |
| Plains All American Pipeline LP | | | 50,387,023 | | | | 677,150,858 | | | | 182,311,442 | | | | 105,022,530 | | | | (195,314,284 | ) | | | – | | | | 400,072,962 | | | | – | | | | (19,765,328 | ) | | | (310,913,912 | ) |
| TC PipeLines LP | | | 6,669,203 | | | | 260,040,764 | | | | 50,072,816 | | | | 54,630,860 | | | | (112,325,156 | ) | | | – | | | | 206,078,373 | | | | – | | | | 21,161,011 | | | | (50,898,840 | ) |
| Western Midstream Partners LP | | | 24,796,503 | | | | 440,612,042 | | | | 47,800,636 | | | | 66,609,951 | | | | (135,383,113 | ) | | | – | | | | 319,874,889 | | | | – | | | | 171,224,787 | | | | (234,279,019 | ) |
| | | | | | | | | | | | | | | | | | | | | | | | | | | $ | 1,682,785,350 | | | $ | – | | | $ | 152,746,342 | | | $ | (1,061,581,223 | ) |
| | | | | | | | | | | | | | | | | | | | | | | | | | | | | | | | | | | | | | | | | |
| Investments no longer affiliated as of November 30, 2020 | | | | | | | | | | | | | | | | | | | | | | |
| CNX Midstream Partners LP** | | | – | | | $ | – | | | $ | 50,898,129 | | | $ | 4,698,549 | | | $ | (13,695,940 | ) | | $ | (44,831,628 | ) | | $ | – | | | $ | – | | | $ | – | | | $ | 11,772,872 | |
| EQM Midstream Partners LP | | | – | | | | 237,295,022 | | | | 16,636,772 | | | | 22,531,333 | | | | (269,751,944 | ) | | | – | | | | – | | | | – | | | | 247,504,280 | | | | (239,412,073 | ) |
| Magellan Midstream Partners LP | | | 9,116,142 | | | | 731,291,774 | | | | 15,917,123 | | | | 119,710,782 | | | | (282,645,274 | ) | | | – | | | | 375,129,243 | | | | – | | | | (110,656,121 | ) | | | (57,089,914 | ) |
| Noble Midstream Partners LP | | | 4,166,781 | | | | 55,449,095 | | | | 42,881,500 | | | | 10,083,142 | | | | (18,477,835 | ) | | | – | | | | 39,709,423 | | | | – | | | | 1,854,915 | | | | (47,197,500 | ) |
| Shell Midstream Partners LP | | | 15,235,191 | | | | 299,598,190 | | | | 42,350,022 | | | | 49,156,678 | | | | (105,147,890 | ) | | | – | | | | 156,313,060 | | | | – | | | | (30,443,676 | ) | | | (72,342,790 | ) |
| Tallgrass Energy LP | | | – | | | | 346,315,139 | | | | 316,677 | | | | 27,153,968 | | | | (314,114,111 | ) | | | – | | | | - | | | | – | | | | 29,309,172 | | | | (88,980,845 | ) |
| | | | | | | | | | | | | | | | | | | | | | | | | | | $ | 571,151,726 | $ | | | – | | | $ | 137,568,570 | | | $ | (493,250,250 | ) |
| | | | | | | | | | | | | | | | | | | | | | | | | | | | | | | | | | | | | | | | | |
| GRAND TOTAL | | | | | | | | | | | | | | | | | | | | | | | | | | | | | | $ | – | | | $ | 290,314,912 | | | $ | (1,554,831,473 | ) |
| * | 100% of the income received was estimated as Return of Capital. |
| ** | On September 28, 2020 CNX Midstream Partners LP and CNX Resources Corporation merged. |
9. MARKET DISRUPTIONS RISK
The Funds are subject to investment and operational risks associated with financial, economic and other global market developments and disruptions, including the recent spread of an infectious respiratory illness caused by a novel strain of coronavirus (known as COVID-19), which can negatively impact the securities markets and cause each Fund to lose value.
The spread of COVID-19 has caused volatility, severe market dislocations and liquidity constraints in many markets, including markets for the securities each Fund holds, and may adversely affect each Fund’s investments and operations. The transmission of COVID-19 and efforts to contain its spread have resulted in travel restrictions and disruptions, closed international borders, enhanced health screenings at ports of entry and elsewhere, disruption of and delays in healthcare service preparation and delivery, quarantines, event and service cancellations or interruptions, disruptions to business operations and supply chains, and a reduction in consumer and business spending, as well as general concern and uncertainty that has negatively affected the economy. These disruptions have led to instability in the market place and the jobs market. The impact of COVID-19 could adversely affect the economies of many nations or the entire global economy, the financial well-being and performance of individual issuers, borrowers and sectors and the health of the markets generally in potentially significant and unforeseen ways.
Alerian Exchange Traded Funds
| Notes to Financial Statements | November 30, 2020 |
The foregoing could lead to a significant economic downturn or recession, increased market volatility, a greater number of market closures, higher default rates and adverse effects on the values and liquidity of each Fund’s securities or other assets. Such impacts may adversely affect the performance of the Funds.
10. SUBSEQUENT EVENTS
Subsequent events, if any, after the date of the Statements of Assets and Liabilities have been evaluated through the date the financial statements were issued. Management has determined that there were no subsequent events to report through the issuance of these financial statements.
Alerian Exchange Traded Funds
| Additional Information | November 30, 2020 (Unaudited) |
PROXY VOTING RECORDS, POLICIES AND PROCEDURES
Information regarding how each Fund voted proxies relating to portfolio securities during the most recent 12-month period ended June 30 and a description of the Funds’ proxy voting policies and procedures used in determining how to vote for proxies are available without charge on the SEC’s website at www.sec.gov and upon request, by calling (toll-free) 1-866-675-2639.
PORTFOLIO HOLDINGS
The Fund files a complete schedule of portfolio holdings with the U.S. Securities and Exchange Commission (“SEC”) for the first and third quarters of each fiscal year as an exhibit to its reports on Form N-PORT within 60 days after the end of the period. Copies of the Fund’s Form N-PORT are available without a charge, upon request, by contacting the Fund at 1-866-759-5679 and on the SEC’s website at https://www.sec.gov.
TAX INFORMATION
The Fund designates the following as a percentage of taxable ordinary income distributions, or up to the maximum amount allowable, for the calendar year ended December 31, 2019:
| | Qualified Dividend Income | Dividend Received Deduction |
| Alerian Energy Infrastructure ETF | 100.00% | 37.15% |
In early 2020, if applicable, shareholders of record received this information for the distribution paid to them by the Fund during the calendar year 2019 via Form 1099. The Fund will notify shareholders in early 2021 of amounts paid to them by the Fund, if any, during the calendar year 2020.
LICENSING AGREEMENTS
Alerian (the “Licensor”) has entered into an index licensing agreement with ALPS Advisors Inc. (the “Adviser”) with respect to each of the Alerian MLP ETF and the Alerian Energy Infrastructure ETF, to allow the Adviser’s use of AMZI and AMEI. The following disclosure relates to the Licensor:
Alerian is the designer of the construction and methodology for the underlying index (each an “Underlying Index”) for each of the Alerian MLP ETF and the Alerian Energy Infrastructure ETF (each a “Fund” and collectively, the “Funds”). “Alerian,” “Alerian MLP Infrastructure Index,” “Alerian Energy Infrastructure Index,” “Alerian Index Series” and “AMZI” are service marks or trademarks of Alerian. Alerian acts as brand licensor for each Underlying Index. Alerian is not responsible for the descriptions of either Underlying Index or the Funds that appear herein. Alerian is not affiliated with the Trust, the Adviser or the Distributor.
Neither Fund is issued, sponsored, endorsed, sold or promoted by Alerian (“Licensor”) or its affiliates. Licensor makes no representation or warranty, express or implied, to the owners of the Fund or any member of the public regarding the advisability of investing in securities generally or in the Fund particularly or the ability of the Alerian MLP Infrastructure Index (“Index”) to track general market performance. Licensor’s only relationship to the Licensee is the licensing of the Index which is determined, composed and calculated by Licensor without regard to the Licensee or the Fund. Licensor has no obligation to take the needs of the Licensee or the owners of the Fund into consideration in determining, composing or calculating the Index. Licensor is not responsible for and has not participated in the determination of the timing of, prices at, or quantities of the Fund to be issued or in the determination or calculation of the equation by which the Fund is to be converted into cash. Licensor has no obligation or liability in connection with the issuance, administration, marketing or trading of either Fund and is not responsible for and has not participated in the determination of pricing or the timing of the issuance or sale of the Shares of either Fund or in the determination or calculation of the NAV of the relevant Fund. Alerian MLP Infrastructure Index, Alerian MLP Infrastructure Total Return Index, AMZI and AMZIX are trademarks of GKD Index Partners, LLC and their general use is granted under a license from GKD Index Partners, LLC.
LICENSOR DOES NOT GUARANTEE THE QUALITY, ACCURACY AND/OR THE COMPLETENESS OF THE INDEX OR ANY DATA INCLUDED THEREIN AND SHALL HAVE NO LIABILITY FOR ERRORS OR OMISSIONS OF ANY KIND RELATED TO THE INDEX OR DATA. LICENSOR MAKES NO WARRANTY, EXPRESS OR IMPLIED, AS TO RESULTS TO BE OBTAINED BY LICENSEE, OWNERS OF THE FUND, OR ANY OTHER PERSON OR ENTITY FROM THE USE OF THE INDEX OR ANY DATA INCLUDED THEREIN IN CONNECTION WITH THE RIGHTS LICENSED TO LICENSEE OR FOR ANY OTHER USE. LICENSOR MAKES NO EXPRESS OR IMPLIED WARRANTIES, AND HEREBY EXPRESSLY DISCLAIMS ALL WARRANTIES OF MERCHANTABILITY OR FITNESS FOR A PARTICULAR PURPOSE OR USE WITH RESPECT TO THE INDEX OR ANY DATA INCLUDED THEREIN. WITHOUT LIMITING ANY OF THE FOREGOING, IN NO EVENT SHALL LICENSOR HAVE ANY LIABILITY FOR ANY SPECIAL, PUNITIVE, INDIRECT, OR CONSEQUENTIAL DAMAGES (INCLUDING LOST PROFITS), EVEN IF NOTIFIED OF THE POSSIBILITY OF SUCH DAMAGES.
Alerian Exchange Traded Funds
| Additional Information | November 30, 2020 (Unaudited) |
The Adviser does not guarantee the accuracy and/or the completeness of either Underlying Index or any data included therein, and the Adviser shall have no liability for any errors, omissions or interruptions therein. The Adviser makes no warranty, express or implied, as to results to be obtained by either Fund, owners of the Shares of the relevant Fund or any other person or entity from the use of either Underlying Index or any data included therein. The Adviser makes no express or implied warranties, and expressly disclaims all warranties of merchantability or fitness for a particular purpose or use with respect to either Underlying Index or any data included therein. Without limiting any of the foregoing, in no event shall the Adviser have any liability for any special, punitive, direct, indirect, or consequential damages (including lost profits) arising out of matters relating to the use of either Underlying Index, even if notified of the possibility of such damages.
(Applicable to the Alerian Energy Infrastructure ETF only)
The Underlying Index is the exclusive property of GKD Index Partners LLC d/b/a Alerian, which has contracted with S&P Opco, LLC (a subsidiary of S&P Dow Jones Indices LLC) (“S&P Dow Jones Indices”) to calculate and maintain the Underlying Index. S&P® is a registered trademark of Standard & Poor’s Financial Services LLC (“SPFS”); Dow Jones® is a registered trademark of Dow Jones Trademark Holdings LLC (“Dow Jones”); and these trademarks have been licensed to S&P Dow Jones Indices. “Calculated by S&P Dow Jones Indices” and its related stylized mark(s) have been licensed for use by Alerian.
The Fund is not sponsored, endorsed, sold or promoted by S&P Dow Jones Indices, SPFS, Dow Jones or any of their affiliates (collectively, “S&P Dow Jones Indices Entities”). S&P Dow Jones Indices Entities do not make any representation or warranty, express or implied, to the owners of the Fund or any member of the public regarding the advisability of investing in securities generally or in the Fund particularly or the ability of the Underlying Index to track general market performance. S&P Dow Jones Indices Entities only relationship to Alerian with respect to the Underlying Index is the licensing of certain trademarks, service marks and trade names of S&P Dow Jones Indices Entities and for the providing of calculation and maintenance services related to the Underlying Index. S&P Dow Jones Indices Entities are not responsible for and have not participated in the determination of the prices and amount of the Fund or the timing of the issuance or sale of the Fund or in the determination or calculation of the equation by which the Fund is to be converted into cash. S&P Dow Jones Indices Entities have no obligation or liability in connection with the administration, marketing or trading of the Fund. S&P Dow Jones Indices LLC is not an investment advisor. Inclusion of a security within the Underlying Index is not a recommendation by S&P Dow Jones Indices Entities to buy, sell, or hold such security, nor is it considered to be investment advice.
S&P DOW JONES INDICES ENTITIES DO NOT GUARANTEE THE ADEQUACY, ACCURACY, TIMELINESS AND/OR THE COMPLETENESS OF THE UNDERLYING INDEX OR ANY DATA RELATED THERETO OR ANY COMMUNICATION, INCLUDING BUT NOT LIMITED TO, ORAL OR WRITTEN COMMUNICATION (INCLUDING ELECTRONIC COMMUNICATIONS) WITH RESPECT THERETO. S&P DOW JONES INDICES ENTITIES SHALL NOT BE SUBJECT TO ANY DAMAGES OR LIABILITY FOR ANY ERRORS, OMISSIONS, OR DELAYS THEREIN. S&P DOW JONES INDICES ENTITIES MAKE NO EXPRESS OR IMPLIED WARRANTIES, AND EXPRESSLY DISCLAIMS ALL WARRANTIES, OF MERCHANTABILITY OR FITNESS FOR A PARTICULAR PURPOSE OR USE OR AS TO RESULTS TO BE OBTAINED BY ALERIAN, OWNERS OF THE FUND, OR ANY OTHER PERSON OR ENTITY FROM THE USE OF THE UNDERLYING INDEX OR WITH RESPECT TO ANY DATA RELATED THERETO. WITHOUT LIMITING ANY OF THE FOREGOING, IN NO EVENT WHATSOEVER SHALL S&P DOW JONES INDICES ENTITIES BE LIABLE FOR ANY INDIRECT, SPECIAL, INCIDENTAL, PUNITIVE, OR CONSEQUENTIAL DAMAGES INCLUDING BUT NOT LIMITED TO, LOSS OF PROFITS, TRADING LOSSES, LOST TIME OR GOODWILL, EVEN IF THEY HAVE BEEN ADVISED OF THE POSSIBILITY OF SUCH DAMAGES, WHETHER IN CONTRACT, TORT, STRICT LIABILITY, OR OTHERWISE.
Alerian Exchange Traded Funds
| Board Considerations Regarding Approval of | November 30, 2020 (Unaudited) |
| Investment Advisory Agreements | |
At a meeting held on June 24, 2020 via electronic means (video-conference), the Board of Trustees of the Trust (the “Board” or the “Trustees”), including the Trustees who are not “interested persons” of the Trust within the meaning of the Investment Company Act of 1940, as amended (the “Independent Trustees”), evaluated a proposal to approve the continuance of the Investment Advisory Agreements between the Trust and ALPS Advisors, Inc. (the “Adviser” or “AAI”) with respect to the Alerian MLP ETF (“AMLP”) and the Alerian Energy Infrastructure ETF (“ENFR”) (each “a Fund” and collectively the “Funds”). The Independent Trustees also met separately to consider each Investment Advisory Agreement.
In evaluating the Investment Advisory Agreements with respect to each Fund, the Board, including the Independent Trustees considered various factors, including (i) the nature, extent and quality of the services provided by AAI with respect to the applicable Fund under the Investment Advisory Agreements; (ii) the advisory fees and other expenses paid by the Fund compared to those of similar funds managed by other investment advisers; (iii) the costs of the services provided to the Fund by AAI and the profits realized by AAI and its affiliates from its relationship to the Fund; (iv) the extent to which economies of scale have been or would be realized if and as the assets of the Fund grow and whether fees reflect the economies of scale for the benefit of shareholders; and (v) any additional benefits and other considerations.
With respect to the nature, extent and quality of the services provided by AAI under the Investment Advisory Agreements, the Board considered and reviewed information concerning the services provided under the Investment Advisory Agreements, the investment parameters of the index of each Fund, financial information regarding AAI and its parent company, information describing AAI’s current organization and the background and experience of the persons responsible for the day-to-day management of the Funds.
The Board reviewed information on the performance of each Fund and its applicable benchmark. The Board also evaluated the correlation and tracking error between each underlying index and its corresponding Fund’s performance. Based on this review, the Board, including the Independent Trustees found that the nature and extent of services provided to each Fund under the Investment Advisory Agreements was appropriate and that the quality was satisfactory.
The Board noted that the advisory fees for each Fund were unitary fees pursuant to which AAI assumes all expenses of the Funds (including the cost of transfer agency, custody, fund administration, legal, audit and other services) other than the payments under the Advisory Agreement, brokerage expenses, taxes, interest, litigation expenses and other extraordinary expenses.
With respect to advisory fee rates, the Board, including the Independent Trustees, noted the following:
The gross management fee rate for each of these Funds is higher than the median of its FUSE expense group. The Funds’ respective net expense ratios are higher than the median of their respective FUSE expense group.
With respect to AMLP, the Board took into account, among other things, supplemental information provided by the Adviser showing AMLP’s total expenses were in line with the total expenses of peer groups deemed by the Adviser to be more comparable, including peer groups comprised of (i) the master limited partnership (“MLP”) asset class as a whole and (ii) exchange-traded products focused solely on MLP investments. The Board also considered the brand recognition of AMLP’s index provider, the additional costs and expenses incurred by AAI in managing and administering the Fund and that AMLP’s investment advisory fee schedule included breakpoints.
The Board also took into account, among other things, the brand recognition of the Funds’ index provider and the fees charged by the index provider for licensing its indexes.
Based on the foregoing, and the other information available to them, the Board, including the Independent Trustees, concluded that the advisory fee rate for each of the Funds was reasonable under the circumstances and in light of the quality of services provided.
The Board, including the Independent Trustees, considered other benefits available to AAI because of its relationship with the Funds and concluded that the advisory fees were reasonable taking into account any such benefits.
The Board, including the Independent Trustees, also considered with respect to each Fund the information provided by AAI about the costs and profitability of AAI with respect to each of the Funds, including the asset levels and other factors that influence the profitability and financial viability of the Funds. The Board, including the Independent Trustees, reviewed and noted the relatively small size of ENFR and concluded that AAI was not realizing any economies of scale. With respect to AMLP, the Independent Trustees noted that the Fund’s asset levels have decreased over the prior year and the Fund’s asset levels have not yet recovered to its historic highs. The Independent Trustees determined that AAI should continue to keep the Board informed on an ongoing basis of any significant developments (e.g., material increases in asset levels) so as to facilitate the Independent Trustees’ evaluation of whether further economies of scale have been achieved.
Alerian Exchange Traded Funds
| Board Considerations Regarding Approval of | November 30, 2020 (Unaudited) |
| Investment Advisory Agreements | |
With respect to AMLP, the Board considered, among other things the brand recognition of AMLP’s index provider as well as the trading volumes of the Fund and the narrow trading spreads. The Board considered the breakpoint schedule adopted previously and whether the breakpoints would benefit shareholders and appropriately reflect economies of scale achieved by AAI with respect to AMLP should AMLP’s assets increase, noting that AMLP’s assets were well below historical highs on account of market events related to COVID-19. Upon discussion, the Board, including the Independent Trustees determined that the advisory fee rate for the Fund reflects an appropriate sharing of economies of scale.
In voting to renew each Investment Advisory Agreement, the Board, including the Independent Trustees, concluded that the terms of each Investment Advisory Agreement are reasonable and fair in light of the services to be performed, the fees paid by certain other funds, expenses to be incurred and such other matters as the members of the Board, including the Independent Trustees, considered relevant in the exercise of their reasonable business judgment. The Board, including the Independent Trustees, did not identify any single factor or group of factors as all important or controlling and considered all factors together.
Alerian Exchange Traded Funds
| Trustees & Officers | November 30, 2020 (Unaudited) |
The general supervision of the duties performed by the Adviser for the Fund under the Investment Advisory Agreement is the responsibility of the Board of Trustees. The Trust currently has four Trustees. Three Trustees have no affiliation or business connection with the Adviser or any of its affiliated persons and do not own any stock or other securities issued by the Adviser. These are the “non-interested” or “independent” Trustees (“Independent Trustees”). The other Trustee (the “Interested Trustee”) is affiliated with the Adviser.
The Independent Trustees of the Trust, their term of office and length of time served, their principal business occupations during the past five years, the number of portfolios in the Fund Complex overseen by each Independent Trustee, and other directorships, if any, held by the Trustee are shown below.
INDEPENDENT TRUSTEES
| Name, Address & Year of Birth* | Position(s) Held with Trust | Term of Office and Length of Time Served** | Principal Occupation(s) During Past 5 Years | Number of Portfolios in Fund Complex Overseen by Trustees*** | Other Directorships Held by Trustees |
| Mary K. Anstine, 1940 | Trustee | Since March 2008 | Ms. Anstine was formerly an Executive Vice President of First Interstate Bank of Denver until 1994, President/Chief Executive Officer of HealthONE Alliance, Denver, Colorado, from 1994 to 2004, and has been retired since 2004. Ms. Anstine is also Trustee/Director of the following: AV Hunter Trust and Colorado Uplift Board. Ms. Anstine was formerly a Director of the Trust Bank of Colorado (later purchased and now known as Northern Trust Bank), HealthONE and Denver Area Council of the Boy Scouts of America and a member of the American Bankers Association Trust Executive Committee. | 35 | Ms. Anstine is a Trustee of ALPS Variable Investment Trust (7 funds); Financial Investors Trust (31 funds); Reaves Utility Income Fund; and Segall Bryant & Hamill Trust (14 funds). |
| Jeremy W. Deems, 1976 | Trustee | Since March 2008 | Mr. Deems is the Co-Founder, Chief Compliance Officer and Chief Financial Officer of Green Alpha Advisors, LLC. Mr. Deems is Co-Portfolio Manager of the Shelton Green Alpha Fund. Prior to joining Green Alpha Advisors, Mr. Deems was CFO and Treasurer of Forward Management, LLC, ReFlow Management Co., LLC, ReFlow Fund, LLC, a private investment fund, and Sutton Place Management, LLC, an administrative services company. | 35 | Mr. Deems is a Trustee of ALPS Variable Investment Trust (7 funds); Financial Investors Trust (31 funds); and Reaves Utility Income Fund; and Clough Funds Trust (1 fund). |
| Rick A. Pederson, 1952 | Trustee | Since March 2008 | Mr. Pederson is Partner, Bow River Capital Partners (private equity management), 2003 - present; Board Member, Prosci Inc. (private business services) 2013-2016; Advisory Board Member, Citywide Banks (Colorado community bank) 2014- 2017; Board Member, Strong-Bridge Consulting, 2015-2019; Board Member, IRI/ODMS Holdings LLC, 2017 – 2019; Director, National Western Stock Show (not for profit) 2010 - present; Director, History Colorado (not for profit) 2015-present; Director, Citywide Bank Advisory Board 2017-present; Trustee, Boettcher Foundation, 2018-present. | 18 | Mr. Pederson is Trustee of Segall Bryant & Hamill Trust (14 funds) and Principal Real Estate Income Fund (1 fund). |
| * | The business address of the Trustee is c/o ALPS Advisors, Inc., 1290 Broadway, Suite 1000, Denver, Colorado 80203. |
| ** | This is the period for which the Trustee began serving the Trust. Each Trustee serves an indefinite term, until his successor is elected. |
| *** | The Fund Complex includes all series of the Trust and any other investment companies for which ALPS Advisors, Inc. provides investment advisory services. |
Alerian Exchange Traded Funds
| Trustees & Officers | November 30, 2020 (Unaudited) |
The Trustee who is an “interested person” of the Trust, his term of office and length of time served, his principal business occupations during the past five years, the number of portfolios in the Fund Complex overseen by the Interested Trustee and the other directorships, if any, held by the Trustee, are shown below.
INTERESTED TRUSTEE
| Name, Address and Year of Birth of Interested Trustee* | Position(s) Held with Trust | Term of Office and Length of Time Served** | Principal Occupation(s) During Past 5 Years | Number of Portfolios in Fund Complex Overseen by Trustees*** | Other Directorships Held by Trustees |
| Edmund J. Burke, 1961 | Trustee | Since December 2017. | Mr. Burke joined ALPS in 1991 and served as the President and Director of ALPS Holdings, Inc., and ALPS Advisors, Inc. (“AAI”), and Director of ALPS Distributors, Inc. (“ADI”), ALPS Fund Services, Inc. (“AFS”), and ALPS Portfolio Solutions Distributor, Inc. (“APSD”). Mr. Burke retired from ALPS in June 2019. | 30 | Mr. Burke is a Trustee of Clough Global Dividend and Income Fund (1 fund); Clough Global Equity Fund (1 fund); Clough Global Opportunities Fund (1 fund); Clough Funds Trust (1 fund); Liberty All-Star Equity Fund (1 fund); Director of the Liberty All- Star Growth Fund, Inc. (1 fund) and Financial Investors Trust (31 funds). |
| * | The business address of the Trustee is c/o ALPS Advisors, Inc., 1290 Broadway, Suite 1000, Denver, Colorado 80203. |
| ** | This is the period for which the Trustee began serving the Trust. Each Trustee serves an indefinite term, until his successor is elected. |
| *** | The Fund Complex includes all series of the Trust and any other investment companies for which ALPS Advisors, Inc. provides investment advisory services. |
Alerian Exchange Traded Funds
| Trustees & Officers | November 30, 2020 (Unaudited) |
| OFFICERS | | | |
| Name, Address and Year of Birth of Officer* | Position(s) Held with Trust | Length of Time Served** | Principal Occupation(s) During Past 5 Years |
| Bradley Swenson, 1972 | President | Since June 2019 | Mr. Swenson joined ALPS in 2004 and currently serves as President of AFS (since 2019) and also Chief Operating Officer of AFS (since 2015). He also currently serves as President of Clough Global Opportunities Fund, Clough Global Dividend and Income Fund, Clough Global Equity Fund, Clough Funds Trust, Financial Investors Trust, Reaves Utility Income Fund and ALPS Series Trust. From 2004-2015, Mr. Swenson served as Chief Compliance Officer to ALPS, its affiliated entities, and to certain investment companies. Mr. Swenson is registered with FINRA, holding a Series 6, 26 and 27. |
| Matthew Sutula, 1985 | Chief Compliance Officer (“CCO”) | Since December 2019 | Mr. Sutula joined ALPS in 2012 and currently serves as Chief Compliance Officer of AAI. Prior to his current role, Mr. Sutula served as interim Compliance Officer of the Trust (September 2019 to December 2019). Compliance Manager and Senior Compliance Analyst for AAI, as well as Compliance Analyst for AFS. Prior to joining ALPS, he spent seven years at Morningstar, Inc. in various analyst roles supporting the registered investment company databases. Mr. Sutula is also Chief Compliance Officer of Principal Real Estate Income Fund, ALPS Variable Investment Trust, RiverNorth Opportunities Fund, Inc., Liberty All-Star Equity Fund and Liberty All- Star Growth Fund, Inc. |
| Kathryn Burns, 1976 | Treasurer | Since September 2018 | Ms. Burns serves as Vice President, Director of Fund Operations of AAI since 2018. From 2013 to 2018, she served as Vice President and Fund Controller at AFS. Prior to joining ALPS, she worked at Old Mutual Capital where she served as Vice President and Chief Compliance Officer (2010 – 2012) and Regulatory Reporting Manager and Assistant Treasurer to the Old Mutual Funds Trusts (2006 – 2012). She also served as a CPA for PricewaterhouseCoopers LLP. Ms. Burns also serves as Treasurer of Boulder Growth & Income Fund, Inc. and as President of ALPS Variable Investment Trust, Principal Real Estate Income Fund and RiverNorth Opportunities Fund, Inc. |
| Richard C. Noyes,*** 1970 | Secretary | Since September 2019 | Mr. Noyes joined ALPS in 2015 and is Senior Vice President and General Counsel of ALPS. Prior to joining ALPS, Mr. Noyes served as Assistant Vice President and Senior Counsel of Janus Capital Management LLC. |
| Sharon Akselrod,*** 1974 | Assistant Secretary | Since December 2016 | Ms. Akselrod joined ALPS in August 2014 and is currently Senior Investment Company Act Paralegal of AFS. Prior to joining ALPS, Ms. Akselrod served as Corporate Governance and Regulatory Associate for Nordstrom fsb (2013-2014) and Senior Legal Assistant – Legal Manager for AXA Equitable Life Insurance Company (2008-2013). Ms. Akselrod is also Secretary of Principal Real Estate Income Fund and Assistant Secretary of Financial Investors Trust and Clough Funds Trust. |
| Cara Owen,*** 1981 | Assistant Secretary | Since March 2020 | Vice President and Principal Legal Counsel, ALPS Fund Services, Inc.; Vice President and Secretary, Boulder Growth & Income Fund, Inc.; Assistant Secretary, James Advantage Funds (since August 2019). Prior to joining ALPS, Ms. Owen was Senior Counsel, Corporate & Investments, Great-West Life & Annuity Insurance Company; Senior Counsel & Assistant Secretary, Great-West Funds, Inc., Great-West Capital Management, LLC, Great-West Trust Company, LLC, and Advised Assets Group, LLC (2014-2019). |
| * | The business address of each Officer is c/o ALPS Advisors, Inc., 1290 Broadway, Suite 1000, Denver, Colorado 80203. Each Officer is deemed an affiliate of the Trust as defined under the 1940 Act. |
| ** | This is the period for which the Officer began serving the Trust. Each Officer serves an indefinite term, until his/her successor is elected. |
| *** | Effective December 7, 2020, Mr. Noyes and Ms. Akselrod resigned from their respective positions held with the Trust. As of the same date, Ms. Owen was appointed to the position of Secretary and Jen Craig as Assistant Secretary. |
The Statement of Additional Information includes additional information about the Fund’s Trustees and is available, without charge, upon request by calling (toll-free) 1-866-759-5679.
Intentionally Left Blank


Table of Contents
| Performance Overview | 1 |
| Disclosure of Fund Expenses | 4 |
| Report of Independent Registered Public Accounting Firm | 5 |
| Financial Statements | |
| Schedule of Investments | 6 |
| Statement of Assets and Liabilities | 7 |
| Statement of Operations | 8 |
| Statements of Changes in Net Assets | 9 |
| Financial Highlights | 10 |
| Notes to Financial Statements | 11 |
| Additional Information | 17 |
| Board Considerations Regarding Approval of Investment Advisory Agreement | 18 |
| Trustees and Officers | 19 |
Beginning on January 1, 2021, as permitted by regulations adopted by the U.S. Securities and Exchange Commission, paper copies of the Fund’s annual and semi-annual shareholder reports will no longer be sent by mail, unless you specifically request paper copies of the reports from your financial intermediary (such as a broker-dealer or bank). Instead, the reports will be made available on the Fund’s website (www.alpsfunds.com), and you will be notified by mail each time a report is posted and provided with a website link to access the report.
If you already elected to receive shareholder reports electronically, you will not be affected by this change and you need not take any action. You may elect to receive shareholder reports and other communications from a Fund electronically anytime by contacting your financial intermediary.
You may elect to receive all future reports in paper free of charge. You can contact your financial intermediary to request that you continue to receive paper copies of your shareholder reports. Your election to receive reports in paper will apply to all funds held in your account with your financial intermediary.
alpsfunds.com
ALPS Equal Sector Weight ETF
| Performance Overview | November 30, 2020 (Unaudited) |
Investment Objective
The ALPS Equal Sector Weight ETF (the “Fund”) seeks investment results that replicate as closely as possible, before fees and expenses, the performance of the NYSE Equal Sector Weight IndexSM (the “Underlying Index”).
The Underlying Index is an index of ETFs comprised of all active Select Sector SPDR® ETFs in an equal weighted portfolio. These are the Communication Services Select Sector SPDR® Fund, Consumer Discretionary Select Sector SPDR® Fund, Consumer Staples Select Sector SPDR® Fund, Materials Select Sector SPDR® Fund, Energy Select Sector SPDR® Fund, Technology Select Sector SPDR® Fund, Utilities Select Sector SPDR® Fund, Financial Select Sector SPDR® Fund, Industrial Select Sector SPDR® Fund, Health Care Select Sector SPDR® Fund and Real Estate Select Sector SPDR® Fund (each, an “Underlying Sector ETF” and collectively, the “Underlying Sector ETFs”). In order to track the Underlying Index, the Fund will use a “fund of funds” approach, and seek to achieve its investment objective by investing at least 90% of its total assets in the shares of the Underlying Sector ETFs.
The Underlying Index is designed to track performance of the equally weighted Underlying Sector ETFs. Accordingly, the Underlying Index is rebalanced to an equal weighting quarterly during the months of March, June, September, and December.
Each Underlying Sector ETF is an “index fund” that invests in the equity securities of companies in a particular sector or group of industries. The objective of each Underlying Sector ETF is to track its respective underlying sector index by replicating the securities in the underlying sector index. Together, the ten Underlying Sector ETFs represent the Underlying Index as a whole.
Performance Overview
For the twelve month period ended November 30, 2020, the Fund generated a total return of 10.37%, compared with the Fund’s Underlying Index, net of fees, which returned 10.64%. The Fund underperformed the S&P 500® Total Return Index (the "S&P 500"), which returned 17.46% for the same period.
The S&P 500 returned 17.46% for the trailing twelve-month period ended November 30, 2020, finishing at an all-time high. U.S. equity markets ended 2019 with solid gains in December 2019, before posting monthly losses in January, February, and March 2020. Global markets plummeted from mid-February through the majority of March due to the spread of the novel coronavirus ("COVID-19"). The spread of COVID-19 prompted shutdowns from global governments, causing global markets to weaken swiftly. The U.S., along with a number of other governments, introduced stimulus measures in late March in order to restart economic growth. These stimulus measures propelled the S&P 500 to climb for five consecutive months from lows seen in April. The S&P 500 fluctuated in September and October over uncertainty in the U.S. election, which ultimately saw Joe Biden win in November. Congress continued to grapple over secondary stimulus measures to combat COVID-19 related economic downfall, but were unable to agree before November 30, 2020. Despite the lack of additional stimulus relief, equity markets rallied in November on news that three COVID-19 vaccine candidates undergoing clinical trials showed high efficacy. Two vaccines were approved for emergency use in the U.K, which prompted investor optimism and drove markets higher into the end of November 2020.
Compared to the S&P 500, the Fund experienced a negative impact (-5.73%) from allocation effect during the period. This impact was largely driven by relative underweight to Information Technology (average weight for the period of 9.55% vs. 26.09% in the S&P 500).
The best performing Fund holdings for the period were the Technology Select Sector SPDR® (XLK), which increased 41.95% and the Consumer Discretionary Select Sector SPDR® (XLY), which saw a gain of 30.05%. The worst performing Fund holdings for the period were the Energy Select Sector SPDR® (XLE) which returned -31.53% and the Financial Select Sector SPDR® (XLF) which returned -5.09%.
Looking forward, the Fund's adviser believes the Fund’s strategy of holding each of the ten sectors (with Information Technology and Telecommunication Service combined) in the S&P 500 via the Select SPDR® Funds can result in a diversified core holding, and potential for market participation in all economic cycles through equal sector weighting.
ALPS Equal Sector Weight ETF
| Performance Overview | November 30, 2020 (Unaudited) |
Performance (as of November 30, 2020)
| | 1 Year | 5 Year | 10 Year | Since Inception^ |
| ALPS Equal Sector Weight ETF - NAV | 10.37% | 11.07% | 12.08% | 13.56% |
| ALPS Equal Sector Weight ETF - Market Price* | 10.49% | 11.10% | 12.09% | 13.58% |
| NYSE® Equal Sector Weight Total Return Index | 10.64% | 11.25% | 12.35% | 13.84% |
| S&P 500® Total Return Index | 17.46% | 13.99% | 14.19% | 15.36% |
Total Expense Ratio (per the current Prospectus) is 0.50%. Net Expense Ratio (per the current Prospectus) is 0.28%. Net expense ratio reflects the reimbursement of distribution fees for underlying sector ETFs. In addition, the Adviser has contractually agreed, through March 31, 2021, to reduce its advisory fee by 0.19%. This fee waiver may only be terminated by the Fund’s Board of Trustees (and not by the Adviser) prior to such date. Please see the prospectus for additional information.
Performance data quoted represents past performance. Past performance does not guarantee future results. Total return figures assume reinvestment of dividends and capital gains distributions, if any. The table does not reflect the deduction of taxes that a shareholder would pay on Fund distributions or the redemption of Fund shares. Investment return and principal value of an investment will fluctuate so that an investor’s shares, when sold or redeemed, may be worth more or less than the original cost. Current performance data may be higher or lower than actual data quoted. For the most current month-end performance data please visit www.alpsfunds.com or call 1.866.675.2639.
NAV is an exchange-traded fund’s per-share value. The per-share dollar amount of the Fund is derived by dividing the total value of all the securities in its portfolio, less any liabilities, by the number of Fund shares outstanding. Market Price is the price at which a share can currently be traded in the market. Information detailing the number of days the Market Price of the Fund was greater than the Fund’s NAV and the number of days it was less than the Fund’s NAV can be obtained at www.alpsfunds.com.
| ^ | The Fund commenced Investment Operations on July 6, 2009 with an Inception Date, the first day of trading on the Exchange, of July 7, 2009. |
| * | Market Price means the official closing price of a share or, if it more accurately reflects the market value of a share at the time as of which the Fund calculates current net asset value per share, the price that is the midpoint of the bid-ask spread as of that time. It does not represent the returns an investor would receive if shares were traded at other times. |
The NYSE® Equal Sector Weight Total Return Index consists of a strategy that holds all active Select Sector SPDR® ETFs in an equal-weighted portfolio. Total return assumes reinvestment of any dividends and distributions realized during a given time period.
S&P 500® Total Return Index: the Standard & Poor’s composite index of 500 stocks, a widely recognized, unmanaged index of common stock prices. Total return assumes reinvestment of any dividends and distributions realized during a given time period. The indexes are not actively managed and do not reflect any deductions for fees, expenses or taxes.
The indexes are reported on a total return basis, which assumes reinvestment of any dividends and distributions realized during a given time period. One cannot invest directly in an index. Index performance does not reflect fund performance.
The Fund’s shares are not individually redeemable. Investors buy and sell shares of the Fund on a secondary market. Only market makers or “authorized participants” may trade directly with the Fund, typically in blocks of 50,000 shares.
The ALPS Equal Sector Weight ETF is not suitable for all investors. Investments in the Fund are subject to investment risks, including possible loss of the principal amount invested.
ALPS Portfolio Solutions Distributor, Inc., a FINRA member, is the distributor for the Fund.
ALPS Equal Sector Weight ETF
| Performance Overview | November 30, 2020 (Unaudited) |
The following table shows the sector weights of both the Fund and the S&P 500® Total Return Index as of November 30, 2020:
Sector Weighting Comparison (as of November 30, 2020)
| | EQL* | S&P 500® | +/- |
| Financials | 9.4% | 10.4% | -1.0% |
| Industrials | 9.4% | 8.7% | 0.7% |
| Communication Services | 9.3% | 11.0% | -1.7% |
| Technology | 9.3% | 27.6% | -18.3% |
| Energy | 9.2% | 2.4% | 6.8% |
| Consumer Discretionary | 9.2% | 11.3% | -2.1% |
| Materials | 9.1% | 2.7% | 6.4% |
| Utilities | 9.0% | 2.9% | 6.1% |
| Consumer Staples | 8.8% | 6.8% | 2.0% |
| Healthcare | 8.7% | 13.7% | -5.0% |
| Real Estate | 8.6% | 2.5% | 6.1% |
| Total | 100.0% | 100.0% | |
Source: S&P 500®
* % of Total Investments (excluding investments purchased with collateral from securities loaned).
Future holdings are subject to change.
Growth of $10,000 (as of November 30, 2020)
Comparison of Change in Value of $10,000 Investment in the Fund and the Indexes
The chart above compares historical performance of a hypothetical investment of $10,000 in the Fund over the past ten years with the performance of the Fund’s benchmark index. Past performance does not guarantee future results. The chart does not reflect the deduction of taxes that a shareholder would pay on Fund distributions or the redemption of Fund shares.
ALPS Equal Sector Weight ETF
| Disclosure of Fund Expenses | November 30, 2020 (Unaudited) |
Shareholder Expense Example: As a shareholder of a Fund, you incur certain ongoing costs, including management fees and other Fund expenses. These examples are intended to help you understand your ongoing costs (in dollars) of investing in the Fund and to compare these costs with the ongoing costs of investing in other funds. The example is based on an investment of $1,000 invested at the beginning of the (six month) period and held through November 30, 2020.
Actual Return: The first line of the table provides information about actual account values and actual expenses. You may use the information in this line, together with the amount you invested, to estimate the expenses that you incurred over the period. Simply divide your account value by $1,000 (for example, an $8,600 account value divided by $1,000 = 8.6), then multiply the result by the number in the first line under the heading entitled “Expenses Paid During Period” to estimate the expenses attributable to your investment during this period.
Hypothetical 5% Return: The second line of the table provides information about hypothetical account values and hypothetical expenses based on the Fund’s actual expense ratio and an assumed rate of return of 5% per year before expenses, which is not the Fund’s actual return. The hypothetical account values and expenses may not be used to estimate the actual ending account balance or expenses you paid for the period. You may use this information to compare ongoing costs of investing in the Fund and other funds. To do so, compare this 5% hypothetical example with the 5% hypothetical examples that appear in the shareholder reports of other funds.
The expenses shown in the table are meant to highlight ongoing Fund costs only and do not reflect any transaction costs, such as brokerage commissions and other fees to financial intermediaries. Therefore, the second line of the table is useful in comparing ongoing costs only, and will not help you determine the relative total costs of owning different funds. In addition, if these costs were included, your costs would have been higher.
| | | Beginning Account Value 6/1/20 | | | Ending Account Value 11/30/20 | | | Expense Ratio(a) | | | Expenses Paid During Period 6/1/20 - 11/30/20(b) | |
| ALPS Equal Sector Weight ETF | | | | | | | | | | | | | | | | |
| Actual | | $ | 1,000.00 | | | $ | 1,172.30 | | | | 0.15 | % | | $ | 0.81 | |
| Hypothetical (5% return before expenses) | | $ | 1,000.00 | | | $ | 1,024.25 | | | | 0.15 | % | | $ | 0.76 | |
| (a) | Annualized, based on the Fund's most recent fiscal half year expenses. |
| (b) | Expenses are equal to the Fund's annualized expense ratio multiplied by the average account value over the period, multiplied by the number of days in the most recent fiscal half year (183), divided by 366. |
ALPS Equal Sector Weight ETF
Report of Independent Registered Public Accounting Firm
To the shareholders and the Board of Trustees of ALPS ETF Trust:
Opinion on the Financial Statements and Financial Highlights
We have audited the accompanying statement of assets and liabilities, including the statement of investments, of ALPS Equal Sector Weight ETF (the "Fund"), one of the funds constituting the ALPS ETF Trust, as of November 30, 2020, the related statement of operations for the year then ended, the statements of changes in net assets for each of the two years in the period then ended, and the financial highlights for each of the five years in the period then ended for the Fund, and the related notes.
In our opinion, the financial statements and financial highlights present fairly, in all material respects, the financial position of the Fund as of November 30, 2020, and the result of its operations for the year then ended, the changes in its net assets for each of the two years in the period then ended, and the financial highlights for each of the five years in the period then ended in conformity with accounting principles generally accepted in the United States of America.
Basis for Opinion
These financial statements and financial highlights are the responsibility of the Fund’s management. Our responsibility is to express an opinion on the Fund’s financial statements and financial highlights based on our audits. We are a public accounting firm registered with the Public Company Accounting Oversight Board (United States) (PCAOB) and are required to be independent with respect to the Fund in accordance with the U.S. federal securities laws and the applicable rules and regulations of the Securities and Exchange Commission and the PCAOB.
We conducted our audits in accordance with the standards of the PCAOB. Those standards require that we plan and perform the audit to obtain reasonable assurance about whether the financial statements and financial highlights are free of material misstatement, whether due to error or fraud. The Fund is not required to have, nor were we engaged to perform, an audit of its internal control over financial reporting. As part of our audit, we are required to obtain an understanding of internal control over financial reporting but not for the purpose of expressing an opinion on the effectiveness of the Fund’s internal control over financial reporting. Accordingly, we express no such opinion.
Our audit included performing procedures to assess the risks of material misstatement of the financial statements and financial highlights, whether due to error or fraud, and performing procedures that respond to those risks. Such procedures included examining, on a test basis, evidence regarding the amounts and disclosures in the financial statements and financial highlights. Our audit also included evaluating the accounting principles used and significant estimates made by management, as well as evaluating the overall presentation of the financial statements and financial highlights. Our procedures included confirmation of securities owned as of November 30, 2020, by correspondence with the custodian and brokers; when replies were not received from brokers, we performed other auditing procedures. We believe that our audit provide a reasonable basis for our opinion.
DELOITTE & TOUCHE LLP
Denver, Colorado
January 25, 2021
We have served as the auditor of one or more investment companies advised by ALPS Advisors, Inc. since 2007.
ALPS Equal Sector Weight ETF
| Schedule of Investments | November 30, 2020 |
| Security Description | | Shares | | | Value | |
| EXCHANGE TRADED FUNDS (99.97%) | | | | | | | | |
| Communication Services (9.34%) | | | | | | | | |
| Communication Services Select Sector SPDR Fund(a) | | | 234,331 | | | $ | 15,325,247 | |
| | | | | | | | | |
| Consumer Discretionary (9.17%) | | | | | | | | |
| Consumer Discretionary Select Sector SPDR Fund(a) | | | 95,662 | | | | 15,043,806 | |
| | | | | | | | | |
| Consumer Staples (8.81%) | | | | | | | | |
| Consumer Staples Select Sector SPDR Fund | | | 216,114 | | | | 14,460,188 | |
| | | | | | | | | |
| Energy (9.17%) | | | | | | | | |
| Energy Select Sector SPDR Fund(a) | | | 409,532 | | | | 15,054,396 | |
| | | | | | | | | |
| Financials (9.47%) | | | | | | | | |
| Financial Select Sector SPDR Fund | | | 557,712 | | | | 15,549,011 | |
| | | | | | | | | |
| Healthcare (8.72%) | | | | | | | | |
| Health Care Select Sector SPDR Fund(a) | | | 130,421 | | | | 14,312,401 | |
| | | | | | | | | |
| Industrials (9.37%) | | | | | | | | |
| Industrial Select Sector SPDR Fund(a) | | | 174,715 | | | | 15,380,161 | |
| | | | | | | | | |
| Materials (9.06%) | | | | | | | | |
| Materials Select Sector SPDR Fund(a) | | | 209,442 | | | | 14,868,288 | |
| | | | | | | | | |
| Real Estate (8.60%) | | | | | | | | |
| Real Estate Select Sector SPDR Fund(a) | | | 386,642 | | | | 14,112,433 | |
| | | | | | | | | |
| Technology (9.26%) | | | | | | | | |
| Technology Select Sector SPDR Fund | | | 123,156 | | | | 15,207,303 | |
| | | | | | | | | |
| Utilities (9.00%) | | | | | | | | |
| Utilities Select Sector SPDR Fund(a) | | | 235,212 | | | | 14,780,722 | |
| | | | | | | | | |
| TOTAL EXCHANGE TRADED FUNDS | | | | | | | | |
| (Cost $124,733,585) | | | | | | | 164,093,956 | |
| | | 7 Day Yield | | | Shares | | | Value | |
| SHORT TERM INVESTMENTS (11.89%) | | | | | | | | | | | | |
| Money Market Fund (0.04%) | | | | | | | | | | | | |
| State Street Institutional Treasury Plus Money Market Fund | | | | | | | | | | | | |
| (Cost $62,583) | | | 0.01 | % | | | 62,583 | | | $ | 62,583 | |
| | | | | | | | | | | | | |
| Investments Purchased with Collateral from Securities Loaned (11.85%) | | | | | | | | | | | | |
| State Street Navigator Securities Lending Government Money Market Portfolio, 0.11% | | | | | | | | | | | | |
| (Cost $19,447,425) | | | | | | | 19,447,425 | | | | 19,447,425 | |
| TOTAL SHORT TERM INVESTMENTS | | | | | | | | | | | | |
| (Cost $19,510,008) | | | | | | | | | | | 19,510,008 | |
| | | | | | | | | | | | | |
| TOTAL INVESTMENTS (111.86%) | | | | | | | | | | | | |
| (Cost $144,243,593) | | | | | | | | | | $ | 183,603,964 | |
| LIABILITIES IN EXCESS OF OTHER ASSETS (-11.86%) | | | | | | | | | | | (19,463,200 | ) |
| NET ASSETS - 100.00% | | | | | | | | | | $ | 164,140,764 | |
| (a) | Security, or a portion of the security position is currently on loan. The total market value of securities on loan is $34,849,937. |
Common Abbreviations:
SPDR® - Standard & Poor's Depositary Receipts
See Notes to Financial Statements.
ALPS Equal Sector Weight ETF
| Statement of Assets and Liabilities | November 30, 2020 |
| ASSETS: | | | |
| Investments, at value | | $ | 183,603,964 | |
| Dividends receivable | | | 3,947 | |
| Total Assets | | | 183,607,911 | |
| | | | | |
| LIABILITIES: | | | | |
| Payable to adviser | | | 19,722 | |
| Payable for collateral upon return of securities loaned | | | 19,447,425 | |
| Total Liabilities | | | 19,467,147 | |
| NET ASSETS | | $ | 164,140,764 | |
| | | | | |
| NET ASSETS CONSIST OF: | | | | |
| Paid-in capital | | $ | 126,755,197 | |
| Total distributable earnings | | | 37,385,567 | |
| NET ASSETS | | $ | 164,140,764 | |
| | | | | |
| INVESTMENTS, AT COST | | $ | 144,243,593 | |
| | | | | |
| PRICING OF SHARES | | | | |
| Net Assets | | $ | 164,140,764 | |
| Shares of beneficial interest outstanding (Unlimited number of shares authorized, par value $0.01 per share) | | | 1,950,000 | |
| Net Asset Value, offering and redemption price per share | | $ | 84.17 | |
See Notes to Financial Statements.
ALPS Equal Sector Weight ETF
| Statement of Operations | For the Year Ended November 30, 2020 |
| INVESTMENT INCOME: | | | |
| Dividends | | $ | 4,039,870 | |
| Securities Lending Income | | | 44,253 | |
| Total Investment Income | | | 4,084,123 | |
| | | | | |
| EXPENSES: | | | | |
| Investment adviser fees | | | 564,326 | |
| Total Expenses before waiver/reimbursement | | | 564,326 | |
| Less fee waiver/reimbursement by investment adviser | | | (335,545 | ) |
| Net Expenses | | | 228,781 | |
| NET INVESTMENT INCOME | | | 3,855,342 | |
| | | | | |
| REALIZED AND UNREALIZED GAIN/(LOSS): | | | | |
| Net realized gain on investments | | | 17,484,465 | |
| Net change in unrealized appreciation/depreciation on investments | | | (6,901,203 | ) |
| NET REALIZED AND UNREALIZED GAIN ON INVESTMENTS | | | 10,583,262 | |
| NET INCREASE IN NET ASSETS RESULTING FROM OPERATIONS | | $ | 14,438,604 | |
See Notes to Financial Statements.
ALPS Equal Sector Weight ETF
Statements of Changes in Net Assets
| | | For the | | | For the | |
| | | Year Ended | | | Year Ended | |
| | | November 30, 2020 | | | November 30, 2019 | |
| OPERATIONS: | | | | | | | | |
| Net investment income | | $ | 3,855,342 | | | $ | 3,291,025 | |
| Net realized gain | | | 17,484,465 | | | | 4,595,674 | |
| Net change in unrealized appreciation/depreciation | | | (6,901,203 | ) | | | 12,663,405 | |
| Net increase in net assets resulting from operations | | | 14,438,604 | | | | 20,550,104 | |
| | | | | | | | | |
| DISTRIBUTIONS TO SHAREHOLDERS: | | | | | | | | |
| From distributable earnings | | | (3,851,925 | ) | | | (3,395,008 | ) |
| From tax return of capital | | | (17,569 | ) | | | – | |
| Total distributions | | | (3,869,494 | ) | | | (3,395,008 | ) |
| | | | | | | | | |
| CAPITAL SHARE TRANSACTIONS: | | | | | | | | |
| Proceeds from sale of shares | | | 36,501,060 | | | | 14,156,882 | |
| Cost of shares redeemed | | | (51,336,731 | ) | | | (17,646,683 | ) |
| Net decrease from capital share transactions | | | (14,835,671 | ) | | | (3,489,801 | ) |
| Net increase/(decrease) in net assets | | | (4,266,561 | ) | | | 13,665,295 | |
| | | | | | | | | |
| NET ASSETS: | | | | | | | | |
| Beginning of year | | | 168,407,325 | | | | 154,742,030 | |
| End of year | | $ | 164,140,764 | | | $ | 168,407,325 | |
| | | | | | | | | |
| OTHER INFORMATION: | | | | | | | | |
| CAPITAL SHARE TRANSACTIONS: | | | | | | | | |
| Beginning shares | | | 2,150,000 | | | | 2,200,000 | |
| Shares sold | | | 500,000 | | | | 200,000 | |
| Shares redeemed | | | (700,000 | ) | | | (250,000 | ) |
| Shares outstanding, end of period | | | 1,950,000 | | | | 2,150,000 | |
See Notes to Financial Statements.
ALPS Equal Sector Weight ETF
| Financial Highlights | For a Share Outstanding Throughout the Years Presented |
| | | For the Year Ended November 30, 2020 | | | For the Year Ended November 30, 2019 | | | For the Year Ended November 30, 2018 | | | For the Year Ended November 30, 2017 | | | For the Year Ended November 30, 2016 | |
| NET ASSET VALUE, BEGINNING OF PERIOD | | $ | 78.33 | | | $ | 70.34 | | | $ | 69.28 | | | $ | 59.74 | | | $ | 56.16 | |
| | | | | | | | | | | | | | | | | | | | | |
| INCOME FROM OPERATIONS: | | | | | | | | | | | | | | | | | | | | |
| Net investment income(a) | | | 1.91 | | | | 1.53 | | | | 1.50 | | | | 1.37 | | | | 1.66 | |
| Net realized and unrealized gain | | | 5.84 | | | | 8.03 | | | | 1.02 | | | | 10.03 | | | | 3.11 | |
| Total from investment operations | | | 7.75 | | | | 9.56 | | | | 2.52 | | | | 11.40 | | | | 4.77 | |
| | | | | | | | | | | | | | | | | | | | | |
| DISTRIBUTIONS: | | | | | | | | | | | | | | | | | | | | |
| From net investment income | | | (1.90 | ) | | | (1.57 | ) | | | (1.46 | ) | | | (1.86 | ) | | | (1.19 | ) |
| From tax return of capital | | | (0.01 | ) | | | – | | | | – | | | | – | | | | – | |
| Total distributions | | | (1.91 | ) | | | (1.57 | ) | | | (1.46 | ) | | | (1.86 | ) | | | (1.19 | ) |
| | | | | | | | | | | | | | | | | | | | | |
| NET INCREASE IN NET ASSET VALUE | | | 5.84 | | | | 7.99 | | | | 1.06 | | | | 9.54 | | | | 3.58 | |
| NET ASSET VALUE, END OF PERIOD | | $ | 84.17 | | | $ | 78.33 | | | $ | 70.34 | | | $ | 69.28 | | | $ | 59.74 | |
| TOTAL RETURN(b) | | | 10.37 | % | | | 13.86 | % | | | 3.66 | % | | | 19.46 | % | | | 8.62 | % |
| | | | | | | | | | | | | | | | | | | | | |
| RATIOS/SUPPLEMENTAL DATA: | | | | | | | | | | | | | | | | | | | | |
| Net assets, end of period (in 000s) | | $ | 164,141 | | | $ | 168,407 | | | $ | 154,742 | | | $ | 166,284 | | | $ | 140,391 | |
| | | | | | | | | | | | | | | | | | | | | |
| RATIOS TO AVERAGE NET ASSETS | | | | | | | | | | | | | | | | | | | | |
| Ratio of expenses excluding waiver/reimbursement to average net assets | | | 0.37 | % | | | 0.37 | % | | | 0.37 | % | | | 0.37 | % | | | 0.37 | % |
| Ratio of expenses including waiver/reimbursement to average net assets | | | 0.15 | % | | | 0.15 | % | | | 0.15 | % | | | 0.15 | % | | | 0.15 | % |
| Ratio of net investment income excluding waiver/reimbursement to average net assets | | | 2.31 | % | | | 1.89 | % | | | 1.92 | % | | | 1.92 | % | | | 2.71 | % |
| Ratio of net investment income including waiver/reimbursement to average net assets | | | 2.53 | % | | | 2.11 | % | | | 2.14 | % | | | 2.14 | % | | | 2.93 | % |
| Portfolio turnover rate(c) | | | 11 | % | | | 4 | % | | | 14 | % | | | 5 | % | | | 13 | % |
| (a) | Based on average shares outstanding during the period. |
| (b) | Total return is calculated assuming an initial investment made at the net asset value at the beginning of the period and redemption at the net asset value on the last day of the period and assuming all distributions are reinvested at the reinvestment prices. |
| (c) | Portfolio turnover for periods less than one year are not annualized and does not include securities received or delivered from processing creations or redemptions in-kind. |
See Notes to Financial Statements.
ALPS Equal Sector Weight ETF
| Notes to Financial Statements | November 30, 2020 |
1. ORGANIZATION
ALPS ETF Trust (the “Trust”), a Delaware statutory trust, is an open-end management investment company registered under the Investment Company Act of 1940, as amended (the “1940 Act”). As of November 30, 2020, the Trust consists of sixteen separate portfolios. Each portfolio represents a separate series of the Trust. This report pertains solely to the ALPS Equal Sector Weight ETF (the “Fund”). The investment objective of the Fund is to seek investment results that replicate as closely as possible, before fees and expenses, the performance of the NYSE® Equal Sector Weight Index (the “Underlying Index”). The Fund is considered non-diversified and may invest a greater portion of assets in securities of individual issuers than a diversified fund. As a result, changes in the market value of a single investment could cause greater fluctuations in share price than would occur in a diversified fund.
The Fund’s Shares (“Shares”) are listed on the NYSE Arca, Inc. The Fund issues and redeems Shares at net asset value (“NAV”) in blocks of 50,000 Shares each of which is called a “Creation Unit”. Creation Units are issued and redeemed principally in-kind for securities included in the Underlying Index. Except when aggregated in Creation Units, Shares are not redeemable securities of the Fund.
Pursuant to the Trust’s organizational documents, its Officers and Trustees are indemnified against certain liability arising out of the performance of their duties to the Trust. Additionally, in the normal course of business, the Trust enters into contracts with service providers that contain general indemnification clauses. The Trust’s maximum exposure under these arrangements is unknown, as this would involve future claims that may be made against the Trust that have not yet occurred.
2. SIGNIFICANT ACCOUNTING POLICIES
The following is a summary of significant accounting policies consistently followed by the Fund in the preparation of the financial statements. The accompanying financial statements were prepared in accordance with accounting principles generally accepted in the United States of America (“U.S. GAAP”). The preparation of financial statements in conformity with U.S. GAAP requires management to make certain estimates and assumptions that affect the reported amounts of assets and liabilities and disclosures of contingent assets and liabilities at the date of the financial statements and the reported amounts of revenue and expenses during the period. Actual results could differ from those estimates. The Fund is considered an investment company under U.S. GAAP and follows the accounting and reporting guidance applicable to investment companies in the Financial Accounting Standards Board (“FASB”) Accounting Standards Codification Topic 946.
A. Portfolio Valuation
The Fund’s NAV is determined daily, as of the close of regular trading on the New York Stock Exchange (the “NYSE”), normally 4:00 p.m. Eastern Time, on each day the NYSE is open for trading. The NAV is computed by dividing the value of all assets of the Fund (including accrued interest and dividends), less all liabilities (including accrued expenses and dividends declared but unpaid), by the total number of shares outstanding.
Portfolio securities listed on any exchange other than the NASDAQ Stock Market LLC (“NASDAQ”) are valued at the last sale price on the business day as of which such value is being determined. If there has been no sale on such day, the securities are valued at the mean of the most recent bid and ask prices on such day. Securities traded on the NASDAQ are valued at the NASDAQ Official Closing Price as determined by NASDAQ. Portfolio securities traded on more than one securities exchange are valued at the last sale price on the business day as of which such value is being determined at the close of the exchange representing the principal market for such securities. Portfolio securities traded in the over-the-counter market, but excluding securities traded on the NASDAQ, are valued at the last quoted sale price in such market.
The Fund’s investments are valued at market value or, in the absence of market value with respect to any portfolio securities, at fair value according to procedures adopted by the Trust’s Board of Trustees (the “Board”). When market quotations are not readily available or when events occur that make established valuation methods unreliable, securities of the Fund may be valued in good faith by or under the direction of the Board. These securities generally include, but are not limited to, restricted securities (securities which may not be publicly sold without registration under the Securities Act of 1933) for which a pricing service is unable to provide a market price; securities whose trading has been formally suspended; a security whose market price is not available from a pre-established primary pricing source or the pricing source is not willing to provide a price; a security with respect to which an event has occurred that is most likely to materially affect the value of the security after the market has closed but before the calculation of the Fund’s NAV or make it difficult or impossible to obtain a reliable market quotation; or a security whose price, as provided by the pricing service, does not reflect the security’s “fair value” due to the security being de-listed from a national exchange or the security’s primary trading market is temporarily closed at a time when, under normal conditions, it would be open. As a general principle, the current “fair value” of a security would be the amount which the owner might reasonably expect to receive from the sale on the applicable exchange or principal market. A variety of factors may be considered in determining the fair value of such securities.
ALPS Equal Sector Weight ETF
| Notes to Financial Statements | November 30, 2020 |
B. Fair Value Measurements
The Fund discloses the classification of its fair value measurements following a three-tier hierarchy based on the inputs used to measure fair value. Inputs refer broadly to the assumptions that market participants would use in pricing the asset or liability, including assumptions about risk. Inputs may be observable or unobservable. Observable inputs reflect the assumptions market participants would use in pricing the asset or liability that are developed based on market data obtained from sources independent of the reporting entity. Unobservable inputs reflect the reporting entity’s own assumptions about the assumptions market participants would use in pricing the asset or liability that are developed based on the best information available.
Valuation techniques used to value the Fund’s investments by major category are as follows:
Exchange Traded Funds, for which market quotations are readily available, are valued at the last reported sale price or official closing price as reported by a third party pricing vendor on the primary market or exchange on which they are traded and are categorized as Level 1 in the hierarchy. In the event there were no sales during the day or closing prices are not available, securities are valued at the mean of the most recent quoted bid and ask prices on such day and are generally categorized as Level 2 in the hierarchy. Investments in open-end mutual funds are valued at their closing NAV each business day and are categorized as Level 1 in the hierarchy.
Changes in valuation techniques may result in transfers in or out of an assigned level within the disclosure hierarchy.
Various inputs are used in determining the value of the Fund’s investments as of the end of the reporting period. When inputs used fall into different levels of the fair value hierarchy, the level in the hierarchy within which the fair value measurement falls is determined based on the lowest level input that is significant to the fair value measurement in its entirety. The designated input levels are not necessarily an indication of the risk or liquidity associated with these investments.
These inputs are categorized in the following hierarchy under applicable financial accounting standards:
Level 1 – Unadjusted quoted prices in active markets for identical investments, unrestricted assets or liabilities that a Fund has the ability to access at the measurement date;
Level 2 – Quoted prices which are not active, quoted prices for similar assets or liabilities in active markets or inputs other than quoted prices that are observable (either directly or indirectly) for substantially the full term of the asset or liability; and
Level 3 – Significant unobservable prices or inputs (including the Fund’s own assumptions in determining the fair value of investments) where there is little or no market activity for the asset or liability at the measurement date.
The following is a summary of inputs used to value the Fund’s investments as of November 30, 2020:
ALPS Equal Sector Weight ETF
| Investments in Securities at Value | | Level 1 - Quoted and Unadjusted Prices | | | Level 2 - Other Significant Observable Inputs | | | Level 3 - Significant Unobservable Inputs | | | Total | |
| Exchange Traded Funds* | | $ | 164,093,956 | | | $ | – | | | $ | – | | | $ | 164,093,956 | |
| Short Term Investments | | | 19,510,008 | | | | – | | | | – | | | | 19,510,008 | |
| Total | | $ | 183,603,964 | | | $ | – | | | $ | – | | | $ | 183,603,964 | |
| * | For a detailed breakdown of sectors, see the accompanying Schedule of Investments. |
The Fund did not have any securities that used significant unobservable inputs (Level 3) in determining fair value and there were no transfers into or out of Level 3 during the year ended November 30, 2020.
C. Securities Transactions and Investment Income
Securities transactions are recorded as of the trade date. Realized gains and losses from securities transactions are recorded on the highest cost basis. Dividend income and capital gains distributions, if any, are recorded on the ex-dividend date. Interest income, if any, is recorded on the accrual basis.
D. Dividends and Distributions to Shareholders
Dividends from net investment income of the Fund, if any, are declared and paid quarterly or as the Board may determine from time to time. Distributions of net realized capital gains earned by the Fund, if any, are distributed at least annually.
ALPS Equal Sector Weight ETF
| Notes to Financial Statements | November 30, 2020 |
E. Federal Tax and Tax Basis Information
The timing and character of income and capital gain distributions are determined in accordance with income tax regulations, which may differ from U.S. GAAP. Reclassifications are made to the Fund’s capital accounts for permanent tax differences to reflect income and gains available for distribution (or available capital loss carryforwards) under income tax regulations.
For the year ended November 30, 2020, the following reclassifications, which had no impact on results of operations or net assets, were recorded to reflect permanent tax differences resulting primarily from in-kind transactions:
| Fund | | Paid-in Capital | | | Total Distributable Earnings | |
| ALPS Equal Sector Weight ETF | | $ | 18,688,206 | | | $ | (18,688,206 | ) |
The tax character of the distributions paid during the fiscal years ended November 30, 2020 and November 30, 2019 was as follows:
| | | Ordinary Income | | | Long-Term Capital Gain | | | Return of Capital | |
| November 30, 2020 | | | | | | | | | | | | |
| ALPS Equal Sector Weight ETF | | $ | 3,851,925 | | | $ | – | | | $ | 17,569 | |
| | | Ordinary Income | | | Long-Term Capital Gain | | | Return of Capital | |
| November 30, 2019 | | | | | | | | | | | | |
| ALPS Equal Sector Weight ETF | | $ | 3,395,008 | | | $ | – | | | $ | – | |
The character of distributions made during the year may differ from its ultimate characterization for federal income tax purposes.
Under current law, capital losses maintain their character as short-term or long-term and are carried forward to the next tax year without expiration. As of November 30, 2020, the following amounts are available as carry forwards to the next tax year:
| Fund | | Short-Term | | | Long-Term | |
| ALPS Equal Sector Weight ETF | | $ | 226,451 | | | $ | 1,646,157 | |
As of November 30, 2020, the components of distributable earnings on a tax basis for each Fund were as follows:
| | | ALPS Equal Sector Weight ETF | |
| Accumulated net realized loss on investments | | | (1,872,608 | ) |
| Net unrealized appreciation on investments | | | 39,258,175 | |
| Total | | $ | 37,385,567 | |
As of November 30, 2020, the cost of investments for federal income tax purposes and accumulated net unrealized appreciation/(depreciation) on investments were as follows:
| | | ALPS Equal Sector Weight ETF | |
| Gross appreciation (excess of value over tax cost) | | $ | 46,308,458 | |
| Gross depreciation (excess of tax cost over value) | | | (7,050,283 | ) |
| Net unrealized appreciation (depreciation) | | $ | 39,258,175 | |
| Cost of investments for income tax purposes | | $ | 144,345,789 | |
The differences between book-basis and tax-basis are primarily due to the deferral of losses from wash sales.
ALPS Equal Sector Weight ETF
| Notes to Financial Statements | November 30, 2020 |
F. Income Taxes
No provision for income taxes is included in the accompanying financial statements, as the Fund intends to distribute to shareholders all taxable investment income and realized gains and otherwise comply with Subchapter M of the Internal Revenue Code of 1986, as amended, applicable to regulated investment companies. The Fund evaluates tax positions taken (or expected to be taken) in the course of preparing the Fund’s tax returns to determine whether these positions meet a “more-likely-than-not” standard that, based on the technical merits, have a more than fifty percent likelihood of being sustained by a taxing authority upon examination. A tax position that meets the “more-likely-than-not” recognition threshold is measured to determine the amount of benefit to recognize in the financial statements.
As of and during the year ended November 30, 2020, the Fund did not have a liability for any unrecognized tax benefits. The Fund files U.S. federal, state, and local tax returns as required. The Fund’s tax returns are subject to examination by the relevant tax authorities until expiration of the applicable statute of limitations, which is generally three years after the filing of the tax return, but may extend to four years in certain jurisdictions. Tax returns for open years have incorporated no uncertain tax positions that require a provision for income taxes.
G. Lending of Portfolio Securities
The Fund has entered into a securities lending agreement with State Street Bank & Trust Co. (“SSB”), the Fund’s lending agent. The Fund may lend its portfolio securities only to borrowers that are approved by SSB. The Fund will limit such lending to not more than 33 1/3% of the value of its total assets. The Fund’s securities held at SSB as custodian shall be available to be lent except those securities the Fund or ALPS Advisors, Inc. specifically identifies in writing as not being available for lending. The borrower pledges and maintains with the Fund collateral consisting of cash (U.S. Dollars only), securities issued or guaranteed by the U.S. government or its agencies or instrumentalities, and cash equivalents (including irrevocable bank letters of credit) issued by a person other than the borrower or an affiliate of the borrower. The initial collateral received by the Fund is required to have a value of no less than 102% of the market value of the loaned securities for U.S equity securities and a value of no less than 105% of the market value for non-U.S. equity securities. The collateral is maintained thereafter, at a market value equal to not less than 102% of the current value of the U.S. equity securities on loan and not less than 105% of the current value of the non-U.S. equity securities on loan. The market value of the loaned securities is determined at the close of each business day and any additional required collateral is delivered to the Fund on the next business day. During the term of the loan, the Fund is entitled to all distributions made on or in respect of the loaned securities. Loans of securities are terminable at any time and the borrower, after notice, is required to return borrowed securities within the customary time period for settlement of securities transactions.
Any cash collateral received is reinvested in a money market fund managed by SSB as disclosed in the Fund’s Schedule of Investments and is reflected in the Statements of Assets and Liabilities as a payable for collateral upon return of securities loaned. Non-cash collateral, in the form of securities issued or guaranteed by the U.S. government or its agencies or instrumentalities, is not disclosed in the Fund’s Statements of Assets and Liabilities as it is held by the lending agent on behalf of the Fund, and the Fund does not have the ability to re-hypothecate these securities. Income earned by the Fund from securities lending activity is disclosed in the Statement of Operations.
The following is a summary of the Fund's securities lending agreement and related cash and non-cash collateral received as of November 30, 2020:
| | | Market Value of Securities on Loan | | | Cash Collateral Received | | | Non-Cash Collateral Received | | | Total Collateral Received | |
| ALPS Equal Sector Weight ETF | | $ | 34,849,937 | | | $ | 19,447,425 | | | $ | 16,746,091 | | | $ | 36,193,516 | |
The risks of securities lending include the risk that the borrower may not provide additional collateral when required or may not return the securities when due. To mitigate these risks, the Fund benefits from a borrower default indemnity provided by SSB. SSB’s indemnity allows for full replacement of securities lent wherein SSB will purchase the unreturned loaned securities on the open market by applying the proceeds of the collateral, or to the extent such proceeds are insufficient or the collateral is unavailable, SSB will purchase the unreturned loan securities at SSB’s expense. However, the Fund could suffer a loss if the value of the investments purchased with cash collateral falls below the value of the cash collateral received.
ALPS Equal Sector Weight ETF
| Notes to Financial Statements | November 30, 2020 |
The following table reflects a breakdown of transactions accounted for as secured borrowings, the gross obligation by the type of collateral pledged or securities loaned, and the remaining contractual maturity of those transactions as of November 30, 2020:
| ALPS Equal Sector Weight ETF | | | | | Remaining contractual maturity of the agreements | | | | |
| Securities Lending Transactions | | Overnight & Continuous | | | Up to 30 days | | | 30-90 days | | | Greater than 90 days | | | Total | |
| Common Stocks | | $ | 19,447,425 | | | $ | – | | | $ | – | | | $ | – | | | $ | 19,447,425 | |
| Total Borrowings | | | | | | | | | | | | | | | | | | | 19,447,425 | |
| Gross amount of recognized liabilities for securities lending (collateral received) | | | | | | | | | | | | | | | | | | $ | 19,447,425 | |
3. INVESTMENT ADVISORY FEE AND OTHER AFFILIATED TRANSACTIONS
ALPS Advisors, Inc. (the “Adviser”) serves as the Fund’s investment adviser pursuant to an Investment Advisory Agreement with the Trust on behalf of the Fund (the “Advisory Agreement”). Pursuant to the Advisory Agreement, the Fund pays the Adviser an annual management fee for the services and facilities it provides, payable on a monthly basis at the annual rate of 0.37% of the Fund’s average daily net assets.
The Adviser has contractually agreed to waive 0.19% of its annual unitary fee payable by the Fund until at least March 31, 2021. The waiver may only be terminated by the Fund's Board of Trustees prior to such date.
ALPS Portfolio Solutions Distributor, Inc. (“APSD”) is both the distributor for the Fund as well as the Select Sector SPDR exchange traded funds (“Underlying Sector ETFs”) that the Fund invests in. As required by exemptive relief obtained by the Underlying Sector ETFs, the Adviser will reimburse the Fund an amount equal to the distribution fee received by APSD from the Underlying Sector ETFs attributable to the Fund’s investment in the Underlying Sector ETFs, for so long as APSD acts as the distributor to the Fund and the Underlying Sector ETFs. Such reimbursement is generally expected to equal 0.03% annually.
Out of the unitary management fees, the Adviser pays substantially all expenses of the Fund, including licensing fees to the Underlying Index provider, the cost of transfer agency, custody, fund administration, legal, audit, independent trustees and other services, except for acquired fund fees and expenses, interest expenses, distribution fees or expenses, brokerage expenses, taxes and extraordinary expenses not incurred in the ordinary course of the Fund's business. The Adviser’s unitary management fee is designed to pay substantially all of the Fund’s expenses and to compensate the Adviser for providing services to the Fund.
ALPS Fund Services, Inc., an affiliate of the Adviser, is the administrator of the Fund.
Effective July 1, 2020, each Trustee receives (1) a quarterly retainer of $10,000, (2) a per meeting fee of $5,000, (3) $1,500 for any special meeting held outside of a regularly scheduled board meeting, and (4) reimbursement for all reasonable out-of-pocket expenses relating to attendance at meetings. Prior to July 1, 2020, each Trustee who is not considered an "interested person" (as defined in the 1940 Act), received (1) a quarterly retainer of $5,000, (2) a per meeting fee of $3,750, (3) $1,500 for any special meeting held outside of a regularly scheduled board meeting, and (4) reimbursement for all reasonable out-of-pocket expenses relating to attendance at meetings. Prior to January 1, 2020, a Trustee who is considered an “interested person” (as defined in the 1940 Act) (“Interested Trustee”) received no compensation or expense reimbursements from the Trust. From January 1, 2020 to June 30, 2020, the Interested Trustee received (1) a quarterly retainer of $5,000, (2) a per meeting fee of $3,750, (3) $1,500 for any special meeting held outside of a regularly scheduled board meeting, and (4) reimbursement for all reasonable out-of-pocket expenses relating to attendance at meetings. In addition, the Chairman of the Board and Chairman of the Audit Committee each receives a quarterly retainer of $2,000, in connection with their respective roles.
ALPS Equal Sector Weight ETF
| Notes to Financial Statements | November 30, 2020 |
4. PURCHASES AND SALES OF SECURITIES
For the year ended November 30, 2020 the cost of purchases and proceeds from sales of investment securities, excluding short-term investments and in-kind transactions, were as follows:
| Fund | | Purchases | | | Sales | |
| ALPS Equal Sector Weight ETF | | $ | 16,037,711 | | | $ | 16,231,087 | |
For the year ended November 30, 2020, the cost of in-kind purchases and proceeds from in-kind sales were as follows:
| Fund | | Purchases | | | Sales | |
| ALPS Equal Sector Weight ETF | | $ | 36,501,287 | | | $ | 51,139,434 | |
For the year ended November 30, 2020, the ALPS Equal Sector Weight ETF had in-kind net realized gain of $18,436,167.
Gains on in-kind transactions are not considered taxable for federal income tax purposes and losses on in-kind transactions are also not deductible for tax purposes.
5. CAPITAL SHARE TRANSACTIONS
Shares are created and redeemed by the Fund only in Creation Unit size aggregations of 50,000 Shares. Only broker-dealers or large institutional investors with creation and redemption agreements called Authorized Participants (“AP”) are permitted to purchase or redeem Creation Units from the Fund. Such transactions are generally permitted on an in-kind basis, with a balancing cash component to equate the transaction to the NAV per unit of the Fund on the transaction date. Cash may be substituted equivalent to the value of certain securities generally when they are not available in sufficient quantity for delivery, not eligible for trading by the AP or as a result of other market circumstances.
6. MARKET DISRUPTIONS RISK
The Fund is subject to investment and operational risks associated with financial, economic and other global market developments and disruptions, including the recent spread of an infectious respiratory illness caused by a novel strain of coronavirus (known as COVID-19), which can negatively impact the securities markets and cause the Fund to lose value.
The spread of COVID-19 has caused volatility, severe market dislocations and liquidity constraints in many markets, including markets for the securities the Fund holds, and may adversely affect the Fund’s investments and operations. The transmission of COVID-19 and efforts to contain its spread have resulted in travel restrictions and disruptions, closed international borders, enhanced health screenings at ports of entry and elsewhere, disruption of and delays in healthcare service preparation and delivery, quarantines, event and service cancellations or interruptions, disruptions to business operations and supply chains, and a reduction in consumer and business spending, as well as general concern and uncertainty that has negatively affected the economy. These disruptions have led to instability in the market place and the jobs market. The impact of COVID-19 could adversely affect the economies of many nations or the entire global economy, the financial well-being and performance of individual issuers, borrowers and sectors and the health of the markets generally in potentially significant and unforeseen ways.
The foregoing could lead to a significant economic downturn or recession, increased market volatility, a greater number of market closures, higher default rates and adverse effects on the values and liquidity of the Fund’s securities or other assets. Such impacts may adversely affect the performance of the Fund.
7. SUBSEQUENT EVENTS
Subsequent events, if any, after the date of the Statements of Assets and Liabilities have been evaluated through the date the financial statements were issued. Management has determined that there were no subsequent events to report through the issuance of these financial statements.
ALPS Equal Sector Weight ETF
| Additional Information | November 30, 2020 (Unaudited) |
PROXY VOTING RECORDS, POLICIES AND PROCEDURES
Information regarding how the Fund voted proxies relating to portfolio securities during the most recent 12-month period ended June 30 and a description of the Fund’s proxy voting policies and procedures used in determining how to vote for proxies are available without charge on the SEC’s website at www.sec.gov and upon request, by calling (toll-free) 1-866-675-2639.
PORTFOLIO HOLDINGS
The Fund files a complete schedule of portfolio holdings with the U.S. Securities and Exchange Commission (“SEC”) for the first and third quarters of each fiscal year as an exhibit to its reports on Form N-PORT within 60 days after the end of the period. Copies of the Fund’s Form N-PORT are available without a charge, upon request, by contacting the Fund at 1-866-759-5679 and on the SEC’s website at https://www.sec.gov.
TAX INFORMATION
The Fund designates the following as a percentage of taxable ordinary income distributions, or up to the maximum amount allowable, for the calendar year ended December 31, 2019:
| | Qualified Dividend Income | Dividend Received Deduction |
| ALPS Equal Sector Weight ETF | 98.34% | 98.86% |
In early 2020, if applicable, shareholders of record received this information for the distribution paid to them by the Fund during the calendar year 2019 via Form 1099. The Fund will notify shareholders in early 2021 of amounts paid to them by the Fund, if any, during the calendar year 2020.
LICENSING AGREEMENT
ICE Data Indices, LLC (the “Index Provider”) is not affiliated with the ALPS Equal Sector Weight ETF (the “Fund”) or ALPS Advisors, Inc. (the “Adviser”). The Fund is entitled to use the Underlying Index pursuant to a licensing agreement with the Index Provider and the Adviser. The Adviser pays a licensing fee to the Index Provider out of the management fee.
The only relationship that the Index Provider has with the Fund, the Adviser or Distributor of the Fund in connection with the Fund is that the Index Provider has licensed certain of its intellectual property, including the determination of the component stocks of the Underlying Index and the name of the Underlying Index. The Underlying Index is selected and calculated without regard to the Adviser, Distributor or owners of the Fund. The Index Provider has no obligation to take the specific needs of the Adviser, Distributor or owners of the Fund into consideration in the determination and calculation of the Underlying Index. The Index Provider is not responsible for and has not participated in the determination of pricing or the timing of the issuance or sale of the Shares of the Fund or in the determination or calculation of the net asset value of the Fund. The Index Provider has no obligation or liability in connection with the administration or trading of the Fund.
NYSE® Equal Sector Weight Index is a service mark of ICE Data Indices, LLC or its affiliates (“ICE Data”) and has been licensed for use by the Adviser in connection with the Fund. Neither the Trust nor the Fund is sponsored, endorsed, sold or promoted by ICE Data. ICE Data makes no representations or warranties regarding the Adviser or the Fund or the ability of the NYSE® Equal Sector Weight Index to track general stock market performance.
ICE DATA MAKES NO EXPRESS OR IMPLIED WARRANTIES, AND HEREBY EXPRESSLY DISCLAIMS ALL WARRANTIES OF MERCHANTABILITY OR FITNESS FOR A PARTICULAR PURPOSE WITH RESPECT TO THE NYSE® EQUAL SECTOR WEIGHT INDEX OR ANY DATA INCLUDED THEREIN. IN NO EVENT SHALL ICE DATA HAVE ANY LIABILITY FOR ANY SPECIAL, PUNITIVE, INDIRECT, OR CONSEQUENTIAL DAMAGES (INCLUDING LOST PROFITS), EVEN IF NOTIFIED OF THE POSSIBILITY OF SUCH DAMAGES.
The Adviser does not guarantee the accuracy and/or the completeness of the Underlying Index or any data included therein, and the Adviser shall have no liability for any errors, omissions or interruptions therein. The Adviser makes no warranty, express or implied, as to results to be obtained by the Fund, owners of the Shares of the Fund or any other person or entity from the use of the Underlying Index or any data included therein. The Adviser makes no express or implied warranties, and expressly disclaims all warranties of merchantability or fitness for a particular purpose or use with respect to the Underlying Index or any data included therein. Without limiting any of the foregoing, in no event shall the Adviser have any liability for any special, punitive, direct, indirect or consequential damages (including lost profits) arising out of matters relating to the use of the Underlying Index even if notified of the possibility of such damages.
ALPS Equal Sector Weight ETF
| Board Considerations Regarding Approval of | November 30, 2020 (Unaudited) |
| Investment Advisory Agreement | |
At a meeting held on June 24, 2020 via electronic means (video-conference), the Board of Trustees of the Trust (the “Board” or the “Trustees”), including the Trustees who are not “interested persons” of the Trust within the meaning of the Investment Company Act of 1940, as amended (the “Independent Trustees”), evaluated a proposal to approve the continuance of the Investment Advisory Agreement between the Trust and ALPS Advisors, Inc. (the “Adviser” or “AAI”) with respect to the ALPS Equal Sector Weight ETF (“EQL” or the “Fund”). The Independent Trustees also met separately to consider the Investment Advisory Agreement.
In evaluating the Investment Advisory Agreement with respect to the Fund, the Board considered various factors, including (i) the nature, extent and quality of the services provided by AAI with respect to the Fund under the Investment Advisory Agreement; (ii) the advisory fees and other expenses paid by the Fund compared to those of similar funds managed by other investment advisers; (iii) the costs of the services provided to the Fund by AAI and the profits realized by AAI and its affiliates from its relationship to the Fund; (iv) the extent to which economies of scale have been or would be realized if and as the assets of the Fund grow and whether fees reflect the economies of scale for the benefit of shareholders; and (v) any additional benefits and other considerations.
With respect to the nature, extent and quality of the services provided by AAI under the Investment Advisory Agreement, the Board considered and reviewed information concerning the services provided under the Investment Advisory Agreement, the investment parameters of the index of the Fund, financial information regarding AAI and its parent company, information describing AAI’s current organization and the background and experience of the persons responsible for the day-to-day management of the Fund.
The Board reviewed information on the performance of the Fund and its benchmark. The Board also evaluated the correlation and tracking error between the underlying index and the Fund’s performance. Based on this review, the Board, including the Independent Trustees, found that the nature and extent of services provided to the Fund under the Investment Advisory Agreement was appropriate and that the quality was satisfactory.
The Board noted that the advisory fees for the Fund were unitary fees pursuant to which AAI assumes all expenses of the Fund (including the cost of transfer agency, custody, fund administration, legal, audit and other services) other than the payments under the Advisory Agreement, brokerage expenses, taxes, interest, litigation expenses and other extraordinary expenses.
With respect to advisory fee rates, the Board, including the Independent Trustees, noted the following:
The gross management fee rate for the Fund is higher than the median of its FUSE expense group. The Fund’s net expense ratio, however, is lower than the median of its FUSE expense group.
Based on the foregoing, and the other information available to them, the Board, including the Independent Trustees, concluded that the advisory fee rate for the Fund was reasonable under the circumstances and in light of the quality of the services provided.
The Board, including the Independent Trustees, considered other benefits available to AAI because of its relationship with the Fund and concluded that the advisory fees were reasonable taking into account any such benefits.
The Board, including the Independent Trustees, also considered with respect to the Fund the information provided by AAI about the costs and profitability of AAI with respect to the Fund, including the asset levels and other factors that influence the profitability and financial viability of the Fund. The Board, including the Independent Trustees, reviewed and noted the relatively small size of the Fund and concluded that AAI was not realizing any economies of scale. The Independent Trustees determined that AAI should continue to keep the Board informed on an ongoing basis of any significant developments (e.g., material increases in asset levels) so as to facilitate the Independent Trustees’ evaluation of whether further economies of scale have been achieved.
In voting to renew the Investment Advisory Agreement, the Board, including the Independent Trustees, concluded that the terms of the Investment Advisory Agreement are reasonable and fair in light of the services to be performed, the fees paid by certain other funds, expenses to be incurred and such other matters as the members of the Board, including the Independent Trustees, considered relevant in the exercise of their reasonable business judgment. The Board, including the Independent Trustees, did not identify any single factor or group of factors as all important or controlling and considered all factors together.
ALPS Equal Sector Weight ETF
| Trustees & Officers | November 30, 2020 (Unaudited) |
The general supervision of the duties performed by the Adviser for the Fund under the Investment Advisory Agreement is the responsibility of the Board of Trustees. The Trust currently has four Trustees. Three Trustees have no affiliation or business connection with the Adviser or any of its affiliated persons and do not own any stock or other securities issued by the Adviser. These are the “non-interested” or “independent” Trustees (“Independent Trustees”). The other Trustee (the “Interested Trustee”) is affiliated with the Adviser.
The Independent Trustees of the Trust, their term of office and length of time served, their principal business occupations during the past five years, the number of portfolios in the Fund Complex overseen by each Independent Trustee, and other directorships, if any, held by the Trustee are shown below.
INDEPENDENT TRUSTEES
| Name, Address & Year of Birth* | Position(s) Held with Trust | Term of Office and Length of Time Served** | Principal Occupation(s) During Past 5 Years | Number of Portfolios in Fund Complex Overseen by Trustees*** | Other Directorships Held by Trustees |
| Mary K. Anstine, 1940 | Trustee | Since March 2008 | Ms. Anstine was formerly an Executive Vice President of First Interstate Bank of Denver until 1994, President/Chief Executive Officer of HealthONE Alliance, Denver, Colorado, from 1994 to 2004, and has been retired since 2004. Ms. Anstine is also Trustee/Director of the following: AV Hunter Trust and Colorado Uplift Board. Ms. Anstine was formerly a Director of the Trust Bank of Colorado (later purchased and now known as Northern Trust Bank), HealthONE and Denver Area Council of the Boy Scouts of America and a member of the American Bankers Association Trust Executive Committee. | 35 | Ms. Anstine is a Trustee of ALPS Variable Investment Trust (7 funds); Financial Investors Trust (31 funds); Reaves Utility Income Fund; and Segall Bryant & Hamill Trust (14 funds). |
| Jeremy W. Deems, 1976 | Trustee | Since March 2008 | Mr. Deems is the Co-Founder, Chief Compliance Officer and Chief Financial Officer of Green Alpha Advisors, LLC. Mr. Deems is Co-Portfolio Manager of the Shelton Green Alpha Fund. Prior to joining Green Alpha Advisors, Mr. Deems was CFO and Treasurer of Forward Management, LLC, ReFlow Management Co., LLC, ReFlow Fund, LLC, a private investment fund, and Sutton Place Management, LLC, an administrative services company. | 35 | Mr. Deems is a Trustee of ALPS Variable Investment Trust (7 funds); Financial Investors Trust (31 funds); and Reaves Utility Income Fund; and Clough Funds Trust (1 fund). |
| Rick A. Pederson, 1952 | Trustee | Since March 2008 | Mr. Pederson is Partner, Bow River Capital Partners (private equity management), 2003 - present; Board Member, Prosci Inc. (private business services) 2013-2016; Advisory Board Member, Citywide Banks (Colorado community bank) 2014- 2017; Board Member, Strong-Bridge Consulting, 2015-2019; Board Member, IRI/ODMS Holdings LLC, 2017 – 2019; Director, National Western Stock Show (not for profit) 2010 - present; Director, History Colorado (not for profit) 2015-present; Director, Citywide Bank Advisory Board 2017-present; Trustee, Boettcher Foundation, 2018-present. | 18 | Mr. Pederson is Trustee of Segall Bryant & Hamill Trust (14 funds) and Principal Real Estate Income Fund (1 fund). |
| * | The business address of the Trustee is c/o ALPS Advisors, Inc., 1290 Broadway, Suite 1000, Denver, Colorado 80203. |
| ** | This is the period for which the Trustee began serving the Trust. Each Trustee serves an indefinite term, until his successor is elected. |
| *** | The Fund Complex includes all series of the Trust and any other investment companies for which ALPS Advisors, Inc. provides investment advisory services. |
ALPS Equal Sector Weight ETF
| Trustees & Officers | November 30, 2020 (Unaudited) |
The Trustee who is an “interested person” of the Trust, his term of office and length of time served, his principal business occupations during the past five years, the number of portfolios in the Fund Complex overseen by the Interested Trustee and the other directorships, if any, held by the Trustee, are shown below.
INTERESTED TRUSTEE
| Name, Address and Year of Birth of Interested Trustee* | Position(s) Held with Trust | Term of Office and Length of Time Served** | Principal Occupation(s) During Past 5 Years | Number of Portfolios in Fund Complex Overseen by Trustees*** | Other Directorships Held by Trustees |
| Edmund J. Burke, 1961 | Trustee | Since December 2017. | Mr. Burke joined ALPS in 1991 and served as the President and Director of ALPS Holdings, Inc., and ALPS Advisors, Inc. (“AAI”), and Director of ALPS Distributors, Inc. (“ADI”), ALPS Fund Services, Inc. (“AFS”), and ALPS Portfolio Solutions Distributor, Inc. (“APSD”). Mr. Burke retired from ALPS in June 2019. | 30 | Mr. Burke is a Trustee of Clough Global Dividend and Income Fund (1 fund); Clough Global Equity Fund (1 fund); Clough Global Opportunities Fund (1 fund); Clough Funds Trust (1 fund); Liberty All-Star Equity Fund (1 fund); Director of the Liberty All- Star Growth Fund, Inc. (1 fund) and Financial Investors Trust (31 funds). |
| * | The business address of the Trustee is c/o ALPS Advisors, Inc., 1290 Broadway, Suite 1000, Denver, Colorado 80203. |
| ** | This is the period for which the Trustee began serving the Trust. Each Trustee serves an indefinite term, until his successor is elected. |
| *** | The Fund Complex includes all series of the Trust and any other investment companies for which ALPS Advisors, Inc. provides investment advisory services. |
ALPS Equal Sector Weight ETF
| Trustees & Officers | November 30, 2020 (Unaudited) |
OFFICERS
| Name, Address and Year of Birth of Officer* | Position(s) Held with Trust | Length of Time Served** | Principal Occupation(s) During Past 5 Years |
Bradley Swenson, 1972 | President | Since June 2019 | Mr. Swenson joined ALPS in 2004 and currently serves as President of AFS (since 2019) and also Chief Operating Officer of AFS (since 2015). He also currently serves as President of Clough Global Opportunities Fund, Clough Global Dividend and Income Fund, Clough Global Equity Fund, Clough Funds Trust, Financial Investors Trust, Reaves Utility Income Fund and ALPS Series Trust. From 2004-2015, Mr. Swenson served as Chief Compliance Officer to ALPS, its affiliated entities, and to certain investment companies. Mr. Swenson is registered with FINRA, holding a Series 6, 26 and 27. |
Matthew Sutula, 1985 | Chief Compliance Officer (“CCO”) | Since December 2019 | Mr. Sutula joined ALPS in 2012 and currently serves as Chief Compliance Officer of AAI. Prior to his current role, Mr. Sutula served as interim Compliance Officer of the Trust (September 2019 to December 2019). Compliance Manager and Senior Compliance Analyst for AAI, as well as Compliance Analyst for AFS. Prior to joining ALPS, he spent seven years at Morningstar, Inc. in various analyst roles supporting the registered investment company databases. Mr. Sutula is also Chief Compliance Officer of Principal Real Estate Income Fund, ALPS Variable Investment Trust, RiverNorth Opportunities Fund, Inc., Liberty All-Star Equity Fund and Liberty All- Star Growth Fund, Inc. |
Kathryn Burns, 1976 | Treasurer | Since September 2018 | Ms. Burns serves as Vice President, Director of Fund Operations of AAI since 2018. From 2013 to 2018, she served as Vice President and Fund Controller at AFS. Prior to joining ALPS, she worked at Old Mutual Capital where she served as Vice President and Chief Compliance Officer (2010 – 2012) and Regulatory Reporting Manager and Assistant Treasurer to the Old Mutual Funds Trusts (2006 – 2012). She also served as a CPA for PricewaterhouseCoopers LLP. Ms. Burns also serves as Treasurer of Boulder Growth & Income Fund, Inc. and as President of ALPS Variable Investment Trust, Principal Real Estate Income Fund and RiverNorth Opportunities Fund, Inc. |
Richard C. Noyes,*** 1970 | Secretary | Since September 2019 | Mr. Noyes joined ALPS in 2015 and is Senior Vice President and General Counsel of ALPS. Prior to joining ALPS, Mr. Noyes served as Assistant Vice President and Senior Counsel of Janus Capital Management LLC. |
Sharon Akselrod,*** 1974 | Assistant Secretary | Since December 2016 | Ms. Akselrod joined ALPS in August 2014 and is currently Senior Investment Company Act Paralegal of AFS. Prior to joining ALPS, Ms. Akselrod served as Corporate Governance and Regulatory Associate for Nordstrom fsb (2013-2014) and Senior Legal Assistant – Legal Manager for AXA Equitable Life Insurance Company (2008-2013). Ms. Akselrod is also Secretary of Principal Real Estate Income Fund and Assistant Secretary of Financial Investors Trust and Clough Funds Trust. |
Cara Owen,*** 1981 | Assistant Secretary | Since March 2020 | Vice President and Principal Legal Counsel, ALPS Fund Services, Inc.; Vice President and Secretary, Boulder Growth & Income Fund, Inc.; Assistant Secretary, James Advantage Funds (since August 2019). Prior to joining ALPS, Ms. Owen was Senior Counsel, Corporate & Investments, Great-West Life & Annuity Insurance Company; Senior Counsel & Assistant Secretary, Great-West Funds, Inc., Great-West Capital Management, LLC, Great-West Trust Company, LLC, and Advised Assets Group, LLC (2014-2019). |
| * | The business address of each Officer is c/o ALPS Advisors, Inc., 1290 Broadway, Suite 1000, Denver, Colorado 80203. Each Officer is deemed an affiliate of the Trust as defined under the 1940 Act. |
| ** | This is the period for which the Officer began serving the Trust. Each Officer serves an indefinite term, until his/her successor is elected. |
| *** | Effective December 7, 2020, Mr. Noyes and Ms. Akselrod resigned from their respective positions held with the Trust. As of the same date, Ms. Owen was appointed to the position of Secretary and Jen Craig as Assistant Secretary. |
The Statement of Additional Information includes additional information about the Fund’s Trustees and is available, without charge, upon request by calling (toll-free) 1-866-759-5679.

Table of Contents
| Performance Overview | |
| ALPS Clean Energy ETF | 1 |
| ALPS Disruptive Technologies ETF | 4 |
| ALPS Medical Breakthroughs ETF | 7 |
| Disclosure of Fund Expenses | 10 |
| Report of Independent Registered Public Accounting Firm | 11 |
| Financial Statements | |
| Schedule of Investments | |
| ALPS Clean Energy ETF | 12 |
| ALPS Disruptive Technologies ETF | 14 |
| ALPS Medical Breakthroughs ETF | 16 |
| Statements of Assets and Liabilities | 18 |
| Statements of Operations | 19 |
| Statements of Changes in Net Assets | |
| ALPS Clean Energy ETF | 20 |
| ALPS Disruptive Technologies ETF | 21 |
| ALPS Medical Breakthroughs ETF | 22 |
| Financial Highlights | 23 |
| Notes to Financial Statements | 26 |
| Additional Information | 35 |
| Board Considerations Regarding Approval of Investment Advisory Agreements | 39 |
| Trustees & Officers | 40 |
Beginning on January 1, 2021, as permitted by regulations adopted by the U.S. Securities and Exchange Commission, paper copies of the Funds’ annual and semi-annual shareholder reports will no longer be sent by mail, unless you specifically request paper copies of the reports from your financial intermediary (such as a broker-dealer or bank). Instead, the reports will be made available on the Funds’ website (www.alpsfunds.com), and you will be notified by mail each time a report is posted and provided with a website link to access the report.
If you already elected to receive shareholder reports electronically, you will not be affected by this change and you need not take any action. You may elect to receive shareholder reports and other communications from a Fund electronically anytime by contacting your financial intermediary.
You may elect to receive all future reports in paper free of charge. You can contact your financial intermediary to request that you continue to receive paper copies of your shareholder reports. Your election to receive reports in paper will apply to all funds held in your account with your financial intermediary.
alpsfunds.com
ALPS Clean Energy ETF
| Performance Overview | November 30, 2020 (Unaudited) |
Investment Objective
The ALPS Clean Energy ETF (the “Fund” or “ACES”) seeks investment results that correspond (before fees and expenses) generally to the performance of its underlying index, the CIBC Atlas Clean Energy Total Return Index (ticker symbol NACEX) (the “Underlying Index”). The Underlying Index utilizes a rules-based methodology developed by CIBC National Trust Company, which is designed to provide exposure to a diverse set of U.S. and Canadian companies involved in the clean energy sector including renewables and clean technology.
Performance Overview
For the twelve month period ended November 30, 2020, the Fund generated a total return of 120.45%. Performance was in-line with the Fund’s Underlying Index, net of fees, which returned 121.39%. The Fund outperformed the S&P 1000 Total Return Index, which returned 8.56% for the same period.
The S&P 1000 Total Return Index returned 8.56% for the trailing twelve month period ended November 30, 2020, finishing at an all-time high once again. U.S. equity markets ended 2019 with solid gains in December 2019, before posting monthly losses in January, February, and March 2020. Global markets plummeted from mid-February through the majority of March due to the spread of the novel coronavirus ("COVID-19"). The spread of COVID-19 prompted shutdowns from global governments, causing global markets to weaken swiftly. The U.S., along with a number of other governments, introduced stimulus measures in late March in order to restart economic growth. These stimulus measures propelled U.S. equity markets to climb for five consecutive months from lows seen in April. U.S. equity markets fluctuated in September and October over uncertainty in the U.S. election, which ultimately saw Joe Biden win in November. Congress continued to grapple over secondary stimulus measures to combat COVID-19 related economic downfall, but were unable to agree before November 30, 2020. However, November also showed positive initial vaccine results from three candidates boosting markets. Two vaccines were approved for emergency use in the U.K., which prompted investor optimism and drove markets higher into the end of November 2020.
COVID-19 accelerated the adoption of clean energy mandates and legislation throughout 2020. President-elect Joe Biden, unveiled a $2 trillion plan to invest in clean energy infrastructure with the goal of 100% clean-electricity in the U.S. by 2035. China is expected to account for 40% of the global renewable capacity expansion between 2019 and 2024 and reach almost 16% renewable electricity generation by 2030. The European Union approved the largest Green stimulus plan in history, agreeing to pour more than 500 billion Euros into everything from electric cars to renewable energy and agriculture. Governments across the world are ramping up investment into clean energy amid the global pandemic to try to ensure a cleaner future.
The best performing stocks in the Fund for the period were Tesla, Inc. (TSLA), which increased 760.16%, Plug Power, Inc. (PLUG), which saw a gain of 576.67%, and Enphase Energy, Inc. (ENPH), which rose 524.46%. The largest detractors were Maxeon Solar Technologies (MAXN), which decreased 27.89%, Workhorse Group, Inc. (WKHS), which fell 17.09%, and REX American Resources Corp. (REX), which lost 10.55%.
The Fund's adviser believes the Fund’s underlying index has a differentiated approach to investing in the clean energy sector. First, by narrowing the list of constituents to companies whose primary operations are focused on clean energy, the Fund offers more pure-play exposure to the clean energy sector. Second, constituents are diversified across the sector and offer exposure to the full opportunity set of the transition from fossil fuels to renewable energy. Lastly, focusing on U.S. and Canadian based companies helps to further minimize the risk of investing in a global industry by reducing risks related to foreign holdings, including currency exchange rates, financial disclosures, and regulatory and policy changes.
ALPS Clean Energy ETF
| Performance Overview | November 30, 2020 (Unaudited) |
Fund Performance (as of November 30, 2020)
| | 1 Year | Since Inception^ |
| ALPS Clean Energy ETF - NAV | 120.45% | 55.21% |
| ALPS Clean Energy ETF - Market Price* | 119.72% | 55.25% |
| S&P 1000® Total Return Index | 8.56% | 4.98% |
| CIBC Atlas Clean Energy Total Return Index | 121.39% | 56.28% |
Total Expense Ratio (per the current prospectus) is 0.65%.
Performance data quoted represents past performance. Past performance does not guarantee future results. Total return figures assume reinvestment of dividends and capital gains distributions, if any. The table does not reflect the deduction of taxes that a shareholder would pay on Fund distributions or the redemption of Fund shares. Investment return and principal value of an investment will fluctuate so that an investor’s shares, when sold or redeemed, may be worth more or less than the original cost. Current performance data may be higher or lower than actual data quoted. For the most current month-end performance data please visit www.alpsfunds.com or call 1.866.759.5679.
NAV is an exchange-traded fund’s per-share value. The per-share dollar amount of the fund is derived by dividing the total value of all the securities in its portfolio, less any liabilities, by the number of fund shares outstanding. Market Price is the price at which a share can currently be traded in the market. Information detailing the number of days the Market Price of the Fund was greater than the Fund’s NAV and the number of days it was less than the Fund’s NAV can be obtained at www.alpsfunds.com.
| ^ | The Fund commenced operations on June 28, 2018, with the first day of trading on the exchange of June 29, 2018. |
| * | Market Price means the official closing price of a share or, if it more accurately reflects the market value of a share at the time as of which the Fund calculates current net asset value per share, the price that is the midpoint of the bid-ask spread as of that time. It does not represent the returns an investor would receive if shares were traded at other times. |
CIBC Atlas Clean Energy Total Return Index is an adjusted market cap weighted index designed to provide exposure to a diverse set of U.S. or Canadian based companies involved in the clean energy sector including renewables and clean technology. The clean energy sector is comprised of companies that provide the products and services which enable the evolution of a more sustainable energy sector. Clean energy business segments include but are not limited to: solar, wind, hydro, geothermal, electric vehicles, LED, biomass, smart grid, energy efficiency and storage. Total return assumes reinvestment of any dividends and distributions realized during a given time period.
The S&P 1000® Total Return Index combines the S&P MidCap 400® and the S&P SmallCap 600® to form an investable benchmark for the mid- to small-cap segment of the U.S. equity market. Total return assumes reinvestment of any dividends and distributions realized during a given time period.
One cannot invest directly in an index. Index performance does not reflect fund performance.
The Fund’s shares are not individually redeemable. Investors buy and sell shares of the Fund on a secondary market. Only market makers or “authorized participants” may trade directly with the Fund, typically in blocks of 50,000 shares.
The ALPS Clean Energy ETF is not suitable for all investors. Investments in the Fund are subject to investment risks, including possible loss of the principal amount invested.
ALPS Portfolio Solutions Distributor, Inc., a FINRA member, is the Distributor for the ALPS Clean Energy ETF.
ALPS Clean Energy ETF
| Performance Overview | November 30, 2020 (Unaudited) |
Top Ten Holdings* (as of November 30, 2020)
| Plug Power, Inc. | 8.07% |
| Enphase Energy, Inc. | 7.12% |
| Sunrun, Inc. | 6.87% |
| Cree, Inc. | 5.22% |
| Brookfield Renewable Partners LP | 4.96% |
| Tesla, Inc. | 4.93% |
| Universal Display Corp. | 4.67% |
| First Solar, Inc. | 4.56% |
| Northland Power, Inc. | 4.36% |
| Hannon Armstrong Sustainable | |
| Infrastructure Capital, Inc. | 4.14% |
| Total % of Top 10 Holdings | 54.90% |
| * | % of Total Investments (excluding investments purchased with collateral from securities loaned) |
Clean Energy Segment Allocation* (as of November 30, 2020)
Future holdings are subject to change.
Growth of $10,000 (as of November 30, 2020)
Comparison of change in value of a $10,000 investment in the Fund and the Index
The chart above compares historical performance of a hypothetical investment of $10,000 in the Fund since inception with the performance of the Fund’s benchmark index. Past performance does not guarantee future results. The chart does not reflect the deduction of taxes that a shareholder would pay on Fund distributions or the redemption of Fund shares.
ALPS Disruptive Technologies ETF
| Performance Overview | November 30, 2020 (Unaudited) |
Investment Objective
ALPS Disruptive Technologies ETF (the “Fund” or “DTEC”) seeks investment results that correspond (before fees and expenses) generally to the performance of the Indxx Disruptive Technologies Net Total Return Index (ticker symbol IDTEC) (the “Underlying Index”). The Fund will invest at least 80% of its net assets in securities that comprise the Underlying Index.
The Fund employs a “passive management” – or indexing – investment approach designed to track the performance of the Underlying Index. The Underlying Index utilizes a rules-based methodology developed by Indxx, LLC (the “Index Provider”), which is designed to identify the companies using disruptive technologies in each of ten thematic areas: Healthcare Innovation, Internet of Things, Clean Energy and Smart Grid, Cloud Computing, Data and Analytics, FinTech, Robotics and Artificial Intelligence, Cybersecurity, 3D Printing, and Mobile Payments (each a “Theme” and together, the “Themes”). Companies using disruptive technologies are those that are entering traditional markets with new digital forms of production and distribution, seek to disrupt an existing market and value network, displace established market-leading firms, products and alliances and increasingly gain market share. The Underlying Index is compiled by the Index Provider and may be comprised of U.S. and non-U.S. companies, including foreign and emerging markets companies. In order to be eligible for inclusion in the Underlying Index’s Index Universe, a company’s stock must be traded on one or more major global securities exchanges, have a minimum market capitalization of at least $500 million, and have a six month minimum average daily trading volume of $2 million, and the company must derive a minimum of 50% of its revenue from a single Theme. All equity securities meeting the above criteria are selected for inclusion in the Index Universe. From the Index Universe, the Underlying Index methodology selects ten stocks in each Theme according to proprietary quantitative and qualitative factors. The eligible stocks that are selected for inclusion in the Underlying Index’s portfolio are equally weighted. The Underlying Index is reconstituted annually on the third Friday of September and rebalanced quarterly.
Performance Overview
For the twelve-month period ended November 30, 2020, the Fund generated a total return of 35.42%. Performance, net of fees, was in-line with the Fund’s Underlying Index, which returned 36.02%. The Fund outperformed the Morningstar Global Markets Index, which returned 14.52% for the same period.
The S&P 500® Index (the "S&P 500") returned 17.46% for the trailing twelve-month period ended November 30, 2020, finishing at an all-time high once again. U.S. equity markets ended 2019 with solid gains in December 2019, before posting monthly losses in January, February, and March 2020. Global markets plummeted from mid-February through the majority of March due to the spread of the novel coronavirus ("COVID-19"). The spread of COVID-19 prompted shutdowns from global governments, causing global markets to weaken swiftly. The U.S., along with a number of other governments, introduced stimulus measures in late March in order to restart economic growth. These stimulus measures propelled the S&P 500 to climb for five consecutive months from lows seen in April. The S&P 500 fluctuated in September and October over uncertainty in the U.S. election, which ultimately saw Joe Biden win in November. Congress continued to grapple over secondary stimulus measures to combat COVID-19 related economic downfall, but were unable to agree before November 30, 2020. However, November also showed positive initial vaccine results from three candidates boosting markets. Two vaccines were approved for emergency use, which prompted investor optimism and drove markets higher into the end of November 2020.
Developed Markets (ex-U.S.), as represented by the Morningstar Developed Markets ex-North America Index, returned 6.96% for the trailing twelve-month period ended November 30, 2020. The U.S. Dollar weakened relative to the Euro, which contributed to positive performance from a U.S. investor’s perspective.
After starting the year relatively flat, developed international markets declined sharply in February and March amid the global COVID-19 pandemic. Developed nations in Europe and Asia saw significant losses as many countries ordered nationwide shutdowns in order to combat the spread of the highly infectious virus. Stimulus measures were later introduced across the globe, including massive measures by the European Union, Japan, Australia, and the U.K., to reinvigorate local economies. The stimulus measures and gradual reopening of economies spurred a healthy recovery for the remainder of the year from lows seen in late March. In November, three COVID-19 vaccine candidates showed efficacy against the virus in clinical testing, prompting investor optimism and gains in international developed markets. The trailing twelve-month period ended November 30, 2020 also saw a noticeable shift to value from growth, especially in the second half of the year when economies reopened. Many developed nations in Europe, particularly the U.K., France, Italy and Germany, saw a heavy resurgence of COVID-19 cases in the fall which led to partial lockdowns in November. Despite COVID-19 related volatility seen since the pandemic began in February, international developed markets in Asia and Europe ended the year higher.
DTEC employs an equal weighted strategy to its disruptive themes, resulting in 10 sub-themes, each with a 10% holding. The Fund picks the top 10 names from its universe that most represent the specific theme. All 10 themes were positive this year. Clean Energy & Smart Grid, adding 6.50% to return, was the largest contributor for the time period. Within that theme, SolarEdge Technologies, Inc. (SEDG), a solar power company, accounted for 1.19% of that contribution after gaining 240.62% during the time period. The worst performing thematic category was Internet of Things (IoT), although still contributing 2.69%. Landis+Gyr Group AG (LAND SW), an energy meter and related software manufacturer, was the worst performer in the theme, losing -42.32% and detracting -0.46%.
Looking forward, the Fund's adviser believes the Fund’s strategy of selecting the top disruptive themes in the market today is designed to provide exposure to high-growth areas of the market relative to the Morningstar Global Markets Index.
ALPS Disruptive Technologies ETF
| Performance Overview | November 30, 2020 (Unaudited) |
Fund Performance (as of November 30, 2020)
| | 1 Year | Since Inception^ |
| ALPS Disruptive Technologies ETF - NAV | 35.42% | 20.56% |
| ALPS Disruptive Technologies ETF - Market Price* | 35.14% | 20.58% |
| Indxx Disruptive Technologies Net Total Return Index | 36.02% | 20.89% |
| Morningstar® Global Markets Net Return Index | 14.52% | 8.20% |
Total Expense Ratio (per the current prospectus) is 0.50%.
Performance data quoted represents past performance. Past performance does not guarantee future results. Total return figures assume reinvestment of dividends and capital gains distributions, if any. The table does not reflect the deduction of taxes that a shareholder would pay on Fund distributions or the redemption of Fund shares. Investment return and principal value of an investment will fluctuate so that an investor’s shares, when sold or redeemed, may be worth more or less than the original cost. Current performance data may be higher or lower than actual data quoted. For the most current month-end performance data please visit www. alpsfunds.com or call 1.866.759.5679.
NAV is an exchange-traded fund’s per-share value. The per-share dollar amount of the fund is derived by dividing the total value of all the securities in its portfolio, less any liabilities, by the number of fund shares outstanding. Market Price is the price at which a share can currently be traded in the market. Information detailing the number of days the Market Price of the Fund was greater than the Fund’s NAV and the number of days it was less than the Fund’s NAV can be obtained at www.alpsfunds.com.
| ^ | The Fund commenced operations on December 28, 2017, with the first day of trading on the exchange of December 29, 2017. |
| * | Market Price means the official closing price of a share or, if it more accurately reflects the market value of a share at the time as of which the Fund calculates current net asset value per share, the price that is the midpoint of the bid-ask spread as of that time. It does not represent the returns an investor would receive if shares were traded at other times. |
Indxx Disruptive Technologies Net Total Return Index (Ticker: IDTEC) is based around companies that enter traditional markets with new digital forms of production and distribution, are likely to disrupt an existing market and value network, displace established market leading firms, products and alliances and increasingly gain market share. Total Return assumes reinvestment of any dividends and distributions realized during a given time period. Net Total Return (NTR) is obtained by reinvesting the net dividend, which is equal to the ordinary gross dividend minus the amount of withholding tax.
The Morningstar® Global Markets Net Return Index, measures the performance of performance of the stocks located in the developed and emerging countries across the world. Stocks in the index are weighted by their float capital, which removes corporate cross ownership, government holdings and other locked-in shares.
One cannot invest directly in an index. Index performance does not reflect fund performance.
The Fund’s shares are not individually redeemable. Investors buy and sell shares of the Fund on a secondary market. Only market makers or “authorized participants” may trade directly with the Fund, typically in blocks of 50,000 shares.
The ALPS Disruptive Technologies ETF is not suitable for all investors. Investments in the Fund are subject to investment risks, including possible loss of the principal amount invested.
ALPS Portfolio Solutions Distributor, Inc., a FINRA member, is the Distributor for the ALPS Disruptive Technologies ETF.
ALPS Disruptive Technologies ETF
| Performance Overview | November 30, 2020 (Unaudited) |
Top Ten Holdings* (as of November 30, 2020)
| Xinjiang Goldwind Science & Technology Co., Ltd. | 1.73% |
| Brooks Automation, Inc. | 1.46% |
| Xinyi Solar Holdings, Ltd. | 1.38% |
| Square, Inc. | 1.31% |
| SolarEdge Technologies, Inc. | 1.30% |
| Align Technology, Inc. | 1.28% |
| Brookfield Renewable Partners LP | 1.26% |
| StoneCo, Ltd. | 1.25% |
| Xero, Ltd. | 1.24% |
| GMO Payment Gateway, Inc. | 1.24% |
| Total % of Top 10 Holdings | 13.45% |
| * | % of Total Investments (excluding investments purchased with collateral from securities loaned) |
Thematic Allocation* (as of November 30, 2020)
Future holdings are subject to change.
Growth of $10,000 (as of November 30, 2020)
Comparison of change in value of a $10,000 investment in the Fund and the Index
The chart above compares historical performance of a hypothetical investment of $10,000 in the Fund since inception with the performance of the Fund’s benchmark index. Past performance does not guarantee future results. The chart does not reflect the deduction of taxes that a shareholder would pay on Fund distributions or the redemption of Fund shares.
ALPS Medical Breakthroughs ETF
| Performance Overview | November 30, 2020 (Unaudited) |
Investment Objective
ALPS Medical Breakthroughs ETF (the “Fund” or “SBIO”) seeks investment results that correspond (before fees and expenses) generally to the performance of the S-Network® Medical Breakthroughs Total Return Index (the “Underlying Index”). The Fund will normally invest at least 80% of its net assets in securities that comprise the Underlying Index (or depository receipts based on such securities).
The Fund employs a “passive management” – or indexing – investment approach designed to track the performance of the Underlying Index. The Underlying Index is comprised of small- and mid-cap stocks of biotechnology companies that have one or more drugs in either Phase II or Phase III of the U.S. Food and Drug Administration ("FDA") clinical trials. In a Phase II trial, the drug is administered to a group of 100-300 people to see if it is effective and to evaluate its safety. In a Phase III trial, the drug is given to a larger group, between 500-3,000 people, to confirm its effectiveness, monitor side effects, compare it to commonly used treatments and collect information that will allow the drug or treatment to be used safely. Stocks selected for inclusion in the Underlying Index must be listed on a U.S. stock exchange. Underlying Index constituents must have a market capitalization of no less than $200 million and no more than $5 billion. Stocks included in the Underlying Index must also sustain an average daily trading volume in excess of $1 million for the 90-day period preceding an Underlying Index reconstitution. Constituents must be able to sustain the monthly rates at which they use shareholder capital ("cash burn rates") for at least 24 months. The Underlying Index is reconstituted semi-annually on the third Fridays of June and December.
Performance Overview
For the twelve-month period ended November 30, 2020, the Fund generated a total return of 24.07%, in-line with the Fund’s Underlying Index, net of fees, which returned 24.52%. The Fund outperformed the broad market, as represented by the S&P 500® Index (the "S&P 500"), which return of 17.46% for the period, and also outperformed the NASDAQ Biotechnology Total Return Index’s return of 22.01% as the small- and mid-cap (SMID) biotech companies, in general, continued to release encouraging clinical trial results.
The S&P 500 declined 19.60% during the first quarter of 2020 as investors retreated from the equity markets due to the spread of the novel coronavirus ("COVID-19"), culminating into a global pandemic. However, investor sentiment reversed during the 2nd half of the year as biotech companies moved quickly to develop a vaccine to combat the pandemic. In addition, the fiscal stimulus bill passed by Congress and a supportive monetary policy enacted by the U.S. Federal Reserve were also key components that contributed to the reverse in market sentiment in the U.S.
Specifically for the biotech industry, during the 2nd half of 2020, acquisition activity lifted valuations in the space as investors appeared optimistic that the large amount of acquisition activity of SMID biotech companies seen in 2019, where drug manufactures spent approximately $342 billion on acquisitions, would continue into 2020. During the one year period ended November 30, 2020, four SBIO constituents were acquired at an average premium of roughly 64%. In addition, investors appeared to take note of the industry’s results and pace of innovation in developing new forms of treatments for diseases. Of note, immunotherapy-based techniques realized a milestone in November 2020 when the first mRNA-based vaccine, which was developed to combat COVID-19, was granted regulatory emergency use in the U.K., reinforcing the strong use-case in immune-based therapies.
The Fund’s volatility during the year was relatively higher than the S&P 500, but not unusual for the biotech industry as the space typically carries a higher beta relative to the broad market. Despite increased volatility, in part due to the pandemic, for the period, SBIO finished the period on a strong note, reaching all-time highs in November of 2020.
The best performing stocks in the Fund for the period were Fate Therapeutics, Inc. (FATE), Scholar Rock Holding Corp. (SRRK), and Replimune Group, Inc (REPL), which returned 274.30%, 254.18%, and 249.19%, respectively. In contrast, the worst performing stocks for the period were Intercept Pharmaceuticals, Inc. (ICPT), Gossamer Bio, Inc. (GOSS), and Assembly Biosciences, Inc. (ASMB), which declined 70.24%, 65.33%, and 64.46%, respectively.
Due to the high failure rate of companies within the space, the non-traditional metrics used to evaluate biotech companies, and the technical knowledge required to succeed in the space, biotechnology is a difficult industry for stock pickers. This environment makes a passive strategy attractive, as it provides a diversified, rules- based access vehicle for those looking to gain exposure to the biotechnology space, while mitigating single stock risk. The Fund and its Underlying Index focus on innovation, seeking to capture research and development opportunities in the biotechnology industry. Looking forward we believe the Fund’s strategy of providing exposure to small- and mid-cap biotechnology companies that have one or more drugs in either Phase II or Phase III FDA clinical trials can provide potential alpha and pure-play exposure to the biotech space.
ALPS Medical Breakthroughs ETF
| Performance Overview | November 30, 2020 (Unaudited) |
Fund Performance (as of November 30, 2020)
| | 1 Year | 5 Year | Since Inception^ |
| ALPS Medical Breakthroughs ETF - NAV | 24.07% | 9.74% | 13.19% |
| ALPS Medical Breakthroughs ETF - Market Price* | 24.14% | 9.76% | 13.21% |
| S-Network Medical Breakthroughs Total Return Index | 24.52% | 10.05% | 13.55% |
| NASDAQ Biotechnology Total Return Index | 22.01% | 5.95% | 6.73% |
Total Expense Ratio (per the current prospectus) is 0.50%
Performance data quoted represents past performance. Past performance does not guarantee future results. Total return figures assume reinvestment of dividends and capital gains distributions, if any. Investment return and principal value of an investment will fluctuate so that an investor’s shares, when sold or redeemed, may be worth more or less than the original cost. Current performance data may be higher or lower than actual data quoted. For most current month-end performance data please visit www.alpsfunds.com or call 1.844.234.5852.
NAV is an exchange-traded fund’s per-share value. The per-share dollar amount of the fund is derived by dividing the total value of all the securities in its portfolio, less any liabilities, by the number of fund shares outstanding. Market Price is the price at which a share can currently be traded in the market. Information detailing the number of days the Market Price of the Fund was greater than the Fund’s NAV and the number of days it was less than the Fund’s NAV can be obtained at www.alpsfunds.com.
| ^ | The Fund commenced investment operations on December 31, 2014. |
| * | Market Price means the official closing price of a share or, if it more accurately reflects the market value of a share at the time as of which the Fund calculates current net asset value per share, the price that is the midpoint of the bid-ask spread as of that time. It does not represent the returns an investor would receive if shares were traded at other times. |
NASDAQ Biotechnology Total Return Index (Ticker: NBI) is a modified market capitalization-weighted index designed to measure the performance of all the NASDAQ stocks in the biotechnology sector. Total return assumes reinvestment of any dividends and distributions realized during a given time period.
S-Network Medical Breakthroughs Total Return Index (Ticker: PMBI) is designed to capture research and development opportunities in the biotechnology industry. PMBI consists of small-cap and mid-cap biotechnology stocks listed on U.S. stock exchanges that have one or more drugs in either Phase II or Phase III U.S. FDA clinical trials. Total return assumes reinvestment of any dividends and distributions realized during a given time period.
One cannot invest directly in an index. Index performance does not reflect fund performance.
Companies in the pharmaceuticals and biotechnology industry may be subject to extensive litigation based on product liability and similar claims. Legislation introduced or considered by certain governments on such industries or on the healthcare sector cannot be predicted.
Companies in the pharmaceuticals industry are subject to competitive forces that may make it difficult to raise prices and, in fact, may result in price discounting. The profitability of some companies in the pharmaceuticals industry may be dependent on a relatively limited number of products. In addition, their products can become obsolete due to industry innovation, changes in technologies or other market developments. Many new products in the pharmaceuticals industry are subject to government approvals, regulation and reimbursement rates. The process of obtaining government approvals may be long and costly. Many companies in the pharmaceuticals industry are heavily dependent on patents and intellectual property rights. The loss or impairment of these rights may adversely affect the profitability of these companies.
The development of new drugs generally has a high failure rate, and such failures may negatively impact the stock price of the company developing the failed drug. Biotechnology companies may have persistent losses during a new product’s transition from development to production. In order to fund operations, biotechnology companies may require financing from the capital markets, which may not always be available on satisfactory terms or at all.
The Fund’s shares are not individually redeemable. Investors buy and sell shares of the Fund on a secondary market. Only market makers or “authorized participants” may trade directly with the Fund, typically in blocks of 50,000 shares.
The ALPS Medical Breakthroughs ETF is not suitable for all investors. Investments in the Fund are subject to investment risks, including possible loss of the principal amount invested.
ALPS Portfolio Solutions Distributor, Inc., a FINRA member, is the Distributor for the ALPS Medical Breakthroughs ETF.
ALPS Portfolio Solutions Distributor, Inc. is not affiliated with S-Network Global Indexes, Inc.
ALPS Medical Breakthroughs ETF
| Performance Overview | November 30, 2020 (Unaudited) |
Top Ten Holdings* (as of November 30, 2020)
| Mirati Therapeutics, Inc. | 6.49% |
| Acceleron Pharma, Inc. | 4.33% |
| Arrowhead Pharmaceuticals, Inc. | 3.92% |
| Kodiak Sciences, Inc. | 3.74% |
| Blueprint Medicines Corp. | 3.66% |
| United Therapeutics Corp. | 3.61% |
| Allakos, Inc. | 3.20% |
| Fate Therapeutics, Inc. | 3.11% |
| Emergent BioSolutions, Inc. | 2.66% |
| PTC Therapeutics, Inc. | 2.59% |
| Total % of Top 10 Holdings | 37.31% |
| * | % of Total Investments (excluding investments purchased with collateral from securities loaned) |
Sector Allocation* (as of November 30, 2020)
Future holdings are subject to change.
Growth of $10,000 (as of November 30, 2020)
Comparison of change in value of a $10,000 investment in the Fund and the Index
The chart above compares historical performance of a hypothetical investment of $10,000 in the Fund since inception with the performance of the Fund’s benchmark index. Past performance does not guarantee future results. The chart does not reflect the deduction of taxes that a shareholder would pay on Fund distributions or the redemption of Fund shares.
ALPS ETF Trust
| Disclosure of Fund Expenses | November 30, 2020 (Unaudited) |
Shareholder Expense Example: As a shareholder of a Fund, you incur certain ongoing costs, including management fees and other Fund expenses. These examples are intended to help you understand your ongoing costs (in dollars) of investing in a Fund and to compare these costs with the ongoing costs of investing in other funds. It is based on an investment of $1,000 invested at the beginning of the (six month) period and held through November 30, 2020.
Actual Return: The first line of the table provides information about actual account values and actual expenses. You may use the information in this line, together with the amount you invested, to estimate the expenses that you incurred over the period. Simply divide your account value by $1,000 (for example, an $8,600 account value divided by $1,000 = 8.6), then multiply the result by the number in the first line under the heading entitled “Expenses Paid During Period” to estimate the expenses attributable to your investment during this period.
Hypothetical 5% Return: The second line of the table provides information about hypothetical account values and hypothetical expenses based on the Fund’s actual expense ratio and an assumed rate of return of 5% per year before expenses, which is not the Fund’s actual return. The hypothetical account values and expenses may not be used to estimate the actual ending account balance or expenses you paid for the period. You may use this information to compare ongoing costs of investing in the Fund and other funds. To do so, compare this 5% hypothetical example with the 5% hypothetical examples that appear in the shareholder reports of the other funds.
The expenses shown in the table are meant to highlight ongoing Fund costs only and do not reflect any transaction costs, such as brokerage commissions and other fees to financial intermediaries. Therefore, the second line is useful in comparing ongoing costs only, and will not help you determine the relative total costs of owning different funds. In addition, if these costs were included, your costs would have been higher.
| | | Beginning Account Value 6/1/20 | | | Ending Account Value 11/30/20 | | | Expense Ratio(a) | | | Expenses Paid During Period 6/1/20 - 11/30/20(b) | |
| ALPS Clean Energy ETF | | | | | | | | | | | | | | | | |
| Actual | | $ | 1,000.00 | | | $ | 1,949.10 | | | | 0.65 | % | | $ | 4.79 | |
| Hypothetical (5% return before expenses) | | $ | 1,000.00 | | | $ | 1,021.75 | | | | 0.65 | % | | $ | 3.29 | |
| ALPS Disruptive Technologies ETF | | | | | | | | | | | | | | | | |
| Actual | | $ | 1,000.00 | | | $ | 1,277.60 | | | | 0.50 | % | | $ | 2.85 | |
| Hypothetical (5% return before expenses) | | $ | 1,000.00 | | | $ | 1,022.50 | | | | 0.50 | % | | $ | 2.53 | |
| ALPS Medical Breakthroughs ETF | | | | | | | | | | | | | | | | |
| Actual | | $ | 1,000.00 | | | $ | 1,181.60 | | | | 0.50 | % | | $ | 2.73 | |
| Hypothetical (5% return before expenses) | | $ | 1,000.00 | | | $ | 1,022.50 | | | | 0.50 | % | | $ | 2.53 | |
| (a) | Annualized, based on the Fund's most recent fiscal half year expenses. |
| (b) | Expenses are equal to the Fund's annualized expense ratio multiplied by the average account value over the period, multiplied by the number of days in the most recent fiscal half year (183), divided by 366. |
ALPS ETF Trust
Report of Independent Registered Public Accounting Firm
To the shareholders and the Board of Trustees of ALPS ETF Trust:
Opinion on the Financial Statements and Financial Highlights
We have audited the accompanying statements of assets and liabilities, including the statements of investments, of ALPS Clean Energy ETF, ALPS Disruptive Technologies ETF and ALPS Medical Breakthroughs ETF (the "Funds"), three of the funds constituting the ALPS ETF Trust, as of November 30, 2020, the related statements of operations for the year then ended, the statements of changes in net assets for each of the two years in the period then ended, and the financial highlights for the periods indicated in the table below, and the related notes.
In our opinion, the financial statements and financial highlights present fairly, in all material respects, the financial position of the Funds as of November 30, 2020, and the results of their operations for the year then ended, the changes in their net assets for each of the two years in the period then ended, and the financial highlights for the periods indicated in the table below, in conformity with accounting principles generally accepted in the United States of America.
| Individual Fund Comprising the ALPS ETF Trust | Statement of Operations, For the Year Ended | Statements of Changes in Net Assets for each of the Years in the Period then Ended | Financial Highlights for each of the Years in the Period then Ended |
| ALPS Clean Energy ETF | November 30, 2020 | November 30, 2020 and November 30, 2019 | November 30, 2020, 2019 and for the period June 28, 2018 (commencement of operations) to November 30, 2018 |
| ALPS Disruptive Technologies ETF | November 30, 2020 | November 30, 2020 and November 30, 2019 | November 30, 2020, 2019 and for the period December 28, 2017 (commencement of operations) to November 30, 2018 |
| ALPS Medical Breakthroughs ETF | November 30, 2020 | November 30, 2020 and November 30, 2019 | November 30, 2020, Five years |
Basis for Opinion
These financial statements and financial highlights are the responsibility of the Funds’ management. Our responsibility is to express an opinion on the Funds’ financial statements and financial highlights based on our audits. We are a public accounting firm registered with the Public Company Accounting Oversight Board (United States) (PCAOB) and are required to be independent with respect to the Funds in accordance with the U.S. federal securities laws and the applicable rules and regulations of the Securities and Exchange Commission and the PCAOB.
We conducted our audits in accordance with the standards of the PCAOB. Those standards require that we plan and perform the audit to obtain reasonable assurance about whether the financial statements and financial highlights are free of material misstatement, whether due to error or fraud. The Funds are not required to have, nor were we engaged to perform, an audit of their internal control over financial reporting. As part of our audits, we are required to obtain an understanding of internal control over financial reporting but not for the purpose of expressing an opinion on the effectiveness of the Funds’ internal control over financial reporting. Accordingly, we express no such opinion.
Our audits included performing procedures to assess the risks of material misstatement of the financial statements and financial highlights, whether due to error or fraud, and performing procedures that respond to those risks. Such procedures included examining, on a test basis, evidence regarding the amounts and disclosures in the financial statements and financial highlights. Our audits also included evaluating the accounting principles used and significant estimates made by management, as well as evaluating the overall presentation of the financial statements and financial highlights. Our procedures included confirmation of securities owned as of November 30, 2020, by correspondence with the custodian and brokers; when replies were not received from brokers, we performed other auditing procedures. We believe that our audits provide a reasonable basis for our opinion.
DELOITTE & TOUCHE LLP
Denver, Colorado
January 25, 2021
We have served as the auditor of one or more investment companies advised by ALPS Advisors, Inc. since 2007.
ALPS Clean Energy ETF
| Schedule of Investments | November 30, 2020 |
| Security Description | | Shares | | | Value | |
| COMMON STOCKS (89.77%) | | | | | | | | |
| Consumer Discretionary (8.28%) | | | | | | | | |
| Arcimoto, Inc.(a)(b) | | | 138,190 | | | $ | 1,865,565 | |
| Blink Charging Co.(a)(b) | | | 150,261 | | | | 3,794,090 | |
| Tesla, Inc.(a) | | | 52,869 | | | | 30,008,445 | |
| Workhorse Group, Inc.(a)(b) | | | 582,525 | | | | 14,778,659 | |
| Total Consumer Discretionary | | | | | | | 50,446,759 | |
| | | | | | | | | |
| Energy (2.33%) | | | | | | | | |
| Renewable Energy Group, Inc.(a) | | | 245,086 | | | | 14,234,594 | |
| | | | | | | | | |
| Financials (4.13%) | | | | | | | | |
| Hannon Armstrong Sustainable Infrastructure Capital, Inc.(b) | | | 461,265 | | | | 25,212,745 | |
| | | | | | | | | |
| Industrials (28.39%) | | | | | | | | |
| Acuity Brands, Inc. | | | 199,181 | | | | 23,646,768 | |
| Ameresco, Inc., Class A(a) | | | 140,590 | | | | 6,263,285 | |
| American Superconductor Corp.(a)(b) | | | 122,833 | | | | 2,441,920 | |
| Ballard Power Systems, Inc.(a)(b) | | | 1,178,188 | | | | 24,188,200 | |
| Covanta Holding Corp. | | | 754,464 | | | | 9,355,354 | |
| Orion Energy Systems, Inc.(a) | | | 165,149 | | | | 1,704,338 | |
| Plug Power, Inc.(a)(b) | | | 1,863,501 | | | | 49,177,791 | |
| Sunrun, Inc.(a) | | | 652,574 | | | | 41,816,942 | |
| TPI Composites, Inc.(a) | | | 220,494 | | | | 8,870,474 | |
| Willdan Group, Inc.(a) | | | 72,398 | | | | 2,814,834 | |
| Xebec Adsorption, Inc.(a)(b) | | | 577,970 | | | | 2,665,774 | |
| Total Industrials | | | | | | | 172,945,680 | |
| | | | | | | | | |
| Information Technology (26.83%) | | | | | | | | |
| Cleanspark, Inc.(a)(b) | | | 104,240 | | | | 1,136,216 | |
| Cree, Inc.(a)(b) | | | 351,876 | | | | 31,806,072 | |
| Enphase Energy, Inc.(a) | | | 317,410 | | | | 43,348,684 | |
| First Solar, Inc.(a) | | | 296,958 | | | | 27,744,786 | |
| Itron, Inc.(a) | | | 249,794 | | | | 19,636,306 | |
| SunPower Corp.(a)(b) | | | 517,346 | | | | 11,464,387 | |
| Universal Display Corp. | | | 124,224 | | | | 28,452,265 | |
| Total Information Technology | | | | | | | 163,588,716 | |
| | | | | | | | | |
| Utilities (19.81%) | | | | | | | | |
| Boralex, Inc., Class A(b) | | | 649,655 | | | | 20,529,638 | |
| Clearway Energy, Inc., Class C | | | 514,604 | | | | 15,062,459 | |
| Innergex Renewable Energy, Inc.(b) | | | 825,502 | | | | 16,335,875 | |
| Northland Power, Inc.(b) | | | 773,973 | | | | 26,526,172 | |
| Ormat Technologies, Inc.(b) | | | 257,253 | | | | 20,274,109 | |
| Security Description | | Shares | | | Value | |
| Utilities (continued) | | | | | | | | |
| Sunnova Energy International, Inc.(a) | | | 311,046 | | | $ | 12,600,473 | |
| TransAlta Renewables, Inc.(b) | | | 680,753 | | | | 9,403,795 | |
| Total Utilities | | | | | | | 120,732,521 | |
| | | | | | | | | |
| TOTAL COMMON STOCKS | | | | | | | | |
| (Cost $326,292,144) | | | | | | | 547,161,015 | |
| Security Description | | Shares | | | Value | |
| MASTER LIMITED PARTNERSHIPS (10.04%) | | | | | | | | |
| Energy (1.20%) | | | | | | | | |
| Enviva Partners LP | | | 163,619 | | | | 7,303,952 | |
| | | | | | | | | |
| Utilities (8.84%) | | | | | | | | |
| Brookfield Renewable Partners LP | | | 475,225 | | | | 30,203,335 | |
| NextEra Energy Partners LP | | | 373,074 | | | | 23,679,007 | |
| Total Utilities | | | | | | | 53,882,342 | |
| | | | | | | | | |
| TOTAL MASTER LIMITED PARTNERSHIPS | | | | | | | | |
| (Cost $46,413,613) | | | | | | | 61,186,294 | |
| | | 7 Day Yield | | | Shares | | | Value | |
| SHORT TERM INVESTMENTS (10.89%) | | | | | | | | | | | | |
| Money Market Fund (0.12%) | | | | | | | | | | | | |
| State Street Institutional Treasury Plus Money Market Fund | | | | | | | | | | | | |
| (Cost $704,665) | | | 0.01 | % | | | 704,665 | | | | 704,665 | |
| | | | | | | | | | | | | |
| Investments Purchased with Collateral from Securities Loaned (10.77%) | | | | | | | | | | | | |
| State Street Navigator Securities Lending Government Money Market Portfolio, 0.11% | | | | | | | | | | | | |
| (Cost $65,666,202) | | | | | | | 65,666,202 | | | | 65,666,202 | |
| | | | | | | | | | | | | |
| TOTAL SHORT TERM INVESTMENTS | | | | | | | | | | | | |
| (Cost $66,370,867) | | | | | | | | | | | 66,370,867 | |
| | | | | | | | | | | | | |
| TOTAL INVESTMENTS (110.71%) | | | | | | | | | | | | |
| (Cost $439,076,624) | | | | | | | | | | $ | 674,718,176 | |
| LIABILITIES IN EXCESS OF OTHER ASSETS (-10.71%) | | | | | | | | | | | (65,261,074 | ) |
| NET ASSETS - 100.00% | | | | | | | | | | $ | 609,457,102 | |
ALPS Clean Energy ETF
| Schedule of Investments | November 30, 2020 |
| (a) | Non-income producing security. |
| (b) | Security, or a portion of the security position is currently on loan. The total market value of securities on loan is $99,021,147. |
See Notes to Financial Statements.
ALPS Disruptive Technologies ETF
| Schedule of Investments | November 30, 2020 |
| Security Description | | Shares | | | Value | |
| COMMON STOCKS (98.65%) | | | | | | | | |
| Communication Services (1.92%) | | | | | | | | |
| Netflix, Inc.(a) | | | 2,732 | | | $ | 1,340,592 | |
| Spotify Technology SA(a) | | | 5,301 | | | | 1,544,552 | |
| Total Communication Services | | | | | | | 2,885,144 | |
| | | | | | | | | |
| Consumer Discretionary (2.99%) | | | | | | | | |
| Garmin, Ltd. | | | 13,214 | | | | 1,542,867 | |
| iRobot Corp.(a)(b) | | | 16,917 | | | | 1,326,800 | |
| Vivint Smart Home, Inc.(a) | | | 74,371 | | | | 1,638,393 | |
| Total Consumer Discretionary | | | | | | | 4,508,060 | |
| | | | | | | | | |
| Financials (2.77%) | | | | | | | | |
| American Express Co. | | | 12,781 | | | | 1,515,699 | |
| Moody's Corp. | | | 4,627 | | | | 1,306,387 | |
| S&P Global, Inc. | | | 3,814 | | | | 1,341,689 | |
| Total Financials | | | | | | | 4,163,775 | |
| | | | | | | | | |
| Health Care (8.49%) | | | | | | | | |
| ABIOMED, Inc.(a) | | | 4,828 | | | | 1,323,355 | |
| Align Technology, Inc.(a) | | | 4,004 | | | | 1,927,086 | |
| Boston Scientific Corp.(a) | | | 32,057 | | | | 1,062,690 | |
| DexCom, Inc.(a) | | | 3,366 | | | | 1,076,043 | |
| DiaSorin SpA | | | 7,342 | | | | 1,546,643 | |
| Insulet Corp.(a) | | | 6,165 | | | | 1,588,782 | |
| Intuitive Surgical, Inc.(a) | | | 1,863 | | | | 1,352,630 | |
| ResMed, Inc. | | | 7,632 | | | | 1,599,667 | |
| Smith & Nephew PLC, | | | | | | | | |
| Sponsored ADR | | | 32,753 | | | | 1,288,831 | |
| Total Health Care | | | | | | | 12,765,727 | |
| | | | | | | | | |
| Industrials (17.18%) | | | | | | | | |
| ABB, Ltd., Sponsored ADR(b) | | | 50,612 | | | | 1,333,120 | |
| ADT, Inc. | | | 120,053 | | | | 932,812 | |
| AeroVironment, Inc.(a) | | | 20,383 | | | | 1,740,504 | |
| Experian PLC | | | 34,713 | | | | 1,224,511 | |
| FANUC Corp. | | | 6,614 | | | | 1,606,936 | |
| IHS Markit, Ltd. | | | 17,020 | | | | 1,692,808 | |
| Proto Labs, Inc.(a) | | | 8,751 | | | | 1,209,038 | |
| RELX PLC, Sponsored ADR(b) | | | 57,553 | | | | 1,345,589 | |
| Schneider Electric SE | | | 10,400 | | | | 1,447,115 | |
| Sensata Technologies Holding PLC(a) | | | 31,138 | | | | 1,520,469 | |
| Siemens Gamesa Renewable Energy SA | | | 50,110 | | | | 1,789,024 | |
| Sunrun, Inc.(a) | | | 23,374 | | | | 1,497,806 | |
| Thomson Reuters Corp. | | | 17,271 | | | | 1,368,966 | |
| Verisk Analytics, Inc. | | | 7,234 | | | | 1,434,575 | |
| Vestas Wind Systems A/S | | | 8,745 | | | | 1,787,482 | |
| Wolters Kluwer NV | | | 15,461 | | | | 1,296,516 | |
| Security Description | | Shares | | | Value | |
| Industrials (continued) | | | | | | | | |
| Xinjiang Goldwind Science & Technology Co., Ltd., Class H | | | 1,622,800 | | | $ | 2,600,316 | |
| Total Industrials | | | | | | | 25,827,587 | |
| | | | | | | | | |
| Information Technology (63.30%) | | | | | | | | |
| Adobe, Inc.(a) | | | 2,756 | | | | 1,318,663 | |
| Adyen NV(a)(c)(d) | | | 811 | | | | 1,549,774 | |
| Afterpay, Ltd.(a) | | | 23,823 | | | | 1,661,460 | |
| Alarm.com Holdings, Inc.(a) | | | 22,953 | | | | 1,742,362 | |
| ams AG(a) | | | 72,227 | | | | 1,843,925 | |
| ANSYS, Inc.(a) | | | 4,137 | | | | 1,398,554 | |
| Autodesk, Inc.(a) | | | 5,754 | | | | 1,612,443 | |
| Avast PLC(c)(d) | | | 187,323 | | | | 1,268,632 | |
| Black Knight, Inc.(a) | | | 16,054 | | | | 1,470,867 | |
| Brooks Automation, Inc. | | | 30,128 | | | | 2,199,043 | |
| Check Point Software Technologies, Ltd.(a)(b) | | | 11,121 | | | | 1,308,719 | |
| Cognex Corp. | | | 20,994 | | | | 1,577,490 | |
| Crowdstrike Holdings, Inc.(a) | | | 10,153 | | | | 1,556,252 | |
| Dassault Systemes SE | | | 7,055 | | | | 1,304,830 | |
| Datadog, Inc.(a) | | | 16,280 | | | | 1,610,418 | |
| Dynatrace, Inc.(a) | | | 33,582 | | | | 1,276,788 | |
| FARO Technologies, Inc.(a) | | | 23,704 | | | | 1,567,308 | |
| Fidelity National Information Services, Inc. | | | 9,005 | | | | 1,336,432 | |
| First Solar, Inc.(a) | | | 18,794 | | | | 1,755,923 | |
| Fiserv, Inc.(a) | | | 13,827 | | | | 1,592,594 | |
| FleetCor Technologies, Inc.(a) | | | 5,629 | | | | 1,492,867 | |
| Fortinet, Inc.(a) | | | 11,247 | | | | 1,385,968 | |
| Global Payments, Inc. | | | 7,806 | | | | 1,523,653 | |
| GMO Payment Gateway, Inc. | | | 13,300 | | | | 1,865,057 | |
| Guidewire Software, Inc.(a) | | | 12,059 | | | | 1,476,986 | |
| Intuit, Inc. | | | 4,097 | | | | 1,442,226 | |
| Itron, Inc.(a) | | | 22,769 | | | | 1,789,871 | |
| Keyence Corp. | | | 3,076 | | | | 1,570,116 | |
| Mastercard, Inc., Class A | | | 3,948 | | | | 1,328,541 | |
| Materialise NV, ADR(a)(b) | | | 31,656 | | | | 1,378,935 | |
| Nemetschek SE | | | 17,619 | | | | 1,393,412 | |
| NortonLifeLock, Inc. | | | 58,450 | | | | 1,065,544 | |
| Nuance Communications, Inc.(a)(b) | | | 42,754 | | | | 1,843,979 | |
| Okta, Inc.(a) | | | 6,617 | | | | 1,621,430 | |
| Omron Corp. | | | 17,100 | | | | 1,544,569 | |
| Pagseguro Digital, Ltd.(a) | | | 35,836 | | | | 1,697,193 | |
| Palo Alto Networks, Inc.(a) | | | 5,541 | | | | 1,628,611 | |
| PayPal Holdings, Inc.(a) | | | 6,910 | | | | 1,479,569 | |
| Proofpoint, Inc.(a) | | | 12,827 | | | | 1,327,466 | |
| PTC, Inc.(a) | | | 15,678 | | | | 1,690,872 | |
ALPS Disruptive Technologies ETF
| Schedule of Investments | November 30, 2020 |
| Security Description | | Shares | | | Value | |
| Information Technology (continued) | | | | | | | | |
| Qorvo, Inc.(a) | | | 10,813 | | | $ | 1,694,181 | |
| Renishaw PLC(a) | | | 20,541 | | | | 1,533,524 | |
| salesforce.com, Inc.(a) | | | 5,301 | | | | 1,302,986 | |
| SAP SE, Sponsored ADR | | | 8,260 | | | | 1,000,782 | |
| ServiceNow, Inc.(a) | | | 2,901 | | | | 1,550,730 | |
| Silicon Laboratories, Inc.(a) | | | 13,734 | | | | 1,609,762 | |
| Skyworks Solutions, Inc. | | | 9,713 | | | | 1,371,184 | |
| SolarEdge Technologies, Inc.(a) | | | 7,022 | | | | 1,951,976 | |
| Splunk, Inc.(a) | | | 6,812 | | | | 1,390,874 | |
| Square, Inc.(a) | | | 9,310 | | | | 1,964,038 | |
| SS&C Technologies Holdings, Inc. | | | 22,084 | | | | 1,521,367 | |
| StoneCo, Ltd.(a) | | | 25,732 | | | | 1,884,097 | |
| Stratasys, Ltd.(a)(b) | | | 91,016 | | | | 1,556,374 | |
| Temenos AG | | | 8,224 | | | | 1,038,916 | |
| Trend Micro, Inc.(b) | | | 21,837 | | | | 1,185,975 | |
| Visa, Inc., Class A | | | 6,516 | | | | 1,370,641 | |
| VMware, Inc., Class A(a)(b) | | | 9,392 | | | | 1,313,847 | |
| Workday, Inc., Class A(a) | | | 6,337 | | | | 1,424,494 | |
| Xero, Ltd.(a) | | | 19,247 | | | | 1,871,988 | |
| Xinyi Solar Holdings, Ltd.(b) | | | 1,134,000 | | | | 2,068,721 | |
| Zoom Video Communications, Inc.(a) | | | 3,416 | | | | 1,634,078 | |
| Zscaler, Inc.(a) | | | 9,906 | | | | 1,542,860 | |
| Total Information Technology | | | | | | | 95,282,737 | |
| | | | | | | | | |
| Real Estate (0.82%) | | | | | | | | |
| Equinix, Inc. | | | 1,767 | | | | 1,232,995 | |
| | | | | | | | | |
| Utilities (1.18%) | | | | | | | | |
| China Longyuan Power Group Corp., Ltd., Class H | | | 2,119,000 | | | | 1,782,453 | |
| | | | | | | | | |
| TOTAL COMMON STOCKS | | | | | | | | |
| (Cost $109,594,127) | | | | | | | 148,448,478 | |
| Security Description | | Shares | | | Value | |
| MASTER LIMITED PARTNERSHIPS (1.26%) | | | | | | | | |
| Utilities (1.26%) | | | | | | | | |
| Brookfield Renewable Partners LP | | | 29,711 | | | | 1,888,308 | |
| | | | | | | | | |
| TOTAL MASTER LIMITED PARTNERSHIPS | | | | | | | | |
| (Cost $1,048,268) | | | | | | | 1,888,308 | |
| | | 7 Day Yield | | | Shares | | | Value | |
| SHORT TERM INVESTMENTS (3.35%) | | | | | | | | | | | | |
| Money Market Fund (0.07%) | | | | | | | | | | | | |
| State Street Institutional Treasury Plus Money Market Fund | | | | | | | | | | | | |
| (Cost $98,424) | | | 0.01 | % | | | 98,424 | | | $ | 98,424 | |
| | | | | | | | | | | | | |
| Investments Purchased with Collateral from Securities Loaned (3.29%) | | | | | | | | | | | | |
| | | | | | | | | | | | |
| State Street Navigator Securities Lending Government Money Market Portfolio, 0.11% | | | | | | | | | | | | |
| (Cost $4,944,275) | | | | | | | 4,944,275 | | | | 4,944,275 | |
| TOTAL SHORT TERM INVESTMENTS | | | | | | | | | | | | |
| (Cost $5,042,699) | | | | | | | | | | | 5,042,699 | |
| | | | | | | | | | | | | |
| TOTAL INVESTMENTS (103.27%) | | | | | | | | | | | | |
| (Cost $115,685,094) | | | | | | | | | | $ | 155,379,485 | |
| LIABILITIES IN EXCESS OF OTHER ASSETS (-3.27%) | | | | | | | | | | | (4,920,444 | ) |
| NET ASSETS - 100.00% | | | | | | | | | | $ | 150,459,041 | |
| (a) | Non-income producing security. |
| (b) | Security, or a portion of the security position is currently on loan. The total market value of securities on loan is $7,829,890. |
| (c) | Securities exempt from registration under Rule 144A of the Securities Act of 1933. These securities may be sold in the ordinary course of business in transactions exempt from registration, normally to qualified institutional buyers. At period end, the aggregate market value of those securities was $2,818,406, representing 1.87% of net assets. |
| (d) | Securities were purchased pursuant to Regulation S under the Securities Act of 1933, which exempts securities offered and sold outside of the United States from registration. Such securities cannot be sold in the United States without either an effective registration statement filed pursuant to the Securities Act of 1933, or pursuant to an exemption from registration. As of November 30, 2020, the market value of those securities was $2,818,406 representing 1.87% of net assets. |
See Notes to Financial Statements.
ALPS Medical Breakthroughs ETF
| Schedule of Investments | November 30, 2020 |
| Security Description | | Shares | | | Value | |
| COMMON STOCKS (100.01%) | | | | | | | | |
| Biotechnology (100.01%) | | | | | | | | |
| Acceleron Pharma, Inc.(a) | | | 89,046 | | | $ | 10,513,661 | |
| Adaptimmune Therapeutics PLC, ADR(a)(b) | | | 229,954 | | | | 1,152,070 | |
| Affimed NV(a)(b) | | | 136,756 | | | | 730,277 | |
| Akero Therapeutics, Inc.(a)(b) | | | 51,608 | | | | 1,485,278 | |
| Albireo Pharma, Inc.(a) | | | 28,233 | | | | 1,050,550 | |
| Alector, Inc.(a)(b) | | | 117,880 | | | | 1,545,407 | |
| Alkermes PLC(a) | | | 237,114 | | | | 4,329,702 | |
| Allakos, Inc.(a)(b) | | | 72,639 | | | | 7,774,552 | |
| AnaptysBio, Inc.(a) | | | 40,609 | | | | 1,047,306 | |
| Apellis Pharmaceuticals, Inc.(a)(b) | | | 112,443 | | | | 5,300,563 | |
| Aprea Therapeutics, Inc.(a)(b) | | | 31,501 | | | | 795,085 | |
| Aravive, Inc.(a)(b) | | | 23,829 | | | | 138,446 | |
| Arcturus Therapeutics Holdings, Inc.(a)(b) | | | 36,263 | | | | 3,327,493 | |
| Arcutis Biotherapeutics, Inc.(a)(b) | | | 56,802 | | | | 1,540,470 | |
| Ardelyx, Inc.(a) | | | 132,580 | | | | 835,254 | |
| Arena Pharmaceuticals, Inc.(a) | | | 85,683 | | | | 5,643,939 | |
| Arrowhead Pharmaceuticals, Inc.(a) | | | 151,937 | | | | 9,500,621 | |
| Assembly Biosciences, Inc.(a) | | | 48,853 | | | | 281,638 | |
| Aurinia Pharmaceuticals, Inc.(a)(b) | | | 188,181 | | | | 2,860,351 | |
| Avrobio, Inc.(a)(b) | | | 54,196 | | | | 746,279 | |
| Bioxcel Therapeutics, Inc.(a)(b) | | | 33,251 | | | | 1,463,044 | |
| Blueprint Medicines Corp.(a) | | | 82,186 | | | | 8,882,663 | |
| Catalyst Pharmaceuticals, Inc.(a) | | | 153,880 | | | | 563,201 | |
| CEL-SCI Corp.(a)(b) | | | 57,442 | | | | 718,025 | |
| ChemoCentryx, Inc.(a) | | | 102,461 | | | | 5,650,724 | |
| Chinook Therapeutics, Inc.(a) | | | 24,145 | | | | 337,547 | |
| Coherus Biosciences, Inc.(a)(b) | | | 106,285 | | | | 1,962,021 | |
| Concert Pharmaceuticals, Inc.(a) | | | 44,135 | | | | 503,139 | |
| Constellation Pharmaceuticals, Inc.(a)(b) | | | 70,640 | | | | 1,790,018 | |
| Cortexyme, Inc.(a)(b) | | | 43,859 | | | | 2,131,547 | |
| Crinetics Pharmaceuticals, Inc.(a)(b) | | | 48,902 | | | | 653,820 | |
| Deciphera Pharmaceuticals, Inc.(a) | | | 83,852 | | | | 5,182,054 | |
| Dicerna Pharmaceuticals, Inc.(a) | | | 110,734 | | | | 2,798,248 | |
| Eidos Therapeutics, Inc.(a)(b) | | | 57,355 | | | | 5,280,101 | |
| Emergent BioSolutions, Inc.(a) | | | 78,687 | | | | 6,446,826 | |
| Enanta Pharmaceuticals, Inc.(a) | | | 29,841 | | | | 1,229,449 | |
| Security Description | | Shares | | | Value | |
| Biotechnology (continued) | | | | | | | | |
| Epizyme, Inc.(a) | | | 150,929 | | | $ | 2,073,764 | |
| Fate Therapeutics, Inc.(a) | | | 129,154 | | | | 7,550,989 | |
| FibroGen, Inc.(a)(b) | | | 134,128 | | | | 5,540,828 | |
| Frequency Therapeutics, Inc.(a)(b) | | | 50,035 | | | | 1,436,005 | |
| G1 Therapeutics, Inc.(a)(b) | | | 56,538 | | | | 1,032,384 | |
| Global Blood Therapeutics, Inc.(a)(b) | | | 91,077 | | | | 4,181,345 | |
| Gossamer Bio, Inc.(a)(b) | | | 112,785 | | | | 997,019 | |
| Heron Therapeutics, Inc.(a)(b) | | | 135,134 | | | | 2,341,872 | |
| ImmunoGen, Inc.(a) | | | 259,599 | | | | 1,414,815 | |
| InflaRx NV(a)(b) | | | 38,821 | | | | 160,331 | |
| Intercept Pharmaceuticals, Inc.(a)(b) | | | 49,048 | | | | 1,741,694 | |
| Ironwood Pharmaceuticals, Inc.(a) | | | 258,734 | | | | 2,980,616 | |
| IVERIC bio, Inc.(a) | | | 133,117 | | | | 907,858 | |
| KalVista Pharmaceuticals, Inc.(a) | | | 26,622 | | | | 498,098 | |
| Karuna Therapeutics, Inc.(a)(b) | | | 39,582 | | | | 3,949,096 | |
| Karyopharm Therapeutics, Inc.(a)(b) | | | 109,290 | | | | 1,856,837 | |
| Kodiak Sciences, Inc.(a)(b) | | | 66,393 | | | | 9,073,931 | |
| Krystal Biotech, Inc.(a) | | | 29,234 | | | | 1,606,116 | |
| Kura Oncology, Inc.(a) | | | 83,700 | | | | 3,038,310 | |
| Ligand Pharmaceuticals, Inc.(a) | | | 23,904 | | | | 2,016,780 | |
| Madrigal Pharmaceuticals, Inc.(a) | | | 22,961 | | | | 2,681,615 | |
| Magenta Therapeutics, Inc.(a)(b) | | | 71,765 | | | | 513,120 | |
| MediciNova, Inc.(a)(b) | | | 66,873 | | | | 397,226 | |
| MEI Pharma, Inc.(a) | | | 167,358 | | | | 481,991 | |
| MeiraGTx Holdings PLC(a)(b) | | | 55,565 | | | | 784,578 | |
| Merus NV(a)(b) | | | 43,210 | | | | 740,187 | |
| Mirati Therapeutics, Inc.(a) | | | 66,191 | | | | 15,743,529 | |
| Molecular Templates, Inc.(a)(b) | | | 74,246 | | | | 664,502 | |
| MorphoSys AG, ADR(a) | | | 199,192 | | | | 5,575,384 | |
| Oyster Point Pharma, Inc.(a)(b) | | | 38,298 | | | | 839,875 | |
| PDL BioPharma, Inc.(a) | | | 169,531 | | | | 428,913 | |
| ProQR Therapeutics NV(a)(b) | | | 74,575 | | | | 293,826 | |
| PTC Therapeutics, Inc.(a) | | | 100,516 | | | | 6,289,286 | |
| Puma Biotechnology, Inc.(a)(b) | | | 59,012 | | | | 663,885 | |
| Replimune Group, Inc.(a) | | | 59,921 | | | | 3,096,717 | |
| Rigel Pharmaceuticals, Inc.(a)(b) | | | 251,245 | | | | 761,272 | |
| Rocket Pharmaceuticals, Inc.(a)(b) | | | 82,078 | | | | 2,541,135 | |
| Scholar Rock Holding Corp.(a)(b) | | | 44,429 | | | | 2,213,453 | |
| SpringWorks Therapeutics, Inc.(a)(b) | | | 63,975 | | | | 4,186,524 | |
| Syros Pharmaceuticals, Inc.(a)(b) | | | 68,057 | | | | 554,665 | |
ALPS Medical Breakthroughs ETF
| Schedule of Investments | November 30, 2020 |
| Security Description | | Shares | | | Value | |
| Biotechnology (continued) | | | | | | | | |
| uniQure NV(a)(b) | | | 66,111 | | | $ | 3,178,617 | |
| United Therapeutics Corp.(a) | | | 66,015 | | | | 8,756,230 | |
| Vericel Corp.(a) | | | 67,298 | | | | 1,718,791 | |
| Viela Bio, Inc.(a)(b) | | | 81,391 | | | | 3,120,531 | |
| Viking Therapeutics, Inc.(a)(b) | | | 108,212 | | | | 695,803 | |
| Vir Biotechnology, Inc.(a)(b) | | | 188,856 | | | | 6,020,729 | |
| Voyager Therapeutics, Inc.(a) | | | 55,663 | | | | 463,116 | |
| XBiotech, Inc.(a)(b) | | | 43,103 | | | | 821,543 | |
| Xenon Pharmaceuticals, Inc.(a)(b) | | | 52,048 | | | | 618,851 | |
| XOMA Corp.(a)(b) | | | 16,372 | | | | 542,077 | |
| Y-mAbs Therapeutics, Inc.(a) | | | 59,509 | | | | 3,027,223 | |
| Zymeworks, Inc.(a) | | | 67,854 | | | | 3,572,513 | |
| Total Biotechnology | | | | | | | 242,577,764 | |
| | | | | | | | | |
| TOTAL COMMON STOCKS | | | | | | | | |
| (Cost $192,196,526) | | | | | | | 242,577,764 | |
| | | 7 Day Yield | | | Shares | | | Value | |
| SHORT TERM INVESTMENTS (10.76%) | | | | | | | | | | | | |
| Money Market Fund (0.02%) | | | | | | | | | | | | |
| State Street Institutional Treasury Plus Money Market Fund | | | | | | | | | | | | |
| (Cost $39,915) | | | 0.01 | % | | | 39,915 | | | | 39,915 | |
| | | | | | | | | | | | | |
| Investments Purchased with Collateral from Securities Loaned (10.75%) | | | | | | | | | | | | |
| State Street Navigator Securities Lending Government Money Market Portfolio, 0.11% | | | | | | | | | | | | |
| (Cost $26,047,359) | | | | | | | 26,047,359 | | | | 26,047,359 | |
| TOTAL SHORT TERM INVESTMENTS | | | | | | | | | | | | |
| (Cost $26,087,274) | | | | | | | | | | | 26,087,274 | |
| | | | | | | | | | | | | |
| TOTAL INVESTMENTS (110.77%) | | | | | | | | | | | | |
| (Cost $218,283,800) | | | | | | | | | | $ | 268,665,038 | |
| LIABILITIES IN EXCESS OF OTHER ASSETS (-10.78%) | | | | | | | | | | | (26,123,008 | ) |
| NET ASSETS - 100.00% | | | | | | | | | | $ | 242,542,030 | |
| (a) | Non-income producing security. |
| (b) | Security, or a portion of the security position is currently on loan. The total market value of securities on loan is $44,040,825. |
See Notes to Financial Statements.
ALPS ETF Trust
| Statements of Assets and Liabilities | November 30, 2020 |
| | | ALPS Clean Energy ETF | | | ALPS Disruptive Technologies ETF | | | ALPS Medical Breakthroughs ETF | |
| ASSETS: | | | | | | | | | | | | |
| Investments, at value | | $ | 674,718,176 | | | $ | 155,379,485 | | | $ | 268,665,038 | |
| Foreign Currency, at value (Cost $33,294, $– and $–) | | | 33,294 | | | | – | | | | – | |
| Dividends receivable | | | 651,812 | | | | 80,614 | | | | 18,128 | |
| Receivable for shares sold | | | 3,502,627 | | | | – | | | | – | |
| Total Assets | | | 678,905,909 | | | | 155,460,099 | | | | 268,683,166 | |
| | | | | | | | | | | | | |
| LIABILITIES: | | | | | | | | | | | | |
| Payable to adviser | | | 280,641 | | | | 56,783 | | | | 93,777 | |
| Payable for investments purchased | | | 3,501,964 | | | | – | | | | – | |
| Payable for collateral upon return of securities loaned | | | 65,666,202 | | | | 4,944,275 | | | | 26,047,359 | |
| Total Liabilities | | | 69,448,807 | | | | 5,001,058 | | | | 26,141,136 | |
| NET ASSETS | | $ | 609,457,102 | | | $ | 150,459,041 | | | $ | 242,542,030 | |
| | | | | | | | | | | | | |
| NET ASSETS CONSIST OF: | | | | | | | | | | | | |
| Paid-in capital | | $ | 379,347,849 | | | $ | 114,534,241 | | | $ | 269,332,193 | |
| Total distributable earnings | | | 230,109,253 | | | | 35,924,800 | | | | (26,790,163 | ) |
| NET ASSETS | | $ | 609,457,102 | | | $ | 150,459,041 | | | $ | 242,542,030 | |
| | | | | | | | | | | | | |
| INVESTMENTS, AT COST | | $ | 439,076,624 | | | $ | 115,685,094 | | | $ | 218,283,800 | |
| | | | | | | | | | | | | |
| PRICING OF SHARES | | | | | | | | | | | | |
| Net Assets | | $ | 609,457,102 | | | $ | 150,459,041 | | | $ | 242,542,030 | |
| Shares of beneficial interest outstanding (Unlimited number of shares authorized, par value $0.01 per share) | | | 8,700,002 | | | | 3,500,002 | | | | 4,950,000 | |
| Net Asset Value, offering and redemption price per share | | $ | 70.05 | | | $ | 42.99 | | | $ | 49.00 | |
See Notes to Financial Statements.
ALPS ETF Trust
| Statements of Operations | For the Year Ended November 30, 2020 |
| | | ALPS Clean Energy ETF | | | ALPS Disruptive Technologies ETF | | | ALPS Medical Breakthroughs ETF | |
| INVESTMENT INCOME: | | | | | | | | | | | | |
| Dividends* | | $ | 2,246,306 | | | $ | 1,069,052 | | | $ | 78,347 | |
| Securities Lending Income | | | 749,461 | | | | 83,713 | | | | 253,619 | |
| Total Investment Income | | | 2,995,767 | | | | 1,152,765 | | | | 331,966 | |
| | | | | | | | | | | | | |
| EXPENSES: | | | | | | | | | | | | |
| Investment adviser fees | | | 1,601,573 | | | | 472,157 | | | | 979,880 | |
| Total Expenses | | | 1,601,573 | | | | 472,157 | | | | 979,880 | |
| NET INVESTMENT INCOME/(LOSS) | | | 1,394,194 | | | | 680,608 | | | | (647,914 | ) |
| | | | | | | | | | | | | |
| REALIZED AND UNREALIZED GAIN/LOSS | | | | | | | | | | | | |
| Net realized gain/(loss) on investments | | | 25,470,242 | | | | (462 | ) | | | 8,402,482 | |
| Net realized loss on foreign currency transactions | | | (7,833 | ) | | | (27,511 | ) | | | – | |
| Total net realized gain/(loss) | | | 25,462,409 | | | | (27,973 | ) | | | 8,402,482 | |
| Net change in unrealized appreciation on investments | | | 221,185,722 | | | | 30,917,821 | | | | 25,696,634 | |
| Net change in unrealized appreciation/(depreciation) on translation of assets and liabilities denominated in foreign currencies | | | (60 | ) | | | 616 | | | | – | |
| Total net change in unrealized appreciation | | | 221,185,662 | | | | 30,918,437 | | | | 25,696,634 | |
| NET REALIZED AND UNREALIZED GAIN ON INVESTMENTS | | | 246,648,071 | | | | 30,890,464 | | | | 34,099,116 | |
| NET INCREASE IN NET ASSETS RESULTING FROM OPERATIONS | | $ | 248,042,265 | | | $ | 31,571,072 | | | $ | 33,451,202 | |
| *Net of foreign tax withholding. | | $ | 201,029 | | | $ | 33,416 | | | $ | – | |
See Notes to Financial Statements.
ALPS Clean Energy ETF
Statement of Changes in Net Assets
| | | For the Year Ended November 30, 2020 | | | For the Year Ended November 30, 2019 | |
| OPERATIONS: | | | | | | | | |
| Net investment income | | $ | 1,394,194 | | | $ | 622,902 | |
| Net realized gain/(loss) | | | 25,462,409 | | | | (376,469 | ) |
| Net change in unrealized appreciation | | | 221,185,662 | | | | 14,645,242 | |
| Net increase in net assets resulting from operations | | | 248,042,265 | | | | 14,891,675 | |
| | | | | | | | | |
| DISTRIBUTIONS TO SHAREHOLDERS: | | | | | | | | |
| From distributable earnings | | | (671,822 | ) | | | (391,478 | ) |
| From tax return of capital | | | (1,796,052 | ) | | | (652,198 | ) |
| Total distributions | | | (2,467,874 | ) | | | (1,043,676 | ) |
| | | | | | | | | |
| CAPITAL SHARE TRANSACTIONS: | | | | | | | | |
| Proceeds from sale of shares | | | 307,508,147 | | | | 77,603,077 | |
| Cost of shares redeemed | | | (49,984,572 | ) | | | (1,362,989 | ) |
| Net increase from capital share transactions | | | 257,523,575 | | | | 76,240,088 | |
| Net increase in net assets | | | 503,097,966 | | | | 90,088,087 | |
| | | | | | | | | |
| NET ASSETS: | | | | | | | | |
| Beginning of year | | | 106,359,136 | | | | 16,271,049 | |
| End of year | | $ | 609,457,102 | | | $ | 106,359,136 | |
| | | | | | | | | |
| OTHER INFORMATION: | | | | | | | | |
| CAPITAL SHARE TRANSACTIONS: | | | | | | | | |
| Beginning shares | | | 3,300,002 | | | | 650,002 | |
| Shares sold | | | 6,400,000 | | | | 2,700,000 | |
| Shares redeemed | | | (1,000,000 | ) | | | (50,000 | ) |
| Shares outstanding, end of period | | | 8,700,002 | | | | 3,300,002 | |
See Notes to Financial Statements.
ALPS Disruptive Technologies ETF
Statement of Changes in Net Assets
| | | For the Year Ended November 30, 2020 | | | For the Year Ended November 30, 2019 | |
| OPERATIONS: | | | | | | | | |
| Net investment income | | $ | 680,608 | | | $ | 295,771 | |
| Net realized loss | | | (27,973 | ) | | | (1,828,096 | ) |
| Net change in unrealized appreciation | | | 30,918,437 | | | | 12,543,297 | |
| Net increase in net assets resulting from operations | | | 31,571,072 | | | | 11,010,972 | |
| | | | | | | | | |
| DISTRIBUTIONS TO SHAREHOLDERS: | | | | | | | | |
| From distributable earnings | | | (330,120 | ) | | | (147,001 | ) |
| Total distributions | | | (330,120 | ) | | | (147,001 | ) |
| | | | | | | | | |
| CAPITAL SHARE TRANSACTIONS: | | | | | | | | |
| Proceeds from sale of shares | | | 50,822,701 | | | | 22,068,308 | |
| Cost of shares redeemed | | | (6,514,699 | ) | | | (6,505,138 | ) |
| Net increase from capital share transactions | | | 44,308,002 | | | | 15,563,170 | |
| Net increase in net assets | | | 75,548,954 | | | | 26,427,141 | |
| | | | | | | | | |
| NET ASSETS: | | | | | | | | |
| Beginning of year | | | 74,910,087 | | | | 48,482,946 | |
| End of year | | $ | 150,459,041 | | | $ | 74,910,087 | |
| | | | | | | | | |
| OTHER INFORMATION: | | | | | | | | |
| CAPITAL SHARE TRANSACTIONS: | | | | | | | | |
| Beginning shares | | | 2,350,002 | | | | 1,850,002 | |
| Shares sold | | | 1,350,000 | | | | 750,000 | |
| Shares redeemed | | | (200,000 | ) | | | (250,000 | ) |
| Shares outstanding, end of period | | | 3,500,002 | | | | 2,350,002 | |
See Notes to Financial Statements.
ALPS Medical Breakthroughs ETF
Statements of Changes in Net Assets
| | | For the Year Ended November 30, 2020 | | | For the Year Ended November 30, 2019 | |
| OPERATIONS: | | | | | | | | |
| Net investment income/(loss) | | $ | (647,914 | ) | | $ | 158,073 | |
| Net realized gain/(loss) | | | 8,402,482 | | | | (9,081,617 | ) |
| Net change in unrealized appreciation | | | 25,696,634 | | | | 38,722,701 | |
| Net increase in net assets resulting from operations | | | 33,451,202 | | | | 29,799,157 | |
| | | | | | | | | |
| DISTRIBUTIONS TO SHAREHOLDERS: | | | | | | | | |
| From distributable earnings | | | (84,005 | ) | | | (4,900,375 | ) |
| Total distributions | | | (84,005 | ) | | | (4,900,375 | ) |
| | | | | | | | | |
| CAPITAL SHARE TRANSACTIONS: | | | | | | | | |
| Proceeds from sale of shares | | | 67,423,531 | | | | 23,073,262 | |
| Cost of shares redeemed | | | (55,818,424 | ) | | | (72,096,324 | ) |
| Net increase/(decrease) from capital share transactions | | | 11,605,107 | | | | (49,023,062 | ) |
| Net increase/(decrease) in net assets | | | 44,972,304 | | | | (24,124,280 | ) |
| | | | | | | | | |
| NET ASSETS: | | | | | | | | |
| Beginning of year | | | 197,569,726 | | | | 221,694,006 | |
| End of year | | $ | 242,542,030 | | | $ | 197,569,726 | |
| | | | | | | | | |
| OTHER INFORMATION: | | | | | | | | |
| CAPITAL SHARE TRANSACTIONS: | | | | | | | | |
| Beginning shares | | | 5,000,000 | | | | 6,600,000 | |
| Shares sold | | | 1,550,000 | | | | 650,000 | |
| Shares redeemed | | | (1,600,000 | ) | | | (2,250,000 | ) |
| Shares outstanding, end of period | | | 4,950,000 | | | | 5,000,000 | |
See Notes to Financial Statements.
ALPS Clean Energy ETF
| Financial Highlights | For a Share Outstanding Throughout the Periods Presented |
| | | For the Year Ended November 30, 2020 | | | For the Year Ended November 30, 2019 | | | For the Period June 28, 2018 (Commencement of Operations) to November 30, 2018 | |
| NET ASSET VALUE, BEGINNING OF PERIOD | | $ | 32.23 | | | $ | 25.03 | | | $ | 24.95 | |
| | | | | | | | | | | | | |
| INCOME/(LOSS) FROM INVESTMENT OPERATIONS: | | | | | | | | | | | | |
| Net investment income (a) | | | 0.25 | | | | 0.32 | | | | 0.09 | |
| Net realized and unrealized gain/(loss) | | | 38.08 | | | | 7.42 | | | | (0.01 | ) |
| Total from investment operations | | | 38.33 | | | | 7.74 | | | | 0.08 | |
| | | | | | | | | | | | | |
| DISTRIBUTIONS: | | | | | | | | | | | | |
| From net investment income | | | (0.18 | ) | | | (0.23 | ) | | | – | |
| Tax return of capital | | | (0.33 | ) | | | (0.31 | ) | | | – | |
| Total distributions | | | (0.51 | ) | | | (0.54 | ) | | | – | |
| | | | | | | | | | | | | |
| Net increase in net asset value | | | 37.82 | | | | 7.20 | | | | 0.08 | |
| NET ASSET VALUE, END OF PERIOD | | $ | 70.05 | | | $ | 32.23 | | | $ | 25.03 | |
| TOTAL RETURN(b) | | | 120.45 | % | | | 31.28 | % | | | 0.32 | % |
| | | | | | | | | | | | | |
| RATIOS/SUPPLEMENTAL DATA: | | | | | | | | | | | | |
| Net assets, end of period (000s) | | $ | 609,457 | | | $ | 106,359 | | | $ | 16,271 | |
| | | | | | | | | | | | | |
| Ratio of expenses to average net assets | | | 0.65 | % | | | 0.65 | % | | | 0.65 | %(c) |
| Ratio of net investment income to average net assets | | | 0.57 | % | | | 1.10 | % | | | 0.89 | %(c) |
| Portfolio turnover rate(d) | | | 34 | % | | | 15 | % | | | 9 | % |
| (a) | Based on average shares outstanding during the period. |
| (b) | Total return is calculated assuming an initial investment made at the net asset value at the beginning of the period and redemption at the net asset value on the last day of the period and assuming all distributions are reinvested at reinvestment prices. Total return calculated for a period of less than one year is not annualized. |
| (d) | Portfolio turnover for periods less than one year are not annualized and does not include securities received or delivered from processing creations or redemptions in-kind. |
See Notes to Financial Statements.
ALPS Disruptive Technologies ETF
| Financial Highlights | For a Share Outstanding Throughout the Periods Presented |
| | | For the Year Ended November 30, 2020 | | | For the Year Ended November 30, 2019 | | | For the Period December 28, 2017 (Commencement of Operations) to November 30, 2018 | |
| NET ASSET VALUE, BEGINNING OF PERIOD | | $ | 31.88 | | | $ | 26.21 | | | $ | 25.08 | |
| | | | | | | | | | | | | |
| INCOME/(LOSS) FROM INVESTMENT OPERATIONS: | | | | | | | | | | | | |
| Net investment income (a) | | | 0.25 | | | | 0.14 | | | | 0.13 | |
| Net realized and unrealized gain | | | 11.00 | | | | 5.61 | | | | 1.00 | (b) |
| Total from investment operations | | | 11.25 | | | | 5.75 | | | | 1.13 | |
| | | | | | | | | | | | | |
| DISTRIBUTIONS: | | | | | | | | | | | | |
| From net investment income | | | (0.14 | ) | | | (0.08 | ) | | | – | |
| Total distributions | | | (0.14 | ) | | | (0.08 | ) | | | – | |
| | | | | | | | | | | | | |
| Net increase in net asset value | | | 11.11 | | | | 5.67 | | | | 1.13 | |
| NET ASSET VALUE, END OF PERIOD | | $ | 42.99 | | | $ | 31.88 | | | $ | 26.21 | |
| TOTAL RETURN(c) | | | 35.42 | % | | | 22.04 | % | | | 4.47 | % |
| | | | | | | | | | | | | |
| RATIOS/SUPPLEMENTAL DATA: | | | | | | | | | | | | |
| Net assets, end of period (000s) | | $ | 150,459 | | | $ | 74,910 | | | $ | 48,483 | |
| | | | | | | | | | | | | |
| Ratio of expenses to average net assets | | | 0.50 | % | | | 0.50 | % | | | 0.50 | %(d) |
| Ratio of net investment income to average net assets | | | 0.72 | % | | | 0.48 | % | | | 0.53 | %(d) |
| Portfolio turnover rate(e) | | | 38 | % | | | 42 | % | | | 33 | % |
| (a) | Based on average shares outstanding during the period. |
| (b) | Net realized and unrealized loss on investments per share does not correlate to aggregate of the net realized and unrealized gain in the Statements of Operations for the year ended November 30, 2018, primarily due to the timing of the sales and repurchases of the Fund's shares in relation to the fluctuating market values for the Fund's portfolio. |
| (c) | Total return is calculated assuming an initial investment made at the net asset value at the beginning of the period and redemption at the net asset value on the last day of the period and assuming all distributions are reinvested at reinvestment prices. Total return calculated for a period of less than one year is not annualized. |
| (e) | Portfolio turnover for periods less than one year are not annualized and does not include securities received or delivered from processing creations or redemptions in-kind. |
See Notes to Financial Statements.
ALPS Medical Breakthroughs ETF
| Financial Highlights | For a Share Outstanding Throughout the Periods Presented |
| | | For the Year Ended November 30, 2020 | | | For the Year Ended November 30, 2019 | | | For the Year Ended November 30, 2018 | | | For the Year Ended November 30, 2017 | | | For the Year Ended November 30, 2016 | |
| NET ASSET VALUE, BEGINNING OF PERIOD | | $ | 39.51 | | | $ | 33.59 | | | $ | 31.70 | | | $ | 24.16 | | | $ | 32.23 | |
| | | | | | | | | | | | | | | | | | | | | |
| INCOME/(LOSS) FROM INVESTMENT OPERATIONS: | | | | | | | | | | | | | | | | | | | | |
| Net investment income/(loss) (a) | | | (0.13 | ) | | | 0.03 | | | | (0.10 | ) | | | 0.18 | | | | (0.09 | ) |
| Net realized and unrealized gain/(loss) | | | 9.64 | | | | 6.67 | | | | 2.57 | (b) | | | 7.36 | | | | (7.98 | ) |
| Total from investment operations | | | 9.51 | | | | 6.70 | | | | 2.47 | | | | 7.54 | | | | (8.07 | ) |
| | | | | | | | | | | | | | | | | | | | | |
| DISTRIBUTIONS: | | | | | | | | | | | | | | | | | | | | |
| From net investment income | | | (0.02 | ) | | | (0.78 | ) | | | (0.58 | ) | | | – | | | | – | |
| Total distributions | | | (0.02 | ) | | | (0.78 | ) | | | (0.58 | ) | | | – | | | | – | |
| | | | | | | | | | | | | | | | | | | | | |
| Net increase/(decrease) in net asset value | | | 9.49 | | | | 5.92 | | | | 1.89 | | | | 7.54 | | | | (8.07 | ) |
| NET ASSET VALUE, END OF PERIOD | | $ | 49.00 | | | $ | 39.51 | | | $ | 33.59 | | | $ | 31.70 | | | $ | 24.16 | |
| TOTAL RETURN(c) | | | 24.07 | % | | | 20.99 | % | | | 7.81 | % | | | 31.21 | % | | | (25.04 | )% |
| | | | | | | | | | | | | | | | | | | | | |
| RATIOS/SUPPLEMENTAL DATA: | | | | | | | | | | | | | | | | | | | | |
| Net assets, end of period (000s) | | $ | 242,542 | | | $ | 197,570 | | | $ | 221,694 | | | $ | 128,402 | | | $ | 118,370 | |
| | | | | | | | | | | | | | | | | | | | | |
| Ratio of expenses to average net assets | | | 0.50 | % | | | 0.50 | % | | | 0.50 | % | | | 0.50 | % | | | 0.50 | % |
| Ratio of net investment income/(loss) to average net assets | | | (0.33 | )% | | | 0.09 | % | | | (0.27 | )% | | | 0.66 | % | | | (0.38 | )% |
| Portfolio turnover rate(d) | | | 68 | % | | | 88 | % | | | 48 | % | | | 43 | % | | | 62 | % |
| (a) | Based on average shares outstanding during the period. |
| (b) | Net realized and unrealized loss on investments per share does not correlate to aggregate of the net realized and unrealized gain in the Statements of Operations for the year ended November 30, 2018, primarily due to the timing of the sales and repurchases of the Fund's shares in relation to the fluctuating market values for the Fund's portfolio. |
| (c) | Total return is calculated assuming an initial investment made at the net asset value at the beginning of the period and redemption at the net asset value on the last day of the period and assuming all distributions are reinvested at reinvestment prices. Total return calculated for a period of less than one year is not annualized. |
| (d) | Portfolio turnover for periods less than one year are not annualized and does not include securities received or delivered from processing creations or redemptions in-kind. |
See Notes to Financial Statements.
ALPS ETF Trust
| Notes to Financial Statements | November 30, 2020 |
1. ORGANIZATION
ALPS ETF Trust (the “Trust”), a Delaware statutory trust, is an open-end management investment company registered under the Investment Company Act of 1940, as amended (the “1940 Act”). As of November 30, 2020, the Trust consisted of sixteen separate portfolios. Each portfolio represents a separate series of the Trust. This report pertains to the ALPS Clean Energy ETF, ALPS Disruptive Technologies ETF, and the ALPS Medical Breakthroughs ETF (each a “Fund” and collectively, the “Funds”). ALPS Clean Energy ETF and ALPS Disruptive Technologies ETF are considered non-diversified and may invest a greater portion of assets in securities of individual issuers than a diversified fund. As a result, changes in the market value of a single investment could cause greater fluctuations in share price than would occur in a diversified fund. ALPS Medical Breakthroughs ETF has elected to qualify as a diversified series of the Trust under the 1940 Act.
The investment objective of the ALPS Clean Energy ETF is to seek investment results that correspond generally, before fees and expenses, to the performance of the CIBC Atlas Clean Energy Total Return Index. The investment objective of the ALPS Disruptive Technologies ETF is to seek investment results that correspond generally, before fees and expenses, to the performance of the Indxx Disruptive Technologies Total Return Index. The investment objective of the ALPS Medical Breakthroughs ETF is to seek investment results that correspond generally, before fees and expenses, to the performance of the S-Network Medical Breakthroughs Total Return Index.
The shares of the ALPS Clean Energy ETF and ALPS Disruptive Technologies ETF (“Shares”) are listed on the Cboe BZX Exchange, Inc. (the “Cboe BZX”). The shares of the ALPS Medical Breakthroughs ETF (“Shares”) are listed on the NYSE Arca, Inc. (the “NYSE Arca”). Each Fund issues and redeems Shares at net asset value (“NAV”) in blocks of 50,000 Shares, each of which is called a “Creation Unit”. Creation Units are issued and redeemed principally in-kind for securities included in the Underlying Index. Except when aggregated in Creation Units, Shares are not redeemable securities of the Fund.
Pursuant to the Trust’s organizational documents, its Officers and Trustees are indemnified against certain liability arising out of the performance of their duties to the Trust. Additionally, in the normal course of business, the Trust enters into contracts with service providers that contain general indemnification clauses. The Trust’s maximum exposure under these arrangements is unknown, as this would involve future claims that may be made against the Trust that have not yet occurred.
2. SIGNIFICANT ACCOUNTING POLICIES
The following is a summary of significant accounting policies consistently followed by the Funds in the preparation of the financial statements. The accompanying financial statements were prepared in accordance with accounting principles generally accepted in the United States of America (“U.S. GAAP”). The preparation of financial statements in conformity with U.S. GAAP requires management to make certain estimates and assumptions that affect the reported amounts of assets and liabilities and disclosures of contingent assets and liabilities at the date of the financial statements and the reported amounts of revenue and expenses during the period. Actual results could differ from those estimates. Each Fund is considered an investment company under U.S. GAAP and follows the accounting and reporting guidance applicable to investment companies in the Financial Accounting Standards Board (“FASB”) Accounting Standards Codification Topic 946.
A. Portfolio Valuation
Each Fund’s NAV is determined daily, as of the close of regular trading on the New York Stock Exchange (the “NYSE”), normally 4:00 p.m. Eastern time, on each day the NYSE is open for trading. The NAV is computed by dividing the value of all assets of the Fund (including accrued interest and dividends), less all liabilities (including accrued expenses and dividends declared but unpaid), by the total number of shares outstanding.
Portfolio securities listed on any exchange other than the NASDAQ Stock Market LLC (“NASDAQ”) are valued at the last sale price on the business day as of which such value is being determined. If there has been no sale on such day, the securities are valued at the mean of the most recent bid and ask prices on such day. Securities traded on the NASDAQ are valued at the NASDAQ Official Closing Price as determined by NASDAQ. Portfolio securities traded on more than one securities exchange are valued at the last sale price on the business day as of which such value is being determined at the close of the exchange representing the principal market for such securities. Portfolio securities traded in the over-the-counter market, but excluding securities traded on the NASDAQ, are valued at the last quoted sale price in such market.
The Funds’ investments are valued at market value or, in the absence of market value with respect to any portfolio securities, at fair value according to procedures adopted by the Trust’s Board of Trustees (the “Board”). When market quotations are not readily available or when events occur that make established valuation methods unreliable, securities of the Funds may be valued in good faith by or under the direction of the Board. These securities generally include, but are not limited to, restricted securities (securities which may not be publicly sold without registration under the Securities Act of 1933) for which a pricing service is unable to provide a market price; securities whose trading has been formally suspended; a security whose market price is not available from a pre-established primary pricing source or the pricing source is not willing to provide a price; a security with respect to which an event has occurred that is most likely to materially affect the value of the security after the market has closed but before the calculation of the Fund’s NAV or make it difficult or impossible to obtain a reliable market quotation; or a security whose price, as provided by the pricing service, does not reflect the security’s “fair value” due to the security being de-listed from a national exchange or the security’s primary trading market is temporarily closed at a time when, under normal conditions, it would be open. As a general principle, the current “fair value” of a security would be the amount which the owner might reasonably expect to receive from the sale on the applicable exchange or principal market. A variety of factors may be considered in determining the fair value of such securities.
ALPS ETF Trust
| Notes to Financial Statements | November 30, 2020 |
B. Fair Value Measurements
Each Fund discloses the classification of its fair value measurements following a three-tier hierarchy based on the inputs used to measure fair value. Inputs refer broadly to the assumptions that market participants would use in pricing the asset or liability; including assumptions about risk. Inputs may be observable or unobservable. Observable inputs reflect the assumptions market participants would use in pricing the asset or liability that are developed based on market data obtained from sources independent of the reporting entity. Unobservable inputs reflect the reporting entity’s own assumptions about the assumptions market participants would use in pricing the asset or liability that are developed based on the best information available.
Valuation techniques used to value the Funds’ investments by major category are as follows:
Equity securities, including restricted securities, for which market quotations are readily available, are valued at the last reported sale price or official closing price as reported by a third party pricing vendor on the primary market or exchange on which they are traded and are categorized as Level 1 in the hierarchy. In the event there were no sales during the day or closing prices are not available, securities are valued at the mean of the most recent quoted bid and ask prices on such day and are generally categorized as Level 2 in the hierarchy. Investments in open-end mutual funds are valued at their closing NAV each business day and are categorized as Level 1 in the hierarchy.
Changes in valuation techniques may result in transfers in or out of an assigned level within the disclosure hierarchy.
Various inputs are used in determining the value of each Fund’s investments as of the end of the reporting period. When inputs used fall into different levels of the fair value hierarchy, the level in the hierarchy within which the fair value measurement falls is determined based on the lowest level input that is significant to the fair value measurement in its entirety. The designated input levels are not necessarily an indication of the risk or liquidity associated with these investments.
These inputs are categorized in the following hierarchy under applicable financial accounting standards:
Level 1 – Unadjusted quoted prices in active markets for identical investments, unrestricted assets or liabilities that a Fund has the ability to access at the measurement date;
Level 2 – Quoted prices which are not active, quoted prices for similar assets or liabilities in active markets or inputs other than quoted prices that are observable (either directly or indirectly) for substantially the full term of the asset or liability; and
Level 3 – Significant unobservable prices or inputs (including the Fund’s own assumptions in determining the fair value of investments) where there is little or no market activity for the asset or liability at the measurement date.
ALPS ETF Trust
| Notes to Financial Statements | November 30, 2020 |
The following is a summary of the inputs used to value the Funds’ investments as of November 30, 2020:
ALPS Clean Energy ETF
| Investments in Securities at Value | | Level 1 - Quoted and Unadjusted Prices | | | Level 2 - Other Significant Observable Inputs | | | Level 3 – Significant Unobservable Inputs | | | Total | |
| Common Stocks* | | $ | 547,161,015 | | | $ | – | | | $ | – | | | $ | 547,161,015 | |
| Master Limited Partnerships* | | | 61,186,294 | | | | – | | | | – | | | | 61,186,294 | |
| Short Term Investments | | | 66,370,867 | | | | – | | | | – | | | | 66,370,867 | |
| Total | | $ | 674,718,176 | | | $ | – | | | $ | – | | | $ | 674,718,176 | |
ALPS Disruptive Technologies ETF
| Investments in Securities at Value | | Level 1 - Quoted and Unadjusted Prices | | | Level 2 - Other Significant Observable Inputs | | | Level 3 - Significant Unobservable Inputs | | | Total | |
| Common Stocks* | | $ | 148,448,478 | | | $ | – | | | $ | – | | | $ | 148,448,478 | |
| Master Limited Partnerships* | | | 1,888,308 | | | | – | | | | – | | | | 1,888,308 | |
| Short Term Investments | | | 5,042,699 | | | | – | | | | – | | | | 5,042,699 | |
| Total | | $ | 155,379,485 | | | $ | – | | | $ | – | | | $ | 155,379,485 | |
ALPS Medical Breakthroughs ETF
| Investments in Securities at Value | | Level 1 - Quoted and Unadjusted Prices | | | Level 2 - Other Significant Observable Inputs | | | Level 3 - Significant Unobservable Inputs | | | Total | |
| Common Stocks* | | $ | 242,577,764 | | | $ | – | | | $ | – | | | $ | 242,577,764 | |
| Short Term Investments | | | 26,087,274 | | | | – | | | | – | | | | 26,087,274 | |
| Total | | $ | 268,665,038 | | | $ | – | | | $ | – | | | $ | 268,665,038 | |
| * | For a detailed sector breakdown, see the accompanying Schedule of Investments. |
The Funds did not have any securities that used significant unobservable inputs (Level 3) in determining fair value and there were no transfers into or out of Level 3 during the year ended November 30, 2020.
C. Foreign Investment Risk
The Funds may directly purchase securities of foreign issuers. Investments in non-U.S. issuers may involve unique risks compared to investing in securities of U.S. issuers, including, among others, less liquidity generally, greater market volatility than U.S. securities and less complete financial information than for U.S. issuers. In addition, adverse political, economic or social developments could undermine the value of the Fund’s investments or prevent the Fund from realizing the full value of its investments. Financial reporting standards for companies based in foreign markets differ from those in the United States. Finally, the value of the currency of the country in which the Fund has invested could decline relative to the value of the U.S. dollar, which may affect the value of the investment to U.S. investors. The Fund will not enter into transactions to hedge against declines in the value of the Fund’s assets that are denominated in foreign currency.
Countries with emerging markets may have relatively unstable governments and may present the risks of nationalization of businesses, restrictions on foreign ownership and prohibitions on the repatriation of assets. The economies of emerging markets countries also may be based on only a few industries, making them more vulnerable to changes in local or global trade conditions and more sensitive to debt burdens, inflation rates or adverse news and events.
Because foreign markets may be open on different days than the days during which investors may purchase the shares of the Fund, the value of the Funds’ securities may change on the days when investors are not able to purchase the shares of the Fund. The value of securities denominated in foreign currencies is converted into U.S. dollars using exchange rates determined daily as of the close of regular trading on the NYSE. Any use of a different rate from the rates used by the Index may adversely affect a Fund's ability to track its Index.
ALPS ETF Trust
| Notes to Financial Statements | November 30, 2020 |
D. Foreign Currency Translation
The books and records of the Funds are maintained in U.S. dollars. Investment valuations and other assets and liabilities initially expressed in foreign currencies are converted each business day into U.S. dollars based upon current exchange rates. The portion of realized and unrealized gains or losses on investments due to fluctuations in foreign currency exchange rates is not separately disclosed and is included in realized and unrealized gains or losses on investments, when applicable.
E. Other Risks
Equity Risk: A principal risk of investing in the Funds is equity risk, which is the risk that the value of the securities held by the Fund will fall due to general market and economic conditions, perceptions regarding the industries in which the issuers of securities held by the Fund participate or factors relating to specific companies in which the Fund invests. For example, an adverse event, such as an unfavorable earnings report, may depress the value of equity securities of an issuer held by a Fund; the price of common stock of an issuer may be particularly sensitive to general movements in the stock market; or a drop in the stock market may depress the price of most or all of the common stocks and other equity securities held by a Fund. In addition, common stock of an issuer in a Fund’s portfolio may decline in price if the issuer fails to make anticipated dividend payments because, among other reasons, the issuer of the security experiences a decline in its financial condition.
Small- and Mid- Capitalization Company Risk: Investments in securities of small and mid-capitalization companies are subject to the risks of common stocks. Investments in smaller companies may involve greater risks because these companies generally have a limited track record. Smaller companies often have narrower markets, more limited managerial and financial resources and a less diversified product offering than larger, more established companies. As a result, their performance can be more volatile, which may increase the volatility of the Fund’s portfolio.
Concentration Risk: Each Fund seeks to track its respective Underlying Index, which may have concentration in certain industries or sectors, as well as regions, economies or markets. Underperformance or increased risk in such other concentrated areas may result in underperformance or increased risk in a Fund.
Non-Correlation Risk: Each Fund’s return may not match the return of its respective Underlying Index for a number of reasons. For example, a Fund incurs a number of operating expenses not applicable to its Underlying Index, and incurs costs in buying and selling securities, especially when rebalancing the Fund’s securities holdings to reflect changes in the composition of the Underlying Index. In addition, the performance of a Fund and its Underlying Index may vary due to asset valuation differences and differences between the Fund’s portfolio and the Underlying Index resulting from legal restrictions. Due to legal and regulatory rules and limitations, a Fund may not be able to invest in all securities included in its Underlying Index. For tax efficiency purposes, a Fund may sell certain securities to realize losses, causing it to deviate from the Underlying Index. The Fund may not be fully invested at times, either as a result of cash flows into the Fund or reserves of cash held by the Fund to meet redemptions and expenses. If a Fund utilizes a sampling approach or otherwise does not hold all of the securities in the Underlying Index, its return may not correlate as well with the return on its Underlying Index, as would be the case if it purchased all of the securities in the Underlying Index with the same weightings as the Underlying Index.
F. Securities Transactions and Investment Income
Securities transactions are recorded as of the trade date. Realized gains and losses from securities transactions are recorded on the highest cost basis. Dividend income and capital gains distributions, if any, are recorded on the ex-dividend date, net of any foreign taxes withheld. Interest income, if any, is recorded on the accrual basis.
G. Dividends and Distributions to Shareholders
Dividends from net investment income for both ALPS Disruptive Technology ETF and ALPS Medical Breakthroughs ETF, if any, are declared and paid annually or as the Board may determine from time to time. Dividends from net investment income for ALPS Clean Energy ETF, if any, are declared and paid quarterly or as the Board may determine from time to time. Distributions of net realized capital gains earned by the Funds, if any, are distributed at least annually.
H. Federal Tax and Tax Basis Information
The timing and character of income and capital gain distributions are determined in accordance with income tax regulations, which may differ from U.S. GAAP. Reclassifications are made to the Funds’ capital accounts for permanent tax differences to reflect income and gains available for distribution (or available capital loss carryforwards) under income tax regulations.
ALPS ETF Trust
| Notes to Financial Statements | November 30, 2020 |
For the year ended November 30, 2020, the following reclassifications, which had no impact on results of operations or net assets, were recorded to reflect permanent tax differences resulting primarily from in-kind transactions:
| Fund | | Paid-in Capital | | | Total Distributable Earnings | |
| ALPS Clean Energy ETF | | $ | 31,158,972 | | | $ | (31,158,972 | ) |
| ALPS Disruptive Technologies ETF | | | 1,567,865 | | | | (1,567,865 | ) |
| ALPS Medical Breakthroughs ETF | | | 3,610,912 | | | | (3,610,912 | ) |
Included in the amounts reclassified was a net operating loss offset to PIC of:
| | | Paid-in Capital | |
| ALPS Clean Energy ETF | | $ | – | |
| ALPS Disruptive Technologies ETF | | | – | |
| ALPS Medical Breakthroughs ETF | | | 529,109 | |
The tax character of the distributions paid during the fiscal years ended November 30, 2020 and November 30, 2019 was as follows:
| | | Ordinary Income | | | Long-Term Capital Gain | | | Return of Capital | |
| November 30, 2020 | | | | | | | | | | | | |
| ALPS Clean Energy ETF | | $ | 671,822 | | | $ | – | | | $ | 1,796,052 | |
| ALPS Disruptive Technologies ETF | | | 330,120 | | | | – | | | | – | |
| ALPS Medical Breakthroughs ETF | | | 84,005 | | | | – | | | | – | |
| | | Ordinary Income | | | Long-Term Capital Gain | | | Return of Capital | |
| November 30, 2019 | | | | | | | | | | | | |
| ALPS Clean Energy ETF | | $ | 391,478 | | | $ | – | | | $ | 652,198 | |
| ALPS Disruptive Technologies ETF | | | 147,001 | | | | – | | | | – | |
| ALPS Medical Breakthroughs ETF | | | 4,900,375 | | | | – | | | | – | |
The character of distributions made during the year may differ from its ultimate characterization for federal income tax purposes.
Under current law, capital losses maintain their character as short-term or long-term and are carried forward to the next tax year without expiration. As of November 30, 2020, the following amounts are available as carry forwards to the next tax year:
| Fund | | Short-Term | | | Long-Term | |
| ALPS Clean Energy ETF | | $ | 4,523,080 | | | $ | 692,732 | |
| ALPS Disruptive Technologies ETF | | | 2,154,912 | | | | 2,085,263 | |
| ALPS Medical Breakthroughs ETF | | | 37,950,571 | | | | 38,144,696 | |
The ALPS Medical Breakthroughs ETF used capital loss carryovers during the period ended November 30, 2020, in the amount of $2,927,334.
As of November 30, 2020, the components of distributable earnings on a tax basis for each Fund were as follows:
| | | Undistributed net investment income | | | Accumulated net realized loss on investments | | | Other accumulated gains/(losses) | | | Net unrealized appreciation/(depreciation) on investments | | | Total | |
| ALPS Clean Energy ETF | | $ | – | | | $ | (5,215,812 | ) | | $ | (123,929 | ) | | $ | 235,448,994 | | | $ | 230,109,253 | |
| ALPS Disruptive Technologies ETF | | | 538,544 | | | | (4,240,175 | ) | | | – | | | | 39,626,431 | | | | 35,924,800 | |
| ALPS Medical Breakthroughs ETF | | | – | | | | (76,095,267 | ) | | | (594,370 | ) | | | 49,899,474 | | | | (26,790,163 | ) |
ALPS ETF Trust
| Notes to Financial Statements | November 30, 2020 |
The ALPS Medical Breakthrough ETF elects to defer to the year ending November 30, 2021, late year ordinary losses in the amount of $594,370.
As of November 30, 2020, the cost of investments for federal income tax purposes and accumulated net unrealized appreciation/(depreciation) on investments were as follows:
| | | ALPS Clean Energy ETF | | | ALPS Disruptive Technologies ETF | | | ALPS Medical Breakthroughs ETF | |
| Gross appreciation (excess of value over tax cost) | | $ | 240,062,518 | | | $ | 40,997,048 | | | $ | 69,251,341 | |
| Gross depreciation (excess of tax cost over value) | | | (4,613,425 | ) | | | (1,371,077 | ) | | | (19,351,867 | ) |
| Net appreciation/(depreciation) of foreign currency | | | (99 | ) | | | 460 | | | | – | |
| Net unrealized appreciation/(depreciation) | | $ | 235,448,994 | | | $ | 39,626,431 | | | $ | 49,899,474 | |
| Cost of investments for income tax purposes | | $ | 439,269,083 | | | $ | 115,753,514 | | | $ | 218,765,564 | |
The differences between book-basis and tax-basis are primarily due to the deferral of losses from wash sales and investments in partnerships.
I. Income Taxes
No provision for income taxes is included in the accompanying financial statements, as each Fund intends to distribute to shareholders all taxable investment income and realized gains and otherwise comply with Subchapter M of the Internal Revenue Code of 1986, as amended, applicable to regulated investment companies. Each Fund evaluates tax positions taken (or expected to be taken) in the course of preparing the Fund’s tax returns to determine whether these positions meet a “more-likely-than-not” standard that, based on the technical merits, have a more than fifty percent likelihood of being sustained by a taxing authority upon examination. A tax position that meets the “more-likely-than-not” recognition threshold is measured to determine the amount of benefit to recognize in the financial statements.
As of and during the year ended November 30, 2020, each Fund did not have a liability for any unrecognized tax benefits. Each Fund files U.S. federal, state, and local tax returns as required. Each Fund’s tax returns are subject to examination by the relevant tax authorities until expiration of the applicable statute of limitations, which is generally three years after the filing of the tax return, but may extend to four years in certain jurisdictions. Tax returns for open years have incorporated no uncertain tax positions that require a provision for income taxes.
J. Lending of Portfolio Securities
The Funds have entered into a securities lending agreement with State Street Bank & Trust Co. (“SSB”), the Funds’ lending agent. Each Fund may lend their portfolio securities only to borrowers that are approved by SSB. Each Fund will limit such lending to not more than 33 1/3% of the value of its total assets. Each Funds’ securities held at SSB as custodian shall be available to be lent except those securities the Fund or ALPS Advisors, Inc. specifically identifies in writing as not being available for lending. The borrower pledges and maintains with each Fund collateral consisting of cash (U.S. Dollars only), securities issued or guaranteed by the U.S. government or its agencies or instrumentalities, and cash equivalents (including irrevocable bank letters of credit) issued by a person other than the borrower or an affiliate of the borrower. The initial collateral received by each Fund is required to have a value of no less than 102% of the market value of the loaned securities for U.S equity securities and a value of no less than 105% of the market value for non-U.S. equity securities. The collateral is maintained thereafter, at a market value equal to not less than 102% of the current value of the U.S. equity securities on loan and not less than 105% of the current value of the non-U.S. equity securities on loan. The market value of the loaned securities is determined at the close of each business day and any additional required collateral is delivered to each Fund on the next business day. During the term of the loan, each Fund is entitled to all distributions made on or in respect of the loaned securities. Loans of securities are terminable at any time and the borrower, after notice, is required to return borrowed securities within the customary time period for settlement of securities transactions.
Any cash collateral received is reinvested in a money market fund managed by SSB as disclosed in the Fund’s Schedule of Investments and is reflected in the Statements of Assets and Liabilities as a payable for collateral upon return of securities loaned. Non-cash collateral, in the form of securities issued or guaranteed by the U.S. government or its agencies or instrumentalities, is not disclosed in a Fund’s Statements of Assets and Liabilities as it is held by the lending agent on behalf of each Fund, and each Fund does not have the ability to re-hypothecate these securities. Income earned by the Fund from securities lending activity is disclosed in the Statement of Operations.
ALPS ETF Trust
| Notes to Financial Statements | November 30, 2020 |
The following is a summary of each Fund's securities lending agreement and related cash and non-cash collateral received as of November 30, 2020:
| | | Market Value of Securities on Loan | | | Cash Collateral Received | | | Non-Cash Collateral Received | | | Total Collateral Received | |
| ALPS Clean Energy ETF | | $ | 99,021,147 | | | $ | 65,666,202 | | | $ | 44,166,397 | | | $ | 109,832,599 | |
| ALPS Disruptive Technologies ETF | | | 7,829,890 | | | | 4,944,275 | | | | 3,114,841 | | | | 8,059,116 | |
| ALPS Medical Breakthroughs ETF | | | 44,040,825 | | | | 26,047,359 | | | | 17,796,763 | | | | 43,844,122 | |
The risks of securities lending include the risk that the borrower may not provide additional collateral when required or may not return the securities when due. To mitigate these risks, each Fund benefits from a borrower default indemnity provided by SSB. SSB’s indemnity allows for full replacement of securities lent wherein SSB will purchase the unreturned loaned securities on the open market by applying the proceeds of the collateral or to the extent such proceeds are insufficient or the collateral is unavailable, SSB will purchase the unreturned loan securities at SSB’s expense. However, the Funds could suffer a loss if the value of the investments purchased with cash collateral falls below the value of the cash collateral received.
The following tables reflect a breakdown of transactions accounted for as secured borrowings, the gross obligation by the type of collateral pledged or securities loaned, and the remaining contractual maturity of those transactions as of November 30, 2020:
| ALPS Clean Energy ETF | | | Remaining contractual maturity of the agreements | | | | |
| Securities Lending Transactions | | Overnight & Continuous | | | Up to 30 days | | | 30-90 days | | | Greater than 90 days | | | Total | |
| Common Stocks | | $ | 65,666,202 | | | $ | – | | | $ | – | | | $ | – | | | $ | 65,666,202 | |
| Total Borrowings | | | | | | | | | | | | | | | | | | | 65,666,202 | |
| Gross amount of recognized liabilities for securities lending (collateral received) | | | | | | | | | | | | | | | | | | $ | 65,666,202 | |
| ALPS Disruptive Technologies ETF | | | | | Remaining contractual maturity of the agreements | | | | |
| Securities Lending Transactions | | Overnight & Continuous | | | Up to 30 days | | | 30-90 days | | | Greater than 90 days | | | Total | |
| Common Stocks | | $ | 4,944,275 | | | $ | – | | | $ | – | | | $ | – | | | $ | 4,944,275 | |
| Total Borrowings | | | | | | | | | | | | | | | | | | | 4,944,275 | |
| Gross amount of recognized liabilities for securities lending (collateral received) | | | | | | | | | | | | | | | | | | $ | 4,944,275 | |
| ALPS Medical Breakthroughs ETF | | | | | Remaining contractual maturity of the agreements | | | | |
| Securities Lending Transactions | | Overnight & Continuous | | | Up to 30 days | | | 30-90 days | | | Greater than 90 days | | | Total | |
| Common Stocks | | $ | 26,047,359 | | | $ | – | | | $ | – | | | $ | – | | | $ | 26,047,359 | |
| Total Borrowings | | | | | | | | | | | | | | | | | | | 26,047,359 | |
| Gross amount of recognized liabilities for securities lending (collateral received) | | | | | | | | | | | | | | | | | | $ | 26,047,359 | |
3. INVESTMENT ADVISORY FEE AND OTHER AFFILIATED TRANSACTIONS
ALPS Advisors, Inc. (the “Adviser”) serves as the Funds’ investment adviser pursuant to an Investment Advisory Agreement with the Trust on behalf of each Fund (the “Advisory Agreement”). Pursuant to the Advisory Agreement, each Fund pays the Adviser an annual management fee for the services and facilities it provides, payable on a monthly basis as a percentage of the relevant Fund’s average daily net assets as set out below. From time to time, the Adviser may waive all or a portion of its fee.
| Fund | Advisory Fee |
| ALPS Clean Energy ETF | 0.65% |
| ALPS Disruptive Technologies ETF | 0.50% |
| ALPS Medical Breakthroughs ETF | 0.50% |
Out of the unitary management fee, the Adviser pays substantially all expenses of each Fund, including licensing fees to the Underlying Index provider, the cost of transfer agency, custody, fund administration, legal, audit, independent trustees and other services, except for interest expenses, distribution fees or expenses, brokerage expenses, taxes and extraordinary expenses not incurred in the ordinary course of each Fund's business. The Adviser’s unitary management fee is designed to pay substantially all of each Fund's expenses and to compensate the Adviser for providing services for each Fund.
ALPS ETF Trust
| Notes to Financial Statements | November 30, 2020 |
ALPS Fund Services, Inc., an affiliate of the Adviser, is the administrator for the Funds.
Effective July 1, 2020, each Trustee receives (1) a quarterly retainer of $10,000, (2) a per meeting fee of $5,000, (3) $1,500 for any special meeting held outside of a regularly scheduled board meeting, and (4) reimbursement for all reasonable out-of-pocket expenses relating to attendance at meetings. Prior to July 1, 2020, each Trustee who is not considered an "interested person" (as defined in the 1940 Act), received (1) a quarterly retainer of $5,000, (2) a per meeting fee of $3,750, (3) $1,500 for any special meeting held outside of a regularly scheduled board meeting, and (4) reimbursement for all reasonable out-of-pocket expenses relating to attendance at meetings. Prior to January 1, 2020, a Trustee who is considered an “interested person” (as defined in the 1940 Act) (“Interested Trustee”) received no compensation or expense reimbursements from the Trust. From January 1, 2020 to June 30, 2020, the Interested Trustee received (1) a quarterly retainer of $5,000, (2) a per meeting fee of $3,750, (3) $1,500 for any special meeting held outside of a regularly scheduled board meeting, and (4) reimbursement for all reasonable out-of-pocket expenses relating to attendance at meetings. In addition, the Chairman of the Board and Chairman of the Audit Committee each receives a quarterly retainer of $2,000, in connection with their respective roles.
4. PURCHASES AND SALES OF SECURITIES
For the year ended November 30, 2020, the cost of purchases and proceeds from sales of investment securities, excluding short-term investments and in-kind transactions, were as follows:
| Fund | | Purchases | | | Sales | |
| ALPS Clean Energy ETF | | $ | 85,552,802 | | | $ | 85,620,694 | |
| ALPS Disruptive Technologies ETF | | | 37,032,825 | | | | 35,987,030 | |
| ALPS Medical Breakthroughs ETF | | | 132,705,841 | | | | 133,379,435 | |
For the year or period ended November 30, 2020, the cost of in-kind purchases and proceeds from in-kind sales were as follows:
| Fund | | Purchases | | | Sales | |
| ALPS Clean Energy ETF | | $ | 307,496,931 | | | $ | 50,201,011 | |
| ALPS Disruptive Technologies ETF | | | 50,263,060 | | | | 6,739,957 | |
| ALPS Medical Breakthroughs ETF | | | 67,366,514 | | | | 55,782,541 | |
For the year ended November 30, 2020, the in-kind net realized gains/(losses) were as follows:
| Fund | | Net Realized Gain/(Loss) | |
| ALPS Clean Energy ETF | | $ | 31,126,208 | |
| ALPS Disruptive Technologies ETF | | | 1,884,777 | |
| ALPS Medical Breakthroughs ETF | | | 4,999,126 | |
Gains on in-kind transactions are not considered taxable for federal income tax purposes and losses on in-kind transactions are also not deductible for tax purposes.
5. CAPITAL SHARE TRANSACTIONS
Shares are created and redeemed by each Fund only in Creation Unit size aggregations of 50,000 Shares. Only broker-dealers or large institutional investors with creation and redemption agreements called Authorized Participants (“AP”) are permitted to purchase or redeem Creation Units from the Funds. Such transactions are generally permitted on an in-kind basis, with a balancing cash component to equate the transaction to the NAV per unit of each Fund on the transaction date. Cash may be substituted equivalent to the value of certain securities generally when they are not available in sufficient quantity for delivery, not eligible for trading by the AP or as a result of other market circumstances.
ALPS ETF Trust
| Notes to Financial Statements | November 30, 2020 |
6. RELATED PARTY TRANSACTIONS
The ALPS Clean Energy ETF and ALPS Disruptive Technologies ETF engaged in cross trades between other funds in the Trust during the year ended November 30, 2020 pursuant to Rule 17a-7 under the 1940 Act. Cross trading is the buying or selling of portfolio securities between funds to which the Adviser serves as the investment adviser. The Board previously adopted procedures that apply to transactions between the Funds of the Trust pursuant to Rule 17a-7. These transactions related to cross trades during the period complied with the requirements set forth by Rule 17a-7 and the Trust’s procedures.
Transactions related to cross trades during the year ended November 30, 2020, were as follows:
| Fund | | Purchase cost paid | | | Sale proceeds received | | | Realized gain/(loss) on sales | |
| ALPS Clean Energy ETF | | $ | – | | | $ | 1,424,313 | | | $ | (257,791 | ) |
| ALPS Disruptive Technologies ETF | | | 1,208,071 | | | | – | | | | – | |
7. MARKET DISRUPTIONS RISK
The Funds are subject to investment and operational risks associated with financial, economic and other global market developments and disruptions, including the recent spread of an infectious respiratory illness caused by a novel strain of coronavirus (known as COVID-19), which can negatively impact the securities markets and cause each Fund to lose value.
The spread of COVID-19 has caused volatility, severe market dislocations and liquidity constraints in many markets, including markets for the securities each Fund holds, and may adversely affect each Fund’s investments and operations. The transmission of COVID-19 and efforts to contain its spread have resulted in travel restrictions and disruptions, closed international borders, enhanced health screenings at ports of entry and elsewhere, disruption of and delays in healthcare service preparation and delivery, quarantines, event and service cancellations or interruptions, disruptions to business operations and supply chains, and a reduction in consumer and business spending, as well as general concern and uncertainty that has negatively affected the economy. These disruptions have led to instability in the market place and the jobs market. The impact of COVID-19 could adversely affect the economies of many nations or the entire global economy, the financial well-being and performance of individual issuers, borrowers and sectors and the health of the markets generally in potentially significant and unforeseen ways.
The foregoing could lead to a significant economic downturn or recession, increased market volatility, a greater number of market closures, higher default rates and adverse effects on the values and liquidity of each Fund’s securities or other assets. Such impacts may adversely affect the performance of the Funds.
8. SUBSEQUENT EVENTS
Effective January 1, 2021, the ALPS Clean Energy ETF changed it's management fee from 0.65% to 0.55%.
ALPS ETF Trust
| Additional Information | November 30, 2020 (Unaudited) |
PROXY VOTING RECORDS, POLICIES AND PROCEDURES
Information regarding how each Fund voted proxies relating to portfolio securities during the most recent 12-month period ended June 30 and a description of the Fund’s proxy voting policies and procedures used in determining how to vote for proxies are available without charge on the SEC’s website at www.sec.gov and upon request, by calling (toll-free) 1-866-675-2639.
PORTFOLIO HOLDINGS
The Fund files a complete schedule of portfolio holdings with the U.S. Securities and Exchange Commission (“SEC”) for the first and third quarters of each fiscal year as an exhibit to its reports on Form N-PORT within 60 days after the end of the period. Copies of the Fund’s Form N-PORT are available without a charge, upon request, by contacting the Fund at 1-866-759-5679 and on the SEC’s website at https://www.sec.gov.
TAX INFORMATION
The Funds designate the following as a percentage of taxable ordinary income distributions, or up to the maximum amount allowable, for the calendar year ended December 31, 2019:
| | Qualified Dividend Income | Dividend Received Deduction |
| ALPS Clean Energy ETF | 30.12% | 3.50% |
| ALPS Disruptive Technologies ETF | 100.00% | 59.30% |
| ALPS Medical Breakthroughs ETF | 0.00% | 0.00% |
In early 2020, if applicable, shareholders of record received this information for the distribution paid to them by the Funds during the calendar year 2019 via Form 1099. The Funds will notify shareholders in early 2021 of amounts paid to them by the Fund, if any, during the calendar year 2020.
LICENSING AGREEMENT
ALPS Clean Energy ETF
CIBC NTC is the designer of the construction and methodology for the Underlying Index. “CIBC NTC” and “CIBC Atlas Clean Energy Index” are service marks or trademarks of the Index Provider. CIBC NTC acts as brand licensor for the Underlying Index and is not responsible for the descriptions of the Fund that appear herein.
The Fund is not sponsored by CIBC NTC or any of its affiliates. CIBC NTC makes no representation or warranty, express or implied, to the owners of the Fund or any member of the public regarding the advisability of investing in securities or commodities generally or in the Fund particularly. CIBC NTC does not guarantee the quality, accuracy or completeness of the Underlying Index or any Underlying Index data included herein or derived therefrom and assumes no liability in connection with their use. The Underlying Index is determined and composed without regard to the Adviser or the Fund. CIBC NTC has no obligation to take the needs of the Adviser, the Fund or the shareholders of the Fund into consideration in determining, composing or calculating the Underlying Index. CIBC NTC is not responsible for and has not participated in the determination of the timing of, prices at, or quantities of the Fund to be issued or in the determination or calculation of the equation by which the Fund is to be converted into cash. CIBC NTC has no obligation or liability in connection with the administration, marketing or trading of the Fund and is not responsible for and has not participated in the determination of pricing or the timing of the issuance or sale of the Shares of the Fund or in the determination or calculation of the NAV of the Fund.
CIBC NTC has no obligation or liability in connection with the administration, marketing or trading of the Fund. CIBC NTC makes no warranty, express or implied, as to results to be obtained by the Adviser, the Fund, Fund shareholders or any other person or entity from the use of the Underlying Index or any data included therein. CIBC NTC makes no express or implied warranties, and expressly disclaims all warranties of merchantability or fitness for a particular purpose or use with respect to the Underlying Index or any data included therein. Without limiting any of the foregoing, in no event shall CIBC NTC have any liability for any special, punitive, indirect, or consequential damages (including lost profits) arising out of matters relating to the use of the Underlying Index, even if notified of the possibility of such damages.
All intellectual property rights in the Underlying Index vests in CIBC NTC.
ALPS ETF Trust
| Additional Information | November 30, 2020 (Unaudited) |
The Underlying Index is the property of CIBC NTC, which has contracted with S&P Opco, LLC (a subsidiary of S&P Dow Jones Indices LLC) to calculate and maintain the Underlying Index. The Underlying Index is not sponsored by S&P Dow Jones Indices or its affiliates or its third party licensors (collectively, “S&P Dow Jones Indices”). S&P Dow Jones Indices will not be liable for any errors or omissions in calculating the Underlying Index. “Calculated by S&P Dow Jones Indices” and the related stylized mark(s) are service marks of S&P Dow Jones Indices and have been licensed for use by CIBC NTC. S&P® is a registered trademark of Standard & Poor’s Financial Services LLC (“SPFS”), and Dow Jones® is a registered trademark of Dow Jones Trademark Holdings LLC (“Dow Jones”).
The Fund is not sponsored, endorsed, sold or promoted by S&P Dow Jones Indices. S&P Dow Jones Indices does not make any representation or warranty, express or implied, to the owners of the Fund or any member of the public regarding the advisability of investing in securities generally or in the Fund particularly or the ability of the Underlying Index to track general market performance. S&P Dow Jones Indices’ only relationship to CIBC NTC with respect to the Underlying Index is the licensing of certain trademarks, service marks and trade names of S&P Dow Jones Indices, and the provision of the calculation services related to the Underlying Index. S&P Dow Jones Indices is not responsible for and has not participated in the determination of the prices and amount of the Fund or the timing of the issuance or sale of the Fund or in the determination or calculation of the equation by which the Fund may be converted into cash or other redemption mechanics. S&P Dow Jones Indices has no obligation or liability in connection with the administration, marketing or trading of the Fund. S&P Dow Jones Indices LLC is not an investment advisor. Inclusion of a security within the Underlying Index is not a recommendation by S&P Dow Jones Indices to buy, sell, or hold such security, nor is it investment advice.
S&P DOW JONES INDICES DOES NOT GUARANTEE THE ADEQUACY, ACCURACY, TIMELINESS AND/OR THE COMPLETENESS OF THE UNDERLYING INDEX OR ANY DATA RELATED THERETO OR ANY COMMUNICATION WITH RESPECT THERETO, INCLUDING, ORAL, WRITTEN, OR ELECTRONIC COMMUNICATIONS. S&P DOW JONES INDICES SHALL NOT BE SUBJECT TO ANY DAMAGES OR LIABILITY FOR ANY ERRORS, OMISSIONS, OR DELAYS THEREIN. S&P DOW JONES INDICES MAKES NO EXPRESS OR IMPLIED WARRANTIES, AND EXPRESSLY DISCLAIMS ALL WARRANTIES, OF MERCHANTABILITY OR FITNESS FOR A PARTICULAR PURPOSE OR USE OR AS TO RESULTS TO BE OBTAINED BY CIBC NTC, OWNERS OF THE FUND, OR ANY OTHER PERSON OR ENTITY FROM THE USE OF THE UNDERLYING INDEX OR WITH RESPECT TO ANY DATA RELATED THERETO. WITHOUT LIMITING ANY OF THE FOREGOING, IN NO EVENT WHATSOEVER SHALL S&P DOW JONES INDICES BE LIABLE FOR ANY INDIRECT, SPECIAL, INCIDENTAL, PUNITIVE, OR CONSEQUENTIAL DAMAGES, INCLUDING BUT NOT LIMITED TO, LOSS OF PROFITS, TRADING LOSSES, LOST TIME, OR GOODWILL, EVEN IF THEY HAVE BEEN ADVISED OF THE POSSIBILITY OF SUCH DAMAGES, WHETHER IN CONTRACT, TORT, STRICT LIABILITY, OR OTHERWISE.
The Index Provider is not affiliated with the Trust, the Adviser or ALPS Portfolio Solutions Distributor, Inc. (the “Distributor”). The Index Provider has entered into a license agreement with the Adviser (the “License Agreement”). The use of the Underlying Index by the Adviser and the Fund is subject to the terms of the License Agreement, which impose certain limitations and conditions on the Fund’s ability to use the Underlying Index.
The Adviser does not guarantee the accuracy and/or the completeness of the Underlying Index or any data included therein, and the Adviser shall have no liability for any errors, omissions or interruptions therein. The Adviser makes no warranty, express or implied, as to results to be obtained by the Fund, owners of the Shares of the Fund or any other person or entity from the use of the Underlying Index or any data included therein. The Adviser makes no express or implied warranties, and expressly disclaims all warranties of merchantability or fitness for a particular purpose or use with respect to the Underlying Index or any data included therein. Without limiting any of the foregoing, in no event shall the Adviser have any liability for any special, punitive, direct, indirect, or consequential damages (including lost profits) arising out of matters relating to the use of the Underlying Index, even if notified of the possibility of such damages.
ALPS Disruptive Technology ETF
The Indxx Disruptive Technologies Index (the “Underlying Index”) is a service mark of Indxx, LLC (“Indxx” or the “Index Provider”) and has been licensed for use for certain purposes by ALPS Advisors, Inc. The ALPS Disruptive Technologies ETF is not sponsored, endorsed, sold or promoted by Indxx and Indxx makes no representation regarding the advisability of investing in the ALPS Disruptive Technologies ETF.
The ALPS Disruptive Technologies ETF is not sponsored, endorsed, sold or promoted by Indxx. Indxx makes no representation or warranty, express or implied, to the owners of the ALPS Disruptive Technologies ETF or any member of the public regarding the advisability of investing in securities generally or in the ALPS Disruptive Technologies ETF particularly. Indxx has no obligation to take the needs of ALPS Advisors, Inc. or the shareholders of ALPS Disruptive Technologies ETF into consideration in determining, composing, or calculating the Underlying Index. Indxx is not responsible for and has not participated in the determination of the timing, amount or pricing of the ALPS Disruptive Technologies ETF shares to be issued or in the determination or calculation of the equation by which the ALPS Disruptive Technologies ETF is to be converted into cash. Indxx has no obligation or liability in connection with the administration, marketing or trading of the ALPS Disruptive Technologies ETF.
INDXX MAKES NO WARRANTY, EXPRESS OR IMPLIED, AS TO THE RESULTS TO BE OBTAINED BY ANY PERSON OR ENTITY FROM THE USE OF THE INDEX(ES), TRADING BASED ON THE INDEX(ES), OR ANY DATA INCLUDED THEREIN IN CONNECTION WITH THE PRODUCTS, OR FOR ANY OTHER USE. INDXX EXPRESSLY DISCLAIMS ALL WARRANTIES AND CONDITIONS, EXPRESS, STATUTORY, OR IMPLIED, EXCEPT AS SET FORTH IN THIS AGREEMENT. EXCEPT AS OTHERWISE SPECIFICALLY SET FORTH IN THIS AGREEMENT, INDXX HEREBY EXPRESSLY DISCLAIMS ALL IMPLIED WARRANTIES AND CONDITIONS OF MERCHANTABILITY, TITLE, OR FITNESS FOR A PARTICULAR PURPOSE OR USE WITH RESPECT TO THE INDEX(ES) OR ANY DATA INCLUDED THEREIN. INDXX DOES NOT GUARANTEE THE ACCURACY AND/OR THE COMPLETENESS OF ANY DATA SUPPLIED BY IT OR ANY DATA INCLUDED THEREIN. INDXX MAKES NO WARRANTY, EXPRESS OR IMPLIED, AS TO RESULTS TO BE OBTAINED BY THE FUNDS, ITS SHAREHOLDERS OR AFFILIATES, OR ANY OTHER PERSON OR ENTITY FROM THE USE OF THE DATA SUPPLIED BY INDXX OR ANY DATA INCLUDED THEREIN. INDXX MAKES NO EXPRESS OR IMPLIED WARRANTIES, AND EXPRESSLY DISCLAIMS ALL WARRANTIES OF MERCHANTABILITY OR FITNESS FOR A PARTICULAR PURPOSE OR USE WITH RESPECT TO THE DATA SUPPLIED BY INDXX OR ANY DATA INCLUDED THEREIN. WITHOUT LIMITING ANY OF THE FOREGOING, IN NO EVENT SHALL INDXX HAVE ANY LIABILITY FOR ANY SPECIAL, PUNITIVE, INDIRECT, OR CONSEQUENTIAL DAMAGES (INCLUDING LOST PROFITS), EVEN IF NOTIFIED OF THE POSSIBILITY OF SUCH DAMAGES.
ALPS ETF Trust
| Additional Information | November 30, 2020 (Unaudited) |
The Adviser does not guarantee the accuracy and/or the completeness of the Underlying Index or any data included therein, and the Adviser shall have no liability for any errors, omissions or interruptions therein. The Adviser makes no warranty, express or implied, as to results to be obtained by the Fund, owners of the Shares of the Fund or any other person or entity from the use of the Underlying Index or any data included therein. Adviser makes no express or implied warranties, and expressly disclaims all warranties of merchantability or fitness for a particular purpose or use with respect to the Underlying Index or any data included therein. Without limiting any of the foregoing, in no event shall the Adviser have any liability for any special, punitive, direct, indirect or consequential damages (including lost profits) arising out of matters relating to the use of the Underlying Index, even if notified of the possibility of such damages.
ALPS Medical Breakthroughs ETF
The Fund is not sponsored, endorsed, sold or promoted by S-Network Global Indexes, Inc. (“Licensor”). Licensor makes no representation or warranty, express or implied, to the owners of the Fund or any member of the public regarding the advisability of investing in securities generally or in the Fund particularly or the ability of the Underlying Index to track the performance of the physical commodities market. Licensor’s only relationship to the Licensee is the licensing of certain service marks and trade names of Licensor and of the Underlying Index that is determined, composed and calculated by Licensor without regard to the Licensee or the Fund. Licensor has no obligation to take the needs of the Licensee or the owners of the Fund into consideration in determining, composing or calculating the Underlying Index. Licensor is not responsible for and has not participated in the determination of the timing of, prices at, or quantities of the Fund to be issued or in the determination or calculation of the equation by which the Fund is to be converted into cash. Licensor has no obligation or liability in connection with the administration, marketing or trading of the Fund.
LICENSOR DOES NOT GUARANTEE THE ACCURACY AND/OR THE COMPLETENESS OF THE UNDERLYING INDEX OR ANY DATA INCLUDED THEREIN AND LICENSOR SHALL HAVE NO LIABILITY FOR ANY ERRORS, OMISSIONS, OR INTERRUPTIONS THEREIN. LICENSOR MAKES NO WARRANTY, EXPRESS OR IMPLIED, AS TO RESULTS TO BE OBTAINED BY LICENSEE, OWNERS OF THE FUND, OR ANY OTHER PERSON OR ENTITY FROM THE USE OF THE UNDERLYING INDEX OR ANY DATA INCLUDED THEREIN. LICENSOR MAKES NO EXPRESS OR IMPLIED WARRANTIES, AND EXPRESSLY DISCLAIMS ALL WARRANTIES OF MERCHANTABILITY OR FITNESS FOR A PARTICULAR PURPOSE OR USE WITH RESPECT TO THE UNDERLYING INDEX OR ANY DATA INCLUDED THEREIN. WITHOUT LIMITING ANY OF THE FOREGOING, IN NO EVENT SHALL LICENSOR HAVE ANY LIABILITY FOR ANY SPECIAL, PUNITIVE, INDIRECT, OR CONSEQUENTIAL DAMAGES (INCLUDING LOST PROFITS), EVEN IF NOTIFIED OF THE POSSIBILITY OF SUCH DAMAGES.
Standard & Poor’s Custom Indexes serves as calculation agent for the Index. The Fund is not sponsored, endorsed, sold or promoted by Standard & Poor’s, a division of The McGraw-Hill Companies, Inc. (“S&P”) or its third party licensors. Neither S&P nor its third party licensors make any representation or warranty, express or implied, to the owners of the Fund or any member of the public regarding the advisability of investing in securities generally or in the Fund particularly or the ability of the Underlying Index to track general stock market performance. S&P’s and its third party licensor’s only relationship to S-Network Global Indexes, Inc. is the licensing of certain trademarks, service marks and trade names of S&P and/or its third party licensors and for the providing of calculation and maintenance services related to the Underlying Index. Neither S&P nor its third party licensors is responsible for and has not participated in the determination of the prices and amount of the Fund or the timing of the issuance or sale of the Fund or in the determination or calculation of the equation by which the Fund is to be converted into cash. S&P has no obligation or liability in connection with the administration, marketing or trading of the Fund.
NEITHER S&P, ITS AFFILIATES NOR THEIR THIRD PARTY LICENSORS GUARANTEE THE ADEQUACY, ACCURACY, TIMELINESS OR COMPLETENESS OF THE UNDERLYING INDEX OR ANY DATA INCLUDED THEREIN OR ANY COMMUNICATIONS, INCLUDING BUT NOT LIMITED TO, ORAL OR WRITTEN COMMUNICATIONS (INCLUDING ELECTRONIC COMMUNICATIONS) WITH RESPECT THERETO. S&P, ITS AFFILIATES AND THEIR THIRD PARTY LICENSORS SHALL NOT BE SUBJECT TO ANY DAMAGES OR LIABILITY FOR ANY ERRORS, OMISSIONS OR DELAYS THEREIN. S&P MAKES NO EXPRESS OR IMPLIED WARRANTIES, AND EXPRESSLY DISCLAIMS ALL WARRANTIES OF MERCHANTABILITY OR FITNESS FOR A PARTICULAR PURPOSE OR USE WITH RESPECT TO ITS TRADEMARKS, THE UNDERLYING INDEX OR ANY DATA INCLUDED THEREIN. WITHOUT LIMITING ANY OF THE FOREGOING, IN NO EVENT WHATSOEVER SHALL S&P, ITS AFFILIATES OR THEIR THIRD PARTY LICENSORS BE LIABLE FOR ANY INDIRECT, SPECIAL, INCIDENTAL, PUNITIVE OR CONSEQUENTIAL DAMAGES, INCLUDING BUT NOT LIMITED TO, LOSS OF PROFITS, TRADING LOSSES, LOST TIME OR GOODWILL, EVEN IF THEY HAVE BEEN ADVISED OF THE POSSIBILITY OF SUCH DAMAGES, WHETHER IN CONTRACT, TORT, STRICT LIABILITY OR OTHERWISE.
ALPS ETF Trust
| Additional Information | November 30, 2020 (Unaudited) |
Standard & Poor’s®, and S&P® are registered trademarks of The McGraw-Hill Companies, Inc.; “Calculated by S&P Custom Indices” and its related stylized mark are service marks of The McGraw-Hill Companies, Inc. These marks have been licensed for use by S-Network Global Indexes, Inc.
The Adviser does not guarantee the accuracy and/or the completeness of the Underlying Index or any data included therein, and the Adviser shall have no liability for any errors, omissions or interruptions therein. The Adviser makes no warranty, express or implied, as to results to be obtained by the Fund, owners of the Shares of the Fund or any other person or entity from the use of the Underlying Index or any data included therein. The Adviser makes no express or implied warranties, and expressly disclaims all warranties of merchantability or fitness for a particular purpose or use with respect to the Underlying Index or any data included therein. Without limiting any of the foregoing, in no event shall the Adviser have any liability for any special, punitive, direct, indirect, or consequential damages (including lost profits) arising out of matters relating to the use of the Underlying Index, even if notified of the possibility of such damages.
ALPS ETF Trust
| Board Considerations Regarding Approval of | November 30, 2020 (Unaudited) |
| Investment Advisory Agreements | |
At a meeting held on June 24, 2020 via electronic means (video-conference), the Board of Trustees of the Trust (the “Board” or the “Trustees”), including the Trustees who are not “interested persons” of the Trust within the meaning of the Investment Company Act of 1940, as amended (the “Independent Trustees”), evaluated a proposal to approve the continuance of the Investment Advisory Agreements between the Trust and ALPS Advisors, Inc. (the “Adviser” or “AAI”) with respect to the ALPS Clean Energy ETF (“ACES”), the ALPS Disruptive Technologies ETF (“DTEC”) and the ALPS Medical Breakthroughs ETF (“SBIO”) (each “a Fund” and collectively the “Funds”). The Independent Trustees also met separately to consider each Investment Advisory Agreement.
In evaluating the Investment Advisory Agreements with respect to each Fund, the Board, including the Independent Trustees considered various factors, including (i) the nature, extent and quality of the services provided by AAI with respect to the applicable Fund under the Investment Advisory Agreements; (ii) the advisory fees and other expenses paid by the Fund compared to those of similar funds managed by other investment advisers; (iii) the costs of the services provided to the Fund by AAI and the profits realized by AAI and its affiliates from its relationship to the Fund; (iv) the extent to which economies of scale have been or would be realized if and as the assets of the Fund grow and whether fees reflect the economies of scale for the benefit of shareholders; and (v) any additional benefits and other considerations.
With respect to the nature, extent and quality of the services provided by AAI under the Investment Advisory Agreements, the Board considered and reviewed information concerning the services provided under the Investment Advisory Agreements, the investment parameters of the index of each Fund, financial information regarding AAI and its parent company, information describing AAI’s current organization and the background and experience of the persons responsible for the day-to-day management of the Funds.
The Board reviewed information on the performance of each Fund and its applicable benchmark. The Board also evaluated the correlation and tracking error between each underlying index and its corresponding Fund’s performance. Based on this review, the Board, including the Independent Trustees found that the nature and extent of services provided to each Fund under the Investment Advisory Agreements was appropriate and that the quality was satisfactory.
The Board noted that the advisory fees for each Fund were unitary fees pursuant to which AAI assumes all expenses of the Funds (including the cost of transfer agency, custody, fund administration, legal, audit and other services) other than the payments under the Advisory Agreement, brokerage expenses, taxes, interest, litigation expenses and other extraordinary expenses.
With respect to advisory fee rates, the Board, including the Independent Trustees, noted the following:
The gross management fee rate for each of DTEC and ACES is higher than the median of its FUSE expense group. The Funds’ respective net expense ratios, however, are slightly above the median of their respective FUSE expense group.
The gross management fee rate for SBIO is equal to the median of its FUSE expense group. The Fund’s net expense ratio, however, is lower than the median for its FUSE expense group.
Based on the foregoing, and the other information available to them, the Board, including the Independent Trustees, concluded that the advisory fee rate for each of the Funds was reasonable under the circumstances and in light of the quality of the services provided.
The Board, including the Independent Trustees, considered other benefits available to AAI because of its relationship with the Funds and concluded that the advisory fees were reasonable taking into account any such benefits.
The Board, including the Independent Trustees, also considered with respect to each Fund the information provided by AAI about the costs and profitability of AAI with respect to each of the Funds, including the asset levels and other factors that influence the profitability and financial viability of the Funds. The Board, including the Independent Trustees reviewed and noted the relatively small sizes of the Funds and concluded that AAI was not realizing any economies of scale. The Independent Trustees determined that AAI should continue to keep the Board informed on an ongoing basis of any significant developments (e.g., material increases in asset levels) so as to facilitate the Independent Trustees’ evaluation of whether further economies of scale have been achieved.
In voting to renew each Investment Advisory Agreement, the Board, including the Independent Trustees, concluded that the terms of each Investment Advisory Agreement are reasonable and fair in light of the services to be performed, the fees paid by certain other funds, expenses to be incurred and such other matters as the members of the Board, including the Independent Trustees, considered relevant in the exercise of their reasonable business judgment. The Board, including the Independent Trustees, did not identify any single factor or group of factors as all important or controlling and considered all factors together.
ALPS ETF Trust
| Trustees & Officers | November 30, 2020 (Unaudited) |
The general supervision of the duties performed by the Adviser for the Fund under the Investment Advisory Agreement is the responsibility of the Board of Trustees. The Trust currently has four Trustees. Three Trustees have no affiliation or business connection with the Adviser or any of its affiliated persons and do not own any stock or other securities issued by the Adviser. These are the “non-interested” or “independent” Trustees (“Independent Trustees”). The other Trustee (the “Interested Trustee”) is affiliated with the Adviser.
The Independent Trustees of the Trust, their term of office and length of time served, their principal business occupations during the past five years, the number of portfolios in the Fund Complex overseen by each Independent Trustee, and other directorships, if any, held by the Trustee are shown below.
INDEPENDENT TRUSTEES
| Name, Address & Year of Birth* | Position(s) Held with Trust | Term of Office and Length of Time Served** | Principal Occupation(s) During Past 5 Years | Number of Portfolios in Fund Complex Overseen by Trustees*** | Other Directorships Held by Trustees |
| Mary K. Anstine, 1940 | Trustee | Since March 2008 | Ms. Anstine was formerly an Executive Vice President of First Interstate Bank of Denver until 1994, President/Chief Executive Officer of HealthONE Alliance, Denver, Colorado, from 1994 to 2004, and has been retired since 2004. Ms. Anstine is also Trustee/Director of the following: AV Hunter Trust and Colorado Uplift Board. Ms. Anstine was formerly a Director of the Trust Bank of Colorado (later purchased and now known as Northern Trust Bank), HealthONE and Denver Area Council of the Boy Scouts of America and a member of the American Bankers Association Trust Executive Committee. | 35 | Ms. Anstine is a Trustee of ALPS Variable Investment Trust (7 funds); Financial Investors Trust (31 funds); Reaves Utility Income Fund; and Segall Bryant & Hamill Trust (14 funds). |
Jeremy W. Deems, 1976 | Trustee | Since March 2008 | Mr. Deems is the Co-Founder, Chief Compliance Officer and Chief Financial Officer of Green Alpha Advisors, LLC. Mr. Deems is Co-Portfolio Manager of the Shelton Green Alpha Fund. Prior to joining Green Alpha Advisors, Mr. Deems was CFO and Treasurer of Forward Management, LLC, ReFlow Management Co., LLC, ReFlow Fund, LLC, a private investment fund, and Sutton Place Management, LLC, an administrative services company. | 35 | Mr. Deems is a Trustee of ALPS Variable Investment Trust (7 funds); Financial Investors Trust (31 funds); and Reaves Utility Income Fund; and Clough Funds Trust (1 fund). |
Rick A. Pederson, 1952 | Trustee | Since March 2008 | Mr. Pederson is Partner, Bow River Capital Partners (private equity management), 2003 - present; Board Member, Prosci Inc. (private business services) 2013-2016; Advisory Board Member, Citywide Banks (Colorado community bank) 2014- 2017; Board Member, Strong-Bridge Consulting, 2015-2019; Board Member, IRI/ODMS Holdings LLC, 2017 – 2019; Director, National Western Stock Show (not for profit) 2010 - present; Director, History Colorado (not for profit) 2015-present; Director, Citywide Bank Advisory Board 2017-present; Trustee, Boettcher Foundation, 2018-present. | 18 | Mr. Pederson is Trustee of Segall Bryant & Hamill Trust (14 funds) and Principal Real Estate Income Fund (1 fund). |
| * | The business address of the Trustee is c/o ALPS Advisors, Inc., 1290 Broadway, Suite 1000, Denver, Colorado 80203. |
| ** | This is the period for which the Trustee began serving the Trust. Each Trustee serves an indefinite term, until his successor is elected. |
| *** | The Fund Complex includes all series of the Trust and any other investment companies for which ALPS Advisors, Inc. provides investment advisory services. |
ALPS ETF Trust
| Trustees & Officers | November 30, 2020 (Unaudited) |
The Trustee who is an “interested person” of the Trust, his term of office and length of time served, his principal business occupations during the past five years, the number of portfolios in the Fund Complex overseen by the Interested Trustee and the other directorships, if any, held by the Trustee, are shown below.
INTERESTED TRUSTEE
| Name, Address and Year of Birth of Interested Trustee* | Position(s) Held with Trust | Term of Office and Length of Time Served** | Principal Occupation(s) During Past 5 Years | Number of Portfolios in Fund Complex Overseen by Trustees*** | Other Directorships Held by Trustees |
Edmund J. Burke, 1961 | Trustee | Since December 2017. | Mr. Burke joined ALPS in 1991 and served as the President and Director of ALPS Holdings, Inc., and ALPS Advisors, Inc. (“AAI”), and Director of ALPS Distributors, Inc. (“ADI”), ALPS Fund Services, Inc. (“AFS”), and ALPS Portfolio Solutions Distributor, Inc. (“APSD”). Mr. Burke retired from ALPS in June 2019. | 30 | Mr. Burke is a Trustee of Clough Global Dividend and Income Fund (1 fund); Clough Global Equity Fund (1 fund); Clough Global Opportunities Fund (1 fund); Clough Funds Trust (1 fund); Liberty All-Star Equity Fund (1 fund); Director of the Liberty All- Star Growth Fund, Inc. (1 fund) and Financial Investors Trust (31 funds). |
| * | The business address of the Trustee is c/o ALPS Advisors, Inc., 1290 Broadway, Suite 1000, Denver, Colorado 80203. |
| ** | This is the period for which the Trustee began serving the Trust. Each Trustee serves an indefinite term, until his successor is elected. |
| *** | The Fund Complex includes all series of the Trust and any other investment companies for which ALPS Advisors, Inc. provides investment advisory services. |
ALPS ETF Trust
| Trustees & Officers | November 30, 2020 (Unaudited) |
OFFICERS
| Name, Address and Year of Birth of Officer* | Position(s) Held with Trust | Length of Time Served** | Principal Occupation(s) During Past 5 Years |
Bradley Swenson, 1972 | President | Since June 2019 | Mr. Swenson joined ALPS in 2004 and currently serves as President of AFS (since 2019) and also Chief Operating Officer of AFS (since 2015). He also currently serves as President of Clough Global Opportunities Fund, Clough Global Dividend and Income Fund, Clough Global Equity Fund, Clough Funds Trust, Financial Investors Trust, Reaves Utility Income Fund and ALPS Series Trust. From 2004-2015, Mr. Swenson served as Chief Compliance Officer to ALPS, its affiliated entities, and to certain investment companies. Mr. Swenson is registered with FINRA, holding a Series 6, 26 and 27. |
Matthew Sutula, 1985 | Chief Compliance Officer (“CCO”) | Since December 2019 | Mr. Sutula joined ALPS in 2012 and currently serves as Chief Compliance Officer of AAI. Prior to his current role, Mr. Sutula served as interim Compliance Officer of the Trust (September 2019 to December 2019). Compliance Manager and Senior Compliance Analyst for AAI, as well as Compliance Analyst for AFS. Prior to joining ALPS, he spent seven years at Morningstar, Inc. in various analyst roles supporting the registered investment company databases. Mr. Sutula is also Chief Compliance Officer of Principal Real Estate Income Fund, ALPS Variable Investment Trust, RiverNorth Opportunities Fund, Inc., Liberty All-Star Equity Fund and Liberty All- Star Growth Fund, Inc. |
Kathryn Burns, 1976 | Treasurer | Since September 2018 | Ms. Burns serves as Vice President, Director of Fund Operations of AAI since 2018. From 2013 to 2018, she served as Vice President and Fund Controller at AFS. Prior to joining ALPS, she worked at Old Mutual Capital where she served as Vice President and Chief Compliance Officer (2010 – 2012) and Regulatory Reporting Manager and Assistant Treasurer to the Old Mutual Funds Trusts (2006 – 2012). She also served as a CPA for PricewaterhouseCoopers LLP. Ms. Burns also serves as Treasurer of Boulder Growth & Income Fund, Inc. and as President of ALPS Variable Investment Trust, Principal Real Estate Income Fund and RiverNorth Opportunities Fund, Inc. |
Richard C. Noyes,*** 1970 | Secretary | Since September 2019 | Mr. Noyes joined ALPS in 2015 and is Senior Vice President and General Counsel of ALPS. Prior to joining ALPS, Mr. Noyes served as Assistant Vice President and Senior Counsel of Janus Capital Management LLC. |
Sharon Akselrod,*** 1974 | Assistant Secretary | Since December 2016 | Ms. Akselrod joined ALPS in August 2014 and is currently Senior Investment Company Act Paralegal of AFS. Prior to joining ALPS, Ms. Akselrod served as Corporate Governance and Regulatory Associate for Nordstrom fsb (2013-2014) and Senior Legal Assistant – Legal Manager for AXA Equitable Life Insurance Company (2008-2013). Ms. Akselrod is also Secretary of Principal Real Estate Income Fund and Assistant Secretary of Financial Investors Trust and Clough Funds Trust. |
Cara Owen,*** 1981 | Assistant Secretary | Since March 2020 | Vice President and Principal Legal Counsel, ALPS Fund Services, Inc.; Vice President and Secretary, Boulder Growth & Income Fund, Inc.; Assistant Secretary, James Advantage Funds (since August 2019). Prior to joining ALPS, Ms. Owen was Senior Counsel, Corporate & Investments, Great-West Life & Annuity Insurance Company; Senior Counsel & Assistant Secretary, Great-West Funds, Inc., Great-West Capital Management, LLC, Great-West Trust Company, LLC, and Advised Assets Group, LLC (2014-2019). |
| * | The business address of each Officer is c/o ALPS Advisors, Inc., 1290 Broadway, Suite 1000, Denver, Colorado 80203. Each Officer is deemed an affiliate of the Trust as defined under the 1940 Act. |
| ** | This is the period for which the Officer began serving the Trust. Each Officer serves an indefinite term, until his/her successor is elected. |
| *** | Effective December 7, 2020, Mr. Noyes and Ms. Akselrod resigned from their respective positions held with the Trust. As of the same date, Ms. Owen was appointed to the position of Secretary and Jen Craig as Assistant Secretary. |
The Statement of Additional Information includes additional information about the Fund’s Trustees and is available, without charge, upon request by calling (toll-free) 1-866-759-5679.
Intentionally Left Blank


Table of Contents
| Performance Overview | 1 |
| Disclosure of Fund Expenses | 13 |
| Report of Independent Registered Public Accounting Firm | 14 |
| Financial Statements | |
| Schedule of Investments | 15 |
| Statements of Assets and Liabilities | 21 |
| Statements of Operations | 22 |
| Statements of Changes in Net Assets | 23 |
| Financial Highlights | 27 |
| Notes to Financial Statements | 31 |
| Additional Information | 39 |
| Board Considerations Regarding Approval of Investment Advisory Agreements | 41 |
| Trustees and Officers | 42 |
Beginning on January 1, 2021, as permitted by regulations adopted by the U.S. Securities and Exchange Commission, paper copies of the Funds’ annual and semi-annual shareholder reports will no longer be sent by mail, unless you specifically request paper copies of the reports from your financial intermediary (such as a broker-dealer or bank). Instead, the reports will be made available on the Funds’ website (www.alpsfunds.com), and you will be notified by mail each time a report is posted and provided with a website link to access the report.
If you already elected to receive shareholder reports electronically, you will not be affected by this change and you need not take any action. You may elect to receive shareholder reports and other communications from a Fund electronically anytime by contacting your financial intermediary.
You may elect to receive all future reports in paper free of charge. You can contact your financial intermediary to request that you continue to receive paper copies of your shareholder reports. Your election to receive reports in paper will apply to all funds held in your account with your financial intermediary.
alpsfunds.com
ALPS Sector Dividend Dogs ETF
| Performance Overview | November 30, 2020 (Unaudited) |
Investment Objective
The ALPS Sector Dividend Dogs ETF (the “Fund” or “SDOG”) seeks investment results that replicate as closely as possible, before fees and expenses, the performance of the S-Network® Sector Dividend Dogs Index (the “Underlying Index”).
The Underlying Index is a rules based index intended to give investors a means of tracking the overall performance of the highest dividend paying stocks (i.e. “Dividend Dogs”) in the S&P 500® Total Return Index (“SPX”) on a sector-by-sector basis. “Dividend Dogs” refers to the five stocks in each of the Global Industry Classification Standard (“GICS”) sectors, excluding the real estate sector, that make up the S&P 500® Total Return Index which offer the highest dividend yields.
Performance Overview
The Fund, for the twelve-month period ended November 30, 2020, generated a total return of -0.27%, in-line with the Fund’s Underlying Index, net of fees, which returned 0.08%. The Fund underperformed the S&P 500® Total Return Index (the “S&P 500”), which returned 17.46% for the same period.
The trailing twelve-month (TTM) distribution yield for the Fund’s underlying constituents as of November 30, 2020 was 4.66% vs. 1.66% for the S&P 500.
The S&P 500 returned 17.46% for the trailing twelve-month period ended November 30, 2020, finishing at an all-time high once again. U.S. equity markets ended 2019 with solid gains in December 2019, before posting monthly losses in January, February, and March 2020. Global markets plummeted from mid-February through the majority of March due to the spread of the novel coronavirus ("COVID-19"). The spread of COVID-19 prompted shutdowns from global governments, causing global markets to weaken swiftly. The U.S., along with a number of other governments, introduced stimulus measures in late March in order to restart economic growth. These stimulus measures propelled the S&P 500 to climb for five consecutive months from lows seen in April. The S&P 500 fluctuated in September and October over uncertainty in the U.S. election, which ultimately saw Joe Biden win in November. Congress continued to grapple over secondary stimulus measures to combat COVID-19 related economic downfall, but were unable to agree before November 30, 2020. However, November also showed positive initial vaccine results from three candidates boosting markets. Two vaccines were approved for emergency use, which prompted investor optimism and drove markets higher into the end of November 2020. The second half of the year, especially in September through November, saw a heavy rotation to value from growth.
Compared to the S&P 500, the Fund saw a negative impact (-5.36%) from sector allocation effect for the period. This was largely driven by relative under-weighting in Information Technology (average weight for the period of 10.32% vs. 26.07% in SPX) and relative over-weight in Energy (average weight for the period of 9.70% vs. 2.96% in SPX); a result of the equal sector weight strategy. The Fund also saw a negative impact (-12.02%) from selection effect, as the constituents in each sector underperformed, with the exception of the Energy and Industrials sectors. The Fund’s Industrials names exhibited the strongest positive contribution to overall selection effect for the period.
The best performing stocks in the Fund for the period were L Brands Inc. (LB), which increased 65.29%, and United Parcel Service (UPS), which saw a gain of 47.69%. Newell Brands Inc. (NWL), which rose 41.92%, and Maxim Integrated Products (MXIM), which climbed 37.75%, were other top performers. The largest detractors were Coty Inc. (COTY), which decreased 73.14%, Occidental Petroleum Corp. (OXY), which fell 55.57%, and Kohl’s Corp. (KSS), which lost 51.81%.
Looking forward, the Fund's adviser believes the Fund’s strategy of annually selecting the five highest yielding securities in each of the ten sectors (excluding Real Estate) in the S&P 500 is designed to provide meaningfully higher yield relative to the S&P 500, potential for market participation in all economic cycles through equal sector weighting, and a deep value portfolio of securities as identified through high yield relative to their sector peers.
Performance (as of November 30, 2020)
| | 1 Year | 5 Year | Since Inception^ |
| ALPS Sector Dividend Dogs ETF – NAV | -0.27% | 7.71% | 10.81% |
| ALPS Sector Dividend Dogs ETF – Market Price* | -0.25% | 7.71% | 10.81% |
| S-Network® Sector Dividend Dogs Total Return Index | 0.08% | 8.19% | 11.31% |
| S&P 500® Total Return Index | 17.46% | 13.99% | 14.64% |
Total Expense Ratio (per the current prospectus) 0.40%.
Performance data quoted represents past performance. Past performance does not guarantee future results. Total return figures assume reinvestment of dividends and capital gains distributions, if any. The table does not reflect the deduction of taxes that a shareholder would pay on Fund distributions or the redemption of Fund shares. Investment return and principal value of an investment will fluctuate so that an investor’s shares, when sold or redeemed, may be worth more or less than the original cost. Current performance data may be higher or lower than actual data quoted. For the most current month-end performance data please visit www.alpsfunds.com or call 1.866.675.2639.
ALPS Sector Dividend Dogs ETF
| Performance Overview | November 30, 2020 (Unaudited) |
NAV is an exchange-traded fund’s per-share value. The per-share dollar amount of the Fund is derived by dividing the total value of all the securities in its portfolio, less any liabilities, by the number of Fund shares outstanding. Market Price is the price at which a share can currently be traded in the market. Information detailing the number of days the Market Price of the Fund was greater than the Fund’s NAV and the number of days it was less than the Fund’s NAV can be obtained at www.alpsfunds.com.
| ^ | The Fund Commencement Date was June 29, 2012. |
| * | Market Price means the official closing price of a share or, if it more accurately reflects the market value of a share at the time as of which the Fund calculates current net asset value per share, the price that is the midpoint of the bid-ask spread as of that time. It does not represent the returns an investor would receive if shares were traded at other times. |
The S-Network® Sector Dividend Dogs Total Return Index is designed to serve as a fair, impartial and transparent measure of the performance of US large cap equities with above average dividend yields. The Underlying Index is a portfolio of fifty stocks derived from the S&P 500® Index. The index is reported on a total return basis, which assumes reinvestment of any dividends and distributions realized during a given time period.
The S&P 500® Total Return Index is an index of 500 stocks chosen for market size, liquidity and industry grouping among other factors. Total return assumes reinvestment of any dividends and distributions realized during a given time period.
The indexes are not actively managed and do not reflect any deductions for fees, expenses or taxes. One cannot invest directly in an index. Index performance does not reflect fund performance.
The Fund’s shares are not individually redeemable. Investors buy and sell shares of the Fund on a secondary market. Only market makers or “authorized participants” may trade directly with the Fund, typically in blocks of 50,000 shares.
The ALPS Sector Dividend Dogs ETF is not suitable for all investors. Investments in the Fund are subject to investment risks, including possible loss of the principal amount invested.
ALPS Portfolio Solutions Distributor, Inc., a FINRA member, is the distributor for the ETF.
ALPS Sector Dividend Dogs ETF
| Performance Overview | November 30, 2020 (Unaudited) |
Top 10 Holdings* (as of November 30, 2020)
| Occidental Petroleum Corp. | 2.71% |
| Invesco, Ltd. | 2.67% |
| ONEOK, Inc. | 2.40% |
| Westrock Co. | 2.28% |
| Interpublic Group of Cos., Inc. | 2.26% |
| International Paper Co. | 2.23% |
| Seagate Technology PLC | 2.22% |
| Maxim Integrated Products, Inc. | 2.21% |
| Huntington Bancshares, Inc. | 2.19% |
| Newell Brands, Inc. | 2.14% |
| Total % of Top 10 Holdings | 23.31% |
Sector Allocation* (as of November 30, 2020)
| Financials | 11.08% |
| Energy | 10.79% |
| Materials | 10.73% |
| Information Technology | 10.30% |
| Industrials | 9.74% |
| Utilities | 9.64% |
| Communication Services | 9.62% |
| Consumer Discretionary | 9.53% |
| Health Care | 9.49% |
| Consumer Staples | 8.86% |
| Money Market Fund | 0.22% |
| Total | 100.00% |
* % of Total Investments
Future holdings are subject to change.
Growth of $10,000 (as of November 30, 2020)
Comparison of Change in Value of $10,000 Investment in the Fund and the Indexes
The chart above compares historical performance of a hypothetical investment of $10,000 in the Fund since inception with the performance of the Fund’s benchmark index. Past performance does not guarantee future results. The chart does not reflect the deduction of taxes that a shareholder would pay on Fund distributions or the redemption of Fund shares.
ALPS International Sector Dividend Dogs ETF
| Performance Overview | November 30, 2020 (Unaudited) |
Investment Objective
The ALPS International Sector Dividend Dogs ETF (the “Fund” or “IDOG”) seeks investment results that replicate as closely as possible, before fees and expenses, the performance of the S-Network® International Sector Dividend Dogs Net Total Return Index (the “Underlying Index”).
The Underlying Index is a rules-based index intended to give investors a means of tracking the overall performance of the highest dividend paying stocks (i.e. “Dividend Dogs”) in the S-Network® Developed Markets (ex NA) Index, a universe of mainly large capitalization stocks in international developed markets not located in the Americas (the “S-Net Developed Markets”) on a sector-by-sector basis. “Dividend Dogs” refers to the five stocks in each of the Global Industry Classification Standard (“GICS”) sectors, excluding the real estate sector, that make up the S-Net Developed Markets which offer the highest dividend yields.
Performance Overview
The Fund, for the trailing twelve-month period ended November 30, 2020, generated a total return of -3.08%, relatively in-line with the Fund’s Underlying Index, net of fees, which returned -2.69%. The Fund underperformed the Morningstar Developed Markets ex-North America Index (MSDINUS), which returned 6.96% for the same period.
The trailing twelve-month (TTM) distribution yield for the Fund’s constituents as of November 30, 2020 was 4.34% vs. 1.26% on the Morningstar Developed Markets ex-North America Index.
Developed Markets (ex-U.S.), as represented by the Morningstar Developed Markets ex-North America Index, returned 6.96% for the trailing twelve-month period ended November 30, 2020. The U.S. Dollar weakened relative to the Euro, which contributed to positive performance from a U.S. investor’s perspective.
After starting the year relatively flat, developed international markets declined sharply in February and March amid the global novel coronavirus ("COVID-19") pandemic. Developed nations in Europe and Asia saw significant losses as many countries ordered nationwide shutdowns in order to combat the spread of the highly infectious virus. Stimulus measures were later introduced across the globe, including massive measures by the European Union, Japan, Australia, and the U.K., to reinvigorate local economies. The stimulus measures and gradual reopening of economies spurred a healthy recovery for the remainder of the year from lows seen in late March. In November, three COVID-19 vaccine candidates showed efficacy against COVID-19 in clinical testing, prompting investor optimism and gains in international developed markets. The trailing twelve-month period ended November 30, 2020 also saw a noticeable shift to value from growth, especially in the second half of the year when economies reopened. Many developed nations in Europe, particularly the U.K., France, Italy and Germany, saw a heavy resurgence of COVID-19 cases in the fall which led to partial lockdowns in November. Despite COVID-19 related volatility seen since the pandemic began in February, international developed markets in Asia and Europe ended the year higher.
Compared to the Morningstar Developed Markets ex-North America Index, the Fund saw a slightly positive impact of 0.52% from sector allocation where a relative overweight in Utilities (average weight for the period of 8.80% vs. 3.63% in MSDINUS) contributed to positive performance, a result of the equal sector weighting strategy. The Fund’s relative overweight to the Energy sector (average weight for the period of 9.79% vs. 3.56% in MSDINUS) detracted from positive performance. The Fund also saw relative underperformance of -9.87% attributed to selection effect.
From a geographical perspective, the highest contribution to return was attributed to holdings based in Australia. The Fund’s performance was adversely impacted by holdings based in the U.K. Overall, currency effect added roughly 0.10% to the overall performance of the Fund.
The best performing stocks for the period were Fortescue Metals Group Ltd. (FMG AU), which increased 103.19%, Tokyo Electron Ltd. (8035 JT), which returned 70.06%, and Energias de Portugal, S.A. (EDP PL), which gained 41.58%. The worst performing stocks were BP PLC (BP/ LN), which lost 42.44%, CITIC Ltd. (267 HK), which fell 37.69%; and Royal Dutch Shell Ltd. (RDSA NA), which decreased 37.07%.
Looking forward, the Fund's adviser believes the Fund’s strategy of annually selecting the five highest yielding securities in each of the ten sectors in the S-Network Developed Markets (Ex N.A.) Index is designed to provide high yield relative to the Morningstar Developed Markets ex-North America Index, potential for market participation in all economic cycles through equal sector weighting, and a deep value portfolio of securities as identified through high yield relative to their sector peers.
Performance (as of November 30, 2020)
| | 1 Year | 5 Year | Since Inception^ |
| ALPS International Sector Dividend Dogs ETF – NAV | -3.08% | 4.74% | 3.96% |
| ALPS International Sector Dividend Dogs ETF – Market Price* | -3.48% | 4.66% | 3.88% |
| S-Network® International Sector Dividend Dogs Net Total Return Index | -2.69% | 5.15% | 4.36% |
| Morningstar® Developed Markets ex-North America Net Total Return Index | 6.96% | 6.39% | 6.09% |
Total Expense Ratio (per the current prospectus) 0.50%.
ALPS International Sector Dividend Dogs ETF
| Performance Overview | November 30, 2020 (Unaudited) |
Performance data quoted represents past performance. Past performance does not guarantee future results. Total return figures assume reinvestment of dividends and capital gains distributions, if any. The table does not reflect the deduction of taxes that a shareholder would pay on Fund distributions or the redemption of Fund shares. Investment return and principal value of an investment will fluctuate so that an investor’s shares, when sold or redeemed, may be worth more or less than the original cost. Current performance data may be higher or lower than actual data quoted. For the most current month-end performance data please visit www.alpsfunds.com or call 1.866.675.2639.
NAV is an exchange-traded fund’s per-share value. The per-share dollar amount of the Fund is derived by dividing the total value of all the securities in its portfolio, less any liabilities, by the number of Fund shares outstanding. Market Price is the price at which a share can currently be traded in the market. Information detailing the number of days the Market Price of the Fund was greater than the Fund’s NAV and the number of days it was less than the Fund’s NAV can be obtained at www.alpsfunds.com.
| ^ | The Fund Commencement Date was June 28, 2013. |
| * | Market Price means the official closing price of a share or, if it more accurately reflects the market value of a share at the time as of which the Fund calculates current net asset value per share, the price that is the midpoint of the bid-ask spread as of that time. It does not represent the returns an investor would receive if shares were traded at other times. |
The S-Network® International Sector Dividend Dogs Net Total Return Index is designed to serve as a fair, impartial and transparent measure of the performance of international large cap equities with above average dividend yields. The Underlying Index is a portfolio of fifty stocks derived from the S-Net International Developed Markets Index (ex-Americas) Index. Total Return assumes reinvestment of any dividends and distributions realized during a given time period. Net Total Return (NTR) is obtained by reinvesting the net dividend, which is equal to the ordinary gross dividend minus the amount of withholding tax.
Morningstar® Developed Markets ex-North America Net Total Return Index measures the performance of companies in developed markets ex-North America. It covers approximately 97% of the full market capitalization in the Developed Markets ex-North America.
The indexes are not actively managed and do not reflect any deductions for fees, expenses or taxes. One cannot invest directly in an index. Index performance does not reflect fund performance.
The Fund’s shares are not individually redeemable. Investors buy and sell shares of the Fund on a secondary market. Only market makers or “authorized participants” may trade directly with the Fund, typically in blocks of 50,000 shares.
The ALPS International Sector Dividend Dogs ETF is not suitable for all investors. Investments in the Fund are subject to investment risks, including possible loss of the principal amount invested.
ALPS Portfolio Solutions Distributor, Inc., a FINRA member, is the distributor for the ETF.
ALPS International Sector Dividend Dogs ETF
| Performance Overview | November 30, 2020 (Unaudited) |
Top 10 Holdings* (as of November 30, 2020)
| Tokyo Electron, Ltd. | 2.57% |
| Renault SA | 2.51% |
| National Australia Bank, Ltd. | 2.47% |
| Hennes & Mauritz AB | 2.38% |
| Australia & New Zealand Banking Group, Ltd. | 2.38% |
| Repsol SA | 2.32% |
| ACS Actividades de Construccion y Servicios SA | 2.30% |
| Royal Dutch Shell PLC | 2.23% |
| WPP PLC | 2.20% |
| Natixis SA | 2.18% |
| Total % of Top 10 Holdings | 23.54% |
Sector Allocation* (as of November 30, 2020)
| Financials | 11.18% |
| Information Technology | 10.36% |
| Consumer Discretionary | 10.34% |
| Energy | 10.20% |
| Communication Services | 10.09% |
| Industrials | 9.94% |
| Utilities | 9.91% |
| Materials | 9.73% |
| Consumer Staples | 9.38% |
| Health Care | 8.65% |
| Money Market Fund | 0.22% |
| Total | 100.00% |
* % of Total Investments
Future holdings are subject to change.
Growth of $10,000 (as of November 30, 2020)
Comparison of Change in Value of $10,000 Investment in the Fund and the Indexes
The chart above compares historical performance of a hypothetical investment of $10,000 in the Fund since inception with the performance of the Fund’s benchmark index. Past performance does not guarantee future results. The chart does not reflect the deduction of taxes that a shareholder would pay on Fund distributions or the redemption of Fund shares.
ALPS Emerging Sector Dividend Dogs ETF
| Performance Overview | November 30, 2020 (Unaudited) |
Investment Objective
The ALPS Emerging Sector Dividend Dogs ETF (the “Fund” or “EDOG”) seeks investment results that replicate as closely as possible, before fees and expenses, the performance of the S-Network® Emerging Sector Dividend Dogs Net Total Return Index (the “Underlying Index”).
The Underlying Index is a rules-based index intended to give investors a means of tracking the overall performance of the highest dividend paying stocks (i.e. “Dividend Dogs”) in the S-Network® Emerging Markets Index, a universe of mainly large capitalization stocks domiciled in emerging markets (the “S-Network Emerging Markets”) on a sector-by-sector basis. “Dividend Dogs” refers to the five stocks in each of the Global Industry Classification Standard (“GICS”) sectors, excluding the real estate sector, that make up the S-Network® Emerging Markets which offer the highest dividend yields. Emerging market countries are countries that major international financial institutions, such as the World Bank, generally consider to be less economically mature than developed nations.
Performance Overview
The Fund, for the trailing twelve-month period ended November 30, 2020, generated a total return of 5.20%, relatively in-line with the Fund’s Underlying Index, net of fees, which returned 5.89%. The Fund underperformed the Morningstar Emerging Markets Index (MEMMN), which returned 18.10% for the same period.
The trailing twelve-month (TTM) distribution yield for the Fund’s constituents as of November 30, 2020 was 4.03% vs. 0.68% on the Morningstar Emerging Markets Index.
The macroeconomic catalysts that dominated emerging market performance in 2020 were the novel coronavirus ("COVID-19") pandemic and volatile oil prices. In January of 2020, the U.S. & China commenced phase one on their trade agreement as China committed to purchase an additional $200B of U.S. goods & services, over the duration of 2020 & 2021. During the first quarter, emerging markets plummeted as COVID-19 spread rapidly throughout the world. Travel bans across the globe negatively affected economies that strongly rely on tourism as well as emerging market economies that rely heavily on oil exports. The combination of oil gluts from Russia and Saudi Arabia not reaching a production agreement and lack of storage drove oil prices downward. Emerging market countries, in general, rebounded strongly throughout the remainder of the year as hopes of a successful COVID-19 vaccine increased. Overall, emerging market currencies were generally strong in 2020 as large fiscal stimulus packages enacted by the U.S. and Eurozone weakened the U.S. dollar and Euro. The notable exception was the weak Russian Ruble, which was negatively impacted from weak oil prices & interest rate cuts.
Compared to the Morningstar Emerging Markets Index, the Fund saw a positive impact (0.37%) from sector allocation effect which was largely driven by the relative overweight in Health Care (average weight for the period of 10.73% vs. 4.41% in MEMMN) and a relative underweight to Financials over the one year period (average weight for the period of 9.30% vs. 20.31% in MEMMN), a result of the equal sector weighting strategy. The Fund also saw a negative impact -10.96% due to selection effect, as the names in Information Technology and Consumer Discretionary were leading detractors, while constituents in Industrials and Health Care propped up Fund performance.
From a geographical perspective, the highest contribution to return was attributed by holdings based in Malaysia. The Fund’s performance was adversely impacted by holdings based in Brazil. Overall, the currency effect lowered the overall performance of the Fund by roughly 0.06%.
The best performing stocks for the period were Top Glove Corp. (TOPG MK), which increased 357.97%, China International Marine (2039 HK), which returned 78.22%, and Infosys Ltd. (INFY), which gained 58.64%. The worst performing stocks were Cielo SA (CIEL3 BZ), which lost 63.87%, Turkiye Petrol Rafinerileri AS (TUPRS TI), which fell 51.42%; and Tatneft PJSC (ATAD LI), which decreased 48.32%.
Looking forward, the Fund's adviser believes the Fund’s strategy of annually selecting the five highest yielding securities in each of the ten sectors in the S-Network Emerging Markets Index is designed to provide high yield relative to the Morningstar Emerging Markets Index, potential for market participation in all economic cycles through equal sector weighting, and a deep value portfolio of securities as identified through high yield relative to their sector peers.
Performance (as of November 30, 2020)
| | 1 Year | 5 Year | Since Inception^ |
| ALPS Emerging Sector Dividend Dogs ETF – NAV | 5.20% | 4.16% | 1.25% |
| ALPS Emerging Sector Dividend Dogs ETF – Market Price* | 5.56% | 4.17% | 1.24% |
| S-Network® Emerging Sector Dividend Dogs Net Total Return Index | 5.89% | 4.93% | 2.06% |
| Morningstar® Emerging Markets Net Total Return Index | 18.10% | 10.65% | 6.09% |
ALPS Emerging Sector Dividend Dogs ETF
| Performance Overview | November 30, 2020 (Unaudited) |
Total Expense Ratio (per the current prospectus) 0.60%.
Performance data quoted represents past performance. Past performance does not guarantee future results. Total return figures assume reinvestment of dividends and capital gains distributions, if any. The table does not reflect the deduction of taxes that a shareholder would pay on Fund distributions or the redemption of Fund shares. Investment return and principal value of an investment will fluctuate so that an investor’s shares, when sold or redeemed, may be worth more or less than the original cost. Current performance data may be higher or lower than actual data quoted. For the most current month-end performance data please visit www.alpsfunds.com or call 1.866.675.2639.
NAV is an exchange-traded fund’s per-share value. The per-share dollar amount of the Fund is derived by dividing the total value of all the securities in its portfolio, less any liabilities, by the number of Fund shares outstanding. Market Price is the price at which a share can currently be traded in the market. Information detailing the number of days the Market Price of the Fund was greater than the Fund’s NAV and the number of days it was less than the Fund’s NAV can be obtained at www.alpsfunds.com.
| ^ | The Fund Commencement Date was March 28, 2014. |
| * | Market Price means the official closing price of a share or, if it more accurately reflects the market value of a share at the time as of which the Fund calculates current net asset value per share, the price that is the midpoint of the bid-ask spread as of that time. It does not represent the returns an investor would receive if shares were traded at other times. |
The S-Network® Emerging Sector Dividend Dogs Net Total Return Index is a portfolio of stocks derived from a universe of mainly large capitalization stocks domiciled in emerging markets (the “S-Network Emerging Markets Index” “SNEMX”). The index methodology selects the five stocks in each of the GICS sectors, excluding the real estate sector, that make up the universe which offer the highest dividend yields as of the last trading day of November. The fifty stocks that are selected for inclusion in the portfolio are equally weighted. The universe includes stocks whose domicile and primary exchange listings are in countries identified by the World Bank as Upper Middle Income (certain lower middle income countries are also included, as well as stocks traded on the Taiwan Stock Exchange despite non-recognition by the World Bank). The selection criteria for the universe, in addition to the aforementioned country qualifications, also include requirements for sector inclusion, primary exchange listing, minimum market capitalization, share price, average daily trading volume and other factors. Total Return assumes reinvestment of any dividends and distributions realized during a given time period. Net Total Return (NTR) is obtained by reinvesting the net dividend, which is equal to the ordinary gross dividend minus the amount of withholding tax.
Morningstar® Emerging Markets Net Total Return Index measures the performance of emerging markets targeting the top 97% of stocks by market capitalization.
The indexes are not actively managed and do not reflect any deductions for fees, expenses or taxes. One cannot invest directly in an index. Index performance does not reflect fund performance.
The Fund’s shares are not individually redeemable. Investors buy and sell shares of the Fund on a secondary market. Only market makers or “authorized participants” may trade directly with the Fund, typically in blocks of 50,000 shares.
The ALPS Emerging Sector Dividend Dogs ETF is not suitable for all investors. Investments in the Fund are subject to investment risks, including possible loss of the principal amount invested.
ALPS Portfolio Solutions Distributor, Inc., a FINRA member, is the distributor for the ETF.
ALPS Emerging Sector Dividend Dogs ETF
| Performance Overview | November 30, 2020 (Unaudited) |
Top 10 Holdings* (as of November 30, 2020)
| China International Marine Containers | |
| Group Co., Ltd. | 2.78% |
| Ternium SA | 2.78% |
| Grupo Aeroportuario del Pacifico SAB de CV | 2.52% |
| Absa Group, Ltd. | 2.42% |
| Grupo Mexico SAB de CV | 2.38% |
| MTN Group, Ltd. | 2.28% |
| Adaro Energy Tbk PT | 2.27% |
| Alfa SAB de CV | 2.25% |
| Astra International Tbk PT | 2.21% |
| Ford Otomotiv Sanayi AS | 2.19% |
| Total % of Top 10 Holdings | 24.08% |
Sector Allocation* (as of November 30, 2020)
| Materials | 11.32% |
| Industrials | 11.07% |
| Financials | 10.26% |
| Consumer Discretionary | 10.08% |
| Information Technology | 9.63% |
| Consumer Staples | 9.62% |
| Utilities | 9.56% |
| Energy | 9.43% |
| Health Care | 9.42% |
| Communication Services | 9.34% |
| Money Market Fund | 0.27% |
| Total | 100.00% |
Future holdings are subject to change.
Growth of $10,000 (as of November 30, 2020)
Comparison of Change in Value of $10,000 Investment in the Fund and the Indexes
The chart above compares historical performance of a hypothetical investment of $10,000 in the Fund since inception with the performance of the Fund’s benchmark index. Past performance does not guarantee future results. The chart does not reflect the deduction of taxes that a shareholder would pay on Fund distributions or the redemption of Fund shares.
ALPS REIT Dividend Dogs ETF
| Performance Overview | November 30, 2020 (Unaudited) |
Investment Objective
The ALPS REIT Dividend Dogs ETF (the “Fund” or "RDOG") seeks investment results that replicate as closely as possible, before fees and expenses, the performance of the S-Network® REIT Dividend Dogs Total Return Index (the “Underlying Index”).
The Underlying Index is a rules-based index intended to give investors a means of tracking the overall performance of the highest dividend paying real estate investment trusts (“REITs”) (i.e. “Dividend Dogs”) in the S-Network® Composite US REIT Index, a universe of mainly REITs listed in the United States (the “S-Net U.S. REIT” or "SNREIT"), on a segment-by-segment basis. “Dividend Dogs” refers to the five REITs in each of the nine segments that make up the S-Net U.S. REIT which offer the highest dividend yields.
Performance Overview
The Fund, for the twelve-month period ended November 30, 2020, generated a total return of -11.75%, in-line with the Fund’s Underlying Index, net of fees, which returned -12.30%. The Fund underperformed the broader U.S. REIT market, as represented by the S-Network Composite US REIT Index (SNREIT), which returned -7.23% for the same period.
The trailing twelve-month (TTM) distribution yield for the Fund as of November 30, 2020 was 4.85% while the SNREIT TTM yield was 4.04% as of November 30, 2020.
The S-Network Composite US REIT Index returned -7.23% on a trailing twelve-month period ended November 30, 2020. U.S. equity markets ended 2019 with solid gains in December 2019, before posting monthly losses in January, February, and March 2020. Global markets plummeted from mid-February through the majority of March due to the spread of the novel coronavirus ("COVID-19"). The spread of COVID-19 prompted shutdowns from global governments thus causing global markets to weaken swiftly. The U.S., along with a number of other governments, introduced stimulus measures in late March in order to restart economic growth. These stimulus measures propelled the broader equity markets to climb for five consecutive months from lows seen in April. U.S. equity markets fluctuated in September and October over uncertainty over the U.S. election, which ultimately saw Joe Biden win in November. Congress continued to grapple over secondary stimulus measures to combat COVID-19 related economic downfall, but were unable to agree before November 30, 2020. However, November also saw positive initial vaccine results from three candidates boosting markets. Two vaccines were approved for emergency in the U.K., which prompted investor optimism and drove markets higher into the end of November 2020. The second half of the year, especially in September through November, saw a heavy rotation to value from growth. Travel sensitive REITs, such as Hotel & Resorts REITs, lagged the broader REIT market the most due to governmental lockdown measures. In contrast, Technology REITs performed the best during the period as data center demand surged to support the shift to a work-from-home schedule for many office workers.
The best performing stocks in the Fund for the period were Taubman Centers (TCO), which increased 45.07%, and Multiplan Empreendimentos (MULT3 BZ), which saw a gain of 22.27%. The largest detractors were Penn Real Estate Investment Trust (PEI), which decreased 91.29%, Washington Prime Group Inc. (WPG), which fell 68.48%, and Corecivic Inc. (CXW), which lost 56.16%.
Looking forward, the Fund's adviser believes the Fund’s strategy of annually selecting the five highest yielding securities in each of the nine segments in the S-Network Composite US REIT Index is designed to provide meaningfully higher yield relative to the S-Network Composite US REIT Index, potential for market participation in all economic cycles through equal segment weighting, and a value portfolio of securities as identified through high yield relative to their segment peers.
Performance (as of November 30, 2020)
| | 1 Year | 5 Year | 10 Year | Since Inception^ |
| ALPS REIT Dividend Dogs ETF – NAV | -11.75%^^ | 2.80% | 5.66% | 2.27% |
| ALPS REIT Dividend Dogs ETF – Market Price* | -11.54% | 2.79% | 5.62% | 2.27% |
| S-Network® REIT Dividend Dogs Total Return Index** | -12.30% | 6.04% | 8.83% | 7.44% |
| Cohen & Steers Global Realty Majors® Index** | -7.78% | 4.31% | 6.83% | 3.36% |
| S-Network® Composite US REIT Index*** | -7.23% | 6.48% | 9.16% | 6.90% |
| FTSE EPRA/ NAREIT Developed Real Estate Index*** | -10.85% | 4.16% | 6.60% | 3.34% |
| S&P 500® Total Return Index*** | 17.46% | 13.99% | 14.19% | 10.21% |
Total Expense Ratio (per the current prospectus) is 0.35%.
Performance data quoted represents past performance. Past performance does not guarantee future results. On January 2, 2020, the Fund changed its Underlying Index and principal investment strategies. Consequently, the Fund's total returns shown above for the periods prior to January 2, 2020 are not necessarily indicative of the performance of the Fund, as it is currently managed. Total return figures assume reinvestment of dividends and capital gains distributions, if any. The table does not reflect the deduction of taxes that a shareholder would pay on Fund distributions or the redemption of Fund shares. Investment return and principal value of an investment will fluctuate so that an investor’s shares, when sold or redeemed, may be worth more or less than the original cost. Current performance data may be higher or lower than actual data quoted. For the most current month-end performance data please visit www.alpsfunds.com or call 1.866.759.5679.
ALPS REIT Dividend Dogs ETF
| Performance Overview | November 30, 2020 (Unaudited) |
NAV is an exchange-traded fund’s per-share value. The per-share dollar amount of the Fund is derived by dividing the total value of all the securities in its portfolio, less any liabilities, by the number of Fund shares outstanding. Market Price is the price at which a share can currently be traded in the market. Information detailing the number of days the Market Price of the Fund was greater than the Fund’s NAV and the number of days it was less than the Fund’s NAV can be obtained at www.alpsfunds.com.
| ^ | The Fund Inception Date was May 7, 2008. |
| ^^ | Excludes adjustments in accordance with accounting principles generally accepted in the United States of America and as such, the net asset value and total return for shareholder transactions reported to the market at the period ended November 30, 2020 may differ from the net asset value for financial reporting purposes. |
| * | Market Price means the official closing price of a share or, if it more accurately reflects the market value of a share at the time as of which the Fund calculates current net asset value per share, the price that is the midpoint of the bid-ask spread as of that time. It does not represent the returns an investor would receive if shares were traded at other times. |
| ** | Effective January 2, 2020, the Fund replaced the Cohen & Steers Global Realty Majors Portfolio Index as the Fund’s primary benchmark for performance comparison purposes. The Adviser made this recommendation to the Board because the Fund’s new primary benchmark, the S-Network® REIT Dividend Dogs Total Return Index more closely aligns with the Fund’s investment strategies and investment restrictions. Returns for both benchmarks will be shown for a transition period. |
| *** | Effective January 2, 2020, the Fund replaced the S&P 500® Total Return Index and the FTSE EPRA/NAREIT Developed Real Estate Index as the Fund’s secondary benchmarks for performance comparison purposes. The Adviser made this recommendation to the Board because the Fund’s new secondary benchmark, the S-Network® Composite US REIT Index, more closely aligns with the Fund’s investment strategies and investment restrictions. Returns for both benchmarks will be shown for a transition period. |
The S-Network® REIT Dividend Dogs Total Return Index, like the S-Net U.S. REIT from which components of the Underlying Index are selected, divides into nine segments, eight of which are based on Global Industry Classification Standard (“GICS”) Sub-Industries (excluding Technology REITs involved in cell towers and/or data centers) and a separate Technology REIT segment based on the research of the Underlying Index provider, S-Network® Global Indexes, Inc. (the “Index Provider”). The Underlying Index generally consists of 45 REITs on each annual reconstitution date. The Underlying Index’s REITs must be constituents of the S-Net U.S. REIT universe, which includes a universe of mainly REITs listed in the United States. The selection criteria for the universe also includes requirements for segment inclusion, primary exchange listing, minimum market capitalization, share price, average daily trading volume and other factors. The Underlying Index is rebalanced quarterly. The index is reported on a total return basis, which assumes reinvestment of any dividends and distributions realized during a given time period.
Cohen & Steers Global Realty Majors® Index: A free-float adjusted, modified market capitalization-weighted index of global real estate equities. The modified market capitalization weighting approach and qualitative screening process emphasize those companies that, in the opinion of the Cohen & Steers investment committee, are leading the securitization of real estate globally.
The S-Network® Composite US REIT Index (the “S-Net U.S. REIT” or “SNREIT”) is a benchmark index for the Real Estate Investment Trust component of the US stock market. The SNREIT provides the universe of stocks for RDOGX. The selection criteria for SNREIT include requirements for sector inclusion, primary exchange listing, minimum market capitalization, minimum average daily trading volume, and other factors. All constituents of RDOGX must be constituents of SNREIT.
FTSE EPRA/NAREIT Developed Real Estate Index: An unmanaged market-weighted total return index that consists of many companies from developed markets whose floats are larger than $100 million and which derive more than half of their revenue from property-related activities.
The S&P 500® Total Return Index is an index of 500 stocks chosen for market size, liquidity and industry grouping among other factors. Total return assumes reinvestment of any dividends and distributions realized during a given time period.
The indexes are not actively managed and do not reflect any deductions for fees, expenses or taxes. Total return assumes reinvestment of any dividends and distributions realized during a given time period. One cannot invest directly in an index. Index performance does not reflect fund performance.
The Fund’s shares are not individually redeemable. Investors buy and sell shares of the Fund on a secondary market. Only market makers or “authorized participants” may trade directly with the Fund, typically in blocks of 50,000 shares.
The ALPS REIT Dividend Dogs ETF is not suitable for all investors. Investments in the Fund are subject to investment risks, including possible loss of the principal amount invested.
ALPS Portfolio Solutions Distributor, Inc., a FINRA member, is the distributor for the ETF.
ALPS REIT Dividend Dogs ETF
| Performance Overview | November 30, 2020 (Unaudited) |
Top 10 Holdings* (as of November 30, 2020)
| Tanger Factory Outlet Centers, Inc. | 3.38% |
| Washington Prime Group, Inc. | 3.32% |
| Park Hotels & Resorts, Inc. | 3.18% |
| Summit Hotel Properties, Inc. | 3.10% |
| Service Properties Trust | 2.81% |
| The Macerich Co. | 2.68% |
| RLJ Lodging Trust | 2.68% |
| Apartment Investment and Management Co., Class A | 2.61% |
| Apple Hospitality REIT, Inc. | 2.58% |
| SL Green Realty Corp. | 2.55% |
| Total % of Top 10 Holdings | 28.89% |
* % of Total Investments (excluding investments purchased with collateral from securities loaned).
REIT Sector Allocation* (as of November 30, 2020)
| Hotel & Resort REITs | 14.35% |
| Retail REITs | 11.75% |
| Residential REITs | 11.48% |
| Office REITs | 11.41% |
| Health Care REITs | 10.79% |
| Diversified REITs | 10.55% |
| Specialized REITs | 9.85% |
| Industrial REITs | 9.76% |
| Technology REITs | 9.73% |
| Money Market Fund | 0.33% |
| Total | 100.00% |
Future holdings are subject to change.
Growth of $10,000 (as of November 30, 2020)
Comparison of Change in Value of $10,000 Investment in the Fund and the Indexes
The chart above compares historical performance of a hypothetical investment of $10,000 in the Fund for the past ten years with the performance of the Fund’s benchmark index. Past performance does not guarantee future results. The chart does not reflect the deduction of taxes that a shareholder would pay on Fund distributions or the redemption of Fund shares.
ALPS ETF Trust
| Disclosure of Fund Expenses | November 30, 2020 (Unaudited) |
Shareholder Expense Example: As a shareholder of a Fund, you incur certain ongoing costs, including management fees and other Fund expenses. These examples are intended to help you understand your ongoing costs (in dollars) of investing in the Fund and to compare these costs with the ongoing costs of investing in other funds. It is based on an investment of $1,000 invested at the beginning of the (six month) period and held through November 30, 2020.
Actual Return: The first line of the table provides information about actual account values and actual expenses. You may use the information in this line, together with the amount you invested, to estimate the expenses that you incurred over the period. Simply divide your account value by $1,000 (for example, an $8,600 account value divided by $1,000 = 8.6), then multiply the result by the number in the first line under the heading entitled “Expenses Paid During Period” to estimate the expenses attributable to your investment during this period.
Hypothetical 5% Return: The second line of the table provides information about hypothetical account values and hypothetical expenses based on the Fund’s actual expense ratio and an assumed rate of return of 5% per year before expenses, which is not the Fund’s actual return. The hypothetical account values and expenses may not be used to estimate the actual ending account balance or expenses you paid for the period. You may use this information to compare ongoing costs of investing in the Fund and other funds. To do so, compare this 5% hypothetical example with the 5% hypothetical examples that appear in the shareholder reports of other funds.
The expenses shown in the table are meant to highlight ongoing Fund costs only and do not reflect any transaction costs, such as brokerage commissions and other fees to financial intermediaries. Therefore, the second line is useful in comparing ongoing costs only, and will not help you determine the relative total costs of owning different funds. In addition, if these costs were included, your costs would have been higher.
| | | Beginning Account Value 6/1/20 | | Ending Account Value 11/30/20 | | Expense Ratio(a) | | Expenses Paid During Period 6/1/20 - 11/30/20(b) |
| ALPS Sector Dividend Dogs ETF | | | | | | | | | | | | | | | | |
| Actual | | $ | 1,000.00 | | | $ | 1,240.00 | | | | 0.40 | % | | $ | 2.24 | |
| Hypothetical (5% return before expenses) | | $ | 1,000.00 | | | $ | 1,023.00 | | | | 0.40 | % | | $ | 2.02 | |
| | | | | | | | | | | | | | | | | |
| ALPS International Sector Dividend Dogs ETF | | | | | | | | | | | | | | | | |
| Actual | | $ | 1,000.00 | | | $ | 1,175.00 | | | | 0.50 | % | | $ | 2.72 | |
| Hypothetical (5% return before expenses) | | $ | 1,000.00 | | | $ | 1,022.50 | | | | 0.50 | % | | $ | 2.53 | |
| | | | | | | | | | | | | | | | | |
| ALPS Emerging Sector Dividend Dogs ETF | | | | | | | | | | | | | | | | |
| Actual | | $ | 1,000.00 | | | $ | 1,210.50 | | | | 0.60 | % | | $ | 3.32 | |
| Hypothetical (5% return before expenses) | | $ | 1,000.00 | | | $ | 1,022.00 | | | | 0.60 | % | | $ | 3.03 | |
| | | | | | | | | | | | | | | | | |
| ALPS REIT Dividend Dogs ETF | | | | | | | | | | | | | | | | |
| Actual | | $ | 1,000.00 | | | $ | 1,174.00 | | | | 0.35 | % | | $ | 1.90 | |
| Hypothetical (5% return before expenses) | | $ | 1,000.00 | | | $ | 1,023.25 | | | | 0.35 | % | | $ | 1.77 | |
| (a) | Annualized based on the Fund's most recent half-year expenses. |
| (b) | Expenses are equal to the Fund's annualized expense ratio multiplied by the average account value over the period, multiplied by the number of days in the most recent fiscal half year (183), divided by 366. |
ALPS ETF Trust
Report of Independent Registered Public Accounting Firm
To the shareholders and the Board of Trustees of ALPS ETF Trust
Opinion on the Financial Statements and Financial Highlights
We have audited the accompanying statements of assets and liabilities, including the statements of investments, of ALPS Sector Dividend Dogs ETF, ALPS International Sector Dividend Dogs ETF, ALPS Emerging Sector Dividend Dogs ETF and ALPS REIT Dividend Dogs ETF1 (the "Funds"), four of the funds constituting the ALPS ETF Trust, as of November 30, 2020, the related statements of operations for the year then ended, the statements of changes in net assets for each of the two years in the period then ended, and the financial highlights for each of the five years in the period then ended for the Funds, and the related notes.
In our opinion, the financial statements and financial highlights present fairly, in all material respects, the financial position of the Funds as of November 30, 2020, and the results of their operations for the year then ended, the changes in their net assets for each of the two years in the period then ended, and the financial highlights for each of the five years in the period then ended in conformity with accounting principles generally accepted in the United States of America.
Basis for Opinion
These financial statements and financial highlights are the responsibility of the Funds’ management. Our responsibility is to express an opinion on the Funds’ financial statements and financial highlights based on our audits. We are a public accounting firm registered with the Public Company Accounting Oversight Board (United States) (PCAOB) and are required to be independent with respect to the Funds in accordance with the U.S. federal securities laws and the applicable rules and regulations of the Securities and Exchange Commission and the PCAOB.
We conducted our audits in accordance with the standards of the PCAOB. Those standards require that we plan and perform the audit to obtain reasonable assurance about whether the financial statements and financial highlights are free of material misstatement, whether due to error or fraud. The Funds are not required to have, nor were we engaged to perform, an audit of their internal control over financial reporting. As part of our audits, we are required to obtain an understanding of internal control over financial reporting but not for the purpose of expressing an opinion on the effectiveness of the Funds’ internal control over financial reporting. Accordingly, we express no such opinion.
Our audits included performing procedures to assess the risks of material misstatement of the financial statements and financial highlights, whether due to error or fraud, and performing procedures that respond to those risks. Such procedures included examining, on a test basis, evidence regarding the amounts and disclosures in the financial statements and financial highlights. Our audits also included evaluating the accounting principles used and significant estimates made by management, as well as evaluating the overall presentation of the financial statements and financial highlights. Our procedures included confirmation of securities owned as of November 30, 2020, by correspondence with the custodian and brokers; when replies were not received from brokers, we performed other auditing procedures. We believe that our audits provide a reasonable basis for our opinion.
DELOITTE & TOUCHE LLP
Denver, Colorado
January 25, 2021
We have served as the auditor of one or more investment companies advised by ALPS Advisors, Inc. since 2007.
| 1 | Formerly Cohen & Steers Global Realty Majors ETF |
ALPS Sector Dividend Dogs ETF
| Schedule of Investments | November 30, 2020 |
| Security Description | | Shares | | | Value | |
| COMMON STOCKS (99.34%) | | | | | | | | |
| Communication Services (9.58%) | | | | | | | | |
| AT&T, Inc. | | | 608,196 | | | $ | 17,485,635 | |
| CenturyLink, Inc. | | | 1,651,521 | | | | 17,258,394 | |
| Interpublic Group of Cos., Inc. | | | 1,019,515 | | | | 22,714,794 | |
| Omnicom Group, Inc. | | | 337,106 | | | | 21,237,678 | |
| Verizon Communications, Inc. | | | 294,985 | | | | 17,820,044 | |
| Total Communication Services | | | | | | | 96,516,545 | |
| | | | | | | | | |
| Consumer Discretionary (9.49%) | | | | | | | | |
| Hanesbrands, Inc. | | | 1,146,050 | | | | 16,273,910 | |
| Hasbro, Inc. | | | 224,759 | | | | 20,909,330 | |
| Leggett & Platt, Inc. | | | 395,811 | | | | 17,059,454 | |
| Newell Brands, Inc. | | | 1,010,741 | | | | 21,488,354 | |
| Whirlpool Corp. | | | 102,055 | | | | 19,860,923 | |
| Total Consumer Discretionary | | | | | | | 95,591,971 | |
| | | | | | | | | |
| Consumer Staples (8.82%) | | | | | | | | |
| Altria Group, Inc. | | | 403,445 | | | | 16,069,215 | |
| Archer-Daniels-Midland Co. | | | 376,145 | | | | 18,720,737 | |
| Kraft Heinz Co. | | | 556,215 | | | | 18,321,722 | |
| Philip Morris International, Inc. | | | 217,127 | | | | 16,447,370 | |
| Walgreens Boots Alliance, Inc. | | | 508,132 | | | | 19,314,097 | |
| Total Consumer Staples | | | | | | | 88,873,141 | |
| | | | | | | | | |
| Energy (10.74%) | | | | | | | | |
| Exxon Mobil Corp. | | | 476,648 | | | | 18,174,588 | |
| Occidental Petroleum Corp. | | | 1,725,580 | | | | 27,195,141 | |
| ONEOK, Inc. | | | 671,146 | | | | 24,074,007 | |
| Schlumberger, Ltd. | | | 984,168 | | | | 20,460,853 | |
| Williams Cos., Inc. | | | 871,854 | | | | 18,291,497 | |
| Total Energy | | | | | | | 108,196,086 | |
| | | | | | | | | |
| Financials (11.03%) | | | | | | | | |
| Huntington Bancshares, Inc. | | | 1,822,065 | | | | 22,010,545 | |
| Invesco, Ltd. | | | 1,648,196 | | | | 26,750,221 | |
| People's United Financial, Inc. | | | 1,732,403 | | | | 21,481,797 | |
| Principal Financial Group, Inc. | | | 429,440 | | | | 21,381,818 | |
| Prudential Financial, Inc. | | | 258,917 | | | | 19,579,304 | |
| Total Financials | | | | | | | 111,203,685 | |
| | | | | | | | | |
| Health Care (9.45%) | | | | | | | | |
| AbbVie, Inc. | | | 196,624 | | | | 20,562,938 | |
| Bristol-Myers Squibb Co. | | | 298,989 | | | | 18,656,913 | |
| Cardinal Health, Inc. | | | 364,559 | | | | 19,901,276 | |
| Gilead Sciences, Inc. | | | 268,201 | | | | 16,271,755 | |
| Pfizer, Inc. | | | 517,556 | | | | 19,827,570 | |
| Total Health Care | | | | | | | 95,220,452 | |
| | | | | | | | | |
| Industrials (9.70%) | | | | | | | | |
| 3M Co. | | | 106,133 | | | | 18,332,353 | |
| Cummins, Inc. | | | 84,831 | | | | 19,610,382 | |
| Eaton Corp. PLC | | | 172,032 | | | | 20,834,796 | |
| Emerson Electric Co. | | | 259,673 | | | | 19,948,080 | |
| Security Description | | Shares | | | Value | |
| Industrials (continued) | | | | | | | | |
| United Parcel Service, Inc., Class B | | | 111,033 | | | $ | 18,994,415 | |
| Total Industrials | | | | | | | 97,720,026 | |
| | | | | | | | | |
| Information Technology (10.25%) | | | | | | | | |
| Broadcom, Inc. | | | 49,013 | | | | 19,682,640 | |
| International Business Machines Corp. | | | 145,209 | | | | 17,936,216 | |
| Maxim Integrated Products, Inc. | | | 267,234 | | | | 22,191,111 | |
| Seagate Technology PLC | | | 378,983 | | | | 22,287,990 | |
| Western Digital Corp. | | | 471,970 | | | | 21,182,014 | |
| Total Information Technology | | | | | | | 103,279,971 | |
| | | | | | | | | |
| Materials (10.68%) | | | | | | | | |
| Eastman Chemical Co. | | | 220,378 | | | | 21,464,817 | |
| International Paper Co. | | | 452,968 | | | | 22,412,857 | |
| LyondellBasell Industries NV, Class A | | | 237,347 | | | | 20,198,230 | |
| Nucor Corp. | | | 384,018 | | | | 20,621,767 | |
| Westrock Co. | | | 542,559 | | | | 22,901,415 | |
| Total Materials | | | | | | | 107,599,086 | |
| | | | | | | | | |
| Utilities (9.60%) | | | | | | | | |
| CenterPoint Energy, Inc. | | | 906,821 | | | | 21,029,179 | |
| Dominion Resources, Inc. | | | 221,463 | | | | 17,382,631 | |
| Duke Energy Corp. | | | 212,419 | | | | 19,682,744 | |
| PPL Corp. | | | 640,659 | | | | 18,207,529 | |
| Southern Co. | | | 340,760 | | | | 20,394,486 | |
| Total Utilities | | | | | | | 96,696,569 | |
| | | | | | | | | |
| TOTAL COMMON STOCKS | | | | | | | | |
| (Cost $1,056,523,785) | | | | | | | 1,000,897,532 | |
| | | 7 Day Yield | | | Shares | | | Value | |
| SHORT TERM INVESTMENTS (0.22%) | | | | | | | | | | | | |
| Money Market Fund | | | | | | | | | | | | |
| State Street Institutional Treasury Plus Money Market Fund | | | 0.01 | % | | | 2,192,467 | | | | 2,192,467 | |
| TOTAL SHORT TERM INVESTMENTS | | | | | | | | | | | | |
| (Cost $2,192,467) | | | | | | | | | | | 2,192,467 | |
| | | | | | | | | | | | | |
| TOTAL INVESTMENTS (99.56%) | | | | | | | | | | | | |
| (Cost $1,058,716,252) | | | | | | | | | | $ | 1,003,089,999 | |
| OTHER ASSETS IN EXCESS OF LIABILITIES (0.44%) | | | | | | | | | | | 4,424,052 | |
| NET ASSETS - 100.00% | | | | | | | | | | $ | 1,007,514,051 | |
See Notes to Financial Statements.
ALPS International Sector Dividend Dogs ETF
| Schedule of Investments | November 30, 2020 |
| Security Description | | Shares | | | Value | |
| COMMON STOCKS (99.16%) | | | | | | | | |
| Australia (12.52%) | | | | | | | | |
| Australia & New Zealand Banking Group, Ltd. | | | 208,388 | | | $ | 3,463,165 | |
| BHP Group, Ltd. | | | 100,046 | | | | 2,795,804 | |
| Fortescue Metals Group, Ltd. | | | 210,662 | | | | 2,819,012 | |
| National Australia Bank, Ltd. | | | 213,596 | | | | 3,588,913 | |
| Rio Tinto, Ltd. | | | 36,620 | | | | 2,725,714 | |
| Wesfarmers, Ltd. | | | 81,181 | | | | 2,946,760 | |
| Total Australia | | | | | | | 18,339,368 | |
| | | | | | | | | |
| Denmark (2.14%) | | | | | | | | |
| Danske Bank A/S(a) | | | 189,955 | | | | 3,130,809 | |
| | | | | | | | | |
| France (8.32%) | | | | | | | | |
| Bouygues SA | | | 69,361 | | | | 2,761,765 | |
| Natixis SA(a) | | | 1,030,305 | | | | 3,170,812 | |
| Renault SA(a) | | | 91,828 | | | | 3,653,601 | |
| Sanofi | | | 25,655 | | | | 2,592,338 | |
| Total France | | | | | | | 12,178,516 | |
| | | | | | | | | |
| Germany (5.57%) | | | | | | | | |
| BASF SE | | | 40,936 | | | | 2,994,769 | |
| Bayer AG | | | 40,599 | | | | 2,337,640 | |
| Evonik Industries AG | | | 93,619 | | | | 2,826,449 | |
| Total Germany | | | | | | | 8,158,858 | |
| | | | | | | | | |
| Hong Kong (5.47%) | | | | | | | | |
| CITIC, Ltd. | | | 3,077,000 | | | | 2,405,689 | |
| CK Hutchison Holdings, Ltd. | | | 425,000 | | | | 3,084,260 | |
| Sands China, Ltd. | | | 612,200 | | | | 2,511,655 | |
| Total Hong Kong | | | | | | | 8,001,604 | |
| | | | | | | | | |
| Italy (3.98%) | | | | | | | | |
| Eni SpA | | | 295,577 | | | | 2,927,458 | |
| Intesa Sanpaolo SpA(a) | | | 1,262,410 | | | | 2,899,388 | |
| Total Italy | | | | | | | 5,826,846 | |
| | | | | | | | | |
| Japan (17.82%) | | | | | | | | |
| Canon, Inc.(b) | | | 160,263 | | | | 2,845,282 | |
| FUJIFILM Holdings Corp. | | | 56,200 | | | | 3,028,017 | |
| Hitachi, Ltd. | | | 76,000 | | | | 2,887,127 | |
| Japan Tobacco, Inc. | | | 141,800 | | | | 2,879,464 | |
| Komatsu, Ltd. | | | 118,000 | | | | 2,870,881 | |
| Kyocera Corp. | | | 45,200 | | | | 2,581,682 | |
| SoftBank Corp. | | | 216,600 | | | | 2,664,968 | |
| Takeda Pharmaceutical Co., Ltd. | | | 72,400 | | | | 2,597,107 | |
| Tokyo Electron, Ltd. | | | 11,000 | | | | 3,737,261 | |
| Total Japan | | | | | | | 26,091,789 | |
| | | | | | | | | |
| Macau (1.69%) | | | | | | | | |
| Wynn Macau, Ltd.(a) | | | 1,453,600 | | | | 2,479,224 | |
| | | | | | | | | |
| Netherlands (3.90%) | | | | | | | | |
| Koninklijke Ahold Delhaize NV | | | 86,351 | | | | 2,471,056 | |
| Security Description | | Shares | | | Value | |
| Netherlands (continued) | | | | | | | | |
| Royal Dutch Shell PLC, Class A | | | 188,964 | | | $ | 3,242,680 | |
| Total Netherlands | | | | | | | 5,713,736 | |
| | | | | | | | | |
| Norway (3.71%) | | | | | | | | |
| Equinor ASA | | | 169,944 | | | | 2,678,329 | |
| Mowi ASA | | | 136,218 | | | | 2,757,006 | |
| Total Norway | | | | | | | 5,435,335 | |
| | | | | | | | | |
| Portugal (1.92%) | | | | | | | | |
| EDP - Energias de Portugal SA | | | 526,486 | | | | 2,805,983 | |
| | | | | | | | | |
| Spain (10.60%) | | | | | | | | |
| ACS Actividades de | | | | | | | | |
| Construccion y Servicios SA | | | 105,749 | | | | 3,341,513 | |
| Endesa SA | | | 95,256 | | | | 2,723,613 | |
| Naturgy Energy Group SA | | | 132,987 | | | | 3,067,174 | |
| Repsol SA | | | 351,278 | | | | 3,376,472 | |
| Telefonica SA | | | 689,402 | | | | 3,007,340 | |
| Total Spain | | | | | | | 15,516,112 | |
| | | | | | | | | |
| Sweden (4.32%) | | | | | | | | |
| Hennes & Mauritz AB, Class B(a) | | | 163,670 | | | | 3,465,410 | |
| Telia Co. AB | | | 675,638 | | | | 2,864,228 | |
| Total Sweden | | | | | | | 6,329,638 | |
| | | | | | | | | |
| United Kingdom (17.20%) | | | | | | | | |
| AstraZeneca PLC | | | 24,656 | | | | 2,565,526 | |
| BP PLC | | | 792,959 | | | | 2,618,001 | |
| British American Tobacco PLC | | | 78,490 | | | | 2,761,956 | |
| BT Group PLC | | | 1,892,485 | | | | 2,946,837 | |
| GlaxoSmithKline PLC | | | 136,766 | | | | 2,497,926 | |
| Imperial Brands PLC | | | 153,228 | | | | 2,780,207 | |
| National Grid Plc | | | 244,060 | | | | 2,760,439 | |
| SSE PLC | | | 171,247 | | | | 3,061,488 | |
| WPP PLC | | | 330,457 | | | | 3,196,635 | |
| Total United Kingdom | | | | | | | 25,189,015 | |
| | | | | | | | | |
| TOTAL COMMON STOCKS | | | | | | | | |
| (Cost $163,114,032) | | | | | | | 145,196,833 | |
| | | 7 Day Yield | | | Shares | | | Value | |
| SHORT TERM INVESTMENTS (0.22%) | | | | | | | | | | | | |
| Money Market Fund | | | | | | | | | | | | |
| State Street Institutional Treasury Plus Money Market Fund | | | 0.01 | % | | | 322,732 | | | | 322,732 | |
| TOTAL SHORT TERM INVESTMENTS | | | | | | | | | | | | |
| (Cost $322,732) | | | | | | | | | | | 322,732 | |
| | | | | | | | | | | | | |
| TOTAL INVESTMENTS (99.38%) | | | | | | | | | | | | |
| (Cost $163,436,764) | | | | | | | | | | $ | 145,519,565 | |
| OTHER ASSETS IN EXCESS OF LIABILITIES (0.62%) | | | | | | | | | | | 911,321 | |
| NET ASSETS - 100.00% | | | | | | | | | | $ | 146,430,886 | |
ALPS International Sector Dividend Dogs ETF
| Schedule of Investments | November 30, 2020 |
| (a) | Non-income producing security. |
| (b) | Security, or a portion of the security position is currently on loan. The total market value of securities on loan is $2,133,672. |
See Notes to Financial Statements.
ALPS Emerging Sector Dividend Dogs ETF
| Schedule of Investments | November 30, 2020 |
| Security Description | | Shares | | | Value | |
| COMMON STOCKS (99.67%) | | | | | | | | |
| Brazil (6.64%) | | | | | | | | |
| CCR SA | | | 143,000 | | | $ | 348,331 | |
| Cielo SA | | | 458,622 | | | | 310,748 | |
| Engie Brasil Energia SA | | | 47,480 | | | | 379,138 | |
| Petrobras Distribuidora SA | | | 92,100 | | | | 353,966 | |
| Total Brazil | | | | | | | 1,392,183 | |
| | | | | | | | | |
| Chile (1.77%) | | | | | | | | |
| Enel Chile SA, ADR | | | 106,488 | | | | 371,643 | |
| | | | | | | | | |
| China (10.15%) | | | | | | | | |
| China International Marine Containers Group Co., Ltd. | | | 362,700 | | | | 582,113 | |
| China Petroleum & Chemical Corp., ADR | | | 8,703 | | | | 392,331 | |
| Legend Holdings Corp.(a)(b) | | | 289,000 | | | | 392,987 | |
| Lenovo Group, Ltd. | | | 578,000 | | | | 412,375 | |
| Livzon Pharmaceutical Group, Inc., Class H | | | 88,330 | | | | 347,574 | |
| Total China | | | | | | | 2,127,380 | |
| | | | | | | | | |
| Colombia (1.98%) | | | | | | | | |
| Grupo Energia Bogota SA ESP | | | 583,709 | | | | 415,515 | |
| | | | | | | | | |
| Czech Republic (4.04%) | | | | | | | | |
| CEZ AS | | | 19,239 | | | | 407,763 | |
| Komercni banka A.S.(c) | | | 16,426 | | | | 439,563 | |
| Total Czech Republic | | | | | | | 847,326 | |
| | | | | | | | | |
| Hungary (1.91%) | | | | | | | | |
| Richter Gedeon Nyrt | | | 16,873 | | | | 399,767 | |
| | | | | | | | | |
| India (4.30%) | | | | | | | | |
| Infosys, Ltd., Sponsored ADR | | | 30,018 | | | | 456,874 | |
| Wipro, Ltd., ADR | | | 86,378 | | | | 444,847 | |
| Total India | | | | | | | 901,721 | |
| | | | | | | | | |
| Indonesia (8.25%) | | | | | | | | |
| Adaro Energy Tbk PT | | | 4,827,900 | | | | 475,268 | |
| Astra International Tbk PT | | | 1,233,300 | | | | 462,924 | |
| Gudang Garam Tbk PT(c) | | | 128,900 | | | | 385,696 | |
| United Tractors Tbk PT | | | 248,400 | | | | 404,617 | |
| Total Indonesia | | | | | | | 1,728,505 | |
| | | | | | | | | |
| Luxembourg (2.78%) | | | | | | | | |
| Ternium SA, Sponsored ADR(c) | | | 20,984 | | | | 581,467 | |
| | | | | | | | | |
| Malaysia (7.79%) | | | | | | | | |
| Genting Malaysia Bhd | | | 717,800 | | | | 431,667 | |
| Malayan Banking Bhd | | | 212,900 | | | | 412,840 | |
| Petronas Gas Bhd | | | 96,400 | | | | 429,706 | |
| Top Glove Corp. Bhd | | | 204,900 | | | | 358,097 | |
| Total Malaysia | | | | | | | 1,632,310 | |
| | | | | | | | | |
| Mexico (9.19%) | | | | | | | | |
| Alfa SAB de CV | | | 600,113 | | | | 471,236 | |
| Security Description | | Shares | | | Value | |
| Mexico (continued) | | | | | | | | |
| Coca-Cola Femsa SAB de CV, ADR | | | 9,458 | | | $ | 428,731 | |
| Grupo Aeroportuario del Pacifico SAB de CV, ADR(c) | | | 5,164 | | | | 526,883 | |
| Grupo Mexico SAB de CV, Series B | | | 136,965 | | | | 498,110 | |
| Total Mexico | | | | | | | 1,924,960 | |
| | | | | | | | | |
| Philippines (3.35%) | | | | | | | | |
| Globe Telecom, Inc. | | | 8,910 | | | | 360,996 | |
| PLDT, Inc. | | | 12,485 | | | | 341,208 | |
| Total Philippines | | | | | | | 702,204 | |
| | | | | | | | | |
| Poland (3.77%) | | | | | | | | |
| Powszechny Zaklad | | | | | | | | |
| Ubezpieczen SA(c) | | | 51,778 | | | | 346,529 | |
| Santander Bank Polska SA(c) | | | 9,550 | | | | 442,719 | |
| Total Poland | | | | | | | 789,248 | |
| | | | | | | | | |
| Russia (9.31%) | | | | | | | | |
| Magnit PJSC, GDR(b) | | | 25,714 | | | | 388,024 | |
| MMC Norilsk Nickel PJSC, ADR | | | 14,895 | | | | 415,422 | |
| Mobile TeleSystems PJSC, Sponsored ADR | | | 43,183 | | | | 372,669 | |
| Severstal PAO, GDR(b) | | | 29,804 | | | | 435,437 | |
| Tatneft PJSC, ADR | | | 8,930 | | | | 339,340 | |
| Total Russia | | | | | | | 1,950,892 | |
| | | | | | | | | |
| South Africa (10.48%) | | | | | | | | |
| Absa Group, Ltd. | | | 71,118 | | | | 506,075 | |
| Exxaro Resources, Ltd. | | | 47,367 | | | | 364,866 | |
| MTN Group, Ltd. | | | 111,717 | | | | 477,852 | |
| Tiger Brands, Ltd. | | | 34,795 | | | | 442,626 | |
| Vodacom Group, Ltd. | | | 50,855 | | | | 404,673 | |
| Total South Africa | | | | | | | 2,196,092 | |
| | | | | | | | | |
| Thailand (6.06%) | | | | | | | | |
| Bangkok Dusit Medical Services Pcl | | | 585,600 | | | | 416,211 | |
| Bumrungrad Hospital Pcl | | | 109,600 | | | | 451,081 | |
| Home Product Center PCL | | | 829,500 | | | | 403,096 | |
| Total Thailand | | | | | | | 1,270,388 | |
| | | | | | | | | |
| Turkey (7.90%) | | | | | | | | |
| BIM Birlesik Magazalar AS | | | 41,307 | | | | 369,756 | |
| Enka Insaat ve Sanayi AS | | | 428,692 | | | | 389,221 | |
| Eregli Demir ve Celik Fabrikalari TAS | | | 312,032 | | | | 438,920 | |
| Ford Otomotiv Sanayi AS | | | 33,218 | | | | 457,916 | |
| Total Turkey | | | | | | | 1,655,813 | |
| | | | | | | | | |
| TOTAL COMMON STOCKS | | | | | | | | |
| (Cost $21,819,599) | | | | | | | 20,887,414 | |
ALPS Emerging Sector Dividend Dogs ETF
| Schedule of Investments | November 30, 2020 |
| | | 7 Day Yield | | | Shares | | | Value | |
| SHORT TERM INVESTMENTS (0.27%) | | | | | | | | | | | | |
| Money Market Fund | | | | | | | | | | | | |
| State Street Institutional Treasury Plus Money Market Fund | | | 0.01 | % | | | 56,958 | | | $ | 56,958 | |
| TOTAL SHORT TERM INVESTMENTS | | | | | | | | | |
| (Cost $56,958) | | | | | | | | | | | 56,958 | |
| | | | | | | | | | | | | |
| TOTAL INVESTMENTS (99.94%) | | | | | | | | | | | | |
| (Cost $21,876,557) | | | | | | | | | | $ | 20,944,372 | |
| OTHER ASSETS IN EXCESS OF LIABILITIES (0.06%) | | | | 13,166 | |
| NET ASSETS - 100.00% | | | | | | | | | | $ | 20,957,538 | |
| (a) | Securities exempt from registration under Rule 144A of the Securities Act of 1933. These securities may be sold in the ordinary course of business in transactions exempt from registration, normally to qualified institutional buyers. At period end, the aggregate market value of those securities was $392,987, representing 1.88% of net assets. |
| (b) | Securities were purchased pursuant to Regulation S under the Securities Act of 1933, which exempts securities offered and sold outside of the United States from registration. Such securities cannot be sold in the United States without either an effective registration statement filed pursuant to the Securities Act of 1933, or pursuant to an exemption from registration. As of November 30, 2020, the market value of those securities was $1,216,448 representing 5.80% of net assets. |
| (c) | Non-income producing security. |
See Notes to Financial Statements.
ALPS REIT Dividend Dogs ETF
| Schedule of Investments | November 30, 2020 |
| Security Description | | Shares | | | Value | |
| COMMON STOCKS (99.52%) | | | | | | | | |
| Diversified REITs (10.53%) | | | | | | | | |
| Global Net Lease, Inc. | | | 30,115 | | | $ | 502,619 | |
| STORE Capital Corp. | | | 18,725 | | | | 609,686 | |
| VEREIT, Inc. | | | 75,530 | | | | 535,508 | |
| Washington Real Estate Investment Trust | | | 25,779 | | | | 598,331 | |
| WP Carey, Inc. | | | 7,588 | | | | 525,165 | |
| Total Diversified REITs | | | | | | | 2,771,309 | |
| | | | | | | | | |
| Health Care REITs (10.77%) | | | | | | | | |
| Diversified Healthcare Trust | | | 139,833 | | | | 616,664 | |
| National Health Investors, Inc. | | | 8,161 | | | | 527,690 | |
| Omega Healthcare Investors, Inc. | | | 16,038 | | | | 564,858 | |
| Sabra Health Care REIT, Inc. | | | 34,016 | | | | 560,584 | |
| Ventas, Inc. | | | 11,809 | | | | 565,769 | |
| Total Health Care REITs | | | | | | | 2,835,565 | |
| | | | | | | | | |
| Hotel & Resort REITs (14.34%) | | | | | | | | |
| Apple Hospitality REIT, Inc. | | | 51,175 | | | | 678,581 | |
| Park Hotels & Resorts, Inc. | | | 51,276 | | | | 836,824 | |
| RLJ Lodging Trust | | | 57,043 | | | | 703,340 | |
| Service Properties Trust | | | 62,335 | | | | 739,293 | |
| Summit Hotel Properties, Inc. | | | 93,899 | | | | 815,982 | |
| Total Hotel & Resort REITs | | | | | | | 3,774,020 | |
| | | | | | | | | |
| Industrial REITs (9.75%) | | | | | | | | |
| Duke Realty Corp. | | | 13,927 | | | | 530,062 | |
| EastGroup Properties, Inc. | | | 4,024 | | | | 548,592 | |
| Lexington Realty Trust | | | 46,949 | | | | 479,349 | |
| Prologis, Inc. | | | 5,163 | | | | 516,558 | |
| STAG Industrial, Inc. | | | 16,508 | | | | 491,608 | |
| Total Industrial REITs | | | | | | | 2,566,169 | |
| | | | | | | | | |
| Office REITs (11.39%) | | | | | | | | |
| Brandywine Realty Trust | | | 50,182 | | | | 558,525 | |
| City Office REIT, Inc. | | | 68,256 | | | | 598,605 | |
| Highwoods Properties, Inc. | | | 14,936 | | | | 572,049 | |
| SL Green Realty Corp. | | | 11,561 | | | | 669,382 | |
| Vornado Realty Trust | | | 15,389 | | | | 598,786 | |
| Total Office REITs | | | | | | | 2,997,347 | |
| | | | | | | | | |
| Residential REITs (11.47%) | | | | | | | | |
| American Campus Communities, Inc. | | | 14,957 | | | | 595,288 | |
| Apartment Investment and Management Co., Class A | | | 22,603 | | | | 686,001 | |
| AvalonBay Communities, Inc. | | | 3,452 | | | | 575,069 | |
| Camden Property Trust | | | 5,767 | | | | 569,953 | |
| UDR, Inc. | | | 15,370 | | | | 591,284 | |
| Total Residential REITs | | | | | | | 3,017,595 | |
| | | | | | | | | |
| Retail REITs (11.73%) | | | | | | | | |
| Tanger Factory Outlet Centers, Inc.(a) | | | 93,899 | | | | 887,346 | |
| Taubman Centers, Inc. | | | 14,627 | | | | 624,865 | |
| Security Description | | Shares | | | Value | |
| Retail REITs (continued) | | | | | | | | |
| The Macerich Co. | | | 70,392 | | | $ | 703,920 | |
| Washington Prime Group, Inc. | | | 854,475 | | | | 871,565 | |
| Total Retail REITs | | | | | | | 3,087,696 | |
| | | | | | | | | |
| Specialized REITs (9.83%) | | | | | | | | |
| CoreCivic, Inc. | | | 57,296 | | | | 406,228 | |
| CubeSmart | | | 16,062 | | | | 522,497 | |
| EPR Properties | | | 16,143 | | | | 581,471 | |
| Four Corners Property Trust, Inc. | | | 20,289 | | | | 568,295 | |
| National Storage Affiliates Trust | | | 15,001 | | | | 509,734 | |
| Total Specialized REITs | | | | | | | 2,588,225 | |
| | | | | | | | | |
| Technology REITs (9.71%) | | | | | | | | |
| CoreSite Realty Corp. | | | 4,471 | | | | 560,619 | |
| Crown Castle International Corp. | | | 3,262 | | | | 546,613 | |
| CyrusOne, Inc. | | | 6,876 | | | | 480,701 | |
| Digital Realty Trust, Inc. | | | 3,553 | | | | 478,767 | |
| QTS Realty Trust, Inc., Class A | | | 8,246 | | | | 489,895 | |
| Total Technology REITs | | | | | | | 2,556,595 | |
| | | | | | | | | |
| TOTAL COMMON STOCKS | | | | | | | | |
| (Cost $30,813,481) | | | | | | | 26,194,521 | |
| | | 7 Day Yield | | | Shares | | | Value | |
| SHORT TERM INVESTMENTS (3.07%) | | | | | | | | | | | | |
| Money Market Fund (0.33%) | | | | | | | | | | | | |
| State Street Institutional Treasury Plus Money Market Fund | | | | | | | | | | | | |
| (Cost $85,685) | | | 0.01 | % | | | 85,685 | | | | 85,685 | |
| | | | | | | | | | | | | |
| Investments Purchased with Collateral from Securities Loaned (2.74%) | | | | | | | | | | | | |
| State Street Navigator Securities Lending Government Money Market Portfolio, 0.11% | | | | | | | | | | | | |
| (Cost $721,846) | | | | | | | 721,846 | | | | 721,846 | |
| TOTAL SHORT TERM INVESTMENTS | | | | | | | | | | | | |
| (Cost $807,531) | | | | | | | | | | | 807,531 | |
| | | | | | | | | | | | | |
| TOTAL INVESTMENTS (102.59%) | | | | | | | | | | | | |
| (Cost $31,621,012) | | | | | | | | | | $ | 27,002,052 | |
| LIABILITIES IN EXCESS OF OTHER ASSETS (-2.59%) | | | | | | | | | | | (681,568 | ) |
| NET ASSETS - 100.00% | | | | | | | | | | $ | 26,320,484 | |
| (a) | Security, or a portion of the security position is currently on loan. The total market value of securities on loan is $665,507. |
See Notes to Financial Statements.
ALPS ETF Trust
| Statements of Assets and Liabilities | November 30, 2020 |
| | | ALPS Sector Dividend Dogs ETF | | | ALPS International Sector Dividend Dogs ETF | | | ALPS Emerging Sector Dividend Dogs ETF | | | ALPS REIT Dividend Dogs ETF | |
| ASSETS: | | | | | | | | | | | | |
| Investments, at value | | $ | 1,003,089,999 | | | $ | 145,519,565 | | | $ | 20,944,372 | | | $ | 27,002,052 | |
| Foreign currency, at value (Cost $–, $37,888, $6,343 and $–) | | | – | | | | 37,888 | | | | 6,294 | | | | – | |
| Foreign tax reclaims | | | – | | | | 332,992 | | | | 4,735 | | | | 9,004 | |
| Dividends receivable | | | 4,741,295 | | | | 593,017 | | | | 12,299 | | | | 23,293 | |
| Receivable for investments sold | | | – | | | | 57,826 | | | | 6,132 | | | | 15,122 | |
| Total Assets | | | 1,007,831,294 | | | | 146,541,288 | | | | 20,973,832 | | | | 27,049,471 | |
| | | | | | | | | | | | | | | | | |
| LIABILITIES: | | | | | | | | | | | | | | | | |
| Payable for investments purchased | | | – | | | | 52,152 | | | | 6,294 | | | | – | |
| Payable to adviser | | | 317,243 | | | | 58,250 | | | | 10,000 | | | | 7,141 | |
| Payable for collateral upon return of securities loaned | | | – | | | | – | | | | – | | | | 721,846 | |
| Total Liabilities | | | 317,243 | | | | 110,402 | | | | 16,294 | | | | 728,987 | |
| NET ASSETS | | $ | 1,007,514,051 | | | $ | 146,430,886 | | | $ | 20,957,538 | | | $ | 26,320,484 | |
| | | | | | | | | | | | | | | | | |
| NET ASSETS CONSIST OF: | | | | | | | | | | | | | | | | |
| Paid-in capital | | $ | 1,349,935,030 | | | $ | 212,686,559 | | | $ | 31,630,682 | | | $ | 37,988,705 | |
| Total Distributable earnings | | | (342,420,979 | ) | | | (66,255,673 | ) | | | (10,673,144 | ) | | | (11,668,221 | ) |
| NET ASSETS | | $ | 1,007,514,051 | | | $ | 146,430,886 | | | $ | 20,957,538 | | | $ | 26,320,484 | |
| | | | | | | | | | | | | | | | | |
| INVESTMENTS, AT COST | | $ | 1,058,716,252 | | | $ | 163,436,764 | | | $ | 21,876,557 | | | $ | 31,621,012 | |
| | | | | | | | | | | | | | | | | |
| PRICING OF SHARES: | | | | | | | | | | | | | | | | |
| Net Assets | | $ | 1,007,514,051 | | | $ | 146,430,886 | | | $ | 20,957,538 | | | $ | 26,320,484 | |
| Shares of beneficial interest outstanding (Unlimited number of shares authorized, par value $0.01 per share) | | | 23,059,141 | | | | 5,900,000 | | | | 1,000,000 | | | | 650,000 | |
| Net Asset Value, offering and redemption price per share | | $ | 43.69 | | | $ | 24.82 | | | $ | 20.96 | | | $ | 40.49 | |
See Notes to Financial Statements.
ALPS ETF Trust
| Statements of Operations | For the Year Ended November 30, 2020 |
| | | ALPS Sector Dividend Dogs ETF | | | ALPS International Sector Dividend Dogs ETF | | | ALPS Emerging Sector Dividend Dogs ETF | | | ALPS REIT Dividend Dogs ETF(a) | |
| INVESTMENT INCOME: | | | | | | | | | | | | | | | | |
| Dividends* | | $ | 55,318,552 | | | $ | 6,169,694 | | | $ | 811,804 | | | $ | 1,221,676 | |
| Securities Lending Income | | | 3,885 | | | | 3,125 | | | | 617 | | | | 9,652 | |
| Total Investment Income | | | 55,322,437 | | | | 6,172,819 | | | | 812,421 | | | | 1,231,328 | |
| | | | | | | | | | | | | | | | | |
| EXPENSES: | | | | | | | | | | | | | | | | |
| Investment adviser fees | | | 4,734,438 | | | | 829,525 | | | | 138,479 | | | | 127,558 | |
| Total Expenses | | | 4,734,438 | | | | 829,525 | | | | 138,479 | | | | 127,558 | |
| NET INVESTMENT INCOME | | | 50,587,999 | | | | 5,343,294 | | | | 673,942 | | | | 1,103,770 | |
| | | | | | | | | | | | | | | | | |
| REALIZED AND UNREALIZED GAIN/(LOSS) | | | | | | | | | | | | | | | | |
| Net realized gain/(loss) on investments | | | (88,409,933 | ) | | | (5,568,875 | ) | | | (2,074,139 | ) | | | 5,183,954 | |
| Net realized loss on foreign currency transactions | | | – | | | | (108,455 | ) | | | (7,243 | ) | | | (18,877 | ) |
| Total net realized gain/(loss) | | | (88,409,933 | ) | | | (5,677,330 | ) | | | (2,081,382 | ) | | | 5,165,077 | |
| Net change in unrealized appreciation/(depreciation) on investments | | | (103,423,993 | ) | | | (16,919,228 | ) | | | 552,401 | | | | (14,486,807 | ) |
| Net change in unrealized appreciation on translation of assets and liabilities denominated in foreign currencies | | | – | | | | 48,804 | | | | 201 | | | | 1,285 | |
| Total net change in unrealized appreciation/(depreciation) | | | (103,423,993 | ) | | | (16,870,424 | ) | | | 552,602 | | | | (14,485,522 | ) |
| NET REALIZED AND UNREALIZED LOSS ON INVESTMENTS | | | (191,833,926 | ) | | | (22,547,754 | ) | | | (1,528,780 | ) | | | (9,320,445 | ) |
| NET DECREASE IN NET ASSETS RESULTING FROM OPERATIONS | | $ | (141,245,927 | ) | | $ | (17,204,460 | ) | | $ | (854,838 | ) | | $ | (8,216,675 | ) |
| *Net of foreign tax withholding: | | $ | – | | | $ | 500,962 | | | $ | 98,021 | | | $ | 11,112 | |
| (a) | Prior to January 2, 2020, the ALPS REIT Dividend Dogs ETF was known as the Cohen & Steers Global Realty Majors ETF. |
See Notes to Financial Statements.
ALPS Sector Dividend Dogs ETF
Statements of Changes in Net Assets
| | | For the Year Ended November 30, 2020 | | | For the Year Ended November 30, 2019 | |
| OPERATIONS: | | | | | | | | |
| Net investment income | | $ | 50,587,999 | | | $ | 73,241,493 | |
| Net realized loss | | | (88,409,933 | ) | | | (29,760,791 | ) |
| Net change in unrealized appreciation/(depreciation) | | | (103,423,993 | ) | | | 59,917,242 | |
| Net increase/(decrease) in net assets resulting from operations | | | (141,245,927 | ) | | | 103,397,944 | |
| | | | | | | | | |
| Net Equalization Credits | | | 3,589,268 | | | | 2,780,661 | |
| | | | | | | | | |
| DISTRIBUTIONS TO SHAREHOLDERS: | | | | | | | | |
| From distributable earnings | | | (51,189,402 | ) | | | (66,976,075 | ) |
| Total distributions | | | (51,189,402 | ) | | | (66,976,075 | ) |
| | | | | | | | | |
| CAPITAL SHARE TRANSACTIONS: | | | | | | | | |
| Proceeds from sale of shares | | | 152,957,639 | | | | 6,339,997 | |
| Cost of shares redeemed | | | (699,792,739 | ) | | | (462,685,894 | ) |
| Net income equalization (Note 2) | | | (3,589,268 | ) | | | (2,780,661 | ) |
| Net decrease from share transactions | | | (550,424,368 | ) | | | (459,126,558 | ) |
| Net decrease in net assets | | | (739,270,429 | ) | | | (419,924,028 | ) |
| | | | | | | | | |
| NET ASSETS: | | | | | | | | |
| Beginning of period | | | 1,746,784,480 | | | | 2,166,708,508 | |
| End of period | | $ | 1,007,514,051 | | | $ | 1,746,784,480 | |
| | | | | | | | | |
| OTHER INFORMATION: | | | | | | | | |
| CAPITAL SHARE TRANSACTIONS: | | | | | | | | |
| Beginning shares | | | 38,159,141 | | | | 48,959,141 | |
| Shares sold | | | 3,350,000 | | | | 150,000 | |
| Shares redeemed | | | (18,450,000 | ) | | | (10,950,000 | ) |
| Shares outstanding, end of period | | | 23,059,141 | | | | 38,159,141 | |
See Notes to Financial Statements.
ALPS International Sector Dividend Dogs ETF
Statements of Changes in Net Assets
| | | For the Year Ended November 30, 2020 | | | For the Year Ended November 30, 2019 | |
| OPERATIONS: | | | | | | | | |
| Net investment income | | $ | 5,343,294 | | | $ | 11,789,400 | |
| Net realized loss | | | (5,677,330 | ) | | | (20,865,192 | ) |
| Net change in unrealized appreciation/(depreciation) | | | (16,870,424 | ) | | | 34,514,316 | |
| Net increase/(decrease) in net assets resulting from operations | | | (17,204,460 | ) | | | 25,438,524 | |
| | | | | | | | | |
| Net Equalization Credits | | | 21,476 | | | | 364,051 | |
| | | | | | | | | |
| DISTRIBUTIONS TO SHAREHOLDERS: | | | | | | | | |
| From distributable earnings | | | (8,323,715 | ) | | | (11,551,790 | ) |
| From tax return of capital | | | (309,701 | ) | | | – | |
| Total distributions | | | (8,633,416 | ) | | | (11,551,790 | ) |
| | | | | | | | | |
| CAPITAL SHARE TRANSACTIONS: | | | | | | | | |
| Proceeds from sale of shares | | | 15,489,973 | | | | 10,544,878 | |
| Cost of shares redeemed | | | (64,962,269 | ) | | | (88,017,701 | ) |
| Net income equalization (Note 2) | | | (21,476 | ) | | | (364,051 | ) |
| Net decrease from share transactions | | | (49,493,772 | ) | | | (77,836,874 | ) |
| Net decrease in net assets | | | (75,310,172 | ) | | | (63,586,089 | ) |
| | | | | | | | | |
| NET ASSETS: | | | | | | | | |
| Beginning of period | | | 221,741,058 | | | | 285,327,147 | |
| End of period | | $ | 146,430,886 | | | $ | 221,741,058 | |
| | | | | | | | | |
| OTHER INFORMATION: | | | | | | | | |
| CAPITAL SHARE TRANSACTIONS: | | | | | | | | |
| Beginning shares | | | 8,250,000 | | | | 11,350,000 | |
| Shares sold | | | 650,000 | | | | 400,000 | |
| Shares redeemed | | | (3,000,000 | ) | | | (3,500,000 | ) |
| Shares outstanding, end of period | | | 5,900,000 | | | | 8,250,000 | |
See Notes to Financial Statements.
ALPS Emerging Sector Dividend Dogs ETF
Statements of Changes in Net Assets
| | | For the Year Ended November 30, 2020 | | | For the Year Ended November 30, 2019 | |
| OPERATIONS: | | | | | | | | |
| Net investment income | | $ | 673,942 | | | $ | 1,332,392 | |
| Net realized loss | | | (2,081,382 | ) | | | (3,357,958 | ) |
| Net change in unrealized appreciation | | | 552,602 | | | | 2,763,939 | |
| Net increase/(decrease) in net assets resulting from operations | | | (854,838 | ) | | | 738,373 | |
| | | | | | | | | |
| Net Equalization Credits | | | 26,895 | | | | 18,601 | |
| | | | | | | | | |
| DISTRIBUTIONS TO SHAREHOLDERS: | | | | | | | | |
| From distributable earnings | | | (831,362 | ) | | | (1,883,340 | ) |
| Total distributions | | | (831,362 | ) | | | (1,883,340 | ) |
| | | | | | | | | |
| CAPITAL SHARE TRANSACTIONS: | | | | | | | | |
| Proceeds from sale of shares | | | 3,165,851 | | | | – | |
| Cost of shares redeemed | | | (9,462,865 | ) | | | (5,114,874 | ) |
| Net income equalization (Note 2) | | | (26,895 | ) | | | (18,601 | ) |
| Net decrease from share transactions | | | (6,323,909 | ) | | | (5,133,475 | ) |
| Net decrease in net assets | | | (7,983,214 | ) | | | (6,259,841 | ) |
| | | | | | | | | |
| NET ASSETS: | | | | | | | | |
| Beginning of period | | | 28,940,752 | | | | 35,200,593 | |
| End of period | | $ | 20,957,538 | | | $ | 28,940,752 | |
| | | | | | | | | |
| OTHER INFORMATION: | | | | | | | | |
| CAPITAL SHARE TRANSACTIONS: | | | | | | | | |
| Beginning shares | | | 1,400,000 | | | | 1,650,000 | |
| Shares sold | | | 150,000 | | | | – | |
| Shares redeemed | | | (550,000 | ) | | | (250,000 | ) |
| Shares outstanding, end of period | | | 1,000,000 | | | | 1,400,000 | |
See Notes to Financial Statements.
ALPS REIT Dividend Dogs ETF
Statements of Changes in Net Assets
| | | For the Year Ended November 30, 2020(a) | | | For the Year Ended November 30, 2019 | |
| OPERATIONS: | | | | | | | | |
| Net investment income | | $ | 1,103,770 | | | $ | 1,368,984 | |
| Net realized gain | | | 5,165,077 | | | | 1,744,020 | |
| Net change in unrealized appreciation/(depreciation) | | | (14,485,522 | ) | | | 3,448,816 | |
| Net increase/(decrease) in net assets resulting from operations | | | (8,216,675 | ) | | | 6,561,820 | |
| | | | | | | | | |
| DISTRIBUTIONS TO SHAREHOLDERS: | | | | | | | | |
| From distributable earnings | | | (1,494,087 | ) | | | (1,634,862 | ) |
| From tax return of capital | | | (336,997 | ) | | | – | |
| Total distributions | | | (1,831,084 | ) | | | (1,634,862 | ) |
| | | | | | | | | |
| CAPITAL SHARE TRANSACTIONS: | | | | | | | | |
| Proceeds from sale of shares | | | 19,287,844 | | | | – | |
| Cost of shares redeemed | | | (36,184,766 | ) | | | (6,883,881 | ) |
| Net decrease from share transactions | | | (16,896,922 | ) | | | (6,883,881 | ) |
| Net decrease in net assets | | | (26,944,681 | ) | | | (1,956,923 | ) |
| | | | | | | | | |
| NET ASSETS: | | | | | | | | |
| Beginning of period | | | 53,265,165 | | | | 55,222,088 | |
| End of period | | $ | 26,320,484 | | | $ | 53,265,165 | |
| | | | | | | | | |
| OTHER INFORMATION: | | | | | | | | |
| CAPITAL SHARE TRANSACTIONS: | | | | | | | | |
| Beginning shares | | | 1,100,000 | | | | 1,250,000 | |
| Shares sold | | | 400,000 | | | | – | |
| Shares redeemed | | | (850,000 | ) | | | (150,000 | ) |
| Shares outstanding, end of period | | | 650,000 | | | | 1,100,000 | |
| (a) | Prior to January 2, 2020, the ALPS REIT Dividend Dogs ETF was known as the Cohen & Steers Global Realty Majors ETF. |
See Notes to Financial Statements.
ALPS Sector Dividend Dogs ETF
| Financial Highlights | For a Share Outstanding Throughout the Periods Presented |
| | | For the Year Ended November 30, 2020 | | | For the Year Ended November 30, 2019 | | | For the Year Ended November 30, 2018 | | | For the Year Ended November 30, 2017 | | | For the Year Ended November 30, 2016 | |
| NET ASSET VALUE, BEGINNING OF PERIOD | | $ | 45.78 | | | $ | 44.26 | | | $ | 45.61 | | | $ | 42.29 | | | $ | 36.23 | |
| | | | | | | | | | | | | | | | | | | | | |
| INCOME/(LOSS) FROM INVESTMENT OPERATIONS: | | | | | | | | | | | | | | | | | | | | |
| Net investment income (a) | | | 1.70 | | | | 1.71 | | | | 1.54 | | | | 1.40 | | | | 1.26 | |
| Net realized and unrealized gain/(loss) | | | (2.14 | ) | | | 1.34 | | | | (1.31 | ) | | | 3.39 | | | | 6.15 | |
| Total from investment operations | | | (0.44 | ) | | | 3.05 | | | | 0.23 | | | | 4.79 | | | | 7.41 | |
| | | | | | | | | | | | | | | | | | | | | |
| DISTRIBUTIONS: | | | | | | | | | | | | | | | | | | | | |
| From net investment income | | | (1.65 | ) | | | (1.53 | ) | | | (1.58 | ) | | | (1.42 | ) | | | (1.34 | ) |
| Tax return of capital | | | – | | | | – | | | | – | | | | (0.05 | ) | | | (0.01 | ) |
| Total distributions | | | (1.65 | ) | | | (1.53 | ) | | | (1.58 | ) | | | (1.47 | ) | | | (1.35 | ) |
| | | | | | | | | | | | | | | | | | | | | |
| Net increase/(decrease) in net asset value | | | (2.09 | ) | | | 1.52 | | | | (1.35 | ) | | | 3.32 | | | | 6.06 | |
| NET ASSET VALUE, END OF PERIOD | | $ | 43.69 | | | $ | 45.78 | | | $ | 44.26 | | | $ | 45.61 | | | $ | 42.29 | |
| TOTAL RETURN(b) | | | (0.27 | )% | | | 7.26 | % | | | 0.51 | % | | | 11.59 | % | | | 20.86 | % |
| | | | | | | | | | | | | | | | | | | | | |
| RATIOS/SUPPLEMENTAL DATA: | | | | | | | | | | | | | | | | | | | | |
| Net assets, end of period (000s) | | $ | 1,007,514 | | | $ | 1,746,784 | | | $ | 2,166,709 | | | $ | 2,322,205 | | | $ | 1,702,405 | |
| | | | | | | | | | | | | | | | | | | | | |
| Ratio of expenses to average net assets | | | 0.40 | % | | | 0.40 | % | | | 0.40 | % | | | 0.40 | % | | | 0.40 | % |
| Ratio of net investment income to average net assets | | | 4.27 | % | | | 3.97 | % | | | 3.40 | % | | | 3.24 | % | | | 3.23 | % |
| Portfolio turnover rate(c) | | | 77 | % | | | 55 | % | | | 61 | % | | | 48 | % | | | 49 | % |
| Undistributed net investment income included in price of units issued and redeemed(a)(d) | | $ | 0.12 | | | $ | 0.06 | | | $ | 0.04 | | | $ | 0.03 | | | $ | 0.06 | |
| (a) | Based on average shares outstanding during the period. |
| (b) | Total return is calculated assuming an initial investment made at the net asset value at the beginning of the period and redemption at the net asset value on the last day of the period and assuming all distributions are reinvested at reinvestment prices. Total return calculated for a period of less than one year is not annualized. |
| (c) | Portfolio turnover for periods less than one year is not annualized and does not include securities received or delivered from processing creations or redemptions in-kind. |
| (d) | The per share amount of equalization is presented to show the impact of equalization on distributable earnings per share. |
See Notes to Financial Statements.
ALPS International Sector Dividend Dogs ETF
| Financial Highlights | For a Share Outstanding Throughout the Periods Presented |
| | | For the Year Ended November 30, 2020 | | | For the Year Ended November 30, 2019 | | | For the Year Ended November 30, 2018 | | | For the Year Ended November 30, 2017 | | | For the Year Ended November 30, 2016 | |
| NET ASSET VALUE, BEGINNING OF PERIOD | | $ | 26.88 | | | $ | 25.14 | | | $ | 28.27 | | | $ | 22.84 | | | $ | 24.25 | |
| | | | | | | | | | | | | | | | | | | | | |
| INCOME/(LOSS) FROM INVESTMENT OPERATIONS: | | | | | | | | | | | | | | | | | | | | |
| Net investment income(a) | | | 0.75 | | | | 1.20 | | | | 1.15 | | | | 0.94 | | | | 1.00 | |
| Net realized and unrealized gain/(loss) | | | (1.66 | ) | | | 1.69 | | | | (3.19 | ) | | | 5.41 | | | | (1.47 | ) |
| Total from investment operations | | | (0.91 | ) | | | 2.89 | | | | (2.04 | ) | | | 6.35 | | | | (0.47 | ) |
| | | | | | | | | | | | | | | | | | | | | |
| DISTRIBUTIONS: | | | | | | | | | | | | | | | | | | | | |
| From net investment income | | | (1.11 | ) | | | (1.15 | ) | | | (1.09 | ) | | | (0.92 | ) | | | (0.94 | ) |
| Tax return of capital | | | (0.04 | ) | | | – | | | | – | | | | – | | | | – | |
| Total distributions | | | (1.15 | ) | | | (1.15 | ) | | | (1.09 | ) | | | (0.92 | ) | | | (0.94 | ) |
| | | | | | | | | | | | | | | | | | | | | |
| Net increase/(decrease) in net asset value | | | (2.06 | ) | | | 1.74 | | | | (3.13 | ) | | | 5.43 | | | | (1.41 | ) |
| NET ASSET VALUE, END OF PERIOD | | $ | 24.82 | | | $ | 26.88 | | | $ | 25.14 | | | $ | 28.27 | | | $ | 22.84 | |
| TOTAL RETURN(b) | | | (3.08 | )% | | | 11.79 | % | | | (7.47 | )% | | | 28.21 | % | | | (1.95 | )% |
| | | | | | | | | | | | | | | | | | | | | |
| RATIOS/SUPPLEMENTAL DATA: | | | | | | | | | | | | | | | | | | | | |
| Net assets, end of period (000s) | | $ | 146,431 | | | $ | 221,741 | | | $ | 285,327 | | | $ | 349,184 | | | $ | 161,042 | |
| | | | | | | | | | | | | | | | | | | | | |
| Ratio of expenses to average net assets | | | 0.50 | % | | | 0.50 | % | | | 0.50 | % | | | 0.50 | % | | | 0.50 | % |
| Ratio of net investment income to average net assets | | | 3.22 | % | | | 4.65 | % | | | 4.16 | % | | | 3.55 | % | | | 4.28 | % |
| Portfolio turnover rate(c) | | | 79 | % | | | 58 | % | | | 72 | % | | | 37 | % | | | 47 | % |
| Undistributed net investment income included in price of units issued and redeemed(a)(d) | | $ | 0.00 | (e) | | $ | 0.04 | | | $ | 0.05 | | | $ | 0.12 | | | $ | 0.09 | |
| (a) | Based on average shares outstanding during the period. |
| (b) | Total return is calculated assuming an initial investment made at the net asset value at the beginning of the period and redemption at the net asset value on the last day of the period and assuming all distributions are reinvested at reinvestment prices. Total return calculated for a period of less than one year is not annualized. |
| (c) | Portfolio turnover for periods less than one year is not annualized and does not include securities received or delivered from processing creations or redemptions in-kind. |
| (d) | The per share amount of equalization is presented to show the impact of equalization on distributable earnings per share. |
See Notes to Financial Statements.
ALPS Emerging Sector Dividend Dogs ETF
| Financial Highlights | For a Share Outstanding Throughout the Periods Presented |
| | | For the Year Ended November 30, 2020 | | | For the Year Ended November 30, 2019 | | | For the Year Ended November 30, 2018 | | | For the Year Ended November 30, 2017 | | | For the Year Ended November 30, 2016 | |
| NET ASSET VALUE, BEGINNING OF PERIOD | | $ | 20.67 | | | $ | 21.33 | | | $ | 24.29 | | | $ | 21.17 | | | $ | 20.78 | |
| | | | | | | | | | | | | | | | | | | | | |
| INCOME/(LOSS) FROM INVESTMENT OPERATIONS: | | | | | | | | | | | | | | | | | | | | |
| Net investment income(a) | | | 0.56 | | | | 0.89 | | | | 0.91 | | | | 0.80 | | | | 0.67 | |
| Net realized and unrealized gain/(loss) | | | 0.42 | | | | (0.33 | ) | | | (3.02 | ) | | | 3.06 | | | | 0.39 | |
| Total from investment operations | | | 0.98 | | | | 0.56 | | | | (2.11 | ) | | | 3.86 | | | | 1.06 | |
| | | | | | | | | | | | | | | | | | | | | |
| DISTRIBUTIONS: | | | | | | | | | | | | | | | | | | | | |
| From net investment income | | | (0.69 | ) | | | (1.22 | ) | | | (0.85 | ) | | | (0.74 | ) | | | (0.67 | ) |
| Total distributions | | | (0.69 | ) | | | (1.22 | ) | | | (0.85 | ) | | | (0.74 | ) | | | (0.67 | ) |
| | | | | | | | | | | | | | | | | | | | | |
| Net increase/(decrease) in net asset value | | | 0.29 | | | | (0.66 | ) | | | (2.96 | ) | | | 3.12 | | | | 0.39 | |
| NET ASSET VALUE, END OF PERIOD | | $ | 20.96 | | | $ | 20.67 | | | $ | 21.33 | | | $ | 24.29 | | | $ | 21.17 | |
| TOTAL RETURN(b) | | | 5.20 | % | | | 2.67 | % | | | (8.76 | )% | | | 18.37 | % | | | 5.10 | % |
| | | | | | | | | | | | | | | | | | | | | |
| RATIOS/SUPPLEMENTAL DATA: | | | | | | | | | | | | | | | | | | | | |
| Net assets, end of period (000s) | | $ | 20,958 | | | $ | 28,941 | | | $ | 35,201 | | | $ | 47,356 | | | $ | 19,057 | |
| | | | | | | | | | | | | | | | | | | | | |
| Ratio of expenses to average net assets | | | 0.60 | % | | | 0.60 | % | | | 0.60 | % | | | 0.60 | % | | | 0.60 | % |
| Ratio of net investment income to average net assets | | | 2.92 | % | | | 4.16 | % | | | 3.88 | % | | | 3.33 | % | | | 3.11 | % |
| Portfolio turnover rate(c) | | | 93 | % | | | 83 | % | | | 85 | % | | | 42 | % | | | 68 | % |
| Undistributed net investment income included in price of units issued and redeemed(a)(d) | | $ | 0.02 | | | $ | 0.01 | | | $ | 0.10 | | | $ | 0.05 | | | $ | 0.36 | |
| (a) | Based on average shares outstanding during the period. |
| (b) | Total return is calculated assuming an initial investment made at the net asset value at the beginning of the period and redemption at the net asset value on the last day of the period and assuming all distributions are reinvested at reinvestment prices. Total return calculated for a period of less than one year is not annualized. |
| (c) | Portfolio turnover for periods less than one year is not annualized and does not include securities received or delivered from processing creations or redemptions in-kind. |
| (d) | The per share amount of equalization is presented to show the impact of equalization on distributable earnings per share. |
See Notes to Financial Statements.
ALPS REIT Dividend Dogs ETF
| Financial Highlights | For a Share Outstanding Throughout the Periods Presented |
| | | For the Year Ended November 30, 2020 (a) | | | For the Year Ended November 30, 2019 | | | For the Year Ended November 30, 2018 | | | For the Year Ended November 30, 2017 | | | For the Year Ended November 30, 2016 | |
| NET ASSET VALUE, BEGINNING OF PERIOD | | $ | 48.42 | | | $ | 44.18 | | | $ | 45.37 | | | $ | 41.31 | | | $ | 42.25 | |
| | | | | | | | | | | | | | | | | | | | | |
| INCOME/(LOSS) FROM INVESTMENT OPERATIONS: | | | | | | | | | | | | | | | | | | | | |
| Net investment income (b) | | | 1.29 | | | | 1.19 | | | | 1.17 | | | | 0.75 | | | | 1.24 | |
| Net realized and unrealized gain/(loss) | | | (7.26 | ) | | | 4.45 | | | | (0.53 | ) | | | 4.45 | | | | (0.90 | ) |
| Total from investment operations | | | (5.97 | ) | | | 5.64 | | | | 0.64 | | | | 5.20 | | | | 0.34 | |
| | | | | | | | | | | | | | | | | | | | | |
| DISTRIBUTIONS: | | | | | | | | | | | | | | | | | | | | |
| From net investment income | | | (1.57 | ) | | | (1.40 | ) | | | (1.83 | ) | | | (1.14 | ) | | | (1.28 | ) |
| Tax return of capital | | | (0.39 | ) | | | – | | | | – | | | | – | | | | – | |
| Total distributions | | | (1.96 | ) | | | (1.40 | ) | | | (1.83 | ) | | | (1.14 | ) | | | (1.28 | ) |
| | | | | | | | | | | | | | | | | | | | | |
| Net increase/(decrease) in net asset value | | | (7.93 | ) | | | 4.24 | | | | (1.19 | ) | | | 4.06 | | | | (0.94 | ) |
| NET ASSET VALUE, END OF PERIOD | | $ | 40.49 | | | $ | 48.42 | | | $ | 44.18 | | | $ | 45.37 | | | $ | 41.31 | |
| TOTAL RETURN(c) | | | (11.77 | )% | | | 13.00 | % | | | 1.47 | % | | | 12.77 | % | | | 0.61 | % |
| | | | | | | | | | | | | | | | | | | | | |
| RATIOS/SUPPLEMENTAL DATA: | | | | | | | | | | | | | | | | | | | | |
| Net assets, end of period (000s) | | $ | 26,320 | | | $ | 53,265 | | | $ | 55,222 | | | $ | 68,050 | | | $ | 80,550 | |
| | | | | | | | | | | | | | | | | | | | | |
| Ratio of expenses to average net assets | | | 0.38 | %(d) | | | 0.55 | % | | | 0.55 | % | | | 0.55 | % | | | 0.55 | % |
| Ratio of net investment income to average net assets | | | 3.26 | % | | | 2.56 | % | | | 2.67 | % | | | 1.71 | % | | | 2.86 | % |
| Portfolio turnover rate(e) | | | 148 | % | | | 10 | % | | | 14 | % | | | 10 | % | | | 8 | % |
| (a) | Prior to January 2, 2020, the ALPS REIT Dividend Dogs ETF was known as the Cohen & Steers Global Realty Majors ETF. |
| (b) | Based on average shares outstanding during the period. |
| (c) | Total return is calculated assuming an initial investment made at the net asset value at the beginning of the period and redemption at the net asset value on the last day of the period and assuming all distributions are reinvested at reinvestment prices. Total return calculated for a period of less than one year is not annualized. |
| (d) | Effective January 2, 2020 the Fund's Advisory Fee changed from 0.55% to 0.35%. |
| (e) | Portfolio turnover for periods less than one year is not annualized and does not include securities received or delivered from processing creations or redemptions in-kind. |
See Notes to Financial Statements.
ALPS ETF Trust
| Notes to Financial Statements | November 30, 2020 |
1. ORGANIZATION
ALPS ETF Trust (the “Trust”), a Delaware statutory trust, is an open-end management investment company registered under the Investment Company Act of 1940, as amended (the “1940 Act”). As of November 30, 2020, the Trust consisted of sixteen separate portfolios. Each portfolio represents a separate series of the Trust. This report pertains to the ALPS Sector Dividend Dogs ETF, the ALPS International Sector Dividend Dogs ETF, the ALPS Emerging Sector Dividend Dogs ETF, and the ALPS REIT Dividend Dogs ETF (formerly known as the Cohen & Steers Global Realty Majors ETF) (each a “Fund” and collectively, the “Funds”). Each Fund has elected to qualify as a diversified series of the Trust under the 1940 Act.
The investment objective of the ALPS Sector Dividend Dogs ETF is to seek investment results that replicate as closely as possible, before fees and expenses, the performance of the S-Network® Sector Dividend Dogs Index. The investment objective of the ALPS International Sector Dividend Dogs ETF is to seek investment results that replicate as closely as possible, before fees and expenses, the performance of the S-Network® International Sector Dividend Dogs Index. The investment objective of the ALPS Emerging Sector Dividend Dogs ETF is to seek investment results that replicate as closely as possible, before fees and expenses, the performance of the S-Network® Emerging Sector Dividend Dogs Index. The investment objective of the ALPS REIT Dividend Dogs ETF is to seek investment results that replicate as closely as possible, before fees and expenses, the performance of the S-Network® REIT Dividend Dogs Index.
The shares of the ALPS Sector Dividend Dogs ETF, the ALPS International Sector Dividend Dogs ETF, the ALPS Emerging Sector Dividend Dogs ETF, and the ALPS REIT Dividend Dogs ETF (“Shares”) are listed on the NYSE Arca, Inc. (the “NYSE Arca”). Each Fund issues and redeems Shares, at net asset value (“NAV”) in blocks of 50,000 Shares, each of which is called a “Creation Unit”. Creation Units are issued and redeemed principally in-kind for securities included in the Underlying Index. Except when aggregated in Creation Units, Shares are not redeemable securities of the Fund.
Pursuant to the Trust’s organizational documents, its Officers and Trustees are indemnified against certain liability arising out of the performance of their duties to the Trust. Additionally, in the normal course of business, the Trust enters into contracts with service providers that contain general indemnification clauses. The Trust’s maximum exposure under these arrangements is unknown, as this would involve future claims that may be made against the Trust that have not yet occurred.
2. SIGNIFICANT ACCOUNTING POLICIES
The following is a summary of significant accounting policies consistently followed by the Funds in the preparation of the financial statements. The accompanying financial statements were prepared in accordance with accounting principles generally accepted in the United States of America (“U.S. GAAP”). The preparation of financial statements in conformity with U.S. GAAP requires management to make certain estimates and assumptions that affect the reported amounts of assets and liabilities and disclosures of contingent assets and liabilities at the date of the financial statements and the reported amounts of revenue and expenses during the period. Actual results could differ from those estimates. Each Fund is considered an investment company under U.S. GAAP and follows the accounting and reporting guidance applicable to investment companies in the Financial Accounting Standards Board (“FASB”) Accounting Standards Codification Topic 946.
A. Portfolio Valuation
Each Fund’s NAV is determined daily, as of the close of regular trading on the New York Stock Exchange (“NYSE”), normally 4:00 p.m. Eastern time, on each day the NYSE is open for trading. The NAV is computed by dividing the value of all assets of the Fund (including accrued interest and dividends), less all liabilities (including accrued expenses and dividends declared but unpaid), by the total number of shares outstanding.
Portfolio securities listed on any exchange other than the NASDAQ Stock Market LLC (“NASDAQ”) are valued at the last sale price on the business day as of which such value is being determined. If there has been no sale on such day, the securities are valued at the mean of the most recent bid and ask prices on such day. Securities traded on the NASDAQ are valued at the NASDAQ Official Closing Price as determined by NASDAQ. Portfolio securities traded on more than one securities exchange are valued at the last sale price on the business day as of which such value is being determined at the close of the exchange representing the principal market for such securities. Portfolio securities traded in the over-the-counter market, but excluding securities traded on the NASDAQ, are valued at the latest quoted sale price in such market.
The Funds’ investments are valued at market value or, in the absence of market value with respect to any portfolio securities, at fair value according to procedures adopted by the Trust’s Board of Trustees (the “Board”). When market quotations are not readily available or when events occur that make established valuation methods unreliable, securities of the Funds may be valued in good faith by or under the direction of the Board. These securities generally include, but are not limited to, restricted securities (securities which may not be publicly sold without registration under the Securities Act of 1933) for which a pricing service is unable to provide a market price; securities whose trading has been formally suspended; a security whose market price is not available from a pre-established primary pricing source or the pricing source is not willing to provide a price; a security with respect to which an event has occurred that is most likely to materially affect the value of the security after the market has closed but before the calculation of the Fund’s NAV or make it difficult or impossible to obtain a reliable market quotation; or a security whose price, as provided by the pricing service, does not reflect the security’s “fair value” due to the security being de-listed from a national exchange or the security’s primary trading market is temporarily closed at a time when, under normal conditions, it would be open. As a general principle, the current “fair value” of a security would be the amount which the owner might reasonably expect to receive from the sale on the applicable exchange or principal market. A variety of factors may be considered in determining the fair value of such securities.
ALPS ETF Trust
| Notes to Financial Statements | November 30, 2020 |
B. Fair Value Measurements
Each Fund discloses the classification of its fair value measurements following a three-tier hierarchy based on the inputs used to measure fair value. Inputs refer broadly to the assumptions that market participants would use in pricing the asset or liability, including assumptions about risk. Inputs may be observable or unobservable. Observable inputs reflect the assumptions market participants would use in pricing the asset or liability that are developed based on market data obtained from sources independent of the reporting entity. Unobservable inputs reflect the reporting entity’s own assumptions about the assumptions market participants would use in pricing the asset or liability that are developed based on the best information available.
Valuation techniques used to value the Funds’ investments by major category are as follows:
Equity securities, including restricted securities, for which market quotations are readily available, are valued at the last reported sale price or official closing price as reported by a third party pricing vendor on the primary market or exchange on which they are traded and are categorized as Level 1 in the hierarchy. In the event there were no sales during the day or closing prices are not available, securities are valued at the mean of the most recent quoted bid and ask prices on such day and are generally categorized as Level 2 in the hierarchy. Investments in open-end mutual funds are valued at their closing NAV each business day and are categorized as Level 1 in the hierarchy.
Changes in valuation techniques may result in transfers in or out of an assigned level within the disclosure hierarchy.
Various inputs are used in determining the value of each Fund’s investments as of the end of the reporting period. When inputs used fall into different levels of the fair value hierarchy, the level in the hierarchy within which the fair value measurement falls is determined based on the lowest level input that is significant to the fair value measurement in its entirety. The designated input levels are not necessarily an indication of the risk or liquidity associated with these investments.
These inputs are categorized in the following hierarchy under applicable financial accounting standards:
| Level 1 – | Unadjusted quoted prices in active markets for identical investments, unrestricted assets or liabilities that a Fund has the ability to access at the measurement date; |
| Level 2 – | Quoted prices which are not active, quoted prices for similar assets or liabilities in active markets or inputs other than quoted prices that are observable (either directly or indirectly) for substantially the full term of the asset or liability; and |
| Level 3 – | Significant unobservable prices or inputs (including the Fund’s own assumptions in determining the fair value of investments) where there is little or no market activity for the asset or liability at the measurement date. |
The following is a summary of the inputs used to value the Funds’ investments as of November 30, 2020:
ALPS Sector Dividend Dogs ETF
| Investments in Securities at Value | | Level 1 - Quoted and Unadjusted Prices | | | Level 2 - Other Significant Observable Inputs | | | Level 3 - Significant Unobservable Inputs | | | Total | |
| Common Stocks* | | $ | 1,000,897,532 | | | $ | – | | | $ | – | | | $ | 1,000,897,532 | |
| Short Term Investments | | | 2,192,467 | | | | – | | | | – | | | | 2,192,467 | |
| Total | | $ | 1,003,089,999 | | | $ | – | | | $ | – | | | $ | 1,003,089,999 | |
ALPS International Sector Dividend Dogs ETF
| Investments in Securities at Value | | Level 1 - Quoted and Unadjusted Prices | | | Level 2 - Other Significant Observable Inputs | | | Level 3 - Significant Unobservable Inputs | | | Total | |
| Common Stocks* | | $ | 145,196,833 | | | $ | – | | | $ | – | | | $ | 145,196,833 | |
| Short Term Investments | | | 322,732 | | | | – | | | | – | | | | 322,732 | |
| Total | | $ | 145,519,565 | | | $ | – | | | $ | – | | | $ | 145,519,565 | |
ALPS ETF Trust
| Notes to Financial Statements | November 30, 2020 |
ALPS Emerging Sector Dividend Dogs ETF
| Investments in Securities at Value | | Level 1 - Quoted and Unadjusted Prices | | | Level 2 - Other Significant Observable Inputs | | | Level 3 - Significant Unobservable Inputs | | | Total | |
| Common Stocks* | | $ | 20,887,414 | | | $ | – | | | $ | – | | | $ | 20,887,414 | |
| Short Term Investments | | | 56,958 | | | | – | | | | – | | | | 56,958 | |
| Total | | $ | 20,944,372 | | | $ | – | | | $ | – | | | $ | 20,944,372 | |
ALPS REIT Dividend Dogs ETF
| Investments in Securities at Value | | Level 1 - Quoted and Unadjusted Prices | | | Level 2 - Other Significant Observable Inputs | | | Level 3 - Significant Unobservable Inputs | | | Total | |
| Common Stocks* | | $ | 26,194,521 | | | $ | – | | | $ | – | | | $ | 26,194,521 | |
| Short Term Investments | | | 807,531 | | | | – | | | | – | | | | 807,531 | |
| Total | | $ | 27,002,052 | | | $ | – | | | $ | – | | | $ | 27,002,052 | |
| * | For a detailed sector/country breakdown, see the accompanying Schedule of Investments. |
The Funds did not have any securities that used significant unobservable inputs (Level 3) in determining fair value and there were no transfers into or out of Level 3 during the year ended November 30, 2020.
C. Foreign Securities
The ALPS International Sector Dividend Dogs ETF, the ALPS Emerging Sector Dividend Dogs ETF, and the ALPS REIT Dividend Dogs ETF may directly purchase securities of foreign issuers. Investments in non-U.S. issuers may involve unique risks compared to investing in securities of U.S. issuers, including, among others, less liquidity generally, greater market volatility than U.S. securities and less complete financial information than for U.S. issuers. In addition, adverse political, economic or social developments could undermine the value of the Fund’s investments or prevent the Fund from realizing the full value of its investments. Financial reporting standards for companies based in foreign markets differ from those in the United States. Finally, the value of the currency of the country in which the Fund has invested could decline relative to the value of the U.S. dollar, which may affect the value of the investment to U.S. investors.
Because foreign markets may be open on different days than the days during which investors may purchase the shares of each Fund, the value of each Fund's securities may change on the days when investors are not able to purchase the shares of the Funds. The value of securities denominated in foreign currencies is converted into U.S. dollars using exchange rates determined daily as of the close of regular trading on the NYSE or NASDAQ. Any use of a different rate from the rates used by the Index may adversely affect a Fund's ability to track its Index.
D. Foreign Currency Translation
The books and records of the Funds are maintained in U.S. dollars. Investment valuations and other assets and liabilities initially expressed in foreign currencies are converted each business day into U.S. dollars based upon current exchange rates. The portion of realized and unrealized gains or losses on investments due to fluctuations in foreign currency exchange rates is not separately disclosed and is included in realized and unrealized gains or losses on investments, when applicable.
E. Securities Transactions and Investment Income
Securities transactions are recorded as of the trade date. Realized gains and losses from securities transactions are recorded on the highest cost basis. Dividend income and capital gains distributions, if any, are recorded on the ex-dividend date, net of any foreign taxes withheld. Interest income, if any, is recorded on the accrual basis, including any amortization of premiums and accretion of discounts.
F. Dividends and Distributions to Shareholders
Dividends from net investment income for each Fund, if any, are declared and paid quarterly or as the Board may determine from time to time. Distributions of net realized capital gains earned by the Funds, if any, are distributed at least annually.
G. Equalization
The ALPS Sector Dividend Dogs ETF, the ALPS International Sector Dividend Dogs ETF, and the ALPS Emerging Sector Dividend Dogs ETF utilize the accounting practice known as “Equalization” by which a portion of the proceeds from sales and costs of reacquiring the Funds’ shares, equivalent on a per share basis to the amount of distributable net investment income on the date of the transaction, is credited or charged to undistributed net investment income. As a result, undistributed net investment income per share is unaffected by sales or reacquisitions of the Funds’ shares. Amounts related to Equalization can be found on the Statement of Changes in Net Assets.
ALPS ETF Trust
| Notes to Financial Statements | November 30, 2020 |
H. Real Estate Investment Trusts (“REITs”)
As part of its investments in real estate related securities, the ALPS REIT Dividend Dogs ETF (“RDOG”) will invest in REITs and is subject to certain risks associated with direct investment in REITs. REITs possess certain risks which differ from an investment in common stocks. REITs are financial vehicles that pool investors’ capital to acquire, develop and/or finance real estate and provide services to their tenants. REITs may concentrate their investments in specific geographic areas or in specific property types, e.g., regional malls, shopping centers, office buildings, apartment buildings and industrial warehouses. REITs may be affected by changes in the value of their underlying properties and by defaults by borrowers or tenants. REITs depend generally on their ability to generate cash flow to make distributions to shareowners, and certain REITs have self-liquidation provisions by which mortgages held may be paid in full and distributions of capital returns may be made at any time.
As REITs generally pay a higher rate of dividends than most other operating companies, to the extent application of RDOG’s investment strategy results in RDOG investing in REIT shares, the percentage of RDOG’s dividend income received from REIT shares will likely exceed the percentage of RDOG’s portfolio that is comprised of REIT shares. Distributions received by RDOG from REITs may consist of dividends, capital gains and/or return of capital.
Dividend income from REITs is recognized on the ex-dividend date. The calendar year-end amounts of ordinary income, capital gains, and return of capital included in distributions received from RDOG’s investments in REITs are reported to RDOG after the end of the calendar year; accordingly, RDOG estimates these amounts for accounting purposes until the characterization of REIT distributions is reported to RDOG after the end of the calendar year. Estimates are based on the most recent REIT distribution information available.
The performance of a REIT may be affected by its failure to qualify for tax-free pass-through of income under the Internal Revenue Code of 1986, as amended (the “Code”), or its failure to maintain exemption from registration under the 1940 Act. Due to RDOG’s investments in REITs, RDOG may also make distributions in excess of RDOG’s earnings and capital gains. Distributions, if any, in excess of RDOG’s earnings and profits will first reduce the adjusted tax basis of a holder’s shares and, after that basis has been reduced to zero, will constitute capital gains to the shareholder.
I. Federal Tax and Tax Basis Information
The timing and character of income and capital gain distributions are determined in accordance with income tax regulations, which may differ from U.S. GAAP. Reclassifications are made to the Funds’ capital accounts for permanent tax differences to reflect income and gains available for distribution (or available capital loss carryforwards) under income tax regulations.
For the year ended November 30, 2020, the following reclassifications, which had no impact on results of operations or net assets, were recorded to reflect permanent tax differences resulting primarily from in-kind transactions:
| Fund | | Paid-in Capital | | | Total Distributable Earnings | |
| ALPS Sector Dividend Dogs ETF | | $ | 23,539,190 | | | $ | (23,539,190 | ) |
| ALPS International Sector Dividend Dogs ETF | | | (3,415,821 | ) | | | 3,415,821 | |
| ALPS Emerging Sector Dividend Dogs ETF | | | (524,073 | ) | | | 524,073 | |
| ALPS REIT Dividend Dogs ETF | | | 6,056,051 | | | | (6,056,051 | ) |
The tax character of the distributions paid during the fiscal years ended November 30, 2020 and November 30, 2019 was as follows:
| Fund | | Ordinary Income | | | Return of Capital | |
| November 30, 2020 | | | | | | | | |
| ALPS Sector Dividend Dogs ETF | | $ | 51,189,402 | | | $ | – | |
| ALPS International Sector Dividend Dogs ETF | | | 8,323,715 | | | | 309,701 | |
| ALPS Emerging Sector Dividend Dogs ETF | | | 831,362 | | | | – | |
| ALPS REIT Dividend Dogs ETF | | | 1,494,087 | | | | 336,997 | |
| Fund | | Ordinary Income | | | Return of Capital | |
| November 30, 2019 | | | | | | | | |
| ALPS Sector Dividend Dogs ETF | | $ | 66,976,075 | | | $ | – | |
| ALPS International Sector Dividend Dogs ETF | | | 11,551,790 | | | | – | |
| ALPS Emerging Sector Dividend Dogs ETF | | | 1,883,340 | | | | – | |
| ALPS REIT Dividend Dogs ETF | | | 1,634,862 | | | | – | |
The character of distributions made during the year may differ from its ultimate characterization for federal income tax purposes.
ALPS ETF Trust
| Notes to Financial Statements | November 30, 2020 |
Under current law, capital losses maintain their character as short-term or long-term and are carried forward to the next tax year without expiration. As of November 30, 2020, the following amounts are available as carry forwards to the next tax year:
| Fund | | Short-Term | | | Long-Term | |
| ALPS Sector Dividend Dogs ETF | | $ | 5,873,875 | | | $ | 282,971,785 | |
| ALPS International Sector Dividend Dogs ETF | | | 4,077,689 | | | | 43,546,573 | |
| ALPS Emerging Sector Dividend Dogs ETF | | | 1,235,204 | | | | 7,894,953 | |
| ALPS REIT Dividend Dogs ETF | | | 3,736,361 | | | | 3,152,502 | |
As of November 30, 2020, the components of distributable earnings on a tax basis for each Fund were as follows:
| | | Undistributed net investment income | | | Accumulated net realized loss on investments | | | Net unrealized appreciation/ (depreciation) on investments | | | Total | |
| ALPS Sector Dividend Dogs ETF | | $ | 5,836,361 | | | $ | (288,845,660 | ) | | $ | (59,411,680 | ) | | $ | (342,420,979 | ) |
| ALPS International Sector Dividend Dogs ETF | | | – | | | | (47,624,262 | ) | | | (18,631,411 | ) | | | (66,255,673 | ) |
| ALPS Emerging Sector Dividend Dogs ETF | | | 17,560 | | | | (9,130,157 | ) | | | (1,560,547 | ) | | | (10,673,144 | ) |
| ALPS REIT Dividend Dogs ETF | | | – | | | | (6,888,863 | ) | | | (4,779,358 | ) | | | (11,668,221 | ) |
As of November 30, 2020, the cost of investments for federal income tax purposes and accumulated net unrealized appreciation/(depreciation) on investments were as follows:
| | | Gross Appreciation (excess of value over tax cost) | | | Gross Depreciation (excess of tax cost over value) | | | Net Appreciation/ (Depreciation) of Foreign Currency | | | Net Unrealized Appreciation/ (Depreciation) | | | Cost of Investments for Income Tax Purposes | |
| ALPS Sector Dividend Dogs ETF | | $ | 93,033,888 | | | $ | (152,445,568 | ) | | $ | – | | | $ | (59,411,680 | ) | | $ | 1,062,501,679 | |
| ALPS International Sector Dividend Dogs ETF | | | 11,068,294 | | | | (29,722,242 | ) | | | 22,537 | | | | (18,631,411 | ) | | | 164,173,513 | |
| ALPS Emerging Sector Dividend Dogs ETF | | | 1,750,397 | | | | (3,311,194 | ) | | | 250 | | | | (1,560,547 | ) | | | 22,505,169 | |
| ALPS REIT Dividend Dogs ETF | | | 2,330,856 | | | | (7,110,714 | ) | | | 500 | | | | (4,779,358 | ) | | | 31,781,910 | |
The differences between book-basis and tax-basis are primarily due to the deferral of losses from wash sales and investments in passive foreign investment companies.
J. Income Taxes
No provision for income taxes is included in the accompanying financial statements, as each Fund intends to distribute to shareholders all taxable investment income and realized gains and otherwise comply with Subchapter M of the Code, applicable to regulated investment companies. Each Fund evaluates tax positions taken (or expected to be taken) in the course of preparing the Fund’s tax returns to determine whether these positions meet a “more-likely-than-not” standard that, based on the technical merits, have a more than fifty percent likelihood of being sustained by a taxing authority upon examination. A tax position that meets the “more-likely-than-not” recognition threshold is measured to determine the amount of benefit to recognize in the financial statements.
As of and during the year ended November 30, 2020, each Fund did not have a liability for any unrecognized tax benefits. Each Fund files U.S. federal, state, and local tax returns as required. Each Fund’s tax returns are subject to examination by the relevant tax authorities until expiration of the applicable statute of limitations, which is generally three years after the filing of the tax return, but may extend to four years in certain jurisdictions. Each Fund’s tax returns for open years have incorporated no uncertain tax positions that require a provision for income taxes.
ALPS ETF Trust
| Notes to Financial Statements | November 30, 2020 |
K. Lending of Portfolio Securities
The Funds have entered into a securities lending agreement with State Street Bank & Trust Co. (“SSB”), the Funds’ lending agent. Each Fund may lend its portfolio securities only to borrowers that are approved by SSB. Each Fund will limit such lending to not more than 33 1/3% of the value of its total assets. The Fund’s securities held at SSB as custodian shall be available to be lent except those securities the Fund or ALPS Advisors, Inc. specifically identifies in writing as not being available for lending. The borrower pledges and maintains with the Fund collateral consisting of cash (U.S. Dollars only), securities issued or guaranteed by the U.S. government or its agencies or instrumentalities, and cash equivalents (including irrevocable bank letters of credit) issued by a person other than the borrower or an affiliate of the borrower. The initial collateral received by the Fund is required to have a value of no less than 102% of the market value of the loaned securities for U.S equity securities and a value of no less than 105% of the market value for non-U.S. equity securities. The collateral is maintained thereafter, at a market value equal to not less than 102% of the current value of the U.S. equity securities on loan and not less than 105% of the current value of the non-U.S. equity securities on loan. The market value of the loaned securities is determined at the close of each business day and any additional required collateral is delivered to the Fund on the next business day. During the term of the loan, each Fund is entitled to all distributions made on or in respect of the loaned securities. Loans of securities are terminable at any time and the borrower, after notice, is required to return borrowed securities within the customary time period for settlement of securities transactions.
Any cash collateral received is reinvested in a money market fund managed by SSB as disclosed in the Fund’s Schedule of Investments and is reflected in the Statements of Assets and Liabilities as a payable for collateral upon return of securities loaned. Non-cash collateral, in the form of securities issued or guaranteed by the U.S. government or its agencies or instrumentalities, is not disclosed in the Fund’s Statement of Assets and Liabilities as it is held by the lending agent on behalf of the Fund, and the Fund does not have the ability to re-hypothecate these securities. Income earned by the Fund from securities lending activity is disclosed in the Statement of Operations.
The following is a summary of the Fund's securities lending agreement and related cash and non-cash collateral received as of November 30, 2020:
| | | Market Value of Securities on Loan | | | Cash Collateral Received | | | Non-Cash Collateral Received | | | Total Collateral Received | |
| ALPS International Sector Dividend Dogs ETF | | $ | 2,133,672 | | | $ | – | | | $ | 2,253,654 | | | $ | 2,253,654 | |
| ALPS REIT Dividend Dogs ETF | | $ | 665,507 | | | $ | 721,846 | | | $ | – | | | $ | 721,846 | |
The risks of securities lending include the risk that the borrower may not provide additional collateral when required or may not return the securities when due. To mitigate these risks, the Funds benefit from a borrower default indemnity provided by SSB. SSB’s indemnity allows for full replacement of securities lent wherein SSB will purchase the unreturned loaned securities on the open market by applying the proceeds of the collateral, or to the extent such proceeds are insufficient or the collateral is unavailable, SSB will purchase the unreturned loan securities at SSB’s expense. However, the Funds could suffer a loss if the value of the investments purchased with cash collateral falls below the value of the cash collateral received.
The following table reflects a breakdown of transactions accounted for as secured borrowings, the gross obligation by the type of collateral pledged or securities loaned, and the remaining contractual maturity of those transactions as of November 30, 2020:
| ALPS REIT Dividend Dogs ETF | Remaining contractual maturity of the agreements |
| Securities Lending Transactions | | Overnight & Continuous | | | Up to 30 days | | | 30-90 days | | | Greater than 90 days | | | Total | |
| Common Stocks | | $ | 721,846 | | | $ | – | | | $ | – | | | $ | – | | | $ | 721,846 | |
| Total Borrowings | | | | | | | | | | | | | | | | | | | 721,846 | |
| Gross amount of recognized liabilities for securities lending (collateral received) | | | | | | | | | | | | $ | 721,846 | |
ALPS ETF Trust
| Notes to Financial Statements | November 30, 2020 |
3. INVESTMENT ADVISORY FEE AND OTHER AFFILIATED TRANSACTIONS
ALPS Advisors, Inc. (the “Adviser”) serves as the Funds’ investment adviser pursuant to an Investment Advisory Agreement with the Trust on behalf of each Fund (the “Advisory Agreement”). Pursuant to the Advisory Agreement, each Fund pays the Adviser an annual management fee for the services and facilities it provides, payable on a monthly basis as a percentage of the relevant Fund’s average daily net assets as set out below. From time to time, the Adviser may waive all or a portion of its fee.
| Fund | Advisory Fee |
| ALPS Sector Dividend Dogs ETF | 0.40% |
| ALPS International Sector Dividend Dogs ETF | 0.50% |
| ALPS Emerging Sector Dividend Dogs ETF | 0.60% |
| ALPS REIT Dividend Dogs ETF | 0.35%(a) |
| (a) | Prior to January 2, 2020, the Fund's Advisory Fee was 0.55%. |
Out of the unitary management fee, the Adviser pays substantially all expenses of each Fund, including licensing fees to the Underlying Index provider, the cost of transfer agency, custody, fund administration, legal, audit, independent trustees and other services, except for interest expenses, distribution fees or expenses, brokerage expenses, taxes and extraordinary expenses not incurred in the ordinary course of each Fund's business. The Adviser’s unitary management fee is designed to pay substantially all of each Fund's expenses and to compensate the Adviser for providing services for each Fund.
ALPS Fund Services, Inc., an affiliate of the Adviser, is the administrator of the Funds.
Effective July 1, 2020, each Trustee receives (1) a quarterly retainer of $10,000, (2) a per meeting fee of $5,000, (3) $1,500 for any special meeting held outside of a regularly scheduled board meeting, and (4) reimbursement for all reasonable out-of-pocket expenses relating to attendance at meetings. Prior to July 1, 2020, each Trustee who is not considered an "interested person" (as defined in the 1940 Act), received (1) a quarterly retainer of $5,000, (2) a per meeting fee of $3,750, (3) $1,500 for any special meeting held outside of a regularly scheduled board meeting, and(4) reimbursement for all reasonable out-of-pocket expenses relating to attendance at meetings. Prior to January 1, 2020, a Trustee who is considered an “interested person” (as defined in the 1940 Act) (“Interested Trustee”) received no compensation or expense reimbursements from the Trust. From January 1, 2020 to June 30, 2020, the Interested Trustee received (1) a quarterly retainer of $5,000, (2) a per meeting fee of $3,750, (3) $1,500 for any special meeting held outside of a regularly scheduled board meeting, and (4) reimbursement for all reasonable out-of-pocket expenses relating to attendance at meetings. In addition, the Chairman of the Board and Chairman of the Audit Committee each receives a quarterly retainer of $2,000, in connection with their respective roles.
4. PURCHASES AND SALES OF SECURITIES
For the year ended November 30, 2020, the cost of purchases and proceeds from sales of investment securities, excluding short-term investments and in-kind transactions, were as follows:
| Fund | | Purchases | | | Sales | |
| ALPS Sector Dividend Dogs ETF | | $ | 916,292,072 | | | $ | 906,597,938 | |
| ALPS International Sector Dividend Dogs ETF | | | 130,012,708 | | | | 132,478,346 | |
| ALPS Emerging Sector Dividend Dogs ETF | | | 20,926,296 | | | | 22,313,974 | |
| ALPS REIT Dividend Dogs ETF | | | 53,896,922 | | | | 50,390,388 | |
For the year ended November 30, 2020, the cost of in-kind purchases and proceeds from in-kind sales were as follows:
| Fund | | Purchases | | | Sales | |
| ALPS Sector Dividend Dogs ETF | | $ | 152,896,567 | | | $ | 707,045,208 | |
| ALPS International Sector Dividend Dogs ETF | | | 15,240,105 | | | | 64,786,351 | |
| ALPS Emerging Sector Dividend Dogs ETF | | | 2,577,580 | | | | 7,626,596 | |
| ALPS REIT Dividend Dogs ETF | | | 16,123,209 | | | | 36,612,984 | |
ALPS ETF Trust
| Notes to Financial Statements | November 30, 2020 |
For the year ended November 30, 2020, the in-kind net realized gains/(losses) were as follows:
| Fund | | Net Realized Gain/(Loss) | |
| ALPS Sector Dividend Dogs ETF | | $ | 33,620,449 | |
| ALPS International Sector Dividend Dogs ETF | | | (1,671,771 | ) |
| ALPS Emerging Sector Dividend Dogs ETF | | | (435,228 | ) |
| ALPS REIT Dividend Dogs ETF | | | 7,384,815 | |
Gains on in-kind transactions are not considered taxable for federal income tax purposes and losses on in-kind transactions are also not deductible for tax purposes.
5. CAPITAL SHARE TRANSACTIONS
Shares are created and redeemed by each Fund only in Creation Unit size aggregations of 50,000 shares. Only broker-dealers or large institutional investors with creation and redemption agreements called Authorized Participants (“AP”) are permitted to purchase or redeem Creation Units from the Funds. Such transactions are generally permitted on an in-kind basis, with a balancing cash component to equate the transaction to the NAV per unit of each Fund on the transaction date. Cash may be substituted equivalent to the value of certain securities generally when they are not available in sufficient quantity for delivery, not eligible for trading by the AP or as a result of other market circumstances.
6. RELATED PARTY TRANSACTIONS
The ALPS Sector Dividend Dogs ETF engaged in cross trades between other funds in the Trust during the year ended November 30, 2020 pursuant to Rule 17a-7 under the 1940 Act. Cross trading is the buying or selling of portfolio securities between funds to which the Adviser serves as the investment adviser. The Board previously adopted procedures that apply to transactions between the Funds of the Trust pursuant to Rule 17a-7. These transactions related to cross trades during the period complied with the requirements set forth by Rule 17a-7 and the Trust’s procedures.
Transactions related to cross trades during the year ended November 30, 2020, were as follows:
| Fund | | Purchase cost paid | | | Sale proceeds received | | | Realized gain/(loss) on sales | |
| ALPS Sector Dividend Dogs ETF | | $ | 388,272 | | | $ | 960,618 | | | ($ | 527,947 | ) |
7. MARKET DISRUPTIONS RISK
The Funds are subject to investment and operational risks associated with financial, economic and other global market developments and disruptions, including the recent spread of an infectious respiratory illness caused by a novel strain of coronavirus (known as COVID-19), which can negatively impact the securities markets and cause each Fund to lose value.
The spread of COVID-19 has caused volatility, severe market dislocations and liquidity constraints in many markets, including markets for the securities each Fund holds, and may adversely affect each Fund’s investments and operations. The transmission of COVID-19 and efforts to contain its spread have resulted in travel restrictions and disruptions, closed international borders, enhanced health screenings at ports of entry and elsewhere, disruption of and delays in healthcare service preparation and delivery, quarantines, event and service cancellations or interruptions, disruptions to business operations and supply chains, and a reduction in consumer and business spending, as well as general concern and uncertainty that has negatively affected the economy. These disruptions have led to instability in the market place and the jobs market. The impact of COVID-19 could adversely affect the economies of many nations or the entire global economy, the financial well-being and performance of individual issuers, borrowers and sectors and the health of the markets generally in potentially significant and unforeseen ways.
The foregoing could lead to a significant economic downturn or recession, increased market volatility, a greater number of market closures, higher default rates and adverse effects on the values and liquidity of each Fund’s securities or other assets. Such impacts may adversely affect the performance of the Funds.
8. SUBSEQUENT EVENTS
Subsequent events, if any, after the date of the Statements of Assets and Liabilities have been evaluated through the date the financial statements were issued. Management has determined that there were no subsequent events to report through the issuance of these financial statements.
ALPS ETF Trust
| Additional Information | November 30, 2020 (Unaudited) |
PROXY VOTING POLICIES AND PROCEDURES
Information regarding how the Fund voted proxies relating to portfolio securities during the most recent 12-month period ended June 30 and a description of the Fund’s proxy voting policies and procedures used in determining how to vote for proxies are available without charge on the SEC’s website at www.sec.gov and upon request, by calling (toll-free) 1-866-675-2639.
PORTFOLIO HOLDINGS
The Fund files a complete schedule of portfolio holdings with the U.S. Securities and Exchange Commission (“SEC”) for the first and third quarters of each fiscal year as an exhibit to its reports on Form N-PORT within 60 days after the end of the period. Copies of the Fund’s Form N-PORT are available without a charge, upon request, by contacting the Fund at 1-866-759-5679 and on the SEC’s website at https://www.sec.gov.
TAX INFORMATION (UNAUDITED)
The Funds designate the following for federal income tax purposes for distributions made during the calendar year ended December 31, 2019:
| | QDI | DRD | 199A |
| ALPS Sector Dividend Dogs ETF | 100.00% | 98.67% | 0.00% |
| ALPS International Sector Dividend Dogs ETF | 79.04% | 0.00% | 0.00% |
| ALPS Emerging Sector Dividend Dogs ETF | 62.28% | 0.00% | 0.00% |
| ALPS REIT Dividend Dogs ETF | 30.00% | 0.00% | 48.89% |
In early 2020, if applicable, shareholders of record received this information for the distributions paid to them by the Funds during the calendar year 2019 via Form 1099. The Funds will notify shareholders in early 2021 of amounts paid to them by the Funds, if any, during the calendar year 2020.
Pursuant to Section 853(c) of the Internal Revenue Code, the following Funds designated the following for the calendar year ended December 31, 2020:
| | | Foreign Taxes Paid | | | Foreign Source Income | |
| Alps Emerging Sector Dividend Dog ETF | | $ | 87,444 | | | $ | 942,423 | |
| ALPS International Sector Dividend Dogs ETF | | $ | 466,218 | | | $ | 7,260,964 | |
LICENSING AGREEMENTS
ALPS Sector Dividend Dogs ETF, ALPS International Sector Dividend Dogs ETF, ALPS Emerging Sector Dividend Dogs ETF, and ALPS REIT Dividend Dogs ETF
The Funds are not sponsored, endorsed, sold or promoted by the Index Provider. The Index Provider makes no representation or warranty, express or implied, to the owners of each Fund or any member of the public regarding the advisability of investing in securities generally or in each Fund particularly or the ability of each Fund to track the performance of the physical commodities market. The Index Provider’s only relationship to the Adviser or each Fund is the licensing of certain service marks and trade names of the Index Provider and of each Underlying Index that is determined, composed and calculated by the Index Provider without regard to the Adviser or the Funds. The Index Provider has no obligation to take the needs of the Adviser or the Funds or the owners of each Fund into consideration in determining, composing or calculating each Underlying Index. The Index Provider is not responsible for and has not participated in the determination of the timing of, prices at, or quantities of each Fund to be issued or in the determination or calculation of the equation by which each Fund is to be converted into cash. The Index Provider has no obligation or liability in connection with the administration, marketing or trading of each Fund.
THE INDEX PROVIDER DOES NOT GUARANTEE THE ACCURACY AND/OR THE COMPLETENESS OF EACH UNDERLYING INDEX OR ANY DATA INCLUDED THEREIN AND THE INDEX PROVIDER SHALL HAVE NO LIABILITY FOR ANY ERRORS, OMISSIONS, OR INTERRUPTIONS THEREIN. THE INDEX PROVIDER MAKES NO WARRANTY, EXPRESS OR IMPLIED, AS TO RESULTS TO BE OBTAINED BY THE ADVISER, EACH FUND, OWNERS OF EACH FUND, OR ANY OTHER PERSON OR ENTITY FROM THE USE OF THE UNDERLYING INDEX OR ANY DATA INCLUDED THEREIN. THE INDEX PROVIDER MAKES NO EXPRESS OR IMPLIED WARRANTIES, AND EXPRESSLY DISCLAIMS ALL WARRANTIES OF MERCHANTABILITY OR FITNESS FOR A PARTICULAR PURPOSE OR USE WITH RESPECT TO EACH UNDERLYING INDEX OR ANY DATA INCLUDED THEREIN. WITHOUT LIMITING ANY OF THE FOREGOING, IN NO EVENT SHALL THE INDEX PROVIDER HAVE ANY LIABILITY FOR ANY SPECIAL, PUNITIVE, INDIRECT, OR CONSEQUENTIAL DAMAGES (INCLUDING LOST PROFITS), EVEN IF NOTIFIED OF THE POSSIBILITY OF SUCH DAMAGES.
ALPS ETF Trust
| Additional Information | November 30, 2020 (Unaudited) |
The Funds are not sponsored, endorsed, sold or promoted by Standard & Poor’s, a division of The McGraw-Hill Companies, Inc. (“S&P”) or its third party licensors. Neither S&P nor its third party licensors make any representation or warranty, express or implied, to the owners of each Fund or any member of the public regarding the advisability of investing in securities generally or in each Fund particularly or the ability of each Underlying Index to track general stock market performance. S&P’s and its third party licensor’s only relationship to the Index Provider is the licensing of certain trademarks, service marks and trade names of S&P and/or its third party licensors and for the providing of calculation and maintenance services related to the Underlying Index. Neither S&P nor its third party licensors is responsible for and has not participated in the determination of the prices and amount of each Fund or the timing of the issuance or sale of each Fund or in the determination or calculation of the equation by which each Fund is to be converted into cash. S&P has no obligation or liability in connection with the administration, marketing or trading of each Fund.
NEITHER S&P, ITS AFFILIATES NOR THEIR THIRD PARTY LICENSORS GUARANTEE THE ADEQUACY, ACCURACY, TIMELINESS OR COMPLETENESS OF EACH UNDERLYING INDEX OR ANY DATA INCLUDED THEREIN OR ANY COMMUNICATIONS, INCLUDING BUT NOT LIMITED TO, ORAL OR WRITTEN COMMUNICATIONS (INCLUDING ELECTRONIC COMMUNICATIONS) WITH RESPECT THERETO. S&P, ITS AFFILIATES AND THEIR THIRD PARTY LICENSORS SHALL NOT BE SUBJECT TO ANY DAMAGES OR LIABILITY FOR ANY ERRORS, OMISSIONS OR DELAYS THEREIN. S&P MAKES NO EXPRESS OR IMPLIED WARRANTIES, AND EXPRESSLY DISCLAIMS ALL WARRANTIES OF MERCHANTABILITY OR FITNESS FOR A PARTICULAR PURPOSE OR USE WITH RESPECT TO ITS TRADEMARKS, EACH UNDERLYING INDEX OR ANY DATA INCLUDED THEREIN. WITHOUT LIMITING ANY OF THE FOREGOING, IN NO EVENT WHATSOEVER SHALL S&P, ITS AFFILIATES OR THEIR THIRD PARTY LICENSORS BE LIABLE FOR ANY INDIRECT, SPECIAL, INCIDENTAL, PUNITIVE OR CONSEQUENTIAL DAMAGES, INCLUDING BUT NOT LIMITED TO, LOSS OF PROFITS, TRADING LOSSES, LOST TIME OR GOODWILL, EVEN IF THEY HAVE BEEN ADVISED OF THE POSSIBILITY OF SUCH DAMAGES, WHETHER IN CONTRACT, TORT, STRICT LIABILITY OR OTHERWISE.
Standard & Poor’s® and S&P® are registered trademarks of The McGraw-Hill Companies, Inc.; “Calculated by S&P Custom Indices” and its related stylized mark are service marks of The McGraw-Hill Companies, Inc. These marks have been licensed for use by the Index Provider.
The S&P 500® is the property of Standard and Poor’s Financial Services LLC (“S&P”) and has been licensed by S&P for use by S-Network® Global Indexes, Inc. in connection with the S-Network® Sector Dividend Dogs Index (Ticker: SDOGX), the S-Network® International Sector Dividend Dogs Index (Ticker: IDOGX), the S-Network® Emerging Sector Dividend Dogs Index (Ticker: EDOGX), and the S-Network® REIT Dividend Dogs Index (Ticker: RDOGX).
The Adviser does not guarantee the accuracy and/or the completeness of each Underlying Index or any data included therein, and the Adviser shall have no liability for any errors, omissions or interruptions therein. The Adviser makes no warranty, express or implied, as to results to be obtained by each Fund, owners of the Shares of each Fund or any other person or entity from the use of each Underlying Index or any data included therein. The Adviser makes no express or implied warranties, and expressly disclaims all warranties of merchantability or fitness for a particular purpose or use with respect to each Underlying Index or any data included therein. Without limiting any of the foregoing, in no event shall the Adviser have any liability for any special, punitive, direct, indirect or consequential damages (including lost profits) arising out of matters relating to the use of each Underlying Index, even if notified of the possibility of such damages.
ALPS ETF Trust
| Board Considerations Regarding Approval of | November 30, 2020 (Unaudited) |
| Investment Advisory Agreements | |
At a meeting held on June 24, 2020 via electronic means (video-conference), the Board of Trustees of the Trust (the “Board” or the “Trustees”), including the Trustees who are not “interested persons” of the Trust within the meaning of the Investment Company Act of 1940, as amended (the “Independent Trustees”), evaluated a proposal to approve the continuance of the Investment Advisory Agreements between the Trust and ALPS Advisors, Inc. (the “Adviser” or “AAI”) with respect to the ALPS Sector Dividend Dogs ETF (“SDOG”), ALPS International Sector Dividend Dogs ETF (“IDOG”), the ALPS Emerging Sector Dividend Dogs ETF (“EDOG”), and the ALPS REIT Dividend Dogs ETF (“RDOG”) (each “a Fund” and collectively the “Funds”). The Independent Trustees also met separately to consider each Investment Advisory Agreement.
In evaluating the Investment Advisory Agreements with respect to each Fund, the Board, including the Independent Trustees considered various factors, including (i) the nature, extent and quality of the services provided by AAI with respect to the applicable Fund under the Investment Advisory Agreements; (ii) the advisory fees and other expenses paid by the Fund compared to those of similar funds managed by other investment advisers; (iii) the costs of the services provided to the Fund by AAI and the profits realized by AAI and its affiliates from its relationship to the Fund; (iv) the extent to which economies of scale have been or would be realized if and as the assets of the Fund grow and whether fees reflect the economies of scale for the benefit of shareholders; and (v) any additional benefits and other considerations.
With respect to the nature, extent and quality of the services provided by AAI under the Investment Advisory Agreements, the Board considered and reviewed information concerning the services provided under the Investment Advisory Agreements, the investment parameters of the index of each Fund, financial information regarding AAI and its parent company, information describing AAI’s current organization and the background and experience of the persons responsible for the day-to-day management of the Funds.
The Board reviewed information on the performance of each Fund and its applicable benchmark. The Board also evaluated the correlation and tracking error between each underlying index and its corresponding Fund’s performance. Based on this review, the Board, including the Independent Trustees found that the nature and extent of services provided to each Fund under the Investment Advisory Agreements was appropriate and that the quality was satisfactory.
The Board noted that the advisory fees for each Fund were unitary fees pursuant to which AAI assumes all expenses of the Funds (including the cost of transfer agency, custody, fund administration, legal, audit and other services) other than the payments under the Advisory Agreement, brokerage expenses, taxes, interest, litigation expenses and other extraordinary expenses.
With respect to advisory fee rates, the Board, including the Independent Trustees, noted the following:
The gross management fee rate for each of SDOG, IDOG, and EDOG is higher than the median of its FUSE expense group. The Funds’ respective net expense ratios, however, are (i) in the case of EDOG, at the median of its FUSE expense group and (ii) in the case of SDOG and IDOG, slightly above the median of their respective FUSE expense group.
The gross management fee rate for RDOG is lower than the median of its FUSE expense group. The Fund’s net expense ratio is also below the median of its FUSE expense group.
Based on the foregoing, and the other information available to them, the Board, including the Independent Trustees, concluded that the advisory fee rate for each of the Funds was reasonable under the circumstances and in light of the quality of services provided.
The Board, including the Independent Trustees, considered other benefits available to AAI because of its relationship with the Funds and concluded that the advisory fees were reasonable taking into account any such benefits.
The Board, including the Independent Trustees, also considered with respect to each Fund the information provided by AAI about the costs and profitability of AAI with respect to each of the Funds, including the asset levels and other factors that influence the profitability and financial viability of the Funds. The Board, including the Independent Trustees, reviewed and noted the relatively small sizes of IDOG, EDOG, and RDOG and concluded that AAI was not realizing any economies of scale with respect to such Funds. With respect to SDOG, the Board, including the Independent Trustees, noted that the Fund’s asset levels have decreased over the prior year and that neither Fund’s asset levels have recovered to its respective historic highs. The Independent Trustees determined that AAI should continue to keep the Board informed on an ongoing basis of any significant developments (e.g., material increases in asset levels) so as to facilitate the Independent Trustees’ evaluation of whether further economies of scale have been achieved.
In voting to renew each Investment Advisory Agreement, the Board, including the Independent Trustees, concluded that the terms of each Investment Advisory Agreement are reasonable and fair in light of the services to be performed, the fees paid by certain other funds, expenses to be incurred and such other matters as the members of the Board, including the Independent Trustees, considered relevant in the exercise of their reasonable business judgment. The Board, including the Independent Trustees, did not identify any single factor or group of factors as all important or controlling and considered all factors together.
ALPS ETF Trust
| Trustees and Officers | November 30, 2020 (Unaudited) |
The general supervision of the duties performed by the Adviser for the Fund under the Investment Advisory Agreement is the responsibility of the Board of Trustees. The Trust currently has four Trustees. Three Trustees have no affiliation or business connection with the Adviser or any of its affiliated persons and do not own any stock or other securities issued by the Adviser. These are the “non-interested” or “independent” Trustees (“Independent Trustees”). The other Trustee (the “Interested Trustee”) is affiliated with the Adviser.
The Independent Trustees of the Trust, their term of office and length of time served, their principal business occupations during the past five years, the number of portfolios in the Fund Complex overseen by each Independent Trustee, and other directorships, if any, held by the Trustee are shown below.
INDEPENDENT TRUSTEES
| Name, Address & Year of Birth* | Position(s) Held with Trust | Term of Office and Length of Time Served** | Principal Occupation(s) During Past 5 Years | Number of Portfolios in Fund Complex Overseen by Trustees*** | Other Directorships Held by Trustees |
| Mary K. Anstine, 1940 | Trustee | Since March 2008 | Ms. Anstine was formerly an Executive Vice President of First Interstate Bank of Denver until 1994, President/Chief Executive Officer of HealthONE Alliance, Denver, Colorado, from 1994 to 2004, and has been retired since 2004. Ms. Anstine is also Trustee/Director of the following: AV Hunter Trust and Colorado Uplift Board. Ms. Anstine was formerly a Director of the Trust Bank of Colorado (later purchased and now known as Northern Trust Bank), HealthONE and Denver Area Council of the Boy Scouts of America and a member of the American Bankers Association Trust Executive Committee. | 35 | Ms. Anstine is a Trustee of ALPS Variable Investment Trust (7 funds); Financial Investors Trust (31 funds); Reaves Utility Income Fund; and Segall Bryant & Hamill Trust (14 funds). |
Jeremy W. Deems, 1976 | Trustee | Since March 2008 | Mr. Deems is the Co-Founder, Chief Compliance Officer and Chief Financial Officer of Green Alpha Advisors, LLC. Mr. Deems is Co-Portfolio Manager of the Shelton Green Alpha Fund. Prior to joining Green Alpha Advisors, Mr. Deems was CFO and Treasurer of Forward Management, LLC, ReFlow Management Co., LLC, ReFlow Fund, LLC, a private investment fund, and Sutton Place Management, LLC, an administrative services company. | 35 | Mr. Deems is a Trustee of ALPS Variable Investment Trust (7 funds); Financial Investors Trust (31 funds); and Reaves Utility Income Fund; and Clough Funds Trust (1 fund). |
Rick A. Pederson, 1952 | Trustee | Since March 2008 | Mr. Pederson is Partner, Bow River Capital Partners (private equity management), 2003 - present; Board Member, Prosci Inc. (private business services) 2013-2016; Advisory Board Member, Citywide Banks (Colorado community bank) 2014- 2017; Board Member, Strong-Bridge Consulting, 2015-2019; Board Member, IRI/ODMS Holdings LLC, 2017 – 2019; Director, National Western Stock Show (not for profit) 2010 - present; Director, History Colorado (not for profit) 2015-present; Director, Citywide Bank Advisory Board 2017-present; Trustee, Boettcher Foundation, 2018-present. | 18 | Mr. Pederson is Trustee of Segall Bryant & Hamill Trust (14 funds) and Principal Real Estate Income Fund (1 fund). |
| * | The business address of the Trustee is c/o ALPS Advisors, Inc., 1290 Broadway, Suite 1000, Denver, Colorado 80203. |
| ** | This is the period for which the Trustee began serving the Trust. Each Trustee serves an indefinite term, until his successor is elected. |
| *** | The Fund Complex includes all series of the Trust and any other investment companies for which ALPS Advisors, Inc. provides investment advisory services. |
ALPS ETF Trust
| Trustees and Officers | November 30, 2020 (Unaudited) |
The Trustee who is an “interested person” of the Trust, his term of office and length of time served, his principal business occupations during the past five years, the number of portfolios in the Fund Complex overseen by the Interested Trustee and the other directorships, if any, held by the Trustee, are shown below.
INTERESTED TRUSTEE
| Name, Address and Year of Birth of Interested Trustee* | Position(s) Held with Trust | Term of Office and Length of Time Served** | Principal Occupation(s) During Past 5 Years | Number of Portfolios in Fund Complex Overseen by Trustees*** | Other Directorships Held by Trustees |
Edmund J. Burke, 1961 | Trustee | Since December 2017. | Mr. Burke joined ALPS in 1991 and served as the President and Director of ALPS Holdings, Inc., and ALPS Advisors, Inc. (“AAI”), and Director of ALPS Distributors, Inc. (“ADI”), ALPS Fund Services, Inc. (“AFS”), and ALPS Portfolio Solutions Distributor, Inc. (“APSD”). Mr. Burke retired from ALPS in June 2019. | 30 | Mr. Burke is a Trustee of Clough Global Dividend and Income Fund (1 fund); Clough Global Equity Fund (1 fund); Clough Global Opportunities Fund (1 fund); Clough Funds Trust (1 fund); Liberty All-Star Equity Fund (1 fund); Director of the Liberty All- Star Growth Fund, Inc. (1 fund) and Financial Investors Trust (31 funds). |
| * | The business address of the Trustee is c/o ALPS Advisors, Inc., 1290 Broadway, Suite 1000, Denver, Colorado 80203. |
| ** | This is the period for which the Trustee began serving the Trust. Each Trustee serves an indefinite term, until his successor is elected. |
| *** | The Fund Complex includes all series of the Trust and any other investment companies for which ALPS Advisors, Inc. provides investment advisory services. |
ALPS ETF Trust
| Trustees and Officers | November 30, 2020 (Unaudited) |
OFFICERS
| Name, Address and Year of Birth of Officer* | Position(s) Held with Trust | Length of Time Served** | Principal Occupation(s) During Past 5 Years |
Bradley Swenson, 1972 | President | Since June 2019 | Mr. Swenson joined ALPS in 2004 and currently serves as President of AFS (since 2019) and also Chief Operating Officer of AFS (since 2015). He also currently serves as President of Clough Global Opportunities Fund, Clough Global Dividend and Income Fund, Clough Global Equity Fund, Clough Funds Trust, Financial Investors Trust, Reaves Utility Income Fund and ALPS Series Trust. From 2004-2015, Mr. Swenson served as Chief Compliance Officer to ALPS, its affiliated entities, and to certain investment companies. Mr. Swenson is registered with FINRA, holding a Series 6, 26 and 27. |
Matthew Sutula, 1985 | Chief Compliance Officer (“CCO”) | Since December 2019 | Mr. Sutula joined ALPS in 2012 and currently serves as Chief Compliance Officer of AAI. Prior to his current role, Mr. Sutula served as interim Compliance Officer of the Trust (September 2019 to December 2019). Compliance Manager and Senior Compliance Analyst for AAI, as well as Compliance Analyst for AFS. Prior to joining ALPS, he spent seven years at Morningstar, Inc. in various analyst roles supporting the registered investment company databases. Mr. Sutula is also Chief Compliance Officer of Principal Real Estate Income Fund, ALPS Variable Investment Trust, RiverNorth Opportunities Fund, Inc., Liberty All-Star Equity Fund and Liberty All- Star Growth Fund, Inc. |
Kathryn Burns, 1976 | Treasurer | Since September 2018 | Ms. Burns serves as Vice President, Director of Fund Operations of AAI since 2018. From 2013 to 2018, she served as Vice President and Fund Controller at AFS. Prior to joining ALPS, she worked at Old Mutual Capital where she served as Vice President and Chief Compliance Officer (2010 – 2012) and Regulatory Reporting Manager and Assistant Treasurer to the Old Mutual Funds Trusts (2006 – 2012). She also served as a CPA for PricewaterhouseCoopers LLP. Ms. Burns also serves as Treasurer of Boulder Growth & Income Fund, Inc. and as President of ALPS Variable Investment Trust, Principal Real Estate Income Fund and RiverNorth Opportunities Fund, Inc. |
Richard C. Noyes,*** 1970 | Secretary | Since September 2019 | Mr. Noyes joined ALPS in 2015 and is Senior Vice President and General Counsel of ALPS. Prior to joining ALPS, Mr. Noyes served as Assistant Vice President and Senior Counsel of Janus Capital Management LLC. |
Sharon Akselrod,*** 1974 | Assistant Secretary | Since December 2016 | Ms. Akselrod joined ALPS in August 2014 and is currently Senior Investment Company Act Paralegal of AFS. Prior to joining ALPS, Ms. Akselrod served as Corporate Governance and Regulatory Associate for Nordstrom fsb (2013-2014) and Senior Legal Assistant – Legal Manager for AXA Equitable Life Insurance Company (2008-2013). Ms. Akselrod is also Secretary of Principal Real Estate Income Fund and Assistant Secretary of Financial Investors Trust and Clough Funds Trust. |
Cara Owen,*** 1981 | Assistant Secretary | Since March 2020 | Vice President and Principal Legal Counsel, ALPS Fund Services, Inc.; Vice President and Secretary, Boulder Growth & Income Fund, Inc.; Assistant Secretary, James Advantage Funds (since August 2019). Prior to joining ALPS, Ms. Owen was Senior Counsel, Corporate & Investments, Great-West Life & Annuity Insurance Company; Senior Counsel & Assistant Secretary, Great-West Funds, Inc., Great-West Capital Management, LLC, Great-West Trust Company, LLC, and Advised Assets Group, LLC (2014-2019). |
| * | The business address of each Officer is c/o ALPS Advisors, Inc., 1290 Broadway, Suite 1000, Denver, Colorado 80203. Each Officer is deemed an affiliate of the Trust as defined under the 1940 Act. |
| ** | This is the period for which the Officer began serving the Trust. Each Officer serves an indefinite term, until his/her successor is elected. |
| *** | Effective December 7, 2020, Mr. Noyes and Ms. Akselrod resigned from their respective positions held with the Trust. As of the same date, Ms. Owen was appointed to the position of Secretary and Jen Craig as Assistant Secretary. |
The Statement of Additional Information includes additional information about the Fund’s Trustees and is available, without charge, upon request by calling (toll-free) 1-866-759-5679.

TABLE OF CONTENTS
| Performance Overview | 1 |
| Disclosure of Fund Expenses | 6 |
| Report of Independent Registered Public Accounting Firm | 7 |
| Schedule of Investments | 8 |
| Statement of Assets and Liabilities | 13 |
| Statement of Operations | 14 |
| Statements of Changes in Net Assets | 15 |
| Financial Highlights | 16 |
| Notes to Financial Statements | 17 |
| Additional Information | 23 |
| Board Considerations Regarding Approval of Investment Advisory Agreement | 25 |
| Trustees & Officers | 26 |
Beginning on January 1, 2021, as permitted by regulations adopted by the U.S. Securities and Exchange Commission, paper copies of the Fund’s annual and semi-annual shareholder reports will no longer be sent by mail, unless you specifically request paper copies of the reports from your financial intermediary (such as a broker-dealer or bank). Instead, the reports will be made available on the Fund’s website (www.alpsfunds.com), and you will be notified by mail each time a report is posted and provided with a website link to access the report.
If you already elected to receive shareholder reports electronically, you will not be affected by this change and you need not take any action. You may elect to receive shareholder reports and other communications from the Fund electronically anytime by contacting your financial intermediary.
You may elect to receive all future reports in paper free of charge. You can contact your financial intermediary to request that you continue to receive paper copies of your shareholder reports. Your election to receive reports in paper will apply to all funds held in your account with your financial intermediary.
Barron’s 400SM ETF
| Performance Overview | November 30, 2020 (Unaudited) |
Investment Objective
The Barron’s 400SM ETF (the “Fund” or “BFOR”) seeks investment results that correspond generally, before fees and expenses, to the performance of the Barron’s 400 IndexSM (the “Underlying Index”). The Underlying Index is a rules-based index intended to give investors a means of tracking the overall performance of high performing equity securities of U.S. companies. The Fund will invest at least 80% of its total assets in the equity securities which comprise the Underlying Index.
The Underlying Index generally consists of 400 stocks. The Underlying Index’s stocks are constituents of the MarketGrader U.S. Coverage Universe. In compiling the Underlying Index, MarketGrader Capital, LLC (the “Index Provider”) selects the 400 stocks from the MarketGrader U.S. Coverage Universe by using a methodology that selects components based on the strength of their fundamentals in growth, value, profitability and cash flow and then screens such potential Underlying Index components for certain criteria regarding concentration, market capitalization, and liquidity. The eligible stocks that are selected for inclusion in the Underlying Index’s portfolio are equally weighted. The Underlying Index is rebalanced by the Index Provider semiannually, on the third Friday of March and September each year.
Performance Overview
Along with the broad U.S. equity market, the Fund staged a spectacular comeback from its pandemic-induced selloff in February and March to close its fiscal year 2020 up a solid 13.3%. This trailed the 14.1% total return clocked by its benchmark, the Barron’s 400 Index (B400T), and the 20% appreciation in the Dow Jones U.S. Total Stock Market Index (DJUSTSM), also including dividends. As a reminder, BFOR’s fiscal year ends on November 30th. And while the returns for both BFOR and its benchmark, the Barron’s 400 Index, trailed those for large cap stocks during its latest fiscal year, they both outpaced some of the most widely followed small cap and mid cap benchmarks. More specifically, the Barron’s 400 Index outperformed, on a total return basis, the Russell 2000 Index of small cap stocks, which gained 14.8%, the S&P Small Cap 600 Index, which gained only 7.1% and the S&P Mid Cap 400 Index, which was up 10.5%, also through the end of November1.
B400 Stages a Remarkable Recovery from March Lows
At the start of 2020, when the coronavirus epidemic evolving in China seemed like a remote event unlikely to affect other parts of the world in a significant way, large cap growth stocks resumed the leadership they had enjoyed in recent years and got off to a roaring start. The Russell 3000 Growth Index rose sharply out of the gate in the new year, gaining 9% by February 19th. The momentum in large cap growth names, which include most of the mega cap technology names that have come to dominate the market cap weighted benchmarks in recent years, lifted both the S&P 500 Index and the Dow Jones U.S. Total Stock Market Index 5.1%, including dividends, also by February 19th. Small cap stocks lagged during this same period, with the Russell 2000 Index rising only 1.6% and the S&P Small Cap 600 Index falling by 0.3%, which trailed the broad market, as measured by the Dow Jones U.S. Total Stock Market Index, by 340 basis points. The Barron’s 400 Index gained only 1.1% as a result of its equally weighted methodology, despite having 210 large caps and only 190 small caps at the beginning of the year2. By the end of February markets took a drastic turn for the worse, as the epidemic in China turned into a global pandemic, causing widespread shutdowns of economic activity all around the world. By March 23rd the Dow Jones U.S. Total Stock Market Index was down 31.7% for the year and the Barron’s 400 Index was down 37.6%, both on a total return basis. What followed was one of the most remarkable turnarounds in stock market history, with the Barron’s 400 Index posting stellar returns and handily outpacing the broad market.
Between March 23, 2020, when the U.S. stock market reached bottom, and the end of BFOR’s fiscal year on November 30th, the Fund had gained 71.5% with its benchmark, the Barron’s 400 Index, gaining 73.1%, including dividends. Coincidentally, March 23rd was also B400’s reconstitution and rebalance date, which means that as the market began its recovery, B400—and consequently BFOR—was starting with a brand new set of equally weighted constituents3. By comparison, DJUSTSM rose 64.6% and the S&P 500 Index gained 59.1%, both also including dividends. Among the market’s widely held benchmarks, the Russell 2000 Index rose a remarkable 81.1%, followed by the S&P Mid Cap 400 Index, up 74.2% and the S&P Small Cap 600 Index, up 72.9%. Figure 1 illustrates the performance for select U.S. equity benchmarks for the year ended on November 30th and since the market’s bottom in March.
Barron’s 400SM ETF
| Performance Overview | November 30, 2020 (Unaudited) |
Figure 1. Performance for the Barron’s 400 ETF (BFOR), the Barron’s 400 Index (B400T) and Select Equity Benchmarks for Fiscal Year 2020 and from the U.S. Stock Market Bottom in 2020 through November 30, 2020.
| | BFOR FY 2020 (12/1/2019 – 11/30/2020) | Since B400 March Rebalance (3/23/2020) |
| Barron’s 400 ETF (BFOR) | 13.3% | 71.5% |
| Barron’s 400 Index | 14.1% | 73.1% |
| S&P 500 Index | 18.5% | 59.1% |
| Dow Jones US Total Stock Market Index | 20.0% | 64.6% |
| Russell 1000 Index | 20.5% | 63.5% |
| Russell 2000 Index | 14.8% | 81.1% |
| S&P Mid Cap 400 Index | 10.5% | 74.2% |
| S&P Small Cap 600 Index | 7.1% | 72.9% |
| Russell 3000 Value Index | 2.2% | 52.6% |
| Russell 3000 Growth Index | 37.3% | 74.5% |
Source: Bloomberg
| 1 | Source of returns: Bloomberg. |
| 2 | Size designation for all U.S. companies is based on MarketGrader’s semi-annual classification according to the market’s aggregate market capitalization. All companies comprising the top 85% of aggregate market capitalization are classified as ‘large’ and all companies in the bottom 15% of aggregate market capitalization are classified as ‘small.’ |
| 3 | The Barron’s 400 Index is reconstituted and rebalanced semi-annually on the third Friday of March and September. All constituents are equally weighted at the start of each rebalance period. Source: MarketGrader. |
Broad Based Recovery for the Barron’s 400 Index
While clear winners and losers have emerged with the market recovery since March, for the Barron’s 400 Index the recovery was felt across most constituents and across all market segments and all sectors, with a few exceptions among some of its constituents, especially in the industries hit hardest by the pandemic and the economic shutdowns. Since its last rebalance on March 23rd, which coincided with the market’s trough following its drawdown, the Barron’s 400 Index has held 580 different positions (since the Index rebalanced on September 18th). Among them, 539 companies contributed a positive return through November 30th (93% of all positions held) and only 41 posted a negative return. Figure 2 illustrates the breakdown of all constituents held by B400 since March 23rd, broken down by sector and by positive and negative return for the period through the end of November. Figure 3 shows the top 40 performers in B400 since the market bottomed in March.
Figure 2. Positions held by Barron’s 400 Index Between March 23, 2020 and November 30, 2020
| Sector | Total | % of Total Holdings | Positive Return | % | Negative Return | % |
| Consumer Discretionary | 90 | 15.5% | 80 | 89% | 10 | 11% |
| Consumer Staples | 32 | 5.5% | 29 | 91% | 3 | 9% |
| Energy | 15 | 2.6% | 14 | 93% | 1 | 7% |
| Financials | 131 | 22.6% | 124 | 95% | 7 | 5% |
| Health Care | 69 | 11.9% | 62 | 90% | 7 | 10% |
| Industrials | 103 | 17.8% | 97 | 94% | 6 | 6% |
| Materials | 25 | 4.3% | 23 | 92% | 2 | 8% |
| Technology | 99 | 17.1% | 96 | 97% | 3 | 3% |
| Telecommunications | 3 | 0.5% | 3 | 100% | 0 | 0% |
| Utilities | 13 | 2.2% | 11 | 85% | 2 | 15% |
Source: MarketGrader Research
Barron’s 400SM ETF
| Performance Overview | November 30, 2020 (Unaudited) |
Figure 3. Top 40 Performing Stocks in the Barron’s 400 Index Since the Market Bottom on March 23, 2020
| Ticker | Name | Size Category | Sector | Industry | Total Return % |
| ENPH | Enphase Energy, Inc. | SMALL | Technology | Semiconductors | 396 |
| CROX | Crocs, Inc. | SMALL | Consumer Discretionary | Apparel/Footwear | 370 |
| HZO | MarineMax, Inc. | SMALL | Consumer Discretionary | Specialty Stores | 317 |
| YETI | YETI Holdings, Inc. | SMALL | Industrials | Miscellaneous Manufacturing | 305 |
| CCS | Century Communities, Inc. | SMALL | Consumer Discretionary | Homebuilding | 277 |
| SQ | Square, Inc. Class A | LARGE | Technology | Information Technology Services | 262 |
| ALGN | Align Technology, Inc. | LARGE | Health Care | Medical Specialties | 249 |
| REGI | Renewable Energy Group, Inc. | SMALL | Materials | Chemicals: Specialty | 208 |
| MTH | Meritage Homes Corporation | SMALL | Consumer Discretionary | Homebuilding | 208 |
| PFSI | PennyMac Financial Services, Inc. | SMALL | Financials | Finance/Rental/Leasing | 202 |
| WSM | Williams-Sonoma, Inc. | SMALL | Consumer Discretionary | Specialty Stores | 198 |
| TKR | Timken Company | SMALL | Industrials | Metal Fabrication | 194 |
| SAM | Boston Beer Company, Inc. Class A | SMALL | Consumer Staples | Beverages: Alcoholic | 189 |
| IBP | Installed Building Products, Inc. | SMALL | Industrials | Wholesale Distributors | 185 |
| LEN.B | Lennar Corporation Class B | SMALL | Consumer Discretionary | Homebuilding | 181 |
| TPX | Tempur Sealy International Inc | SMALL | Consumer Discretionary | Home Furnishings | 178 |
| SPSC | SPS Commerce, Inc. | SMALL | Technology | Packaged Software | 178 |
| ACMR | ACM Research, Inc. Class A | SMALL | Industrials | Industrial Machinery | 178 |
| PH | Parker-Hannifin Corporation | LARGE | Industrials | Industrial Machinery | 177 |
| KNSL | Kinsale Capital Group, Inc. | SMALL | Financials | Multi-Line Insurance | 174 |
| GNRC | Generac Holdings Inc. | LARGE | Industrials | Electrical Products | 173 |
| CRMT | America's Car-Mart, Inc. | SMALL | Consumer Discretionary | Specialty Stores | 167 |
| BLD | TopBuild Corp. | SMALL | Industrials | Building Products | 166 |
| APAM | Artisan Partners Asset Management | SMALL | Financials | Investment Managers | 161 |
| FND | Floor & Decor Holdings, Inc. Class A | SMALL | Consumer Discretionary | Home Improvement | 155 |
| | | | | Chains | |
| DHI | D.R. Horton, Inc. | LARGE | Consumer Discretionary | Homebuilding | 153 |
| NVDA | NVIDIA Corporation | LARGE | Technology | Semiconductors | 152 |
| IDXX | IDEXX Laboratories, Inc. | LARGE | Health Care | Medical Specialties | 152 |
| PYPL | PayPal Holdings Inc | LARGE | Technology | Data Processing Services | 151 |
| PHM | PulteGroup, Inc. | LARGE | Consumer Discretionary | Homebuilding | 147 |
| TTD | Trade Desk, Inc. Class A | LARGE | Consumer Discretionary | Advertising/Marketing Services | 147 |
| PUMP | ProPetro Holding Corp. | SMALL | Energy | Oilfield Services/Equipment | 145 |
| LGIH | LGI Homes, Inc. | SMALL | Consumer Discretionary | Homebuilding | 143 |
| PJT | PJT Partners, Inc. Class A | SMALL | Financials | Investment Banks/Brokers | 141 |
| TER | Teradyne, Inc. | LARGE | Technology | Electronic Production | 141 |
| | | | | Equipment | |
| OMF | OneMain Holdings, Inc. | SMALL | Financials | Finance/Rental/Leasing | 140 |
| DE | Deere & Company | LARGE | Industrials | Trucks/Construction/Farm Mach. | 137 |
| LRCX | Lam Research Corporation | LARGE | Technology | Electronic Production Equipment | 137 |
| HOLX | Hologic, Inc. | LARGE | Health Care | Medical Specialties | 135 |
| SMG | Scotts Miracle-Gro Company Class A | SMALL | Materials | Chemicals: Agricultural | 135 |
Sources: FactSet (returns), MarketGrader Research (companies and index data)
Barron’s 400SM ETF
| Performance Overview | November 30, 2020 (Unaudited) |
Performance (as of November 30, 2020)
| | 1 Year | 5 Year | Since Inception^ |
| Barron’s 400SM ETF – NAV | 13.33% | 9.15% | 9.58% |
| Barron’s 400SM ETF – Market Price* | 13.36% | 9.16% | 9.58% |
| Barron’s 400 IndexSM | 14.14% | 9.85% | 10.30% |
Total Expense Ratio (per the current prospectus) is 0.65%
Performance data quoted represents past performance. Past performance does not guarantee future results. Total return figures assume reinvestment of dividends and capital gains distributions, if any. The table does not reflect the deduction of taxes that a shareholder would pay on Fund distributions or the redemption of Fund shares. Investment return and principal value of an investment will fluctuate so that an investor’s shares, when sold or redeemed, may be worth more or less than the original cost. Current performance data may be higher or lower than actual data quoted. For the most current month-end performance data please visit www.alpsfunds.com or call 1.855.724.0450.
NAV is an exchange-traded fund’s per-share value. The per-share dollar amount of the Fund is derived by dividing the total value of all the securities in its portfolio, less any liabilities, by the number of Fund shares outstanding. Market Price is the price at which a share can currently be traded in the market. Information detailing the number of days the Market Price of the Fund was greater than the Fund’s NAV and the number of days it was less than the Fund’s NAV can be obtained at www.alpsfunds.com.
| ^ | The Fund commenced Investment Operations on June 4, 2013. |
| * | Market Price means the official closing price of a share or, if it more accurately reflects the market value of a share at the time as of which the Fund calculates current net asset value per share, the price that is the midpoint of the bid-ask spread as of that time. It does not represent the returns an investor would receive if shares were traded at other times. |
The Barron’s 400 IndexSM, calculated by NYSE Arca or its affiliates, measures the performance of a diversified group of U.S. companies selected in part based on fundamentals-related rules-based criteria. The index includes companies that have scored highest according to fundamentals-related rankings calculated by MarketGrader Capital, LLC. Additional rules-based screening provides for sector and market cap diversification. The Underlying Index has been licensed by MarketGrader for use with the Barron’s 400SM ETF.
The index is not actively managed and does not reflect any deductions for fees, expenses or taxes. One cannot invest directly in an index. Index performance does not reflect Fund performance.
Funds that emphasize investments in small/mid cap companies will generally experience greater price volatility.
Barron’s 400SM ETF shares are not individually redeemable. Investors buy and sell shares of the Barron’s 400SM ETF on a secondary market. Only market makers or “authorized participants” may trade directly with the Fund, typically in blocks of 50,000 shares.
The Barron’s 400SM ETF is not suitable for all investors. Investments in the Fund are subject to investment risks, including possible loss of the principal amount invested.
ALPS Portfolio Solutions Distributor, Inc., a FINRA member, is the distributor for the Fund.
Barron’s 400SM ETF
| Performance Overview | November 30, 2020 (Unaudited) |
Top 10 Holdings* (as of November 30, 2020)
| Enphase Energy, Inc. | 0.42% |
| Meta Financial Group, Inc. | 0.40% |
| Atkore International Group, Inc. | 0.35% |
| Digital Turbine, Inc. | 0.35% |
| Western Alliance Bancorp | 0.34% |
| Paycom Software, Inc. | 0.33% |
| Chart Industries, Inc. | 0.33% |
| MYR Group, Inc. | 0.33% |
| Lam Research Corp. | 0.32% |
| Etsy, Inc. | 0.32% |
| Total % of Top 10 Holdings | 3.49% |
| * | % of Total Investments (excluding investments purchased with collateral from securities loaned). |
Sector Allocation* (as of November 30, 2020)
Future holdings are subject to change.
Growth of $10,000 (as of November 30, 2020)
Comparison of change in value of a $10,000 investment in the Fund and the Underlying Index
The chart above compares historical performance of a hypothetical investment of $10,000 in the Fund since inception with the performance of the Fund’s benchmark index. Past performance does not guarantee future results. The chart does not reflect the deduction of taxes that a shareholder would pay on Fund distributions or the redemption of Fund shares.
Barron’s 400SM ETF
| Disclosure of Fund Expenses | November 30, 2020 (Unaudited) |
Shareholder Expense Example: As a shareholder of a Fund, you incur certain ongoing costs, including management fees and other Fund expenses. These examples are intended to help you understand your ongoing costs (in dollars) of investing in the Fund and to compare these costs with the ongoing costs of investing in other funds. It is based on an investment of $1,000 invested at the beginning of the (six month) period and held through November 30, 2020.
Actual Return: The first line of the table provides information about actual account values and actual expenses. You may use the information in this line, together with the amount you invested, to estimate the expenses that you incurred over the period. Simply divide your account value by $1,000 (for example, an $8,600 account value divided by $1,000 = 8.6), then multiply the result by the number in the first line under the heading entitled “Expenses Paid During Period” to estimate the expenses attributable to your investment during this period.
Hypothetical 5% Return: The second line of the table provides information about hypothetical account values and hypothetical expenses based on the Fund’s actual expense ratio and an assumed rate of return of 5% per year before expenses, which is not the Fund’s actual return. The hypothetical account values and expenses may not be used to estimate the actual ending account balance or expenses you paid for the period. You may use this information to compare ongoing costs of investing in the Fund and other funds. To do so, compare this 5% hypothetical example with the 5% hypothetical examples that appear in the shareholder reports of other funds.
The expenses shown in the table are meant to highlight ongoing Fund costs only and do not reflect any transaction costs, such as brokerage commissions and other fees to financial intermediaries. Therefore, the second line is useful in comparing ongoing costs only, and will not help you determine the relative total costs of owning different funds. In addition, if these costs were included, your costs would have been higher.
| | Beginning Account Value 6/1/20 | Ending Account Value 11/30/20 | Expense Ratio(a) | Expenses Paid During Period 6/1/20 - 11/30/20(b) |
| Barron's 400 ETF | | | | |
| Actual | $1,000.00 | $1,222.70 | 0.65% | $3.61 |
| Hypothetical (5% return before expenses) | $1,000.00 | $1,021.75 | 0.65% | $3.29 |
| (a) | Annualized, based on the Fund's most recent fiscal half year expenses. |
| (b) | Expenses are equal to the Fund's annualized expense ratio multiplied by the average account value over the period, multiplied by the number of days in the most recent fiscal half year (183), divided by 366. |
Barron’s 400SM ETF
Report of Independent Registered Public Accounting Firm
To the shareholders and the Board of Trustees of ALPS ETF Trust:
Opinion on the Financial Statements and Financial Highlights
We have audited the accompanying statement of assets and liabilities, including the statement of investments, of Barron’s 400SM ETF (the "Fund"), one of the funds constituting the ALPS ETF Trust, as of November 30, 2020, the related statement of operations for the year then ended, the statements of changes in net assets for each of the two years in the period then ended, and the financial highlights for each of the five years in the period then ended for the Fund, and the related notes.
In our opinion, the financial statements and financial highlights present fairly, in all material respects, the financial position of the Fund as of November 30, 2020, and the result of its operations for the year then ended, the changes in its net assets for each of the two years in the period then ended, and the financial highlights for each of the five years in the period then ended in conformity with accounting principles generally accepted in the United States of America.
Basis for Opinion
These financial statements and financial highlights are the responsibility of the Fund’s management. Our responsibility is to express an opinion on the Fund’s financial statements and financial highlights based on our audits. We are a public accounting firm registered with the Public Company Accounting Oversight Board (United States) (PCAOB) and are required to be independent with respect to the Fund in accordance with the U.S. federal securities laws and the applicable rules and regulations of the Securities and Exchange Commission and the PCAOB.
We conducted our audits in accordance with the standards of the PCAOB. Those standards require that we plan and perform the audit to obtain reasonable assurance about whether the financial statements and financial highlights are free of material misstatement, whether due to error or fraud. The Fund is not required to have, nor were we engaged to perform, an audit of its internal control over financial reporting. As part of our audit, we are required to obtain an understanding of internal control over financial reporting but not for the purpose of expressing an opinion on the effectiveness of the Fund’s internal control over financial reporting. Accordingly, we express no such opinion.
Our audit included performing procedures to assess the risks of material misstatement of the financial statements and financial highlights, whether due to error or fraud, and performing procedures that respond to those risks. Such procedures included examining, on a test basis, evidence regarding the amounts and disclosures in the financial statements and financial highlights. Our audit also included evaluating the accounting principles used and significant estimates made by management, as well as evaluating the overall presentation of the financial statements and financial highlights. Our procedures included confirmation of securities owned as of November 30, 2020, by correspondence with the custodian and brokers; when replies were not received from brokers, we performed other auditing procedures. We believe that our audit provide a reasonable basis for our opinion.
DELOITTE & TOUCHE LLP
Denver, Colorado
January 25, 2021
We have served as the auditor of one or more investment companies advised by ALPS Advisors, Inc. since 2007.
Barron’s 400SM ETF
| Schedule of Investments | November 30, 2020 |
| Security Description | | Shares | | | Value | |
| COMMON STOCKS (98.54%) | | | | | | | | |
| Communication Services (3.51%) | | | | | | | | |
| Activision Blizzard, Inc. | | | 3,168 | | | $ | 251,793 | |
| Alphabet, Inc., Class A(a) | | | 172 | | | | 301,757 | |
| Cable One, Inc. | | | 144 | | | | 285,216 | |
| CenturyLink, Inc. | | | 24,089 | | | | 251,730 | |
| Charter Communications, Inc., Class A(a) | | | 425 | | | | 277,096 | |
| Discovery, Inc., Class A(a)(b) | | | 11,114 | | | | 299,078 | |
| Electronic Arts, Inc.(a) | | | 2,063 | | | | 263,548 | |
| Facebook, Inc., Class A(a) | | | 972 | | | | 269,215 | |
| Netflix, Inc.(a) | | | 533 | | | | 261,543 | |
| Nexstar Media Group, Inc., Class A | | | 2,681 | | | | 282,175 | |
| Sciplay Corp., Class A(a)(b) | | | 17,130 | | | | 255,066 | |
| Take-Two Interactive Software, Inc.(a) | | | 1,648 | | | | 297,480 | |
| Verizon Communications, Inc. | | | 4,368 | | | | 263,871 | |
| ViacomCBS, Inc.(b) | | | 8,786 | | | | 309,970 | |
| World Wrestling Entertainment, Inc., Class A(b) | | | 6,432 | | | | 276,833 | |
| Total Communication Services | | | | | | | 4,146,371 | |
| | | | | | | | | |
| Consumer Discretionary (11.99%) | | | | | | | | |
| 1-800-Flowers.com, Inc., Class | | | | | | | | |
| A(a)(b) | | | 11,206 | | | | 262,669 | |
| Advance Auto Parts, Inc. | | | 1,687 | | | | 249,170 | |
| Amazon.com, Inc.(a) | | | 83 | | | | 262,947 | |
| America's Car-Mart, Inc.(a) | | | 2,991 | | | | 312,559 | |
| Best Buy Co., Inc. | | | 2,452 | | | | 266,778 | |
| Big Lots, Inc. | | | 5,545 | | | | 286,510 | |
| Buckle, Inc.(b) | | | 12,429 | | | | 333,346 | |
| Century Communities, Inc.(a) | | | 6,749 | | | | 300,330 | |
| Crocs, Inc.(a) | | | 6,210 | | | | 365,707 | |
| Deckers Outdoor Corp.(a) | | | 1,234 | | | | 314,164 | |
| Dollar General Corp. | | | 1,285 | | | | 280,875 | |
| Dollar Tree, Inc.(a) | | | 2,985 | | | | 326,081 | |
| Domino's Pizza, Inc. | | | 679 | | | | 266,555 | |
| DR Horton, Inc. | | | 3,688 | | | | 274,756 | |
| eBay, Inc. | | | 5,112 | | | | 257,798 | |
| Etsy, Inc.(a) | | | 2,384 | | | | 383,109 | |
| Grand Canyon Education, Inc.(a) | | | 3,085 | | | | 257,505 | |
| Green Brick Partners, Inc.(a) | | | 14,914 | | | | 324,678 | |
| Hanesbrands, Inc. | | | 16,851 | | | | 239,284 | |
| Helen of Troy, Ltd.(a) | | | 1,324 | | | | 267,435 | |
| Hibbett Sports, Inc.(a) | | | 6,897 | | | | 283,881 | |
| Home Depot, Inc. | | | 926 | | | | 256,882 | |
| Installed Building Products, Inc.(a) | | | 2,767 | | | | 273,435 | |
| Lennar Corp., Class B | | | 4,303 | | | | 261,192 | |
| LGI Homes, Inc.(a) | | | 2,390 | | | | 258,239 | |
| Lithia Motors, Inc., Class A | | | 1,097 | | | | 317,362 | |
| Lowe's Cos., Inc. | | | 1,566 | | | | 244,014 | |
| M/I Homes, Inc.(a) | | | 5,928 | | | | 269,428 | |
| MarineMax, Inc.(a) | | | 9,989 | | | | 328,039 | |
| MDC Holdings, Inc. | | | 5,666 | | | | 273,498 | |
| Meritage Homes Corp.(a) | | | 2,625 | | | | 236,644 | |
| Security Description | | Shares | | | Value | |
| Consumer Discretionary (continued) | | | | | | | | |
| Murphy USA, Inc. | | | 1,926 | | | $ | 246,913 | |
| NVR, Inc.(a) | | | 66 | | | | 263,814 | |
| Ollie's Bargain Outlet Holdings, | | | | | | | | |
| Inc.(a)(b) | | | 3,011 | | | | 265,149 | |
| O'Reilly Automotive, Inc.(a) | | | 554 | | | | 245,112 | |
| Pool Corp. | | | 858 | | | | 296,962 | |
| PulteGroup, Inc. | | | 5,876 | | | | 256,370 | |
| Rent-A-Center, Inc., Class A | | | 9,034 | | | | 305,530 | |
| Sportsman's Warehouse | | | | | | | | |
| Holdings, Inc.(a) | | | 18,855 | | | | 262,650 | |
| Stamps.com, Inc.(a) | | | 1,240 | | | | 232,450 | |
| Sturm Ruger & Co., Inc. | | | 4,221 | | | | 258,494 | |
| Target Corp. | | | 1,776 | | | | 318,845 | |
| Tempur Sealy International, Inc.(a) | | | 11,252 | | | | 283,438 | |
| TopBuild Corp.(a) | | | 1,704 | | | | 296,888 | |
| Tractor Supply Co. | | | 1,878 | | | | 264,441 | |
| TRI Pointe Group, Inc.(a) | | | 15,249 | | | | 266,553 | |
| Williams-Sonoma, Inc. | | | 2,845 | | | | 311,442 | |
| Wingstop, Inc. | | | 2,007 | | | | 255,511 | |
| XPEL, Inc.(a)(b)(c) | | | 9,640 | | | | 365,163 | |
| YETI Holdings, Inc.(a) | | | 5,500 | | | | 347,435 | |
| Total Consumer Discretionary | | | | | | | 14,178,030 | |
| | | | | | | | | |
| Consumer Staples (6.08%) | | | | | | | | |
| BJ's Wholesale Club Holdings, Inc.(a) | | | 6,632 | | | | 271,846 | |
| Boston Beer Co., Inc., Class A(a) | | | 302 | | | | 281,114 | |
| Brown-Forman Corp., Class B | | | 3,352 | | | | 270,372 | |
| Church & Dwight Co., Inc. | | | 2,867 | | | | 251,637 | |
| Clorox Co. | | | 1,263 | | | | 256,338 | |
| Coca-Cola Co. | | | 5,185 | | | | 267,546 | |
| Colgate-Palmolive Co. | | | 3,440 | | | | 294,602 | |
| Conagra Brands, Inc. | | | 7,657 | | | | 279,940 | |
| Darling Ingredients, Inc.(a) | | | 7,564 | | | | 365,190 | |
| General Mills, Inc. | | | 4,485 | | | | 272,778 | |
| Hershey Co. | | | 1,833 | | | | 271,082 | |
| Hormel Foods Corp. | | | 5,315 | | | | 250,762 | |
| J M Smucker Co. | | | 2,355 | | | | 276,006 | |
| Kellogg Co. | | | 4,033 | | | | 257,749 | |
| Kimberly-Clark Corp. | | | 1,807 | | | | 251,733 | |
| Kroger Co. | | | 7,940 | | | | 262,020 | |
| McCormick & Co., Inc. | | | 1,321 | | | | 247,001 | |
| Medifast, Inc. | | | 1,501 | | | | 306,414 | |
| Monster Beverage Corp.(a) | | | 3,130 | | | | 265,361 | |
| National Beverage Corp.(a)(b) | | | 3,545 | | | | 347,516 | |
| PepsiCo, Inc. | | | 1,952 | | | | 281,537 | |
| Procter & Gamble Co. | | | 1,909 | | | | 265,103 | |
| Sprouts Farmers Market, Inc.(a) | | | 12,844 | | | | 271,907 | |
| USANA Health Sciences, Inc.(a) | | | 3,473 | | | | 261,100 | |
| Wal-Mart Stores, Inc. | | | 1,926 | | | | 294,274 | |
| Weis Markets, Inc. | | | 5,589 | | | | 266,204 | |
| Total Consumer Staples | | | | | | | 7,187,132 | |
| | | | | | | | | |
| Energy (0.81%) | | | | | | | | |
| Cheniere Energy, Inc.(a) | | | 5,374 | | | | 304,652 | |
| Dorian LPG, Ltd.(a) | | | 29,744 | | | | 325,102 | |
Barron’s 400SM ETF
| Schedule of Investments | November 30, 2020 |
| Security Description | | Shares | | | Value | |
| Energy (continued) | | | | | | | | |
| Renewable Energy Group, Inc.(a) | | | 5,735 | | | $ | 333,089 | |
| Total Energy | | | | | | | 962,843 | |
| | | | | | | | | |
| Financials (20.68%) | | | | | | | | |
| Allstate Corp. | | | 2,791 | | | | 285,659 | |
| Artisan Partners Asset | | | | | | | | |
| Management, Inc., Class A | | | 6,797 | | | | 305,865 | |
| Associated Banc-Corp | | | 19,949 | | | | 305,619 | |
| BancFirst Corp. | | | 6,052 | | | | 328,200 | |
| Bancorp, Inc.(a) | | | 28,313 | | | | 334,093 | |
| BancorpSouth Bank | | | 12,989 | | | | 329,271 | |
| Bank of New York Mellon Corp. | | | 7,591 | | | | 296,960 | |
| BankUnited, Inc. | | | 11,391 | | | | 324,757 | |
| BlackRock, Inc. | | | 482 | | | | 336,605 | |
| Cathay General Bancorp | | | 11,480 | | | | 324,310 | |
| Central Pacific Financial Corp. | | | 17,899 | | | | 293,365 | |
| Charles Schwab Corp. | | | 7,479 | | | | 364,826 | |
| Comerica, Inc. | | | 6,522 | | | | 320,882 | |
| Community Bank System, Inc. | | | 4,561 | | | | 283,922 | |
| CVB Financial Corp. | | | 15,664 | | | | 297,459 | |
| East West Bancorp, Inc. | | | 7,781 | | | | 332,404 | |
| Encore Capital Group, Inc.(a) | | | 6,591 | | | | 225,017 | |
| Enstar Group, Ltd.(a) | | | 1,707 | | | | 323,101 | |
| FactSet Research Systems, Inc. | | | 786 | | | | 262,335 | |
| FB Financial Corp. | | | 9,782 | | | | 312,241 | |
| Federated Hermes, Inc. | | | 11,730 | | | | 314,833 | |
| Fidelity National Financial, Inc., Class A | | | 8,118 | | | | 292,167 | |
| First Busey Corp. | | | 15,563 | | | | 311,416 | |
| First Financial Bankshares, Inc. | | | 9,072 | | | | 303,186 | |
| First Foundation, Inc. | | | 18,194 | | | | 323,125 | |
| First Interstate BancSystem, Inc., Class A | | | 8,285 | | | | 315,244 | |
| First Merchants Corp. | | | 10,930 | | | | 364,188 | |
| First Republic Bank | | | 2,449 | | | | 317,292 | |
| Flagstar Bancorp, Inc. | | | 8,401 | | | | 294,371 | |
| Glacier Bancorp, Inc. | | | 7,742 | | | | 315,641 | |
| HarborOne Bancorp, Inc. | | | 30,676 | | | | 300,932 | |
| Hilltop Holdings, Inc. | | | 13,674 | | | | 329,407 | |
| Home BancShares, Inc. | | | 16,723 | | | | 309,543 | |
| HomeStreet, Inc. | | | 9,707 | | | | 314,022 | |
| Independent Bank Group, Inc. | | | 5,753 | | | | 322,801 | |
| Kinsale Capital Group, Inc. | | | 1,378 | | | | 330,941 | |
| Lakeland Financial Corp. | | | 5,979 | | | | 303,673 | |
| LPL Financial Holdings, Inc. | | | 3,285 | | | | 298,180 | |
| MarketAxess Holdings, Inc. | | | 570 | | | | 307,333 | |
| Meta Financial Group, Inc. | | | 14,260 | | | | 472,006 | |
| Moody's Corp. | | | 921 | | | | 260,035 | |
| Nasdaq, Inc. | | | 2,065 | | | | 264,299 | |
| National Bank Holdings Corp., Class A | | | 9,790 | | | | 315,042 | |
| Northern Trust Corp. | | | 3,361 | | | | 312,976 | |
| Old National Bancorp | | | 19,624 | | | | 310,648 | |
| OneMain Holdings, Inc. | | | 8,224 | | | | 320,654 | |
| Park National Corp.(b) | | | 2,966 | | | | 299,892 | |
| Security Description | | Shares | | | Value | |
| Financials (continued) | | | | | | | | |
| PennyMac Financial Services, Inc., Class A | | | 4,594 | | | $ | 264,798 | |
| PJT Partners, Inc., Class A | | | 4,596 | | | | 318,411 | |
| PNC Financial Services Group, Inc. | | | 2,378 | | | | 328,331 | |
| Preferred Bank | | | 7,892 | | | | 290,189 | |
| Primerica, Inc. | | | 2,169 | | | | 282,556 | |
| Progressive Corp. | | | 2,783 | | | | 242,427 | |
| Prosperity Bancshares, Inc. | | | 5,215 | | | | 327,658 | |
| S&P Global, Inc. | | | 740 | | | | 260,317 | |
| ServisFirst Bancshares, Inc. | | | 7,411 | | | | 279,988 | |
| Signature Bank/New York NY | | | 2,926 | | | | 328,268 | |
| Simmons First National Corp., Class A | | | 16,422 | | | | 320,229 | |
| Stifel Financial Corp. | | | 4,991 | | | | 345,876 | |
| Stock Yards Bancorp, Inc. | | | 6,629 | | | | 264,099 | |
| SVB Financial Group(a) | | | 1,066 | | | | 367,621 | |
| Synovus Financial Corp. | | | 11,877 | | | | 374,957 | |
| T Rowe Price Group, Inc. | | | 2,088 | | | | 299,440 | |
| TCF Financial Corp. | | | 10,442 | | | | 350,851 | |
| The Hartford Financial Services Group, Inc. | | | 7,063 | | | | 312,185 | |
| Towne Bank | | | 15,618 | | | | 339,692 | |
| Truist Financial Corp. | | | 6,717 | | | | 311,803 | |
| UMB Financial Corp. | | | 5,187 | | | | 352,768 | |
| United Bankshares, Inc. | | | 10,623 | | | | 311,041 | |
| Valley National Bancorp | | | 36,768 | | | | 336,060 | |
| Veritex Holdings, Inc. | | | 15,258 | | | | 330,946 | |
| Victory Capital Holdings, Inc., Class A(b) | | | 15,777 | | | | 323,902 | |
| Virtu Financial, Inc., Class A | | | 9,860 | | | | 224,709 | |
| Washington Trust Bancorp, Inc. | | | 7,848 | | | | 308,583 | |
| Webster Financial Corp. | | | 9,793 | | | | 370,567 | |
| Westamerica BanCorp | | | 4,706 | | | | 259,395 | |
| Western Alliance Bancorp | | | 7,777 | | | | 398,727 | |
| Zions Bancorp NA | | | 8,495 | | | | 327,822 | |
| Total Financials | | | | | | | 24,464,954 | |
| | | | | | | | | |
| Health Care (12.80%) | | | | | | | | |
| Abbott Laboratories | | | 2,483 | | | | 268,710 | |
| AbbVie, Inc. | | | 2,912 | | | | 304,537 | |
| Addus HomeCare Corp.(a) | | | 2,778 | | | | 275,716 | |
| Alexion Pharmaceuticals, Inc.(a) | | | 2,290 | | | | 279,632 | |
| Align Technology, Inc.(a) | | | 789 | | | | 379,738 | |
| Amedisys, Inc.(a) | | | 1,105 | | | | 270,493 | |
| AmerisourceBergen Corp. | | | 2,789 | | | | 287,574 | |
| Amgen, Inc. | | | 1,066 | | | | 236,695 | |
| Anthem, Inc. | | | 1,017 | | | | 316,816 | |
| Bio-Rad Laboratories, Inc., Class A(a) | | | 509 | | | | 274,096 | |
| Boston Scientific Corp.(a) | | | 6,308 | | | | 209,110 | |
| Catalent, Inc.(a) | | | 3,139 | | | | 301,783 | |
| Catalyst Pharmaceuticals, Inc.(a) | | | 78,789 | | | | 288,368 | |
| Charles River Laboratories International, Inc.(a) | | | 1,175 | | | | 275,561 | |
| Chemed Corp. | | | 535 | | | | 255,864 | |
Barron’s 400SM ETF
| Schedule of Investments | November 30, 2020 |
| Security Description | | Shares | | | Value | |
| Health Care (continued) | | | | | | | | |
| Coherus Biosciences, Inc.(a)(b) | | | 13,984 | | | $ | 258,145 | |
| Corcept Therapeutics, Inc.(a) | | | 14,659 | | | | 331,880 | |
| CVS Health Corp. | | | 4,554 | | | | 308,716 | |
| Danaher Corp. | | | 1,268 | | | | 284,831 | |
| DaVita, Inc.(a) | | | 2,946 | | | | 323,618 | |
| DexCom, Inc.(a) | | | 665 | | | | 212,587 | |
| Eli Lilly & Co. | | | 1,764 | | | | 256,927 | |
| Emergent BioSolutions, Inc.(a) | | | 2,576 | | | | 211,052 | |
| Ensign Group, Inc. | | | 4,814 | | | | 345,982 | |
| Exelixis, Inc.(a) | | | 10,334 | | | | 197,999 | |
| HCA Healthcare, Inc. | | | 1,949 | | | | 292,564 | |
| Hologic, Inc.(a) | | | 4,267 | | | | 294,978 | |
| Humana, Inc. | | | 662 | | | | 265,144 | |
| ICU Medical, Inc.(a) | | | 1,379 | | | | 260,217 | |
| IDEXX Laboratories, Inc.(a) | | | 717 | | | | 330,523 | |
| Innoviva, Inc.(a) | | | 23,187 | | | | 242,420 | |
| Intuitive Surgical, Inc.(a) | | | 370 | | | | 268,638 | |
| Johnson & Johnson | | | 1,777 | | | | 257,096 | |
| Masimo Corp.(a) | | | 1,184 | | | | 301,316 | |
| Medpace Holdings, Inc.(a) | | | 2,204 | | | | 282,905 | |
| Merck & Co., Inc. | | | 3,143 | | | | 252,666 | |
| Meridian Bioscience, Inc.(a) | | | 17,346 | | | | 327,839 | |
| Mettler-Toledo International, Inc.(a) | | | 265 | | | | 304,761 | |
| Molina Healthcare, Inc.(a) | | | 1,456 | | | | 297,213 | |
| PerkinElmer, Inc. | | | 2,233 | | | | 296,989 | |
| Pfizer, Inc. | | | 7,564 | | | | 289,777 | |
| Quidel Corp.(a) | | | 1,609 | | | | 313,835 | |
| Regeneron Pharmaceuticals, Inc.(a) | | | 456 | | | | 235,310 | |
| ResMed, Inc. | | | 1,508 | | | | 316,077 | |
| Supernus Pharmaceuticals, Inc.(a) | | | 12,055 | | | | 256,772 | |
| Teleflex, Inc. | | | 716 | | | | 274,049 | |
| Thermo Fisher Scientific, Inc. | | | 608 | | | | 282,708 | |
| UnitedHealth Group, Inc. | | | 861 | | | | 289,589 | |
| Vanda Pharmaceuticals, Inc.(a) | | | 27,491 | | | | 335,665 | |
| Veeva Systems, Inc., Class A(a) | | | 948 | | | | 262,473 | |
| Vertex Pharmaceuticals, Inc.(a) | | | 991 | | | | 225,700 | |
| Viemed Healthcare, Inc.(a)(b) | | | 31,893 | | | | 310,957 | |
| West Pharmaceutical Services, Inc. | | | 930 | | | | 255,899 | |
| Zoetis, Inc. | | | 1,630 | | | | 261,419 | |
| Total Health Care | | | | | | | 15,141,929 | |
| | | | | | | | | |
| Industrials (17.02%) | | | | | | | | |
| 3M Co. | | | 1,589 | | | | 274,468 | |
| AAON, Inc. | | | 4,612 | | | | 300,380 | |
| Advanced Drainage Systems, Inc. | | | 4,498 | | | | 313,736 | |
| Aerojet Rocketdyne Holdings, Inc.(a)(b) | | | 6,564 | | | | 245,691 | |
| AeroVironment, Inc.(a) | | | 4,081 | | | | 348,477 | |
| Air Lease Corp. | | | 8,317 | | | | 304,153 | |
| AMETEK, Inc. | | | 2,587 | | | | 306,637 | |
| Arcosa, Inc. | | | 5,946 | | | | 308,538 | |
| Atkore International Group, Inc.(a) | | | 10,538 | | | | 410,771 | |
| Security Description | | Shares | | | Value | |
| Industrials (continued) | | | | | | | | |
| BMC Stock Holdings, Inc.(a) | | | 6,257 | | | $ | 306,218 | |
| Builders FirstSource, Inc.(a) | | | 8,126 | | | | 303,994 | |
| BWX Technologies, Inc. | | | 4,628 | | | | 263,241 | |
| Caterpillar, Inc. | | | 1,781 | | | | 309,164 | |
| Chart Industries, Inc.(a) | | | 3,758 | | | | 388,427 | |
| Cintas Corp. | | | 806 | | | | 286,372 | |
| Comfort Systems USA, Inc. | | | 5,084 | | | | 256,183 | |
| Copart, Inc.(a) | | | 2,519 | | | | 290,819 | |
| CoStar Group, Inc.(a) | | | 309 | | | | 281,366 | |
| CSW Industrials, Inc. | | | 3,564 | | | | 382,382 | |
| Cummins, Inc. | | | 1,260 | | | | 291,274 | |
| Deere & Co. | | | 1,226 | | | | 320,746 | |
| Dover Corp. | | | 2,311 | | | | 282,011 | |
| Emerson Electric Co. | | | 3,870 | | | | 297,293 | |
| Expeditors International of Washington, Inc. | | | 2,837 | | | | 253,543 | |
| Exponent, Inc. | | | 3,443 | | | | 285,803 | |
| Fastenal Co. | | | 5,925 | | | | 292,991 | |
| Federal Signal Corp. | | | 8,533 | | | | 264,779 | |
| Fortune Brands Home & Security, Inc. | | | 3,148 | | | | 262,858 | |
| FTI Consulting, Inc.(a) | | | 2,480 | | | | 260,450 | |
| Generac Holdings, Inc.(a) | | | 1,415 | | | | 305,074 | |
| General Dynamics Corp. | | | 1,824 | | | | 272,414 | |
| Gibraltar Industries, Inc.(a) | | | 4,177 | | | | 273,426 | |
| Great Lakes Dredge & Dock Corp.(a) | | | 29,123 | | | | 328,799 | |
| HEICO Corp., Class A | | | 2,855 | | | | 316,191 | |
| Honeywell International, Inc. | | | 1,573 | | | | 320,766 | |
| Hubbell, Inc. | | | 1,843 | | | | 297,810 | |
| Illinois Tool Works, Inc. | | | 1,332 | | | | 281,172 | |
| Insperity, Inc. | | | 3,920 | | | | 335,160 | |
| ITT, Inc. | | | 4,091 | | | | 297,129 | |
| JB Hunt Transport Services, Inc. | | | 1,990 | | | | 269,207 | |
| John Bean Technologies Corp. | | | 2,654 | | | | 293,426 | |
| Kforce, Inc. | | | 8,007 | | | | 328,687 | |
| L3Harris Technologies, Inc. | | | 1,480 | | | | 284,145 | |
| Lockheed Martin Corp. | | | 674 | | | | 246,010 | |
| McGrath RentCorp | | | 4,378 | | | | 278,616 | |
| MSA Safety, Inc. | | | 2,051 | | | | 306,501 | |
| MYR Group, Inc.(a) | | | 7,516 | | | | 384,293 | |
| National Presto Industries, Inc. | | | 3,122 | | | | 265,526 | |
| Nordson Corp. | | | 1,333 | | | | 271,679 | |
| Northrop Grumman Corp. | | | 782 | | | | 236,367 | |
| Old Dominion Freight Line, Inc. | | | 1,340 | | | | 272,502 | |
| PACCAR, Inc. | | | 3,086 | | | | 268,667 | |
| Parker-Hannifin Corp. | | | 1,261 | | | | 337,015 | |
| Rockwell Automation, Inc. | | | 1,177 | | | | 300,794 | |
| Roper Technologies, Inc. | | | 655 | | | | 279,685 | |
| Simpson Manufacturing Co., Inc. | | | 2,634 | | | | 242,065 | |
| Sterling Construction Co., Inc.(a) | | | 19,788 | | | | 316,410 | |
| Teledyne Technologies, Inc.(a) | | | 827 | | | | 312,556 | |
| The Timken Co. | | | 4,597 | | | | 337,604 | |
| Toro Co. | | | 3,141 | | | | 284,920 | |
| TransUnion | | | 3,026 | | | | 275,638 | |
Barron’s 400SM ETF
| Schedule of Investments | November 30, 2020 |
| Security Description | | Shares | | | Value | |
| Industrials (continued) | | | | | | | | |
| Trex Co., Inc.(a) | | | 3,788 | | | $ | 283,418 | |
| TriNet Group, Inc.(a) | | | 4,277 | | | | 320,775 | |
| UFP Industries, Inc. | | | 4,709 | | | | 252,638 | |
| Union Pacific Corp. | | | 1,308 | | | | 266,937 | |
| United Parcel Service, Inc., Class B | | | 1,638 | | | | 280,213 | |
| Watts Water Technologies, Inc., Class A | | | 2,642 | | | | 309,510 | |
| WW Grainger, Inc. | | | 746 | | | | 312,052 | |
| Total Industrials | | | | | | | 20,138,562 | |
| | | | | | | | | |
| Information Technology (19.25%) | | | | | | | | |
| Acacia Communications, Inc.(a) | | | 3,856 | | | | 268,686 | |
| ACI Worldwide, Inc.(a) | | | 9,881 | | | | 321,923 | |
| Adobe, Inc.(a) | | | 531 | | | | 254,068 | |
| Advanced Micro Devices, Inc.(a) | | | 3,354 | | | | 310,782 | |
| Akamai Technologies, Inc.(a) | | | 2,431 | | | | 251,633 | |
| Alarm.com Holdings, Inc.(a) | | | 4,607 | | | | 349,717 | |
| Amdocs, Ltd. | | | 4,523 | | | | 297,659 | |
| Amkor Technology, Inc.(a) | | | 23,201 | | | | 341,983 | |
| Amphenol Corp., Class A | | | 2,443 | | | | 319,569 | |
| ANSYS, Inc.(a) | | | 798 | | | | 269,772 | |
| Apple, Inc. | | | 2,291 | | | | 272,744 | |
| Applied Materials, Inc. | | | 4,627 | �� | | | 381,635 | |
| Arista Networks, Inc.(a) | | | 1,282 | | | | 347,037 | |
| Aspen Technology, Inc.(a) | | | 2,047 | | | | 275,219 | |
| Autodesk, Inc.(a) | | | 1,122 | | | | 314,418 | |
| Axcelis Technologies, Inc.(a) | | | 12,152 | | | | 327,861 | |
| Booz Allen Hamilton Holding Corp. | | | 3,156 | | | | 273,909 | |
| Broadcom, Inc. | | | 721 | | | | 289,539 | |
| Broadridge Financial Solutions, Inc. | | | 1,951 | | | | 286,563 | |
| CACI International, Inc., Class A(a) | | | 1,175 | | | | 278,816 | |
| Cadence Design Systems, Inc.(a) | | | 2,516 | | | | 292,611 | |
| CDW Corp. | | | 2,318 | | | | 302,476 | |
| Ciena Corp.(a) | | | 6,360 | | | | 284,928 | |
| Citrix Systems, Inc. | | | 1,947 | | | | 241,272 | |
| Cognizant Technology Solutions Corp., Class A | | | 3,775 | | | | 294,941 | |
| Digital Turbine, Inc.(a) | | | 9,073 | | | | 408,104 | |
| Enphase Energy, Inc.(a)(b) | | | 3,669 | | | | 501,075 | |
| Entegris, Inc. | | | 3,837 | | | | 355,383 | |
| EPAM Systems, Inc.(a) | | | 790 | | | | 254,641 | |
| Fair Isaac Corp.(a) | | | 607 | | | | 286,977 | |
| FleetCor Technologies, Inc.(a) | | | 1,139 | | | | 302,074 | |
| Fortinet, Inc.(a) | | | 2,239 | | | | 275,912 | |
| Gartner, Inc.(a) | | | 1,973 | | | | 299,896 | |
| International Business Machines Corp. | | | 2,162 | | | | 267,050 | |
| Intuit, Inc. | | | 821 | | | | 289,008 | |
| j2 Global, Inc.(a)(b) | | | 3,653 | | | | 327,345 | |
| Jack Henry & Associates, Inc. | | | 1,656 | | | | 266,384 | |
| Keysight Technologies, Inc.(a) | | | 2,751 | | | | 330,230 | |
| KLA Corp. | | | 1,464 | | | | 368,884 | |
| Lam Research Corp. | | | 847 | | | | 383,403 | |
| Leidos Holdings, Inc. | | | 2,982 | | | | 300,287 | |
| Security Description | | Shares | | | Value | |
| Information Technology (continued) | | | | | | | | |
| ManTech International Corp., Class A | | | 3,608 | | | $ | 277,708 | |
| Maxim Integrated Products, Inc. | | | 3,886 | | | | 322,693 | |
| Methode Electronics, Inc. | | | 9,397 | | | | 329,083 | |
| Microsoft Corp. | | | 1,243 | | | | 266,089 | |
| Mitek Systems, Inc.(a) | | | 20,894 | | | | 246,131 | |
| MKS Instruments, Inc. | | | 2,491 | | | | 343,708 | |
| Monolithic Power Systems, Inc. | | | 1,023 | | | | 327,319 | |
| NetApp, Inc. | | | 5,833 | | | | 310,957 | |
| NVIDIA Corp. | | | 509 | | | | 272,855 | |
| Oracle Corp. | | | 4,254 | | | | 245,541 | |
| Paychex, Inc. | | | 3,354 | | | | 312,425 | |
| Paycom Software, Inc.(a) | | | 945 | | | | 394,141 | |
| PayPal Holdings, Inc.(a) | | | 1,423 | | | | 304,693 | |
| Power Integrations, Inc. | | | 4,815 | | | | 343,743 | |
| Qorvo, Inc.(a) | | | 2,036 | | | | 319,000 | |
| Qualys, Inc.(a) | | | 2,688 | | | | 255,387 | |
| salesforce.com, Inc.(a) | | | 1,051 | | | | 258,336 | |
| ServiceNow, Inc.(a) | | | 558 | | | | 298,279 | |
| Skyworks Solutions, Inc. | | | 1,878 | | | | 265,117 | |
| SPS Commerce, Inc.(a) | | | 3,467 | | | | 357,344 | |
| SS&C Technologies Holdings, Inc. | | | 4,321 | | | | 297,674 | |
| Sykes Enterprises, Inc.(a) | | | 8,100 | | | | 304,803 | |
| SYNNEX Corp. | | | 2,013 | | | | 322,704 | |
| Synopsys, Inc.(a) | | | 1,255 | | | | 285,513 | |
| Teradyne, Inc. | | | 3,428 | | | | 378,246 | |
| Texas Instruments, Inc. | | | 1,881 | | | | 303,311 | |
| Trimble, Inc.(a) | | | 5,082 | | | | 304,259 | |
| TTEC Holdings, Inc. | | | 4,743 | | | | 320,911 | |
| Tyler Technologies, Inc.(a) | | | 787 | | | | 336,521 | |
| VeriSign, Inc.(a) | | | 1,295 | | | | 259,932 | |
| VMware, Inc., Class A(a) | | | 1,849 | | | | 258,657 | |
| Zebra Technologies Corp., Class A(a) | | | 1,008 | | | | 381,447 | |
| Zoom Video Communications, Inc., Class A(a) | | | 634 | | | | 303,280 | |
| Total Information Technology | | | | | | | 22,774,221 | |
| | | | | | | | | |
| Materials (4.24%) | | | | | | | | |
| Air Products and Chemicals, Inc. | | | 871 | | | | 244,002 | |
| Balchem Corp. | | | 2,754 | | | | 285,562 | |
| Berry Global Group, Inc.(a) | | | 5,134 | | | | 272,102 | |
| Celanese Corp. | | | 2,399 | | | | 310,263 | |
| Commercial Metals Co. | | | 12,764 | | | | 254,131 | |
| Compass Minerals International, Inc. | | | 4,545 | | | | 283,881 | |
| Crown Holdings, Inc.(a) | | | 3,495 | | | | 329,404 | |
| Eagle Materials, Inc. | | | 3,078 | | | | 280,067 | |
| FMC Corp. | | | 2,368 | | | | 274,712 | |
| FutureFuel Corp. | | | 21,809 | | | | 261,490 | |
| Ingevity Corp.(a) | | | 4,637 | | | | 308,731 | |
| Martin Marietta Materials, Inc. | | | 1,214 | | | | 322,475 | |
| Newmont Corp. | | | 3,919 | | | | 230,516 | |
| RPM International, Inc. | | | 3,108 | | | | 273,535 | |
Barron’s 400SM ETF
| Schedule of Investments | November 30, 2020 |
| Security Description | | Shares | | | Value | |
| Materials (continued) | | | | | | | | |
| Scotts Miracle-Gro Co. | | | 1,648 | | | $ | 289,669 | |
| Sherwin-Williams Co. | | | 370 | | | | 276,623 | |
| Silgan Holdings, Inc. | | | 7,185 | | | | 242,853 | |
| Vulcan Materials Co. | | | 1,973 | | | | 275,529 | |
| Total Materials | | | | | | | 5,015,545 | |
| | | | | | | | | |
| Utilities (2.16%) | | | | | | | | |
| Alliant Energy Corp. | | | 5,017 | | | | 263,894 | |
| American States Water Co. | | | 3,652 | | | | 269,591 | |
| Entergy Corp. | | | 2,742 | | | | 298,467 | |
| NRG Energy, Inc. | | | 8,651 | | | | 283,320 | |
| PPL Corp. | | | 9,550 | | | | 271,411 | |
| Public Service Enterprise Group, Inc. | | | 5,125 | | | | 298,685 | |
| Sempra Energy | | | 2,250 | | | | 286,830 | |
| Southern Co. | | | 4,993 | | | | 298,831 | |
| UGI Corp. | | | 8,061 | | | | 286,004 | |
| Total Utilities | | | | | | | 2,557,033 | |
| | | | | | | | | |
| TOTAL COMMON STOCKS | | | | | | | | |
| (Cost $88,248,436) | | | | | | | 116,566,620 | |
| Security Description | | Shares | | | Value | |
| LIMITED PARTNERSHIPS (1.24%) | | | | | | | | |
| Energy (1.24%) | | | | | | | | |
| BP Midstream Partners LP | | | 25,069 | | | | 284,283 | |
| Hess Midstream LP, Class A | | | 16,015 | | | | 288,750 | |
| Magellan Midstream Partners LP | | | 7,178 | | | | 295,375 | |
| Noble Midstream Partners LP | | | 34,414 | | | | 327,965 | |
| Shell Midstream Partners LP | | | 26,466 | | | | 271,541 | |
| Total Energy | | | | | | | 1,467,914 | |
| | | | | | | | | |
| TOTAL LIMITED PARTNERSHIPS | | | | | | | | |
| (Cost $1,426,981) | | | | | | | 1,467,914 | |
| | | 7 Day Yield | | | Shares | | | Value | |
| SHORT TERM INVESTMENTS (1.25%) | | | | | | | | | | | | |
| Money Market Fund (0.15%) | | | | | | | | | | | | |
| State Street Institutional | | | | | | | | | | | | |
| Treasury Plus Money | | | | | | | | | | | | |
| Market Fund | | | | | | | | | | | | |
| (Cost $177,041) | | | 0.01 | % | | | 177,041 | | | $ | 177,041 | |
| | | | | | | | | | | | | |
| Investments Purchased with Collateral from Securities Loaned (1.10%) | | | | | | | | | | | | |
| State Street Navigator | | | | | | | | | | | | |
| Securities Lending | | | | | | | | | | | | |
| Government Money | | | | | | | | | | | | |
| Market Portfolio, 0.11% | | | | | | | | | | | | |
| (Cost $1,302,973) | | | | | | | 1,302,973 | | | | 1,302,973 | |
| TOTAL SHORT TERM INVESTMENTS | | | | | | |
| (Cost $1,480,014) | | | | | | | | | | | 1,480,014 | |
| | | | | | | | | | | | | |
| TOTAL INVESTMENTS (101.03%) | | | | | | | | | | | | |
| (Cost $91,155,431) | | | | | | | | | | $ | 119,514,548 | |
| LIABILITIES IN EXCESS OF OTHER ASSETS (-1.03%) | | | (1,221,429 | ) |
| NET ASSETS - 100.00% | | | | | | | | | | $ | 118,293,119 | |
| (a) | Non-income producing security. |
| (b) | Security, or a portion of the security position is currently on loan. The total market value of securities on loan is $2,921,697. |
| (c) | Securities were purchased pursuant to Regulation S under the Securities Act of 1933, which exempts securities offered and sold outside of the United States from registration. Such securities cannot be sold in the United States without either an effective registration statement filed pursuant to the Securities Act of 1933, or pursuant to an exemption from registration. As of November 30, 2020, the market value of those securities was $365,163 representing 0.31% of net assets. |
See Notes to Financial Statements.
Barron’s 400SM ETF
| Statement of Assets and Liabilities | November 30, 2020 |
| ASSETS: | | | |
| Investments, at value | | $ | 119,514,548 | |
| Dividends receivable | | | 143,819 | |
| Total Assets | | | 119,658,367 | |
| | | | | |
| LIABILITIES: | | | | |
| Payable to adviser | | | 62,275 | |
| Payable for collateral upon return of securities loaned | | | 1,302,973 | |
| Total Liabilities | | | 1,365,248 | |
| NET ASSETS | | $ | 118,293,119 | |
| | | | | |
| NET ASSETS CONSIST OF: | | | | |
| Paid-in capital | | $ | 144,610,092 | |
| Total distributable earnings | | | (26,316,973 | ) |
| NET ASSETS | | $ | 118,293,119 | |
| | | | | |
| INVESTMENTS, AT COST | | $ | 91,155,431 | |
| | | | | |
| PRICING OF SHARES | | | | |
| Net Assets | | $ | 118,293,119 | |
| Shares of beneficial interest outstanding (Unlimited number of shares authorized, par value $0.01 per share) | | | 2,500,000 | |
| Net Asset Value, offering and redemption price per share | | $ | 47.32 | |
See Notes to Financial Statements.
Barron’s 400SM ETF
| Statement of Operations | For the Year Ended November 30, 2020 |
| INVESTMENT INCOME: | | | |
| Dividends(a) | | $ | 1,993,922 | |
| Securities Lending Income | | | 24,519 | |
| Total Investment Income | | | 2,018,441 | |
| | | | | |
| EXPENSES: | | | | |
| Investment adviser fees | | | 759,334 | |
| Net Expenses | | | 759,334 | |
| NET INVESTMENT INCOME | | | 1,259,107 | |
| | | | | |
| REALIZED AND UNREALIZED GAIN/(LOSS): | | | | |
| Net realized loss on investments | | | (6,883,800 | ) |
| Net change in unrealized appreciation on investments | | | 14,975,635 | |
| NET REALIZED AND UNREALIZED GAIN ON INVESTMENTS | | | 8,091,835 | |
| NET INCREASE IN NET ASSETS RESULTING FROM OPERATIONS | | $ | 9,350,942 | |
| (a) | Net of foreign tax withholding of $660. |
See Notes to Financial Statements.
Barron’s 400SM ETF
Statements of Changes in Net Assets
| | | For the Year Ended November 30, 2020 | | | For the Year Ended November 30, 2019 | |
| OPERATIONS: | | | | | | | | |
| Net investment income | | $ | 1,259,107 | | | $ | 1,674,201 | |
| Net realized loss | | | (6,883,800 | ) | | | (13,333,969 | ) |
| Net change in unrealized appreciation | | | 14,975,635 | | | | 18,178,162 | |
| Net increase in net assets resulting from operations | | | 9,350,942 | | | | 6,518,394 | |
| | | | | | | | | |
| DISTRIBUTIONS TO SHAREHOLDERS: | | | | | | | | |
| From distributable earnings | | | (1,017,716 | ) | | | (1,353,834 | ) |
| Total distributions | | | (1,017,716 | ) | | | (1,353,834 | ) |
| | | | | | | | | |
| CAPITAL SHARE TRANSACTIONS: | | | | | | | | |
| Cost of shares redeemed | | | (37,189,939 | ) | | | (21,723,092 | ) |
| Net decrease from capital share transactions | | | (37,189,939 | ) | | | (21,723,092 | ) |
| Net decrease in net assets | | | (28,856,713 | ) | | | (16,558,532 | ) |
| | | | | | | | | |
| NET ASSETS: | | | | | | | | |
| Beginning of year | | | 147,149,832 | | | | 163,708,364 | |
| End of year | | $ | 118,293,119 | | | $ | 147,149,832 | |
| | | | | | | | | |
| OTHER INFORMATION: | | | | | | | | |
| CAPITAL SHARE TRANSACTIONS: | | | | | | | | |
| Beginning shares | | | 3,500,000 | | | | 4,050,000 | |
| Shares sold | | | – | | | | – | |
| Shares redeemed | | | (1,000,000 | ) | | | (550,000 | ) |
| Shares outstanding, end of period | | | 2,500,000 | | | | 3,500,000 | |
See Notes to Financial Statements.
Barron’s 400SM ETF
| Financial Highlights | For a Share Outstanding Throughout the Periods Presented |
| | | For the Year Ended November 30, 2020 | | | For the Year Ended November 30, 2019 | | | For the Year Ended November 30, 2018 | | | For the Year Ended November 30, 2017 | | | For the Year Ended November 30, 2016 | |
| NET ASSET VALUE, BEGINNING OF PERIOD | | $ | 42.04 | | | $ | 40.42 | | | $ | 41.54 | | | $ | 34.35 | | | $ | 31.75 | |
| | | | | | | | | | | | | | | | | | | | | |
| INCOME FROM OPERATIONS: | | | | | | | | | | | | | | | | | | | | |
| Net investment income(a) | | | 0.43 | | | | 0.44 | | | | 0.40 | | | | 0.29 | | | | 0.33 | |
| Net realized and unrealized gain/(loss) | | | 5.14 | | | | 1.51 | | | | (1.27 | ) | | | 7.17 | | | | 2.53 | |
| Total from investment operations | | | 5.57 | | | | 1.95 | | | | (0.87 | ) | | | 7.46 | | | | 2.86 | |
| | | | | | | | | | | | | | | | | | | | | |
| DISTRIBUTIONS: | | | | | | | | | | | | | | | | | | | | |
| From net investment income | | | (0.29 | ) | | | (0.33 | ) | | | (0.25 | ) | | | (0.27 | ) | | | (0.26 | ) |
| Total distributions | | | (0.29 | ) | | | (0.33 | ) | | | (0.25 | ) | | | (0.27 | ) | | | (0.26 | ) |
| | | | | | | | | | | | | | | | | | | | | |
| NET INCREASE/(DECREASE) IN NET ASSET VALUE | | | 5.28 | | | | 1.62 | | | | (1.12 | ) | | | 7.19 | | | | 2.60 | |
| NET ASSET VALUE, END OF PERIOD | | $ | 47.32 | | | $ | 42.04 | | | $ | 40.42 | | | $ | 41.54 | | | $ | 34.35 | |
| TOTAL RETURN(b) | | | 13.33 | % | | | 5.00 | % | | | (2.12 | )% | | | 21.87 | % | | | 9.12 | % |
| | | | | | | | | | | | | | | | | | | | | |
| RATIOS/SUPPLEMENTAL DATA: | | | | | | | | | | | | | | | | | | | | |
| Net assets, end of period (in 000s) | | $ | 118,293 | | | $ | 147,150 | | | $ | 163,708 | | | $ | 205,601 | | | $ | 178,612 | |
| | | | | | | | | | | | | | | | | | | | | |
| RATIOS TO AVERAGE NET ASSETS | | | | | | | | | | | | | | | | | | | | |
| Ratio of expenses to average net assets | | | 0.65 | % | | | 0.65 | % | | | 0.65 | % | | | 0.65 | % | | | 0.65 | % |
| Ratio of net investment income to average net assets | | | 1.08 | % | | | 1.10 | % | | | 0.93 | % | | | 0.78 | % | | | 1.07 | % |
| Portfolio turnover rate(c) | | | 83 | % | | | 109 | % | | | 88 | % | | | 84 | % | | | 88 | % |
| (a) | Based on average shares outstanding during the period. |
| (b) | Total return is calculated assuming an initial investment made at the net asset value at the beginning of the period and redemption at the net asset value on the last day of the period and assuming all distributions are reinvested at the reinvestment prices. |
| (c) | Portfolio turnover for periods less than one year are not annualized and does not include securities received or delivered from processing creations or redemptions in-kind. |
See Notes to Financial Statements.
Barron’s 400SM ETF
| Notes to Financial Statements | November 30, 2020 |
1. ORGANIZATION
ALPS ETF Trust (the “Trust”), a Delaware statutory trust, is an open-end management investment company registered under the Investment Company Act of 1940, as amended (the “1940 Act”). As of November 30, 2020, the Trust consisted of sixteen separate portfolios. Each portfolio represents a separate series of the Trust. This report pertains solely to the Barron’s 400SM ETF (the “Fund”). The investment objective of the Fund is to seek investment results that correspond generally, before fees and expenses, to the performance of the Barron’s 400 IndexSM (the “Underlying Index”). The Fund has elected to qualify as a diversified series of the Trust under the 1940 Act.
The Fund’s Shares (“Shares”) are listed on the NYSE Arca, Inc. (the “NYSE Arca”). The Fund issues and redeems Shares at net asset value (“NAV”) in blocks of 50,000 Shares, each of which is called a “Creation Unit”. Creation Units are issued and redeemed principally in-kind for securities included in the Underlying Index. Except when aggregated in Creation Units, Shares are not redeemable securities of the Fund.
Pursuant to the Trust’s organizational documents, its Officers and Trustees are indemnified against certain liability arising out of the performance of their duties to the Trust. Additionally, in the normal course of business, the Trust enters into contracts with service providers that contain general indemnification clauses. The Trust’s maximum exposure under these arrangements is unknown, as this would involve future claims that may be made against the Trust that have not yet occurred.
2. SIGNIFICANT ACCOUNTING POLICIES
The following is a summary of significant accounting policies consistently followed by the Fund in the preparation of the financial statements. The accompanying financial statements were prepared in accordance with accounting principles generally accepted in the United States of America (“U.S. GAAP”). The preparation of financial statements in conformity with U.S. GAAP requires management to make certain estimates and assumptions that affect the reported amounts of assets and liabilities and disclosures of contingent assets and liabilities at the date of the financial statements and the reported amounts of revenue and expenses during the period. Actual results could differ from those estimates. The Fund is considered an investment company under U.S. GAAP and follows the accounting and reporting guidance applicable to investment companies in the Financial Accounting Standards Board (“FASB”) Accounting Standards Codification Topic 946.
A. Portfolio Valuation
The Fund’s NAV is determined daily, as of the close of regular trading on the New York Stock Exchange (the “NYSE”), normally 4:00 p.m. Eastern time, on each day the NYSE is open for trading. The NAV is computed by dividing the value of all assets of the Fund (including accrued interest and dividends), less all liabilities (including accrued expenses and dividends declared but unpaid), by the total number of shares outstanding.
Portfolio securities listed on any exchange other than the NASDAQ Stock Market LLC (“NASDAQ”) are valued at the last sale price on the business day as of which such value is being determined. If there has been no sale on such day, the securities are valued at the mean of the most recent bid and ask prices on such day. Securities traded on the NASDAQ are valued at the NASDAQ Official Closing Price as determined by NASDAQ. Portfolio securities traded on more than one securities exchange are valued at the last sale price on the business day as of which such value is being determined at the close of the exchange representing the principal market for such securities. Portfolio securities traded in the over-the-counter market, but excluding securities traded on the NASDAQ, are valued at the latest quoted sale price in such market.
The Fund’s investments are valued at market value or, in the absence of market value with respect to any portfolio securities, at fair value according to procedures adopted by the Trust’s Board of Trustees (the “Board”). When market quotations are not readily available or when events occur that make established valuation methods unreliable, securities of the Fund may be valued in good faith by or under the direction of the Board. These securities generally include, but are not limited to, restricted securities (securities which may not be publicly sold without registration under the Securities Act of 1933) for which a pricing service is unable to provide a market price; securities whose trading has been formally suspended; a security whose market price is not available from a pre-established primary pricing source or the pricing source is not willing to provide a price; a security with respect to which an event has occurred that is most likely to materially affect the value of the security after the market has closed but before the calculation of the Fund’s NAV or make it difficult or impossible to obtain a reliable market quotation; or a security whose price, as provided by the pricing service, does not reflect the security’s “fair value” due to the security being de-listed from a national exchange or the security’s primary trading market is temporarily closed at a time when, under normal conditions, it would be open. As a general principle, the current “fair value” of a security would be the amount which the owner might reasonably expect to receive from the sale on the applicable exchange or principal market. A variety of factors may be considered in determining the fair value of such securities.
Barron’s 400SM ETF
| Notes to Financial Statements | November 30, 2020 |
B. Fair Value Measurements
The Fund discloses the classification of its fair value measurements following a three-tier hierarchy based on the inputs used to measure fair value. Inputs refer broadly to the assumptions that market participants would use in pricing the asset or liability; including assumptions about risk. Inputs may be observable or unobservable. Observable inputs reflect the assumptions market participants would use in pricing the asset or liability that are developed based on market data obtained from sources independent of the reporting entity. Unobservable inputs reflect the reporting entity’s own assumptions about the assumptions market participants would use in pricing the asset or liability that are developed based on the best information available.
Valuation techniques used to value the Fund's investments by major category are as follows:
Equity securities and Limited Partnerships, including restricted securities, for which market quotations are readily available, are valued at the last reported sale price or official closing price as reported by a third party pricing vendor on the primary market or exchange on which they are traded and are categorized as Level 1 in the hierarchy. In the event there were no sales during the day or closing prices are not available, securities are valued at the mean of the most recent quoted bid and ask prices on such day and are generally categorized as Level 2 in the hierarchy. Investments in open-end mutual funds are valued at their closing NAV each business day and are categorized as Level 1 in the hierarchy.
Changes in valuation techniques may result in transfers in or out of an assigned level within the disclosure hierarchy.
Various inputs are used in determining the value of the Fund’s investments as of the end of the reporting period. When inputs used fall into different levels of the fair value hierarchy, the level in the hierarchy within which the fair value measurement falls is determined based on the lowest level input that is significant to the fair value measurement in its entirety. The designated input levels are not necessarily an indication of the risk or liquidity associated with these investments.
These inputs are categorized in the following hierarchy under applicable financial accounting standards:
| Level 1 – | Unadjusted quoted prices in active markets for identical investments, unrestricted assets or liabilities that a Fund has the ability to access at the measurement date; |
| Level 2 – | Quoted prices which are not active, quoted prices for similar assets or liabilities in active markets or inputs other than quoted prices that are observable (either directly or indirectly) for substantially the full term of the asset or liability; and |
| Level 3 – | Significant unobservable prices or inputs (including the Fund’s own assumptions in determining the fair value of investments) where there is little or no market activity for the asset or liability at the measurement date. |
The following is a summary of the inputs used to value the Fund’s investments as of November 30, 2020:
Barron's 400 ETF
| Investments in Securities at Value | | Level 1 - Quoted and Unadjusted Prices | | | Level 2 - Other Significant Observable Inputs | | | Level 3 - Significant Unobservable Inputs | | | Total | |
| Common Stocks* | | $ | 116,566,620 | | | $ | – | | | $ | – | | | $ | 116,566,620 | |
| Limited Partnerships* | | | 1,467,914 | | | | – | | | | – | | | | 1,467,914 | |
| Short Term Investments | | | 1,480,014 | | | | – | | | | – | | | | 1,480,014 | |
| Total | | $ | 119,514,548 | | | $ | – | | | $ | – | | | $ | 119,514,548 | |
| * | For a detailed sector breakdown, see the accompanying Schedule of Investments. |
The Fund did not have any securities that used significant unobservable inputs (Level 3) in determining fair value and there were no transfers into or out of Level 3.
C. Securities Transactions and Investment Income
Securities transactions are recorded as of the trade date. Realized gains and losses from securities transactions are recorded on the highest cost basis. Dividend income and capital gains distributions, if any, are recorded on the ex-dividend date. Interest income, if any, is recorded on the accrual basis.
Barron’s 400SM ETF
| Notes to Financial Statements | November 30, 2020 |
D. Dividends and Distributions to Shareholders
Dividends from net investment income of the Fund, if any, are declared and paid annually or as the Board may determine from time to time. Distributions of net realized capital gains earned by the Fund, if any, are distributed at least annually.
E. Federal Tax and Tax Basis Information
The timing and character of income and capital gain distributions are determined in accordance with income tax regulations, which may differ from U.S. GAAP. Reclassifications are made to the Fund’s capital accounts for permanent tax differences to reflect income and gains available for distribution (or available capital loss carryforwards) under income tax regulations.
For the year ended November 30, 2020, the following reclassifications, which had no impact on results of operations or net assets, were recorded to reflect permanent tax differences resulting primarily from in-kind transactions:
| Fund | | Paid-in Capital | | | Total Distributable Earnings | |
| Barron’s 400SM ETF | | $ | 5,733,613 | | | $ | (5,733,613 | ) |
The tax character of the distributions paid during the fiscal years ended November 30, 2020 and November 30, 2019 was as follows:
| | | Ordinary Income | | | Long-Term Capital Gain | | | Return of Capital | |
| November 30, 2020 | | | | | | | | | | | | |
| Barron’s 400SM ETF | | $ | 1,017,716 | | | $ | – | | | $ | – | |
| | | Ordinary Income | | | Long-Term Capital Gain | | | Return of Capital | |
| November 30, 2019 | | | | | | | | | | | | |
| Barron’s 400SM ETF | | $ | 1,353,834 | | | $ | – | | | $ | – | |
The character of distributions made during the year may differ from its ultimate characterization for federal income tax purposes.
Under current law, capital losses maintain their character as short-term or long-term and are carried forward to the next tax year without expiration. As of November 30, 2020, the following amounts are available as carry forwards to the next tax year:
| Fund | | Short-Term | | | Long-Term | |
| Barron’s 400SM ETF | | $ | 37,276,443 | | | $ | 18,250,027 | |
As of November 30, 2020, the components of distributable earnings on a tax basis for each Fund were as follows:
| | | Barron’s 400SM ETF | |
| Undistributed net investment income | | $ | 756,768 | |
| Accumulated net realized loss on investments | | | (55,526,470 | ) |
| Net unrealized appreciation on investments | | | 28,462,434 | |
| Other accumulated losses | | | (9,705 | ) |
| Total | | $ | (26,316,973 | ) |
As of November 30, 2020, the cost of investments for federal income tax purposes and accumulated net unrealized appreciation/(depreciation) on investments were as follows:
| | | Barron’s 400SM ETF | |
| Gross appreciation (excess of value over tax cost) | | $ | 29,795,838 | |
| Gross depreciation (excess of tax cost over value) | | | (1,333,404 | ) |
| Net unrealized appreciation (depreciation) | | $ | 28,462,434 | |
| Cost of investments for income tax purposes | | $ | 91,052,114 | |
The differences between book-basis and tax-basis are primarily due to the deferral of losses from wash sales and investments in partnerships.
Barron’s 400SM ETF
| Notes to Financial Statements | November 30, 2020 |
F. Income Taxes
No provision for income taxes is included in the accompanying financial statements, as the Fund intends to distribute to shareholders all taxable investment income and realized gains and otherwise comply with Subchapter M of the Internal Revenue Code of 1986, as amended, applicable to regulated investment companies. The Fund evaluates tax positions taken (or expected to be taken) in the course of preparing the Fund’s tax returns to determine whether these positions meet a “more-likely-than-not” standard that, based on the technical merits, have a more than fifty percent likelihood of being sustained by a taxing authority upon examination. A tax position that meets the “more-likely-than-not” recognition threshold is measured to determine the amount of benefit to recognize in the financial statements.
As of and during the year ended November 30, 2020, the Fund did not have a liability for any unrecognized tax benefits. The Fund files U.S. federal, state, and local tax returns as required. The Fund’s tax returns are subject to examination by the relevant tax authorities until expiration of the applicable statute of limitations, which is generally three years after the filing of the tax return, but may extend to four years in certain jurisdictions. Tax returns for open years have incorporated no uncertain tax positions that require a provision for income taxes.
G. Lending of Portfolio Securities
The Fund has entered into a securities lending agreement with State Street Bank & Trust Co. (“SSB”), the Fund’s lending agent. The Fund may lend its portfolio securities only to borrowers that are approved by SSB. The Fund will limit such lending to not more than 33 1/3% of the value of its total assets. The Fund’s securities held at SSB as custodian shall be available to be lent except those securities the Fund or ALPS Advisors, Inc. specifically identifies in writing as not being available for lending. The borrower pledges and maintains with the Fund collateral consisting of cash (U.S. Dollars only), securities issued or guaranteed by the U.S. government or its agencies or instrumentalities, and cash equivalents (including irrevocable bank letters of credit) issued by a person other than the borrower or an affiliate of the borrower. The initial collateral received by the Fund is required to have a value of no less than 102% of the market value of the loaned securities for U.S equity securities and a value of no less than 105% of the market value for non-U.S. equity securities. The collateral is maintained thereafter, at a market value equal to not less than 102% of the current value of the U.S. equity securities on loan and not less than 105% of the current value of the non-U.S. equity securities on loan. The market value of the loaned securities is determined at the close of each business day and any additional required collateral is delivered to the Fund on the next business day. During the term of the loan, the Fund is entitled to all distributions made on or in respect of the loaned securities. Loans of securities are terminable at any time and the borrower, after notice, is required to return borrowed securities within the customary time period for settlement of securities transactions.
Any cash collateral received is reinvested in a money market fund managed by SSB as disclosed in the Fund’s Schedule of Investments and is reflected in the Statements of Assets and Liabilities as a payable for collateral upon return of securities loaned. Non-cash collateral, in the form of securities issued or guaranteed by the U.S. government or its agencies or instrumentalities, is not disclosed in the Fund’s Statements of Assets and Liabilities as it is held by the lending agent on behalf of the Fund, and the Fund does not have the ability to re-hypothecate these securities. Income earned by the Fund from securities lending activity is disclosed in the Statement of Operations.
The following is a summary of the Fund's securities lending agreement and related cash and non-cash collateral received as of November 30, 2020:
| | | Market Value of Securities on Loan | | | Cash Collateral Received | | | Non-Cash Collateral Received | | | Total Collateral Received | |
| Barron's 400 ETF | | $ | 2,921,697 | | | $ | 1,302,973 | | | $ | 1,732,261 | | | $ | 3,035,234 | |
The risks of securities lending include the risk that the borrower may not provide additional collateral when required or may not return the securities when due. To mitigate these risks, the Fund benefits from a borrower default indemnity provided by SSB. SSB’s indemnity allows for full replacement of securities lent wherein SSB will purchase the unreturned loaned securities on the open market by applying the proceeds of the collateral, or to the extent such proceeds are insufficient or the collateral is unavailable, SSB will purchase the unreturned loan securities at SSB’s expense. However, the Fund could suffer a loss if the value of the investments purchased with cash collateral falls below the value of the cash collateral received.
Barron’s 400SM ETF
| Notes to Financial Statements | November 30, 2020 |
The following table reflects a breakdown of transactions accounted for as secured borrowings, the gross obligation by the type of collateral pledged or securities loaned, and the remaining contractual maturity of those transactions as of November 30, 2020:
| Barron's 400 ETF | Remaining contractual maturity of the agreements |
| Securities Lending Transactions | | Overnight & Continuous | | | Up to 30 days | | | 30-90 days | | | Greater than 90 days | | | Total | |
| Common Stocks | | $ | 1,302,973 | | | $ | – | | | $ | – | | | $ | – | | | $ | 1,302,973 | |
| Total Borrowings | | | | | | | | | | | | | | | | | | | 1,302,973 | |
| Gross amount of recognized liabilities for securities lending (collateral received) | | | | | | | | | | $ | 1,302,973 | |
3. INVESTMENT ADVISORY FEE AND OTHER AFFILIATED TRANSACTIONS
ALPS Advisors, Inc. (the “Adviser”) serves as the Fund’s investment adviser pursuant to an Investment Advisory Agreement with the Trust on behalf of the Fund (the “Advisory Agreement”). Pursuant to the Advisory Agreement, the Fund pays the Adviser an annual management fee for the services and facilities it provides, payable on a monthly basis at the annual rate of 0.65% of the Fund’s average daily net assets. From time to time, the Adviser may waive all or a portion of its fee.
Out of the unitary management fees, the Adviser pays substantially all expenses of the Fund, including the cost of transfer agency, custody, fund administration, legal, audit, independent trustees and other services, except for interest expenses, distribution fees or expenses, brokerage expenses, taxes and extraordinary expenses not incurred in the ordinary course of the Fund's business. The Adviser’s unitary management fee is designed to pay substantially all of the Fund’s expenses and to compensate the Adviser for providing services to the Fund.
ALPS Fund Services, Inc., an affiliate of the Adviser, is the administrator of the Fund.
Effective July 1, 2020, each Trustee receives (1) a quarterly retainer of $10,000, (2) a per meeting fee of $5,000, (3) $1,500 for any special meeting held outside of a regularly scheduled board meeting, and (4) reimbursement for all reasonable out-of-pocket expenses relating to attendance at meetings. Prior to July 1, 2020, each Trustee who is not considered an "interested person" (as defined in the 1940 Act), received (1) a quarterly retainer of $5,000, (2) a per meeting fee of $3,750, (3) $1,500 for any special meeting held outside of a regularly scheduled board meeting, and (4) reimbursement for all reasonable out-of-pocket expenses relating to attendance at meetings. Prior to January 1, 2020, a Trustee who is considered an “interested person” (as defined in the 1940 Act) (“Interested Trustee”) received no compensation or expense reimbursements from the Trust. From January 1, 2020 to June 30, 2020, the Interested Trustee received (1) a quarterly retainer of $5,000, (2) a per meeting fee of $3,750, (3) $1,500 for any special meeting held outside of a regularly scheduled board meeting, and (4) reimbursement for all reasonable out-of-pocket expenses relating to attendance at meetings. In addition, the Chairman of the Board and Chairman of the Audit Committee each receives a quarterly retainer of $2,000, in connection with their respective roles.
4. PURCHASES AND SALES OF SECURITIES
For the year ended November 30, 2020, the cost of purchases and proceeds from sales of investment securities, excluding in-kind transactions and short-term investments, were as follows:
| Fund | | Purchases | | | Sales | |
| Barron's 400 ETF | | $ | 98,764,695 | | | $ | 97,006,262 | |
For the year ended November 30, 2020, the cost of in-kind purchases and proceeds from in-kind sales were as follows:
| Fund | | Purchases | | | Sales | |
| Barron's 400 ETF | | $ | – | | | $ | 37,008,159 | |
For the year ended November 30, 2020, the Barron's 400 ETF had in-kind net realized gains of $5,776,087.
Gains on in-kind transactions are not considered taxable for federal income tax purposes and losses on in-kind transactions are also not deductible for tax purposes.
Barron’s 400SM ETF
| Notes to Financial Statements | November 30, 2020 |
5. CAPITAL SHARE TRANSACTIONS
Shares are created and redeemed by the Fund only in Creation Unit size aggregations of 50,000 Shares. Only broker-dealers or large institutional investors with creation and redemption agreements called Authorized Participants (“AP”) are permitted to purchase or redeem Creation Units from the Fund. Such transactions are generally permitted on an in-kind basis, with a balancing cash component to equate the transaction to the NAV per unit of the Fund on the transaction date. Cash may be substituted equivalent to the value of certain securities generally when they are not available in sufficient quantity for delivery, not eligible for trading by the AP or as a result of other market circumstances.
6. RELATED PARTY TRANSACTIONS
The Fund engaged in cross trades between other funds in the Trust during the year ended November 30, 2020 pursuant to Rule 17a-7 under the 1940 Act. Cross trading is the buying or selling of portfolio securities between funds to which the Adviser serves as the investment adviser. The Board previously adopted procedures that apply to transactions between the Funds of the Trust pursuant to Rule 17a-7. These transactions related to cross trades during the period complied with the requirements set forth by Rule 17a-7 and the Trust’s procedures.
Transactions related to cross trades during the year ended November 30, 2020, were as follows:
| Fund | | Purchase cost paid | | | Sale proceeds received | | | Realized gain/(loss) on sales | |
| Barron's 400 ETF | | $ | 1,381,416 | | | $ | 2,390,301 | | | $ | 1,727,268 | |
7. MARKET DISRUPTIONS RISK
The Fund is subject to investment and operational risks associated with financial, economic and other global market developments and disruptions, including the recent spread of an infectious respiratory illness caused by a novel strain of coronavirus (known as COVID-19), which can negatively impact the securities markets and cause the Fund to lose value.
The spread of COVID-19 has caused volatility, severe market dislocations and liquidity constraints in many markets, including markets for the securities the Fund holds, and may adversely affect the Fund’s investments and operations. The transmission of COVID-19 and efforts to contain its spread have resulted in travel restrictions and disruptions, closed international borders, enhanced health screenings at ports of entry and elsewhere, disruption of and delays in healthcare service preparation and delivery, quarantines, event and service cancellations or interruptions, disruptions to business operations and supply chains, and a reduction in consumer and business spending, as well as general concern and uncertainty that has negatively affected the economy. These disruptions have led to instability in the market place and the jobs market. The impact of COVID-19 could adversely affect the economies of many nations or the entire global economy, the financial well-being and performance of individual issuers, borrowers and sectors and the health of the markets generally in potentially significant and unforeseen ways.
The foregoing could lead to a significant economic downturn or recession, increased market volatility, a greater number of market closures, higher default rates and adverse effects on the values and liquidity of the Fund’s securities or other assets. Such impacts may adversely affect the performance of the Fund.
8. SUBSEQUENT EVENTS
Subsequent events, if any, after the date of the Statements of Assets and Liabilities have been evaluated through the date the financial statements were issued. Management has determined that there were no subsequent events to report through the issuance of these financial statements.
Barron’s 400SM ETF
| Additional Information | November 30, 2020 (Unaudited) |
PROXY VOTING RECORDS, POLICIES AND PROCEDURES
Information regarding how the Fund voted proxies relating to portfolio securities during the most recent 12-month period ended June 30 and a description of the Fund’s proxy voting policies and procedures used in determining how to vote for proxies are available without charge on the SEC’s website at www.sec.gov and upon request, by calling (toll-free) 1-866-675-2639.
PORTFOLIO HOLDINGS
The Fund files a complete schedule of portfolio holdings with the U.S. Securities and Exchange Commission (“SEC”) for the first and third quarters of each fiscal year as an exhibit to its reports on Form N-PORT within 60 days after the end of the period. Copies of the Fund’s Form N-PORT are available without a charge, upon request, by contacting the Fund at 1-866-759-5679 and on the SEC’s website at https://www.sec.gov.
TAX INFORMATION
The Fund designates the following as a percentage of taxable ordinary income distributions, or up to the maximum amount allowable, for the calendar year ended December 31, 2019:
| | Qualified Dividend Income | Dividend Received Deduction |
| Barron's 400 ETF | 100.00% | 100.00% |
In early 2020, if applicable, shareholders of record received this information for the distribution paid to them by the Fund during the calendar year 2019 via Form 1099. The Fund will notify shareholders in early 2021 of amounts paid to them by the Fund, if any, during the calendar year 2020.
LICENSING AGREEMENT
MarketGrader Capital, LLC (the “Index Provider”) has entered into a license agreement with Dow Jones & Company to use the “Barron’s” name and certain related intellectual property in connection with the Underlying Index. The Index Provider also has entered into a license and services agreement with its parent company, MarketGrader.com, to use the methodology for constructing the Underlying Index. The Index Provider in turn has entered into the Sublicense Agreement with ALPS Advisers, Inc. to use the Underlying Index. The following disclosure relates to such licensing agreements:
The Barron’s 400 ETF (the “Fund”) is not sponsored, endorsed, sold or promoted by the Index Provider. The Index Provider makes no representation or warranty, express or implied, to the owners of the Fund or any member of the public regarding the advisability of investing in securities generally or in the Fund particularly or the ability of the Fund to track the performance of the physical commodities market. The Index Provider’s only relationship to the ALPS Advisors, Inc. (the “Adviser”) or the Fund is the licensing of certain service marks and trade names of the Index Provider and of the Underlying Index that is determined, composed and calculated by the Index Provider without regard to the Adviser or the Fund. The Index Provider has no obligation to take the needs of the Adviser or the Fund or the owners of the Fund into consideration in determining, composing or calculating the Underlying Index. The Index Provider is not responsible for and has not participated in the determination of the timing of, prices at, or quantities of the Fund to be issued or in the determination or calculation of the equation by which the Fund is to be converted into cash. The Index Provider has no obligation or liability in connection with the administration, marketing or trading of the Fund.
THE INDEX PROVIDER DOES NOT GUARANTEE THE ACCURACY AND/OR THE COMPLETENESS OF THE UNDERLYING INDEX OR ANY DATA INCLUDED THEREIN AND THE INDEX PROVIDER SHALL HAVE NO LIABILITY FOR ANY ERRORS, OMISSIONS, OR INTERRUPTIONS THEREIN. THE INDEX PROVIDER MAKES NO WARRANTY, EXPRESS OR IMPLIED, AS TO RESULTS TO BE OBTAINED BY THE ADVISER, THE FUND, OWNERS OF THE FUND, OR ANY OTHER PERSON OR ENTITY FROM THE USE OF THE UNDERLYING INDEX OR ANY DATA INCLUDED THEREIN. THE INDEX PROVIDER MAKES NO EXPRESS OR IMPLIED WARRANTIES, AND EXPRESSLY DISCLAIMS ALL WARRANTIES OF MERCHANTABILITY OR FITNESS FOR A PARTICULAR PURPOSE OR USE WITH RESPECT TO THE UNDERLYING INDEX OR ANY DATA INCLUDED THEREIN. WITHOUT LIMITING ANY OF THE FOREGOING, IN NO EVENT SHALL THE INDEX PROVIDER HAVE ANY LIABILITY FOR ANY SPECIAL, PUNITIVE, INDIRECT, OR CONSEQUENTIAL DAMAGES (INCLUDING LOST PROFITS), EVEN IF NOTIFIED OF THE POSSIBILITY OF SUCH DAMAGES.
“The Barron’s 400 IndexSM” is calculated and published by MarketGrader Capital, LLC (“MarketGrader”). “Barron’s,” “Barron’s 400” and “Barron’s 400 Index” are trademarks or service marks of DJC & Company, Inc. or its affiliates and have been licensed to MarketGrader and sublicensed for certain purposes by Barron’s 400 Exchange Traded Fund, a sub-fund of that certain ALPS ETF Trust, a Delaware Statutory Trust (“Sub-Licensee”). The Barron’s 400 ETF (the “Product”) is not sponsored, endorsed, sold or promoted by DJC or its affiliates. DJC and its affiliates make no representation or warranty, express or implied, to the owners of the Fund or any member of the public regarding the advisability of trading in the Fund particularly. DJC and its affiliates’ only relationship to the Licensee is the licensing of certain trademarks and trade names of DJC. DJC has no obligation to take the needs of the Licensee or the owners of the Fund into consideration in connection with its licensing of the Barron’s 400 Index to MarketGrader or the sublicense to Licensee. DJC and its affiliates are not responsible for and have not participated in the determination of the timing of, prices at, or quantities of the Fund to be sold or in the determination or calculation of the equation by which the Product are to be converted into cash. DJC and its affiliates have no obligation or liability in connection with the administration, marketing or trading of the Barron’s 400 Index or the Product.
Barron’s 400SM ETF
| Additional Information | November 30, 2020 (Unaudited) |
DOW JONES DOES NOT GUARANTEE THE ACCURACY AND/OR THE COMPLETENESS OF THE BARRON’S 400 INDEX OR ANY DATA INCLUDED THEREIN AND DOW JONES AND ITS AFFILIATES SHALL HAVE NO LIABILITY FOR ANY ERRORS, OMISSIONS, OR INTERRUPTIONS THEREIN. DOW JONESAND ITS AFFILIATES MAKE NO WARRANTY, EXPRESS OR IMPLIED, AS TO RESULTS TO BE OBTAINED BY THE LICENSEE, OWNERS OF THE FUND, OR ANY OTHER PERSON OR ENTITY FROM THE USE OF THE BARRON’S 400 INDEX OR ANY DATA INCLUDED THEREIN. DOW JONES AND ITS AFFILIATES MAKE NO EXPRESS OR IMPLIED WARRANTIES. AND EXPRESSLY DISCLAIM ALL WARRANTIES, OF MERCHANTABILITY OR FITNESS FOR A PARTICULAR PURPOSE OR USE WITH RESPECT TO THE BARRON’S 400 INDEX OR ANY DATA INCLUDED THEREIN. WITHOUT LIMITING ANY OF THE FOREGOING, IN NO EVENT SHALL DOW JONES AND ITS AFFILIATES HAVE ANY LIABILITY FOR ANY LOST PROFITS OR INDIRECT, PUNITIVE, SPECIAL OR CONSEQUENTIAL DAMAGES OR LOSSES, EVEN IF NOTIFIED OF THE POSSIBILITY OF SUCH DAMAGES. THERE ARE NO THIRD PARTY BENEFICIARIES OF ANY AGREEMENTS OR ARRANGEMENTS BETWEEN DJC AND THE LICENSEE, OTHER THAN THE LICENSORS OF MARKETGRADER.
The Adviser does not guarantee the accuracy and/or the completeness of the Underlying Index or any data included therein, and the Adviser shall have no liability for any errors, omissions or interruptions therein. The Adviser makes no warranty, express or implied, as to results to be obtained by the Fund, owners of the Shares of the Fund or any other person or entity from the use of the Underlying Index or any data included therein. The Adviser makes no express or implied warranties, and expressly disclaims all warranties of merchantability or fitness for a particular purpose or use with respect to the Underlying Index or any data included therein. Without limiting any of the foregoing, in no event shall the Adviser have any liability for any special, punitive, direct, indirect or consequential damages (including lost profits) arising out of matters relating to the use of the Underlying Index, even if notified of the possibility of such damages.
Barron’s 400SM ETF
| Board Considerations Regarding Approval | November 30, 2020 (Unaudited) |
| of Investment Advisory Agreement | |
At a meeting held on June 24, 2020 via electronic means (video-conference), the Board of Trustees of the Trust (the “Board” or the “Trustees”), including the Trustees who are not “interested persons” of the Trust within the meaning of the Investment Company Act of 1940, as amended (the “Independent Trustees”), evaluated a proposal to approve the continuance of the Investment Advisory Agreement between the Trust and ALPS Advisors, Inc. (the “Adviser” or “AAI”) with respect to the Barron’s 400 ETF (“BFOR” or the “Fund”). The Independent Trustees also met separately to consider the Investment Advisory Agreement.
In evaluating the Investment Advisory Agreement with respect to the Fund, the Board considered various factors, including (i) the nature, extent and quality of the services provided by AAI with respect to the Fund under the Investment Advisory Agreement; (ii) the advisory fees and other expenses paid by the Fund compared to those of similar funds managed by other investment advisers; (iii) the costs of the services provided to the Fund by AAI and the profits realized by AAI and its affiliates from its relationship to the Fund; (iv) the extent to which economies of scale have been or would be realized if and as the assets of the Fund grow and whether fees reflect the economies of scale for the benefit of shareholders; and (v) any additional benefits and other considerations.
With respect to the nature, extent and quality of the services provided by AAI under the Investment Advisory Agreement, the Board considered and reviewed information concerning the services provided under the Investment Advisory Agreement, the investment parameters of the index of the Fund, financial information regarding AAI and its parent company, information describing AAI’s current organization and the background and experience of the persons responsible for the day-to-day management of the Fund.
The Board reviewed information on the performance of the Fund and its benchmark. The Board also evaluated the correlation and tracking error between the underlying index and the Fund’s performance. Based on this review, the Board, including the Independent Trustees, found that the nature and extent of services provided to the Fund under the Investment Advisory Agreement was appropriate and that the quality was satisfactory.
The Board noted that the advisory fees for the Fund were unitary fees pursuant to which AAI assumes all expenses of the Fund (including the cost of transfer agency, custody, fund administration, legal, audit and other services) other than the payments under the Advisory Agreement, brokerage expenses, taxes, interest, litigation expenses and other extraordinary expenses.
With respect to advisory fee rates, the Board, including the Independent Trustees, noted the following:
The gross management fee rate for the Fund is higher than the median of its FUSE expense group. The Fund’s net expense ratio, however, is slightly above the median of its FUSE expense group.
The Board took into account, among other things, the unique features and performance of the Fund’s underlying index and the costs and benefits of linkage to the Barron’s name.
Based on the foregoing, and the other information available to them, the Board, including the Independent Trustees, concluded that the advisory fee rate for the Fund was reasonable under the circumstances and in light of the quality of the services provided.
The Board, including the Independent Trustees, considered other benefits available to AAI because of its relationship with the Fund and concluded that the advisory fees were reasonable taking into account any such benefits.
The Board, including the Independent Trustees, also considered with respect to the Fund the information provided by AAI about the costs and profitability of AAI with respect to the Fund, including the asset levels and other factors that influence profitability and financial viability of the Fund. The Board, including the Independent Trustees, reviewed and noted the relatively small size of the Fund and concluded that AAI was not realizing any economies of scale. The Independent Trustees determined that AAI should continue to keep the Board informed on an ongoing basis of any significant developments (e.g., material increases in asset levels) so as to facilitate the Independent Trustees’ evaluation of whether further economies of scale have been achieved.
In voting to renew the Investment Advisory Agreement, the Board, including the Independent Trustees, concluded that the terms of the Investment Advisory Agreement are reasonable and fair in light of the services to be performed, the fees paid by certain other funds, expenses to be incurred and such other matters as the members of the Board, including the Independent Trustees, considered relevant in the exercise of their reasonable business judgment. The Board, including the Independent Trustees, did not identify any single factor or group of factors as all important or controlling and considered all factors together.
Barron’s 400SM ETF
| Trustees & Officers | November 30, 2020 (Unaudited) |
The general supervision of the duties performed by the Adviser for the Fund under the Investment Advisory Agreement is the responsibility of the Board of Trustees. The Trust currently has four Trustees. Three Trustees have no affiliation or business connection with the Adviser or any of its affiliated persons and do not own any stock or other securities issued by the Adviser. These are the “non-interested” or “independent” Trustees (“Independent Trustees”). The other Trustee (the “Interested Trustee”) is affiliated with the Adviser.
The Independent Trustees of the Trust, their term of office and length of time served, their principal business occupations during the past five years, the number of portfolios in the Fund Complex overseen by each Independent Trustee, and other directorships, if any, held by the Trustee are shown below.
INDEPENDENT TRUSTEES
| Name, Address & Year of Birth* | Position(s) Held with Trust | Term of Office and Length of Time Served** | Principal Occupation(s) During Past 5 Years | Number of Portfolios in Fund Complex Overseen by Trustees*** | Other Directorships Held by Trustees |
| Mary K. Anstine, 1940 | Trustee | Since March 2008 | Ms. Anstine was formerly an Executive Vice President of First Interstate Bank of Denver until 1994, President/Chief Executive Officer of HealthONE Alliance, Denver, Colorado, from 1994 to 2004, and has been retired since 2004. Ms. Anstine is also Trustee/Director of the following: AV Hunter Trust and Colorado Uplift Board. Ms. Anstine was formerly a Director of the Trust Bank of Colorado (later purchased and now known as Northern Trust Bank), HealthONE and Denver Area Council of the Boy Scouts of America and a member of the American Bankers Association Trust Executive Committee. | 35 | Ms. Anstine is a Trustee of ALPS Variable Investment Trust (7 funds); Financial Investors Trust (31 funds); Reaves Utility Income Fund; and Segall Bryant & Hamill Trust (14 funds). |
| Jeremy W. Deems, 1976 | Trustee | Since March 2008 | Mr. Deems is the Co-Founder, Chief Compliance Officer and Chief Financial Officer of Green Alpha Advisors, LLC. Mr. Deems is Co-Portfolio Manager of the Shelton Green Alpha Fund. Prior to joining Green Alpha Advisors, Mr. Deems was CFO and Treasurer of Forward Management, LLC, ReFlow Management Co., LLC, ReFlow Fund, LLC, a private investment fund, and Sutton Place Management, LLC, an administrative services company. | 35 | Mr. Deems is a Trustee of ALPS Variable Investment Trust (7 funds); Financial Investors Trust (31 funds); and Reaves Utility Income Fund; and Clough Funds Trust (1 fund). |
| Rick A. Pederson, 1952 | Trustee | Since March 2008 | Mr. Pederson is Partner, Bow River Capital Partners (private equity management), 2003 - present; Board Member, Prosci Inc. (private business services) 2013-2016; Advisory Board Member, Citywide Banks (Colorado community bank) 2014- 2017; Board Member, Strong-Bridge Consulting, 2015-2019; Board Member, IRI/ODMS Holdings LLC, 2017 – 2019; Director, National Western Stock Show (not for profit) 2010 - present; Director, History Colorado (not for profit) 2015-present; Director, Citywide Bank Advisory Board 2017-present; Trustee, Boettcher Foundation, 2018-present. | 18 | Mr. Pederson is Trustee of Segall Bryant & Hamill Trust (14 funds) and Principal Real Estate Income Fund (1 fund). |
| * | The business address of the Trustee is c/o ALPS Advisors, Inc., 1290 Broadway, Suite 1000, Denver, Colorado 80203. |
| ** | This is the period for which the Trustee began serving the Trust. Each Trustee serves an indefinite term, until his successor is elected. |
| *** | The Fund Complex includes all series of the Trust and any other investment companies for which ALPS Advisors, Inc. provides investment advisory services. |
Barron’s 400SM ETF
| Trustees & Officers | November 30, 2020 (Unaudited) |
The Trustee who is an “interested person” of the Trust, his term of office and length of time served, his principal business occupations during the past five years, the number of portfolios in the Fund Complex overseen by the Interested Trustee and the other directorships, if any, held by the Trustee, are shown below.
INTERESTED TRUSTEE
| Name, Address and Year of Birth of Interested Trustee* | Position(s) Held with Trust | Term of Office and Length of Time Served** | Principal Occupation(s) During Past 5 Years | Number of Portfolios in Fund Complex Overseen by Trustees*** | Other Directorships Held by Trustees |
| Edmund J. Burke, 1961 | Trustee | Since December 2017. | Mr. Burke joined ALPS in 1991 and served as the President and Director of ALPS Holdings, Inc., and ALPS Advisors, Inc. (“AAI”), and Director of ALPS Distributors, Inc. (“ADI”), ALPS Fund Services, Inc. (“AFS”), and ALPS Portfolio Solutions Distributor, Inc. (“APSD”). Mr. Burke retired from ALPS in June 2019. | 30 | Mr. Burke is a Trustee of Clough Global Dividend and Income Fund (1 fund); Clough Global Equity Fund (1 fund); Clough Global Opportunities Fund (1 fund); Clough Funds Trust (1 fund); Liberty All-Star Equity Fund (1 fund); Director of the Liberty All- Star Growth Fund, Inc. (1 fund) and Financial Investors Trust (31 funds). |
| * | The business address of the Trustee is c/o ALPS Advisors, Inc., 1290 Broadway, Suite 1000, Denver, Colorado 80203. |
| ** | This is the period for which the Trustee began serving the Trust. Each Trustee serves an indefinite term, until his successor is elected. |
| *** | The Fund Complex includes all series of the Trust and any other investment companies for which ALPS Advisors, Inc. provides investment advisory services. |
Barron’s 400SM ETF
| Trustees & Officers | November 30, 2020 (Unaudited) |
OFFICERS
| Name, Address and Year of Birth of Officer* | Position(s) Held with Trust | Length of Time Served** | Principal Occupation(s) During Past 5 Years |
| Bradley Swenson, 1972 | President | Since June 2019 | Mr. Swenson joined ALPS in 2004 and currently serves as President of AFS (since 2019) and also Chief Operating Officer of AFS (since 2015). He also currently serves as President of Clough Global Opportunities Fund, Clough Global Dividend and Income Fund, Clough Global Equity Fund, Clough Funds Trust, Financial Investors Trust, Reaves Utility Income Fund and ALPS Series Trust. From 2004-2015, Mr. Swenson served as Chief Compliance Officer to ALPS, its affiliated entities, and to certain investment companies. Mr. Swenson is registered with FINRA, holding a Series 6, 26 and 27. |
| Matthew Sutula, 1985 | Chief Compliance Officer (“CCO”) | Since December 2019 | Mr. Sutula joined ALPS in 2012 and currently serves as Chief Compliance Officer of AAI. Prior to his current role, Mr. Sutula served as interim Compliance Officer of the Trust (September 2019 to December 2019). Compliance Manager and Senior Compliance Analyst for AAI, as well as Compliance Analyst for AFS. Prior to joining ALPS, he spent seven years at Morningstar, Inc. in various analyst roles supporting the registered investment company databases. Mr. Sutula is also Chief Compliance Officer of Principal Real Estate Income Fund, ALPS Variable Investment Trust, RiverNorth Opportunities Fund, Inc., Liberty All-Star Equity Fund and Liberty All- Star Growth Fund, Inc. |
| Kathryn Burns, 1976 | Treasurer | Since September 2018 | Ms. Burns serves as Vice President, Director of Fund Operations of AAI since 2018. From 2013 to 2018, she served as Vice President and Fund Controller at AFS. Prior to joining ALPS, she worked at Old Mutual Capital where she served as Vice President and Chief Compliance Officer (2010 – 2012) and Regulatory Reporting Manager and Assistant Treasurer to the Old Mutual Funds Trusts (2006 – 2012). She also served as a CPA for PricewaterhouseCoopers LLP. Ms. Burns also serves as Treasurer of Boulder Growth & Income Fund, Inc. and as President of ALPS Variable Investment Trust, Principal Real Estate Income Fund and RiverNorth Opportunities Fund, Inc. |
| Richard C. Noyes,*** 1970 | Secretary | Since September 2019 | Mr. Noyes joined ALPS in 2015 and is Senior Vice President and General Counsel of ALPS. Prior to joining ALPS, Mr. Noyes served as Assistant Vice President and Senior Counsel of Janus Capital Management LLC. |
| Sharon Akselrod,*** 1974 | Assistant Secretary | Since December 2016 | Ms. Akselrod joined ALPS in August 2014 and is currently Senior Investment Company Act Paralegal of AFS. Prior to joining ALPS, Ms. Akselrod served as Corporate Governance and Regulatory Associate for Nordstrom fsb (2013-2014) and Senior Legal Assistant – Legal Manager for AXA Equitable Life Insurance Company (2008-2013). Ms. Akselrod is also Secretary of Principal Real Estate Income Fund and Assistant Secretary of Financial Investors Trust and Clough Funds Trust. |
| Cara Owen,*** 1981 | Assistant Secretary | Since March 2020 | Vice President and Principal Legal Counsel, ALPS Fund Services, Inc.; Vice President and Secretary, Boulder Growth & Income Fund, Inc.; Assistant Secretary, James Advantage Funds (since August 2019). Prior to joining ALPS, Ms. Owen was Senior Counsel, Corporate & Investments, Great-West Life & Annuity Insurance Company; Senior Counsel & Assistant Secretary, Great-West Funds, Inc., Great-West Capital Management, LLC, Great-West Trust Company, LLC, and Advised Assets Group, LLC (2014-2019). |
| * | The business address of each Officer is c/o ALPS Advisors, Inc., 1290 Broadway, Suite 1000, Denver, Colorado 80203. Each Officer is deemed an affiliate of the Trust as defined under the 1940 Act. |
| ** | This is the period for which the Officer began serving the Trust. Each Officer serves an indefinite term, until his/her successor is elected. |
| *** | Effective December 7, 2020, Mr. Noyes and Ms. Akselrod resigned from their respective positions held with the Trust. As of the same date, Ms. Owen was appointed to the position of Secretary and Jen Craig as Assistant Secretary. |
The Statement of Additional Information includes additional information about the Fund’s Trustees and is available, without charge, upon request by calling (toll-free) 1-866-759-5679.
Table of Contents
| Performance Overview | |
| RiverFront Dynamic Core Income ETF | 1 |
| RiverFront Dynamic Unconstrained Income ETF | 4 |
| RiverFront Dynamic US Dividend Advantage ETF | 7 |
| RiverFront Dynamic US Flex-Cap ETF | 10 |
| RiverFront Strategic Income Fund | 13 |
| Disclosure of Fund Expenses | 16 |
| Report of Independent Registered Public Accounting Firm | 17 |
| Financial Statements | |
| Schedule of Investments | |
| RiverFront Dynamic Core Income ETF | 18 |
| RiverFront Dynamic Unconstrained Income ETF | 24 |
| RiverFront Dynamic US Dividend Advantage ETF | 28 |
| RiverFront Dynamic US Flex-Cap ETF | 30 |
| RiverFront Strategic Income Fund | 32 |
| Statement of Assets and Liabilities | 35 |
| Statement of Operations | 36 |
| Statements of Changes in Net Assets | |
| RiverFront Dynamic Core Income ETF | 37 |
| RiverFront Dynamic Unconstrained Income ETF | 38 |
| RiverFront Dynamic US Dividend Advantage ETF | 39 |
| RiverFront Dynamic US Flex-Cap ETF | 40 |
| RiverFront Strategic Income Fund | 41 |
| Financial Highlights | 42 |
| Notes to Financial Statements | 47 |
| Additional Information | 56 |
| Board Considerations Regarding Approval of Investment Advisory Agreement and Investment Sub-Advisory Agreements | 57 |
| Trustees & Officers | 59 |
Beginning on January 1, 2021, as permitted by regulations adopted by the U.S. Securities and Exchange Commission, paper copies of the Funds’ annual and semi-annual shareholder reports will no longer be sent by mail, unless you specifically request paper copies of the reports from your financial intermediary (such as a broker-dealer or bank). Instead, the reports will be made available on the Funds’ website (www.alpsfunds.com), and you will be notified by mail each time a report is posted and provided with a website link to access the report.
If you already elected to receive shareholder reports electronically, you will not be affected by this change and you need not take any action. You may elect to receive shareholder reports and other communications from a Fund electronically anytime by contacting your financial intermediary.
You may elect to receive all future reports in paper free of charge. You can contact your financial intermediary to request that you continue to receive paper copies of your shareholder reports. Your election to receive reports in paper will apply to all funds held in your account with your financial intermediary.
alpsfunds.com
RiverFront Dynamic Core Income ETF
| Performance Overview | November 30, 2020 (Unaudited) |
Investment Objective
RiverFront Dynamic Core Income ETF (the “Fund” or "RFCI") seeks total return, with an emphasis on income as the source of that total return. The Fund seeks to achieve its investment objective by investing in a global portfolio of fixed income securities of various maturities, ratings and currency denominations.
Market Outlook
The 12-month period ended November 30, 2020 was one defined by the novel coronavirus (“COVID-19”) pandemic; the returns on global equity market were dependent on its ability to handle the pandemic and the resilience of its underlying earnings to the pandemic.
The final month of the 2019 calendar year and the first month of 2020 were overall positive for equity markets. Led by the S&P 500® Index (the "S&P 500"), global markets rose to varying degrees on the prospect of decreased tensions between the U.S. and China. However, this rally was quickly ended as the COVID-19 pandemic swiftly sent the world’s economy into a recession. The month of March 2020 saw some of the steepest declines in regional equity markets ever. These declines were short lived, with April bringing positive gains across each region. This momentum carried into the third quarter of 2020, where the S&P 500, MSCI EAFE® Index and MSCI Emerging® Index all saw double digit gains. However, these gains were not completely equal. The S&P 500 saw a rebound, despite increasing COVID-19 cases, because its Technology sector was able to grow its bottom-line despite the pandemic. The MSCI Emerging Index had the sharpest rebound led by China, which benefited from the tough measures taken by their government to combat the disease. With their official case numbers stabilizing at low levels, the Chinese economy was able to get back to work. The MSCI EAFE Index’s rebound was the smallest, compared to its decline. The main culprit was Europe’s inability to contain COVID-19, tied with its overall value tilt. These three themes carried over into September and October 2020. Asia Pacific and Emerging Markets, driven by China, outperformed, with COVID-19 in Asia’s rear view. The S&P 500 was able to produce tepid gains of less than 1%, on the back of Technology mega caps. Finally, Europe lost ground, on a relative and absolute basis, due to their still combatting COVID-19 combined with structural issues that existed prior to but were exasperated by the COVID-19.
In the final month of the fiscal year, positive vaccine breakthroughs caused value equities to sharply outperform growth.
2020 Performance Attribution
RFCI underperformed its benchmark for the 12-month period ending November 30, 2020, based upon its return at NAV. The underperformance of RFCI relative to its benchmark was primarily due to the Fund’s selection within investment grade bonds as well as an overweight to cash throughout the period.
Negative Contributors:
| • | Selection within Investment Grade Corporates: During the 12-month attribution period, the Fund had a shorter duration than the ICE BAML US Corporate Index and the longer duration corporates outperformed their shorter duration counterparts. The ICE BAML US Corporate Index returned 9.61% over the period, as spreads tightened by 289 basis points from the March 23rd lows. |
| • | Excess Cash: The Fund held higher levels of cash during the period due to a combination of market volatility and higher than normal called issues as companies refinanced debt to take advantage of lower interest rates. |
Positive Contributors:
| • | Allocation to credit: The Fund’s overweight to corporate bonds relative to Treasuries, agencies, and mortgages was additive during the period. |
| • | Selection within rates: The Fund positioning of longer duration Treasuries was additive, as the longer end of the curve rallied throughout the year. The 10-year Treasury yield fell by 98 basis points and the 30-year Treasury yield fell by 60 basis points. |
2021 Outlook
Going forward, RiverFront believes stocks will rise over the next 12-18 months, recognizing that short-term risk remains high with continued COVID-19 concerns, until a vaccine can be distributed. Across RiverFront’s equity portfolios, the portfolios are slightly overweight equities compared to their respective benchmarks. From a selection standpoint, RiverFront believes asset classes and stocks that can deliver growth should continue to be valued at a premium to their peers.
There are several potential catalysts on the near-term horizon including another stimulus bill, further advances in COVID-19 treatment and earnings season. From a macro standpoint, we believe that low interest rates and accommodative policy will continue to provide support for stocks globally. Thus, we believe that international equities provide a relatively attractive long-term return potential relative to fixed income alternatives in the United States or abroad. We find the relative valuation of international equities to domestic equities also compelling, but value is not in and of itself a ‘catalyst’ - a timing signal - for stocks, in our opinion. International equities have long been awaiting a positive catalyst to help drive relative performance versus the S&P 500. While fears of a COVID-19 “second wave” continue to spike along with case counts in both the United States and across Europe, economic fallout from the first wave of COVID-19 has sparked historic levels of fiscal and monetary stimulus from European and Asian policy makers. Monetary supply is now growing in most major economies of the world, a positive for stocks in our opinion. On the currency front, we remain of the view that the U.S. Dollar may have reached a structural peak, and do not intend to hedge to dollars at current prices – we will reconsider that on a currency by currency basis should the currency crosses rise.
RiverFront Dynamic Core Income ETF
| Performance Overview | November 30, 2020 (Unaudited) |
Going into 2021, the expectation is for the yield curve to steepen as financial markets deal with an easy monetary policy and possible fiscal stimulus. With the yield of the 10-year Treasury beginning to inch up ever so slightly, RiverFront Investment Group, LLC (“RiverFront”) believes the path is being paved for yields to breach 1% and potentially trade within a 50-basis point range between .80% and 1.30%. Given the need for income by fixed income investors, it will be important to focus investments towards spread products such as investment grade corporate bonds and high yield securities. RiverFront believes that 2021, will offer continued opportunities for these two asset classes to experience further spread tightening relative to Treasuries if the yield curve steepens. However, RiverFront acknowledges that there will be a cap on how high yields will climb given the roughly $17 trillion of negative yielding debt globally.
Performance (as of November 30, 2020)
| | 1 Year | 3 Year | Since Inception^ |
| RiverFront Dynamic Core Income ETF – NAV | 5.97% | 4.70% | 3.43% |
| RiverFront Dynamic Core Income ETF – Market Price* | 5.93% | 4.61% | 3.41% |
| Bloomberg Barclays U.S. Aggregate Bond Total Return Index | 7.28% | 5.45% | 3.90% |
Total Expense Ratio (per the current prospectus) is 0.52%.
Performance data quoted represents past performance. Past performance does not guarantee future results. Total return figures assume reinvestment of dividends and capital gains distributions, if any. The table does not reflect the deduction of taxes that a shareholder would pay on Fund distributions or the redemption of Fund shares. Investment return and principal value of an investment will fluctuate so that an investor’s shares, when sold or redeemed, may be worth more or less than the original cost. Current performance data may be higher or lower than actual data quoted. For the most current month-end performance data please visit www.alpsfunds.com or call 1.866.759.5679.
NAV is an exchange-traded fund’s per-share value. The per-share dollar amount of the fund is derived by dividing the total value of all the securities in its portfolio, less any liabilities, by the number of fund shares outstanding. Market Price is the price at which a share can currently be traded in the market. Information detailing the number of days the Market Price of the Fund was greater than the Fund’s NAV and the number of days it was less than the Fund’s NAV can be obtained at www.alpsfunds.com.
| ^ | The Fund commenced operations on June 14, 2016. |
| * | Market Price means the official closing price of a share or, if it more accurately reflects the market value of a share at the time as of which the Fund calculates current net asset value per share, the price that is the midpoint of the bid-ask spread as of that time. It does not represent the returns an investor would receive if shares were traded at other times. |
Bloomberg Barclays U.S. Aggregate Bond Total Return Index is a broad-based benchmark that measures the investment grade, U.S. dollar-denominated, fixed-rate taxable bond market, including Treasuries, government-related and corporate securities, MBS (agency fixed-rate and hybrid ARM pass-throughs), ABS, and CMBS (agency and non-agency). The index is reported on a total return basis, which assumes reinvestment of any dividends and distributions realized during a given time period. The index is not actively managed and does not reflect any deductions for fees, expenses or taxes. One cannot invest directly in an index. Index performance does not reflect fund performance.
The RiverFront Dynamic Core Income ETF is not suitable for all investors. Investments in the Fund are subject to investment risks, including possible loss of the principal amount invested.
The Fund’s shares are not individually redeemable. Investors buy and sell shares of the Fund on a secondary market. Only market makers or “authorized participants” may trade directly with the Fund, typically in blocks of 50,000 shares.
ALPS Portfolio Solutions Distributor, Inc., a FINRA member, is the Distributor for the RiverFront Dynamic Core Income ETF.
RiverFront Dynamic Core Income ETF
| Performance Overview | November 30, 2020 (Unaudited) |
Top 10 Holdings*^ (as of November 30, 2020)
| United States Treasury Bond 2.75%, 2/15/2028 | 6.61% |
| United States Treasury Note 3.00%, 10/31/2025 | 3.24% |
| United States Treasury Note 2.88%, 11/15/2021 | 2.94% |
| United States Treasury Strip Principal, 8/15/2039 | 2.72% |
| United States Treasury Strip Principal, 2/15/2038 | 2.35% |
| United States Treasury Note 2.88%, 10/31/2023 | 1.85% |
| AT&T, Inc. | 1.70% |
| Bank of America Corp. | 1.64% |
| United States Treasury Strip Principal, 5/15/2048 | 1.48% |
| United States Treasury Bond 2.75%, 11/15/2047 | 1.39% |
| Total % of Top 10 Holdings | 25.92% |
Asset Allocation* (as of November 30, 2020)
| ^ | Excludes Money Market Fund |
Future holdings are subject to change.
Growth of $10,000 (as of November 30, 2020)
Comparison of Change in Value of $10,000 Investment in the Fund and the Fund’s benchmark
The chart above compares historical performance of a hypothetical investment of $10,000 in the Fund since inception with the performance of the Fund’s benchmark index. Past performance does not guarantee future results. The chart does not reflect the deduction of taxes that a shareholder would pay on Fund distributions or the redemption of Fund shares.
RiverFront Dynamic Unconstrained Income ETF
| Performance Overview | November 30, 2020 (Unaudited) |
Investment Objective
RiverFront Dynamic Unconstrained Income ETF (the “Fund” or "RFUN") seeks total return, with an emphasis on income as the source of that total return. The Fund seeks to achieve its investment objective by investing in a global portfolio of fixed income securities of various maturities, ratings and currency denominations.
Market Outlook
The 12-month period ended November 30, 2020 was one defined by the novel coronavirus (“COVID-19”) pandemic; the returns on global equity market were dependent on its ability to handle the pandemic and the resilience of its underlying earnings to the pandemic.
The final month of the 2019 calendar year and the first month of 2020 were overall positive for equity markets. Led by the S&P 500® Index (the "S&P 500"), global markets rose to varying degrees on the prospect of decreased tensions between the U.S. and China. However, this rally was quickly ended as the COVID-19 pandemic swiftly sent the world’s economy into a recession. The month of March 2020 saw some of the steepest declines in regional equity markets ever. These declines were short lived, with April bringing positive gains across each region. This momentum carried into the third quarter of 2020, where the S&P 500, MSCI EAFE® Index and MSCI Emerging® Index all saw double digit gains. However, these gains were not completely equal. The S&P 500 saw a rebound, despite increasing COVID-19 cases, because its Technology sector was able to grow its bottom-line despite the pandemic. The MSCI Emerging Index had the sharpest rebound led by China, which benefited from the tough measures taken by their government to combat the disease. With their official case numbers stabilizing at low levels, the Chinese economy was able to get back to work. The MSCI EAFE Index’s rebound was the smallest, compared to its decline. The main culprit was Europe’s inability to contain COVID-19, tied with its overall value tilt. These three themes carried over into September and October 2020. Asia Pacific and Emerging Markets, driven by China, outperformed, with COVID-19 in Asia’s rear view. The S&P 500 was able to produce tepid gains of less than 1%, on the back of Technology mega caps. Finally, Europe lost ground, on a relative and absolute basis, due to their still combatting COVID-19 combined with structural issues that existed prior to but were exasperated by COVID-19.
In the final month of the fiscal year, positive vaccine breakthroughs caused value equities to sharply outperform growth.
2020 Performance Attribution
RFUN underperformed its benchmark over the 12 months ending November 30, 2020, based upon its return at NAV. The underperformance of RFUN was primarily due to its overweight to cash. We believe that the Fund’s higher quality strategy will outperform over a full credit cycle however, due to the lower historical defaults on higher quality bonds.
Negative Contributors:
| • | Excess Cash: The Fund held higher levels of cash during the period due to a combination of market volatility and higher than normal called issues as companies refinanced debt to take advantage of lower interest rates. |
Positive Contributors:
| • | Selection within High Yield: The Fund held higher quality bonds within high yield during the period versus the ICE BofA US High Yield Index (the "Index"). On average the Fund held BB rated bonds versus the Index’s B rated holdings. During the attribution period, BB rated high yield returned 8.30% versus 4.06% for B rated high yield, largely due to the avoidance of energy exposure. |
2021 Outlook
Going forward, RiverFront believes stocks will rise over the next 12-18 months, recognizing that short-term risk remains high with continued COVID-19 concerns, until a vaccine can be distributed. Across RiverFront’s equity portfolios, the portfolios are slightly overweight equities compared to their respective benchmarks. From a selection standpoint, RiverFront believes asset classes and stocks that can deliver growth should continue to be valued at a premium to their peers.
There are several potential catalysts on the near-term horizon including another stimulus bill, further advances in COVID-19 treatment and earnings season. From a macro standpoint, we believe that low interest rates and accommodative policy will continue to provide support for stocks globally. Thus, we believe that international equities provide a relatively attractive long-term return potential relative to fixed income alternatives in the United States or abroad. We find the relative valuation of international equities to domestic equities also compelling, but value is not in and of itself a ‘catalyst’ - a timing signal - for stocks, in our opinion. International equities have long been awaiting a positive catalyst to help drive relative performance versus the S&P 500. While fears of a COVID-19 “second wave” continue to spike along with case counts in both the United States and across Europe, economic fallout from the first wave of COVID-19 has sparked historic levels of fiscal and monetary stimulus from European and Asian policy makers. Monetary supply is now growing in most major economies of the world, a positive for stocks in our opinion. On the currency front, we remain of the view that the U.S. Dollar may have reached a structural peak, and do not intend to hedge to dollars at current prices – we will reconsider that on a currency by currency basis should the currency crosses rise.
Going into 2021, the expectation is for the yield curve to steepen as financial markets deal with an easy monetary policy and possible fiscal stimulus. With the yield of the 10-year Treasury beginning to inch up ever so slightly, RiverFront Investment Group, LLC (“RiverFront”) believes the path is being paved for yields to breach 1% and potentially trade within a 50-basis point range between .80% and 1.30%. Given the need for income by fixed income investors, it will be important to focus investments towards spread products such as investment grade corporate bonds and high yield securities. RiverFront believes that 2021, will offer continued opportunities for these two asset classes to experience further spread
RiverFront Dynamic Unconstrained Income ETF
| Performance Overview | November 30, 2020 (Unaudited) |
tightening relative to Treasuries if the yield curve steepens. However, RiverFront acknowledges that there will be a cap on how high yields will climb given the roughly $17 trillion of negative yielding debt globally.
Performance (as of November 30, 2020)
| | 1 Year | 3 Year | Since Inception^ |
| RiverFront Dynamic Unconstrained Income ETF – NAV | 5.07% | 4.14% | 5.43% |
| RiverFront Dynamic Unconstrained Income ETF – Market Price* | 5.07% | 4.05% | 5.41% |
| ICE BofAML U.S. High Yield Master II Total Return Index | 6.36% | 5.32% | 6.97% |
Total Expense Ratio (per the current prospectus) is 0.52%.
Performance data quoted represents past performance. Past performance does not guarantee future results. Total return figures assume reinvestment of dividends and capital gains distributions, if any. The table does not reflect the deduction of taxes that a shareholder would pay on Fund distributions or the redemption of Fund shares. Investment return and principal value of an investment will fluctuate so that an investor’s shares, when sold or redeemed, may be worth more or less than the original cost. Current performance data may be higher or lower than actual data quoted. For the most current month-end performance data please visit www.alpsfunds.com or call 1.866.759.5679.
NAV is an exchange-traded fund’s per-share value. The per-share dollar amount of the fund is derived by dividing the total value of all the securities in its portfolio, less any liabilities, by the number of fund shares outstanding. Market Price is the price at which a share can currently be traded in the market. Information detailing the number of days the Market Price of the Fund was greater than the Fund’s NAV and the number of days it was less than the Fund’s NAV can be obtained at www.alpsfunds.com.
| ^ | The Fund commenced operations on June 14, 2016. |
| * | Market Price means the official closing price of a share or, if it more accurately reflects the market value of a share at the time as of which the Fund calculates current net asset value per share, the price that is the midpoint of the bid-ask spread as of that time. It does not represent the returns an investor would receive if shares were traded at other times. |
ICE BofAML U.S. High Yield Master II Total Return Index tracks the performance of below-investment grade U.S. dollar-denominated corporate bonds issued in the U.S. Domestic market. The index is reported on a total return basis, which assumes reinvestment of any dividends and distributions realized during a given time period. The index is not actively managed and does not reflect any deductions for fees, expenses or taxes. One cannot invest directly in an index. Index performance does not reflect fund performance.
The RiverFront Dynamic Unconstrained Income ETF is not suitable for all investors. Investments in the Fund are subject to investment risks, including possible loss of the principal amount invested.
The Fund’s shares are not individually redeemable. Investors buy and sell shares of the Fund on a secondary market. Only market makers or “authorized participants” may trade directly with the Fund, typically in blocks of 50,000 shares.
ALPS Portfolio Solutions Distributor, Inc., a FINRA member, is the Distributor for the RiverFront Dynamic Unconstrained Income ETF.
RiverFront Dynamic Unconstrained Income ETF
| Performance Overview | November 30, 2020 (Unaudited) |
Top 10 Holdings*^ (as of November 30, 2020)
| Xtrackers USD High Yield Corporate Bond ETF | 4.89% |
| iShares iBoxx High Yield Corporate Bond ETF | 4.85% |
| Ford Motor Co. | 2.16% |
| Bausch Health Cos., Inc. | 1.85% |
| CSC Holdings LLC | 1.71% |
| Altice France SA | 1.66% |
| Ford Motor Credit Co. LLC | 1.64% |
| Occidental Petroleum Corp. | 1.52% |
| Centene Corp. | 1.43% |
| TransDigm, Inc. | 1.26% |
| Total % of Top 10 Holdings | 22.97% |
| ^ | Excludes Money Market Fund |
Asset Allocation* (as of November 30, 2020)
Future holdings are subject to change.
Growth of $10,000 (as of November 30, 2020)
Comparison of Change in Value of $10,000 Investment in the Fund and the Fund’s benchmark
The chart above compares historical performance of a hypothetical investment of $10,000 in the Fund since inception with the performance of the Fund’s benchmark index. Results include the reinvestment of all dividends and capital gains distributions. Past performance does not guarantee future results. The graph does not reflect the deduction of taxes that a shareholder would pay on Fund distributions or the redemption of Fund shares.
RiverFront Dynamic US Dividend Advantage ETF
| Performance Overview | November 30, 2020 (Unaudited) |
Investment Objective
RiverFront Dynamic US Dividend Advantage ETF (the “Fund” or "RFDA") seeks to provide capital appreciation and dividend income. Under normal market conditions, the Fund seeks to achieve its investment objective by investing at least 65% of its net assets in a portfolio of equity securities of publicly traded U.S. companies with the potential for dividend income. Equity securities include common stocks and common or preferred shares of real estate investment trusts (“REITs”).
Market Outlook
The 12-month period ended November 30, 2020 was one defined by the novel coronavirus (“COVID-19”) pandemic; the returns on global equity market were dependent on its ability to handle the pandemic and the resilience of its underlying earnings to the pandemic.
The final month of the 2019 calendar year and the first month of 2020 were overall positive for equity markets. Led by the S&P 500® Index (the "S&P 500"), global markets rose to varying degrees on the prospect of decreased tensions between the U.S. and China. However, this rally was quickly ended as the COVID-19 pandemic swiftly sent the world’s economy into a recession. The month of March 2020 saw some of the steepest declines in regional equity markets ever. These declines were short lived, with April bringing positive gains across each region. This momentum carried into the third quarter of 2020, where the S&P 500, MSCI EAFE® Index and MSCI Emerging® Index all saw double digit gains. However, these gains were not completely equal. The S&P 500 saw a rebound, despite increasing COVID-19 cases, because its Technology sector was able to grow its bottom-line despite the pandemic. The MSCI Emerging Index had the sharpest rebound led by China, which benefited from the tough measures taken by their government to combat the disease. With their official case numbers stabilizing at low levels, the Chinese economy was able to get back to work. The MSCI EAFE Index’s rebound was the smallest, compared to its decline. The main culprit was Europe’s inability to contain COVID-19, tied with its overall value tilt. These three themes carried over into September and October 2020. Asia Pacific and Emerging Markets, driven by China, outperformed, with COVID-19 in Asia’s rear view. The S&P 500 was able to produce tepid gains of less than 1%, on the back of Technology mega caps. Finally, Europe lost ground, on a relative and absolute basis, due to their still combatting COVID-19 combined with structural issues that existed prior to, but were exasperated, by COVID-19.
In the final month of the fiscal year, positive vaccine breakthroughs caused value equities to sharply outperform growth.
2020 Performance Attribution
Broadly, RFDA underperformed its benchmark in fiscal year 2020 ("FY 2020") largely due to security selection decisions.
| 1. | Sector Allocation: The sector allocations in RFDA are determined through a bottoms-up process that ranks stocks on three fundamental cornerstones: value, quality and momentum/sentiment. If a sector produces more highly ranked stocks relative to another sector, that sector’s allocation is allowed to exceed its benchmark by a tolerable level, and vice versa. Sector allocation was a slightly positive contributor for RFDA in FY 2020. |
| a. | Positive contributors: The underweights to financials and healthcare were positive contributors. |
| b. | Negative contributors: The portfolio’s underweights to energy and its over-weights to telecommunications and utilities dampened relative performance. |
| 2. | Security Selection: The investment selection process behind RFDA is built on making a number of security selection choices. This means that there are rarely just one or two things contributing to the returns in the Fund. In FY 2020, our equity selection posted negative results in aggregate. A few of the top themes that contributed most to performance in the year were: |
| a. | Positive contributors: Security selection in consumer cyclicals, consumer services and business services were additive. |
| b. | Negative contributors: Security selection in technology, financials, non-energy materials, and telecommunications detracted from performance. |
2021 Outlook
Going forward, RiverFront believes stocks will rise over the next 12-18 months, recognizing that short-term risk remains high with continued COVID-19 concerns, until a vaccine can be distributed. Across RiverFront’s equity portfolios, the portfolios are slightly overweight equities compared to their respective benchmarks. From a selection standpoint, RiverFront believes asset classes and stocks that can deliver growth should continue to be valued at a premium to their peers.
There are several potential catalysts on the near-term horizon including another stimulus bill, further advances in COVID-19 treatment and earnings season. From a macro standpoint, we believe that low interest rates and accommodative policy will continue to provide support for stocks globally. Thus, we believe that international equities provide a relatively attractive long-term return potential relative to fixed income alternatives in the United States or abroad. We find the relative valuation of international equities to domestic equities also compelling, but value is not in and of itself a ‘catalyst’ - a timing signal - for stocks, in our opinion. International equities have long been awaiting a positive catalyst to help drive relative performance versus the S&P 500. While fears of a COVID-19 “second wave” continue to spike along with case counts in both the United States and across Europe, economic fallout from the first wave of COVID-19 has sparked historic levels of fiscal and monetary stimulus from European and Asian policy makers. Monetary supply is now growing in most major economies of the world, a positive for stocks in our opinion. On the currency front, we remain of the view that the U.S. Dollar may have reached a structural peak, and do not intend to hedge to dollars at current prices – we will reconsider that on a currency by currency basis should the currency crosses rise.
RiverFront Dynamic US Dividend Advantage ETF
| Performance Overview | November 30, 2020 (Unaudited) |
Performance (as of November 30, 2020)
| | 1 Year | 3 Year | Since Inception^ |
| RiverFront Dynamic US Dividend Advantage ETF – NAV | 10.92% | 7.79% | 11.19% |
| RiverFront Dynamic US Dividend Advantage ETF – Market Price* | 10.89% | 7.80% | 11.19% |
| S&P 500® Total Return Index | 17.46% | 13.17% | 15.06% |
Total Expense Ratio (per the current prospectus) is 0.52%.
Performance data quoted represents past performance. Past performance does not guarantee future results. Total return figures assume reinvestment of dividends and capital gains distributions, if any. The table does not reflect the deduction of taxes that a shareholder would pay on Fund distributions or the redemption of Fund shares. Investment return and principal value of an investment will fluctuate so that an investor’s shares, when sold or redeemed, may be worth more or less than the original cost. Current performance data may be higher or lower than actual data quoted. For the most current month-end performance data please visit www.alpsfunds.com or call 1.866.759.5679.
NAV is an exchange-traded fund’s per-share value. The per-share dollar amount of the fund is derived by dividing the total value of all the securities in its portfolio, less any liabilities, by the number of fund shares outstanding. Market Price is the price at which a share can currently be traded in the market. Information detailing the number of days the Market Price of the Fund was greater than the Fund’s NAV and the number of days it was less than the Fund’s NAV can be obtained at www.alpsfunds.com.
| ^ | The Fund commenced operations on June 7, 2016. |
| * | Market Price means the official closing price of a share or, if it more accurately reflects the market value of a share at the time as of which the Fund calculates current net asset value per share, the price that is the midpoint of the bid-ask spread as of that time. It does not represent the returns an investor would receive if shares were traded at other times. |
S&P 500® Total Return Index is the Standard & Poor’s composite index of 500 stocks, a widely recognized, unmanaged index of common stock prices. The index is reported on a total return basis, which assumes reinvestment of any dividends and distributions realized during a given time period. The index is not actively managed and does not reflect any deductions for fees, expenses or taxes. One cannot invest directly in an index. Index performance does not reflect fund performance.
The RiverFront Dynamic US Dividend Advantage ETF is not suitable for all investors. Investments in the Fund are subject to investment risks, including possible loss of the principal amount invested.
The Fund’s shares are not individually redeemable. Investors buy and sell shares of the Fund on a secondary market. Only market makers or “authorized participants” may trade directly with the Fund, typically in blocks of 50,000 shares.
ALPS Portfolio Solutions Distributor, Inc., a FINRA member, is the Distributor for the RiverFront Dynamic US Dividend Advantage ETF.
RiverFront Dynamic US Dividend Advantage ETF
| Performance Overview | November 30, 2020 (Unaudited) |
Top 10 Holdings* (as of November 30, 2020)
| Microsoft Corp. | 6.71% |
| Apple, Inc. | 4.85% |
| Amazon.com, Inc. | 4.53% |
| Visa, Inc. | 2.58% |
| Broadcom, Inc. | 2.29% |
| Coca-Cola Co. | 2.09% |
| Bank of America Corp. | 1.98% |
| Intel Corp. | 1.95% |
| Pfizer, Inc. | 1.85% |
| Oracle Corp. | 1.81% |
| Total % of Top 10 Holdings | 30.64% |
| * | % of Total Investments (excluding investments purchased with collateral from securities loaned) |
Asset Allocation* (as of November 30, 2020)

Future holdings are subject to change.
Growth of $10,000 (as of November 30, 2020)
Comparison of Change in Value of $10,000 Investment in the Fund and the Fund’s benchmark
The chart above compares historical performance of a hypothetical investment of $10,000 in the Fund since inception with the performance of the Fund’s benchmark index. Results include the reinvestment of all dividends and capital gains distributions. Past performance does not guarantee future results. The graph does not reflect the deduction of taxes that a shareholder would pay on Fund distributions or the redemption of Fund shares.
RiverFront Dynamic US Flex-Cap ETF
| Performance Overview | November 30, 2020 (Unaudited) |
Investment Objective
RiverFront Dynamic US Flex-Cap ETF (the “Fund” or "RFFC") seeks to provide capital appreciation. Under normal market conditions, the Fund seeks to achieve its investment objective by investing at least 65% of its net assets in a portfolio of equity securities of publicly traded U.S. companies. Equity securities include common stocks and common or preferred shares of real estate investment trusts (“REITs”).
Market Outlook
The 12-month period ended November 30, 2020 was one defined by the novel coronavirus (“COVID-19”) pandemic; the returns on global equity market were dependent on its ability to handle the pandemic and the resilience of its underlying earnings to the pandemic.
The final month of the 2019 calendar year and the first month of 2020 were overall positive for equity markets. Led by the S&P 500® Index (the "S&P 500"), global markets rose to varying degrees on the prospect of decreased tensions between the U.S. and China. However, this rally was quickly ended as the COVID-19 pandemic swiftly sent the world’s economy into a recession. The month of March 2020 saw some of the steepest declines in regional equity markets ever. These declines were short lived, with April bringing positive gains across each region. This momentum carried into the third quarter of 2020, where the S&P 500, MSCI EAFE® Index and MSCI Emerging® Index all saw double digit gains. However, these gains were not completely equal. The S&P 500 saw a rebound, despite increasing COVID-19 cases, because its Technology sector was able to grow its bottom-line despite the pandemic. The MSCI Emerging Index had the sharpest rebound led by China, which benefited from the tough measures taken by their government to combat the disease. With their official case numbers stabilizing at low levels, the Chinese economy was able to get back to work. The MSCI EAFE Index’s rebound was the smallest, compared to its decline. The main culprit was Europe’s inability to contain COVID-19, tied with its overall value tilt. These three themes carried over into September and October 2020. Asia Pacific and Emerging Markets, driven by China, outperformed, with COVID-19 in Asia’s rear view. The S&P 500 was able to produce tepid gains of less than 1%, on the back of Technology mega caps. Finally, Europe lost ground, on a relative and absolute basis, due to their still combatting COVID-19 combined with structural issues that existed prior to, but were exasperated, by COVID-19.
In the final month of the fiscal year, positive vaccine breakthroughs caused value equities to sharply outperform growth.
2020 Performance Attribution
Broadly, RFFC underperformed its benchmark in fiscal year 2020 ("FY 2020") due to both allocation and selection decisions.
| 1. | Sector Allocation: The sector allocations in RFFC are determined through a bottoms-up process that ranks stocks on three fundamental cornerstones: value, quality and momentum/sentiment. If a sector produces more highly ranked stocks relative to another sector, that sector’s allocation is allowed to exceed its benchmark by a tolerable level, and vice versa. Sector allocation was a slightly negative contributor for RFFC in FY 2020. |
| a. | Positive contributors: The over-weight to consumer cyclicals and underweights to financials and utilities were positive contributors. |
| b. | Negative contributors: The portfolio’s underweights to energy and healthcare and over-weight to consumer services negatively impacted portfolio returns. |
| 2. | Security Selection: The investment selection process behind RFFC is built on making a number of security selection choices. This means that there are rarely just one or two things contributing to the returns in the Fund. In FY 2020, our equity selection posted negative results in aggregate. A few of the top themes that contributed most to performance in the year were: |
| a. | Positive contributors: Security selection in healthcare, consumer staples, and industrials were net positives. |
| b. | Negative contributors: Security selection in consume cyclicals, non-energy materials, technology, and financials were detractors. |
2021 Outlook
Going forward, RiverFront believes stocks will rise over the next 12-18 months, recognizing that short-term risk remains high with continued COVID-19 concerns, until a vaccine can be distributed. Across RiverFront’s equity portfolios, the portfolios are slightly overweight equities compared to their respective benchmarks. From a selection standpoint, RiverFront believes asset classes and stocks that can deliver growth should continue to be valued at a premium to their peers.
There are several potential catalysts on the near-term horizon including another stimulus bill, further advances in COVID-19 treatment and earnings season. From a macro standpoint, we believe that low interest rates and accommodative policy will continue to provide support for stocks globally. Thus, we believe that international equities provide a relatively attractive long-term return potential relative to fixed income alternatives in the United States or abroad. We find the relative valuation of international equities to domestic equities also compelling, but value is not in and of itself a ‘catalyst’ - a timing signal - for stocks, in our opinion. International equities have long been awaiting a positive catalyst to help drive relative performance versus the S&P 500. While fears of a COVID-19 “second wave” continue to spike along with case counts in both the United States and across Europe, economic fallout from the first wave of COVID-19 has sparked historic levels of fiscal and monetary stimulus from European and Asian policy makers. Monetary supply is now growing in most major economies of the world, a positive for stocks in our opinion. On the currency front, we remain of the view that the U.S. Dollar may have reached a structural peak, and do not intend to hedge to dollars at current prices – we will reconsider that on a currency by currency basis should the currency crosses rise.
RiverFront Dynamic US Flex-Cap ETF
| Performance Overview | November 30, 2020 (Unaudited) |
Performance (as of November 30, 2020)
| | 1 Year | 3 Year | Since Inception^ |
| RiverFront Dynamic US Flex-Cap ETF – NAV | 9.75% | 6.42% | 10.75% |
| RiverFront Dynamic US Flex-Cap ETF – Market Price* | 9.78% | 6.43% | 10.76% |
| S&P Composite 1500® Total Return Index | 16.67% | 12.48% | 14.61% |
Total Expense Ratio (per the current prospectus) is 0.52%.
Performance data quoted represents past performance. Past performance does not guarantee future results. Total return figures assume reinvestment of dividends and capital gains distributions, if any. The table does not reflect the deduction of taxes that a shareholder would pay on Fund distributions or the redemption of Fund shares. Investment return and principal value of an investment will fluctuate so that an investor’s shares, when sold or redeemed, may be worth more or less than the original cost. Current performance data may be higher or lower than actual data quoted. For the most current month-end performance data please visit www.alpsfunds.com or call 1.866.759.5679.
NAV is an exchange-traded fund’s per-share value. The per-share dollar amount of the fund is derived by dividing the total value of all the securities in its portfolio, less any liabilities, by the number of fund shares outstanding. Market Price is the price at which a share can currently be traded in the market. Information detailing the number of days the Market Price of the Fund was greater than the Fund’s NAV and the number of days it was less than the Fund’s NAV can be obtained at www.alpsfunds.com.
| ^ | The Fund commenced operations on June 7, 2016. |
| * | Market Price means the official closing price of a share or, if it more accurately reflects the market value of a share at the time as of which the Fund calculates current net asset value per share, the price that is the midpoint of the bid-ask spread as of that time. It does not represent the returns an investor would receive if shares were traded at other times. |
S&P Composite 1500® Total Return Index is the Standard & Poor’s broad-based unmanaged capitalization-weighted index comprising 1,500 stocks of Large-cap, Mid-cap, and Small-cap U.S. companies. The index is reported on a total return basis, which assumes reinvestment of any dividends and distributions realized during a given time period. The index is not actively managed and does not reflect any deductions for fees, expenses or taxes. One cannot invest directly in an index. Index performance does not reflect fund performance.
The RiverFront Dynamic US Flex-Cap ETF is not suitable for all investors. Investments in the Fund are subject to investment risks, including possible loss of the principal amount invested.
The Fund’s shares are not individually redeemable. Investors buy and sell shares of the Fund on a secondary market. Only market makers or “authorized participants” may trade directly with the Fund, typically in blocks of 50,000 shares.
ALPS Portfolio Solutions Distributor, Inc., a FINRA member, is the Distributor for the RiverFront Dynamic US Flex-Cap ETF.
RiverFront Dynamic US Flex-Cap ETF
| Performance Overview | November 30, 2020 (Unaudited) |
Top 10 Holdings* (as of November 30, 2020)
| Apple, Inc. | 5.33% |
| Microsoft Corp. | 5.12% |
| Amazon.com, Inc. | 3.67% |
| Visa, Inc. | 1.75% |
| UnitedHealth Group, Inc. | 1.61% |
| Procter & Gamble Co. | 1.57% |
| Mastercard, Inc. | 1.55% |
| PayPal Holdings, Inc. | 1.45% |
| Verizon Communications, Inc. | 1.37% |
| Walmart, Inc. | 1.35% |
| Total % of Top 10 Holdings | 24.77% |
* % of Total Investments (excluding investments purchased with collateral from securities loaned)
Asset Allocation* (as of November 30, 2020)
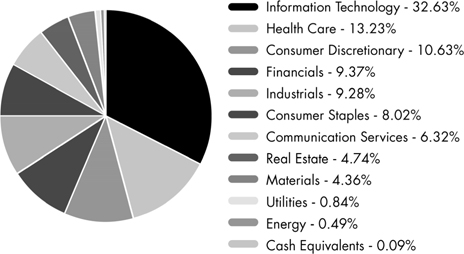
Future holdings are subject to change.
Growth of $10,000 (as of November 30, 2020)
Comparison of Change in Value of $10,000 Investment in the Fund and the Fund’s benchmark
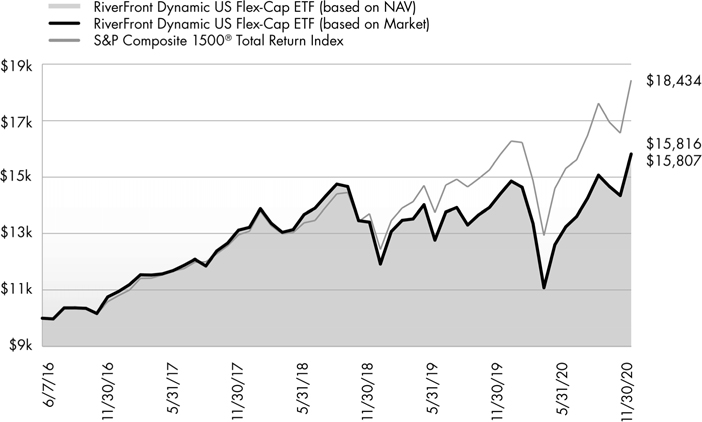
The chart above compares historical performance of a hypothetical investment of $10,000 in the Fund since inception with the performance of the Fund’s benchmark index. Results include the reinvestment of all dividends and capital gains distributions. Past performance does not guarantee future results. The graph does not reflect the deduction of taxes that a shareholder would pay on Fund distributions or the redemption of Fund shares.
RiverFront Strategic Income Fund
| Performance Overview | November 30, 2020 (Unaudited) |
Investment Objective
The RiverFront Strategic Income Fund (the “Fund” or "RIGS") seeks total return, with an emphasis on income as the source of that total return. The Fund seeks to achieve its investment objective by investing in a global portfolio of fixed income securities of various maturities, ratings and currency denominations. The Fund utilizes various investment strategies in a broad array of fixed income sectors.
Market Outlook
The 12-month period ended November 30, 2020 was one defined by the novel coronavirus (“COVID-19”) pandemic; the returns on global equity market were dependent on its ability to handle the pandemic and the resilience of its underlying earnings to the pandemic.
The final month of the 2019 calendar year and the first month of 2020 were overall positive for equity markets. Led by the S&P 500® Index (the "S&P 500"), global markets rose to varying degrees on the prospect of decreased tensions between the U.S. and China. However, this rally was quickly ended as the COVID-19 pandemic swiftly sent the world’s economy into a recession. The month of March 2020 saw some of the steepest declines in regional equity markets ever. These declines were short lived, with April bringing positive gains across each region. This momentum carried into the third quarter of 2020, where the S&P 500, MSCI EAFE® Index and MSCI Emerging® Index all saw double digit gains. However, these gains were not completely equal. The S&P 500 saw a rebound, despite increasing COVID-19 cases, because its Technology sector was able to grow its bottom-line despite the pandemic. The MSCI Emerging Index had the sharpest rebound led by China, which benefited from the tough measures taken by their government to combat the disease. With their official case numbers stabilizing at low levels, the Chinese economy was able to get back to work. The MSCI EAFE Index’s rebound was the smallest, compared to its decline. The main culprit was Europe’s inability to contain COVID-19, tied with its overall value tilt. These three themes carried over into September and October 2020. Asia Pacific and Emerging Markets, driven by China, outperformed, with COVID-19 in Asia’s rear view. The S&P 500 was able to produce tepid gains of less than 1%, on the back of Technology mega caps. Finally, Europe lost ground, on a relative and absolute basis, due to their still combatting COVID-19 combined with structural issues that existed prior to but were exasperated by COVID-19.
In the final month of the fiscal year, positive vaccine breakthroughs caused value equities to sharply outperform growth.
2020 Performance Attribution
RIGS underperformed its benchmark for the 12-month period ending November 30, 2020. The underperformance was primarily due to its shorter duration and exposure to high yield.
Negative Contributors:
| · | Selection within Credit: The Fund held high yield exposure throughout the period versus the benchmark’s exposure to investment grade corporates. Investment grade corporates outperformed high yield thus leading to the most of the Fund’s underperformance. |
| · | Lack of exposure to Rates: The Fund had no exposure to Treasuries during a period when the long end of the curve saw yields fall by 98 basis points on the 10-year and 60 basis points on the 30-year. |
Positive Contributors:
| · | Allocation Overweight to Credit: The Fund was allocated to shorter duration credit versus the longer duration of The Bloomberg Barclays US Aggregate. While longer duration credit outperformed during the period, having a larger allocation of shorter duration high yield closed the underperformance gap. |
2021 Outlook
Going forward, RiverFront believes stocks will rise over the next 12-18 months, recognizing that short-term risk remains high with continued COVID-19 concerns, until a vaccine can be distributed. Across RiverFront’s equity portfolios, the portfolios are slightly overweight equities compared to their respective benchmarks. From a selection standpoint, RiverFront believes asset classes and stocks that can deliver growth should continue to be valued at a premium to their peers.
There are several potential catalysts on the near-term horizon including another stimulus bill, further advances in COVID-19 treatment and earnings season. From a macro standpoint, we believe that low interest rates and accommodative policy will continue to provide support for stocks globally. Thus, we believe that international equities provide a relatively attractive long-term return potential relative to fixed income alternatives in the United States or abroad. We find the relative valuation of international equities to domestic equities also compelling, but value is not in and of itself a ‘catalyst’ - a timing signal - for stocks, in our opinion. International equities have long been awaiting a positive catalyst to help drive relative performance versus the S&P 500. While fears of a COVID-19 “second wave” continue to spike along with case counts in both the United States and across Europe, economic fallout from the first wave of COVID-19 has sparked historic levels of fiscal and monetary stimulus from European and Asian policy makers. Monetary supply is now growing in most major economies of the world, a positive for stocks in our opinion. On the currency front, we remain of the view that the U.S. Dollar may have reached a structural peak, and do not intend to hedge to dollars at current prices – we will reconsider that on a currency by currency basis should the currency crosses rise.
Going into 2021, the expectation is for the yield curve to steepen as financial markets deal with an easy monetary policy and possible fiscal stimulus. With the yield of the 10-year Treasury beginning to inch up ever so slightly, RiverFront Investment Group, LLC (“RiverFront”) believes the path is being paved for yields to breach 1% and potentially trade within a 50-basis point range between .80% and 1.30%. Given the need for income by fixed income investors, it will be important to focus investments towards spread products such as investment grade corporate bonds and high yield securities. RiverFront believes that 2021, will offer continued opportunities for these two asset classes to experience further spread tightening relative to Treasuries if the yield curve steepens. However, RiverFront acknowledges that there will be a cap on how high yields will climb given the roughly $17 trillion of negative yielding debt globally.
RiverFront Strategic Income Fund
| Performance Overview | November 30, 2020 (Unaudited) |
Performance (as of November 30, 2020)
| | 1 Year | 5 Year | Since Inception^ |
| RiverFront Strategic Income Fund – NAV | 3.95% | 4.61% | 4.17% |
| RiverFront Strategic Income Fund – Market Price* | 3.53% | 4.56% | 4.14% |
| Bloomberg Barclays U.S. Aggregate Bond Total Return Index | 7.28% | 4.34% | 3.96% |
Total Expense Ratio (per the current prospectus) is 0.47%. The Fund’s management fees consist of a fee of 0.11% paid to the Fund’s investment adviser and a fee of 0.35% paid to the Fund’s sub-adviser.
Performance data quoted represents past performance. Past performance does not guarantee future results. Total return figures assume reinvestment of dividends and capital gains distributions, if any. The table does not reflect the deduction of taxes that a shareholder would pay on Fund distributions or the redemption of Fund shares. Investment return and principal value of an investment will fluctuate so that an investor’s shares, when sold or redeemed, may be worth more or less than the original cost. Current performance data may be higher or lower than actual data quoted. For most current month-end performance data please visit www.alpsfunds.com or call 1.866.759.5679.
NAV is an exchange-traded fund’s per-share value. The per-share dollar amount of the Fund is derived by dividing the total value of all the securities in its portfolio, less any liabilities, by the number of Fund shares outstanding. Market Price is the price at which a share can currently be traded in the market. Information detailing the number of days the Market Price of the Fund was greater than the Fund’s NAV and the number of days it was less than the Fund’s NAV can be obtained at www.alpsfunds.com.
| ^ | The Fund commenced Investment Operations on October 8, 2013. |
| * | Market Price means the official closing price of a share or, if it more accurately reflects the market value of a share at the time as of which the Fund calculates current net asset value per share, the price that is the midpoint of the bid-ask spread as of that time. It does not represent the returns an investor would receive if shares were traded at other times. |
Duration is a measure of the sensitivity of the price (the value of principal) of a fixed-income investment to a change in interest rates. Duration is expressed as a number of years. The duration number is a calculation involving present value, yield, coupon, final maturity and call features. The bigger the duration number, the greater the interest-rate risk or reward for bond prices. Rising interest rates mean falling bond prices, while declining interest rates mean rising bond prices.
Bloomberg Barclays U.S. Aggregate Bond Total Return Index is a broad-based benchmark that measures the investment grade, U.S. dollar-denominated, fixed-rate taxable bond market, including Treasuries, government-related and corporate securities, MBS (agency fixed-rate and hybrid ARM pass-throughs), ABS, and CMBS (agency and non-agency). The index is reported on a total return basis, which assumes reinvestment of any dividends and distributions realized during a given time period. The index is not actively managed and does not reflect any deductions for fees, expenses or taxes. One cannot invest directly in an index. Index performance does not reflect fund performance.
The RiverFront Strategic Income Fund is not suitable for all investors. Investments in the Fund are subject to investment risks, including possible loss of the principal amount invested.
ALPS Portfolio Solutions Distributor, Inc., a FINRA member, is the distributor for the RiverFront Strategic Income Fund.
RiverFront Strategic Income Fund
| Performance Overview | November 30, 2020 (Unaudited) |
Top 10 Holdings*^ (as of November 30, 2020)
| XPO Logistics, Inc. | 2.03% |
| CIT Group, Inc. | 1.59% |
| Park Aerospace Holdings, Ltd. | 1.53% |
| WESCO Distribution, Inc. | 1.51% |
| JPMorgan Chase & Co. | 1.37% |
| Citigroup, Inc. | 1.37% |
| FMG Resources August 2006 Pty, Ltd. | 1.36% |
| Bank of America Corp. | 1.36% |
| Goldman Sachs Group, Inc. | 1.34% |
| Vistra Operations Co. LLC | 1.30% |
| Total % of Top 10 Holdings | 14.76% |
| ^ | Excludes Money Market Fund |
Asset Allocation* (as of November 30, 2020)
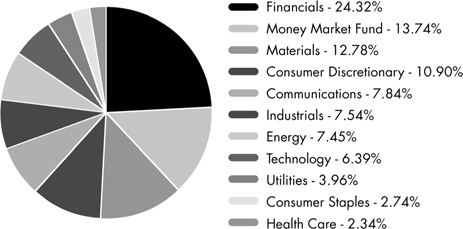
Future holdings are subject to change.
Growth of $10,000 (as of November 30, 2020)
Comparison of Change in Value of $10,000 Investment in the Fund and the Fund’s benchmark
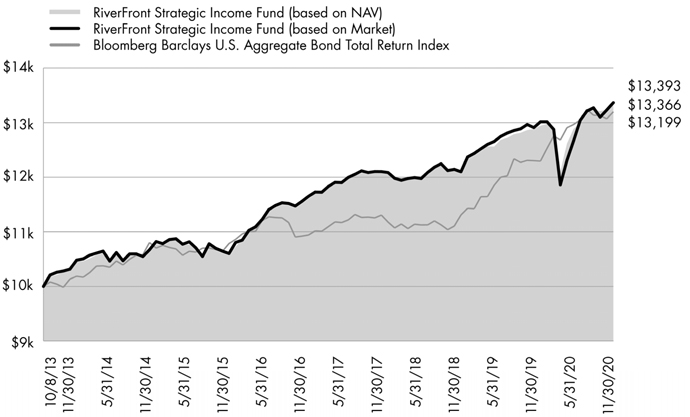
The chart above compares historical performance of a hypothetical investment of $10,000 in the Fund since inception with the performance of the Fund’s benchmark index. Results include the reinvestment of all dividends and capital gains distributions. Past performance does not guarantee future results. The graph does not reflect the deduction of taxes that a shareholder would pay on Fund distributions or the redemption of Fund shares.
RiverFront ETFs
| Disclosure of Fund Expenses | November 30, 2020 (Unaudited) |
Shareholder Expense Example: As a shareholder of a Fund, you incur certain ongoing costs, including management fees and other Fund expenses. These examples are intended to help you understand your ongoing costs (in dollars) of investing in a Fund and to compare these costs with the ongoing costs of investing in other funds. It is based on an investment of $1,000 invested at the beginning of the (six month) period and held through November 30, 2020.
Actual Return: The first line of the table provides information about actual account values and actual expenses. You may use the information in this line, together with the amount you invested, to estimate the expenses that you incurred over the period. Simply divide your account value by $1,000 (for example, an $8,600 account value divided by $1,000 = 8.6), then multiply the result by the number in the first line under the heading entitled “Expenses Paid During Period” to estimate the expenses attributable to your investment during this period.
Hypothetical 5% Return: The second line of the table provides information about hypothetical account values and hypothetical expenses based on the Fund’s actual expense ratio and an assumed rate of return of 5% per year before expenses, which is not the Fund’s actual return. The hypothetical account values and expenses may not be used to estimate the actual ending account balance or expenses you paid for the period. You may use this information to compare ongoing costs of investing in the Fund and other funds. To do so, compare this 5% hypothetical example with the 5% hypothetical examples that appear in the shareholder reports of other funds.
The expenses shown in the table are meant to highlight ongoing Fund costs only and do not reflect any transaction costs, such as brokerage commissions and other fees to financial intermediaries. Therefore, the second line is useful in comparing ongoing costs only, and will not help you determine the relative total costs of owning different funds. In addition, if these costs were included, your costs would have been higher.
| | | Beginning Account Value 6/1/20 | | | Ending Account Value 11/30/20 | | | Expense Ratio(a) | | Expenses Paid During Period 6/1/20 - 11/30/20(b) | |
| RiverFront Dynamic Core Income ETF | | | | | | | | | | | | | | |
| Actual | | $ | 1,000.00 | | | $ | 1,012.00 | | | 0.51% | | $ | 2.57 | |
| Hypothetical (5% return before expenses) | | $ | 1,000.00 | | | $ | 1,022.45 | | | 0.51% | | $ | 2.58 | |
| RiverFront Dynamic Unconstrained Income ETF | | | | | | | | | | | | | | |
| Actual | | $ | 1,000.00 | | | $ | 1,054.10 | | | 0.51% | | $ | 2.62 | |
| Hypothetical (5% return before expenses) | | $ | 1,000.00 | | | $ | 1,022.45 | | | 0.51% | | $ | 2.58 | |
| RiverFront Dynamic US Dividend Advantage ETF | | | | | | | | | | | | | | |
| Actual | | $ | 1,000.00 | | | $ | 1,175.40 | | | 0.52% | | $ | 2.83 | |
| Hypothetical (5% return before expenses) | | $ | 1,000.00 | | | $ | 1,022.40 | | | 0.52% | | $ | 2.63 | |
| RiverFront Dynamic US Flex-Cap ETF | | | | | | | | | | | | | | |
| Actual | | $ | 1,000.00 | | | $ | 1,194.10 | | | 0.52% | | $ | 2.85 | |
| Hypothetical (5% return before expenses) | | $ | 1,000.00 | | | $ | 1,022.40 | | | 0.52% | | $ | 2.63 | |
| RiverFront Strategic Income Fund | | | | | | | | | | | | | | |
| Actual | | $ | 1,000.00 | | | $ | 1,039.40 | | | 0.46% | | $ | 2.35 | |
| Hypothetical (5% return before expenses) | | $ | 1,000.00 | | | $ | 1,022.70 | | | 0.46% | | $ | 2.33 | |
| (a) | Annualized, based on the Fund's most recent fiscal half year expenses. |
| (b) | Expenses are equal to the Fund's annualized expense ratio multiplied by the average account value over the period, multiplied by the number of days in the most recent fiscal half year (183), divided by 366. |
RiverFront ETFs
Report of Independent Registered Public Accounting Firm
To the shareholders and the Board of Trustees of ALPS ETF Trust:
Opinion on the Financial Statements and Financial Highlights
We have audited the accompanying statements of assets and liabilities, including the statements of investments, of RiverFront Dynamic Core Income ETF, RiverFront Dynamic Unconstrained Income ETF, RiverFront Dynamic US Dividend Advantage ETF, RiverFront Dynamic US Flex-Cap ETF and RiverFront Strategic Income Fund (the “Funds”), five of the funds constituting the ALPS ETF Trust, as of November 30, 2020, the related statements of operations for the year then ended, the statements of changes in net assets for each of the two years in the period then ended, and the financial highlights for the periods indicated in the table below, and the related notes.
In our opinion, the financial statements and financial highlights present fairly, in all material respects, the financial position of the Funds as of November 30, 2020, and the results of their operations for the year then ended, the changes in their net assets for each of the two years in the period then ended, and the financial highlights for the periods indicated in the table below, in conformity with accounting principles generally accepted in the United States of America.
| Individual Fund Comprising the ALPS ETF Trust | Statement of Operations, For the year ended | Statements of Changes in Net Assets for each of the Years in the Period then Ended | Financial Highlights for each of the Years in the Period then Ended |
RiverFront Dynamic Core Income ETF RiverFront Dynamic Unconstrained Income ETF | November 30, 2020 | November 30, 2020 and 2019 | November 30, 2020, 2019, 2018, 2017, and for the period June 14, 2016 (commencement of operations) to November 30, 2016 |
RiverFront Dynamic US Dividend Advantage ETF RiverFront Dynamic US Flex-Cap ETF | November 30, 2020 | November 30, 2020 and 2019 | November 30, 2020, 2019, 2018, 2017 and for the period June 7, 2016 (commencement of operations) to November 30, 2016 |
| RiverFront Strategic Income Fund | November 30, 2020 | November 30, 2020 and 2019 | November 30, 2020, Five years |
Basis for Opinion
These financial statements and financial highlights are the responsibility of the Funds’ management. Our responsibility is to express an opinion on the Funds’ financial statements and financial highlights based on our audits. We are a public accounting firm registered with the Public Company Accounting Oversight Board (United States) (PCAOB) and are required to be independent with respect to the Funds in accordance with the U.S. federal securities laws and the applicable rules and regulations of the Securities and Exchange Commission and the PCAOB.
We conducted our audits in accordance with the standards of the PCAOB. Those standards require that we plan and perform the audit to obtain reasonable assurance about whether the financial statements and financial highlights are free of material misstatement, whether due to error or fraud. The Funds are not required to have, nor were we engaged to perform, an audit of their internal control over financial reporting. As part of our audits, we are required to obtain an understanding of internal control over financial reporting but not for the purpose of expressing an opinion on the effectiveness of the Funds’ internal control over financial reporting. Accordingly, we express no such opinion.
Our audits included performing procedures to assess the risks of material misstatement of the financial statements and financial highlights, whether due to error or fraud, and performing procedures that respond to those risks. Such procedures included examining, on a test basis, evidence regarding the amounts and disclosures in the financial statements and financial highlights. Our audits also included evaluating the accounting principles used and significant estimates made by management, as well as evaluating the overall presentation of the financial statements and financial highlights. Our procedures included confirmation of securities owned as of November 30, 2020, by correspondence with the custodian and brokers; when replies were not received from brokers, we performed other auditing procedures. We believe that our audits provide a reasonable basis for our opinion.
DELOITTE & TOUCHE LLP
Denver, Colorado
January 25, 2021
We have served as the auditor of one or more investment companies advised by ALPS Advisors, Inc. since 2007.
RiverFront Dynamic Core Income ETF
| Schedule of Investments | November 30, 2020 |
| | | Principal | | | | |
| Security Description | | Amount | | | Value | |
| CORPORATE BONDS (63.13%) | | | | | | | | |
| Communications (5.68%) | | | | | | | | |
| Alphabet, Inc. | | | | | | | | |
| 2.00%, 08/15/2026 | | $ | 183,000 | | | $ | 196,223 | |
| AT&T, Inc. | | | | | | | | |
| 3.40%, 05/15/2025 | | | 122,000 | | | | 135,985 | |
| 4.10%, 02/15/2028 | | | 1,620,000 | | | | 1,907,817 | |
| Comcast Corp. | | | | | | | | |
| 3.60%, 03/01/2024 | | | 67,000 | | | | 73,675 | |
| 3.55%, 05/01/2028 | | | 183,000 | | | | 211,681 | |
| 4.15%, 10/15/2028 | | | 1,013,000 | | | | 1,220,401 | |
| Discovery Communications LLC | | | | | | | | |
| 2.95%, 03/20/2023 | | | 65,000 | | | | 68,576 | |
| 3.95%, 03/20/2028 | | | 122,000 | | | | 139,725 | |
| Time Warner Cable LLC | | | | | | | | |
| 4.00%, 09/01/2021 | | | 86,000 | | | | 87,406 | |
| T-Mobile USA, Inc. | | | | | | | | |
| 4.00%, 04/15/2022 | | | 183,000 | | | | 189,292 | |
| TWDC Enterprises 18 Corp. | | | | | | | | |
| 2.45%, 03/04/2022 | | | 61,000 | | | | 62,568 | |
| 3.15%, 09/17/2025 | | | 37,000 | | | | 41,155 | |
| VeriSign, Inc. | | | | | | | | |
| 4.63%, 05/01/2023 | | | 183,000 | | | | 185,173 | |
| Verizon Communications, Inc. | | | | | | | | |
| 3.38%, 02/15/2025 | | | 789,000 | | | | 876,885 | |
| 3M US L + 1.10%, | | | | | | | | |
| 05/15/2025(a) | | | 105,000 | | | | 107,904 | |
| 4.33%, 09/21/2028 | | | 183,000 | | | | 222,299 | |
| 4.02%, 12/03/2029 | | | 104,000 | | | | 124,303 | |
| ViacomCBS, Inc. | | | | | | | | |
| 3.50%, 01/15/2025 | | | 344,000 | | | | 376,601 | |
| 3.70%, 06/01/2028 | | | 37,000 | | | | 41,998 | |
| Walt Disney Co. | | | | | | | | |
| 3.00%, 09/15/2022 | | | 122,000 | | | | 127,729 | |
| Total Communications | | | | | | | 6,397,396 | |
| | | | | | | | | |
| Consumer Discretionary (4.70%) | | | | | | | | |
| ADT Security Corp. | | | | | | | | |
| 4.13%, 06/15/2023 | | | 86,000 | | | | 90,784 | |
| Alibaba Group Holding, Ltd. | | | | | | | | |
| 3.60%, 11/28/2024 | | | 252,000 | | | | 278,118 | |
| 3.40%, 12/06/2027 | | | 183,000 | | | | 205,805 | |
| Amazon.com, Inc. | | | | | | | | |
| 3.15%, 08/22/2027 | | | 377,000 | | | | 429,115 | |
| American Honda Finance Corp. | | | | | | | | |
| 2.60%, 11/16/2022 | | | 140,000 | | | | 146,192 | |
| Delta Air Lines, Inc. | | | | | | | | |
| 3.40%, 04/19/2021 | | | 183,000 | | | | 183,246 | |
| eBay, Inc. | | | | | | | | |
| 3.45%, 08/01/2024 | | | 122,000 | | | | 133,205 | |
| General Motors Financial Co., Inc. | | | | | | | | |
| 4.38%, 09/25/2021 | | | 61,000 | | | | 62,755 | |
| 3.70%, 05/09/2023 | | | 322,000 | | | | 341,087 | |
| 3.60%, 06/21/2030 | | | 1,000,000 | | | | 1,117,257 | |
| Goodyear Tire & Rubber Co. | | | | | | | | |
| 5.13%, 11/15/2023 | | | 183,000 | | | | 183,631 | |
| | | Principal | | | | |
| Security Description | | Amount | | | Value | |
| Consumer Discretionary (continued) | | | | | | | | |
| Hilton Worldwide Finance LLC / | | | | | | | | |
| Hilton Worldwide Finance Corp. | | | | | | | | |
| 4.63%, 04/01/2025 | | $ | 61,000 | | | $ | 62,410 | |
| Home Depot, Inc. | | | | | | | | |
| 2.70%, 04/01/2023 | | | 252,000 | | | | 264,563 | |
| Lowe's Cos., Inc. | | | | | | | | |
| 2.50%, 04/15/2026 | | | 122,000 | | | | 132,274 | |
| 3.10%, 05/03/2027 | | | 122,000 | | | | 136,721 | |
| Marriott International, Inc. | | | | | | | | |
| 4.00%, 04/15/2028(b) | | | 171,000 | | | | 185,412 | |
| McDonald's Corp. | | | | | | | | |
| 3.70%, 01/30/2026 | | | 183,000 | | | | 207,800 | |
| 3.50%, 03/01/2027 | | | 61,000 | | | | 69,585 | |
| Starbucks Corp. | | | | | | | | |
| 3.85%, 10/01/2023 | | | 183,000 | | | | 198,802 | |
| TJX Cos., Inc. | | | | | | | | |
| 2.75%, 06/15/2021 | | | 61,000 | | | | 61,569 | |
| Toyota Motor Corp. | | | | | | | | |
| 3.42%, 07/20/2023 | | | 453,000 | | | | 488,542 | |
| Toyota Motor Credit Corp. | | | | | | | | |
| 3M US L + 0.39%, | | | | | | | | |
| 01/11/2023(a) | | | 183,000 | | | | 183,624 | |
| 3.20%, 01/11/2027 | | | 122,000 | | | | 137,492 | |
| Total Consumer Discretionary | | | | | | | 5,299,989 | |
| | | | | | | | | |
| Consumer Staples (2.66%) | | | | | | | | |
| Anheuser-Busch InBev | | | | | | | | |
| Worldwide, Inc. | | | | | | | | |
| 4.15%, 01/23/2025 | | | 875,000 | | | | 994,540 | |
| 4.00%, 04/13/2028 | | | 122,000 | | | | 143,134 | |
| Constellation Brands, Inc. | | | | | | | | |
| 2.70%, 05/09/2022 | | | 61,000 | | | | 62,863 | |
| 4.25%, 05/01/2023 | | | 183,000 | | | | 199,216 | |
| 4.75%, 12/01/2025 | | | 61,000 | | | | 72,092 | |
| Kroger Co. | | | | | | | | |
| 3.70%, 08/01/2027 | | | 62,000 | | | | 71,831 | |
| PepsiCo, Inc. | | | | | | | | |
| 1.70%, 10/06/2021 | | | 453,000 | | | | 458,206 | |
| 3.10%, 07/17/2022 | | | 183,000 | | | | 190,684 | |
| Procter & Gamble Co. | | | | | | | | |
| 2.45%, 11/03/2026 | | | 183,000 | | | | 201,643 | |
| Walmart, Inc. | | | | | | | | |
| 3.40%, 06/26/2023 | | | 175,000 | | | | 188,365 | |
| 3.30%, 04/22/2024 | | | 183,000 | | | | 199,078 | |
| 3.70%, 06/26/2028 | | | 183,000 | | | | 216,185 | |
| Total Consumer Staples | | | | | | | 2,997,837 | |
| | | | | | | | | |
| Energy (5.82%) | | | | | | | | |
| BP Capital Markets America, Inc. | | | | | | | | |
| 3.25%, 05/06/2022 | | | 644,000 | | | | 670,724 | |
| BP Capital Markets PLC | | | | | | | | |
| 3.51%, 03/17/2025 | | | 171,000 | | | | 190,625 | |
| 3.72%, 11/28/2028 | | | 122,000 | | | | 140,942 | |
See Notes to Financial Statements.
RiverFront Dynamic Core Income ETF
| Schedule of Investments | November 30, 2020 |
| | | Principal | | | | |
| Security Description | | Amount | | | Value | |
| Energy (continued) | | | | | | | | |
| Chevron Corp. | | | | | | | | |
| 2.90%, 03/03/2024 | | $ | 322,000 | | | $ | 344,945 | |
| 3.33%, 11/17/2025 | | | 183,000 | | | | 205,945 | |
| 2.95%, 05/16/2026 | | | 180,000 | | | | 199,418 | |
| Concho Resources, Inc. | | | | | | | | |
| 3.75%, 10/01/2027 | | | 122,000 | | | | 138,853 | |
| ConocoPhillips Co. | | | | | | | | |
| 4.95%, 03/15/2026 | | | 122,000 | | | | 146,625 | |
| Continental Resources, Inc. | | | | | | | | |
| 4.50%, 04/15/2023 | | | 183,000 | | | | 187,910 | |
| 3.80%, 06/01/2024 | | | 183,000 | | | | 185,354 | |
| Energy Transfer Operating LP | | | | | | | | |
| 3.60%, 02/01/2023 | | | 108,000 | | | | 112,207 | |
| 4.25%, 03/15/2023 | | | 35,000 | | | | 36,879 | |
| Enterprise Products Operating LLC | | | | | | | | |
| 3.35%, 03/15/2023 | | | 322,000 | | | | 341,037 | |
| Exxon Mobil Corp. | | | | | | | | |
| 2.22%, 03/01/2021 | | | 322,000 | | | | 323,032 | |
| 3.04%, 03/01/2026 | | | 453,000 | | | | 501,376 | |
| Halliburton Co. | | | | | | | | |
| 3.80%, 11/15/2025 | | | 10,000 | | | | 11,067 | |
| Kinder Morgan Energy Partners LP | | | | | | | | |
| 4.25%, 09/01/2024 | | | 183,000 | | | | 203,170 | |
| Marathon Oil Corp. | | | | | | | | |
| 4.40%, 07/15/2027 | | | 37,000 | | | | 40,394 | |
| Marathon Petroleum Corp. | | | | | | | | |
| 3.80%, 04/01/2028 | | | 122,000 | | | | 133,472 | |
| MPLX LP | | | | | | | | |
| 4.50%, 07/15/2023 | | | 171,000 | | | | 185,475 | |
| 5.25%, 01/15/2025 | | | 198,000 | | | | 203,453 | |
| Newfield Exploration Co. | | | | | | | | |
| 5.63%, 07/01/2024 | | | 183,000 | | | | 194,495 | |
| ONEOK Partners LP | | | | | | | | |
| 3.38%, 10/01/2022 | | | 322,000 | | | | 335,381 | |
| Sabine Pass Liquefaction LLC | | | | | | | | |
| 5.63%, 04/15/2023 | | | 252,000 | | | | 276,221 | |
| 5.75%, 05/15/2024 | | | 122,000 | | | | 138,965 | |
| Schlumberger Investment SA | | | | | | | | |
| 3.65%, 12/01/2023 | | | 519,000 | | | | 559,242 | |
| Shell International Finance BV | | | | | | | | |
| 2.88%, 05/10/2026 | | | 183,000 | | | | 202,540 | |
| Williams Cos., Inc. | | | | | | | | |
| 4.55%, 06/24/2024 | | | 122,000 | | | | 137,133 | |
| 3.90%, 01/15/2025 | | | 196,000 | | | | 216,721 | |
| Total Energy | | | | | | | 6,563,601 | |
| | | | | | | | | |
| Financials (26.58%) | | | | | | | | |
| Aflac, Inc. | | | | | | | | |
| 3.63%, 11/15/2024 | | | 252,000 | | | | 282,064 | |
| Aircastle, Ltd. | | | | | | | | |
| 5.50%, 02/15/2022 | | | 252,000 | | | | 259,955 | |
| Ally Financial, Inc. | | | | | | | | |
| 4.13%, 02/13/2022 | | | 471,000 | | | | 490,821 | |
| American Express Credit Corp. | | | | | | | | |
| 2.25%, 05/05/2021 | | | 252,000 | | | | 253,764 | |
| | | Principal | | | | |
| Security Description | | Amount | | | Value | |
| Financials (continued) | | | | | | | | |
| American International Group, Inc. | | | | | | | | |
| 4.13%, 02/15/2024 | | $ | 106,000 | | | $ | 118,134 | |
| 3.90%, 04/01/2026 | | | 122,000 | | | | 139,438 | |
| Bank of America Corp. | | | | | | | | |
| 3M US L + 0.77%, | | | | | | | | |
| 02/05/2026(a) | | | 644,000 | | | | 646,286 | |
| 4.25%, 10/22/2026 | | | 1,578,000 | | | | 1,844,500 | |
| Bank of Montreal | | | | | | | | |
| 1.90%, 08/27/2021 | | | 644,000 | | | | 651,974 | |
| 2.35%, 09/11/2022 | | | 183,000 | | | | 189,927 | |
| 2.55%, 11/06/2022 | | | 122,000 | | | | 127,231 | |
| Bank of New York Mellon Corp. | | | | | | | | |
| 3M US L + 1.05%, | | | | | | | | |
| 10/30/2023(a) | | | 315,000 | | | | 320,302 | |
| 3.25%, 05/16/2027 | | | 46,000 | | | | 52,114 | |
| Barclays PLC | | | | | | | | |
| 3M US L + 1.38%, | | | | �� | | | | |
| 05/16/2024(a) | | | 322,000 | | | | 325,808 | |
| Berkshire Hathaway, Inc. | | | | | | | | |
| 3.13%, 03/15/2026 | | | 322,000 | | | | 361,711 | |
| BNP Paribas SA | | | | | | | | |
| 5.00%, 01/15/2021 | | | 106,000 | | | | 106,600 | |
| 3.25%, 03/03/2023 | | | 171,000 | | | | 182,213 | |
| Boston Properties LP | | | | | | | | |
| 3.85%, 02/01/2023 | | | 519,000 | | | | 552,435 | |
| Capital One Financial Corp. | | | | | | | | |
| 3.50%, 06/15/2023 | | | 392,000 | | | | 420,727 | |
| 3.30%, 10/30/2024 | | | 86,000 | | | | 93,507 | |
| 3.80%, 01/31/2028 | | | 33,000 | | | | 37,949 | |
| Charles Schwab Corp. | | | | | | | | |
| 2.65%, 01/25/2023 | | | 183,000 | | | | 191,948 | |
| Chubb INA Holdings, Inc. | | | | | | | | |
| 2.70%, 03/13/2023 | | | 76,000 | | | | 79,969 | |
| 3.35%, 05/03/2026 | | | 311,000 | | | | 351,704 | |
| Citigroup, Inc. | | | | | | | | |
| 2.70%, 03/30/2021 | | | 233,000 | | | | 234,852 | |
| 3M US L + 1.43%, | | | | | | | | |
| 09/01/2023(a) | | | 322,000 | | | | 327,759 | |
| 4.45%, 09/29/2027 | | | 183,000 | | | | 214,843 | |
| 6.63%, 06/15/2032 | | | 654,000 | | | | 933,064 | |
| CME Group, Inc. | | | | | | | | |
| 3.75%, 06/15/2028 | | | 61,000 | | | | 72,138 | |
| Cooperatieve Rabobank UA | | | | | | | | |
| 4.63%, 12/01/2023 | | | 322,000 | | | | 358,655 | |
| CoreCivic, Inc. | | | | | | | | |
| 4.63%, 05/01/2023 | | | 183,000 | | | | 172,477 | |
| Credit Suisse Group AG | | | | | | | | |
| 4.55%, 04/17/2026 | | | 294,000 | | | | 344,749 | |
| Credit Suisse Group Funding | | | | | | | | |
| Guernsey, Ltd. | | | | | | | | |
| 3.13%, 12/10/2020 | | | 105,000 | | | | 105,067 | |
| 3.45%, 04/16/2021 | | | 106,000 | | | | 107,221 | |
| Deutsche Bank AG | | | | | | | | |
| 4.25%, 10/14/2021 | | | 183,000 | | | | 187,828 | |
| 3.95%, 02/27/2023 | | | 122,000 | | | | 129,602 | |
See Notes to Financial Statements.
RiverFront Dynamic Core Income ETF
| Schedule of Investments | November 30, 2020 |
| | | Principal | | | | |
| Security Description | | Amount | | | Value | |
| Financials (continued) | | | | | | | | |
| Discover Bank | | | | | | | | |
| 3.20%, 08/09/2021 | | $ | 61,000 | | | $ | 62,062 | |
| 4.65%, 09/13/2028 | | | 171,000 | | | | 204,044 | |
| Fidelity National Information | | | | | | | | |
| Services, Inc. | | | | | | | | |
| 3.50%, 04/15/2023 | | | 105,000 | | | | 111,601 | |
| Goldman Sachs Group, Inc. | | | | | | | | |
| 3M US L + 0.75%, | | | | | | | | |
| 02/23/2023(a) | | | 519,000 | | | | 523,325 | |
| 3M US L + 1.60%, | | | | | | | | |
| 11/29/2023(a) | | | 322,000 | | | | 332,947 | |
| 3.50%, 11/16/2026 | | | 39,000 | | | | 43,759 | |
| 5.95%, 01/15/2027 | | | 905,000 | | | | 1,146,681 | |
| Host Hotels & Resorts LP | | | | | | | | |
| 4.00%, 06/15/2025 | | | 122,000 | | | | 129,379 | |
| HSBC Holdings PLC | | | | | | | | |
| 4.30%, 03/08/2026 | | | 171,000 | | | | 196,482 | |
| 3.90%, 05/25/2026 | | | 252,000 | | | | 285,571 | |
| 3M US L + 1.38%, | | | | | | | | |
| 09/12/2026(a) | | | 183,000 | | | | 184,343 | |
| 4.38%, 11/23/2026 | | | 122,000 | | | | 139,594 | |
| Huntington Bancshares, Inc. | | | | | | | | |
| 3.15%, 03/14/2021 | | | 157,000 | | | | 157,893 | |
| 4.00%, 05/15/2025 | | | 37,000 | | | | 42,094 | |
| Huntington National Bank | | | | | | | | |
| 3.25%, 05/14/2021 | | | 252,000 | | | | 254,779 | |
| Intercontinental Exchange, Inc. | | | | | | | | |
| 3.75%, 12/01/2025 | | | 122,000 | | | | 138,502 | |
| 3.10%, 09/15/2027 | | | 166,000 | | | | 185,324 | |
| 3.75%, 09/21/2028 | | | 183,000 | | | | 213,350 | |
| International Lease Finance Corp. | | | | | | | | |
| 5.88%, 08/15/2022 | | | 171,000 | | | | 184,188 | |
| JPMorgan Chase & Co. | | | | | | | | |
| 3.38%, 05/01/2023 | | | 252,000 | | | | 269,435 | |
| 3M US L + 1.23%, | | | | | | | | |
| 10/24/2023(a) | | | 751,000 | | | | 763,963 | |
| 4.25%, 10/01/2027 | | | 1,228,000 | | | | 1,448,347 | |
| KeyBank NA/Cleveland OH | | | | | | | | |
| 3.38%, 03/07/2023 | | | 171,000 | | | | 182,673 | |
| KeyCorp | | | | | | | | |
| 5.10%, 03/24/2021 | | | 392,000 | | | | 397,955 | |
| Lincoln National Corp. | | | | | | | | |
| 3.35%, 03/09/2025 | | | 252,000 | | | | 276,371 | |
| 3.80%, 03/01/2028 | | | 61,000 | | | | 70,022 | |
| M&T Bank Corp. | | | | | | | | |
| 3M US L + 0.68%, | | | | | | | | |
| 07/26/2023(a) | | | 322,000 | | | | 324,527 | |
| Manufacturers & Traders Trust Co. | | | | | | | | |
| 3M US L + 0.27%, | | | | | | | | |
| 01/25/2021(a) | | | 392,000 | | | | 392,127 | |
| MetLife, Inc. | | | | | | | | |
| 3.60%, 04/10/2024 | | | 313,000 | | | | 344,530 | |
| 6.50%, 12/15/2032 | | | 37,000 | | | | 56,276 | |
| | | Principal | | | | |
| Security Description | | Amount | | | Value | |
| Financials (continued) | | | | | | | | |
| Mitsubishi UFJ Financial Group, Inc. | | | | | | | | |
| 3.85%, 03/01/2026 | | $ | 252,000 | | | $ | 290,409 | |
| Mizuho Financial Group, Inc. | | | | | | | | |
| 2.95%, 02/28/2022 | | | 183,000 | | | | 189,003 | |
| 3M US L + 1.00%, | | | | | | | | |
| 09/11/2024(a) | | | 644,000 | | | | 651,110 | |
| 3.17%, 09/11/2027 | | | 61,000 | | | | 68,038 | |
| Morgan Stanley | | | | | | | | |
| 3M US L + 1.40%, | | | | | | | | |
| 10/24/2023(a) | | | 644,000 | | | | 656,347 | |
| 5.00%, 11/24/2025 | | | 392,000 | | | | 467,664 | |
| 3.63%, 01/20/2027 | | | 500,000 | | | | 571,918 | |
| National Australia Bank, Ltd. | | | | | | | | |
| 2.50%, 07/12/2026 | | | 61,000 | | | | 66,486 | |
| Natwest Group PLC | | | | | | | | |
| 3M US L + 1.48%, | | | | | | | | |
| 05/15/2023(a) | | | 252,000 | | | | 262,130 | |
| 3M US L + 1.47%, | | | | | | | | |
| 05/15/2023(a) | | | 322,000 | | | | 325,221 | |
| PNC Financial Services Group, Inc. | | | | | | | | |
| 3.15%, 05/19/2027 | | | 252,000 | | | | 283,855 | |
| 3.45%, 04/23/2029 | | | 1,000,000 | | | | 1,155,412 | |
| Prudential Financial, Inc. | | | | | | | | |
| 4.50%, 11/16/2021 | | | 122,000 | | | | 126,916 | |
| Simon Property Group LP | | | | | | | | |
| 3.38%, 10/01/2024 | | | 61,000 | | | | 66,051 | |
| 3.38%, 12/01/2027 | | | 122,000 | | | | 134,139 | |
| Starwood Property Trust, Inc. | | | | | | | | |
| 5.00%, 12/15/2021 | | | 171,000 | | | | 173,993 | |
| State Street Corp. | | | | | | | | |
| 3.30%, 12/16/2024 | | | 183,000 | | | | 202,902 | |
| 3.55%, 08/18/2025 | | | 86,000 | | | | 97,662 | |
| Truist Bank | | | | | | | | |
| 3.30%, 05/15/2026 | | | 252,000 | | | | 282,296 | |
| UBS Group AG | | | | | | | | |
| 3.49%, 05/23/2023(c) | | | 122,000 | | | | 127,103 | |
| 4.13%, 09/24/2025(c) | | | 106,000 | | | | 121,369 | |
| 4.13%, 04/15/2026(c) | | | 61,000 | | | | 70,544 | |
| US Bancorp | | | | | | | | |
| 2.63%, 01/24/2022 | | | 122,000 | | | | 125,089 | |
| 3.00%, 03/15/2022 | | | 252,000 | | | | 260,377 | |
| Visa, Inc. | | | | | | | | |
| 3.15%, 12/14/2025 | | | 183,000 | | | | 204,420 | |
| 2.75%, 09/15/2027 | | | 171,000 | | | | 190,863 | |
| Wells Fargo & Co. | | | | | | | | |
| 2.55%, 12/07/2020 | | | 122,000 | | | | 122,039 | |
| 3M US L + 0.93%, | | | | | | | | |
| 02/11/2022(a) | | | 122,000 | | | | 122,185 | |
| 3M US L + 1.23%, | | | | | | | | |
| 10/31/2023(a) | | | 183,000 | | | | 185,925 | |
| 3.00%, 04/22/2026 | | | 1,402,000 | | | | 1,540,512 | |
See Notes to Financial Statements.
RiverFront Dynamic Core Income ETF
| Schedule of Investments | November 30, 2020 |
| | | Principal | | | | |
| Security Description | | Amount | | | Value | |
| Financials (continued) | | | | | | | | |
| Westpac Banking Corp. | | | | | | | | |
| 2.10%, 05/13/2021 | | $ | 223,000 | | | $ | 224,919 | |
| 3.65%, 05/15/2023 | | | 183,000 | | | | 197,602 | |
| 2.70%, 08/19/2026 | | | 61,000 | | | | 67,235 | |
| Total Financials | | | | | | | 29,963,214 | |
| | | | | | | | | |
| Health Care (5.39%) | | | | | | | | |
| AbbVie, Inc. | | | | | | | | |
| 2.90%, 11/06/2022 | | | 392,000 | | | | 409,963 | |
| 3.85%, 06/15/2024 | | | 195,000 | | | | 214,848 | |
| 3.60%, 05/14/2025 | | | 61,000 | | | | 67,909 | |
| Aetna, Inc. | | | | | | | | |
| 3.50%, 11/15/2024 | | | 183,000 | | | | 201,600 | |
| Amgen, Inc. | | | | | | | | |
| 3.63%, 05/22/2024 | | | 252,000 | | | | 275,990 | |
| Anthem, Inc. | | | | | | | | |
| 3.50%, 08/15/2024 | | | 61,000 | | | | 66,878 | |
| Bristol-Myers Squibb Co. | | | | | | | | |
| 3.25%, 02/27/2027 | | | 705,000 | | | | 803,690 | |
| Cigna Corp. | | | | | | | | |
| 3.00%, 07/15/2023 | | | 312,000 | | | | 331,026 | |
| 4.38%, 10/15/2028 | | | 140,000 | | | | 168,632 | |
| CVS Health Corp. | | | | | | | | |
| 4.30%, 03/25/2028 | | | 854,000 | | | | 1,004,090 | |
| Eli Lilly and Co. | | | | | | | | |
| 2.75%, 06/01/2025 | | | 37,000 | | | | 40,403 | |
| Gilead Sciences, Inc. | | | | | | | | |
| 4.40%, 12/01/2021 | | | 122,000 | | | | 125,612 | |
| 2.50%, 09/01/2023 | | | 122,000 | | | | 128,529 | |
| Johnson & Johnson | | | | | | | | |
| 2.45%, 03/01/2026 | | | 322,000 | | | | 350,811 | |
| Medtronic, Inc. | | | | | | | | |
| 3.50%, 03/15/2025 | | | 67,000 | | | | 75,178 | |
| Merck & Co., Inc. | | | | | | | | |
| 2.80%, 05/18/2023 | | | 629,000 | | | | 667,877 | |
| Pfizer, Inc. | | | | | | | | |
| 3.20%, 09/15/2023 | | | 267,000 | | | | 288,266 | |
| 3.00%, 12/15/2026 | | | 122,000 | | | | 137,974 | |
| Thermo Fisher Scientific, Inc. | | | | | | | | |
| 3.65%, 12/15/2025 | | | 106,000 | | | | 119,969 | |
| UnitedHealth Group, Inc. | | | | | | | | |
| 2.88%, 03/15/2023 | | | 183,000 | | | | 193,574 | |
| 3.75%, 07/15/2025 | | | 252,000 | | | | 287,234 | |
| 3.10%, 03/15/2026 | | | 105,000 | | | | 118,266 | |
| Total Health Care | | | | | | | 6,078,319 | |
| | | | | | | | | |
| Industrials (4.09%) | | | | | | | | |
| 3M Co. | | | | | | | | |
| 3.25%, 02/14/2024 | | | 519,000 | | | | 565,539 | |
| Boeing Co. | | | | | | | | |
| 3.45%, 11/01/2028 | | | 183,000 | | | | 190,550 | |
| Burlington Northern Santa Fe LLC | | | | | | | | |
| 3.05%, 09/01/2022 | | | 183,000 | | | | 190,631 | |
| | | Principal | | | | |
| Security Description | | Amount | | | Value | |
| Industrials (continued) | | | | | | | | |
| Caterpillar Financial Services Corp. | | | | | | | | |
| 2.75%, 08/20/2021 | | $ | 37,000 | | | $ | 37,659 | |
| 2.40%, 06/06/2022 | | | 183,000 | | | | 188,900 | |
| CNH Industrial Capital LLC | | | | | | | | |
| 4.88%, 04/01/2021 | | | 183,000 | | | | 185,393 | |
| CNH Industrial NV | | | | | | | | |
| 4.50%, 08/15/2023 | | | 252,000 | | | | 274,621 | |
| CSX Corp. | | | | | | | | |
| 3.40%, 08/01/2024 | | | 183,000 | | | | 200,520 | |
| 2.60%, 11/01/2026 | | | 61,000 | | | | 66,660 | |
| FedEx Corp. | | | | | | | | |
| 3.40%, 02/15/2028 | | | 183,000 | | | | 209,838 | |
| General Dynamics Corp. | | | | | | | | |
| 3.50%, 05/15/2025 | | | 245,000 | | | | 274,444 | |
| 2.63%, 11/15/2027 | | | 183,000 | | | | 200,976 | |
| Honeywell International, Inc. | | | | | | | | |
| 2.50%, 11/01/2026 | | | 183,000 | | | | 201,327 | |
| John Deere Capital Corp. | | | | | | | | |
| 3M US L + 0.16%, | | | | | | | | |
| 01/08/2021(a) | | | 122,000 | | | | 122,023 | |
| 2.65%, 06/24/2024 | | | 252,000 | | | | 270,684 | |
| Lockheed Martin Corp. | | | | | | | | |
| 3.55%, 01/15/2026 | | | 183,000 | | | | 207,412 | |
| Northrop Grumman Corp. | | | | | | | | |
| 3.50%, 03/15/2021 | | | 35,000 | | | | 35,322 | |
| 3.25%, 01/15/2028 | | | 183,000 | | | | 206,610 | |
| Textron, Inc. | | | | | | | | |
| 3.65%, 03/01/2021 | | | 50,000 | | | | 50,392 | |
| 3.65%, 03/15/2027 | | | 171,000 | | | | 188,142 | |
| United Parcel Service, Inc. | | | | | | | | |
| 2.50%, 04/01/2023 | | | 379,000 | | | | 397,678 | |
| 2.40%, 11/15/2026 | | | 33,000 | | | | 36,039 | |
| WESCO Distribution, Inc. | | | | | | | | |
| 5.38%, 12/15/2021 | | | 122,000 | | | | 122,600 | |
| XPO Logistics, Inc. | | | | | | | | |
| 6.13%, 09/01/2023(c) | | | 183,000 | | | | 186,729 | |
| Total Industrials | | | | | | | 4,610,689 | |
| | | | | | | | | |
| Materials (1.49%) | | | | | | | | |
| Ashland LLC | | | | | | | | |
| 4.75%, 08/15/2022 | | | 26,000 | | | | 27,324 | |
| Ball Corp. | | | | | | | | |
| 4.00%, 11/15/2023 | | | 183,000 | | | | 195,370 | |
| Celanese US Holdings LLC | | | | | | | | |
| 5.88%, 06/15/2021 | | | 122,000 | | | | 125,274 | |
| 4.63%, 11/15/2022 | | | 122,000 | | | | 131,339 | |
| Glencore Funding LLC | | | | | | | | |
| 3.00%, 10/27/2022(c) | | | 322,000 | | | | 334,369 | |
| Graphic Packaging International LLC | | | | | | | | |
| 4.75%, 04/15/2021 | | | 122,000 | | | | 122,610 | |
| LyondellBasell Industries NV | | | | | | | | |
| 5.75%, 04/15/2024 | | | 183,000 | | | | 210,263 | |
| Nutrien, Ltd. | | | | | | | | |
| 3.50%, 06/01/2023 | | | 183,000 | | | | 194,973 | |
See Notes to Financial Statements.
RiverFront Dynamic Core Income ETF
| Schedule of Investments | November 30, 2020 |
| | | Principal | | | | |
| Security Description | | Amount | | | Value | |
| Materials (continued) | | | | | | | | |
| Sherwin-Williams Co. | | | | | | | | |
| 3.45%, 08/01/2025 | | $ | 183,000 | | | $ | 203,191 | |
| 3.45%, 06/01/2027 | | | 122,000 | | | | 139,023 | |
| Total Materials | | | | | | | 1,683,736 | |
| | | | | | | | | |
| Technology (4.92%) | | | | | | | | |
| Apple, Inc. | | | | | | | | |
| 2.40%, 05/03/2023 | | | 322,000 | | | | 338,154 | |
| 3.45%, 05/06/2024 | | | 183,000 | | | | 201,563 | |
| 2.75%, 01/13/2025 | | | 86,000 | | | | 93,182 | |
| 3.20%, 05/11/2027 | | | 183,000 | | | | 207,687 | |
| Broadcom, Inc. | | | | | | | | |
| 4.11%, 09/15/2028 | | | 195,000 | | | | 223,748 | |
| Cisco Systems, Inc. | | | | | | | | |
| 2.20%, 09/20/2023 | | | 122,000 | | | | 127,906 | |
| Corning, Inc. | | | | | | | | |
| 2.90%, 05/15/2022 | | | 61,000 | | | | 62,814 | |
| Dell International LLC / EMC Corp. | | | | | | | | |
| 5.88%, 06/15/2021(c) | | | 30,000 | | | | 30,097 | |
| Flex, Ltd. | | | | | | | | |
| 5.00%, 02/15/2023 | | | 252,000 | | | | 273,404 | |
| IBM Credit LLC | | | | | | | | |
| 3M US L + 0.16%, | | | | | | | | |
| 02/05/2021(a) | | | 477,000 | | | | 477,152 | |
| Intel Corp. | | | | | | | | |
| 2.60%, 05/19/2026 | | | 183,000 | | | | 200,563 | |
| International Business Machines Corp. | | | | | | | | |
| 2.50%, 01/27/2022 | | | 322,000 | | | | 330,354 | |
| 3.63%, 02/12/2024 | | | 183,000 | | | | 200,974 | |
| Microsoft Corp. | | | | | | | | |
| 3.30%, 02/06/2027 | | | 875,000 | | | | 1,000,131 | |
| 3.45%, 08/08/2036 | | | 171,000 | | | | 212,008 | |
| Moody's Corp. | | | | | | | | |
| 4.50%, 09/01/2022 | | | 33,000 | | | | 35,013 | |
| Oracle Corp. | | | | | | | | |
| 3.40%, 07/08/2024 | | | 183,000 | | | | 200,105 | |
| 3.25%, 11/15/2027 | | | 988,000 | | | | 1,122,979 | |
| S&P Global, Inc. | | | | | | | | |
| 4.00%, 06/15/2025 | | | 183,000 | | | | 208,555 | |
| Total Technology | | | | | | | 5,546,389 | |
| | | | | | | | | |
| Utilities (1.80%) | | | | | | | | |
| Alabama Power Co. | | | | | | | | |
| 3.55%, 12/01/2023 | | | 106,000 | | | | 115,610 | |
| CMS Energy Corp. | | | | | | | | |
| 3.60%, 11/15/2025 | | | 106,000 | | | | 119,157 | |
| Consumers Energy Co. | | | | | | | | |
| 3.38%, 08/15/2023 | | | 122,000 | | | | 130,861 | |
| 3.13%, 08/31/2024 | | | 122,000 | | | | 131,572 | |
| Dominion Energy, Inc. | | | | | | | | |
| 4.25%, 06/01/2028 | | | 171,000 | | | | 203,678 | |
| Duke Energy Carolinas LLC | | | | | | | | |
| 2.95%, 12/01/2026 | | | 122,000 | | | | 136,887 | |
| Duke Energy Corp. | | | | | | | | |
| 1.80%, 09/01/2021 | | | 392,000 | | | | 395,799 | |
| | | Principal | | | | |
| Security Description | | Amount | | | Value | |
| Utilities (continued) | | | | | | | | |
| Exelon Corp. | | | | | | | | |
| 3.50%, 06/01/2022 | | $ | 122,000 | | | $ | 127,214 | |
| 3.40%, 04/15/2026 | | | 105,000 | | | | 117,980 | |
| Exelon Generation Co. LLC | | | | | | | | |
| 4.25%, 06/15/2022 | | | 61,000 | | | | 63,947 | |
| Southern Co. | | | | | | | | |
| 2.95%, 07/01/2023 | | | 322,000 | | | | 340,941 | |
| Southwestern Electric Power Co. | | | | | | | | |
| 4.10%, 09/15/2028 | | | 122,000 | | | | 142,718 | |
| Total Utilities | | | | | | | 2,026,364 | |
| | | | | | | | | |
| TOTAL CORPORATE BONDS | | | | | | | | |
| (Cost $67,371,955) | | | | | | | 71,167,534 | |
| | | Principal | | | | |
| Security Description | | Amount | | | Value | |
| GOVERNMENT BONDS (25.23%) | | | | | | | | |
| United States Treasury Bond | | | | | | | | |
| 2.75%, 02/15/2028 | | | 6,442,000 | | | | 7,412,075 | |
| 3.88%, 08/15/2040 | | | 901,300 | | | | 1,310,124 | |
| 2.75%, 11/15/2047 | | | 1,224,000 | | | | 1,559,405 | |
| United States Treasury Inflation Indexed Bonds | | | | | | | | |
| 2.13%, 02/15/2040(d) | | | 339,335 | | | | 523,533 | |
| United States Treasury Note | | | | | | | | |
| 2.88%, 11/15/2021 | | | 3,217,000 | | | | 3,302,011 | |
| 2.88%, 10/31/2023 | | | 1,923,000 | | | | 2,073,835 | |
| 3.00%, 10/31/2025 | | | 3,217,000 | | | | 3,631,314 | |
| United States Treasury Strip Principal | | | | | | | | |
| 0.00%, 02/15/2038(e) | | | 3,217,000 | | | | 2,634,659 | |
| 0.00%, 08/15/2039(e) | | | 3,861,000 | | | | 3,054,929 | |
| 0.00%, 11/15/2046(e) | | | 1,923,000 | | | | 1,278,140 | |
| 0.00%, 05/15/2048(e) | | | 2,567,000 | | | | 1,657,543 | |
| TOTAL GOVERNMENT BONDS | | | | | | | | |
| (Cost $24,050,393) | | | | | | | 28,437,568 | |
| | | | | | | | | |
| | | 7 Day Yield | | | Shares | | | Value | |
| SHORT TERM INVESTMENTS (11.15%) | | | | | | | | | | | | |
| State Street Institutional Treasury Plus Money Market Fund | | | 0.01 | % | | | 12,570,919 | | | | 12,570,919 | |
| TOTAL SHORT TERM INVESTMENTS | | | | | | | | | | | | |
| (Cost $12,570,919) | | | | | | | | | | | 12,570,919 | |
| | | | | | | | | | | | | |
| TOTAL INVESTMENTS (99.51%) | | | | | | | | | | | | |
| (Cost $103,993,267) | | | | | | | | | | $ | 112,176,021 | |
| OTHER ASSETS IN EXCESS OF LIABILITIES (0.49%) | | | | | | | | | | | 547,485 | |
| NET ASSETS - 100.00% | | | | | | | | | | $ | 112,723,506 | |
See Notes to Financial Statements.
RiverFront Dynamic Core Income ETF
| Schedule of Investments | November 30, 2020 |
Investment Abbreviations:
LIBOR - London Interbank Offered Rate
Reference Rates:
3M US L - 3 Month LIBOR as of November 30, 2020 was 0.23%
| (a) | Floating or variable rate security. The reference rate is described above. The rate in effect as of November 30, 2020 is based on the reference rate plus the displayed spread as of the security's last reset date. |
| (b) | Securities were purchased pursuant to Regulation S under the Securities Act of 1933, which exempts securities offered and sold outside of the United States from registration. Such securities cannot be sold in the United States without either an effective registration statement filed pursuant to the Securities Act of 1933, or pursuant to an exemption from registration. As of November 30, 2020, the market value of those securities was $185,412 representing 0.16% of net assets. |
| (c) | Securities exempt from registration under Rule 144A of the Securities Act of 1933. These securities may be sold in the ordinary course of business in transactions exempt from registration, normally to qualified institutional buyers. At period end, the aggregate market value of those securities was $870,211, representing 0.77% of net assets. |
| (d) | Principal amount of security is adjusted for inflation. |
See Notes to Financial Statements.
RiverFront Dynamic Unconstrained Income ETF
| Schedule of Investments | November 30, 2020 |
| | | Principal | | | | |
| Security Description | | Amount | | | Value | |
| CORPORATE BONDS (79.29%) | | | | | | | | |
| Communications (16.44%) | | | | | | | | |
| Altice France SA | | | | | | | | |
| 7.38%, 05/01/2026(a) | | $ | 200,000 | | | $ | 210,210 | |
| AMC Networks, Inc. | | | | | | | | |
| 4.75%, 08/01/2025 | | | 70,000 | | | | 72,170 | |
| CCO Holdings LLC / CCO Holdings | | | | | | | | |
| Capital Corp. | | | | | | | | |
| 5.75%, 02/15/2026(a) | | | 100,000 | | | | 103,750 | |
| 5.13%, 05/01/2027(a) | | | 101,000 | | | | 106,399 | |
| 5.00%, 02/01/2028(a) | | | 35,000 | | | | 36,916 | |
| CenturyLink, Inc. | | | | | | | | |
| 6.45%, 06/15/2021 | | | 129,000 | | | | 132,354 | |
| 7.50%, 04/01/2024 | | | 26,000 | | | | 29,152 | |
| CSC Holdings LLC | | | | | | | | |
| 5.75%, 01/15/2030(a) | | | 200,000 | | | | 216,751 | |
| DISH DBS Corp. | | | | | | | | |
| 5.88%, 07/15/2022 | | | 75,000 | | | | 78,846 | |
| Hughes Satellite Systems Corp. | | | | | | | | |
| 7.63%, 06/15/2021 | | | 49,000 | | | | 50,531 | |
| 6.63%, 08/01/2026 | | | 49,000 | | | | 54,687 | |
| Lamar Media Corp. | | | | | | | | |
| 5.75%, 02/01/2026 | | | 149,000 | | | | 154,479 | |
| Level 3 Financing, Inc. | | | | | | | | |
| 5.38%, 01/15/2024 | | | 75,000 | | | | 75,798 | |
| Netflix, Inc. | | | | | | | | |
| 5.50%, 02/15/2022 | | | 94,000 | | | | 98,935 | |
| Sinclair Television Group, Inc. | | | | | | | | |
| 5.13%, 02/15/2027(a) | | | 26,000 | | | | 25,594 | |
| Sirius XM Radio, Inc. | | | | | | | | |
| 4.63%, 07/15/2024 | | | 100,000 | | | | 103,713 | |
| Sprint Communications, Inc. | | | | | | | | |
| 6.00%, 11/15/2022 | | | 108,000 | | | | 116,370 | |
| Sprint Corp. | | | | | | | | |
| 7.88%, 09/15/2023 | | | 49,000 | | | | 56,575 | |
| 7.13%, 06/15/2024 | | | 49,000 | | | | 57,086 | |
| T-Mobile USA, Inc. | | | | | | | | |
| 4.50%, 02/01/2026 | | | 150,000 | | | | 154,331 | |
| VeriSign, Inc. | | | | | | | | |
| 4.75%, 07/15/2027 | | | 49,000 | | | | 52,522 | |
| ViacomCBS, Inc. | | | | | | | | |
| 5.88%, 02/28/2057 | | | 36,000 | | | | 37,148 | |
| Ziggo BV | | | | | | | | |
| 5.50%, 01/15/2027(a) | | | 75,000 | | | | 78,603 | |
| Total Communications | | | | | | | 2,102,920 | |
| | | | | | | | | |
| Consumer Discretionary (15.34%) | | | | | | | | |
| Anixter, Inc. | | | | | | | | |
| 5.50%, 03/01/2023 | | | 75,000 | | | | 78,648 | |
| Aramark Services, Inc. | | | | | | | | |
| 5.00%, 02/01/2028(a) | | | 50,000 | | | | 52,625 | |
| Boyd Gaming Corp. | | | | | | | | |
| 6.38%, 04/01/2026 | | | 50,000 | | | | 52,007 | |
| Builders FirstSource, Inc. | | | | | | | | |
| 6.75%, 06/01/2027(a) | | | 33,000 | | | | 35,516 | |
| Dana, Inc. | | | | | | | | |
| 5.50%, 12/15/2024 | | | 75,000 | | | | 76,693 | |
| | | Principal | | | | |
| Security Description | | Amount | | | Value | |
| Consumer Discretionary (continued) | | | | | | | | |
| Ford Motor Co. | | | | | | | | |
| 9.00%, 04/22/2025 | | $ | 225,000 | | | $ | 273,716 | |
| Ford Motor Credit Co. LLC | | | | | | | | |
| 4.13%, 08/04/2025 | | | 200,000 | | | | 207,375 | |
| Goodyear Tire & Rubber Co. | | | | | | | | |
| 5.00%, 05/31/2026 | | | 35,000 | | | | 35,759 | |
| Hanesbrands, Inc. | | | | | | | | |
| 4.88%, 05/15/2026(a) | | | 143,000 | | | | 153,904 | |
| Hilton Worldwide Finance LLC / | | | | | | | | |
| Hilton Worldwide Finance Corp. | | | | | | | | |
| 4.63%, 04/01/2025 | | | 49,000 | | | | 50,133 | |
| International Game Technology PLC | | | | | | | | |
| 6.25%, 02/15/2022(a) | | | 58,000 | | | | 59,779 | |
| KB Home | | | | | | | | |
| 7.50%, 09/15/2022 | | | 65,000 | | | | 71,404 | |
| L Brands, Inc. | | | | | | | | |
| 5.63%, 02/15/2022 | | | 33,000 | | | | 34,382 | |
| Lennar Corp. | | | | | | | | |
| 4.75%, 11/29/2027 | | | 100,000 | | | | 118,750 | |
| MGM Resorts International | | | | | | | | |
| 6.00%, 03/15/2023 | | | 100,000 | | | | 107,103 | |
| Penske Automotive Group, Inc. | | | | | | | | |
| 5.50%, 05/15/2026 | | | 70,000 | | | | 72,931 | |
| PulteGroup, Inc. | | | | | | | | |
| 5.00%, 01/15/2027 | | | 49,000 | | | | 57,958 | |
| Scotts Miracle-Gro Co. | | | | | | | | |
| 5.25%, 12/15/2026 | | | 70,000 | | | | 74,799 | |
| Service Corp. International | | | | | | | | |
| 4.63%, 12/15/2027 | | | 87,000 | | | | 92,383 | |
| Six Flags Entertainment Corp. | | | | | | | | |
| 4.88%, 07/31/2024(a) | | | 49,000 | | | | 48,896 | |
| Toll Brothers Finance Corp. | | | | | | | | |
| 4.88%, 03/15/2027 | | | 49,000 | | | | 56,344 | |
| Wynn Las Vegas LLC / Wynn Las | | | | | | | | |
| Vegas Capital Corp. | | | | | | | | |
| 5.50%, 03/01/2025(a) | | | 49,000 | | | | 50,072 | |
| Wynn Macau, Ltd. | | | | | | | | |
| 4.88%, 10/01/2024(a) | | | 101,000 | | | | 101,566 | |
| Total Consumer Discretionary | | | | | | | 1,962,743 | |
| | | | | | | | | |
| Consumer Staples (3.37%) | | | | | | | | |
| B&G Foods, Inc. | | | | | | | | |
| 5.25%, 04/01/2025 | | | 49,000 | | | | 50,882 | |
| Kraft Heinz Foods Co. | | | | | | | | |
| 3.00%, 06/01/2026 | | | 100,000 | | | | 104,446 | |
| Pilgrim's Pride Corp. | | | | | | | | |
| 5.75%, 03/15/2025(a) | | | 49,000 | | | | 50,394 | |
| Spectrum Brands, Inc. | | | | | | | | |
| 5.75%, 07/15/2025 | | | 143,000 | | | | 147,854 | |
| TreeHouse Foods, Inc. | | | | | | | | |
| 6.00%, 02/15/2024(a) | | | 75,000 | | | | 76,861 | |
| Total Consumer Staples | | | | | | | 430,437 | |
See Notes to Financial Statements.
RiverFront Dynamic Unconstrained Income ETF
| Schedule of Investments | November 30, 2020 |
| | | Principal | | | | |
| Security Description | | Amount | | | Value | |
| Energy (7.90%) | | | | | | | | |
| CrownRock LP / CrownRock | | | | | | | | |
| Finance, Inc. | | | | | | | | |
| 5.63%, 10/15/2025(a) | | $ | 49,000 | | | $ | 49,582 | |
| DCP Midstream Operating LP | | | | | | | | |
| 5.38%, 07/15/2025 | | | 70,000 | | | | 75,644 | |
| Endeavor Energy Resources LP / | | | | | | | | |
| EER Finance, Inc. | | | | | | | | |
| 5.50%, 01/30/2026(a) | | | 49,000 | | | | 50,501 | |
| EQT Corp. | | | | | | | | |
| 3.90%, 10/01/2027 | | | 65,000 | | | | 64,534 | |
| Murphy Oil Corp. | | | | | | | | |
| 5.75%, 08/15/2025 | | | 75,000 | | | | 70,696 | |
| NGL Energy Partners LP / NGL | | | | | | | | |
| Energy Finance Corp. | | | | | | | | |
| 6.13%, 03/01/2025 | | | 50,000 | | | | 20,750 | |
| Occidental Petroleum Corp. | | | | | | | | |
| 3.50%, 06/15/2025 | | | 205,000 | | | | 191,931 | |
| Parkland Corp. | | | | | | | | |
| 6.00%, 04/01/2026(a) | | | 75,000 | | | | 79,150 | |
| Parsley Energy LLC / Parsley | | | | | | | | |
| Finance Corp. | | | | | | | | |
| 5.38%, 01/15/2025(a) | | | 75,000 | | | | 77,391 | |
| SM Energy Co. | | | | | | | | |
| 6.13%, 11/15/2022 | | | 49,000 | | | | 43,782 | |
| Sunoco LP / Sunoco Finance Corp. | | | | | | | | |
| 5.50%, 02/15/2026 | | | 49,000 | | | | 50,981 | |
| Targa Resources Partners LP / | | | | | | | | |
| Targa Resources Partners | | | | | | | | |
| Finance Corp. | | | | | | | | |
| 5.88%, 04/15/2026 | | | 75,000 | | | | 79,078 | |
| USA Compression Partners LP / | | | | | | | | |
| USA Compression Finance Corp. | | | | | | | | |
| 6.88%, 04/01/2026 | | | 75,000 | | | | 77,743 | |
| WPX Energy, Inc. | | | | | | | | |
| 5.75%, 06/01/2026 | | | 75,000 | | | | 79,050 | |
| Total Energy | | | | | | | 1,010,813 | |
| | | | | | | | | |
| Financials (7.17%) | | | | | | | | |
| Ally Financial, Inc. | | | | | | | | |
| 5.75%, 11/20/2025 | | | 101,000 | | | | 118,097 | |
| CIT Group, Inc. | | | | | | | | |
| 5.00%, 08/15/2022 | | | 118,000 | | | | 125,692 | |
| 5.25%, 03/07/2025 | | | 40,000 | | | | 45,125 | |
| Icahn Enterprises LP / Icahn | | | | | | | | |
| Enterprises Finance Corp. | | | | | | | | |
| 6.25%, 02/01/2022 | | | 50,000 | | | | 50,393 | |
| Iron Mountain, Inc. | | | | | | | | |
| 4.88%, 09/15/2027(a) | | | 100,000 | | | | 103,915 | |
| Jefferies Financial Group, Inc. | | | | | | | | |
| 5.50%, 10/18/2023 | | | 49,000 | | | | 54,068 | |
| MGM Growth Properties | | | | | | | | |
| Operating Partnership LP / | | | | | | | | |
| MGP Finance Co.-Issuer, Inc. | | | | | | | | |
| 5.63%, 05/01/2024 | | | 49,000 | | | | 52,644 | |
| | | Principal | | | | |
| Security Description | | Amount | | | Value | |
| Financials (continued) | | | | | | | | |
| Navient Corp. | | | | | | | | |
| 6.50%, 06/15/2022 | | $ | 89,000 | | | $ | 93,940 | |
| OneMain Finance Corp. | | | | | | | | |
| 5.63%, 03/15/2023 | | | 80,000 | | | | 85,250 | |
| Park Aerospace Holdings, Ltd. | | | | | | | | |
| 5.25%, 08/15/2022(a) | | | 75,000 | | | | 78,458 | |
| Quicken Loans LLC | | | | | | | | |
| 5.25%, 01/15/2028(a) | | | 70,000 | | | | 74,156 | |
| Starwood Property Trust, Inc. | | | | | | | | |
| 4.75%, 03/15/2025 | | | 35,000 | | | | 36,039 | |
| Total Financials | | | | | | | 917,777 | |
| | | | | | | | | |
| Health Care (7.87%) | | | | | | | | |
| Bausch Health Cos., Inc. | | | | | | | | |
| 5.50%, 03/01/2023(a) | | | 10,000 | | | | 10,010 | |
| 6.13%, 04/15/2025(a) | | | 26,000 | | | | 26,785 | |
| 9.00%, 12/15/2025(a) | | | 35,000 | | | | 38,542 | |
| 6.25%, 02/15/2029(a) | | | 150,000 | | | | 159,216 | |
| Centene Corp. | | | | | | | | |
| 4.75%, 01/15/2025 | | | 175,000 | | | | 180,596 | |
| CHS/Community Health Systems, Inc. | | | | | | | | |
| 6.25%, 03/31/2023 | | | 150,000 | | | | 153,375 | |
| HCA, Inc. | | | | | | | | |
| 5.88%, 05/01/2023 | | | 115,000 | | | | 125,949 | |
| Tenet Healthcare Corp. | | | | | | | | |
| 4.88%, 01/01/2026(a) | | | 150,000 | | | | 154,686 | |
| Teva Pharmaceutical Finance | | | | | | | | |
| Netherlands III BV | | | | | | | | |
| 2.20%, 07/21/2021 | | | 10,000 | | | | 10,022 | |
| 2.80%, 07/21/2023 | | | 150,000 | | | | 147,662 | |
| Total Health Care | | | | | | | 1,006,843 | |
| | | | | | | | | |
| Industrials (6.90%) | | | | | | | | |
| Bombardier, Inc. | | | | | | | | |
| 6.13%, 01/15/2023(a) | | | 49,000 | | | | 45,864 | |
| H&E Equipment Services, Inc. | | | | | | | | |
| 5.63%, 09/01/2025 | | | 35,000 | | | | 36,629 | |
| Howmet Aerospace, Inc. | | | | | | | | |
| 5.13%, 10/01/2024 | | | 70,000 | | | | 76,206 | |
| Terex Corp. | | | | | | | | |
| 5.63%, 02/01/2025(a) | | | 101,000 | | | | 103,841 | |
| TransDigm, Inc. | | | | | | | | |
| 6.25%, 03/15/2026(a) | | | 150,000 | | | | 159,188 | |
| United Rentals North America, Inc. | | | | | | | | |
| 5.88%, 09/15/2026 | | | 143,000 | | | | 151,382 | |
| WESCO Distribution, Inc. | | | | | | | | |
| 5.38%, 06/15/2024 | | | 125,000 | | | | 128,281 | |
| XPO Logistics, Inc. | | | | | | | | |
| 6.50%, 06/15/2022(a) | | | 107,000 | | | | 107,302 | |
| 6.75%, 08/15/2024(a) | | | 70,000 | | | | 74,256 | |
| Total Industrials | | | | | | | 882,949 | |
See Notes to Financial Statements.
RiverFront Dynamic Unconstrained Income ETF
| Schedule of Investments | November 30, 2020 |
| | | Principal | | | | |
| Security Description | | Amount | | | Value | |
| Materials (6.45%) | | | | | | | | |
| Ball Corp. | | | | | | | | |
| 4.88%, 03/15/2026 | | $ | 49,000 | | | $ | 55,227 | |
| Berry Global, Inc. | | | | | | | | |
| 4.88%, 07/15/2026(a) | | | 35,000 | | | | 37,195 | |
| Chemours Co. | | | | | | | | |
| 7.00%, 05/15/2025 | | | 50,000 | | | | 51,785 | |
| Crown Americas LLC / Crown | | | | | | | | |
| Americas Capital Corp. V | | | | | | | | |
| 4.25%, 09/30/2026 | | | 85,000 | | | | 91,747 | |
| FMG Resources August 2006 Pty, Ltd. | | | | | | | | |
| 5.13%, 03/15/2023(a) | | | 49,000 | | | | 51,756 | |
| Freeport-McMoRan, Inc. | | | | | | | | |
| 4.55%, 11/14/2024 | | | 100,000 | | | | 109,487 | |
| Graphic Packaging International LLC | | | | | | | | |
| 4.75%, 07/15/2027(a) | | | 70,000 | | | | 77,249 | |
| Koppers, Inc. | | | | | | | | |
| 6.00%, 02/15/2025(a) | | | 49,000 | | | | 50,623 | |
| Mauser Packaging Solutions Holding Co. | | | | | | | | |
| 5.50%, 04/15/2024(a) | | | 49,000 | | | | 49,684 | |
| NOVA Chemicals Corp. | | | | | | | | |
| 5.25%, 06/01/2027(a) | | | 75,000 | | | | 78,277 | |
| Rayonier AM Products, Inc. | | | | | | | | |
| 5.50%, 06/01/2024(a) | | | 19,000 | | | | 16,172 | |
| Reynolds Group Issuer, Inc. / | | | | | | | | |
| Reynolds Group Issuer LLC / | | | | | | | | |
| Reynolds Group Issuer Lu | | | | | | | | |
| 5.13%, 07/15/2023(a) | | | 4,000 | | | | 4,051 | |
| Sealed Air Corp. | | | | | | | | |
| 5.25%, 04/01/2023(a) | | | 49,000 | | | | 52,288 | |
| SunCoke Energy Partners LP / | | | | | | | | |
| SunCoke Energy Partners | | | | | | | | |
| Finance Corp. | | | | | | | | |
| 7.50%, 06/15/2025(a) | | | 35,000 | | | | 34,541 | |
| United States Steel Corp. | | | | | | | | |
| 6.88%, 08/15/2025 | | | 70,000 | | | | 65,319 | |
| Total Materials | | | | | | | 825,401 | |
| | | | | | | | | |
| Technology (4.30%) | | | | | | | | |
| Amkor Technology, Inc. | | | | | | | | |
| 6.63%, 09/15/2027(a) | | | 35,000 | | | | 38,019 | |
| CommScope Technologies LLC | | | | | | | | |
| 6.00%, 06/15/2025(a) | | | 43,000 | | | | 44,120 | |
| CommScope, Inc. | | | | | | | | |
| 5.50%, 03/01/2024(a) | | | 70,000 | | | | 72,021 | |
| Dell International LLC / EMC Corp. | | | | | | | | |
| 5.88%, 06/15/2021(a) | | | 48,000 | | | | 48,156 | |
| 7.13%, 06/15/2024(a) | | | 26,000 | | | | 26,968 | |
| j2 Cloud Services LLC / j2 Cloud | | | | | | | | |
| Co.-Obligor, Inc. | | | | | | | | |
| 6.00%, 07/15/2025 | | | 75,000 | | | | 78,503 | |
| MSCI, Inc. | | | | | | | | |
| 5.38%, 05/15/2027(a) | | | 49,000 | | | | 52,614 | |
| | | Principal | | | | |
| Security Description | | Amount | | | Value | |
| Technology (continued) | | | | | | | | |
| Nielsen Finance LLC / Nielsen | | | | | | | | |
| Finance Co. | | | | | | | | |
| 5.00%, 04/15/2022(a) | | $ | 27,000 | | | $ | 27,027 | |
| NortonLifeLock, Inc. | | | | | | | | |
| 5.00%, 04/15/2025(a) | | | 49,000 | | | | 50,034 | |
| Seagate HDD Cayman | | | | | | | | |
| 4.09%, 06/01/2029(a) | | | 20,000 | | | | 22,161 | |
| Western Digital Corp. | | | | | | | | |
| 4.75%, 02/15/2026 | | | 49,000 | | | | 53,578 | |
| Xerox Corp. | | | | | | | | |
| 4.38%, 03/15/2023 | | | 35,000 | | | | 36,798 | |
| Total Technology | | | | | | | 549,999 | |
| | | | | | | | | |
| Utilities (3.55%) | | | | | | | | |
| AmeriGas Partners LP / AmeriGas | | | | | | | | |
| Finance Corp. | | | | | | | | |
| 5.75%, 05/20/2027 | | | 75,000 | | | | 84,968 | |
| Calpine Corp. | | | | | | | | |
| 5.13%, 03/15/2028(a) | | | 100,000 | | | | 105,262 | |
| Cemig Geracao e Transmissao SA | | | | | | | | |
| 9.25%, 12/05/2024(a) | | | 49,000 | | | | 56,093 | |
| NRG Energy, Inc. | | | | | | | | |
| 6.63%, 01/15/2027 | | | 89,000 | | | | 93,802 | |
| Suburban Propane Partners | | | | | | | | |
| LP/Suburban Energy Finance Corp. | | | | | | | | |
| 5.50%, 06/01/2024 | | | 75,000 | | | | 76,901 | |
| Vistra Operations Co. LLC | | | | | | | | |
| 5.00%, 07/31/2027(a) | | | 35,000 | | | | 37,051 | |
| Total Utilities | | | | | | | 454,077 | |
| | | | | | | | | |
| TOTAL CORPORATE BONDS | | | | | | | | |
| (Cost $9,809,391) | | | | | | | 10,143,959 | |
| Security Description | | Shares | | | Value | |
| EXCHANGE TRADED FUNDS (9.63%) | | | | | | | | |
| iShares iBoxx High Yield | | | | | | | | |
| Corporate Bond ETF | | | 7,100 | | | $ | 612,872 | |
| Xtrackers USD High Yield | | | | | | | | |
| Corporate Bond ETF | | | 12,500 | | | | 619,000 | |
| | | | | | | | | |
| TOTAL EXCHANGE TRADED FUNDS | | | | | | | | |
| (Cost $1,117,025) | | | | | | | 1,231,872 | |
See Notes to Financial Statements.
RiverFront Dynamic Unconstrained Income ETF
| Schedule of Investments | November 30, 2020 |
| | | 7 Day Yield | | | Shares | | | Value | |
| SHORT TERM INVESTMENTS (9.94%) | | | | | | | | | | | | |
| State Street Institutional | | | | | | | | | | | | |
| Treasury Plus Money | | | | | | | | | | | | |
| Market Fund | | | 0.01 | % | | | 1,271,994 | | | $ | 1,271,994 | |
| TOTAL SHORT TERM INVESTMENTS | | | | | | | | | | | | |
| (Cost $1,271,994) | | | | | | | | | | | 1,271,994 | |
| | | | | | | | | | | | | |
| TOTAL INVESTMENTS (98.86%) | | | | | | | | | | | | |
| (Cost $12,198,410) | | | | | | | | | | $ | 12,647,825 | |
| OTHER ASSETS IN EXCESS OF LIABILITIES (1.14%) | | | | | | | | | | | 145,962 | |
| NET ASSETS - 100.00% | | | | | | | | | | $ | 12,793,787 | |
Investment Abbreviations:
LIBOR - London Interbank Offered Rate
Reference Rates:
3M US L - 3 Month LIBOR as of November 30, 2020 was 0.23%
| (a) | Securities exempt from registration under Rule 144A of the Securities Act of 1933. These securities may be sold in the ordinary course of business in transactions exempt from registration, normally to qualified institutional buyers. At period end, the aggregate market value of those securities was $3,832,041, representing 29.95% of net assets. |
See Notes to Financial Statements.
RiverFront Dynamic US Dividend Advantage ETF
| Schedule of Investments | November 30, 2020 |
| Security Description | | Shares | | | Value | |
| COMMON STOCKS (99.80%) | | | | | | | | |
| Communication Services (6.15%) | | | | | | | | |
| AT&T, Inc. | | | 67,496 | | | $ | 1,940,510 | |
| Facebook, Inc., Class A(a) | | | 4,644 | | | | 1,286,249 | |
| News Corp., Class B | | | 92,149 | | | | 1,641,174 | |
| Sirius XM Holdings, Inc.(b) | | | 190,536 | | | | 1,236,578 | �� |
| Verizon Communications, Inc. | | | 34,561 | | | | 2,087,830 | |
| Total Communication Services | | | | | | | 8,192,341 | |
| | | | | | | | | |
| Consumer Discretionary (11.43%) | | | | | | | | |
| Amazon.com, Inc.(a) | | | 1,904 | | | | 6,031,948 | |
| Best Buy Co., Inc. | | | 11,685 | | | | 1,271,328 | |
| Dollar General Corp. | | | 3,982 | | | | 870,386 | |
| Domino's Pizza, Inc. | | | 3,171 | | | | 1,244,839 | |
| Lowe's Cos., Inc. | | | 8,604 | | | | 1,340,675 | |
| NIKE, Inc., Class B | | | 5,531 | | | | 745,026 | |
| PulteGroup, Inc. | | | 15,643 | | | | 682,504 | |
| Starbucks Corp. | | | 14,278 | | | | 1,399,530 | |
| Target Corp. | | | 9,190 | | | | 1,649,881 | |
| Total Consumer Discretionary | | | | | | | 15,236,117 | |
| | | | | | | | | |
| Consumer Staples (8.12%) | | | | | | | | |
| Coca-Cola Co. | | | 53,842 | | | | 2,778,247 | |
| Colgate-Palmolive Co. | | | 27,441 | | | | 2,350,047 | |
| Mondelez International, Inc. | | | 39,596 | | | | 2,274,790 | |
| Philip Morris International, Inc. | | | 6,939 | | | | 525,629 | |
| Vector Group, Ltd. | | | 93,121 | | | | 1,046,680 | |
| Walmart, Inc. | | | 12,102 | | | | 1,849,065 | |
| Total Consumer Staples | | | | | | | 10,824,458 | |
| | | | | | | | | |
| Energy (1.27%) | | | | | | | | |
| Kinder Morgan, Inc. | | | 118,056 | | | | 1,697,645 | |
| | | | | | | | | |
| Financials (8.17%) | | | | | | | | |
| Ameriprise Financial, Inc. | | | 7,704 | | | | 1,427,089 | |
| Artisan Partners Asset | | | | | | | | |
| Management, Inc., Class A | | | 21,870 | | | | 984,150 | |
| Bank of America Corp. | | | 93,837 | | | | 2,642,450 | |
| First Republic Bank | | | 768 | | | | 99,502 | |
| FNB Corp. | | | 81,645 | | | | 720,925 | |
| Fulton Financial Corp. | | | 77,850 | | | | 959,112 | |
| Mercury General Corp. | | | 15,386 | | | | 684,215 | |
| Navient Corp. | | | 53,485 | | | | 501,155 | |
| Progressive Corp. | | | 15,062 | | | | 1,312,051 | |
| Starwood Property Trust, Inc. | | | 42,223 | | | | 757,481 | |
| Trustmark Corp. | | | 32,354 | | | | 803,026 | |
| Total Financials | | | | | | | 10,891,156 | |
| | | | | | | | | |
| Health Care (9.93%) | | | | | | | | |
| AbbVie, Inc. | | | 12,446 | | | | 1,301,603 | |
| Boston Scientific Corp.(a) | | | 54,005 | | | | 1,790,266 | |
| Eli Lilly and Co. | | | 15,054 | | | | 2,192,615 | |
| Humana, Inc. | | | 4,013 | | | | 1,607,287 | |
| Merck & Co., Inc. | | | 27,375 | | | | 2,200,676 | |
| Pfizer, Inc. | | | 64,462 | | | | 2,469,539 | |
| Security Description | | Shares | | | Value | |
| Health Care (continued) | | | | | | | | |
| Zoetis, Inc. | | | 10,418 | | | $ | 1,670,839 | |
| Total Health Care | | | | | | | 13,232,825 | |
| | | | | | | | | |
| Industrials (9.50%) | | | | | | | | |
| 3M Co. | | | 13,422 | | | | 2,318,382 | |
| A O Smith Corp. | | | 9,956 | | | | 560,623 | |
| Fastenal Co. | | | 44,149 | | | | 2,183,168 | |
| Lockheed Martin Corp. | | | 5,378 | | | | 1,962,970 | |
| Northrop Grumman Corp. | | | 4,273 | | | | 1,291,557 | |
| Rollins, Inc. | | | 40,734 | | | | 2,329,170 | |
| United Parcel Service, Inc., | | | | | | | | |
| Class B | | | 11,800 | | | | 2,018,626 | |
| Total Industrials | | | | | | | 12,664,496 | |
| | | | | | | | | |
| Information Technology (31.37%) | | | | | | | | |
| Advanced Micro Devices, Inc.(a) | | | 15,476 | | | | 1,434,006 | |
| Apple, Inc. | | | 54,222 | | | | 6,455,129 | |
| Broadcom, Inc. | | | 7,595 | | | | 3,050,000 | |
| Cadence Design Systems, Inc.(a) | | | 18,104 | | | | 2,105,495 | |
| Cisco Systems, Inc. | | | 18,989 | | | | 816,907 | |
| CommVault Systems, Inc.(a) | | | 22,742 | | | | 1,086,158 | |
| Intel Corp. | | | 53,802 | | | | 2,601,327 | |
| Microsoft Corp. | | | 41,742 | | | | 8,935,710 | |
| Motorola Solutions, Inc. | | | 7,328 | | | | 1,256,972 | |
| National Instruments Corp. | | | 19,301 | | | | 722,436 | |
| Oracle Corp. | | | 41,708 | | | | 2,407,386 | |
| Paychex, Inc. | | | 17,329 | | | | 1,614,196 | |
| Power Integrations, Inc. | | | 18,281 | | | | 1,305,080 | |
| Salesforce.com, Inc.(a) | | | 3,425 | | | | 841,865 | |
| Square, Inc., Class A(a) | | | 11,079 | | | | 2,337,226 | |
| Texas Instruments, Inc. | | | 8,715 | | | | 1,405,294 | |
| Visa, Inc. | | | 16,354 | | | | 3,440,064 | |
| Total Information Technology | | | | | | | 41,815,251 | |
| | | | | | | | | |
| Materials (1.84%) | | | | | | | | |
| Newmont Mining Corp. | | | 32,384 | | | | 1,904,827 | |
| Westrock Co. | | | 13,125 | | | | 554,006 | |
| Total Materials | | | | | | | 2,458,833 | |
| | | | | | | | | |
| Real Estate (9.97%) | | | | | | | | |
| American Assets Trust, Inc. | | | 30,590 | | | | 877,627 | |
| American Tower Corp. | | | 8,693 | | | | 2,009,822 | |
| Brandywine Realty Trust | | | 64,868 | | | | 721,981 | |
| Douglas Emmett, Inc. | | | 18,704 | | | | 579,263 | |
| Equity Residential | | | 23,557 | | | | 1,364,421 | |
| Iron Mountain, Inc.(b) | | | 41,509 | | | | 1,141,498 | |
| Kimco Realty Corp. | | | 1,935 | | | | 27,941 | |
| Lexington Realty Trust | | | 52,525 | | | | 536,280 | |
| National Health Investors, Inc. | | | 11,253 | | | | 727,619 | |
| Omega Healthcare Investors, Inc. | | | 20,722 | | | | 729,829 | |
| Paramount Group, Inc. | | | 98,757 | | | | 913,502 | |
| Piedmont Office Realty Trust, Inc., Class A | | | 87,112 | | | | 1,361,561 | |
| Prologis, Inc. | | | 10,161 | | | | 1,016,608 | |
| Sabra Health Care REIT, Inc. | | | 45,280 | | | | 746,214 | |
See Notes to Financial Statements.
RiverFront Dynamic US Dividend Advantage ETF
| Schedule of Investments | November 30, 2020 |
| Security Description | | Shares | | | Value | |
| Real Estate (continued) | | | | | | | | |
| SITE Centers Corp. | | | 53,409 | | | $ | 538,897 | |
| Total Real Estate | | | | | | | 13,293,063 | |
| | | | | | | | | |
| Utilities (2.05%) | | | | | | | | |
| Alliant Energy Corp. | | | 10,123 | | | | 532,470 | |
| Entergy Corp. | | | 9,691 | | | | 1,054,865 | |
| PPL Corp. | | | 40,145 | | | | 1,140,921 | |
| Total Utilities | | | | | | | 2,728,256 | |
| | | | | | | | | |
| TOTAL COMMON STOCKS | | | | | | | | |
| (Cost $110,170,844) | | | | | | | 133,034,441 | |
| | | 7 Day Yield | | | Shares | | | Value | |
| SHORT TERM INVESTMENTS (0.94%) | | | | | | | | | | | | |
| Money Market Fund (0.08%) | | | | | | | | | | | | |
| State Street Institutional | | | | | | | | | | | | |
| Treasury Plus Money | | | | | | | | | | | | |
| Market Fund | | | | | | | | | | | | |
| (Cost $101,663) | | | 0.01 | % | | | 101,663 | | | | 101,663 | |
| | | | | | | | | | | | | |
| Investments Purchased with Collateral from Securities Loaned (0.86%) | | | | | | | | | | | | |
| State Street Navigator | | | | | | | | | | | | |
| Securities Lending | | | | | | | | | | | | |
| Government Money | | | | | | | | | | | | |
| Market Portfolio, 0.11% | | | | | | | | | | | | |
| (Cost $1,144,314) | | | | | | | 1,144,314 | | | | 1,144,314 | |
| TOTAL SHORT TERM INVESTMENTS | | | | | | | | | | | | |
| (Cost $1,245,977) | | | | | | | | | | | 1,245,977 | |
| | | | | | | | | | | | | |
| TOTAL INVESTMENTS (100.74%) | | | | | | | | | | | | |
| (Cost $111,416,821) | | | | | | | | | | $ | 134,280,418 | |
| LIABILITIES IN EXCESS OF OTHER ASSETS (-0.74%) | | | | | | | | | | | (986,253 | ) |
| NET ASSETS - 100.00% | | | | | | | | | | $ | 133,294,165 | |
| (a) | Non-income producing security. |
| (b) | Security, or a portion of the security position is currently on loan. The total market value of securities on loan is $1,783,322. |
See Notes to Financial Statements.
RiverFront Dynamic US Flex-Cap ETF
| Schedule of Investments | November 30, 2020 |
| Security Description | | Shares | | | Value | |
| COMMON STOCKS (99.91%) | | | | | | | | |
| Communication Services (6.32%) | | | | | | | | |
| Alphabet, Inc., Class A(a) | | | 265 | | | $ | 464,916 | |
| Alphabet, Inc., Class C(a) | | | 253 | | | | 445,467 | |
| Comcast Corp., Class A | | | 14,785 | | | | 742,798 | |
| Facebook, Inc., Class A(a) | | | 3,269 | | | | 905,415 | |
| New York Times Co., Class A | | | 10,469 | | | | 449,225 | |
| Sirius XM Holdings, Inc.(b) | | | 80,461 | | | | 522,192 | |
| Verizon Communications, Inc. | | | 16,239 | | | | 980,998 | |
| Total Communication Services | | | | | | | 4,511,011 | |
| | | | | | | | | |
| Consumer Discretionary (10.63%) | | | | | | | | |
| Adtalem Global Education, | | | | | | | | |
| Inc.(a) | | | 10,093 | | | | 288,963 | |
| Amazon.com, Inc.(a) | | | 826 | | | | 2,616,801 | |
| Chegg, Inc.(a)(b) | | | 5,980 | | | | 466,022 | |
| Domino's Pizza, Inc. | | | 1,442 | | | | 566,086 | |
| Hanesbrands, Inc. | | | 22,287 | | | | 316,475 | |
| Lowe's Cos., Inc. | | | 4,551 | | | | 709,137 | |
| PulteGroup, Inc. | | | 10,799 | | | | 471,160 | |
| Sonic Automotive, Inc., Class A | | | 10,614 | | | | 428,593 | |
| Target Corp. | | | 4,612 | | | | 827,992 | |
| Wendy's Co. | | | 16,910 | | | | 371,851 | |
| Williams-Sonoma, Inc. | | | 4,781 | | | | 523,376 | |
| Total Consumer Discretionary | | | | | | | 7,586,456 | |
| | | | | | | | | |
| Consumer Staples (8.02%) | | | | | | | | |
| Brown-Forman Corp. | | | 7,756 | | | | 571,850 | |
| Coca-Cola Co. | | | 17,773 | | | | 917,087 | |
| Colgate-Palmolive Co. | | | 8,485 | | | | 726,655 | |
| Mondelez International, Inc. | | | 11,984 | | | | 688,481 | |
| Procter & Gamble Co. | | | 8,068 | | | | 1,120,403 | |
| Sprouts Farmers Market, Inc.(a) | | | 13,582 | | | | 287,531 | |
| Vector Group, Ltd. | | | 40,325 | | | | 453,253 | |
| Walmart, Inc. | | | 6,304 | | | | 963,188 | |
| Total Consumer Staples | | | | | | | 5,728,448 | |
| | | | | | | | | |
| Energy (0.49%) | | | | | | | | |
| Cabot Oil & Gas Corp. | | | 20,098 | | | | 352,117 | |
| | | | | | | | | |
| Financials (9.37%) | | | | | | | | |
| Ameriprise Financial, Inc. | | | 3,479 | | | | 644,450 | |
| Berkshire Hathaway, Inc., Class B(a) | | | 1,152 | | | | 263,704 | |
| BlackRock, Inc. | | | 1,154 | | | | 805,896 | |
| First Commonwealth Financial Corp. | | | 39,877 | | | | 385,611 | |
| Hope Bancorp, Inc. | | | 33,827 | | | | 320,680 | |
| Kearny Financial Corp. | | | 40,645 | | | | 401,979 | |
| Mercury General Corp. | | | 9,867 | | | | 438,785 | |
| National General Holdings Corp. | | | 12,787 | | | | 435,781 | |
| OceanFirst Financial Corp. | | | 16,581 | | | | 261,482 | |
| Progressive Corp. | | | 9,523 | | | | 829,549 | |
| Provident Financial Services, Inc. | | | 24,410 | | | | 382,505 | |
| S&P Global, Inc. | | | 1,859 | | | | 653,959 | |
| Security Description | | Shares | | | Value | |
| Financials (continued) | | | | | | | | |
| Trupanion, Inc.(a) | | | 5,153 | | | $ | 522,411 | |
| Trustmark Corp. | | | 13,938 | | | | 345,941 | |
| Total Financials | | | | | | | 6,692,733 | |
| | | | | | | | | |
| Health Care (13.23%) | | | | | | | | |
| Alexion Pharmaceuticals, Inc.(a) | | | 5,264 | | | | 642,787 | |
| Anthem, Inc. | | | 2,233 | | | | 695,624 | |
| Boston Scientific Corp.(a) | | | 15,369 | | | | 509,482 | |
| Eli Lilly and Co. | | | 5,096 | | | | 742,232 | |
| Exelixis, Inc.(a) | | | 22,280 | | | | 426,885 | |
| HMS Holdings Corp.(a) | | | 10,671 | | | | 335,283 | |
| Johnson & Johnson | | | 1,808 | | | | 261,581 | |
| Merck & Co., Inc. | | | 10,773 | | | | 866,042 | |
| NeoGenomics, Inc.(a) | | | 9,843 | | | | 468,330 | |
| Pacific Biosciences of California, Inc.(a) | | | 27,366 | | | | 432,657 | |
| Perrigo Co. PLC | | | 8,556 | | | | 412,570 | |
| Quidel Corp.(a) | | | 2,393 | | | | 466,755 | |
| RadNet, Inc.(a) | | | 20,685 | | | | 385,155 | |
| STAAR Surgical Co.(a) | | | 5,064 | | | | 360,911 | |
| UnitedHealth Group, Inc. | | | 3,410 | | | | 1,146,919 | |
| Vertex Pharmaceuticals, Inc.(a) | | | 2,401 | | | | 546,828 | |
| Zoetis, Inc. | | | 4,647 | | | | 745,286 | |
| Total Health Care | | | | | | | 9,445,327 | |
| | | | | | | | | |
| Industrials (9.28%) | | | | | | | | |
| 3M Co. | | | 4,206 | | | | 726,502 | |
| Allison Transmission Holdings, Inc. | | | 9,355 | | | | 384,023 | |
| Cintas Corp. | | | 1,708 | | | | 606,852 | |
| Expeditors International of Washington, Inc. | | | 4,257 | | | | 380,448 | |
| Fastenal Co. | | | 8,757 | | | | 433,034 | |
| Graco, Inc. | | | 9,013 | | | | 610,541 | |
| Hubbell, Inc. | | | 2,279 | | | | 368,264 | |
| Lockheed Martin Corp. | | | 1,731 | | | | 631,815 | |
| Northrop Grumman Corp. | | | 1,803 | | | | 544,975 | |
| Rollins, Inc. | | | 9,291 | | | | 531,259 | |
| Steelcase, Inc., Class A | | | 23,111 | | | | 280,799 | |
| United Parcel Service, Inc., Class B | | | 4,716 | | | | 806,766 | |
| Vicor Corp.(a) | | | 3,894 | | | | 319,152 | |
| Total Industrials | | | | | | | 6,624,430 | |
| | | | | | | | | |
| Information Technology (32.63%) | | | | | | | | |
| Adobe, Inc.(a) | | | 1,876 | | | | 897,610 | |
| Advanced Micro Devices, Inc.(a) | | | 8,101 | | | | 750,639 | |
| Apple, Inc. | | | 31,968 | | | | 3,805,790 | |
| Broadcom, Inc. | | | 1,752 | | | | 703,568 | |
| CACI International, Inc., Class A(a) | | | 1,373 | | | | 325,799 | |
| Cognizant Technology Solutions Corp., Class A | | | 5,580 | | | | 435,965 | |
| Enphase Energy, Inc.(a) | | | 5,752 | | | | 785,551 | |
| Entegris, Inc. | | | 6,292 | | | | 582,765 | |
| EPAM Systems, Inc.(a) | | | 1,607 | | | | 517,984 | |
| Gogo, Inc.(a)(b) | | | 40,469 | | | | 426,543 | |
See Notes to Financial Statements.
RiverFront Dynamic US Flex-Cap ETF
| Schedule of Investments | November 30, 2020 |
| Security Description | | Shares | | | Value | |
| Information Technology (continued) | | | | | | | | |
| Intel Corp. | | | 18,554 | | | $ | 897,086 | |
| Knowles Corp.(a) | | | 29,180 | | | | 495,476 | |
| Mastercard, Inc., Class A | | | 3,284 | | | | 1,105,099 | |
| Microsoft Corp. | | | 17,085 | | | | 3,657,386 | |
| Monolithic Power Systems, Inc. | | | 2,065 | | | | 660,717 | |
| NCR Corp.(a) | | | 11,901 | | | | 329,301 | |
| Oracle Corp. | | | 12,962 | | | | 748,167 | |
| PayPal Holdings, Inc.(a) | | | 4,823 | | | | 1,032,701 | |
| Power Integrations, Inc. | | | 7,755 | | | | 553,630 | |
| QAD, Inc. | | | 8,399 | | | | 481,515 | |
| Salesforce.com, Inc.(a) | | | 3,834 | | | | 942,397 | |
| Square, Inc., Class A(a) | | | 3,297 | | | | 695,535 | |
| Visa, Inc. | | | 5,935 | | | | 1,248,427 | |
| VMware, Inc., Class A(a) | | | 3,589 | | | | 502,065 | |
| Zebra Technologies Corp., Class A(a) | | | 1,892 | | | | 715,971 | |
| Total Information Technology | | | | | | | 23,297,687 | |
| | | | | | | | | |
| Materials (4.36%) | | | | | | | | |
| Axalta Coating Systems, Ltd.(a) | | | 13,944 | | | | 398,938 | |
| Eastman Chemical Co. | | | 3,967 | | | | 386,386 | |
| FMC Corp. | | | 4,875 | | | | 565,549 | |
| NewMarket Corp. | | | 739 | | | | 273,253 | |
| Owens-Illinois, Inc. | | | 38,565 | | | | 436,556 | |
| Packaging Corp. of America | | | 2,607 | | | | 338,910 | |
| Vulcan Materials Co. | | | 2,788 | | | | 389,344 | |
| Westrock Co. | | | 7,593 | | | | 320,500 | |
| Total Materials | | | | | | | 3,109,436 | |
| | | | | | | | | |
| Real Estate (4.74%) | | | | | | | | |
| Apartment Investment and | | | | | | | | |
| Management Co., Class A | | | 8,962 | | | | 271,997 | |
| CoreCivic, Inc. | | | 58,163 | | | | 412,375 | |
| CubeSmart | | | 11,156 | | | | 362,905 | |
| Douglas Emmett, Inc. | | | 11,805 | | | | 365,601 | |
| Kennedy-Wilson Holdings, Inc. | | | 22,707 | | | | 362,858 | |
| Piedmont Office Realty Trust, | | | | | | | | |
| Inc., Class A | | | 27,954 | | | | 436,921 | |
| Prologis, Inc. | | | 8,056 | | | | 806,003 | |
| Weingarten Realty Investors | | | 17,405 | | | | 363,938 | |
| Total Real Estate | | | | | | | 3,382,598 | |
| | | | | | | | | |
| Utilities (0.84%) | | | | | | | | |
| Entergy Corp. | | | 5,528 | | | | 601,723 | |
| | | | | | | | | |
| TOTAL COMMON STOCKS | | | | | | | | |
| (Cost $58,601,310) | | | | | | | 71,331,966 | |
| | | Shares | | | Value | |
| SHORT TERM INVESTMENTS (0.76%) | | | | | | | | |
| Investments Purchased with Collateral | | | | | | | | |
| from Securities Loaned (0.76%) | | | | | | | | |
| State Street Navigator | | | | | | | | |
| Securities Lending | | | | | | | | |
| Government Money Market | | | | | | | | |
| Portfolio, 0.11% | | | | | | | | |
| (Cost $546,893) | | | 546,893 | | | $ | 546,893 | |
| | | | | | | | | |
| TOTAL SHORT TERM INVESTMENTS | | | | | | | | |
| (Cost $546,893) | | | | | | | 546,893 | |
| | | | | | | | | |
| TOTAL INVESTMENTS (100.67%) | | | | | | | | |
| (Cost $59,148,203) | | | | | | $ | 71,878,859 | |
| LIABILITIES IN EXCESS OF OTHER ASSETS (-0.67%) | | | | | | | (479,100 | ) |
| NET ASSETS - 100.00% | | | | | | $ | 71,399,759 | |
| (a) | Non-income producing security. |
| (b) | Security, or a portion of the security position is currently on loan. The total market value of securities on loan is $1,061,055. |
See Notes to Financial Statements.
RiverFront Strategic Income Fund
| Schedule of Investments | November 30, 2020 |
| | | Principal | | | | |
| Security Description | | Amount | | | Value | |
| CORPORATE BONDS (84.88%) | | | | | | | | |
| Communications (7.72%) | | | | | | | | |
| AMC Networks, Inc. | | | | | | | | |
| 5.00%, 04/01/2024 | | $ | 1,060,000 | | | $ | 1,078,942 | |
| CCO Holdings LLC / CCO Holdings | | | | | | | | |
| Capital Corp. | | | | | | | | |
| 5.50%, 05/01/2026(a) | | | 912,000 | | | | 951,130 | |
| CSC Holdings LLC | | | | | | | | |
| 6.75%, 11/15/2021 | | | 912,000 | | | | 955,749 | |
| Hughes Satellite Systems Corp. | | | | | | | | |
| 7.63%, 06/15/2021 | | | 1,165,000 | | | | 1,201,406 | |
| Lamar Media Corp. | | | | | | | | |
| 5.75%, 02/01/2026 | | | 452,000 | | | | 468,622 | |
| Netflix, Inc. | | | | | | | | |
| 5.38%, 02/01/2021 | | | 1,249,000 | | | | 1,261,490 | |
| T-Mobile USA, Inc. | | | | | | | | |
| 4.50%, 02/01/2026 | | | 912,000 | | | | 938,334 | |
| VeriSign, Inc. | | | | | | | | |
| 4.63%, 05/01/2023 | | | 1,038,000 | | | | 1,050,326 | |
| Videotron, Ltd. | | | | | | | | |
| 5.00%, 07/15/2022 | | | 1,209,000 | | | | 1,273,228 | |
| Total Communications | | | | | | | 9,179,227 | |
| | | | | | | | | |
| Consumer Discretionary (10.73%) | | | | | | | | |
| ADT Security Corp. | | | | | | | | |
| 3.50%, 07/15/2022 | | | 922,000 | | | | 945,626 | |
| Boyd Gaming Corp. | | | | | | | | |
| 6.00%, 08/15/2026 | | | 719,000 | | | | 750,456 | |
| DR Horton, Inc. | | | | | | | | |
| 4.38%, 09/15/2022 | | | 1,432,000 | | | | 1,515,573 | |
| General Motors Financial Co., Inc. | | | | | | | | |
| 4.20%, 11/06/2021 | | | 912,000 | | | | 942,063 | |
| Hilton Worldwide Finance LLC / | | | | | | | | |
| Hilton Worldwide Finance Corp. | | | | | | | | |
| 4.63%, 04/01/2025 | | | 805,000 | | | | 823,612 | |
| International Game Technology PLC | | | | | | | | |
| 6.25%, 02/15/2022(a) | | | 861,000 | | | | 887,411 | |
| KB Home | | | | | | | | |
| 7.00%, 12/15/2021 | | | 452,000 | | | | 470,928 | |
| Las Vegas Sands Corp. | | | | | | | | |
| 3.20%, 08/08/2024 | | | 805,000 | | | | 841,766 | |
| Lennar Corp. | | | | | | | | |
| 4.13%, 01/15/2022 | | | 452,000 | | | | 465,278 | |
| 4.75%, 11/29/2027 | | | 1,000,000 | | | | 1,187,500 | |
| Newell Brands, Inc. | | | | | | | | |
| 4.35%, 04/01/2023 | | | 326,000 | | | | 343,506 | |
| Nissan Motor Co., Ltd. | | | | | | | | |
| 3.52%, 09/17/2025(a) | | | 1,000,000 | | | | 1,044,653 | |
| PulteGroup, Inc. | | | | | | | | |
| 4.25%, 03/01/2021 | | | 452,000 | | | | 455,718 | |
| 5.50%, 03/01/2026 | | | 452,000 | | | | 543,982 | |
| Six Flags Entertainment Corp. | | | | | | | | |
| 4.88%, 07/31/2024(a) | | | 595,000 | | | | 593,733 | |
| | | Principal | | | | |
| Security Description | | Amount | | | Value | |
| Consumer Discretionary (continued) | | | | | | | | |
| Toll Brothers Finance Corp. | | | | | | | | |
| 5.88%, 02/15/2022 | | $ | 912,000 | | | $ | 950,468 | |
| Total Consumer Discretionary | | | | | | | 12,762,273 | |
| | | | | | | | | |
| Consumer Staples (2.70%) | | | | | | | | |
| Anheuser-Busch InBev | | | | | | | | |
| Worldwide, Inc. | | | | | | | | |
| 4.75%, 01/23/2029 | | | 912,000 | | | | 1,121,280 | |
| JBS USA LUX SA / JBS USA | | | | | | | | |
| Finance, Inc. | | | | | | | | |
| 5.75%, 06/15/2025(a) | | | 367,000 | | | | 379,386 | |
| Spectrum Brands, Inc. | | | | | | | | |
| 5.75%, 07/15/2025 | | | 560,000 | | | | 579,006 | |
| TreeHouse Foods, Inc. | | | | | | | | |
| 6.00%, 02/15/2024(a) | | | 1,100,000 | | | | 1,127,297 | |
| Total Consumer Staples | | | | | | | 3,206,969 | |
| | | | | | | | | |
| Energy (7.33%) | | | | | | | | |
| Cheniere Corpus Christi Holdings LLC | | | | | | | | |
| 7.00%, 06/30/2024 | | | 1,051,000 | | | | 1,214,003 | |
| EQM Midstream Partners LP | | | | | | | | |
| 4.75%, 07/15/2023 | | | 865,000 | | | | 883,814 | |
| Kinder Morgan Energy Partners LP | | | | | | | | |
| 5.00%, 10/01/2021 | | | 1,235,000 | | | | 1,267,299 | |
| Newfield Exploration Co. | | | | | | | | |
| 5.75%, 01/30/2022 | | | 1,440,000 | | | | 1,491,535 | |
| Petroleos Mexicanos | | | | | | | | |
| 5.50%, 01/21/2021 | | | 1,059,000 | | | | 1,064,083 | |
| Schlumberger Holdings Corp. | | | | | | | | |
| 3.90%, 05/17/2028(a) | | | 912,000 | | | | 1,015,659 | |
| Tallgrass Energy Partners LP / | | | | | | | | |
| Tallgrass Energy Finance Corp. | | | | | | | | |
| 4.75%, 10/01/2023(a) | | | 718,000 | | | | 706,738 | |
| Valero Energy Corp. | | | | | | | | |
| 3.40%, 09/15/2026 | | | 1,000,000 | | | | 1,079,356 | |
| Total Energy | | | | | | | 8,722,487 | |
| | | | | | | | | |
| Financials (23.93%) | | | | | | | | |
| Air Lease Corp. | | | | | | | | |
| 4.25%, 02/01/2024 | | | 835,000 | | | | 896,323 | |
| Ally Financial, Inc. | | | | | | | | |
| 4.25%, 04/15/2021 | | | 1,277,000 | | | | 1,294,010 | |
| Ares Capital Corp. | | | | | | | | |
| 3.50%, 02/10/2023 | | | 1,002,000 | | | | 1,045,963 | |
| Bancolombia SA | | | | | | | | |
| 5.13%, 09/11/2022 | | | 824,000 | | | | 870,152 | |
| Bank of America Corp. | | | | | | | | |
| 4.25%, 10/22/2026 | | | 1,364,000 | | | | 1,594,359 | |
| Capital One Financial Corp. | | | | | | | | |
| 4.20%, 10/29/2025 | | | 912,000 | | | | 1,036,069 | |
| CIT Group, Inc. | | | | | | | | |
| 5.00%, 08/15/2022 | | | 1,750,000 | | | | 1,864,082 | |
| Citigroup, Inc. | | | | | | | | |
| 4.45%, 09/29/2027 | | | 1,364,000 | | | | 1,601,342 | |
See Notes to Financial Statements.
RiverFront Strategic Income Fund
| Schedule of Investments | November 30, 2020 |
| | | Principal | | | | |
| Security Description | | Amount | | | Value | |
| Financials (continued) | | | | | | | | |
| ESH Hospitality, Inc. | | | | | | | | |
| 5.25%, 05/01/2025(a) | | $ | 1,002,000 | $ | | | 1,027,275 | |
| Fortress Transportation and | | | | | | | | |
| Infrastructure Investors LLC | | | | | | | | |
| 6.75%, 03/15/2022(a) | | | 360,000 | | | | 363,382 | |
| GLP Capital LP / GLP Financing II, Inc. | | | | | | | | |
| 3.35%, 09/01/2024 | | | 805,000 | | | | 828,929 | |
| Goldman Sachs Group, Inc. | | | | | | | | |
| 4.25%, 10/21/2025 | | | 1,364,000 | | | | 1,568,395 | |
| HAT Holdings I LLC / HAT Holdings II LLC | | | | | | | | |
| 5.25%, 07/15/2024(a) | | | 360,000 | | | | 375,113 | |
| Icahn Enterprises LP / Icahn | | | | | | | | |
| Enterprises Finance Corp. | | | | | | | | |
| 4.75%, 09/15/2024 | | | 1,079,000 | | | | 1,113,059 | |
| Iron Mountain, Inc. | | | | | | | | |
| 4.88%, 09/15/2027(a) | | | 452,000 | | | | 469,698 | |
| iStar, Inc. | | | | | | | | |
| 4.75%, 10/01/2024 | | | 1,121,000 | | | | 1,122,990 | |
| JPMorgan Chase & Co. | | | | | | | | |
| 4.25%, 10/01/2027 | | | 1,364,000 | | | | 1,608,750 | |
| Ladder Capital Finance Holdings | | | | | | | | |
| LLLP / Ladder Capital Finance Corp. | | | | | | | | |
| 5.25%, 03/15/2022(a) | | | 360,000 | | | | 359,775 | |
| MPT Operating Partnership LP / | | | | | | | | |
| MPT Finance Corp. | | | | | | | | |
| 5.25%, 08/01/2026 | | | 805,000 | | | | 843,398 | |
| Newmark Group, Inc. | | | | | | | | |
| 6.13%, 11/15/2023 | | | 503,000 | | | | 546,775 | |
| Omega Healthcare Investors, Inc. | | | | | | | | |
| 4.38%, 08/01/2023 | | | 1,332,000 | | | | 1,436,253 | |
| Park Aerospace Holdings, Ltd. | | | | | | | | |
| 5.25%, 08/15/2022(a) | | | 1,712,000 | | | | 1,790,924 | |
| Santander Holdings USA, Inc. | | | | | | | | |
| 3.50%, 06/07/2024 | | | 408,000 | | | | 440,779 | |
| SBA Communications Corp. | | | | | | | | |
| 4.00%, 10/01/2022 | | | 360,000 | | | | 364,725 | |
| 3.88%, 02/15/2027(a) | | | 452,000 | | | | 466,125 | |
| Starwood Property Trust, Inc. | | | | | | | | |
| 5.00%, 12/15/2021 | | | 1,415,000 | | | | 1,439,762 | |
| Synchrony Financial | | | | | | | | |
| 2.85%, 07/25/2022 | | | 850,000 | | | | 878,215 | |
| VICI Properties LP / VICI Note Co., Inc. | | | | | | | | |
| 4.25%, 12/01/2026(a) | | | 1,183,000 | | | | 1,229,226 | |
| Total Financials | | | | | | | 28,475,848 | |
| | | | | | | | | |
| Health Care (2.30%) | | | | | | | | |
| Centene Corp. | | | | | | | | |
| 4.75%, 01/15/2025 | | | 1,202,000 | | | | 1,240,440 | |
| DaVita, Inc. | | | | | | | | |
| 4.63%, 06/01/2030(a) | | | 452,000 | | | | 475,448 | |
| | | Principal | | | | |
| Security Description | | Amount | | | Value | |
| Health Care (continued) | | | | | | | | |
| HCA, Inc. | | | | | | | | |
| 5.88%, 05/01/2023 | | $ | 934,000 | | | $ | 1,022,921 | |
| Total Health Care | | | | | | | 2,738,809 | |
| | | | | | | | | |
| Industrials (7.42%) | | | | | | | | |
| Boeing Co. | | | | | | | | |
| 4.88%, 05/01/2025 | | | 1,000,000 | | | | 1,116,601 | |
| Colfax Corp. | | | | | | | | |
| 6.00%, 02/15/2024(a) | | | 742,000 | | | | 770,752 | |
| MasTec, Inc. | | | | | | | | |
| 4.50%, 08/15/2028(a) | | | 922,000 | | | | 964,255 | |
| Stericycle, Inc. | | | | | | | | |
| 5.38%, 07/15/2024(a) | | | 360,000 | | | | 375,300 | |
| United Rentals North America, Inc. | | | | | | | | |
| 5.88%, 09/15/2026 | | | 1,386,000 | | | | 1,467,240 | |
| WESCO Distribution, Inc. | | | | | | | | |
| 5.38%, 12/15/2021 | | | 1,758,000 | | | | 1,766,641 | |
| XPO Logistics, Inc. | | | | | | | | |
| 6.50%, 06/15/2022(a) | | | 1,515,000 | | | | 1,519,280 | |
| 6.75%, 08/15/2024(a) | | | 805,000 | | | | 853,944 | |
| Total Industrials | | | | | | | 8,834,013 | |
| | | | | | | | | |
| Materials (12.57%) | | | | | | | | |
| ArcelorMittal SA | | | | | | | | |
| 3.60%, 07/16/2024 | | | 934,000 | | | | 994,288 | |
| Ashland LLC | | | | | | | | |
| 4.75%, 08/15/2022 | | | 130,000 | | | | 136,622 | |
| Ball Corp. | | | | | | | | |
| 5.00%, 03/15/2022 | | | 452,000 | | | | 472,182 | |
| 5.25%, 07/01/2025 | | | 686,000 | | | | 788,478 | |
| Berry Global, Inc. | | | | | | | | |
| 4.88%, 07/15/2026(a) | | | 951,000 | | | | 1,010,632 | |
| Braskem Finance, Ltd. | | | | | | | | |
| 6.45%, 02/03/2024 | | | 1,102,000 | | | | 1,208,641 | |
| Celanese US Holdings LLC | | | | | | | | |
| 5.88%, 06/15/2021 | | | 1,275,000 | | | | 1,309,213 | |
| CF Industries, Inc. | | | | | | | | |
| 3.45%, 06/01/2023 | | | 1,078,000 | | | | 1,133,743 | |
| Crown Americas LLC / Crown | | | | | | | | |
| Americas Capital Corp. IV | | | | | | | | |
| 4.50%, 01/15/2023 | | | 1,106,000 | | | | 1,169,595 | |
| FMG Resources August 2006 Pty, | | | | | | | | |
| Ltd. | | | | | | | | |
| 4.75%, 05/15/2022(a) | | | 1,547,000 | | | | 1,596,311 | |
| Freeport-McMoRan, Inc. | | | | | | | | |
| 3.88%, 03/15/2023 | | | 934,000 | | | | 973,228 | |
| 5.00%, 09/01/2027 | | | 452,000 | | | | 480,711 | |
| Graphic Packaging International LLC | | | | | | | | |
| 4.75%, 04/15/2021 | | | 627,000 | | | | 630,135 | |
| 4.88%, 11/15/2022 | | | 1,224,000 | | | | 1,287,911 | |
| Mauser Packaging Solutions | | | | | | | | |
| Holding Co. | | | | | | | | |
| 5.50%, 04/15/2024(a) | | | 360,000 | | | | 365,026 | |
See Notes to Financial Statements.
RiverFront Strategic Income Fund
| Schedule of Investments | November 30, 2020 |
| | | Principal | | | | |
| Security Description | | Amount | | | Value | |
| Materials (continued) | | | | | | | | |
| Sasol Financing International, Ltd. | | | | | | | | |
| 4.50%, 11/14/2022 | | $ | 483,000 | | | $ | 488,410 | |
| Standard Industries, Inc. | | | | | | | | |
| 3.38%, 01/15/2031(a) | | | 912,000 | | | | 916,560 | |
| Total Materials | | | | | | | 14,961,686 | |
| | | | | | | | | |
| Technology (6.29%) | | | | | | | | |
| CommScope, Inc. | | | | | | | | |
| 5.50%, 03/01/2024(a) | | | 1,195,000 | | | | 1,229,494 | |
| Dell, Inc. | | | | | | | | |
| 4.63%, 04/01/2021 | | | 997,000 | | | | 1,009,762 | |
| Flex, Ltd. | | | | | | | | |
| 5.00%, 02/15/2023 | | | 1,100,000 | | | | 1,193,431 | |
| Microchip Technology, Inc. | | | | | | | | |
| 4.25%, 09/01/2025(a) | | | 922,000 | | | | 967,155 | |
| Micron Technology, Inc. | | | | | | | | |
| 4.64%, 02/06/2024 | | | 835,000 | | | | 930,794 | |
| NortonLifeLock, Inc. | | | | | | | | |
| 3.95%, 06/15/2022 | | | 123,000 | | | | 126,075 | |
| 5.00%, 04/15/2025(a) | | | 713,000 | | | | 728,044 | |
| Seagate HDD Cayman | | | | | | | | |
| 4.75%, 06/01/2023 | | | 912,000 | | | | 989,557 | |
| Xerox Corp. | | | | | | | | |
| 4.50%, 05/15/2021 | | | 305,000 | | | | 309,644 | |
| Total Technology | | | | | | | 7,483,956 | |
| | | | | | | | | |
| Utilities (3.89%) | | | | | | | | |
| Calpine Corp. | | | | | | | | |
| 5.25%, 06/01/2026(a) | | | 719,000 | | | | 745,999 | |
| NextEra Energy Operating | | | | | | | | |
| Partners LP | | | | | | | | |
| 4.25%, 07/15/2024(a) | | | 1,239,000 | | | | 1,305,633 | |
| NRG Energy, Inc. | | | | | | | | |
| 6.63%, 01/15/2027 | | | 1,000,000 | | | | 1,053,960 | |
| Vistra Operations Co. LLC | | | | | | | | |
| 3.55%, 07/15/2024(a) | | | 1,418,000 | | | | 1,526,847 | |
| Total Utilities | | | | | | | 4,632,439 | |
| | | | | | | | | |
| TOTAL CORPORATE BONDS | | | | | | | | |
| (Cost $99,471,947) | | | | | | | 100,997,707 | |
| | | | | | | | | |
| | | 7 Day Yield | | | Shares | | | Value | |
| SHORT TERM INVESTMENTS (13.53%) | | | | | | | | | | | | |
| State Street Institutional | | | | | | | | | | | | |
| Treasury Plus Money | | | | | | | | | | | | |
| Market Fund | | | 0.01 | % | | | 16,092,366 | | | | 16,092,366 | |
| TOTAL SHORT TERM INVESTMENTS | | | | | | | | | | | | |
| (Cost $16,092,366) | | | | | | | | | | | 16,092,366 | |
| | | | | | | | | | | | | |
| TOTAL INVESTMENTS (98.41%) | | | | | | | | | | | | |
| (Cost $115,564,313) | | | | | | | | | | $ | 117,090,073 | |
| OTHER ASSETS IN EXCESS OF LIABILITIES (1.59%) | | | | | | | | | | | 1,893,592 | |
| NET ASSETS - 100.00% | | | | | | | | | | $ | 118,983,665 | |
| (a) | Securities exempt from registration under Rule 144A of the Securities Act of 1933. These securities may be sold in the ordinary course of business in transactions exempt from registration, normally to qualified institutional buyers. At period end, the aggregate market value of those securities was $28,138,205, representing 23.65% of net assets. |
See Notes to Financial Statements.
RiverFront ETFs
| Statement of Assets and Liabilities | November 30, 2020 |
| | | RiverFront Dynamic Core Income ETF | | | RiverFront Dynamic Unconstrained Income ETF | | | RiverFront Dynamic US Dividend Advantage ETF | | | RiverFront Dynamic US Flex-Cap ETF | | | RiverFront Strategic Income Fund | |
| ASSETS: | | | | | | | | | | | | | | | | | | | | |
| Investments, at value | | $ | 112,176,021 | | | $ | 12,647,825 | | | $ | 134,280,418 | | | $ | 71,878,859 | | | $ | 117,090,073 | |
| Cash | | | – | | | | – | | | | – | | | | – | | | | 647,295 | |
| Dividend receivable | | | – | | | | – | | | | 213,635 | | | | 91,607 | | | | – | |
| Interest receivable | | | 592,904 | | | | 151,314 | | | | – | | | | – | | | | 1,291,022 | |
| Receivable for investments sold | | | 1,560 | | | | 2,000 | | | | – | | | | 1,896,626 | | | | – | |
| Total Assets | | | 112,770,485 | | | | 12,801,139 | | | | 134,494,053 | | | | 73,867,092 | | | | 119,028,390 | |
| | | | | | | | | | | | | | | | | | | | | |
| LIABILITIES: | | | | | | | | | | | | | | | | | | | | |
| Payable to adviser | | | 46,979 | | | | 5,325 | | | | 55,574 | | | | 30,527 | | | | 44,725 | |
| Payable for investments purchased | | | – | | | | 2,027 | | | | – | | | | – | | | | – | |
| Payable for collateral upon return of | | | | | | | | | | | | | | | | | | | | |
| securities loaned | | | – | | | | – | | | | 1,144,314 | | | | 546,893 | | | | – | |
| Payable for capital shares | | | – | | | | – | | | | – | | | | 1,889,913 | | | | – | |
| Total Liabilities | | | 46,979 | | | | 7,352 | | | | 1,199,888 | | | | 2,467,333 | | | | 44,725 | |
| NET ASSETS | | $ | 112,723,506 | | | $ | 12,793,787 | | | $ | 133,294,165 | | | $ | 71,399,759 | | | $ | 118,983,665 | |
| | | | | | | | | | | | | | | | | | | | | |
| NET ASSETS CONSIST OF: | | | | | | | | | | | | | | | | | | | | |
| Paid-in capital | | $ | 104,715,049 | | | $ | 12,815,858 | | | $ | 127,727,164 | | | $ | 83,688,531 | | | $ | 127,363,278 | |
| Total distributable earnings | | | 8,008,457 | | | | (22,071 | ) | | | 5,567,001 | | | | (12,288,772 | ) | | | (8,379,613 | ) |
| NET ASSETS | | $ | 112,723,506 | | | $ | 12,793,787 | | | $ | 133,294,165 | | | $ | 71,399,759 | | | $ | 118,983,665 | |
| | | | | | | | | | | | | | | | | | | | | |
| INVESTMENTS, AT COST | | $ | 103,993,267 | | | $ | 12,198,410 | | | $ | 111,416,821 | | | $ | 59,148,203 | | | $ | 115,564,313 | |
| | | | | | | | | | | | | | | | | | | | | |
| PRICING OF SHARES | | | | | | | | | | | | | | | | | | | | |
| Net Assets | | $ | 112,723,506 | | | $ | 12,793,787 | | | $ | 133,294,165 | | | $ | 71,399,759 | | | $ | 118,983,665 | |
| Shares of beneficial interest outstanding (Unlimited number of shares authorized, par value $0.01 per share) | | | 4,300,000 | | | | 500,000 | | | | 3,600,002 | | | | 1,900,002 | | | | 4,800,000 | |
| Net Asset Value, offering and redemption price per share | | $ | 26.21 | | | $ | 25.59 | | | $ | 37.03 | | | $ | 37.58 | | | $ | 24.79 | |
See Notes to Financial Statements.
RiverFront ETFs
| Statement of Operations | For the Year Ended November 30, 2020 |
| | | RiverFront Dynamic Core Income ETF | | | RiverFront Dynamic Unconstrained Income ETF | | | RiverFront Dynamic US Dividend Advantage ETF | | | RiverFront Dynamic US Flex-Cap ETF | | | RiverFront Strategic Income Fund | |
| INVESTMENT INCOME: | | | | | | | | | | | | | | | | | | | | |
| Interest | | $ | 2,963,226 | | | $ | 597,197 | | | $ | – | | | $ | – | | | $ | 5,292,256 | |
| Dividends(a) | | | 116,777 | | | | 47,390 | | | | 2,734,286 | | | | 1,640,738 | | | | 96,269 | |
| Securities Lending Income | | | – | | | | – | | | | 2,372 | | | | 4,035 | | | | – | |
| Total Investment Income | | | 3,080,003 | | | | 644,587 | | | | 2,736,658 | | | | 1,644,773 | | | | 5,388,525 | |
| | | | | | | | | | | | | | | | | | | | | |
| EXPENSES: | | | | | | | | | | | | | | | | | | | | |
| Investment adviser and sub-adviser fees (Note 3) | | | 641,636 | | | | 69,126 | | | | 646,482 | | | | 460,449 | | | | 655,065 | |
| Total Expenses | | | 641,636 | | | | 69,126 | | | | 646,482 | | | | 460,449 | | | | 655,065 | |
| NET INVESTMENT INCOME | | | 2,438,367 | | | | 575,461 | | | | 2,090,176 | | | | 1,184,324 | | | | 4,733,460 | |
| | | | | | | | | | | | | | | | | | | | | |
| REALIZED AND UNREALIZED GAIN/(LOSS) | | | | | | | | | | | | | | | | | | | | |
| Net realized gain/(loss) on investments | | | 3,629,089 | | | | (63,161 | ) | | | (3,382,886 | ) | | | (7,294,795 | ) | | | (800,489 | ) |
| NET REALIZED GAIN/(LOSS) | | | 3,629,089 | | | | (63,161 | ) | | | (3,382,886 | ) | | | (7,294,795 | ) | | | (800,489 | ) |
| Net change in unrealized appreciation/(depreciation) on investments | | | 1,439,069 | | | | 1,997 | | | | 17,047,755 | | | | 6,053,248 | | | | (812,935 | ) |
| NET CHANGE IN UNREALIZED APPRECIATION/(DEPRECIATION) | | | 1,439,069 | | | | 1,997 | | | | 17,047,755 | | | | 6,053,248 | | | | (812,935 | ) |
| NET REALIZED AND UNREALIZED GAIN/(LOSS) ON INVESTMENTS | | | 5,068,158 | | | | (61,164 | ) | | | 13,664,869 | | | | (1,241,547 | ) | | | (1,613,424 | ) |
| NET INCREASE/(DECREASE) IN NET ASSETS RESULTING FROM OPERATIONS | | $ | 7,506,525 | | | $ | 514,297 | | | $ | 15,755,045 | | | $ | (57,223 | ) | | $ | 3,120,036 | |
| (a) | Net of foreign tax withholding in the amounts of $0, $0, $0, $572 and $0 respectively. |
See Notes to Financial Statements.
RiverFront Dynamic Core Income ETF
Statements of Changes in Net Assets
| | | For the | | | For the | |
| | | Year Ended | | | Year Ended | |
| | | November 30, | | | November 30, | |
| | | 2020 | | | 2019 | |
| OPERATIONS: | | | | | | | | |
| Net investment income | | $ | 2,438,367 | | | $ | 4,038,242 | |
| Net realized gain | | | 3,629,089 | | | | 1,644,094 | |
| Net change in unrealized appreciation | | | 1,439,069 | | | | 9,057,180 | |
| Net increase in net assets resulting from operations | | | 7,506,525 | | | | 14,739,516 | |
| | | | | | | | | |
| DISTRIBUTIONS TO SHAREHOLDERS: | | | | | | | | |
| From distributable earnings | | | (2,449,436 | ) | | | (4,068,776 | ) |
| Total distributions | | | (2,449,436 | ) | | | (4,068,776 | ) |
| | | | | | | | | |
| CAPITAL SHARE TRANSACTIONS: | | | | | | | | |
| Proceeds from sale of shares | | | 11,640,417 | | | | 8,489,400 | |
| Shares redeemed | | | (38,925,424 | ) | | | (34,735,633 | ) |
| Net decrease from share transactions | | | (27,285,007 | ) | | | (26,246,233 | ) |
| | | | | | | | | |
| Net decrease in net assets | | | (22,227,918 | ) | | | (15,575,493 | ) |
| | | | | | | | | |
| NET ASSETS: | | | | | | | | |
| Beginning of period | | | 134,951,424 | | | | 150,526,917 | |
| End of period | | $ | 112,723,506 | | | $ | 134,951,424 | |
| | | | | | | | | |
| OTHER INFORMATION: | | | | | | | | |
| CAPITAL SHARE TRANSACTIONS: | | | | | | | | |
| Beginning shares | | | 5,350,000 | | | | 6,400,000 | |
| Shares sold | | | 450,000 | | | | 350,000 | |
| Shares redeemed | | | (1,500,000 | ) | | | (1,400,000 | ) |
| Shares outstanding, end of period | | | 4,300,000 | | | | 5,350,000 | |
See Notes to Financial Statements.
RiverFront Dynamic Unconstrained Income ETF
Statements of Changes in Net Assets
| | | For the Year Ended November 30, 2020 | | | For the Year Ended November 30, 2019 | |
| OPERATIONS: | | | | | | | | |
| Net investment income | | $ | 575,461 | | | $ | 893,603 | |
| Net realized loss | | | (63,161 | ) | | | (73,537 | ) |
| Net change in unrealized appreciation | | | 1,997 | | | | 864,883 | |
| Net increase in net assets resulting from operations | | | 514,297 | | | | 1,684,949 | |
| | | | | | | | | |
| DISTRIBUTIONS TO SHAREHOLDERS: | | | | | | | | |
| From distributable earnings | | | (587,266 | ) | | | (919,523 | ) |
| Total distributions | | | (587,266 | ) | | | (919,523 | ) |
| | | | | | | | | |
| CAPITAL SHARE TRANSACTIONS: | | | | | | | | |
| Shares redeemed | | | (3,666,634 | ) | | | (8,712,993 | ) |
| Net decrease from share transactions | | | (3,666,634 | ) | | | (8,712,993 | ) |
| | | | | | | | | |
| Net decrease in net assets | | | (3,739,603 | ) | | | (7,947,567 | ) |
| | | | | | | | | |
| NET ASSETS: | | | | | | | | |
| Beginning of period | | | 16,533,390 | | | | 24,480,957 | |
| End of period | | $ | 12,793,787 | | | $ | 16,533,390 | |
| | | | | | | | | |
| OTHER INFORMATION: | | | | | | | | |
| CAPITAL SHARE TRANSACTIONS: | | | | | | | | |
| Beginning shares | | | 650,000 | | | | 1,000,000 | |
| Shares redeemed | | | (150,000 | ) | | | (350,000 | ) |
| Shares outstanding, end of period | | | 500,000 | | | | 650,000 | |
See Notes to Financial Statements.
RiverFront Dynamic US Dividend Advantage ETF
Statements of Changes in Net Assets
| | | For the Year Ended November 30, 2020 | | | For the Year Ended November 30, 2019 | |
| OPERATIONS: | | | | | | | | |
| Net investment income | | $ | 2,090,176 | | | $ | 2,748,112 | |
| Net realized gain/(loss) | | | (3,382,886 | ) | | | 842,336 | |
| Net change in unrealized appreciation | | | 17,047,755 | | | | 9,392,104 | |
| Net increase in net assets resulting from operations | | | 15,755,045 | | | | 12,982,552 | |
| | | | | | | | | |
| DISTRIBUTIONS TO SHAREHOLDERS: | | | | | | | | |
| From distributable earnings | | | (2,186,237 | ) | | | (2,830,437 | ) |
| Total distributions | | | (2,186,237 | ) | | | (2,830,437 | ) |
| | | | | | | | | |
| CAPITAL SHARE TRANSACTIONS: | | | | | | | | |
| Proceeds from sale of shares | | | 26,065,088 | | | | 12,883,372 | |
| Shares redeemed | | | (37,167,998 | ) | | | (43,499,849 | ) |
| Net decrease from share transactions | | | (11,102,910 | ) | | | (30,616,477 | ) |
| | | | | | | | | |
| Net increase/(decrease) in net assets | | | 2,465,898 | | | | (20,464,362 | ) |
| | | | | | | | | |
| NET ASSETS: | | | | | | | | |
| Beginning of period | | | 130,828,267 | | | | 151,292,629 | |
| End of period | | $ | 133,294,165 | | | $ | 130,828,267 | |
| | | | | | | | | |
| OTHER INFORMATION: | | | | | | | | |
| CAPITAL SHARE TRANSACTIONS: | | | | | | | | |
| Beginning shares | | | 3,850,002 | | | | 4,850,002 | |
| Shares sold | | | 850,000 | | | | 400,000 | |
| Shares redeemed | | | (1,100,000 | ) | | | (1,400,000 | ) |
| Shares outstanding, end of period | | | 3,600,002 | | | | 3,850,002 | |
See Notes to Financial Statements.
RiverFront Dynamic US Flex-Cap ETF
Statements of Changes in Net Assets
| | | For the Year Ended November 30, 2020 | | | For the Year Ended November 30, 2019 | |
| OPERATIONS: | | | | | | | | |
| Net investment income | | $ | 1,184,324 | | | $ | 1,979,232 | |
| Net realized loss | | | (7,294,795 | ) | | | (7,792,444 | ) |
| Net change in unrealized appreciation | | | 6,053,248 | | | | 14,831,746 | |
| Net Increase/(Decrease) in net assets resulting from operations | | | (57,223 | ) | | | 9,018,534 | |
| | | | | | | | | |
| DISTRIBUTIONS TO SHAREHOLDERS: | | | | | | | | |
| From distributable earnings | | | (1,188,592 | ) | | | (2,084,364 | ) |
| Total distributions | | | (1,188,592 | ) | | | (2,084,364 | ) |
| | | | | | | | | |
| CAPITAL SHARE TRANSACTIONS: | | | | | | | | |
| Proceeds from sale of shares | | | 1,823,640 | | | | 14,320,639 | |
| Shares redeemed | | | (55,840,068 | ) | | | (47,057,304 | ) |
| Net decrease from share transactions | | | (54,016,428 | ) | | | (32,736,665 | ) |
| | | | | | | | | |
| Net decrease in net assets | | | (55,262,243 | ) | | | (25,802,495 | ) |
| | | | | | | | | |
| NET ASSETS: | | | | | | | | |
| Beginning of period | | | 126,662,002 | | | | 152,464,497 | |
| End of period | | $ | 71,399,759 | | | $ | 126,662,002 | |
| | | | | | | | | |
| OTHER INFORMATION: | | | | | | | | |
| CAPITAL SHARE TRANSACTIONS: | | | | | | | | |
| Beginning shares | | | 3,650,002 | | | | 4,650,002 | |
| Shares sold | | | 50,000 | | | | 450,000 | |
| Shares redeemed | | | (1,800,000 | ) | | | (1,450,000 | ) |
| Shares outstanding, end of period | | | 1,900,002 | | | | 3,650,002 | |
See Notes to Financial Statements.
RiverFront Strategic Income Fund
Statements of Changes in Net Assets
| | | For the Year Ended November 30, 2020 | | | For the Year Ended November 30, 2019 | |
| OPERATIONS: | | | | | | | | |
| Net investment income | | $ | 4,733,460 | | | $ | 5,968,063 | |
| Net realized gain/(loss) | | | (800,489 | ) | | | 2,778 | |
| Net change in unrealized appreciation/(depreciation) | | | (812,935 | ) | | | 3,051,952 | |
| Net increase in net assets resulting from operations | | | 3,120,036 | | | | 9,022,793 | |
| | | | | | | | | |
| DISTRIBUTIONS TO SHAREHOLDERS: | | | | | | | | |
| From distributable earnings | | | (4,943,458 | ) | | | (6,324,290 | ) |
| Total distributions | | | (4,943,458 | ) | | | (6,324,290 | ) |
| | | | | | | | | |
| CAPITAL SHARE TRANSACTIONS: | | | | | | | | |
| Proceeds from sale of shares | | | 17,274,109 | | | | 26,966,259 | |
| Shares redeemed | | | (64,356,361 | ) | | | (14,655,413 | ) |
| Net increase/(decrease) from share transactions | | | (47,082,252 | ) | | | 12,310,846 | |
| | | | | | | | | |
| Net increase/(decrease) in net assets | | | (48,905,674 | ) | | | 15,009,349 | |
| | | | | | | | | |
| NET ASSETS: | | | | | | | | |
| Beginning of period | | | 167,889,339 | | | | 152,879,990 | |
| End of period | | $ | 118,983,665 | | | $ | 167,889,339 | |
| | | | | | | | | |
| OTHER INFORMATION: | | | | | | | | |
| CAPITAL SHARE TRANSACTIONS: | | | | | | | | |
| Beginning shares | | | 6,800,000 | | | | 6,300,000 | |
| Shares sold | | | 700,000 | | | | 1,100,000 | |
| Shares redeemed | | | (2,700,000 | ) | | | (600,000 | ) |
| Shares outstanding, end of period | | | 4,800,000 | | | | 6,800,000 | |
See Notes to Financial Statements.
RiverFront Dynamic Core Income ETF
| Financial Highlights | For a share outstanding throughout the periods presented |
| | | For the Year Ended November 30, 2020 | | | For the Year Ended November 30, 2019 | | | For the Year Ended November 30, 2018 | | | For the Year Ended November 30, 2017 | | | For the Period June 14, 2016 (Commencement) to November 30, 2016 | |
| NET ASSET VALUE, BEGINNING OF PERIOD | | $ | 25.22 | | | $ | 23.52 | | | $ | 24.60 | | | $ | 24.32 | | | $ | 25.00 | |
| | | | | | | | | | | | | | | | | | | | | |
| INCOME/(LOSS) FROM INVESTMENT OPERATIONS: | | | | | | | | | | | | | | | | | | | | |
| Net investment income(a) | | | 0.50 | | | | 0.68 | | | | 0.68 | | | | 0.53 | | | | 0.24 | |
| Net realized and unrealized gain/(loss) | | | 0.99 | | | | 1.70 | | | | (1.10 | ) | | | 0.23 | | | | (0.68 | ) |
| Total from investment operations | | | 1.49 | | | | 2.38 | | | | (0.42 | ) | | | 0.76 | | | | (0.44 | ) |
| | | | | | | | | | | | | | | | | | | | | |
| DISTRIBUTIONS: | | | | | | | | | | | | | | | | | | | | |
| From net investment income | | | (0.50 | ) | | | (0.68 | ) | | | (0.66 | ) | | | (0.48 | ) | | | (0.24 | ) |
| Total distributions | | | (0.50 | ) | | | (0.68 | ) | | | (0.66 | ) | | | (0.48 | ) | | | (0.24 | ) |
| | | | | | | | | | | | | | | | | | | | | |
| NET INCREASE/(DECREASE) IN NET ASSET VALUE | | | 0.99 | | | | 1.70 | | | | (1.08 | ) | | | 0.28 | | | | (0.68 | ) |
| NET ASSET VALUE, END OF PERIOD | | $ | 26.21 | | | $ | 25.22 | | | $ | 23.52 | | | $ | 24.60 | | | $ | 24.32 | |
| TOTAL RETURN(b) | | | 5.97 | % | | | 10.22 | % | | | (1.74 | )% | | | 3.15 | % | | | (1.77 | )% |
| | | | | | | | | | | | | | | | | | | | | |
| RATIOS/SUPPLEMENTAL DATA: | | | | | | | | | | | | | | | | | | | | |
| Net assets, end of period (000s) | | $ | 112,724 | | | $ | 134,951 | | | $ | 150,527 | | | $ | 47,962 | | | $ | 6,081 | |
| | | | | | | | | | | | | | | | | | | | | |
| Ratio of expenses to average net assets | | | 0.51 | % | | | 0.51 | % | | | 0.51 | % | | | 0.51 | % | | | 0.51 | %(c) |
| Ratio of net investment income to average net assets | | | 1.94 | % | | | 2.74 | % | | | 2.83 | % | | | 2.15 | % | | | 2.12 | %(c) |
| Portfolio turnover rate(d) | | | 11 | % | | | 6 | % | | | 15 | % | | | 18 | % | | | 26 | % |
| (a) | Based on average shares outstanding during the period. |
| (b) | Total return is calculated assuming an initial investment made at the net asset value at the beginning of the period and the redemption at the net asset value on the last day of the period and assuming all distributions are reinvested at the actual reinvestment prices. Total return calculated for a period of less than one year is not annualized. |
| (d) | Portfolio turnover for periods less than one year are not annualized and does not include securities received or delivered from processing creations or redemptions in-kind. |
See Notes to Financial Statements.
RiverFront Dynamic Unconstrained Income ETF
| Financial Highlights | For a share outstanding throughout the periods presented |
| | | For the Year Ended November 30, 2020 | | | For the Year Ended November 30, 2019 | | | For the Year Ended November 30, 2018 | | | For the Year Ended November 30, 2017 | | | For the Period June 14, 2016 (Commencement) to November 30, 2016 | |
| NET ASSET VALUE, BEGINNING OF PERIOD | | $ | 25.44 | | | $ | 24.48 | | | $ | 26.13 | | | $ | 25.55 | | | $ | 25.00 | |
| | | | | | | | | | | | | | | | | | | | | |
| INCOME/(LOSS) FROM INVESTMENT OPERATIONS: | | | | | | | | | | | | | | | | | | | | |
| Net investment income(a) | | | 1.06 | | | | 1.20 | | | | 1.24 | | | | 1.22 | | | | 0.63 | |
| Net realized and unrealized gain/(loss) | | | 0.18 | (b) | | | 0.99 | | | | (1.63 | ) | | | 0.56 | | | | 0.55 | |
| Total from investment operations | | | 1.24 | | | | 2.19 | | | | (0.39 | ) | | | 1.78 | | | | 1.18 | |
| | | | | | | | | | | | | | | | | | | | | |
| DISTRIBUTIONS: | | | | | | | | | | | | | | | | | | | | |
| From net investment income | | | (1.09 | ) | | | (1.23 | ) | | | (1.15 | ) | | | (1.20 | ) | | | (0.63 | ) |
| From net realized gains | | | – | | | | – | | | | (0.09 | ) | | | – | | | | – | |
| Tax return of capital | | | – | | | | – | | | | (0.02 | ) | | | – | | | | – | |
| Total distributions | | | (1.09 | ) | | | (1.23 | ) | | | (1.26 | ) | | | (1.20 | ) | | | (0.63 | ) |
| | | | | | | | | | | | | | | | | | | | | |
| NET INCREASE/(DECREASE) IN NET ASSET VALUE | | | 0.15 | | | | 0.96 | | | | (1.65 | ) | | | 0.58 | | | | 0.55 | |
| NET ASSET VALUE, END OF PERIOD | | $ | 25.59 | | | $ | 25.44 | | | $ | 24.48 | | | $ | 26.13 | | | $ | 25.55 | |
| TOTAL RETURN(c) | | | 5.07 | % | | | 9.15 | % | | | (1.52 | )% | | | 7.06 | % | | | 4.72 | % |
| | | | | | | | | | | | | | | | | | | | | |
| RATIOS/SUPPLEMENTAL DATA: | | | | | | | | | | | | | | | | | | | | |
| Net assets, end of period (000s) | | $ | 12,794 | | | $ | 16,533 | | | $ | 24,481 | | | $ | 11,759 | | | $ | 5,110 | |
| | | | | | | | | | | | | | | | | | | | | |
| Ratio of expenses to average net assets | | | 0.51 | % | | | 0.51 | % | | | 0.51 | % | | | 0.51 | % | | | 0.51 | %(d) |
| Ratio of net investment income to average net assets | | | 4.25 | % | | | 4.77 | % | | | 4.93 | % | | | 4.65 | % | | | 5.31 | %(d) |
| Portfolio turnover rate(e) | | | 38 | % | | | 23 | % | | | 51 | % | | | 30 | % | | | 11 | % |
| (a) | Based on average shares outstanding during the period. |
| (b) | Net realized and unrealized gain on investments per share does not correlate to aggregate of the net realized and unrealized gain/(loss) in the Statements of Operations for the period(s) presented, primarily due to the timing of the sales and repurchases of the Fund's shares in relation to the fluctuating market values for the Fund's portfolio. |
| (c) | Total return is calculated assuming an initial investment made at the net asset value at the beginning of the period and the redemption at the net asset value on the last day of the period and assuming all distributions are reinvested at the actual reinvestment prices. Total return calculated for a period of less than one year is not annualized. |
| (e) | Portfolio turnover for periods less than one year are not annualized and does not include securities received or delivered from processing creations or redemptions in-kind. |
See Notes to Financial Statements.
RiverFront Dynamic US Dividend Advantage ETF
| Financial Highlights | For a share outstanding throughout the periods presented |
| | | For the Year Ended November 30, 2020 | | | For the Year Ended November 30, 2019 | | | For the Year Ended November 30, 2018 | | | For the Year Ended November 30, 2017 | | | For the Period June 7, 2016 (Commencement) to November 30, 2016 | |
| NET ASSET VALUE, BEGINNING OF PERIOD | | $ | 33.98 | | | $ | 31.19 | | | $ | 31.39 | | | $ | 26.59 | | | $ | 25.14 | |
| | | | | | | | | | | | | | | | | | | | | |
| INCOME/(LOSS) FROM INVESTMENT OPERATIONS: | | | | | | | | | | | | | | | | | | | | |
| Net investment income(a) | | | 0.56 | | | | 0.65 | | | | 0.73 | | | | 0.63 | | | | 0.26 | |
| Net realized and unrealized gain/(loss) | | | 3.08 | | | | 2.81 | | | | (0.26 | ) | | | 4.76 | | | | 1.40 | |
| Total from investment operations | | | 3.64 | | | | 3.46 | | | | 0.47 | | | | 5.39 | | | | 1.66 | |
| | | | | | | | | | | | | | | | | | | | | |
| DISTRIBUTIONS: | | | | | | | | | | | | | | | | | | | | |
| From net investment income | | | (0.59 | ) | | | (0.67 | ) | | | (0.67 | ) | | | (0.59 | ) | | | (0.21 | ) |
| Total distributions | | | (0.59 | ) | | | (0.67 | ) | | | (0.67 | ) | | | (0.59 | ) | | | (0.21 | ) |
| | | | | | | | | | | | | | | | | | | | | |
| NET INCREASE/(DECREASE) IN NET ASSET VALUE | | | 3.05 | | | | 2.79 | | | | (0.20 | ) | | | 4.80 | | | | 1.45 | |
| NET ASSET VALUE, END OF PERIOD | | $ | 37.03 | | | $ | 33.98 | | | $ | 31.19 | | | $ | 31.39 | | | $ | 26.59 | |
| TOTAL RETURN(b) | | | 10.92 | % | | | 11.29 | % | | | 1.45 | % | | | 20.49 | % | | | 6.64 | % |
| | | | | | | | | | | | | | | | | | | | | |
| RATIOS/SUPPLEMENTAL DATA: | | | | | | | | | | | | | | | | | | | | |
| Net assets, end of period (000s) | | $ | 133,294 | | | $ | 130,828 | | | $ | 151,293 | | | $ | 59,644 | | | $ | 13,297 | |
| | | | | | | | | | | | | | | | | | | | | |
| Ratio of expenses to average net assets | | | 0.52 | % | | | 0.52 | % | | | 0.52 | % | | | 0.52 | % | | | 0.52 | %(c) |
| Ratio of net investment income to average net assets | | | 1.68 | % | | | 2.05 | % | | | 2.27 | % | | | 2.19 | % | | | 2.13 | %(c) |
| Portfolio turnover rate(d) | | | 75 | % | | | 64 | % | | | 96 | % | | | 54 | % | | | 45 | % |
| (a) | Based on average shares outstanding during the period. |
| (b) | Total return is calculated assuming an initial investment made at the net asset value at the beginning of the period and the redemption at the net asset value on the last day of the period and assuming all distributions are reinvested at the actual reinvestment prices. Total return calculated for a period of less than one year is not annualized. |
| (d) | Portfolio turnover for periods less than one year are not annualized and does not include securities received or delivered from processing creations or redemptions in-kind. |
See Notes to Financial Statements.
RiverFront Dynamic US Flex-Cap ETF
| Financial Highlights | For a share outstanding throughout the periods presented |
| | | For the Year Ended November 30, 2020 | | | For the Year Ended November 30, 2019 | | | For the Year Ended November 30, 2018 | | | For the Year Ended November 30, 2017 | | | For the Period June 7, 2016 (Commencement) to November 30, 2016 | |
| NET ASSET VALUE, BEGINNING OF PERIOD | | $ | 34.70 | | | $ | 32.79 | | | $ | 32.46 | | | $ | 26.84 | | | $ | 25.13 | |
| | | | | | | | | | | | | | | | | | | | | |
| INCOME/(LOSS) FROM INVESTMENT OPERATIONS: | | | | | | | | | | | | | | | | | | | | |
| Net investment income(a) | | | 0.45 | | | | 0.48 | | | | 0.44 | | | | 0.31 | | | | 0.17 | |
| Net realized and unrealized gain | | | 2.87 | (b) | | | 1.93 | | | | 0.27 | (b) | | | 5.59 | | | | 1.70 | |
| Total from investment operations | | | 3.32 | | | | 2.41 | | | | 0.71 | | | | 5.90 | | | | 1.87 | |
| | | | | | | | | | | | | | | | | | | | | |
| DISTRIBUTIONS: | | | | | | | | | | | | | | | | | | | | |
| From net investment income | | | (0.44 | ) | | | (0.50 | ) | | | (0.38 | ) | | | (0.28 | ) | | | (0.16 | ) |
| Total distributions | | | (0.44 | ) | | | (0.50 | ) | | | (0.38 | ) | | | (0.28 | ) | | | (0.16 | ) |
| | | | | | | | | | | | | | | | | | | | | |
| NET INCREASE IN NET ASSET VALUE | | | 2.88 | | | | 1.91 | | | | 0.33 | | | | 5.62 | | | | 1.71 | |
| NET ASSET VALUE, END OF PERIOD | | $ | 37.58 | | | $ | 34.70 | | | $ | 32.79 | | | $ | 32.46 | | | $ | 26.84 | |
| TOTAL RETURN(c) | | | 9.75 | % | | | 7.49 | % | | | 2.16 | % | | | 22.08 | % | | | 7.45 | % |
| | | | | | | | | | | | | | | | | | | | | |
| RATIOS/SUPPLEMENTAL DATA: | | | | | | | | | | | | | | | | | | | | |
| Net assets, end of period (000s) | | $ | 71,400 | | | $ | 126,662 | | | $ | 152,464 | | | $ | 40,576 | | | $ | 8,053 | |
| | | | | | | | | | | | | | | | | | | | | |
| Ratio of expenses to average net assets | | | 0.52 | % | | | 0.52 | % | | | 0.52 | % | | | 0.52 | % | | | 0.52 | %(d) |
| Ratio of net investment income to average net assets | | | 1.34 | % | | | 1.46 | % | | | 1.30 | % | | | 1.05 | % | | | 1.34 | %(d) |
| Portfolio turnover rate(e) | | | 99 | % | | | 98 | % | | | 152 | % | | | 86 | % | | | 41 | % |
| (a) | Based on average shares outstanding during the period. |
| (b) | Net realized and unrealized gain on investments per share does not correlate to aggregate of the net realized and unrealized gain/(loss) in the Statements of Operations for the period(s) presented, primarily due to the timing of the sales and repurchases of the Fund's shares in relation to the fluctuating market values for the Fund's portfolio. |
| (c) | Total return is calculated assuming an initial investment made at the net asset value at the beginning of the period and the redemption at the net asset value on the last day of the period and assuming all distributions are reinvested at the actual reinvestment prices. Total return calculated for a period of less than one year is not annualized. |
| (e) | Portfolio turnover for periods less than one year are not annualized and does not include securities received or delivered from processing creations or redemptions in-kind. |
See Notes to Financial Statements.
RiverFront Strategic Income Fund
| Financial Highlights | For a share outstanding throughout the periods presented |
| | | For the Year Ended November 30, 2020 | | | For the Year Ended November 30, 2019 | | | For the Year Ended November 30, 2018 | | | For the Year Ended November 30, 2017 | | | For the Year Ended November 30, 2016 | |
| NET ASSET VALUE, BEGINNING OF PERIOD | | $ | 24.69 | | | $ | 24.27 | | | $ | 25.21 | | | $ | 25.02 | | | $ | 24.36 | |
| | | | | | | | | | | | | | | | | | | | | |
| INCOME/(LOSS) FROM INVESTMENT OPERATIONS: | | | | | | | | | | | | | | | | | | | | |
| Net investment income(a) | | | 0.81 | | | | 0.94 | | | | 1.06 | | | | 1.11 | | | | 1.05 | |
| Net realized and unrealized gain/(loss) | | | 0.13 | (b) | | | 0.48 | | | | (0.92 | ) | | | 0.19 | | | | 0.71 | |
| Total from investment operations | | | 0.94 | | | | 1.42 | | | | 0.14 | | | | 1.30 | | | | 1.76 | |
| | | | | | | | | | | | | | | | | | | | | |
| DISTRIBUTIONS: | | | | | | | | | | | | | | | | | | | | |
| From net investment income | | | (0.84 | ) | | | (1.00 | ) | | | (1.08 | ) | | | (1.11 | ) | | | (1.10 | ) |
| Total distributions | | | (0.84 | ) | | | (1.00 | ) | | | (1.08 | ) | | | (1.11 | ) | | | (1.10 | ) |
| | | | | | | | | | | | | | | | | | | | | |
| NET INCREASE/(DECREASE) IN NET ASSET VALUE | | | 0.10 | | | | 0.42 | | | | (0.94 | ) | | | 0.19 | | | | 0.66 | |
| NET ASSET VALUE, END OF PERIOD | | $ | 24.79 | | | $ | 24.69 | | | $ | 24.27 | | | $ | 25.21 | | | $ | 25.02 | |
| TOTAL RETURN(c) | | | 3.95 | % | | | 5.96 | % | | | 0.57 | % | | | 5.29 | % | | | 7.38 | % |
| | | | | | | | | | | | | | | | | | | | | |
| RATIOS/SUPPLEMENTAL DATA: | | | | | | | | | | | | | | | | | | | | |
| Net assets, end of period (000s) | | $ | 118,984 | | | $ | 167,889 | | | $ | 152,880 | | | $ | 337,769 | | | $ | 326,515 | |
| | | | | | | | | | | | | | | | | | | | | |
| Ratio of expenses excluding waiver/reimbursement to average net assets | | | 0.46 | % | | | 0.46 | % | | | 0.46 | % | | | 0.46 | % | | | 0.46 | % |
| Ratio of expenses including waiver/reimbursement to average net assets | | | 0.46 | % | | | 0.46 | % | | | 0.17 | %(d) | | | 0.16 | %(e) | | | 0.17 | %(e) |
| Ratio of net investment income including expenses waiver/reimbursement to average net assets | | | 3.32 | % | | | 3.83 | % | | | 4.31 | % | | | 4.41 | % | | | 4.26 | % |
| Portfolio turnover rate(f) | | | 54 | % | | | 44 | % | | | 35 | % | | | 32 | % | | | 52 | % |
| (a) | Based on average shares outstanding during the period. |
| (b) | Net realized and unrealized gain on investments per share does not correlate to aggregate of the net realized and unrealized gain/(loss) in the Statements of Operations for the period(s) presented, primarily due to the timing of the sales and repurchases of the Fund's shares in relation to the fluctuating market values for the Fund's portfolio. |
| (c) | Total return is calculated assuming an initial investment made at the net asset value at the beginning of the period and the redemption at the net asset value on the last day of the period and assuming all distributions are reinvested at the actual reinvestment prices. Total return calculated for a period of less than one year is not annualized. |
| (d) | Effective November 1, 2018, the Fund’s management fee consists of a fee of 0.11% paid to the Fund’s investment adviser and a fee of 0.35% paid to the Fund’s sub-adviser. The Fund’s sub-adviser ceased its voluntary waiver effective November 1, 2018. |
| (e) | Effective July 1, 2016, the Fund’s management fee consists of a fee of 0.16% paid to the Fund’s investment adviser and a fee of 0.30% paid to the Fund’s sub-adviser. The Fund’s sub-adviser voluntarily waived all of its 0.30% annual sub-advisory fee payable by the Fund until November 1, 2018. |
| | (f) | Portfolio turnover for periods less than one year are not annualized and does not include securities received or delivered from processing creations or redemptions in-kind. |
See Notes to Financial Statements.
RiverFront ETFs
| Notes to Financial Statements | November 30, 2020 |
1. ORGANIZATION
ALPS ETF Trust (the “Trust”), a Delaware statutory trust, is an open-end management investment company registered under the Investment Company Act of 1940, as amended (the “1940 Act”). As of November 30, 2020, the Trust consists of sixteen separate portfolios. Each portfolio represents a separate series of the Trust. This report pertains solely to the RiverFront Dynamic Core Income ETF, the RiverFront Dynamic Unconstrained Income ETF, the RiverFront Dynamic US Dividend Advantage ETF, the RiverFront Dynamic US Flex-Cap ETF, and the RiverFront Strategic Income Fund (each a “Fund” and collectively, the “Funds”).
The investment objective of the RiverFront Dynamic Core Income ETF Fund is to seek total return, with an emphasis on income as the source of that total return. The Fund has elected to qualify as a diversified series of the Trust under the 1940 Act.
The investment objective of the RiverFront Dynamic Unconstrained Income ETF Fund is to seek total return, with an emphasis on income as the source of that total return. The Fund is considered non-diversified and may invest a greater portion of assets in securities of individual issuers than a diversified fund. As a result, changes in the market value of a single investment could cause greater fluctuations in share price than would occur in a diversified fund.
The investment objective of the RiverFront Dynamic US Dividend Advantage ETF Fund is to seek to provide capital appreciation and dividend income. The Fund has elected to qualify as a diversified series of the Trust under the 1940 Act.
The investment objective of the RiverFront Dynamic US Flex-Cap ETF Fund is to seek to provide capital appreciation. The Fund has elected to qualify as a diversified series of the Trust under the 1940 Act.
The investment objective of the RiverFront Strategic Income Fund is to seek total return, with an emphasis on income as the source of that total return. The Fund has elected to qualify as a diversified series of the Trust under the 1940 Act.
Each Fund’s Shares (“Shares”) are listed on the NYSE Arca, Inc. Each Fund issues and redeems Shares at net asset value (“NAV”) in blocks of 50,000 Shares, each of which is called a “Creation Unit”. Creation Units are issued and redeemed principally in-kind for securities and/or cash. Except when aggregated in Creation Units, Shares are not redeemable securities of a Fund.
Pursuant to the Trust’s organizational documents, its Officers and Trustees are indemnified against certain liability arising out of the performance of their duties to the Trust. Additionally, in the normal course of business, the Trust enters into contracts with service providers that contain general indemnification clauses. The Trust’s maximum exposure under these arrangements is unknown, as this would involve future claims that may be made against the Trust that have not yet occurred.
2. SIGNIFICANT ACCOUNTING POLICIES
The following is a summary of significant accounting policies consistently followed by the Funds in the preparation of the financial statements. The accompanying financial statements were prepared in accordance with accounting principles generally accepted in the United States of America (“U.S. GAAP”). The preparation of financial statements in conformity with U.S. GAAP requires management to make certain estimates and assumptions that affect the reported amounts of assets and liabilities and disclosures of contingent assets and liabilities at the date of the financial statements and the reported amounts of revenue and expenses during the period. Actual results could differ from those estimates. Each Fund is considered an investment company under U.S. GAAP and follows the accounting and reporting guidance applicable to investment companies in the Financial Accounting Standards Board (“FASB”) Accounting Standards Codification Topic 946.
A. Portfolio Valuation
Each Fund’s NAV is determined daily, as of the close of regular trading on the New York Stock Exchange (the “NYSE”), normally 4:00 p.m. Eastern time, on each day the NYSE is open for trading. The NAV is computed by dividing the value of all assets of each Fund (including accrued interest and dividends), less all liabilities (including accrued expenses and dividends declared but unpaid), by the total number of shares outstanding.
Portfolio securities listed on any exchange other than the NASDAQ Stock Market LLC (“NASDAQ”) are valued at the last sale price on the business day as of which such value is being determined. If there has been no sale on such day, the securities are valued at the mean of the most recent bid and ask prices on such day. Securities traded on the NASDAQ are valued at the NASDAQ Official Closing Price as determined by NASDAQ. Portfolio securities traded on more than one securities exchange are valued at the last sale price on the business day as of which such value is being determined at the close of the exchange representing the principal market for such securities. Portfolio securities traded in the over-the-counter market, but excluding securities traded on the NASDAQ, are valued at the last quoted sale price in such market.
RiverFront ETFs
| Notes to Financial Statements | November 30, 2020 |
Corporate bonds and United States government bonds are typically valued at the mean between the evaluated bid and ask prices formulated by an independent pricing service.
Each Fund’s investments are valued at market value or, in the absence of market value with respect to any portfolio securities, at fair value according to procedures adopted by the Trust’s Board of Trustees (the “Board”). When market quotations are not readily available or when events occur that make established valuation methods unreliable, securities of the Funds may be valued in good faith by or under the direction of the Board. These securities generally include, but are not limited to, restricted securities (securities which may not be publicly sold without registration under the Securities Act of 1933) for which a pricing service is unable to provide a market price; securities whose trading has been formally suspended; a security whose market price is not available from a pre-established primary pricing source or the pricing source is not willing to provide a price; a security with respect to which an event has occurred that is most likely to materially affect the value of the security after the market has closed but before the calculation of a Fund’s NAV or make it difficult or impossible to obtain a reliable market quotation; or a security whose price, as provided by the pricing service, does not reflect the security’s “fair value” due to the security being de-listed from a national exchange or the security’s primary trading market is temporarily closed at a time when, under normal conditions, it would be open. As a general principle, the current “fair value” of a security would be the amount which the owner might reasonably expect to receive from the sale on the applicable exchange or principal market. A variety of factors may be considered in determining the fair value of such securities.
B. Fair Value Measurements
Each Fund discloses the classification of its fair value measurements following a three-tier hierarchy based on the inputs used to measure fair value. Inputs refer broadly to the assumptions that market participants would use in pricing the asset or liability, including assumptions about risk. Inputs may be observable or unobservable. Observable inputs reflect the assumptions market participants would use in pricing the asset or liability that are developed based on market data obtained from sources independent of the reporting entity. Unobservable inputs reflect the reporting entity’s own assumptions about the assumptions market participants would use in pricing the asset or liability that are developed based on the best information available.
Valuation techniques used to value the Funds’ investments by major category are as follows:
Equity securities, including restricted securities, for which market quotations are readily available, are valued at the last reported sale price or official closing price as reported by a third party pricing vendor on the primary market or exchange on which they are traded and are categorized as Level 1 in the hierarchy. In the event there were no sales during the day or closing prices are not available, securities are valued at the mean of the most recent quoted bid and ask prices on such day and are generally categorized as Level 2 in the hierarchy. Investments in open-end mutual funds are valued at their closing NAV each business day and are categorized as Level 1 in the hierarchy.
Debt securities, including restricted securities, are valued based on evaluated prices received from third party pricing vendors or from brokers who make markets in such securities. For corporate bonds, pricing vendors utilize matrix pricing which considers yield or price of bonds of comparable quality, coupon, maturity and type as well as broker-supplied prices. When independent prices are unavailable or unreliable, debt securities may be valued utilizing pricing methodologies which consider similar factors that would be used by third party pricing vendors. Debt securities are generally categorized as Level 2 in the hierarchy but may be Level 3 depending on the circumstances. The RiverFront Dynamic Core Income ETF, the RiverFront Dynamic Unconstrained Income ETF, and the RiverFront Strategic Income Fund may invest a significant portion of their assets in below investment grade securities. The value of these securities can be more volatile due to changes in the credit quality of the issuer and is sensitive to changes in economic, market and regulatory conditions.
Changes in valuation techniques may result in transfers in or out of an assigned level within the disclosure hierarchy.
Various inputs are used in determining the value of each Fund’s investments as of the end of the reporting period. When inputs used fall into different levels of the fair value hierarchy, the level in the hierarchy within which the fair value measurement falls is determined based on the lowest level input that is significant to the fair value measurement in its entirety. The designated input levels are not necessarily an indication of the risk or liquidity associated with these investments.
RiverFront ETFs
| Notes to Financial Statements | November 30, 2020 |
These inputs are categorized in the following hierarchy under applicable financial accounting standards:
Level 1 – Unadjusted quoted prices in active markets for identical investments, unrestricted assets or liabilities that a Fund has the ability to access at the measurement date;
Level 2 – Quoted prices which are not active, quoted prices for similar assets or liabilities in active markets or inputs other than quoted prices that are observable (either directly or indirectly) for substantially the full term of the asset or liability; and
Level 3 – Significant unobservable prices or inputs (including the Fund’s own assumptions in determining the fair value of investments) where there is little or no market activity for the asset or liability at the measurement date.
The following is a summary of the inputs used to value the Funds’ investments as of November 30, 2020:
| RiverFront Dynamic Core Income ETF | | | | | | | | | | | | |
| Investments in Securities at Value | | Level 1 - Quoted and Unadjusted Prices | | | Level 2 - Other Significant Observable Inputs | | | Level 3 - Significant Unobservable Inputs | | | Total | |
| Corporate Bonds* | | $ | – | | | $ | 71,167,534 | | | $ | – | | | $ | 71,167,534 | |
| Government Bonds* | | | – | | | | 28,437,568 | | | | – | | | | 28,437,568 | |
| Short Term Investments | | | 12,570,919 | | | | – | | | | – | | | | 12,570,919 | |
| Total | | $ | 12,570,919 | | | $ | 99,605,102 | | | $ | – | | | $ | 112,176,021 | |
RiverFront Dynamic Unconstrained Income ETF
| Investments in Securities at Value | | Level 1 - Quoted and Unadjusted Prices | | | Level 2 - Other Significant Observable Inputs | | | Level 3 - Significant Unobservable Inputs | | | Total | |
| Corporate Bonds* | | $ | – | | | $ | 10,143,959 | | | $ | – | | | $ | 10,143,959 | |
| Exchange Traded Funds | | | 1,231,872 | | | | – | | | | – | | | | 1,231,872 | |
| Short Term Investments | | | 1,271,994 | | | | – | | | | – | | | | 1,271,994 | |
| Total | | $ | 2,503,866 | | | $ | 10,143,959 | | | $ | – | | | $ | 12,647,825 | |
RiverFront Dynamic US Dividend Advantage ETF
| Investments in Securities at Value | | Level 1 - Quoted and Unadjusted Prices | | | Level 2 - Other Significant Observable Inputs | | | Level 3 - Significant Unobservable Inputs | | | Total | |
| Common Stocks* | | $ | 133,034,441 | | | $ | – | | | $ | – | | | $ | 133,034,441 | |
| Short Term Investments | | | 1,245,977 | | | | – | | | | – | | | | 1,245,977 | |
| Total | | $ | 134,280,418 | | | $ | – | | | $ | – | | | $ | 134,280,418 | |
RiverFront Dynamic US Flex-Cap ETF
| Investments in Securities at Value | | Level 1 - Quoted and Unadjusted Prices | | | Level 2 - Other Significant Observable Inputs | | | Level 3 - Significant Unobservable Inputs | | | Total | |
| Common Stocks* | | $ | 71,331,966 | | | $ | – | | | $ | – | | | $ | 71,331,966 | |
| Short Term Investments | | | 546,893 | | | | – | | | | – | | | | 546,893 | |
| Total | | $ | 71,878,859 | | | $ | – | | | $ | – | | | $ | 71,878,859 | |
RiverFront Strategic Income Fund
| Investments in Securities at Value | | Level 1 - Quoted and Unadjusted Prices | | | Level 2 - Other Significant Observable Inputs | | | Level 3 - Significant Unobservable Inputs | | | Total | |
| Corporate Bonds* | | $ | – | | | $ | 100,997,707 | | | $ | – | | | $ | 100,997,707 | |
| Short Term Investments | | | 16,092,366 | | | | – | | | | – | | | | 16,092,366 | |
| Total | | $ | 16,092,366 | | | $ | 100,997,707 | | | $ | – | | | $ | 117,090,073 | |
| * | For a detailed sector breakdown, see the accompanying Schedule of Investments. |
RiverFront ETFs
| Notes to Financial Statements | November 30, 2020 |
The Funds did not have any securities that used significant unobservable inputs (Level 3) in determining fair value and there were no transfers into or out of Level 3 during the year ended November 30, 2020.
C. Securities Transactions and Investment Income
Securities transactions are recorded as of the trade date. Realized gains and losses from securities transactions are recorded on the highest cost basis. Dividend income and capital gains distributions, if any, are recorded on the ex-dividend date. Interest income, if any, is recorded on the accrual basis, including amortization of premiums and accretion of discounts.
D. Dividends and Distributions to Shareholders
Dividends from net investment income for each Fund, if any, are declared and paid monthly or as the Board may determine from time to time. Distributions of net realized capital gains earned by the Funds, if any, are distributed at least annually.
E. Federal Tax and Tax Basis Information
The timing and character of income and capital gain distributions are determined in accordance with income tax regulations, which may differ from U.S. GAAP. Reclassifications are made to the Funds’ capital accounts for permanent tax differences to reflect income and gains available for distribution (or available capital loss carryforwards) under income tax regulations.
For the year ended November 30, 2020, the following reclassifications, which had no impact on results of operations or net assets, were recorded to reflect permanent tax differences resulting primarily from in-kind transactions:
| Fund | | Paid-in Capital | | | Total Distributable Earnings | |
| RiverFront Dynamic Core Income ETF | | $ | 3,376,724 | | | $ | (3,376,724 | ) |
| RiverFront Dynamic Unconstrained Income ETF | | | (66,688 | ) | | | 66,688 | |
| RiverFront Dynamic US Dividend Advantage ETF | | | 6,483,866 | | | | (6,483,866 | ) |
| RiverFront Dynamic US Flex-Cap ETF | | | 4,486,396 | | | | (4,486,396 | ) |
| RiverFront Strategic Income Fund | | | (527,662 | ) | | | 527,662 | |
The tax character of the distributions paid during the fiscal years ended November 30, 2020 and November 30, 2019 was as follows:
| | | Ordinary Income | | | Long-Term Capital Gain | | | Return of Capital | |
| November 30, 2020 | | | | | | | | | | | | |
| RiverFront Dynamic Core Income ETF | | $ | 2,449,436 | | | $ | – | | | $ | – | |
| RiverFront Dynamic Unconstrained Income ETF | | | 587,266 | | | | – | | | | – | |
| RiverFront Dynamic US Dividend Advantage ETF | | | 2,186,237 | | | | – | | | | – | |
| RiverFront Dynamic US Flex-Cap ETF | | | 1,188,592 | | | | – | | | | – | |
| RiverFront Strategic Income Fund | | | 4,943,458 | | | | – | | | | – | |
| | | Ordinary Income | | | Long-Term Capital Gain | | | Return of Capital | |
| November 30, 2019 | | | | | | | | | | | | |
| RiverFront Dynamic Core Income ETF | | $ | 4,068,776 | | | $ | – | | | $ | – | |
| RiverFront Dynamic Unconstrained Income ETF | | | 919,523 | | | | – | | | | – | |
| RiverFront Dynamic US Dividend Advantage ETF | | | 2,830,437 | | | | – | | | | – | |
| RiverFront Dynamic US Flex-Cap ETF | | | 2,084,364 | | | | – | | | | – | |
| RiverFront Strategic Income Fund | | | 6,324,290 | | | | – | | | | – | |
RiverFront ETFs
| Notes to Financial Statements | November 30, 2020 |
The character of distributions made during the year may differ from its ultimate characterization for federal income tax purposes.
The RiverFront Dynamic Core Income ETF used capital loss carryovers during the year ended November 30, 2020 in the amount of $244,801.
Under current law, capital losses maintain their character as short-term or long-term and are carried forward to the next tax year without expiration. As of November 30, 2020, the following amounts are available as carry forwards to the next tax year:
| Fund | | Short-Term | | | Long-Term | |
| RiverFront Dynamic Core Income ETF | | $ | 163,328 | | | $ | – | |
| RiverFront Dynamic Unconstrained Income ETF | | | 424,652 | | | | 34,652 | |
| RiverFront Dynamic US Dividend Advantage ETF | | | 5,627,278 | | | | 11,676,257 | |
| RiverFront Dynamic US Flex-Cap ETF | | | 12,657,629 | | | | 12,396,510 | |
| RiverFront Strategic Income Fund | | | 6,913,761 | | | | 2,874,062 | |
As of November 30, 2020, the components of distributable earnings on a tax basis for each Fund were as follows:
| | | RiverFront Dynamic Core Income ETF | | | RiverFront Dynamic Unconstrained Income ETF | | | RiverFront Dynamic US Dividend Advantage ETF | | | RiverFront Dynamic US Flex- Cap ETF | | | RiverFront Strategic Income Fund | |
| Accumulated net investment income | | $ | 5,847 | | | $ | 1,394 | | | $ | 14,447 | | | $ | 39,455 | | | $ | 85,143 | |
| Accumulated net realized loss on investments | | | (163,328 | ) | | | (459,304 | ) | | | (17,303,535 | ) | | | (25,054,139 | ) | | | (9,787,823 | ) |
| Net unrealized appreciation on investments | | | 8,165,938 | | | | 435,839 | | | | 22,856,089 | | | | 12,725,912 | | | | 1,323,067 | |
| Total | | $ | 8,008,457 | | | $ | (22,071 | ) | | $ | 5,567,001 | | | $ | (12,288,772 | ) | | $ | (8,379,613 | ) |
As of November 30, 2020, the cost of investments for federal income tax purposes and accumulated net unrealized appreciation/(depreciation) on investments were as follows:
| | | RiverFront Dynamic Core Income ETF | | | RiverFront Dynamic Unconstrained Income ETF | | | RiverFront Dynamic US Dividend Advantage ETF | | | RiverFront Dynamic US Flex- Cap ETF | | | RiverFront Strategic Income Fund | |
| Gross appreciation (excess of value over tax cost) | | $ | 8,226,183 | | | $ | 486,335 | | | $ | 26,423,619 | | | $ | 14,153,493 | | | $ | 1,444,046 | |
| Gross depreciation (excess of tax cost over value) | | | (60,245 | ) | | | (50,496 | ) | | | (3,567,530 | ) | | | (1,427,581 | ) | | | (120,979 | ) |
| Net unrealized appreciation/(depreciation) | | | 8,165,938 | | | | 435,839 | | | | 22,856,089 | | | | 12,725,912 | | | | 1,323,067 | |
| Cost of investments for income tax purposes | | $ | 104,010,083 | | | $ | 12,211,986 | | | $ | 111,424,329 | | | $ | 59,152,947 | | | $ | 115,767,006 | |
The differences between book-basis and tax-basis are primarily due to the deferral of losses from wash sales and difference between premium amortization due to Accounting Standards Update 2017-08.
F. Income Taxes
No provision for income taxes is included in the accompanying financial statements, as each Fund intends to distribute to shareholders all taxable investment income and realized gains and otherwise comply with Subchapter M of the Internal Revenue Code of 1986, as amended, applicable to regulated investment companies. Each Fund evaluates tax positions taken (or expected to be taken) in the course of preparing the Funds’ tax returns to determine whether these positions meet a “more-likely-than-not” standard that, based on the technical merits, have a more than fifty percent likelihood of being sustained by a taxing authority upon examination. A tax position that meets the “more-likely-than-not” recognition threshold is measured to determine the amount of benefit to recognize in the financial statements.
As of and during the year ended November 30, 2020, the Funds did not have a liability for any unrecognized tax benefits. Each Fund files U.S. federal, state, and local tax returns as required. Each Fund’s tax returns are subject to examination by the relevant tax authorities until expiration of the applicable statute of limitations, which is generally three years after the filing of the tax return, but may extend to four years in certain jurisdictions. Tax returns for open years have incorporated no uncertain tax positions that require a provision for income taxes.
RiverFront ETFs
| Notes to Financial Statements | November 30, 2020 |
G. Lending of Portfolio Securities
The RiverFront Dynamic US Dividend Advantage ETF and the RiverFront Dynamic US Flex-Cap ETF have entered into a securities lending agreement with State Street Bank & Trust Co. (“SSB”), the Funds’ lending agent. Each Fund may lend its portfolio securities only to borrowers that are approved by SSB. Each Fund will limit such lending to not more than 33 1/3% of the value of its total assets. Each Fund’s securities held at SSB as custodian shall be available to be lent except those securities the Fund or ALPS Advisors, Inc. specifically identifies in writing as not being available for lending. The borrower pledges and maintains with the Fund collateral consisting of cash (U.S. Dollars only), securities issued or guaranteed by the U.S. government or its agencies or instrumentalities, and cash equivalents (including irrevocable bank letters of credit) issued by a person other than the borrower or an affiliate of the borrower. The initial collateral received by each Fund is required to have a value of no less than 102% of the market value of the loaned securities for U.S equity securities and a value of no less than 105% of the market value for non-U.S. equity securities. The collateral is maintained thereafter, at a market value equal to not less than 102% of the current value of the U.S. equity securities on loan and not less than 105% of the current value of the non-U.S. equity securities on loan. The market value of the loaned securities is determined at the close of each business day and any additional required collateral is delivered to each Fund on the next business day. During the term of the loan, each Fund is entitled to all distributions made on or in respect of the loaned securities. Loans of securities are terminable at any time and the borrower, after notice, is required to return borrowed securities within the customary time period for settlement of securities transactions.
Any cash collateral received is reinvested in a money market fund managed by SSB as disclosed in the Fund’s Schedule of Investments and is reflected in the Statements of Assets and Liabilities as a payable for collateral upon return of securities loaned. Non-cash collateral, in the form of securities issued or guaranteed by the U.S. government or its agencies or instrumentalities, is not disclosed in the Fund’s Statements of Assets and Liabilities as it is held by the lending agent on behalf of the Fund, and the Fund does not have the ability to re-hypothecate these securities. Income earned by the Fund from securities lending activity is disclosed in the Statement of Operations.
The following is a summary of the Fund's securities lending agreement and related cash and non-cash collateral received as of November 30, 2020:
| | | Market Value of Securities on Loan | | | Cash Collateral Received | | | Non-Cash Collateral Received | | | Total Collateral Received | |
| RiverFront Dynamic US Dividend Advantage ETF | | $ | 1,783,322 | | | $ | 1,144,314 | | | $ | 661,784 | | | $ | 1,806,098 | |
| RiverFront Dynamic US Flex-Cap ETF | | | 1,061,055 | | | | 546,893 | | | | 550,627 | | | | 1,097,520 | |
The risks of securities lending include the risk that the borrower may not provide additional collateral when required or may not return the securities when due. To mitigate these risks, the Funds benefit from a borrower default indemnity provided by SSB. SSB’s indemnity allows for full replacement of securities lent wherein SSB will purchase the unreturned loaned securities on the open market by applying the proceeds of the collateral, or to the extent such proceeds are insufficient or the collateral is unavailable, SSB will purchase the unreturned loan securities at SSB’s expense. However, the Funds could suffer a loss if the value of the investments purchased with cash collateral falls below the value of the cash collateral received.
The following table reflects a breakdown of transactions accounted for as secured borrowings, the gross obligation by the type of collateral pledged or securities loaned, and the remaining contractual maturity of those transactions as of November 30, 2020:
| RiverFront Dynamic US Dividend Advantage ETF | | | | | Remaining contractual maturity of the agreements | | | | |
| Securities Lending Transactions | | Overnight & Continuous | | | Up to 30 days | | | 30-90 days | | | Greater than 90 days | | | Total | |
| Common Stocks | | $ | 1,144,314 | | | $ | – | | | $ | – | | | $ | – | | | $ | 1,144,314 | |
| Total Borrowings | | | | | | | | | | | | | | | | | | | 1,144,314 | |
| Gross amount of recognized liabilities for securities lending (collateral received) | | | | | | | | | | | | | | | | | | $ | 1,144,314 | |
| RiverFront Dynamic US Flex-Cap ETF | | | | | Remaining contractual maturity of the agreements | | | | |
| Securities Lending Transactions | | Overnight & Continuous | | | Up to 30 days | | | 30-90 days | | | Greater than 90 days | | | Total | |
| Common Stocks | | $ | 546,893 | | | $ | – | | | $ | – | | | $ | – | | | $ | 546,893 | |
| Total Borrowings | | | | | | | | | | | | | | | | | | | 546,893 | |
| Gross amount of recognized liabilities for securities lending (collateral received) | | | | | | | | | | | | | | | | | | $ | 546,893 | |
RiverFront ETFs
| Notes to Financial Statements | November 30, 2020 |
3. INVESTMENT ADVISORY FEE AND OTHER AFFILIATED TRANSACTIONS
ALPS Advisors, Inc. (the “Adviser”) serves as the Funds’ investment adviser pursuant to an Investment Advisory Agreement with the Trust on behalf of each Fund (the “Advisory Agreement”). Pursuant to the Advisory Agreement, each Fund pays the Adviser an annual management fee for the services and facilities it provides, payable on a monthly basis as a percentage of the relevant Fund’s average daily net assets as set out below:
| Fund | Advisory Fee |
| RiverFront Dynamic Core Income ETF | 0.51%(a) |
| RiverFront Dynamic Unconstrained Income ETF | 0.51%(a) |
| RiverFront Dynamic US Dividend Advantage ETF | 0.52%(b) |
| RiverFront Dynamic US Flex-Cap ETF | 0.52%(b) |
| RiverFront Strategic Income Fund | 0.11% |
| (a) | The unitary advisory fee as a percentage of net assets is subject to the following breakpoints: (i) 0.51% for average net assets up to $600 million, (ii) 0.48% for average net assets equal to or greater than $600 million. |
| (b) | The unitary advisory fee as a percentage of net assets is subject to the following breakpoints: (i) 0.52% for average net assets up to $600 million, (ii) 0.49% for average net assets equal to or greater than $600 million. |
Out of the unitary management fee, the Adviser pays substantially all expenses of each Fund, including the cost of transfer agency, custody, fund administration, legal, audit, independent trustees and other services, except for interest expenses, distribution fees or expenses, brokerage expenses, taxes and extraordinary expenses not incurred in the ordinary course of each Fund's business. The Adviser’s unitary management fee is designed to pay substantially all of each Fund's expenses and to compensate the Adviser for providing services for each Fund.
RiverFront Investment Group, LLC (the “Sub-Adviser”) serves as each Fund’s sub-adviser pursuant to a sub-advisory agreement with the Trust (the ‘‘Sub-Advisory Agreement’’). Pursuant to the Sub-Advisory Agreement, the Adviser pays the Sub-Adviser a sub-advisory fee out of the Adviser’s advisory fee for the services it provides besides RiverFront Strategic Income Fund, in which the Fund directly pays the Sub-Adviser. The fee is payable on a monthly basis at the annual rate of the relevant Fund’s average daily net assets as set out below:
| Fund | Sub-Advisory Fee |
| RiverFront Dynamic Core Income ETF | 0.35% |
| RiverFront Dynamic Unconstrained Income ETF | 0.35% |
| RiverFront Dynamic US Dividend Advantage ETF | 0.35% |
| RiverFront Dynamic US Flex-Cap ETF | 0.35% |
| RiverFront Strategic Income Fund | 0.35% |
ALPS Fund Services, Inc., an affiliate of the Adviser, is the administrator of the Funds.
Effective July 1, 2020, each Trustee receives (1) a quarterly retainer of $10,000, (2) a per meeting fee of $5,000, (3) $1,500 for any special meeting held outside of a regularly scheduled board meeting, and (4) reimbursement for all reasonable out-of-pocket expenses relating to attendance at meetings. Prior to July 1, 2020, each Trustee who is not considered an "interested person" (as defined in the 1940 Act), received (1) a quarterly retainer of $5,000, (2) a per meeting fee of $3,750, (3) $1,500 for any special meeting held outside of a regularly scheduled board meeting, and (4) reimbursement for all reasonable out-of-pocket expenses relating to attendance at meetings. Prior to January 1, 2020, a Trustee who is considered an “interested person” (as defined in the 1940 Act) (“Interested Trustee”) received no compensation or expense reimbursements from the Trust. From January 1, 2020 to June 30, 2020, the Interested Trustee received (1) a quarterly retainer of $5,000, (2) a per meeting fee of $3,750, (3) $1,500 for any special meeting held outside of a regularly scheduled board meeting, and (4) reimbursement for all reasonable out-of-pocket expenses relating to attendance at meetings. In addition, the Chairman of the Board and Chairman of the Audit Committee each receives a quarterly retainer of $2,000, in connection with their respective roles.
RiverFront ETFs
| Notes to Financial Statements | November 30, 2020 |
4. PURCHASES AND SALES OF SECURITIES
For the year ended November 30, 2020, the cost of purchases and proceeds from sales of investment securities, excluding in-kind transactions and short-term investments, were as follows:
| Fund | | Purchases | | | Sales | |
| RiverFront Dynamic Core Income ETF | | $ | 18,942,379 | | | $ | 11,124,896 | |
| RiverFront Dynamic Unconstrained Income ETF | | | 4,439,895 | | | | 4,565,407 | |
| RiverFront Dynamic US Dividend Advantage ETF | | | 92,681,032 | | | | 92,264,170 | |
| RiverFront Dynamic US Flex-Cap ETF | | | 88,037,148 | | | | 87,693,045 | |
| RiverFront Strategic Income Fund | | | 66,397,631 | | | | 79,845,684 | |
For the year ended November 30, 2020, the cost of U.S. Government security purchases and proceeds from U.S. Government security sales were as follows:
| Fund | | Purchases | | | Sales | |
| RiverFront Dynamic Core Income ETF | | $ | 2,516,993 | | | $ | 10,784,198 | |
For the year ended November 30, 2020, the cost of in-kind purchases and proceeds from in-kind sales were as follows:
| Fund | | Purchases | | | Sales | |
| RiverFront Dynamic Core Income ETF | | $ | 7,898,997 | | | $ | 35,324,617 | |
| RiverFront Dynamic Unconstrained Income ETF | | | – | | | | 3,529,272 | |
| RiverFront Dynamic US Dividend Advantage ETF | | | 26,019,187 | | | | 37,150,570 | |
| RiverFront Dynamic US Flex-Cap ETF | | | 1,823,520 | | | | 55,836,910 | |
| RiverFront Strategic Income Fund | | | 15,683,048 | | | | 44,879,014 | |
For the year ended November 30, 2020, the in-kind net realized gains/(losses) were as follows:
| Fund | | Net Realized Gain/(Loss) | |
| RiverFront Dynamic Core Income ETF | | $ | 3,380,708 | |
| RiverFront Dynamic Unconstrained Income ETF | | | (63,314 | ) |
| RiverFront Dynamic US Dividend Advantage ETF | | | 6,446,846 | |
| RiverFront Dynamic US Flex-Cap ETF | | | 4,508,646 | |
| RiverFront Strategic Income Fund | | | (472,587 | ) |
Gains on in-kind transactions are not considered taxable for federal income tax purposes and losses on in-kind transactions are also not deductible for tax purposes.
5. CAPITAL SHARE TRANSACTIONS
Shares are created and redeemed by each Fund only in Creation Unit size aggregations of 50,000 Shares. Only broker-dealers or large institutional investors with creation and redemption agreements called Authorized Participants (“AP”) are permitted to purchase or redeem Creation Units from each Fund. Such transactions are generally permitted on an in-kind basis, with a balancing cash component to equate the transaction to the NAV per unit of each Fund on the transaction date. Cash may be substituted equivalent to the value of certain securities generally when they are not available in sufficient quantity for delivery, not eligible for trading by the AP or as a result of other market circumstances.
RiverFront ETFs
| Notes to Financial Statements | November 30, 2020 |
6. RELATED PARTY TRANSACTIONS
The RiverFront Dynamic US Dividend Advantage ETF and RiverFront Dynamic US Flex-Cap ETF engaged in cross trades between other funds in the Trust during the year ended November 30, 2020 pursuant to Rule 17a-7 under the 1940 Act. Cross trading is the buying or selling of portfolio securities between funds to which the Adviser serves as the investment adviser. The Board previously adopted procedures that apply to transactions between the Funds of the Trust pursuant to Rule 17a-7. These transactions related to cross trades during the period complied with the requirements set forth by Rule 17a-7 and the Trust's procedures.
Transactions related to cross trades during the year ended November 30, 2020, were as follows:
| Fund | | Purchase Cost Paid | | | Sales Proceeds Received | | | Realized Gain/(Loss) on Sales | |
| RiverFront Dynamic US Dividend Advantage ETF | | $ | 566,132 | | | $ | – | | | $ | – | |
| RiverFront Dynamic US Flex-Cap ETF | | | – | | | | 566,132 | | | | (115,441 | ) |
7. MARKET DISRUPTIONS RISK
The Funds are subject to investment and operational risks associated with financial, economic and other global market developments and disruptions, including the recent spread of an infectious respiratory illness caused by a novel strain of coronavirus (known as COVID-19), which can negatively impact the securities markets and cause each Fund to lose value.
The spread of COVID-19 has caused volatility, severe market dislocations and liquidity constraints in many markets, including markets for the securities each Fund holds, and may adversely affect each Fund’s investments and operations. The transmission of COVID-19 and efforts to contain its spread have resulted in travel restrictions and disruptions, closed international borders, enhanced health screenings at ports of entry and elsewhere, disruption of and delays in healthcare service preparation and delivery, quarantines, event and service cancellations or interruptions, disruptions to business operations and supply chains, and a reduction in consumer and business spending, as well as general concern and uncertainty that has negatively affected the economy. These disruptions have led to instability in the market place and the jobs market. The impact of COVID-19 could adversely affect the economies of many nations or the entire global economy, the financial well-being and performance of individual issuers, borrowers and sectors and the health of the markets generally in potentially significant and unforeseen ways.
The foregoing could lead to a significant economic downturn or recession, increased market volatility, a greater number of market closures, higher default rates and adverse effects on the values and liquidity of each Fund’s securities or other assets. Such impacts may adversely affect the performance of the Funds.
8. SUBSEQUENT EVENTS
Subsequent events, if any, after the date of the Statements of Assets and Liabilities have been evaluated through the date the financial statements were issued. Management has determined that there were no subsequent events to report through the issuance of these financial statements.
RiverFront ETFs
| Additional Information | November 30, 2020 (Unaudited) |
PROXY VOTING RECORDS, POLICIES AND PROCEDURES
Information regarding how each Fund voted proxies relating to portfolio securities during the most recent 12-month period ended June 30 and a description of the Funds’ proxy voting policies and procedures used in determining how to vote for proxies are available without charge on the SEC’s website at www.sec.gov and upon request, by calling (toll-free) 1-866-675-2639.
PORTFOLIO HOLDINGS
The Fund files a complete schedule of portfolio holdings with the U.S. Securities and Exchange Commission (“SEC”) for the first and third quarters of each fiscal year as an exhibit to its reports on Form N-PORT within 60 days after the end of the period. Copies of the Fund’s Form N-PORT are available without a charge, upon request, by contacting the Fund at 1-866-759-5679 and on the SEC’s website at https://www.sec.gov.
TAX INFORMATION
The Funds designate the following as a percentage of taxable ordinary income distributions, or up to the maximum amount allowable, for the calendar year ended December 31, 2019:
| | Qualified Dividend Income | Dividend Received Deduction |
| RiverFront Dynamic Core Income ETF | 0.00% | 0.00% |
| RiverFront Dynamic Unconstrained Income ETF | 0.00% | 0.00% |
| Riverfront Dynamic US Dividend Advantage ETF | 100.00% | 100.00% |
| Riverfront Dynamic US Flex-Cap ETF | 100.00% | 100.00% |
| Riverfront Strategic Income Fund | 0.00% | 0.00% |
In early 2020, if applicable, shareholders of record received this information for the distributions paid to them by the Funds during the calendar year 2019 via Form 1099. The Funds will notify shareholders in early 2021 of amounts paid to them by the Funds, if any, during the calendar year 2020.
RiverFront ETFs
| Board Considerations Regarding Approval of | November 30, 2020 (Unaudited) |
| Investment Advisory Agreement and | |
| Investment Sub-Advisory Agreements | |
RIGS, RFUN, RFCI, RFDA and RFFC
At a meeting held on June 24, 2020 via electronic means (video-conference), the Board of Trustees of the Trust (the “Board” or the “Trustees”), including the Trustees who are not “interested persons” of the Trust within the meaning of the Investment Company Act of 1940, as amended (the “Independent Trustees”), evaluated a proposal to approve the continuance of (i) the Investment Advisory Agreements between the Trust and ALPS Advisors, Inc. (the “Adviser” or “AAI”) with respect to the RiverFront Strategic Income Fund (“RIGS”), RiverFront Dynamic Unconstrained Income ETF (“RFUN”), RiverFront Dynamic Core Income ETF (“RFCI”), RiverFront Dynamic US Dividend Advantage ETF (“RFDA”) and RiverFront Dynamic US Flex-Cap ETF (“RFFC”) (each “a Fund” and collectively the “Funds”) and (ii) the Investment Sub-Advisory Agreements between the Trust or AAI and RiverFront Investment Group, LLC (the “Sub-Adviser” or “RiverFront”) with respect to the Funds. The Independent Trustees also met separately to consider each Investment Advisory Agreement and Investment Sub-Advisory Agreement.
In evaluating the Investment Advisory Agreements with respect to each Fund, the Board, including the Independent Trustees, considered various factors, including (i) the nature, extent and quality of the services provided by AAI with respect to the applicable Fund under the Investment Advisory Agreements; (ii) the advisory fees and other expenses paid by the Fund compared to those of similar funds managed by other investment advisers; (iii) the costs of the services provided to the Fund by AAI and the profits realized by AAI and its affiliates from its relationship to the Fund; (iv) the extent to which economies of scale have been or would be realized if and as the assets of the Fund grow and whether fees reflect the economies of scale for the benefit of shareholders; and (v) any additional benefits and other considerations.
With respect to the nature, extent and quality of the services provided by AAI under the Investment Advisory Agreements, the Board considered and reviewed information concerning the services provided under the Investment Advisory Agreements, financial information regarding AAI and its parent company, information describing AAI’s current organization and the background and experience of the persons responsible for the day-to-day management of the Funds.
The Board reviewed information on the performance of each Fund and its applicable benchmark and the FUSE performance group. Based on this review, the Board, including the Independent Trustees found that the nature and extent of services provided to each Fund under the Investment Advisory Agreements was appropriate and that the quality was satisfactory.
The Board noted that the advisory fees for each Fund were unitary fees pursuant to which AAI assumes all expenses of the Funds (including the cost of transfer agency, custody, fund administration, legal, audit and other services) other than the payments under the Investment Advisory Agreement (and, with respect to RIGS, under the Investment Sub-Advisory Agreement), brokerage expenses, taxes, interest, litigation expenses and other extraordinary expenses.
With respect to advisory fee rates, the Board, including the Independent Trustees, noted the following:
The gross management fee rate for RFCI is higher than the median of its FUSE expense group. RFCI net expense ratio is also slightly above the median of its FUSE expense group.
The gross management fee rate for each of RIGS, RFUN, RFFC and RFDA is lower than the median of its FUSE expense group. These Funds’ respective net expense ratios, however, are (i) in the case of RFDA, at the median of its FUSE expense group and (ii) in the case of RIGS, RFUN, and RFFC, below the median of their respective FUSE expense group.
Based on the foregoing, and the other information available to them, the Board, including the Independent Trustees, concluded that the advisory fee rate for each of the Funds was reasonable under the circumstances and in light of the quality of services provided.
The Board, including the Independent Trustees, considered other benefits available to AAI because of its relationship with the Funds and concluded that the advisory fees were reasonable taking into account any such benefits.
The Board, including the Independent Trustees, also considered with respect to each Fund the information provided by AAI about the costs and profitability of AAI with respect to each of the Funds, including the asset levels and other factors that influence the profitability and financial viability of the Funds. The Board, including the Independent Trustees, reviewed and noted the relatively small sizes of the Funds and concluded that AAI was not realizing any economies of scale. The Independent Trustees determined that AAI should continue to keep the Board informed on an ongoing basis of any significant developments (e.g., material increases in asset levels) so as to facilitate the Independent Trustees’ evaluation of whether further economies of scale have been achieved.
RiverFront ETFs
| Board Considerations Regarding Approval of | November 30, 2020 (Unaudited) |
| Investment Advisory Agreement and | |
| Investment Sub-Advisory Agreements | |
In voting to renew each Investment Advisory Agreement, the Board, including the Independent Trustees, concluded that the terms of each Investment Advisory Agreement are reasonable and fair in light of the services to be performed, the fees paid by certain other funds, expenses to be incurred and such other matters as the members of the Board, including the Independent Trustees, considered relevant in the exercise of their reasonable business judgment. The Board, including the Independent Trustees, did not identify any single factor or group of factors as all important or controlling and considered all factors together.
RiverFront Investment Sub-Advisory Agreements
In evaluating the Funds’ Investment Sub-Advisory Agreements, the Board, including the Independent Trustees, considered various factors, including (i) the nature, extent and quality of the services provided by RiverFront with respect to the Funds under the Investment Sub-Advisory Agreements; (ii) the advisory fees and other expenses paid by the Funds compared to those of similar funds managed by other investment advisers; (iii) the profitability to RiverFront of its sub-advisory relationship with the Funds and the reasonableness of compensation to RiverFront; (iv) the extent to which economies of scale would be realized if, and as, the Funds’ assets increase, and whether the fee level in the Investment Sub-Advisory Agreements reflects these economies of scale; and (v) any additional benefits and other considerations.
With respect to the nature, extent and quality of the services provided by RiverFront under the Investment Sub-Advisory Agreements, the Board, including the Independent Trustees, considered and reviewed information concerning the services provided under the Investment Sub-Advisory Agreements, the Funds’ respective performance, financial information regarding RiverFront, information describing RiverFront’s current organization and the background and experience of the persons responsible for the day-to-day portfolio management of the Funds. Based upon their review, the members of the Board, including the Independent Trustees, concluded that RiverFront was qualified to oversee the portfolio management of the Funds and that the services provided by RiverFront to the Funds are satisfactory. The Board, including the Independent Trustees, considered that the contractual sub-advisory fee to be paid to RiverFront from RIGS was 0.35% of RIGS’ average daily net assets out of a total management fee of 0.46% of RIGS’ average daily net assets. The Board, including the Independent Trustees, considered that the contractual sub-advisory fee to be paid to RiverFront with respect to each of RFUN, RFCI, RFDA and RFFC was 0.35% of each Fund’s average daily net assets out of a total management fee of 0.51% with respect to each of RFUN’s and RFCI’s average daily net assets, respectively, and 0.52% with respect to each of RFDA’s and RFFC’s average daily net assets, respectively. Based on the consideration of all factors deemed relevant by them, the members of the Board, including the Independent Trustees, concluded that the sub-advisory fees received by RiverFront under the Investment Sub-Advisory Agreements were reasonable under the circumstances and in light of the quality of services provided.
With respect to the costs of services provided and profits realized by RiverFront, the Board, including the Independent Trustees, considered the resources involved in sub-advising the Funds. Based on their review of the profitability of each of the Funds to RiverFront, the Board, including the Independent Trustees, concluded that the profitability of each Fund to RiverFront was not unreasonable.
The Board, including the Independent Trustees, also considered other benefits that have been and may be realized by RiverFront from its relationships with each Fund and concluded that the sub-advisory fees with respect to each Fund were reasonable taking into account such benefits.
The Board, including the Independent Trustees noted that RIGS had declined in assets over the prior year. The Board, including the Independent Trustees, considered the extent to which economies of scale may be realized if RIGS’ assets increase to its previous levels and continue to grow in size and whether fee levels reflect a reasonable sharing of such economies of scale for the benefit of the Fund’s investors. The Board also noted that RIGS has experienced fluctuations in assets, which makes it difficult to quantify the potential variability in net assets and thus determine the sustainability of any potential economies of scale which may exist. The Board, including the Independent Trustees, also noted that RFUN, RFCI, RFDA and RFFC were all launched during June 2016 and are only beginning to reach scale in terms of assets, with the exception of RFUN which is below scale and decreasing in assets over the prior year. The Independent Trustees determined that AAI should continue to keep the Board informed on an ongoing basis of any significant developments (e.g., material increases in asset levels) so as to facilitate the Independent Trustees’ evaluation of whether further economies of scale have been achieved with respect to each RiverFront ETF.
In voting to approve each of the Investment Sub-Advisory Agreements, the Board, including the Independent Trustees, concluded that the terms of each Investment Sub-Advisory Agreement are reasonable and fair in light of the services performed, expenses incurred and such other matters as the members of the Board, including the Independent Trustees, considered relevant in the exercise of their reasonable business judgment. The Board, including the Independent Trustees, did not identify any single factor or group of factors as all important or controlling and considered all factors together.
RiverFront ETFs
| Trustees & Officers | November 30, 2020 (Unaudited) |
The general supervision of the duties performed by the Adviser for the Fund under the Investment Advisory Agreement is the responsibility of the Board of Trustees. The Trust currently has four Trustees. Three Trustees have no affiliation or business connection with the Adviser or any of its affiliated persons and do not own any stock or other securities issued by the Adviser. These are the “non-interested” or “independent” Trustees (“Independent Trustees”). The other Trustee (the “Interested Trustee”) is affiliated with the Adviser.
The Independent Trustees of the Trust, their term of office and length of time served, their principal business occupations during the past five years, the number of portfolios in the Fund Complex overseen by each Independent Trustee, and other directorships, if any, held by the Trustee are shown below.
INDEPENDENT TRUSTEES
| Name, Address & Year of Birth* | Position(s) Held with Trust | Term of Office and Length of Time Served** | Principal Occupation(s) During Past 5 Years | Number of Portfolios in Fund Complex Overseen by Trustees*** | Other Directorships Held by Trustees |
Mary K. Anstine,
1940 | Trustee | Since March 2008 | Ms. Anstine was formerly an Executive Vice President of First Interstate Bank of Denver until 1994, President/Chief Executive Officer of HealthONE Alliance, Denver, Colorado, from 1994 to 2004, and has been retired since 2004. Ms. Anstine is also Trustee/Director of the following: AV Hunter Trust and Colorado Uplift Board. Ms. Anstine was formerly a Director of the Trust Bank of Colorado (later purchased and now known as Northern Trust Bank), HealthONE and Denver Area Council of the Boy Scouts of America and a member of the American Bankers Association Trust Executive Committee. | 35 | Ms. Anstine is a Trustee of ALPS Variable Investment Trust (7 funds); Financial Investors Trust (31 funds); Reaves Utility Income Fund; and Segall Bryant & Hamill Trust (14 funds). |
Jeremy W. Deems,
1976 | Trustee | Since March 2008 | Mr. Deems is the Co-Founder, Chief Compliance Officer and Chief Financial Officer of Green Alpha Advisors, LLC. Mr. Deems is Co-Portfolio Manager of the Shelton Green Alpha Fund. Prior to joining Green Alpha Advisors, Mr. Deems was CFO and Treasurer of Forward Management, LLC, ReFlow Management Co., LLC, ReFlow Fund, LLC, a private investment fund, and Sutton Place Management, LLC, an administrative services company. | 35 | Mr. Deems is a Trustee of ALPS Variable Investment Trust (7 funds); Financial Investors Trust (31 funds); and Reaves Utility Income Fund; and Clough Funds Trust (1 fund). |
Rick A. Pederson,
1952 | Trustee | Since March 2008 | Mr. Pederson is Partner, Bow River Capital Partners (private equity management), 2003 - present; Board Member, Prosci Inc. (private business services) 2013-2016; Advisory Board Member, Citywide Banks (Colorado community bank) 2014- 2017; Board Member, Strong-Bridge Consulting, 2015-2019; Board Member, IRI/ODMS Holdings LLC, 2017 – 2019; Director, National Western Stock Show (not for profit) 2010 - present; Director, History Colorado (not for profit) 2015-present; Director, Citywide Bank Advisory Board 2017-present; Trustee, Boettcher Foundation, 2018-present. | 18 | Mr. Pederson is Trustee of Segall Bryant & Hamill Trust (14 funds) and Principal Real Estate Income Fund (1 fund). |
| * | The business address of the Trustee is c/o ALPS Advisors, Inc., 1290 Broadway, Suite 1000, Denver, Colorado 80203. |
| ** | This is the period for which the Trustee began serving the Trust. Each Trustee serves an indefinite term, until his successor is elected. |
| *** | The Fund Complex includes all series of the Trust and any other investment companies for which ALPS Advisors, Inc. provides investment advisory services. |
RiverFront ETFs
| Trustees & Officers | November 30, 2020 (Unaudited) |
The Trustee who is an “interested person” of the Trust, his term of office and length of time served, his principal business occupations during the past five years, the number of portfolios in the Fund Complex overseen by the Interested Trustee and the other directorships, if any, held by the Trustee, are shown below.
INTERESTED TRUSTEE
| Name, Address and Year of Birth of Interested Trustee* | Position(s) Held with Trust | Term of Office and Length of Time Served** | Principal Occupation(s) During Past 5 Years | Number of Portfolios in Fund Complex Overseen by Trustees*** | Other Directorships Held by Trustees |
Edmund J. Burke,
1961 | Trustee | Since December 2017. | Mr. Burke joined ALPS in 1991 and served as the President and Director of ALPS Holdings, Inc., and ALPS Advisors, Inc. (“AAI”), and Director of ALPS Distributors, Inc. (“ADI”), ALPS Fund Services, Inc. (“AFS”), and ALPS Portfolio Solutions Distributor, Inc. (“APSD”). Mr. Burke retired from ALPS in June 2019. | 30 | Mr. Burke is a Trustee of Clough Global Dividend and Income Fund (1 fund); Clough Global Equity Fund (1 fund); Clough Global Opportunities Fund (1 fund); Clough Funds Trust (1 fund); Liberty All-Star Equity Fund (1 fund); Director of the Liberty All- Star Growth Fund, Inc. (1 fund) and Financial Investors Trust (31 funds). |
| * | The business address of the Trustee is c/o ALPS Advisors, Inc., 1290 Broadway, Suite 1000, Denver, Colorado 80203. |
| ** | This is the period for which the Trustee began serving the Trust. Each Trustee serves an indefinite term, until his successor is elected. |
| *** | The Fund Complex includes all series of the Trust and any other investment companies for which ALPS Advisors, Inc. provides investment advisory services. |
RiverFront ETFs
| Trustees & Officers | November 30, 2020 (Unaudited) |
OFFICERS
| Name, Address and Year of Birth of Officer* | Position(s) Held with Trust | Length of Time Served** | Principal Occupation(s) During Past 5 Years |
Bradley Swenson,
1972 | President | Since June 2019 | Mr. Swenson joined ALPS in 2004 and currently serves as President of AFS (since 2019) and also Chief Operating Officer of AFS (since 2015). He also currently serves as President of Clough Global Opportunities Fund, Clough Global Dividend and Income Fund, Clough Global Equity Fund, Clough Funds Trust, Financial Investors Trust, Reaves Utility Income Fund and ALPS Series Trust. From 2004-2015, Mr. Swenson served as Chief Compliance Officer to ALPS, its affiliated entities, and to certain investment companies. Mr. Swenson is registered with FINRA, holding a Series 6, 26 and 27. |
Matthew Sutula,
1985 | Chief Compliance Officer (“CCO”) | Since December 2019 | Mr. Sutula joined ALPS in 2012 and currently serves as Chief Compliance Officer of AAI. Prior to his current role, Mr. Sutula served as interim Compliance Officer of the Trust (September 2019 to December 2019). Compliance Manager and Senior Compliance Analyst for AAI, as well as Compliance Analyst for AFS. Prior to joining ALPS, he spent seven years at Morningstar, Inc. in various analyst roles supporting the registered investment company databases. Mr. Sutula is also Chief Compliance Officer of Principal Real Estate Income Fund, ALPS Variable Investment Trust, RiverNorth Opportunities Fund, Inc., Liberty All-Star Equity Fund and Liberty All- Star Growth Fund, Inc. |
Kathryn Burns,
1976 | Treasurer | Since September 2018 | Ms. Burns serves as Vice President, Director of Fund Operations of AAI since 2018. From 2013 to 2018, she served as Vice President and Fund Controller at AFS. Prior to joining ALPS, she worked at Old Mutual Capital where she served as Vice President and Chief Compliance Officer (2010 – 2012) and Regulatory Reporting Manager and Assistant Treasurer to the Old Mutual Funds Trusts (2006 – 2012). She also served as a CPA for PricewaterhouseCoopers LLP. Ms. Burns also serves as Treasurer of Boulder Growth & Income Fund, Inc. and as President of ALPS Variable Investment Trust, Principal Real Estate Income Fund and RiverNorth Opportunities Fund, Inc. |
Richard C. Noyes,***
1970 | Secretary | Since September 2019 | Mr. Noyes joined ALPS in 2015 and is Senior Vice President and General Counsel of ALPS. Prior to joining ALPS, Mr. Noyes served as Assistant Vice President and Senior Counsel of Janus Capital Management LLC. |
Sharon Akselrod,***
1974 | Assistant Secretary | Since December 2016 | Ms. Akselrod joined ALPS in August 2014 and is currently Senior Investment Company Act Paralegal of AFS. Prior to joining ALPS, Ms. Akselrod served as Corporate Governance and Regulatory Associate for Nordstrom fsb (2013-2014) and Senior Legal Assistant – Legal Manager for AXA Equitable Life Insurance Company (2008-2013). Ms. Akselrod is also Secretary of Principal Real Estate Income Fund and Assistant Secretary of Financial Investors Trust and Clough Funds Trust. |
Cara Owen,***
1981 | Assistant Secretary | Since March 2020 | Vice President and Principal Legal Counsel, ALPS Fund Services, Inc.; Vice President and Secretary, Boulder Growth & Income Fund, Inc.; Assistant Secretary, James Advantage Funds (since August 2019). Prior to joining ALPS, Ms. Owen was Senior Counsel, Corporate & Investments, Great-West Life & Annuity Insurance Company; Senior Counsel & Assistant Secretary, Great-West Funds, Inc., Great-West Capital Management, LLC, Great-West Trust Company, LLC, and Advised Assets Group, LLC (2014-2019). |
| * | The business address of each Officer is c/o ALPS Advisors, Inc., 1290 Broadway, Suite 1000, Denver, Colorado 80203. Each Officer is deemed an affiliate of the Trust as defined under the 1940 Act. |
| ** | This is the period for which the Officer began serving the Trust. Each Officer serves an indefinite term, until his/her successor is elected. |
| *** | Effective December 7, 2020, Mr. Noyes and Ms. Akselrod resigned from their respective positions held with the Trust. As of the same date, Ms. Owen was appointed to the position of Secretary and Jen Craig as Assistant Secretary. |
The Statement of Additional Information includes additional information about the Fund’s Trustees and is available, without charge, upon request by calling (toll-free) 1-866-759-5679.

| (a) | The Registrant, as of the end of the period covered by this report, has adopted a code of ethics that applies to the Registrant's principal executive officer, principal financial officer, principal accounting officer or controller or any persons performing similar functions on behalf of the Registrant. |
| (c) | During the period covered by this report, no amendments to the provisions of the code of ethics adopted in 2(a) above were made. |
| (d) | During the period covered by this report, no implicit or explicit waivers to the provisions of the code of ethics adopted in 2(a) above were granted. |
| (f) | The Registrant's Code of Ethics is attached as an Exhibit hereto. |
| Item 3. | Audit Committee Financial Expert. |
The Board of Trustees of the Registrant has determined that the Registrant has at least one Audit Committee Financial Expert serving on its audit committee. The Board of Trustees of the Registrant has designated Jeremy W. Deems as the Registrant’s “Audit Committee Financial Expert”. Mr. Deems is “independent” as defined in paragraph (a)(2) of Item 3 to Form N-CSR.
| Item 4. | Principal Accountant Fees and Services. |
| (a) | Audit Fees: For the Registrant’s fiscal years ended November 30, 2020 and November 30, 2019, the aggregate fees billed for professional services rendered by the principal accountant for the audit of the Registrant’s annual financial statements were $321,865 and $321,865, respectively. |
| (b) | Audit-Related Fees: For the Registrant’s fiscal years ended November 30, 2020 and November 30, 2019, the aggregate fees billed for professional services rendered by the principal accountant that are reasonably related to the performance of the audit of the Registrant's financial statements and are not reported under paragraph (a) of this Item were $0 and $0, respectively. |
| (c) | Tax Fees: For the Registrant’s fiscal years ended November 30, 2020 and November 30, 2019, the aggregate fees billed for professional services rendered by the principal accountant for tax compliance, tax advice and tax planning were $91,730 and $98,930, respectively. The fiscal year 2020 and 2019 tax fees were for services pertaining to federal and state income tax return review, review of year end dividend distributions and excise tax preparation. |
| (d) | All Other Fees: For the Registrant’s fiscal years ended November 30, 2020 and November 30, 2019, aggregate fees billed to the Registrant by the principal accountant for services provided by the principal accountant other than the services reported in paragraphs (a) through (c) of this Item 4 were $0 and $0, respectively. |
| (e)(1) | Audit Committee Pre-Approval Policies and Procedures: All services to be performed by the Registrant's principal accountant must be pre-approved by the Registrant's audit committee. |
| (e)(2) | No services described in paragraphs (b) through (d) of this Item were approved by the Registrant’s audit committee pursuant to paragraph (c)(7)(i)(C) of Rule 2-01 of Regulation S-X. |
| (g) | The aggregate non-audit fees billed by the Registrant’s accountant for the fiscal years ended November 30, 2020 and November 30, 2019 of the Registrant were $91,730 and $267,930, respectively. These fees consisted of non-audit fees billed to (i) the Registrant of $91,730 and $98,930, respectively as described in response to paragraph (c) above and (ii) to ALPS Fund Services, Inc. (“AFS”), an entity under common control with ALPS Advisors, Inc., the Registrant’s investment adviser, of $0 and $169,000, respectively. The non-audit fees billed to AFS related to SSAE 16 services and other compliance-related matters. |
| (h) | The Registrant’s audit committee has considered whether the provision of non- audit services that were rendered to the Registrant’s investment adviser (not including any sub-adviser whose role is primarily portfolio management and is subcontracted with or overseen by another investment adviser), and any entity controlling, controlled by, or under common control with the investment adviser that provides ongoing services to the Registrant that were not pre-approved pursuant to paragraph (c)(7)(ii) of Rule 2-01 of Regulation S-X, is compatible with maintaining the principal accountant’s independence. The Registrant’s audit committee determined that the provision of such non-audit services is compatible with maintaining the principal accountant’s independence. |
| Item 5. | Audit Committee of Listed Registrants. |
Not applicable to the Registrant.
(a) Schedule of Investments is included as part of the Report to Stockholders filed under Item 1 of this Form N-CSR.
(b) Not applicable
| Item 7. | Disclosure of Proxy Voting Policies and Procedures for Closed-End Management Investment Companies. |
Not applicable to Registrant.
| Item 8. | Portfolio Managers of Closed-End Management Investment Companies. |
Not applicable to Registrant.
| Item 9. | Purchases of Equity Securities by Closed-End Management Investment Company and Affiliated Purchasers. |
Not applicable to Registrant.
| Item 10. | Submission of Matters to a Vote of Security Holders. |
No material changes to the procedures by which the shareholders may recommend nominees to the Registrant’s Board of Trustees have been implemented after the Registrant’s last provided disclosure in response to the requirements of Item 407(c)(2)(iv) of Regulation S-K (17 CFR 229.407) (as required by Item 22(b)(15) of Schedule 14A (17 CFR 240.14a-101)), or this Item.
| Item 11. | Controls and Procedures. |
| (a) | The Registrant’s principal executive officer and principal financial officer have concluded that the Registrant’s disclosure controls and procedures (as defined in Rule 30a-3(c) under the Investment Company Act of 1940, as amended) are effective based on their evaluation of these controls and procedures as of a date within 90 days of the filing date of this report. |
| (b) | There was no change in the Registrant's internal control over financial reporting (as defined in Rule 30a-3(d) under the Investment Company Act of 1940, as amended) during the period covered by this report that has materially affected, or is reasonably likely to materially affect, the Registrant's internal control over financial reporting. |
| Item 12. | Disclosure of Securities Lending Activities for Closed-End Management Investment Companies. |
Not applicable.
SIGNATURES
Pursuant to the requirements of the Securities Exchange Act of 1934 and the Investment Company Act of 1940, the Registrant has duly caused this report to be signed on its behalf by the undersigned, thereunto duly authorized.
ALPS ETF TRUST
| By: | /s/ Bradley J. Swenson | |
| | Bradley J. Swenson (Principal Executive Officer) | |
| | President | |
| | | |
| Date: | February 5, 2021 | |
Pursuant to the requirements of the Securities Exchange Act of 1934 and the Investment Company Act of 1940, this report has been signed below by the following persons on behalf of the Registrant and in the capacities and on the dates indicated.
| By: | /s/ Bradley J. Swenson | |
| | Bradley J. Swenson (Principal Executive Officer) | |
| | President | |
| | | |
| Date: | February 5, 2021 | |
| | | |
| By: | /s/ Kathryn Burns | |
| | Kathryn Burns (Principal Financial Officer) | |
| | Treasurer | |
| | | |
| Date: | February 5, 2021 | |